User login
Broad application of JNC-8 would save lives, reduce costs
Antihypertensive therapy would prevent about 56,000 cardiovascular events annually and 13,000 deaths from strokes, myocardial infarctions, and other causes if it were used by all U.S. adults who qualify for treatment under 2014 Joint National Committee hypertension guidelines, according to computer modeling published online Jan. 28 in the New England Journal of Medicine.
Even though the new Joint Committee guidelines are a bit less stringent than the committee’s prior 2003 advice, blood pressure remains inadequately controlled in 44% of the 64 million U.S. adults with hypertension, according to the investigators, led by Dr. Andrew Moran of Columbia University Medical Center, New York (N. Engl. J. Med. 2015;372:447-55).

The team used data from the National Health and Nutrition Examination Survey, the Framingham Heart Study, and other sources to estimate costs and benefits of expanding treatment to all U.S. adults aged 35-74 years who meet the 2014 benchmarks. They then calculated cost-effectiveness of expanding use in various subpopulations, using $50,000/quality-adjusted life-year (QALY) gained, or less, as their cut-off.
Overall, the investigators found that fuller implementation of the Joint Committee goals would pay for itself in reduced cardiovascular morbidity and mortality. The results were driven primarily by secondary prevention in patients with cardiovascular disease and primary prevention in patients with stage 2 hypertension, meaning systolic BP of 160 mm Hg or higher or diastolic BP of 100 mm Hg or higher.
“There is an enormous potential for improving population health by expanding treatment and improving control. Our findings clearly show that it would be worthwhile to significantly increase spending on office visits, home blood pressure monitoring, and interventions to improve treatment adherence. In fact, we could double treatment and monitoring spending for some patients – namely those with severe hypertension – and still break even,” Dr. Moran said in a statement announcing the results.
Treatment of patients with existing cardiovascular disease or stage 2 hypertension would save lives and costs in all men 35-74 years old and in women aged 45-74 years. The treatment of more modest hypertension – systolic BP of 140-159 mm Hg or a diastolic BP of 90-99 mm Hg – was cost effective for all men and for women also between the ages of 45 and 74 years, but treating women 35-44 years old with moderate hypertension and diabetes or kidney disease had intermediate cost-effectiveness ($125,000 per QALY), and low cost-effectiveness ($181,000 per QALY) if those comorbidities were not present.
“Some people will be alarmed about our conclusion that it may not be cost effective to treat hypertension in young adults, especially young women. It’s worth noting that our analysis didn’t capture the cumulative, lifetime effects of hypertension. It may well turn out to be cost effective to treat this group if we look at data on costs and benefits over several decades,” Dr. Moran said.
The team assumed a medication adherence rate of 75%. The costs of treatment included medications, monitoring, and drug side effects.
They did not analyze the effect of diet and lifestyle interventions for lowering blood pressure, or compare the cost-effectiveness of specific antihypertensive medication classes or combinations.
The work was funded by the National Heart, Lung, and Blood Institute, among others. The authors reported no relevant financial disclosures.
Antihypertensive therapy would prevent about 56,000 cardiovascular events annually and 13,000 deaths from strokes, myocardial infarctions, and other causes if it were used by all U.S. adults who qualify for treatment under 2014 Joint National Committee hypertension guidelines, according to computer modeling published online Jan. 28 in the New England Journal of Medicine.
Even though the new Joint Committee guidelines are a bit less stringent than the committee’s prior 2003 advice, blood pressure remains inadequately controlled in 44% of the 64 million U.S. adults with hypertension, according to the investigators, led by Dr. Andrew Moran of Columbia University Medical Center, New York (N. Engl. J. Med. 2015;372:447-55).
The team used data from the National Health and Nutrition Examination Survey, the Framingham Heart Study, and other sources to estimate costs and benefits of expanding treatment to all U.S. adults aged 35-74 years who meet the 2014 benchmarks. They then calculated cost-effectiveness of expanding use in various subpopulations, using $50,000/quality-adjusted life-year (QALY) gained, or less, as their cut-off.
Overall, the investigators found that fuller implementation of the Joint Committee goals would pay for itself in reduced cardiovascular morbidity and mortality. The results were driven primarily by secondary prevention in patients with cardiovascular disease and primary prevention in patients with stage 2 hypertension, meaning systolic BP of 160 mm Hg or higher or diastolic BP of 100 mm Hg or higher.
“There is an enormous potential for improving population health by expanding treatment and improving control. Our findings clearly show that it would be worthwhile to significantly increase spending on office visits, home blood pressure monitoring, and interventions to improve treatment adherence. In fact, we could double treatment and monitoring spending for some patients – namely those with severe hypertension – and still break even,” Dr. Moran said in a statement announcing the results.
Treatment of patients with existing cardiovascular disease or stage 2 hypertension would save lives and costs in all men 35-74 years old and in women aged 45-74 years. The treatment of more modest hypertension – systolic BP of 140-159 mm Hg or a diastolic BP of 90-99 mm Hg – was cost effective for all men and for women also between the ages of 45 and 74 years, but treating women 35-44 years old with moderate hypertension and diabetes or kidney disease had intermediate cost-effectiveness ($125,000 per QALY), and low cost-effectiveness ($181,000 per QALY) if those comorbidities were not present.
“Some people will be alarmed about our conclusion that it may not be cost effective to treat hypertension in young adults, especially young women. It’s worth noting that our analysis didn’t capture the cumulative, lifetime effects of hypertension. It may well turn out to be cost effective to treat this group if we look at data on costs and benefits over several decades,” Dr. Moran said.
The team assumed a medication adherence rate of 75%. The costs of treatment included medications, monitoring, and drug side effects.
They did not analyze the effect of diet and lifestyle interventions for lowering blood pressure, or compare the cost-effectiveness of specific antihypertensive medication classes or combinations.
The work was funded by the National Heart, Lung, and Blood Institute, among others. The authors reported no relevant financial disclosures.
FROM THE NEW ENGLAND JOURNAL OF MEDICINE
Key clinical point: Even young patients, in many cases, can benefit from adherence to theJoint National Committee 2014 hypertension guidelines.
Major finding: The treatment of modest hypertension is cost effective for men 35-74 years old, and women between the ages of 45 and 74 years, meaning that each quality-adjusted life-year gained would cost less than $50,000.
Data source: Computer estimates of the impact of applying JNC-8 to all hypertensive U.S. adults 35-74 years old.
Disclosures: The work was funded by the National Heart, Lung, and Blood Institute, among others. The authors reported no relevant financial disclosures.

Icatibant rapidly resolved ACE inhibitor–induced angioedema
Angioedema caused by ACE inhibitors resolved 70% more rapidly with icatibant than did standard therapy in a multicenter phase II study in Germany, which was reported online Jan. 29 in the New England Journal of Medicine.
Because of the increasing use of ACE inhibitors, approximately one-third of all cases of angioedema treated in emergency departments now are attributed to these agents. The current standard ED treatment of ACE inhibitor–induced angioedema is glucocorticoids plus antihistamines. However, patients generally don’t respond to this therapy, likely because this form of angioedema isn’t a histamine-mediated reaction. Instead, it is thought by some to be a bradykinin-mediated reaction, said Dr. Murat Bas of the department of otorhinolaryngology, Technische Universität München (Germany), and his associates.
Icatibant injections (Firazyr) are approved by the Food and Drug Administration for the treatment of acute attacks of hereditary angioedema in adults 18 years of age and older. The drug also is being studied in the United States for the treatment of ACE-inhibitor–induced angioedema.
Since ACE inhibitors interfere with the breakdown of bradykinin, and bradykinin-mediated hereditary angioedema is usually treated with bradykinin-receptor antagonists such as icatibant, the investigators performed a double-blind randomized trial comparing subcutaneous icatibant against standard treatment in 27 adults who presented to four German EDs during a 1.5-year period.
The primary endpoint – the time to complete resolution of ACE inhibitor–induced angioedema – was 8 hours with icatibant and 27 hours with standard therapy. Angioedema resolved within 4 hours in five patients (38%) given icatibant; none of the patients given standard therapy responded that quickly. The onset of symptom relief was 2 hours with icatibant and 12 hours with standard glucocorticoids plus antihistamines, a significant difference as judged by the study participants and the researchers. Also, the physician-assessed severity of angioedema began to abate within 1 hour of icatibant administration and within 8 hours for standard treatment (N. Engl. J. Med. 2015 Jan. 29 [doi:10.1056/NEJMoa1312524]).
“Although the sample size in this trial was too small to allow for a robust evaluation of safety, no patient discontinued participation in the study owing to adverse events,” Dr. Bas and his associates added.
Dr. Bas reported receiving grants and personal fees from Shire, the maker of icatibant, as did some of his associates.
Key clinical point: Icatibant may prove to be a more effective treatment than glucocorticoids and antihistamines for ACE inhibitor–induced angioedema.
Major finding: The time to complete resolution of ACE inhibitor–induced angioedema was 8 hours with icatibant and 27 hours with standard therapy.
Data source: A multicenter double-blind randomized phase II clinical trial involving 27 adults hospitalized in Germany for ACE inhibitor–induced angioedema during a 1.5-year period.
Disclosures: This study was supported by an educational grant from Shire and by the Federal Ministry of Education and Research of Germany. Dr. Bas reported receiving grants and personal fees from Shire, the maker of icatibant, as did some of his associates.
Fluid Resuscitation in Sepsis: A Systematic Review and Network Meta-Analysis
Clinical question: Is there any difference between different resuscitative fluids (crystalloids or colloids) on mortality in critically ill sepsis patients?
Background: Fluid resuscitation, in addition to antibiotics and source control, is a cornerstone of initial management of sepsis. Resuscitation with crystalloids compared with colloids for critically ill patients has been evaluated in large randomized controlled trials and meta-analyses; however, whether any of these fluid properties translates into a survival advantage, particularly regarding the optimal fluid for resuscitation in critically ill sepsis patients, remains unclear.
Study design: Systematic review, network meta-analysis (NMA).
Setting: Database search in MEDLINE, Embase, ACP Journal Club, Cumulative Index to Nursing and Allied Health Literature (CINAHL), HealthSTAR, the Allied and Complementary Medicine Database (AMED), and the Cochrane Central Register of Controlled Trials (CENTRAL).
Synopsis: Of 9,875 records that involved adult (age =16 years) critically ill patients with severe sepsis or septic shock who required fluid resuscitation, with no restrictions on language or publication date, 14 randomized controlled trials were considered eligible. Interventions studied included any fluid or fluid strategy used for resuscitation compared with another fluid or fluid strategy. The endpoint was 90-day mortality or, if not available, 30-day intensive care unit or hospital mortality, whichever was longest.
The analysis classified fluids as crystalloids or colloids. The relevant analyses were a four-node NMA (crystalloids versus albumin versus hydroxyethyl starch [HES] versus gelatin) and a six-node NMA (crystalloids versus albumin versus HES versus gelatin, with crystalloids divided into balanced or unbalanced and HES divided into low or high molecular weight), and a conventional fixed-effects meta-analytic comparison of crystalloids versus colloids.
In the four-node analysis, the results suggested higher mortality with starches (versus crystalloids) and lower mortality with albumin (versus crystalloids and starches). In the six-node analysis, the results suggested that albumin is superior to saline and low-molecular-weight starch and that balanced crystalloids are superior to saline and starch (both high and low molecular weight).
These results highlight potentially important differences in mortality among solutions; they suggest an advantage of balanced crystalloids versus saline and low- or high-molecular-weight starch, with similar mortality results for balanced crystalloids and albumin. These differences were not detectable using a standard meta-analytic approach directly comparing “any crystalloids versus any colloids.” Biological rationale is consistent with the findings of lower mortality with balanced crystalloid solutions than with saline as it mimics the homeostatic composition of body fluids to a greater extent than unbalanced fluids. These results raise concerns about using unbalanced crystalloids in the acute resuscitation of patients with sepsis.
Bottom line: Among patients with sepsis, resuscitation with balanced crystalloids or albumin is associated with reduced mortality compared to other fluids.
Physician Dashboards, Pay-for-Performance Deliver Better VTE Prophylaxis Rates
The combination of direct feedback from web-based physician dashboards and a pay-for-performance program “significantly improved” hospitalists’ compliance with VTE prophylaxis, according to a recent study in the Journal of Hospital Medicine.
In the report, hospitalist Henry Michtalik, MD, MPH, MHS, and colleagues noted that while physicians’ compliance increased most by using dashboards, the combination of the two methods is recommended to “combine extrinsic and intrinsic motivations.”
“They end up enhancing each other,” says Dr. Michtalik, associate faculty and international consultant at the Armstrong Institute for Patient Safety and Quality at Johns Hopkins Medicine in Baltimore. “I really don’t think you can have one without the other. If you have a pay-for-performance program without a dashboard, that’s the equivalent of driving down an unfamiliar highway without any signs. You’re not really sure where you were, you’re not really sure where you’re going, you think you’re on the right path, but you would sure feel a lot better if you had some markers along the way.”
The study analyzed 3,144 inpatient admissions at a tertiary-care medical center from 2009 to 2012. During the dashboard-only intervention period, providers improved compliance by 4% on average (95% CI, 3–5; P<0.001). With the addition of the pay-for-performance program, providers improved another 4% (95% CI, 3–5; P<0.001). Group compliance improved from 86% (95% CI, 85–88) during the baseline period to 90% (95% CI, 88–93) during the dashboard period (P=0.01) and 94% (95% CI, 93–96) during the pay-for-performance program (P=0.01).
Dr. Michtalik says that in an era of value-based purchasing and broader healthcare reform, most institutions are already collecting data on VTE prophylaxis. The next step, he says, should be bringing data to the provider level and making that an agent for change.
Visit our website for more information on VTE prophylaxis.
Can social media help mental health practitioners prevent suicides?
Suicide is the tenth leading cause of death among Americans and the third leading cause among those age 15 to 24.1 As many as 36% of suicide victims leave a suicide note.2 Researchers have analyzed such notes with the aim of identifying specific content and patterns that might aid in creating more effective strategies for preventing suicide.3-5
One study found that the presence of a suicide note is an indicator of serious intent; that is, when the initial attempt fails, those who had left a suicide note were found to be at increased risk of subsequent completed suicide.4 Researchers also found that 75% of suicide notes contained the theme “apology/shame,” suggesting that many suicide victims might have welcomed an alternative to suicide to solve their personal predicament. Tragically, however, most suicide notes are not discovered until suicide has been attempted or completed.4
That’s where social media comes in. As platforms for self-expression, social networking sites such as Facebook, Twitter, and Tumblr are sources of real-time information that could aid in suicide prevention.6 With that in mind, we:
• present 2 cases in which a patient announced her suicidal ideation on Facebook
• consider the opportunities that social media present for early intervention
• propose high-tech monitoring methods for high-risk patients.
CASE 1 Major depressive disorder (MDD) and nonadherence
Ms. S, age 24, has a 4-year history of MDD and treatment nonadherence. She had no history of suicide attempt or inpatient treatment, but she had briefly engaged in psychotherapy before discontinuing visits. Physically healthy and employed as a security officer, Ms. S recently broke up with her boyfriend who had abused her physically—and against whom she had an order of protection.
On the day in question, Ms. S posted several status updates on Facebook expressing hopelessness, which, over the course of the day, escalated to expression of frank suicidal ideation:
• “I am ugly, no man would ever want to live with me.”
• “I have made no effect on the world and I’m just a waste of space.”
• “It’s sad that I want to die but such is life. We all die one day.”
• “I’m going to kill myself. It was nice knowing you world. Goodbye everyone.”
CASE 2 Substance abuse and previous suicide attempt
Ms. B, age 21, had a remote (approximately age 16) history of a suicide attempt and was actively abusing 3,4-methylenedioxymethamphetamine (MDMA [“Ecstasy,” “Molly”]) and Cannabis. She was not receiving outpatient care. One afternoon, Ms. B walked into the emergency department (ED) and said she had just taken 17 ibuprofen pills with the intent of killing herself.
On initial evaluation, Ms. B was irritable and uncooperative, denying all psychiatric symptoms and refusing to divulge details of her recent behavior. Her mother, who had not accompanied her daughter to the ED, reported that Ms. B had engaged in excessive risk-taking—speeding, driving while intoxicated, having multiple sex partners—for the past 5 years, resulting in several arrests for minor offenses, and she had been depressed and was sleeping and eating poorly in the 2 weeks leading up to the suicide attempt.
Two days ago, her mother added, Ms. B had posted disturbing notes on Facebook: ”Life is useless,” she declared in one post; “I’d be better off dead,” in another.
Suicidal content online
Worldwide, Facebook has 1.35 billion active users each month.7 Thus far, a limited number of posts indicating suicidal intent have been reported in the lay press,8 but evidence suggests that the use of social media for this purpose is an emerging trend.9
A search of the literature yielded only 3 case reports.8,10,11 In one case, a delayed response to a suicide note resulted in a failure to prevent the suicide.8 In another, a clinician’s discovery of a patient’s explicitly suicidal Facebook post led to what the team leader described as a more meaningful therapeutic relationship.10 The clinician’s discovery might have been pivotal in preventing the patient from committing suicide.
The authors of these case reports explored the idea of using Facebook for suicide prevention, raising a number of practical and ethical issues. Among them are the potential for immediate intervention by other Facebook users and the extent to which suicidal posts on social media sites induce copycat suicides.8
Issues associated with clinicians’ use of social media to follow or monitor patients include the ethical concepts of beneficence and nonmaleficence, privacy and confidentiality, clinical judgment, and informed consent,8,10 including potential benefit and harm and the difference between actual and perceived privacy violations. Bennett et al11 recommend developing guidelines for the use of social media to enhance medical care and provide appropriate protections to both patients and providers.
Reporting suicidal content. Although the primary purpose of Facebook is to give users the opportunity to share life events and thoughts with friends and family, the company does address the question of suicidal content in its Help Center (Box 1).12 As our 2 cases illustrate, however, intervention can be significantly delayed. 
CASE 1 CONTINUED Call to 911
Fortunately for Ms. S, a friend who read her Facebook posts called 911; even then, however, 16 hours passed between the initial postings and the patient’s arrival at the ED. When emergency medical services brought Ms. S to the Comprehensive Psychiatry Emergency Program, she acknowledged suicidal ideation without an active plan. Other symptoms included depressed mood, a sense of hopelessness, feelings of worthlessness lasting >2 months, low self-esteem, dissatisfaction with body image, and a recent verbal altercation with a friend.
Ms. S was admitted to the inpatient unit for further observation and stabilization.
CASE 2 CONTINUED No one answered her calls
Ms. B, who did not arrive at the ED until 2 days after her suicidal posts, corroborated the history given by her mother. She also reported that she had attempted to reach out to her friends for support, but no one had answered her phone calls. She felt hurt because of this, Ms. B said, and impulsively ingested the pills.
Ms. B said she regretted the suicide attempt. Nevertheless, in light of her recent attempt and persistent distress, she was admitted to the inpatient unit for observation and stabilization.
Can artificial intelligence help?
There is no effective means of tracking high-risk patients after their first contact with the mental health system, despite the fact that (1) those who attempt suicide are at high risk of subsequent suicide attempts3 and (2) we have the potential to prevent future attempts based on self-expressed online cues. We propose machine learning algorithms—a branch of artificial intelligence—to capture and process suicide notes on Facebook in real time.
Machine learning can be broadly defined as computational methods using experience to improve performance or make accurate predictions. In this context, “experience” refers to past information, typically in the form of electronic data collected and analyzed to design accurate and efficient predictive algorithms. Machine learning, which incorporates fundamental concepts in computer science, as well as statistics, probability, and optimization, already has been established in a variety of applications, such as detecting e-mail spam, natural language processing, and computational biology.13
Affective computing, known as emotion-oriented computing, is a branch of artificial intelligence that involves the design of systems and devices that can recognize, interpret, and process human moods and emotions (Box 2).14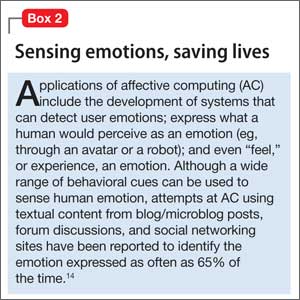
Prediction models, developed by Poulin et al15 to estimate the risk of suicide (based on keywords and multiword phrases from unstructured clinical notes from a national sample of U.S. Veterans Administration medical records), resulted in an inference accuracy of ≥65%. Pestian et al16 created and annotated a collection of suicide notes—a vital resource for scientists to use for machine learning and data mining. Machine learning algorithms based on such notes and clinical data might be used to capture alarming social media posts by high-risk patients and activate crisis management, with potentially life-saving results.
But limitations remain
It is not easy to identify or analyze people’s emotions based on social media posts; emotions can be implicit, based on specific events or situations. To distinguish among different emotions purely on the basis of keywords is to deal in great subtlety. Framing algorithms to include multiple parameters—the duration of suicidal content and the number of suicidal posts, for example—would help mitigate the risk of false alarms.
Another problem is that not all Facebook profiles are public. In fact, only 28% of users share all or most of their posts with anyone other than their friends.17 This limitation could be addressed by urging patients identified as being at high risk of suicide during an initial clinical encounter with a mental health provider to “friend” a generic Web page created by the hospital or clinic to protect patients’ privacy.
As Levahot et al10 wrote in their report of the patient whose clinician discovered a patient’s explicitly suicidal Facebook post, the incident “did not hinder the therapeutic alliance.” Instead, the team leader said, the discovery deepened the therapeutic relationship and helped the patient “better understand his mental illness and need for increased support.”
Bottom Line
Machine learning algorithms offer the possibility of analyzing status updates from patients who express suicidal ideation on social media and alerting clinicians to the need for early intervention. There are steps clinicians can take now, however, to take advantage of Facebook, in particular, to monitor and potentially prevent suicide attempts by those at high risk.
Related Resource
• Ahuja AK, Biesaga K, Sudak DM, et al. Suicide on Facebook. J Psychiatr Pract. 2014;20(2):141-146.
Acknowledgement
Zafar Sharif MD, Associate Clinical Professor of Psychiatry, Columbia University College of Physicians and Surgeons, and Director of Psychiatry, Harlem Hospital Center, New York, New York, and Michael Yogman MD, Assistant Clinical Professor of Pediatrics, Harvard Medical School, Boston Children’s Hospital, Boston, Massachusetts, provided insight into the topic and useful feedback on the manuscript of this article.
Disclosures
The authors report no financial relationships with any company whose products are mentioned in this article or with manufacturers of competing products.
1. Centers for Disease Control and Prevention. Web-based Injury Statistics Query and Reporting System (WISQARS) 2010. http://www.cdc.gov/injury/wisqars/index.html. Updated July 7, 2014. Accessed January 19, 2015.
2. Shioiri T, Nishimura A, Akazawa K, et al. Incidence of note-leaving remains constant despite increasing suicide rates. Psychiatr Clin Neurosci. 2005;59(2):226-228.
3. Barr W, Leitner M, Thomas J. Self-harm or attempted suicide? Do suicide notes help us decide the level of intent in those who survive? Accid Emerg Nurs. 2007;15(3):122-127.
4. Foster T. Suicide note themes and suicide prevention. Int J Psychiatry Med. 2003;33(4):323-331.
5. Bhatia MS, Verma SK, Murty OP. Suicide notes: psychological and clinical profile. Int J Psychiatry Med. 2006;36(2):163-170.
6. Jashinsky J, Burton SH, Hanson CL, et al. Tracking suicide risk factors through Twitter in the US. Crisis. 2014;35(1):51-59.
7. Facebook news room. Company info. http://newsroom. fb.com/company-info. Accessed January 7, 2015.
8. Ruder TD, Hatch GM, Ampanozi G, et al. Suicide announcement on Facebook. Crisis. 2011;32(5):280-282.
9. Luxton DD, June JD, Fairall JM. Social media and suicide: a public health perspective. Am J Public Health. 2012;102(suppl 2):S195-S200.
10. Lehavot K, Ben-Zeev D, Neville RE. Ethical considerations and social media: a case of suicidal postings on Facebook. Journal of Dual Diagnosis. 2012;8(4):341-346.
11. Bennett A, Pourmand A, Shokoohi H, et al. Impacts of social networking sites on patient care in the emergency department. Telemed J E Health. 2014;20(1):94-96.
12. How to report suicidal content/threats on Facebook. h t tps ://www. facebook.com/notes/amer ican-foundation-for-suicide-prevention/how-to-report-suicidal-contentthreats-on-facebook/10150090259398144. Published February 15, 2011. Accessed January 22, 2015.
13. Mohri M, Rostamizadeh A, Talwalker A. Foundations of machine learning (adaptive computation and machine learning series). Cambridge, MA: MIT Press; 2012:14.
14. Blázquez Gil G, Berlanga de Jesús A, Molina Lopéz JM. Combining machine learning techniques and natural language processing to infer emotions using Spanish Twitter corpus. Communications in Computer and Information Science. 2013;365:149-157.
15. Poulin C, Shiner B, Thompson P, et al. Predicting the risk of suicide by analyzing the text of clinical notes. PLoS One. 2014;9(1):e85733.
16. Pestian JP, Matykiewicz P, Linn-Gust M. What’s in a note: construction of a suicide note corpus. Biomed Inform Insights. 2012;5:1-6.
17. ConsumerReports.org. Facebook & your privacy. http:// www.consumerreports.org/cro/magazine/2012/06/ facebook-your-privacy/index.html. Published June 2012. Accessed January 22, 2015
Suicide is the tenth leading cause of death among Americans and the third leading cause among those age 15 to 24.1 As many as 36% of suicide victims leave a suicide note.2 Researchers have analyzed such notes with the aim of identifying specific content and patterns that might aid in creating more effective strategies for preventing suicide.3-5
One study found that the presence of a suicide note is an indicator of serious intent; that is, when the initial attempt fails, those who had left a suicide note were found to be at increased risk of subsequent completed suicide.4 Researchers also found that 75% of suicide notes contained the theme “apology/shame,” suggesting that many suicide victims might have welcomed an alternative to suicide to solve their personal predicament. Tragically, however, most suicide notes are not discovered until suicide has been attempted or completed.4
That’s where social media comes in. As platforms for self-expression, social networking sites such as Facebook, Twitter, and Tumblr are sources of real-time information that could aid in suicide prevention.6 With that in mind, we:
• present 2 cases in which a patient announced her suicidal ideation on Facebook
• consider the opportunities that social media present for early intervention
• propose high-tech monitoring methods for high-risk patients.
CASE 1 Major depressive disorder (MDD) and nonadherence
Ms. S, age 24, has a 4-year history of MDD and treatment nonadherence. She had no history of suicide attempt or inpatient treatment, but she had briefly engaged in psychotherapy before discontinuing visits. Physically healthy and employed as a security officer, Ms. S recently broke up with her boyfriend who had abused her physically—and against whom she had an order of protection.
On the day in question, Ms. S posted several status updates on Facebook expressing hopelessness, which, over the course of the day, escalated to expression of frank suicidal ideation:
• “I am ugly, no man would ever want to live with me.”
• “I have made no effect on the world and I’m just a waste of space.”
• “It’s sad that I want to die but such is life. We all die one day.”
• “I’m going to kill myself. It was nice knowing you world. Goodbye everyone.”
CASE 2 Substance abuse and previous suicide attempt
Ms. B, age 21, had a remote (approximately age 16) history of a suicide attempt and was actively abusing 3,4-methylenedioxymethamphetamine (MDMA [“Ecstasy,” “Molly”]) and Cannabis. She was not receiving outpatient care. One afternoon, Ms. B walked into the emergency department (ED) and said she had just taken 17 ibuprofen pills with the intent of killing herself.
On initial evaluation, Ms. B was irritable and uncooperative, denying all psychiatric symptoms and refusing to divulge details of her recent behavior. Her mother, who had not accompanied her daughter to the ED, reported that Ms. B had engaged in excessive risk-taking—speeding, driving while intoxicated, having multiple sex partners—for the past 5 years, resulting in several arrests for minor offenses, and she had been depressed and was sleeping and eating poorly in the 2 weeks leading up to the suicide attempt.
Two days ago, her mother added, Ms. B had posted disturbing notes on Facebook: ”Life is useless,” she declared in one post; “I’d be better off dead,” in another.
Suicidal content online
Worldwide, Facebook has 1.35 billion active users each month.7 Thus far, a limited number of posts indicating suicidal intent have been reported in the lay press,8 but evidence suggests that the use of social media for this purpose is an emerging trend.9
A search of the literature yielded only 3 case reports.8,10,11 In one case, a delayed response to a suicide note resulted in a failure to prevent the suicide.8 In another, a clinician’s discovery of a patient’s explicitly suicidal Facebook post led to what the team leader described as a more meaningful therapeutic relationship.10 The clinician’s discovery might have been pivotal in preventing the patient from committing suicide.
The authors of these case reports explored the idea of using Facebook for suicide prevention, raising a number of practical and ethical issues. Among them are the potential for immediate intervention by other Facebook users and the extent to which suicidal posts on social media sites induce copycat suicides.8
Issues associated with clinicians’ use of social media to follow or monitor patients include the ethical concepts of beneficence and nonmaleficence, privacy and confidentiality, clinical judgment, and informed consent,8,10 including potential benefit and harm and the difference between actual and perceived privacy violations. Bennett et al11 recommend developing guidelines for the use of social media to enhance medical care and provide appropriate protections to both patients and providers.
Reporting suicidal content. Although the primary purpose of Facebook is to give users the opportunity to share life events and thoughts with friends and family, the company does address the question of suicidal content in its Help Center (Box 1).12 As our 2 cases illustrate, however, intervention can be significantly delayed.
CASE 1 CONTINUED Call to 911
Fortunately for Ms. S, a friend who read her Facebook posts called 911; even then, however, 16 hours passed between the initial postings and the patient’s arrival at the ED. When emergency medical services brought Ms. S to the Comprehensive Psychiatry Emergency Program, she acknowledged suicidal ideation without an active plan. Other symptoms included depressed mood, a sense of hopelessness, feelings of worthlessness lasting >2 months, low self-esteem, dissatisfaction with body image, and a recent verbal altercation with a friend.
Ms. S was admitted to the inpatient unit for further observation and stabilization.
CASE 2 CONTINUED No one answered her calls
Ms. B, who did not arrive at the ED until 2 days after her suicidal posts, corroborated the history given by her mother. She also reported that she had attempted to reach out to her friends for support, but no one had answered her phone calls. She felt hurt because of this, Ms. B said, and impulsively ingested the pills.
Ms. B said she regretted the suicide attempt. Nevertheless, in light of her recent attempt and persistent distress, she was admitted to the inpatient unit for observation and stabilization.
Can artificial intelligence help?
There is no effective means of tracking high-risk patients after their first contact with the mental health system, despite the fact that (1) those who attempt suicide are at high risk of subsequent suicide attempts3 and (2) we have the potential to prevent future attempts based on self-expressed online cues. We propose machine learning algorithms—a branch of artificial intelligence—to capture and process suicide notes on Facebook in real time.
Machine learning can be broadly defined as computational methods using experience to improve performance or make accurate predictions. In this context, “experience” refers to past information, typically in the form of electronic data collected and analyzed to design accurate and efficient predictive algorithms. Machine learning, which incorporates fundamental concepts in computer science, as well as statistics, probability, and optimization, already has been established in a variety of applications, such as detecting e-mail spam, natural language processing, and computational biology.13
Affective computing, known as emotion-oriented computing, is a branch of artificial intelligence that involves the design of systems and devices that can recognize, interpret, and process human moods and emotions (Box 2).14
Prediction models, developed by Poulin et al15 to estimate the risk of suicide (based on keywords and multiword phrases from unstructured clinical notes from a national sample of U.S. Veterans Administration medical records), resulted in an inference accuracy of ≥65%. Pestian et al16 created and annotated a collection of suicide notes—a vital resource for scientists to use for machine learning and data mining. Machine learning algorithms based on such notes and clinical data might be used to capture alarming social media posts by high-risk patients and activate crisis management, with potentially life-saving results.
But limitations remain
It is not easy to identify or analyze people’s emotions based on social media posts; emotions can be implicit, based on specific events or situations. To distinguish among different emotions purely on the basis of keywords is to deal in great subtlety. Framing algorithms to include multiple parameters—the duration of suicidal content and the number of suicidal posts, for example—would help mitigate the risk of false alarms.
Another problem is that not all Facebook profiles are public. In fact, only 28% of users share all or most of their posts with anyone other than their friends.17 This limitation could be addressed by urging patients identified as being at high risk of suicide during an initial clinical encounter with a mental health provider to “friend” a generic Web page created by the hospital or clinic to protect patients’ privacy.
As Levahot et al10 wrote in their report of the patient whose clinician discovered a patient’s explicitly suicidal Facebook post, the incident “did not hinder the therapeutic alliance.” Instead, the team leader said, the discovery deepened the therapeutic relationship and helped the patient “better understand his mental illness and need for increased support.”
Bottom Line
Machine learning algorithms offer the possibility of analyzing status updates from patients who express suicidal ideation on social media and alerting clinicians to the need for early intervention. There are steps clinicians can take now, however, to take advantage of Facebook, in particular, to monitor and potentially prevent suicide attempts by those at high risk.
Related Resource
• Ahuja AK, Biesaga K, Sudak DM, et al. Suicide on Facebook. J Psychiatr Pract. 2014;20(2):141-146.
Acknowledgement
Zafar Sharif MD, Associate Clinical Professor of Psychiatry, Columbia University College of Physicians and Surgeons, and Director of Psychiatry, Harlem Hospital Center, New York, New York, and Michael Yogman MD, Assistant Clinical Professor of Pediatrics, Harvard Medical School, Boston Children’s Hospital, Boston, Massachusetts, provided insight into the topic and useful feedback on the manuscript of this article.
Disclosures
The authors report no financial relationships with any company whose products are mentioned in this article or with manufacturers of competing products.
1. Centers for Disease Control and Prevention. Web-based Injury Statistics Query and Reporting System (WISQARS) 2010. http://www.cdc.gov/injury/wisqars/index.html. Updated July 7, 2014. Accessed January 19, 2015.
2. Shioiri T, Nishimura A, Akazawa K, et al. Incidence of note-leaving remains constant despite increasing suicide rates. Psychiatr Clin Neurosci. 2005;59(2):226-228.
3. Barr W, Leitner M, Thomas J. Self-harm or attempted suicide? Do suicide notes help us decide the level of intent in those who survive? Accid Emerg Nurs. 2007;15(3):122-127.
4. Foster T. Suicide note themes and suicide prevention. Int J Psychiatry Med. 2003;33(4):323-331.
5. Bhatia MS, Verma SK, Murty OP. Suicide notes: psychological and clinical profile. Int J Psychiatry Med. 2006;36(2):163-170.
6. Jashinsky J, Burton SH, Hanson CL, et al. Tracking suicide risk factors through Twitter in the US. Crisis. 2014;35(1):51-59.
7. Facebook news room. Company info. http://newsroom. fb.com/company-info. Accessed January 7, 2015.
8. Ruder TD, Hatch GM, Ampanozi G, et al. Suicide announcement on Facebook. Crisis. 2011;32(5):280-282.
9. Luxton DD, June JD, Fairall JM. Social media and suicide: a public health perspective. Am J Public Health. 2012;102(suppl 2):S195-S200.
10. Lehavot K, Ben-Zeev D, Neville RE. Ethical considerations and social media: a case of suicidal postings on Facebook. Journal of Dual Diagnosis. 2012;8(4):341-346.
11. Bennett A, Pourmand A, Shokoohi H, et al. Impacts of social networking sites on patient care in the emergency department. Telemed J E Health. 2014;20(1):94-96.
12. How to report suicidal content/threats on Facebook. h t tps ://www. facebook.com/notes/amer ican-foundation-for-suicide-prevention/how-to-report-suicidal-contentthreats-on-facebook/10150090259398144. Published February 15, 2011. Accessed January 22, 2015.
13. Mohri M, Rostamizadeh A, Talwalker A. Foundations of machine learning (adaptive computation and machine learning series). Cambridge, MA: MIT Press; 2012:14.
14. Blázquez Gil G, Berlanga de Jesús A, Molina Lopéz JM. Combining machine learning techniques and natural language processing to infer emotions using Spanish Twitter corpus. Communications in Computer and Information Science. 2013;365:149-157.
15. Poulin C, Shiner B, Thompson P, et al. Predicting the risk of suicide by analyzing the text of clinical notes. PLoS One. 2014;9(1):e85733.
16. Pestian JP, Matykiewicz P, Linn-Gust M. What’s in a note: construction of a suicide note corpus. Biomed Inform Insights. 2012;5:1-6.
17. ConsumerReports.org. Facebook & your privacy. http:// www.consumerreports.org/cro/magazine/2012/06/ facebook-your-privacy/index.html. Published June 2012. Accessed January 22, 2015

Prescriber’s guide to using 3 new antidepressants: Vilazodone, levomilnacipran, vortioxetine
With a prevalence >17%, depression is one of the most common mental disorders in the United States and the second leading cause of disability worldwide.1,2 For decades, primary care and mental health providers have used selective serotonin reuptake inhibitors (SSRIs) as first-line treatment for depression—yet the remission rate after the first trial of an antidepressant is <30%, and continues to decline after a first antidepressant failure.3
That is why clinicians continue to seek effective treatments for depression—ones that will provide quick and sustainable remission—and why scientists and pharmaceutical manufacturers have been competing to develop more effective antidepressant medications.
In the past 4 years, the FDA has approved 3 antidepressants—vilazodone, levomilnacipran, and vortioxetine—with the hope of increasing options for patients who suffer from major depression. These 3 antidepressants differ in their mechanisms of action from other available antidepressants, and all have been shown to have acceptable safety and tolerability profiles.
In this article, we review these novel antidepressants and present some clinical pearls for their use. We also present our observations that each agent appears to show particular advantage in a certain subpopulation of depressed patients who often do not respond, or who do not adequately respond, to other antidepressants.
Vilazodone
Vilazodone was approved by the FDA in 2011 (Table 1). The drug increases serotonin bioavailability in synapses through a strong dual action:
• blocking serotonin reuptake through the serotonin transporter
• partial agonism of the 5-HT1A presynaptic receptor.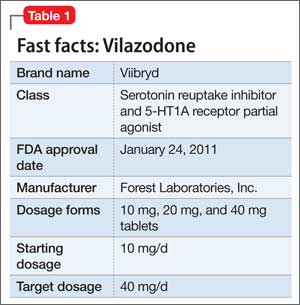
Vilazodone also has a moderate effect on the 5-HT4 receptor and on dopamine and norepinephrine uptake inhibition.
The unique presynaptic 5-HT1A partial agonism of vilazodone is similar to that of buspirone, in which both drugs initially inhibit serotonin synthesis and neuronal firing.4 Researchers therefore expected that vilazodone would be more suitable for patients who have depression and a comorbid anxiety disorder; current FDA approval, however, is for depression only.
Adverse effects. The 5-HT4 receptor on which vilazodone acts is present in the gastrointestinal (GI) tract, and contributes to regulating symptoms in patients with irritable bowel syndrome (IBS)5; not surprisingly, the most frequent adverse effects of vilazodone are GI in nature (diarrhea, nausea, vomiting).
Headache is the most common non- GI side effect of vilazodone. Depressed patients who took vilazodone had no significant weight gain and did not report adverse sexual effects, compared with subjects given placebo.6
The following case—a patient with depression, significant anxiety, and IBS— exemplifies the type of patient for whom we find vilazodone most useful.
CASE Ms. A, age 19, is a college student with a history of major depressive disorder, social anxiety, and panic attacks for 2 years and IBS for 3 years. She was taking lubiprostone for IBS, with incomplete relief of GI symptoms. Because the family history included depression in Ms. A’s mother and sister, and both were doing well on escitalopram, we began a trial of that drug, 10 mg/d, that was quickly titrated to 20 mg/d.
Ms. A did not respond to 20 mg of escitalopram combined with psychotherapy.
We then started vilazodone, 10 mg/d after breakfast, for the first week, and reduced escitalopram to 10 mg/d. During Week 2, escitalopram was discontinued and vilazodone was increased to 20 mg/d. During Week 3, vilazodone was titrated to 40 mg/d.
Ms. A tolerated vilazodone well. Her depressive symptoms improved at the end of Week 2.
Unlike her experience with escitalopram, Ms. A’s anxiety symptoms—tenseness, racing thoughts, and panic attacks—all diminished when she switched to vilazodone. Notably, her IBS symptoms also were relieved, and she discontinued lubiprostone.
Ms. A’s depression remained in remission for 2 years, except for a brief period one summer, when she thought she “could do without any medication.” She tapered the vilazodone, week by week, to 10 mg/d, but her anxiety and bowel symptoms resurfaced to a degree that she resumed the 40-mg/d dosage.
Levomilnacipran
This drug is a 2013 addition to the small serotonin–norepinephrine reuptake inhibitor (SNRI) family of venlafaxine, desvenlafaxine, and duloxetine7 (Table 2). Levomilnacipran is the enantiomer of milnacipran, approved in Europe for depression but only for fibromyalgia pain and peripheral neuropathy in the United States.8 (Levomilnacipran is not FDA-approved for treating fibromyalgia pain.)
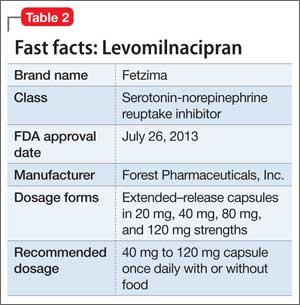
Levomilnacipran is unique because it is more of an NSRI, so to speak, than an SNRI: That is, the drug’s uptake inhibition of norepinephrine is more potent than its serotonin inhibition. Theoretically, levomilnacipran should help improve cognitive functions linked to the action of norepinephrine, such as concentration and motivation, and in turn, improve social function. The FDA also has approved levomilnacipran for treating functional impairment in depression.9
Adverse effects. The norepinephrine uptake inhibition of levomilnacipran might be responsible for observed increases in heart rate and blood pressure in some patients, and dose-dependent urinary hesitancy and erectile dysfunction in others. The drug has no significant effect on weight in depressed patients, compared with placebo.
Continue to: The benefits of levomilnacipran
The following case illustrates the benefits of levomilnacipran in a depressed patient who suffers from chronic pain and impaired social function.
CASE Mrs. C, age 44, was referred by her outpatient psychologist and her primary care provider for management of refractory depression. She did not respond to an SSRI, an SNRI, or augmentation with bupropion and aripiprazole.
Mrs. C was on disability leave from work because of depression and cervical spine pain that might have been related to repetitive movement as a telephone customer service representative. She complained of loss of motivation, fatigue, and high anxiety about returning to work because of the many unhappy customers she felt she had to soothe.
Levomilnacipran was started at 20 mg/d for 2 days, then titrated to 40 mg/d for 5 days, 80 mg/d for 1 week, and 120 mg/d thereafter. Her previous antidepressants, fluoxetine and bupropion, were discontinued while levomilnacipran was titrated.
Mrs. C continued to receive weekly psychotherapy and physical therapy and to take tizanidine, a muscle relaxant, and over-the-counter medications for pain. Her Patient Health Questionnaire (PHQ-9) score declined from 13 when levomilnacipran was started to 5 at the next visit, 6 weeks later.
Within 4 months of initiating levomilnacipran, Mrs. C returned to work with a series of cue cards to use when speaking with irate or unhappy customers. At that point, her cervical spine pain was barely noticeable and no longer interfered with function.
Vortioxetine
This agent has a novel multimodal mechanism of action (Table 3). It is an SSRI as well as a 5-HT1A full agonist and 5-HT3 receptor antagonist. Vortioxetine also has an inhibitory effect on 5-HT7 and 5-HT1D receptors and partial agonism of 5-HT1B receptors.
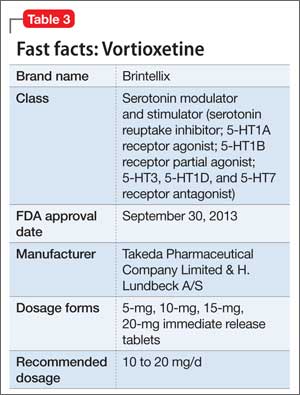
The downstream effect of this multimodal action is an increase in dopamine, norepinephrine, and acetylcholine activity in the prefrontal cortex.10 These downstream effects are thought to help restore some cognitive deficits associated with depression.11
Vortioxetine is the only antidepressant among the 3 discussed in this article that was studied over a long period to ensure that short-term benefits continue beyond the 6- to 8-week acute Phase-III studies. A high remission rate (61%) was observed in patients who were treated on an open-label basis with vortioxetine, 10 mg/d, then randomized to maintenance with vortioxetine or placebo.12
Older patients. Vortioxetine is unique among these 3 antidepressants in that it is the only one studied separately in geriatric patients: In an 8-week Phase-III trial, 452 geriatric patients age 64 to 88 were randomized to 5 mg/d of vortioxetine or placebo.13 Vortioxetine was significantly more effective than placebo at Week 6.
Vortioxetine also is the only antidepressant investigated for an effect on cognitive deficits: In a Phase-III double-blind, placebo-controlled study of 602 patients with major depressive disorder, using duloxetine as active reference, vortioxetine was found to have a significant effect on Digit Symbol Substitution Test scores, compared with placebo, independent of its antidepressant effect (ie, patients who did not show any antidepressant benefit still showed an improvement in attention, speed processing, memory, and executive function).14
We have found, therefore, that vortioxetine is helpful for depressed patients who have cognitive deficits, especially geriatric patients.
CASE Mrs. B, age 84, married, has a 4-year history of depression. She has taken several antidepressants with little consistent relief.
A brief psychiatric hospitalization 2 years ago temporarily reduced the severity of Mrs. B’s depression; gradually, she relapsed. She felt hopeless and resisted another psychiatric evaluation. Mrs. B’s family includes several clinicians, who wondered if she was developing cognitive deficits that were interfering with her recovery.
At initial evaluation, Mrs. B failed to recall 2 of 3 objects but performed the clock drawing test perfectly—qualifying her for a diagnosis of mild cognitive impairment in addition to major depression. Her PHQ-9 score at baseline was 22.
On the assumption that the severity of her depression was contributing to cognitive deficits, vortioxetine, 5 mg/d, was initiated for 2 weeks and then titrated to 10 mg/d.
At 4 weeks’ follow-up, Mrs. B passed the Mini-Cog test; her PHQ-9 score fell to 8. She has remained asymptomatic for 6 months at the 10-mg/d dosage; her lowest PHQ-9 score was 5.
Adverse effects. The most common adverse effects are mild or moderate GI in nature. Weight gain and adverse sexual effects were not significantly different among patients receiving vortioxetine than among patients given placebo.
A note about the safety of these agents
All 3 of these antidepressants carry the standard black-box warning about the elevated risk of suicide in patients taking an antidepressant. None of them are approved for patients age <18.
Continue to: Suicidal ideation was reported
Suicidal ideation was reported in 11.2% of patients taking vortioxetine, compared with 12.5% of those given placebo15; 24% of patients taking levomilnacipran reported suicidal ideation, compared with 22% of those who took placebo.16 In a long-term study of 599 patients taking vilazodone, 4 given placebo exhibited suicidal behavior, compared with 2 who took vilazodone.17
Drug-drug interactions are an important consideration when vilazodone, levomilnacipran, and vortioxetine are prescribed in combination with other medications. See the following discussion.
Vilazodone should be taken with food because it has 72% bioavailability after a meal.18 The drug is metabolized primarily by cytochrome P (CYP) 3A4 and CYP3A5; it does not affect CYP substrates or, it’s likely, produce significant changes to other medications metabolized by the CYP pathway.
Conversely, the dosage of vilazodone should be reduced to 20 mg/d if it is co- administered with a strong CYP3A4 inhibitor (eg, ketoconazole). The dosage should be increased as much as 2-fold when vilazodone is used concomitantly used with a strong CYP3A4 inducer (eg, carbamazepine) for >14 days. The maximum daily dosage should not exceed 80 mg/d.
Levomilnacipran. Unlike vilazodone and vortioxetine, levomilnacipran is affected by renal function.19 Concomitant medications, however, including those that influence CYP renal transporters (particularly CYP3A4, which metabolizes levomilnacipran), do not show an impact on the blood level of levomilnacipran.
No dosage adjustment is needed for patients who have mild renal impairment, but the maintenance dosage of levomilnacipran for patients who have moderate or severe renal impairment should not exceed 80 mg/d in 1 dose, and 60 mg/d in 1 dose, respectively.20
Vortioxetine. Seventy percent of a dose of vortioxetine is absorbed independent of food; the drug has a half-life of 66 hours. Vortioxetine is metabolized primarily by the CYP450 enzyme system, including 2D6, and, to a lesser extent, by CYP3A4, CYP3A5, CYP2C9, and CYP2C19.21
Vortioxetine has minimal effect on P450 substrates in in vitro studies, which was confirmed in 4 other in vivo studies.21-23 In studies of hormonal contraception, bupropion, and omeprazole, vortioxetine did not produce significant changes in the blood level of the other medications. The blood level of vortioxetine increased by 128% when taken with the CYP2D6 inhibitor bupropion,24 but the blood level did not markedly change with other inhibitors because the drug utilizes uses several CYP pathways. Use caution, therefore, when adding bupropion to vortioxetine because the combination elevates the risk of nausea, diarrhea, and headache.
With each agent, specific benefit
Vilazodone, levomilnacipran, and vortioxetine each add distinct benefit to the clinician’s toolbox of treatments for major depressive disorder. Although all antidepressants to some extent alleviate anxiety and pain and reverse cognitive decline associated with depression, our experience suggests using vilazodone for anxious depressed patients; levomilnacipran for depressed patients who experience pain; and vortioxetine for depressed patients who suffer cognitive decline and for geriatric patients.
Bottom Line
The FDA has approved 3 antidepressants in the past 4 years: vilazodone, levomilnacipran, and vortioxetine. The hope is that these agents will bolster treatment options for major depression—perhaps especially so, as we have seen, in the anxious depressed (vilazodone), the depressed in pain (levomilnacipran), and the depressed with cognitive decline, or geriatric patients (vortioxetine).
Related Resources
• Kalia R, Mittal M, Preskorn S. Vilazodone for major depressive disorder. Current Psychiatry. 2011;10(4):84-86,88.
• Lincoln J, Wehler C. Vortioxetine for major depressive disorder. Current Psychiatry. 2014;13(2):67-70.
• Macaluso M, Kazanchi H, Malhotra V. Levomilnacipran for the treatment of major depressive disorder. Current Psychiatry. 2013;12(12):50-52,54,55.
• McIntyre RS, Lophaven S, Olsen CK. A randomized, double-blind, placebo-controlled study of vortioxetine on cognitive function in depressed adults. Int J Neuropsychopharmacol. 2014;17(10):1557-1567.
• Thase ME, Chen D, Edwards J, et al. Efficacy of vilazodone on anxiety symptoms in patients with major depressive disorder. Int Clin Psychopharmacol. 2014;29(6):351-356.
Drug Brand Names
Aripiprazole • Abilify Levomilnacipran • Fetzima
Bupropion • Wellbutrin, Zyban Lubiprostone • Amitiza
Buspirone • BuSpar Milnacipran • Savella
Carbamazepine • Tegretol, Equetro Omeprazole • Prilosec
Desvenlafaxine • Pristiq Tizanidine • Zanaflex
Duloxetine • Cymbalta Venlafaxine • Effexor
Escitalopram • Lexapro Vilazodone • Viibryd
Fluoxetine • Prozac Vortioxetine • Brintellix
Ketoconazole • Nizoral
1. Andrade L, Caraveo-Anduaga JJ, Berglund P, et al. The epidemiology of major depressive episodes: results from the International Consortium of Psychiatric Epidemiology (ICPE) Surveys. Int J Methods Psychiatr Res. 2003;12(1):3-21.
2. Ferrari AJ, Charlson FJ, Norman RE, et al. Burden of depressive disorders by country, sex, age, and year: findings from the global burden of disease study 2010. PLoS Med. 2013;10(11):e1001547.
3. Warden D, Rush AJ, Trivedi MH, et al. The STAR*D Project results: a comprehensive review of findings. Curr Psychiatry Rep. 2007;9(6):449-459.
4. Khan A. Vilazodone, a novel dual-acting serotonergic antidepressant for managing major depression. Expert Opin Investig Drugs. 2009;18(11):1753-1764.
5. Khan A, Sambunaris A, Edwards J, et al. Vilazodone in the treatment of major depressive disorder: efficacy across symptoms and severity of depression. Int Clin Psychopharmacol. 2014;29(2):86-92.
6. Robinson DS, Kajdasz DK, Gallipoli S, et al. A 1-year, open-label study assessing the safety and tolerability of vilazodone in patients with major depressive disorder. J Clin Psychopharmacol. 2011;31(5):643-646.
7. Saraceni MM, Venci JV, Gandhi MA. Levomilnacipran (Fetzima): a new serotonin-norepinephrine reuptake inhibitor for the treatment of major depressive disorder. J Pharm Pract. 2013;27(4):389-395.
8. Deardorff WJ, Grossberg GT. A review of the clinical efficacy, safety and tolerability of the antidepressants vilazodone, levomilnacipran and vortioxetine. Expert Opin Pharmacother. 2014;15(17):2525-2542.
9. Citrome L. Levomilnacipran for major depressive disorder: a systematic review of the efficacy and safety profile for this newly approved antidepressant—what is the number needed to treat, number needed to harm and likelihood to be helped or harmed? Int J Clin Pract. 2013;67(11):1089-1104.
10. Mørk A, Pehrson A, Brennum LT, et al. Pharmacological effects of Lu AA21004: a novel multimodal compound for the treatment of major depressive disorder. J Pharmacol Exp Ther. 2012;340(3):666-675.
11. Pehrson AL, Leiser SC, Gulinello M, et al. Treatment of cognitive dysfunction in major depressive disorder-a review of the preclinical evidence for efficacy of selective serotonin reuptake inhibitors, serotonin-norepinephrine reuptake inhibitors and the multimodal-acting antidepressant vortioxetine [published online August 5, 2014]. Eur J Pharmacol. doi: 10.1016/j.ejphar.2014.07.044.
12. Baldwin DS, Hansen T, Florea I. Vortioxetine (Lu AA21004) in the long-term open-label treatment of major depressive disorder. Curr Med Res Opin. 2012;28(10):1717-1724.
13. Katona C, Hansen T, Olsen CK. A randomized, double-blind, placebo-controlled, duloxetine-referenced, fixed-dose study comparing the efficacy and safety of Lu AA21004 in elderly patients with major depressive disorder. Int Clin Psychopharmacol. 2012;27(4):215-523.
14. Raskin J, Wiltse CG, Siegal A, et al. Efficacy of duloxetine on cognition, depression, and pain in elderly patients with major depressive disorder: an 8-week, double-blind, placebo-controlled trial. Am J Psychiatry. 2007;164(6): 900-909.
15. Boulenger JP, Loft H, Olsen CK. Efficacy and safety of vortioxetine (Lu AA21004), 15 and 20 mg/day: a randomized, double-blind, placebo-controlled, duloxetine-referenced study in the acute treatment of adult patients with major depressive disorder. Int Clin Psychopharmacol. 2014;29(3):138-149.
16. Mago R, Forero G, Greenberg WM, et al. Safety and tolerability of levomilnacipran ER in major depressive disorder: results from an open-label, 48-week extension study. Clin Drug Investig. 2013;33(10):761-771.
17. Khan A, Sambunaris A, Edwards J, et al. Vilazodone in the treatment of major depressive disorder: efficacy across symptoms and severity of depression. Int Clin Psychopharmacol. 2014;29(2):86-92.
18. Boinpally R, Gad N, Gupta S, et al. Influence of CYP3A4 induction/inhibition on the pharmacokinetics of vilazodone in healthy subjects. Clin Ther. 2014; 36(11):1638-1649.
19. Chen L, Boinpally R, Greenberg WM, et al. Effect of hepatic impairment on the pharmacokinetics of levomilnacipran following a single oral dose of a levomilnacipran extended-release capsule in human participants. Clin Drug Investig. 2014;34(5):351-359.
20. Asnis GM, Bose A, Gommoll CP, et al. Efficacy and safety of levomilnacipran sustained release 40 mg, 80 mg, or 120 mg in major depressive disorder: a phase 3, randomized, double-blind, placebo-controlled study. J Clin Psychiatry. 2013;74(3):242-248.
21. Hvenegaard MG, Bang-Andersen B, Pedersen H, et al. Identification of the cytochrome P450 and other enzymes involved in the in vitro oxidative metabolism of a novel antidepressant, Lu AA21004. Drug Metab Dispos. 2012; 40(7):1357-1365.
22. Chen G, Lee R, Højer AM, et al. Pharmacokinetic drug interactions involving vortioxetine (Lu AA21004), a multimodal antidepressant. Clin Drug Investig. 2013; 33(10):727-736.
23. Areberg J, Søgaard B, Højer AM. The clinical pharmacokinetics of Lu AA21004 and its major metabolite in healthy young volunteers. Basic Clin Pharmacol Toxicol. 2012;111(3):198-205.
24. Areberg J, Petersen KB, Chen G, et al. Population pharmacokinetic meta-analysis of vortioxetine in healthy individuals. Basic Clin Pharmacol Toxicol. 2014;115(6):552-559.
With a prevalence >17%, depression is one of the most common mental disorders in the United States and the second leading cause of disability worldwide.1,2 For decades, primary care and mental health providers have used selective serotonin reuptake inhibitors (SSRIs) as first-line treatment for depression—yet the remission rate after the first trial of an antidepressant is <30%, and continues to decline after a first antidepressant failure.3
That is why clinicians continue to seek effective treatments for depression—ones that will provide quick and sustainable remission—and why scientists and pharmaceutical manufacturers have been competing to develop more effective antidepressant medications.
In the past 4 years, the FDA has approved 3 antidepressants—vilazodone, levomilnacipran, and vortioxetine—with the hope of increasing options for patients who suffer from major depression. These 3 antidepressants differ in their mechanisms of action from other available antidepressants, and all have been shown to have acceptable safety and tolerability profiles.
In this article, we review these novel antidepressants and present some clinical pearls for their use. We also present our observations that each agent appears to show particular advantage in a certain subpopulation of depressed patients who often do not respond, or who do not adequately respond, to other antidepressants.
Vilazodone
Vilazodone was approved by the FDA in 2011 (Table 1). The drug increases serotonin bioavailability in synapses through a strong dual action:
• blocking serotonin reuptake through the serotonin transporter
• partial agonism of the 5-HT1A presynaptic receptor.
Vilazodone also has a moderate effect on the 5-HT4 receptor and on dopamine and norepinephrine uptake inhibition.
The unique presynaptic 5-HT1A partial agonism of vilazodone is similar to that of buspirone, in which both drugs initially inhibit serotonin synthesis and neuronal firing.4 Researchers therefore expected that vilazodone would be more suitable for patients who have depression and a comorbid anxiety disorder; current FDA approval, however, is for depression only.
Adverse effects. The 5-HT4 receptor on which vilazodone acts is present in the gastrointestinal (GI) tract, and contributes to regulating symptoms in patients with irritable bowel syndrome (IBS)5; not surprisingly, the most frequent adverse effects of vilazodone are GI in nature (diarrhea, nausea, vomiting).
Headache is the most common non- GI side effect of vilazodone. Depressed patients who took vilazodone had no significant weight gain and did not report adverse sexual effects, compared with subjects given placebo.6
The following case—a patient with depression, significant anxiety, and IBS— exemplifies the type of patient for whom we find vilazodone most useful.
CASE Ms. A, age 19, is a college student with a history of major depressive disorder, social anxiety, and panic attacks for 2 years and IBS for 3 years. She was taking lubiprostone for IBS, with incomplete relief of GI symptoms. Because the family history included depression in Ms. A’s mother and sister, and both were doing well on escitalopram, we began a trial of that drug, 10 mg/d, that was quickly titrated to 20 mg/d.
Ms. A did not respond to 20 mg of escitalopram combined with psychotherapy.
We then started vilazodone, 10 mg/d after breakfast, for the first week, and reduced escitalopram to 10 mg/d. During Week 2, escitalopram was discontinued and vilazodone was increased to 20 mg/d. During Week 3, vilazodone was titrated to 40 mg/d.
Ms. A tolerated vilazodone well. Her depressive symptoms improved at the end of Week 2.
Unlike her experience with escitalopram, Ms. A’s anxiety symptoms—tenseness, racing thoughts, and panic attacks—all diminished when she switched to vilazodone. Notably, her IBS symptoms also were relieved, and she discontinued lubiprostone.
Ms. A’s depression remained in remission for 2 years, except for a brief period one summer, when she thought she “could do without any medication.” She tapered the vilazodone, week by week, to 10 mg/d, but her anxiety and bowel symptoms resurfaced to a degree that she resumed the 40-mg/d dosage.
Levomilnacipran
This drug is a 2013 addition to the small serotonin–norepinephrine reuptake inhibitor (SNRI) family of venlafaxine, desvenlafaxine, and duloxetine7 (Table 2). Levomilnacipran is the enantiomer of milnacipran, approved in Europe for depression but only for fibromyalgia pain and peripheral neuropathy in the United States.8 (Levomilnacipran is not FDA-approved for treating fibromyalgia pain.)
Levomilnacipran is unique because it is more of an NSRI, so to speak, than an SNRI: That is, the drug’s uptake inhibition of norepinephrine is more potent than its serotonin inhibition. Theoretically, levomilnacipran should help improve cognitive functions linked to the action of norepinephrine, such as concentration and motivation, and in turn, improve social function. The FDA also has approved levomilnacipran for treating functional impairment in depression.9
Adverse effects. The norepinephrine uptake inhibition of levomilnacipran might be responsible for observed increases in heart rate and blood pressure in some patients, and dose-dependent urinary hesitancy and erectile dysfunction in others. The drug has no significant effect on weight in depressed patients, compared with placebo.
Continue to: The benefits of levomilnacipran
The following case illustrates the benefits of levomilnacipran in a depressed patient who suffers from chronic pain and impaired social function.
CASE Mrs. C, age 44, was referred by her outpatient psychologist and her primary care provider for management of refractory depression. She did not respond to an SSRI, an SNRI, or augmentation with bupropion and aripiprazole.
Mrs. C was on disability leave from work because of depression and cervical spine pain that might have been related to repetitive movement as a telephone customer service representative. She complained of loss of motivation, fatigue, and high anxiety about returning to work because of the many unhappy customers she felt she had to soothe.
Levomilnacipran was started at 20 mg/d for 2 days, then titrated to 40 mg/d for 5 days, 80 mg/d for 1 week, and 120 mg/d thereafter. Her previous antidepressants, fluoxetine and bupropion, were discontinued while levomilnacipran was titrated.
Mrs. C continued to receive weekly psychotherapy and physical therapy and to take tizanidine, a muscle relaxant, and over-the-counter medications for pain. Her Patient Health Questionnaire (PHQ-9) score declined from 13 when levomilnacipran was started to 5 at the next visit, 6 weeks later.
Within 4 months of initiating levomilnacipran, Mrs. C returned to work with a series of cue cards to use when speaking with irate or unhappy customers. At that point, her cervical spine pain was barely noticeable and no longer interfered with function.
Vortioxetine
This agent has a novel multimodal mechanism of action (Table 3). It is an SSRI as well as a 5-HT1A full agonist and 5-HT3 receptor antagonist. Vortioxetine also has an inhibitory effect on 5-HT7 and 5-HT1D receptors and partial agonism of 5-HT1B receptors.
The downstream effect of this multimodal action is an increase in dopamine, norepinephrine, and acetylcholine activity in the prefrontal cortex.10 These downstream effects are thought to help restore some cognitive deficits associated with depression.11
Vortioxetine is the only antidepressant among the 3 discussed in this article that was studied over a long period to ensure that short-term benefits continue beyond the 6- to 8-week acute Phase-III studies. A high remission rate (61%) was observed in patients who were treated on an open-label basis with vortioxetine, 10 mg/d, then randomized to maintenance with vortioxetine or placebo.12
Older patients. Vortioxetine is unique among these 3 antidepressants in that it is the only one studied separately in geriatric patients: In an 8-week Phase-III trial, 452 geriatric patients age 64 to 88 were randomized to 5 mg/d of vortioxetine or placebo.13 Vortioxetine was significantly more effective than placebo at Week 6.
Vortioxetine also is the only antidepressant investigated for an effect on cognitive deficits: In a Phase-III double-blind, placebo-controlled study of 602 patients with major depressive disorder, using duloxetine as active reference, vortioxetine was found to have a significant effect on Digit Symbol Substitution Test scores, compared with placebo, independent of its antidepressant effect (ie, patients who did not show any antidepressant benefit still showed an improvement in attention, speed processing, memory, and executive function).14
We have found, therefore, that vortioxetine is helpful for depressed patients who have cognitive deficits, especially geriatric patients.
CASE Mrs. B, age 84, married, has a 4-year history of depression. She has taken several antidepressants with little consistent relief.
A brief psychiatric hospitalization 2 years ago temporarily reduced the severity of Mrs. B’s depression; gradually, she relapsed. She felt hopeless and resisted another psychiatric evaluation. Mrs. B’s family includes several clinicians, who wondered if she was developing cognitive deficits that were interfering with her recovery.
At initial evaluation, Mrs. B failed to recall 2 of 3 objects but performed the clock drawing test perfectly—qualifying her for a diagnosis of mild cognitive impairment in addition to major depression. Her PHQ-9 score at baseline was 22.
On the assumption that the severity of her depression was contributing to cognitive deficits, vortioxetine, 5 mg/d, was initiated for 2 weeks and then titrated to 10 mg/d.
At 4 weeks’ follow-up, Mrs. B passed the Mini-Cog test; her PHQ-9 score fell to 8. She has remained asymptomatic for 6 months at the 10-mg/d dosage; her lowest PHQ-9 score was 5.
Adverse effects. The most common adverse effects are mild or moderate GI in nature. Weight gain and adverse sexual effects were not significantly different among patients receiving vortioxetine than among patients given placebo.
A note about the safety of these agents
All 3 of these antidepressants carry the standard black-box warning about the elevated risk of suicide in patients taking an antidepressant. None of them are approved for patients age <18.
Continue to: Suicidal ideation was reported
Suicidal ideation was reported in 11.2% of patients taking vortioxetine, compared with 12.5% of those given placebo15; 24% of patients taking levomilnacipran reported suicidal ideation, compared with 22% of those who took placebo.16 In a long-term study of 599 patients taking vilazodone, 4 given placebo exhibited suicidal behavior, compared with 2 who took vilazodone.17
Drug-drug interactions are an important consideration when vilazodone, levomilnacipran, and vortioxetine are prescribed in combination with other medications. See the following discussion.
Vilazodone should be taken with food because it has 72% bioavailability after a meal.18 The drug is metabolized primarily by cytochrome P (CYP) 3A4 and CYP3A5; it does not affect CYP substrates or, it’s likely, produce significant changes to other medications metabolized by the CYP pathway.
Conversely, the dosage of vilazodone should be reduced to 20 mg/d if it is co- administered with a strong CYP3A4 inhibitor (eg, ketoconazole). The dosage should be increased as much as 2-fold when vilazodone is used concomitantly used with a strong CYP3A4 inducer (eg, carbamazepine) for >14 days. The maximum daily dosage should not exceed 80 mg/d.
Levomilnacipran. Unlike vilazodone and vortioxetine, levomilnacipran is affected by renal function.19 Concomitant medications, however, including those that influence CYP renal transporters (particularly CYP3A4, which metabolizes levomilnacipran), do not show an impact on the blood level of levomilnacipran.
No dosage adjustment is needed for patients who have mild renal impairment, but the maintenance dosage of levomilnacipran for patients who have moderate or severe renal impairment should not exceed 80 mg/d in 1 dose, and 60 mg/d in 1 dose, respectively.20
Vortioxetine. Seventy percent of a dose of vortioxetine is absorbed independent of food; the drug has a half-life of 66 hours. Vortioxetine is metabolized primarily by the CYP450 enzyme system, including 2D6, and, to a lesser extent, by CYP3A4, CYP3A5, CYP2C9, and CYP2C19.21
Vortioxetine has minimal effect on P450 substrates in in vitro studies, which was confirmed in 4 other in vivo studies.21-23 In studies of hormonal contraception, bupropion, and omeprazole, vortioxetine did not produce significant changes in the blood level of the other medications. The blood level of vortioxetine increased by 128% when taken with the CYP2D6 inhibitor bupropion,24 but the blood level did not markedly change with other inhibitors because the drug utilizes uses several CYP pathways. Use caution, therefore, when adding bupropion to vortioxetine because the combination elevates the risk of nausea, diarrhea, and headache.
With each agent, specific benefit
Vilazodone, levomilnacipran, and vortioxetine each add distinct benefit to the clinician’s toolbox of treatments for major depressive disorder. Although all antidepressants to some extent alleviate anxiety and pain and reverse cognitive decline associated with depression, our experience suggests using vilazodone for anxious depressed patients; levomilnacipran for depressed patients who experience pain; and vortioxetine for depressed patients who suffer cognitive decline and for geriatric patients.
Bottom Line
The FDA has approved 3 antidepressants in the past 4 years: vilazodone, levomilnacipran, and vortioxetine. The hope is that these agents will bolster treatment options for major depression—perhaps especially so, as we have seen, in the anxious depressed (vilazodone), the depressed in pain (levomilnacipran), and the depressed with cognitive decline, or geriatric patients (vortioxetine).
Related Resources
• Kalia R, Mittal M, Preskorn S. Vilazodone for major depressive disorder. Current Psychiatry. 2011;10(4):84-86,88.
• Lincoln J, Wehler C. Vortioxetine for major depressive disorder. Current Psychiatry. 2014;13(2):67-70.
• Macaluso M, Kazanchi H, Malhotra V. Levomilnacipran for the treatment of major depressive disorder. Current Psychiatry. 2013;12(12):50-52,54,55.
• McIntyre RS, Lophaven S, Olsen CK. A randomized, double-blind, placebo-controlled study of vortioxetine on cognitive function in depressed adults. Int J Neuropsychopharmacol. 2014;17(10):1557-1567.
• Thase ME, Chen D, Edwards J, et al. Efficacy of vilazodone on anxiety symptoms in patients with major depressive disorder. Int Clin Psychopharmacol. 2014;29(6):351-356.
Drug Brand Names
Aripiprazole • Abilify Levomilnacipran • Fetzima
Bupropion • Wellbutrin, Zyban Lubiprostone • Amitiza
Buspirone • BuSpar Milnacipran • Savella
Carbamazepine • Tegretol, Equetro Omeprazole • Prilosec
Desvenlafaxine • Pristiq Tizanidine • Zanaflex
Duloxetine • Cymbalta Venlafaxine • Effexor
Escitalopram • Lexapro Vilazodone • Viibryd
Fluoxetine • Prozac Vortioxetine • Brintellix
Ketoconazole • Nizoral
1. Andrade L, Caraveo-Anduaga JJ, Berglund P, et al. The epidemiology of major depressive episodes: results from the International Consortium of Psychiatric Epidemiology (ICPE) Surveys. Int J Methods Psychiatr Res. 2003;12(1):3-21.
2. Ferrari AJ, Charlson FJ, Norman RE, et al. Burden of depressive disorders by country, sex, age, and year: findings from the global burden of disease study 2010. PLoS Med. 2013;10(11):e1001547.
3. Warden D, Rush AJ, Trivedi MH, et al. The STAR*D Project results: a comprehensive review of findings. Curr Psychiatry Rep. 2007;9(6):449-459.
4. Khan A. Vilazodone, a novel dual-acting serotonergic antidepressant for managing major depression. Expert Opin Investig Drugs. 2009;18(11):1753-1764.
5. Khan A, Sambunaris A, Edwards J, et al. Vilazodone in the treatment of major depressive disorder: efficacy across symptoms and severity of depression. Int Clin Psychopharmacol. 2014;29(2):86-92.
6. Robinson DS, Kajdasz DK, Gallipoli S, et al. A 1-year, open-label study assessing the safety and tolerability of vilazodone in patients with major depressive disorder. J Clin Psychopharmacol. 2011;31(5):643-646.
7. Saraceni MM, Venci JV, Gandhi MA. Levomilnacipran (Fetzima): a new serotonin-norepinephrine reuptake inhibitor for the treatment of major depressive disorder. J Pharm Pract. 2013;27(4):389-395.
8. Deardorff WJ, Grossberg GT. A review of the clinical efficacy, safety and tolerability of the antidepressants vilazodone, levomilnacipran and vortioxetine. Expert Opin Pharmacother. 2014;15(17):2525-2542.
9. Citrome L. Levomilnacipran for major depressive disorder: a systematic review of the efficacy and safety profile for this newly approved antidepressant—what is the number needed to treat, number needed to harm and likelihood to be helped or harmed? Int J Clin Pract. 2013;67(11):1089-1104.
10. Mørk A, Pehrson A, Brennum LT, et al. Pharmacological effects of Lu AA21004: a novel multimodal compound for the treatment of major depressive disorder. J Pharmacol Exp Ther. 2012;340(3):666-675.
11. Pehrson AL, Leiser SC, Gulinello M, et al. Treatment of cognitive dysfunction in major depressive disorder-a review of the preclinical evidence for efficacy of selective serotonin reuptake inhibitors, serotonin-norepinephrine reuptake inhibitors and the multimodal-acting antidepressant vortioxetine [published online August 5, 2014]. Eur J Pharmacol. doi: 10.1016/j.ejphar.2014.07.044.
12. Baldwin DS, Hansen T, Florea I. Vortioxetine (Lu AA21004) in the long-term open-label treatment of major depressive disorder. Curr Med Res Opin. 2012;28(10):1717-1724.
13. Katona C, Hansen T, Olsen CK. A randomized, double-blind, placebo-controlled, duloxetine-referenced, fixed-dose study comparing the efficacy and safety of Lu AA21004 in elderly patients with major depressive disorder. Int Clin Psychopharmacol. 2012;27(4):215-523.
14. Raskin J, Wiltse CG, Siegal A, et al. Efficacy of duloxetine on cognition, depression, and pain in elderly patients with major depressive disorder: an 8-week, double-blind, placebo-controlled trial. Am J Psychiatry. 2007;164(6): 900-909.
15. Boulenger JP, Loft H, Olsen CK. Efficacy and safety of vortioxetine (Lu AA21004), 15 and 20 mg/day: a randomized, double-blind, placebo-controlled, duloxetine-referenced study in the acute treatment of adult patients with major depressive disorder. Int Clin Psychopharmacol. 2014;29(3):138-149.
16. Mago R, Forero G, Greenberg WM, et al. Safety and tolerability of levomilnacipran ER in major depressive disorder: results from an open-label, 48-week extension study. Clin Drug Investig. 2013;33(10):761-771.
17. Khan A, Sambunaris A, Edwards J, et al. Vilazodone in the treatment of major depressive disorder: efficacy across symptoms and severity of depression. Int Clin Psychopharmacol. 2014;29(2):86-92.
18. Boinpally R, Gad N, Gupta S, et al. Influence of CYP3A4 induction/inhibition on the pharmacokinetics of vilazodone in healthy subjects. Clin Ther. 2014; 36(11):1638-1649.
19. Chen L, Boinpally R, Greenberg WM, et al. Effect of hepatic impairment on the pharmacokinetics of levomilnacipran following a single oral dose of a levomilnacipran extended-release capsule in human participants. Clin Drug Investig. 2014;34(5):351-359.
20. Asnis GM, Bose A, Gommoll CP, et al. Efficacy and safety of levomilnacipran sustained release 40 mg, 80 mg, or 120 mg in major depressive disorder: a phase 3, randomized, double-blind, placebo-controlled study. J Clin Psychiatry. 2013;74(3):242-248.
21. Hvenegaard MG, Bang-Andersen B, Pedersen H, et al. Identification of the cytochrome P450 and other enzymes involved in the in vitro oxidative metabolism of a novel antidepressant, Lu AA21004. Drug Metab Dispos. 2012; 40(7):1357-1365.
22. Chen G, Lee R, Højer AM, et al. Pharmacokinetic drug interactions involving vortioxetine (Lu AA21004), a multimodal antidepressant. Clin Drug Investig. 2013; 33(10):727-736.
23. Areberg J, Søgaard B, Højer AM. The clinical pharmacokinetics of Lu AA21004 and its major metabolite in healthy young volunteers. Basic Clin Pharmacol Toxicol. 2012;111(3):198-205.
24. Areberg J, Petersen KB, Chen G, et al. Population pharmacokinetic meta-analysis of vortioxetine in healthy individuals. Basic Clin Pharmacol Toxicol. 2014;115(6):552-559.

Court allows generic colchicine to enter market
After a 5-year monopoly on the sale of colchicine put the gout medication out of reach for many patients, a federal judge in January denied an injunction request by Takeda Pharmaceuticals U.S.A. to halt the distribution of colchicine products by Hikma Pharmaceuticals PLC.
The availability of a generic colchicine will introduce competition into the marketplace and drive down costs, said Dr. E. William St.Clair, president of the American College of Rheumatology and chief of the division of rheumatology and immunology at Duke University, Durham, N.C. The ACR issued a friend-of-the-court brief to the federal district court in support of a generic colchicine product entering the market.

“With the steep price increase in colchicine, many patients with gout were now unable to afford chronic colchicine therapy,” Dr. St.Clair said in an interview. “Improving access to colchicine by making it more affordable will increase patient compliance and reduce the suffering and disability associated with repeated gout flares.”
The debate over colchicine and the right to market the medication has a lengthy history. The drug has been prescribed to treat gout for decades, predating the law that requires drugs to be approved by the Food and Drug Administration. In 2009, the FDA approved a brand name colchicine product (Colcrys) by Mutual Pharmaceutical Company/URL Pharmacy Inc. – now Takeda Pharmaceuticals U.S.A. – after the company conducted clinical trials on dosing regimens and performed drug interaction studies. The FDA’s approval of Colcrys came with exclusive marketing rights for gout for 3 years and for familial Mediterranean fever for 7 years.
Mutual Pharmaceutical Company then sued other manufacturers of colchicine, claiming the drug makers were falsely implying that their products were FDA approved. Shortly later, the FDA ordered companies marketing single-ingredient oral colchicine to remove their unapproved products from the market. Physicians and patients meanwhile saw the price of colchicine increase from about 10 cents per tablet to $5 per tablet.
In September 2014, the FDA granted approval for Hikma to market and sell Mitigare, a colchicine capsule for the prophylactic treatment of gout. Hikma had also planned to launch an authorized generic of Mitigare. Before Mitigare could fully launch, Takeda obtained a temporary restraining order against the sale of colchicine products by Hikma, citing Takeda’s patents for acute gout treatment. Takeda simultaneously sued the FDA in a separate proceeding. Takeda said the FDA’s approval of Hikma’s colchicine product was legally impermissible.
In its brief to the federal court, the ACR argued the public interest would be severely disserved by the barring of Hikma’s colchicine product.
“The unfortunate reality is that nearly 30% of patients in the United States take risky and potentially dangerous steps to save money on prescription medicines, with many choosing to skip doses, or not fill their prescriptions altogether,” the ACR said in its brief. “Takeda’s monopoly and the associated price increase for colchicine has resulted in precisely the sorts of risky behavior described.”
A lower court denied Takeda’s preliminary injunction request and the decision was upheld by the U.S. Court of Appeals for the Federal Circuit on Jan. 9. Pending the outcome of further litigation, the federal court ruled that both Takeda and Hikma are free to immediately offer colchicine products for prophylactic use. Also on Jan. 9, the U.S. District Court for the District of Columbia denied Takeda’s request to overturn the FDA’s approval of Mitigare.
In an interview, a Takeda spokeswoman said the company will continue its patent infringement litigation against Hikma and its U.S. subsidiary, West-Ward Pharmaceuticals, along with its lawsuit against the FDA. The company offered no comment on the judge’s decision to deny the injunction.
West-Ward, meanwhile, launched its authorized generic to Mitigare following the judge’s Jan. 9 decision, and Mitigare’s entry to the market was resumed.
“We immediately sought to launch a generic of Mitigare to ensure that adult patients in need of treatment for the prophylaxis of gout flares had access to a lower-cost, alternative colchicine capsule product,” said Spiro Gavaris, vice president of sales and marketing for West-Ward Pharmaceuticals. “We understood that in recent years, some patients may have lost access to, or became frustrated with, colchicine when there was one brand product at a significantly higher price point. With our launch of the authorized generic of Mitigare capsules, doctors can now choose to prescribe Mitigare for the prophylaxis of gout flares in adults, thereby providing these patients with a lower cost generic medication.”
Days after the decision, Takeda announced that it also would be offering access to a generic colchicine. In a statement, the company said it would partner with Prasco Laboratories to distribute Colchicine Tablets, USP, an authorized generic version of Colcrys. The product is being marketed under the Prasco label and became available in U.S. pharmacies in mid-January.
“At Takeda, we remain committed to providing patients with therapies that are safe, efficacious and meet high quality standards,” Douglas Cole, Takeda Pharmaceuticals President, said in a statement. “This new partnership will help enhance patient access to an important gout medicine by supplying Prasco with Colchicine Tablets, USP, manufactured under the same rigorous standards and processes as Colcrys.”
Prices for the Mitigare authorized generic and the Colcrys authorized generic have not been publicly announced. In an interview, West-Ward said it could not comment on exact savings to patients as savings will vary between insurance plans and pharmacy distribution channels.
“Our goal is to provide the most aggressive discounts on generic colchicine in the market with the intent for those discounts to be passed on to adult patients in need of treatment for the prophylaxis of gout flares,” Mr. Gavaris said.
At this article’s deadline, Takeda and Prasco had not responded to a question about the price of the generic Colcrys.
While rheumatologists expressed relief that generic colchicine products have finally become available, they also voiced concerns about potential barriers to access.
“I am proud of what the ACR did here and would hope that it serves as a model for future efforts by professional medical organizations to get into the (often legal) trenches and truly help their patients get affordable care. … [They] put their mouth where the money is and stood up for patients,” said Dr. Christopher M. Burns, a rheumatologist at the Geisel School of Medicine at Dartmouth College, Lebanon, N.H.
“I hope that this will, in fact, reduce the pricing for colchicine, and that it will not allow payers to add an onerous out-of-pocket cost for the drug far in excess of the cost if paid without utilizing pharmacy benefits,” said Dr. Norman B. Gaylis, a rheumatologist in private practice in Aventura, Fla.
Dr. St.Clair added that the future availability and cost of generic colchicine is not certain given common supply-and-demand problems that can arise with generic drugs.
“We have observed critical shortages of several generic medications during the past several years that have drastically affected medical therapy for many common conditions,” he said in an interview. “We will need to keep a close eye on the supply of generic colchicine to ensure it keeps up with the demand. The FDA and the pharmaceutical industry has an obligation to ensure that patients have access to these critical generic drugs.”
On Twitter @legal_med
After a 5-year monopoly on the sale of colchicine put the gout medication out of reach for many patients, a federal judge in January denied an injunction request by Takeda Pharmaceuticals U.S.A. to halt the distribution of colchicine products by Hikma Pharmaceuticals PLC.
The availability of a generic colchicine will introduce competition into the marketplace and drive down costs, said Dr. E. William St.Clair, president of the American College of Rheumatology and chief of the division of rheumatology and immunology at Duke University, Durham, N.C. The ACR issued a friend-of-the-court brief to the federal district court in support of a generic colchicine product entering the market.
“With the steep price increase in colchicine, many patients with gout were now unable to afford chronic colchicine therapy,” Dr. St.Clair said in an interview. “Improving access to colchicine by making it more affordable will increase patient compliance and reduce the suffering and disability associated with repeated gout flares.”
The debate over colchicine and the right to market the medication has a lengthy history. The drug has been prescribed to treat gout for decades, predating the law that requires drugs to be approved by the Food and Drug Administration. In 2009, the FDA approved a brand name colchicine product (Colcrys) by Mutual Pharmaceutical Company/URL Pharmacy Inc. – now Takeda Pharmaceuticals U.S.A. – after the company conducted clinical trials on dosing regimens and performed drug interaction studies. The FDA’s approval of Colcrys came with exclusive marketing rights for gout for 3 years and for familial Mediterranean fever for 7 years.
Mutual Pharmaceutical Company then sued other manufacturers of colchicine, claiming the drug makers were falsely implying that their products were FDA approved. Shortly later, the FDA ordered companies marketing single-ingredient oral colchicine to remove their unapproved products from the market. Physicians and patients meanwhile saw the price of colchicine increase from about 10 cents per tablet to $5 per tablet.
In September 2014, the FDA granted approval for Hikma to market and sell Mitigare, a colchicine capsule for the prophylactic treatment of gout. Hikma had also planned to launch an authorized generic of Mitigare. Before Mitigare could fully launch, Takeda obtained a temporary restraining order against the sale of colchicine products by Hikma, citing Takeda’s patents for acute gout treatment. Takeda simultaneously sued the FDA in a separate proceeding. Takeda said the FDA’s approval of Hikma’s colchicine product was legally impermissible.
In its brief to the federal court, the ACR argued the public interest would be severely disserved by the barring of Hikma’s colchicine product.
“The unfortunate reality is that nearly 30% of patients in the United States take risky and potentially dangerous steps to save money on prescription medicines, with many choosing to skip doses, or not fill their prescriptions altogether,” the ACR said in its brief. “Takeda’s monopoly and the associated price increase for colchicine has resulted in precisely the sorts of risky behavior described.”
A lower court denied Takeda’s preliminary injunction request and the decision was upheld by the U.S. Court of Appeals for the Federal Circuit on Jan. 9. Pending the outcome of further litigation, the federal court ruled that both Takeda and Hikma are free to immediately offer colchicine products for prophylactic use. Also on Jan. 9, the U.S. District Court for the District of Columbia denied Takeda’s request to overturn the FDA’s approval of Mitigare.
In an interview, a Takeda spokeswoman said the company will continue its patent infringement litigation against Hikma and its U.S. subsidiary, West-Ward Pharmaceuticals, along with its lawsuit against the FDA. The company offered no comment on the judge’s decision to deny the injunction.
West-Ward, meanwhile, launched its authorized generic to Mitigare following the judge’s Jan. 9 decision, and Mitigare’s entry to the market was resumed.
“We immediately sought to launch a generic of Mitigare to ensure that adult patients in need of treatment for the prophylaxis of gout flares had access to a lower-cost, alternative colchicine capsule product,” said Spiro Gavaris, vice president of sales and marketing for West-Ward Pharmaceuticals. “We understood that in recent years, some patients may have lost access to, or became frustrated with, colchicine when there was one brand product at a significantly higher price point. With our launch of the authorized generic of Mitigare capsules, doctors can now choose to prescribe Mitigare for the prophylaxis of gout flares in adults, thereby providing these patients with a lower cost generic medication.”
Days after the decision, Takeda announced that it also would be offering access to a generic colchicine. In a statement, the company said it would partner with Prasco Laboratories to distribute Colchicine Tablets, USP, an authorized generic version of Colcrys. The product is being marketed under the Prasco label and became available in U.S. pharmacies in mid-January.
“At Takeda, we remain committed to providing patients with therapies that are safe, efficacious and meet high quality standards,” Douglas Cole, Takeda Pharmaceuticals President, said in a statement. “This new partnership will help enhance patient access to an important gout medicine by supplying Prasco with Colchicine Tablets, USP, manufactured under the same rigorous standards and processes as Colcrys.”
Prices for the Mitigare authorized generic and the Colcrys authorized generic have not been publicly announced. In an interview, West-Ward said it could not comment on exact savings to patients as savings will vary between insurance plans and pharmacy distribution channels.
“Our goal is to provide the most aggressive discounts on generic colchicine in the market with the intent for those discounts to be passed on to adult patients in need of treatment for the prophylaxis of gout flares,” Mr. Gavaris said.
At this article’s deadline, Takeda and Prasco had not responded to a question about the price of the generic Colcrys.
While rheumatologists expressed relief that generic colchicine products have finally become available, they also voiced concerns about potential barriers to access.
“I am proud of what the ACR did here and would hope that it serves as a model for future efforts by professional medical organizations to get into the (often legal) trenches and truly help their patients get affordable care. … [They] put their mouth where the money is and stood up for patients,” said Dr. Christopher M. Burns, a rheumatologist at the Geisel School of Medicine at Dartmouth College, Lebanon, N.H.
“I hope that this will, in fact, reduce the pricing for colchicine, and that it will not allow payers to add an onerous out-of-pocket cost for the drug far in excess of the cost if paid without utilizing pharmacy benefits,” said Dr. Norman B. Gaylis, a rheumatologist in private practice in Aventura, Fla.
Dr. St.Clair added that the future availability and cost of generic colchicine is not certain given common supply-and-demand problems that can arise with generic drugs.
“We have observed critical shortages of several generic medications during the past several years that have drastically affected medical therapy for many common conditions,” he said in an interview. “We will need to keep a close eye on the supply of generic colchicine to ensure it keeps up with the demand. The FDA and the pharmaceutical industry has an obligation to ensure that patients have access to these critical generic drugs.”
On Twitter @legal_med

Patient-led teledermoscopy appears feasible and effective
Patient-administered teledermoscopy using an iPhone-based mobile dermatoscope attachment and app is an effective and feasible method for short-term monitoring of clinically atypical nevi, with the added benefit of improving patient and physician convenience, based on data from a pilot study of 29 patients.
Researchers found a high level of diagnostic concordance (0.87) between dermatoscope images taken and assessed by an office-based dermatologist and those taken by the patient – albeit in the clinic setting – using the mobile dermatoscope and assessed by a teledermatologist.
All but one of the 29 patients with clinically atypical nevi who completed the study were able to acquire evaluable baseline and follow-up images, the researchers noted. In addition, most of the patients reported that the device was easy to use and that it saved them a trip to the doctor’s office. The study findings were published online Jan. 28 in JAMA Dermatology (doi:10.1001/jamadermatol.2014.3837).
“Under our modality of care, patients needing short-term monitoring will have an established relationship with their dermatologists, who will be the ones identifying concerning lesions that need to be monitored and the ones who evaluate the lesions via teledermoscopy and communicate treatment options directly with the patients,” wrote Xinyuan Wu of Memorial Sloan Kettering Cancer Center, New York, and colleagues.
The authors of an accompanying editorial wrote that recommendations for screening and follow-up for melanoma placed considerable burdens on patients, physicians, and the health care system, and that the patient-led mobile teledermoscopy described in the study was one of a number of options being considered to reduce that burden.
“The study by Wu and colleagues in this issue adds significantly to the discussion on whether regular follow-up visits with clinicians could be replaced by patient self-monitoring with remote feedback by a teledermatologist,” wrote Monika Janda, Ph.D., of the Queensland University of Technology in Brisbane, Australia, and colleagues.
One editorial author reported shares and consultancies with e-derm-consult GmbH and MoleMap, but there were no other conflicts of interest declared.
FROM JAMA DERMATOLOGY
Key clinical point: Patient-administered teledermoscopy using an iPhone-based mobile dermatoscope attachment and app is an effective and feasible method for short-term monitoring of clinically atypical nevi.
Major finding: Researchers found a high level of diagnostic concordance (0.87) between dermatoscope images taken and assessed by the office-based dermatologist and those taken by the patient using an iPhone.
Data source:A prospective cohort study in 34 patients – 29 of whom completed follow-up – with clinically atypical nevi.
Disclosures: One editorial author reported shares and consultancies with e-derm-consult GmbH and MoleMap. No other conflicts of interest were declared.
Marijuana: The good, the bad, and the ugly
With the recent legalization of marijuana in many states, marijuana and its uses are a hot topic in most social circles. As physicians, we see the full spectrum, from its healing properties to its destructive ones. The goal of this article is not to persuade you into changing positions on its legalization, but rather to stress the importance of remaining neutral and educating families on the facts and potential pros and cons as they relate to the health of their children.
On Jan. 26, 2015,* the American Academy of Pediatrics released its policy statement on marijuana and its use (Pediatrics 2014 [doi:10.1542/peds.2014-4146]). The AAP does not support the legalization of marijuana because of the harm that it poses to children and adolescents, nor does it support legalization of medical marijuana outside the regulatory process of the Food and Drug Administration. It does recognize that marijuana may be an option for children with life-threatening or debilitating illnesses. The AAP does support the decriminalization of marijuana use or possession and advocates for less-harsh criminal penalties. Many of the recommendations were made because of the current research on marijuana and its use.

According to 2014’s Monitoring the Future survey of drug use and attitudes among American 8th, 10th, and 12th graders, marijuana is the most common illegal drug used by adolescents. Among 8th graders, 6.5% reported use; among 10th graders, 16.6% reported use; and 21.2 % of 12th graders reported use. A total of 81% of 12th grade students stated it was easy to get. Marijuana use at all three grade levels was higher than cigarette use (National Institute on Drug Abuse. Drug Facts, 2014). Another study found that early initiation of marijuana use was 6.5 times more likely to result in addiction than if it was initiated after the age of 21 years (Adolescent substance use: America’s #1 public health problem. CASA Columbia, 2011).
One thing we can agree upon is that an adolescent using any substance to mask or lessen the pain of a situation is in trouble. Whether adolescents are overeating or denying themselves food, or using drugs to get high, or behaving promiscuously to get attention, overindulgence is never good. So when we evaluate the effects of marijuana use among teens, we have to separate out the underlying emotional issues from the effects related to the drug. Adolescents are at particular risk for overuse because most lack the experience or maturity to stop when things get out of hand. And they are at risk when using anything that will give them a “high.” Substances like glue, gasoline, and cold medicine can bring them that high, and marijuana is no different – except that it is illegal.

Alcohol, cigarettes, and prescription medications are also vehicles to that desired high. Each has greater addictive properties than marijuana does. According to the Monitoring the Future study, most high school seniors do not think occasional use of marijuana is harmful, with only 36% saying regular use puts you at greater risk, compared with 39.5% in 2013 and 52% in 2009. The perception that marijuana is harmful has definitely declined.
Cannabis smoke contains three times the amount of tar found in tobacco smoke and 50% more carcinogens (N. Engl. J. Med. 1988;318:347). It also can irritate the airways, causing exacerbations of asthma, cystic fibrosis, sputum production, and pharyngitis (Arch. Intern. Med. 2007;167:221). Long-term studies showed that extended use was associated with increased obstructive lung diseases.
There is substantial evidence that indicates that cannabis use can cause psychosis. One review noted evidence that genetic factors may influence the risk of psychosis in adults who used cannabis as adolescents (Biol. Psychiatry 2005;57:1117). Cannabis is believed to release dopamine in the body, which may lead to the psychosis. Another study found that the onset of psychotic illness occurred more than 2 years earlier in patients who were heavy cannabis users (Arch. Gen. Psychiatry 2011;68:555).
Another important finding is that marijuana can suppress testosterone secretion in men, which may result in decreased libido, impotence, and gynecomastia (N. Engl. J. Med. 1974;290:872). Many teens believe cannabis is safe because it’s a plant, and consequently, may not relate these symptoms to its use.
The research on cannabis smoke and its relationship to cancer are limited by inadequate sample sizes and confounding factors not taken into account, but there does seem to be a relationship between cannabis smoke and lung cancer and bladder cancer (J. Psychoactive Drugs 1994;26:285; Urology 2006;67:100). However, head and neck cancers have not shown a relationship to marijuana use (Cancer Epidemiol. Biomarkers Prev. 2009;18:1544-51). Cardiovascular effects have been related to the increased sympathetic activity and decreased parasympathetic activity that can result in bradycardia and hypotension with high doses. This may be of particular concern in older people with coronary artery disease (J. Clin. Pharmacol. 2002;42:58S).
The medicinal properties of marijuana are an important consideration. Marijuana has been shown to be particularly effective in controlling some forms of seizure, pain, nausea from chemotherapy, muscle spasms caused by multiple sclerosis, and Crohn’s disease. The FDA has approved tetrahydrocannabinol, or THC, a key ingredient in marijuana, to treat nausea and improve appetite. In states that have legalized cannabis, qualifying patients can get prescriptions from their physicians to use at authorized dispensaries. For some patients, the effects can be life changing; for others, it can help with pain management and the discomfort associated with certain illnesses.
Beyond the scope of medicine is the economics of the legalization of marijuana. States that have already legalized it have seen revenues in the billions. Marijuana cash crops are estimated at $14 billion in revenue. Jon Gettman’s 2007 study, “Lost Taxes and Other Costs of Marijuana,” states that the prohibition of marijuana costs the government $113 billion, while it costs taxpayers $31.1 billion each year. The study projects that legalization of cannabis may save the criminal justice system $10.7 billion and an additional $6.2 billion for taxpayers. That sort of money does talk: Regardless of current opposition to the legalization of marijuana, it is probably just a matter of time before marijuana is legalized in every state.
The scope of marijuana issues is broad and, for many, controversial. The drug can serve as a healer, create health challenges, lead to drug addiction, or even become a significant revenue source to a state’s coffers. As providers, we need to be able to provide our patients with research-based information and resources, and dispel myths, so that they can make informed decisions for themselves that are in the best interests of their children.
Dr. Pearce is a pediatrician in Frankfort, Ill. She had no relevant financial disclosures. E-mail her at [email protected].
*Correction, 1/29/2015: An earlier version of this story had the incorrect date of publication of the AAP's policy statement.
With the recent legalization of marijuana in many states, marijuana and its uses are a hot topic in most social circles. As physicians, we see the full spectrum, from its healing properties to its destructive ones. The goal of this article is not to persuade you into changing positions on its legalization, but rather to stress the importance of remaining neutral and educating families on the facts and potential pros and cons as they relate to the health of their children.
On Jan. 26, 2015,* the American Academy of Pediatrics released its policy statement on marijuana and its use (Pediatrics 2014 [doi:10.1542/peds.2014-4146]). The AAP does not support the legalization of marijuana because of the harm that it poses to children and adolescents, nor does it support legalization of medical marijuana outside the regulatory process of the Food and Drug Administration. It does recognize that marijuana may be an option for children with life-threatening or debilitating illnesses. The AAP does support the decriminalization of marijuana use or possession and advocates for less-harsh criminal penalties. Many of the recommendations were made because of the current research on marijuana and its use.
According to 2014’s Monitoring the Future survey of drug use and attitudes among American 8th, 10th, and 12th graders, marijuana is the most common illegal drug used by adolescents. Among 8th graders, 6.5% reported use; among 10th graders, 16.6% reported use; and 21.2 % of 12th graders reported use. A total of 81% of 12th grade students stated it was easy to get. Marijuana use at all three grade levels was higher than cigarette use (National Institute on Drug Abuse. Drug Facts, 2014). Another study found that early initiation of marijuana use was 6.5 times more likely to result in addiction than if it was initiated after the age of 21 years (Adolescent substance use: America’s #1 public health problem. CASA Columbia, 2011).
One thing we can agree upon is that an adolescent using any substance to mask or lessen the pain of a situation is in trouble. Whether adolescents are overeating or denying themselves food, or using drugs to get high, or behaving promiscuously to get attention, overindulgence is never good. So when we evaluate the effects of marijuana use among teens, we have to separate out the underlying emotional issues from the effects related to the drug. Adolescents are at particular risk for overuse because most lack the experience or maturity to stop when things get out of hand. And they are at risk when using anything that will give them a “high.” Substances like glue, gasoline, and cold medicine can bring them that high, and marijuana is no different – except that it is illegal.
Alcohol, cigarettes, and prescription medications are also vehicles to that desired high. Each has greater addictive properties than marijuana does. According to the Monitoring the Future study, most high school seniors do not think occasional use of marijuana is harmful, with only 36% saying regular use puts you at greater risk, compared with 39.5% in 2013 and 52% in 2009. The perception that marijuana is harmful has definitely declined.
Cannabis smoke contains three times the amount of tar found in tobacco smoke and 50% more carcinogens (N. Engl. J. Med. 1988;318:347). It also can irritate the airways, causing exacerbations of asthma, cystic fibrosis, sputum production, and pharyngitis (Arch. Intern. Med. 2007;167:221). Long-term studies showed that extended use was associated with increased obstructive lung diseases.
There is substantial evidence that indicates that cannabis use can cause psychosis. One review noted evidence that genetic factors may influence the risk of psychosis in adults who used cannabis as adolescents (Biol. Psychiatry 2005;57:1117). Cannabis is believed to release dopamine in the body, which may lead to the psychosis. Another study found that the onset of psychotic illness occurred more than 2 years earlier in patients who were heavy cannabis users (Arch. Gen. Psychiatry 2011;68:555).
Another important finding is that marijuana can suppress testosterone secretion in men, which may result in decreased libido, impotence, and gynecomastia (N. Engl. J. Med. 1974;290:872). Many teens believe cannabis is safe because it’s a plant, and consequently, may not relate these symptoms to its use.
The research on cannabis smoke and its relationship to cancer are limited by inadequate sample sizes and confounding factors not taken into account, but there does seem to be a relationship between cannabis smoke and lung cancer and bladder cancer (J. Psychoactive Drugs 1994;26:285; Urology 2006;67:100). However, head and neck cancers have not shown a relationship to marijuana use (Cancer Epidemiol. Biomarkers Prev. 2009;18:1544-51). Cardiovascular effects have been related to the increased sympathetic activity and decreased parasympathetic activity that can result in bradycardia and hypotension with high doses. This may be of particular concern in older people with coronary artery disease (J. Clin. Pharmacol. 2002;42:58S).
The medicinal properties of marijuana are an important consideration. Marijuana has been shown to be particularly effective in controlling some forms of seizure, pain, nausea from chemotherapy, muscle spasms caused by multiple sclerosis, and Crohn’s disease. The FDA has approved tetrahydrocannabinol, or THC, a key ingredient in marijuana, to treat nausea and improve appetite. In states that have legalized cannabis, qualifying patients can get prescriptions from their physicians to use at authorized dispensaries. For some patients, the effects can be life changing; for others, it can help with pain management and the discomfort associated with certain illnesses.
Beyond the scope of medicine is the economics of the legalization of marijuana. States that have already legalized it have seen revenues in the billions. Marijuana cash crops are estimated at $14 billion in revenue. Jon Gettman’s 2007 study, “Lost Taxes and Other Costs of Marijuana,” states that the prohibition of marijuana costs the government $113 billion, while it costs taxpayers $31.1 billion each year. The study projects that legalization of cannabis may save the criminal justice system $10.7 billion and an additional $6.2 billion for taxpayers. That sort of money does talk: Regardless of current opposition to the legalization of marijuana, it is probably just a matter of time before marijuana is legalized in every state.
The scope of marijuana issues is broad and, for many, controversial. The drug can serve as a healer, create health challenges, lead to drug addiction, or even become a significant revenue source to a state’s coffers. As providers, we need to be able to provide our patients with research-based information and resources, and dispel myths, so that they can make informed decisions for themselves that are in the best interests of their children.
Dr. Pearce is a pediatrician in Frankfort, Ill. She had no relevant financial disclosures. E-mail her at [email protected].
*Correction, 1/29/2015: An earlier version of this story had the incorrect date of publication of the AAP's policy statement.

Delusional and aggressive, while playing the lottery
CASE Delusional and aggressive
Mr. P, age 78, of Filipino heritage, is brought to the psychiatric hospital because he has been verbally aggressive toward his wife for several weeks. He has no history of a psychiatric diagnosis or inpatient psychiatric hospitalization, and no history of taking any psychotropic medications.
According to his wife, Mr. P has been ruminating about his father, who died in World War II, saying that “the Japanese never gave his body back” to him. Also, his wife describes 3 weeks of physically aggressive behavior, such as throwing punches; the last episode was 2 days before admission.
Mr. P is not bathing, eating, taking his medications, and attending to his activities of daily living. He sleeps for only 1 to 2 hours a night; is irritable and easily distractible; and experiences flight of ideas. Mr. P has been buying lottery tickets, telling his daughter that he will become a millionaire and then buy a house in the Philippines.
Mr. P reports depressed mood, but no other depressive symptoms are present. He reports no suicidal or homicidal ideations, auditory or visual hallucinations, or anxiety symptoms. He has no history of substance abuse.
What diagnosis would you give Mr. P?
a) late-onset bipolar disorder
b) Alzheimer’s disease
c) major depressive disorder
d) frontotemporal dementia
The authors’ observations
Bipolar disorder in later life is a complex and confounding neuropsychiatric syndrome with diagnostic and therapeutic challenges. The disorder can affect people of all ages and is not uncommon among geriatric patients, with a 1-year prevalence in United States of 0.4%.1 In one study, 10% of new bipolar disorder cases were found to occur after age 50.2 As the American population grows older, the number of bipolar disorder cases among seniors is expected to increase.3
It was once thought that symptoms of bipolar disorder disappear with age; newer research has disproved this theory, and proposes that untreated bipolar disorder worsens over time.4 Persons who are given the diagnosis later in life could have had bipolar disorder for decades, but symptoms became more noticeable and problematic with age.5
Common symptoms in geriatric patients can differ from what we might expect in younger patients: agitation, hyperactivity, irritability, confusion, and psychosis.6 When the disorder presents in patients age >60, it can be severe, with significant changes in cognitive function, including difficulties with memory, perception, judgment, and problem-solving.7,8
HISTORY Medical comorbidities
Mr. P emigrated from the Philippines 20 years ago, is married, and lives with his wife. He has 3 brothers; his parents were divorced, and his mother remarried. Mr. P completed high school.
Mr. P has an extensive medical history: diabetes mellitus, hypertension, dyslipidemia, and recent double coronary artery bypass grafting. He is taking several medications: sitagliptin, 25 mg/d; pantoprazole, 5 mg/d; metformin, 1,000 mg/d; rivaroxaban, 20 mg/d; amiodarone, 200 mg/d; metoprolol, 12.5 mg/d; olmesartan medoxomil, 40 mg/d; aspirin, 81 mg/d; simvastatin, 10 mg/d; eszopiclone, 3 mg at bedtime; and amlodipine, 5 mg at bedtime.
Mr. P was following up with his primary care physician for his medical conditions and was adherent with treatment until 1 week before he was admitted to our facility.
The authors’ observations
Always rule out medical causes in a case of new-onset mania, which is particularly important in geriatric patients. Older patients with new-onset mania are more than twice as likely to have a comorbid neurologic disorder.9 Neurologic causes of late-onset mania include:
• stroke
• tumor
• epilepsy
• Huntington’s disease and other movement disorders
• multiple sclerosis and other white-matter diseases
• head trauma
• infection (such as neurosyphilis)
• Creutzfeldt-Jakob disease
• frontotemporal dementia.10
Mr. P’s presentation of psychomotor agitation, impaired functioning, decreased need for sleep, increased energy, hyperverbal speech, and complex paranoid delusions meets DSM-5 criteria for bipolar disorder, manic phase. In addition, older manic patients frequently present with confusion, disorientation, and distractibility. Younger patients with mania often present with euphoric moods and grandiosity; in contrast, geriatric patients are more likely to show a mixture of depressed affect and manic symptoms (pressured speech and a decreased need for sleep).11-15
We considered an emerging neurodegenerative process, because dementia can present early with disinhibition, lability, and other behavioral disturbances, including classic manic syndromes.16 Although we could not fully rule out a neurodegenerative process in the initial phase of treatment, Mr. P’s longitudinal course demonstrated no change in baseline cognitive function and no evidence of subsequent decline, making dementia unlikely.17
Patients with frontotemporal dementia are more likely to present initially to a psychiatrist than to a neurologist.18
Frontotemporal dementia is a progressive neurodegenerative disease that affects the frontal and temporal cortices; it is a common cause of dementia in patients age <65.19 Frontotemporal dementia is characterized by insidious behavioral and personality changes; often, the initial presentation lacks any clear neurologic signs or symptoms. Key features include apathy, disinhibition, loss of sympathy and empathy, repetitive motor behaviors, and overeating.20
Mr. P’s symptoms stabilized with divalproex sprinkles and risperidone. There was no evidence of decline in memory, social interaction, or behavior.
EVALUATION Paranoia
On mental status exam, Mr. P has an appropriate appearance; he is clean and shaven, with good eye contact. Muscular tone and gait are within normal limits. Level of activity is increased; he exhibits psychomotor agitation. Speech is rapid, over-productive, and loud; thought process shows flight of ideas, and thought associations are circumstantial.
Mr. P has paranoid delusions about the staff trying to hurt him. His judgment is poor, evidenced by an inability to take care of himself. Insight is minimal, as seen by noncompliance with treatment. Mr. P is oriented only to person and place. His mood is anxious; affect is labile.
Complete blood count, comprehensive metabolic profile, blood alcohol level, urine analysis, urine toxicology, electrocardiogram, and CT scan of the head are within normal limits.
Mr. P is given a diagnosis of mood disorder due to general medical condition, psychotic disorder due to general medical condition. The team rules out acute delirium, bipolar I disorder, and neurodegenerative disorders such as frontotemporal dementia.
Mr. P is maintained on pre-admission medications for his medical conditions. A mood stabilizer, divalproex sprinkles, 250 mg/d, is added.
Once on the unit, Mr. P is re-evaluated. Divalproex is increased to 500 mg/d; risperidone, 0.5 mg/d, is added to address paranoia. Mr. P also receives group and individual psychotherapy. He does not participate in neuropsychological testing, and no single-photon emission CT analysis is done. Mr. P remains in the hospital for 2 weeks. After a family meeting, his daughter says she feels comfortable taking Mr. P home. He follows up in the outpatient clinic and is doing well.
The authors’ observations
Treating geriatric patients with bipolar disorder requires attention to several factors (Table). Older patients might tolerate or metabolize medications differently than younger adults, and therefore may need a different dosage. Older patients are more likely to have comorbid medical conditions and to be taking medications for those ailments. Treatment is much more complicated for this age group because physicians need to account for possible drug-drug interactions.21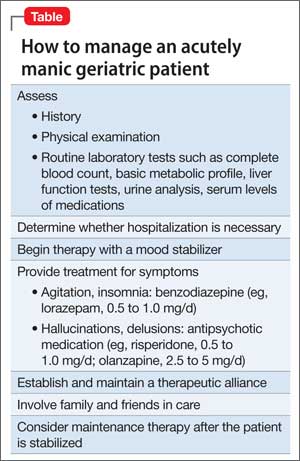
A number of medications can be helpful in treating older patients who have bipolar disorder.11 Ongoing research compares lithium with anticonvulsants in older bipolar disorder patients to determine which drug has the greatest benefit with the lowest risk of side effects.
Psychotherapy can be a valuable addition to pharmacotherapy in older adults. Some psychotherapy programs are specifically geared to older bipolar disorder patients.22,23
Use of divalproex sodium in older patients
First, perform baseline laboratory tests: complete blood count, liver function, and electrocardiogram. Initiate divalproex sodium, 250 mg at bedtime, increasing the dosage every 3 to 5 days by 250 mg, with a target dose of 500 to 2,000 mg/d (divided into 2 or 3 doses). Monitor serum levels; levels of 29 to 100 μg/mL are effective and well tolerated. Common side effects include excess sedation, ataxia, tremor, nausea, and, rarely, hepatotoxicity, leukopenia, and thrombocytopenia.24
Use of lithium in geriatric patients
First, perform baseline laboratory tests: electrolytes, creatinine, blood urea nitrogen, urine, thyroid stimulating hormone, and electrocardiogram. Starting dosage is 300 mg at bedtime (150 mg for frail cachectic patients). Monitor serum levels 12 hours after last dose, adjusting dosage every 5 days until a target serum level of 0.5 to 0.8 mEq/L is reached. Common dosages for geriatric patients are 300 to 600 mg/d, which often can be given as a single bedtime dose. Cautions: When using lithium with a thiazide diuretic or nonsteroidal anti-inflammatory drug, watch for dehydration, vomiting, and diarrhea, which will elevate the serum lithium level. Side effects include ataxia, tremor, urinary frequency, thirst, nausea, diarrhea, hypothyroidism, and exacerbation of psoriasis. Once stabilized, monitor the serum lithium level, thyroid-stimulating hormone, and kidney function every 3 to 6 months.24
Bottom Line
In geriatric patients, bipolar disorder can present with agitation, irritability, confusion, and psychosis, rather than euphoric mood and grandiosity. When you suspect bipolar disorder in an older patient, first rule out medical causes of symptoms. When selecting treatment, consider comorbid medical conditions and possible drug-drug interactions.
Related Resources
• Sajatovic M, Forester BP, Gildengers A, et al. Aging changes and medical complexity in late-life bipolar disorder: emerging research findings that may help advance care. Neuropsychiatry (London). 2013;3(6):621-633.
• Dols A, Rhebergen D, Beekman A, et al. Psychiatric and medical comorbidities: results from a bipolar elderly cohort study. Am J Geriatr Psychiatry. 2014;22(11):1066-1074.
Drug Brand Names
Amiodarone • Cordarone Olanzapine • Zyprexa
Amlodipine • Norvasc Olmesartan medoxomil • Benicar
Divalproex sodium • Depakote Pantoprazole • Protonix
Eszopiclone • Lunesta Risperidone • Risperdal
Lithium • Eskalith, Lithobid Rivaroxaban • Xarelto
Lorazepam • Ativan Simvastatin • Zocor
Metformin • Glucophage Sitagliptin • Januvia
Metoprolol • Lopressor
Disclosures
The authors report no financial relationships with any company whose products are mentioned in this article or with manufacturers of competing products.
1. Weissman MM, Leaf PJ, Tischler GL, et al. Affective disorders in five United States communities. Psychol Med. 1988;18(1):141-153.
2. Yassa R, Nair NP, Iskandar H. Late-onset bipolar disorder. Psychiatr Clin North Am. 1988;11(1):117-131.
3. Verdoux H, Bourgeois M. Secondary mania caused by cerebral organic pathology [in French]. Ann Med Psychol (Paris). 1995;153(3):161-168.
4. Fadden G, Bebbington P, Kuipers L. The burden of care: the impact of functional psychiatric illness in the patient’s family. Br J Psychiatry. 1987;150:285-292.
5. Yassa R, Nair V, Nastase C, et al. Prevalence of bipolar disorder in a psychogeriatric population. J Affect Disord. 1988;14(3):197-201.
6. Robinson RG, Boston JD, Starkstein SE, et al. Comparison of mania with depression following brain injury: casual factors. Am J Psychiatry. 1988;145(2):172-178.
7. Starkstein SE, Boston JD, Robinson RG. Mechanisms of mania after brain injury: 12 case reports and review of the literature. J Nerv Ment Dis. 1988;176(2):87-100.
8. Herrmann N, Bremner KE, Naranjo CA. Pharmacotherapy of late life mood disorders. Clin Neurosci. 1997;4(1):41-47.
9. Tohen M, Shulman KI, Satlin A. First-episode mania in late life. Am J Psychiatry. 1994;151(1):130-132.
10. Mendez MF. Mania in neurologic disorders. Curr Psychiatry Rep. 2000;2(5):440-445.
11. Eagles JM, Whalley LJ. Aging and affective disorders: the age at first onset of affective disorders in Scotland, 1969- 1978. Br J Psychiatry. 1985;147:180-187.
12. Snowdon J. A retrospective case-note study of bipolar disorder in old age. Br J Psychiatry. 1991;158:485-490.
13. Winokur G. The Iowa 500: heterogeneity and course in manic-depressive illness (bipolar). Compr Psychiatry. 1975;16(2):125-131.
14. Shulman K, Post F. Bipolar affective disorder in old age. Br J Psychiatry. 1980;136:26-32.
15. Young RC, Falk JR. Age, manic psychopathology, and treatment response. Int J Geriatr Psychiatry. 1989;4(2):73-78.
16. Almeida OP. Bipolar disorder with late onset: an organic variety of mood disorder [in Portuguese]? Rev Bras Psiquiatr. 2004;26(suppl 3):27-30.
17. Carlino AR, Stinnett JL, Kim DR. New onset of bipolar disorder in late life. Psychosomatics. 2013;54(1):94-97.
18. Woolley JD, Wilson MR, Hung E, et al. Frontotemporal dementia and mania. Am J Psychiatry. 2007;164(12):1811-1816.
19. Ratnavalli E, Brayne C, Dawson K, et al. The prevalence of frontotemporal dementia. Neurology. 2002;58(11):1615-1621.
20. Gregory CA, Hodges JR. Clinical features of frontal lobe dementia in comparison to Alzheimer’s disease. J Neural Transm Suppl. 1996;47:103-123.
21. Broadhead J, Jacoby R. Mania in old age: a first prospective study. Int J Geriatr Psychiatry. 1990;5(4):215-222.
22. Dhingra U, Rabins PV. Mania in the elderly: a 5-7 year follow-up. J Am Geriatr Soc. 1991;39(6):581-583.
23. Shulman KI. Neurologic comorbidity and mania in old age. Clin Neurosci. 1997;4(1):37-40.
24. Shulman KI, Herrmann N. Bipolar disorder in old age. Can Fam Physician. 1999;45:1229-1237.
CASE Delusional and aggressive
Mr. P, age 78, of Filipino heritage, is brought to the psychiatric hospital because he has been verbally aggressive toward his wife for several weeks. He has no history of a psychiatric diagnosis or inpatient psychiatric hospitalization, and no history of taking any psychotropic medications.
According to his wife, Mr. P has been ruminating about his father, who died in World War II, saying that “the Japanese never gave his body back” to him. Also, his wife describes 3 weeks of physically aggressive behavior, such as throwing punches; the last episode was 2 days before admission.
Mr. P is not bathing, eating, taking his medications, and attending to his activities of daily living. He sleeps for only 1 to 2 hours a night; is irritable and easily distractible; and experiences flight of ideas. Mr. P has been buying lottery tickets, telling his daughter that he will become a millionaire and then buy a house in the Philippines.
Mr. P reports depressed mood, but no other depressive symptoms are present. He reports no suicidal or homicidal ideations, auditory or visual hallucinations, or anxiety symptoms. He has no history of substance abuse.
What diagnosis would you give Mr. P?
a) late-onset bipolar disorder
b) Alzheimer’s disease
c) major depressive disorder
d) frontotemporal dementia
The authors’ observations
Bipolar disorder in later life is a complex and confounding neuropsychiatric syndrome with diagnostic and therapeutic challenges. The disorder can affect people of all ages and is not uncommon among geriatric patients, with a 1-year prevalence in United States of 0.4%.1 In one study, 10% of new bipolar disorder cases were found to occur after age 50.2 As the American population grows older, the number of bipolar disorder cases among seniors is expected to increase.3
It was once thought that symptoms of bipolar disorder disappear with age; newer research has disproved this theory, and proposes that untreated bipolar disorder worsens over time.4 Persons who are given the diagnosis later in life could have had bipolar disorder for decades, but symptoms became more noticeable and problematic with age.5
Common symptoms in geriatric patients can differ from what we might expect in younger patients: agitation, hyperactivity, irritability, confusion, and psychosis.6 When the disorder presents in patients age >60, it can be severe, with significant changes in cognitive function, including difficulties with memory, perception, judgment, and problem-solving.7,8
HISTORY Medical comorbidities
Mr. P emigrated from the Philippines 20 years ago, is married, and lives with his wife. He has 3 brothers; his parents were divorced, and his mother remarried. Mr. P completed high school.
Mr. P has an extensive medical history: diabetes mellitus, hypertension, dyslipidemia, and recent double coronary artery bypass grafting. He is taking several medications: sitagliptin, 25 mg/d; pantoprazole, 5 mg/d; metformin, 1,000 mg/d; rivaroxaban, 20 mg/d; amiodarone, 200 mg/d; metoprolol, 12.5 mg/d; olmesartan medoxomil, 40 mg/d; aspirin, 81 mg/d; simvastatin, 10 mg/d; eszopiclone, 3 mg at bedtime; and amlodipine, 5 mg at bedtime.
Mr. P was following up with his primary care physician for his medical conditions and was adherent with treatment until 1 week before he was admitted to our facility.
The authors’ observations
Always rule out medical causes in a case of new-onset mania, which is particularly important in geriatric patients. Older patients with new-onset mania are more than twice as likely to have a comorbid neurologic disorder.9 Neurologic causes of late-onset mania include:
• stroke
• tumor
• epilepsy
• Huntington’s disease and other movement disorders
• multiple sclerosis and other white-matter diseases
• head trauma
• infection (such as neurosyphilis)
• Creutzfeldt-Jakob disease
• frontotemporal dementia.10
Mr. P’s presentation of psychomotor agitation, impaired functioning, decreased need for sleep, increased energy, hyperverbal speech, and complex paranoid delusions meets DSM-5 criteria for bipolar disorder, manic phase. In addition, older manic patients frequently present with confusion, disorientation, and distractibility. Younger patients with mania often present with euphoric moods and grandiosity; in contrast, geriatric patients are more likely to show a mixture of depressed affect and manic symptoms (pressured speech and a decreased need for sleep).11-15
We considered an emerging neurodegenerative process, because dementia can present early with disinhibition, lability, and other behavioral disturbances, including classic manic syndromes.16 Although we could not fully rule out a neurodegenerative process in the initial phase of treatment, Mr. P’s longitudinal course demonstrated no change in baseline cognitive function and no evidence of subsequent decline, making dementia unlikely.17
Patients with frontotemporal dementia are more likely to present initially to a psychiatrist than to a neurologist.18
Frontotemporal dementia is a progressive neurodegenerative disease that affects the frontal and temporal cortices; it is a common cause of dementia in patients age <65.19 Frontotemporal dementia is characterized by insidious behavioral and personality changes; often, the initial presentation lacks any clear neurologic signs or symptoms. Key features include apathy, disinhibition, loss of sympathy and empathy, repetitive motor behaviors, and overeating.20
Mr. P’s symptoms stabilized with divalproex sprinkles and risperidone. There was no evidence of decline in memory, social interaction, or behavior.
EVALUATION Paranoia
On mental status exam, Mr. P has an appropriate appearance; he is clean and shaven, with good eye contact. Muscular tone and gait are within normal limits. Level of activity is increased; he exhibits psychomotor agitation. Speech is rapid, over-productive, and loud; thought process shows flight of ideas, and thought associations are circumstantial.
Mr. P has paranoid delusions about the staff trying to hurt him. His judgment is poor, evidenced by an inability to take care of himself. Insight is minimal, as seen by noncompliance with treatment. Mr. P is oriented only to person and place. His mood is anxious; affect is labile.
Complete blood count, comprehensive metabolic profile, blood alcohol level, urine analysis, urine toxicology, electrocardiogram, and CT scan of the head are within normal limits.
Mr. P is given a diagnosis of mood disorder due to general medical condition, psychotic disorder due to general medical condition. The team rules out acute delirium, bipolar I disorder, and neurodegenerative disorders such as frontotemporal dementia.
Mr. P is maintained on pre-admission medications for his medical conditions. A mood stabilizer, divalproex sprinkles, 250 mg/d, is added.
Once on the unit, Mr. P is re-evaluated. Divalproex is increased to 500 mg/d; risperidone, 0.5 mg/d, is added to address paranoia. Mr. P also receives group and individual psychotherapy. He does not participate in neuropsychological testing, and no single-photon emission CT analysis is done. Mr. P remains in the hospital for 2 weeks. After a family meeting, his daughter says she feels comfortable taking Mr. P home. He follows up in the outpatient clinic and is doing well.
The authors’ observations
Treating geriatric patients with bipolar disorder requires attention to several factors (Table). Older patients might tolerate or metabolize medications differently than younger adults, and therefore may need a different dosage. Older patients are more likely to have comorbid medical conditions and to be taking medications for those ailments. Treatment is much more complicated for this age group because physicians need to account for possible drug-drug interactions.21
A number of medications can be helpful in treating older patients who have bipolar disorder.11 Ongoing research compares lithium with anticonvulsants in older bipolar disorder patients to determine which drug has the greatest benefit with the lowest risk of side effects.
Psychotherapy can be a valuable addition to pharmacotherapy in older adults. Some psychotherapy programs are specifically geared to older bipolar disorder patients.22,23
Use of divalproex sodium in older patients
First, perform baseline laboratory tests: complete blood count, liver function, and electrocardiogram. Initiate divalproex sodium, 250 mg at bedtime, increasing the dosage every 3 to 5 days by 250 mg, with a target dose of 500 to 2,000 mg/d (divided into 2 or 3 doses). Monitor serum levels; levels of 29 to 100 μg/mL are effective and well tolerated. Common side effects include excess sedation, ataxia, tremor, nausea, and, rarely, hepatotoxicity, leukopenia, and thrombocytopenia.24
Use of lithium in geriatric patients
First, perform baseline laboratory tests: electrolytes, creatinine, blood urea nitrogen, urine, thyroid stimulating hormone, and electrocardiogram. Starting dosage is 300 mg at bedtime (150 mg for frail cachectic patients). Monitor serum levels 12 hours after last dose, adjusting dosage every 5 days until a target serum level of 0.5 to 0.8 mEq/L is reached. Common dosages for geriatric patients are 300 to 600 mg/d, which often can be given as a single bedtime dose. Cautions: When using lithium with a thiazide diuretic or nonsteroidal anti-inflammatory drug, watch for dehydration, vomiting, and diarrhea, which will elevate the serum lithium level. Side effects include ataxia, tremor, urinary frequency, thirst, nausea, diarrhea, hypothyroidism, and exacerbation of psoriasis. Once stabilized, monitor the serum lithium level, thyroid-stimulating hormone, and kidney function every 3 to 6 months.24
Bottom Line
In geriatric patients, bipolar disorder can present with agitation, irritability, confusion, and psychosis, rather than euphoric mood and grandiosity. When you suspect bipolar disorder in an older patient, first rule out medical causes of symptoms. When selecting treatment, consider comorbid medical conditions and possible drug-drug interactions.
Related Resources
• Sajatovic M, Forester BP, Gildengers A, et al. Aging changes and medical complexity in late-life bipolar disorder: emerging research findings that may help advance care. Neuropsychiatry (London). 2013;3(6):621-633.
• Dols A, Rhebergen D, Beekman A, et al. Psychiatric and medical comorbidities: results from a bipolar elderly cohort study. Am J Geriatr Psychiatry. 2014;22(11):1066-1074.
Drug Brand Names
Amiodarone • Cordarone Olanzapine • Zyprexa
Amlodipine • Norvasc Olmesartan medoxomil • Benicar
Divalproex sodium • Depakote Pantoprazole • Protonix
Eszopiclone • Lunesta Risperidone • Risperdal
Lithium • Eskalith, Lithobid Rivaroxaban • Xarelto
Lorazepam • Ativan Simvastatin • Zocor
Metformin • Glucophage Sitagliptin • Januvia
Metoprolol • Lopressor
Disclosures
The authors report no financial relationships with any company whose products are mentioned in this article or with manufacturers of competing products.
1. Weissman MM, Leaf PJ, Tischler GL, et al. Affective disorders in five United States communities. Psychol Med. 1988;18(1):141-153.
2. Yassa R, Nair NP, Iskandar H. Late-onset bipolar disorder. Psychiatr Clin North Am. 1988;11(1):117-131.
3. Verdoux H, Bourgeois M. Secondary mania caused by cerebral organic pathology [in French]. Ann Med Psychol (Paris). 1995;153(3):161-168.
4. Fadden G, Bebbington P, Kuipers L. The burden of care: the impact of functional psychiatric illness in the patient’s family. Br J Psychiatry. 1987;150:285-292.
5. Yassa R, Nair V, Nastase C, et al. Prevalence of bipolar disorder in a psychogeriatric population. J Affect Disord. 1988;14(3):197-201.
6. Robinson RG, Boston JD, Starkstein SE, et al. Comparison of mania with depression following brain injury: casual factors. Am J Psychiatry. 1988;145(2):172-178.
7. Starkstein SE, Boston JD, Robinson RG. Mechanisms of mania after brain injury: 12 case reports and review of the literature. J Nerv Ment Dis. 1988;176(2):87-100.
8. Herrmann N, Bremner KE, Naranjo CA. Pharmacotherapy of late life mood disorders. Clin Neurosci. 1997;4(1):41-47.
9. Tohen M, Shulman KI, Satlin A. First-episode mania in late life. Am J Psychiatry. 1994;151(1):130-132.
10. Mendez MF. Mania in neurologic disorders. Curr Psychiatry Rep. 2000;2(5):440-445.
11. Eagles JM, Whalley LJ. Aging and affective disorders: the age at first onset of affective disorders in Scotland, 1969- 1978. Br J Psychiatry. 1985;147:180-187.
12. Snowdon J. A retrospective case-note study of bipolar disorder in old age. Br J Psychiatry. 1991;158:485-490.
13. Winokur G. The Iowa 500: heterogeneity and course in manic-depressive illness (bipolar). Compr Psychiatry. 1975;16(2):125-131.
14. Shulman K, Post F. Bipolar affective disorder in old age. Br J Psychiatry. 1980;136:26-32.
15. Young RC, Falk JR. Age, manic psychopathology, and treatment response. Int J Geriatr Psychiatry. 1989;4(2):73-78.
16. Almeida OP. Bipolar disorder with late onset: an organic variety of mood disorder [in Portuguese]? Rev Bras Psiquiatr. 2004;26(suppl 3):27-30.
17. Carlino AR, Stinnett JL, Kim DR. New onset of bipolar disorder in late life. Psychosomatics. 2013;54(1):94-97.
18. Woolley JD, Wilson MR, Hung E, et al. Frontotemporal dementia and mania. Am J Psychiatry. 2007;164(12):1811-1816.
19. Ratnavalli E, Brayne C, Dawson K, et al. The prevalence of frontotemporal dementia. Neurology. 2002;58(11):1615-1621.
20. Gregory CA, Hodges JR. Clinical features of frontal lobe dementia in comparison to Alzheimer’s disease. J Neural Transm Suppl. 1996;47:103-123.
21. Broadhead J, Jacoby R. Mania in old age: a first prospective study. Int J Geriatr Psychiatry. 1990;5(4):215-222.
22. Dhingra U, Rabins PV. Mania in the elderly: a 5-7 year follow-up. J Am Geriatr Soc. 1991;39(6):581-583.
23. Shulman KI. Neurologic comorbidity and mania in old age. Clin Neurosci. 1997;4(1):37-40.
24. Shulman KI, Herrmann N. Bipolar disorder in old age. Can Fam Physician. 1999;45:1229-1237.