User login
Do glutamatergic drugs have a role in treating depression?
Mrs. S, age 46, has been struggling to manage depression for 7 years. She completed adequate trials of several selective serotonin reuptake inhibitors and bupropion. Currently, she is taking duloxetine, 60 mg/d, and aripiprazole, 5 mg/d.
At her most recent clinic visit, Mrs. S reports that she is doing “OK,” but that she still feels sad and disengaged most days of the week. She wants to know more about ketamine for treating depression after reading about it on the Internet and hearing it mentioned in a support group she attends. She asks if you think it would work for her, and gives you with a copy of an article about its use in patients with treatment-resistant depression. Mrs. S has no other health conditions and takes a daily vitamin D and calcium supplement.
The monoamine hypothesis of depression postulates that symptoms originate from underactivity of monoamines, such as serotonin, norepinephrine, and dopamine, in the brain. This hypothesis was formulated in the 1960s after researchers observed that monoamine oxidase inhibitors and tricyclic antidepressants relieved depressive symptoms; both were known to increase monoamine concentrations in the synaptic cleft.1
Regrettably, these medications do not adequately relieve depressive symptoms for many people. In fact, symptom remission occurs in only one-third of treated patients.2 This low remission rate reflects a lack of understanding of the pathophysiology of depression, and the need for drugs with unique mechanisms of action.
One of the newest drug targets shown to be relevant in psychiatric illness is the
glutamatergic system. Glutamate is the predominant excitatory neurotransmitter in the CNS, and it is responsible for many key functions, including synaptic plasticity, learning, memory, and locomotion.3 Normally, the glutamatergic system tightly regulates the amount of glutamate in the neuronal synapse via receptors on presynaptic and postsynaptic neurons, as well as on glial cells (Figure). When this equilibrium is disrupted in stressful situations, such as ischemia, trauma, or seizures, excess glutamate is released into the synapse. The resulting glutamatergic hyperactivity can lead to neurotoxicity and cell death when neuronal receptors are activated for an extended period. 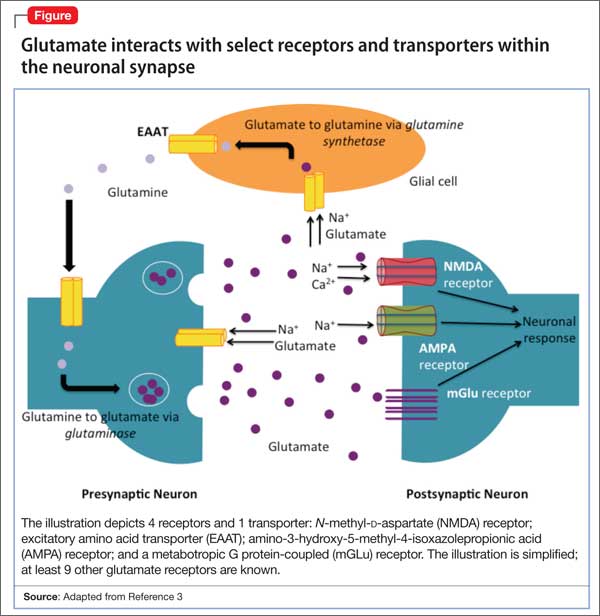
A key component of the glutamatergic system that is responsible for removing excess glutamate from the synapse is membrane-bound transporters, which are similar to serotonin and norepinephrine transporters. These excitatory amino acid transporters (EAATs) are important because glutamate metabolism does not occur within the synapse and EAATS are responsible for removing most of the glutamate from the synapse into glial cells.3
The network of receptors within the synapse that are activated by glutamate is extensive and complex. There are at least 11 glutamate-responsive receptors: 3 are ionotropic action channels, and the remaining 8 are metabotropic G protein-coupled receptors. Previous studies have shown regional changes in glutamate receptors, as well as elevated levels of glutamate, in the brains of patients with major depressive disorder (MDD).4
Ketamine. The ionotropic receptor N-methyl-d-aspartate (NMDA) is one of the most studied glutamate receptors. Pharmacologically, ketamine is a noncompetitive NMDA receptor antagonist that also activates the amino-3-hydroxy-5-methyl-4-isoxazolepropionic acid (AMPA) receptor, which is another subtype of ionotropic glutamate receptors. In open-label clinical trials, ketamine has demonstrated rapid antidepressant action in patients with treatment-resistant MDD.4,5
Recently, Murrough et al6 performed the first randomized, psychoactive controlled trial using a single IV infusion of ketamine dosed below anesthesia ranges (0.5 mg/kg), or midazolam (0.045 mg/kg), in patients with treatment-resistant depression who had been antidepressant-free for at least 4 weeks. They found that 24 hours after medication administration, the likelihood of response to ketamine was significantly higher than the response to midazolam (OR: 2.18; 95% CI: 1.21 to 4.14), with a response rate of 64% in the ketamine group and 28% in the midazolam group.6
Psychotropic side effects, such as hallucinations, are a major concern with ketamine tolerability and abuse potential. This is largely because of ketamine’s antagonism of the NMDA receptor, which is a property shared with other abused drugs such as phencyclidine (PCP) and dextromethorphan. In the Murrough et al6 study, there were no reported cases of paranoia or hallucinations, but dissociative symptoms were relatively common (17%).
Although the results in this trial appear encouraging, there are several limitations to using ketamine to treat MDD, especially in an ambulatory setting. Concerns include ketamine’s IV administration, potential for abuse, long-term efficacy, and side-effect profile—particularly psychotic symptoms and hemodynamic changes. An ideal compound would have the rapid efficacy of ketamine, but with a safer side-effect profile, easier administration, and less potential for abuse.
Riluzole also acts on the glutamatergic system, but has not shown antidepressant efficacy as consistently as ketamine. Riluzole is FDA-approved for treating amyotrophic lateral sclerosis.5 Pharmacologically, riluzole is a glutamatergic modulator that increases glutamate reuptake into glial cells, decreases glutamate release, and increases AMPA trafficking. In open-label studies riluzole has shown efficacy in reducing depressive symptoms.4,5 However, when compared with placebo as a means of sustaining treatment response after a 1-time dose of ketamine, riluzole showed was no significant improvement in time to depressive relapse.7
Acamprosate, often used for treating alcohol abuse, is another a drug with glutamatergic activity that has been studied for possible use as an antidepressant.5
A review by Lapidus et al5 has a more extensive listing of current medications and investigational compounds that modulate glutamate transmission, and are of interest for their possible antidepressant activity. Given the relatively new “glutamatergic hypothesis” of depression, it is exciting that so many current and novel glutamatergic drug therapies are being evaluated.
Future of ketamine treatment
Glutamate has been shown to play an important part in the pathophysiology of depression. The rapid antidepressant efficacy of ketamine provides evidence that future medications with glutamate-modulating activity could be useful for patients who struggle to achieve symptom relief using available antidepressants. Several limitations exist regarding ketamine use, and more work in this important therapeutic area needs to be done. This last point is important to remember when speaking with patients such as Mrs. S. Although it is understandable for her to be excited about novel treatment options such as ketamine, stress to her that treating depression with ketamine at this time is strictly investigational, and that the drug needs to be thoroughly evaluated for safety and efficacy before it can be prescribed for this indication.
CASE CONTINUED
Mrs. S realizes that ketamine may not be the best next step for her, and she agrees to explore other approaches to treat her residual depressive symptoms.
Related Resources
• Machado-Vieira R, Ibrahim L, Henter ID, et al. Novel glutamatergic agents for major depressive disorder and bipolar disorder. Pharmacol Biochem Behav. 2012;100(4):678-687.
• Mathews DC, Henter ID, Zarate CA. Targeting the glutamatergic system to treat major depressive disorder: rationale and progress to date. Drugs. 2012;72(10):1313-1333.
Drug Brand Names
Acamprosate • Campral Duloxetine • Cymbalta
Aripiprazole • Abilify Ketamine • Ketalar
Bupropion • Wellbutrin, Zyban Riluzole • Rilutek
Disclosures
The authors report no financial relationships with any companies whose products are mentioned in this article or with manufacturers of competing products.
1. Niciu MJ, Ionescu DF, Richards EM, et al. Glutamate and its receptors in the pathophysiology and treatment of major depressive disorder. J Neural Transm. 2014;121(8):907-924.
2. Gaynes BN, Dusetzina SB, Ellis AR, et al. Treating depression after initial treatment failure: directly comparing switch and augmenting strategies in STAR*D. J Clin Psychopharmacol. 2012;32(1):114-119.
3. Curry SC, Mills KC, Ruha A, et al. Neurotransmitters and neuromodulators. In: Nelson LS, Lewin NA, Howland MA, et al, eds. Goldfrank’s toxicologic emergencies. 9th ed. New York, NY: McGraw-Hill; 2011:189-220.
4. Zarate C Jr, Machado-Vieira R, Henter I, et al. Glutamatergic modulators: the future of treating mood disorders? Harv Rev Psychiatry. 2010;18(5):293-303.
5. Lapidus KA, Soleimani L, Murrough JW. Novel glutamatergic drugs for the treatment of mood disorders. Neuropsychiatr Dis Treat. 2013;9:1101-1112.
6. Murrough JW, Iosifescu DV, Chang LC, et al. Antidepressant efficacy of ketamine in treatment-resistant major depression: a two-site randomized controlled trial. Am J Psychiatry. 2013;170(10):1134-1142.
7. Ibrahim L, Diazgranados N, Franco-Chaves J, et al. Course of improvement in depressive symptoms to a single intravenous infusion of ketamine vs add-on riluzole: results from a 4-week, double-blind, placebo-controlled study. Neuropsychopharmacology. 2012;37(6):1526-1533.
Mrs. S, age 46, has been struggling to manage depression for 7 years. She completed adequate trials of several selective serotonin reuptake inhibitors and bupropion. Currently, she is taking duloxetine, 60 mg/d, and aripiprazole, 5 mg/d.
At her most recent clinic visit, Mrs. S reports that she is doing “OK,” but that she still feels sad and disengaged most days of the week. She wants to know more about ketamine for treating depression after reading about it on the Internet and hearing it mentioned in a support group she attends. She asks if you think it would work for her, and gives you with a copy of an article about its use in patients with treatment-resistant depression. Mrs. S has no other health conditions and takes a daily vitamin D and calcium supplement.
The monoamine hypothesis of depression postulates that symptoms originate from underactivity of monoamines, such as serotonin, norepinephrine, and dopamine, in the brain. This hypothesis was formulated in the 1960s after researchers observed that monoamine oxidase inhibitors and tricyclic antidepressants relieved depressive symptoms; both were known to increase monoamine concentrations in the synaptic cleft.1
Regrettably, these medications do not adequately relieve depressive symptoms for many people. In fact, symptom remission occurs in only one-third of treated patients.2 This low remission rate reflects a lack of understanding of the pathophysiology of depression, and the need for drugs with unique mechanisms of action.
One of the newest drug targets shown to be relevant in psychiatric illness is the
glutamatergic system. Glutamate is the predominant excitatory neurotransmitter in the CNS, and it is responsible for many key functions, including synaptic plasticity, learning, memory, and locomotion.3 Normally, the glutamatergic system tightly regulates the amount of glutamate in the neuronal synapse via receptors on presynaptic and postsynaptic neurons, as well as on glial cells (Figure). When this equilibrium is disrupted in stressful situations, such as ischemia, trauma, or seizures, excess glutamate is released into the synapse. The resulting glutamatergic hyperactivity can lead to neurotoxicity and cell death when neuronal receptors are activated for an extended period.
A key component of the glutamatergic system that is responsible for removing excess glutamate from the synapse is membrane-bound transporters, which are similar to serotonin and norepinephrine transporters. These excitatory amino acid transporters (EAATs) are important because glutamate metabolism does not occur within the synapse and EAATS are responsible for removing most of the glutamate from the synapse into glial cells.3
The network of receptors within the synapse that are activated by glutamate is extensive and complex. There are at least 11 glutamate-responsive receptors: 3 are ionotropic action channels, and the remaining 8 are metabotropic G protein-coupled receptors. Previous studies have shown regional changes in glutamate receptors, as well as elevated levels of glutamate, in the brains of patients with major depressive disorder (MDD).4
Ketamine. The ionotropic receptor N-methyl-d-aspartate (NMDA) is one of the most studied glutamate receptors. Pharmacologically, ketamine is a noncompetitive NMDA receptor antagonist that also activates the amino-3-hydroxy-5-methyl-4-isoxazolepropionic acid (AMPA) receptor, which is another subtype of ionotropic glutamate receptors. In open-label clinical trials, ketamine has demonstrated rapid antidepressant action in patients with treatment-resistant MDD.4,5
Recently, Murrough et al6 performed the first randomized, psychoactive controlled trial using a single IV infusion of ketamine dosed below anesthesia ranges (0.5 mg/kg), or midazolam (0.045 mg/kg), in patients with treatment-resistant depression who had been antidepressant-free for at least 4 weeks. They found that 24 hours after medication administration, the likelihood of response to ketamine was significantly higher than the response to midazolam (OR: 2.18; 95% CI: 1.21 to 4.14), with a response rate of 64% in the ketamine group and 28% in the midazolam group.6
Psychotropic side effects, such as hallucinations, are a major concern with ketamine tolerability and abuse potential. This is largely because of ketamine’s antagonism of the NMDA receptor, which is a property shared with other abused drugs such as phencyclidine (PCP) and dextromethorphan. In the Murrough et al6 study, there were no reported cases of paranoia or hallucinations, but dissociative symptoms were relatively common (17%).
Although the results in this trial appear encouraging, there are several limitations to using ketamine to treat MDD, especially in an ambulatory setting. Concerns include ketamine’s IV administration, potential for abuse, long-term efficacy, and side-effect profile—particularly psychotic symptoms and hemodynamic changes. An ideal compound would have the rapid efficacy of ketamine, but with a safer side-effect profile, easier administration, and less potential for abuse.
Riluzole also acts on the glutamatergic system, but has not shown antidepressant efficacy as consistently as ketamine. Riluzole is FDA-approved for treating amyotrophic lateral sclerosis.5 Pharmacologically, riluzole is a glutamatergic modulator that increases glutamate reuptake into glial cells, decreases glutamate release, and increases AMPA trafficking. In open-label studies riluzole has shown efficacy in reducing depressive symptoms.4,5 However, when compared with placebo as a means of sustaining treatment response after a 1-time dose of ketamine, riluzole showed was no significant improvement in time to depressive relapse.7
Acamprosate, often used for treating alcohol abuse, is another a drug with glutamatergic activity that has been studied for possible use as an antidepressant.5
A review by Lapidus et al5 has a more extensive listing of current medications and investigational compounds that modulate glutamate transmission, and are of interest for their possible antidepressant activity. Given the relatively new “glutamatergic hypothesis” of depression, it is exciting that so many current and novel glutamatergic drug therapies are being evaluated.
Future of ketamine treatment
Glutamate has been shown to play an important part in the pathophysiology of depression. The rapid antidepressant efficacy of ketamine provides evidence that future medications with glutamate-modulating activity could be useful for patients who struggle to achieve symptom relief using available antidepressants. Several limitations exist regarding ketamine use, and more work in this important therapeutic area needs to be done. This last point is important to remember when speaking with patients such as Mrs. S. Although it is understandable for her to be excited about novel treatment options such as ketamine, stress to her that treating depression with ketamine at this time is strictly investigational, and that the drug needs to be thoroughly evaluated for safety and efficacy before it can be prescribed for this indication.
CASE CONTINUED
Mrs. S realizes that ketamine may not be the best next step for her, and she agrees to explore other approaches to treat her residual depressive symptoms.
Related Resources
• Machado-Vieira R, Ibrahim L, Henter ID, et al. Novel glutamatergic agents for major depressive disorder and bipolar disorder. Pharmacol Biochem Behav. 2012;100(4):678-687.
• Mathews DC, Henter ID, Zarate CA. Targeting the glutamatergic system to treat major depressive disorder: rationale and progress to date. Drugs. 2012;72(10):1313-1333.
Drug Brand Names
Acamprosate • Campral Duloxetine • Cymbalta
Aripiprazole • Abilify Ketamine • Ketalar
Bupropion • Wellbutrin, Zyban Riluzole • Rilutek
Disclosures
The authors report no financial relationships with any companies whose products are mentioned in this article or with manufacturers of competing products.
1. Niciu MJ, Ionescu DF, Richards EM, et al. Glutamate and its receptors in the pathophysiology and treatment of major depressive disorder. J Neural Transm. 2014;121(8):907-924.
2. Gaynes BN, Dusetzina SB, Ellis AR, et al. Treating depression after initial treatment failure: directly comparing switch and augmenting strategies in STAR*D. J Clin Psychopharmacol. 2012;32(1):114-119.
3. Curry SC, Mills KC, Ruha A, et al. Neurotransmitters and neuromodulators. In: Nelson LS, Lewin NA, Howland MA, et al, eds. Goldfrank’s toxicologic emergencies. 9th ed. New York, NY: McGraw-Hill; 2011:189-220.
4. Zarate C Jr, Machado-Vieira R, Henter I, et al. Glutamatergic modulators: the future of treating mood disorders? Harv Rev Psychiatry. 2010;18(5):293-303.
5. Lapidus KA, Soleimani L, Murrough JW. Novel glutamatergic drugs for the treatment of mood disorders. Neuropsychiatr Dis Treat. 2013;9:1101-1112.
6. Murrough JW, Iosifescu DV, Chang LC, et al. Antidepressant efficacy of ketamine in treatment-resistant major depression: a two-site randomized controlled trial. Am J Psychiatry. 2013;170(10):1134-1142.
7. Ibrahim L, Diazgranados N, Franco-Chaves J, et al. Course of improvement in depressive symptoms to a single intravenous infusion of ketamine vs add-on riluzole: results from a 4-week, double-blind, placebo-controlled study. Neuropsychopharmacology. 2012;37(6):1526-1533.
More on insomnia disorders in older patients
Regarding Drs. Irene S. Hong’s and Jeffrey R. Bishop’s article, “Sedative-hypnotics for sleepless geriatric patients: Choose wisely” (Current Psychiatry, 2014;13(10):36-39, 46-50, 52 [http://bit.ly/1ApmcoO]), which undertook a comprehensive review of current therapies for insomnia in geriatric patients, here are 3 clarifications.
• I want to reinforce the latest thinking about the nature and pathophysiology of insomnia. DSM-5 classifies insomnia as a disorder, not as a symptom of other problems; the concept of “secondary insomnia” is rejected in DSM-5. Insomnia typically is seen as comorbid with other medical and psychiatric disorders. Often, insomnia predates the comorbid disorder (eg, depression), but rarely is it resolved by treating the comorbid condition.
• Good clinical practice, therefore, requires treating the comorbid condition and the insomnia each directly.
• The insomnia disorder manifests itself, in part, by a report of difficulty falling asleep or staying asleep. The authors use the example of sleep-onset insomnia as typical in older adults. However, sleep maintenance and early morning awakenings are the most common symptoms among geriatric insomnia patients.
• The authors mention only in passing an important medication for sleep maintenance in adults and in the geriatric patient specifically: doxepin. Low-dose doxepin, at 3 mg (for the geriatric patient) and 6 mg, is FDA-approved as a nonscheduled hypnotic for sleep maintenance insomnia. This formulationa is the only hypnotic classified as safe for geriatric patients in the 2012 Beers Criteria Update of the American Geriatrics Society.1 Unlike higher dosages of doxepin, the action of low-dose doxepin is, essentially, selective H1 antagonism.
aSold as Silenor.
Reference
1. American Geriatrics Society 2012 Beers Criteria Update Expert Panel. American Geriatrics Society updated Beers Criteria for potentially inappropriate medication use in older adults. J Am Geriatr Soc. 2012;60(4):616-631.
Regarding Drs. Irene S. Hong’s and Jeffrey R. Bishop’s article, “Sedative-hypnotics for sleepless geriatric patients: Choose wisely” (Current Psychiatry, 2014;13(10):36-39, 46-50, 52 [http://bit.ly/1ApmcoO]), which undertook a comprehensive review of current therapies for insomnia in geriatric patients, here are 3 clarifications.
• I want to reinforce the latest thinking about the nature and pathophysiology of insomnia. DSM-5 classifies insomnia as a disorder, not as a symptom of other problems; the concept of “secondary insomnia” is rejected in DSM-5. Insomnia typically is seen as comorbid with other medical and psychiatric disorders. Often, insomnia predates the comorbid disorder (eg, depression), but rarely is it resolved by treating the comorbid condition.
• Good clinical practice, therefore, requires treating the comorbid condition and the insomnia each directly.
• The insomnia disorder manifests itself, in part, by a report of difficulty falling asleep or staying asleep. The authors use the example of sleep-onset insomnia as typical in older adults. However, sleep maintenance and early morning awakenings are the most common symptoms among geriatric insomnia patients.
• The authors mention only in passing an important medication for sleep maintenance in adults and in the geriatric patient specifically: doxepin. Low-dose doxepin, at 3 mg (for the geriatric patient) and 6 mg, is FDA-approved as a nonscheduled hypnotic for sleep maintenance insomnia. This formulationa is the only hypnotic classified as safe for geriatric patients in the 2012 Beers Criteria Update of the American Geriatrics Society.1 Unlike higher dosages of doxepin, the action of low-dose doxepin is, essentially, selective H1 antagonism.
aSold as Silenor.
Reference
1. American Geriatrics Society 2012 Beers Criteria Update Expert Panel. American Geriatrics Society updated Beers Criteria for potentially inappropriate medication use in older adults. J Am Geriatr Soc. 2012;60(4):616-631.
Reference
1. American Geriatrics Society 2012 Beers Criteria Update Expert Panel. American Geriatrics Society updated Beers Criteria for potentially inappropriate medication use in older adults. J Am Geriatr Soc. 2012;60(4):616-631.
Gene variation explains drug toxicity in ALL

Credit: Peter Barta
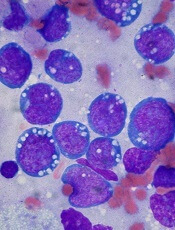
Inherited variations in the NUDT15 gene can reduce tolerance of the drug mercaptopurine in children with acute lymphoblastic leukemia (ALL), according to research published in the Journal of Clinical Oncology.
The study showed that patients who inherited one or two copies of the newly identified variation in the NUDT15 gene were extremely sensitive to mercaptopurine.
The patients required dose reductions of as much as 92%.
And when mercaptopurine was given at standard doses, the patients developed side effects that caused treatment delays.
These findings should aid efforts to improve the identification and treatment of patients who need reduced doses of mercaptopurine, according to researchers.
“Mercaptopurine intolerance has been suspected to be a problem for young ALL patients of East Asian ancestry,” said study author Jun J. Yang, PhD, of St Jude Children’s Research Hospital in Memphis, Tennessee.
“Even at very low doses, the patients often develop toxicity that delays treatment. But, until now, the genetic basis of the problem was unknown.”
With that in mind, Dr Yang and his colleagues performed a genome-wide association study in children with ALL who received mercaptopurine treatment regimens. The discovery and replication cohorts included 657 and 371 children, respectively, from two prospective trials.
The research revealed that patients of East Asian and Hispanic background were more likely to inherit the NUDT15 variant than patients from other racial and ethnic groups.
Among patients of East Asian ancestry, 9.8% carried at least one copy of the NUDT15 variant, compared to 3.9% of Hispanic patients. (East Asia includes China, Japan, and Korea.)
The NUDT15 variant was rarer among patients of European or African ancestry.
This study also confirmed previous research that showed variations in another gene, TPMT, are associated with an increased risk of mercaptopurine toxicity.
TPMT carries instructions for assembling an enzyme of the same name that inactivates mercaptopurine and related drugs. The TPMT variants are less able to inactivate the drug, which can lead to a dangerous build-up of mercaptopurine and suppression of the immune system.
The researchers suspect the NUDT15 variant acts in a similar fashion.
Regardless, the team found that 100% of children who were homozygous for either TPMT or NUDT15 variants or heterozygous for both required at least a 50% reduction in mercaptopurine dose. Only 7.7% of the other patients required similar reductions.
“The results of this study confirm that TPMT genetic variation is one of the most critical determinants of mercaptopurine tolerance, particularly in non-East Asian populations,” said senior study author Mary Relling, PharmD, of St Jude.
“But we also found that TPMT variants do not completely explain mercaptopurine intolerance, particularly in patients of East Asian ancestry. Other factors, both genetic and non-genetic, are still to be discovered to improve the safety and effectiveness of mercaptopurine treatment for children with ALL.” ![]()
Credit: Peter Barta
Inherited variations in the NUDT15 gene can reduce tolerance of the drug mercaptopurine in children with acute lymphoblastic leukemia (ALL), according to research published in the Journal of Clinical Oncology.
The study showed that patients who inherited one or two copies of the newly identified variation in the NUDT15 gene were extremely sensitive to mercaptopurine.
The patients required dose reductions of as much as 92%.
And when mercaptopurine was given at standard doses, the patients developed side effects that caused treatment delays.
These findings should aid efforts to improve the identification and treatment of patients who need reduced doses of mercaptopurine, according to researchers.
“Mercaptopurine intolerance has been suspected to be a problem for young ALL patients of East Asian ancestry,” said study author Jun J. Yang, PhD, of St Jude Children’s Research Hospital in Memphis, Tennessee.
“Even at very low doses, the patients often develop toxicity that delays treatment. But, until now, the genetic basis of the problem was unknown.”
With that in mind, Dr Yang and his colleagues performed a genome-wide association study in children with ALL who received mercaptopurine treatment regimens. The discovery and replication cohorts included 657 and 371 children, respectively, from two prospective trials.
The research revealed that patients of East Asian and Hispanic background were more likely to inherit the NUDT15 variant than patients from other racial and ethnic groups.
Among patients of East Asian ancestry, 9.8% carried at least one copy of the NUDT15 variant, compared to 3.9% of Hispanic patients. (East Asia includes China, Japan, and Korea.)
The NUDT15 variant was rarer among patients of European or African ancestry.
This study also confirmed previous research that showed variations in another gene, TPMT, are associated with an increased risk of mercaptopurine toxicity.
TPMT carries instructions for assembling an enzyme of the same name that inactivates mercaptopurine and related drugs. The TPMT variants are less able to inactivate the drug, which can lead to a dangerous build-up of mercaptopurine and suppression of the immune system.
The researchers suspect the NUDT15 variant acts in a similar fashion.
Regardless, the team found that 100% of children who were homozygous for either TPMT or NUDT15 variants or heterozygous for both required at least a 50% reduction in mercaptopurine dose. Only 7.7% of the other patients required similar reductions.
“The results of this study confirm that TPMT genetic variation is one of the most critical determinants of mercaptopurine tolerance, particularly in non-East Asian populations,” said senior study author Mary Relling, PharmD, of St Jude.
“But we also found that TPMT variants do not completely explain mercaptopurine intolerance, particularly in patients of East Asian ancestry. Other factors, both genetic and non-genetic, are still to be discovered to improve the safety and effectiveness of mercaptopurine treatment for children with ALL.” ![]()
Why EBV-positive lymphomas resist IFN therapy
Credit: Ed Uthman
New research has revealed how Epstein Barr virus (EBV) and other herpes viruses outwit the body’s immune response.
It seems these viruses carry microRNAs (miRNAs) that block the interferon (IFN) response—when immune cells release IFN to prevent viral replication, which often kills or slows the growth of infected host cells.
This appears to explain why patients with EBV-positive lymphomas and other viral cancers may resist treatment with IFN.
Jennifer Cox, a graduate student at the University of Texas Austin, and her colleagues recounted these findings in PNAS.
The team noted that many viruses, including EBV, carry miRNAs they use to hijack natural processes in a host’s cells during an infection.
Viral miRNAs are known to prevent host cell death, promote host cell growth, and dampen the host cell’s viral defenses. However, scientists don’t yet know which viral miRNAs perform which functions.
To gain some insight, Cox and her colleagues screened a library of more than 70 human viral miRNAs. This revealed 3 unrelated miRNAs from distantly related herpes viruses that significantly inhibited IFN signaling.
The 5’ and 3’ derivatives from EBV-encoded miR-BART-18 precursor miRNA and the orthologous precursor miRNA from Rhesus lymphocryptovirus all reduced expression of the cyclic AMP-responsive element-binding protein (CBP), which, as part of the p300-CBP complex, mediates IFN signaling.
When the researchers restored miR-BART-18 to cells infected with an EBV miRNA mutant, they observed a cellular growth advantage upon IFN treatment. And they found that miRNAs from other herpes viruses were able to complement this activity.
The team also showed that blocking miR-BART-18 function in an EBV-positive tumor cell line rendered cells more susceptible to IFN-mediated effects.
“[These findings] could explain the variability seen in the success of previous interferon-based cancer treatments,” Cox said. “While this work does not immediately identify new drugs, the fact that such different tumor viruses have converged on the same strategy makes this an exciting pursuit for future therapies against viral cancers.” ![]()
Drug on the fast track to treat HAE

within pancreatic tissue
Credit: Louisa Howard
The US Food and Drug Administration (FDA) has granted fast track designation for BCX4161, an oral inhibitor of plasma kallikrein intended to treat hereditary angioedema (HAE).
Uncontrolled activation of plasma kallikrein, caused by deficiency of its physiological inhibitor (C1 inhibitor) in HAE, results in acute systemic edema.
By inhibiting plasma kallikrein, BCX4161 suppresses the production of bradykinin, the mediator of acute swelling attacks in HAE patients.
HAE is a severely debilitating and potentially fatal condition that occurs in approximately 1 in 50,000 people. Symptoms include recurrent episodes of edema in various locations, as well as bouts of excruciating abdominal pain, nausea, and vomiting that are caused by swelling in the intestinal walls.
HAE patients have a defect in the gene that controls C1 inhibitor, and this results in the production of inadequate or non-functioning C1 inhibitor protein.
Normal C1 inhibitor helps regulate the biochemical interactions of blood-based systems involved in disease-fighting, inflammatory response, and coagulation.
Because defective C1 inhibitor does not adequately perform its regulatory function, a biochemical imbalance can occur and produce unwanted peptides that induce the capillaries to release fluids into surrounding tissue, causing edema.
BCX4161 trials
In May 2014, BioCryst Pharmaceuticals, the company developing BCX4161, announced results from the phase 2a OPuS-1 trial.
OPuS-1 investigators evaluated 400 mg of BCX4161 administered 3 times a day for 28 days in HAE patients with a high angioedema attack frequency (≥ 1 per week), in a randomized, placebo-controlled, 2-period cross-over design.
BCX4161 demonstrated a significant reduction in mean attack rate compared to placebo. The mean attack rate per patient-week was 0.82 on BCX4161 treatment and 1.27 on placebo (P<0.001).
The mean number of attack-free days during each treatment period improved from 19 for placebo to 22 for BCX4161 (P=0.008). Three subjects were attack-free during the BCX4161 period, compared to none during the placebo period.
BCX4161 was generally well-tolerated, BioCryst reported, with an adverse event profile similar to that observed for placebo. There was one serious adverse event reported, an abdominal HAE attack during the placebo period.
In December, the first patient was dosed in the OPuS-2 trial, a double-blind, randomized, placebo- controlled trial conducted in the US and European Union.
Study investigators will evaluate the efficacy and safety of BCX4161 treatment for 12 weeks in patients with HAE. BioCryst expects to report results from OPuS-2 by the end of 2015.
About fast track designation
The FDA’s fast track process is designed to facilitate the development and expedite the review and approval of drugs intended to treat serious or life-threatening conditions that also address unmet medical needs.
A drug that receives fast track designation is usually eligible for more frequent written communication and meetings with the FDA to discuss the drug’s development plan and the collection of appropriate data supporting drug approval.
Priority review and rolling review may be granted if relevant criteria are met. Rolling review allows a drug company to submit completed sections of its new drug application on an ongoing basis, rather than wait until the entire application is complete. ![]()
Risk After Hospitalization
The immediate period after hospital discharge is dangerous. Patients' health, often marginal at best, frequently deteriorates, sending them to the emergency department,[1] back to the hospital inpatient service,[2] or into a period of functional decline.[3, 4] Among older patients hospitalized with heart failure, for example, death is even more common in the month following discharge than during the initial hospital stay.[5, 6] Vulnerabilities in this period are many, and patients are susceptible to deterioration in health from a broad spectrum of conditions, not just the initial illness that triggered hospitalization.[7] This period has been labeled posthospital syndrome, as it appears that patients have an acquired, transient period of generalized risk to a wide range of medical problems.[8] As recognition of these risks has increased, the goal of improved short‐term outcomes after hospitalization has become a focus for providers, payers, and policymakers.[9]
In this issue of the Journal of Hospital Medicine, McAlister and colleagues10 ask whether short‐term vulnerability after hospitalization is related to weekend versus weekday discharge. After examining almost 8000 patients discharged from the general medical wards of 7 teaching hospitals in Alberta, Canada, the authors found that only 1 in 7 were discharged on weekends, defined as Saturday or Sunday. Patients discharged on the weekend were younger, had fewer chronic health conditions, and shorter average lengths of stay. In analyses adjusted for patient demographics and a measure of short‐term risk after hospitalization (LACE score [length of hospital stay, acuity of admission, comorbidity burden quantified using the Charlson Comorbidity Index, and emergency department visits in the 6 months prior to admission]), weekend discharge was not associated with higher rates of unplanned readmission or death at 30 days.
Most strikingly, only the healthiest patients were discharged on weekends. These results are similar to findings from the authors' previous work on patients hospitalized with heart failure.[11] Yet the implications for discharge planning are much less clear, as the few analyses of discharge day from the authors[11] and others[12] do not account for the range of factors that may influence risk after hospitalization such as patients' clinical characteristics, the quality of both hospital and transitional care, and the posthospital environments to which patients are discharged. Not surprisingly, different methodological approaches have shown weekend discharge to be associated with a range of outcomes including lower,[12] identical,[10] and higher[11] rates of unplanned readmission and death. Moreover, the influence of discharge timing itself is likely to involve further complexities including patients' readiness for discharge,[13] the specific days of the week on which both admission and discharge occur,[14] and the outpatient resources made available to patients by specific health insurance carriers.[14]
These studies illustrate a fundamental issue with our efforts to reduce short‐term readmission, namely, that we do not understand which factors most influence risk.[15] Prediction models have generally focused on traditional markers of risk including patients' demographic characteristics, their physical examination findings, and laboratory test results. Although models based on these variables are often excellent at discriminating between patients who are likely to die soon after hospitalization, their ability to identify specific patients who will be rehospitalized has been mediocre.[16, 17] This difficulty with prediction suggests that readmission has far more complex determinants than death in the short‐term period after hospitalization. Unfortunately, we have yet to identify and model the factors that matter most.
Where should we look to find these additional sources of vulnerability after hospitalization? Previous research has made clear that we are unlikely to find single markers of risk that adequately predict the future. Rather, we will need to develop more complete understandings of patients including their dynamics of recovery, the role of the hospital environment in prolonging or instigating further vulnerability, the manners by which organizational context and implementation strategies impact transitional care, and the ways in which social and environmental factors hasten or retard recovery. For each of these categories, there are multiple specific questions to address. The following are illustrative examples.
PATIENT FACTORS
What is the role of multiple chronic conditions in risk after discharge? Are specific clusters of chronic diseases particularly correlated with adverse health events? Moreover, how do common impairments and syndromes in older persons, such as cognitive impairment, functional impairment, difficulty with walking, sleep disturbance, and frailty, contribute to posthospitalization vulnerability? Would measurements of mobility and function immediately after discharge provide additional value in risk stratification beyond such measurements made during hospitalization?
HOSPITAL ENVIRONMENT
How does ambient sound, ambient light, shared rooms, and frequent awakening for vital signs checks, diagnostic tests, or medication administration affect sleep duration and quality, incident delirium, and in‐hospital complications? What influence do these factors have on postdischarge recovery of baseline sleep patterns and cognition? How does forced immobility from bed rest or restraints influence recovery of muscle mass and the function of arms and legs after discharge? How does fasting prior to diagnostic tests or therapeutic interventions impact recovery of weight, recovery of strength, and susceptibility to further illnesses after hospitalization?
CARE TRANSITIONS
What are the influences of organizational context on the success or failure of specific transitional care interventions? What is the relative importance of senior managerial commitment to improving postdischarge outcomes, the presence of local champions for quality, and an organization's culture of learning, collaboration, and belief in shared accountability? How does the particular way in which a program is implemented and managed with regard to its staffing, education of key personnel, available resources, methods for data collection, measurement of results, and approach to continuous quality improvement relate to its ability to reduce readmission?
SOCIAL AND ENVIRONMENTAL FACTORS
What particular types of emotional, informational, and instrumental supports are most critical after hospitalization to avoid subsequent adverse health events? How do financial issues contribute to difficulties with follow‐up care and medication management, adherence to dietary and activity recommendations, and levels of stress and anxiety following discharge? How does the home environment mitigate or exacerbate new vulnerabilities after hospitalization?
Ultimately, an improved understanding of the breadth of factors that predict recurrent medical illness after discharge, as signaled by readmission, and the manner in which they confer risk will improve both risk prediction and efforts to mitigate vulnerability after hospitalization. Ultimately, we need to learn how to align our hospital environments, transitional care interventions, and strategies for longitudinal engagement in ways that improve patients' recovery. The work by McAlister and colleagues[10] is a step in the right direction, as it breaks with the exclusive examination of traditional patient factors to incorporate complexities associated with discharge timing. Such investigations are necessary to truly understand the myriad sources of risk and recovery after hospital discharge.
ACKNOWLEDGMENTS
Disclosures: Dr. Dharmarajan is supported by grant K23AG048331‐01 from the National Institute on Aging and the American Federation for Aging Research through the Paul B. Beeson Career Development Award Program. Dr. Krumholz is supported by grant 1U01HL105270‐05 (Center for Cardiovascular Outcomes Research at Yale University) from the National Heart, Lung, and Blood Institute. The content is solely the responsibility of the authors and does not represent the official views of the National Institute on Aging; National Heart, Lung, and Blood Institute; or American Federation for Aging Research. Drs. Dharmarajan and Krumholz work under contract with the Centers for Medicare & Medicaid Services to develop and maintain performance measures. Dr. Krumholz is the chair of a cardiac scientific advisory board for UnitedHealth and is the recipient of research grants from Medtronic and from Johnson & Johnson, through Yale University, to develop methods of clinical trial data sharing.
- , , , et al. Use of hospital‐based acute care among patients recently discharged from the hospital. JAMA. 2013;309:364–371.
- , , . Rehospitalizations among patients in the Medicare fee‐for‐service program. N Engl J Med. 2009;360:1418–1428.
- , , , . Hospitalization, restricted activity, and the development of disability among older persons. JAMA. 2004;292:2115–2124.
- , , , . Change in disability after hospitalization or restricted activity in older persons. JAMA. 2010;304:1919–1928.
- , , , et al. Trends in length of stay and short‐term outcomes among Medicare patients hospitalized for heart failure, 1993–2006. JAMA. 2010;303:2141–2147.
- , , , et al. Comparison of hospital risk‐standardized mortality rates calculated by using in‐hospital and 30‐day models: an observational study with implications for hospital profiling. Ann Intern Med. 2012;156:19–26.
- , , , et al. Diagnoses and timing of 30‐day readmissions after hospitalization for heart failure, acute myocardial infarction, or pneumonia. JAMA. 2013;309:355–363.
- . Post‐hospital syndrome—an acquired, transient condition of generalized risk. N Engl J Med. 2013;368:100–102.
- , . Hospital readmissions and the Affordable Care Act: paying for coordinated quality care. JAMA. 2011;306:1794–1795.
- , , , . Post‐discharge outcomes are similar for weekend versus weekday discharges for general internal medicine patients admitted to teaching hospitals. J Hosp Med. 2015;10(2):69–74.
- , , , , . Postdischarge outcomes in heart failure are better for teaching hospitals and weekday discharges. Circ Heart Fail. 2013;6:922–929.
- , . Risk of death or readmission among people discharged from hospital on Fridays. CMAJ. 2002;166:1672–1673.
- , , , et al. Predictors of short‐term rehospitalization following discharge of patients hospitalized with community‐acquired pneumonia. Chest. 2009;136:1079–1085.
- , , . Should hospitals keep their patients longer? The role of inpatient and outpatient care in reducing readmissions. NBER working paper no. 20499. Cambridge, MA: National Bureau of Economic Research; 2014.
- , , , et al. Risk prediction models for hospital readmission: a systematic review. JAMA. 2011;306:1688–1698.
- , . Strategies to reduce 30‐day readmissions in older patients hospitalized with heart failure and acute myocardial infarction. Curr Geri Rep. 2014;3:306–315.
- , , . Postdischarge environment following heart failure hospitalization: expanding the view of hospital readmission. J Am Heart Assoc. 2013;2:e000116.
The immediate period after hospital discharge is dangerous. Patients' health, often marginal at best, frequently deteriorates, sending them to the emergency department,[1] back to the hospital inpatient service,[2] or into a period of functional decline.[3, 4] Among older patients hospitalized with heart failure, for example, death is even more common in the month following discharge than during the initial hospital stay.[5, 6] Vulnerabilities in this period are many, and patients are susceptible to deterioration in health from a broad spectrum of conditions, not just the initial illness that triggered hospitalization.[7] This period has been labeled posthospital syndrome, as it appears that patients have an acquired, transient period of generalized risk to a wide range of medical problems.[8] As recognition of these risks has increased, the goal of improved short‐term outcomes after hospitalization has become a focus for providers, payers, and policymakers.[9]
In this issue of the Journal of Hospital Medicine, McAlister and colleagues10 ask whether short‐term vulnerability after hospitalization is related to weekend versus weekday discharge. After examining almost 8000 patients discharged from the general medical wards of 7 teaching hospitals in Alberta, Canada, the authors found that only 1 in 7 were discharged on weekends, defined as Saturday or Sunday. Patients discharged on the weekend were younger, had fewer chronic health conditions, and shorter average lengths of stay. In analyses adjusted for patient demographics and a measure of short‐term risk after hospitalization (LACE score [length of hospital stay, acuity of admission, comorbidity burden quantified using the Charlson Comorbidity Index, and emergency department visits in the 6 months prior to admission]), weekend discharge was not associated with higher rates of unplanned readmission or death at 30 days.
Most strikingly, only the healthiest patients were discharged on weekends. These results are similar to findings from the authors' previous work on patients hospitalized with heart failure.[11] Yet the implications for discharge planning are much less clear, as the few analyses of discharge day from the authors[11] and others[12] do not account for the range of factors that may influence risk after hospitalization such as patients' clinical characteristics, the quality of both hospital and transitional care, and the posthospital environments to which patients are discharged. Not surprisingly, different methodological approaches have shown weekend discharge to be associated with a range of outcomes including lower,[12] identical,[10] and higher[11] rates of unplanned readmission and death. Moreover, the influence of discharge timing itself is likely to involve further complexities including patients' readiness for discharge,[13] the specific days of the week on which both admission and discharge occur,[14] and the outpatient resources made available to patients by specific health insurance carriers.[14]
These studies illustrate a fundamental issue with our efforts to reduce short‐term readmission, namely, that we do not understand which factors most influence risk.[15] Prediction models have generally focused on traditional markers of risk including patients' demographic characteristics, their physical examination findings, and laboratory test results. Although models based on these variables are often excellent at discriminating between patients who are likely to die soon after hospitalization, their ability to identify specific patients who will be rehospitalized has been mediocre.[16, 17] This difficulty with prediction suggests that readmission has far more complex determinants than death in the short‐term period after hospitalization. Unfortunately, we have yet to identify and model the factors that matter most.
Where should we look to find these additional sources of vulnerability after hospitalization? Previous research has made clear that we are unlikely to find single markers of risk that adequately predict the future. Rather, we will need to develop more complete understandings of patients including their dynamics of recovery, the role of the hospital environment in prolonging or instigating further vulnerability, the manners by which organizational context and implementation strategies impact transitional care, and the ways in which social and environmental factors hasten or retard recovery. For each of these categories, there are multiple specific questions to address. The following are illustrative examples.
PATIENT FACTORS
What is the role of multiple chronic conditions in risk after discharge? Are specific clusters of chronic diseases particularly correlated with adverse health events? Moreover, how do common impairments and syndromes in older persons, such as cognitive impairment, functional impairment, difficulty with walking, sleep disturbance, and frailty, contribute to posthospitalization vulnerability? Would measurements of mobility and function immediately after discharge provide additional value in risk stratification beyond such measurements made during hospitalization?
HOSPITAL ENVIRONMENT
How does ambient sound, ambient light, shared rooms, and frequent awakening for vital signs checks, diagnostic tests, or medication administration affect sleep duration and quality, incident delirium, and in‐hospital complications? What influence do these factors have on postdischarge recovery of baseline sleep patterns and cognition? How does forced immobility from bed rest or restraints influence recovery of muscle mass and the function of arms and legs after discharge? How does fasting prior to diagnostic tests or therapeutic interventions impact recovery of weight, recovery of strength, and susceptibility to further illnesses after hospitalization?
CARE TRANSITIONS
What are the influences of organizational context on the success or failure of specific transitional care interventions? What is the relative importance of senior managerial commitment to improving postdischarge outcomes, the presence of local champions for quality, and an organization's culture of learning, collaboration, and belief in shared accountability? How does the particular way in which a program is implemented and managed with regard to its staffing, education of key personnel, available resources, methods for data collection, measurement of results, and approach to continuous quality improvement relate to its ability to reduce readmission?
SOCIAL AND ENVIRONMENTAL FACTORS
What particular types of emotional, informational, and instrumental supports are most critical after hospitalization to avoid subsequent adverse health events? How do financial issues contribute to difficulties with follow‐up care and medication management, adherence to dietary and activity recommendations, and levels of stress and anxiety following discharge? How does the home environment mitigate or exacerbate new vulnerabilities after hospitalization?
Ultimately, an improved understanding of the breadth of factors that predict recurrent medical illness after discharge, as signaled by readmission, and the manner in which they confer risk will improve both risk prediction and efforts to mitigate vulnerability after hospitalization. Ultimately, we need to learn how to align our hospital environments, transitional care interventions, and strategies for longitudinal engagement in ways that improve patients' recovery. The work by McAlister and colleagues[10] is a step in the right direction, as it breaks with the exclusive examination of traditional patient factors to incorporate complexities associated with discharge timing. Such investigations are necessary to truly understand the myriad sources of risk and recovery after hospital discharge.
ACKNOWLEDGMENTS
Disclosures: Dr. Dharmarajan is supported by grant K23AG048331‐01 from the National Institute on Aging and the American Federation for Aging Research through the Paul B. Beeson Career Development Award Program. Dr. Krumholz is supported by grant 1U01HL105270‐05 (Center for Cardiovascular Outcomes Research at Yale University) from the National Heart, Lung, and Blood Institute. The content is solely the responsibility of the authors and does not represent the official views of the National Institute on Aging; National Heart, Lung, and Blood Institute; or American Federation for Aging Research. Drs. Dharmarajan and Krumholz work under contract with the Centers for Medicare & Medicaid Services to develop and maintain performance measures. Dr. Krumholz is the chair of a cardiac scientific advisory board for UnitedHealth and is the recipient of research grants from Medtronic and from Johnson & Johnson, through Yale University, to develop methods of clinical trial data sharing.
- , , , et al. Use of hospital‐based acute care among patients recently discharged from the hospital. JAMA. 2013;309:364–371.
- , , . Rehospitalizations among patients in the Medicare fee‐for‐service program. N Engl J Med. 2009;360:1418–1428.
- , , , . Hospitalization, restricted activity, and the development of disability among older persons. JAMA. 2004;292:2115–2124.
- , , , . Change in disability after hospitalization or restricted activity in older persons. JAMA. 2010;304:1919–1928.
- , , , et al. Trends in length of stay and short‐term outcomes among Medicare patients hospitalized for heart failure, 1993–2006. JAMA. 2010;303:2141–2147.
- , , , et al. Comparison of hospital risk‐standardized mortality rates calculated by using in‐hospital and 30‐day models: an observational study with implications for hospital profiling. Ann Intern Med. 2012;156:19–26.
- , , , et al. Diagnoses and timing of 30‐day readmissions after hospitalization for heart failure, acute myocardial infarction, or pneumonia. JAMA. 2013;309:355–363.
- . Post‐hospital syndrome—an acquired, transient condition of generalized risk. N Engl J Med. 2013;368:100–102.
- , . Hospital readmissions and the Affordable Care Act: paying for coordinated quality care. JAMA. 2011;306:1794–1795.
- , , , . Post‐discharge outcomes are similar for weekend versus weekday discharges for general internal medicine patients admitted to teaching hospitals. J Hosp Med. 2015;10(2):69–74.
- , , , , . Postdischarge outcomes in heart failure are better for teaching hospitals and weekday discharges. Circ Heart Fail. 2013;6:922–929.
- , . Risk of death or readmission among people discharged from hospital on Fridays. CMAJ. 2002;166:1672–1673.
- , , , et al. Predictors of short‐term rehospitalization following discharge of patients hospitalized with community‐acquired pneumonia. Chest. 2009;136:1079–1085.
- , , . Should hospitals keep their patients longer? The role of inpatient and outpatient care in reducing readmissions. NBER working paper no. 20499. Cambridge, MA: National Bureau of Economic Research; 2014.
- , , , et al. Risk prediction models for hospital readmission: a systematic review. JAMA. 2011;306:1688–1698.
- , . Strategies to reduce 30‐day readmissions in older patients hospitalized with heart failure and acute myocardial infarction. Curr Geri Rep. 2014;3:306–315.
- , , . Postdischarge environment following heart failure hospitalization: expanding the view of hospital readmission. J Am Heart Assoc. 2013;2:e000116.
OMP and SNAPPS for Inpatient Teaching
Hospitalists who teach in the clinical environment face challenges that include increased workload,[1] perception among trainees that there is less time to teach,[2] and competition with electronic devices for teaching engagement.[3, 4] In view of these and other challenges, we believe there is potentially much to gain from considering and adapting educational techniques that have been successful in nonhospital and even nonmedical domains. Innovative teaching methods include those designed for the grade‐school classroom (Courage to Teach,[5] Teaching With Love and Logic[6]), and the business world (Teaching Smart People How to Learn,[7] The Back of the Napkin[8]), among other nonmedical professions. Within medicine, we can also re‐examine strategies long utilized in the ambulatory setting. Pascoe and colleagues offer an important example of this in their review of one‐minute preceptor (OMP) and SNAPPS, techniques developed by our colleagues in the outpatient setting but with great potential for framing discussion of clinical reasoning in the inpatient space.[9]
Applying OMP and SNAPPS to inpatient teaching presents some challenges but also genuine opportunities not found in traditional outpatient teaching. As noted by the authors, unlike the solitary learner typical of the outpatient setting, in the inpatient setting the attending is more commonly working with a group of learners of multiple levels and sometimes multiple disciplines. Furthermore, the supervising resident typical of inpatient teams is a learner who inhabits the roles of both trainee and teacher. One can imagine that if OMP and SNAPPs are applied with absolute fidelity to the inpatient setting, without reflection on venue, the teaching encounter might be overly focused on the presenting learner, leaving the rest of the team unattended to, disengaged, and not benefitting from the models. Therefore, attention to group engagement in the process is necessary for successful adaptation. Both models have the potential to help organize the group dynamic during rounds to promote broad participation. The authors describe some examples of how to engage various group members in different steps. It is worth highlighting a few key themes that enable successful use of these models in the inpatient setting.
One key theme is to teach the model to the supervising resident at the beginning of the rotation and agree, before rounds, how the attending and resident will interact as coleaders of the discussion. Because these models offer a stepwise approach to going through a case with a learner, they have the potential to demystify the teaching process, offering an accessible framework for supervising residents to learn teaching both by practicing and by comprehending what their attending is doing to lead a team through a case discussion. With attending support, the supervising resident can be encouraged to manage the team discussion, leading the team using either approach. It can be helpful to touch base briefly before rounds each day to define the teaching roles, giving the resident progressively more responsibility leading the discussion as the rotation progresses.
Another key theme is to use graduated participation. As the authors note, the group must be engaged in the discussion, and the example scenarios illustrate each step of the models being applied to the group. To ensure that the entire group remains eager to partake, the leader must maintain a nonthreatening teaching atmosphere, organizing participation in a way that does not shame learners or undermine the roles people inhabit. To this end, it can be helpful to direct questions to particular members or levels of the group at a time. When expanding participation around a specific question or concept, always work from junior members to senior members, never imposing the reverse. This principle is clearly not exclusive to using these models, but is requisite to successful adaptation of these traditionally dyadic models, in which there is no particular attention to group dynamics within the framework.
A third key theme is to utilize the unique expertise of the other health professionals on the team in steps 4, 5, and 6 of SNAPPS and step 3 of OMP. In step 4 and 5 of SNAPPS, when the teaching attending introduces the team to the model, it is important to encourage them to probe not just the teacher but other disciplines on the team for input. In the inpatient setting, these steps provide an organized point in the discussion in which to involve the other members of the professional team, modeling collaborative interdisciplinary practice.
As Pascoe et al. point out, there are limited studies of OMP and SNAPPS as teaching models in the inpatient environment. This should stimulate academic hospitalists with interest in medical education research to consider how these models might be studied. For example, in comparison to traditional inpatient teaching rounds, do these approaches provide equivalent content coverage? How do they impact the efficiency of teaching rounds? Are attendings who consistently apply these models more effective in providing feedback or assessing training milestones? How much training and practice is required to incorporate these teaching models in the inpatient environment?
Given the time pressure and increasing complexity of medical care in the hospital, coupled with the evolving needs and resources of our learners, we must seek innovative educational practices from sources outside our hospitals to provide the best possible training in hospital medicine. An outstanding recent review by Martin et al. provided an overview of other strategies for teaching in today's environment.[10] We also have much to learn from our colleagues in outpatient medicine, not only in clinical care, but also in medical education. And we have much that we have learned about teaching as hospitalists that needs to be more broadly disseminated.
ACKNOWLEDGMENTS
Disclosure: Nothing to report.
- , , , et al. Effect of the 2011 vs 2003 duty hour regulation‐compliant models on sleep duration, trainee education, and continuity of patient care among internal medicine house staff: a randomized trial. JAMA Intern Med. 2013;173(8):649–655.
- , , , , . Impact of duty‐hour restriction on resident inpatient teaching. J Hosp Med. 2009;4(8):476–480.
- . Culture shock—patient as icon, icon as patient. N Engl J Med. 2008;359(26):2748–2751.
- , , , . Smartphone use during inpatient attending rounds: prevalence, patterns and potential for distraction. J Hosp Med. 2012;7(8):595–599.
- . The Courage to Teach: Exploring the Inner Landscape of a Teacher's Life. San Francisco, CA: Jossey‐Bass; 2007.
- , . Teaching With Love 1995.
- . Teaching Smart People How to Learn. Boston, MA: Harvard Business Press; 2008.
- . The Back of the Napkin: Solving Problems and Selling Ideas With Pictures. New York, NY: Portfolio; 2008.
- , , . Maximizing teaching on the wards: review and application of the one‐minute preceptor and SNAPPS models. J Hosp Med. 2015;10(2):125–130.
- , , . Future: new strategies for hospitalists to overcome challenges in teaching on today's wards. J Hosp Med. 2013;8(7):409–413.
Hospitalists who teach in the clinical environment face challenges that include increased workload,[1] perception among trainees that there is less time to teach,[2] and competition with electronic devices for teaching engagement.[3, 4] In view of these and other challenges, we believe there is potentially much to gain from considering and adapting educational techniques that have been successful in nonhospital and even nonmedical domains. Innovative teaching methods include those designed for the grade‐school classroom (Courage to Teach,[5] Teaching With Love and Logic[6]), and the business world (Teaching Smart People How to Learn,[7] The Back of the Napkin[8]), among other nonmedical professions. Within medicine, we can also re‐examine strategies long utilized in the ambulatory setting. Pascoe and colleagues offer an important example of this in their review of one‐minute preceptor (OMP) and SNAPPS, techniques developed by our colleagues in the outpatient setting but with great potential for framing discussion of clinical reasoning in the inpatient space.[9]
Applying OMP and SNAPPS to inpatient teaching presents some challenges but also genuine opportunities not found in traditional outpatient teaching. As noted by the authors, unlike the solitary learner typical of the outpatient setting, in the inpatient setting the attending is more commonly working with a group of learners of multiple levels and sometimes multiple disciplines. Furthermore, the supervising resident typical of inpatient teams is a learner who inhabits the roles of both trainee and teacher. One can imagine that if OMP and SNAPPs are applied with absolute fidelity to the inpatient setting, without reflection on venue, the teaching encounter might be overly focused on the presenting learner, leaving the rest of the team unattended to, disengaged, and not benefitting from the models. Therefore, attention to group engagement in the process is necessary for successful adaptation. Both models have the potential to help organize the group dynamic during rounds to promote broad participation. The authors describe some examples of how to engage various group members in different steps. It is worth highlighting a few key themes that enable successful use of these models in the inpatient setting.
One key theme is to teach the model to the supervising resident at the beginning of the rotation and agree, before rounds, how the attending and resident will interact as coleaders of the discussion. Because these models offer a stepwise approach to going through a case with a learner, they have the potential to demystify the teaching process, offering an accessible framework for supervising residents to learn teaching both by practicing and by comprehending what their attending is doing to lead a team through a case discussion. With attending support, the supervising resident can be encouraged to manage the team discussion, leading the team using either approach. It can be helpful to touch base briefly before rounds each day to define the teaching roles, giving the resident progressively more responsibility leading the discussion as the rotation progresses.
Another key theme is to use graduated participation. As the authors note, the group must be engaged in the discussion, and the example scenarios illustrate each step of the models being applied to the group. To ensure that the entire group remains eager to partake, the leader must maintain a nonthreatening teaching atmosphere, organizing participation in a way that does not shame learners or undermine the roles people inhabit. To this end, it can be helpful to direct questions to particular members or levels of the group at a time. When expanding participation around a specific question or concept, always work from junior members to senior members, never imposing the reverse. This principle is clearly not exclusive to using these models, but is requisite to successful adaptation of these traditionally dyadic models, in which there is no particular attention to group dynamics within the framework.
A third key theme is to utilize the unique expertise of the other health professionals on the team in steps 4, 5, and 6 of SNAPPS and step 3 of OMP. In step 4 and 5 of SNAPPS, when the teaching attending introduces the team to the model, it is important to encourage them to probe not just the teacher but other disciplines on the team for input. In the inpatient setting, these steps provide an organized point in the discussion in which to involve the other members of the professional team, modeling collaborative interdisciplinary practice.
As Pascoe et al. point out, there are limited studies of OMP and SNAPPS as teaching models in the inpatient environment. This should stimulate academic hospitalists with interest in medical education research to consider how these models might be studied. For example, in comparison to traditional inpatient teaching rounds, do these approaches provide equivalent content coverage? How do they impact the efficiency of teaching rounds? Are attendings who consistently apply these models more effective in providing feedback or assessing training milestones? How much training and practice is required to incorporate these teaching models in the inpatient environment?
Given the time pressure and increasing complexity of medical care in the hospital, coupled with the evolving needs and resources of our learners, we must seek innovative educational practices from sources outside our hospitals to provide the best possible training in hospital medicine. An outstanding recent review by Martin et al. provided an overview of other strategies for teaching in today's environment.[10] We also have much to learn from our colleagues in outpatient medicine, not only in clinical care, but also in medical education. And we have much that we have learned about teaching as hospitalists that needs to be more broadly disseminated.
ACKNOWLEDGMENTS
Disclosure: Nothing to report.
- , , , et al. Effect of the 2011 vs 2003 duty hour regulation‐compliant models on sleep duration, trainee education, and continuity of patient care among internal medicine house staff: a randomized trial. JAMA Intern Med. 2013;173(8):649–655.
- , , , , . Impact of duty‐hour restriction on resident inpatient teaching. J Hosp Med. 2009;4(8):476–480.
- . Culture shock—patient as icon, icon as patient. N Engl J Med. 2008;359(26):2748–2751.
- , , , . Smartphone use during inpatient attending rounds: prevalence, patterns and potential for distraction. J Hosp Med. 2012;7(8):595–599.
- . The Courage to Teach: Exploring the Inner Landscape of a Teacher's Life. San Francisco, CA: Jossey‐Bass; 2007.
- , . Teaching With Love 1995.
- . Teaching Smart People How to Learn. Boston, MA: Harvard Business Press; 2008.
- . The Back of the Napkin: Solving Problems and Selling Ideas With Pictures. New York, NY: Portfolio; 2008.
- , , . Maximizing teaching on the wards: review and application of the one‐minute preceptor and SNAPPS models. J Hosp Med. 2015;10(2):125–130.
- , , . Future: new strategies for hospitalists to overcome challenges in teaching on today's wards. J Hosp Med. 2013;8(7):409–413.
PCPs Who Adopted the Hospitalist Model
Although primary care physicians (PCPs) have traditionally treated patients in both ambulatory and hospital settings, many relinquished inpatient duties to hospitalists in recent decades.[1] Little is known about the PCPs who relinquished inpatient care duties or how the transition to the hospitalist model occurred. For example, what are the characteristics of PCPs who change? Do PCPs adopt the hospitalist model enthusiastically or cautiously? Characterizing PCPs who adopted the hospitalist model can help hospitalists understand their specialty's history and also inform health services research.
Much of the interest in the hospitalist model has been generated by studies reporting improved outcomes and lower hospital lengths of stay associated with hospitalist care.[2, 3, 4, 5] Conversely, detractors of the model point to reports of higher postacute care utilization among hospitalist patients.[6] Although these studies usually adjusted for differences among patients and hospitals, they did not account for PCP characteristics. As patients' access to PCPs and their PCP's capabilities are both plausible factors that could influence hospital length of stay (eg, decisions to complete more or less of a workup in the hospital), quality of care transitions, and postdischarge utilization, it is important to determine if PCPs who use hospitalists differ systematically from those who do not to correctly interpret health system utilization patterns that currently are attributed only to hospitalists.[7, 8]
We conducted this study to determine if observable PCP factors are associated with patients' use of hospitalists and to describe the trajectory by which PCPs referred their patients to hospitalists over time.
METHODS
Source of Data
We used claims data from 100% of Texas Medicare beneficiaries from 2000 to 2009, including Medicare beneficiary summary files, Medicare Provider Analysis and Review (MedPAR) files, Outpatient Standard Analytical Files (OutSAF), and Medicare Carrier files. Diagnosis related group (DRG)‐associated information, including weights, and Major Diagnostic Categories, were obtained from Centers for Medicare & Medicaid Services (
Establishment of the Study Cohort
Using the MedPAR file, we first selected hospital admissions from acute care hospitals in Texas for each year of the study period. We excluded beneficiaries younger than 66 years old, with incomplete Medicare Parts A and B enrollment, or with any health maintenance organization enrollment in the 12 months prior to the admission of interest. For patients with more than 1 admission in a given year, we randomly selected 1 admission. We then attempted to assign each patient to a PCP. We defined a PCP as a generalist (general practitioner, family physician, internist, or geriatrician) who saw a given beneficiary on 3 or more occasions in an outpatient setting in the year prior to the admission of interest.[9] We identified outpatient visits using Current Procedural Terminology (CPT) codes 99201 to 99205 (new patient encounters), and 99211 to 99215 (established patient encounters) from Carrier files. If more than 1 generalist physician saw the beneficiary on 3 or more occasions in a given year, the physician with more than 75% of the total outpatient evaluation and management (E&M) billings was classified as the beneficiary's PCP. Using these criteria, approximately 66% of patients were assigned to a PCP.
For cross‐sectional analyses, we restricted our cohort to beneficiaries whose PCPs were associated with at least 20 inpatients in a given year. To study trends in PCP practice patterns over time, we further restricted the cohort to beneficiaries whose PCPs were associated with at least 20 inpatients in every year of the study period, resulting in 1172 PCPs for the trajectory analyses. The reliability of PCPs' practice profiles increases as the number of patients in their panel increases. We chose 20 inpatients as the minimum because PCPs with 20 hospitalized patients per study year would achieve a reliability of 0.9 for estimating the proportion of their patients that received care from hospitalists.[10]
Identification of Hospitalists
We defined hospitalists as generalists who had at least 100 E&M billings in a given year and generated at least 90% of their total E&M billings in the year from inpatient services.[1] Inpatient E&M billings were identified by CPT codes 99221 to 99223 (new or established patient encounters), 99231 to 99233 (subsequent hospital care), and 99251 to 99255 (inpatient consultations).[1]
Patient Measures
Patient demographic information including, age at admission, gender, race/ethnicity, and Medicaid eligibility were obtained from Medicare beneficiary summary files. We used the Medicaid indicator as a proxy for low socioeconomic status. Information on weekday versus weekend admission, emergent admission, and DRG were obtained from MedPAR files. The DRG category (circulatory system, digestive system, infectious disease, nervous system, respiratory system, or other) was determined based on its Major Diagnostic Category. We determined residence in a nursing facility in the 3 months before the admission of interest from the MedPAR files and by E&M codes 99304 to 99318 (nursing facility services) from Carrier files.[11] Comorbidities were identified using the claims from MedPAR, Carrier, and OutSAF files in the year prior to the admission of interest.[12] Total hospitalizations and outpatient visits in the prior year were identified from MedPAR files and Carrier files, respectively.
PCP Measures
We categorized PCPs by specialty (general practice, gamily practice, geriatric medicine, or internal medicine), years in practice, gender, US‐ versus foreign‐trained, metropolitan statistical area (MSA) of their practice location, and board certification status. The specialty was identified from Carrier files and the other information from AMA data. For each PCP, the total number of outpatient visits and total number of patients seen as outpatients in each year was calculated based on E&M codes (9920199205, 9921199215) from Carrier files. For each year, we computed the average outpatient age, gender, race, and outpatient comorbidity for each PCP's patient panel. We computed hospital volumes using the number of hospitalized patients associated with each PCP in the study cohort.
Study Outcome
To determine whether hospitalized patients received care from hospitalists during a given hospitalization, we identified all inpatient E&M bills from generalist physicians during the admission of interest by linking MedPAR and Carrier files. If more than 50% of the generalist inpatient E&M billings from generalist physicians were from 1 or more hospitalists, the patient was considered to have received care from hospitalists.
Statistical Analyses
Multilevel analyses were used to account for the clustering of patients within PCPs. All multilevel models were adjusted for patient characteristics including age, race/ethnicity, gender, Medicaid eligibility, emergency admission, weekend admission, DRG weight, DRG category, any nursing home stay in the prior 3 months, number of comorbidities, number of hospitalizations, and number of physician visits in the year prior to the admission of interest. To analyze trends in practice patterns, we first used multilevel models to calculate the proportions of inpatients cared for by hospitalists each year for each of the 1172 PCPs with at least 20 patients. Then we employed an SAS procedure (PROC TRAJ) developed by Jones et al. to classify these PCPs into groups based on their trajectories.[13] This group‐based trajectory modeling allowed us to identify relatively homogeneous clusters within a heterogeneous sample population.[14] We chose a model that classified the PCPs into 4 groups.[15] With 4 groups, the average of the posterior probabilities of group membership for the PCPs assigned to each group exceeded 0.93, indicating a low rate of misclassification among these 4 distinct groups. For the 1172 PCPs, we tested interactions between year of hospitalization and PCP characteristics while adjusting for patient characteristics in order to investigate whether or not the impacts of PCP characteristics on how likely their patients being cared for by hospitalists differed with time. All analyses were performed with SAS version 9.2 (SAS Institute Inc., Cary, NC).
RESULTS
During the 2001 through 2009 study period, between 2252 and 2848 PCPs were associated with at least 20 hospitalized beneficiaries in any single year. Among these, 1172 PCPs were associated with at least 20 hospitalized beneficiaries in every year of the study period. These 1172 PCPs were associated with 608,686 hospitalizations over the 9 years.
Table 1 presents the characteristics of the PCPs who contributed to the cross‐sectional analyses in 2001 (N=2252) and 2009 (N=2387), as well as the 1172 PCPs for whom we had data for all 9 years for the longitudinal analyses. Most PCPs were male, trained in the United States, and were board certified. The average number of Medicare patients seen by these PCPs and number of outpatient Medicare visits went up about 7% between 2001 and 2009.
| PCP Characteristics | Cross‐Sectional Analysis | Trajectory Analysis, 20012009 | |
|---|---|---|---|
| 2001 | 2009 | ||
| |||
| Overall, no. (%) | 2,252 (100%) | 2,387 (100%) | 1,172 (100%) |
| Specialty, no. (%) | |||
| General practice | 39 (1.7%) | 34 (1.4%) | 15 (1.3%) |
| Family practice | 948 (42.1%) | 1,089 (45.6%) | 466 (39.8%) |
| Internal medicine | 1,255 (55.7%) | 1,249 (52.3%) | 688 (58.7%) |
| Geriatrics | 10 (0.4%) | 15 (0.6%) | 3 (0.3%) |
| Gender, no. (%) | |||
| Male | 1,990 (88.4%) | 2,015 (84.4%) | 1,072 (91.5%) |
| Female | 262 (11.6%) | 372 (15.6%) | 100 (8.5%) |
| Trained in the United States, no. (%) | |||
| Yes | 1,669 (74.1%) | 1,738 (72.8%) | 844 (72.0%) |
| No | 583 (25.9%) | 649 (27.2%) | 328 (28.0%) |
| Metropolitan statistical area, no. (%) | |||
| 99,999 or less | 417 (17.5) | 237 (20.2) | |
| 100,000249,000 | 438 (18.3) | 234 (20.0) | |
| 250,000999,999 | 381 (16.0) | 216 (18.4) | |
| 1,000,000 or more | 1,151 (48.2) | 485 (41.4) | |
| Board certification, no. (%) | |||
| Yes | 1,657 (69.4%) | 800 (68.3%) | |
| No | 730 (30.6%) | 372 (31.7%) | |
| Years in practice, 2001, meanSD (Q1Q3) | 22.310.6 (15.028.0) | 21.28.9 (15.027.0) | |
| Years in practice, 2009, meanSD (Q1Q3) | 25.010.2 (17.032.0) | 29.28.9 (23.035.0) | |
| Total no. of Medicare outpatient visits, 2001, meanSD (Q1Q3) | 1,624.8879.2 (1,057.51,970.0) | 1,883.39,48.5 (1,236.52,240.5) | |
| Total no. of Medicare outpatient visits, 2009, meanSD (Q1Q3) | 1,733.81,053.3 (1,080.02,048.0) | 2,020.51,200.9 (1,334.52,373.0) | |
| Total no. of Medicare outpatients, 2001, meanSD (Q1Q3) | 418.6186.9 (284.0522.0) | 473.4189.5 (338.0580.5) | |
| Total no. of Medicare outpatients, 2009, meanSD (Q1Q3) | 448.7217.8 (300.0548.0) | 508.7238.2 (350.5615.0) | |
| No. of hospitalized patients, 2001, meanSD (Q1Q3) | 46.025.0 (27.057.0) | 53.028.0 (32.066.0) | |
| No. of hospitalized patients, 2009, meanSD (Q1Q3) | 44.024.0 (26.052.0) | 52.027.0 (33.065.0) | |
| Average outpatient age, 2001, meanSD (Q1Q3) | 72.82.3 (71.574.2) | 72.82.1 (71.774.1) | |
| Average outpatient age, 2009, meanSD (Q1Q3) | 72.12.8 (70.673.9) | 72.82.7 (71.474.5) | |
| Average outpatient gender (% male), 2001, meanSD (Q1Q3) | 38.17.0 (35.542.3) | 38.56.4 (36.242.3) | |
| Average outpatient gender (% male), 2009, meanSD (Q1Q3) | 40.27.6 (37.644.8) | 41.06.5 (38.644.8) | |
| Average outpatient race (% white), 2001, meanSD (Q1Q3) | 84.316.4 (79.295.5) | 85.414.3 (79.995.7) | |
| Average outpatient race (% white), 2009, meanSD (Q1Q3) | 85.214.4 (79.895.2) | 86.312.9 (80.895.6) | |
| Average outpatient comorbidity, 2001, meanSD (Q1Q3)a | 1.60.5 (1.21.8) | 1.60.4 (1.21.8) | |
| Average outpatient comorbidity, 2009, meanSD (Q1Q3)a | 2.20.6 (1.82.5) | 2.20.6 (1.72.5) | |
Figure 1 graphs the percentage of PCPs as a function of what percent of their hospitalized patients received care from hospitalists, and how that changed from 2001 to 2009. For 70.9% of PCPs, fewer than 5% of their hospitalized patients received hospitalist care in 2001. By 2009, the percent of PCPs in this category had decreased to 15.2%. In contrast, in 2001, more than half of the patients for 2.1% of PCPs received hospitalist care, and the percent of PCPs in this category increased to 26.3% by 2009.
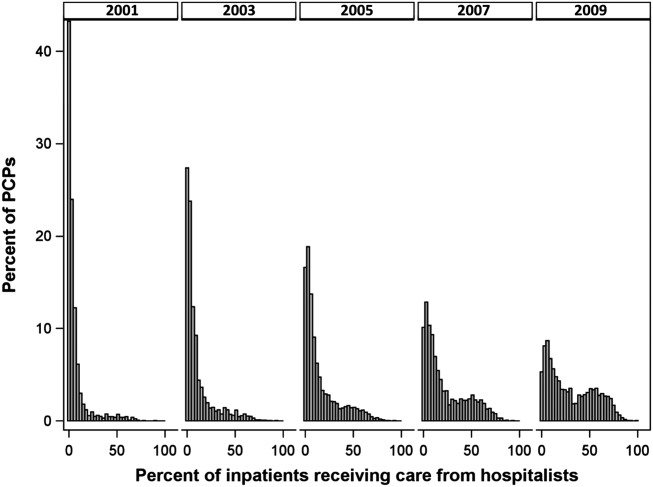
The pattern in Figure 1 shows that PCPs' use of hospitalists changed continuously and gradually over time. However, this pattern describes the PCPs as a group. When examined at the individual PCP level, different patterns emerge. Figure 2, which presents selected individual PCP's use of hospitalists over time, shows several distinct subpatterns of PCP practice behaviors. First, there are PCPs whose use of hospitalists was high in 2001 and stayed high or increased over time (eg, PCP A). There also were PCPs whose use of hospitalists stayed low over the entire study period (eg, PCP B). Finally, there were PCPs whose use of hospitalists was low in 2001 but high in 2009 (eg, PCP C). For this last group, the pattern of change in hospitalist utilization over time was discontinuous; that is, most of the increase occurred over a 1‐ or 2‐year period, instead of increasing gradually over time.
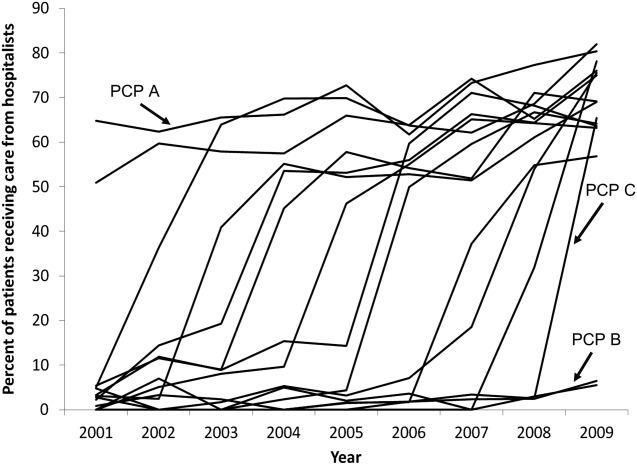
Among the 1172 PCPs associated with 20 hospitalized beneficiaries each year in all 9 years of the study period, group‐based trajectory modeling classified their practice patterns into 4 distinct trajectories (Figure 3). Among PCPs in group 1, more than one‐third of their hospitalized patients were cared for by hospitalists in 2001, and this increased to 60% by 2009. PCPs in groups 2 and 3 rarely used hospitalist care in 2001 but increased their use over time. The increase started early in the period for PCPs in group 2 and later for those in group 3. PCPs in group 4 were associated with little hospitalist use throughout the study period.
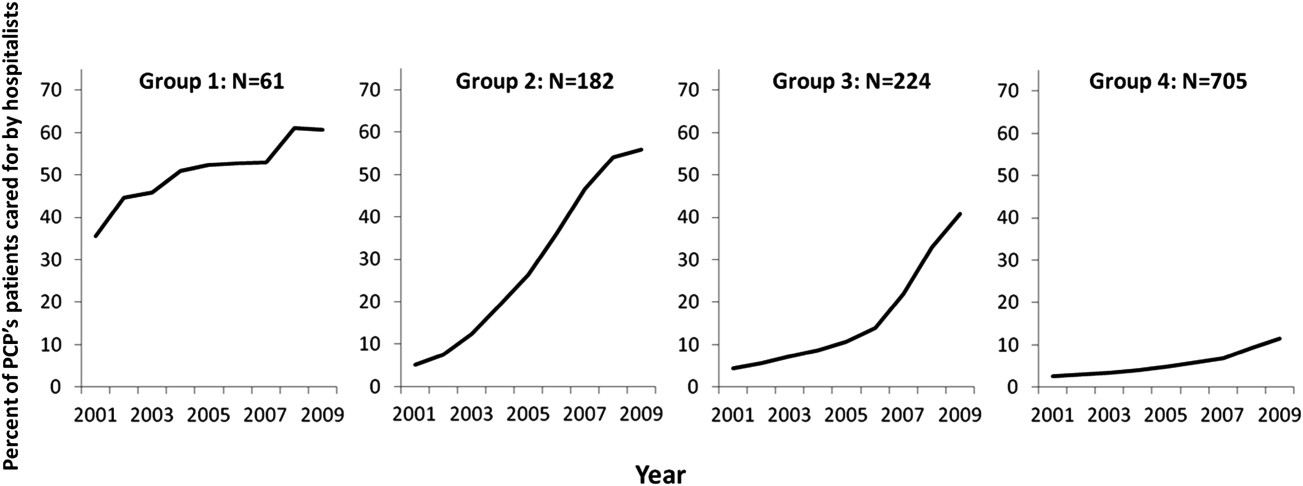
We constructed a model to describe the odds of a patient receiving care from hospitalists during the study period using patients associated with these 1172 PCPs. After adjusting for patient characteristics, the residual intraclass correlation coefficient for PCP level was 0.334, which indicates that 33.4% of the variance in whether a hospitalized patient received care from a hospitalist is explained by which PCP the patient saw. When adjusting for both patient and PCP characteristics, the overall odds of a patient receiving hospitalist care increased by 30% (95% confidence interval [CI]: 1.29‐1.30) per year from 2001 through 2009.
There were also significant interactions between year of hospitalization and several PCP characteristics. These interactions are illustrated in Table 2, which stratifies each of those PCP characteristics by 3 time periods: 2001 to 2003, 2004 to 2006, and 2007 to 2009. In all time periods, patients were more likely to receive hospitalist care if their PCP was US trained (US vs international medical graduate: odds ratio [OR]: 1.42, 95% CI: 1.19‐1.69 in 20012003; OR: 1.46, 95% CI: 1.23‐1.73 in 20072009), or specialized in family medicine (family medicine vs internal medicine: OR: 1.46, 95% CI: 1.25‐1.72 in 20012003; OR: 1.46, 95% CI: 1.25‐1.70 in 20072009). Over time, the relative odds of a patient receiving care from hospitalists decreased if their PCP was female (female vs male: OR: 1.91, 95% CI: 1.46‐2.50 in 20012003 vs OR: 1.50, 95% CI: 1.15‐1.95 in 20072009) or practiced in an urban area (largest vs smallest MSA: OR: 3.34, 95% CI: 2.72‐4.09 in 20012003; OR: 2.22, 95% CI: 1.82‐2.71 in 20072009). Although the longest‐practicing PCPs were most likely to use hospitalists in the early 2000s, this effect disappeared by 2007 to 2009 (most vs least years in practice: OR: 1.35, 95% CI: 1.06‐1.72 in 20012003 vs OR: 0.92, 95% CI: 0.73‐1.17 in 20072009).
| PCP Characteristics | 20012003, OR (95% CI) | 20042006, OR (95% CI) | 20072009, OR (95% CI) |
|---|---|---|---|
| |||
| Family practicea vs. internal medicineb | 1.46 (1.251.72) | 1.50 (1.281.76) | 1.46 (1.251.70) |
| Female vs male | 1.91 (1.462.50) | 1.43 (1.091.86) | 1.50 (1.151.95) |
| United States trained (yes vs no) | 1.42 (1.191.69) | 1.53 (1.281.81) | 1.46 (1.231.73) |
| Metropolitan statistical area | |||
| 99,999 or less | 1.00 | 1.00 | 1.00 |
| 100,000249,000 | 0.83 (0.651.05) | 1.00 (0.791.25) | 1.13 (0.901.41) |
| 250,000999,999 | 0.92 (0.721.17) | 1.03 (0.821.31) | 0.98 (0.771.23) |
| 1,000,000 or more | 3.34 (2.724.09) | 2.90 (2.373.54) | 2.22 (1.822.71) |
| Years in practice, 2001 | |||
| Q1 (lowest) | 1.00 | 1.00 | 1.00 |
| Q2 | 0.89 (0.711.12) | 0.83 (0.671.04) | 0.92 (0.741.14) |
| Q3 | 1.06 (0.841.34) | 0.99 (0.791.24) | 1.03 (0.821.29) |
| Q4 | 1.25 (0.991.59) | 1.13 (0.891.42) | 1.15 (0.921.45) |
| Q5 (highest) | 1.35 (1.061.72) | 1.05 (0.831.33) | 0.92 (0.731.17) |
| Total no. of outpatient visitsc | |||
| Q1 (lowest) | 1.00 | 1.00 | 1.00 |
| Q2 | 1.21 (1.121.30) | 1.07 (1.001.14) | 1.13 (1.071.19) |
| Q3 | 1.42 (1.301.54) | 1.18 (1.091.27) | 1.14 (1.071.22) |
| Q4 | 1.34 (1.211.47) | 1.34 (1.231.46) | 1.25 (1.161.35) |
| Q5 (highest) | 1.46 (1.301.63) | 1.33 (1.211.47) | 1.32 (1.201.44) |
| No. of hospitalized patientsc | |||
| Q1 (lowest) | 1.00 | 1.00 | 1.00 |
| Q2 | 1.07 (1.001.15) | 0.91 (0.860.96) | 0.85 (0.810.89) |
| Q3 | 1.00 (0.921.08) | 0.87 (0.820.93) | 0.74 (0.700.79) |
| Q4 | 0.89 (0.810.97) | 0.76 (0.710.82) | 0.62 (0.580.67) |
| Q5 (highest) | 1.05 (0.951.18) | 0.67 (0.610.73) | 0.55 (0.510.60) |
| Average outpatient agec | |||
| Q1 (lowest) | 1.00 | 1.00 | 1.00 |
| Q2 | 0.94 (0.871.01) | 1.15 (1.081.23) | 1.18 (1.111.25) |
| Q3 | 0.82 (0.760.90) | 1.05 (0.971.13) | 1.17 (1.091.25) |
| Q4 | 0.71 (0.650.79) | 1.03 (0.951.12) | 1.10 (1.021.19) |
| Q5 (highest) | 0.72 (0.640.81) | 1.12 (1.011.23) | 1.15 (1.051.26) |
| Average outpatient gender (% male)c | |||
| Q1 (lowest) | 1.00 | 1.00 | 1.00 |
| Q2 | 1.10 (1.021.18) | 1.19 (1.101.27) | 1.27 (1.181.37) |
| Q3 | 1.12 (1.031.22) | 1.27 (1.171.37) | 1.43 (1.321.54) |
| Q4 | 1.36 (1.251.48) | 1.49 (1.371.61) | 1.52 (1.401.65) |
| Q5 (highest) | 1.47 (1.341.61) | 1.84 (1.682.00) | 1.68 (1.541.83) |
| Average outpatient race (% white)c | |||
| Q1 (lowest) | 1.00 | 1.00 | 1.00 |
| Q2 | 1.08 (0.981.20) | 1.01 (0.921.10) | 1.23 (1.131.34) |
| Q3 | 1.27 (1.131.43) | 1.06 (0.951.18) | 1.21 (1.091.34) |
| Q4 | 1.47 (1.291.67) | 0.97 (0.861.09) | 1.33 (1.181.48) |
| Q5 (highest) | 1.39 (1.211.59) | 1.18 (1.041.34) | 1.25 (1.101.42) |
| Average outpatient comorbidityc | |||
| Q1 (lowest) | 1.00 | 1.00 | 1.00 |
| Q2 | 1.26 (1.191.35) | 1.23 (1.161.31) | 1.22 (1.141.30) |
| Q3 | 1.62 (1.491.75) | 1.61 (1.501.72) | 1.43 (1.341.54) |
| Q4 | 1.96 (1.792.15) | 1.86 (1.722.02) | 1.59 (1.471.72) |
| Q5 (highest) | 1.79 (1.592.01) | 2.20 (2.002.41) | 2.03 (1.852.22) |
In terms of PCP workload, patients of PCPs with high outpatient activity were more likely to receive hospitalists care throughout the study period, although the association had decreased by 2007 to 2009 (highest vs lowest outpatient volume: OR: 1.46, 95% CI: 1.30‐1.63 in 20012003 vs OR: 1.32, 95% CI: 1.20‐1.44 in 20072009). In contrast, PCPs with the lowest inpatient volumes became more likely to use hospitalists by the end of the study period (highest vs lowest inpatient volume: OR: 1.05, 95% CI: 0.95‐1.18 in 20012003 vs OR: 0.55, 95% CI: 0.51‐0.60 in 20072009).
The characteristics of PCPs' practice panels also were associated with patients' likelihood of receiving care from hospitalists. PCPs whose practice panels consisted of patients who were predominantly male, white, or with more outpatient comorbidities were consistently more likely to use hospitalists throughout the study period. PCPs with older patient panels were less likely to use hospitalists in 2001 to 2003, but by 2007 to 2009, they were slightly more likely to do so (oldest vs youngest average outpatient panel age: OR: 0.72, 95% CI: 0.64‐0.81 in 20012003 vs OR: 1.15, 95% CI: 1.05‐1.26 in 20072009).
CONCLUSIONS
Prior studies of the hospitalist model have shown that the likelihood of a patient receiving inpatient care from hospitalists is associated with patient characteristics, hospital characteristics, geographic region, and type of admission.[1, 16, 17] We found that PCP characteristics also predict whether patients receive care from hospitalists and that their use of hospitalists developed dynamically between 2001 to 2009. Although many factors (such as whether patients were admitted to a hospital where their PCP had admitting privileges) can influence the decision to use hospitalists, we found that over one‐third of the variance in whether a hospitalized patient received care from a hospitalist is explained by which PCP the patient saw. In showing that systemic differences exist among PCPs who use hospitalists and those who do not, our study suggests that future research on the hospitalist model should, if possible, adjust for PCP characteristics in addition to hospital and patient factors.
Although this study identifies the existence and magnitude of differences in whether or not PCPs use hospitalists, it cannot explain why the differences exist. We only can offer hypotheses. For example, our finding that PCPs with the most years of practice experience were more likely to use hospitalists in the early 2000s but not in more recent years suggests that in hospital medicine's early years, long‐practicing generalist physicians were choosing between practicing traditionalist medicine and adopting the hospitalists model, but by 2009, experienced generalist physicians had already specialized to either inpatient or outpatient settings earlier in their careers. On the other hand, the decreasing odds of urban PCPs using hospitalists may reflect a relative growth in hospitalist use in less populated areas rather than a change in urban PCPs' practice patterns.
PCPs trained in family medicine have reported less inpatient training and less comfort with providing hospital care,[18, 19] thus it is unsurprising that family physicians were more likely to refer patients to hospitalists. Although a recent study reported that family physicians' inpatient volumes remained constant, whereas those of outpatient internists declined between 2003 and 2012, the analysis used University Health Consortium data and thus reflects practice patterns in academic medical centers.[20] Our data suggest that outside of academia, family physicians have embraced the hospitalists as clinical partners.
Meltzer and Chung had previously proposed an economic model to describe the growing use of hospitalists in the United States. They posited that decisions to adopt the hospitalist model are governed by trade‐offs between coordination costs (eg, time and effort spent coordinating multiple providers across different settings) and switching costs (eg, time spent traveling between the office and the hospital or the effort of adjusting to different work settings).[16] The authors hypothesized that empirical testing of this model would show PCPs are more likely to use hospitalists if they have less available professional time (ie, work fewer hours per week), are female (due to competing demands from domestic responsibilities), have relatively few hospitalized patients, or live in areas with high traffic congestion. Our findings provide empirical evidence to support their division‐of‐labor model in showing that patients were more likely to receive hospitalist care if their PCP was female, practiced in an urban location, had higher outpatient practice volumes, or had lower inpatient volumes.
At first glance, some of our findings appear to contradict our earlier study, which showed that younger, black, male patients are more likely to receive inpatient care from hospitalists.[1] However, that study included patients regardless of whether they had a PCP. This study shows that when patients have a PCP, their PCPs are more likely to refer them to hospitalists if they are older, white, male, and have more comorbid conditions. A potential explanation for this finding is that PCPs may preferentially use hospitalists when caring for older and sicker hospitalized patients. For example, commentators often cite hospitalists' constant availability in the hospital as a valuable resource when caring for acutely ill patients.[21, 22]
Another potential explanation is that despite their preferences, PCPs who care for younger, minority patients lack access to hospitalist services. One large study of Medicare beneficiaries reported that physicians who care for black patients are less well‐trained clinically and often lack access to important clinical resources such as diagnostic imaging and nonemergency hospital admissions.[23] Similarly, international medical graduates are more likely than their US‐trained counterparts to care for underserved patients and to practice in small, independent offices.[24, 25, 26] As hospitalist groups often rely on cross‐subsidization from sources within a large healthcare organization, independent PCPs may have less access to their services when compared with PCPs in managed care organizations or large integrated groups. Viewed in this context, our findings imply that although hospitalists often care for socioeconomically vulnerable patients (eg, younger, uninsured, black men) who lack access to primary care services,[1] they also appear to share care responsibilities for more complex hospitalized patients with PCPs in more affluent communities. Further research may determine if the availability of hospitalists influences racial disparities in hospital care.
Our study has limitations. It is an observational study and thus subject to bias and confounding. As our cohort was formed using fee‐for‐service Medicare data in a single, large state, it may not be generalizable to PCPs who practice in other states, who care for a younger population, or who do not accept Medicare. Our findings also may not reflect the practice patterns of physicians‐in‐training, PCP populations with high board‐certification rates, those employed in temporary positions, or those who interrupt their practices for personal reasons, as we restricted our study to established PCPs who had been in practice long and consistently enough to be associated with 20 hospitalized patients during every year of the study. For example, the lower proportion of female PCPs in our cohort (15.6% in our study in 2009 vs 27.5% reported in a nationally representative 2008 survey[27]) may be explained by our exclusion of women who take prolonged time off for childcare duties. We also did not establish whether patient outcomes or healthcare costs differ between PCPs who adopted the hospitalist model and traditionalists. Finally, we could not examine the effect of a number of PCP factors that could plausibly influence whether or not PCPs relinquish inpatient care to hospitalists, such as their comfort with providing inpatient care, having hospital admitting privileges, having office‐based access to hospitals' electronic medical records, or the distance between their office and the hospital. However, this study lays the groundwork for future studies to explore these factors.
In summary, this study is the first, to our knowledge, to characterize PCPs who relinquished inpatient responsibilities to hospitalists. Our findings suggest that some groups of PCPs are more likely to refer patient to hospitalists, that the relationship between hospitalists and PCPs has evolved over time, and that the hospitalist model still has ample room to grow.
ACKNOWLEDGMENTS
Disclosures: This study was supported by grants from the National Institute on Aging (1RO1‐AG033134 and P30‐AG024832) and the National Cancer Institute (K05‐CA124923). The authors have no financial conflicts of interest to disclose. An oral abstract of this article was presented on May 18, 2013 at the Society of Hospital Medicine Annual Meeting in National Harbor, Maryland.
- , , , . Growth in the care of older patients by hospitalists in the United States. N Engl J Med. 2009;360(11):1102–1112.
- , . Effect of hospitalists on length of stay in the medicare population: variation according to hospital and patient characteristics. J Am Geriatr Soc. 2010;58(9):1649–1657.
- , , , , , . Outcomes of care by hospitalists, general internists, and family physicians. N Engl J Med. 2007;357(25):2589–2600.
- , , , , . Hospitalist care and length of stay in patients requiring complex discharge planning and close clinical monitoring. Arch Intern Med. 2007;167(17):1869–1874.
- , . The impact of hospitalists on the cost and quality of inpatient care in the United States: a research synthesis. Med Care Res Rev. 2005;62(4):379–406.
- , . Association of hospitalist care with medical utilization after discharge: evidence of cost shift from a cohort study. Ann Intern Med. 2011;155(3):152–159.
- , . Hospital care and medical utilization after discharge. Ann Intern Med. 2011;155(10):719–720; author reply 722.
- . Hospital care and medical utilization after discharge. Ann Intern Med. 2011;155(10):721; author reply 722.
- , , , , , . Administrative data algorithms can describe ambulatory physician utilization. Health Serv Res. 2007;42:1783–1796.
- , . Estimating the reliability of continuous measures with Cronbach's alpha or the intraclass correlation coefficient: toward the integration of two traditions. J Clin Epidemiol. 1991;44(4–5):381–390.
- , , . Ability of Medicare claims data to identify nursing home patients: a validation study. Med Care. 2008;46(11):1184–1187.
- , , , . Comorbidity measures for use with administrative data. Med Care. 1998;36(1):8–27.
- , , . A SAS procedure based on mixture models for estimating developmental trajectories. Sociol Methods Res. 2001;29(3):374–393.
- . Group‐Based Modeling of Development. Cambridge, MA: Harvard University Press; 2005.
- , . Group‐based trajectory modeling in clinical research. Annu Rev Clin Psychol. 2010;6:109–138.
- , . Coordination, switching costs and the division of labor in general medicine: an economic explanation for the emergence of hospitalists in the United States. National Bureau of Economic Research Working Paper Series No. 16040. Cambridge, MA: National Bureau of Economic Research; 2010.
- , , , , , . Continuity of outpatient and inpatient care by primary care physicians for hospitalized older adults. JAMA. 2009;301(16):1671–1680.
- . Hospitalists and family physicians: understanding opportunities and risks. J Fam Pract. 2004;53(6):473–481.
- , , , , , . Preparedness of internal medicine and family practice residents for treating common conditions. JAMA. 2002;288(20):2609–2614.
- , , , . The status of adult inpatient care by family physicians at US academic medical centers and affiliated teaching hospitals 2003 to 2012: the impact of the hospitalist movement. Fam Med. 2014;46(2):94–99.
- . Hospitalists and the hospital medicine system of care are good for patient care. Arch Intern Med. 2008;168(12):1254–1256; discussion 1259–1260.
- . Hospitalists in the United States—mission accomplished or work in progress? N Engl J Med. 2004;350(19):1935–1936.
- , , , , . Primary care physicians who treat blacks and whites. N Engl J Med. 2004;351(6):575–584.
- , , , . International medical graduates and the primary care workforce for rural underserved areas. Health Aff (Millwood). 2003;22(2):255–262.
- , , . Medical migration and the physician workforce. International medical graduates and American medicine. JAMA. 1995;273(19):1521–1527.
- , , , , . International medical graduates in family medicine in the United States of America: an exploration of professional characteristics and attitudes. Hum Resour Health. 2006;4:17.
- , , . A snapshot of U.S. physicians: key findings from the 2008 Health Tracking Physician Survey. Data Bull (Cent Stud Health Syst Change). 2009(35):1–11.
Although primary care physicians (PCPs) have traditionally treated patients in both ambulatory and hospital settings, many relinquished inpatient duties to hospitalists in recent decades.[1] Little is known about the PCPs who relinquished inpatient care duties or how the transition to the hospitalist model occurred. For example, what are the characteristics of PCPs who change? Do PCPs adopt the hospitalist model enthusiastically or cautiously? Characterizing PCPs who adopted the hospitalist model can help hospitalists understand their specialty's history and also inform health services research.
Much of the interest in the hospitalist model has been generated by studies reporting improved outcomes and lower hospital lengths of stay associated with hospitalist care.[2, 3, 4, 5] Conversely, detractors of the model point to reports of higher postacute care utilization among hospitalist patients.[6] Although these studies usually adjusted for differences among patients and hospitals, they did not account for PCP characteristics. As patients' access to PCPs and their PCP's capabilities are both plausible factors that could influence hospital length of stay (eg, decisions to complete more or less of a workup in the hospital), quality of care transitions, and postdischarge utilization, it is important to determine if PCPs who use hospitalists differ systematically from those who do not to correctly interpret health system utilization patterns that currently are attributed only to hospitalists.[7, 8]
We conducted this study to determine if observable PCP factors are associated with patients' use of hospitalists and to describe the trajectory by which PCPs referred their patients to hospitalists over time.
METHODS
Source of Data
We used claims data from 100% of Texas Medicare beneficiaries from 2000 to 2009, including Medicare beneficiary summary files, Medicare Provider Analysis and Review (MedPAR) files, Outpatient Standard Analytical Files (OutSAF), and Medicare Carrier files. Diagnosis related group (DRG)‐associated information, including weights, and Major Diagnostic Categories, were obtained from Centers for Medicare & Medicaid Services (
Establishment of the Study Cohort
Using the MedPAR file, we first selected hospital admissions from acute care hospitals in Texas for each year of the study period. We excluded beneficiaries younger than 66 years old, with incomplete Medicare Parts A and B enrollment, or with any health maintenance organization enrollment in the 12 months prior to the admission of interest. For patients with more than 1 admission in a given year, we randomly selected 1 admission. We then attempted to assign each patient to a PCP. We defined a PCP as a generalist (general practitioner, family physician, internist, or geriatrician) who saw a given beneficiary on 3 or more occasions in an outpatient setting in the year prior to the admission of interest.[9] We identified outpatient visits using Current Procedural Terminology (CPT) codes 99201 to 99205 (new patient encounters), and 99211 to 99215 (established patient encounters) from Carrier files. If more than 1 generalist physician saw the beneficiary on 3 or more occasions in a given year, the physician with more than 75% of the total outpatient evaluation and management (E&M) billings was classified as the beneficiary's PCP. Using these criteria, approximately 66% of patients were assigned to a PCP.
For cross‐sectional analyses, we restricted our cohort to beneficiaries whose PCPs were associated with at least 20 inpatients in a given year. To study trends in PCP practice patterns over time, we further restricted the cohort to beneficiaries whose PCPs were associated with at least 20 inpatients in every year of the study period, resulting in 1172 PCPs for the trajectory analyses. The reliability of PCPs' practice profiles increases as the number of patients in their panel increases. We chose 20 inpatients as the minimum because PCPs with 20 hospitalized patients per study year would achieve a reliability of 0.9 for estimating the proportion of their patients that received care from hospitalists.[10]
Identification of Hospitalists
We defined hospitalists as generalists who had at least 100 E&M billings in a given year and generated at least 90% of their total E&M billings in the year from inpatient services.[1] Inpatient E&M billings were identified by CPT codes 99221 to 99223 (new or established patient encounters), 99231 to 99233 (subsequent hospital care), and 99251 to 99255 (inpatient consultations).[1]
Patient Measures
Patient demographic information including, age at admission, gender, race/ethnicity, and Medicaid eligibility were obtained from Medicare beneficiary summary files. We used the Medicaid indicator as a proxy for low socioeconomic status. Information on weekday versus weekend admission, emergent admission, and DRG were obtained from MedPAR files. The DRG category (circulatory system, digestive system, infectious disease, nervous system, respiratory system, or other) was determined based on its Major Diagnostic Category. We determined residence in a nursing facility in the 3 months before the admission of interest from the MedPAR files and by E&M codes 99304 to 99318 (nursing facility services) from Carrier files.[11] Comorbidities were identified using the claims from MedPAR, Carrier, and OutSAF files in the year prior to the admission of interest.[12] Total hospitalizations and outpatient visits in the prior year were identified from MedPAR files and Carrier files, respectively.
PCP Measures
We categorized PCPs by specialty (general practice, gamily practice, geriatric medicine, or internal medicine), years in practice, gender, US‐ versus foreign‐trained, metropolitan statistical area (MSA) of their practice location, and board certification status. The specialty was identified from Carrier files and the other information from AMA data. For each PCP, the total number of outpatient visits and total number of patients seen as outpatients in each year was calculated based on E&M codes (9920199205, 9921199215) from Carrier files. For each year, we computed the average outpatient age, gender, race, and outpatient comorbidity for each PCP's patient panel. We computed hospital volumes using the number of hospitalized patients associated with each PCP in the study cohort.
Study Outcome
To determine whether hospitalized patients received care from hospitalists during a given hospitalization, we identified all inpatient E&M bills from generalist physicians during the admission of interest by linking MedPAR and Carrier files. If more than 50% of the generalist inpatient E&M billings from generalist physicians were from 1 or more hospitalists, the patient was considered to have received care from hospitalists.
Statistical Analyses
Multilevel analyses were used to account for the clustering of patients within PCPs. All multilevel models were adjusted for patient characteristics including age, race/ethnicity, gender, Medicaid eligibility, emergency admission, weekend admission, DRG weight, DRG category, any nursing home stay in the prior 3 months, number of comorbidities, number of hospitalizations, and number of physician visits in the year prior to the admission of interest. To analyze trends in practice patterns, we first used multilevel models to calculate the proportions of inpatients cared for by hospitalists each year for each of the 1172 PCPs with at least 20 patients. Then we employed an SAS procedure (PROC TRAJ) developed by Jones et al. to classify these PCPs into groups based on their trajectories.[13] This group‐based trajectory modeling allowed us to identify relatively homogeneous clusters within a heterogeneous sample population.[14] We chose a model that classified the PCPs into 4 groups.[15] With 4 groups, the average of the posterior probabilities of group membership for the PCPs assigned to each group exceeded 0.93, indicating a low rate of misclassification among these 4 distinct groups. For the 1172 PCPs, we tested interactions between year of hospitalization and PCP characteristics while adjusting for patient characteristics in order to investigate whether or not the impacts of PCP characteristics on how likely their patients being cared for by hospitalists differed with time. All analyses were performed with SAS version 9.2 (SAS Institute Inc., Cary, NC).
RESULTS
During the 2001 through 2009 study period, between 2252 and 2848 PCPs were associated with at least 20 hospitalized beneficiaries in any single year. Among these, 1172 PCPs were associated with at least 20 hospitalized beneficiaries in every year of the study period. These 1172 PCPs were associated with 608,686 hospitalizations over the 9 years.
Table 1 presents the characteristics of the PCPs who contributed to the cross‐sectional analyses in 2001 (N=2252) and 2009 (N=2387), as well as the 1172 PCPs for whom we had data for all 9 years for the longitudinal analyses. Most PCPs were male, trained in the United States, and were board certified. The average number of Medicare patients seen by these PCPs and number of outpatient Medicare visits went up about 7% between 2001 and 2009.
| PCP Characteristics | Cross‐Sectional Analysis | Trajectory Analysis, 20012009 | |
|---|---|---|---|
| 2001 | 2009 | ||
| |||
| Overall, no. (%) | 2,252 (100%) | 2,387 (100%) | 1,172 (100%) |
| Specialty, no. (%) | |||
| General practice | 39 (1.7%) | 34 (1.4%) | 15 (1.3%) |
| Family practice | 948 (42.1%) | 1,089 (45.6%) | 466 (39.8%) |
| Internal medicine | 1,255 (55.7%) | 1,249 (52.3%) | 688 (58.7%) |
| Geriatrics | 10 (0.4%) | 15 (0.6%) | 3 (0.3%) |
| Gender, no. (%) | |||
| Male | 1,990 (88.4%) | 2,015 (84.4%) | 1,072 (91.5%) |
| Female | 262 (11.6%) | 372 (15.6%) | 100 (8.5%) |
| Trained in the United States, no. (%) | |||
| Yes | 1,669 (74.1%) | 1,738 (72.8%) | 844 (72.0%) |
| No | 583 (25.9%) | 649 (27.2%) | 328 (28.0%) |
| Metropolitan statistical area, no. (%) | |||
| 99,999 or less | 417 (17.5) | 237 (20.2) | |
| 100,000249,000 | 438 (18.3) | 234 (20.0) | |
| 250,000999,999 | 381 (16.0) | 216 (18.4) | |
| 1,000,000 or more | 1,151 (48.2) | 485 (41.4) | |
| Board certification, no. (%) | |||
| Yes | 1,657 (69.4%) | 800 (68.3%) | |
| No | 730 (30.6%) | 372 (31.7%) | |
| Years in practice, 2001, meanSD (Q1Q3) | 22.310.6 (15.028.0) | 21.28.9 (15.027.0) | |
| Years in practice, 2009, meanSD (Q1Q3) | 25.010.2 (17.032.0) | 29.28.9 (23.035.0) | |
| Total no. of Medicare outpatient visits, 2001, meanSD (Q1Q3) | 1,624.8879.2 (1,057.51,970.0) | 1,883.39,48.5 (1,236.52,240.5) | |
| Total no. of Medicare outpatient visits, 2009, meanSD (Q1Q3) | 1,733.81,053.3 (1,080.02,048.0) | 2,020.51,200.9 (1,334.52,373.0) | |
| Total no. of Medicare outpatients, 2001, meanSD (Q1Q3) | 418.6186.9 (284.0522.0) | 473.4189.5 (338.0580.5) | |
| Total no. of Medicare outpatients, 2009, meanSD (Q1Q3) | 448.7217.8 (300.0548.0) | 508.7238.2 (350.5615.0) | |
| No. of hospitalized patients, 2001, meanSD (Q1Q3) | 46.025.0 (27.057.0) | 53.028.0 (32.066.0) | |
| No. of hospitalized patients, 2009, meanSD (Q1Q3) | 44.024.0 (26.052.0) | 52.027.0 (33.065.0) | |
| Average outpatient age, 2001, meanSD (Q1Q3) | 72.82.3 (71.574.2) | 72.82.1 (71.774.1) | |
| Average outpatient age, 2009, meanSD (Q1Q3) | 72.12.8 (70.673.9) | 72.82.7 (71.474.5) | |
| Average outpatient gender (% male), 2001, meanSD (Q1Q3) | 38.17.0 (35.542.3) | 38.56.4 (36.242.3) | |
| Average outpatient gender (% male), 2009, meanSD (Q1Q3) | 40.27.6 (37.644.8) | 41.06.5 (38.644.8) | |
| Average outpatient race (% white), 2001, meanSD (Q1Q3) | 84.316.4 (79.295.5) | 85.414.3 (79.995.7) | |
| Average outpatient race (% white), 2009, meanSD (Q1Q3) | 85.214.4 (79.895.2) | 86.312.9 (80.895.6) | |
| Average outpatient comorbidity, 2001, meanSD (Q1Q3)a | 1.60.5 (1.21.8) | 1.60.4 (1.21.8) | |
| Average outpatient comorbidity, 2009, meanSD (Q1Q3)a | 2.20.6 (1.82.5) | 2.20.6 (1.72.5) | |
Figure 1 graphs the percentage of PCPs as a function of what percent of their hospitalized patients received care from hospitalists, and how that changed from 2001 to 2009. For 70.9% of PCPs, fewer than 5% of their hospitalized patients received hospitalist care in 2001. By 2009, the percent of PCPs in this category had decreased to 15.2%. In contrast, in 2001, more than half of the patients for 2.1% of PCPs received hospitalist care, and the percent of PCPs in this category increased to 26.3% by 2009.
The pattern in Figure 1 shows that PCPs' use of hospitalists changed continuously and gradually over time. However, this pattern describes the PCPs as a group. When examined at the individual PCP level, different patterns emerge. Figure 2, which presents selected individual PCP's use of hospitalists over time, shows several distinct subpatterns of PCP practice behaviors. First, there are PCPs whose use of hospitalists was high in 2001 and stayed high or increased over time (eg, PCP A). There also were PCPs whose use of hospitalists stayed low over the entire study period (eg, PCP B). Finally, there were PCPs whose use of hospitalists was low in 2001 but high in 2009 (eg, PCP C). For this last group, the pattern of change in hospitalist utilization over time was discontinuous; that is, most of the increase occurred over a 1‐ or 2‐year period, instead of increasing gradually over time.
Among the 1172 PCPs associated with 20 hospitalized beneficiaries each year in all 9 years of the study period, group‐based trajectory modeling classified their practice patterns into 4 distinct trajectories (Figure 3). Among PCPs in group 1, more than one‐third of their hospitalized patients were cared for by hospitalists in 2001, and this increased to 60% by 2009. PCPs in groups 2 and 3 rarely used hospitalist care in 2001 but increased their use over time. The increase started early in the period for PCPs in group 2 and later for those in group 3. PCPs in group 4 were associated with little hospitalist use throughout the study period.
We constructed a model to describe the odds of a patient receiving care from hospitalists during the study period using patients associated with these 1172 PCPs. After adjusting for patient characteristics, the residual intraclass correlation coefficient for PCP level was 0.334, which indicates that 33.4% of the variance in whether a hospitalized patient received care from a hospitalist is explained by which PCP the patient saw. When adjusting for both patient and PCP characteristics, the overall odds of a patient receiving hospitalist care increased by 30% (95% confidence interval [CI]: 1.29‐1.30) per year from 2001 through 2009.
There were also significant interactions between year of hospitalization and several PCP characteristics. These interactions are illustrated in Table 2, which stratifies each of those PCP characteristics by 3 time periods: 2001 to 2003, 2004 to 2006, and 2007 to 2009. In all time periods, patients were more likely to receive hospitalist care if their PCP was US trained (US vs international medical graduate: odds ratio [OR]: 1.42, 95% CI: 1.19‐1.69 in 20012003; OR: 1.46, 95% CI: 1.23‐1.73 in 20072009), or specialized in family medicine (family medicine vs internal medicine: OR: 1.46, 95% CI: 1.25‐1.72 in 20012003; OR: 1.46, 95% CI: 1.25‐1.70 in 20072009). Over time, the relative odds of a patient receiving care from hospitalists decreased if their PCP was female (female vs male: OR: 1.91, 95% CI: 1.46‐2.50 in 20012003 vs OR: 1.50, 95% CI: 1.15‐1.95 in 20072009) or practiced in an urban area (largest vs smallest MSA: OR: 3.34, 95% CI: 2.72‐4.09 in 20012003; OR: 2.22, 95% CI: 1.82‐2.71 in 20072009). Although the longest‐practicing PCPs were most likely to use hospitalists in the early 2000s, this effect disappeared by 2007 to 2009 (most vs least years in practice: OR: 1.35, 95% CI: 1.06‐1.72 in 20012003 vs OR: 0.92, 95% CI: 0.73‐1.17 in 20072009).
| PCP Characteristics | 20012003, OR (95% CI) | 20042006, OR (95% CI) | 20072009, OR (95% CI) |
|---|---|---|---|
| |||
| Family practicea vs. internal medicineb | 1.46 (1.251.72) | 1.50 (1.281.76) | 1.46 (1.251.70) |
| Female vs male | 1.91 (1.462.50) | 1.43 (1.091.86) | 1.50 (1.151.95) |
| United States trained (yes vs no) | 1.42 (1.191.69) | 1.53 (1.281.81) | 1.46 (1.231.73) |
| Metropolitan statistical area | |||
| 99,999 or less | 1.00 | 1.00 | 1.00 |
| 100,000249,000 | 0.83 (0.651.05) | 1.00 (0.791.25) | 1.13 (0.901.41) |
| 250,000999,999 | 0.92 (0.721.17) | 1.03 (0.821.31) | 0.98 (0.771.23) |
| 1,000,000 or more | 3.34 (2.724.09) | 2.90 (2.373.54) | 2.22 (1.822.71) |
| Years in practice, 2001 | |||
| Q1 (lowest) | 1.00 | 1.00 | 1.00 |
| Q2 | 0.89 (0.711.12) | 0.83 (0.671.04) | 0.92 (0.741.14) |
| Q3 | 1.06 (0.841.34) | 0.99 (0.791.24) | 1.03 (0.821.29) |
| Q4 | 1.25 (0.991.59) | 1.13 (0.891.42) | 1.15 (0.921.45) |
| Q5 (highest) | 1.35 (1.061.72) | 1.05 (0.831.33) | 0.92 (0.731.17) |
| Total no. of outpatient visitsc | |||
| Q1 (lowest) | 1.00 | 1.00 | 1.00 |
| Q2 | 1.21 (1.121.30) | 1.07 (1.001.14) | 1.13 (1.071.19) |
| Q3 | 1.42 (1.301.54) | 1.18 (1.091.27) | 1.14 (1.071.22) |
| Q4 | 1.34 (1.211.47) | 1.34 (1.231.46) | 1.25 (1.161.35) |
| Q5 (highest) | 1.46 (1.301.63) | 1.33 (1.211.47) | 1.32 (1.201.44) |
| No. of hospitalized patientsc | |||
| Q1 (lowest) | 1.00 | 1.00 | 1.00 |
| Q2 | 1.07 (1.001.15) | 0.91 (0.860.96) | 0.85 (0.810.89) |
| Q3 | 1.00 (0.921.08) | 0.87 (0.820.93) | 0.74 (0.700.79) |
| Q4 | 0.89 (0.810.97) | 0.76 (0.710.82) | 0.62 (0.580.67) |
| Q5 (highest) | 1.05 (0.951.18) | 0.67 (0.610.73) | 0.55 (0.510.60) |
| Average outpatient agec | |||
| Q1 (lowest) | 1.00 | 1.00 | 1.00 |
| Q2 | 0.94 (0.871.01) | 1.15 (1.081.23) | 1.18 (1.111.25) |
| Q3 | 0.82 (0.760.90) | 1.05 (0.971.13) | 1.17 (1.091.25) |
| Q4 | 0.71 (0.650.79) | 1.03 (0.951.12) | 1.10 (1.021.19) |
| Q5 (highest) | 0.72 (0.640.81) | 1.12 (1.011.23) | 1.15 (1.051.26) |
| Average outpatient gender (% male)c | |||
| Q1 (lowest) | 1.00 | 1.00 | 1.00 |
| Q2 | 1.10 (1.021.18) | 1.19 (1.101.27) | 1.27 (1.181.37) |
| Q3 | 1.12 (1.031.22) | 1.27 (1.171.37) | 1.43 (1.321.54) |
| Q4 | 1.36 (1.251.48) | 1.49 (1.371.61) | 1.52 (1.401.65) |
| Q5 (highest) | 1.47 (1.341.61) | 1.84 (1.682.00) | 1.68 (1.541.83) |
| Average outpatient race (% white)c | |||
| Q1 (lowest) | 1.00 | 1.00 | 1.00 |
| Q2 | 1.08 (0.981.20) | 1.01 (0.921.10) | 1.23 (1.131.34) |
| Q3 | 1.27 (1.131.43) | 1.06 (0.951.18) | 1.21 (1.091.34) |
| Q4 | 1.47 (1.291.67) | 0.97 (0.861.09) | 1.33 (1.181.48) |
| Q5 (highest) | 1.39 (1.211.59) | 1.18 (1.041.34) | 1.25 (1.101.42) |
| Average outpatient comorbidityc | |||
| Q1 (lowest) | 1.00 | 1.00 | 1.00 |
| Q2 | 1.26 (1.191.35) | 1.23 (1.161.31) | 1.22 (1.141.30) |
| Q3 | 1.62 (1.491.75) | 1.61 (1.501.72) | 1.43 (1.341.54) |
| Q4 | 1.96 (1.792.15) | 1.86 (1.722.02) | 1.59 (1.471.72) |
| Q5 (highest) | 1.79 (1.592.01) | 2.20 (2.002.41) | 2.03 (1.852.22) |
In terms of PCP workload, patients of PCPs with high outpatient activity were more likely to receive hospitalists care throughout the study period, although the association had decreased by 2007 to 2009 (highest vs lowest outpatient volume: OR: 1.46, 95% CI: 1.30‐1.63 in 20012003 vs OR: 1.32, 95% CI: 1.20‐1.44 in 20072009). In contrast, PCPs with the lowest inpatient volumes became more likely to use hospitalists by the end of the study period (highest vs lowest inpatient volume: OR: 1.05, 95% CI: 0.95‐1.18 in 20012003 vs OR: 0.55, 95% CI: 0.51‐0.60 in 20072009).
The characteristics of PCPs' practice panels also were associated with patients' likelihood of receiving care from hospitalists. PCPs whose practice panels consisted of patients who were predominantly male, white, or with more outpatient comorbidities were consistently more likely to use hospitalists throughout the study period. PCPs with older patient panels were less likely to use hospitalists in 2001 to 2003, but by 2007 to 2009, they were slightly more likely to do so (oldest vs youngest average outpatient panel age: OR: 0.72, 95% CI: 0.64‐0.81 in 20012003 vs OR: 1.15, 95% CI: 1.05‐1.26 in 20072009).
CONCLUSIONS
Prior studies of the hospitalist model have shown that the likelihood of a patient receiving inpatient care from hospitalists is associated with patient characteristics, hospital characteristics, geographic region, and type of admission.[1, 16, 17] We found that PCP characteristics also predict whether patients receive care from hospitalists and that their use of hospitalists developed dynamically between 2001 to 2009. Although many factors (such as whether patients were admitted to a hospital where their PCP had admitting privileges) can influence the decision to use hospitalists, we found that over one‐third of the variance in whether a hospitalized patient received care from a hospitalist is explained by which PCP the patient saw. In showing that systemic differences exist among PCPs who use hospitalists and those who do not, our study suggests that future research on the hospitalist model should, if possible, adjust for PCP characteristics in addition to hospital and patient factors.
Although this study identifies the existence and magnitude of differences in whether or not PCPs use hospitalists, it cannot explain why the differences exist. We only can offer hypotheses. For example, our finding that PCPs with the most years of practice experience were more likely to use hospitalists in the early 2000s but not in more recent years suggests that in hospital medicine's early years, long‐practicing generalist physicians were choosing between practicing traditionalist medicine and adopting the hospitalists model, but by 2009, experienced generalist physicians had already specialized to either inpatient or outpatient settings earlier in their careers. On the other hand, the decreasing odds of urban PCPs using hospitalists may reflect a relative growth in hospitalist use in less populated areas rather than a change in urban PCPs' practice patterns.
PCPs trained in family medicine have reported less inpatient training and less comfort with providing hospital care,[18, 19] thus it is unsurprising that family physicians were more likely to refer patients to hospitalists. Although a recent study reported that family physicians' inpatient volumes remained constant, whereas those of outpatient internists declined between 2003 and 2012, the analysis used University Health Consortium data and thus reflects practice patterns in academic medical centers.[20] Our data suggest that outside of academia, family physicians have embraced the hospitalists as clinical partners.
Meltzer and Chung had previously proposed an economic model to describe the growing use of hospitalists in the United States. They posited that decisions to adopt the hospitalist model are governed by trade‐offs between coordination costs (eg, time and effort spent coordinating multiple providers across different settings) and switching costs (eg, time spent traveling between the office and the hospital or the effort of adjusting to different work settings).[16] The authors hypothesized that empirical testing of this model would show PCPs are more likely to use hospitalists if they have less available professional time (ie, work fewer hours per week), are female (due to competing demands from domestic responsibilities), have relatively few hospitalized patients, or live in areas with high traffic congestion. Our findings provide empirical evidence to support their division‐of‐labor model in showing that patients were more likely to receive hospitalist care if their PCP was female, practiced in an urban location, had higher outpatient practice volumes, or had lower inpatient volumes.
At first glance, some of our findings appear to contradict our earlier study, which showed that younger, black, male patients are more likely to receive inpatient care from hospitalists.[1] However, that study included patients regardless of whether they had a PCP. This study shows that when patients have a PCP, their PCPs are more likely to refer them to hospitalists if they are older, white, male, and have more comorbid conditions. A potential explanation for this finding is that PCPs may preferentially use hospitalists when caring for older and sicker hospitalized patients. For example, commentators often cite hospitalists' constant availability in the hospital as a valuable resource when caring for acutely ill patients.[21, 22]
Another potential explanation is that despite their preferences, PCPs who care for younger, minority patients lack access to hospitalist services. One large study of Medicare beneficiaries reported that physicians who care for black patients are less well‐trained clinically and often lack access to important clinical resources such as diagnostic imaging and nonemergency hospital admissions.[23] Similarly, international medical graduates are more likely than their US‐trained counterparts to care for underserved patients and to practice in small, independent offices.[24, 25, 26] As hospitalist groups often rely on cross‐subsidization from sources within a large healthcare organization, independent PCPs may have less access to their services when compared with PCPs in managed care organizations or large integrated groups. Viewed in this context, our findings imply that although hospitalists often care for socioeconomically vulnerable patients (eg, younger, uninsured, black men) who lack access to primary care services,[1] they also appear to share care responsibilities for more complex hospitalized patients with PCPs in more affluent communities. Further research may determine if the availability of hospitalists influences racial disparities in hospital care.
Our study has limitations. It is an observational study and thus subject to bias and confounding. As our cohort was formed using fee‐for‐service Medicare data in a single, large state, it may not be generalizable to PCPs who practice in other states, who care for a younger population, or who do not accept Medicare. Our findings also may not reflect the practice patterns of physicians‐in‐training, PCP populations with high board‐certification rates, those employed in temporary positions, or those who interrupt their practices for personal reasons, as we restricted our study to established PCPs who had been in practice long and consistently enough to be associated with 20 hospitalized patients during every year of the study. For example, the lower proportion of female PCPs in our cohort (15.6% in our study in 2009 vs 27.5% reported in a nationally representative 2008 survey[27]) may be explained by our exclusion of women who take prolonged time off for childcare duties. We also did not establish whether patient outcomes or healthcare costs differ between PCPs who adopted the hospitalist model and traditionalists. Finally, we could not examine the effect of a number of PCP factors that could plausibly influence whether or not PCPs relinquish inpatient care to hospitalists, such as their comfort with providing inpatient care, having hospital admitting privileges, having office‐based access to hospitals' electronic medical records, or the distance between their office and the hospital. However, this study lays the groundwork for future studies to explore these factors.
In summary, this study is the first, to our knowledge, to characterize PCPs who relinquished inpatient responsibilities to hospitalists. Our findings suggest that some groups of PCPs are more likely to refer patient to hospitalists, that the relationship between hospitalists and PCPs has evolved over time, and that the hospitalist model still has ample room to grow.
ACKNOWLEDGMENTS
Disclosures: This study was supported by grants from the National Institute on Aging (1RO1‐AG033134 and P30‐AG024832) and the National Cancer Institute (K05‐CA124923). The authors have no financial conflicts of interest to disclose. An oral abstract of this article was presented on May 18, 2013 at the Society of Hospital Medicine Annual Meeting in National Harbor, Maryland.
- , , , . Growth in the care of older patients by hospitalists in the United States. N Engl J Med. 2009;360(11):1102–1112.
- , . Effect of hospitalists on length of stay in the medicare population: variation according to hospital and patient characteristics. J Am Geriatr Soc. 2010;58(9):1649–1657.
- , , , , , . Outcomes of care by hospitalists, general internists, and family physicians. N Engl J Med. 2007;357(25):2589–2600.
- , , , , . Hospitalist care and length of stay in patients requiring complex discharge planning and close clinical monitoring. Arch Intern Med. 2007;167(17):1869–1874.
- , . The impact of hospitalists on the cost and quality of inpatient care in the United States: a research synthesis. Med Care Res Rev. 2005;62(4):379–406.
- , . Association of hospitalist care with medical utilization after discharge: evidence of cost shift from a cohort study. Ann Intern Med. 2011;155(3):152–159.
- , . Hospital care and medical utilization after discharge. Ann Intern Med. 2011;155(10):719–720; author reply 722.
- . Hospital care and medical utilization after discharge. Ann Intern Med. 2011;155(10):721; author reply 722.
- , , , , , . Administrative data algorithms can describe ambulatory physician utilization. Health Serv Res. 2007;42:1783–1796.
- , . Estimating the reliability of continuous measures with Cronbach's alpha or the intraclass correlation coefficient: toward the integration of two traditions. J Clin Epidemiol. 1991;44(4–5):381–390.
- , , . Ability of Medicare claims data to identify nursing home patients: a validation study. Med Care. 2008;46(11):1184–1187.
- , , , . Comorbidity measures for use with administrative data. Med Care. 1998;36(1):8–27.
- , , . A SAS procedure based on mixture models for estimating developmental trajectories. Sociol Methods Res. 2001;29(3):374–393.
- . Group‐Based Modeling of Development. Cambridge, MA: Harvard University Press; 2005.
- , . Group‐based trajectory modeling in clinical research. Annu Rev Clin Psychol. 2010;6:109–138.
- , . Coordination, switching costs and the division of labor in general medicine: an economic explanation for the emergence of hospitalists in the United States. National Bureau of Economic Research Working Paper Series No. 16040. Cambridge, MA: National Bureau of Economic Research; 2010.
- , , , , , . Continuity of outpatient and inpatient care by primary care physicians for hospitalized older adults. JAMA. 2009;301(16):1671–1680.
- . Hospitalists and family physicians: understanding opportunities and risks. J Fam Pract. 2004;53(6):473–481.
- , , , , , . Preparedness of internal medicine and family practice residents for treating common conditions. JAMA. 2002;288(20):2609–2614.
- , , , . The status of adult inpatient care by family physicians at US academic medical centers and affiliated teaching hospitals 2003 to 2012: the impact of the hospitalist movement. Fam Med. 2014;46(2):94–99.
- . Hospitalists and the hospital medicine system of care are good for patient care. Arch Intern Med. 2008;168(12):1254–1256; discussion 1259–1260.
- . Hospitalists in the United States—mission accomplished or work in progress? N Engl J Med. 2004;350(19):1935–1936.
- , , , , . Primary care physicians who treat blacks and whites. N Engl J Med. 2004;351(6):575–584.
- , , , . International medical graduates and the primary care workforce for rural underserved areas. Health Aff (Millwood). 2003;22(2):255–262.
- , , . Medical migration and the physician workforce. International medical graduates and American medicine. JAMA. 1995;273(19):1521–1527.
- , , , , . International medical graduates in family medicine in the United States of America: an exploration of professional characteristics and attitudes. Hum Resour Health. 2006;4:17.
- , , . A snapshot of U.S. physicians: key findings from the 2008 Health Tracking Physician Survey. Data Bull (Cent Stud Health Syst Change). 2009(35):1–11.
© 2015 Society of Hospital Medicine

Maximizing Teaching on the Wards
An important role of the hospitalist educator is to teach residents and medical students how to diagnose and manage acute medical problems. However, clinical reasoning is complex and nuanced, and there are many challenges to teaching this important process. Medical inpatients are increasingly complex, older, and more seriously ill.[1] Documentation requirements and productivity obligations compete with teaching time. Hospitalists must adjust their teaching for learners from different professions and at various levels of training. In addition, hospitalists tend to be less experienced, and must balance the need to learn their roles as clinicians with developing their own skills as educators.[2]
Despite the challenges inherent to the setting, inpatient rotations provide tremendous teaching and learning opportunities. Patients with undifferentiated complaints or known diagnoses in need of management decisions are available to stimulate discussion. Hospitalist educators have the opportunity to assess residents' progress along the developmental milestones, which residency programs are now required to report for accreditation,[3] and provide role modeling for residents who are developing their own teaching skills.
To maximize these opportunities, attendings must engage trainees to practice clinical reasoning and identify their own knowledge gaps. Various strategies for facilitating the clinical reasoning discussion exist, but two frameworksthe One‐Minute Preceptor (OMP) and SNAPPShave been well studied, albeit mainly in the outpatient setting. Both models offer ways to maximize teaching and assess clinical reasoning, but they have different methods and strengths. This article provides a narrative review of the two frameworks and discusses how they can be applied to the inpatient teaching environment. Hospitalists can utilize these models or components of each framework to facilitate teaching on inpatient teams and enhance their roles as educators.
ONE‐MINUTE PRECEPTOR
The OMP was first described in 1992 by Neher and colleagues as an alternative to the traditional model of precepting.[4] It gives preceptors a method to facilitate learners presentation of their thought process and then for the preceptor to provide targeted teaching points.[4] The OMP helps diagnose both learner and patient, whereas the traditional model focuses on diagnosing the patient.[5] In the traditional model, the attending questions the learner to diagnose the patient, which does not often make clear the learner's thinking process. Thus, there may be a mismatch between the teaching points the preceptor makes and what the learner really needs to know.[5] There are several key benefits to the OMP compared to the traditional model; broadly, these relate to improved ability to assess the learner and provide targeted teaching,[4, 5, 6, 7] improved integration of feedback,[4, 8, 9, 10] learner preference,[11] and ease with which it is learned by faculty members.[4]
The OMP model consists of five steps outlined in Table 1. Step 1, getting a commitment, can involve any aspect of the casediagnosis, treatment, or follow‐upand learners should be challenged to make intellectual commitments just beyond their level of comfort.[12] Steps 1 and 2 bring to light the learner's individual learning needs,[11] then the preceptor follows up with personalized teaching. The OMP is efficient; no increase in time was needed to precept a case in an outpatient study.[9] In a separate outpatient study, the OMP led preceptors to be more likely to teach about disease‐specific points and differential diagnosis, as compared to generic items such as history taking and presentation skills with the traditional model.[5]
| A 5‐step framework in which the preceptor does the following: |
| 1. Get a commitment |
| 2. Probe for supporting evidence |
| 3. Provide general rules |
| 4. Reinforce what was done correctly |
| 5. Correct mistakes |
Faculty feel better prepared to assess learners and provide feedback with the OMP model.[6, 9] Aagaard and colleagues provided 116 mostly ambulatory preceptors with scripted, videotaped encounters of the OMP and traditional models. The OMP improved preceptors' confidence at rating students' presentation skills, clinical reasoning, and fund of knowledge. It was rated more efficient and effective, and preceptors were able to diagnose the patient with the same or improved accuracy compared to the traditional model.[6] In a pre‐post study assessing the efficacy of a faculty development workshop, students rated ambulatory teaching encounters incorporating the OMP model as having increased quantity and quality of feedback. Furthermore, faculty reported improved ability to evaluate students and were more likely to let students reach their own conclusions and create their own postencounter learning plans.[9]
The OMP is also well‐received by trainees. Teherani and colleagues analyzed medical students' responses to videotaped teaching encounters of the OMP and traditional models. Students gave higher mean ratings for all studied items (including feedback, involving the student in decision‐making, and overall effectiveness) to the OMP model, and preferred it over the traditional model.[11]
Several studies have evaluated the OMP for use by residents as teachers,[10, 13, 14] and it is one of the most common models taught to residents.[13] One study evaluated the impact of a one‐day workshop for 276 residents that included the five‐step microskills model (also known as the OMP).[10] Residents felt more prepared to teach, set expectations, and provide feedback.[10] The OMP model, despite brief training, is effective in improving residents' teaching effectiveness and confidence.[13]
The only study we found that exclusively evaluated the OMP in the inpatient setting was a randomized trial[8] involving 57 internal medicine residents. Interns and students rated OMP‐trained residents more highly in 4 of 5 behaviors. The behavior that showed no difference from the control group was teaching general rules.[8] However, there was no difference in ratings of overall teaching effectiveness between groups.[8]
Our review of the literature on the OMP shows it is a quickly learned, easily implemented framework for teaching clinical reasoning. It has been used across specialties and settings, provides a built‐in mechanism for feedback, and allows educators to assess trainees' reasoning while extracting the clinical information needed to work efficiently.
SNAPPS
SNAPPS was first described in 2003 by Wolpaw and colleagues. It is a six‐step learner‐centered model as outlined in Table 2.[15] Unlike the OMP, SNAPPS requires both trainee and teacher to learn the framework. In doing so, the responsibility for directing the teaching encounter is shifted toward the learner.[15] Consequently, this model may be best suited to advanced or motivated learners. Like the OMP, SNAPPS was originally described for the ambulatory environment. However, it has been studied in the inpatient setting as well.
| A 6‐step framework in which the learner does the following: |
| 1. Summarize briefly the history and findings |
| 2. Narrow the differential to 2 or 3 possibilities |
| 3. Analyze the differential by comparing/contrasting the possibilities |
| 4. Probe the preceptor by asking questions |
| 5. Plan management for the patient's medical issues |
| 6. Select a case‐related issue for self‐directed learning |
With SNAPPS, the teaching encounter is learner driven. The trainee presents the case and directs the discussion of differential diagnosis. The educator does not have an active role until the fourth step, where the learner asks questions or identifies areas of uncertainty. But even at this stage, the discussion is learner driven. Step 5, planning management, is collaborative, with trainees suggesting management plans with appropriate attending guidance. Depending on learner skill level or case difficulty, the preceptor may need to play more or less of an active role. The final step, picking a case‐related issue to examine, extends the learning beyond the initial encounter, and ensures that it is individualized and relevant. This step also encourages learner progression toward the Accreditation Council for Graduate Medical Education (ACGME) competency of practice‐based learning and improvement.[3]
A handful of studies have evaluated the SNAPPS model. A randomized comparison group trial found that SNAPPS‐trained students outperformed students trained to elicit feedback and students who received the usual and customary preparation.[16] Notably, SNAPPS students expressed more than twice as many differential diagnoses, justified their reasoning more than five times as often, and expressed more questions and uncertainties. The SNAPPS students' presentations were no longer than in the usual and customary group, and were just one minute longer than in the group trained to elicit feedback.[16] A follow‐up analysis found that 100% of the SNAPPS students expressed an uncertainty (i.e. step 4) compared with 54% of the comparison group, and that most of these uncertainties related to diagnostic reasoning.[17]
A study of medicine clerkship students evaluated the impact of extending SNAPPS to the inpatient setting and including educational prescriptions.[18] The goal was to facilitate the formulation and answering of clinical questions by using the patient, intervention, comparison, outcome (PICO) format for step 6 (selecting a case‐based issue to learn about). Dubbing this SNAPPS‐Plus, the authors found that 99% of cases included a question, and 93% of those were answered. Most questions related to therapeutics, and there was a positive correlation between questions more closely corresponding to the PICO format and higher quality answers.[18]
As with the OMP, SNAPPS does not require additional time for case presentations compared to the usual method.[16] From the perspective of a busy hospitalist, this model takes some responsibility for education away from faculty and places it on the learner. This is an important process for fostering self‐directed learning. As with the OMP, SNAPPS appears easily translatable from the outpatient to inpatient setting. Its main downside is the training time required for both parties to implement it.
TRANSLATING THE MODELS TO THE INPATIENT SETTING
The OMP and SNAPPS have largely been used in the outpatient setting. However, we propose that hospitalists can adapt either model for teaching on ward rotations, as the steps of each framework are not exclusive to one clinical setting.
Although the OMP is typically used between a preceptor and single trainee, it is well suited to engaging the entire group on inpatient rounds (Table 3). For example, a student could commit to and support a diagnosis (steps 1 and 2), whereas the intern could commit to and provide evidence for a treatment or management option. Attendings can repeat steps 1 and 2 for patients' secondary problems, encouraging learners to commit to other items on the problem list.
| Attending/ Senior Resident | Learner | Practical Tips | |
|---|---|---|---|
| |||
| Active listening. | Ms. Weinstein is a 60 year old with a history of alcohol abuse and osteoarthritis, admitted with 1 day of epigastric pain and coffee ground emesis. Workup revealed normal vital signs, mild epigastric tenderness, and mild anemia, with normal pancreatic and liver enzymes. | Learners may end their presentation here and expect you to fill in with your assessment and plan. Rather than jumping in, turn it back to the learner following the OMP model. | |
| Get a commitment | What do you think is going on? | The most likely diagnoses are upper GI bleed due to peptic ulcer disease, gastritis, or Mallory‐Weiss tear. | If the diagnosis is already established or the leaner prematurely closes the differential, ask What else could this be? |
| If the student does not expand the differential, direct this question to the intern. | |||
| Probe for supporting evidence | Why do you think this? | Peptic ulcer disease is most likely because of her alcohol abuse and her daily use of NSAIDs for arthritis pain. Gastritis is equally likely for the same reasons. Mallory‐Weiss tear is less likely, as she was not retching prior to the episode of bleeding. | Learners should use the key findings to argue for or against each diagnostic hypothesis. Novice learners often need reminders that vital signs and negative findings (e.g. absence of tachycardia) are often key findings. |
| Provide general rules | When a patient with a history of alcohol abuse has a GI bleed, you should consider whether she has underlying liver disease or a coagulopathy. If she did have liver disease, what other sources of bleeding should you consider? | Esophageal varices? | This is the step the residents tend to struggle with when teaching.[8] If your senior resident is leading the case discussion, be prepared to step in with some clinical pearls. |
| Reinforce what was done correctly | You did a nice job considering her predisposing factors, including NSAIDS and alcohol. This helped you prioritize the most likely diagnoses. | Thank you. | Tell them what they did right and the effect it had. |
| Correct mistakes | You did not address her risk for alcohol withdrawal. This increases in patients who are hospitalized for a medical illness. Next time be sure to include substance abuse in your problem list. | I'll make sure to do that. | Tell them what they did not do right and how to improve for the next time. If the student is presenting, consider asking the intern or senior resident for a management plan. |
While teaching general rules (step 3) in the group setting, hospitalists should emphasize basic principles for students (which will serve as reinforcement for residents) as well as discuss more complex rules for the edification of all team members. Hospitalists should encourage senior residents to speak up during this step and share their knowledge with the group. This is an opportunity for residents to practice their role as teachers, and for faculty to assess their clinical acumen. However, residents struggled with teaching general rules in Furney and colleagues' randomized trial.[8] Successful clinical teachers use a mix of improvisational teaching and curriculum scripts developed through years of experience.[19] Hospitalists can model this method of instruction for residents who are learning to teach. For more junior hospitalists who may still be developing their own teaching scripts, the OMP provides an opportunity to regularly integrate these scripts into rounds.
The OMP teaching encounter ends with feedback. Providing real‐time feedback to an individual in the group setting could feel awkward. Reassuringly, in Furney and colleagues' study, some of the greatest gains were in the realm of feedback, as reported by both the senior residents providing the feedback and the interns and students on the receiving end.[8] Although the OMP builds in a space for feedback, it does not teach one how to give feedback. Although it is possible that not all feedback is beneficial, trainees are eager to receive constructive input, and hospitalists should not fear providing this in front of the group. Thoughtful critique of one trainee can provide learning opportunities for others listening in.
SNAPPS is also well suited to inpatient education (Table 4). Because it emphasizes a discussion of differential diagnosis, it works well for new admissions. Because hospitalized patients usually have multiple problems, learners may repeat steps 2 and 3 for each problem, or just for the primary issue. On subsequent days, a standard presentation may work better, but if new problems arise (e.g. fever), hospitalists can ask learners to go through the SNAPPS steps for the new issue.
| Learner | Attending/ Senior Resident | Practical Tips | |
|---|---|---|---|
| |||
| 1. Summarize | Ms. Weinstein is a 60 year old with a history of alcohol abuse and osteoarthritis, admitted with 1 day of epigastric pain and coffee ground emesis. Workup revealed normal vital signs, mild epigastric tenderness, and mild anemia, with normal pancreatic and liver enzymes. | Active listening. | Rather than a complete, detailed history and physical, we emphasize tailoring the oral presentation to include only those components relevant to this admission. Then, transition to the SNAPPS presentation with a summary statement as presented here. |
| 2. Narrow the differential | The most likely diagnoses are upper GI bleed due to peptic ulcer disease, gastritis, or Mallory‐Weiss tear. | If the diagnosis is already established or the leaner prematurely closes the differential, ask What else could this be? | Hospitalized patients often have multiple problems. Learners can go through this process of SNAPPS for each problem or only the primary problem. |
| 3. Analyze the differential | Peptic ulcer disease is most likely because of her alcohol abuse and her daily use of NSAIDs for arthritis pain. Gastritis is equally likely for the same reasons. Mallory‐Weiss tear is less likely, as she was not retching prior to the episode of bleeding. | That's a very reasonable differential. You did a nice job considering her predisposing factors. What do her vital signs tell you about how much blood she has lost? | Learners should use the key findings to argue for or against each diagnostic hypothesis. Novice learners often need reminders that vital signs and negative findings (eg, absence of tachycardia) are often key findings. |
| 4. Probe the preceptor | I know alcohol increases the risk of esophageal cancer, but I was not sure if that could present like this. | You are right that she has a higher risk of cancer. Because most tumors are slow‐growing, what kind of symptoms do you think a mass in the esophagus might cause? | Guide learners to the correct answer, helping them connect pre‐existing knowledge to the question at hand. This is also a good spot to provide real‐time feedback. |
| NOTE: This is a great place for learners to ask questions that might be harder to look up, or to ask about physical findings (eg, I thought I heard crackles but was not sure. Could somebody check this with me?) | Does anyone else on the team have thoughts about this question? | Alternatively, give the senior resident an opportunity to address the question. This allows the attending to assess the senior resident's clinical reasoning and gives him or her an opportunity to practice teaching. | |
| 5. Plan management | For the suspected GI bleed, I would like to start a proton pump inhibitor, call a GI consult for an EGD, and check the hematocrit every 8 hours. We can use sequential compression devices for DVT prophylaxis. We will also counsel on alcohol cessation and monitor for withdrawal. | Good start. Does anyone else on the team want to add to the management plan? We have a pharmacist rounding with us today. Is there a difference in outcomes or costs with BID dosing versus continuous infusion of a proton pump inhibitor? | If a student is presenting, offer the intern and/or senior resident an opportunity to add to the plan.Incorporate the expertise of ancillary providers rounding with the team. |
| 6. Select a case‐related issue for self‐directed learning | I would like to look up the best way to treat her alcohol withdrawal if she develops it. | Great! We do have a protocol at the hospital, but it is a good idea to review the literature behind it. | Set aside 10 minutes before rounds each day for learners to present their findings. |
| Consider having learners write educational prescriptions following the PICO format. | |||
Step 6 of SNAPPS provides trainees an opportunity to search for and present relevant information to guide patient management. To incorporate more formal teaching time each day, set aside 10 minutes before rounds for learners to present their answers to the team. Also, because SNAPPS has the learner ask about uncertainties, faculty can use their on‐the‐fly teaching time to answer questions for which trainees do not know the answer. In the era of problem‐based learning (PBL) and medical school curricula that foster self‐directed learning from day one, many students should find SNAPPS a natural extension of PBL‐style learning from the preclinical into the clinical years.
Unlike the OMP, SNAPPS does not build in a step for feedback. Therefore, preceptors should focus on step 4 as an opportunity for this. Because feedback is paired with discussion of an uncertainty, it focuses on a trainee's immediate needs and can maximize learning opportunities.[17]
Clinical educators must simultaneously diagnose and manage patients as well as assess learners' abilities.[20] Workplace‐based assessment is particularly important for residents, and hospitalists play a pivotal role in determining their progression along the developmental milestones for achieving the ACGME competencies in medical knowledge, patient care, and practice‐based learning and improvement.[3] Both the OMP and SNAPPS frameworks encourage trainees to think out loud, providing some transparency to their thought process and enabling faculty to more accurately assess their clinical reasoning.
CONCLUSION
Many hospitalists may already use a teaching approach resembling the OMP. It has a familiar, back‐and‐forth rhythm. By explicitly following its steps, however, attendings can ensure they are providing feedback and individualized teaching with each case. SNAPPS, on the other hand, relieves faculty of their familiar role of leading the thought process and imparting teaching points. Instead, the trainee directs the encounter, leaving the attending in the role of guide.[15] SNAPPS aims to help students and residents take charge of their education and develop lifelong learning skills.
Both frameworks can be transferred from the ambulatory to inpatient setting with little modification. The OMP is older and better studied. It is easy to learn, and can be utilized by attendings and residents as teachers. In contrast, SNAPPS requires both teacher and trainee to learn the framework. Typically, this means that SNAPPS needs to be implemented systematically, via a clerkship or residency program. However, if a team was motivated, they could learn and apply it for their time together on service. Though it requires more effort to put in place, SNAPPS provides a novel approach to teaching clinical reasoning. Finally, hospitalists need not implement all steps of either framework for every teaching encounter, but can use components of either model, depending on the individual learners, team composition, time available, or clinical case.
Additional studies examining both frameworks' use for inpatient teaching and assessment would be helpful. Potential questions to address include how the team structure of inpatient rotations impacts the effectiveness of either model (e.g. which trainees benefit when committing to diagnoses or getting feedback in front of a group?), whether either model improves senior residents' ability to lead rounds and teach, whether written faculty assessments of residents are more specific and accurate with either model, and the impact of not following all steps of either model. Higher level outcomes for both models would be another area for investigation, including change in clinical performance, exam performance of students and residents, or patient outcomes, such as length of stay, cost per case, or need for rapid response/emntensive care unit transfer.
ACKNOWLEDGMENTS
Disclosure: Nothing to report.
- , , , . 2006 national hospital discharge survey. Natl Health Stat Report. 2008;(5):1–20.
- , , , , , . Challenges and opportunities in academic hospital medicine: report from the academic hospital medicine summit. J Hosp Med. 2009;4(4):240–246.
- Accreditation Council for Graduate Medical Education. Program and institutional accreditation: next accreditation system: Milestones. Available at: https://www.acgme.org/acgmeweb/tabid/430/ProgramandInstitutionalAccreditation/NextAccreditationSystem/Milestones.aspx. Accessed July 28, 2014.
- , , , . A five‐step "microskills" model of clinical teaching. J Am Board Fam Pract. 1992;5(4):419–424.
- , , . Teaching points identified by preceptors observing one‐minute preceptor and traditional preceptor encounters. Acad Med. 2004;79(1):50–55.
- , , . Effectiveness of the one‐minute preceptor model for diagnosing the patient and the learner: proof of concept. Acad Med. 2004;79(1):42–49.
- , , . Measuring outcomes of a one‐minute preceptor faculty development workshop. J Gen Intern Med. 2006;21(5):410–414.
- , , , , , . Teaching the one‐minute preceptor. A randomized controlled trial. J Gen Intern Med. 2001;16(9):620–624.
- , , , , , . Faculty development seminars based on the one‐minute preceptor improve feedback in the ambulatory setting. J Gen Intern Med. 2002;17(10):779–787.
- , , , , . Change in residents' perceptions of teaching: following a one day "residents as teachers" (RasT) workshop. South Med J. 2008;101(5):495–502.
- , , , , . Student perceptions of the one minute preceptor and traditional preceptor models. Med Teach. 2007;29(4):323–327.
- , . The one‐minute preceptor: shaping the teaching conversation. Fam Med. 2003;35(6):391–393.
- , , . Residents‐as‐teachers curricula: a critical review. Acad Med. 2009;84(3):374–380.
- , , . Teaching to teach in Toronto. Acad Psychiatry. 2010;34(4):277–281.
- , , . SNAPPS: a learner‐centered model for outpatient education. Acad Med. 2003;78(9):893–898.
- , , . Using SNAPPS to facilitate the expression of clinical reasoning and uncertainties: A randomized comparison group trial. Acad Med. 2009;84(4):517–524.
- , , , . Student uncertainties drive teaching during case presentations: more so with SNAPPS. Acad Med. 2012;87(9):1210–1217.
- , , , , , . SNAPPS‐plus: an educational prescription for students to facilitate formulating and answering clinical questions. Acad Med. 2014;89(8):1174–1179.
- . How attending physicians make instructional decisions when conducting teaching rounds. Acad Med. 1992;67(10):630–638.
- . Educational strategies to promote clinical diagnostic reasoning. N Engl J Med. 2006;355(21):2217–2225.
An important role of the hospitalist educator is to teach residents and medical students how to diagnose and manage acute medical problems. However, clinical reasoning is complex and nuanced, and there are many challenges to teaching this important process. Medical inpatients are increasingly complex, older, and more seriously ill.[1] Documentation requirements and productivity obligations compete with teaching time. Hospitalists must adjust their teaching for learners from different professions and at various levels of training. In addition, hospitalists tend to be less experienced, and must balance the need to learn their roles as clinicians with developing their own skills as educators.[2]
Despite the challenges inherent to the setting, inpatient rotations provide tremendous teaching and learning opportunities. Patients with undifferentiated complaints or known diagnoses in need of management decisions are available to stimulate discussion. Hospitalist educators have the opportunity to assess residents' progress along the developmental milestones, which residency programs are now required to report for accreditation,[3] and provide role modeling for residents who are developing their own teaching skills.
To maximize these opportunities, attendings must engage trainees to practice clinical reasoning and identify their own knowledge gaps. Various strategies for facilitating the clinical reasoning discussion exist, but two frameworksthe One‐Minute Preceptor (OMP) and SNAPPShave been well studied, albeit mainly in the outpatient setting. Both models offer ways to maximize teaching and assess clinical reasoning, but they have different methods and strengths. This article provides a narrative review of the two frameworks and discusses how they can be applied to the inpatient teaching environment. Hospitalists can utilize these models or components of each framework to facilitate teaching on inpatient teams and enhance their roles as educators.
ONE‐MINUTE PRECEPTOR
The OMP was first described in 1992 by Neher and colleagues as an alternative to the traditional model of precepting.[4] It gives preceptors a method to facilitate learners presentation of their thought process and then for the preceptor to provide targeted teaching points.[4] The OMP helps diagnose both learner and patient, whereas the traditional model focuses on diagnosing the patient.[5] In the traditional model, the attending questions the learner to diagnose the patient, which does not often make clear the learner's thinking process. Thus, there may be a mismatch between the teaching points the preceptor makes and what the learner really needs to know.[5] There are several key benefits to the OMP compared to the traditional model; broadly, these relate to improved ability to assess the learner and provide targeted teaching,[4, 5, 6, 7] improved integration of feedback,[4, 8, 9, 10] learner preference,[11] and ease with which it is learned by faculty members.[4]
The OMP model consists of five steps outlined in Table 1. Step 1, getting a commitment, can involve any aspect of the casediagnosis, treatment, or follow‐upand learners should be challenged to make intellectual commitments just beyond their level of comfort.[12] Steps 1 and 2 bring to light the learner's individual learning needs,[11] then the preceptor follows up with personalized teaching. The OMP is efficient; no increase in time was needed to precept a case in an outpatient study.[9] In a separate outpatient study, the OMP led preceptors to be more likely to teach about disease‐specific points and differential diagnosis, as compared to generic items such as history taking and presentation skills with the traditional model.[5]
| A 5‐step framework in which the preceptor does the following: |
| 1. Get a commitment |
| 2. Probe for supporting evidence |
| 3. Provide general rules |
| 4. Reinforce what was done correctly |
| 5. Correct mistakes |
Faculty feel better prepared to assess learners and provide feedback with the OMP model.[6, 9] Aagaard and colleagues provided 116 mostly ambulatory preceptors with scripted, videotaped encounters of the OMP and traditional models. The OMP improved preceptors' confidence at rating students' presentation skills, clinical reasoning, and fund of knowledge. It was rated more efficient and effective, and preceptors were able to diagnose the patient with the same or improved accuracy compared to the traditional model.[6] In a pre‐post study assessing the efficacy of a faculty development workshop, students rated ambulatory teaching encounters incorporating the OMP model as having increased quantity and quality of feedback. Furthermore, faculty reported improved ability to evaluate students and were more likely to let students reach their own conclusions and create their own postencounter learning plans.[9]
The OMP is also well‐received by trainees. Teherani and colleagues analyzed medical students' responses to videotaped teaching encounters of the OMP and traditional models. Students gave higher mean ratings for all studied items (including feedback, involving the student in decision‐making, and overall effectiveness) to the OMP model, and preferred it over the traditional model.[11]
Several studies have evaluated the OMP for use by residents as teachers,[10, 13, 14] and it is one of the most common models taught to residents.[13] One study evaluated the impact of a one‐day workshop for 276 residents that included the five‐step microskills model (also known as the OMP).[10] Residents felt more prepared to teach, set expectations, and provide feedback.[10] The OMP model, despite brief training, is effective in improving residents' teaching effectiveness and confidence.[13]
The only study we found that exclusively evaluated the OMP in the inpatient setting was a randomized trial[8] involving 57 internal medicine residents. Interns and students rated OMP‐trained residents more highly in 4 of 5 behaviors. The behavior that showed no difference from the control group was teaching general rules.[8] However, there was no difference in ratings of overall teaching effectiveness between groups.[8]
Our review of the literature on the OMP shows it is a quickly learned, easily implemented framework for teaching clinical reasoning. It has been used across specialties and settings, provides a built‐in mechanism for feedback, and allows educators to assess trainees' reasoning while extracting the clinical information needed to work efficiently.
SNAPPS
SNAPPS was first described in 2003 by Wolpaw and colleagues. It is a six‐step learner‐centered model as outlined in Table 2.[15] Unlike the OMP, SNAPPS requires both trainee and teacher to learn the framework. In doing so, the responsibility for directing the teaching encounter is shifted toward the learner.[15] Consequently, this model may be best suited to advanced or motivated learners. Like the OMP, SNAPPS was originally described for the ambulatory environment. However, it has been studied in the inpatient setting as well.
| A 6‐step framework in which the learner does the following: |
| 1. Summarize briefly the history and findings |
| 2. Narrow the differential to 2 or 3 possibilities |
| 3. Analyze the differential by comparing/contrasting the possibilities |
| 4. Probe the preceptor by asking questions |
| 5. Plan management for the patient's medical issues |
| 6. Select a case‐related issue for self‐directed learning |
With SNAPPS, the teaching encounter is learner driven. The trainee presents the case and directs the discussion of differential diagnosis. The educator does not have an active role until the fourth step, where the learner asks questions or identifies areas of uncertainty. But even at this stage, the discussion is learner driven. Step 5, planning management, is collaborative, with trainees suggesting management plans with appropriate attending guidance. Depending on learner skill level or case difficulty, the preceptor may need to play more or less of an active role. The final step, picking a case‐related issue to examine, extends the learning beyond the initial encounter, and ensures that it is individualized and relevant. This step also encourages learner progression toward the Accreditation Council for Graduate Medical Education (ACGME) competency of practice‐based learning and improvement.[3]
A handful of studies have evaluated the SNAPPS model. A randomized comparison group trial found that SNAPPS‐trained students outperformed students trained to elicit feedback and students who received the usual and customary preparation.[16] Notably, SNAPPS students expressed more than twice as many differential diagnoses, justified their reasoning more than five times as often, and expressed more questions and uncertainties. The SNAPPS students' presentations were no longer than in the usual and customary group, and were just one minute longer than in the group trained to elicit feedback.[16] A follow‐up analysis found that 100% of the SNAPPS students expressed an uncertainty (i.e. step 4) compared with 54% of the comparison group, and that most of these uncertainties related to diagnostic reasoning.[17]
A study of medicine clerkship students evaluated the impact of extending SNAPPS to the inpatient setting and including educational prescriptions.[18] The goal was to facilitate the formulation and answering of clinical questions by using the patient, intervention, comparison, outcome (PICO) format for step 6 (selecting a case‐based issue to learn about). Dubbing this SNAPPS‐Plus, the authors found that 99% of cases included a question, and 93% of those were answered. Most questions related to therapeutics, and there was a positive correlation between questions more closely corresponding to the PICO format and higher quality answers.[18]
As with the OMP, SNAPPS does not require additional time for case presentations compared to the usual method.[16] From the perspective of a busy hospitalist, this model takes some responsibility for education away from faculty and places it on the learner. This is an important process for fostering self‐directed learning. As with the OMP, SNAPPS appears easily translatable from the outpatient to inpatient setting. Its main downside is the training time required for both parties to implement it.
TRANSLATING THE MODELS TO THE INPATIENT SETTING
The OMP and SNAPPS have largely been used in the outpatient setting. However, we propose that hospitalists can adapt either model for teaching on ward rotations, as the steps of each framework are not exclusive to one clinical setting.
Although the OMP is typically used between a preceptor and single trainee, it is well suited to engaging the entire group on inpatient rounds (Table 3). For example, a student could commit to and support a diagnosis (steps 1 and 2), whereas the intern could commit to and provide evidence for a treatment or management option. Attendings can repeat steps 1 and 2 for patients' secondary problems, encouraging learners to commit to other items on the problem list.
| Attending/ Senior Resident | Learner | Practical Tips | |
|---|---|---|---|
| |||
| Active listening. | Ms. Weinstein is a 60 year old with a history of alcohol abuse and osteoarthritis, admitted with 1 day of epigastric pain and coffee ground emesis. Workup revealed normal vital signs, mild epigastric tenderness, and mild anemia, with normal pancreatic and liver enzymes. | Learners may end their presentation here and expect you to fill in with your assessment and plan. Rather than jumping in, turn it back to the learner following the OMP model. | |
| Get a commitment | What do you think is going on? | The most likely diagnoses are upper GI bleed due to peptic ulcer disease, gastritis, or Mallory‐Weiss tear. | If the diagnosis is already established or the leaner prematurely closes the differential, ask What else could this be? |
| If the student does not expand the differential, direct this question to the intern. | |||
| Probe for supporting evidence | Why do you think this? | Peptic ulcer disease is most likely because of her alcohol abuse and her daily use of NSAIDs for arthritis pain. Gastritis is equally likely for the same reasons. Mallory‐Weiss tear is less likely, as she was not retching prior to the episode of bleeding. | Learners should use the key findings to argue for or against each diagnostic hypothesis. Novice learners often need reminders that vital signs and negative findings (e.g. absence of tachycardia) are often key findings. |
| Provide general rules | When a patient with a history of alcohol abuse has a GI bleed, you should consider whether she has underlying liver disease or a coagulopathy. If she did have liver disease, what other sources of bleeding should you consider? | Esophageal varices? | This is the step the residents tend to struggle with when teaching.[8] If your senior resident is leading the case discussion, be prepared to step in with some clinical pearls. |
| Reinforce what was done correctly | You did a nice job considering her predisposing factors, including NSAIDS and alcohol. This helped you prioritize the most likely diagnoses. | Thank you. | Tell them what they did right and the effect it had. |
| Correct mistakes | You did not address her risk for alcohol withdrawal. This increases in patients who are hospitalized for a medical illness. Next time be sure to include substance abuse in your problem list. | I'll make sure to do that. | Tell them what they did not do right and how to improve for the next time. If the student is presenting, consider asking the intern or senior resident for a management plan. |
While teaching general rules (step 3) in the group setting, hospitalists should emphasize basic principles for students (which will serve as reinforcement for residents) as well as discuss more complex rules for the edification of all team members. Hospitalists should encourage senior residents to speak up during this step and share their knowledge with the group. This is an opportunity for residents to practice their role as teachers, and for faculty to assess their clinical acumen. However, residents struggled with teaching general rules in Furney and colleagues' randomized trial.[8] Successful clinical teachers use a mix of improvisational teaching and curriculum scripts developed through years of experience.[19] Hospitalists can model this method of instruction for residents who are learning to teach. For more junior hospitalists who may still be developing their own teaching scripts, the OMP provides an opportunity to regularly integrate these scripts into rounds.
The OMP teaching encounter ends with feedback. Providing real‐time feedback to an individual in the group setting could feel awkward. Reassuringly, in Furney and colleagues' study, some of the greatest gains were in the realm of feedback, as reported by both the senior residents providing the feedback and the interns and students on the receiving end.[8] Although the OMP builds in a space for feedback, it does not teach one how to give feedback. Although it is possible that not all feedback is beneficial, trainees are eager to receive constructive input, and hospitalists should not fear providing this in front of the group. Thoughtful critique of one trainee can provide learning opportunities for others listening in.
SNAPPS is also well suited to inpatient education (Table 4). Because it emphasizes a discussion of differential diagnosis, it works well for new admissions. Because hospitalized patients usually have multiple problems, learners may repeat steps 2 and 3 for each problem, or just for the primary issue. On subsequent days, a standard presentation may work better, but if new problems arise (e.g. fever), hospitalists can ask learners to go through the SNAPPS steps for the new issue.
| Learner | Attending/ Senior Resident | Practical Tips | |
|---|---|---|---|
| |||
| 1. Summarize | Ms. Weinstein is a 60 year old with a history of alcohol abuse and osteoarthritis, admitted with 1 day of epigastric pain and coffee ground emesis. Workup revealed normal vital signs, mild epigastric tenderness, and mild anemia, with normal pancreatic and liver enzymes. | Active listening. | Rather than a complete, detailed history and physical, we emphasize tailoring the oral presentation to include only those components relevant to this admission. Then, transition to the SNAPPS presentation with a summary statement as presented here. |
| 2. Narrow the differential | The most likely diagnoses are upper GI bleed due to peptic ulcer disease, gastritis, or Mallory‐Weiss tear. | If the diagnosis is already established or the leaner prematurely closes the differential, ask What else could this be? | Hospitalized patients often have multiple problems. Learners can go through this process of SNAPPS for each problem or only the primary problem. |
| 3. Analyze the differential | Peptic ulcer disease is most likely because of her alcohol abuse and her daily use of NSAIDs for arthritis pain. Gastritis is equally likely for the same reasons. Mallory‐Weiss tear is less likely, as she was not retching prior to the episode of bleeding. | That's a very reasonable differential. You did a nice job considering her predisposing factors. What do her vital signs tell you about how much blood she has lost? | Learners should use the key findings to argue for or against each diagnostic hypothesis. Novice learners often need reminders that vital signs and negative findings (eg, absence of tachycardia) are often key findings. |
| 4. Probe the preceptor | I know alcohol increases the risk of esophageal cancer, but I was not sure if that could present like this. | You are right that she has a higher risk of cancer. Because most tumors are slow‐growing, what kind of symptoms do you think a mass in the esophagus might cause? | Guide learners to the correct answer, helping them connect pre‐existing knowledge to the question at hand. This is also a good spot to provide real‐time feedback. |
| NOTE: This is a great place for learners to ask questions that might be harder to look up, or to ask about physical findings (eg, I thought I heard crackles but was not sure. Could somebody check this with me?) | Does anyone else on the team have thoughts about this question? | Alternatively, give the senior resident an opportunity to address the question. This allows the attending to assess the senior resident's clinical reasoning and gives him or her an opportunity to practice teaching. | |
| 5. Plan management | For the suspected GI bleed, I would like to start a proton pump inhibitor, call a GI consult for an EGD, and check the hematocrit every 8 hours. We can use sequential compression devices for DVT prophylaxis. We will also counsel on alcohol cessation and monitor for withdrawal. | Good start. Does anyone else on the team want to add to the management plan? We have a pharmacist rounding with us today. Is there a difference in outcomes or costs with BID dosing versus continuous infusion of a proton pump inhibitor? | If a student is presenting, offer the intern and/or senior resident an opportunity to add to the plan.Incorporate the expertise of ancillary providers rounding with the team. |
| 6. Select a case‐related issue for self‐directed learning | I would like to look up the best way to treat her alcohol withdrawal if she develops it. | Great! We do have a protocol at the hospital, but it is a good idea to review the literature behind it. | Set aside 10 minutes before rounds each day for learners to present their findings. |
| Consider having learners write educational prescriptions following the PICO format. | |||
Step 6 of SNAPPS provides trainees an opportunity to search for and present relevant information to guide patient management. To incorporate more formal teaching time each day, set aside 10 minutes before rounds for learners to present their answers to the team. Also, because SNAPPS has the learner ask about uncertainties, faculty can use their on‐the‐fly teaching time to answer questions for which trainees do not know the answer. In the era of problem‐based learning (PBL) and medical school curricula that foster self‐directed learning from day one, many students should find SNAPPS a natural extension of PBL‐style learning from the preclinical into the clinical years.
Unlike the OMP, SNAPPS does not build in a step for feedback. Therefore, preceptors should focus on step 4 as an opportunity for this. Because feedback is paired with discussion of an uncertainty, it focuses on a trainee's immediate needs and can maximize learning opportunities.[17]
Clinical educators must simultaneously diagnose and manage patients as well as assess learners' abilities.[20] Workplace‐based assessment is particularly important for residents, and hospitalists play a pivotal role in determining their progression along the developmental milestones for achieving the ACGME competencies in medical knowledge, patient care, and practice‐based learning and improvement.[3] Both the OMP and SNAPPS frameworks encourage trainees to think out loud, providing some transparency to their thought process and enabling faculty to more accurately assess their clinical reasoning.
CONCLUSION
Many hospitalists may already use a teaching approach resembling the OMP. It has a familiar, back‐and‐forth rhythm. By explicitly following its steps, however, attendings can ensure they are providing feedback and individualized teaching with each case. SNAPPS, on the other hand, relieves faculty of their familiar role of leading the thought process and imparting teaching points. Instead, the trainee directs the encounter, leaving the attending in the role of guide.[15] SNAPPS aims to help students and residents take charge of their education and develop lifelong learning skills.
Both frameworks can be transferred from the ambulatory to inpatient setting with little modification. The OMP is older and better studied. It is easy to learn, and can be utilized by attendings and residents as teachers. In contrast, SNAPPS requires both teacher and trainee to learn the framework. Typically, this means that SNAPPS needs to be implemented systematically, via a clerkship or residency program. However, if a team was motivated, they could learn and apply it for their time together on service. Though it requires more effort to put in place, SNAPPS provides a novel approach to teaching clinical reasoning. Finally, hospitalists need not implement all steps of either framework for every teaching encounter, but can use components of either model, depending on the individual learners, team composition, time available, or clinical case.
Additional studies examining both frameworks' use for inpatient teaching and assessment would be helpful. Potential questions to address include how the team structure of inpatient rotations impacts the effectiveness of either model (e.g. which trainees benefit when committing to diagnoses or getting feedback in front of a group?), whether either model improves senior residents' ability to lead rounds and teach, whether written faculty assessments of residents are more specific and accurate with either model, and the impact of not following all steps of either model. Higher level outcomes for both models would be another area for investigation, including change in clinical performance, exam performance of students and residents, or patient outcomes, such as length of stay, cost per case, or need for rapid response/emntensive care unit transfer.
ACKNOWLEDGMENTS
Disclosure: Nothing to report.
- , , , . 2006 national hospital discharge survey. Natl Health Stat Report. 2008;(5):1–20.
- , , , , , . Challenges and opportunities in academic hospital medicine: report from the academic hospital medicine summit. J Hosp Med. 2009;4(4):240–246.
- Accreditation Council for Graduate Medical Education. Program and institutional accreditation: next accreditation system: Milestones. Available at: https://www.acgme.org/acgmeweb/tabid/430/ProgramandInstitutionalAccreditation/NextAccreditationSystem/Milestones.aspx. Accessed July 28, 2014.
- , , , . A five‐step "microskills" model of clinical teaching. J Am Board Fam Pract. 1992;5(4):419–424.
- , , . Teaching points identified by preceptors observing one‐minute preceptor and traditional preceptor encounters. Acad Med. 2004;79(1):50–55.
- , , . Effectiveness of the one‐minute preceptor model for diagnosing the patient and the learner: proof of concept. Acad Med. 2004;79(1):42–49.
- , , . Measuring outcomes of a one‐minute preceptor faculty development workshop. J Gen Intern Med. 2006;21(5):410–414.
- , , , , , . Teaching the one‐minute preceptor. A randomized controlled trial. J Gen Intern Med. 2001;16(9):620–624.
- , , , , , . Faculty development seminars based on the one‐minute preceptor improve feedback in the ambulatory setting. J Gen Intern Med. 2002;17(10):779–787.
- , , , , . Change in residents' perceptions of teaching: following a one day "residents as teachers" (RasT) workshop. South Med J. 2008;101(5):495–502.
- , , , , . Student perceptions of the one minute preceptor and traditional preceptor models. Med Teach. 2007;29(4):323–327.
- , . The one‐minute preceptor: shaping the teaching conversation. Fam Med. 2003;35(6):391–393.
- , , . Residents‐as‐teachers curricula: a critical review. Acad Med. 2009;84(3):374–380.
- , , . Teaching to teach in Toronto. Acad Psychiatry. 2010;34(4):277–281.
- , , . SNAPPS: a learner‐centered model for outpatient education. Acad Med. 2003;78(9):893–898.
- , , . Using SNAPPS to facilitate the expression of clinical reasoning and uncertainties: A randomized comparison group trial. Acad Med. 2009;84(4):517–524.
- , , , . Student uncertainties drive teaching during case presentations: more so with SNAPPS. Acad Med. 2012;87(9):1210–1217.
- , , , , , . SNAPPS‐plus: an educational prescription for students to facilitate formulating and answering clinical questions. Acad Med. 2014;89(8):1174–1179.
- . How attending physicians make instructional decisions when conducting teaching rounds. Acad Med. 1992;67(10):630–638.
- . Educational strategies to promote clinical diagnostic reasoning. N Engl J Med. 2006;355(21):2217–2225.
Acute Kidney Injury for Hospitalists
Acute kidney injury (AKI) is a clinical syndrome broadly defined as an abrupt decline in renal function occurring over a period of hours to days resulting in the retention of nitrogenous and metabolic waste products. Although the initial clinical manifestation of AKI may be oliguria, urine volume can remain normal or even increase. Patients may be asymptomatic, especially early in the course of AKI. The diagnosis is often made in hospitalized patients when biochemical screening reveals a recent increase in serum creatinine and/or blood urea nitrogen concentrations, or when there is a dramatic decrease in urine output.
Older studies looking at the incidence of AKI in hospitalized patients are difficult to interpret due to variable definitions of AKI. Those based on administrative databases were limited by lack of clinical context and/or variation in coding for AKI.[1]
There is no universally accepted operational definition of AKI, and more than 30 different criteria have been employed in various clinical studies. Difficulty in defining AKI lies in the lag time in the rise and fall of the serum creatinine concentration with injury and recovery, the variability of oliguria, and in the heterogeneity of patterns of renal injury. Two classification systems that attempt to capture the spectrum of AKI are the RIFLE (Risk, Injury, Failure, Loss, End Stage) criteria and the AKIN (Acute Kidney Injury Network) criteria.[2, 3] The AKIN criteria parallel the risk, injury, and failure stages of the RIFLE criteria and are the most applicable to characterizing AKI in the hospital (Table 1). AKI is commonly classified by daily urine output as anuric (50 mL/day), oliguric (500 mL/day), or nonoliguric.
| Stage | Creatinine Criteria | Urine Output Criteria |
|---|---|---|
| 1 | Increase in serum creatinine of 0.3 mg/dL (26.4 mol/L) or increase of 150%200% (1.5‐fold to 2‐fold) above baseline | 0.5 mL/kg/hr for >6 hours |
| 2 | Increase in serum creatinine of >200%300% (>2‐fold to 3‐fold) above baseline | 0.5 mL/kg/hr for >12 hours |
| 3 | Increase in serum creatinine of >300% (3‐fold) above baseline or serum creatinine 5.0 mg/dL (354 mol/L) with an acute rise of 0.5 mg/dL (44 mol/L) | 0.3 mL/kg/hr 24 hours or anuria 12 hours |
With a move toward standardized definitions, recent studies have shown a rising incidence of AKI in hospitalized patients.[4, 5, 6] According to these series, AKI develops in up to 7% of hospitalized patients and in about 30% of those admitted to intensive care units. In one study of consecutive hospital admissions, patients classified by the RIFLE criteria had a sharp rise in the rate of in‐hospital mortality whether they had no change or improvement in creatinine (4.4%), or fell into a risk (15.1%), injury (29.2%), or failure (41.1%) class.[7] The in‐hospital mortality of critically ill patients with AKI is higher than 50%. AKI increases length of stay and hospital costs, and affects the clinical course after discharge.[8, 9] Small increases in serum creatinine during an intensive care unit stay predict increased 10‐year mortality above a critical illness alone.[10]
Risk factors for AKI include advanced age, male gender, African American ethnicity, and diabetes mellitus.[11] The most important risk factor, however, is preexisting chronic kidney disease (CKD).[12] AKI and CKD are tightly linked, each increasing the risk of the other.[13, 14, 15] Preexisting renal insufficiency is a key predictor of postoperative AKI and poor surgical outcomes.[16, 17]
AKI AND CLINICAL CONTEXT
The causes of AKI can be broadly divided into 3 categories: prerenal azotemia (a disorder characterized by renal hypoperfusion in which renal parenchymal tissue integrity is preserved), intrinsic kidney injury with parenchymal tissue injury, and postrenal AKI (dysfunction due to acute obstruction of the urinary tract). Table 2 lists several clinical scenarios sorted into these 3 categories.[18] The general epidemiology of AKI varies based on whether it was acquired in the community or in a hospital setting. Prerenal azotemia accounts for the bulk of community‐acquired AKI, followed in lesser frequency by postrenal and intrinsic etiologies. Prerenal azotemia continues to be the major cause of hospital‐acquired AKI, but intrinsic kidney injury becomes more common.[5, 19]
| Prerenal | Intrinsic | Postrenal |
|---|---|---|
| ||
| Hemorrhage | Acute tubular necrosis | Bilateral upper tract obstruction |
| Surgical | Ischemic | Nephrolithiasis |
| Gastrointestinal | Postoperative | Papillary necrosis |
| Retroperitoneal | Prolonged hypotension | Retroperitoneal fibrosis |
| Gastrointestinal losses | Sepsis | Retroperitoneal lymphadenopathy |
| Diarrhea | Nephrotoxins | Obstruction of solitary functioning kidney |
| Vomiting | Myoglobin | Lower tract obstruction |
| Nasogastric suction | Hemoglobin | Prostatic hypertrophy |
| Enteral fistula | Radiocontrast agents | Urethral stricture |
| Renal losses | Aminoglycosides | Bladder mass or stone |
| Diuretics | Intratubular obstruction | Obstructed urinary catheter |
| Glucosuria | Tumor lysis/uric acid | Urinary retention |
| Skin losses | Oxalosis/ethylene glycol ingestion | Neurogenic bladder |
| Excessive sweating | Phosphate nephropathy | Constipation |
| Burns | Light chain nephropathy | Medications |
| Erythroderma | Acyclovir | Anticholinergics |
| Third‐spacing | Indinavir | Antihistamines |
| Hypoalbuminemia | Methotrexate | Alpha1‐agonists |
| Pancreatitis | Acute glomerulonephritis | ‐Blockers |
| Capillary leak | Acute interstitial nephritis | Opiates |
| Reduced effective arterial volume | Proton pump inhibitors | Tricyclic antidepressants |
| Congestive heart failure | Penicillins | |
| Cirrhosis | Fluoroquinolones | |
| Renal vasoconstriction | Atheroembolic disease | |
| Hypercalcemia | Acute vascular syndrome | |
| NSAIDs | Aortic dissection | |
| ACEI/ARB | Bilateral renal artery thromboembolism | |
| Calcineurin inhibitors | Bilateral renal vein thrombosis | |
| Vasopressors | Thrombotic microangiopathy | |
| Iodinated contrast | ||
MEDICAL HISTORY
The initial goal of history taking is to establish whether the patient has AKI rather than the acute discovery of a more chronic process. A recent serum creatinine measurement can be valuable in this regard. In some cases the clinician must make a presumptive diagnosis of AKI while simultaneously reviewing past medical history and family history to assess for underlying CKD. A diagnosis of AKI is more readily established when it occurs during a hospitalization through review of urine output and serial laboratory values.
Symptoms of poor oral intake as well as salt and fluid losses from diarrhea or vomiting suggest a prerenal etiology. Subjective symptoms of lightheadedness, visual clouding, and near‐syncope with standing also suggest volume depletion. Patients should be asked about recent nonsteroidal anti‐inflammatory drug (NSAID) use, as these agents can exacerbate renal hypoperfusion through loss of prostaglandin‐mediated afferent arteriole dilatation. Angiotensin‐converting enzyme inhibitors and angiotensin receptor blockers, especially when combined with diuretics, can generate a hypoperfusion state. Heart failure and liver disease regularly result in an expanded extracellular fluid (ECF) compartment yet a reduced effective arterial volume and predispose to renal hypoperfusion.
A history of decreased urine output or anuria suggests postrenal AKI, but its absence does not rule out urinary tract obstruction. Voiding symptoms such as urinary frequency, hesitancy, or incontinence also raise the possibility of obstructive uropathy. Flank pain and hematuria often accompany obstruction from nephrolithiasis.
Symptoms of fever, skin rash, arthralgias, sinusitis, and/or hemoptysis raise the possibility of glomerulonephritis from infection, collagen vascular disease, or vasculitis. Risk factors for viral hepatitis and human immunodeficiency virus are important to clarify as are systemic symptoms of autoimmunity (eg, dry eyes, dry mouth, eye pain/emnflammation, or visual changes). The recent start of any new medication, including NSAIDs, antibiotics, or proton‐pump inhibitors, raises the possibility of a drug‐induced interstitial nephritis.[20] Statins are direct myotoxins, and the risk of rhabdomyolysis with renal injury increases with dose. Patients may not associate intravenous (IV) contrast or phosphate‐containing bowel preparations (eg, Fleet Phospho Soda), with the development of AKI, thus the clinician must carefully review for recent exposures that could result in intrinsic renal injury.[21]
PHYSICAL EXAMINATION
Estimation of the ECF volume and effective arterial volume are central to assessing the likelihood of renal hypoperfusion. Overt hypotension is the strongest indicator of hypoperfusion, and a careful review of initial blood pressure prior to worsening of renal function can provide significant information. Normal blood pressure does not exclude renal hypoperfusion, as acute tubular necrosis (ATN) may develop in chronically hypertensive patients whose blood pressures are acutely reduced.[22] Less‐severe volume depletion is suggested by an orthostatic pulse increase of more than 30 beats/minute, measured 1 minute after standing. Orthostatic hypotension, defined as a drop in systolic pressure of more than 20 mm Hg after standing, is less helpful, as it occurs in 10% of normovolemic subjects.[23] Dry axillae and mucous membranes with a furrowed tongue are useful signs of volume depletion. Poor skin turgor and slow capillary refill have not been shown to be reliable signs of hypovolemia in adults. The neck veins are usually flat when volume contraction exists, though engorged neck veins in the setting of elevated right‐sided pressures from heart failure or pulmonary hypertension may obscure this sign. Similarly, pulmonary rales, ascites, and peripheral edema may confound the exam in patients with underlying heart failure and/or cirrhosis.
Flank tenderness or a bladder palpable or percussable above the pelvic brim suggests possible urinary tract obstruction. Prostate exam should be performed on all men with AKI and a bimanual pelvic exam considered in women with changes in usual voiding pattern or with suspected gynecologic disease. Postvoid residual can be assessed at the bedside with either straight catheterization or bladder scan where available.
Signs of systemic disease associated with intrinsic AKI include fever, skin and joint findings of connective tissue disease, a new or changing heart murmur, purpura, and petechiae. Cholesterol emboli, disrupted by interarterial catheterization (eg, cardiac catheterization, angiography), cardiac or aortic surgeries, or, rarely, by systemic anticoagulation can shower throughout the vasculature, causing organ dysfunction and local inflammation. Kidney injury due to atheroemboli often has a stuttering course and may be separated in time from the vascular procedure by days to weeks. Physical exam findings of atheroembolic disease include livedo reticularis, blue toes, purpura, painful skin nodules, and gangrene. Retinal examination may reveal atheroembolic emboli (Hollenhorst plaques).[24, 25]
LABORATORY TESTING
Initial testing in AKI aims to assess the severity of injury as well as the likely mechanism of the injury. Estimation of glomerular filtration rate (GFR) gives an approximate measure of the number of functioning nephrons and hence an overall measure of renal function. Mathematical estimates of GFR, however, assume a steady state, and AKI, by definition, is not a steady state. This makes GFR estimates based on plasma creatinine unreliable. A rising serum creatinine concentration indicates that the renal injury is persistent or worsening, whereas a stable or falling creatinine concentration suggests recovery. Interventions that expand the ECF (eg, volume resuscitation with normal saline) will dilute the plasma creatinine concentration and must be considered when interpreting a falling creatinine concentration. A daily rise in the serum creatinine concentration of more than 1 mg/dL nearly always implies a GFR of 10 mL/min. Any change in serum creatinine must be interpreted with the nonlinear relationship of GFR and serum creatinine in mind (Figure 1).[26]

The fractional excretion of sodium (FENa) has been used to differentiate prerenal azotemia from intrinsic renal injury in patients with oligoanuria. Specifically, an FENa of 1% implies a prerenal cause for the oliguric AKI, whereas if it is >1%, then intrinsic renal injury is more likely. Unfortunately, there are significant limitations to this laboratory measure.[27] The FENa may be low (1%) in any intrinsic process that causes tissue ischemia, such as vasculitis, acute glomerulonephritis, atheroembolic disease, or from intense vasoconstriction such as after IV contrast administration. Patients with severe heart failure or portal hypertension often have avid sodium retention, and can have a FENa 1% even in the setting of ATN. Alternatively, the FENa may be elevated (>1%) in prerenal patients on diuretics, with osmotic diuresis, or in the setting of aldosterone deficiency.
Examination of the urinalysis and urine sediment provides valuable information about the etiology of the AKI. Prerenal and postrenal AKI typically present with a bland urine, without evidence of blood, protein, or leukocyte esterase on urinalysis and few cells or hyaline casts in the sediment. The urinalysis typically has a high specific gravity in prerenal AKI, reflecting intact tubules producing a concentrated urine. An active urinary sediment suggests intrinsic renal injury that is either the mechanism of the current AKI or indicative of underlying CKD. ATN, the most common cause of intrinsic renal injury, often produces a dirty urinalysis with many epithelial cells and muddy brown granular and epithelial cell casts. The urine is generally isosthenuric (ie, specific gravity of 1.010) due to loss of tubular function. A urinalysis positive for heme pigment but without red cells on microscopic analysis suggests the presence of either myoglobin from rhabdomyolysis or hemoglobin from hemolysis. Acute glomerulonephritis disrupts the usual glomerular barrier to large proteins and red cells and results in proteinuria and hematuria. Red cells that weather the journey from the glomerulus through the nephron often become dysmorphic with Mickey Mouse ear blebs in their membrane or are bound together by Tamm‐Horsfall protein into red cell casts. Acute interstitial nephritis results in pyuria, proteinuria, and white cell casts. Urinary eosinophils are neither sensitive nor specific for interstitial nephritis and have little utility in its diagnosis.[28, 29]
Given the limitations of serum creatinine as a marker of renal injury, a number of new urinary biomarkers have been recognized over the past decade.[30, 31, 32] These molecules are normal constituents of renal tubular cells that are upregulated and released into the urine in response to renal injury. Early measurement of these biomarkers might allow for detection of AKI within hours of the insult. The 2 biomarkers with the most promise include kidney injury molecule‐1 (KIM‐1) and neutrophil gelatinase‐associated lipocalin (NGAL). KIM‐1 is expressed by proximal tubular cells, and its production is sharply upregulated in response to ischemic injury. NGAL is a protein expressed primarily in immune cells, but also by renal tubular cells. Urinary NGAL levels rapidly rise in response to renal ischemia, and return to baseline following resolution of the injury. Although these urinary biomarkers are promising, they have a relatively low (70%75%) sensitivity and specificity, and have not yet been adopted into routine clinical practice.[33]
IMAGING
Renal ultrasound is useful both in the assessment of AKI as well as in the investigation for underlying CKD. Patients with long‐standing kidney disease frequently have small, echogenic kidneys consistent with fibrosis and nephron loss, or markedly distorted renal architecture in cystic diseases. Hydronephrosis and/or hydroureter suggest an acute or chronic urinary tract obstruction. However, this may not be present in the setting of early obstruction or ureteric encasement. Doppler ultrasonography of the renal vasculature can assess patency when vascular obstruction is suspected. The use of computerized tomography, magnetic resonance imaging, or angiography may be helpful in selected clinical circumstances, but their use is often limited due to the potential risk of contrast nephrotoxicity. Nuclear renal scans use less radiation than computerized tomography and are a preferred imaging modality for pediatric patients. When volume status is uncertain, echocardiography to assess both inferior vena cava volume and change in volume with respiration may be helpful.
MANAGEMENT
The general principles for management of AKI are to limit further injury and prevent systemic complications. Management of the patient with AKI greatly depends on which category of AKI is suspected, namely prerenal, intrinsic renal injury, or a postrenal (obstructive) cause. If a prerenal etiology due to true ECF volume depletion is suspected, volume resuscitation to replace baseline and ongoing losses is imperative. Careful attention to intake and output as well as serial volume assessment should dictate the strategy for resuscitation. Hyperchloremic acidosis is an expected consequence of normal saline resuscitation but is irrelevant to clinical outcomes.[34] NSAIDs, antihypertensives, especially those that affect the angiotensin/aldosterone system, and diuretics should be discontinued. Ongoing hypotension despite volume resuscitation suggests the possibility of blood loss, infection, or autonomic nervous system dysfunction. If this occurs, the patient may need to be transferred to an intensive care unit for pressor support to keep the mean arterial pressure >70 mm Hg. When prerenal AKI from reduced effective circulating volume is suspected, as in decompensated heart failure or cirrhosis, management must be tailored to the underlying pathophysiology.
If judicious volume resuscitation produces no improvement in renal function or if oliguria develops, repeat urinalysis and urine microscopy should be considered to assess for intrinsic renal injury. Aggressive volume resuscitation in the face of oliguria will not speed recovery from the intrinsic injury and may cause signs or symptoms of volume overload. This could also potentially necessitate renal replacement therapy earlier than anticipated.
In patients where an obstructive etiology for the AKI is identified, the obstruction must be relieved as soon and as safely as possible. In this regard, a timely urologic consultation may be helpful in assuring that urethral and/or ureteral conduits are placed rapidly. Interventional radiology can also assist in those patients who need percutaneous nephrostomies for the relief of the obstruction. In many patients with obstructive nephropathy, a timely intervention will avoid the need for renal replacement therapy.
The suspected mechanism of injury influences the management of intrinsic AKI. The management of ATN is primarily supportive, paying close attention to optimizing volume status, correcting electrolyte abnormalities, avoiding further nephrotoxic agents, and adjusting medication doses to the low GFR present. Over the last several decades, multiple studies have explored treatment strategies for established ATN using various drugs and biologic agents. All have been uniformly disappointing.
When the trajectory of AKI is uncertain and the creatinine continues to rise, all medication dosing should be adjusted for GFR 10 mL/min. Antibiotics routinely will require dose reduction, but all current medications should be reviewed for risk of accumulation in renal failure. Because the half‐life of oral hypoglycemic medications is unpredictable in AKI, these medications should be discontinued and replaced with insulin. Vigilance for hypoglycemia is necessary, as renal clearance of insulin is also reduced. Narcotics such as morphine and oxycodone, which are renally cleared, can produce unwanted sedation and respiratory depression if not discontinued. Fentanyl, methadone, and hydromorphone are safer choices for controlling pain in a patient with AKI.[35] Gabapentin is regularly used to treat symptoms of neuropathic pain, but can produce encephalopathy and myoclonus if not dose reduced in renal failure.[36] Clinicians should weigh the risk of overdose with underdose for each medication, namely antibiotics in critically ill patients.
TIMING OF NEPHROLOGY CONSULTATION
The optimal timing for nephrology consultation in hospital‐acquired AKI is uncertain, though several studies have suggested better outcomes, including shorter length of stay and reduced mortality, with early consultation.[37, 38, 39] A renal consult is indicated when intrinsic ATN does not reverse in a timely fashion. Renal replacement therapy should be instituted to limit the systemic complications of prolonged AKI and to allow time for the renal injury to improve or resolve over time. If acute glomerulonephritis or interstitial nephritis is suspected, an urgent consultation may be required for consideration of biopsy, immunosuppression, and guidance for further management. Early consultation may help limit drug toxicities and volume overload in the setting of decreased renal clearance. Guidance on vascular access (eg, peripherally inserted central catheter placement) may prevent future complications with hemodialysis access if the patient ultimately develops end‐stage renal disease (ESRD).[40]
PREVENTION OF AKI
Most studies of AKI prevention have focused on clinical scenarios where the likelihood of ATN was substantial such as in vascular or open heart surgery, or with the use of intravenous contrast agents.[41, 42] This topic remains controversial, though generally supported strategies include judicious volume expansion, avoidance of hypotension, and, when using contrast, limiting the volume of contrast and using iso‐osmolar formulations. As recent studies have shown uncertain benefit, the role for pretreatment with n‐acetylcysteine remains uncertain. Many clinicians, however, continue to use it as a preventive strategy as there are few side effects with this medication.
TAKE HOME POINTS
- AKI is common in hospitalized patients, with pre‐renal azotemia being the dominant etiology in both community‐acquired and hospital‐acquired AKI.
- CKD is an important risk factor for AKI. AKI increases the long‐term risk of developing CKD and ESRD.
- The diagnosis of AKI hinges on detailed medical history, careful physical exam, and key laboratory parameters including the urinalysis and urinary sediment.
- The management of AKI is tailored to the likely mechanism of injury. Reconsideration of the likely etiology is imperative if AKI fails to respond to initial attempts to reverse or limit injury.
- Early renal consultation for AKI is indicated when the etiology remains uncertain, AKI persists despite initial management, or acute glomerulonephritis or interstitial nephritis are suspected.
- , , . Acute kidney injury. Lancet. 2012;380(9843):756–766.
- , , , , . Acute renal failure—definition, outcome measures, animal models, fluid therapy and information technology needs: the Second International Consensus Conference of the Acute Dialysis Quality Initiative (ADQI) Group. Crit Care. 2004;8(4):R204–R212.
- , , , et al. Improving outcomes from acute kidney injury: report of an initiative. Am J Kidney Dis. 2007;50(1):1–4.
- , , , et al. Incidence and mortality of acute renal failure in Medicare beneficiaries, 1992 to 2001. J Am Soc Nephrol. 2006;17(4):1135–1142.
- , , . Hospital‐acquired renal insufficiency. Am J Kidney Dis. 2002;39(5):930–936.
- , , , . Acute renal failure: factors influencing nephrology referral and outcome. QJM. 1997;90(12):781–785.
- , , , , . An assessment of the RIFLE criteria for acute renal failure in hospitalized patients. Crit Care Med. 2006;34(7):1913–1917.
- , , , , . Acute kidney injury, mortality, length of stay, and costs in hospitalized patients. J Am Soc Nephrol. 2005;16(11):3365–3370.
- , , , , . The prognostic importance of a small acute decrement in kidney function in hospitalized patients: a systematic review and meta‐analysis. Am J Kidney Dis. 2007;50(5):712–720.
- , , , , , . Small acute increases in serum creatinine are associated with decreased long‐term survival in the critically ill. Am J Respir Crit Care Med. 2014;189(9):1075–1081.
- , , , et al. Acute kidney injury increases risk of ESRD among elderly. J Am Soc Nephrol. 2009;20(1):223–228.
- , , , , , . The risk of acute renal failure in patients with chronic kidney disease. Kidney Int. 2008;74(1):101–107.
- , , . Chronic kidney disease after acute kidney injury: a systematic review and meta‐analysis. Kidney Int. 2012;81(5):442–448.
- , , , et al. Risk of chronic dialysis and death following acute kidney injury. Am J Med. 2012;125(6):585–593.
- , , , et al. Chronic dialysis and death among survivors of acute kidney injury requiring dialysis. JAMA. 2009;302(11):1179–1185.
- , , , et al. Development and validation of an acute kidney injury risk index for patients undergoing general surgery: results from a national data set. Anesthesiology. 2009;110(3):505–515.
- , , , et al. Preoperative estimates of glomerular filtration rate as predictors of outcome after surgery: a systematic review and meta‐analysis. Anesthesiology. 2013;118(4):809–824.
- , . Brenner 2008.
- , , , , . Hospital‐acquired renal insufficiency: a prospective study. Am J Med. 1983;74(2):243–248.
- , , , . A nationwide nested case‐control study indicates an increased risk of acute interstitial nephritis with proton pump inhibitor use. Kidney Int. 2014;86(4):837–844.
- , , , . Acute phosphate nephropathy following oral sodium phosphate bowel purgative: an underrecognized cause of chronic renal failure. J Am Soc Nephrol. 2005;16(11):3389–3396.
- . Normotensive ischemic acute renal failure. N Engl J Med. 2007;357(8):797–805.
- , , . The rational clinical examination. Is this patient hypovolemic? JAMA. 1999;281(11):1022–1029.
- , . Atheroembolic renal disease. Lancet. 2010;375(9726):1650–1660.
- , , , et al. The challenge of diagnosing atheroembolic renal disease: clinical features and prognostic factors. Circulation. 2007;116(3):298–304.
- , , , , , . A more accurate method to estimate glomerular filtration rate from serum creatinine: a new prediction equation. Modification of Diet in Renal Disease Study Group. Ann Intern Med. 1999;130(6):461–470.
- , . Traditional urinary biomarkers in the assessment of hospital‐acquired AKI. Clin J Am Soc Nephrol. 2012;7(1):167–174.
- , . Urinary eosinophils in AIN: farewell to an old biomarker? Clin J Am Soc Nephrol. 2013;8(11):1841–1843.
- , , . Utility of urine eosinophils in the diagnosis of acute interstitial nephritis. Clin J Am Soc Nephrol. 2013;8(11):1857–1862.
- . Diagnosis of acute kidney injury: from classic parameters to new biomarkers. Contrib Nephrol. 2007;156:213–219.
- , . Biomarkers in nephrology: Core Curriculum 2013. Am J Kidney Dis. 2013;62(1):165–178.
- , , , et al. Urinary biomarkers in the clinical prognosis and early detection of acute kidney injury. Clin J Am Soc Nephrol. 2010;5(12):2154–2165.
- , , , et al. Biomarkers for early diagnosis of AKI in the ICU: ready for prime time use at the bedside? Ann Intensive Care. 2012;2(1):24.
- , . The case for 0.9% NaCl: is the undefendable, defensible? Kidney Int. 2014;86(6):1087–1095.
- , , , , . A systematic review of the use of opioid medication for those with moderate to severe cancer pain and renal impairment: a European Palliative Care Research Collaborative opioid guidelines project. Palliat Med. 2011;25(5):525–552.
- , , . Gabapentin toxicity in patients with chronic kidney disease: a preventable cause of morbidity. Am J Med. 2010;123(4):367–373.
- , , , et al. Timing of initiation of dialysis in critically ill patients with acute kidney injury. Clin J Am Soc Nephrol. 2006;1(5):915–919.
- , , , et al. Nephrology consultation in acute renal failure: does timing matter? Am J Med. 2002;113(6):456–461.
- , , , et al. Early nephrologist involvement in hospital‐acquired acute kidney injury: a pilot study. Am J Kidney Dis. 2011;57(2):228–234.
- , , , et al. Association between prior peripherally inserted central catheters and lack of functioning arteriovenous fistulas: a case‐control study in hemodialysis patients. Am J Kidney Dis. 2012;60(4):601–608.
- , , , , , . Update on clinical trials for the prevention of acute kidney injury in patients undergoing cardiac surgery. Am J Surg. 2013;206(1):86–95.
- , , , et al. Strategies to reduce the risk of contrast‐induced nephropathy. Am J Cardiol. 2006;98(6A):59K–77K.
Acute kidney injury (AKI) is a clinical syndrome broadly defined as an abrupt decline in renal function occurring over a period of hours to days resulting in the retention of nitrogenous and metabolic waste products. Although the initial clinical manifestation of AKI may be oliguria, urine volume can remain normal or even increase. Patients may be asymptomatic, especially early in the course of AKI. The diagnosis is often made in hospitalized patients when biochemical screening reveals a recent increase in serum creatinine and/or blood urea nitrogen concentrations, or when there is a dramatic decrease in urine output.
Older studies looking at the incidence of AKI in hospitalized patients are difficult to interpret due to variable definitions of AKI. Those based on administrative databases were limited by lack of clinical context and/or variation in coding for AKI.[1]
There is no universally accepted operational definition of AKI, and more than 30 different criteria have been employed in various clinical studies. Difficulty in defining AKI lies in the lag time in the rise and fall of the serum creatinine concentration with injury and recovery, the variability of oliguria, and in the heterogeneity of patterns of renal injury. Two classification systems that attempt to capture the spectrum of AKI are the RIFLE (Risk, Injury, Failure, Loss, End Stage) criteria and the AKIN (Acute Kidney Injury Network) criteria.[2, 3] The AKIN criteria parallel the risk, injury, and failure stages of the RIFLE criteria and are the most applicable to characterizing AKI in the hospital (Table 1). AKI is commonly classified by daily urine output as anuric (50 mL/day), oliguric (500 mL/day), or nonoliguric.
| Stage | Creatinine Criteria | Urine Output Criteria |
|---|---|---|
| 1 | Increase in serum creatinine of 0.3 mg/dL (26.4 mol/L) or increase of 150%200% (1.5‐fold to 2‐fold) above baseline | 0.5 mL/kg/hr for >6 hours |
| 2 | Increase in serum creatinine of >200%300% (>2‐fold to 3‐fold) above baseline | 0.5 mL/kg/hr for >12 hours |
| 3 | Increase in serum creatinine of >300% (3‐fold) above baseline or serum creatinine 5.0 mg/dL (354 mol/L) with an acute rise of 0.5 mg/dL (44 mol/L) | 0.3 mL/kg/hr 24 hours or anuria 12 hours |
With a move toward standardized definitions, recent studies have shown a rising incidence of AKI in hospitalized patients.[4, 5, 6] According to these series, AKI develops in up to 7% of hospitalized patients and in about 30% of those admitted to intensive care units. In one study of consecutive hospital admissions, patients classified by the RIFLE criteria had a sharp rise in the rate of in‐hospital mortality whether they had no change or improvement in creatinine (4.4%), or fell into a risk (15.1%), injury (29.2%), or failure (41.1%) class.[7] The in‐hospital mortality of critically ill patients with AKI is higher than 50%. AKI increases length of stay and hospital costs, and affects the clinical course after discharge.[8, 9] Small increases in serum creatinine during an intensive care unit stay predict increased 10‐year mortality above a critical illness alone.[10]
Risk factors for AKI include advanced age, male gender, African American ethnicity, and diabetes mellitus.[11] The most important risk factor, however, is preexisting chronic kidney disease (CKD).[12] AKI and CKD are tightly linked, each increasing the risk of the other.[13, 14, 15] Preexisting renal insufficiency is a key predictor of postoperative AKI and poor surgical outcomes.[16, 17]
AKI AND CLINICAL CONTEXT
The causes of AKI can be broadly divided into 3 categories: prerenal azotemia (a disorder characterized by renal hypoperfusion in which renal parenchymal tissue integrity is preserved), intrinsic kidney injury with parenchymal tissue injury, and postrenal AKI (dysfunction due to acute obstruction of the urinary tract). Table 2 lists several clinical scenarios sorted into these 3 categories.[18] The general epidemiology of AKI varies based on whether it was acquired in the community or in a hospital setting. Prerenal azotemia accounts for the bulk of community‐acquired AKI, followed in lesser frequency by postrenal and intrinsic etiologies. Prerenal azotemia continues to be the major cause of hospital‐acquired AKI, but intrinsic kidney injury becomes more common.[5, 19]
| Prerenal | Intrinsic | Postrenal |
|---|---|---|
| ||
| Hemorrhage | Acute tubular necrosis | Bilateral upper tract obstruction |
| Surgical | Ischemic | Nephrolithiasis |
| Gastrointestinal | Postoperative | Papillary necrosis |
| Retroperitoneal | Prolonged hypotension | Retroperitoneal fibrosis |
| Gastrointestinal losses | Sepsis | Retroperitoneal lymphadenopathy |
| Diarrhea | Nephrotoxins | Obstruction of solitary functioning kidney |
| Vomiting | Myoglobin | Lower tract obstruction |
| Nasogastric suction | Hemoglobin | Prostatic hypertrophy |
| Enteral fistula | Radiocontrast agents | Urethral stricture |
| Renal losses | Aminoglycosides | Bladder mass or stone |
| Diuretics | Intratubular obstruction | Obstructed urinary catheter |
| Glucosuria | Tumor lysis/uric acid | Urinary retention |
| Skin losses | Oxalosis/ethylene glycol ingestion | Neurogenic bladder |
| Excessive sweating | Phosphate nephropathy | Constipation |
| Burns | Light chain nephropathy | Medications |
| Erythroderma | Acyclovir | Anticholinergics |
| Third‐spacing | Indinavir | Antihistamines |
| Hypoalbuminemia | Methotrexate | Alpha1‐agonists |
| Pancreatitis | Acute glomerulonephritis | ‐Blockers |
| Capillary leak | Acute interstitial nephritis | Opiates |
| Reduced effective arterial volume | Proton pump inhibitors | Tricyclic antidepressants |
| Congestive heart failure | Penicillins | |
| Cirrhosis | Fluoroquinolones | |
| Renal vasoconstriction | Atheroembolic disease | |
| Hypercalcemia | Acute vascular syndrome | |
| NSAIDs | Aortic dissection | |
| ACEI/ARB | Bilateral renal artery thromboembolism | |
| Calcineurin inhibitors | Bilateral renal vein thrombosis | |
| Vasopressors | Thrombotic microangiopathy | |
| Iodinated contrast | ||
MEDICAL HISTORY
The initial goal of history taking is to establish whether the patient has AKI rather than the acute discovery of a more chronic process. A recent serum creatinine measurement can be valuable in this regard. In some cases the clinician must make a presumptive diagnosis of AKI while simultaneously reviewing past medical history and family history to assess for underlying CKD. A diagnosis of AKI is more readily established when it occurs during a hospitalization through review of urine output and serial laboratory values.
Symptoms of poor oral intake as well as salt and fluid losses from diarrhea or vomiting suggest a prerenal etiology. Subjective symptoms of lightheadedness, visual clouding, and near‐syncope with standing also suggest volume depletion. Patients should be asked about recent nonsteroidal anti‐inflammatory drug (NSAID) use, as these agents can exacerbate renal hypoperfusion through loss of prostaglandin‐mediated afferent arteriole dilatation. Angiotensin‐converting enzyme inhibitors and angiotensin receptor blockers, especially when combined with diuretics, can generate a hypoperfusion state. Heart failure and liver disease regularly result in an expanded extracellular fluid (ECF) compartment yet a reduced effective arterial volume and predispose to renal hypoperfusion.
A history of decreased urine output or anuria suggests postrenal AKI, but its absence does not rule out urinary tract obstruction. Voiding symptoms such as urinary frequency, hesitancy, or incontinence also raise the possibility of obstructive uropathy. Flank pain and hematuria often accompany obstruction from nephrolithiasis.
Symptoms of fever, skin rash, arthralgias, sinusitis, and/or hemoptysis raise the possibility of glomerulonephritis from infection, collagen vascular disease, or vasculitis. Risk factors for viral hepatitis and human immunodeficiency virus are important to clarify as are systemic symptoms of autoimmunity (eg, dry eyes, dry mouth, eye pain/emnflammation, or visual changes). The recent start of any new medication, including NSAIDs, antibiotics, or proton‐pump inhibitors, raises the possibility of a drug‐induced interstitial nephritis.[20] Statins are direct myotoxins, and the risk of rhabdomyolysis with renal injury increases with dose. Patients may not associate intravenous (IV) contrast or phosphate‐containing bowel preparations (eg, Fleet Phospho Soda), with the development of AKI, thus the clinician must carefully review for recent exposures that could result in intrinsic renal injury.[21]
PHYSICAL EXAMINATION
Estimation of the ECF volume and effective arterial volume are central to assessing the likelihood of renal hypoperfusion. Overt hypotension is the strongest indicator of hypoperfusion, and a careful review of initial blood pressure prior to worsening of renal function can provide significant information. Normal blood pressure does not exclude renal hypoperfusion, as acute tubular necrosis (ATN) may develop in chronically hypertensive patients whose blood pressures are acutely reduced.[22] Less‐severe volume depletion is suggested by an orthostatic pulse increase of more than 30 beats/minute, measured 1 minute after standing. Orthostatic hypotension, defined as a drop in systolic pressure of more than 20 mm Hg after standing, is less helpful, as it occurs in 10% of normovolemic subjects.[23] Dry axillae and mucous membranes with a furrowed tongue are useful signs of volume depletion. Poor skin turgor and slow capillary refill have not been shown to be reliable signs of hypovolemia in adults. The neck veins are usually flat when volume contraction exists, though engorged neck veins in the setting of elevated right‐sided pressures from heart failure or pulmonary hypertension may obscure this sign. Similarly, pulmonary rales, ascites, and peripheral edema may confound the exam in patients with underlying heart failure and/or cirrhosis.
Flank tenderness or a bladder palpable or percussable above the pelvic brim suggests possible urinary tract obstruction. Prostate exam should be performed on all men with AKI and a bimanual pelvic exam considered in women with changes in usual voiding pattern or with suspected gynecologic disease. Postvoid residual can be assessed at the bedside with either straight catheterization or bladder scan where available.
Signs of systemic disease associated with intrinsic AKI include fever, skin and joint findings of connective tissue disease, a new or changing heart murmur, purpura, and petechiae. Cholesterol emboli, disrupted by interarterial catheterization (eg, cardiac catheterization, angiography), cardiac or aortic surgeries, or, rarely, by systemic anticoagulation can shower throughout the vasculature, causing organ dysfunction and local inflammation. Kidney injury due to atheroemboli often has a stuttering course and may be separated in time from the vascular procedure by days to weeks. Physical exam findings of atheroembolic disease include livedo reticularis, blue toes, purpura, painful skin nodules, and gangrene. Retinal examination may reveal atheroembolic emboli (Hollenhorst plaques).[24, 25]
LABORATORY TESTING
Initial testing in AKI aims to assess the severity of injury as well as the likely mechanism of the injury. Estimation of glomerular filtration rate (GFR) gives an approximate measure of the number of functioning nephrons and hence an overall measure of renal function. Mathematical estimates of GFR, however, assume a steady state, and AKI, by definition, is not a steady state. This makes GFR estimates based on plasma creatinine unreliable. A rising serum creatinine concentration indicates that the renal injury is persistent or worsening, whereas a stable or falling creatinine concentration suggests recovery. Interventions that expand the ECF (eg, volume resuscitation with normal saline) will dilute the plasma creatinine concentration and must be considered when interpreting a falling creatinine concentration. A daily rise in the serum creatinine concentration of more than 1 mg/dL nearly always implies a GFR of 10 mL/min. Any change in serum creatinine must be interpreted with the nonlinear relationship of GFR and serum creatinine in mind (Figure 1).[26]
The fractional excretion of sodium (FENa) has been used to differentiate prerenal azotemia from intrinsic renal injury in patients with oligoanuria. Specifically, an FENa of 1% implies a prerenal cause for the oliguric AKI, whereas if it is >1%, then intrinsic renal injury is more likely. Unfortunately, there are significant limitations to this laboratory measure.[27] The FENa may be low (1%) in any intrinsic process that causes tissue ischemia, such as vasculitis, acute glomerulonephritis, atheroembolic disease, or from intense vasoconstriction such as after IV contrast administration. Patients with severe heart failure or portal hypertension often have avid sodium retention, and can have a FENa 1% even in the setting of ATN. Alternatively, the FENa may be elevated (>1%) in prerenal patients on diuretics, with osmotic diuresis, or in the setting of aldosterone deficiency.
Examination of the urinalysis and urine sediment provides valuable information about the etiology of the AKI. Prerenal and postrenal AKI typically present with a bland urine, without evidence of blood, protein, or leukocyte esterase on urinalysis and few cells or hyaline casts in the sediment. The urinalysis typically has a high specific gravity in prerenal AKI, reflecting intact tubules producing a concentrated urine. An active urinary sediment suggests intrinsic renal injury that is either the mechanism of the current AKI or indicative of underlying CKD. ATN, the most common cause of intrinsic renal injury, often produces a dirty urinalysis with many epithelial cells and muddy brown granular and epithelial cell casts. The urine is generally isosthenuric (ie, specific gravity of 1.010) due to loss of tubular function. A urinalysis positive for heme pigment but without red cells on microscopic analysis suggests the presence of either myoglobin from rhabdomyolysis or hemoglobin from hemolysis. Acute glomerulonephritis disrupts the usual glomerular barrier to large proteins and red cells and results in proteinuria and hematuria. Red cells that weather the journey from the glomerulus through the nephron often become dysmorphic with Mickey Mouse ear blebs in their membrane or are bound together by Tamm‐Horsfall protein into red cell casts. Acute interstitial nephritis results in pyuria, proteinuria, and white cell casts. Urinary eosinophils are neither sensitive nor specific for interstitial nephritis and have little utility in its diagnosis.[28, 29]
Given the limitations of serum creatinine as a marker of renal injury, a number of new urinary biomarkers have been recognized over the past decade.[30, 31, 32] These molecules are normal constituents of renal tubular cells that are upregulated and released into the urine in response to renal injury. Early measurement of these biomarkers might allow for detection of AKI within hours of the insult. The 2 biomarkers with the most promise include kidney injury molecule‐1 (KIM‐1) and neutrophil gelatinase‐associated lipocalin (NGAL). KIM‐1 is expressed by proximal tubular cells, and its production is sharply upregulated in response to ischemic injury. NGAL is a protein expressed primarily in immune cells, but also by renal tubular cells. Urinary NGAL levels rapidly rise in response to renal ischemia, and return to baseline following resolution of the injury. Although these urinary biomarkers are promising, they have a relatively low (70%75%) sensitivity and specificity, and have not yet been adopted into routine clinical practice.[33]
IMAGING
Renal ultrasound is useful both in the assessment of AKI as well as in the investigation for underlying CKD. Patients with long‐standing kidney disease frequently have small, echogenic kidneys consistent with fibrosis and nephron loss, or markedly distorted renal architecture in cystic diseases. Hydronephrosis and/or hydroureter suggest an acute or chronic urinary tract obstruction. However, this may not be present in the setting of early obstruction or ureteric encasement. Doppler ultrasonography of the renal vasculature can assess patency when vascular obstruction is suspected. The use of computerized tomography, magnetic resonance imaging, or angiography may be helpful in selected clinical circumstances, but their use is often limited due to the potential risk of contrast nephrotoxicity. Nuclear renal scans use less radiation than computerized tomography and are a preferred imaging modality for pediatric patients. When volume status is uncertain, echocardiography to assess both inferior vena cava volume and change in volume with respiration may be helpful.
MANAGEMENT
The general principles for management of AKI are to limit further injury and prevent systemic complications. Management of the patient with AKI greatly depends on which category of AKI is suspected, namely prerenal, intrinsic renal injury, or a postrenal (obstructive) cause. If a prerenal etiology due to true ECF volume depletion is suspected, volume resuscitation to replace baseline and ongoing losses is imperative. Careful attention to intake and output as well as serial volume assessment should dictate the strategy for resuscitation. Hyperchloremic acidosis is an expected consequence of normal saline resuscitation but is irrelevant to clinical outcomes.[34] NSAIDs, antihypertensives, especially those that affect the angiotensin/aldosterone system, and diuretics should be discontinued. Ongoing hypotension despite volume resuscitation suggests the possibility of blood loss, infection, or autonomic nervous system dysfunction. If this occurs, the patient may need to be transferred to an intensive care unit for pressor support to keep the mean arterial pressure >70 mm Hg. When prerenal AKI from reduced effective circulating volume is suspected, as in decompensated heart failure or cirrhosis, management must be tailored to the underlying pathophysiology.
If judicious volume resuscitation produces no improvement in renal function or if oliguria develops, repeat urinalysis and urine microscopy should be considered to assess for intrinsic renal injury. Aggressive volume resuscitation in the face of oliguria will not speed recovery from the intrinsic injury and may cause signs or symptoms of volume overload. This could also potentially necessitate renal replacement therapy earlier than anticipated.
In patients where an obstructive etiology for the AKI is identified, the obstruction must be relieved as soon and as safely as possible. In this regard, a timely urologic consultation may be helpful in assuring that urethral and/or ureteral conduits are placed rapidly. Interventional radiology can also assist in those patients who need percutaneous nephrostomies for the relief of the obstruction. In many patients with obstructive nephropathy, a timely intervention will avoid the need for renal replacement therapy.
The suspected mechanism of injury influences the management of intrinsic AKI. The management of ATN is primarily supportive, paying close attention to optimizing volume status, correcting electrolyte abnormalities, avoiding further nephrotoxic agents, and adjusting medication doses to the low GFR present. Over the last several decades, multiple studies have explored treatment strategies for established ATN using various drugs and biologic agents. All have been uniformly disappointing.
When the trajectory of AKI is uncertain and the creatinine continues to rise, all medication dosing should be adjusted for GFR 10 mL/min. Antibiotics routinely will require dose reduction, but all current medications should be reviewed for risk of accumulation in renal failure. Because the half‐life of oral hypoglycemic medications is unpredictable in AKI, these medications should be discontinued and replaced with insulin. Vigilance for hypoglycemia is necessary, as renal clearance of insulin is also reduced. Narcotics such as morphine and oxycodone, which are renally cleared, can produce unwanted sedation and respiratory depression if not discontinued. Fentanyl, methadone, and hydromorphone are safer choices for controlling pain in a patient with AKI.[35] Gabapentin is regularly used to treat symptoms of neuropathic pain, but can produce encephalopathy and myoclonus if not dose reduced in renal failure.[36] Clinicians should weigh the risk of overdose with underdose for each medication, namely antibiotics in critically ill patients.
TIMING OF NEPHROLOGY CONSULTATION
The optimal timing for nephrology consultation in hospital‐acquired AKI is uncertain, though several studies have suggested better outcomes, including shorter length of stay and reduced mortality, with early consultation.[37, 38, 39] A renal consult is indicated when intrinsic ATN does not reverse in a timely fashion. Renal replacement therapy should be instituted to limit the systemic complications of prolonged AKI and to allow time for the renal injury to improve or resolve over time. If acute glomerulonephritis or interstitial nephritis is suspected, an urgent consultation may be required for consideration of biopsy, immunosuppression, and guidance for further management. Early consultation may help limit drug toxicities and volume overload in the setting of decreased renal clearance. Guidance on vascular access (eg, peripherally inserted central catheter placement) may prevent future complications with hemodialysis access if the patient ultimately develops end‐stage renal disease (ESRD).[40]
PREVENTION OF AKI
Most studies of AKI prevention have focused on clinical scenarios where the likelihood of ATN was substantial such as in vascular or open heart surgery, or with the use of intravenous contrast agents.[41, 42] This topic remains controversial, though generally supported strategies include judicious volume expansion, avoidance of hypotension, and, when using contrast, limiting the volume of contrast and using iso‐osmolar formulations. As recent studies have shown uncertain benefit, the role for pretreatment with n‐acetylcysteine remains uncertain. Many clinicians, however, continue to use it as a preventive strategy as there are few side effects with this medication.
TAKE HOME POINTS
- AKI is common in hospitalized patients, with pre‐renal azotemia being the dominant etiology in both community‐acquired and hospital‐acquired AKI.
- CKD is an important risk factor for AKI. AKI increases the long‐term risk of developing CKD and ESRD.
- The diagnosis of AKI hinges on detailed medical history, careful physical exam, and key laboratory parameters including the urinalysis and urinary sediment.
- The management of AKI is tailored to the likely mechanism of injury. Reconsideration of the likely etiology is imperative if AKI fails to respond to initial attempts to reverse or limit injury.
- Early renal consultation for AKI is indicated when the etiology remains uncertain, AKI persists despite initial management, or acute glomerulonephritis or interstitial nephritis are suspected.
- , , . Acute kidney injury. Lancet. 2012;380(9843):756–766.
- , , , , . Acute renal failure—definition, outcome measures, animal models, fluid therapy and information technology needs: the Second International Consensus Conference of the Acute Dialysis Quality Initiative (ADQI) Group. Crit Care. 2004;8(4):R204–R212.
- , , , et al. Improving outcomes from acute kidney injury: report of an initiative. Am J Kidney Dis. 2007;50(1):1–4.
- , , , et al. Incidence and mortality of acute renal failure in Medicare beneficiaries, 1992 to 2001. J Am Soc Nephrol. 2006;17(4):1135–1142.
- , , . Hospital‐acquired renal insufficiency. Am J Kidney Dis. 2002;39(5):930–936.
- , , , . Acute renal failure: factors influencing nephrology referral and outcome. QJM. 1997;90(12):781–785.
- , , , , . An assessment of the RIFLE criteria for acute renal failure in hospitalized patients. Crit Care Med. 2006;34(7):1913–1917.
- , , , , . Acute kidney injury, mortality, length of stay, and costs in hospitalized patients. J Am Soc Nephrol. 2005;16(11):3365–3370.
- , , , , . The prognostic importance of a small acute decrement in kidney function in hospitalized patients: a systematic review and meta‐analysis. Am J Kidney Dis. 2007;50(5):712–720.
- , , , , , . Small acute increases in serum creatinine are associated with decreased long‐term survival in the critically ill. Am J Respir Crit Care Med. 2014;189(9):1075–1081.
- , , , et al. Acute kidney injury increases risk of ESRD among elderly. J Am Soc Nephrol. 2009;20(1):223–228.
- , , , , , . The risk of acute renal failure in patients with chronic kidney disease. Kidney Int. 2008;74(1):101–107.
- , , . Chronic kidney disease after acute kidney injury: a systematic review and meta‐analysis. Kidney Int. 2012;81(5):442–448.
- , , , et al. Risk of chronic dialysis and death following acute kidney injury. Am J Med. 2012;125(6):585–593.
- , , , et al. Chronic dialysis and death among survivors of acute kidney injury requiring dialysis. JAMA. 2009;302(11):1179–1185.
- , , , et al. Development and validation of an acute kidney injury risk index for patients undergoing general surgery: results from a national data set. Anesthesiology. 2009;110(3):505–515.
- , , , et al. Preoperative estimates of glomerular filtration rate as predictors of outcome after surgery: a systematic review and meta‐analysis. Anesthesiology. 2013;118(4):809–824.
- , . Brenner 2008.
- , , , , . Hospital‐acquired renal insufficiency: a prospective study. Am J Med. 1983;74(2):243–248.
- , , , . A nationwide nested case‐control study indicates an increased risk of acute interstitial nephritis with proton pump inhibitor use. Kidney Int. 2014;86(4):837–844.
- , , , . Acute phosphate nephropathy following oral sodium phosphate bowel purgative: an underrecognized cause of chronic renal failure. J Am Soc Nephrol. 2005;16(11):3389–3396.
- . Normotensive ischemic acute renal failure. N Engl J Med. 2007;357(8):797–805.
- , , . The rational clinical examination. Is this patient hypovolemic? JAMA. 1999;281(11):1022–1029.
- , . Atheroembolic renal disease. Lancet. 2010;375(9726):1650–1660.
- , , , et al. The challenge of diagnosing atheroembolic renal disease: clinical features and prognostic factors. Circulation. 2007;116(3):298–304.
- , , , , , . A more accurate method to estimate glomerular filtration rate from serum creatinine: a new prediction equation. Modification of Diet in Renal Disease Study Group. Ann Intern Med. 1999;130(6):461–470.
- , . Traditional urinary biomarkers in the assessment of hospital‐acquired AKI. Clin J Am Soc Nephrol. 2012;7(1):167–174.
- , . Urinary eosinophils in AIN: farewell to an old biomarker? Clin J Am Soc Nephrol. 2013;8(11):1841–1843.
- , , . Utility of urine eosinophils in the diagnosis of acute interstitial nephritis. Clin J Am Soc Nephrol. 2013;8(11):1857–1862.
- . Diagnosis of acute kidney injury: from classic parameters to new biomarkers. Contrib Nephrol. 2007;156:213–219.
- , . Biomarkers in nephrology: Core Curriculum 2013. Am J Kidney Dis. 2013;62(1):165–178.
- , , , et al. Urinary biomarkers in the clinical prognosis and early detection of acute kidney injury. Clin J Am Soc Nephrol. 2010;5(12):2154–2165.
- , , , et al. Biomarkers for early diagnosis of AKI in the ICU: ready for prime time use at the bedside? Ann Intensive Care. 2012;2(1):24.
- , . The case for 0.9% NaCl: is the undefendable, defensible? Kidney Int. 2014;86(6):1087–1095.
- , , , , . A systematic review of the use of opioid medication for those with moderate to severe cancer pain and renal impairment: a European Palliative Care Research Collaborative opioid guidelines project. Palliat Med. 2011;25(5):525–552.
- , , . Gabapentin toxicity in patients with chronic kidney disease: a preventable cause of morbidity. Am J Med. 2010;123(4):367–373.
- , , , et al. Timing of initiation of dialysis in critically ill patients with acute kidney injury. Clin J Am Soc Nephrol. 2006;1(5):915–919.
- , , , et al. Nephrology consultation in acute renal failure: does timing matter? Am J Med. 2002;113(6):456–461.
- , , , et al. Early nephrologist involvement in hospital‐acquired acute kidney injury: a pilot study. Am J Kidney Dis. 2011;57(2):228–234.
- , , , et al. Association between prior peripherally inserted central catheters and lack of functioning arteriovenous fistulas: a case‐control study in hemodialysis patients. Am J Kidney Dis. 2012;60(4):601–608.
- , , , , , . Update on clinical trials for the prevention of acute kidney injury in patients undergoing cardiac surgery. Am J Surg. 2013;206(1):86–95.
- , , , et al. Strategies to reduce the risk of contrast‐induced nephropathy. Am J Cardiol. 2006;98(6A):59K–77K.