User login
Irritated and Downright Painful
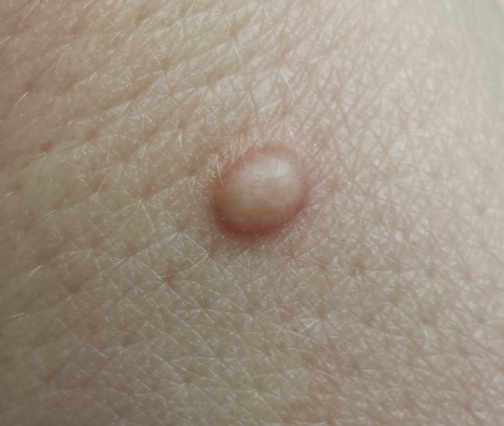
A 33-year-old woman presents with a lesion on the dorsum of her hand. Though it manifested several years ago, it was not problematic until recently, when it became irritated and downright painful. It has not changed in size and has never been red or swollen.
The patient denies ever having similar lesions elsewhere. She also denies any other serious health problems, specifically ophthalmologic problems.

EXAMINATION
The lesion, a 5-mm ovoid tan-orange papule, is located on the dorsum of her left hand. The surface is smooth, with a very firm feel. No skin changes are noted on the surrounding skin, and there are no palpable nodes in the arm or adjacent axilla.
In light of the patient’s concern, the lesion is excised, using an elliptical incision and minimal margins. The incision is carried down into superficial adipose tissue to ensure complete removal. Bleeding is controlled and the defect closed with simple interrupted sutures.
The pathology report shows numerous densely distributed polyhedral histiocytes. Many contain a large amount of cytoplasm.
What is the diagnosis?
DISCUSSION
The clinical presentation and pathology report were both consistent with an entity called juvenile xanthogranuloma (JXG). It usually presents, as in this case, as a solitary, firm, tan to orange papule or nodule. It is more commonly seen on the head and neck of young children, although it is by no means limited to that population (despite its name, which represents anachronistic derm terminology).
Based on the pathologic picture (typified by the biopsy report in this case), JXG may represent a disordered macrophage response to an unknown tissue injury that eventuates in a granulomatous reaction.
JXG is one of the more common members of a spectrum of histiocytic disorders that includes Langerhans cell histiocytosis. In addition to its more common cutaneous distribution, JXG has been seen in almost every internal organ as well. It is rarely associated with systemic manifestations.
The most significant extracutaneous manifestation of JXG is in the eye, where it is the most common cause of spontaneous hyphema in children (usually those younger than 2). This, in turn, can lead to a secondary glaucoma and eventual blindness. This is the main caveat with solitary cutaneous JXGs: They can be associated with ocular involvement, which would manifest as changes in the color of the iris or in the size of the globe itself. Fortunately, this is a rare complication.
Beyond the potential for ocular involvement, since the vast majority of cutaneous JXG lesions are easy to diagnose and self-limiting, there is no reason to remove or otherwise treat them.
The differential for cutaneous JXG includes Spitz tumor, molluscum, and intradermal nevus.
TAKE-HOME LEARNING POINTS
• Juvenile xanthogranuloma (JXG) lesions usually resolve on their own, without treatment.
• In rare instances, cutaneous JXG can be associated with ocular involvement, which manifests with either changes in iris color or in the size of the globe itself.
• JXG lesions are commonly seen on the head and neck of young children, usually as a solitary tan to orange firm papule.
• The differential for JXG includes molluscum, Spitz tumor, and nevus. Removal of JXG lesions is usually not necessary, but pathologic examination shows pathognomic changes that effectively distinguish it from its lookalikes.
A 33-year-old woman presents with a lesion on the dorsum of her hand. Though it manifested several years ago, it was not problematic until recently, when it became irritated and downright painful. It has not changed in size and has never been red or swollen.
The patient denies ever having similar lesions elsewhere. She also denies any other serious health problems, specifically ophthalmologic problems.
EXAMINATION
The lesion, a 5-mm ovoid tan-orange papule, is located on the dorsum of her left hand. The surface is smooth, with a very firm feel. No skin changes are noted on the surrounding skin, and there are no palpable nodes in the arm or adjacent axilla.
In light of the patient’s concern, the lesion is excised, using an elliptical incision and minimal margins. The incision is carried down into superficial adipose tissue to ensure complete removal. Bleeding is controlled and the defect closed with simple interrupted sutures.
The pathology report shows numerous densely distributed polyhedral histiocytes. Many contain a large amount of cytoplasm.
What is the diagnosis?
DISCUSSION
The clinical presentation and pathology report were both consistent with an entity called juvenile xanthogranuloma (JXG). It usually presents, as in this case, as a solitary, firm, tan to orange papule or nodule. It is more commonly seen on the head and neck of young children, although it is by no means limited to that population (despite its name, which represents anachronistic derm terminology).
Based on the pathologic picture (typified by the biopsy report in this case), JXG may represent a disordered macrophage response to an unknown tissue injury that eventuates in a granulomatous reaction.
JXG is one of the more common members of a spectrum of histiocytic disorders that includes Langerhans cell histiocytosis. In addition to its more common cutaneous distribution, JXG has been seen in almost every internal organ as well. It is rarely associated with systemic manifestations.
The most significant extracutaneous manifestation of JXG is in the eye, where it is the most common cause of spontaneous hyphema in children (usually those younger than 2). This, in turn, can lead to a secondary glaucoma and eventual blindness. This is the main caveat with solitary cutaneous JXGs: They can be associated with ocular involvement, which would manifest as changes in the color of the iris or in the size of the globe itself. Fortunately, this is a rare complication.
Beyond the potential for ocular involvement, since the vast majority of cutaneous JXG lesions are easy to diagnose and self-limiting, there is no reason to remove or otherwise treat them.
The differential for cutaneous JXG includes Spitz tumor, molluscum, and intradermal nevus.
TAKE-HOME LEARNING POINTS
• Juvenile xanthogranuloma (JXG) lesions usually resolve on their own, without treatment.
• In rare instances, cutaneous JXG can be associated with ocular involvement, which manifests with either changes in iris color or in the size of the globe itself.
• JXG lesions are commonly seen on the head and neck of young children, usually as a solitary tan to orange firm papule.
• The differential for JXG includes molluscum, Spitz tumor, and nevus. Removal of JXG lesions is usually not necessary, but pathologic examination shows pathognomic changes that effectively distinguish it from its lookalikes.
Shoulder morbidity common after thyroid cancer surgery
CORONADO, CALIF. – More than 50% of patients who underwent surgery for differentiated thyroid cancer experienced shoulder morbidity up to 10 years after the procedure, results from a Dutch study showed.
“What’s causing the pain?” Dr. Romana T. Netea-Maier asked in an interview at the annual meeting of the American Thyroid Association. “It may be that the spinal accessory nerve or other nerves have been injured during the surgery. We don’t know.”

In what she said is the first study of its kind, Dr. Netea-Maier and her associates compared the prevalence of shoulder morbidity and its relation to clinical characteristics and quality of life in 109 patients who underwent surgery for differentiated thyroid cancer at Radboud University Medical Center, Nijmegen, the Netherlands, with a group of 81 healthy controls and a group of 59 patients who underwent surgery for benign thyroid pathology. Main outcome measures were the prevalence of shoulder complaints based on results of the Disabilities of the Arm, Shoulder, and Hand (DASH) questionnaire and the European Organization for Research and Treatment of Cancer, Quality of Life Questionnaire-C-30 (EORTC QLQ-C30).
Dr. Netea-Maier, of the department of medicine at the university, reported that the mean age of patients in the two surgery groups was 46 years, and 73% were women. During an average of 10 years following surgery, 59% of patients in the thyroid cancer group and 49% of patients in the benign thyroid pathology group reported shoulder morbidity, compared with 14% of controls (P < .01). The chief complaints among patients in the thyroid cancer group were pain (25%), muscle weakness (8%), and tingling (8%), while the main complaints among those with benign thyroid pathology were pain (38%), and tingling (7%).
Compared with healthy controls, patients in the thyroid cancer group scored worse on all subscales of the DASH and the EORTC QLQ-C30. On bivariate analysis, level V neck dissection, spinal accessory nerve damage, and employment status were associated with the prevalence of shoulder complaints and DASH scores, while the prevalence of shoulder complaints and DASH scores correlated significantly with EORTC QLQ-C30 scores.
The researchers found that only 12% of patients in the thyroid cancer group received preoperative information on the potential for shoulder morbidity and 35% received additional care for postoperative shoulder complaints.
“The take-home message would be to inform your patients of the potential for shoulder comorbidity, because what we have shown here is that patients do not recall being informed about this possible complication before the surgery,” Dr. Netea-Maier said. “If they have complaints, start with physiotherapy early on.”
Dr. Netea-Maier reported having no financial disclosures.
On Twitter @dougbrunk
CORONADO, CALIF. – More than 50% of patients who underwent surgery for differentiated thyroid cancer experienced shoulder morbidity up to 10 years after the procedure, results from a Dutch study showed.
“What’s causing the pain?” Dr. Romana T. Netea-Maier asked in an interview at the annual meeting of the American Thyroid Association. “It may be that the spinal accessory nerve or other nerves have been injured during the surgery. We don’t know.”
In what she said is the first study of its kind, Dr. Netea-Maier and her associates compared the prevalence of shoulder morbidity and its relation to clinical characteristics and quality of life in 109 patients who underwent surgery for differentiated thyroid cancer at Radboud University Medical Center, Nijmegen, the Netherlands, with a group of 81 healthy controls and a group of 59 patients who underwent surgery for benign thyroid pathology. Main outcome measures were the prevalence of shoulder complaints based on results of the Disabilities of the Arm, Shoulder, and Hand (DASH) questionnaire and the European Organization for Research and Treatment of Cancer, Quality of Life Questionnaire-C-30 (EORTC QLQ-C30).
Dr. Netea-Maier, of the department of medicine at the university, reported that the mean age of patients in the two surgery groups was 46 years, and 73% were women. During an average of 10 years following surgery, 59% of patients in the thyroid cancer group and 49% of patients in the benign thyroid pathology group reported shoulder morbidity, compared with 14% of controls (P < .01). The chief complaints among patients in the thyroid cancer group were pain (25%), muscle weakness (8%), and tingling (8%), while the main complaints among those with benign thyroid pathology were pain (38%), and tingling (7%).
Compared with healthy controls, patients in the thyroid cancer group scored worse on all subscales of the DASH and the EORTC QLQ-C30. On bivariate analysis, level V neck dissection, spinal accessory nerve damage, and employment status were associated with the prevalence of shoulder complaints and DASH scores, while the prevalence of shoulder complaints and DASH scores correlated significantly with EORTC QLQ-C30 scores.
The researchers found that only 12% of patients in the thyroid cancer group received preoperative information on the potential for shoulder morbidity and 35% received additional care for postoperative shoulder complaints.
“The take-home message would be to inform your patients of the potential for shoulder comorbidity, because what we have shown here is that patients do not recall being informed about this possible complication before the surgery,” Dr. Netea-Maier said. “If they have complaints, start with physiotherapy early on.”
Dr. Netea-Maier reported having no financial disclosures.
On Twitter @dougbrunk
AT THE ATA ANNUAL MEETING
Key clinical point: Postoperative shoulder morbidity is highly prevalent in patients who undergo surgery for thyroid cancer.
Major finding: During an average of 10 years following surgery, 59% of patients in the thyroid cancer group and 49% of patients in the benign thyroid pathology group reported shoulder morbidity, compared with 14% of controls (P < .01).
Data source: A Dutch study of 109 patients who underwent surgery for differentiated thyroid cancer, compared with 81 healthy controls and 59 patients who underwent surgery for benign thyroid pathology.
Disclosures: Dr. Netea-Maier reported having no financial disclosures.

A new treatment option for elderly AML patients?

Credit: NIH
In a phase 2 study, the anticancer quinolone derivative vosaroxin produced responses in poor-risk, elderly patients with previously untreated acute myeloid leukemia (AML), but most patients ultimately died.
Twenty-nine percent of patients achieved a complete response (CR) following treatment with vosaroxin.
However, 84% of patients discontinued treatment, most due to treatment failure. And 91% of patients died, most from disease progression.
Still, study investigators said single-agent vosaroxin shows promise as a treatment option for this group of patients, who are unlikely to benefit from standard induction chemotherapy.
“There remains an acute unmet medical need for new treatment options in AML, including patients 60 years of age and older who are unlikely to benefit from standard induction chemotherapy,” said Farhad Ravandi, MD, of the University of Texas MD Anderson Cancer Center.
“Vosaroxin is active and well-tolerated in this population, both as a single agent, as seen in [this] study, and in combination with decitabine, as seen in an ongoing MD Anderson Cancer Center-sponsored study.”
Dr Ravandi and his colleagues reported results of the phase 2 trial, called REVEAL-1, in the British Journal of Haematology. The study was sponsored by Sunesis Pharmaceuticals, the company developing vosaroxin.
The investigators evaluated vosaroxin in 113 patients aged 60 and older who had previously untreated AML with an unfavorable prognosis.
The patients’ median age was 75 years, and most (82%) had 2 or more risk factors, which included being 70 or older, having antecedent hematologic disease, having an ECOG performance status of 2, and having intermediate/unfavorable cytogenetics.
Patients received vosaroxin in sequential cohorts. In group A, they received 72 mg/m2 on days 1, 8, and 15. In group B, they received 72 mg/m2 on days 1 and 8. And in group C, they received 72 mg/m2 or 90 mg/m2 on days 1 and 4.
The primary efficacy endpoint was the combined CR rate and the rate of CR with incomplete platelet recovery (CRp). CR and CR/CRp rates were 29% and 32%, respectively. Responses occurred in all categories of risk factors, including in patients with 2 or more risk factors.
Ninety-five patients (84%) discontinued treatment due to treatment failure (n=50), death (n=21), unacceptable adverse events (n=6), relapse (n=5), their physician’s decision (n=5) or other reasons (n=8).
The all-cause mortality rate was 12% at 30 days and 31% at 60 days. The median overall survival (OS) was 7.0 months, and the 1-year OS rate was 34%.
Common grade 3/4 hematologic adverse events (occurring in 20% of patients or more) included thrombocytopenia (59%), febrile neutropenia (50%), anemia (49%), and neutropenia (29%).
Common grade 3/4 nonhematologic adverse events included sepsis (39%), pneumonia (30%), hypokalemia (25%), and oral mucositis/stomatitis (22%).
Ninety-one patients (81%) had one or more serious adverse event. The most common were pneumonia (24%), febrile neutropenia (21%), and oral mucositis/stomatitis (10%).
Of the 113 patients treated, 103 died. Most deaths (78%) were due to progressive disease.
Patients in group C (72 mg/m2) had the most favorable balance of safety and efficacy. They had faster hematologic recovery (a median of 27 days) than the other groups and the lowest incidence of aggregate sepsis (24%) and 30-day (7%) and 60-day (17%) all-cause mortality.
At this dose and schedule, CR and CR/CRp rates were 31% and 35%, respectively. The median OS was 7.7 months, and the 1-year OS rate was 38%.
“Publication of these data in the British Journal of Haematology further support our goal of establishing vosaroxin as a new standard of care in AML,” said Adam Craig, chief medical officer of Sunesis.
“Given ongoing demographic shifts in the US and other major territories, the challenge of treating AML in older adults will continue to grow, underscoring a need for new treatment options. We look forward to building on these data through further investigator-sponsored studies and, with the outcome of VALOR in relapsed or refractory AML, progressing towards initial regulatory approval.”
Based on results of the phase 3 VALOR trial, which were recently announced, Sunesis has filed a marketing authorization application with the European Medicines Agency and plans to meet with the US Food and Drug Administration to determine the appropriate regulatory path forward for vosaroxin in the treatment of relapsed or refractory AML. ![]()
NSAIDs Linked to Poor Pneumonia Outcomes
Nonsteroidal anti-inflammatory drugs (NSAIDs) given in the early stages of lower respiratory tract infection could be helping send younger adults to the intensive care unit (ICU) with serious pneumonia, say researchers from Hôpital Louis Mourier, Colombes, and Université Paris Diderot, both in France. Their concerns were triggered in part by witnessing several cases of unexpectedly severe forms of Streptococcus pneumoniae (S pneumoniae) community-acquired pneumonia (CAP) in healthy adults.
They analyzed data on 106 patients admitted with pneumococcal pneumonia or S pneumoniae and pneumonia as the discharge diagnosis. Twenty patients had received NSAIDs within 4 days prior to admission. The patients given NSAIDs were younger than those who were not prescribed NSAIDs (aged 43 years on average vs aged 62 years on average), usually working, and less likely to have comorbidities. The mean duration of NSAID treatment was 4 days. The time to the first medical consultation after pneumonia-related symptoms appeared was the same in both groups, but the patients on NSAIDs were prescribed antibiotics significantly later than those not taking NSAIDs (4.5 days vs 2 days, P = .001). They were also admitted to the ICU later.
A “noticeable and significant difference” was that more patients in the NSAID group had pleural effusion (P < .0006). New onset of pleuropulmonary complications during the ICU stay was significantly greater in the group who had received NSAIDs than in the no-NSAID group (P = .0008).
The researchers say their findings “highlight the overlooked risk of taking NSAIDs to treat physical symptoms at an early stage of CAP.” They hypothesize that patient age and comorbidity status led physicians to not diagnose CAP, and thus withhold antibiotics. NSAIDs may blunt general signs and symptoms and mask the severity of the infectious process, the researchers caution. Thus, they recommend ensuring appropriate antibiotic coverage along with NSAIDs.
In a survey of French general practitioners’ prescriptions, NSAIDs were prescribed for almost half of all patients seen for lower respiratory tract infection, “despite the fact that this prescription never appears in any national or international guideline,” the researchers say. That underscores the need to better inform general practitioners about the risks of NSAIDs, they say.
Source
Messika J, Sztrymf B, Bertrand F, et al. J Crit Care. 2014;29(5):733-738.
doi: 10.1016/j.jcrc.2014.05.021.
More education on SCD needed in sub-Saharan Africa

and a normal one
Credit: Betty Pace
Aggressive public health campaigns are needed to educate people in sub-Saharan Africa about sickle cell disease (SCD), according to a professor of health studies.
William Ebomoyi, PhD, of Chicago State University in Illinois, investigated the prevalence of SCD in sub-Saharan Africa, assessed the physical and emotional ramifications of the disease, evaluated ethical and legal issues related to SCD, and assessed the socio-cultural implications of the disease.
He reported his findings in the International Journal of Medical Engineering and Informatics.
Dr Ebomoyi explained that SCD occurs from a change in valine to glutamine substitution in the sixth amino acid position of the beta globin chain. If one of the two beta globin genes is affected, a person simply has sickle cell trait (SCT), but if both genes are involved, the person has SCD.
If two people with SCT decide to have a child, there is a 50% chance that child will have SCT, a 25% chance the child will have SCD, and a 25% chance the child will have neither condition. If one parent has SCT, there is a 50% chance the child will have SCT.
In some communities in sub-Saharan Africa, up to 2% of all children are born with SCD. And the prevalence of SCT ranges from 10% to 40% across equatorial Africa.
Dr Ebomoyi said early screening to identify infants with SCD is needed, as life-threatening complications can occur within the first 3 years of life. Unfortunately, the method of choice for SCD screening—cellulose acetate accompanied by citrate agar electrophoresis—is only available in two sub-Saharan African nations—South Africa and Ghana.
Similarly, innovative SCD treatment techniques have not been introduced in sub-Saharan African nations. There are not enough well-trained physicians, Dr Ebomoyi said. In fact, many SCD patients are treated improperly by traditional African healers.
Furthermore, aside from Senegal and Liberia, sub-Saharan African nations spend less than 10% of their gross domestic product on healthcare. And inadequate funding plays a major role in the high prevalence of SCD in these nations.
For all these reasons, it is important to raise awareness in sub-Saharan Africa about SCD, according to Dr Ebomoyi. He said members of the public should be aware of how they can pass SCD down to their children and inform their partners if they have SCT prior to conceiving a child.
He added that sickle cell education programs should be integrated into the curriculum of elementary, secondary, and tertiary academic institutions.
The abstract of this article, “Ethical, legal, social, and financial implications of neonatal screening for sickle cell anaemia in Sub-Sahara Africa in the age of genomic science,” can be found on the Inderscience Publishers website. ![]()
Switzerland approves drug to treat MCL

Credit: CDC
Swissmedic, the regulatory authority for Switzerland, has granted
approval for lenalidomide (Revlimid) to treat patients with
relapsed or refractory mantle cell lymphoma (MCL) after prior therapy
that included bortezomib and chemotherapy or rituximab.
This is the third approval of lenalidomide for MCL worldwide. The drug is also approved for this indication in the US and Israel.
Swissmedic’s decision to approve the drug was based on results of the phase 2 EMERGE study (MCL-001).
In this trial, researchers evaluated lenalidomide (25 mg once a day on days 1-21 of each 28-day cycle) in 134 MCL patients who had received prior treatment with rituximab, cyclophosphamide, an anthracycline (or mitoxantrone), and bortezomib alone or in combination.
The overall response rate (the primary endpoint) was 28% (37/134), and the complete response rate was 7% (10/134). The median duration of response was 16.6 months (95% CI, 7.7-26.7).
The most common grade 3/4 adverse events reported in at least 5% of patients were neutropenia (43%), thrombocytopenia (28%), anemia (11%), pneumonia (9%), fatigue (7%), leukopenia (7%), febrile neutropenia (6%), diarrhea (6%), and dyspnea (6%).
“MCL is a rare B-cell lymphoma of the elderly that usually responds quite well to first-line treatment,” said Christoph Renner, MD, of Onkozentrum Hirslanden Zürich.
“However, even intensive treatment does not prevent relapse in the majority of patients, and new therapeutic options are needed. Therefore, having access to lenalidomide, an immunomodulatory drug with a well-known safety profile, will definitely enrich our therapeutic armamentarium.”
Lenalidomide is already approved in Switzerland for use in combination
with dexamethasone to treat patients with multiple myeloma who have
received at least one previous treatment.
The drug is also
approved to treat patients with transfusion-dependent anemia due to low-
or intermediate-risk-1 myelodysplastic syndrome associated with a 5q
deletion, with or without additional cytogenetic abnormalities.
Lenalidomide is under development by Celgene International Sàrl, a wholly owned subsidiary of Celgene Corporation. ![]()
FDA grants drug orphan designation for aHUS

Credit: Kevin MacKenzie
The US Food and Drug Administration (FDA) has granted orphan drug designation for CCX168, an oral inhibitor targeting the receptor for the complement protein C5a, to treat atypical hemolytic uremic syndrome (aHUS).
This rare but life-threatening disease causes inflammation of the blood vessels and thrombus formation throughout the body.
Patients with aHUS are at constant risk of sudden and progressive damage to, and failure of, vital organs. Roughly 10% to 15% of patients die in the initial, acute phase of aHUS.
The majority of patients—up to 70%—develop end-stage kidney failure requiring dialysis. And 1 in 5 patients has aHUS affecting organs other than the kidneys, most commonly the brain or heart.
“Given the life-threatening nature of aHUS, we are very pleased with the granting of orphan drug designation for CCX168 in this disease,” said Thomas J. Schall, PhD, president and chief executive officer of ChemoCentryx, Inc., the company developing CCX168.
ChemoCentryx has generated positive preclinical data that suggest an important role of C5a receptor inhibition in reducing microvasculature thrombosis formation in aHUS.
The company plans to initiate a phase 2 proof-of-concept study in patients with aHUS by the end of 2014.
CCX168 is also in phase 2 development for the treatment of anti-neutrophil cytoplasmic antibody-associated vasculitis.
The orphan designation for CCX168 will provide ChemoCentryx with a 7-year period of US marketing exclusivity if the drug is approved to treat aHUS, tax credits for clinical research costs, the ability to apply for annual grant funding, clinical research trial design assistance, and the waiver of prescription drug user fees. ![]()
Public Quality Reporting
Few consumers would choose to dine at a restaurant if they knew the kitchen was infested with cockroaches. Few patients would choose to undergo a liver transplant in a hospital that was performing the procedure for the first time. In most sectors, consumers gather information about quality (and price) from the marketplace, where economic theory predicts that rational behavior and competition will lead to continuous improvement over time. However, for some goods and services, information is sparse and asymmetric between consumers and suppliers. In sectors where consumer health is at risk, society has often intervened to assure minimum standards. Yet sometimes these efforts have fallen short. In healthcare, physician licensure and hospital accreditation (eg, through the Joint Commission), although providing an important foundation to assure safety, have not come close to solving the widespread quality problems.[1] Basic regulatory requirements for restaurants have also proven inadequate to prevent food‐borne illness. Consumer trust, without information, can be a recipe (or prescription) for trouble.
In response, high‐profile efforts have been introduced to publicize the quality and safety of service providers. One example is Hospital Compare, Medicare's national quality reporting program for US hospitals.[2] The New York City sanitary grade inspection program is a parallel effort for restaurants. Although customers can judge how much they like the food from a restaurantor look up reviews at
The aims of Hospital Compare and the New York City sanitary inspection program are fundamentally similar. Both initiatives seek to address a common market failure resulting in the consumer's lack of information on quality and safety. By infusing the market with information, these programs enable consumers to make better choices and encourage service providers to improve quality and safety.[3] Despite the promise of these programs, a copious literature about the effects of public quality reporting in healthcare has found mixed results.[4, 5] Although the performance measures in any public reporting program must be valid and reliable, good measures are not sufficient to achieve the goals of public reporting. To engage patients, reported results must also be accessible, understandable, and meaningful. Both patients' lack of knowledge about the reports[6] and patients' inability to effectively use these data to make better decisions[7] are some reasons why public quality reporting has fallen short of its expectations. This article argues that the New York City program is much better structured to positively affect patient choice, and holds important lessons for public quality reporting in US hospitals.
CONTRASTS BETWEEN HOSPITAL COMPARE AND THE NEW YORK CITY RESTAURANT SANITARY INSPECTION PROGRAM
Hospital Compare reports performance for 108 separate quality indicators related to quality and patient safety for US hospitals (Table 1). These are a combination of structure measures (eg, hospital participation in a systematic database for cardiac surgery), process of care measures (eg, acute myocardial infarction patients receiving fibrinolytic therapy within 30 minutes of hospital arrival), outcomes (eg, 30‐day mortality and readmission), and patient experience measures (eg, how you would rate your communication with your physician). Hospital Compare data, frequently based on hospital quality performance 1 to 3 years prior to publication, are displayed on a website. Hospitals do not receive a summary measure of quality or safety.[8] Hospitals face financial incentives that are tied to measure reporting[9] and performance for some of the measures on Hospital Compare.[10, 11] Hospital accreditation is only loosely related to performance on these measures.
| Attribute | Hospital Compare | New York City Sanitary Inspection Program |
|---|---|---|
| Display of information | On a website ( |
On the front of the restaurant, with additional information also available on a website ( |
| Frequency of information update | Quarterly; data often lag by between 1 and 3 years. | Unannounced inspections occur at least annually. Grades are posted immediately after inspection. |
| Quality measures | Mix of measures pertaining to quality improvement activities (eg, hospital participation in a cardiac surgery registry or a quality improvement initiative), rates of adherence with evidence‐based medicine (eg, heart failure patients receiving discharge instructions, acute myocardial infarction patients receiving ‐blocker at arrival), and patient outcomes (eg, 30‐day mortality and 30‐day readmission for acute myocardial infarction, heart failure, and pneumonia). | Mix of measures pertaining to conditions of the facility (eg, improper sewage disposal system, improper food contact surface, evidence of live rats in the facility) and the treatment and handling of food (eg, food is unwrapped, appropriate thermometer not used to measure temperature of potentially hazardous foods, food not prepared to sufficiently high temperature). |
| Clarity and simplicity of information | 108 individual measures. No summary measure. | Single summary letter grade displayed on front of restaurant. Detailed data on individual violations (ie, measures) available on website. |
| Consequences of poor performance and mechanisms for enforcement | Hospitals are subject to financial penalties for not reporting certain measures and face financial incentives for performance on a subset of measures. | Restaurants are fined for violations, are subject to repeated inspections for poor performance, and are subject to closure for severe violations. |
| Consumer awareness | Limited | Widespread |
The New York City sanitation program regularly inspects restaurants and scores them on a standard set of indicators that correspond to critical violations (eg, food is contaminated by mouse droppings) or general violations (eg, garbage is not adequately covered).[12] Points are assigned to each type and severity of violation, and the sum of the points are converted into a summary grade of A, B, or C. Restaurants can dispute the grades, receiving a grade pending designation until the dispute is adjudicated. After inspection, sanitation grades are immediately posted on restaurants' front door or window, providing current information that is clearly visible to consumers before entering. More detailed information on sanitation violations is also available on a website. If restaurants receive an A grade, they face no additional inspections for 1 year, but poorly graded restaurants may receive monthly inspections. Restaurants face fines from violations and are subject to closure from severe violations. Recently proposed changes would decrease fines and give restaurants greater opportunities to appeal grades, but leave the program otherwise intact.[13]
IMPLICATIONS FOR PUBLIC QUALITY REPORTING IN HOSPITALS
Along with value‐based payment reforms, public quality reporting is one of the few major system‐level approaches that is being implemented in the US to improve quality and safety in healthcare. However, without a simple and understandable display of information that is available when a patient needs it, quality and safety information will likely go unused.[14] Hospital Compare leaves it up the patient to find the quality and safety information and does little to help patients understand and use the information effectively. Hospital Compare asks patients to do far more work, which is perhaps why it has been largely ignored by patients.[2, 15] The New York City sanitation inspection program evaluates restaurants, prominently displays an understandable summary result, and puts the scoring details in the background. Although peer‐reviewed evaluations of the New York City sanitation inspection program have not yet been published, internal data show that the program has decreased customer concern about getting sick, improved sanitary practices, and decreased salmonella.[16] Evidence from a similar program in Los Angeles County found that hygiene grades steered consumers toward restaurants with better sanitary conditions and decreased food‐borne illness.[17]
The nature of choice in healthcare, particularly the choice of hospital, is much different than it is for restaurants. In some areas, a single hospital may serve a large geographical area, severely limiting choice. Even when patients have the ability to receive care at different hospitals, choice may be limited because patients are referred to a specific hospital by their outpatient physician or are brought to a hospital during an emergency.[18] In these cases, quality grades on the front doors of hospitals would not affect patient decisions, at least for that admission. Nonetheless, if quality grades were posted on the front doors of hospitals, patients receiving both inpatient and outpatient care would see the grades, and could use the information to make future decisions. Posted grades may also lead patients to review more in‐depth quality information related to their condition on the Hospital Compare website. Posted quality grades would also increase the visibility of the grades for other stakeholdersincluding the media and boards of directorsmagnifying their salience and impact.
How quality information is displayed and summarized can make or break public reporting programs. The New York City sanitation inspection program displays summarized, composite measures in the form of widely understood letter grades. Hospital Compare, however, displays myriad, unrelated performance measures that are not summarized into a global quality or safety measure. This information display is at odds with best practice. Patients find it difficult to synthesize data from multiple performance indicators to determine the relative quality of healthcare providers or insurance plans.7 In many cases, more information can lead to worse decision making.[19] Patients' difficulty making optimal choices has been noted in numerous healthcare settings, including purchasing Medicare Part D plans[20] and choosing health plans.[21] Recent evidence suggests that Nursing Home Compare's shift from an unsummarized collection of disparate performance measures to a 5‐star rating system has led patients to choose higher‐ranked facilities.[22] The fact that commercial providers of product quality information, such as Consumer Reports[23] and US News and World Report,[24] publish global summary scores, in addition to component scores, is a hint that this style of reporting is more appealing to consumers. Reports suggest that Medicare is moving toward a 5‐star quality rating system for hospitals,[8] which is a welcome development.
Different types of patients may demand different types of quality information, and a single summary measure for Hospital Compare may not meet the needs of a diverse set of patients. Nonetheless, the benefits from an actionable, understandable, comprehensive, and appropriate summary measure likely outweigh the costs of a potential mismatch for certain types of patients. Many of the performance measures on Hospital Compare already apply broadly to diverse sets of patients (eg, the structure measures, patient experience, and surgical safety) and are not specific to certain disease areas. Global summary measures could be complemented by separate component scores (eg, by disease area or domain of quality) for patients who wanted information on different aspects of care.
The inspection regime that underlies the New York City sanitary inspection program has parallels in healthcare that could be extended to Hospital Compare. For instance, the Joint Commission performs surprise inspections of hospitals as part of its accreditation process. The publicly reported 5‐star ratings for nursing homes are also based, in part, on inspection results.[25] Results from these types of inspections can capture up‐to‐date information on important dimensions of quality and safety that are not available in standard administrative data sources. Incorporating inspection results into Hospital Compare could increase both the timeliness and validity of the reporting.
The New York City sanitation inspection program is not a panacea: the indicators may not capture all relevant aspects of restaurant sanitation, some research suggests that past sanitary grades do not predict future grades,[26] and sanitary grade inflation over time has the potential to mask meaningful differences in sanitary conditions that are related to food‐borne illness.[16, 26] However, by providing understandable and meaningful reports at the point of service, the New York City program is well designed to encourage sanitation improvement through both consumer and supplier behavior.
Where the New York City sanitation inspection program succeeds, Hospital Compare fails. Hospital Compare is not patient centered, and it is not working for patients. Medicare can learn from the New York City restaurant sanitation inspection program to enhance the effects of public reporting by presenting information to consumers that is relevant, easy to access and interpret, and up to date. The greater complexity of hospital product lines should not deter these efforts. Patients' lives, not just the health of their gastrointestinal tracts, are at stake.
ACKNOWLEDGEMENTS
The authors thank Kaveh G. Shojania, MD, and Edward E. Etchells, MD, MSc, University of Toronto, and Martin Roland, DM, University of Oxford and RAND Europe for their comments on an earlier draft of the manuscript. None were compensated for their contributions.
Disclosures: Nothing to report.
- Institute of Medicine. Crossing the Quality Chasm: A New Health System for the 21st Century. Washington, DC: National Academy Press; 2001.
- , , . Medicare's public reporting initiative on hospital quality had modest or no impact on mortality from three key conditions. Health Aff (Millwood). 2012;31(3):585–592.
- , . Public reporting of hospital hand hygiene compliance—helpful or harmful? JAMA. 2010;304(10):1116–1117.
- . Do cardiac surgery report cards reduce mortality? Assessing the evidence. Med Care Res Rev. 2006;63(4):403–426.
- , . Quality and consumer decision making in the market for health insurance and health care services. Med Care Res Rev. 2009;66(1 suppl):28S–52S.
- , . Use of public performance reports: a survey of patients undergoing cardiac surgery. JAMA. 1998;279(20):1638–1642.
- , , . Informing consumer decisions in health care: implications from decision‐making research. Milbank Q. 1997;75(3):395–414.
- Centers for Medicare hospital inpatient prospective payment systems for acute care hospitals and the long‐term care hospital prospective payment system and proposed fiscal year 2014 rates; quality reporting requirements for specific providers; hospital conditions of participation. Fed Regist. 2013:27486–27823.
- , . Relationship between Medicare's hospital compare performance measures and mortality rates. JAMA. 2006;296(22):2694–2702.
- . Will value‐based purchasing increase disparities in care? N Engl J Med. 2013;369(26):2472–2474.
- , . A path forward on Medicare readmissions. N Engl J Med. 2013;368(13):1175–1177.
- New York City Department of Health and Mental Hygiene. What to expect when you're inspected: a guide for food service operators. New York, NY: New York City Department of Health and Mental Hygiene; 2010.
- . In reprieve for restaurant industry, New York proposes changes to grading system. New York Times. March 22, 2014:A15.
- . Thinking, Fast and Slow. New York, NY: Farrar, Straus and Giroux; 2011.
- , , . Public hospital quality report awareness: evidence from National and Californian Internet searches and social media mentions, 2012. BMJ Open. 2014;4(3):e004417.
- New York City Department of Health and Mental Hygiene. Restaurant Grading in New York City at 18 Months. New York, NY: New York City Department of Health and Mental Hygiene; 2013.
- , . The effect of information on product quality: evidence from restaurant hygiene grade cards. Q J Econ. 2003;118(2):409–451.
- , , , . Do high‐cost hospitals deliver better care? Evidence from ambulance referral patterns. National Bureau of Economic Research. Working paper no. 17936. Available at: http://www.nber.org/papers/w17936.pdf. Published March 2012. Accessed November 18, 2014.
- , , , , . Less is more in presenting quality information to consumers. Med Care Res Rev. 2007;64(2)169–190.
- and . Choice inconsistencies among the elderly: evidence from plan choice in the Medicare Part D program. Amer Econ Rev. 2011;101(4)1180–1210.
- , , , . Strategies for reporting health plan performance information to consumers: evidence from controlled studies. Health Serv Res. 2002;37(2):291–313.
- , . Quality reporting and private prices: evidence from the nursing home industry. Paper presented at: American Society of Health Economists Annual Meeting; June 23, 2014; Los Angeles, CA.
- Consumer Reports. Best new care values. Available at: http://consumerreports.org/cro/2012/05/best-new-car-values/index.htm. Updated February 2014. Accessed November 18, 2014.
- . Best value schools methodology. US News and World Report. September 8, 2014. Available at: http://www.usnews.com/education/best-colleges/articles/2013/09/09/best-value-schools-methodology. Accessed November 18, 2014.
- Centers for Medicare 122:574–677.
Few consumers would choose to dine at a restaurant if they knew the kitchen was infested with cockroaches. Few patients would choose to undergo a liver transplant in a hospital that was performing the procedure for the first time. In most sectors, consumers gather information about quality (and price) from the marketplace, where economic theory predicts that rational behavior and competition will lead to continuous improvement over time. However, for some goods and services, information is sparse and asymmetric between consumers and suppliers. In sectors where consumer health is at risk, society has often intervened to assure minimum standards. Yet sometimes these efforts have fallen short. In healthcare, physician licensure and hospital accreditation (eg, through the Joint Commission), although providing an important foundation to assure safety, have not come close to solving the widespread quality problems.[1] Basic regulatory requirements for restaurants have also proven inadequate to prevent food‐borne illness. Consumer trust, without information, can be a recipe (or prescription) for trouble.
In response, high‐profile efforts have been introduced to publicize the quality and safety of service providers. One example is Hospital Compare, Medicare's national quality reporting program for US hospitals.[2] The New York City sanitary grade inspection program is a parallel effort for restaurants. Although customers can judge how much they like the food from a restaurantor look up reviews at
The aims of Hospital Compare and the New York City sanitary inspection program are fundamentally similar. Both initiatives seek to address a common market failure resulting in the consumer's lack of information on quality and safety. By infusing the market with information, these programs enable consumers to make better choices and encourage service providers to improve quality and safety.[3] Despite the promise of these programs, a copious literature about the effects of public quality reporting in healthcare has found mixed results.[4, 5] Although the performance measures in any public reporting program must be valid and reliable, good measures are not sufficient to achieve the goals of public reporting. To engage patients, reported results must also be accessible, understandable, and meaningful. Both patients' lack of knowledge about the reports[6] and patients' inability to effectively use these data to make better decisions[7] are some reasons why public quality reporting has fallen short of its expectations. This article argues that the New York City program is much better structured to positively affect patient choice, and holds important lessons for public quality reporting in US hospitals.
CONTRASTS BETWEEN HOSPITAL COMPARE AND THE NEW YORK CITY RESTAURANT SANITARY INSPECTION PROGRAM
Hospital Compare reports performance for 108 separate quality indicators related to quality and patient safety for US hospitals (Table 1). These are a combination of structure measures (eg, hospital participation in a systematic database for cardiac surgery), process of care measures (eg, acute myocardial infarction patients receiving fibrinolytic therapy within 30 minutes of hospital arrival), outcomes (eg, 30‐day mortality and readmission), and patient experience measures (eg, how you would rate your communication with your physician). Hospital Compare data, frequently based on hospital quality performance 1 to 3 years prior to publication, are displayed on a website. Hospitals do not receive a summary measure of quality or safety.[8] Hospitals face financial incentives that are tied to measure reporting[9] and performance for some of the measures on Hospital Compare.[10, 11] Hospital accreditation is only loosely related to performance on these measures.
| Attribute | Hospital Compare | New York City Sanitary Inspection Program |
|---|---|---|
| Display of information | On a website ( |
On the front of the restaurant, with additional information also available on a website ( |
| Frequency of information update | Quarterly; data often lag by between 1 and 3 years. | Unannounced inspections occur at least annually. Grades are posted immediately after inspection. |
| Quality measures | Mix of measures pertaining to quality improvement activities (eg, hospital participation in a cardiac surgery registry or a quality improvement initiative), rates of adherence with evidence‐based medicine (eg, heart failure patients receiving discharge instructions, acute myocardial infarction patients receiving ‐blocker at arrival), and patient outcomes (eg, 30‐day mortality and 30‐day readmission for acute myocardial infarction, heart failure, and pneumonia). | Mix of measures pertaining to conditions of the facility (eg, improper sewage disposal system, improper food contact surface, evidence of live rats in the facility) and the treatment and handling of food (eg, food is unwrapped, appropriate thermometer not used to measure temperature of potentially hazardous foods, food not prepared to sufficiently high temperature). |
| Clarity and simplicity of information | 108 individual measures. No summary measure. | Single summary letter grade displayed on front of restaurant. Detailed data on individual violations (ie, measures) available on website. |
| Consequences of poor performance and mechanisms for enforcement | Hospitals are subject to financial penalties for not reporting certain measures and face financial incentives for performance on a subset of measures. | Restaurants are fined for violations, are subject to repeated inspections for poor performance, and are subject to closure for severe violations. |
| Consumer awareness | Limited | Widespread |
The New York City sanitation program regularly inspects restaurants and scores them on a standard set of indicators that correspond to critical violations (eg, food is contaminated by mouse droppings) or general violations (eg, garbage is not adequately covered).[12] Points are assigned to each type and severity of violation, and the sum of the points are converted into a summary grade of A, B, or C. Restaurants can dispute the grades, receiving a grade pending designation until the dispute is adjudicated. After inspection, sanitation grades are immediately posted on restaurants' front door or window, providing current information that is clearly visible to consumers before entering. More detailed information on sanitation violations is also available on a website. If restaurants receive an A grade, they face no additional inspections for 1 year, but poorly graded restaurants may receive monthly inspections. Restaurants face fines from violations and are subject to closure from severe violations. Recently proposed changes would decrease fines and give restaurants greater opportunities to appeal grades, but leave the program otherwise intact.[13]
IMPLICATIONS FOR PUBLIC QUALITY REPORTING IN HOSPITALS
Along with value‐based payment reforms, public quality reporting is one of the few major system‐level approaches that is being implemented in the US to improve quality and safety in healthcare. However, without a simple and understandable display of information that is available when a patient needs it, quality and safety information will likely go unused.[14] Hospital Compare leaves it up the patient to find the quality and safety information and does little to help patients understand and use the information effectively. Hospital Compare asks patients to do far more work, which is perhaps why it has been largely ignored by patients.[2, 15] The New York City sanitation inspection program evaluates restaurants, prominently displays an understandable summary result, and puts the scoring details in the background. Although peer‐reviewed evaluations of the New York City sanitation inspection program have not yet been published, internal data show that the program has decreased customer concern about getting sick, improved sanitary practices, and decreased salmonella.[16] Evidence from a similar program in Los Angeles County found that hygiene grades steered consumers toward restaurants with better sanitary conditions and decreased food‐borne illness.[17]
The nature of choice in healthcare, particularly the choice of hospital, is much different than it is for restaurants. In some areas, a single hospital may serve a large geographical area, severely limiting choice. Even when patients have the ability to receive care at different hospitals, choice may be limited because patients are referred to a specific hospital by their outpatient physician or are brought to a hospital during an emergency.[18] In these cases, quality grades on the front doors of hospitals would not affect patient decisions, at least for that admission. Nonetheless, if quality grades were posted on the front doors of hospitals, patients receiving both inpatient and outpatient care would see the grades, and could use the information to make future decisions. Posted grades may also lead patients to review more in‐depth quality information related to their condition on the Hospital Compare website. Posted quality grades would also increase the visibility of the grades for other stakeholdersincluding the media and boards of directorsmagnifying their salience and impact.
How quality information is displayed and summarized can make or break public reporting programs. The New York City sanitation inspection program displays summarized, composite measures in the form of widely understood letter grades. Hospital Compare, however, displays myriad, unrelated performance measures that are not summarized into a global quality or safety measure. This information display is at odds with best practice. Patients find it difficult to synthesize data from multiple performance indicators to determine the relative quality of healthcare providers or insurance plans.7 In many cases, more information can lead to worse decision making.[19] Patients' difficulty making optimal choices has been noted in numerous healthcare settings, including purchasing Medicare Part D plans[20] and choosing health plans.[21] Recent evidence suggests that Nursing Home Compare's shift from an unsummarized collection of disparate performance measures to a 5‐star rating system has led patients to choose higher‐ranked facilities.[22] The fact that commercial providers of product quality information, such as Consumer Reports[23] and US News and World Report,[24] publish global summary scores, in addition to component scores, is a hint that this style of reporting is more appealing to consumers. Reports suggest that Medicare is moving toward a 5‐star quality rating system for hospitals,[8] which is a welcome development.
Different types of patients may demand different types of quality information, and a single summary measure for Hospital Compare may not meet the needs of a diverse set of patients. Nonetheless, the benefits from an actionable, understandable, comprehensive, and appropriate summary measure likely outweigh the costs of a potential mismatch for certain types of patients. Many of the performance measures on Hospital Compare already apply broadly to diverse sets of patients (eg, the structure measures, patient experience, and surgical safety) and are not specific to certain disease areas. Global summary measures could be complemented by separate component scores (eg, by disease area or domain of quality) for patients who wanted information on different aspects of care.
The inspection regime that underlies the New York City sanitary inspection program has parallels in healthcare that could be extended to Hospital Compare. For instance, the Joint Commission performs surprise inspections of hospitals as part of its accreditation process. The publicly reported 5‐star ratings for nursing homes are also based, in part, on inspection results.[25] Results from these types of inspections can capture up‐to‐date information on important dimensions of quality and safety that are not available in standard administrative data sources. Incorporating inspection results into Hospital Compare could increase both the timeliness and validity of the reporting.
The New York City sanitation inspection program is not a panacea: the indicators may not capture all relevant aspects of restaurant sanitation, some research suggests that past sanitary grades do not predict future grades,[26] and sanitary grade inflation over time has the potential to mask meaningful differences in sanitary conditions that are related to food‐borne illness.[16, 26] However, by providing understandable and meaningful reports at the point of service, the New York City program is well designed to encourage sanitation improvement through both consumer and supplier behavior.
Where the New York City sanitation inspection program succeeds, Hospital Compare fails. Hospital Compare is not patient centered, and it is not working for patients. Medicare can learn from the New York City restaurant sanitation inspection program to enhance the effects of public reporting by presenting information to consumers that is relevant, easy to access and interpret, and up to date. The greater complexity of hospital product lines should not deter these efforts. Patients' lives, not just the health of their gastrointestinal tracts, are at stake.
ACKNOWLEDGEMENTS
The authors thank Kaveh G. Shojania, MD, and Edward E. Etchells, MD, MSc, University of Toronto, and Martin Roland, DM, University of Oxford and RAND Europe for their comments on an earlier draft of the manuscript. None were compensated for their contributions.
Disclosures: Nothing to report.
- Institute of Medicine. Crossing the Quality Chasm: A New Health System for the 21st Century. Washington, DC: National Academy Press; 2001.
- , , . Medicare's public reporting initiative on hospital quality had modest or no impact on mortality from three key conditions. Health Aff (Millwood). 2012;31(3):585–592.
- , . Public reporting of hospital hand hygiene compliance—helpful or harmful? JAMA. 2010;304(10):1116–1117.
- . Do cardiac surgery report cards reduce mortality? Assessing the evidence. Med Care Res Rev. 2006;63(4):403–426.
- , . Quality and consumer decision making in the market for health insurance and health care services. Med Care Res Rev. 2009;66(1 suppl):28S–52S.
- , . Use of public performance reports: a survey of patients undergoing cardiac surgery. JAMA. 1998;279(20):1638–1642.
- , , . Informing consumer decisions in health care: implications from decision‐making research. Milbank Q. 1997;75(3):395–414.
- Centers for Medicare hospital inpatient prospective payment systems for acute care hospitals and the long‐term care hospital prospective payment system and proposed fiscal year 2014 rates; quality reporting requirements for specific providers; hospital conditions of participation. Fed Regist. 2013:27486–27823.
- , . Relationship between Medicare's hospital compare performance measures and mortality rates. JAMA. 2006;296(22):2694–2702.
- . Will value‐based purchasing increase disparities in care? N Engl J Med. 2013;369(26):2472–2474.
- , . A path forward on Medicare readmissions. N Engl J Med. 2013;368(13):1175–1177.
- New York City Department of Health and Mental Hygiene. What to expect when you're inspected: a guide for food service operators. New York, NY: New York City Department of Health and Mental Hygiene; 2010.
- . In reprieve for restaurant industry, New York proposes changes to grading system. New York Times. March 22, 2014:A15.
- . Thinking, Fast and Slow. New York, NY: Farrar, Straus and Giroux; 2011.
- , , . Public hospital quality report awareness: evidence from National and Californian Internet searches and social media mentions, 2012. BMJ Open. 2014;4(3):e004417.
- New York City Department of Health and Mental Hygiene. Restaurant Grading in New York City at 18 Months. New York, NY: New York City Department of Health and Mental Hygiene; 2013.
- , . The effect of information on product quality: evidence from restaurant hygiene grade cards. Q J Econ. 2003;118(2):409–451.
- , , , . Do high‐cost hospitals deliver better care? Evidence from ambulance referral patterns. National Bureau of Economic Research. Working paper no. 17936. Available at: http://www.nber.org/papers/w17936.pdf. Published March 2012. Accessed November 18, 2014.
- , , , , . Less is more in presenting quality information to consumers. Med Care Res Rev. 2007;64(2)169–190.
- and . Choice inconsistencies among the elderly: evidence from plan choice in the Medicare Part D program. Amer Econ Rev. 2011;101(4)1180–1210.
- , , , . Strategies for reporting health plan performance information to consumers: evidence from controlled studies. Health Serv Res. 2002;37(2):291–313.
- , . Quality reporting and private prices: evidence from the nursing home industry. Paper presented at: American Society of Health Economists Annual Meeting; June 23, 2014; Los Angeles, CA.
- Consumer Reports. Best new care values. Available at: http://consumerreports.org/cro/2012/05/best-new-car-values/index.htm. Updated February 2014. Accessed November 18, 2014.
- . Best value schools methodology. US News and World Report. September 8, 2014. Available at: http://www.usnews.com/education/best-colleges/articles/2013/09/09/best-value-schools-methodology. Accessed November 18, 2014.
- Centers for Medicare 122:574–677.
Improving Notes in the EHR
There are described advantages to documenting in an electronic health record (EHR).[1, 2, 3, 4, 5] There has been, however, an unanticipated decline in certain aspects of documentation quality after implementing EHRs,[6, 7, 8] for example, the overinclusion of data (note clutter) and inappropriate use of copy‐paste.[6, 7, 8, 9, 10, 11, 12, 13, 14, 15, 16, 17]
The objectives of this pilot study were to examine the effectiveness of an intervention bundle designed to improve resident progress notes written in an EHR (Epic Systems Corp., Verona, WI) and to establish the reliability of an audit tool used to assess the notes. Prior to this intervention, we provided no formal education for our residents about documentation in the EHR and had no policy governing format or content. The institutional review board at the University of Wisconsin approved this study.
METHODS
The Intervention Bundle
A multidisciplinary task force developed a set of Best Practice Guidelines for Writing Progress Notes in the EHR (see Supporting Information, Appendix 1, in the online version of this article). They were designed to promote cognitive review of data, reduce note clutter, promote synthesis of data, and discourage copy‐paste. For example, the guidelines recommended either the phrase, Vital signs from the last 24 hours have been reviewed and are pertinent for or a link that included minimum/maximum values rather than including multiple sets of data. We next developed a note template aligned with these guidelines (see Supporting Information, Appendix 2, in the online version of this article) using features and links that already existed within the EHR. Interns received classroom teaching about the best practices and instruction in use of the template.
Study Design
The study was a retrospective pre‐/postintervention. An audit tool designed to assess compliance with the guidelines was used to score 25 progress notes written by pediatric interns in August 2010 and August 2011 during the pre‐ and postintervention periods, respectively (see Supporting Information, Appendix 3, in the online version of this article).
Progress notes were eligible based on the following criteria: (1) written on any day subsequent to the admission date, (2) written by a pediatric intern, and (3) progress note from the previous day available for comparison. It was not required that 2 consecutive notes be written by the same resident. Eligible notes were identified using a computer‐generated report, reviewed by a study member to ensure eligibility, and assigned a number.
Notes were scored on a scale of 0 to 17, with each question having a range of possible scores from 0 to 2. Some questions related to inappropriate copy‐paste (questions 2, 9, 10) and a question related to discrete diagnostic language for abnormal labs (question 11) were weighted more heavily in the tool, as compliance with these components of the guideline was felt to be of greater importance. Several questions within the audit tool refer to clutter. We defined clutter as any additional data not endorsed by the guidelines or not explicitly stated as relevant to the patient's care for that day.
Raters were trained to score notes through practice sessions, during which they all scored the same note and compared findings. To rectify inter‐rater scoring discrepancies identified during these sessions, a reference manual was created to assist raters in scoring notes (see Supporting Information, Appendix 4, in the online version of this article). Each preintervention note was then systematically assigned to 2 raters, comprised of a physician and 3 staff from health information management. Each rater scored the note individually without discussion. The inter‐rater reliability was determined to be excellent, with kappa indices ranging from 88% to 100% for the 13 questions; each note in the postintervention period was therefore assigned to only 1 rater. Total and individual questions' scores were sent to the statistician for analysis.
Statistical Analysis
Inter‐rater reliability of the audit tool was evaluated by calculating the intraclass correlation (ICC) coefficient using a multilevel random intercept model to account for the rater effect.[18] The study was powered to detect an anticipated ICC of at least 0.75 at the 1‐sided 0.05 significance level, assuming a null hypothesis that the ICC is 0.4 or less. The total score was summarized in terms of means and standard deviation. Individual item responses were summarized using percentages and compared between the pre‐ and postintervention assessment using the Fisher exact test. The analysis of response patterns for individual item scores was considered exploratory. The Benjamini‐Hochberg false discovery rate method was utilized to control the false‐positive rate when comparing individual item scores.[19] All P values were 2‐sided and considered statistically significant at 0.05. Statistical analyses were conducted using SAS software version 9.2 (SAS Institute Inc., Cary, NC).
RESULTS
The ICC was 0.96 (95% confidence interval: 0.91‐0.98), indicating an excellent level of inter‐rater reliability. There was a significant improvement in the total score (see Supporting Information, Appendix 5, in the online version of this article) between the preintervention (mean 9.72, standard deviation [SD] 1.52) and postintervention (mean 11.72, SD 1.62) periods (P0.0001).
Table 1 shows the percentage of yes responses to each individual item in the pre‐ and postintervention periods. Our intervention had a significant impact on reducing vital sign clutter (4% preintervention, 84% postintervention, P0.0001) and other visual clutter within the note (0% preintervention, 28% postintervention, P=0.0035). We did not observe a significant impact on the reduction of input/output or lab clutter. There was no significant difference observed in the inclusion of the medication list. No significant improvements were seen in questions related to copy‐paste. The intervention had no significant impact on areas with an already high baseline performance: newly written interval histories, newly written physical exams, newly written plans, and the inclusion of discrete diagnostic language for abnormal labs.
| Question | Preintervention, N=25* | Postintervention, N=25 | P Value |
|---|---|---|---|
| |||
| 1. Does the note header include the name of the service, author, and training level of the author? | 0% | 68% | 0.0001 |
| 2. Does it appear that the subjective/emnterval history section of the note was newly written? (ie, not copied in its entirety from the previous note) | 100% | 96% | 0.9999 |
| 3. Is the vital sign section noncluttered? | 4% | 84% | 0.0001 |
| 4. Is the entire medication list included in the note? | 96% | 96% | 0.9999 |
| 5. Is the intake/output section noncluttered? | 0% | 16% | 0.3076 |
| 6. Does it appear that the physical exam was newly written? (ie, not copied in its entirety from the previous note) | 80% | 68% | 0.9103 |
| 7. Is the lab section noncluttered? | 64% | 44% | 0.5125 |
| 8. Is the imaging section noncluttered? | 100% | 100% | 0.9999 |
| 9. Does it appear that the assessment was newly written? | 48% | 28% | 0.5121 |
| 48% partial | 52% partial | 0.9999 | |
| 10. Does it appear that the plan was newly written or partially copied with new information added? | 88% | 96% | 0.9477 |
| 11. If the assessment includes abnormal lab values, is there also an accompanying diagnosis? (eg, inclusion of patient has hemoglobin of 6.2, also includes diagnosis of anemia) | 96% | 96% | 0.9999 |
| 12. Is additional visual clutter prevented by excluding other objective data found elsewhere in the chart? | 0% | 28% | 0.0035 |
| 13. Is the author's name and contact information (pager, cell) included at the bottom of the note? | 0% | 72% | 0.0001 |
DISCUSSION
Principal Findings
Improvements in electronic note writing, particularly in reducing note clutter, were achieved after the implementation of a bundled intervention. Because the intervention is a bundle, we cannot definitively identify which component had the greatest impact. Given the improvements seen in some areas with very low baseline performance, we hypothesize that these are most attributable to the creation of a compliant note template that (1) guided authors in using data links that were less cluttered and (2) eliminated the use of unnecessary links (eg, pain scores and daily weights). The lack of similar improvements in reducing input/output and lab clutter may be due to the fact that even with changes to the template suggesting a more narrative approach to these components, residents still felt compelled to use data links. Because our EHR does not easily allow for the inclusion of individual data elements, such as specific drain output or hemoglobin as opposed to a complete blood count, residents continued to use links that included more data than necessary. Although not significant findings, there was an observed decline in the proportion of notes containing a physical exam not entirely copied from the previous day and containing an assessment that was entirely new. These findings may be attributable to having a small sample of authors, a few of whom in the postintervention period were particularly prone to using copy‐paste.
Relationship to Other Evidence
The observed decline in quality of provider documentation after implementation of the EHR has led to a robust discussion in the literature about what really constitutes a quality provider note.[7, 8, 9, 10, 20] The absence of a defined gold standard makes research in this area challenging. It is our observation that when physicians refer to a decline in quality documentation in the EHR, they are frequently referring to the fact that electronically generated notes are often unattractive, difficult to read, and seem to lack clinical narrative.
Several publications have attempted to define note quality. Payne et al. described physical characteristics of electronically generated notes that were deemed more attractive to a reader, including a large proportion of narrative free text.[15] Hanson performed a qualitative study to describe outpatient clinical notes from the perspective of multiple stakeholders, resulting in a description of the characteristics of a quality note.[21] This formed the basis for the QNOTE, a validated tool to measure the quality of outpatient notes.[22] Similar work has not been done to rigorously define quality for inpatient documentation. Stetson did develop an instrument, the Physician Documentation Quality Instrument (PDQI‐9) to assess inpatient notes across 9 attributes; however, the validation method relied on a gold standard of a general impression score of 7 physician leaders.[23, 24]
Although these tools aim to address overall note quality, an advantage provided by our audit tool is that it directly addresses the problems most attributable to documenting in an EHR, namely note clutter and copy‐paste. A second advantage is that clinicians and nonclinicians can score notes objectively. The QNOTE and PDQI‐9 still rely on subjective assessment and require that the evaluator be a clinician.
There has also been little published about how to achieve notes of high quality. In 2013, Shoolin et al. did publish a consensus statement from the Association of Medical Directors of Information Systems outlining some guidelines for inpatient EHR documentation.[25] Optimal strategies for implementing such guidelines, however, and the overall impact such an implementation would have on improving note writing has not previously been studied. This study, therefore, adds to the existing body of literature by providing an example of an intervention that may lead to improvements in note writing.
Limitations
Our study has several limitations. The sample size of notes and authors was small. The short duration of the study and the assessment of notes soon after the intervention prevented an assessment of whether improvements were sustained over time.
Unfortunately, we were not evaluating the same group of interns in the pre‐ and postintervention periods. Interns were chosen as subjects as there was an existing opportunity to do large group training during new intern orientation. Furthermore, we were concerned that more note‐writing experience alone would influence the outcome if we examined the same interns later in the year.
The audit tool was also a first attempt at measuring compliance with the guidelines. Determination of an optimal score/weight for each item requires further investigation as part of a larger scale validation study. In addition, the cognitive review and synthesis of data encouraged in our guideline were more difficult to measure using the audit tool, as they require some clinical knowledge about the patient and an assessment of the author's medical decision making. We do not assert, therefore, that compliance with the guidelines or a higher total score necessarily translates into overall note quality, as we recognize these limitations of the tool.
Future Directions
In conclusion, this report is a first effort to improve the quality of note writing in the EHR. Much more work is necessary, particularly in improving the clinical narrative and inappropriate copy‐paste. The examination of other interventions, such as the impact of structured feedback to the note author, whether by way of a validated scoring tool and/or narrative comments, is a logical next step for investigation.
ACKNOWLEDGEMENTS
The authors acknowledge and appreciate the support of Joel Buchanan, MD, Ellen Wald, MD, and Ann Boyer, MD, for their contributions to this study and manuscript preparation. We also acknowledge the members of the auditing team: Linda Brickert, Jane Duckert, and Jeannine Strunk.
Disclosure: Nothing to report.
- , , . Use of computer‐based records, completeness of documentation, and appropriateness of documented clinical decisions. J Am Med Inform Assoc. 1999;6(3):245–251.
- , , , et al. An automated model to identify heart failure patients at risk for 30‐day readmission or death using electronic medical record data. Med Care. 2010;48(11):981–988.
- , , , , . Clinical information technologies and inpatient outcomes: a multiple hospital study. Arch Intern Med. 2009;169(2):108–114.
- , , , , . Identifying patients with diabetes and the earliest date of diagnosis in real time: an electronic health record case‐finding algorithm. BMC Med Inform Decis Mak. 2013;13:81.
- , , , et al. Relationship between use of electronic health record features and health care quality: results of a statewide survey. Med Care. 2010;48(3):203–209.
- , , , , , . Impacts of computerized physician documentation in a teaching hospital: perceptions of faculty and resident physicians. J Am Med Inform Assoc. 2004;11(4):300–309.
- , . Off the record—avoiding the pitfalls of going electronic. N Engl J Med. 2008;358(16):1656–1658.
- . A piece of my mind. Copy‐and‐paste. JAMA. 2006;295(20):2335–2336.
- , . Copy and paste: a remediable hazard of electronic health records. Am J Med. 2009;122(6):495–496.
- , , , , , . Physicians' attitudes towards copy and pasting in electronic note writing. J Gen Intern Med. 2009;24(1):63–68.
- . Improving the electronic health record—are clinicians getting what they wished for? JAMA. 2013;309(10):991–992.
- , , . Copying and pasting of examinations within the electronic medical record. Int J Med Inform. 2007;76(suppl 1):S122–S128.
- . The evolving medical record. Ann Intern Med. 2010;153(10):671–677.
- , , , , , . Direct text entry in electronic progress notes. An evaluation of input errors. Methods Inf Med. 2003;42(1):61–67.
- , , , . The physical attractiveness of electronic physician notes. AMIA Annu Symp Proc. 2010;2010:622–626.
- , . Copy‐and‐paste‐and‐paste. JAMA. 2006;296(19):2315; author reply 2315–2316.
- , , , . Are electronic medical records trustworthy? Observations on copying, pasting and duplication. AMIA Annu Symp Proc. 2003:269–273.
- , . Hierarchical Linear Models: Applications and Data Analysis Methods. 2nd ed. Thousand Oaks, CA: Sage; 2002.
- , . Controlling the false discovery rate: a practical and powerful approach for multiple testing. J R Stat Soc Series B Stat Methodol 1995;57(1):289–300.
- , , . The role of copy‐and‐paste in the hospital electronic health record. JAMA Intern Med. 2014;174(8):1217–1218.
- , , , . Quality of outpatient clinical notes: a stakeholder definition derived through qualitative research. BMC Health Serv Res. 2012;12:407.
- , , , et al. QNOTE: an instrument for measuring the quality of EHR clinical notes. J Am Med Inform Assoc. 2014;21(5):910–916.
- , , , . Assessing electronic note quality using the physician documentation quality instrument (PDQI‐9). Appl Clin Inform. 2012;3(2):164–174.
- , , , . Preliminary development of the physician documentation quality instrument. J Am Med Inform Assoc. 2008;15(4):534–541.
- , , , . Association of Medical Directors of Information Systems consensus on inpatient electronic health record documentation. Appl Clin Inform. 2013;4(2):293–303.
There are described advantages to documenting in an electronic health record (EHR).[1, 2, 3, 4, 5] There has been, however, an unanticipated decline in certain aspects of documentation quality after implementing EHRs,[6, 7, 8] for example, the overinclusion of data (note clutter) and inappropriate use of copy‐paste.[6, 7, 8, 9, 10, 11, 12, 13, 14, 15, 16, 17]
The objectives of this pilot study were to examine the effectiveness of an intervention bundle designed to improve resident progress notes written in an EHR (Epic Systems Corp., Verona, WI) and to establish the reliability of an audit tool used to assess the notes. Prior to this intervention, we provided no formal education for our residents about documentation in the EHR and had no policy governing format or content. The institutional review board at the University of Wisconsin approved this study.
METHODS
The Intervention Bundle
A multidisciplinary task force developed a set of Best Practice Guidelines for Writing Progress Notes in the EHR (see Supporting Information, Appendix 1, in the online version of this article). They were designed to promote cognitive review of data, reduce note clutter, promote synthesis of data, and discourage copy‐paste. For example, the guidelines recommended either the phrase, Vital signs from the last 24 hours have been reviewed and are pertinent for or a link that included minimum/maximum values rather than including multiple sets of data. We next developed a note template aligned with these guidelines (see Supporting Information, Appendix 2, in the online version of this article) using features and links that already existed within the EHR. Interns received classroom teaching about the best practices and instruction in use of the template.
Study Design
The study was a retrospective pre‐/postintervention. An audit tool designed to assess compliance with the guidelines was used to score 25 progress notes written by pediatric interns in August 2010 and August 2011 during the pre‐ and postintervention periods, respectively (see Supporting Information, Appendix 3, in the online version of this article).
Progress notes were eligible based on the following criteria: (1) written on any day subsequent to the admission date, (2) written by a pediatric intern, and (3) progress note from the previous day available for comparison. It was not required that 2 consecutive notes be written by the same resident. Eligible notes were identified using a computer‐generated report, reviewed by a study member to ensure eligibility, and assigned a number.
Notes were scored on a scale of 0 to 17, with each question having a range of possible scores from 0 to 2. Some questions related to inappropriate copy‐paste (questions 2, 9, 10) and a question related to discrete diagnostic language for abnormal labs (question 11) were weighted more heavily in the tool, as compliance with these components of the guideline was felt to be of greater importance. Several questions within the audit tool refer to clutter. We defined clutter as any additional data not endorsed by the guidelines or not explicitly stated as relevant to the patient's care for that day.
Raters were trained to score notes through practice sessions, during which they all scored the same note and compared findings. To rectify inter‐rater scoring discrepancies identified during these sessions, a reference manual was created to assist raters in scoring notes (see Supporting Information, Appendix 4, in the online version of this article). Each preintervention note was then systematically assigned to 2 raters, comprised of a physician and 3 staff from health information management. Each rater scored the note individually without discussion. The inter‐rater reliability was determined to be excellent, with kappa indices ranging from 88% to 100% for the 13 questions; each note in the postintervention period was therefore assigned to only 1 rater. Total and individual questions' scores were sent to the statistician for analysis.
Statistical Analysis
Inter‐rater reliability of the audit tool was evaluated by calculating the intraclass correlation (ICC) coefficient using a multilevel random intercept model to account for the rater effect.[18] The study was powered to detect an anticipated ICC of at least 0.75 at the 1‐sided 0.05 significance level, assuming a null hypothesis that the ICC is 0.4 or less. The total score was summarized in terms of means and standard deviation. Individual item responses were summarized using percentages and compared between the pre‐ and postintervention assessment using the Fisher exact test. The analysis of response patterns for individual item scores was considered exploratory. The Benjamini‐Hochberg false discovery rate method was utilized to control the false‐positive rate when comparing individual item scores.[19] All P values were 2‐sided and considered statistically significant at 0.05. Statistical analyses were conducted using SAS software version 9.2 (SAS Institute Inc., Cary, NC).
RESULTS
The ICC was 0.96 (95% confidence interval: 0.91‐0.98), indicating an excellent level of inter‐rater reliability. There was a significant improvement in the total score (see Supporting Information, Appendix 5, in the online version of this article) between the preintervention (mean 9.72, standard deviation [SD] 1.52) and postintervention (mean 11.72, SD 1.62) periods (P0.0001).
Table 1 shows the percentage of yes responses to each individual item in the pre‐ and postintervention periods. Our intervention had a significant impact on reducing vital sign clutter (4% preintervention, 84% postintervention, P0.0001) and other visual clutter within the note (0% preintervention, 28% postintervention, P=0.0035). We did not observe a significant impact on the reduction of input/output or lab clutter. There was no significant difference observed in the inclusion of the medication list. No significant improvements were seen in questions related to copy‐paste. The intervention had no significant impact on areas with an already high baseline performance: newly written interval histories, newly written physical exams, newly written plans, and the inclusion of discrete diagnostic language for abnormal labs.
| Question | Preintervention, N=25* | Postintervention, N=25 | P Value |
|---|---|---|---|
| |||
| 1. Does the note header include the name of the service, author, and training level of the author? | 0% | 68% | 0.0001 |
| 2. Does it appear that the subjective/emnterval history section of the note was newly written? (ie, not copied in its entirety from the previous note) | 100% | 96% | 0.9999 |
| 3. Is the vital sign section noncluttered? | 4% | 84% | 0.0001 |
| 4. Is the entire medication list included in the note? | 96% | 96% | 0.9999 |
| 5. Is the intake/output section noncluttered? | 0% | 16% | 0.3076 |
| 6. Does it appear that the physical exam was newly written? (ie, not copied in its entirety from the previous note) | 80% | 68% | 0.9103 |
| 7. Is the lab section noncluttered? | 64% | 44% | 0.5125 |
| 8. Is the imaging section noncluttered? | 100% | 100% | 0.9999 |
| 9. Does it appear that the assessment was newly written? | 48% | 28% | 0.5121 |
| 48% partial | 52% partial | 0.9999 | |
| 10. Does it appear that the plan was newly written or partially copied with new information added? | 88% | 96% | 0.9477 |
| 11. If the assessment includes abnormal lab values, is there also an accompanying diagnosis? (eg, inclusion of patient has hemoglobin of 6.2, also includes diagnosis of anemia) | 96% | 96% | 0.9999 |
| 12. Is additional visual clutter prevented by excluding other objective data found elsewhere in the chart? | 0% | 28% | 0.0035 |
| 13. Is the author's name and contact information (pager, cell) included at the bottom of the note? | 0% | 72% | 0.0001 |
DISCUSSION
Principal Findings
Improvements in electronic note writing, particularly in reducing note clutter, were achieved after the implementation of a bundled intervention. Because the intervention is a bundle, we cannot definitively identify which component had the greatest impact. Given the improvements seen in some areas with very low baseline performance, we hypothesize that these are most attributable to the creation of a compliant note template that (1) guided authors in using data links that were less cluttered and (2) eliminated the use of unnecessary links (eg, pain scores and daily weights). The lack of similar improvements in reducing input/output and lab clutter may be due to the fact that even with changes to the template suggesting a more narrative approach to these components, residents still felt compelled to use data links. Because our EHR does not easily allow for the inclusion of individual data elements, such as specific drain output or hemoglobin as opposed to a complete blood count, residents continued to use links that included more data than necessary. Although not significant findings, there was an observed decline in the proportion of notes containing a physical exam not entirely copied from the previous day and containing an assessment that was entirely new. These findings may be attributable to having a small sample of authors, a few of whom in the postintervention period were particularly prone to using copy‐paste.
Relationship to Other Evidence
The observed decline in quality of provider documentation after implementation of the EHR has led to a robust discussion in the literature about what really constitutes a quality provider note.[7, 8, 9, 10, 20] The absence of a defined gold standard makes research in this area challenging. It is our observation that when physicians refer to a decline in quality documentation in the EHR, they are frequently referring to the fact that electronically generated notes are often unattractive, difficult to read, and seem to lack clinical narrative.
Several publications have attempted to define note quality. Payne et al. described physical characteristics of electronically generated notes that were deemed more attractive to a reader, including a large proportion of narrative free text.[15] Hanson performed a qualitative study to describe outpatient clinical notes from the perspective of multiple stakeholders, resulting in a description of the characteristics of a quality note.[21] This formed the basis for the QNOTE, a validated tool to measure the quality of outpatient notes.[22] Similar work has not been done to rigorously define quality for inpatient documentation. Stetson did develop an instrument, the Physician Documentation Quality Instrument (PDQI‐9) to assess inpatient notes across 9 attributes; however, the validation method relied on a gold standard of a general impression score of 7 physician leaders.[23, 24]
Although these tools aim to address overall note quality, an advantage provided by our audit tool is that it directly addresses the problems most attributable to documenting in an EHR, namely note clutter and copy‐paste. A second advantage is that clinicians and nonclinicians can score notes objectively. The QNOTE and PDQI‐9 still rely on subjective assessment and require that the evaluator be a clinician.
There has also been little published about how to achieve notes of high quality. In 2013, Shoolin et al. did publish a consensus statement from the Association of Medical Directors of Information Systems outlining some guidelines for inpatient EHR documentation.[25] Optimal strategies for implementing such guidelines, however, and the overall impact such an implementation would have on improving note writing has not previously been studied. This study, therefore, adds to the existing body of literature by providing an example of an intervention that may lead to improvements in note writing.
Limitations
Our study has several limitations. The sample size of notes and authors was small. The short duration of the study and the assessment of notes soon after the intervention prevented an assessment of whether improvements were sustained over time.
Unfortunately, we were not evaluating the same group of interns in the pre‐ and postintervention periods. Interns were chosen as subjects as there was an existing opportunity to do large group training during new intern orientation. Furthermore, we were concerned that more note‐writing experience alone would influence the outcome if we examined the same interns later in the year.
The audit tool was also a first attempt at measuring compliance with the guidelines. Determination of an optimal score/weight for each item requires further investigation as part of a larger scale validation study. In addition, the cognitive review and synthesis of data encouraged in our guideline were more difficult to measure using the audit tool, as they require some clinical knowledge about the patient and an assessment of the author's medical decision making. We do not assert, therefore, that compliance with the guidelines or a higher total score necessarily translates into overall note quality, as we recognize these limitations of the tool.
Future Directions
In conclusion, this report is a first effort to improve the quality of note writing in the EHR. Much more work is necessary, particularly in improving the clinical narrative and inappropriate copy‐paste. The examination of other interventions, such as the impact of structured feedback to the note author, whether by way of a validated scoring tool and/or narrative comments, is a logical next step for investigation.
ACKNOWLEDGEMENTS
The authors acknowledge and appreciate the support of Joel Buchanan, MD, Ellen Wald, MD, and Ann Boyer, MD, for their contributions to this study and manuscript preparation. We also acknowledge the members of the auditing team: Linda Brickert, Jane Duckert, and Jeannine Strunk.
Disclosure: Nothing to report.
- , , . Use of computer‐based records, completeness of documentation, and appropriateness of documented clinical decisions. J Am Med Inform Assoc. 1999;6(3):245–251.
- , , , et al. An automated model to identify heart failure patients at risk for 30‐day readmission or death using electronic medical record data. Med Care. 2010;48(11):981–988.
- , , , , . Clinical information technologies and inpatient outcomes: a multiple hospital study. Arch Intern Med. 2009;169(2):108–114.
- , , , , . Identifying patients with diabetes and the earliest date of diagnosis in real time: an electronic health record case‐finding algorithm. BMC Med Inform Decis Mak. 2013;13:81.
- , , , et al. Relationship between use of electronic health record features and health care quality: results of a statewide survey. Med Care. 2010;48(3):203–209.
- , , , , , . Impacts of computerized physician documentation in a teaching hospital: perceptions of faculty and resident physicians. J Am Med Inform Assoc. 2004;11(4):300–309.
- , . Off the record—avoiding the pitfalls of going electronic. N Engl J Med. 2008;358(16):1656–1658.
- . A piece of my mind. Copy‐and‐paste. JAMA. 2006;295(20):2335–2336.
- , . Copy and paste: a remediable hazard of electronic health records. Am J Med. 2009;122(6):495–496.
- , , , , , . Physicians' attitudes towards copy and pasting in electronic note writing. J Gen Intern Med. 2009;24(1):63–68.
- . Improving the electronic health record—are clinicians getting what they wished for? JAMA. 2013;309(10):991–992.
- , , . Copying and pasting of examinations within the electronic medical record. Int J Med Inform. 2007;76(suppl 1):S122–S128.
- . The evolving medical record. Ann Intern Med. 2010;153(10):671–677.
- , , , , , . Direct text entry in electronic progress notes. An evaluation of input errors. Methods Inf Med. 2003;42(1):61–67.
- , , , . The physical attractiveness of electronic physician notes. AMIA Annu Symp Proc. 2010;2010:622–626.
- , . Copy‐and‐paste‐and‐paste. JAMA. 2006;296(19):2315; author reply 2315–2316.
- , , , . Are electronic medical records trustworthy? Observations on copying, pasting and duplication. AMIA Annu Symp Proc. 2003:269–273.
- , . Hierarchical Linear Models: Applications and Data Analysis Methods. 2nd ed. Thousand Oaks, CA: Sage; 2002.
- , . Controlling the false discovery rate: a practical and powerful approach for multiple testing. J R Stat Soc Series B Stat Methodol 1995;57(1):289–300.
- , , . The role of copy‐and‐paste in the hospital electronic health record. JAMA Intern Med. 2014;174(8):1217–1218.
- , , , . Quality of outpatient clinical notes: a stakeholder definition derived through qualitative research. BMC Health Serv Res. 2012;12:407.
- , , , et al. QNOTE: an instrument for measuring the quality of EHR clinical notes. J Am Med Inform Assoc. 2014;21(5):910–916.
- , , , . Assessing electronic note quality using the physician documentation quality instrument (PDQI‐9). Appl Clin Inform. 2012;3(2):164–174.
- , , , . Preliminary development of the physician documentation quality instrument. J Am Med Inform Assoc. 2008;15(4):534–541.
- , , , . Association of Medical Directors of Information Systems consensus on inpatient electronic health record documentation. Appl Clin Inform. 2013;4(2):293–303.
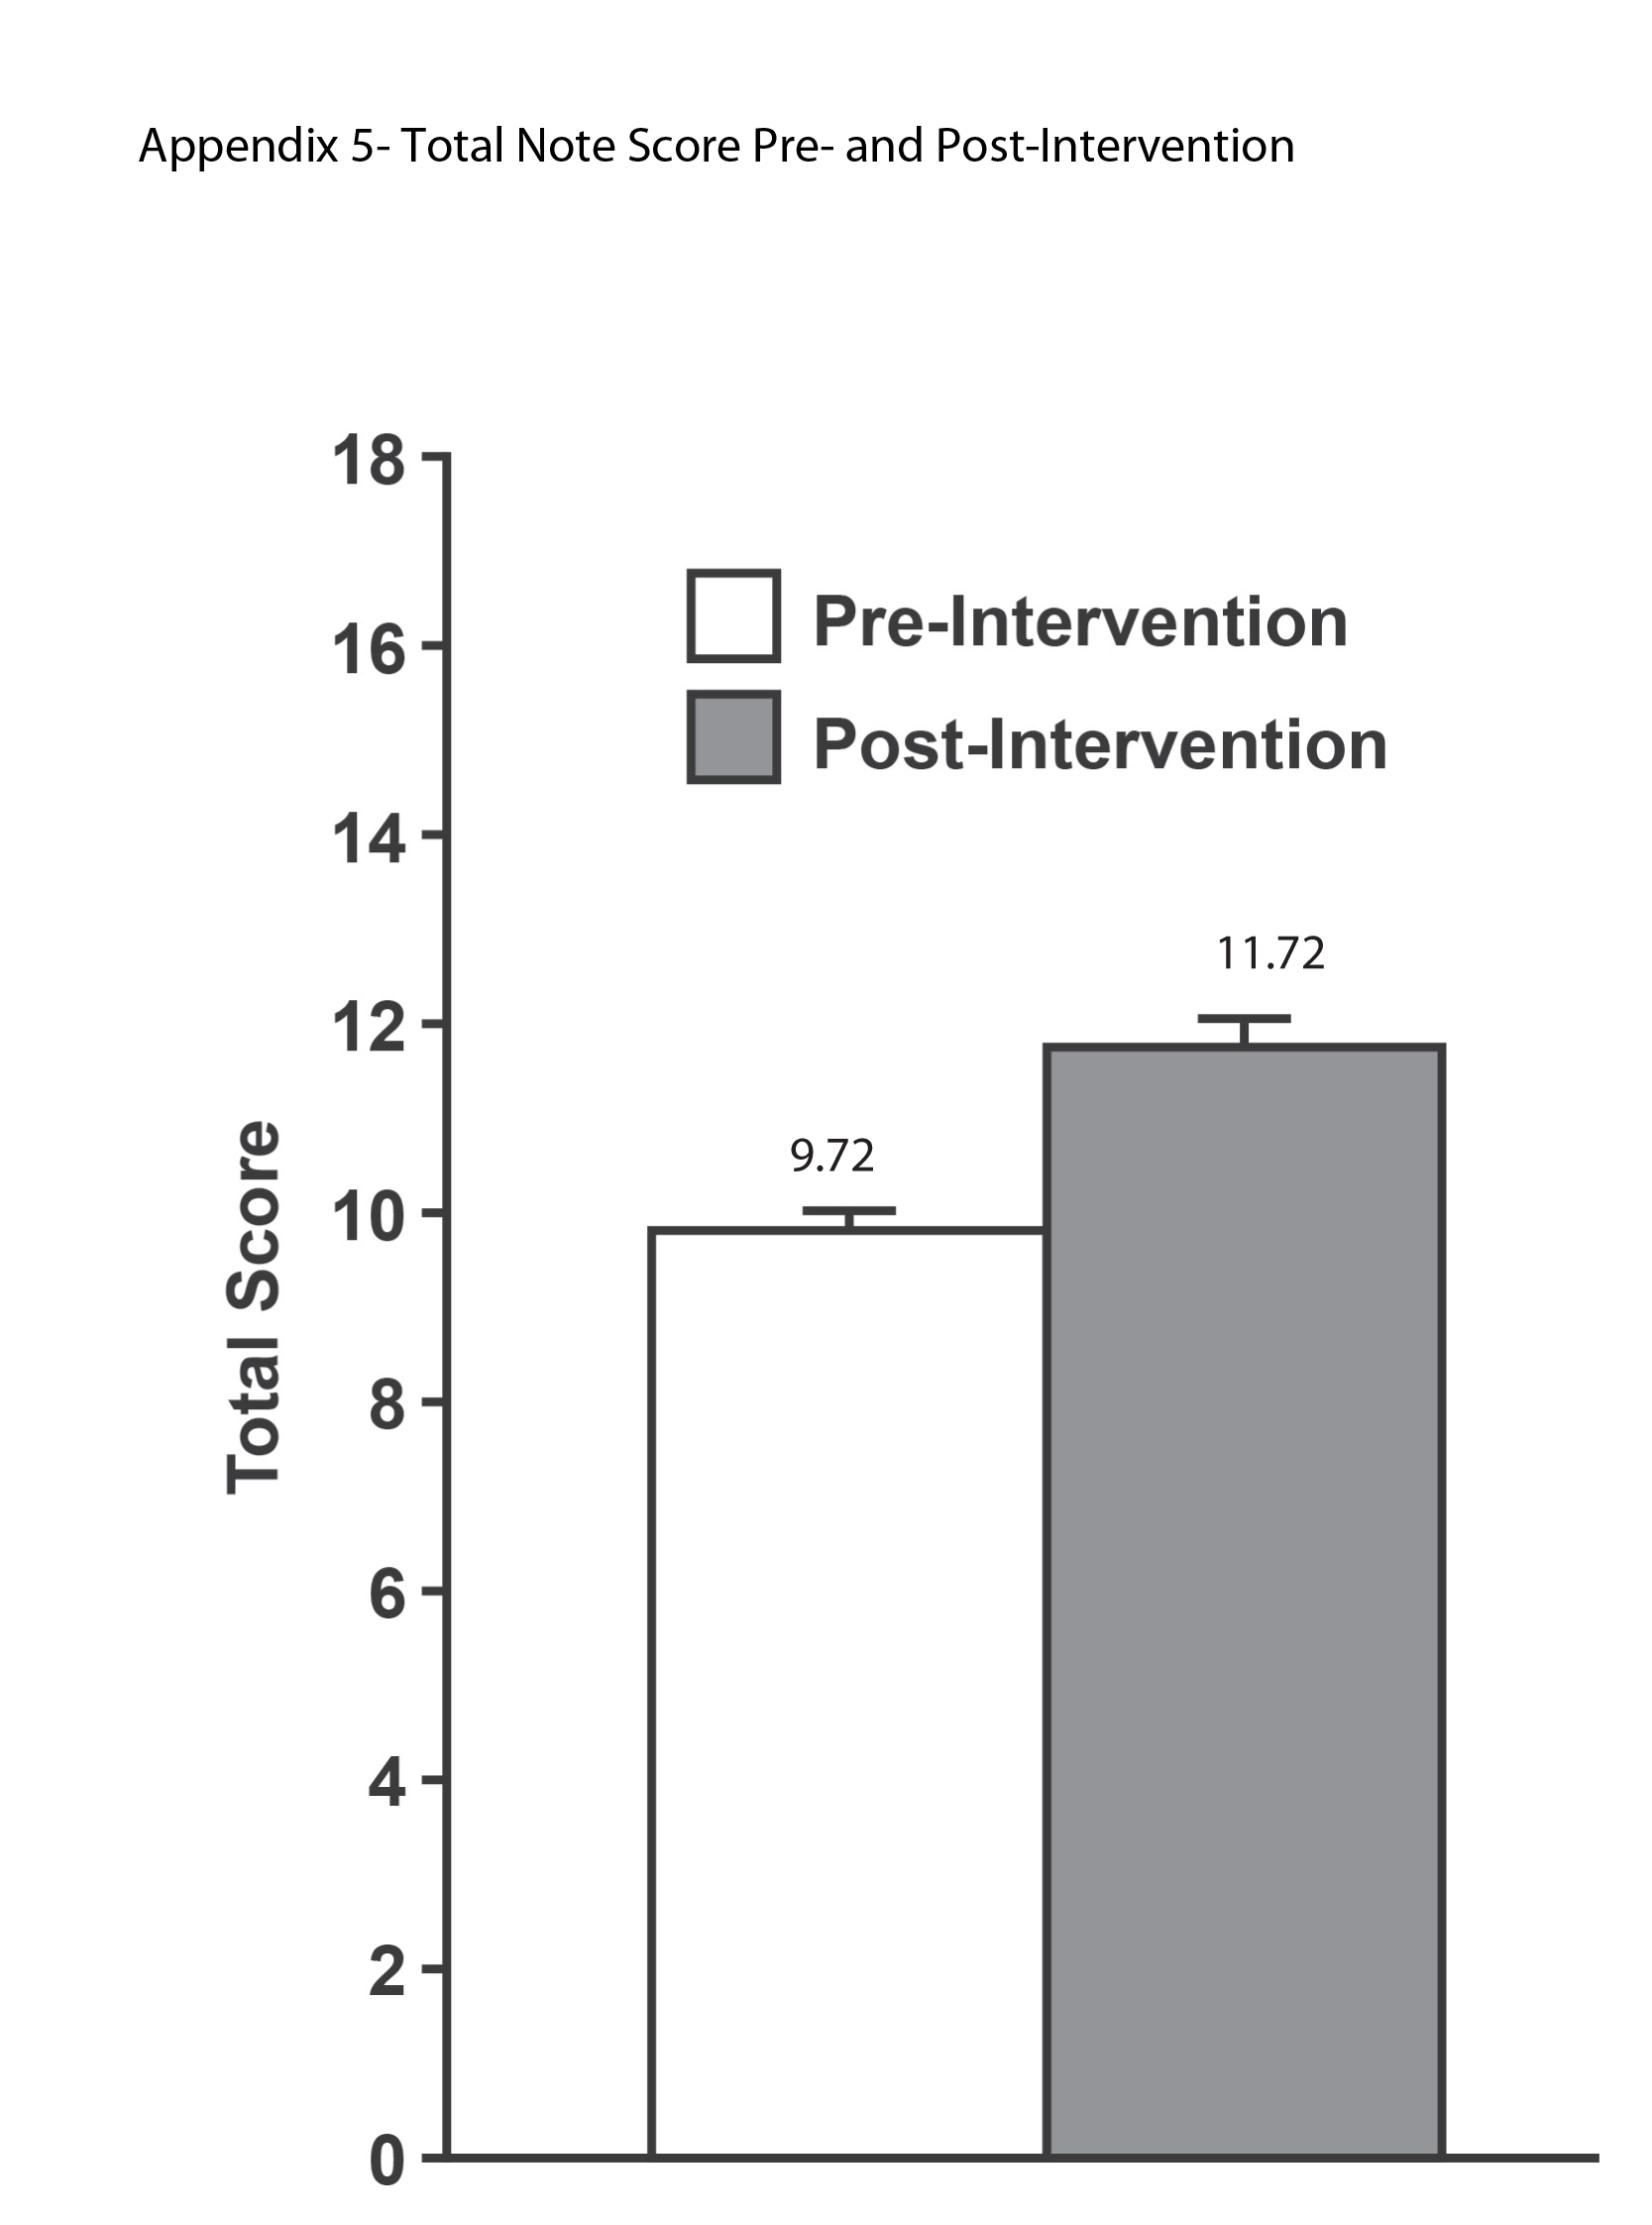
Severe‐Sepsis Screening Tool
Sepsis remains a significant healthcare burden and is the sixth most common reason for hospitalization in the United States. For patients presenting with severe sepsis, mortality rates are approximately 30%,[1, 2] and sepsis remains the most expensive reason for hospitalization. In 2009, septicemia accounted for nearly $15.4 billion in aggregate hospital costs.[2]
Early identification of sepsis and the timely implementation of goal‐directed therapy significantly decrease sepsis‐related mortality and are cost‐effective,[3, 4, 5] highlighting the need for new clinical strategies to aid in early diagnosis. To date, most studies have focused on the screening and management of sepsis in the emergency department and intensive care unit (ICU),[6, 7] and less is known about the benefits of screening in non‐ICU settings. In the non‐ICU setting, conditions may go unrecognized and treatments delayed. Evidence suggests that patients diagnosed with severe sepsis in the non‐ICU setting are almost twice as likely to die as those diagnosed in an emergency department.[8, 9]
Application of a sepsis screening tool to both medical and surgical patients poses an additional challenge that may impact the screen's performance. The specificity may be compromised by noninfectious causes of systemic inflammatory response syndrome (SIRS) commonly seen in the postsurgical patient. For example, the tachycardia and fever often seen in the postoperative patient are sufficient to qualify for SIRS, making the diagnosis of sepsis more challenging. The purpose of this study was to examine the performance of a nurse‐driven, simple sepsis screening tool in a mixed medical and surgical non‐ICU setting.
METHODS
Setting
This was an observational pilot study of prospectively screened patients admitted to a 26‐bed medical/surgical intermediate care unit with telemetry monitoring in a 613‐bed university tertiary referral hospital over a 1‐month time period. The surgical patient population of this floor consisted of cardiothoracic (50%), general (24%), and vascular surgery (17%) patients as well as a small number of trauma (7%) patients. The medical patient population admitted to this unit included pretransplant and complex medical patients requiring telemetry monitoring. Though the incidence of sepsis specific to this unit was unknown prior to the study, after an analysis of discharges the study team surmised there would be sufficient volume for testing of a nurse‐based screening tool.
Nurse Education
Registered nurses (RNs) working on the study unit had an average of 5 to 7 years of experience. The all‐RN unit was staffed predominantly at a 1:3 RN to patient ratio. RNs were supported by a clinical nurse specialist (CNS) and clinical educator (CE) RN who provided regular ongoing education about infection prevention and identification of common conditions that are seen on the unit.
In the 6 months prior to our sepsis screening initiative, nursing staff had been given more than 8 hours of education on infection‐ and sepsis‐related topics in 15‐ to 20‐minute blocks of time. This dedicated education took place during the nurses' shift in groups of 2 to 3, and was run by the CNS, assistant nurse manager, and CE RN. Nurses were also encouraged to attend an optional 8‐hour sepsis continuing medical education (CME) program. Approximately 20% of the nurses on the study unit attended.
Just prior to the pilot study, nursing staff completed a 1‐hour refresher self‐study module on severe sepsis stressing the importance of early identification. There was also a training month prior to the actual data collection time frame, where unit core trainers (RNs) or champions who had attended the optional 8‐hour sepsis CME conducted 1:1 follow‐up with each RN, reviewing at least 1 of their screens to validate understanding of screening concepts. Each RN was checked off after correctly completing a screen. During the study, unit educators and the CNS provided additional on‐unit in‐service training with screening tool completion instructions and advice on how to incorporate the tool into the RN's current assessment workflow. In addition, the charge nurses were asked to review the screens collected each shift and validate any that may have seemed inconsistent with the RN's verbal report of the patient's status.
The university's institutional review board notice of determination waived review for this study because it was classified as quality improvement.
Screening Tool
A sepsis screening tool was developed as part of a broader initiative to improve sepsis‐related morbidity and mortality at our hospital. The screening tool was adapted from the severe sepsis screening tool created by the Surviving Sepsis Campaign and Institute for Healthcare Improvement,[10] and consisted of a simple 3‐tiered paper‐based screening assessment that was to be completed by the bedside RN (Figure 1). RNs on the pilot medical/surgical intermediate care unit performed the screening assessment with their regular patient assessment at the beginning of each shift.
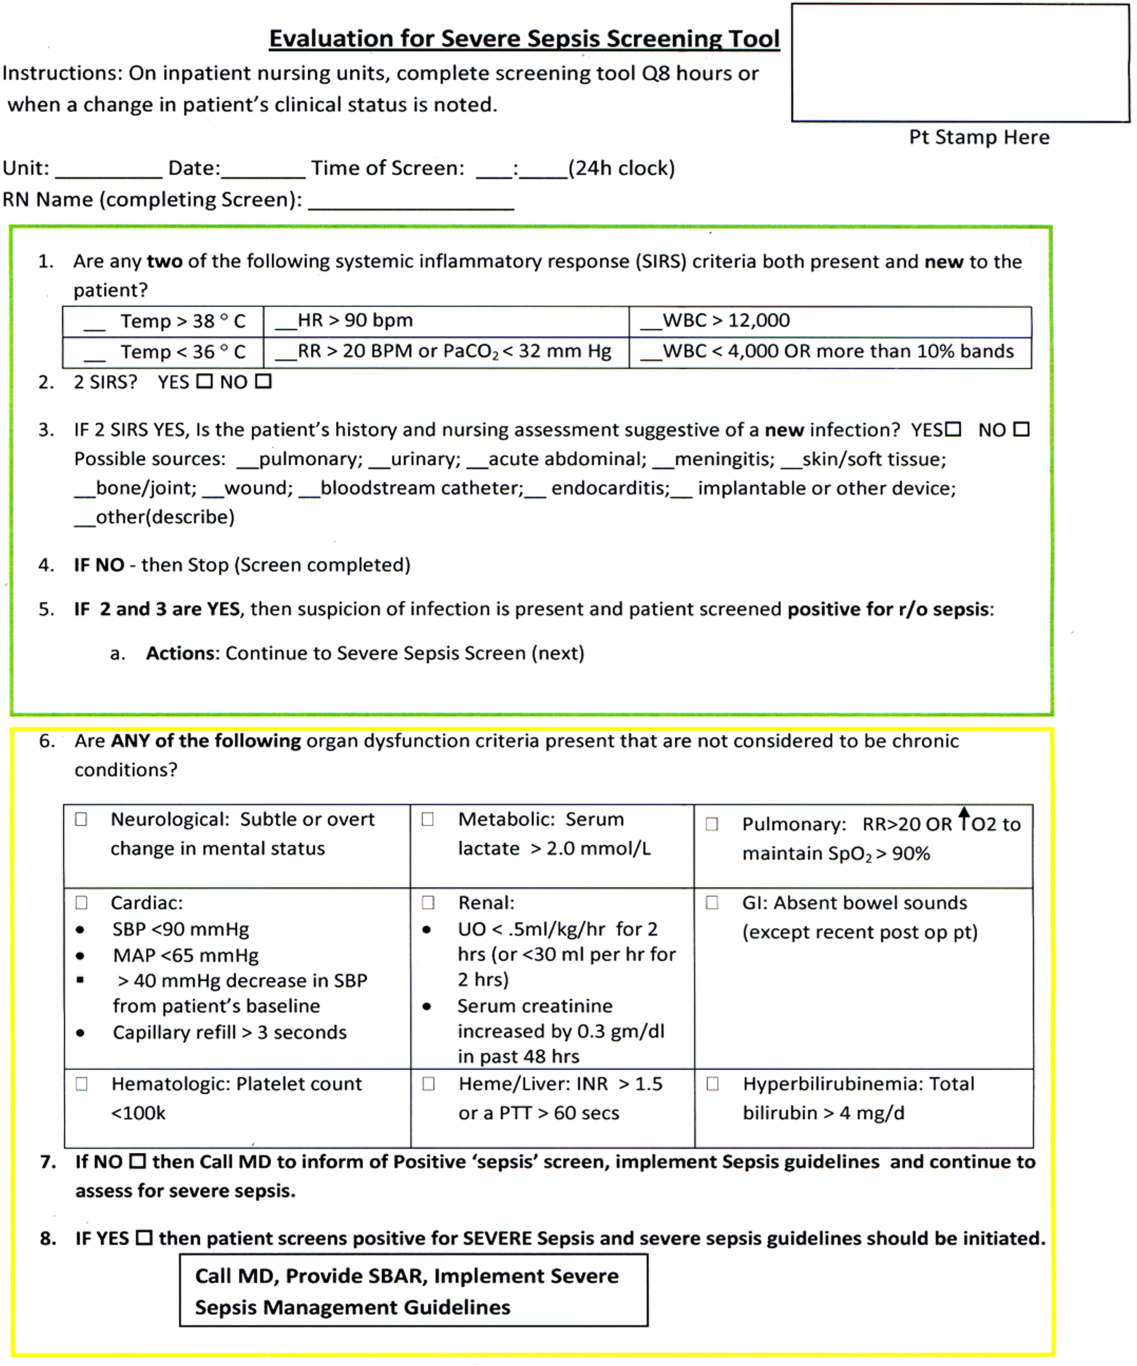
The first tier of the tool screened for the presence of SIRS. Positive parameters included heart rate >90, temperature >38C or <36C, white blood cell count >12,000 or<4000 or >10% bands, and/or respiratory rate >20 or partial pressure of carbon dioxide (PaCO2) <32 mm Hg. To decrease the number of false‐positive screens in patients whose abnormal vitals could already be attributed to a condition other than sepsis, these symptoms were only scored if they had emerged within the previous 8 hours.
If patients met 2 SIRS criteria, the nurse would move to the second tier of the tool, which involved consideration of possible infection as a contributor to a patient's clinical condition as well as a source of infection. If infection was not suspected, further screening was terminated. If infection was suspected, the patient then met criteria for a positive sepsis screen, and a third tier of screening involving assessment of organ dysfunction was initiated.
If the patient screened positive for sepsis (2 SIRS and suspicion for new infection) or severe sepsis (sepsis with end‐organ dysfunction), nurses were instructed to document this in the patient's electronic medical record (EMR) and call the primary team to initiate actions following the hospital‐wide sepsis guidelines. Any subsequent actions were recorded in the patient's EMR.
Data Collection
Completed sepsis screening forms during the month of October 2010 were reviewed by the authors (E.G., L.S., and P.M.). Data including age, gender, International Classification of Diseases, Ninth Revision (ICD‐9) admission and discharge diagnoses, vital signs, lab results, clinical interventions, and documented clinical decision processes by healthcare staff were collected on patients with a positive screen or those who did not screen positive but had an ICD‐9 code for sepsis, severe sepsis, or septic shock during their hospitalization or at discharge. We also collected demographic and clinical data for a random sample of patients who consistently screened negative for sepsis.
Performance Measurement
The sensitivity and specificity of the screening tool was determined by identifying true‐positive, false‐positive, true‐negative, and false‐negative results and calculating accordingly using a 2 2 contingency table. True positives were defined as cases where patients screened positive for sepsis and had a documented diagnosis of sepsis in their EMR within 24 hours of the positive screening or had an ICD‐9 billing code for sepsis. False‐positive cases were those in which patients screened positive for sepsis but did not have a diagnosis of sepsis by manual chart review nor was there an ICD‐9 code for sepsis for their hospital stay. True‐negative cases were those where patients screened negative and did not have an ICD‐9 code for sepsis. False negatives were cases where patients consistently screened negative for sepsis but had an ICD‐9 code for sepsis.
Clinical Activities
To examine the impact of a positive sepsis screen on subsequent clinical action, we assessed the frequency with which a treatment or diagnostic workup was initiated after a positive screen and compared this to clinical activity initiated after a negative screen. Specifically, the patient's EMR was reviewed for actions including measurement of lactate, blood cultures, administration of broad spectrum antibiotics, administration of fluid boluses, or consultation with or transfer to the ICU. These actions were chosen because they are part of the Surviving Sepsis Bundle, which has been demonstrated to improve mortality rates after diagnosis of severe sepsis or septic shock,[11, 12] and can be done outside of an ICU setting. Because screening was done every 8 hours, clinical activity was only attributed to a positive or negative sepsis screen if it occurred within 8 hours of the screening result. Patients were excluded if there were missing data points that precluded full analysis of their clinical course.
Statistical Analysis
To compare the performance of the screening tool between surgical and medical patients, we calculated 95% confidence intervals of screening test sensitivity and specificity. To test if performance was significantly different between these groups, we performed a nonparametric, 2‐sided, 2‐sample test of proportions. Though similar to a [2] test, the 2‐sided test of proportions allowed us to determine if there was a directional difference in test performance (ie, Does the screening tool perform better or worse in a certain patient group?). We also used the test of proportions to compare differences in the proportion of patients receiving sepsis‐related interventions before and after a positive or negative screening result. For comparisons of demographic variables we used nonparametric tests including the [2] test for categorical variables and the Kruskal‐Wallis test for continuous variables. We used SAS 9.3 (SAS Institute Inc., Cary, NC) to perform our analyses.
RESULTS
Over a 1‐month time period, 2143 screens were completed on 245 patients (169 surgical, 76 medical). The overall incidence of sepsis on the treatment unit during this time period was 9%. Surgical patients had an 8.9% incidence of sepsis, and medical patients had an incidence of 9.2%.
Screening tool performance is presented in Table 1. The screening tool had 95.5% sensitivity and 91.9% specificity, with no significant differences in performance between surgical and medical patients. The overall negative predictive value was 99.5%, also with comparable performance in both surgical and medical patients (P = 0.89). The overall positive predictive value (PPV) was 70% in medical patients and 48% in surgical patients (P = 0.12). Screening tool accuracy for medical and surgical patients was 92%.
| Overall, N = 245 (95% CI) | Surgery, N = 169 (95% CI) | Medicine, N = 76 (95% CI) | P Value* | |
|---|---|---|---|---|
| ||||
| Sensitivity | 95.5% (75%‐99.7%) | 93% (66%‐99.6%) | 100% (56%‐100%) | 0.17 |
| Specificity | 91.9% (87%‐95%) | 90% (84%‐94%) | 95% (87%‐99%) | 0.48 |
| NPV | 99.5% (81%‐100%) | 99.3% (71%‐100%) | 100% (67%‐100%) | 0.89 |
| PPV | 53.8% (39%‐70%) | 48% (23%‐73%) | 70% (30%‐100%) | 0.12 |
| LR+ | 11.8 | 9.3 | 20 | |
| LR | 0.05 | 0.08 | 0 | |
| Confirmed patient diagnosis, overall | ||||
| Sepsis | No sepsis | |||
| Screen positive | 21 (TP) | 18 (FP) | ||
| Screen negative | 1 (FN) | 205 (TN) | ||
| Confirmed patient diagnosis, medicine | ||||
| Sepsis | No sepsis | |||
| Screen positive | 7 (TP) | 3 (FP) | ||
| Screen negative | 0 (FN) | 66 (TN) | ||
| Confirmed patient diagnosis, surgery | ||||
| Sepsis | No sepsis | |||
| Screen positive | 14 (TP) | 15 (FP) | ||
| Screen negative | 1 (FN) | 139 (TN) | ||
Clinical Activities
Of the 39 patients who screened positive for sepsis, nurses classified 20 with sepsis and 19 with severe sepsis. Of these 39 patients, 33 were included in our descriptive analysis of the effect of positive screening results on clinical activity (3 were excluded for admission for sepsis and 3 for missing data). As a comparison, we randomly selected 30 patients of the 206 patients who screened negative for sepsis to evaluate clinical activity before and after a negative screen.
Characteristics of patients screening positive and negative for sepsis are reported in Table 2. We found no statistically significant differences in age, sex, length of hospital stay, or mortality amongst all groups.
| Patient Characteristics | Surgery (Positive) | Medicine (Positive) | Surgery (Negative) | Medicine (Negative) | P Value |
|---|---|---|---|---|---|
| |||||
| No. | 26 | 7 | 20 | 10 | |
| Age, y, mean | 57.8 ( 16.5) | 72.4 ( 16.8) | 64.6 ( 19.4) | 63.6 ( 16.8) | 0.25 |
| % Male (no.) | 50% (13) | 57% (4) | 60% (12) | 60% (6) | 0.27 |
| Length of stay, d, median (IQR) | 9 (716.7) | 7 (5.511.5) | 11 (7.722) | 8 (421) | 0.38 |
| No. of PODs until first positive screen, d, median (IQR) | 2 (13) | N/A | N/A | N/A | |
| % Mortality (no.) | 0% | 14% (1) | 5% (1) | 10% (1) | 0.19 |
Figure 2 illustrates differences in the proportion of patients receiving a clinical action before and after a negative or positive screening test result. In the cohort of 33 patients screening positive for sepsis, clinical action after a positive screen was taken in 4 of the 7 (50%) medical patients and 11 of 26 (42%) surgical patients. In patients screening negative for sepsis we found only 1 incident in which a sepsis‐related action was taken after a negative screen. In this case the patient was admitted to the ICU within 8 hours of a negative screen, though there was no explicit documentation that sepsis was the reason for this admission.
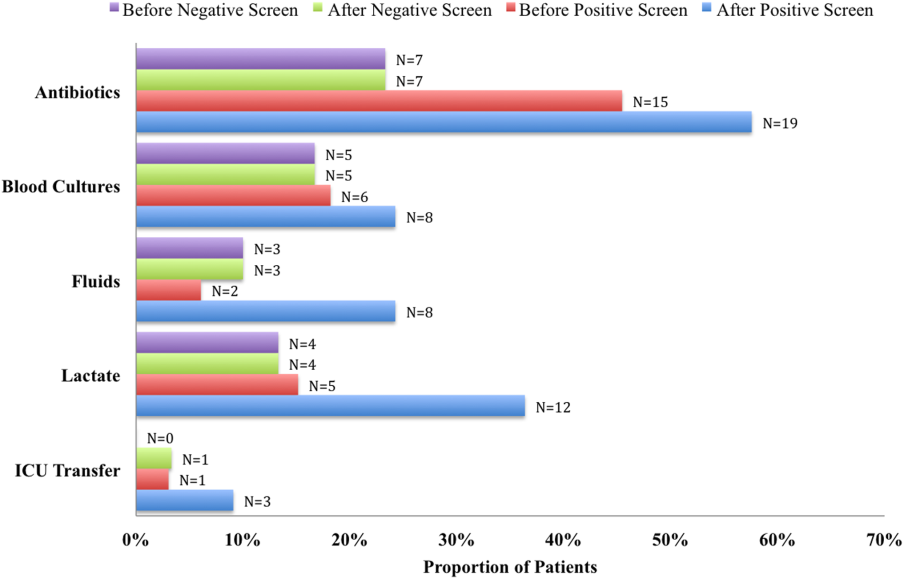
We compared the proportion of patients receiving sepsis‐related treatment before either a negative or positive screen and found no significant difference (Table 3). We then compared the proportion of patients receiving sepsis‐related actions after a positive or negative screening test result and found that the proportion of patients receiving antibiotics, blood cultures, and lactate measurement was significantly higher for patients with a positive sepsis screening result compared to those with a negative screening result (Table 3).
| Intervention and Group | Proportion | P Value |
|---|---|---|
| ||
| Before screening test | ||
| Antibiotics | 0.066 | |
| Positive screen | 45% | |
| Negative screen | 23% | |
| Lactate | 0.837 | |
| Positive screen | 15% | |
| Negative screen | 13% | |
| Blood culture | 0.181 | |
| Positive screen | 18% | |
| Negative screen | 17% | |
| Fluid administration | 0.564 | |
| Positive screen | 6% | |
| Negative screen | 10% | |
| ICU transfer/consult | 0.337 | |
| Positive screen | 3% | |
| Negative screen | 0% | |
| After screening test | ||
| Antibiotics | 0.006 | |
| Positive screen | 58% | |
| Negative screen | 23% | |
| Lactate | 0.018 | |
| Positive screen | 36% | |
| Negative screen | 13% | |
| Blood Culture | 0.002 | |
| Positive screen | 24% | |
| Negative screen | 17% | |
| Fluid administration | 0.112 | |
| Positive screen | 24% | |
| Negative screen | 10% | |
| ICU transfer/consult | 0.175 | |
| Positive screen | 9% | |
| Negative screen | 3% | |
DISCUSSION
Improving recognition and time to treatment of sepsis in a non‐ICU setting is an important step toward decreasing sepsis‐related mortality. Lundberg and colleagues found that mortality rates for patients diagnosed with septic shock on a general ward were higher than for patients diagnosed in the ICU, even though ward patients were younger and healthier at baseline.[8] For ward patients, treatment delays were most profound in initiating vasoactive therapies, and minor delays were encountered in initiating fluid resuscitation. In their international study on the impact of early goal‐directed therapy guidelines, Levy and colleagues found that patients diagnosed with severe sepsis on the wards were almost twice as likely to die as patients diagnosed with sepsis in the emergency department.[9]
We are the first to report about an accurate nurse‐driven SIRS‐based sepsis screening protocol that is effective in the early identification of sepsis in both medical and surgical patients in an intermediate care setting. We found no significant difference in the screening tool performance between the medical and surgical cohorts. This is an important comparison given that SIRS criteria alone can be nonspecific in the postoperative population, where it is common to have hemodynamic changes, elevation of inflammatory markers, and fevers from noninfectious sources.
Our sepsis screening tool was designed in 3 tiers to improve its specificity. The first tier was based strictly on SIRS criteria (eg, tachycardia or fever), whereas the second and third tiers served to increase the specificity of the screening tool by instructing the evaluator to assess possible sources of infection and assess for objective signs of organ dysfunction. We relied heavily on the nursing staff to assess for the presence or absence of infection and believe that the educational component prior to initiating the screening protocol was vital.
EMR‐based screening tools that rely purely on physiologic data have been considered for the early detection and management of sepsis, although they lack the specificity gained through the incorporation of clinical judgment.[13] Sawyer and colleagues report using a real‐time EMR‐based method for early sepsis detection in non‐ICU patients that is based solely on objective measures; however, their PPV was only 19.5%. The model we describe in this study is one that incorporates real‐time physiologic data available from an EMR coupled with the clinical judgment of a bedside registered nurse. As our data suggest, this provides a screen that is both sensitive and specific.
It is interesting to note that in our assessment of clinical action taken 8 hours after a positive screening test (the interval after which a new screening test was performed), the rate of diagnostic workup and/or treatment for sepsis was relatively low. One reason for this could have been that the treating team had suspicion for sepsis prior to a positive screen and had already initiated clinical action. Of the 51 recorded clinical actions taken around the time of a positive screen, the majority (67%) occurred before the screening result. It is also possible that clinical action was not pursued because the treatment team disagreed with a diagnosis of sepsis. Of all the false positive screening cases, manual chart review confirmed that these patients did not have sepsis, nor did they develop sepsis during their index hospital stay. Last, we only recorded clinical actions taken within 8 hours of the first positive screen for sepsis and measured 5 very specific actions. Thus, our analysis may have missed actions taken after 8 hours or actions that differed from the 5 we chose to assess.
Even with the apparently low levels of new clinical activity after a positive screen, when compared to patients who screened negative for sepsis, a significantly higher number of patients who had a positive screen received antibiotics, had lactate measured, and had blood cultures drawn. We did not find a significant difference in the proportion of patients receiving a sepsis‐related clinical action before a screening result (positive or negative), which suggests that a positive screening test may have led to increased clinical action.
A limitation of our study is its small size and that it was conducted in 1 pilot unit. Additionally, our retrospective analysis of clinical care inhibited our ability to fully understand a patient's clinical course or retrieve missing data points. A related limitation is that we could not ascertain how often the screening tool did not identify a case of sepsis before it was clinically diagnosed. Assessing the temporal performance of our screening tool is of great interest and may be more easily performed using an electronic version of the screening tool, which is currently in development.
Using ICD‐9 codes to determine the true‐negative cohort is another limitation of our study. It is well documented that use of administrative data can lead to inaccurate classification of patients.[14] To address this, we performed random audits of 30 test‐negative patients. In doing so we did not find any errors in classification.
Although we did not find a significant difference in screening tool performance between surgical and medical patients, the PPV of the tool was lower in the surgical population (48%) compared to the medical population (70%). The lower PPV observed in surgical patients could be attributable to an overall lower incidence of sepsis in this cohort as well as possible errors in initial assessment of infection, which can be difficult in postsurgical patients. Our retrospective analysis included data from the early months of the screening protocol, a time in which nursing staff was still developing clinical acumen in identifying sepsis. However, this could have led nurses to either overestimate or underestimate the presence of infection in either patient group.
Suspicion for infection is the cornerstone definition of sepsis, and in our screening protocol nurses were charged with making this decision based on their knowledge of the patient's clinical course and current status. Issues concerning nurses' recognition of infection symptoms are an area of opportunity for further research and education and could aid in improving PPV. Clinical judgment could be further bolstered by adding promising laboratory tests such as C‐reactive protein or procalcitonin as objective adjuncts to an initial assessment for sepsis,[15] which could potentially increase screening test PPV.
CONCLUSIONS
A simple screening tool for sepsis performed by the bedside nurse can provide a means to successfully identify sepsis early and lead to more timely diagnostics and treatment in both medical and surgical patients in an intermediate care setting.
ACKNOWLEDGEMENTS
The authors thank Eileen Pummer, quality manager for the sepsis team; Pauline Regner, patient care manager of the pilot study unit; and the nurses who contributed to the screening tool design team and data collection. The authors acknowledge Pooja Loftus for her statistical expertise, and Isabella Chu for her review of the manuscript. Disclosures: Presented as a poster at the 31st Annual Meeting of the Surgical Infection Society, Palm Beach, Florida, May 2011. The authors report no conflicts of interest.
- , , , , , Epidemiology of severe sepsis in the United States: analysis of incidence, outcome, and associated costs of care. Crit Care Med. 2001;29(7):1303–1310.
- , , Septicemia in U.S. hospitals, 2009. HCUP statistical brief #122. Agency for Healthcare Research and Quality. Available at: http://www.hcup-us.ahrq.gov/reports/statbriefs/sb122.pdf. Published October 2011. Accessed on September 4, 2012.
- , , , Economic implications of an evidence‐based sepsis protocol: can we improve outcomes and lower costs? Crit Care Med. 2007;35(5):1257–1262.
- , , , , , Late compliance with the sepsis resuscitation bundle: impact on mortality. Shock. 2011;36(6):542–547.
- , , , , , The costs and cost‐effectiveness of an integrated sepsis treatment protocol. Crit Care Med. 2008;36(4):1168–1174.
- , , A simple prediction algorithm for bacteraemia in patients with acute febrile illness. QJM. 2005;98(11):813–820.
- , , , et al. Validation of a screening tool for the early identification of sepsis. J Trauma. 2009;66(6):1539–1546; discussion 1546–1547.
- , , , et al. Septic shock: an analysis of outcomes for patients with onset on hospital wards versus intensive care units. Crit Care Med. 1998;26(6):1020–1024.
- , , , et al. The Surviving Sepsis Campaign: results of an international guideline‐based performance improvement program targeting severe sepsis. Crit Care Med. 2010;38(2):367–374.
- Institute of Healthcare Improvement. Evaluation for severe sepsis screening tool. Surviving Sepsis Campaign. Available at: http://www.survivingsepsis.org/About_the_Campaign/Documents/evaluationforseveresepsisscreeningtool.pdf. Accessed on September 30, 2012.
- , , , et al. Impact of the Surviving Sepsis Campaign protocols on hospital length of stay and mortality in septic shock patients: results of a three‐year follow‐up quasi‐experimental study. Crit Care Med. 2010;38(4):1036–1043.
- , , , et al. Reduction of the severe sepsis or septic shock associated mortality by reinforcement of the recommendations bundle: a multicenter study. Ann Fr Anesth Reanim. 2010;29(9):621–628.
- , , , et al. Implementation of a real‐time computerized sepsis alert in nonintensive care unit patients. Crit Care Med. 2011;39(3):469–473.
- , , , Accuracy of administrative data for identifying patients with pneumonia. Am J Med Qual. 2005;20(6):319–328.
- , , , , , Comparison of procalcitonin and C‐reactive protein as markers of sepsis. Crit Care Med. 2003;31(6):1737–1741.
Sepsis remains a significant healthcare burden and is the sixth most common reason for hospitalization in the United States. For patients presenting with severe sepsis, mortality rates are approximately 30%,[1, 2] and sepsis remains the most expensive reason for hospitalization. In 2009, septicemia accounted for nearly $15.4 billion in aggregate hospital costs.[2]
Early identification of sepsis and the timely implementation of goal‐directed therapy significantly decrease sepsis‐related mortality and are cost‐effective,[3, 4, 5] highlighting the need for new clinical strategies to aid in early diagnosis. To date, most studies have focused on the screening and management of sepsis in the emergency department and intensive care unit (ICU),[6, 7] and less is known about the benefits of screening in non‐ICU settings. In the non‐ICU setting, conditions may go unrecognized and treatments delayed. Evidence suggests that patients diagnosed with severe sepsis in the non‐ICU setting are almost twice as likely to die as those diagnosed in an emergency department.[8, 9]
Application of a sepsis screening tool to both medical and surgical patients poses an additional challenge that may impact the screen's performance. The specificity may be compromised by noninfectious causes of systemic inflammatory response syndrome (SIRS) commonly seen in the postsurgical patient. For example, the tachycardia and fever often seen in the postoperative patient are sufficient to qualify for SIRS, making the diagnosis of sepsis more challenging. The purpose of this study was to examine the performance of a nurse‐driven, simple sepsis screening tool in a mixed medical and surgical non‐ICU setting.
METHODS
Setting
This was an observational pilot study of prospectively screened patients admitted to a 26‐bed medical/surgical intermediate care unit with telemetry monitoring in a 613‐bed university tertiary referral hospital over a 1‐month time period. The surgical patient population of this floor consisted of cardiothoracic (50%), general (24%), and vascular surgery (17%) patients as well as a small number of trauma (7%) patients. The medical patient population admitted to this unit included pretransplant and complex medical patients requiring telemetry monitoring. Though the incidence of sepsis specific to this unit was unknown prior to the study, after an analysis of discharges the study team surmised there would be sufficient volume for testing of a nurse‐based screening tool.
Nurse Education
Registered nurses (RNs) working on the study unit had an average of 5 to 7 years of experience. The all‐RN unit was staffed predominantly at a 1:3 RN to patient ratio. RNs were supported by a clinical nurse specialist (CNS) and clinical educator (CE) RN who provided regular ongoing education about infection prevention and identification of common conditions that are seen on the unit.
In the 6 months prior to our sepsis screening initiative, nursing staff had been given more than 8 hours of education on infection‐ and sepsis‐related topics in 15‐ to 20‐minute blocks of time. This dedicated education took place during the nurses' shift in groups of 2 to 3, and was run by the CNS, assistant nurse manager, and CE RN. Nurses were also encouraged to attend an optional 8‐hour sepsis continuing medical education (CME) program. Approximately 20% of the nurses on the study unit attended.
Just prior to the pilot study, nursing staff completed a 1‐hour refresher self‐study module on severe sepsis stressing the importance of early identification. There was also a training month prior to the actual data collection time frame, where unit core trainers (RNs) or champions who had attended the optional 8‐hour sepsis CME conducted 1:1 follow‐up with each RN, reviewing at least 1 of their screens to validate understanding of screening concepts. Each RN was checked off after correctly completing a screen. During the study, unit educators and the CNS provided additional on‐unit in‐service training with screening tool completion instructions and advice on how to incorporate the tool into the RN's current assessment workflow. In addition, the charge nurses were asked to review the screens collected each shift and validate any that may have seemed inconsistent with the RN's verbal report of the patient's status.
The university's institutional review board notice of determination waived review for this study because it was classified as quality improvement.
Screening Tool
A sepsis screening tool was developed as part of a broader initiative to improve sepsis‐related morbidity and mortality at our hospital. The screening tool was adapted from the severe sepsis screening tool created by the Surviving Sepsis Campaign and Institute for Healthcare Improvement,[10] and consisted of a simple 3‐tiered paper‐based screening assessment that was to be completed by the bedside RN (Figure 1). RNs on the pilot medical/surgical intermediate care unit performed the screening assessment with their regular patient assessment at the beginning of each shift.
The first tier of the tool screened for the presence of SIRS. Positive parameters included heart rate >90, temperature >38C or <36C, white blood cell count >12,000 or<4000 or >10% bands, and/or respiratory rate >20 or partial pressure of carbon dioxide (PaCO2) <32 mm Hg. To decrease the number of false‐positive screens in patients whose abnormal vitals could already be attributed to a condition other than sepsis, these symptoms were only scored if they had emerged within the previous 8 hours.
If patients met 2 SIRS criteria, the nurse would move to the second tier of the tool, which involved consideration of possible infection as a contributor to a patient's clinical condition as well as a source of infection. If infection was not suspected, further screening was terminated. If infection was suspected, the patient then met criteria for a positive sepsis screen, and a third tier of screening involving assessment of organ dysfunction was initiated.
If the patient screened positive for sepsis (2 SIRS and suspicion for new infection) or severe sepsis (sepsis with end‐organ dysfunction), nurses were instructed to document this in the patient's electronic medical record (EMR) and call the primary team to initiate actions following the hospital‐wide sepsis guidelines. Any subsequent actions were recorded in the patient's EMR.
Data Collection
Completed sepsis screening forms during the month of October 2010 were reviewed by the authors (E.G., L.S., and P.M.). Data including age, gender, International Classification of Diseases, Ninth Revision (ICD‐9) admission and discharge diagnoses, vital signs, lab results, clinical interventions, and documented clinical decision processes by healthcare staff were collected on patients with a positive screen or those who did not screen positive but had an ICD‐9 code for sepsis, severe sepsis, or septic shock during their hospitalization or at discharge. We also collected demographic and clinical data for a random sample of patients who consistently screened negative for sepsis.
Performance Measurement
The sensitivity and specificity of the screening tool was determined by identifying true‐positive, false‐positive, true‐negative, and false‐negative results and calculating accordingly using a 2 2 contingency table. True positives were defined as cases where patients screened positive for sepsis and had a documented diagnosis of sepsis in their EMR within 24 hours of the positive screening or had an ICD‐9 billing code for sepsis. False‐positive cases were those in which patients screened positive for sepsis but did not have a diagnosis of sepsis by manual chart review nor was there an ICD‐9 code for sepsis for their hospital stay. True‐negative cases were those where patients screened negative and did not have an ICD‐9 code for sepsis. False negatives were cases where patients consistently screened negative for sepsis but had an ICD‐9 code for sepsis.
Clinical Activities
To examine the impact of a positive sepsis screen on subsequent clinical action, we assessed the frequency with which a treatment or diagnostic workup was initiated after a positive screen and compared this to clinical activity initiated after a negative screen. Specifically, the patient's EMR was reviewed for actions including measurement of lactate, blood cultures, administration of broad spectrum antibiotics, administration of fluid boluses, or consultation with or transfer to the ICU. These actions were chosen because they are part of the Surviving Sepsis Bundle, which has been demonstrated to improve mortality rates after diagnosis of severe sepsis or septic shock,[11, 12] and can be done outside of an ICU setting. Because screening was done every 8 hours, clinical activity was only attributed to a positive or negative sepsis screen if it occurred within 8 hours of the screening result. Patients were excluded if there were missing data points that precluded full analysis of their clinical course.
Statistical Analysis
To compare the performance of the screening tool between surgical and medical patients, we calculated 95% confidence intervals of screening test sensitivity and specificity. To test if performance was significantly different between these groups, we performed a nonparametric, 2‐sided, 2‐sample test of proportions. Though similar to a [2] test, the 2‐sided test of proportions allowed us to determine if there was a directional difference in test performance (ie, Does the screening tool perform better or worse in a certain patient group?). We also used the test of proportions to compare differences in the proportion of patients receiving sepsis‐related interventions before and after a positive or negative screening result. For comparisons of demographic variables we used nonparametric tests including the [2] test for categorical variables and the Kruskal‐Wallis test for continuous variables. We used SAS 9.3 (SAS Institute Inc., Cary, NC) to perform our analyses.
RESULTS
Over a 1‐month time period, 2143 screens were completed on 245 patients (169 surgical, 76 medical). The overall incidence of sepsis on the treatment unit during this time period was 9%. Surgical patients had an 8.9% incidence of sepsis, and medical patients had an incidence of 9.2%.
Screening tool performance is presented in Table 1. The screening tool had 95.5% sensitivity and 91.9% specificity, with no significant differences in performance between surgical and medical patients. The overall negative predictive value was 99.5%, also with comparable performance in both surgical and medical patients (P = 0.89). The overall positive predictive value (PPV) was 70% in medical patients and 48% in surgical patients (P = 0.12). Screening tool accuracy for medical and surgical patients was 92%.
| Overall, N = 245 (95% CI) | Surgery, N = 169 (95% CI) | Medicine, N = 76 (95% CI) | P Value* | |
|---|---|---|---|---|
| ||||
| Sensitivity | 95.5% (75%‐99.7%) | 93% (66%‐99.6%) | 100% (56%‐100%) | 0.17 |
| Specificity | 91.9% (87%‐95%) | 90% (84%‐94%) | 95% (87%‐99%) | 0.48 |
| NPV | 99.5% (81%‐100%) | 99.3% (71%‐100%) | 100% (67%‐100%) | 0.89 |
| PPV | 53.8% (39%‐70%) | 48% (23%‐73%) | 70% (30%‐100%) | 0.12 |
| LR+ | 11.8 | 9.3 | 20 | |
| LR | 0.05 | 0.08 | 0 | |
| Confirmed patient diagnosis, overall | ||||
| Sepsis | No sepsis | |||
| Screen positive | 21 (TP) | 18 (FP) | ||
| Screen negative | 1 (FN) | 205 (TN) | ||
| Confirmed patient diagnosis, medicine | ||||
| Sepsis | No sepsis | |||
| Screen positive | 7 (TP) | 3 (FP) | ||
| Screen negative | 0 (FN) | 66 (TN) | ||
| Confirmed patient diagnosis, surgery | ||||
| Sepsis | No sepsis | |||
| Screen positive | 14 (TP) | 15 (FP) | ||
| Screen negative | 1 (FN) | 139 (TN) | ||
Clinical Activities
Of the 39 patients who screened positive for sepsis, nurses classified 20 with sepsis and 19 with severe sepsis. Of these 39 patients, 33 were included in our descriptive analysis of the effect of positive screening results on clinical activity (3 were excluded for admission for sepsis and 3 for missing data). As a comparison, we randomly selected 30 patients of the 206 patients who screened negative for sepsis to evaluate clinical activity before and after a negative screen.
Characteristics of patients screening positive and negative for sepsis are reported in Table 2. We found no statistically significant differences in age, sex, length of hospital stay, or mortality amongst all groups.
| Patient Characteristics | Surgery (Positive) | Medicine (Positive) | Surgery (Negative) | Medicine (Negative) | P Value |
|---|---|---|---|---|---|
| |||||
| No. | 26 | 7 | 20 | 10 | |
| Age, y, mean | 57.8 ( 16.5) | 72.4 ( 16.8) | 64.6 ( 19.4) | 63.6 ( 16.8) | 0.25 |
| % Male (no.) | 50% (13) | 57% (4) | 60% (12) | 60% (6) | 0.27 |
| Length of stay, d, median (IQR) | 9 (716.7) | 7 (5.511.5) | 11 (7.722) | 8 (421) | 0.38 |
| No. of PODs until first positive screen, d, median (IQR) | 2 (13) | N/A | N/A | N/A | |
| % Mortality (no.) | 0% | 14% (1) | 5% (1) | 10% (1) | 0.19 |
Figure 2 illustrates differences in the proportion of patients receiving a clinical action before and after a negative or positive screening test result. In the cohort of 33 patients screening positive for sepsis, clinical action after a positive screen was taken in 4 of the 7 (50%) medical patients and 11 of 26 (42%) surgical patients. In patients screening negative for sepsis we found only 1 incident in which a sepsis‐related action was taken after a negative screen. In this case the patient was admitted to the ICU within 8 hours of a negative screen, though there was no explicit documentation that sepsis was the reason for this admission.
We compared the proportion of patients receiving sepsis‐related treatment before either a negative or positive screen and found no significant difference (Table 3). We then compared the proportion of patients receiving sepsis‐related actions after a positive or negative screening test result and found that the proportion of patients receiving antibiotics, blood cultures, and lactate measurement was significantly higher for patients with a positive sepsis screening result compared to those with a negative screening result (Table 3).
| Intervention and Group | Proportion | P Value |
|---|---|---|
| ||
| Before screening test | ||
| Antibiotics | 0.066 | |
| Positive screen | 45% | |
| Negative screen | 23% | |
| Lactate | 0.837 | |
| Positive screen | 15% | |
| Negative screen | 13% | |
| Blood culture | 0.181 | |
| Positive screen | 18% | |
| Negative screen | 17% | |
| Fluid administration | 0.564 | |
| Positive screen | 6% | |
| Negative screen | 10% | |
| ICU transfer/consult | 0.337 | |
| Positive screen | 3% | |
| Negative screen | 0% | |
| After screening test | ||
| Antibiotics | 0.006 | |
| Positive screen | 58% | |
| Negative screen | 23% | |
| Lactate | 0.018 | |
| Positive screen | 36% | |
| Negative screen | 13% | |
| Blood Culture | 0.002 | |
| Positive screen | 24% | |
| Negative screen | 17% | |
| Fluid administration | 0.112 | |
| Positive screen | 24% | |
| Negative screen | 10% | |
| ICU transfer/consult | 0.175 | |
| Positive screen | 9% | |
| Negative screen | 3% | |
DISCUSSION
Improving recognition and time to treatment of sepsis in a non‐ICU setting is an important step toward decreasing sepsis‐related mortality. Lundberg and colleagues found that mortality rates for patients diagnosed with septic shock on a general ward were higher than for patients diagnosed in the ICU, even though ward patients were younger and healthier at baseline.[8] For ward patients, treatment delays were most profound in initiating vasoactive therapies, and minor delays were encountered in initiating fluid resuscitation. In their international study on the impact of early goal‐directed therapy guidelines, Levy and colleagues found that patients diagnosed with severe sepsis on the wards were almost twice as likely to die as patients diagnosed with sepsis in the emergency department.[9]
We are the first to report about an accurate nurse‐driven SIRS‐based sepsis screening protocol that is effective in the early identification of sepsis in both medical and surgical patients in an intermediate care setting. We found no significant difference in the screening tool performance between the medical and surgical cohorts. This is an important comparison given that SIRS criteria alone can be nonspecific in the postoperative population, where it is common to have hemodynamic changes, elevation of inflammatory markers, and fevers from noninfectious sources.
Our sepsis screening tool was designed in 3 tiers to improve its specificity. The first tier was based strictly on SIRS criteria (eg, tachycardia or fever), whereas the second and third tiers served to increase the specificity of the screening tool by instructing the evaluator to assess possible sources of infection and assess for objective signs of organ dysfunction. We relied heavily on the nursing staff to assess for the presence or absence of infection and believe that the educational component prior to initiating the screening protocol was vital.
EMR‐based screening tools that rely purely on physiologic data have been considered for the early detection and management of sepsis, although they lack the specificity gained through the incorporation of clinical judgment.[13] Sawyer and colleagues report using a real‐time EMR‐based method for early sepsis detection in non‐ICU patients that is based solely on objective measures; however, their PPV was only 19.5%. The model we describe in this study is one that incorporates real‐time physiologic data available from an EMR coupled with the clinical judgment of a bedside registered nurse. As our data suggest, this provides a screen that is both sensitive and specific.
It is interesting to note that in our assessment of clinical action taken 8 hours after a positive screening test (the interval after which a new screening test was performed), the rate of diagnostic workup and/or treatment for sepsis was relatively low. One reason for this could have been that the treating team had suspicion for sepsis prior to a positive screen and had already initiated clinical action. Of the 51 recorded clinical actions taken around the time of a positive screen, the majority (67%) occurred before the screening result. It is also possible that clinical action was not pursued because the treatment team disagreed with a diagnosis of sepsis. Of all the false positive screening cases, manual chart review confirmed that these patients did not have sepsis, nor did they develop sepsis during their index hospital stay. Last, we only recorded clinical actions taken within 8 hours of the first positive screen for sepsis and measured 5 very specific actions. Thus, our analysis may have missed actions taken after 8 hours or actions that differed from the 5 we chose to assess.
Even with the apparently low levels of new clinical activity after a positive screen, when compared to patients who screened negative for sepsis, a significantly higher number of patients who had a positive screen received antibiotics, had lactate measured, and had blood cultures drawn. We did not find a significant difference in the proportion of patients receiving a sepsis‐related clinical action before a screening result (positive or negative), which suggests that a positive screening test may have led to increased clinical action.
A limitation of our study is its small size and that it was conducted in 1 pilot unit. Additionally, our retrospective analysis of clinical care inhibited our ability to fully understand a patient's clinical course or retrieve missing data points. A related limitation is that we could not ascertain how often the screening tool did not identify a case of sepsis before it was clinically diagnosed. Assessing the temporal performance of our screening tool is of great interest and may be more easily performed using an electronic version of the screening tool, which is currently in development.
Using ICD‐9 codes to determine the true‐negative cohort is another limitation of our study. It is well documented that use of administrative data can lead to inaccurate classification of patients.[14] To address this, we performed random audits of 30 test‐negative patients. In doing so we did not find any errors in classification.
Although we did not find a significant difference in screening tool performance between surgical and medical patients, the PPV of the tool was lower in the surgical population (48%) compared to the medical population (70%). The lower PPV observed in surgical patients could be attributable to an overall lower incidence of sepsis in this cohort as well as possible errors in initial assessment of infection, which can be difficult in postsurgical patients. Our retrospective analysis included data from the early months of the screening protocol, a time in which nursing staff was still developing clinical acumen in identifying sepsis. However, this could have led nurses to either overestimate or underestimate the presence of infection in either patient group.
Suspicion for infection is the cornerstone definition of sepsis, and in our screening protocol nurses were charged with making this decision based on their knowledge of the patient's clinical course and current status. Issues concerning nurses' recognition of infection symptoms are an area of opportunity for further research and education and could aid in improving PPV. Clinical judgment could be further bolstered by adding promising laboratory tests such as C‐reactive protein or procalcitonin as objective adjuncts to an initial assessment for sepsis,[15] which could potentially increase screening test PPV.
CONCLUSIONS
A simple screening tool for sepsis performed by the bedside nurse can provide a means to successfully identify sepsis early and lead to more timely diagnostics and treatment in both medical and surgical patients in an intermediate care setting.
ACKNOWLEDGEMENTS
The authors thank Eileen Pummer, quality manager for the sepsis team; Pauline Regner, patient care manager of the pilot study unit; and the nurses who contributed to the screening tool design team and data collection. The authors acknowledge Pooja Loftus for her statistical expertise, and Isabella Chu for her review of the manuscript. Disclosures: Presented as a poster at the 31st Annual Meeting of the Surgical Infection Society, Palm Beach, Florida, May 2011. The authors report no conflicts of interest.
- , , , , , Epidemiology of severe sepsis in the United States: analysis of incidence, outcome, and associated costs of care. Crit Care Med. 2001;29(7):1303–1310.
- , , Septicemia in U.S. hospitals, 2009. HCUP statistical brief #122. Agency for Healthcare Research and Quality. Available at: http://www.hcup-us.ahrq.gov/reports/statbriefs/sb122.pdf. Published October 2011. Accessed on September 4, 2012.
- , , , Economic implications of an evidence‐based sepsis protocol: can we improve outcomes and lower costs? Crit Care Med. 2007;35(5):1257–1262.
- , , , , , Late compliance with the sepsis resuscitation bundle: impact on mortality. Shock. 2011;36(6):542–547.
- , , , , , The costs and cost‐effectiveness of an integrated sepsis treatment protocol. Crit Care Med. 2008;36(4):1168–1174.
- , , A simple prediction algorithm for bacteraemia in patients with acute febrile illness. QJM. 2005;98(11):813–820.
- , , , et al. Validation of a screening tool for the early identification of sepsis. J Trauma. 2009;66(6):1539–1546; discussion 1546–1547.
- , , , et al. Septic shock: an analysis of outcomes for patients with onset on hospital wards versus intensive care units. Crit Care Med. 1998;26(6):1020–1024.
- , , , et al. The Surviving Sepsis Campaign: results of an international guideline‐based performance improvement program targeting severe sepsis. Crit Care Med. 2010;38(2):367–374.
- Institute of Healthcare Improvement. Evaluation for severe sepsis screening tool. Surviving Sepsis Campaign. Available at: http://www.survivingsepsis.org/About_the_Campaign/Documents/evaluationforseveresepsisscreeningtool.pdf. Accessed on September 30, 2012.
- , , , et al. Impact of the Surviving Sepsis Campaign protocols on hospital length of stay and mortality in septic shock patients: results of a three‐year follow‐up quasi‐experimental study. Crit Care Med. 2010;38(4):1036–1043.
- , , , et al. Reduction of the severe sepsis or septic shock associated mortality by reinforcement of the recommendations bundle: a multicenter study. Ann Fr Anesth Reanim. 2010;29(9):621–628.
- , , , et al. Implementation of a real‐time computerized sepsis alert in nonintensive care unit patients. Crit Care Med. 2011;39(3):469–473.
- , , , Accuracy of administrative data for identifying patients with pneumonia. Am J Med Qual. 2005;20(6):319–328.
- , , , , , Comparison of procalcitonin and C‐reactive protein as markers of sepsis. Crit Care Med. 2003;31(6):1737–1741.
© 2014 Society of Hospital Medicine
