User login
Clostridium difficile: Not just for adults
The true prevalence and meaning of Clostridium difficile detection in children remains an issue despite a known high prevalence of asymptomatic colonization in children during the first 3 years of life. Distinguishing C. difficile disease from colonization is difficult. Endoscopy can identify some severe C. difficile disease, but what about mild to moderate C. difficile infection?
A passive Centers for Disease Control and Prevention surveillance study (Pediatrics 2014;133:651-8) helps in understanding C. difficile prevalence by documenting the relatively high prevalence of community-acquired C. difficile often associated with use of common oral antibiotics and possibly because of the emergence of the NAP1 strain, which is also emerging in adults. But distinguishing infection from colonization remains an issue. The data have implications for everyday pediatric care.
Methods
Children aged 1-17 years from 10 U.S. states were studied during 2011-2012. C. difficile "cases" were defined via a positive toxin or a molecular test ordered as part of standard care. Standard of care testing for other selected gastrointestinal pathogens and data from medical records were collected. Within 3-6 months of the C. difficile–positive test, a convenience sample of families (about 9%) underwent a telephone interview.
Factors in C. difficile detection
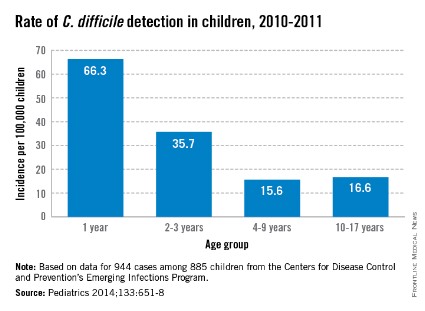
C. difficile was detected in 944 stools from 885 children with no gender difference. The highest rates per 100,000 by race were in whites (23.9) vs. nonwhites (17.4), and in 12- to 23-month-olds (66.3). Overall, 71% of detections were categorized from charted data as community acquired. Only 17% were associated with outpatient health care and 12% with inpatient care.
Antibiotic use in the 14 days before a C. difficile–positive stool was 33% among all cases with no age group differences. Cephalosporins (41%) and amoxicillin/clavulanate (28%) were most common. Among 84 cases also later interviewed by phone, antibiotic use was more frequent (73%); penicillins (39%) and cephalosporins (44%) were the antibiotics most commonly used in this subset of patients. Indications were most often otitis, sinusitis, or upper respiratory infection. In the phone interviews, outpatient office visits were a more frequent (97%) health care exposure than in the overall case population.
Signs and symptoms were mild and similar in all age groups. Diarrhea was not present in 28%. Coinfection with another enteric pathogen was identified in 3% of 535 tested samples: bacterial (n = 12), protozoal (n = 4), and viral (n = 1) – and more common in 2- to 9-year-olds (P = .03). Peripheral WBC counts were abnormal (greater than 15, 000/mm3) in only 7%. There was radiographic evidence of ileus in three and pseudomembranous colitis developed in five cases. Cases were defined as severe in 8% with no age preponderance. There were no deaths.
Infection vs. colonization?
The authors reason that similar clinical presentations and symptom severity at all ages means that detection of C. difficile "likely represents infection" but not colonization. They explain that they expect milder symptoms in the youngest cases if they were only colonized. Is this reasonable?
One could counterargue that in the absence of testing for the most common diarrheagenic pathogen in the United States (norovirus), that diarrhea in at least some of these C. difficile–positive children was likely caused by undetected norovirus. That could partially explain why symptoms were not significantly different by age. One viral coinfection in nearly 500 diarrhea stools (even preselected by C. difficile positivity) seems low. Even if norovirus is not the wildcard here, the similar "disease" at all ages could suggest that something other than C. difficile is the cause. Norovirus and other viral agents testing of samples that were cultured for C. difficile could increase understanding of coinfection rates. Another issue is that 28% of C. difficile children did not have diarrhea, raising concern that these were colonized children.
The authors state that high antibiotic use (73% in phone interviewees) might have contributed to the high C. difficile detection rates. This seems logical, but the phone-derived data came from only about 8% of the total population. The original charted data from the entire population showed 33% antibiotic use. The charted data may have been more reliable because it was collected at the time of the C. difficile–positive stool, not 3-6 months later. Nevertheless, it seems apparent that common outpatient antibiotics could be a factor. If the data were compared with antibiotic use rates for C. difficile–negative children of the same ages, the conclusion would be more powerful.
Children less than 1year of age were not included because up to 73% (Eur. J. Clin. Microbiol. Infect. Dis. 1989;8:390-3) of infants have been reported as asymptomatically colonized. In similar studies, colonized infants were frequent (25% between 6 days and 6 months) up to about 3 years of age when rates dropped off to less than 3%, similar to adults. Inclusion of children in the second and third year of life likely means that not all detections were infections. But there is no way to definitively distinguish infection from colonization in this study.
A further step in filling the knowledge gap on C. difficile would be prospective surveillance with improved definitions of infection vs. colonization and a more complete search for potential concurrent causes of diarrhea. Undoubtedly, many of these C. difficile–positive children had true infection, but it also seems likely that some were colonized, particularly in the second and third year of life. It would be interesting to compare results from healthy controls vs. those with diarrhea using new multiplex molecular assays to gain a better understanding of what proportion of all children have detectable C. difficile with and without other pathogens.
Bottom line
NAP1 C. difficile is emerging in children. C. difficile detection, whether infected or colonized, in this many children is new. These data suggest that our best contributions to reducing the spread of C. difficile are the use of amoxicillin without clavulanate as first line – if antibiotics are needed for acute otitis media and for acute sinusitis – while we refrain from antibiotics for viral upper respiratory infections. As the old knight told Indiana Jones, "Choose wisely."
Factors associated with C. difficile detection in children
1. White race. Question more frequent health care and antibiotic exposure.
2. Age 12 to 23 months. Question whether the population is mix of colonized and infected children. This needs more study.
3. Amoxicillin/clavulanate or oral cephalosporin use for common outpatient infection. Is narrower spectrum, amoxicillin alone better?
4. A recent outpatient health care visit may be a cofactor with #1 and #3.
Dr. Harrison is professor of pediatrics and pediatric infectious diseases at Children’s Mercy Hospitals and Clinics, Kansas City, Mo. Dr. Harrison said he has no relevant financial disclosures. E-mail him at [email protected].
The true prevalence and meaning of Clostridium difficile detection in children remains an issue despite a known high prevalence of asymptomatic colonization in children during the first 3 years of life. Distinguishing C. difficile disease from colonization is difficult. Endoscopy can identify some severe C. difficile disease, but what about mild to moderate C. difficile infection?
A passive Centers for Disease Control and Prevention surveillance study (Pediatrics 2014;133:651-8) helps in understanding C. difficile prevalence by documenting the relatively high prevalence of community-acquired C. difficile often associated with use of common oral antibiotics and possibly because of the emergence of the NAP1 strain, which is also emerging in adults. But distinguishing infection from colonization remains an issue. The data have implications for everyday pediatric care.
Methods
Children aged 1-17 years from 10 U.S. states were studied during 2011-2012. C. difficile "cases" were defined via a positive toxin or a molecular test ordered as part of standard care. Standard of care testing for other selected gastrointestinal pathogens and data from medical records were collected. Within 3-6 months of the C. difficile–positive test, a convenience sample of families (about 9%) underwent a telephone interview.
Factors in C. difficile detection
C. difficile was detected in 944 stools from 885 children with no gender difference. The highest rates per 100,000 by race were in whites (23.9) vs. nonwhites (17.4), and in 12- to 23-month-olds (66.3). Overall, 71% of detections were categorized from charted data as community acquired. Only 17% were associated with outpatient health care and 12% with inpatient care.
Antibiotic use in the 14 days before a C. difficile–positive stool was 33% among all cases with no age group differences. Cephalosporins (41%) and amoxicillin/clavulanate (28%) were most common. Among 84 cases also later interviewed by phone, antibiotic use was more frequent (73%); penicillins (39%) and cephalosporins (44%) were the antibiotics most commonly used in this subset of patients. Indications were most often otitis, sinusitis, or upper respiratory infection. In the phone interviews, outpatient office visits were a more frequent (97%) health care exposure than in the overall case population.
Signs and symptoms were mild and similar in all age groups. Diarrhea was not present in 28%. Coinfection with another enteric pathogen was identified in 3% of 535 tested samples: bacterial (n = 12), protozoal (n = 4), and viral (n = 1) – and more common in 2- to 9-year-olds (P = .03). Peripheral WBC counts were abnormal (greater than 15, 000/mm3) in only 7%. There was radiographic evidence of ileus in three and pseudomembranous colitis developed in five cases. Cases were defined as severe in 8% with no age preponderance. There were no deaths.
Infection vs. colonization?
The authors reason that similar clinical presentations and symptom severity at all ages means that detection of C. difficile "likely represents infection" but not colonization. They explain that they expect milder symptoms in the youngest cases if they were only colonized. Is this reasonable?
One could counterargue that in the absence of testing for the most common diarrheagenic pathogen in the United States (norovirus), that diarrhea in at least some of these C. difficile–positive children was likely caused by undetected norovirus. That could partially explain why symptoms were not significantly different by age. One viral coinfection in nearly 500 diarrhea stools (even preselected by C. difficile positivity) seems low. Even if norovirus is not the wildcard here, the similar "disease" at all ages could suggest that something other than C. difficile is the cause. Norovirus and other viral agents testing of samples that were cultured for C. difficile could increase understanding of coinfection rates. Another issue is that 28% of C. difficile children did not have diarrhea, raising concern that these were colonized children.
The authors state that high antibiotic use (73% in phone interviewees) might have contributed to the high C. difficile detection rates. This seems logical, but the phone-derived data came from only about 8% of the total population. The original charted data from the entire population showed 33% antibiotic use. The charted data may have been more reliable because it was collected at the time of the C. difficile–positive stool, not 3-6 months later. Nevertheless, it seems apparent that common outpatient antibiotics could be a factor. If the data were compared with antibiotic use rates for C. difficile–negative children of the same ages, the conclusion would be more powerful.
Children less than 1year of age were not included because up to 73% (Eur. J. Clin. Microbiol. Infect. Dis. 1989;8:390-3) of infants have been reported as asymptomatically colonized. In similar studies, colonized infants were frequent (25% between 6 days and 6 months) up to about 3 years of age when rates dropped off to less than 3%, similar to adults. Inclusion of children in the second and third year of life likely means that not all detections were infections. But there is no way to definitively distinguish infection from colonization in this study.
A further step in filling the knowledge gap on C. difficile would be prospective surveillance with improved definitions of infection vs. colonization and a more complete search for potential concurrent causes of diarrhea. Undoubtedly, many of these C. difficile–positive children had true infection, but it also seems likely that some were colonized, particularly in the second and third year of life. It would be interesting to compare results from healthy controls vs. those with diarrhea using new multiplex molecular assays to gain a better understanding of what proportion of all children have detectable C. difficile with and without other pathogens.
Bottom line
NAP1 C. difficile is emerging in children. C. difficile detection, whether infected or colonized, in this many children is new. These data suggest that our best contributions to reducing the spread of C. difficile are the use of amoxicillin without clavulanate as first line – if antibiotics are needed for acute otitis media and for acute sinusitis – while we refrain from antibiotics for viral upper respiratory infections. As the old knight told Indiana Jones, "Choose wisely."
Factors associated with C. difficile detection in children
1. White race. Question more frequent health care and antibiotic exposure.
2. Age 12 to 23 months. Question whether the population is mix of colonized and infected children. This needs more study.
3. Amoxicillin/clavulanate or oral cephalosporin use for common outpatient infection. Is narrower spectrum, amoxicillin alone better?
4. A recent outpatient health care visit may be a cofactor with #1 and #3.
Dr. Harrison is professor of pediatrics and pediatric infectious diseases at Children’s Mercy Hospitals and Clinics, Kansas City, Mo. Dr. Harrison said he has no relevant financial disclosures. E-mail him at [email protected].

Privacy or transparency: Maryland psychiatrists speculate on Medicare payments and their accessibility to the public
Despite protests from the American Medical Association, on Wednesday, April 9, the Obama administration made public payments to 880,000 Medicare providers. The data, released by the Centers for Medicare & Medicaid Services, include the clinician's name; specialty; address; and a breakdown of the number of patients who received each itemized service, the number of services rendered, the average amount billed per CPT code, and the average amount paid; along with the physician's total Medicare reimbursement for 2012. The data are easily accessible, and major newspapers have included look-up tools on their websites to allow for easy access to the data.
Through a discussion on the Maryland Psychiatric Society listserv, the opinions of several psychiatrists were solicited. From this, I learned that psychiatrists in my metro area have had mixed responses to the release of this information. Jesse Hellman, a psychiatrist in private practice in Towson, Md., notes: "This was a major privacy violation. Publishing the payments to individual physicians was a blunder. It should never have happened. Relevant data might have been released in another form."
Brian Crowley, a psychiatrist in practice in Washington, feels otherwise. "Personally, I'm in favor of the publication. It is of interest that most of the money goes to a few doctors, I believe, and may help planning. I believe the transparency is likely a good thing."
Roger Peele, a psychiatrist in Rockville, Md., agreed. "Even though misleading in some ways, and even though it might decrease the willingness of a few to be part of Medicare, it adds weight to the argument for a more rational payment system for physicians."
Robert Roca, vice president and medical director of Sheppard Pratt Health Systems added that he’d heard a journalist with expertise about this issue speaking on National Public Radio. "They don’t see this as a privacy issue. Their argument is that these are public dollars and that the public is entitled to know how and where they are spent. Unfortunately, the question of whether detailed information about payment of public dollars for other goods or services should be readily available to the public did not come up."
Steve Daviss, president of FUSE Health Strategies, had a lot to say about making the data public: "Put me in the 'transparency is good' camp. I see this less from a privacy of the doctor viewpoint, but rather from the perspectives of open government, and that this sort of data feedback mechanism is needed for proper homeostasis of our health care system.
"The U.S. spends twice as much per person on health care as any other country – double! – yet, we are not getting twice the health outcomes. When the CMS [Centers for Medicare & Medicaid Services] released this sort of data for hospitals, only then could we see the huge disparity in billing practices across the country. This sort of data about physicians will help demonstrate similar discrepancies, not just the 0.1% of physicians making millions on senior cataract surgery or whatever, but the shortages. There are many explanations for the odd data bits, which provide us a great opportunity to educate our patients and our policy makers.
"I don’t really see the danger," Dr. Daviss continued. "Where I do see the danger is in preventing people from understanding how much health care costs, where the money goes, and how to comparison shop. The next step (maybe it should have been the first) is to also share aggregate quality data, patient experience data, and comorbidity data. Then people will begin to connect the dots and have the information needed to make better health care decisions."
Laurie Orgel, a psychiatrist in private practice in Towson, countered, "I suppose we can look at this as a privacy issue, but there is the issue of relevance. What does it get anyone? Yes, there will be those of us who note the minority who get huge reimbursements, but I suspect that will just tarnish the rest of us rather than be understood as ‘a few outliers.’ Does this information really help planning?"
Kery Hummel, executive director of the Maryland Psychiatric Society, said, "I also wonder why some people have such considerable amounts and others such small amounts." He was quick to point out that the list included income earned for a psychiatrist, still listed at a Maryland address, who had moved out of state several years before.
Whether it's a violation of a doctor’s privacy to have the details of his practice and incomes easily accessible to the public, and whether this degree of transparency adds value when it comes to making health care more efficient with better outcomes, will be seen over time. In terms of capturing fraud, one might think that the CMS always had access to this data, and if it's an outlier for a physician to receive $21 million in Medicare dollars, then that should have been known without the need to make that information public. Notably, the data, even if completely correct, don’t tell the full picture of American health care dollars, as it doesn’t capture the practice habits of those who have opted out, or any transactions that are not provided through the Medicare program. The statistics, by definition, are skewed to reflect the practice habits of participating physicians who treat senior citizens and the disabled.
Finally, and as a bit of a humorous aside, having the data available does enable some interesting statistical analysis. One day after the data went public, Brian Reid published an article on the widely read medical blog KevinMD. In "Doctors who tweet aren’t ones who bill Medicare for millions," Mr. Reid said,"First, we created a list of doctors who appeared both in the dataset of Medicare providers and our MDigitalLife database of verified doctors in the United States with Twitter handles: 8,000 doctors who both used Twitter and received Medicare payments. We compared that group to the top 14,000 or so providers in the Medicare dataset (every single person who received $500,000 or more from the Medicare). There wasn't a lot of overlap. Only 230 docs made both the top-tweeter and the top-biller list. And among the real outliers – the top 1,000 recipients of Medicare dollars – only 13 were on Twitter, with a measly median follower count of 112. What’s more, there was an inverse association between Twitter followers and money received from Medicare."
Typically, I might end an article by asking readers to follow me on Twitter, but today I think I'll opt for a shot at higher reimbursement.
Dr. Miller is a coauthor of "Shrink Rap: Three Psychiatrists Explain Their Work" (Baltimore: the Johns Hopkins University Press, 2011).

Doing battle in the war on drug-resistant organisms
"Superbugs" is a catchy term, and one that piques the interest of many patients. It gives the microbes a certain mystique, an unusual, sometimes unharnessed power to seek out and destroy.
Physicians come into contact with so many drug-resistant organisms that some have become virtually immune to that bright contact isolation sign on the door. They boldly enter the rooms unprotected, mistakenly believing that as long as they don’t touch anything, they will be safe. But, even when you just want to ask the patient a quick question or two and donning a gown and gloves is cumbersome, it’s extremely important nonetheless.

According to UpToDate, the environments in these rooms are often highly contaminated with notorious organisms, such as MRSA, VRE, and the dreaded C. diff., and one can become exposed to them without ever even touching the patient.
You know what happens next: The bugs are taken from room to room. They are carried into the nurses’ station, where a brief brush against the counter deposits fresh inocula for others to spread. They are deposited on computers, where physicians, nurses, and even case managers work, only to be picked up to by unwary workers (who practice great hand hygiene) and spread around even further. And ultimately, they are taken home on our clothing, making yet another leap when our spouses or children greet us at the door with a big bear hug.
We see the devastation these bacteria have on the lives of our patients and their families, but now they are getting the attention of a much higher authority. The Obama administration recently unveiled its proposal to increase spending to combat antibiotic-resistant microorganisms in hospitals. Specifically, the Centers for Disease Control and Prevention seeks $30 million to fund specialized labs in five areas of the United States to assist local hospitals in diagnosing and combating these infections; it also calls for all hospitals to develop a program to track and improve antibiotic prescribing.
Yes, top-down politics (and medicine) has a very important place. But we are the foot soldiers, the ones who actually take care of patients and prescribe (and sometimes overprescribe) the antibiotics that put them at risk for developing drug-resistant organisms. No doubt, responsible antibiotics stewardship saves lives. Most of us have encountered at least one unfortunate patient who, as a result of antibiotics, developed fulminate C. diff and required a partial colectomy, changing his life forever.
While it may be tempting to continue the broad-spectrum antibiotics that rescued a septic shock patient from the brink of death, if the culture results provide a clear path to streamline treatment and narrow the spectrum, be diligent about making the change. If you think, "In my experience, a patient generally does well continuing on broad-spectrum antibiotics for the course of her treatment," think again. Chances are we will not be the ones readmitting that patient a few weeks later with a new case of sepsis – drug-induced sepsis from the C. diff we predisposed her to.
In addition to our practicing good antibiotics stewardship, educating our patients on the proper use for (and of) antibiotics will empower them to have a role in this battle as well. We have a long way to go in this battle against drug-resistant organisms, and everyone has a part to play.
Dr. Hester is a hospitalist with Baltimore-Washington Medical Center who has a passion for empowering patients to partner in their health care. She is the creator of the Patient Whiz, a patient-engagement app for iOS. Reach her at [email protected].
"Superbugs" is a catchy term, and one that piques the interest of many patients. It gives the microbes a certain mystique, an unusual, sometimes unharnessed power to seek out and destroy.
Physicians come into contact with so many drug-resistant organisms that some have become virtually immune to that bright contact isolation sign on the door. They boldly enter the rooms unprotected, mistakenly believing that as long as they don’t touch anything, they will be safe. But, even when you just want to ask the patient a quick question or two and donning a gown and gloves is cumbersome, it’s extremely important nonetheless.
According to UpToDate, the environments in these rooms are often highly contaminated with notorious organisms, such as MRSA, VRE, and the dreaded C. diff., and one can become exposed to them without ever even touching the patient.
You know what happens next: The bugs are taken from room to room. They are carried into the nurses’ station, where a brief brush against the counter deposits fresh inocula for others to spread. They are deposited on computers, where physicians, nurses, and even case managers work, only to be picked up to by unwary workers (who practice great hand hygiene) and spread around even further. And ultimately, they are taken home on our clothing, making yet another leap when our spouses or children greet us at the door with a big bear hug.
We see the devastation these bacteria have on the lives of our patients and their families, but now they are getting the attention of a much higher authority. The Obama administration recently unveiled its proposal to increase spending to combat antibiotic-resistant microorganisms in hospitals. Specifically, the Centers for Disease Control and Prevention seeks $30 million to fund specialized labs in five areas of the United States to assist local hospitals in diagnosing and combating these infections; it also calls for all hospitals to develop a program to track and improve antibiotic prescribing.
Yes, top-down politics (and medicine) has a very important place. But we are the foot soldiers, the ones who actually take care of patients and prescribe (and sometimes overprescribe) the antibiotics that put them at risk for developing drug-resistant organisms. No doubt, responsible antibiotics stewardship saves lives. Most of us have encountered at least one unfortunate patient who, as a result of antibiotics, developed fulminate C. diff and required a partial colectomy, changing his life forever.
While it may be tempting to continue the broad-spectrum antibiotics that rescued a septic shock patient from the brink of death, if the culture results provide a clear path to streamline treatment and narrow the spectrum, be diligent about making the change. If you think, "In my experience, a patient generally does well continuing on broad-spectrum antibiotics for the course of her treatment," think again. Chances are we will not be the ones readmitting that patient a few weeks later with a new case of sepsis – drug-induced sepsis from the C. diff we predisposed her to.
In addition to our practicing good antibiotics stewardship, educating our patients on the proper use for (and of) antibiotics will empower them to have a role in this battle as well. We have a long way to go in this battle against drug-resistant organisms, and everyone has a part to play.
Dr. Hester is a hospitalist with Baltimore-Washington Medical Center who has a passion for empowering patients to partner in their health care. She is the creator of the Patient Whiz, a patient-engagement app for iOS. Reach her at [email protected].

Open power morcellation of uterine tumors during hysterectomy banned at two Boston hospitals
The use of power morcellation to remove the uterus or uterine tumors during hysterectomy may be riskier than many have thought, especially when morcellation is performed in an “open” fashion (without use of a protective bag) in the peritoneal cavity. That’s the conclusion reached by two top Boston hospitals recently, when Brigham and Women’s and Massachusetts General both banned use of open power morcellation in gynecologic surgery.
Both hospitals assert that, when used outside of a containment system such as a morcellation bag, intraperitoneal open morcellation can spread tumor tissue throughout the peritoneal cavity. Robert L. Barbieri, MD, who is chair of obstetrics and gynecology at Brigham and Women’s Hospital, recently wrote about this concern for OBG Management in his capacity as editor in chief of the journal.
“When used to treat tumors presumed to be fibroids, open power morcellation is associated with an increased risk of dispersing benign myoma tissue and occult malignant leiomyosarcoma tissue throughout the abdominal cavity,” he wrote.1 “Dispersion of benign myoma tissue may result in the growth of fibroids on the peritoneal surface, omentum, and bowel, causing abdominal and pelvic pain and necessitating reoperation. Dispersion of leiomyosarcoma tissue throughout the abdominal cavity may result in a Stage I cancer being upstaged to a Stage IV malignancy, requiring additional surgery and chemotherapy. In cases in which open power morcellation causes the upstaging of a leiomyosarcoma, the death rate is increased.”1
Related article: Options for reducing the use of open power morcellation of uterine tumors Robert L. Barbieri, MD (Editorial, March 2014)
The two Boston hospitals are not the only institutions reconsidering the use of open power morcellation. Temple University Hospital in Philadelphia banned the procedure in late February 2014.
And in December 2013, the Society of Gynecologic Oncology issued a position statement on the issue, which said, “power morcellation or other techniques that cut up the uterus in the abdomen have the potential to disseminate an otherwise contained malignancy throughout the abdominal cavity. For this reason, the Society of Gynecologic Oncology (SGO) asserts that it is generally contraindicated in the presence of documented or highly suspected malignancy, and may be inadvisable in premalignant conditions or risk-reducing surgery.”2
For its part, the AAGL, previously known as the American Association of Gynecologic Laparoscopists, “is reviewing the scientific evidence and best practices reported by our members,” stated an article in its Association News. “We recognize that, in rare cases, the use of power morcellators can lead to the dissemination of an occult malignancy of endometrial or myometrial origin, and also of dissemination of benign morcellated tissues. We encourage our members to fully research and understand the risks of power morcellation and to learn more about when alternative methods of tissue extraction may be appropriate.”3
The most recent committee opinion on choosing a hysterectomy route from the American College of Obstetricians and Gynecologists (ACOG) to touch on the issue states that, “the decision to perform a hysterectomy via [minimally invasive surgery] (with or without morcellation) is based on a patient evaluation, including the patient’s history and general health, tests, and procedures, such as pre-surgery biopsies. The evaluation and diagnostic process also provides an opportunity to identify any cautions or contraindications, such as finding a gynecological cancer.”4
FILLING THE TECHNOLOGY GAP
Now that open power morcellation appears to be receding as an option for minimally invasive gynecologic surgeons, what is the best approach?
In its position statement, the SGO recommends that, “Patients being considered for minimally invasive surgery performed by laparoscopic or robotic techniques who might require intracorporeal morcellation should be appropriately evaluated for the possibility of coexisting uterine or cervical malignancy. Other options to intracorporeal morcellation include removing the uterus through a mini-laparotomy or morcellating the uterus inside a laparoscopic bag.”2
K. Anthony Shibley, MD, a Minneapolis-area ObGyn, has developed a novel strategy to prevent tissue dissemination during open power morcellation. His strategy involves utilization of a large bowel isolation bag. For more on this approach, click here.
AAGL is in the process of formulating a policy on the use of open power morcellation. ACOG has not signaled its intent to weigh in on the issue.
Brigham and Women’s Hospital intends to carefully review requests for permission to utilize open power morcellation on a case-by-case basis, provided the surgeon presents all case details and a rationale for exemption from the new rule.
- Barbieri RL. Options for reducing the use of open power morcellation of uterine tumors. OBG Manag. 2014;26(3):10,11,20.
- Society of Gynecologic Oncology. Position Statement: Morcellation. https://www.sgo.org/newsroom/position-statements-2/morcellation/. Published December 2013. Accessed April 8, 2014.
- AAGL. AAGL Member Update: Disseminated Leiomyosarcoma with Power Morcellation. http://www.aagl.org/aaglnews/aagl-member-update-disseminated-leiomyosarcoma-with-power-morcellation/. Accessed April 11, 2014.
- American College of Obstetricians and Gynecologists. Committee Opinion No. 444: Choosing the route of hysterectomy for benign disease. Obstet Gynecol. 2009;114(5):1156–1158.
The use of power morcellation to remove the uterus or uterine tumors during hysterectomy may be riskier than many have thought, especially when morcellation is performed in an “open” fashion (without use of a protective bag) in the peritoneal cavity. That’s the conclusion reached by two top Boston hospitals recently, when Brigham and Women’s and Massachusetts General both banned use of open power morcellation in gynecologic surgery.
Both hospitals assert that, when used outside of a containment system such as a morcellation bag, intraperitoneal open morcellation can spread tumor tissue throughout the peritoneal cavity. Robert L. Barbieri, MD, who is chair of obstetrics and gynecology at Brigham and Women’s Hospital, recently wrote about this concern for OBG Management in his capacity as editor in chief of the journal.
“When used to treat tumors presumed to be fibroids, open power morcellation is associated with an increased risk of dispersing benign myoma tissue and occult malignant leiomyosarcoma tissue throughout the abdominal cavity,” he wrote.1 “Dispersion of benign myoma tissue may result in the growth of fibroids on the peritoneal surface, omentum, and bowel, causing abdominal and pelvic pain and necessitating reoperation. Dispersion of leiomyosarcoma tissue throughout the abdominal cavity may result in a Stage I cancer being upstaged to a Stage IV malignancy, requiring additional surgery and chemotherapy. In cases in which open power morcellation causes the upstaging of a leiomyosarcoma, the death rate is increased.”1
Related article: Options for reducing the use of open power morcellation of uterine tumors Robert L. Barbieri, MD (Editorial, March 2014)
The two Boston hospitals are not the only institutions reconsidering the use of open power morcellation. Temple University Hospital in Philadelphia banned the procedure in late February 2014.
And in December 2013, the Society of Gynecologic Oncology issued a position statement on the issue, which said, “power morcellation or other techniques that cut up the uterus in the abdomen have the potential to disseminate an otherwise contained malignancy throughout the abdominal cavity. For this reason, the Society of Gynecologic Oncology (SGO) asserts that it is generally contraindicated in the presence of documented or highly suspected malignancy, and may be inadvisable in premalignant conditions or risk-reducing surgery.”2
For its part, the AAGL, previously known as the American Association of Gynecologic Laparoscopists, “is reviewing the scientific evidence and best practices reported by our members,” stated an article in its Association News. “We recognize that, in rare cases, the use of power morcellators can lead to the dissemination of an occult malignancy of endometrial or myometrial origin, and also of dissemination of benign morcellated tissues. We encourage our members to fully research and understand the risks of power morcellation and to learn more about when alternative methods of tissue extraction may be appropriate.”3
The most recent committee opinion on choosing a hysterectomy route from the American College of Obstetricians and Gynecologists (ACOG) to touch on the issue states that, “the decision to perform a hysterectomy via [minimally invasive surgery] (with or without morcellation) is based on a patient evaluation, including the patient’s history and general health, tests, and procedures, such as pre-surgery biopsies. The evaluation and diagnostic process also provides an opportunity to identify any cautions or contraindications, such as finding a gynecological cancer.”4
FILLING THE TECHNOLOGY GAP
Now that open power morcellation appears to be receding as an option for minimally invasive gynecologic surgeons, what is the best approach?
In its position statement, the SGO recommends that, “Patients being considered for minimally invasive surgery performed by laparoscopic or robotic techniques who might require intracorporeal morcellation should be appropriately evaluated for the possibility of coexisting uterine or cervical malignancy. Other options to intracorporeal morcellation include removing the uterus through a mini-laparotomy or morcellating the uterus inside a laparoscopic bag.”2
K. Anthony Shibley, MD, a Minneapolis-area ObGyn, has developed a novel strategy to prevent tissue dissemination during open power morcellation. His strategy involves utilization of a large bowel isolation bag. For more on this approach, click here.
AAGL is in the process of formulating a policy on the use of open power morcellation. ACOG has not signaled its intent to weigh in on the issue.
Brigham and Women’s Hospital intends to carefully review requests for permission to utilize open power morcellation on a case-by-case basis, provided the surgeon presents all case details and a rationale for exemption from the new rule.
- Barbieri RL. Options for reducing the use of open power morcellation of uterine tumors. OBG Manag. 2014;26(3):10,11,20.
- Society of Gynecologic Oncology. Position Statement: Morcellation. https://www.sgo.org/newsroom/position-statements-2/morcellation/. Published December 2013. Accessed April 8, 2014.
- AAGL. AAGL Member Update: Disseminated Leiomyosarcoma with Power Morcellation. http://www.aagl.org/aaglnews/aagl-member-update-disseminated-leiomyosarcoma-with-power-morcellation/. Accessed April 11, 2014.
- American College of Obstetricians and Gynecologists. Committee Opinion No. 444: Choosing the route of hysterectomy for benign disease. Obstet Gynecol. 2009;114(5):1156–1158.
RELATED ARTICLES
![]()
![]()
Options for reducing the use of open power morcellation of uterine tumors Robert L. Barbieri, MD (Editorial, March 2014)
How I avoid open power morcellation
Morcellated leiomyosarcoma is a very real risk
(Comment & Controversy, March 2014)

![]()
Benefits and pitfalls of open power morcellation of uterine fibroids Robert L. Barbieri, MD (Editorial, February 2014)
Combo may overcome bortezomib resistance in MCL
SAN DIEGO—Preclinical research suggests that combining a BET inhibitor with lenalidomide may overcome resistance to bortezomib in mantle cell lymphoma (MCL).
Experiments in MCL cell lines and mouse models of the disease showed that lenalidomide alone is active in bortezomib-resistant cells and tumors.
But the anticancer effects are more pronounced with the addition of the BET inhibitor CPI203.
“So we think that this new combination based on BET inhibition and lenalidomide may be helpful for the design of new therapies in the subset of MCL patients resistant to bortezomib,” said study investigator Gael Roue, PhD, of IDIBAPS in Barcelona, Spain.
Dr Roue and his colleagues presented this research in a poster at the AACR Annual Meeting 2014 (abstract 1691*). The team included researchers from Constellation Pharmaceuticals, the company developing CPI203.
With this research, the investigators wanted to assess the possibility of targeting IRF4 and MYC signaling and overcoming bortezomib resistance with lenalidomide-based therapies.
To that end, they tested lenalidomide in 9 MCL cell lines. They found the drug’s antitumor activity is mediated by inhibition of the plasmacytic differentiation program in bortezomib-resistant MCL.
The team then evaluated the effects of lenalidomide on REC-1 cells injected into SCID mice. And they found that lenalidomide significantly reduced tumor growth compared to vehicle control (P=0.04).
The researchers next injected mice with REC-1 cells and treated them with 50 mg/kg of lenalidomide, 0.15 mg/kg of bortezomib, both agents, or vehicle control. The mice received lenalidomide 5 days a week and bortezomib twice a week for up to 18 days.
Lenalidomide alone significantly reduced tumor volume when compared to control (P=0.04). The same was true of the combination treatment compared to control (P=0.02).
The investigators also noted a 25% increase in MYC expression in cells and tumors that were resistant to bortezomib. So they speculated that inhibiting MYC could increase lenalidomide activity.
“This was the rationale for combining lenalidomide with a BET inhibitor,” Dr Roue said. “BET inhibitors are known to inhibit MYC transcription, to inhibit MYC signaling, in multiple myeloma and lymphoma cells.”
The researchers first evaluated the effects of CPI203 alone. They cultured 9 MCL cell lines and peripheral blood mononuclear cells from 2 healthy donors with increasing concentrations of CPI203 and assessed cytotoxicity, MYC levels, and cell viability.
They found that CPI203 was active in all the cell lines tested, but it didn’t affect the proliferation or viability of the healthy cells. And CPI203 activity was linked to the downregulation of MYC.
The team then tested CPI203 in combination with lenalidomide. They treated REC-1 cells for 72 hours with 0.1 μM to 0.5 μM of CPI203 and/or 1 μM to 5 μM of lenalidomide.
“[W]e observed synergistic activity in vitro, linked to a complete disappearance of MYC and also of IRF4,” Dr Roue said.
Finally, the investigators tested the 2 agents in mice with bortezomib-resistant MCL. The mice were injected with REC-1 cells and randomized to treatment with lenalidomide at 50 mg/kg/day, CPI203 at 2.5 mg/kg BID, both agents, or vehicle control.
“We found that by treating mice with [both agents] for 3 weeks, we reached 80% tumor remission, which was linked to inhibition of mitosis, complete disappearance of MYC and IRF4 protein levels, and induction of apoptosis in about 30% to 40% of the tumors.”
The researchers said these results suggest the lenalidomide-BET inhibitor combination warrants investigation in MCL patients who are refractory to bortezomib. ![]()
*Information in the abstract differs from that presented at the meeting.
Cases of ‘misconduct’ were really mistakes, STAP cell researcher says

Associated Press
The scientist who led the research on STAP cells (stimulus-triggered acquisition of pluripotency cells) has apologized for the errors in her published work but maintains that she is not guilty of misconduct.
She offered additional explanations for the errors and argued that they do not change the conclusion of the research—that the STAP phenomenon is real.
Earlier this month, Haruko Obokata, PhD, was accused of research misconduct by her institution, the RIKEN Center for Developmental Biology in Kobe, Japan.
RIKEN had launched an investigation into the STAP cell research (published in an article and a letter to Nature) after members of the scientific community began questioning its validity.
The researchers had claimed they could induce pluripotency in somatic cells by introducing them to a low-pH environment.
RIKEN investigated 6 issues with the research and ruled that there were 2 cases of data mishandling, 2 unintentional errors, and 2 cases of misconduct in the form of data manipulation.
In the first case of data manipulation, Dr Obokata switched 1 lane of a diagram for another. In the second, she used an image of a teratoma from her doctoral thesis.
Dr Obokata said the first manipulation was for the purpose of image clarity and not made with an intent to deceive readers. And the second “manipulation” was the result of a mix up in Power Point slides.
Dr Obokata also maintained that STAP cells do exist, and she has produced them more than 200 times. She added that she is willing to help scientists trying to replicate her experiments.
Furthermore, the notes that RIKEN reviewed in their investigation—2 notebooks that detail the STAP cell experiments—are not the complete set of notes Dr Obokata made. She said she has at least 4 or 5 other notebooks in different labs.
Dr Obokata has filed an appeal with RIKEN, asking the institute to reconsider its judgment. If RIKEN upholds the allegations of misconduct, Dr Obokata and 2 of her co-authors—Yoshiki Sasai, MD, PhD, and Teruhiko Wakayama, PhD—will face disciplinary action.
Meanwhile, a group of RIKEN investigators is conducting research to determine if STAP cells can be created, but they expect the process to take up to a year. ![]()
Synthetic collagen can function as hemostatic agent

the clotting power of KOD
Hartgerink Lab/Rice University
Researchers have synthesized a collagen mimetic that may help wounds heal by directing the natural clotting of blood.
It was several years ago that the team developed KOD, a synthetic collagen mimetic made of 36 amino acids that self-assemble into triple-helix nanofibers and hydrogels.
With their latest research, the group showed that KOD collagen matrices adhere to platelets and activate them, thereby creating clots in blood and plasma.
An account of this research appears in Biomacromolecules.
“We showed we can make small peptides that we can easily synthesize chemically . . .,” said study author Jeffrey Hartgerink, PhD, of Rice University in Houston, Texas.
“Those peptides self-assemble into fibers that, in turn, become a hydrogel. This hierarchy of assembly—from a peptide to a triple helix to a fiber to a hydrogel—mimics much of the hierarchy of assembly of natural collagen.”
Dr Hartgerink added that collagen’s importance goes beyond its role as a scaffold for cells.
“We’ve been thinking about KOD for hemostasis for a long time,” he said. “Natural collagen is already used in a variety of on-the-market products for hemostasis, but there are benefits to a synthetic system. We can avoid the immune problems associated with using collagen from cows, for example. The ability to synthesize KOD chemically gives us a pure product.”
Lab tests showed that KOD hydrogel traps red blood cells to stop bleeding and, unlike commercial barriers, binds and activates platelets that form clots to promote healing. The synthetic collagen matrices adhered to the platelets, and their activation was confirmed via the secretion of soluble P-selectin.
The tests also indicated that KOD does not promote inflammation. The researchers incubated THP-1 monocytes with KOD and observed “minimal” production of the proinflammatory cytokines TNF-α and IL-1β.
The team therefore believes KOD could improve upon commercial sponges or therapies based on naturally derived porcine or bovine-derived collagen that are now used to aid healing during or after surgery.
“We wouldn’t envision using KOD for major trauma, because there are conventional methods like tourniquets or using clay-based materials that are much more effective in that immediate situation,” said study author Vivek Kumar, PhD, also of Rice University.
“This is not going to be a battlefield dressing or something a first-responder is likely to use,” Dr Hartgerink added. “But when the goal is to promote delicate and natural healing where scarring is a concern, this can be more nuanced and effective.” ![]()
System allows blood group typing at the DNA level

Daniel Gay
A new system allows for accurate blood group typing at the DNA level, on a large scale and at a relatively low cost, according to a paper published in The Journal of Molecular Diagnostics.
Researchers designed this automated genotyping system using 96-well DNA microarrays for blood donation screening and a panel of 8 single-nucleotide polymorphisms (SNPs) to identify 16 alleles in 4 blood group systems—KEL, KIDD, DUFFY, and MNS.
The team said they developed this system because conventional hemagglutination falls short in 2 ways: it’s time consuming and involves a limited range of antigen testing.
“In the French Blood Service, the Etablissement Français du Sang (EFS), blood donation qualification laboratories test all blood donations for A, B, O, Rhesus, and KEL blood groups, but only 5% to 10% of donations are tested for other clinically significant antigens [such as FY1, FY2, JK1, JK2, MNS3, and MNS4],” said study investigator Jean-Charles Brès, PhD, of EFS Pyrénées Méditerranée in Montpellier, France.
So he and his colleagues developed their system—a robotic platform using a 96-well DNA microarray for multiplex blood group genotyping.
They designed an SNP module to allow for simultaneous determination of KEL (KEL*01/KEL*02, KEL*03/KEL*04), KIDD (JK*01/JK*02), DUFFY (FY*01/FY*02, FY*02M.01 or FY*X, and FY*02M.02 or FY*Fy), and MNS (GYPA*01/GYPA*02 or MNS*01/MNS*02, GYPB*03/GYPB*04 or MNS*03/MNS*04) blood group antigens.
The researchers tested the system in a pilot study, using 1132 EDTA-anticoagulated blood samples collected by the EFS. Random donors, mostly Caucasian, were extensively phenotyped using standard serologic hemagglutination techniques.
The team used 172 samples to determine scoring criteria for predicting phenotype and the remaining 960 samples for validation of the 96-well DNA microarray system.
A total of 938 samples were considered valid and assigned genotypes based on the scoring criteria determined for the 8 SNPs. Twenty-two samples were invalid because they were considered “uninterpretable” for all SNPs.
The researchers compared the phenotypes predicted from genotypes with those obtained by serologic typing. And they found the concordance rates between the DNA-based and standard hemagglutination assays were high.
The overall concordance rate was 99.92%. There was 100% concordance for KEL*03/KEL*04; GYPA*01/GYPA*02; and FY*01/FY*02/FY*02M.01/FY*02M.02. And the concordance rate was 99.89% for KEL*01/KEL*02; JK*01/JK*02; and GYPB*03/GYPB*04.
So the researchers said that, overall, this system appears effective. They also noted that the system allows for simultaneous multiplex assay of up to 96 samples in a single reaction run. But other DNA microarray formats with a lower number of wells can be processed as well.
For small batch production, the cost of genotyping, including genomic DNA extraction, labor, and equipment, was less than $2.60 per SNP for a multiplex set of 8 SNPs, which is 4 times lower than the per-antigen cost using serologic methods.
“In addition to providing more fully antigen-matched [red blood cells] and allowing better identification of rare donor blood types, this technology will reduce adverse reactions and decrease the relative cost of analysis,” Dr Brès said.
“High-throughput DNA typing could facilitate support for patients undergoing long-term transfusion who are at high risk of alloantibody production, such as patients with sickle cell disease, thalassemia, or autoimmune hemolytic anemia.” ![]()
Draft recommendations back aspirin for preeclampsia prevention
Prophylactic low-dose aspirin – 81 mg per day – should be started after 12 weeks’ gestation in women at high risk for developing preeclampsia, according to a draft recommendation issued by the U.S. Preventive Services Task Force in April.
The recommendation applies to asymptomatic pregnant women at increased risk for preeclampsia who have no contraindications to using low-dose aspirin and have not experienced adverse effects associated with aspirin previously.
"The USPSTF found adequate evidence of a reduction in preeclampsia, preterm birth, and IUGR [intrauterine growth restriction] in women at increased risk for preeclampsia who received low-dose aspirin, thus demonstrating substantial benefit," the recommendations state. In a review of clinical trials, low-dose aspirin (at doses of 50-160 mg per day) reduced the risk of preeclampsia by 24%, the risk of preterm birth by 14%, and the risk of IUGR by 20%. There also was "adequate evidence" that the risks of placental abruption, postpartum hemorrhage, and fetal intracranial bleeding were not increased with low-dose aspirin, the USPSTF statement said.
The draft recommendations were based on a review of data on low-dose aspirin and preeclampsia in 23 studies of women at high or average risk of preeclampsia, which was published online April 8 in Annals of Internal Medicine (doi: 10.7326/M13-2844).
The recommendation is considered a "B" recommendation, defined as one that has a "high certainty that the net benefit is moderate or there is moderate certainty that the net benefit is moderate to substantial." The statement includes a table to help identify patients who are at an increased risk of preeclampsia.
The last statement about low-dose aspirin and preeclampsia, issued by the USPSTF in 1996, concluded that there was not enough evidence to support a recommendation for or against the use of aspirin for preventing preeclampsia. The American College of Obstetricians and Gynecologists recommends low-dose aspirin, starting late in the first trimester, in women with a history of early-onset preeclampsia and preterm delivery before 34 weeks’ gestation, or a history of preeclampsia in more than one previous pregnancy.
The USPSTF is an independent panel of nonfederal experts in prevention and evidence-based medicine, which includes ob.gyns., pediatricians, family physicians, nurses, and health behavior specialists, according to the USPSTF website.
The draft recommendations are available here. Comments on the recommendations can be submitted via the website until May 5, 2014, at 5 p.m. EST.
Doc groups say Medicare payment data need context

Credit: NIH
In an effort to make the US healthcare system more transparent, the Centers for Medicare & Medicaid Services (CMS) released data on Medicare payments made to healthcare providers in 2012.
The CMS said the data provide the public with new insight into healthcare spending and physician practice patterns.
But physician groups argued that releasing the data without context—such as specific drivers of cost—could lead to misinterpretation.
The data set includes information for more than 880,000 distinct healthcare providers who collectively received $77 billion in Medicare payments in 2012, under the Medicare Part B Fee-For-Service program.
The CMS said these data make it possible to conduct a wide range of analyses that compare 6000 different types of services and procedures provided, as well as payments received by individual healthcare providers.
The information allows comparisons by physician, specialty, location, the types of medical service and procedures delivered, Medicare payment, and submitted charges.
“Currently, consumers have limited information about how physicians and other healthcare professionals practice medicine,” said Health and Human Services Secretary Kathleen Sebelius. “This data will help fill that gap by offering insight into the Medicare portion of a physician’s practice.”
The presidents of the American Society of Hematology (ASH) and the American Medical Association (AMA) expressed less positive views about the data.
“While ASH supports greater transparency about Medicare physician payment and its potential to enhance the quality of the US healthcare system, the society strongly believes that this incredibly complex data must be released with appropriate disclosures and explanatory statements that will encourage and facilitate value-based consumer decision making,” said ASH President Linda J. Burns, MD.
“Specifically, the numbers alone will not explain quality of care or account for specific drivers of cost such as specialty, location, supply costs, and support staff. The release of data without placing these aspects of care and others into context may result in inaccurate and misleading information for consumers.”
For example, the data show that the highest-paid cardiologist (a physician in Ocala, Florida) received more than $18 million in Medicare payments, or nearly $23 million when totaling the amount Medicare pays, the deductible and co-insurance amounts the beneficiary pays, and any amounts a third party pays. And that $23 million figure is nearly 80 times higher than the average payment for a cardiologist in 2012.
While this high figure could be a result of improper billing, it might also be explained by a number of other factors. For instance, the physician might specialize in geriatric care and therefore receive nearly all his payments from Medicare, or the figure might include payments for staff, medical devices, tests, medications, and supplies.
“We believe that [CMS’s data set] has significant shortcomings regarding the accuracy and value of the medical services rendered by physicians,” said AMA President Ardis Dee Hoven, MD.
“Releasing the data without context will likely lead to inaccuracies, misinterpretations, false conclusions, and other unintended consequences. The AMA is disappointed that CMS did not include reasonable safeguards that would help the public understand the limitations of this data.”
The CMS did compile a document that lists the limitations of the data (eg, they might not be representative of a physician’s entire practice). This document and the complete data set are available for download from the CMS website. ![]()