User login
Compound is potent FLT3 inhibitor, team says

Credit: Rhoda Baer
An experimental compound called TTT-3002 could be “one of the most potent FLT3 inhibitors to date,” according to researchers.
In preclinical experiments, TTT-3002 proved more active than the most potent FLT3 inhibitor currently in clinical trials.
TTT-3002 blocked FLT3 activity in human FLT3/ITD mutant leukemia cell lines, prolonged survival in a mouse model of FLT3-associated acute myeloid leukemia (AML), and proved toxic to leukemic cells from patients with AML.
Donald Small, MD, PhD, of Johns Hopkins University School of Medicine in Baltimore, and his colleagues reported these results in Blood.
“We’re very excited about TTT-3002, because it appears in our tests so far to be the most potent FLT3 inhibitor to date,” Dr Small said. “It showed activity against FLT3-mutated cells taken from patients and with minimal toxicity to normal bone marrow cells, making it a promising new candidate for the treatment of AML.”
In a series of experiments, the researchers found that the amount of TTT-3002 needed to block FLT3 activity in human leukemia cell lines was 6- to 7-fold lower than for ACC220, the most potent FLT3 inhibitor currently in clinical trials.
TTT-3002 also inhibited proteins made by genes further down the FLT3 signaling pathway, including STAT5, AKT, and MAPK. And it showed activity against the most frequently occurring FLT3 mutations, FLT3/ITD and FLT3/D835Y. (Many other inhibitors are ineffective against FLT3/D835Y mutations.)
When the researchers tested TTT-3002 in a mouse model of leukemia, they found the drug eliminated the presence of leukemic cells within 10 days of treatment.
Mice lived an average of more than 100 days after TTT-3002 treatment and resumed normal bone marrow activity. In comparison, mice treated with a placebo died an average of 18 days after treatment.
The researchers also found that TTT-3002 was toxic to leukemia samples taken from newly diagnosed and relapsed patients with AML, but it did not affect normal bone marrow cells taken from healthy donors.
A single dose of TTT-3002 caused more than 90% inhibition against FLT3 signaling that lasted for 12 hours. ![]()
How NK cells kill abnormal blood cells

Credit: Bjorn Onfelt/Dan Davis
New research provides additional insight into how natural killer (NK) cells eliminate abnormal hematopoietic cells.
The investigators evaluated 2 molecules that are known to play important roles in this process.
Ewing’s sarcoma-associated transcript 2 (EAT-2) and signaling lymphocytic activation molecule (SLAM)–associated protein (SAP) are expressed in NK cells, and their combined expression is essential for NK cells to kill abnormal hematopoietic cells.
“We knew that EAT-2 cooperates with SAP, and, with this research project, we wanted to better understand why they are both required for the proper functioning of NK cells,” said study author André Veillette, PhD, of the Institut de Recherches Cliniques de Montréal (IRCM) in Canada.
Dr Veillette and his colleagues described this research in the Journal of Experimental Medicine.
“We identified the molecular chain of events that occur and showed that EAT-2 and SAP perform different functions using distinct mechanisms,” Dr Veillette said. “These findings explain the cooperative and essential function of these 2 molecules in activating NK cells, thereby allowing them to kill abnormal blood cells.”
The investigators noted that SAP couples SLAM family receptors to the protein tyrosine kinase Fyn and the exchange factor Vav, thereby promoting conjugate formation between NK cells and target hematopoietic cells.
EAT-2, on the other hand, works by accelerating the polarization and exocytosis of cytotoxic granules toward hematopoietic cells.
EAT-2 mediates its effects in NK cells by linking SLAM family receptors to phospholipase Cγ, calcium fluxes, and Erk kinase. These signals are triggered by 1 or 2 tyrosines that are located in the carboxyl-terminal tail of EAT-2.
Dr Veillete pointed out that, although EAT-2 and SAP behave differently, both are linked to receptors of the SLAM family on the cell surface.
“Because they can make better drug targets, our future work will focus on these receptors,” he said, “which could eventually lead to identifying new potential treatment avenues for blood cancers such as leukemia and lymphoma.” ![]()
More ways to make the most of lasers in clinical practice
PHOENIX – What’s the latest in lasers? The most stubborn tattoos – those with blue or green ink – are now the easiest to remove with new laser technology and techniques. Microwave treatment for armpit hair is a real option, even on difficult-to-remove blond hair. Cutaneous laser expert Dr. Roy Geronemus, director of the Laser and Skin Surgery Center of New York, describes what dermatologists need to know about these and other innovative cosmetic treatments in an interview at the annual meeting of the American Society for Laser Medicine and Surgery.

But that’s not all. More data support the use of lasers for common medical conditions, says Dr. Geronemus. Hear his description of how the same new laser used for tattoo removal can be a noninvasive treatment to reduce either hypertrophic or atrophic scarring in any skin type, with practically no downtime. He also explains several new approaches that show promise as acne therapy.
On Twitter @sherryboschert
PHOENIX – What’s the latest in lasers? The most stubborn tattoos – those with blue or green ink – are now the easiest to remove with new laser technology and techniques. Microwave treatment for armpit hair is a real option, even on difficult-to-remove blond hair. Cutaneous laser expert Dr. Roy Geronemus, director of the Laser and Skin Surgery Center of New York, describes what dermatologists need to know about these and other innovative cosmetic treatments in an interview at the annual meeting of the American Society for Laser Medicine and Surgery.
But that’s not all. More data support the use of lasers for common medical conditions, says Dr. Geronemus. Hear his description of how the same new laser used for tattoo removal can be a noninvasive treatment to reduce either hypertrophic or atrophic scarring in any skin type, with practically no downtime. He also explains several new approaches that show promise as acne therapy.
On Twitter @sherryboschert
AT LASER 2014

HM 14 Special Report: Care of the Hospitalized Patient with Diabetes
Presenter:
Eric Felner, MD, Associate Professor of Pediatric Endocrinology and Director of the Pediatric Endocrine Fellowship Program at Emory University
Espousing a “3-Bag Theory of DKA management,” Dr. Eric Fellner presented an update of the inpatient management of diabetes mellitus at SHM 2014. This approach to dKA involves maintenance IV fluids based on BSA after fluid resuscitation, with variable proportions of ½ NS and D10 ½ NS with potassium chloride/potassium phosphate, and insulin given intravenously. This approach can reduce costs by avoiding multiple changes in IV fluid solution bags, and avoids multiple mistake-prone calculations. He recommends all patients with DKA under the age of 5 years be admitted to the PICU. Constant monitoring of lab values, glucose, vital signs, and clinical condition is also required. In general, insulin boluses do not provide a benefit over insulin drip alone, and use of bicarbonate remains controversial.
Although it is somewhat controversial as to whether all new type 1 diabetics need to be admitted, Dr. Felner favored admission due to improved teaching of patients/families, evaluation of the proposed insulin and carbohydrate regimen, and identification of potential insurance and social problems. Type 2 diabetics rarely get admitted for diabetic complications, but there are increasing numbers admitted for hyperglycemic hyperosmolar state.
Dr. Chang is a pediatric hospitalist with the University of San Diego Medical Center and Rady Children's Hospital, San Diego, and the pediatric editor for The Hospitalist.
Hormone therapy may decrease risk of NHL

SAN DIEGO—The use of hormone therapy may lower the risk of B-cell non-Hodgkin lymphoma (NHL) in menopausal women, according to a presentation at the AACR Annual Meeting 2014.
Researchers found that menopausal women who used hormone therapy were about 30% less likely than their untreated peers to develop NHL.
And the risk of NHL decreased further if a woman began receiving hormone therapy at a younger age and used it for a longer period of time.
Sophia Wang, PhD, of City of Hope National Medical Center in Duarte, California, presented these findings at the meeting as abstract 2918.
“The connection between lymphomas and menopausal hormone therapy use hinges on understanding the disease’s biology and the window of susceptibility,” Dr Wang said. “Hormone therapy is of interest because the loss of estrogen coupled with aging in women result in decreased immune function, which can elevate the risk of non-Hodgkin lymphoma.”
For this study, Dr Wang and her colleagues examined data from the Los Angeles Cancer Surveillance Program. They compared 685 postmenopausal women diagnosed with B-cell NHL to 685 postmenopausal women without lymphoma.
The researchers assessed the women’s use of menopausal hormone therapy, which included estrogen alone or estrogen with progestin in pill, patch, topical cream, or injected forms.
After controlling for factors such as age, race, and socioeconomic status, Dr Wang and her colleagues found that women who reported using any form of menopausal hormone therapy were approximately 30% less likely to be diagnosed with B-cell NHL, compared to women who reported never using hormone therapy.
An additional analysis showed that the risk reduction was even greater for women who initiated menopausal hormone therapy at 45 years of age or younger and used it for at least 5 years.
This group was approximately 40% less likely to be diagnosed with B-cell NHL compared to those who had never used hormone therapy.
Dr Wang said further research is needed to determine the exact biological mechanisms that might be linked to a lower NHL risk. These mechanisms could include supporting a healthy immune system or reducing inflammation.
She also cautioned that these findings are preliminary and should not change current recommendations and guidelines for menopausal hormone therapy use.
Due to well-established evidence tying menopausal hormone therapy to elevated risks of breast and endometrial cancers, the American Cancer Society recommends that women considering or using this therapy do so at the lowest effective dose for the shortest amount of time needed and that they discuss with their physicians other treatments to alleviate menopausal symptoms. ![]()
FDA approves new indications for dabigatran

Credit: Andre E.X. Brown
The US Food and Drug Administration (FDA) has approved dabigatran etexilate (Pradaxa) for the treatment and prevention of deep vein thrombosis (DVT) and pulmonary embolism (PE) in patients who have already received anticoagulation therapy.
The drug is now approved to treat DVT and PE in patients who have received parenteral anticoagulant therapy for 5 to 10 days.
And it is approved as prophylaxis to reduce the risk of recurrent DVT and PE in previously treated patients.
The FDA’s approval of dabigatran is based on the results of four phase 3 trials.
The first of these, the RE-COVER trial, was published in NEJM in 2009. The results suggested that a fixed dose of dabigatran was as effective as warfarin for treating acute venous thromboembolism (VTE). And the safety profiles of the 2 drugs were deemed similar.
Data from a second trial, RE-SONATE, indicated that dabigatran was significantly more effective than placebo as long-term VTE prophylaxis. But the anticoagulant posed a higher risk of clinically relevant bleeding.
Results from the third trial, RE-MEDY, suggested dabigatran was non-inferior to warfarin as VTE prophylaxis. And warfarin conferred a higher risk of clinically relevant bleeding.
Both RE-MEDY and RE-SONATE were published in NEJM last year.
Data from the fourth trial, RE-COVER II, indicated that dabigatran had a similar effect on VTE recurrence and a lower risk of bleeding than warfarin when used to treat acute VTE. These results were published in Circulation last year.
Dabigatran is already approved by the FDA as prophylaxis for stroke and systemic embolism in patients with non-valvular atrial fibrillation. The drug is marketed as Pradaxa by Boehringer Ingelheim. ![]()
Targeting sperm protection to combat malaria

Credit: CDC
New research has revealed a strategy for impairing fertility in malaria-carrying mosquitoes, potentially providing a tactic for combatting the disease.
Anopheles gambiae mosquitoes are the main transmitters of malaria, and the females mate only once during their lives.
They store the sperm from this single mating in an organ called the spermatheca, from which they repeatedly take sperm over the course of their lifetime to fertilize the eggs they lay.
The new research, published in PNAS, reveals that the sperm are partly protected by the actions of an enzyme called HPX15.
When researchers interfered with HPX15 in female A gambiae mosquitoes in the lab, the mosquitoes fertilized fewer eggs and, therefore, produced fewer offspring.
The team injected the female mosquitoes with an inhibitor to reduce the levels of HPX15. Normally, around 3% of the eggs a female lays do not develop into offspring. When the researchers reduced the levels of HPX15 in female mosquitoes, 20% of the mosquitoes’ eggs were infertile.
“[W]e reduced the number of offspring by a fifth, and that’s not a huge reduction,” said study author Flaminia Catteruccia, PhD, of the Harvard School of Public Health in Boston and the University of Perugia in Italy.
“But mosquitoes in the laboratory are subjected to much less stress than those in the wild, so we suspect that this kind of intervention would have a bigger impact on the fertility of wild mosquitoes. That’s something we would ultimately hope to investigate.”
The researchers also discovered how HPX15 is activated, suggesting another possible target for immobilizing the enzyme. The male mosquito transfers the hormone 20E to the female during mating, and it is this hormone that induces the expression of HPX15 in the female.
“The next step for this research is to think about how we could prevent activation of either the enzyme that protects the sperm, HPX15, or of the male trigger, 20E, that kicks that enzyme into action,” Dr Catteruccia said. “There may also be other pathways that we could target, and this is something that we’re keen to investigate.” ![]()
Novel Anticoagulants in Atrial Fibrillation
Approximately 2.3 million people in the United States and 4.5 million people in Europe have atrial fibrillation (AF), with an increase in prevalence with age to 8% among patients aged 80 years and older.[1] The most feared and potentially preventable complications of AF are stroke or systemic thromboembolism, and stroke in particular is increased approximately 5‐fold in patients with nonvalvular atrial fibrillation (NVAF).[2] For over 50 years, warfarin and similar vitamin K antagonists have been the principal anticoagulants used for preventing stroke in NVAF, with consistent reductions in systemic thromboembolic events when compared with placebo or aspirin.[2, 3] However, because of its narrow therapeutic window and related management difficulties (ie, frequent monitoring of international normalized ratio [INR] levels, dietary and medication restrictions, interindividual variability in dosing), many patients with NVAF do not receive warfarin or are inadequately treated.[4]
In response to the need for antithrombotic agents with better efficacy, patient tolerance, and convenience, the US Food and Drug Administration (FDA) recently approved 3 novel oral anticoagulants (NOACs) as alternatives to warfarin for NVAF: dabigatran, rivaroxaban, and apixaban. In this review, we evaluated the pharmacologic properties and clinical studies of these NOACs, including the continued role of warfarin in many patients requiring systemic anticoagulation, to guide practicing clinicians in providing individualized, patient‐centered care to each of their patients with NVAF.
PHARMACOLOGY
Mechanisms of Action
Whereas warfarin inhibits the formation of multiple vitamin K‐dependent coagulation factors (II, VII, IX, and X),[5] the NOACs are competitive and reversible inhibitors of more distal targets in the coagulation pathway. Dabigatran is a direct thrombin inhibitor, whereas rivaroxaban and apixaban directly inhibit factor Xa, ultimately resulting in the inhibition of fibrin formation and thrombosis.
Clinical Pathways and Drug Interactions
Key aspects of the pharmacokinetic profiles of the 3 NOACs are summarized in Table 1. In addition to these baseline properties of each medication, drug interactions play an important role in the effectiveness and potential toxicities of the NOACs. For example, dabigatran is almost exclusively excreted via glomerular filtration, resulting in a terminal half‐life of 12 to 17 hours in normal volunteers and a significantly higher half‐life in moderate and severe renal dysfunction (18 and 27 hours, respectively). In phase II and III trials, there was a 30% decrease in bioavailability when dabigatran was administered with pantoprazole, but no comparable effect was noted when coadministered with histamine receptor blockers like ranitidine.[6] In addition, although dabigatran has no significant interaction with hepatic P450 enzymes, its prodrug is excreted by the intestinal efflux transporter p‐glycoprotein. As a result, dabigatran's bioavailability is increased by coadministration with potent p‐glycoprotein inhibitors such as dronedarone, amiodarone, verapamil, diltiazem, or ketoconazole.[6, 7] According to FDA labeling, the only drug contraindicated with concomitant dabigatran administration is rifampin, which reduces serum concentration of dabigatran by 66%.
| Characteristic | Dabigatran | Rivaroxaban | Apixaban |
|---|---|---|---|
| |||
| Target | Factor IIa | Factor Xa | Factor Xa |
| Reversible binding | Yes | Yes | Yes |
| Half‐life, h | 1217 | 59 | 815 |
| Time to peak serum concentration, h | 13 | 24 | 34 |
| Protein binding, % | 35 | 9295 | 87 |
| Renal excretion, % | 80 | 66 | 2527 |
| Primary hepatic clearance pathway | Does not interact with CYP enzymes | CYP‐3A4 | CYP‐3A4 |
Unlike dabigatran, the absorption of rivaroxaban has significant variability between individuals, but the bioavailability of the 20‐mg dose increases by 39% and is significantly less variable when taken with food.[8] Phase I studies of rivaroxaban demonstrated that elderly patients had 50% higher serum concentrations when compared with younger patients.[7, 9] Also of note, rivaroxaban has 50% higher bioavailability in Japanese patients as compared with other ethnicities, including Chinese ethnicity, resulting in higher exposure to the drug and potentially explaining higher bleeding rates in Japan when using this drug.[9] The primary mechanisms for metabolism of rivaroxaban are the CYP‐3A4 and CYP‐2C8 pathways in the liver,[10] so other drugs metabolized through these pathways (eg, azole antifungals, protease inhibitors, clarithromycin) may have significant drug‐drug interactions.
Like the other NOACs, apixaban achieves its maximal concentration within 3 to 4 hours,[11] and like rivaroxaban, apixaban is metabolized by the CYP‐3A4 hepatic pathway. However, apixaban does not induce or inhibit hepatic cytochrome P450 (CYP) enzymes, so the potential for drug‐drug interactions is considered minimal.[12] Important exceptions include coadministration with ketoconazole or clarithromycin, each of which increases the bioavailability of apixaban up to 1.5‐fold, so a dose reduction to 2.5 mg twice‐daily (BID) is recommended.[11]
CLINICAL STUDIES
Randomized trials evaluating warfarin against placebo or aspirin for NVAF have spanned more than 3 decades, encompassing a variety of study designs, patient populations, and analytic techniques.[2, 3] Despite differences between trials, these studies have provided the framework for contemporary AF management, with consistent reductions in thromboembolic events with systemic anticoagulation, most notably among patients with multiple risk factors for stroke. Current professional guidelines recommend risk assessment of patients with NVAF, using the CHADS2 (1 point each for Congestive heart failure, Hypertension, Age 75 years, Diabetes, and 2 points for prior Stroke) or similar risk scores, to identify patients most likely to benefit from systemic anticoagulation.[1, 13] As a result of this extensive background literature, the 3 NOACs have primarily been evaluated against warfarin (instead of aspirin or placebo) as potential alternatives for reducing thromboembolic events in patients with NVAF. The 1 exception is a prematurely terminated trial of apixaban in warfarin‐ineligible patients with NVAF, in which apixaban reduced stroke or systemic embolism by 55% compared with aspirin after only 1.1 years of follow‐up, with no significant difference in major bleeding.[14]
Pivotal Clinical Trials
The 3 principal trials evaluating the NOACs against warfarin for NVAF are summarized in Table 2. In the Randomized Evaluation of Long‐term anticoagulation Therapy (RE‐LY) trial, dabigatran was compared with warfarin in 18,113 patients recruited from 951 clinical centers in 44 countries using a noninferiority study design.[15] Two different doses of dabigatran were studied, but only the 150‐mg BID dose was approved by the FDA. As a result, only the findings from the clinically approved 150‐mg dose are summarized in this review. Although RE‐LY was considered a semiblinded randomized trial, patients enrolled in the warfarin control arm underwent regular INR surveillance by their treating physicians, leaving the trial open to potential reporting biases. The authors tried to minimize bias by providing a standardized protocol for INR management, and by assigning 2 independent investigators blinded to the treatment assignments to adjudicate each event.
| Characteristic | RE‐LY | ROCKET‐AF | ARISTOTLE |
|---|---|---|---|
| |||
| Drug | Dabigatran | Rivaroxaban | Apixaban |
| Dosing | 150 mg BID (110 mg BID also tested) | 20 mg daily (15 mg for creatinine clearance 3049 mL/min) | 5 mg BID (2.5 mg for patients at higher risk of bleeding)a |
| Total population | 18,113 | 14,264 | 18,201 |
| Randomization | Semiblinded | Double blinded | Double blinded |
| Primary analytic approach | Noninferiority, intention‐to‐treat | Noninferiority, both intention‐to‐treat and on‐treatment | Noninferiority, intention‐to‐treat |
| Primary efficacy end point | Stroke or systemic embolism | Stroke or systemic embolism | Stroke or systemic embolism |
| Primary safety end point | Major bleeding | Major and clinically relevant nonmajor bleeding | Major bleeding |
| Key inclusion criteria | |||
| Documented atrial fibrillation | At screening or within 6 months | Within 30 days prior to randomization and within past year | At least 2 episodes recorded 2 weeks apart in past year |
| Eligible CHADS[2] scores | 1 | 2 | 1 |
| Selected exclusion criteria | |||
| Valvular heart disease | Any hemodynamically relevant or prosthetic valve | Severe mitral stenosis or any mechanical prosthetic valve | Moderate or severe mitral stenosis, or any mechanical prosthetic valve |
| Stroke | Severe 6 months or mild/moderate 14 days | Severe 3 months, any stroke 14 days, TIA 3 days | Stroke 7 days |
| Bleeding | Surgery 30 days, gastrointestinal bleed 12 months, any prior intracranial bleed, severe hypertension | Surgery 30 days, gastrointestinal bleed 6 months, active internal bleeding, any prior intracranial bleed, chronic dual antiplatelet therapy, severe hypertension, platelets 90,000/L | Any prior intracranial bleed, chronic dual antiplatelet therapy, severe hypertension |
| Renal | Creatinine clearance 30 mL/min | Creatinine clearance 30 mL/min | Creatinine clearance 25 mL/min |
The Rivaroxaban Once Daily Oral Direct Factor Xa Inhibition Compared with Vitamin K Antagonism for Prevention of Stroke and Embolism Trial in Atrial Fibrillation (ROCKET‐AF) study involved 14,264 patients from 1178 participating sites in 45 countries.[16] Again, a noninferiority design was used to evaluate 20‐mg daily rivaroxaban against warfarin, but the 2 arms were compared in double‐blinded, double‐dummy fashion (thus eliminating the reporting bias related to the warfarin control arm in RE‐LY). In addition, whereas RE‐LY randomized patients to fixed doses of dabigatran within their respective treatment arms, ROCKET‐AF required a lower dose of rivaroxaban (15 mg daily) for patients with moderately reduced creatinine clearance (3049 mL/min). Also of note, ROCKET‐AF reported both intention‐to‐treat and on‐treatment analyses, with outcomes listed as number of events per 100 patient‐years (instead of percent per year). To facilitate comparisons between trials, only the intention‐to‐treat data are reported in this review.
Like ROCKET‐AF, the Apixaban for Reduction in Stroke and Other Thromboembolic Events in Atrial Fibrillation (ARISTOTLE) study randomized patients using a double‐blind, double‐dummy, noninferiority design to therapy with apixaban 5 mg BID versus warfarin, ultimately enrolling 18,201 patients at 1034 clinical sites in 39 countries.[17] ARISTOTLE also provided a lower dose of apixaban (2.5 mg BID) for patients at higher risk of bleeding, defined by the authors as patients with 2 of the following characteristics: age 80 years and older, weight 60 kg, or serum creatinine 1.5 mg/dL. However, 5% of all patients in ARISTOTLE met these criteria and received the lower dose of apixaban.
Patient Populations and Study End Points
All 3 trials used relatively similar criteria for enrolling and following patients, with individual thromboembolic risk calculated using the CHADS2 definition, where higher scores are associated with incrementally higher risk of stroke.[18] However, ROCKET‐AF required a minimum CHADS2 score of 2 and permitted patients with lower left ventricular ejection fractions (35%), thus enrolling a higher‐risk patient population than RE‐LY and ARISTOTLE (where ejection fraction 40% was considered a risk factor for thromboembolism). As a result, more patients in ROCKET‐AF had prior stroke or systemic embolism than the other 2 trials (55% vs 20% in RE‐LY and 19% in ARISTOTLE) and more patients had significant heart failure (63%,vs 32% in RE‐LY and 36% in ARISTOTLE). These differences in enrollment ultimately translated into a higher overall risk profile in ROCKET‐AF (Table 3), which may have impacted some of the study results. In addition, patients requiring dual antiplatelet therapy (ie, clopidogrel and aspirin) were permitted in RE‐LY (5% of the final randomized population) but were excluded from the other 2 trials. The primary outcome for all 3 trials was the composite of stroke or systemic embolism, and the primary safety end point was major bleeding (RE‐LY and ARISTOTLE), or combined major and clinically relevant nonmajor bleeding events (ROCKET‐AF).
| Characteristic | RE‐LY | ROCKET‐AF | ARISTOTLE |
|---|---|---|---|
| |||
| Age, y | 72 | 73 | 70 |
| Male sex, % | 63 | 60 | 65 |
| Type of atrial fibrillation, % | |||
| Paroxysmal | 33 | 18 | 15 |
| Persistent/permanent | 67 | 82 | 85 |
| Comorbidities, % | |||
| Hypertension | 79 | 90 | 87 |
| Previous stroke or systemic embolism | 20 | 55 | 19 |
| Diabetes | 23 | 40 | 25 |
| Congestive heart failure | 32 | 63 | 36 |
| Prior myocardial infarction | 17 | 17 | 15 |
| CHADS2 score, % | |||
| 01 | 32 | 0 | 34 |
| 2 | 35 | 13 | 36 |
| 3 | 33 | 87 | 30 |
| Medications, % | |||
| ACE inhibitor or angiotensin receptor blocker | 67 | 55 | 71 |
| ‐Blockers | 64 | 65 | 64 |
| Digoxin | 29 | 39 | 32 |
| Amiodarone | 11 | Not reported | 11 |
| Aspirin | 39 | 36 | 31 |
| Aspirin and clopidogrel | 5 | 0 | 0 |
| Prior long‐term warfarin or other vitamin K antagonist | 50 | 62 | 57 |
| Creatinine clearance, % | |||
| >80 mL/min | 32 | 32 | 41 |
| >5080 mL/min | 48 | 47 | 42 |
| >3050 mL/min | 20 | 21 | 15 |
| 30 mL/min | 1 | None reported | 2 |
| Mean time in therapeutic range among warfarin‐treated patients, % | 64 | 55 | 66 |
Clinical Outcomes
As illustrated in Table 4, the dabigatran 150‐mg BID dose was both noninferior and superior to warfarin for reducing the composite primary end point. Patients randomized to this arm of the RE‐LY study experienced fewer ischemic strokes, fewer hemorrhagic strokes, and a strong trend toward lower all‐cause mortality despite higher rates of myocardial infarction. There was no difference in overall major bleeding, although a significant reduction in intracranial hemorrhage was offset by a higher rate of gastrointestinal bleeding.
| Clinical Outcome | RE‐LY | ROCKET‐AF | ARISTOTLE | |||||||||
|---|---|---|---|---|---|---|---|---|---|---|---|---|
| Dabigatran, 150 mg BID, %/y | Warfarin, %/y | Hazard Ratio | P Valuea | Rivaroxaban, 20 mg QD, No./100 Patient‐Years | Warfarin, No./100 Patient‐Years | Hazard Ratio | P Valuea | Apixaban 5 mg BID, %/y | Warfarin, %/yr | Hazard Ratio | P Valuea | |
| ||||||||||||
| Stroke or systemic embolism | 1.11 | 1.69 | 0.66 | 0.001 | 2.1 | 2.4 | 0.88 | 0.001 | 1.27 | 1.60 | 0.79 | 0.01 |
| Any stroke | 1.01 | 1.57 | 0.64 | 0.001 | 1.65 | 1.96 | 0.85 | 0.092 | 1.19 | 1.51 | 0.79 | 0.01 |
| Ischemic | 0.92 | 1.20 | 0.76 | 0.03 | 1.34 | 1.42 | 0.94 | 0.581 | 0.97 | 1.05 | 0.92 | 0.42 |
| Hemorrhagic | 0.10 | 0.38 | 0.26 | 0.001 | 0.26 | 0.44 | 0.59 | 0.024 | 0.24 | 0.47 | 0.51 | 0.001 |
| Myocardial infarction | 0.74 | 0.53 | 1.38 | 0.048 | 0.91 | 1.12 | 0.81 | 0.121 | 0.53 | 0.61 | 0.88 | 0.37 |
| All‐cause mortality | 3.64 | 4.13 | 0.88 | 0.051 | 1.87 | 2.21 | 0.85 | 0.073 | 3.52 | 3.94 | 0.89 | 0.047 |
| Major bleeds | 3.11 | 3.36 | 0.93 | 0.31 | 3.6 | 3.4 | 1.04 | 0.58 | 2.13 | 3.09 | 0.69 | 0.001 |
| Intracranial | 0.30 | 0.74 | 0.40 | 0.001 | 0.5 | 0.7 | 0.67 | 0.02 | 0.33 | 0.80 | 0.42 | 0.001 |
| Gastrointestinal | 1.51 | 1.02 | 1.50 | 0.001 | 3.15b | 2.16b | 0.001 | 0.76 | 0.86 | 0.89 | 0.37 | |
In the intention‐to‐treat analyses from ROCKET‐AF, rivaroxaban was noninferior to warfarin for reducing the primary end point, and there was a significant reduction in hemorrhagic stroke by rivaroxaban. Again, a strong trend toward lower mortality was seen, and like RE‐LY, an equivocal bleeding end point was largely driven by the combination of lower intracranial hemorrhage but higher gastrointestinal bleeding rates. Of note, the on‐treatment analysis from ROCKET‐AF demonstrated both noninferiority and superiority to warfarin, and there was no signal for higher rates of myocardial infarction as seen in RE‐LY.
In ARISTOTLE, apixaban was both noninferior and superior to warfarin, with stroke reduction largely driven by lower rates of intracranial hemorrhage. Unlike the prior studies of dabigatran and rivaroxaban, ARISTOTLE demonstrated a statistically significant reduction in all‐cause mortality and a significant reduction in major bleeding with apixaban therapy, with no increase in gastrointestinal bleeding.
INR Control
In prior randomized trials and observational registries of patients with AF, INR control has been highly variable, and better clinical outcomes were observed among patients consistently achieving INR levels between 2 and 3.[3, 19] For all 3 randomized trials of the NOACs summarized in this review, the warfarin control arms were analyzed using the Rosendaal method of evaluating total time in therapeutic range (TTR), reflecting the percent of time the patient had an INR between 2 and 3.[20] Overall, the mean TTR was 64% to 66% in the RE‐LY and ARISTOTLE trials, but only 55% in ROCKET‐AF. This has led to considerable criticism of the ROCKET‐AF trial, given concerns for a less robust comparator arm for rivaroxaban (and thus the potential for inflated efficacy of rivaroxaban over warfarin).[21, 22] However, these TTR levels are similar to those reported in prior studies of warfarin and may better represent real‐world INR management across multiple countries.[23]
Of note, the heterogeneity of INR management also appeared to impact clinical outcomes. For example, in RE‐LY, the INR control for warfarin was particularly poor in countries from east and southeast Asia, which may explain the more robust performance of dabigatran in these regions (vs Western and Central Europe, where TTR was >64%).[24] In the same analysis of variability within the RE‐LY trial, center‐specific TTRs demonstrated higher rates of cardiovascular events and major bleeds in centers with TTR 57%.[24] A different issue was noted in ROCKET‐AF, where TTR was relatively low in the overall trial and clinical outcomes were more equivalent between rivaroxaban and warfarin, when compared with the superiority of the new drugs in RE‐LY and ARISTOTLE. However, in ROCKET‐AF centers with mean TTR >68%, rivaroxaban was associated with higher rates of stroke and systemic embolism, and in the US subgroup (where TTR was 64%), rivaroxaban had a higher bleeding rate than warfarin.[9] Taken together, these findings highlight the potential for net clinical benefit among patients and populations with poor INR control during warfarin therapy, and conversely, the loss of benefit (and even potential harm) if replacing good INR management with the newer antithrombotic drugs.
To further explore these questions regarding NOAC efficacy and safety, the FDA review of rivaroxaban included a calculation of the major bleeds incurred per embolic event prevented.[9] Using this risk‐benefit ratio, the FDA confirmed that the advantage of using rivaroxaban over warfarin in ROCKET‐AF occurred among patients with difficult INR control, whereas patients with better INR management did not experience this net clinical benefit. As a result, in the absence of carefully managed INR levels in randomized trials (where INRs are managed through an intensive protocol), careful selection of patients with poor INR control may be prudent when considering rivaroxaban or other NOACs over warfarin.
Patient‐Centered Selection of Therapy
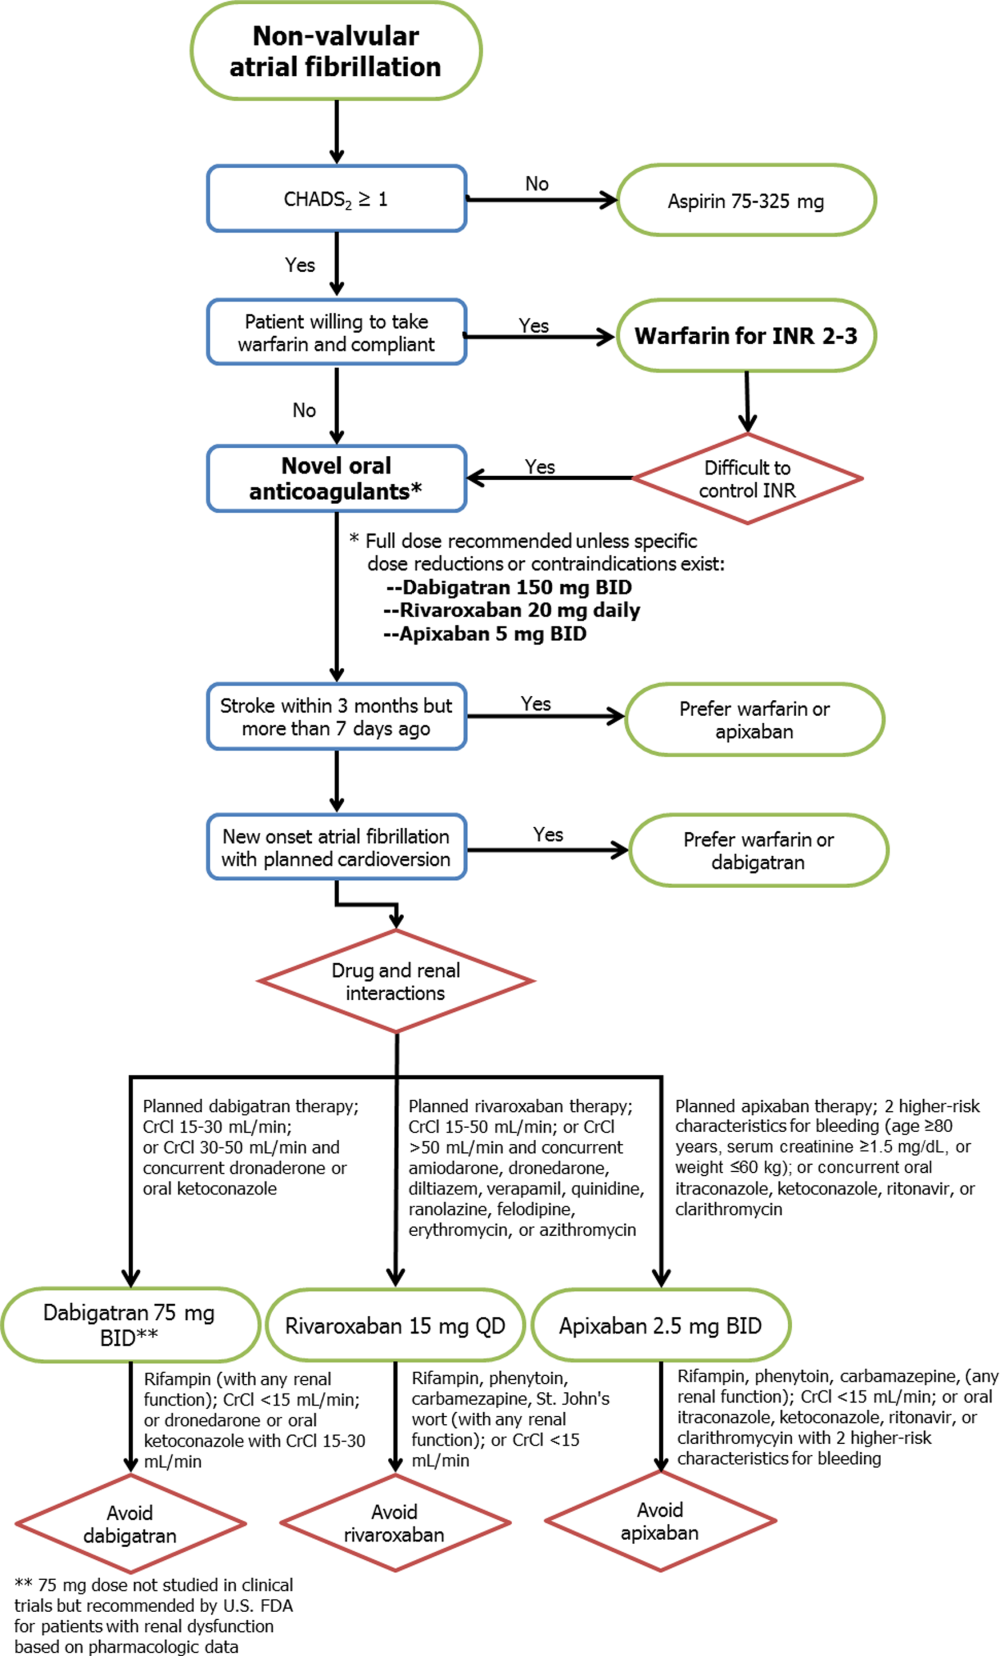
Although none of the NOACs have been compared with each other, several important drug and trial characteristics may help identify patients most likely to benefit from a specific drug choice for preventing thromboembolism in NVAF (Figure 1). For example, the modest increase in myocardial infarction noted among patients randomized to dabigatran in RE‐LY remains inadequately understood, and may lead some practitioners to favor using rivaroxaban or apixaban for NVAF patients at risk for coronary events. Others may point to the mortality reduction and lower rates of bleeding, including no increase in gastrointestinal hemorrhage, among patients receiving apixaban in ARISTOTLE. Concerns about reversibility also may impact drug selection, as none of the NOACs can be easily reversed for major life‐threatening bleeding, although potential antidotes are in development and may hopefully address this concern in the near future.[25] Other considerations include patient adherence to the twice‐daily dosing regimen of dabigatran or apixaban, comorbid conditions such as bleeding risk, drug‐drug interactions, outcomes reported during postmarketing surveillance, and cost. Overall, the noninferiority of these new agents compared with warfarin, plus their superiority in reducing the risk of important clinical events like intracranial hemorrhage, has led some professional societies to recommend the NOACs over warfarin in patients with NVAF whose CHADS2 scores are 1 or greater.[26]
Limitations
Several important limitations to these agents and their principal clinical trials should be noted. First, all 3 NOACs were compared with warfarin (or aspirin in the 1 prematurely halted apixaban trial), so comparisons between each drug and comparisons with placebo cannot be extrapolated from the data available. Second, the importance of remaining on label and using the NOACs appropriately for NVAF cannot be overemphasized, as recent experience with the NOACs among patients with mechanical heart valves or other clinical scenarios outside of the patient populations from the pivotal clinical trials (eg, severe renal dysfunction) will likely result in adverse patient outcomes.[27] Third, despite greater reliability in drug effects between patients and lack of need for intensive INR monitoring, more than 1 in 5 patients treated with the NOACs in these trials prematurely stopped therapy before reaching a study end point. Some of this premature discontinuation may be related to the more consistent degree of systemic anticoagulation with NOACs when compared with warfarin, thus resulting in higher bleeding rates (major, minor, or nuisance) than those reported in older trials using aspirin or placebo as the comparator. For each new antithrombotic medication, annual rates of major bleeding were higher than annual thromboembolic event rates (3.1% vs 1.1% in RE‐LY, 3.6% vs 2.1% in ROCKET‐AF, and 2.1% vs 1.3% in ARISTOTLE, respectively), although similar trends were noted for patients treated with warfarin. Nonetheless, because the average thromboembolic event may have more devastating consequences than the average bleeding event,[28] these clinical considerations must be carefully weighed for each patient when expanding the use of all 3 new drugs to the general population with NVAF. Further evaluation of the NOACs in real‐world populations, including an assessment of these drugs among patients taking dual antiplatelet therapy, is clearly warranted.
CONCLUSIONS
The recent development of alternative anticoagulation strategies to warfarin represents an exciting new opportunity for preventing the devastating consequences of stroke or systemic thromboembolism in patients with NVAF. However, despite the limitations of chronic warfarin therapy, it remains highly effective for a large proportion of patients with good INR control. Future studies will allow clinicians to better understand the advantages and disadvantages of each NOAC, so that ultimately an individualized, patient‐centered plan of care may be developed for each patient with NVAF.
ACKNOWLEDGMENTS
Disclosures: No funding support was used for the preparation of this review. Parts of these data were previously presented at the annual meeting of the Midwest Stroke Network (October 2013). Dr. Patel has no disclosures to report. Dr. Mehdirad serves on the speaker's bureau for Johnson & Johnson and Bristol‐Myers Squibb. Dr. Lim receives grant support from Astellas and InfraReDx, is a consultant for Acist Medical and Astra Zeneca, and serves on the speaker's bureau for Boehringer Ingelheim, Boston Scientific, St. Jude Medical, Abiomed, and Volcano Corporation. Dr. Ferreira reports consulting for St. Jude Medical. Dr. Mikolajczak reports grant support from Medtronic. Dr. Stolker receives grant support from GE Healthcare; is a consultant for Cordis Corp, and serves on the speaker's bureau for Astra Zeneca, Astellas, and InfraReDx. Dr Ferreira also reports serving on the speaker's bureau for Medtronic.
- , , , et al. ACC/AHA/ESC 2006 guidelines for the management of patients with atrial fibrillation. Circulation. 2006;114:e257–e354.
- , , , . Antithrombotic therapy to prevent stroke in patients with atrial fibrillation: a meta‐analysis. Ann Intern Med. 1999;131:492–501.
- , , . Current trial‐associated outcomes with warfarin in prevention of stroke in patients with nonvalvular atrial fibrillation: a meta‐analysis. Arch Intern Med. 2012;172:623–631.
- , , , et al. Stroke prophylaxis in atrial fibrillation: who gets it and who does not? Report from the Stockholm Cohort‐study on Atrial Fibrillation (SCAF‐study). Eur Heart J. 2006;27:1954–1964.
- , , , et al. Oral anticoagulants: mechanism of action, clinical effectiveness, and optimal therapeutic range. Chest. 1998;114(5 suppl):445S–469S.
- U.S. Food and Drug Administration. Boehringer Ingelheim advisory committee briefing document for dabigatran. Available at: http://www.fda.gov/downloads/advisorycommittees/committeemeetingmaterials/drugs/cardiovascularandrenaldrugsadvisorycommittee/ucm226009.pdf. Accessed May 20, 2013.
- , , , et al. New oral anticoagulants in atrial fibrillation and acute coronary syndromes: ESC working group on thrombosis‐task force on anticoagulants in heart disease position paper. J Am Coll Cardiol. 2012;59:1413–1425.
- Rivaroxaban (Xarelto rivaroxaban tablets) prescribing information [package insert]. Titusville, NJ: Janssen Pharmaceuticals Inc.; 2011.
- U.S. Food and Drug Administration. Johnson 48:1–22.
- Apixaban (Eliquis apixaban tablets) prescribing information [package insert]. Princeton, NJ: Bristol‐Myers Squibb Co.; 2012.
- , , , et al. Apixaban metabolism and pharmacokinetics after oral administration to humans. Drug Metab Dispos. 2009;37:74–81.
- , , , et al. Antithrombotic therapy for atrial fibrillation: antithrombotic therapy and prevention of thrombosis, 9th ed: American College of Chest Physicians evidence‐based clinical practice guidelines. Chest. 2012;141(2 suppl):e531S–575S.
- , , , et al. Apixaban in patients with atrial fibrillation. N Engl J Med. 2011;364:806–817.
- , , , et al. Dabigatran versus warfarin in patients with atrial fibrillation. N Engl J Med. 2009;361:1139–1151.
- , , , et al. Rivaroxaban versus warfarin in nonvalvular atrial fibrillation. N Engl J Med. 2011;365:883–891.
- , , , et al. Apixaban versus warfarin in patients with atrial fibrillation. N Engl J Med. 2011;365:981–992.
- , , , et al. Selecting patients with atrial fibrillation for anticoagulation: stroke risk stratification in patients taking aspirin. Circulation. 2004;110:2287–2292.
- , , , et al. Evaluation of the pattern of treatment, level of anticoagulation control, and outcome of treatment with warfarin in patients with non‐valvar atrial fibrillation: a record linkage study in a large British population. Heart. 2005;91:472–477.
- , , , . A method to determine the optimal intensity of oral anticoagulant therapy. Thromb Haemost. 1993;69:236–239.
- , . Rivaroxaban in atrial fibrillation. Vasc Health Risk Manag. 2012;8:525–531.
- , . Evaluating rivaroxaban for nonvalvular atrial fibrillation—regulatory considerations. N Engl J Med. 2011;365:1557–1559.
- , , , . Worldwide management of oral anticoagulant therapy: the ISAM study. J Thromb Thrombolysis. 2006;21:73–77.
- , , , et al. Efficacy and safety of dabigatran compared with warfarin at different levels of international normalised ratio control for stroke prevention in atrial fibrillation: an analysis of the RE‐LY trial. Lancet. 2010;376:975–983.
- , , , et al. Reversal of rivaroxaban and dabigatran by prothrombin complex concentrate: a randomized, placebo‐controlled, crossover study in healthy subjects. Circulation. 2011;124:1573–1579.
- , , , et al. Executive summary: antithrombotic therapy and prevention of thrombosis, 9th ed: American College of Chest Physicians evidence‐based clinical practice guidelines. Chest. 2012;141(2 suppl):7S–47S.
- , , , et al. Dabigatran versus warfarin in patients with mechanical heart valves. N Engl J Med. 2013;369:1206–1214.
- World Health Organization. Global burden of disease 2004 update: disability weights for diseases and conditions. Geneva: WHO, 2004. Available at: www.who.int/healthinfo/global_burden_disease/gbd2004_disabilityweights.pdf. Accessed February 24, 2013.
Approximately 2.3 million people in the United States and 4.5 million people in Europe have atrial fibrillation (AF), with an increase in prevalence with age to 8% among patients aged 80 years and older.[1] The most feared and potentially preventable complications of AF are stroke or systemic thromboembolism, and stroke in particular is increased approximately 5‐fold in patients with nonvalvular atrial fibrillation (NVAF).[2] For over 50 years, warfarin and similar vitamin K antagonists have been the principal anticoagulants used for preventing stroke in NVAF, with consistent reductions in systemic thromboembolic events when compared with placebo or aspirin.[2, 3] However, because of its narrow therapeutic window and related management difficulties (ie, frequent monitoring of international normalized ratio [INR] levels, dietary and medication restrictions, interindividual variability in dosing), many patients with NVAF do not receive warfarin or are inadequately treated.[4]
In response to the need for antithrombotic agents with better efficacy, patient tolerance, and convenience, the US Food and Drug Administration (FDA) recently approved 3 novel oral anticoagulants (NOACs) as alternatives to warfarin for NVAF: dabigatran, rivaroxaban, and apixaban. In this review, we evaluated the pharmacologic properties and clinical studies of these NOACs, including the continued role of warfarin in many patients requiring systemic anticoagulation, to guide practicing clinicians in providing individualized, patient‐centered care to each of their patients with NVAF.
PHARMACOLOGY
Mechanisms of Action
Whereas warfarin inhibits the formation of multiple vitamin K‐dependent coagulation factors (II, VII, IX, and X),[5] the NOACs are competitive and reversible inhibitors of more distal targets in the coagulation pathway. Dabigatran is a direct thrombin inhibitor, whereas rivaroxaban and apixaban directly inhibit factor Xa, ultimately resulting in the inhibition of fibrin formation and thrombosis.
Clinical Pathways and Drug Interactions
Key aspects of the pharmacokinetic profiles of the 3 NOACs are summarized in Table 1. In addition to these baseline properties of each medication, drug interactions play an important role in the effectiveness and potential toxicities of the NOACs. For example, dabigatran is almost exclusively excreted via glomerular filtration, resulting in a terminal half‐life of 12 to 17 hours in normal volunteers and a significantly higher half‐life in moderate and severe renal dysfunction (18 and 27 hours, respectively). In phase II and III trials, there was a 30% decrease in bioavailability when dabigatran was administered with pantoprazole, but no comparable effect was noted when coadministered with histamine receptor blockers like ranitidine.[6] In addition, although dabigatran has no significant interaction with hepatic P450 enzymes, its prodrug is excreted by the intestinal efflux transporter p‐glycoprotein. As a result, dabigatran's bioavailability is increased by coadministration with potent p‐glycoprotein inhibitors such as dronedarone, amiodarone, verapamil, diltiazem, or ketoconazole.[6, 7] According to FDA labeling, the only drug contraindicated with concomitant dabigatran administration is rifampin, which reduces serum concentration of dabigatran by 66%.
| Characteristic | Dabigatran | Rivaroxaban | Apixaban |
|---|---|---|---|
| |||
| Target | Factor IIa | Factor Xa | Factor Xa |
| Reversible binding | Yes | Yes | Yes |
| Half‐life, h | 1217 | 59 | 815 |
| Time to peak serum concentration, h | 13 | 24 | 34 |
| Protein binding, % | 35 | 9295 | 87 |
| Renal excretion, % | 80 | 66 | 2527 |
| Primary hepatic clearance pathway | Does not interact with CYP enzymes | CYP‐3A4 | CYP‐3A4 |
Unlike dabigatran, the absorption of rivaroxaban has significant variability between individuals, but the bioavailability of the 20‐mg dose increases by 39% and is significantly less variable when taken with food.[8] Phase I studies of rivaroxaban demonstrated that elderly patients had 50% higher serum concentrations when compared with younger patients.[7, 9] Also of note, rivaroxaban has 50% higher bioavailability in Japanese patients as compared with other ethnicities, including Chinese ethnicity, resulting in higher exposure to the drug and potentially explaining higher bleeding rates in Japan when using this drug.[9] The primary mechanisms for metabolism of rivaroxaban are the CYP‐3A4 and CYP‐2C8 pathways in the liver,[10] so other drugs metabolized through these pathways (eg, azole antifungals, protease inhibitors, clarithromycin) may have significant drug‐drug interactions.
Like the other NOACs, apixaban achieves its maximal concentration within 3 to 4 hours,[11] and like rivaroxaban, apixaban is metabolized by the CYP‐3A4 hepatic pathway. However, apixaban does not induce or inhibit hepatic cytochrome P450 (CYP) enzymes, so the potential for drug‐drug interactions is considered minimal.[12] Important exceptions include coadministration with ketoconazole or clarithromycin, each of which increases the bioavailability of apixaban up to 1.5‐fold, so a dose reduction to 2.5 mg twice‐daily (BID) is recommended.[11]
CLINICAL STUDIES
Randomized trials evaluating warfarin against placebo or aspirin for NVAF have spanned more than 3 decades, encompassing a variety of study designs, patient populations, and analytic techniques.[2, 3] Despite differences between trials, these studies have provided the framework for contemporary AF management, with consistent reductions in thromboembolic events with systemic anticoagulation, most notably among patients with multiple risk factors for stroke. Current professional guidelines recommend risk assessment of patients with NVAF, using the CHADS2 (1 point each for Congestive heart failure, Hypertension, Age 75 years, Diabetes, and 2 points for prior Stroke) or similar risk scores, to identify patients most likely to benefit from systemic anticoagulation.[1, 13] As a result of this extensive background literature, the 3 NOACs have primarily been evaluated against warfarin (instead of aspirin or placebo) as potential alternatives for reducing thromboembolic events in patients with NVAF. The 1 exception is a prematurely terminated trial of apixaban in warfarin‐ineligible patients with NVAF, in which apixaban reduced stroke or systemic embolism by 55% compared with aspirin after only 1.1 years of follow‐up, with no significant difference in major bleeding.[14]
Pivotal Clinical Trials
The 3 principal trials evaluating the NOACs against warfarin for NVAF are summarized in Table 2. In the Randomized Evaluation of Long‐term anticoagulation Therapy (RE‐LY) trial, dabigatran was compared with warfarin in 18,113 patients recruited from 951 clinical centers in 44 countries using a noninferiority study design.[15] Two different doses of dabigatran were studied, but only the 150‐mg BID dose was approved by the FDA. As a result, only the findings from the clinically approved 150‐mg dose are summarized in this review. Although RE‐LY was considered a semiblinded randomized trial, patients enrolled in the warfarin control arm underwent regular INR surveillance by their treating physicians, leaving the trial open to potential reporting biases. The authors tried to minimize bias by providing a standardized protocol for INR management, and by assigning 2 independent investigators blinded to the treatment assignments to adjudicate each event.
| Characteristic | RE‐LY | ROCKET‐AF | ARISTOTLE |
|---|---|---|---|
| |||
| Drug | Dabigatran | Rivaroxaban | Apixaban |
| Dosing | 150 mg BID (110 mg BID also tested) | 20 mg daily (15 mg for creatinine clearance 3049 mL/min) | 5 mg BID (2.5 mg for patients at higher risk of bleeding)a |
| Total population | 18,113 | 14,264 | 18,201 |
| Randomization | Semiblinded | Double blinded | Double blinded |
| Primary analytic approach | Noninferiority, intention‐to‐treat | Noninferiority, both intention‐to‐treat and on‐treatment | Noninferiority, intention‐to‐treat |
| Primary efficacy end point | Stroke or systemic embolism | Stroke or systemic embolism | Stroke or systemic embolism |
| Primary safety end point | Major bleeding | Major and clinically relevant nonmajor bleeding | Major bleeding |
| Key inclusion criteria | |||
| Documented atrial fibrillation | At screening or within 6 months | Within 30 days prior to randomization and within past year | At least 2 episodes recorded 2 weeks apart in past year |
| Eligible CHADS[2] scores | 1 | 2 | 1 |
| Selected exclusion criteria | |||
| Valvular heart disease | Any hemodynamically relevant or prosthetic valve | Severe mitral stenosis or any mechanical prosthetic valve | Moderate or severe mitral stenosis, or any mechanical prosthetic valve |
| Stroke | Severe 6 months or mild/moderate 14 days | Severe 3 months, any stroke 14 days, TIA 3 days | Stroke 7 days |
| Bleeding | Surgery 30 days, gastrointestinal bleed 12 months, any prior intracranial bleed, severe hypertension | Surgery 30 days, gastrointestinal bleed 6 months, active internal bleeding, any prior intracranial bleed, chronic dual antiplatelet therapy, severe hypertension, platelets 90,000/L | Any prior intracranial bleed, chronic dual antiplatelet therapy, severe hypertension |
| Renal | Creatinine clearance 30 mL/min | Creatinine clearance 30 mL/min | Creatinine clearance 25 mL/min |
The Rivaroxaban Once Daily Oral Direct Factor Xa Inhibition Compared with Vitamin K Antagonism for Prevention of Stroke and Embolism Trial in Atrial Fibrillation (ROCKET‐AF) study involved 14,264 patients from 1178 participating sites in 45 countries.[16] Again, a noninferiority design was used to evaluate 20‐mg daily rivaroxaban against warfarin, but the 2 arms were compared in double‐blinded, double‐dummy fashion (thus eliminating the reporting bias related to the warfarin control arm in RE‐LY). In addition, whereas RE‐LY randomized patients to fixed doses of dabigatran within their respective treatment arms, ROCKET‐AF required a lower dose of rivaroxaban (15 mg daily) for patients with moderately reduced creatinine clearance (3049 mL/min). Also of note, ROCKET‐AF reported both intention‐to‐treat and on‐treatment analyses, with outcomes listed as number of events per 100 patient‐years (instead of percent per year). To facilitate comparisons between trials, only the intention‐to‐treat data are reported in this review.
Like ROCKET‐AF, the Apixaban for Reduction in Stroke and Other Thromboembolic Events in Atrial Fibrillation (ARISTOTLE) study randomized patients using a double‐blind, double‐dummy, noninferiority design to therapy with apixaban 5 mg BID versus warfarin, ultimately enrolling 18,201 patients at 1034 clinical sites in 39 countries.[17] ARISTOTLE also provided a lower dose of apixaban (2.5 mg BID) for patients at higher risk of bleeding, defined by the authors as patients with 2 of the following characteristics: age 80 years and older, weight 60 kg, or serum creatinine 1.5 mg/dL. However, 5% of all patients in ARISTOTLE met these criteria and received the lower dose of apixaban.
Patient Populations and Study End Points
All 3 trials used relatively similar criteria for enrolling and following patients, with individual thromboembolic risk calculated using the CHADS2 definition, where higher scores are associated with incrementally higher risk of stroke.[18] However, ROCKET‐AF required a minimum CHADS2 score of 2 and permitted patients with lower left ventricular ejection fractions (35%), thus enrolling a higher‐risk patient population than RE‐LY and ARISTOTLE (where ejection fraction 40% was considered a risk factor for thromboembolism). As a result, more patients in ROCKET‐AF had prior stroke or systemic embolism than the other 2 trials (55% vs 20% in RE‐LY and 19% in ARISTOTLE) and more patients had significant heart failure (63%,vs 32% in RE‐LY and 36% in ARISTOTLE). These differences in enrollment ultimately translated into a higher overall risk profile in ROCKET‐AF (Table 3), which may have impacted some of the study results. In addition, patients requiring dual antiplatelet therapy (ie, clopidogrel and aspirin) were permitted in RE‐LY (5% of the final randomized population) but were excluded from the other 2 trials. The primary outcome for all 3 trials was the composite of stroke or systemic embolism, and the primary safety end point was major bleeding (RE‐LY and ARISTOTLE), or combined major and clinically relevant nonmajor bleeding events (ROCKET‐AF).
| Characteristic | RE‐LY | ROCKET‐AF | ARISTOTLE |
|---|---|---|---|
| |||
| Age, y | 72 | 73 | 70 |
| Male sex, % | 63 | 60 | 65 |
| Type of atrial fibrillation, % | |||
| Paroxysmal | 33 | 18 | 15 |
| Persistent/permanent | 67 | 82 | 85 |
| Comorbidities, % | |||
| Hypertension | 79 | 90 | 87 |
| Previous stroke or systemic embolism | 20 | 55 | 19 |
| Diabetes | 23 | 40 | 25 |
| Congestive heart failure | 32 | 63 | 36 |
| Prior myocardial infarction | 17 | 17 | 15 |
| CHADS2 score, % | |||
| 01 | 32 | 0 | 34 |
| 2 | 35 | 13 | 36 |
| 3 | 33 | 87 | 30 |
| Medications, % | |||
| ACE inhibitor or angiotensin receptor blocker | 67 | 55 | 71 |
| ‐Blockers | 64 | 65 | 64 |
| Digoxin | 29 | 39 | 32 |
| Amiodarone | 11 | Not reported | 11 |
| Aspirin | 39 | 36 | 31 |
| Aspirin and clopidogrel | 5 | 0 | 0 |
| Prior long‐term warfarin or other vitamin K antagonist | 50 | 62 | 57 |
| Creatinine clearance, % | |||
| >80 mL/min | 32 | 32 | 41 |
| >5080 mL/min | 48 | 47 | 42 |
| >3050 mL/min | 20 | 21 | 15 |
| 30 mL/min | 1 | None reported | 2 |
| Mean time in therapeutic range among warfarin‐treated patients, % | 64 | 55 | 66 |
Clinical Outcomes
As illustrated in Table 4, the dabigatran 150‐mg BID dose was both noninferior and superior to warfarin for reducing the composite primary end point. Patients randomized to this arm of the RE‐LY study experienced fewer ischemic strokes, fewer hemorrhagic strokes, and a strong trend toward lower all‐cause mortality despite higher rates of myocardial infarction. There was no difference in overall major bleeding, although a significant reduction in intracranial hemorrhage was offset by a higher rate of gastrointestinal bleeding.
| Clinical Outcome | RE‐LY | ROCKET‐AF | ARISTOTLE | |||||||||
|---|---|---|---|---|---|---|---|---|---|---|---|---|
| Dabigatran, 150 mg BID, %/y | Warfarin, %/y | Hazard Ratio | P Valuea | Rivaroxaban, 20 mg QD, No./100 Patient‐Years | Warfarin, No./100 Patient‐Years | Hazard Ratio | P Valuea | Apixaban 5 mg BID, %/y | Warfarin, %/yr | Hazard Ratio | P Valuea | |
| ||||||||||||
| Stroke or systemic embolism | 1.11 | 1.69 | 0.66 | 0.001 | 2.1 | 2.4 | 0.88 | 0.001 | 1.27 | 1.60 | 0.79 | 0.01 |
| Any stroke | 1.01 | 1.57 | 0.64 | 0.001 | 1.65 | 1.96 | 0.85 | 0.092 | 1.19 | 1.51 | 0.79 | 0.01 |
| Ischemic | 0.92 | 1.20 | 0.76 | 0.03 | 1.34 | 1.42 | 0.94 | 0.581 | 0.97 | 1.05 | 0.92 | 0.42 |
| Hemorrhagic | 0.10 | 0.38 | 0.26 | 0.001 | 0.26 | 0.44 | 0.59 | 0.024 | 0.24 | 0.47 | 0.51 | 0.001 |
| Myocardial infarction | 0.74 | 0.53 | 1.38 | 0.048 | 0.91 | 1.12 | 0.81 | 0.121 | 0.53 | 0.61 | 0.88 | 0.37 |
| All‐cause mortality | 3.64 | 4.13 | 0.88 | 0.051 | 1.87 | 2.21 | 0.85 | 0.073 | 3.52 | 3.94 | 0.89 | 0.047 |
| Major bleeds | 3.11 | 3.36 | 0.93 | 0.31 | 3.6 | 3.4 | 1.04 | 0.58 | 2.13 | 3.09 | 0.69 | 0.001 |
| Intracranial | 0.30 | 0.74 | 0.40 | 0.001 | 0.5 | 0.7 | 0.67 | 0.02 | 0.33 | 0.80 | 0.42 | 0.001 |
| Gastrointestinal | 1.51 | 1.02 | 1.50 | 0.001 | 3.15b | 2.16b | 0.001 | 0.76 | 0.86 | 0.89 | 0.37 | |
In the intention‐to‐treat analyses from ROCKET‐AF, rivaroxaban was noninferior to warfarin for reducing the primary end point, and there was a significant reduction in hemorrhagic stroke by rivaroxaban. Again, a strong trend toward lower mortality was seen, and like RE‐LY, an equivocal bleeding end point was largely driven by the combination of lower intracranial hemorrhage but higher gastrointestinal bleeding rates. Of note, the on‐treatment analysis from ROCKET‐AF demonstrated both noninferiority and superiority to warfarin, and there was no signal for higher rates of myocardial infarction as seen in RE‐LY.
In ARISTOTLE, apixaban was both noninferior and superior to warfarin, with stroke reduction largely driven by lower rates of intracranial hemorrhage. Unlike the prior studies of dabigatran and rivaroxaban, ARISTOTLE demonstrated a statistically significant reduction in all‐cause mortality and a significant reduction in major bleeding with apixaban therapy, with no increase in gastrointestinal bleeding.
INR Control
In prior randomized trials and observational registries of patients with AF, INR control has been highly variable, and better clinical outcomes were observed among patients consistently achieving INR levels between 2 and 3.[3, 19] For all 3 randomized trials of the NOACs summarized in this review, the warfarin control arms were analyzed using the Rosendaal method of evaluating total time in therapeutic range (TTR), reflecting the percent of time the patient had an INR between 2 and 3.[20] Overall, the mean TTR was 64% to 66% in the RE‐LY and ARISTOTLE trials, but only 55% in ROCKET‐AF. This has led to considerable criticism of the ROCKET‐AF trial, given concerns for a less robust comparator arm for rivaroxaban (and thus the potential for inflated efficacy of rivaroxaban over warfarin).[21, 22] However, these TTR levels are similar to those reported in prior studies of warfarin and may better represent real‐world INR management across multiple countries.[23]
Of note, the heterogeneity of INR management also appeared to impact clinical outcomes. For example, in RE‐LY, the INR control for warfarin was particularly poor in countries from east and southeast Asia, which may explain the more robust performance of dabigatran in these regions (vs Western and Central Europe, where TTR was >64%).[24] In the same analysis of variability within the RE‐LY trial, center‐specific TTRs demonstrated higher rates of cardiovascular events and major bleeds in centers with TTR 57%.[24] A different issue was noted in ROCKET‐AF, where TTR was relatively low in the overall trial and clinical outcomes were more equivalent between rivaroxaban and warfarin, when compared with the superiority of the new drugs in RE‐LY and ARISTOTLE. However, in ROCKET‐AF centers with mean TTR >68%, rivaroxaban was associated with higher rates of stroke and systemic embolism, and in the US subgroup (where TTR was 64%), rivaroxaban had a higher bleeding rate than warfarin.[9] Taken together, these findings highlight the potential for net clinical benefit among patients and populations with poor INR control during warfarin therapy, and conversely, the loss of benefit (and even potential harm) if replacing good INR management with the newer antithrombotic drugs.
To further explore these questions regarding NOAC efficacy and safety, the FDA review of rivaroxaban included a calculation of the major bleeds incurred per embolic event prevented.[9] Using this risk‐benefit ratio, the FDA confirmed that the advantage of using rivaroxaban over warfarin in ROCKET‐AF occurred among patients with difficult INR control, whereas patients with better INR management did not experience this net clinical benefit. As a result, in the absence of carefully managed INR levels in randomized trials (where INRs are managed through an intensive protocol), careful selection of patients with poor INR control may be prudent when considering rivaroxaban or other NOACs over warfarin.
Patient‐Centered Selection of Therapy
Although none of the NOACs have been compared with each other, several important drug and trial characteristics may help identify patients most likely to benefit from a specific drug choice for preventing thromboembolism in NVAF (Figure 1). For example, the modest increase in myocardial infarction noted among patients randomized to dabigatran in RE‐LY remains inadequately understood, and may lead some practitioners to favor using rivaroxaban or apixaban for NVAF patients at risk for coronary events. Others may point to the mortality reduction and lower rates of bleeding, including no increase in gastrointestinal hemorrhage, among patients receiving apixaban in ARISTOTLE. Concerns about reversibility also may impact drug selection, as none of the NOACs can be easily reversed for major life‐threatening bleeding, although potential antidotes are in development and may hopefully address this concern in the near future.[25] Other considerations include patient adherence to the twice‐daily dosing regimen of dabigatran or apixaban, comorbid conditions such as bleeding risk, drug‐drug interactions, outcomes reported during postmarketing surveillance, and cost. Overall, the noninferiority of these new agents compared with warfarin, plus their superiority in reducing the risk of important clinical events like intracranial hemorrhage, has led some professional societies to recommend the NOACs over warfarin in patients with NVAF whose CHADS2 scores are 1 or greater.[26]
Limitations
Several important limitations to these agents and their principal clinical trials should be noted. First, all 3 NOACs were compared with warfarin (or aspirin in the 1 prematurely halted apixaban trial), so comparisons between each drug and comparisons with placebo cannot be extrapolated from the data available. Second, the importance of remaining on label and using the NOACs appropriately for NVAF cannot be overemphasized, as recent experience with the NOACs among patients with mechanical heart valves or other clinical scenarios outside of the patient populations from the pivotal clinical trials (eg, severe renal dysfunction) will likely result in adverse patient outcomes.[27] Third, despite greater reliability in drug effects between patients and lack of need for intensive INR monitoring, more than 1 in 5 patients treated with the NOACs in these trials prematurely stopped therapy before reaching a study end point. Some of this premature discontinuation may be related to the more consistent degree of systemic anticoagulation with NOACs when compared with warfarin, thus resulting in higher bleeding rates (major, minor, or nuisance) than those reported in older trials using aspirin or placebo as the comparator. For each new antithrombotic medication, annual rates of major bleeding were higher than annual thromboembolic event rates (3.1% vs 1.1% in RE‐LY, 3.6% vs 2.1% in ROCKET‐AF, and 2.1% vs 1.3% in ARISTOTLE, respectively), although similar trends were noted for patients treated with warfarin. Nonetheless, because the average thromboembolic event may have more devastating consequences than the average bleeding event,[28] these clinical considerations must be carefully weighed for each patient when expanding the use of all 3 new drugs to the general population with NVAF. Further evaluation of the NOACs in real‐world populations, including an assessment of these drugs among patients taking dual antiplatelet therapy, is clearly warranted.
CONCLUSIONS
The recent development of alternative anticoagulation strategies to warfarin represents an exciting new opportunity for preventing the devastating consequences of stroke or systemic thromboembolism in patients with NVAF. However, despite the limitations of chronic warfarin therapy, it remains highly effective for a large proportion of patients with good INR control. Future studies will allow clinicians to better understand the advantages and disadvantages of each NOAC, so that ultimately an individualized, patient‐centered plan of care may be developed for each patient with NVAF.
ACKNOWLEDGMENTS
Disclosures: No funding support was used for the preparation of this review. Parts of these data were previously presented at the annual meeting of the Midwest Stroke Network (October 2013). Dr. Patel has no disclosures to report. Dr. Mehdirad serves on the speaker's bureau for Johnson & Johnson and Bristol‐Myers Squibb. Dr. Lim receives grant support from Astellas and InfraReDx, is a consultant for Acist Medical and Astra Zeneca, and serves on the speaker's bureau for Boehringer Ingelheim, Boston Scientific, St. Jude Medical, Abiomed, and Volcano Corporation. Dr. Ferreira reports consulting for St. Jude Medical. Dr. Mikolajczak reports grant support from Medtronic. Dr. Stolker receives grant support from GE Healthcare; is a consultant for Cordis Corp, and serves on the speaker's bureau for Astra Zeneca, Astellas, and InfraReDx. Dr Ferreira also reports serving on the speaker's bureau for Medtronic.
- , , , et al. ACC/AHA/ESC 2006 guidelines for the management of patients with atrial fibrillation. Circulation. 2006;114:e257–e354.
- , , , . Antithrombotic therapy to prevent stroke in patients with atrial fibrillation: a meta‐analysis. Ann Intern Med. 1999;131:492–501.
- , , . Current trial‐associated outcomes with warfarin in prevention of stroke in patients with nonvalvular atrial fibrillation: a meta‐analysis. Arch Intern Med. 2012;172:623–631.
- , , , et al. Stroke prophylaxis in atrial fibrillation: who gets it and who does not? Report from the Stockholm Cohort‐study on Atrial Fibrillation (SCAF‐study). Eur Heart J. 2006;27:1954–1964.
- , , , et al. Oral anticoagulants: mechanism of action, clinical effectiveness, and optimal therapeutic range. Chest. 1998;114(5 suppl):445S–469S.
- U.S. Food and Drug Administration. Boehringer Ingelheim advisory committee briefing document for dabigatran. Available at: http://www.fda.gov/downloads/advisorycommittees/committeemeetingmaterials/drugs/cardiovascularandrenaldrugsadvisorycommittee/ucm226009.pdf. Accessed May 20, 2013.
- , , , et al. New oral anticoagulants in atrial fibrillation and acute coronary syndromes: ESC working group on thrombosis‐task force on anticoagulants in heart disease position paper. J Am Coll Cardiol. 2012;59:1413–1425.
- Rivaroxaban (Xarelto rivaroxaban tablets) prescribing information [package insert]. Titusville, NJ: Janssen Pharmaceuticals Inc.; 2011.
- U.S. Food and Drug Administration. Johnson 48:1–22.
- Apixaban (Eliquis apixaban tablets) prescribing information [package insert]. Princeton, NJ: Bristol‐Myers Squibb Co.; 2012.
- , , , et al. Apixaban metabolism and pharmacokinetics after oral administration to humans. Drug Metab Dispos. 2009;37:74–81.
- , , , et al. Antithrombotic therapy for atrial fibrillation: antithrombotic therapy and prevention of thrombosis, 9th ed: American College of Chest Physicians evidence‐based clinical practice guidelines. Chest. 2012;141(2 suppl):e531S–575S.
- , , , et al. Apixaban in patients with atrial fibrillation. N Engl J Med. 2011;364:806–817.
- , , , et al. Dabigatran versus warfarin in patients with atrial fibrillation. N Engl J Med. 2009;361:1139–1151.
- , , , et al. Rivaroxaban versus warfarin in nonvalvular atrial fibrillation. N Engl J Med. 2011;365:883–891.
- , , , et al. Apixaban versus warfarin in patients with atrial fibrillation. N Engl J Med. 2011;365:981–992.
- , , , et al. Selecting patients with atrial fibrillation for anticoagulation: stroke risk stratification in patients taking aspirin. Circulation. 2004;110:2287–2292.
- , , , et al. Evaluation of the pattern of treatment, level of anticoagulation control, and outcome of treatment with warfarin in patients with non‐valvar atrial fibrillation: a record linkage study in a large British population. Heart. 2005;91:472–477.
- , , , . A method to determine the optimal intensity of oral anticoagulant therapy. Thromb Haemost. 1993;69:236–239.
- , . Rivaroxaban in atrial fibrillation. Vasc Health Risk Manag. 2012;8:525–531.
- , . Evaluating rivaroxaban for nonvalvular atrial fibrillation—regulatory considerations. N Engl J Med. 2011;365:1557–1559.
- , , , . Worldwide management of oral anticoagulant therapy: the ISAM study. J Thromb Thrombolysis. 2006;21:73–77.
- , , , et al. Efficacy and safety of dabigatran compared with warfarin at different levels of international normalised ratio control for stroke prevention in atrial fibrillation: an analysis of the RE‐LY trial. Lancet. 2010;376:975–983.
- , , , et al. Reversal of rivaroxaban and dabigatran by prothrombin complex concentrate: a randomized, placebo‐controlled, crossover study in healthy subjects. Circulation. 2011;124:1573–1579.
- , , , et al. Executive summary: antithrombotic therapy and prevention of thrombosis, 9th ed: American College of Chest Physicians evidence‐based clinical practice guidelines. Chest. 2012;141(2 suppl):7S–47S.
- , , , et al. Dabigatran versus warfarin in patients with mechanical heart valves. N Engl J Med. 2013;369:1206–1214.
- World Health Organization. Global burden of disease 2004 update: disability weights for diseases and conditions. Geneva: WHO, 2004. Available at: www.who.int/healthinfo/global_burden_disease/gbd2004_disabilityweights.pdf. Accessed February 24, 2013.

Letter to the Editor
Fanucchi et al. provide compelling evidence that geographic localization decreases pager frequency in a dose‐dependent fashion.[1] However, the study's inability to capture the burden of face‐to‐face interruptions for localized teams undermines their conclusion that reduced paging will decrease resident workload and increase physician efficiency.
Although in‐person communications are less prone to error, psychological research suggests it is the actual interruption (and not just the modality) that disrupts cognitive processes and thus impedes problem solving, decision making, patient care efficiency, and safety.[2]
One study based in a teaching hospital emergency room (an effectively completely geographically localized care setting) found that attending physicians were interrupted once every 13.8 minutes on average. Only 1.86% of intrusions were from pages; 85.7% were face‐to‐face interruptions by nurses or medical staff.[3] Anecdotal evidence after restructuring our hospital's housestaff medicine teams to a geographic model was analogous. Such frequent disruptions would contradict Fanucchi et al.'s claim that direct communication[s]lead to fewer overall interruptions,[1] and would nullify the benefit of decreased paging.
Geographic localization offers potential advantages. However, rigorous scrutiny measuring amalgamate pager and in‐person interruptions is needed to know whether these translate into tangible workflow benefits.
- , , . (Re)turning the pages of residency: the impact of localizing resident physicians to hospital units on paging frequency. J Hosp Med. 2014;9(2):120–122.
- , , . A systematic review of the psychological literature on interruption and its patient safety implications. J Am Med Inform Assoc. 2012;19(1):6–12.
- , , . A study of emergency physician work and communication: a human factors approach. Isr J Em Med. 2005;5(3):35–42.
Fanucchi et al. provide compelling evidence that geographic localization decreases pager frequency in a dose‐dependent fashion.[1] However, the study's inability to capture the burden of face‐to‐face interruptions for localized teams undermines their conclusion that reduced paging will decrease resident workload and increase physician efficiency.
Although in‐person communications are less prone to error, psychological research suggests it is the actual interruption (and not just the modality) that disrupts cognitive processes and thus impedes problem solving, decision making, patient care efficiency, and safety.[2]
One study based in a teaching hospital emergency room (an effectively completely geographically localized care setting) found that attending physicians were interrupted once every 13.8 minutes on average. Only 1.86% of intrusions were from pages; 85.7% were face‐to‐face interruptions by nurses or medical staff.[3] Anecdotal evidence after restructuring our hospital's housestaff medicine teams to a geographic model was analogous. Such frequent disruptions would contradict Fanucchi et al.'s claim that direct communication[s]lead to fewer overall interruptions,[1] and would nullify the benefit of decreased paging.
Geographic localization offers potential advantages. However, rigorous scrutiny measuring amalgamate pager and in‐person interruptions is needed to know whether these translate into tangible workflow benefits.
- , , . (Re)turning the pages of residency: the impact of localizing resident physicians to hospital units on paging frequency. J Hosp Med. 2014;9(2):120–122.
- , , . A systematic review of the psychological literature on interruption and its patient safety implications. J Am Med Inform Assoc. 2012;19(1):6–12.
- , , . A study of emergency physician work and communication: a human factors approach. Isr J Em Med. 2005;5(3):35–42.
Impact of HOCDI on Sepsis Patients
There are approximately 3 million cases of Clostridium difficile infection (CDI) per year in the United States.[1, 2, 3, 4] Of these, 10% result in a hospitalization or occur as a consequence of the exposures and treatments associated with hospitalization.[1, 2, 3, 4] Some patients with CDI experience mild diarrhea that is responsive to therapy, but other patients experience severe, life‐threatening disease that is refractory to treatment, leading to pseudomembranous colitis, toxic megacolon, and sepsis with a 60‐day mortality rate that exceeds 12%.[5, 6, 7, 8, 9, 10, 11, 12, 13, 14]
Hospital‐onset CDI (HOCDI), defined as C difficile‐associated diarrhea and related symptoms with onset more than 48 hours after admission to a healthcare facility,[15] represents a unique marriage of CDI risk factors.[5] A vulnerable patient is introduced into an environment that contains both exposure to C difficile (through other patients or healthcare workers) and treatment with antibacterial agents that may diminish normal flora. Consequently, CDI is common among hospitalized patients.[16, 17, 18] A particularly important group for understanding the burden of disease is patients who initially present to the hospital with sepsis and subsequently develop HOCDI. Sepsis patients are often critically ill and are universally treated with antibiotics.
Determining the incremental cost and mortality risk attributable to HOCDI is methodologically challenging. Because HOCDI is associated with presenting severity, the sickest patients are also the most likely to contract the disease. HOCDI is also associated with time of exposure or length of stay (LOS). Because LOS is a risk factor, comparing LOS between those with and without HOCDI will overestimate the impact if the time to diagnosis is not taken into account.[16, 17, 19, 20] We aimed to examine the impact of HOCDI in hospitalized patients with sepsis using a large, multihospital database with statistical methods that took presenting severity and time to diagnosis into account.
METHODS
Data Source and Subjects
Permission to conduct this study was obtained from the institutional review board at Baystate Medical Center. We used the Premier Healthcare Informatics database, a voluntary, fee‐supported database created to measure quality and healthcare utilization, which has been used extensively in health services research.[21, 22, 23] In addition to the elements found in hospital claims derived from the uniform billing 04 form, Premier data include an itemized, date‐stamped log of all items and services charged to the patient or their insurer, including medications, laboratory tests, and diagnostic and therapeutic services. Approximately 75% of hospitals that submit data also provide information on actual hospital costs, taken from internal cost accounting systems. The rest provide cost estimates based on Medicare cost‐to‐charge ratios. Participating hospitals are similar to the composition of acute care hospitals nationwide, although they are more commonly small‐ to midsized nonteaching facilities and are more likely to be located in the southern United States.
We included medical (nonsurgical) adult patients with sepsis who were admitted to a participating hospital between July 1, 2004 and December 31, 2010. Because we sought to focus on the care of patients who present to the hospital with sepsis, we defined sepsis as the presence of a diagnosis of sepsis plus evidence of both blood cultures and antibiotic treatment within the first 2 days of hospitalization; we used the first 2 days of hospitalization rather than just the first day because, in administrative datasets, the duration of the first hospital day includes partial days that can vary in length. We excluded patients who died or were discharged prior to day 3, because HOCDI is defined as onset after 48 hours in a healthcare facility.[15] We also excluded surviving patients who received less than 3 consecutive days of antibiotics, and patients who were transferred from or to another acute‐care facility; the latter exclusion criterion was used because we could not accurately determine the onset or subsequent course of their illness.
Identification of Patients at Risk for and Diagnosed With HOCDI
Among eligible patients with sepsis, we aimed to identify a cohort at risk for developing CDI during the hospital stay. We excluded patients: (1) with a diagnosis indicating that diarrhea was present on admission, (2) with a diagnosis of CDI that was indicated to be present on admission, (3) who were tested for CDI on the first or second hospital day, and (4) who received an antibiotic that could be consistent with treatment for CDI (oral or intravenous [IV] metronidazole or oral vancomycin) on hospital days 1 or 2.
Next, we aimed to identify sepsis patients at risk for HOCDI who developed HOCDI during their hospital stay. Among eligible patients described above, we considered a patient to have HOCDI if they had an International Classification of Diseases, Ninth Revision, Clinical Modification diagnosis of CDI (primary or secondary but not present on admission), plus evidence of testing for CDI after hospital day 2, and treatment with oral vancomycin or oral or IV metronidazole that was started after hospital day 2 and within 2 days of the C difficile test, and evidence of treatment for CDI for at least 3 days unless the patient was discharged or died.
Patient Information
We recorded patient age, gender, marital status, insurance status, race, and ethnicity. Using software provided by the Healthcare Costs and Utilization Project of the Agency for Healthcare Research and Quality, we categorized information on 30 comorbid conditions. We also created a single numerical comorbidity score based on a previously published and validated combined comorbidity score that predicts 1‐year mortality.[24] Based on a previously described algorithm,[25] we used diagnosis codes to assess the source (lung, abdomen, urinary tract, blood, other) and type of sepsis (Gram positive, Gram negative, mixed, anaerobic, fungal). Because patients can have more than 1 potential source of sepsis (eg, pneumonia and urinary tract infection) and more than 1 organism causing infection (eg, urine with Gram negative rods and blood culture with Gram positive cocci), these categories are not mutually exclusive (see Supporting Table 1 in the online version of this article). We used billing codes to identify the use of therapies, monitoring devices, and pharmacologic treatments to characterize both initial severity of illness and severity at the time of CDI diagnosis. These therapies are included in a validated sepsis mortality prediction model (designed for administrative datasets) with similar discrimination and calibration to clinical intensive care unit (ICU) risk‐adjustment models such as the mortality probability model, version III.[26, 27]
Outcomes
Our primary outcome of interest was in‐hospital mortality. Secondary outcomes included LOS and costs for survivors only and for all patients.
Statistical Methods
We calculated patient‐level summary statistics for all patients using frequencies for binary variables and medians and interquartile percentiles for continuous variables. P values <0.05 were considered statistically significant.
To account for presenting severity and time to diagnosis, we used methods that have been described elsewhere.[12, 13, 18, 20, 28] First, we identified patients who were eligible to develop HOCDI. Second, for all eligible patients, we identified a date of disease onset (index date). For patients who met criteria for HOCDI, this was the date on which the patient was tested for CDI. For eligible patients without disease, this was a date randomly assigned to any time during the hospital stay.[29] Next, we developed a nonparsimonious propensity score model that included all patient characteristics (demographics, comorbidities, sepsis source, and severity of illness on presentation and on the index date; all variables listed in Table 1 were included in the propensity model). Some of the variables for this model (eg, mechanical ventilation and vasopressors) were derived from a validated severity model.[26] We adjusted for correlation within hospital when creating the propensity score using Huber‐White robust standard error estimators clustered at the hospital level.[30] We then created matched pairs with the same LOS prior to the index date and similar propensity for developing CDI. We first matched on index date, and then, within each index‐datematched subset, matched patients with and without HOCDI by their propensity score using a 5‐to‐1 greedy match algorithm.[31] We used the differences in LOS between the cases and controls after the index date to calculate the additional attributable LOS estimates; we also separately estimated the impact on cost and LOS in a group limited to those who survived after discharge because of concerns that death could shorten LOS and reduce costs.
| Before Matching | After Matching | |||||
|---|---|---|---|---|---|---|
| HOCDI, n=2,368, % | No CDI, n=216,547, % | P | HOCDI, n=2,368, % | No CDI, n=2,368, % | P | |
| ||||||
| Age, y | 70.9 (15.1) | 68.6 (16.8) | <0.01 | 70.9 (15.1) | 69.8 (15.9) | 0.02 |
| Male | 46.8 | 46.0 | 0.44 | 46.8 | 47.2 | 0.79 |
| Race | ||||||
| White | 61.0 | 63.3 | 61.0 | 58.1 | ||
| Black | 15.6 | 14.5 | <0.01 | 15.6 | 17.0 | 0.11 |
| Hispanic | 3.2 | 5.4 | 3.2 | 4.1 | ||
| Other race | 20.2 | 16.8 | 20.2 | 20.9 | ||
| Marital status | ||||||
| Married | 31.6 | 36.3 | <0.01 | 31.6 | 32.6 | 0.74 |
| Single/divorced | 52.8 | 51.1 | 52.8 | 52.0 | ||
| Other/unknown | 15.7 | 12.6 | 15.7 | 14.5 | ||
| Insurance status | ||||||
| Medicare traditional | 63.2 | 59.5 | 63.2 | 60.3 | ||
| Medicare managed | 10.6 | 10.1 | 10.6 | 10.9 | ||
| Medicaid traditional | 7.6 | 6.9 | 7.6 | 8.2 | ||
| Medicaid managed | 1.8 | 2.0 | <0.01 | 1.8 | 1.8 | 0.50 |
| Managed care | 10.8 | 12.3 | 10.8 | 12.0 | ||
| Commercial | 2.0 | 3.5 | 2.0 | 2.2 | ||
| Self‐pay/other/unknown | 4.0 | 5.7 | 4.0 | 4.7 | ||
| Infection source | ||||||
| Respiratory | 46.5 | 37.0 | <0.01 | 46.5 | 49.6 | 0.03 |
| Skin/bone | 10.1 | 8.6 | 0.01 | 10.1 | 11.2 | 0.21 |
| Urinary | 52.2 | 51.3 | 0.38 | 52.2 | 50.3 | 0.18 |
| Blood | 11.1 | 15.1 | <0.01 | 11.1 | 11.5 | 0.65 |
| Infecting organism | ||||||
| Gram negative | 35.0 | 36.6 | <0.01 | 35.0 | 33.1 | 0.18 |
| Anaerobe | 1.4 | 0.7 | <0.01 | 1.4 | 1.1 | 0.24 |
| Fungal | 17.5 | 7.5 | <0.01 | 17.5 | 18.3 | 0.44 |
| Most common comorbid conditions | ||||||
| Congestive heart failure | 35.1 | 24.6 | <0.01 | 35.1 | 37.5 | 0.06 |
| Chronic lung disease | 31.6 | 27.6 | <0.01 | 31.6 | 32.1 | 0.71 |
| Hypertension | 31.5 | 37.7 | <0.01 | 31.5 | 29.7 | 0.16 |
| Renal Failure | 29.7 | 23.8 | <0.01 | 29.7 | 31.2 | 0.28 |
| Weight Loss | 27.7 | 13.3 | <0.01 | 27.7 | 29.4 | 0.17 |
| Treatments by day 2 | ||||||
| ICU admission | 40.0 | 29.5 | <0.01 | 40.0 | 40.7 | 0.64 |
| Use of bicarbonate | 12.2 | 7.1 | <0.01 | 12.2 | 13.6 | 0.15 |
| Fresh frozen plasma | 1.4 | 1.0 | 0.03 | 1.4 | 1.1 | 0.36 |
| Inotropes | 1.4 | 0.9 | 0.01 | 1.4 | 2.2 | 0.04 |
| Hydrocortisone | 6.7 | 4.7 | <0.01 | 6.7 | 7.4 | 0.33 |
| Thiamine | 4.2 | 3.3 | 0.01 | 4.2 | 4.1 | 0.83 |
| Psychotropics (eg, haldol for delirium) | 10.0 | 9.2 | 0.21 | 10.0 | 10.8 | 0.36 |
| Restraints (eg, for delirium) | 2.0 | 1.5 | 0.05 | 2.0 | 2.5 | 0.29 |
| Angiotensin‐converting enzyme inhibitors | 12.1 | 13.2 | 0.12 | 12.1 | 10.9 | 0.20 |
| Statins | 18.8 | 21.1 | 0.01 | 18.8 | 16.9 | 0.09 |
| Drotrecogin alfa | 0.6 | 0.3 | 0.00 | 0.6 | 0.6 | 0.85 |
| Foley catheter | 19.2 | 19.8 | 0.50 | 19.2 | 22.0 | 0.02 |
| Diuretics | 28.5 | 25.4 | 0.01 | 28.5 | 29.6 | 0.42 |
| Red blood cells | 15.5 | 10.6 | <0.01 | 15.5 | 15.8 | 0.81 |
| Calcium channel blockers | 19.3 | 16.8 | 0.01 | 19.3 | 19.1 | 0.82 |
| ‐Blockers | 32.7 | 29.6 | 0.01 | 32.7 | 30.6 | 0.12 |
| Proton pump inhibitors | 59.6 | 53.1 | <0.01 | 59.6 | 61.0 | 0.31 |
Analysis Across Clinical Subgroups
In a secondary analysis, we examined heterogeneity in the association between HOCDI and outcomes within subsets of patients defined by age, combined comorbidity score, and admission to the ICU by day 2. We created separate propensity scores using the same covariates in the primary analysis, but limited matches to within these subsets. For each group, we examined how the covariates in the HOCDI and control groups differed after matching with inference tests that took the paired nature of the data into account. All analyses were carried out using Stata/SE 11.1 (StataCorp, College Station, TX).
RESULTS
We identified 486,943 adult sepsis admissions to a Premier hospital between July 1, 2004 and December 31, 2010. After applying all exclusion criteria, we had a final sample of 218,915 admissions with sepsis (from 400 hospitals) at risk for HOCDI (Figure 1). Of these, 2368 (1.08%) met criteria for diagnosis of CDI after hospital day 2 and were matched to controls using index date and propensity score.
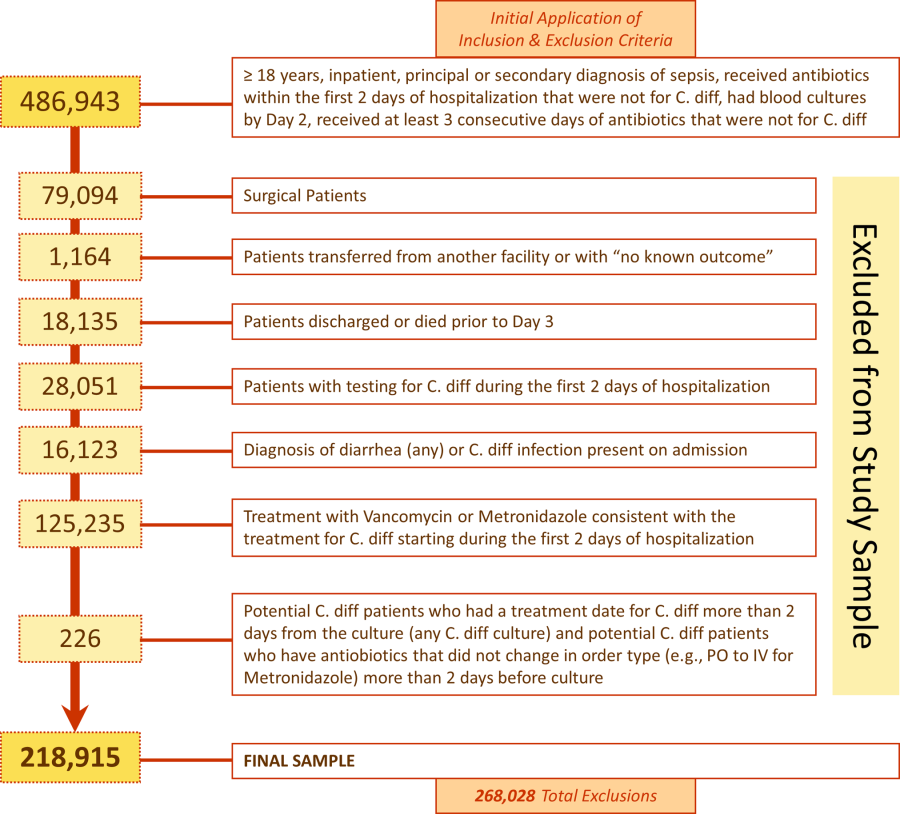
Patient and Hospital Factors
After matching, the median age was 71 years in cases and 70 years in controls (Table 1). Less than half (46%) of the population was male. Most cases (61%) and controls (58%) were white. Heart failure, hypertension, chronic lung disease, renal failure, and weight loss were the most common comorbid conditions. Our propensity model, which had a C statistic of 0.75, identified patients whose risk varied from a mean of 0.1% in the first decile to a mean of 3.8% in the tenth decile. Before matching, 40% of cases and 29% of controls were treated in the ICU by hospital day 2; after matching, 40% of both cases and controls were treated in the ICU by hospital day 2.
Distribution by LOS, Index Day, and Risk for Mortality
The unadjusted and unmatched LOS was longer for cases than controls (19 days vs 8 days, Table 2) (see Supporting Figure 1 in the online version of this article). Approximately 90% of the patients had an index day of 14 or less (Figure 2). Among patients both with and without CDI, the unadjusted mortality risk increased as the index day (and thus the total LOS) increased.
| Outcome | HOCDI | No HOCDI | Difference (95% CI) | P |
|---|---|---|---|---|
| ||||
| Length of stay, d | ||||
| Raw results | 19.2 | 8.3 | 8.4 (8.48.5) | <0.01 |
| Raw results for survivors only | 18.6 | 8.0 | 10.6 (10.311.0) | <0.01 |
| Matched results | 19.2 | 14.2 | 5.1(4.45.7) | <0.01 |
| Matched results for survivors only | 18.6 | 13.6 | 5.1 (4.45.8) | <0.01 |
| Mortality, % | ||||
| Raw results | 24.0 | 10.1 | 13.9 (12.615.1), RR=2.4 (2.22.5) | <0.01 |
| Matched results | 24.0 | 15.4 | 8.6 (6.410.9), RR=1.6 (1.41.8) | <0.01 |
| Costs, US$ | ||||
| Raw results median costs [interquartile range] | $26,187 [$15,117$46,273] | $9,988 [$6,296$17,351] | $16,190 ($15,826$16,555) | <0.01 |
| Raw results for survivors only [interquartile range] | $24,038 [$14,169$41,654] | $9,429 [$6,070$15,875] | $14,620 ($14,246$14,996) | <0.01 |
| Matched results [interquartile range] | $26,187 [$15,117$46,273] | $19,160 [$12,392$33,777] | $5,308 ($4,521$6,108) | |
| Matched results for survivors only [interquartile range] | $24,038 [$14,169$41,654] | $17,811 [$11,614$29,298] | $4,916 ($4,088$5,768) | <0.01 |
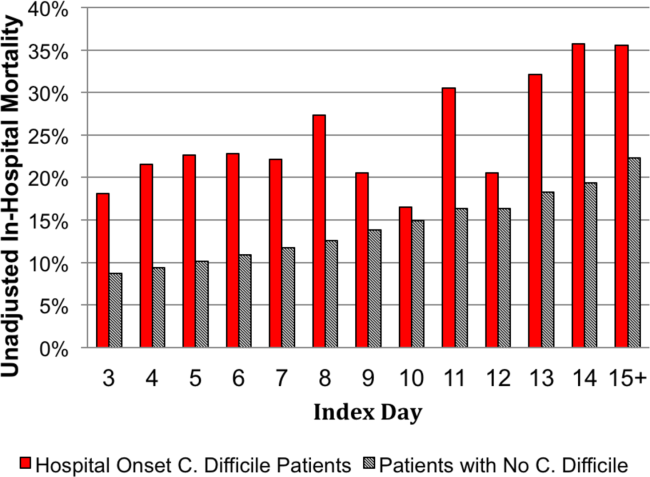
Adjusted Results
Compared to patients without disease, HOCDI patients had an increased unadjusted mortality (24% vs 10%, P<0.001). This translates into a relative risk of 2.4 (95% confidence interval [CI]: 2.2, 2.5). In the matched cohort, the difference in the mortality rates was attenuated, but still significantly higher in the HOCDI patients (24% versus 15%, P<0.001, an absolute difference of 9%; 95% CI: 6.410.8). The adjusted relative risk of mortality for HOCDI was 1.6 (95% CI: 1.41.8; Table 2). After matching, patients with CDI had a LOS of 19.2 days versus 14.2 days in matched controls (difference of 5.1 days; 95% CI: 4.45.7; P<0.001). When the LOS analysis was limited to survivors only, this difference of 5 days remained (P<0.001). In an analysis limited to survivors only, the difference in median costs between cases and controls was $4916 (95% CI: $4088$5768; P<0.001). In a secondary analysis examining heterogeneity between HOCDI and outcomes across clinical subgroups, the absolute difference in mortality and costs between cases and controls varied across demographics, comorbidity, and ICU admission, but the relative risks were similar (Figure 3) (see Supporting Figure 3 in the online version of this article).
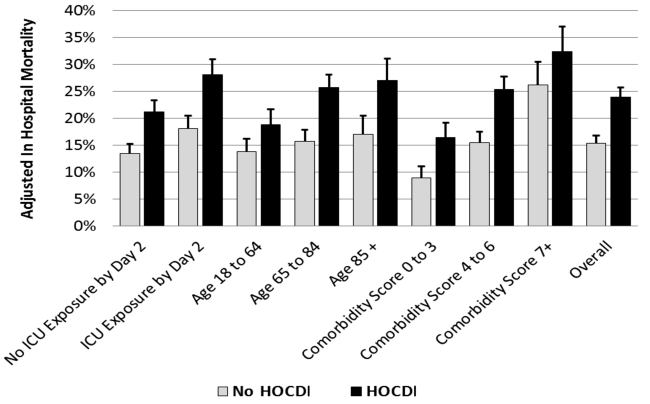
DISCUSSION
In this large cohort of patients with sepsis, we found that approximately 1 in 100 patients with sepsis developed HOCDI. Even after matching with controls based on the date of symptom onset and propensity score, patients who developed HOCDI were more than 1.6 times more likely to die in the hospital. HOCDI also added 5 days to the average hospitalization for patients with sepsis and increased median costs by approximately $5000. These findings suggest that a hospital that prevents 1 case of HOCDI per month in sepsis patients could avoid 1 death and 60 inpatient days annually, achieving an approximate yearly savings of $60,000.
Until now, the incremental cost and mortality attributable to HOCDI in sepsis patients have been poorly understood. Attributing outcomes can be methodologically challenging because patients who are at greatest risk for poor outcomes are the most likely to contract the disease and are at risk for longer periods of time. Therefore, it is necessary to take into account differences in severity of illness and time at risk between diseased and nondiseased populations and to ensure that outcomes attributed to the disease occur after disease onset.[28, 32] The majority of prior studies examining the impact of CDI on hospitalized patients have been limited by a lack of adequate matching to controls, small sample size, or failure to take into account time to infection.[16, 17, 19, 20]
A few studies have taken into account severity, time to infection, or both in estimating the impact of HOCDI. Using a time‐dependent Cox model that accounted for time to infection, Micek et al. found no difference in mortality but a longer LOS in mechanically ventilated patients (not limited to sepsis) with CDI.[33] However, their study was conducted at only 3 centers, did not take into account severity at the time of diagnosis, and did not clearly distinguish between community‐onset CDI and HOCDI. Oake et al. and Forster et al. examined the impact of CDI on patients hospitalized in a 2‐hospital health system in Canada.[12, 13] Using the baseline mortality estimate in a Cox multivariate proportional hazards regression model that accounted for the time‐varying nature of CDI, they found that HOCDI increased absolute risk of death by approximately 10%. Also, notably similar to our study were their findings that HOCDI occurred in approximately 1 in 100 patients and that the attributable median increase in LOS due to hospital‐onset CDI was 6 days. Although methodologically rigorous, these 2 small studies did not assess the impact of CDI on costs of care, were not focused on sepsis patients or even patients who received antibiotics, and also did not clearly distinguish between community‐onset CDI and HOCDI.
Our study therefore has important strengths. It is the first to examine the impact of HOCDI, including costs, on the outcomes of patients hospitalized with sepsis. The fact that we took into account both time to diagnosis and severity at the time of diagnosis (by using an index date for both cases and controls and determining severity on that date) prevented us from overestimating the impact of HOCDI on outcomes. The large differences in outcomes we observed in unadjusted and unmatched data were tempered after multivariate adjustment (eg, difference in LOS from 10.6 days to 5.1 additional days, costs from $14,620 to $4916 additional costs after adjustment). Our patient sample was derived from a large, multihospital database that contains actual hospital costs as derived from internal accounting systems. The fact that our study used data from hundreds of hospitals means that our estimates of cost, LOS, and mortality may be more generalizable than the work of Micek et al., Oake et al., and Forster et al.
This work also has important implications. First, hospital administrators, clinicians, and researchers can use our results to evaluate the cost‐effectiveness of HOCDI prevention measures (eg, hand hygiene programs, antibiotic stewardship). By quantifying the cost per case in sepsis patients, we allow administrators and researchers to compare the incremental costs of HOCDI prevention programs to the dollars and lives saved due to prevention efforts. Second, we found that our propensity model identified patients whose risk varied greatly. This suggests that an opportunity exists to identify subgroups of patients that are at highest risk. Identifying high‐risk subgroups will allow for targeted risk reduction interventions and the opportunity to reduce transmission (eg, by placing high‐risk patients in a private room). Finally, we have reaffirmed that time to diagnosis and presenting severity need to be rigorously addressed prior to making estimates of the impact of CDI burden and other hospital‐acquired conditions and injuries.
There are limitations to this study as well. We did not have access to microbiological data. However, we required a diagnosis code of CDI, evidence of testing, and treatment after the date of testing to confirm a diagnosis. We also adopted detailed exclusion criteria to ensure that CDI that was not present on admission and that controls did not have CDI. These stringent inclusion and exclusion criteria strengthened the internal validity of our estimates of disease impact. We used administrative claims data, which limited our ability to adjust for severity. However, the detailed nature of the database allowed us to use treatments, such as vasopressors and antibiotics, to identify cases; treatments were also used as a validated indicator of severity,[26] which may have helped to reduce some of this potential bias. Although our propensity model included many predictors of CDI, such as use of proton pump inhibitors and factors associated with mortality, not every confounder was completely balanced after propensity matching, although the statistical differences may have been related to our large sample size and therefore might not be clinically significant. We also may have failed to include all possible predictors of CDI in the propensity model.
In a large, diverse cohort of hospitalized patients with sepsis, we found that HOCDI lengthened hospital stay by approximately 5 days, increased risk of in‐hospital mortality by 9%, and increased hospital cost by approximately $5000 per patient. These findings highlight the importance of identifying effective prevention measures and of determining the patient populations at greatest risk for HOCDI.
Disclosures: The study was conducted with funding from the Division of Critical Care and the Center for Quality of Care Research at Baystate Medical Center. Dr. Lagu is supported by the National Heart, Lung, and Blood Institute of the National Institutes of Health under award number K01HL114745. Dr. Stefan is supported by the National Heart, Lung, and Blood Institute of the National Institutes of Health under award number K01HL114631. Drs. Lagu and Lindenauer had full access to all of the data in the study; they take responsibility for the integrity of the data and the accuracy of the data analysis. Drs. Lagu, Lindenauer, Steingrub, Higgins, Stefan, Haessler, and Rothberg conceived of the study. Dr. Lindenauer acquired the data. Drs. Lagu, Lindenauer, Rothberg, Steingrub, Nathanson, Stefan, Haessler, Higgins, and Mr. Hannon analyzed and interpreted the data. Dr. Lagu drafted the manuscript. Drs. Lagu, Lindenauer, Rothberg, Steingrub, Nathanson, Stefan, Haessler, Higgins, and Mr. Hannon critically reviewed the manuscript for important intellectual content. Dr. Nathanson carried out the statistical analyses. Dr. Nathanson, through his company OptiStatim LLC, was paid by the investigators with funding from the Department of Medicine at Baystate Medical Center to assist in conducting the statistical analyses in this study. The authors report no further conflicts of interest.
- , , , . Increasing prevalence and severity of Clostridium difficile colitis in hospitalized patients in the United States. Arch Surg. 2007;142(7):624–631; discussion 631.
- , , , et al. The changing epidemiology of Clostridium difficile infections. Clin Microbiol Rev. 2010;23(3):529–549.
- , . Clostridium Difficile‐Associated Disease in U.S. Hospitals, 1993–2005. HCUP Statistical Brief #50. April 2008. Agency for Healthcare Research and Quality, Rockville, MD. Available at: http://www.hcup‐us.ahrq.gov/reports/statbriefs/sb50.pdf. Accessed April 4, 2014.
- , , , . National point prevalence of Clostridium difficile in US health care facility inpatients, 2008. Am J Infect Control. 2009;37(4):263–270.
- . A 76‐year‐old man with recurrent Clostridium difficile‐associated diarrhea: review of C. difficile infection. JAMA. 2009;301(9):954–962.
- , , , , , . Recurrent Clostridium difficile disease: epidemiology and clinical characteristics. Infect Control Hosp Epidemiol. 1999;20(1):43–50.
- , , , , , . Recurrent Clostridium difficile diarrhea: characteristics of and risk factors for patients enrolled in a prospective, randomized, double‐blinded trial. Clin Infect Dis. 1997;24(3):324–333.
- . Narrative review: the new epidemic of Clostridium difficile‐associated enteric disease. Ann Intern Med. 2006;145(10):758–764.
- , , , et al. Impact of emergency colectomy on survival of patients with fulminant Clostridium difficile colitis during an epidemic caused by a hypervirulent strain. Ann Surg. 2007;245(2):267–272.
- , , , . Hospital‐acquired Clostridium difficile‐associated disease in the intensive care unit setting: epidemiology, clinical course and outcome. BMC Infect Dis. 2007;7:42.
- , , , , , . Factors associated with prolonged symptoms and severe disease due to Clostridium difficile. Age Ageing. 1999;28(2):107–113.
- , , , , , . The effect of hospital‐acquired Clostridium difficile infection on in‐hospital mortality. Arch Intern Med. 2010;170(20):1804–1810.
- , , , , , . The effect of hospital‐acquired infection with Clostridium difficile on length of stay in hospital. CMAJ. 2012;184(1):37–42.
- , . Clostridium difficile—more difficult than ever. N Engl J Med. 2008;359(18):1932–1940.
- , , , et al. Clinical practice guidelines for Clostridium difficile infection in adults: 2010 update by the society for healthcare epidemiology of America (SHEA) and the infectious diseases society of America (IDSA). Infect Control Hosp Epidemiol. 2010;31(5):431–455.
- , , , . Health care costs and mortality associated with nosocomial diarrhea due to Clostridium difficile. Clin Infect Dis. 2002;34(3):346–353.
- , , , , . Short‐ and long‐term attributable costs of Clostridium difficile‐associated disease in nonsurgical inpatients. Clin Infect Dis. 2008;46(4):497–504.
- , , , , . Estimation of extra hospital stay attributable to nosocomial infections: heterogeneity and timing of events. J Clin Epidemiol. 2000;53(4):409–417.
- , , , et al. Attributable outcomes of endemic Clostridium difficile‐associated disease in nonsurgical patients. Emerging Infect Dis. 2008;14(7):1031–1038.
- , . Excess length of stay, charges, and mortality attributable to medical injuries during hospitalization. JAMA. 2003;290(14):1868–1874.
- , , , , , . Association of corticosteroid dose and route of administration with risk of treatment failure in acute exacerbation of chronic obstructive pulmonary disease. JAMA. 2010;303(23):2359–2367.
- , , , , , . The relationship between hospital spending and mortality in patients with sepsis. Arch Intern Med. 2011;171(4):292–299.
- , , , , , . Comparative effectiveness of macrolides and quinolones for patients hospitalized with acute exacerbations of chronic obstructive pulmonary disease (AECOPD). J Hosp Med. 2010;5(5):261–267.
- , , , , . A combined comorbidity score predicted mortality in elderly patients better than existing scores. J Clin Epidemiol. 2011;64(7):749–759.
- , , , , , . Epidemiology of severe sepsis in the United States: analysis of incidence, outcome, and associated costs of care. Crit Care Med. 2001;29(7):1303–1310.
- , , , et al. Development and validation of a model that uses enhanced administrative data to predict mortality in patients with sepsis. Crit Care Med. 2011;39(11):2425–2430.
- , , , , . Incorporating initial treatments improves performance of a mortality prediction model for patients with sepsis. Pharmacoepidemiol Drug Saf. 2012;21(suppl 2):44–52.
- , , , . Nosocomial infection, length of stay, and time‐dependent bias. Infect Control Hosp Epidemiol. 2009;30(3):273–276.
- , , , , , . Length of stay and hospital costs among high‐risk patients with hospital‐origin Clostridium difficile‐associated diarrhea. J Med Econ. 2013;16(3):440–448.
- Rogers. Regression standard errors in clustered samples. Stata Technical Bulletin. 1993;13(13):19–23.
- . Reducing bias in a propensity score matched‐pair sample using greedy matching techniques. In: Proceedings of the 26th Annual SAS Users Group International Conference; April 22–25, 2001; Long Beach, CA. Paper 214‐26. Available at: http://www2.sas.com/proceedings/sugi26/p214‐26.pdf. Accessed April 4, 2014.
- , . Prolongation of length of stay and Clostridium difficile infection: a review of the methods used to examine length of stay due to healthcare associated infections. Antimicrob Resist Infect Control. 2012;1(1):14.
- , , , et al. Clostridium difficile Infection: a multicenter study of epidemiology and outcomes in mechanically ventilated patients. Crit Care Med. 2013;41(8):1968–1975.
There are approximately 3 million cases of Clostridium difficile infection (CDI) per year in the United States.[1, 2, 3, 4] Of these, 10% result in a hospitalization or occur as a consequence of the exposures and treatments associated with hospitalization.[1, 2, 3, 4] Some patients with CDI experience mild diarrhea that is responsive to therapy, but other patients experience severe, life‐threatening disease that is refractory to treatment, leading to pseudomembranous colitis, toxic megacolon, and sepsis with a 60‐day mortality rate that exceeds 12%.[5, 6, 7, 8, 9, 10, 11, 12, 13, 14]
Hospital‐onset CDI (HOCDI), defined as C difficile‐associated diarrhea and related symptoms with onset more than 48 hours after admission to a healthcare facility,[15] represents a unique marriage of CDI risk factors.[5] A vulnerable patient is introduced into an environment that contains both exposure to C difficile (through other patients or healthcare workers) and treatment with antibacterial agents that may diminish normal flora. Consequently, CDI is common among hospitalized patients.[16, 17, 18] A particularly important group for understanding the burden of disease is patients who initially present to the hospital with sepsis and subsequently develop HOCDI. Sepsis patients are often critically ill and are universally treated with antibiotics.
Determining the incremental cost and mortality risk attributable to HOCDI is methodologically challenging. Because HOCDI is associated with presenting severity, the sickest patients are also the most likely to contract the disease. HOCDI is also associated with time of exposure or length of stay (LOS). Because LOS is a risk factor, comparing LOS between those with and without HOCDI will overestimate the impact if the time to diagnosis is not taken into account.[16, 17, 19, 20] We aimed to examine the impact of HOCDI in hospitalized patients with sepsis using a large, multihospital database with statistical methods that took presenting severity and time to diagnosis into account.
METHODS
Data Source and Subjects
Permission to conduct this study was obtained from the institutional review board at Baystate Medical Center. We used the Premier Healthcare Informatics database, a voluntary, fee‐supported database created to measure quality and healthcare utilization, which has been used extensively in health services research.[21, 22, 23] In addition to the elements found in hospital claims derived from the uniform billing 04 form, Premier data include an itemized, date‐stamped log of all items and services charged to the patient or their insurer, including medications, laboratory tests, and diagnostic and therapeutic services. Approximately 75% of hospitals that submit data also provide information on actual hospital costs, taken from internal cost accounting systems. The rest provide cost estimates based on Medicare cost‐to‐charge ratios. Participating hospitals are similar to the composition of acute care hospitals nationwide, although they are more commonly small‐ to midsized nonteaching facilities and are more likely to be located in the southern United States.
We included medical (nonsurgical) adult patients with sepsis who were admitted to a participating hospital between July 1, 2004 and December 31, 2010. Because we sought to focus on the care of patients who present to the hospital with sepsis, we defined sepsis as the presence of a diagnosis of sepsis plus evidence of both blood cultures and antibiotic treatment within the first 2 days of hospitalization; we used the first 2 days of hospitalization rather than just the first day because, in administrative datasets, the duration of the first hospital day includes partial days that can vary in length. We excluded patients who died or were discharged prior to day 3, because HOCDI is defined as onset after 48 hours in a healthcare facility.[15] We also excluded surviving patients who received less than 3 consecutive days of antibiotics, and patients who were transferred from or to another acute‐care facility; the latter exclusion criterion was used because we could not accurately determine the onset or subsequent course of their illness.
Identification of Patients at Risk for and Diagnosed With HOCDI
Among eligible patients with sepsis, we aimed to identify a cohort at risk for developing CDI during the hospital stay. We excluded patients: (1) with a diagnosis indicating that diarrhea was present on admission, (2) with a diagnosis of CDI that was indicated to be present on admission, (3) who were tested for CDI on the first or second hospital day, and (4) who received an antibiotic that could be consistent with treatment for CDI (oral or intravenous [IV] metronidazole or oral vancomycin) on hospital days 1 or 2.
Next, we aimed to identify sepsis patients at risk for HOCDI who developed HOCDI during their hospital stay. Among eligible patients described above, we considered a patient to have HOCDI if they had an International Classification of Diseases, Ninth Revision, Clinical Modification diagnosis of CDI (primary or secondary but not present on admission), plus evidence of testing for CDI after hospital day 2, and treatment with oral vancomycin or oral or IV metronidazole that was started after hospital day 2 and within 2 days of the C difficile test, and evidence of treatment for CDI for at least 3 days unless the patient was discharged or died.
Patient Information
We recorded patient age, gender, marital status, insurance status, race, and ethnicity. Using software provided by the Healthcare Costs and Utilization Project of the Agency for Healthcare Research and Quality, we categorized information on 30 comorbid conditions. We also created a single numerical comorbidity score based on a previously published and validated combined comorbidity score that predicts 1‐year mortality.[24] Based on a previously described algorithm,[25] we used diagnosis codes to assess the source (lung, abdomen, urinary tract, blood, other) and type of sepsis (Gram positive, Gram negative, mixed, anaerobic, fungal). Because patients can have more than 1 potential source of sepsis (eg, pneumonia and urinary tract infection) and more than 1 organism causing infection (eg, urine with Gram negative rods and blood culture with Gram positive cocci), these categories are not mutually exclusive (see Supporting Table 1 in the online version of this article). We used billing codes to identify the use of therapies, monitoring devices, and pharmacologic treatments to characterize both initial severity of illness and severity at the time of CDI diagnosis. These therapies are included in a validated sepsis mortality prediction model (designed for administrative datasets) with similar discrimination and calibration to clinical intensive care unit (ICU) risk‐adjustment models such as the mortality probability model, version III.[26, 27]
Outcomes
Our primary outcome of interest was in‐hospital mortality. Secondary outcomes included LOS and costs for survivors only and for all patients.
Statistical Methods
We calculated patient‐level summary statistics for all patients using frequencies for binary variables and medians and interquartile percentiles for continuous variables. P values <0.05 were considered statistically significant.
To account for presenting severity and time to diagnosis, we used methods that have been described elsewhere.[12, 13, 18, 20, 28] First, we identified patients who were eligible to develop HOCDI. Second, for all eligible patients, we identified a date of disease onset (index date). For patients who met criteria for HOCDI, this was the date on which the patient was tested for CDI. For eligible patients without disease, this was a date randomly assigned to any time during the hospital stay.[29] Next, we developed a nonparsimonious propensity score model that included all patient characteristics (demographics, comorbidities, sepsis source, and severity of illness on presentation and on the index date; all variables listed in Table 1 were included in the propensity model). Some of the variables for this model (eg, mechanical ventilation and vasopressors) were derived from a validated severity model.[26] We adjusted for correlation within hospital when creating the propensity score using Huber‐White robust standard error estimators clustered at the hospital level.[30] We then created matched pairs with the same LOS prior to the index date and similar propensity for developing CDI. We first matched on index date, and then, within each index‐datematched subset, matched patients with and without HOCDI by their propensity score using a 5‐to‐1 greedy match algorithm.[31] We used the differences in LOS between the cases and controls after the index date to calculate the additional attributable LOS estimates; we also separately estimated the impact on cost and LOS in a group limited to those who survived after discharge because of concerns that death could shorten LOS and reduce costs.
| Before Matching | After Matching | |||||
|---|---|---|---|---|---|---|
| HOCDI, n=2,368, % | No CDI, n=216,547, % | P | HOCDI, n=2,368, % | No CDI, n=2,368, % | P | |
| ||||||
| Age, y | 70.9 (15.1) | 68.6 (16.8) | <0.01 | 70.9 (15.1) | 69.8 (15.9) | 0.02 |
| Male | 46.8 | 46.0 | 0.44 | 46.8 | 47.2 | 0.79 |
| Race | ||||||
| White | 61.0 | 63.3 | 61.0 | 58.1 | ||
| Black | 15.6 | 14.5 | <0.01 | 15.6 | 17.0 | 0.11 |
| Hispanic | 3.2 | 5.4 | 3.2 | 4.1 | ||
| Other race | 20.2 | 16.8 | 20.2 | 20.9 | ||
| Marital status | ||||||
| Married | 31.6 | 36.3 | <0.01 | 31.6 | 32.6 | 0.74 |
| Single/divorced | 52.8 | 51.1 | 52.8 | 52.0 | ||
| Other/unknown | 15.7 | 12.6 | 15.7 | 14.5 | ||
| Insurance status | ||||||
| Medicare traditional | 63.2 | 59.5 | 63.2 | 60.3 | ||
| Medicare managed | 10.6 | 10.1 | 10.6 | 10.9 | ||
| Medicaid traditional | 7.6 | 6.9 | 7.6 | 8.2 | ||
| Medicaid managed | 1.8 | 2.0 | <0.01 | 1.8 | 1.8 | 0.50 |
| Managed care | 10.8 | 12.3 | 10.8 | 12.0 | ||
| Commercial | 2.0 | 3.5 | 2.0 | 2.2 | ||
| Self‐pay/other/unknown | 4.0 | 5.7 | 4.0 | 4.7 | ||
| Infection source | ||||||
| Respiratory | 46.5 | 37.0 | <0.01 | 46.5 | 49.6 | 0.03 |
| Skin/bone | 10.1 | 8.6 | 0.01 | 10.1 | 11.2 | 0.21 |
| Urinary | 52.2 | 51.3 | 0.38 | 52.2 | 50.3 | 0.18 |
| Blood | 11.1 | 15.1 | <0.01 | 11.1 | 11.5 | 0.65 |
| Infecting organism | ||||||
| Gram negative | 35.0 | 36.6 | <0.01 | 35.0 | 33.1 | 0.18 |
| Anaerobe | 1.4 | 0.7 | <0.01 | 1.4 | 1.1 | 0.24 |
| Fungal | 17.5 | 7.5 | <0.01 | 17.5 | 18.3 | 0.44 |
| Most common comorbid conditions | ||||||
| Congestive heart failure | 35.1 | 24.6 | <0.01 | 35.1 | 37.5 | 0.06 |
| Chronic lung disease | 31.6 | 27.6 | <0.01 | 31.6 | 32.1 | 0.71 |
| Hypertension | 31.5 | 37.7 | <0.01 | 31.5 | 29.7 | 0.16 |
| Renal Failure | 29.7 | 23.8 | <0.01 | 29.7 | 31.2 | 0.28 |
| Weight Loss | 27.7 | 13.3 | <0.01 | 27.7 | 29.4 | 0.17 |
| Treatments by day 2 | ||||||
| ICU admission | 40.0 | 29.5 | <0.01 | 40.0 | 40.7 | 0.64 |
| Use of bicarbonate | 12.2 | 7.1 | <0.01 | 12.2 | 13.6 | 0.15 |
| Fresh frozen plasma | 1.4 | 1.0 | 0.03 | 1.4 | 1.1 | 0.36 |
| Inotropes | 1.4 | 0.9 | 0.01 | 1.4 | 2.2 | 0.04 |
| Hydrocortisone | 6.7 | 4.7 | <0.01 | 6.7 | 7.4 | 0.33 |
| Thiamine | 4.2 | 3.3 | 0.01 | 4.2 | 4.1 | 0.83 |
| Psychotropics (eg, haldol for delirium) | 10.0 | 9.2 | 0.21 | 10.0 | 10.8 | 0.36 |
| Restraints (eg, for delirium) | 2.0 | 1.5 | 0.05 | 2.0 | 2.5 | 0.29 |
| Angiotensin‐converting enzyme inhibitors | 12.1 | 13.2 | 0.12 | 12.1 | 10.9 | 0.20 |
| Statins | 18.8 | 21.1 | 0.01 | 18.8 | 16.9 | 0.09 |
| Drotrecogin alfa | 0.6 | 0.3 | 0.00 | 0.6 | 0.6 | 0.85 |
| Foley catheter | 19.2 | 19.8 | 0.50 | 19.2 | 22.0 | 0.02 |
| Diuretics | 28.5 | 25.4 | 0.01 | 28.5 | 29.6 | 0.42 |
| Red blood cells | 15.5 | 10.6 | <0.01 | 15.5 | 15.8 | 0.81 |
| Calcium channel blockers | 19.3 | 16.8 | 0.01 | 19.3 | 19.1 | 0.82 |
| ‐Blockers | 32.7 | 29.6 | 0.01 | 32.7 | 30.6 | 0.12 |
| Proton pump inhibitors | 59.6 | 53.1 | <0.01 | 59.6 | 61.0 | 0.31 |
Analysis Across Clinical Subgroups
In a secondary analysis, we examined heterogeneity in the association between HOCDI and outcomes within subsets of patients defined by age, combined comorbidity score, and admission to the ICU by day 2. We created separate propensity scores using the same covariates in the primary analysis, but limited matches to within these subsets. For each group, we examined how the covariates in the HOCDI and control groups differed after matching with inference tests that took the paired nature of the data into account. All analyses were carried out using Stata/SE 11.1 (StataCorp, College Station, TX).
RESULTS
We identified 486,943 adult sepsis admissions to a Premier hospital between July 1, 2004 and December 31, 2010. After applying all exclusion criteria, we had a final sample of 218,915 admissions with sepsis (from 400 hospitals) at risk for HOCDI (Figure 1). Of these, 2368 (1.08%) met criteria for diagnosis of CDI after hospital day 2 and were matched to controls using index date and propensity score.
Patient and Hospital Factors
After matching, the median age was 71 years in cases and 70 years in controls (Table 1). Less than half (46%) of the population was male. Most cases (61%) and controls (58%) were white. Heart failure, hypertension, chronic lung disease, renal failure, and weight loss were the most common comorbid conditions. Our propensity model, which had a C statistic of 0.75, identified patients whose risk varied from a mean of 0.1% in the first decile to a mean of 3.8% in the tenth decile. Before matching, 40% of cases and 29% of controls were treated in the ICU by hospital day 2; after matching, 40% of both cases and controls were treated in the ICU by hospital day 2.
Distribution by LOS, Index Day, and Risk for Mortality
The unadjusted and unmatched LOS was longer for cases than controls (19 days vs 8 days, Table 2) (see Supporting Figure 1 in the online version of this article). Approximately 90% of the patients had an index day of 14 or less (Figure 2). Among patients both with and without CDI, the unadjusted mortality risk increased as the index day (and thus the total LOS) increased.
| Outcome | HOCDI | No HOCDI | Difference (95% CI) | P |
|---|---|---|---|---|
| ||||
| Length of stay, d | ||||
| Raw results | 19.2 | 8.3 | 8.4 (8.48.5) | <0.01 |
| Raw results for survivors only | 18.6 | 8.0 | 10.6 (10.311.0) | <0.01 |
| Matched results | 19.2 | 14.2 | 5.1(4.45.7) | <0.01 |
| Matched results for survivors only | 18.6 | 13.6 | 5.1 (4.45.8) | <0.01 |
| Mortality, % | ||||
| Raw results | 24.0 | 10.1 | 13.9 (12.615.1), RR=2.4 (2.22.5) | <0.01 |
| Matched results | 24.0 | 15.4 | 8.6 (6.410.9), RR=1.6 (1.41.8) | <0.01 |
| Costs, US$ | ||||
| Raw results median costs [interquartile range] | $26,187 [$15,117$46,273] | $9,988 [$6,296$17,351] | $16,190 ($15,826$16,555) | <0.01 |
| Raw results for survivors only [interquartile range] | $24,038 [$14,169$41,654] | $9,429 [$6,070$15,875] | $14,620 ($14,246$14,996) | <0.01 |
| Matched results [interquartile range] | $26,187 [$15,117$46,273] | $19,160 [$12,392$33,777] | $5,308 ($4,521$6,108) | |
| Matched results for survivors only [interquartile range] | $24,038 [$14,169$41,654] | $17,811 [$11,614$29,298] | $4,916 ($4,088$5,768) | <0.01 |
Adjusted Results
Compared to patients without disease, HOCDI patients had an increased unadjusted mortality (24% vs 10%, P<0.001). This translates into a relative risk of 2.4 (95% confidence interval [CI]: 2.2, 2.5). In the matched cohort, the difference in the mortality rates was attenuated, but still significantly higher in the HOCDI patients (24% versus 15%, P<0.001, an absolute difference of 9%; 95% CI: 6.410.8). The adjusted relative risk of mortality for HOCDI was 1.6 (95% CI: 1.41.8; Table 2). After matching, patients with CDI had a LOS of 19.2 days versus 14.2 days in matched controls (difference of 5.1 days; 95% CI: 4.45.7; P<0.001). When the LOS analysis was limited to survivors only, this difference of 5 days remained (P<0.001). In an analysis limited to survivors only, the difference in median costs between cases and controls was $4916 (95% CI: $4088$5768; P<0.001). In a secondary analysis examining heterogeneity between HOCDI and outcomes across clinical subgroups, the absolute difference in mortality and costs between cases and controls varied across demographics, comorbidity, and ICU admission, but the relative risks were similar (Figure 3) (see Supporting Figure 3 in the online version of this article).
DISCUSSION
In this large cohort of patients with sepsis, we found that approximately 1 in 100 patients with sepsis developed HOCDI. Even after matching with controls based on the date of symptom onset and propensity score, patients who developed HOCDI were more than 1.6 times more likely to die in the hospital. HOCDI also added 5 days to the average hospitalization for patients with sepsis and increased median costs by approximately $5000. These findings suggest that a hospital that prevents 1 case of HOCDI per month in sepsis patients could avoid 1 death and 60 inpatient days annually, achieving an approximate yearly savings of $60,000.
Until now, the incremental cost and mortality attributable to HOCDI in sepsis patients have been poorly understood. Attributing outcomes can be methodologically challenging because patients who are at greatest risk for poor outcomes are the most likely to contract the disease and are at risk for longer periods of time. Therefore, it is necessary to take into account differences in severity of illness and time at risk between diseased and nondiseased populations and to ensure that outcomes attributed to the disease occur after disease onset.[28, 32] The majority of prior studies examining the impact of CDI on hospitalized patients have been limited by a lack of adequate matching to controls, small sample size, or failure to take into account time to infection.[16, 17, 19, 20]
A few studies have taken into account severity, time to infection, or both in estimating the impact of HOCDI. Using a time‐dependent Cox model that accounted for time to infection, Micek et al. found no difference in mortality but a longer LOS in mechanically ventilated patients (not limited to sepsis) with CDI.[33] However, their study was conducted at only 3 centers, did not take into account severity at the time of diagnosis, and did not clearly distinguish between community‐onset CDI and HOCDI. Oake et al. and Forster et al. examined the impact of CDI on patients hospitalized in a 2‐hospital health system in Canada.[12, 13] Using the baseline mortality estimate in a Cox multivariate proportional hazards regression model that accounted for the time‐varying nature of CDI, they found that HOCDI increased absolute risk of death by approximately 10%. Also, notably similar to our study were their findings that HOCDI occurred in approximately 1 in 100 patients and that the attributable median increase in LOS due to hospital‐onset CDI was 6 days. Although methodologically rigorous, these 2 small studies did not assess the impact of CDI on costs of care, were not focused on sepsis patients or even patients who received antibiotics, and also did not clearly distinguish between community‐onset CDI and HOCDI.
Our study therefore has important strengths. It is the first to examine the impact of HOCDI, including costs, on the outcomes of patients hospitalized with sepsis. The fact that we took into account both time to diagnosis and severity at the time of diagnosis (by using an index date for both cases and controls and determining severity on that date) prevented us from overestimating the impact of HOCDI on outcomes. The large differences in outcomes we observed in unadjusted and unmatched data were tempered after multivariate adjustment (eg, difference in LOS from 10.6 days to 5.1 additional days, costs from $14,620 to $4916 additional costs after adjustment). Our patient sample was derived from a large, multihospital database that contains actual hospital costs as derived from internal accounting systems. The fact that our study used data from hundreds of hospitals means that our estimates of cost, LOS, and mortality may be more generalizable than the work of Micek et al., Oake et al., and Forster et al.
This work also has important implications. First, hospital administrators, clinicians, and researchers can use our results to evaluate the cost‐effectiveness of HOCDI prevention measures (eg, hand hygiene programs, antibiotic stewardship). By quantifying the cost per case in sepsis patients, we allow administrators and researchers to compare the incremental costs of HOCDI prevention programs to the dollars and lives saved due to prevention efforts. Second, we found that our propensity model identified patients whose risk varied greatly. This suggests that an opportunity exists to identify subgroups of patients that are at highest risk. Identifying high‐risk subgroups will allow for targeted risk reduction interventions and the opportunity to reduce transmission (eg, by placing high‐risk patients in a private room). Finally, we have reaffirmed that time to diagnosis and presenting severity need to be rigorously addressed prior to making estimates of the impact of CDI burden and other hospital‐acquired conditions and injuries.
There are limitations to this study as well. We did not have access to microbiological data. However, we required a diagnosis code of CDI, evidence of testing, and treatment after the date of testing to confirm a diagnosis. We also adopted detailed exclusion criteria to ensure that CDI that was not present on admission and that controls did not have CDI. These stringent inclusion and exclusion criteria strengthened the internal validity of our estimates of disease impact. We used administrative claims data, which limited our ability to adjust for severity. However, the detailed nature of the database allowed us to use treatments, such as vasopressors and antibiotics, to identify cases; treatments were also used as a validated indicator of severity,[26] which may have helped to reduce some of this potential bias. Although our propensity model included many predictors of CDI, such as use of proton pump inhibitors and factors associated with mortality, not every confounder was completely balanced after propensity matching, although the statistical differences may have been related to our large sample size and therefore might not be clinically significant. We also may have failed to include all possible predictors of CDI in the propensity model.
In a large, diverse cohort of hospitalized patients with sepsis, we found that HOCDI lengthened hospital stay by approximately 5 days, increased risk of in‐hospital mortality by 9%, and increased hospital cost by approximately $5000 per patient. These findings highlight the importance of identifying effective prevention measures and of determining the patient populations at greatest risk for HOCDI.
Disclosures: The study was conducted with funding from the Division of Critical Care and the Center for Quality of Care Research at Baystate Medical Center. Dr. Lagu is supported by the National Heart, Lung, and Blood Institute of the National Institutes of Health under award number K01HL114745. Dr. Stefan is supported by the National Heart, Lung, and Blood Institute of the National Institutes of Health under award number K01HL114631. Drs. Lagu and Lindenauer had full access to all of the data in the study; they take responsibility for the integrity of the data and the accuracy of the data analysis. Drs. Lagu, Lindenauer, Steingrub, Higgins, Stefan, Haessler, and Rothberg conceived of the study. Dr. Lindenauer acquired the data. Drs. Lagu, Lindenauer, Rothberg, Steingrub, Nathanson, Stefan, Haessler, Higgins, and Mr. Hannon analyzed and interpreted the data. Dr. Lagu drafted the manuscript. Drs. Lagu, Lindenauer, Rothberg, Steingrub, Nathanson, Stefan, Haessler, Higgins, and Mr. Hannon critically reviewed the manuscript for important intellectual content. Dr. Nathanson carried out the statistical analyses. Dr. Nathanson, through his company OptiStatim LLC, was paid by the investigators with funding from the Department of Medicine at Baystate Medical Center to assist in conducting the statistical analyses in this study. The authors report no further conflicts of interest.
- , , , . Increasing prevalence and severity of Clostridium difficile colitis in hospitalized patients in the United States. Arch Surg. 2007;142(7):624–631; discussion 631.
- , , , et al. The changing epidemiology of Clostridium difficile infections. Clin Microbiol Rev. 2010;23(3):529–549.
- , . Clostridium Difficile‐Associated Disease in U.S. Hospitals, 1993–2005. HCUP Statistical Brief #50. April 2008. Agency for Healthcare Research and Quality, Rockville, MD. Available at: http://www.hcup‐us.ahrq.gov/reports/statbriefs/sb50.pdf. Accessed April 4, 2014.
- , , , . National point prevalence of Clostridium difficile in US health care facility inpatients, 2008. Am J Infect Control. 2009;37(4):263–270.
- . A 76‐year‐old man with recurrent Clostridium difficile‐associated diarrhea: review of C. difficile infection. JAMA. 2009;301(9):954–962.
- , , , , , . Recurrent Clostridium difficile disease: epidemiology and clinical characteristics. Infect Control Hosp Epidemiol. 1999;20(1):43–50.
- , , , , , . Recurrent Clostridium difficile diarrhea: characteristics of and risk factors for patients enrolled in a prospective, randomized, double‐blinded trial. Clin Infect Dis. 1997;24(3):324–333.
- . Narrative review: the new epidemic of Clostridium difficile‐associated enteric disease. Ann Intern Med. 2006;145(10):758–764.
- , , , et al. Impact of emergency colectomy on survival of patients with fulminant Clostridium difficile colitis during an epidemic caused by a hypervirulent strain. Ann Surg. 2007;245(2):267–272.
- , , , . Hospital‐acquired Clostridium difficile‐associated disease in the intensive care unit setting: epidemiology, clinical course and outcome. BMC Infect Dis. 2007;7:42.
- , , , , , . Factors associated with prolonged symptoms and severe disease due to Clostridium difficile. Age Ageing. 1999;28(2):107–113.
- , , , , , . The effect of hospital‐acquired Clostridium difficile infection on in‐hospital mortality. Arch Intern Med. 2010;170(20):1804–1810.
- , , , , , . The effect of hospital‐acquired infection with Clostridium difficile on length of stay in hospital. CMAJ. 2012;184(1):37–42.
- , . Clostridium difficile—more difficult than ever. N Engl J Med. 2008;359(18):1932–1940.
- , , , et al. Clinical practice guidelines for Clostridium difficile infection in adults: 2010 update by the society for healthcare epidemiology of America (SHEA) and the infectious diseases society of America (IDSA). Infect Control Hosp Epidemiol. 2010;31(5):431–455.
- , , , . Health care costs and mortality associated with nosocomial diarrhea due to Clostridium difficile. Clin Infect Dis. 2002;34(3):346–353.
- , , , , . Short‐ and long‐term attributable costs of Clostridium difficile‐associated disease in nonsurgical inpatients. Clin Infect Dis. 2008;46(4):497–504.
- , , , , . Estimation of extra hospital stay attributable to nosocomial infections: heterogeneity and timing of events. J Clin Epidemiol. 2000;53(4):409–417.
- , , , et al. Attributable outcomes of endemic Clostridium difficile‐associated disease in nonsurgical patients. Emerging Infect Dis. 2008;14(7):1031–1038.
- , . Excess length of stay, charges, and mortality attributable to medical injuries during hospitalization. JAMA. 2003;290(14):1868–1874.
- , , , , , . Association of corticosteroid dose and route of administration with risk of treatment failure in acute exacerbation of chronic obstructive pulmonary disease. JAMA. 2010;303(23):2359–2367.
- , , , , , . The relationship between hospital spending and mortality in patients with sepsis. Arch Intern Med. 2011;171(4):292–299.
- , , , , , . Comparative effectiveness of macrolides and quinolones for patients hospitalized with acute exacerbations of chronic obstructive pulmonary disease (AECOPD). J Hosp Med. 2010;5(5):261–267.
- , , , , . A combined comorbidity score predicted mortality in elderly patients better than existing scores. J Clin Epidemiol. 2011;64(7):749–759.
- , , , , , . Epidemiology of severe sepsis in the United States: analysis of incidence, outcome, and associated costs of care. Crit Care Med. 2001;29(7):1303–1310.
- , , , et al. Development and validation of a model that uses enhanced administrative data to predict mortality in patients with sepsis. Crit Care Med. 2011;39(11):2425–2430.
- , , , , . Incorporating initial treatments improves performance of a mortality prediction model for patients with sepsis. Pharmacoepidemiol Drug Saf. 2012;21(suppl 2):44–52.
- , , , . Nosocomial infection, length of stay, and time‐dependent bias. Infect Control Hosp Epidemiol. 2009;30(3):273–276.
- , , , , , . Length of stay and hospital costs among high‐risk patients with hospital‐origin Clostridium difficile‐associated diarrhea. J Med Econ. 2013;16(3):440–448.
- Rogers. Regression standard errors in clustered samples. Stata Technical Bulletin. 1993;13(13):19–23.
- . Reducing bias in a propensity score matched‐pair sample using greedy matching techniques. In: Proceedings of the 26th Annual SAS Users Group International Conference; April 22–25, 2001; Long Beach, CA. Paper 214‐26. Available at: http://www2.sas.com/proceedings/sugi26/p214‐26.pdf. Accessed April 4, 2014.
- , . Prolongation of length of stay and Clostridium difficile infection: a review of the methods used to examine length of stay due to healthcare associated infections. Antimicrob Resist Infect Control. 2012;1(1):14.
- , , , et al. Clostridium difficile Infection: a multicenter study of epidemiology and outcomes in mechanically ventilated patients. Crit Care Med. 2013;41(8):1968–1975.
© 2014 Society of Hospital Medicine
