User login
EHR Report: One step at a time
The response to our request for readers to comment on their experiences with electronic health records continues to astonish us, with the quantity, depth, and intensity of responses. The majority of e-mails discuss concerns about the way EHRs have affected both patient care and office workflow, and we have made an effort to make sure that these voices are heard.
This month, we thought that we would emphasize a response from Dr. Don Weinshenker, a general internist in Denver who has worked in the VA system since 1992 and who describes himself as a "champion" of the EHR for over a decade. What we like about Dr. Weinshenker’s comments is that while he acknowledges the challenges inherent in adopting electronic records, he also offers some solutions based on a decade of experience. Some of his suggestions remind us of columns we published about a year ago on Humanism and EHRs, two words seldom used together, but which present what we feel is an important concept – discerning how to use our new tools to carry out, not distract us from, our core goals of connecting with other human beings to help safely alleviate suffering and improve health using an empathic manner that communicates caring and understanding. Dr. Weinshenker shares his thoughts as follows:
I feel it is quite possible and relatively easy to integrate the computer into an exam room while maintaining the excellent clinician/patient experience for which we all strive.
The first thing I do when I walk into a room is greet the patient and look the patient in the eye. I don’t look at the computer at first. I then acknowledge the "elephant in the room." I usually say something to the effect of, "As you likely know, we do almost everything on the computer. I will be using the computer today during this visit." I have not had a single patient object.
Next I do bring the patient’s chart up on the computer, if I hadn’t already preloaded it, and open a progress note with my simple template. I then turn to the patient, away from the computer, and start to take a history. At an appropriate pause I say, "Let me get that into your chart." I do turn to the computer at that time and start to type. I repeat what the patient told me as I type. By doing this, patients know what I am typing as well as experiencing a version of "reflective listening" so that they know that I truly did hear them. Also, I always clarify as I type. "The left foot pain has been going on for 2 weeks, or was it 3 weeks?" I write my primary care note in real time while talking with the patient. The majority of the content of my notes is in natural language, as opposed to clicking on little phrases.
Then, I talk about what I am doing in terms of ordering on the computer. "I am going to go ahead and order that podiatry consult now. You said that you would prefer to be seen after the 15th, right? I’ll order that x-ray we talked about as well."
I am sitting at a desk with the patient next to me facing me. It only takes a small turn of my head to face the patient. It is common for me to turn the computer screen a little so it faces the patient. I involve the patients with the computer. Very frequently, they can actually see what I am typing into the computer. In addition, for many of the computerized clinical reminders that we use, I will have the patient read the questions off the screen, e.g., for depression screening, so that they can answer the questions directly.
It appears that some of your readers have misconceptions about the role of computers. At least one mentioned that the computers are essentially going to replace doctors. Ideally, the use of computers is synergistic. The whole is more than the sum of the parts. Using cars as an analogy, no one complains about having power steering or brakes in a car. They make the car easier to drive. It is more common to have a lane change warning if there is a car in the next lane. Some of the fanciest cars, such as the top-end Mercedes, monitor what is in front of the car and will automatically put on the brakes if a pedestrian is present. I can’t afford that car but would be grateful if I had it and it saved the life of a pedestrian who stepped in front of me.
This brings up the questions of alerts and alert fatigue. One wouldn’t want a beep and/or a warning light every time a car passes you in the next lane. Clearly, there has to be more work on alerts making them smarter and more configurable, as otherwise they just become noise. EHRs are far from perfect, but with good design and with thoughtful implementation, I am completely convinced that they are an aid rather than a hindrance.
We like Dr. Weinshenker’s thoughts – he has figured out and shared ways to incorporate and communicate his care for and attention to patients into his workflow with the EHR. We are still at the beginning of our transformation from paper to electronic records, and this change is not easy. It has been said, beginnings are always hard. It is through shared suggestions like those provided by Dr. Weinshenker that we will together develop a patient-oriented electronic approach. Keep those comments coming.
Dr. Skolnik is associate director of the family medicine residency program at Abington (Pa.) Memorial Hospital and professor of family and community medicine at Temple University, Philadelphia. He is editor-in-chief of Redi-Reference, a company that creates mobile apps. Dr. Notte practices family medicine and health care informatics at Abington Memorial. They are partners in EHR Practice Consultants. Contact them at [email protected].
Know Your Prostate

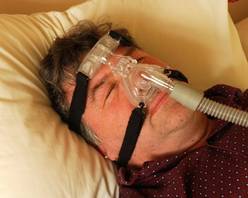
Start sleep apnea therapy with CPAP, not surgery
First-line treatment for adults with obstructive sleep apnea should be continuous positive airway pressure therapy or a mandibular advancement device, according to the American College of Physicians’ clinical practice guideline published online Sept. 24 in Annals of Internal Medicine.
In contrast, no surgical procedures or pharmacologic agents should be considered as first-line treatment, because there is insufficient evidence supporting those approaches, said Dr. Amir Qaseem, director of clinical policy at the ACP, Philadelphia, and his associates on the clinical guidelines committee.
Overweight and obese patients with obstructive sleep apnea (OSA) should be encouraged to lose weight, because that has been shown to improve symptoms and reduce scores on the Apnea-Hypopnea Index. Weight loss also confers many other health benefits, they added, while carrying minimal risk of adverse effects.
Those are the chief recommendations of the clinical practice guideline, which was compiled "to present information on both the benefits and harms of interventions" to all clinicians who treat adults with OSA. The guideline is based on a rigorous review of the evidence regarding OSA published in the literature from 1966 through 2012.
Overall, the evidence concerning hard clinical outcomes for any intervention for OSA was extremely limited.
Continuous positive airway pressure (CPAP) was the most extensively studied intervention for OSA, but the evidence from most studies was considered to be only of moderate quality. Studies assessed only the treatment’s effect on immediate outcomes and did not evaluate longer term outcomes such as cardiovascular illness or mortality. In addition, studies that examined CPAP’s effect on quality of life "were inconsistent and therefore inconclusive."
Nevertheless, the balance of evidence does show that CPAP is more effective than are control conditions or sham CPAP at improving scores on the apnea-hypopnea index, which measures the number of apneic and hypopneic episodes per hour of monitored sleep. CPAP also improved scores on the Epworth Sleepiness Scale, a self-administered questionnaire in which patients rate their likelihood of dozing off during various situations.
CPAP also is effective at improving oxygen saturation and reducing scores on the arousal index, which measures the frequency of arousals per hour of sleep using electroencephalography. However, there were insufficient data to compare the different types of CPAP, such as fixed CPAP, auto-CPAP, flexible bilevel CPAP, or CPAP with humidification.
There also was insufficient evidence to directly compare CPAP against other interventions, Dr. Qaseem and his colleagues said (Ann. Intern. Med. 2013;159:471-83).
The guideline recommends that mandibular or dental advancement devices to position the patient’s jaw while sleeping are a useful alternative for those who prefer this intervention to CPAP or for those who cannot tolerate or adhere to CPAP. Moderate-quality evidence showed that mandibular advancement devices improve scores on the apnea-hypopnea index and the arousal index.
However, that recommendation is considered "weak," because the overall data supporting the use of mandibular advancement devices are of low quality.
The data also were insufficient to recommend the use of any pharmacologic agents as a first-line therapy for OSA, or indeed as any therapy for the condition. Those include mirtazapine, xylometazoline, fluticasone, paroxetine, pantoprazole, steroids, acetazolamide, and protriptyline.
Only seven studies assessed surgical interventions for OSA. They were of varied quality, and their outcomes were inconsistent, so, the evidence is insufficient to support any surgery as first-line treatment. The procedures assessed in the studies included uvulopalatopharyngoplasty (UPPP); laser-assisted uvulopalatoplasty; radiofrequency ablation; and various combinations of pharyngoplasty, tonsillectomy, adenoidectomy, genioglossal advancement septoplasty, ablation of the nasal turbinates, and other nasal surgeries.
However, there was some evidence to suggest that UPPP and tracheostomy reduced mortality in patients with OSA.
The guideline strongly recommends that all OSA patients who are overweight or obese should be encouraged to lose weight. The evidence, albeit of low quality, shows that any intensive weight-loss intervention helps improve OSA symptoms and scores on the apnea-hypopnea index.
Finally, the evidence was insufficient to assess the potential benefits of positional therapy, oropharyngeal exercise, palatal implants, or atrial overdrive pacing for patients who already have dual-chamber pacemakers, Dr. Qaseem and his associates said.
The guideline was supported entirely by the American College of Physicians. The investigators had no relevant conflicts of interest.
Obesity is
epidemic in the United States
and “recommending to patients that they lose weight” is not a particularly
effective intervention. The real take-home message from this study is that
there is poor evidence for all treatments, but that the only studies showing a decreased
mortality were those involving surgery. Noninvasive remedies should generally
be preferred when deemed effective. Many patients find CPAP and oral appliances
uncomfortable and compliance rates with these treatments are poor. Obstructive
sleep apnea presents with a wide spectrum of symptoms, and occasionally, an
emergency tracheotomy may be lifesaving for a moribund patient. Patients with
severe OSA have a three- to sixfold increase in all-cause mortality. Motor
vehicle accidents are a major cause of death in patients with severe OSA. It
should also be emphasized that patients with OSA are best evaluated with a formal
sleep study to quantitate the degree of sleep apnea. OSA is a serious health
problem for which a variety of treatments are available. Although surgery is
rarely the first-line therapy, it plays an important role for patients with
particularly severe OSA, some of whom will require a tracheotomy, and in patients
for whom medical therapy is intolerable, not complied with, or ineffective.
Dr. Mark
Weissler is the J.P. Riddle Distinguished Professor of Otolaryngology – head
and neck surgery, University of North Carolina,
Chapel Hill.
First-line treatment for adults with obstructive sleep apnea should be continuous positive airway pressure therapy or a mandibular advancement device, according to the American College of Physicians’ clinical practice guideline published online Sept. 24 in Annals of Internal Medicine.
In contrast, no surgical procedures or pharmacologic agents should be considered as first-line treatment, because there is insufficient evidence supporting those approaches, said Dr. Amir Qaseem, director of clinical policy at the ACP, Philadelphia, and his associates on the clinical guidelines committee.
Overweight and obese patients with obstructive sleep apnea (OSA) should be encouraged to lose weight, because that has been shown to improve symptoms and reduce scores on the Apnea-Hypopnea Index. Weight loss also confers many other health benefits, they added, while carrying minimal risk of adverse effects.
Those are the chief recommendations of the clinical practice guideline, which was compiled "to present information on both the benefits and harms of interventions" to all clinicians who treat adults with OSA. The guideline is based on a rigorous review of the evidence regarding OSA published in the literature from 1966 through 2012.
Overall, the evidence concerning hard clinical outcomes for any intervention for OSA was extremely limited.
Continuous positive airway pressure (CPAP) was the most extensively studied intervention for OSA, but the evidence from most studies was considered to be only of moderate quality. Studies assessed only the treatment’s effect on immediate outcomes and did not evaluate longer term outcomes such as cardiovascular illness or mortality. In addition, studies that examined CPAP’s effect on quality of life "were inconsistent and therefore inconclusive."
Nevertheless, the balance of evidence does show that CPAP is more effective than are control conditions or sham CPAP at improving scores on the apnea-hypopnea index, which measures the number of apneic and hypopneic episodes per hour of monitored sleep. CPAP also improved scores on the Epworth Sleepiness Scale, a self-administered questionnaire in which patients rate their likelihood of dozing off during various situations.
CPAP also is effective at improving oxygen saturation and reducing scores on the arousal index, which measures the frequency of arousals per hour of sleep using electroencephalography. However, there were insufficient data to compare the different types of CPAP, such as fixed CPAP, auto-CPAP, flexible bilevel CPAP, or CPAP with humidification.
There also was insufficient evidence to directly compare CPAP against other interventions, Dr. Qaseem and his colleagues said (Ann. Intern. Med. 2013;159:471-83).
The guideline recommends that mandibular or dental advancement devices to position the patient’s jaw while sleeping are a useful alternative for those who prefer this intervention to CPAP or for those who cannot tolerate or adhere to CPAP. Moderate-quality evidence showed that mandibular advancement devices improve scores on the apnea-hypopnea index and the arousal index.
However, that recommendation is considered "weak," because the overall data supporting the use of mandibular advancement devices are of low quality.
The data also were insufficient to recommend the use of any pharmacologic agents as a first-line therapy for OSA, or indeed as any therapy for the condition. Those include mirtazapine, xylometazoline, fluticasone, paroxetine, pantoprazole, steroids, acetazolamide, and protriptyline.
Only seven studies assessed surgical interventions for OSA. They were of varied quality, and their outcomes were inconsistent, so, the evidence is insufficient to support any surgery as first-line treatment. The procedures assessed in the studies included uvulopalatopharyngoplasty (UPPP); laser-assisted uvulopalatoplasty; radiofrequency ablation; and various combinations of pharyngoplasty, tonsillectomy, adenoidectomy, genioglossal advancement septoplasty, ablation of the nasal turbinates, and other nasal surgeries.
However, there was some evidence to suggest that UPPP and tracheostomy reduced mortality in patients with OSA.
The guideline strongly recommends that all OSA patients who are overweight or obese should be encouraged to lose weight. The evidence, albeit of low quality, shows that any intensive weight-loss intervention helps improve OSA symptoms and scores on the apnea-hypopnea index.
Finally, the evidence was insufficient to assess the potential benefits of positional therapy, oropharyngeal exercise, palatal implants, or atrial overdrive pacing for patients who already have dual-chamber pacemakers, Dr. Qaseem and his associates said.
The guideline was supported entirely by the American College of Physicians. The investigators had no relevant conflicts of interest.
FROM ANNALS OF INTERNAL MEDICINE
Major finding: First-line therapy for adults with obstructive sleep apnea should be CPAP or a mandibular advancement device; surgery and pharmacotherapy do not appear to be effective, and weight loss is strongly recommended for patients who are overweight or obese.
Data source: The guideline was based on a systematic review of the literature regarding obstructive sleep apnea from 1966 through 2010.
Disclosures: The guideline was supported entirely by the American College of Physicians. The investigators had no relevant conflicts of interest.

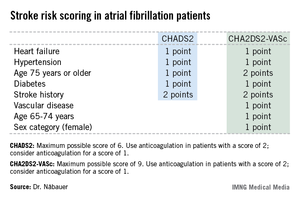
CHA2DS2-VASc score performs best in assessing atrial fibrillation stroke risk
AMSTERDAM – Use of the CHA2DS2-VASc score markedly improves classification of atrial fibrillation patients who are truly at low risk of stroke, compared with the commonly used CHADS2 score, a German national study found.
"We do not feel that a CHADS2 risk score of 0 or 1 is suitable to identify low-risk patients. The CHA2DS2-VASc score provides a more refined risk stratification in low-risk patients. In the real life, prospective German AFNET [German Competence Network on Atrial Fibrillation] registry, a CHA2DS2-VASc score of 0 identifies a subgroup of patients with very low stroke risk unlikely to benefit from oral anticoagulation therapy," Dr. Michael Näbauer said at the annual congress of the European Society of Cardiology.
Among 795 patients in the AFNET registry who had a CHA2DS2-VASc score of 0, only 8 correctly categorized patients had a nonprocedurally related stroke, transient ischemic attack (TIA), or thromboembolism during 5 years of prospective follow-up, reported Dr. Näbauer, head of the echocardiographic unit at Ludwig Maximilians University Hospital, Munich.
A transcontinental split exists at present regarding the best clinical decision tool for assessing stroke risk in patients with atrial fibrillation (AF), and thus identifying those in whom oral anticoagulation is or is not warranted. Current American guidelines recommend using the CHADS2 score, while more recent ESC guidelines released last year advocate superseding CHADS2 with the newer CHA2DS2-VASc scoring system (Eur. Heart J. 2012;33:2719-47).

Dr. Näbauer’s report from the German AFNET registry highlighted the advantages of using CHA2DS2-VASc. Among 8,847 patients with nonvalvular AF participating in the registry run by physicians having a special interest in atrial fibrillation, 16.2% were assigned a CHADS2 score of 0 and 31.5% had a score of 1, meaning their stroke risk going forward was too low to justify the routine use of prophylactic oral anticoagulation therapy, with its attendant bleeding risk.
Here’s the deal killer for the CHADS2 scoring system, he said: Of the 403 stroke, TIA, and thromboembolic events that occurred in the nearly 9,000 AF patients during 5 years of prospective follow-up, 36% occurred in patients with a CHADS2 score of 0 or 1.
"This finding suggests that CHADS2 classes 0 and 1 contain subgroups of patients with significant stroke risk that may be identified by refined stroke risk classification," the cardiologist noted.
Application of the CHA2DS2-VASc score to the AFNET population resulted in reclassification of 126 of the 145 CHADS2 class 0 or 1 patients who had a stroke, TIA, or thromboembolism to a higher-risk CHA2DS2-VASc category where oral anticoagulation is appropriate.
Of the 45 stroke events that occurred among 1,430 patients who were CHADS2 class 0, 12 events occurred in patients who were CHA2DS2-VASc class 2 and 14 in CHA2DS2-VASc class 1 – groups in which oral anticoagulation is recommended.
Moreover, 4 of the 19 stroke events occurring in the 795 patients who were CHA2DS2-VASc class 0 happened in association with AF ablation or cardioversion procedures, when oral anticoagulation is temporarily discontinued. Another seven stroke events occurred in patients whose true CHA2DS2-VASc score had increased from 0 during follow-up, mainly because of advancing age. So ultimately only 8 of 795 patients correctly classified as CHA2DS2-VASc 0 had a stroke event unrelated to a cardiac procedure during 5 years of follow-up.

Session cochair Dr. Robert Hatala said that the AFNET experience highlights an important clinical lesson: Stroke risk in AF patients is not static. It changes over time, and periodic reassessment is essential.
"All of the risk scores are imperfect. It’s really very important to relook at your patients and not give them a fixed stamp forever. The risk scores change over time as patients get older, perhaps receive a diagnosis of hypertension, or develop congestive heart failure, maybe with preserved systolic function. So restratify," urged Dr. Hatala, head of cardiology and director of the arrhythmia and pacing center at Slovak Medical University, Bratislava, Slovakia.
Dr. Näbauer and Dr. Hatala reported having no relevant financial conflicts.
AMSTERDAM – Use of the CHA2DS2-VASc score markedly improves classification of atrial fibrillation patients who are truly at low risk of stroke, compared with the commonly used CHADS2 score, a German national study found.
"We do not feel that a CHADS2 risk score of 0 or 1 is suitable to identify low-risk patients. The CHA2DS2-VASc score provides a more refined risk stratification in low-risk patients. In the real life, prospective German AFNET [German Competence Network on Atrial Fibrillation] registry, a CHA2DS2-VASc score of 0 identifies a subgroup of patients with very low stroke risk unlikely to benefit from oral anticoagulation therapy," Dr. Michael Näbauer said at the annual congress of the European Society of Cardiology.
Among 795 patients in the AFNET registry who had a CHA2DS2-VASc score of 0, only 8 correctly categorized patients had a nonprocedurally related stroke, transient ischemic attack (TIA), or thromboembolism during 5 years of prospective follow-up, reported Dr. Näbauer, head of the echocardiographic unit at Ludwig Maximilians University Hospital, Munich.
A transcontinental split exists at present regarding the best clinical decision tool for assessing stroke risk in patients with atrial fibrillation (AF), and thus identifying those in whom oral anticoagulation is or is not warranted. Current American guidelines recommend using the CHADS2 score, while more recent ESC guidelines released last year advocate superseding CHADS2 with the newer CHA2DS2-VASc scoring system (Eur. Heart J. 2012;33:2719-47).
Dr. Näbauer’s report from the German AFNET registry highlighted the advantages of using CHA2DS2-VASc. Among 8,847 patients with nonvalvular AF participating in the registry run by physicians having a special interest in atrial fibrillation, 16.2% were assigned a CHADS2 score of 0 and 31.5% had a score of 1, meaning their stroke risk going forward was too low to justify the routine use of prophylactic oral anticoagulation therapy, with its attendant bleeding risk.
Here’s the deal killer for the CHADS2 scoring system, he said: Of the 403 stroke, TIA, and thromboembolic events that occurred in the nearly 9,000 AF patients during 5 years of prospective follow-up, 36% occurred in patients with a CHADS2 score of 0 or 1.
"This finding suggests that CHADS2 classes 0 and 1 contain subgroups of patients with significant stroke risk that may be identified by refined stroke risk classification," the cardiologist noted.
Application of the CHA2DS2-VASc score to the AFNET population resulted in reclassification of 126 of the 145 CHADS2 class 0 or 1 patients who had a stroke, TIA, or thromboembolism to a higher-risk CHA2DS2-VASc category where oral anticoagulation is appropriate.
Of the 45 stroke events that occurred among 1,430 patients who were CHADS2 class 0, 12 events occurred in patients who were CHA2DS2-VASc class 2 and 14 in CHA2DS2-VASc class 1 – groups in which oral anticoagulation is recommended.
Moreover, 4 of the 19 stroke events occurring in the 795 patients who were CHA2DS2-VASc class 0 happened in association with AF ablation or cardioversion procedures, when oral anticoagulation is temporarily discontinued. Another seven stroke events occurred in patients whose true CHA2DS2-VASc score had increased from 0 during follow-up, mainly because of advancing age. So ultimately only 8 of 795 patients correctly classified as CHA2DS2-VASc 0 had a stroke event unrelated to a cardiac procedure during 5 years of follow-up.
Session cochair Dr. Robert Hatala said that the AFNET experience highlights an important clinical lesson: Stroke risk in AF patients is not static. It changes over time, and periodic reassessment is essential.
"All of the risk scores are imperfect. It’s really very important to relook at your patients and not give them a fixed stamp forever. The risk scores change over time as patients get older, perhaps receive a diagnosis of hypertension, or develop congestive heart failure, maybe with preserved systolic function. So restratify," urged Dr. Hatala, head of cardiology and director of the arrhythmia and pacing center at Slovak Medical University, Bratislava, Slovakia.
Dr. Näbauer and Dr. Hatala reported having no relevant financial conflicts.
AT THE ESC CONGRESS 2013
Major finding: During 5 years of prospective follow-up of patients with nonvalvular atrial fibrillation, 145 patients who had a stroke, transient ischemic attack, or thromboembolism also had a CHADS2 score indicating a low risk for stroke, compared with only 19 who had one of those events and were classified as low risk by the CHA2DS2-VASc stroke risk scoring system.
Data source: The German AFNET registry, a real-world, prospective national registry including 8,847 patients with nonvalvular atrial fibrillation.
Disclosures: The AFNET registry is publically funded by the German Federal Ministry for Education and Research. Dr. Näbauer and Dr. Hatala reported having no relevant financial conflicts.

Silence isn’t always golden
One thing that is consistent for all teenage boys is that no one is talking about what going on "down there!" As young men approach adolescence, the thought of a conversation regarding their testicles is almost ludicrous. Certainly they will not talk to their parents, and the doctor also is likely to get the silent treatment when questioning if they have any concerns regarding their "private parts." One study, however, showed that testicular cancer is on the rise, particularly in the industrialized nations (J. Urol. 2003;170:5-11).
Testicular cancer is rare, accounting for only 1% of all male cancers, but it is the most common cancer for males aged 15-35 years (CA Cancer J. Clin. 2013;63:11-30). Every year there are about 8,300 men diagnosed with testicular cancer, approximately 350 of whom will die (CA Cancer J. Clin. 2011;61:212-36).

Risk factors for testicular cancer are history of undescended testes, family history, and history of contralateral testicular cancer. A screening test has not been found to be beneficial, given the low incidence and high cure rate.
Testicular cancer is very treatable when caught early, with nearly a 90% cure rate with radical orchiectomy and continued surveillance with radiation and or single-agent chemotherapy. When it is not caught early and metastasis has occurred that number decreases to 70% (Eur. J. Cancer 2006;42:820-6).
Testicular cancer is painless, presenting as a lump on the testicle. The testicle may enlarge, feel heavy, or become hard, so it’s not hard to imagine how this can easily be overlooked without regular self-exams.
With this cancer being on the rise, it is imperative that pediatricians educate young men about their risk and teach them how to do self-examinations. Also, using sports physicals and annual wellness exams to do an inspection will aid in early diagnosis, so that even subtle changes can be identified.
We have become very comfortable in educating women that monthly breast exams are important. Testicular exams also are important, and education is the first step in preventing advanced testicular disease.
One thing that is consistent for all teenage boys is that no one is talking about what going on "down there!" As young men approach adolescence, the thought of a conversation regarding their testicles is almost ludicrous. Certainly they will not talk to their parents, and the doctor also is likely to get the silent treatment when questioning if they have any concerns regarding their "private parts." One study, however, showed that testicular cancer is on the rise, particularly in the industrialized nations (J. Urol. 2003;170:5-11).
Testicular cancer is rare, accounting for only 1% of all male cancers, but it is the most common cancer for males aged 15-35 years (CA Cancer J. Clin. 2013;63:11-30). Every year there are about 8,300 men diagnosed with testicular cancer, approximately 350 of whom will die (CA Cancer J. Clin. 2011;61:212-36).
Risk factors for testicular cancer are history of undescended testes, family history, and history of contralateral testicular cancer. A screening test has not been found to be beneficial, given the low incidence and high cure rate.
Testicular cancer is very treatable when caught early, with nearly a 90% cure rate with radical orchiectomy and continued surveillance with radiation and or single-agent chemotherapy. When it is not caught early and metastasis has occurred that number decreases to 70% (Eur. J. Cancer 2006;42:820-6).
Testicular cancer is painless, presenting as a lump on the testicle. The testicle may enlarge, feel heavy, or become hard, so it’s not hard to imagine how this can easily be overlooked without regular self-exams.
With this cancer being on the rise, it is imperative that pediatricians educate young men about their risk and teach them how to do self-examinations. Also, using sports physicals and annual wellness exams to do an inspection will aid in early diagnosis, so that even subtle changes can be identified.
We have become very comfortable in educating women that monthly breast exams are important. Testicular exams also are important, and education is the first step in preventing advanced testicular disease.

Evaluation of VTE Prophylaxis in CLD
Chronic liver disease (CLD) or cirrhosis results in greater than 400,000 hospital admissions every year and accounted for approximately 29,000 deaths in 2007.1,2 CLD patients often have an elevated international normalized ratio (INR) due to disease‐associated coagulopathy resulting from a decrease in the production of most procoagulant factors. Due to INR elevations in CLD, clinicians are given a false sense of security surrounding the risk of developing a venous thromboembolism (VTE). The hypothesis that CLD patients are autoanticoagulated and therefore protected against VTE has not been proven.
In the United States, the total incidence of VTE is greater than 200,000 events per year accompanied by a significant number of events occurring in high‐risk hospitalized patients.[3] It has been suggested that patients with liver disease may have a reduced risk for VTE.[4] However, more recent studies report an increased risk with the incidence of VTE in CLD patients occurring in 0.5% to 6.3% of the population.[5, 6, 7, 8, 9, 10] The parallel reduction of anticoagulant factors, such as antithrombin and protein C, along with the reduction in procoagulant factors rebalances the coagulation system, possibly explaining why CLD patients are not protected from VTE.[11, 12] Other mechanistic possibilities include low serum albumin,[8, 9] an elevation of endogenous estrogen levels, immobility associated with the disease,[5] greater morbidity as reflected by high Child‐Pugh scores, and a chronic inflammatory state that results in poor flow and vasculopathy.[7]
Current guidelines for the prevention of VTE do not provide recommendations on the use of prophylaxis in the cirrhotic population,[13] although recent literature reviews suggest that strong consideration for pharmacologic prophylaxis be given when the benefit outweighs the risk.[14, 15] Limited studies have evaluated the use of VTE prophylaxis in CLD patients, whether pharmacologic or mechanical.[6, 7, 8, 16] These studies report that the utilization of VTE prophylaxis in CLD patients is suboptimal, with at least 75% of CLD patients receiving no prophylaxis.[6, 7, 8] The purpose of our study was to examine the use of prophylactic agents and the incidence of VTE and bleeding events in CLD patients.
METHODS
A retrospective chart review of patients diagnosed with CLD or cirrhosis at Methodist University Hospital between August 1, 2009 and July 31, 2011 was conducted. These patients were identified through the corporate patient financial services database using the International Classification of Diseases, 9th Revision, Clinical Modification code 571.xx for CLD/cirrhosis. Patients were included if they were 18 years or older, admitted for or with a history of CLD, and had an INR of 1.4 on admission. An elevated INR was chosen as inclusion criteria as this is often when the controversy of prophylaxis versus no prophylaxis emerges. CLD was defined based on previous histories or clinical presentations of past variceal bleed, presence of varices based on endoscopy report, hepatic encephalopathy, spontaneous bacterial peritonitis, ascites, liver biopsy proven cirrhosis, or imaging consistent with cirrhotic liver changes. CLD was classified as alcoholic, viral hepatitis (hepatitis B and C), and other, such as nonalcoholic steatohepatitis and autoimmune. Patients admitted with maintenance anticoagulation, suspected bleed or VTE, palliative care diagnosis, or history of/anticipated liver transplant were excluded. If a patient met inclusion criteria for an admission and was subsequently readmitted within 30 days, only the initial admission was included. Once patients were included they were assigned to 1 of 4 groups based on the type of prophylaxis received: pharmacologic, mechanical, combined pharmacologic and mechanical, and no prophylaxis. Patients who received pharmacologic or mechanical prophylaxis for at least 50% of their hospital stay were assigned to their corresponding groups accordingly. Patients who received pharmacologic and mechanical prophylaxis for at least 50% of their hospital stay were assigned to the combination group. Patients receiving either form of VTE prophylaxis for <50% of their hospital stay were considered to be without prophylaxis. Pharmacologic prophylaxis was defined by the use of unfractionated heparin (UFH) 5000 units subcutaneously (sq) 3 times daily or twice daily (bid), low molecular weight heparin (LMWH) 30 mg sq bid or 40 mg every day (qd), or fondaparinux 2.5 mg qd. Mechanical prophylaxis was defined by the use of a sequential compression device (SCD). The study was approved by the University of Tennessee Institutional Review Board.
Patient demographics including age, sex, race, height, and weight were documented with a body mass index (BMI) calculated for each patient. Obesity was defined as BMI 30 kg/m2. Risk factors for VTE including obesity, surgery, infection, trauma, malignancy, and history of VTE as well as the etiology of cirrhosis were collected and recorded whenever available based on documentation in the medical chart. Clinical data including lowest serum albumin, highest total bilirubin, highest INR, and platelets on admission were recorded. Severity of ascites and hepatic encephalopathy were documented. Child‐Pugh score and stage as well as Model for End‐Stage Liver Disease (MELD) score were calculated. In‐hospital VTE, bleeding events, length of stay, in‐hospital mortality, and the use, type, and number of days of VTE prophylaxis were documented. VTE was defined as deep venous thrombosis (DVT) or pulmonary embolism diagnosed by venous Doppler ultrasonography, spiral computed tomography (CT) of the chest, or ventilation/perfusion scan. Bleeding was defined by documentation in the medical record plus the administration of packed red blood cells, fresh frozen plasma, recombinant factor VIIa, or vitamin K. For patients who experienced a bleed, risk factors for in‐hospital bleeding as defined by American College of Chest Physicians Evidence‐Based Clinical Practice Guidelines 2012 guidelines (CHEST) were documented.[13]
The primary outcome was to describe the use of VTE prophylaxis in CLD patients. Secondary outcomes were to determine the overall incidence of VTE in CLD patients, examine the incidence of VTE based on the utilization of prophylaxis, compare the occurrence of bleeding events in CLD patients based on type of prophylaxis, evaluate the use of mechanical versus pharmacologic prophylaxis based on INR, evaluate length of stay (LOS) and in‐hospital mortality for CLD patients with and without prophylaxis, and evaluate 30‐day readmission rate for VTE.
Patients were arbitrarily divided into 2 groups according to the highest INR (1.42.0 or >2.0). Baseline characteristics were compared between the 2 groups. Variables were expressed as mean or median with standard deviation or interquartile range. Categorical values were expressed as percentages and compared using the [2] test or Fisher exact test. Continuous data were compared using Mann‐Whitney U test for nonparametric data or Student t test for parametric data. Significance was defined as P<0.05. All statistical analyses were performed using SPSS Statistics (version 20.0; SPSS, Inc., Chicago, IL).
RESULTS
We identified 410 patients who met inclusion criteria during the study period. Baseline demographics were similar between the 2 groups with the exception of age, which was statistically higher in the INR 1.4 to 2.0 group. The most common etiology of CLD was hepatitis B or C, followed by alcohol, then other causes. Alcoholic CLD was associated with higher INR values (>2.0). Patients with INR >2.0 were found to exhibit lower serum albumin levels and platelets on admission as well as higher total bilirubin and INR values. There was also a significant difference in Child‐Pugh stages B and C, with the INR >2.0 group only having stage C. In addition, the higher INR group had a significantly higher average MELD score (Table 1).
| Characteristic | INR1.42.0, n=251 | INR>2.0, n=159 | P Value |
|---|---|---|---|
| |||
| Age, yearsSD | 55.710.4 | 53.310.1 | 0.017 |
| Male sex | 137 (54.6) | 99 (62.3) | 0.125 |
| BMISD | 29.17.3 | 30.37.7 | 0.103 |
| Race | |||
| African American | 99 (39.4) | 53 (33.3) | 0.212 |
| White | 139 (55.4) | 99 (62.3) | 0.169 |
| Other | 13 (5.2) | 7 (4.4) | 0.722 |
| Etiology of CLD | |||
| Hepatitis B or C | 127 (50.6) | 70 (44) | 0.194 |
| Alcohol | 59 (23.5) | 57 (35.9) | 0.007 |
| Other | 65 (25.9) | 32 (20.1) | 0.18 |
| VTE risk factors | |||
| Obesity, BMI 30 | 107 (42.6) | 71 (44.6) | 0.687 |
| Surgery | 21 (8.4) | 7 (4.1) | 0.121 |
| Infection | 81 (32.3) | 63 (39.6) | 0.129 |
| Trauma | 1 (0.4) | 1 (0.6) | 1.00 |
| Malignancy | 35 (13.9) | 24 (15.1) | 0.746 |
| History of VTE | 6 (2.4) | 4 (2.5) | 1.00 |
| Median number VTE risk factors (range) | 1 (03) | 1 (04) | 0.697 |
| Laboratory values | |||
| AlbuminSD | 2.20.58 | 2.00.53 | <0.001 |
| Tbili, median (IQR) | 2.8 (1.95.0) | 8.1 (5.013.3) | <0.001 |
| INR, median (IQR) | 1.7 (1.51.8) | 2.4 (2.22.9) | <0.001 |
| Admission platelets, median (IQR) | 92 (61141) | 79 (58121) | 0.008 |
| Child Pugh stage | |||
| Class A | 3 (1.2) | 0 (0) | 0.286 |
| Class B | 91 (36.3) | 0 (0) | <0.001 |
| Class C | 157 (62.5) | 159 (100) | <0.001 |
| MELD scoreSD | 18.55.1 | 28.36.3 | <0.001 |
Of the 410 patients included, 225 (55%) patients received thromboprophylaxis. The majority of patients received mechanical prophylaxis (n=154), followed by pharmacologic (n=49), and then a combination of mechanical plus pharmacologic (n=22). For patients receiving pharmacologic either alone or in combination with SCDs, 30 received UFH, 33 received LMWH, 1 patient received fondaparinux, and the remaining 7 received a combination of the agents to total 50% of their hospital stay. For patients with INR >2.0, a significant decrease in overall thromboprophylaxis use was seen compared to those with INR 1.4 to 2.0 (47% vs 60%; P=0.013). Patients with INR >2.0 also received significantly less pharmacologic prophylaxis compared to those with INR 1.4 to 2.0 (3.2% vs 17.5%; P<0.001). No differences in the use of mechanical or combination prophylaxis was seen between the groups (Figure 1).

As shown in Table 2, in‐hospital VTE occurred in 3 patients (0.7%). All 3 patients had a DVT. Of the patients with documented VTE, 1 was Child‐Pugh stage B and 2 were stage C. Fifteen bleeding events occurred (3.7%), 9 on mechanical prophylaxis, 1 on pharmacologic, 3 on combination, and 2 with no prophylaxis. The majority of patients experiencing a bleeding event had an INR >2.0 (P=0.001). Eleven patients out of the 15 were considered to be at high risk of bleeding as defined per CHEST 2012 guidelines,[13] whereas 100% had Child‐Pugh stage C with an average MELD score of 31.77.5. It should be noted that 1 patient experienced a bleeding event after receiving pharmacologic treatment doses for VTE and was subsequently placed on a prophylactic dose without any bleeding complications.
| Characteristic | INR1.42.0, n=251 | INR>2.0, n=159 | P Value |
|---|---|---|---|
| |||
| In‐hospital VTE | 1 (0.4) | 2 (1.3) | 0.563 |
| Mechanical | 0 (0) | 1 (0.6) | 0.389 |
| Pharmacologic | 0 (0) | 1 (0.6) | 0.389 |
| Combination | 0 (0) | 0 (0) | 1.00 |
| No prophylaxis | 1 (0.4) | 0 (0) | 1.00 |
| Bleeding event | 3 (1.2) | 12 (7.5) | 0.001 |
| Mechanical | 2 (0.8) | 7 (4.4) | 0.033 |
| Pharmacologic* | 0 (0) | 1 (0.6) | 0.389 |
| Combination | 1 (0.4) | 2 (1.3) | 0.563 |
| No prophylaxis | 0 (0) | 2 (1.3) | 0.152 |
| LOS, median (IQR) | 5 (2.98) | 7.2 (413.1) | <0.001 |
| Hospital mortality | 6 (2.4) | 30 (18.9) | <0.001 |
| 30‐day readmission rate for VTE | 2 (0.8) | 0 (0) | 0.524 |
Longer LOS and higher mortality rates were seen in patients who received prophylaxis compared to those who received no prophylaxis (P<0.001 and P=0.001, respectively). Of the 36 patients who died, 22 received mechanical prophylaxis, 2 received pharmacologic, 5 received a combination, and 7 received no prophylaxis. Longer LOS and higher mortality rates were also seen in patients with INR >2 compared to patients with INR 1.4 to 2.0 (P<0.001 for both) (Table 2). Higher mortality rates were associated with greater severity of disease as defined by Child‐Pugh C classification in all 36 patients (P=0.001) and an average MELD score of 31.87.6. No differences in 30‐day readmission rates for VTE were seen between prophylaxis groups.
DISCUSSION/CONCLUSION
The use of thromboprophylaxis in our study was 55%, which is consistent with the reported rate of 30% to 70% in general hospitalized patients.[17] To our knowledge this is the first study to focus primarily on the use of both pharmacologic and mechanical thromboprophylaxis in CLD patients. Previous studies have focused on the incidence and risks of VTE in CLD patients,[5, 6, 7, 8, 9, 10] with only 3 of those studies evaluating the use of pharmacologic and mechanical thromboprophylaxis as a secondary outcome.[6, 7, 8] The reported use of thromboprophylaxis in these studies ranges from 21% to 25%. Pharmacologic prophylaxis rates were 7% in Northup et al.,[8] 12% in Aldawood et al.,[7] and 9% in Dabbagh et al.,[6] compared to 17% in our study (pharmacologic alone plus combination). Mechanical prophylaxis rates were 14%, 12%, and 16%, respectively, compared to our 38%. None of the previous studies gave a definition for prophylaxis. This is important to note because discrepancies in prophylaxis reporting could lead to significant differences in rates of prophylaxis when comparing these studies to our study.
Despite the higher rates of thromboprophylaxis, the incidence of VTE was 0.7%. Our VTE incidence falls within the reported incidence rate of 0.5% to 6.3%.[6, 7, 8, 9, 10] Similar to Aldawood et al. and Dabbagh et al., we found no significant differences in the incidence of VTE and prophylaxis use.[6, 7] Dabbagh et al. suggest that the incidence of VTE increases as disease severity increases.[6] However, with only 25% of their patients receiving thromboprophylaxis, it is hard to determine if the higher incidence of VTE was due to greater disease severity or the low use of thromboprophylaxis. It is expected that patients with more severe disease are less likely to receive VTE prophylaxis secondary to increases in INR and/or thrombocytopenia. As evidenced in our study, there was a significant decrease in the use of thromboprophylaxis in patients with INR >2.0, driven largely by the significant decrease in the use of pharmacologic prophylaxis. Due to the low incidence of VTE observed, our study lacks adequate power to truly determine the relationship between use of thromboprophylaxis or severity of disease and incidence of VTE.
Nonetheless, we did find a significant correlation between disease severity and bleeding in CLD patients. Although not a new finding in the literature, this result substantiates the claim that the delicate balance and unpredictability of coagulopathy in CLD leads to bleeding events as well as VTE. In our study we had an overall bleeding rate of 3.7%. Patients who experienced a bleeding event had greater disease severity, significantly higher INR, and 73% were considered to be at high risk for an event as defined by CHEST guidelines.[13] The majority of events happened while on mechanical or no prophylaxis. Four patients who received pharmacologic prophylaxis had a bleeding event; however, 1 of those patients bled on VTE pharmacologic treatment dose for VTE found on day 2 of hospital admission. In a recent study by Bechmann et al. looking at the use of LMWH in 84 cirrhotic patients, they report a bleeding rate of 8.3%, a rate that is similar to rates of bleeding in nonanticoagulated cirrhotic patients.[18] In comparison with our study, we had 71 patients receive pharmacologic prophylaxis either alone or in combination and 4 bleeding events, giving an event rate of 5.6%. This rate decreases to 4.2% when considering only prophylactic pharmacologic doses, suggesting that pharmacologic prophylaxis in CLD patients poses a low risk of bleeding. Interestingly enough, an association was found between alcoholic CLD and higher INR (>2.0) in our study. Given that patients with higher INR had increased bleeding events, this introduces a question of whether or not the specific cause of CLD (ie, alcoholic hepatitis) may represent a special risk for bleeding in this population. However, additional studies are needed to confirm this hypothesis.
To our knowledge, this study is also the first to look at the relationship of thromboprophylaxis use on LOS and mortality in CLD patients. At first glance, the fact that patients who received prophylaxis had both significantly longer LOS and higher mortality rates in our study is concerning. However, it is likely that the increased LOS and mortality in our study is attributed to greater disease severity, as evidenced by higher INRs and Child‐Pugh scores regardless of prophylaxis use or not. Also, a known risk factor for VTE is reduced mobility. Although no standard definition for reduced mobility exists, Barbar et al. define it as anticipated bed rest with bathroom privileges (either because of patient's limitations or on physician's order) for at least 3 days.[19] Due to this known increased risk for VTE, it is expected that patient's with a LOS of 3 days are more likely to receive thromboprophylaxis.
Our study has several limitations. Like other retrospective studies, this study was conducted in 1 medical center and relies on the accuracy of documentation. We relied on patient history and clinical presentation to diagnose CLD without the requirement of histologic diagnosis. However, all patients included in the study had an unquestionable diagnosis by a physician. We used an arbitrary definition and assignment of patients into groups based on the method of VTE prophylaxis utilized due to lack of a definition in the medical literature. There was a possible selection bias for pharmacologic prophylaxis based on patient risk factors for bleeding, such as presence of varices and thrombocytopenia. Also, the inability to ensure that patients with an order for SCDs were actively wearing the device throughout their hospital stay is yet another limitation. Not all patients underwent testing for VTE; therefore, the actual incidence of VTE may be higher than what we found. Only those patients who experienced a bleeding event were assessed for risk factors that predisposed them to bleed, making it hard to correlate those risk factors with the risk of bleeding in all CLD patients.
Despite these limitations, our study has great strengths. This is the first study to focus primarily on the use of both pharmacologic and mechanical thromboprophylaxis in CLD patients. Therefore, it has the potential to influence and raise awareness on the decisions made involving the management of CLD patients in regard to VTE prophylaxis and will hopefully serve as an impetus for future prospective studies. When comparing this study to other studies looking at the incidence of VTE in CLD patients and the use of prophylaxis, our study sample size is relatively large. Also, by including only those patients with INR of at least 1.4 on admission, our study patients had greater severity of disease, making this study distinctly relevant in the clinical debate of whether or not CLD patients should receive thromboprophylaxis.
In conclusion, the use of thromboprophylaxis in CLD patients is higher in our study than previous reports but remains suboptimal. Although bleeding is an inherent risk factor in CLD independent of VTE prophylaxis, the use of VTE pharmacologic prophylaxis does not appear to increase bleeding in CLD patients with INR 2.0. Further studies focusing on baseline bleeding risks (ie, thrombocytopenia, presence of varices) and the use of pharmacologic prophylaxis are needed to provide additional safety data on the use of pharmacologic prophylaxis in this patient population.
Disclosures: All coauthors have seen and agree with the contents of the article. Submission is not under review by any other publication. All authors have not received notification of redundant or duplicate publication. All authors have no financial conflicts of interest. No funding was received for this study or article.
- , , . National hospital discharge survey: 2002 annual summary with detailed diagnosis and procedure data. Vital Health Stat 13. 2005;158:1–199.
- , , , . Deaths: final data for 2007. Natl Vital Stat Rep. 2010;58(19):1–135.
- , , , et al. The diagnostic approach to acute venous thromboembolism: clinical practice guideline. Am J Respir Crit Care Med. 1999;160(3):1043–1066.
- , , , , , . Risk factors for deep vein thrombosis and pulmonary embolism: a population‐based case‐control study. Arch Intern Med. 2000;160(6):809–815.
- , , , , , . Risk of venous thromboembolism in patients with liver disease: a nationwide population‐based case‐control study. Am J Gastroenterol. 2009;104(1):96–101.
- , , , , . Coagulopathy does not protect against venous thromboembolism in hospitalized patients with chronic liver disease. Chest. 2010;137(5):1145–1149.
- , , , et al. The incidence of venous thromboembolism and practice of deep venous thrombosis prophylaxis in hospitalized cirrhotic patients. Thromb J. 2011;9(1):1.
- , , , et al. Coagulopathy does not fully protect hospitalized cirrhosis patients from peripheral venous thromboembolism. Am J Gastroenterol. 2006;101(7):1524–1528.
- , , , , . Deep vein thrombosis and pulmonary embolism in cirrhosis patients. Dig Dis Sci. 2008;53(11):3012–3017.
- , , , , , . Venous thromboembolism and liver cirrhosis. Rev Esp Enferm Dig. 2008;100(5):259–262.
- , , . Should we give thromboprophylaxis to patients with liver cirrhosis and coagulopathy? HPB. 2009;11(6):459–464.
- , . The coagulopathy of chronic liver disease. N Engl J Med. 2011;365(2):147–156.
- , , , et al. Prevention of VTE in nonsurgical patients: antithrombotic therapy and prevention of thrombosis, 9th ed: American College of Chest Physicians Evidence‐Based Clinical Practice Guidelines. Chest. 2012;141(suppl 2):e195S–e226S.
- , . Pharmacologic prophylaxis against venous thromboembolism in hospitalized patients with cirrhosis and associated coagulopathies. Am J Health Syst Pharm. 2012;69(8):658–63.
- , , . Risk of venous thromboembolism in patients with chronic liver disease and the utility of venous thromboembolism prophylaxis. Ann Pharmacother. 2012;46(6):873–878.
- , , , et al. A systematic review of venous thromboembolism prophylaxis strategies in patients with renal insufficiency, obesity, or on antiplatelet agents. J Hosp Med. 2013;8(7):394–401.
- , , , , , . Prevention of venous thromboembolism in the hospitalized medical patient. Cleve Clin J Med. 2008;75(suppl 3):S7–S16.
- , , , , , . Low‐molecular‐weight heparin in patients with advanced cirrhosis. Liver Int. 2011;31(1):75–82.
- , , , et al. A risk assessment model for the identification of hospitalized medical patients at risk for venous thromboembolism: the Padua Prediction Score. J Thromb Haemost. 2010;8(11):2450–2457.
Chronic liver disease (CLD) or cirrhosis results in greater than 400,000 hospital admissions every year and accounted for approximately 29,000 deaths in 2007.1,2 CLD patients often have an elevated international normalized ratio (INR) due to disease‐associated coagulopathy resulting from a decrease in the production of most procoagulant factors. Due to INR elevations in CLD, clinicians are given a false sense of security surrounding the risk of developing a venous thromboembolism (VTE). The hypothesis that CLD patients are autoanticoagulated and therefore protected against VTE has not been proven.
In the United States, the total incidence of VTE is greater than 200,000 events per year accompanied by a significant number of events occurring in high‐risk hospitalized patients.[3] It has been suggested that patients with liver disease may have a reduced risk for VTE.[4] However, more recent studies report an increased risk with the incidence of VTE in CLD patients occurring in 0.5% to 6.3% of the population.[5, 6, 7, 8, 9, 10] The parallel reduction of anticoagulant factors, such as antithrombin and protein C, along with the reduction in procoagulant factors rebalances the coagulation system, possibly explaining why CLD patients are not protected from VTE.[11, 12] Other mechanistic possibilities include low serum albumin,[8, 9] an elevation of endogenous estrogen levels, immobility associated with the disease,[5] greater morbidity as reflected by high Child‐Pugh scores, and a chronic inflammatory state that results in poor flow and vasculopathy.[7]
Current guidelines for the prevention of VTE do not provide recommendations on the use of prophylaxis in the cirrhotic population,[13] although recent literature reviews suggest that strong consideration for pharmacologic prophylaxis be given when the benefit outweighs the risk.[14, 15] Limited studies have evaluated the use of VTE prophylaxis in CLD patients, whether pharmacologic or mechanical.[6, 7, 8, 16] These studies report that the utilization of VTE prophylaxis in CLD patients is suboptimal, with at least 75% of CLD patients receiving no prophylaxis.[6, 7, 8] The purpose of our study was to examine the use of prophylactic agents and the incidence of VTE and bleeding events in CLD patients.
METHODS
A retrospective chart review of patients diagnosed with CLD or cirrhosis at Methodist University Hospital between August 1, 2009 and July 31, 2011 was conducted. These patients were identified through the corporate patient financial services database using the International Classification of Diseases, 9th Revision, Clinical Modification code 571.xx for CLD/cirrhosis. Patients were included if they were 18 years or older, admitted for or with a history of CLD, and had an INR of 1.4 on admission. An elevated INR was chosen as inclusion criteria as this is often when the controversy of prophylaxis versus no prophylaxis emerges. CLD was defined based on previous histories or clinical presentations of past variceal bleed, presence of varices based on endoscopy report, hepatic encephalopathy, spontaneous bacterial peritonitis, ascites, liver biopsy proven cirrhosis, or imaging consistent with cirrhotic liver changes. CLD was classified as alcoholic, viral hepatitis (hepatitis B and C), and other, such as nonalcoholic steatohepatitis and autoimmune. Patients admitted with maintenance anticoagulation, suspected bleed or VTE, palliative care diagnosis, or history of/anticipated liver transplant were excluded. If a patient met inclusion criteria for an admission and was subsequently readmitted within 30 days, only the initial admission was included. Once patients were included they were assigned to 1 of 4 groups based on the type of prophylaxis received: pharmacologic, mechanical, combined pharmacologic and mechanical, and no prophylaxis. Patients who received pharmacologic or mechanical prophylaxis for at least 50% of their hospital stay were assigned to their corresponding groups accordingly. Patients who received pharmacologic and mechanical prophylaxis for at least 50% of their hospital stay were assigned to the combination group. Patients receiving either form of VTE prophylaxis for <50% of their hospital stay were considered to be without prophylaxis. Pharmacologic prophylaxis was defined by the use of unfractionated heparin (UFH) 5000 units subcutaneously (sq) 3 times daily or twice daily (bid), low molecular weight heparin (LMWH) 30 mg sq bid or 40 mg every day (qd), or fondaparinux 2.5 mg qd. Mechanical prophylaxis was defined by the use of a sequential compression device (SCD). The study was approved by the University of Tennessee Institutional Review Board.
Patient demographics including age, sex, race, height, and weight were documented with a body mass index (BMI) calculated for each patient. Obesity was defined as BMI 30 kg/m2. Risk factors for VTE including obesity, surgery, infection, trauma, malignancy, and history of VTE as well as the etiology of cirrhosis were collected and recorded whenever available based on documentation in the medical chart. Clinical data including lowest serum albumin, highest total bilirubin, highest INR, and platelets on admission were recorded. Severity of ascites and hepatic encephalopathy were documented. Child‐Pugh score and stage as well as Model for End‐Stage Liver Disease (MELD) score were calculated. In‐hospital VTE, bleeding events, length of stay, in‐hospital mortality, and the use, type, and number of days of VTE prophylaxis were documented. VTE was defined as deep venous thrombosis (DVT) or pulmonary embolism diagnosed by venous Doppler ultrasonography, spiral computed tomography (CT) of the chest, or ventilation/perfusion scan. Bleeding was defined by documentation in the medical record plus the administration of packed red blood cells, fresh frozen plasma, recombinant factor VIIa, or vitamin K. For patients who experienced a bleed, risk factors for in‐hospital bleeding as defined by American College of Chest Physicians Evidence‐Based Clinical Practice Guidelines 2012 guidelines (CHEST) were documented.[13]
The primary outcome was to describe the use of VTE prophylaxis in CLD patients. Secondary outcomes were to determine the overall incidence of VTE in CLD patients, examine the incidence of VTE based on the utilization of prophylaxis, compare the occurrence of bleeding events in CLD patients based on type of prophylaxis, evaluate the use of mechanical versus pharmacologic prophylaxis based on INR, evaluate length of stay (LOS) and in‐hospital mortality for CLD patients with and without prophylaxis, and evaluate 30‐day readmission rate for VTE.
Patients were arbitrarily divided into 2 groups according to the highest INR (1.42.0 or >2.0). Baseline characteristics were compared between the 2 groups. Variables were expressed as mean or median with standard deviation or interquartile range. Categorical values were expressed as percentages and compared using the [2] test or Fisher exact test. Continuous data were compared using Mann‐Whitney U test for nonparametric data or Student t test for parametric data. Significance was defined as P<0.05. All statistical analyses were performed using SPSS Statistics (version 20.0; SPSS, Inc., Chicago, IL).
RESULTS
We identified 410 patients who met inclusion criteria during the study period. Baseline demographics were similar between the 2 groups with the exception of age, which was statistically higher in the INR 1.4 to 2.0 group. The most common etiology of CLD was hepatitis B or C, followed by alcohol, then other causes. Alcoholic CLD was associated with higher INR values (>2.0). Patients with INR >2.0 were found to exhibit lower serum albumin levels and platelets on admission as well as higher total bilirubin and INR values. There was also a significant difference in Child‐Pugh stages B and C, with the INR >2.0 group only having stage C. In addition, the higher INR group had a significantly higher average MELD score (Table 1).
| Characteristic | INR1.42.0, n=251 | INR>2.0, n=159 | P Value |
|---|---|---|---|
| |||
| Age, yearsSD | 55.710.4 | 53.310.1 | 0.017 |
| Male sex | 137 (54.6) | 99 (62.3) | 0.125 |
| BMISD | 29.17.3 | 30.37.7 | 0.103 |
| Race | |||
| African American | 99 (39.4) | 53 (33.3) | 0.212 |
| White | 139 (55.4) | 99 (62.3) | 0.169 |
| Other | 13 (5.2) | 7 (4.4) | 0.722 |
| Etiology of CLD | |||
| Hepatitis B or C | 127 (50.6) | 70 (44) | 0.194 |
| Alcohol | 59 (23.5) | 57 (35.9) | 0.007 |
| Other | 65 (25.9) | 32 (20.1) | 0.18 |
| VTE risk factors | |||
| Obesity, BMI 30 | 107 (42.6) | 71 (44.6) | 0.687 |
| Surgery | 21 (8.4) | 7 (4.1) | 0.121 |
| Infection | 81 (32.3) | 63 (39.6) | 0.129 |
| Trauma | 1 (0.4) | 1 (0.6) | 1.00 |
| Malignancy | 35 (13.9) | 24 (15.1) | 0.746 |
| History of VTE | 6 (2.4) | 4 (2.5) | 1.00 |
| Median number VTE risk factors (range) | 1 (03) | 1 (04) | 0.697 |
| Laboratory values | |||
| AlbuminSD | 2.20.58 | 2.00.53 | <0.001 |
| Tbili, median (IQR) | 2.8 (1.95.0) | 8.1 (5.013.3) | <0.001 |
| INR, median (IQR) | 1.7 (1.51.8) | 2.4 (2.22.9) | <0.001 |
| Admission platelets, median (IQR) | 92 (61141) | 79 (58121) | 0.008 |
| Child Pugh stage | |||
| Class A | 3 (1.2) | 0 (0) | 0.286 |
| Class B | 91 (36.3) | 0 (0) | <0.001 |
| Class C | 157 (62.5) | 159 (100) | <0.001 |
| MELD scoreSD | 18.55.1 | 28.36.3 | <0.001 |
Of the 410 patients included, 225 (55%) patients received thromboprophylaxis. The majority of patients received mechanical prophylaxis (n=154), followed by pharmacologic (n=49), and then a combination of mechanical plus pharmacologic (n=22). For patients receiving pharmacologic either alone or in combination with SCDs, 30 received UFH, 33 received LMWH, 1 patient received fondaparinux, and the remaining 7 received a combination of the agents to total 50% of their hospital stay. For patients with INR >2.0, a significant decrease in overall thromboprophylaxis use was seen compared to those with INR 1.4 to 2.0 (47% vs 60%; P=0.013). Patients with INR >2.0 also received significantly less pharmacologic prophylaxis compared to those with INR 1.4 to 2.0 (3.2% vs 17.5%; P<0.001). No differences in the use of mechanical or combination prophylaxis was seen between the groups (Figure 1).
As shown in Table 2, in‐hospital VTE occurred in 3 patients (0.7%). All 3 patients had a DVT. Of the patients with documented VTE, 1 was Child‐Pugh stage B and 2 were stage C. Fifteen bleeding events occurred (3.7%), 9 on mechanical prophylaxis, 1 on pharmacologic, 3 on combination, and 2 with no prophylaxis. The majority of patients experiencing a bleeding event had an INR >2.0 (P=0.001). Eleven patients out of the 15 were considered to be at high risk of bleeding as defined per CHEST 2012 guidelines,[13] whereas 100% had Child‐Pugh stage C with an average MELD score of 31.77.5. It should be noted that 1 patient experienced a bleeding event after receiving pharmacologic treatment doses for VTE and was subsequently placed on a prophylactic dose without any bleeding complications.
| Characteristic | INR1.42.0, n=251 | INR>2.0, n=159 | P Value |
|---|---|---|---|
| |||
| In‐hospital VTE | 1 (0.4) | 2 (1.3) | 0.563 |
| Mechanical | 0 (0) | 1 (0.6) | 0.389 |
| Pharmacologic | 0 (0) | 1 (0.6) | 0.389 |
| Combination | 0 (0) | 0 (0) | 1.00 |
| No prophylaxis | 1 (0.4) | 0 (0) | 1.00 |
| Bleeding event | 3 (1.2) | 12 (7.5) | 0.001 |
| Mechanical | 2 (0.8) | 7 (4.4) | 0.033 |
| Pharmacologic* | 0 (0) | 1 (0.6) | 0.389 |
| Combination | 1 (0.4) | 2 (1.3) | 0.563 |
| No prophylaxis | 0 (0) | 2 (1.3) | 0.152 |
| LOS, median (IQR) | 5 (2.98) | 7.2 (413.1) | <0.001 |
| Hospital mortality | 6 (2.4) | 30 (18.9) | <0.001 |
| 30‐day readmission rate for VTE | 2 (0.8) | 0 (0) | 0.524 |
Longer LOS and higher mortality rates were seen in patients who received prophylaxis compared to those who received no prophylaxis (P<0.001 and P=0.001, respectively). Of the 36 patients who died, 22 received mechanical prophylaxis, 2 received pharmacologic, 5 received a combination, and 7 received no prophylaxis. Longer LOS and higher mortality rates were also seen in patients with INR >2 compared to patients with INR 1.4 to 2.0 (P<0.001 for both) (Table 2). Higher mortality rates were associated with greater severity of disease as defined by Child‐Pugh C classification in all 36 patients (P=0.001) and an average MELD score of 31.87.6. No differences in 30‐day readmission rates for VTE were seen between prophylaxis groups.
DISCUSSION/CONCLUSION
The use of thromboprophylaxis in our study was 55%, which is consistent with the reported rate of 30% to 70% in general hospitalized patients.[17] To our knowledge this is the first study to focus primarily on the use of both pharmacologic and mechanical thromboprophylaxis in CLD patients. Previous studies have focused on the incidence and risks of VTE in CLD patients,[5, 6, 7, 8, 9, 10] with only 3 of those studies evaluating the use of pharmacologic and mechanical thromboprophylaxis as a secondary outcome.[6, 7, 8] The reported use of thromboprophylaxis in these studies ranges from 21% to 25%. Pharmacologic prophylaxis rates were 7% in Northup et al.,[8] 12% in Aldawood et al.,[7] and 9% in Dabbagh et al.,[6] compared to 17% in our study (pharmacologic alone plus combination). Mechanical prophylaxis rates were 14%, 12%, and 16%, respectively, compared to our 38%. None of the previous studies gave a definition for prophylaxis. This is important to note because discrepancies in prophylaxis reporting could lead to significant differences in rates of prophylaxis when comparing these studies to our study.
Despite the higher rates of thromboprophylaxis, the incidence of VTE was 0.7%. Our VTE incidence falls within the reported incidence rate of 0.5% to 6.3%.[6, 7, 8, 9, 10] Similar to Aldawood et al. and Dabbagh et al., we found no significant differences in the incidence of VTE and prophylaxis use.[6, 7] Dabbagh et al. suggest that the incidence of VTE increases as disease severity increases.[6] However, with only 25% of their patients receiving thromboprophylaxis, it is hard to determine if the higher incidence of VTE was due to greater disease severity or the low use of thromboprophylaxis. It is expected that patients with more severe disease are less likely to receive VTE prophylaxis secondary to increases in INR and/or thrombocytopenia. As evidenced in our study, there was a significant decrease in the use of thromboprophylaxis in patients with INR >2.0, driven largely by the significant decrease in the use of pharmacologic prophylaxis. Due to the low incidence of VTE observed, our study lacks adequate power to truly determine the relationship between use of thromboprophylaxis or severity of disease and incidence of VTE.
Nonetheless, we did find a significant correlation between disease severity and bleeding in CLD patients. Although not a new finding in the literature, this result substantiates the claim that the delicate balance and unpredictability of coagulopathy in CLD leads to bleeding events as well as VTE. In our study we had an overall bleeding rate of 3.7%. Patients who experienced a bleeding event had greater disease severity, significantly higher INR, and 73% were considered to be at high risk for an event as defined by CHEST guidelines.[13] The majority of events happened while on mechanical or no prophylaxis. Four patients who received pharmacologic prophylaxis had a bleeding event; however, 1 of those patients bled on VTE pharmacologic treatment dose for VTE found on day 2 of hospital admission. In a recent study by Bechmann et al. looking at the use of LMWH in 84 cirrhotic patients, they report a bleeding rate of 8.3%, a rate that is similar to rates of bleeding in nonanticoagulated cirrhotic patients.[18] In comparison with our study, we had 71 patients receive pharmacologic prophylaxis either alone or in combination and 4 bleeding events, giving an event rate of 5.6%. This rate decreases to 4.2% when considering only prophylactic pharmacologic doses, suggesting that pharmacologic prophylaxis in CLD patients poses a low risk of bleeding. Interestingly enough, an association was found between alcoholic CLD and higher INR (>2.0) in our study. Given that patients with higher INR had increased bleeding events, this introduces a question of whether or not the specific cause of CLD (ie, alcoholic hepatitis) may represent a special risk for bleeding in this population. However, additional studies are needed to confirm this hypothesis.
To our knowledge, this study is also the first to look at the relationship of thromboprophylaxis use on LOS and mortality in CLD patients. At first glance, the fact that patients who received prophylaxis had both significantly longer LOS and higher mortality rates in our study is concerning. However, it is likely that the increased LOS and mortality in our study is attributed to greater disease severity, as evidenced by higher INRs and Child‐Pugh scores regardless of prophylaxis use or not. Also, a known risk factor for VTE is reduced mobility. Although no standard definition for reduced mobility exists, Barbar et al. define it as anticipated bed rest with bathroom privileges (either because of patient's limitations or on physician's order) for at least 3 days.[19] Due to this known increased risk for VTE, it is expected that patient's with a LOS of 3 days are more likely to receive thromboprophylaxis.
Our study has several limitations. Like other retrospective studies, this study was conducted in 1 medical center and relies on the accuracy of documentation. We relied on patient history and clinical presentation to diagnose CLD without the requirement of histologic diagnosis. However, all patients included in the study had an unquestionable diagnosis by a physician. We used an arbitrary definition and assignment of patients into groups based on the method of VTE prophylaxis utilized due to lack of a definition in the medical literature. There was a possible selection bias for pharmacologic prophylaxis based on patient risk factors for bleeding, such as presence of varices and thrombocytopenia. Also, the inability to ensure that patients with an order for SCDs were actively wearing the device throughout their hospital stay is yet another limitation. Not all patients underwent testing for VTE; therefore, the actual incidence of VTE may be higher than what we found. Only those patients who experienced a bleeding event were assessed for risk factors that predisposed them to bleed, making it hard to correlate those risk factors with the risk of bleeding in all CLD patients.
Despite these limitations, our study has great strengths. This is the first study to focus primarily on the use of both pharmacologic and mechanical thromboprophylaxis in CLD patients. Therefore, it has the potential to influence and raise awareness on the decisions made involving the management of CLD patients in regard to VTE prophylaxis and will hopefully serve as an impetus for future prospective studies. When comparing this study to other studies looking at the incidence of VTE in CLD patients and the use of prophylaxis, our study sample size is relatively large. Also, by including only those patients with INR of at least 1.4 on admission, our study patients had greater severity of disease, making this study distinctly relevant in the clinical debate of whether or not CLD patients should receive thromboprophylaxis.
In conclusion, the use of thromboprophylaxis in CLD patients is higher in our study than previous reports but remains suboptimal. Although bleeding is an inherent risk factor in CLD independent of VTE prophylaxis, the use of VTE pharmacologic prophylaxis does not appear to increase bleeding in CLD patients with INR 2.0. Further studies focusing on baseline bleeding risks (ie, thrombocytopenia, presence of varices) and the use of pharmacologic prophylaxis are needed to provide additional safety data on the use of pharmacologic prophylaxis in this patient population.
Disclosures: All coauthors have seen and agree with the contents of the article. Submission is not under review by any other publication. All authors have not received notification of redundant or duplicate publication. All authors have no financial conflicts of interest. No funding was received for this study or article.
- , , . National hospital discharge survey: 2002 annual summary with detailed diagnosis and procedure data. Vital Health Stat 13. 2005;158:1–199.
- , , , . Deaths: final data for 2007. Natl Vital Stat Rep. 2010;58(19):1–135.
- , , , et al. The diagnostic approach to acute venous thromboembolism: clinical practice guideline. Am J Respir Crit Care Med. 1999;160(3):1043–1066.
- , , , , , . Risk factors for deep vein thrombosis and pulmonary embolism: a population‐based case‐control study. Arch Intern Med. 2000;160(6):809–815.
- , , , , , . Risk of venous thromboembolism in patients with liver disease: a nationwide population‐based case‐control study. Am J Gastroenterol. 2009;104(1):96–101.
- , , , , . Coagulopathy does not protect against venous thromboembolism in hospitalized patients with chronic liver disease. Chest. 2010;137(5):1145–1149.
- , , , et al. The incidence of venous thromboembolism and practice of deep venous thrombosis prophylaxis in hospitalized cirrhotic patients. Thromb J. 2011;9(1):1.
- , , , et al. Coagulopathy does not fully protect hospitalized cirrhosis patients from peripheral venous thromboembolism. Am J Gastroenterol. 2006;101(7):1524–1528.
- , , , , . Deep vein thrombosis and pulmonary embolism in cirrhosis patients. Dig Dis Sci. 2008;53(11):3012–3017.
- , , , , , . Venous thromboembolism and liver cirrhosis. Rev Esp Enferm Dig. 2008;100(5):259–262.
- , , . Should we give thromboprophylaxis to patients with liver cirrhosis and coagulopathy? HPB. 2009;11(6):459–464.
- , . The coagulopathy of chronic liver disease. N Engl J Med. 2011;365(2):147–156.
- , , , et al. Prevention of VTE in nonsurgical patients: antithrombotic therapy and prevention of thrombosis, 9th ed: American College of Chest Physicians Evidence‐Based Clinical Practice Guidelines. Chest. 2012;141(suppl 2):e195S–e226S.
- , . Pharmacologic prophylaxis against venous thromboembolism in hospitalized patients with cirrhosis and associated coagulopathies. Am J Health Syst Pharm. 2012;69(8):658–63.
- , , . Risk of venous thromboembolism in patients with chronic liver disease and the utility of venous thromboembolism prophylaxis. Ann Pharmacother. 2012;46(6):873–878.
- , , , et al. A systematic review of venous thromboembolism prophylaxis strategies in patients with renal insufficiency, obesity, or on antiplatelet agents. J Hosp Med. 2013;8(7):394–401.
- , , , , , . Prevention of venous thromboembolism in the hospitalized medical patient. Cleve Clin J Med. 2008;75(suppl 3):S7–S16.
- , , , , , . Low‐molecular‐weight heparin in patients with advanced cirrhosis. Liver Int. 2011;31(1):75–82.
- , , , et al. A risk assessment model for the identification of hospitalized medical patients at risk for venous thromboembolism: the Padua Prediction Score. J Thromb Haemost. 2010;8(11):2450–2457.
© 2013 Society of Hospital Medicine
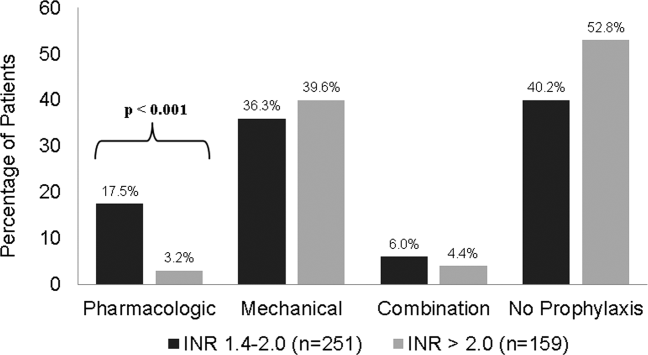
Stress Testing Effect on ED Visits
More than 9 million people visit the emergency department (ED) annually for evaluation of acute chest pain.[1, 2] Most of these patients are placed on observation status while being assessed for an acute coronary syndrome (ACS). Traditionally, serial cardiac enzymes and absence of changes suggestive of ischemia on electrocardiogram rule out ACS. Patients are then stratified based on their presentation and risk factors. However, healthcare providers are not comfortable discharging even low‐risk patients without further testing.[3] Routine treadmill stress testing is usually performed, often complimented by an imaging modality. A negative stress test before discharge reassures both the physician and the patient that the chest pain is not caused by an obstructive coronary lesion.
Patients with chest pain who have been discharged from the ED after ruling out an ACS are frequently readmitted for chest pain within 1 year.[4] It is unclear whether stress testing can prevent these readmissions by preventing return to the ED or by influencing the decision of ED physicians to admit patients for observation.[5, 6, 7] Even if stress testing can reduce ED visits or readmissions, it is not known whether the savings from preventing these visits can offset the initial cost of stress testing. The purpose of this study was to examine the impact of stress testing on readmission for chest pain, and to determine whether stress testing can reduce overall costs.
METHODS
Study Population
The hospital's billing database was used to obtain the data. Inclusion criteria included age 18 years or older with index hospitalization between January 2007and July 2009 with International Classification of Diseases, 9th Revision admitting diagnoses of chest pain (786.5), chest pain NOSnot otherwise specified (786.50), chest pain NECnot elsewhere classified (786.59) or angina pectoris (413.9). All eligible patients were admitted under observation status. Although observation patients are technically outpatients, they are cared for by inpatient physicians on inpatient units and are otherwise indistinguishable from inpatients. Patients with a discharge diagnosis of acute myocardial infarction at index admission were excluded. Also, patients who had a chest pain admission or an outpatient stress test within the previous 12 months of index admission were excluded.
Data Collection and Outcomes
All data were extracted electronically from the hospital's billing database. For each patient we noted age, sex, race, insurance status, and cardiovascular comorbidities (current smoker, congestive heart failure, valvular disease, pulmonary/circulatory disorders, peripheral vascular disease, obesity, diabetes mellitus, and hypertension). For each admission we ascertained whether or not any type of stress test was performed. We obtained ED and hospitalization costs for chest pain visits within 12 months of index admission from the hospital's cost accounting system. We also obtained corresponding physician charges as well as collection rate from the health system's clinical decision support system.
The primary outcome was the rate of ED visits and readmissions for chest pain within 1 year of the index visit. Secondary outcomes included total annual hospitalization and ED costs. Total annual costs were calculated by summing index costs and follow‐up costs for subsequent ED visits and readmissions.
Statistical Analysis
Fisher exact (categorical) and unpaired t tests/Wilcoxon rank sum (continuous) tests were used to compare the baseline characteristics of patients who received a stress test at index admission to those who did not. To address possible confounding by indication (allocation bias), the association between stress testing and various outcomes was quantified using multivariable logistic (ED visits and readmissions) or linear regression (costs).[8, 9] In addition, we developed a propensity model using conditional logistic regression and matched patients on propensity score using 1:1 greedy matching algorithm with a caliper tolerance of 0.05.[10, 11] For cost analyses, the annual collection rate was applied to all physician charges, and these were added to hospital or ED costs to obtain the total cost of each visit. The average cost of ED visits or readmissions for each group was calculated by dividing the total ED or readmission cost by the number of ED visits and readmissions, respectively. Physician charges were unavailable for approximately one‐third (1487/5163 or 29%) of all hospitalizations; missing charges were estimated using mean imputation, and sensitivity analyses were conducted to ensure consistency of inferences between full (imputed) and restricted models.[12, 13, 14] Stata/MP 12.1 for Windows (StataCorp, College Station, TX) was used for all analyses.
RESULTS
A total of 3315 patients admitted with chest pain during the study period met the inclusion criteria. Of these, 2376 (71.7%) had a stress test on index admission. Table 1 describes the baseline characteristics of the study population. Receipt of a stress test during index admission was positively associated with white race, private insurance, and number of cardiac comorbidities. The propensity model included these covariates as well as study year, age (80+ vs younger), sex, and smoking status. The C statistic, which quantifies the model's ability to discriminate subjects who received a stress test from those who did not, was 0.63 (95% confidence interval [CI]: 0.61 to 0.65). Of patients who returned to the ED, we were able to find propensity matches for 69% to create a matched sample of 1776 patients. Of patients who were readmitted, we were able to find matches for 83% to create a matched sample of 186 patients.
| Total, N=3315 | Stress Test Original Admission, N=2376 | No Stress Test, N=939 | P Valuea | |
|---|---|---|---|---|
| ||||
| Age, y, mean/SD | 57.5/13.9 | 57.2/12.8 | 58.2/16.2 | 0.10 |
| Male, n (%) | 1505 (45.4) | 1080 (45.5) | 425 (45.3) | 0.94 |
| Race, n (%) | <0.001 | |||
| White | 2082 (62.8) | 1552 (65.3) | 530 (56.4) | |
| Black | 345 (10.4) | 239 (10.1) | 106 (11.3) | |
| Hispanic | 585 (17.7) | 381 (16.0) | 204 (21.7) | |
| Other | 303 (9.1) | 204 (8.6) | 99 (10.5) | |
| Private insurance, n (%) | 1469 (44.3) | 1176 (49.5) | 293 (31.2) | <0.001 |
| No. of cardiovascular comorbidities, mean/SDb | 0.68/0.78 | 0.70/0.78 | 0.64/0.77 | 0.04 |
| Smoker, n (%) | 335 (10.1) | 249 (10.5) | 86 (9.2) | 0.28 |
| Return for chest pain, n (%) | 256 (7.7) | 148 (6.2) | 108 (11.5) | <0.001 |
| All cause return, n (%) | 1279 (38.6) | 819 (34.5) | 460 (49.0) | <0.001 |
| Median time to next chest pain visit, d (25th, 75th percentile) | 69 (6, 180) | 67 (5, 190) | 71 (9, 172) | 0.86 |
| Median time to all cause return, d (25th, 75th percentile) | 92 (27, 198) | 108 (33, 207) | 67 (20, 175) | <0.001 |
| Admitted upon first return for chest pain, n (%) | 112 (43.8) | 62 (41.9) | 50 (46.3) | 0.53 |
Subsequent ED Visits for Chest Pain
Within 1 year, 1279 (38.6%) of all patients returned to the ED, and 256 (7.7%) returned at least once for chest pain. Patients who had a stress test at index admission were less likely to return to ED for chest pain, compared to those who did not get a stress test at admission (6.2% vs 11.5%; P<0.001). The median time to the first subsequent ED visit for any complaint was greater among patients who had a stress test at index admission (108 days vs 67 days, P<0.001), but no effect was noted on time to return for chest complaint (67 days vs 71 days, P=0.86).
In a multivariable model, return to the ED for chest pain was positively associated with self‐reported nonwhite race, insurance with Medicare or Medicaid, and earlier year of index admission (Table 2). Return ED visit was negatively associated with stress testing at index admission (adjusted odds ratio [OR]: 0.5, 95% CI: 0.4 to 0.7; propensity‐matched analysis OR: 0.6, 95% CI: 0.5 to 0.9).
| Variable | Odds Ratio | 95% CI |
|---|---|---|
| ||
| Stress test | 0.5 | 0.4 0.7 |
| Age >80 years | 1.0 | 0.6 1.6 |
| Gender | ||
| Female | 1.0 | |
| Male | 1.0 | 0.8 1.3 |
| Race/ethnicity | ||
| White | 1.0 | |
| Hispanic | 1.6 | 1.2 2.3 |
| Black | 1.6 | 1.1 2.4 |
| Other | 2.3 | 1.6 3.5 |
| 1 Cardiac comorbiditya | 1.1 | 0.8 1.4 |
| Medicare/Medicaid | 1.5 | 1.1 2.0 |
| Year of index admission | ||
| 2007 | 1.0 | |
| 2008 | 0.8 | 0.6 1.1 |
| 2009 | 0.5 | 0.4 0.7 |
| Smoking | 1.4 | 0.9 2.1 |
Subsequent Readmissions for Chest Pain
Of the 256 patients who returned to the ED for chest pain, 112 (43.8%) were readmitted during the first return visit. There was no statistically significant difference in the proportion admitted from the ED by prior stress test status. In a multivariable model, readmission after returning to the ED for chest pain was positively associated with cardiac comorbidities and earlier year of index admission (Table 3). The decision to readmit was not significantly associated with prior stress testing (adjusted OR: 0.8, 95% CI: 0.5 to 1.4; propensity‐matched analysis OR: 0.8, 95% CI: 0.4 to 1.4).
| Variable | Odds Ratio | 95% CI |
|---|---|---|
| ||
| Stress test | 0.8 | 0.5 1.4 |
| Age >80 years | 1.0 | 0.4 2.6 |
| Gender | ||
| Female | 1.0 | |
| Male | 1.0 | 0.6 1.7 |
| Race/ethnicity | ||
| White | 1.0 | |
| Hispanic | 1.3 | 0.6 2.5 |
| Black | 0.6 | 0.2 1.4 |
| Other | 4.5 | 1.9 10.6 |
| 1 Cardiac comorbiditya | 1.8 | 1.0 3.4 |
| Medicare/Medicaid | 1.3 | 0.7 2.4 |
| Year of index admission | ||
| 2007 | 1.0 | |
| 2008 | 0.6 | 0.4 1.2 |
| 2009 | 0.2 | 0.1 0.5 |
| Smoker | 0.3 | 0.1 0.8 |
Cost Analysis
The average multivariable‐adjusted cost (hospital+physician costs) for a patient at index chest pain admission was $3462 if a stress test was performed compared to $2374 without a stress test (+$1088, 95% CI: $972 to $1203). In the propensity‐matched sample the difference was +$1211(95% CI: $1084 to $1338). There were 155 occasions on which a patient returned to the ED for chest pain but was not readmitted. The average per‐visit cost did not differ based on prior stress test status in the overall sample ($763 if stress testing done previously vs $722 if not [+$41, 95% CI: $43 to+$125]) or in the propensity‐matched sample ($787 if stress testing was done vs $744 if not [$43, 95% CI: $54 to +$140]). Because ED visits were less frequent among patients who had a stress test at index admission, the average annual cost of ED visits was significantly lower for this group ($32 vs $52; $20, 95% CI: $36 to $4) or ($42 vs $54; $12 (95% CI: $32 to +$8) in the propensity‐matched sample. For the 117 occasions on which a patient returned with chest pain and was readmitted, the average cost per readmission also did not differ based on whether a stress test was performed at index admission or not ($2912 vs $2806, P=0.85). Again, because readmissions were less common after stress testing, the average cost of readmissions was lower for patients with stress tests than for those without ($88 vs $180; $92, 95% CI: $176 to $8) or $137 vs $194 ( $57, 95% CI: $161 to $47) in the propensity‐matched sample. The total cost of all visits (index, ED, and readmissions) was higher for patients who had a stress test at index admission than for those who did not ($3582 vs $2606; +$975, 95% CI: $829 to $1122) or ($3833 vs $2690; +$1142, 95% CI: $970, $1315) in the propensity‐matched sample.
DISCUSSION
In this retrospective cohort study of patients admitted with low‐risk chest pain, we found that a majority (>70%) underwent stress testing prior to discharge. Within 1 year approximately 8% returned to the ED with chest pain. Stress testing at index admission was associated with 40% reduction in the odds of subsequent ED visits for chest pain; however, once in the ED, having a previous stress test did not significantly affect the decision to admit. Despite the reduction in readmission rates, the overall hospital costsincluding cost of index admission, subsequent ED visits, and readmissionswere higher for patients who had a stress test at index admission.
Two other studies have evaluated the impact of stress testing on return ED visits.[5, 6] In a cohort of 1195 low‐risk chest pain patients at a tertiary center in New York, patients who underwent stress testing were less likely to return to the ED for chest pain within 3 months compared to those who did not get a stress test (10% vs 15%, P<0.001).[5] In contrast, another prospective study of 692 low‐risk chest pain patients found no difference in return ED visits between patients who were evaluated versus those who were not evaluated for underlying coronary artery disease at index admission by stress testing or cardiac catheterization (39% vs 40%; P=0.85).[6] In this study, the lack of difference may have been due to the population sampled, which had high rates of return in both groups. In our study, we also found that having a previous stress test does not significantly impact the decision to admit the patient. This was consistent with the results of another prospective cohort study of low‐risk chest pain patients presenting to the ED.[7]
Previous studies offer conflicting interpretations of the cost implications of stress testing in this population. Based on studies conducted in the 1990s that showed that mandatory stress testing in the ED was cost‐effective compared to hospital admission,[15, 16] the most recent scientific statement by the American Heart Association recommends stress testing for all low‐risk chest pain patients.[17] However, more recent studies have questioned the value of diagnostic testing beyond serial electrocardiograms and cardiac enzymes in low‐risk patients.[18, 19, 20, 21, 22] In a study done at our institution among patients admitted with low‐risk chest pain, the rate of positive stress tests was noted to be extremely low, and patients had a benign course; at 30 days the rates of major cardiovascular events was as low as 0.3%.[19] Other studies also showed no difference in outcomes among patients who received inpatient, outpatient, or no stress testing.[21, 22]
These studies have generally been limited to the initial hospitalization period. Our study extends these findings in terms of resource utilization to the year following hospitalization. This is important because physicians might order stress tests to reassure patients or themselves that the pain is noncardiac, with the hope that this will decrease subsequent ED visits or readmissions. In our study, stress tests did reduce both ED visits and readmissions, but the index cost of hospitalization was so much higher with stress testing that the reduced readmissions did not offset the initial costs. Because stress tests have not been shown to change cardiovascular outcomes but did increase costs, it may be time to reevaluate the need for any kind of inpatient stress testing in these patients.
Our study has several limitations. The retrospective nature of the study subjects it to confounding. We adjusted for demographics, insurance, and comorbidities, but other unmeasured elements of the patients' presentation might have affected stress test ordering and subsequent return to the ED. In addition, we relied on administrative data, and comorbidities may not have been documented completely. During the follow‐up period, we did not take into account patients who presented to the EDs of other hospitals or those who might have died. Because there is only one other hospital in our city, and it does not perform angioplasties, it is unlikely that we missed many infarctions this way, but we may not have included all ED visits. Similarly, we included only costs accrued within our healthcare system. If patients presented to outside facilities for testing or treatment, we were unable to capture it. It is possible that patients who did not undergo initial stress testing may have been more likely to have subsequent testing at outside facilities, which would have reduced the difference in cost that we observed. However, given the magnitude of this difference, it is unlikely that including outside costs would have completely eliminated the difference. The data in our study were collected over a 3‐year period. Secular trends in the healthcare system over that time could potentially have affected our results. To reduce this bias, we included the year of the study in the propensity model. Also, the study was performed at a single hospital, and the results might not be generalizable to other institutions. Ours is a large independent academic medical center serving both a tertiary and a community role. Therefore, the population it serves would appear to be representative of the general population having chest pain without ACS.
Finally, we did not collect data on the results of stress tests. It is probable that the decision to admit a patient is modified by the results of a previous test, and this was not explored in our analysis. Presumably, patients with positive tests would be more likely, and those with negative tests less likely, to be admitted than patients who had no previous test. Previous studies have shown that among low‐risk chest pain patients, the rate of abnormal stress tests is <15%, and among these only a minority (0.6%0.7%) can benefit from revascularization.[19, 20] Therefore, testing should result in a lower rate of readmissions overall, which is what we observed in this study. Once patients reached the ED, however, the decision to admit was not associated with having a previous stress test. This could be due to a high rate of positive tests among patients who came to the ED, or a lack of discrimination by ED physicians. Although our study design could not distinguish between these 2 possibilities, studies have shown that fear of litigation and aversion to risk play an important role in this decision,[23, 24] and it is possible that these considerations override the results of previous stress tests, which cannot categorically rule out current ischemia.
In an era of rising healthcare costs and limited resources, the care of low‐risk chest pain is an attractive target for cost‐reduction strategies. Low‐risk chest pain accounts for 1.8 % of all admissions, at an average annual cost of $3.4 billion in the United States,[25] so figuring out how to prevent such admissions has important economic implications. Although stress testing did keep patients from returning to the ED, it did not affect the ED physicians' decisions to admit. We found that stress testing does decrease subsequent resource utilization, but not enough to offset the initial cost of testing. Thus, stress testing does not appear to be a cost‐effective means to reduce readmissions.
Disclosures: Jaya Mallidi and Michael Rothberg had full access to all of the data in the study and take full responsibility for the integrity of the data and accuracy of the analysis. The authors report no conflicts of interest.
© 2013 Society of Hospital Medicine
AMA Documentation Analysis
Approximately 1% to 2% of inpatient stays result in discharges against medical advice (AMA).[1] Though relatively infrequent, AMA discharges warrant attention as they are associated with higher morbidity, increased risk of readmission, and greater 30‐day mortality.[2] A recent study found a 30‐day readmission rate among AMA patients of 24.5%, nearly twice that of matched non‐AMA patients, and a 30‐day mortality rate of 1.3%, also nearly double that of planned discharges.[3] Discharges AMA may be expected to decrease index length of stay, yet accounting for 30‐day readmissions they are estimated to increase costs 56% higher than expected from an initial hospitalization.[4] Patients note several possible reasons for leaving AMA including family emergencies, dissatisfaction with care, financial concerns, or simply feeling better, among others.[5, 6, 7] Risk factors for AMA discharges include previous AMA discharge, having no primary care physician, younger age, lack of insurance, male sex, substance abuse, and lower socioeconomic status.[4, 6, 7, 8]
A number of prior studies have assessed risk factors for AMA discharges, the long‐ and short‐term outcomes, patient reasons for leaving, and physician perceptions of why patients leave AMA.[3, 5, 7, 9] However, there is limited information about opportunities for discharge transition interventions in this potentially more vulnerable population. Because of the increased short‐term and long‐term risks to these patients, treatment and follow‐up plans at the time of discharge may carry even greater importance than follow‐up plans with standard discharges. This study analyzed AMA documentation and what interventions were carried out at the time of discharge.
METHODS
We reviewed the records of all adult patients, ages 18 years and older, admitted to a university‐affiliated tertiary care hospital in Dayton, Ohio (a 520‐bed hospital with approximately 17,000 adult patient encounters per year) over a 2‐year period, and who subsequently left AMA. A hospital database identified 351 adult AMA cases (1.0% of adult admissions). A single reviewer performed an in‐depth review of the 291 patient admissions to the general medical service between January 1, 2009 and December 31, 2010, and manually reviewed and abstracted the data of interest. The Wright State University institutional review board approved the study.
Documentation review focused on the presence of a specified AMA note, the presence of documentation addressing informed consent, patient decision‐making capacity, patient health literacy, follow‐up plans, whether or not medications were prescribed, and whether or not any warning indicators of impending AMA were apparent. These items represented key elements of the discharge policy and procedure in place at our institution during the period of study. We speculated that nurses may be more immediately available at the time of AMA discharge and thus might carry out AMA documentation more often than physicians. To assess this we recorded the role (nurse vs provider) of the writer of AMA notes. We also assessed patient gender, length of stay, prior AMA, 30‐day emergency department (ED) re‐encounters, and 30‐day hospital readmission after AMA discharge.
Informed consent was deemed present if patients signed the hospital's standardized AMA form. Decision‐making capacity was assessed as present if there was specific mention of the patient's capacity on the day of discharge. Any mention of health literacy or the patient's stated understanding of his medical condition at any time during the hospitalization was considered positive documentation of healthcare literacy. Follow‐up plans included any mention of where and when the patient would return. Discharge medications included prescribed medication or indication that no medications were warranted. Warning indicators included specific mention of the patient's desire to leave AMA. For example, patients who left the unit without informing staff were considered to have given no warning of AMA. Alternatively, when documentation was present stating that the patient had verbally expressed a desire to leave AMA, this was considered advanced warning of AMA.
Statistical Analysis
Continuous variables were reported as means and standard deviations. Categorical variables were reported as counts and percents. The independent samples t test was used for comparisons involving 2 groups and a second variable measured on a continuous scale. The 2 test was used to compare 2 categorical variables. Inferences were made at the 0.05 level of significance with no correction for multiple comparisons.
RESULTS
Mean age and gender distribution were similar to those reported in other AMA studies (Table 1).[3] Thirty‐day ED revisit and 30‐day hospital readmission frequencies for medical service patients were 121 (41.6%) and 88 (30.2%), respectively, also similar to those reported in other AMA studies.[3]
| Study Population, Mean SD or Count (%) | Hospital Population, Mean or Count (%) | |
|---|---|---|
| ||
| Age, y | 45.3 15.9 | 62.8 18.2 |
| Sex | ||
| Male | 168 (57.7) | 14,965 (43.6) |
| Female | 123 (42.3) | 19,333 (56.4) |
| Length of stay, d | 2.46 2.82 | 4.72 4.74 |
| 30‐day ED re‐encounter rate | 121 (41.6) | |
| 30‐day hospital readmission rate | 88 (30.2) | 4424 (12.9) |
| Prior AMA discharge | 49 (16.8) | |
Although our intent was to conduct a quantitative assessment of discharge interventions, we found stated reasons for leaving similar to those previously reported. In our study, AMA patients tended to be younger, more likely male, and at increased risk for AMA discharge if they had prior AMA discharges (Table 1). The most common reasons found in the medical record for leaving AMA were caring for sick family members, financial concerns, feeling better, and occasionally dissatisfaction with care, reasons similar to those reported in previous studies.[5, 7, 9, 10]
AMA notes were present in 276 (94.8%) charts. AMA notes were written by physicians in 163 (59.1%) and nurses in 110 (37.8%) encounters. The informed consent form was present in 88 (30.2%) charts, mentioned in the note but not present in the electronic medical record in 111 (38.1%), and not signed in 92 (31.6%) charts. Decision‐making capacity and health literacy were documented in 108 (37.1%) and 75 (25.8%) records, respectively. Warning of impending AMA was present in 217 (74.6%) charts. Medications prescribed and follow‐up plans were only documented in 71 (24.4%) and 91 (31.3%) charts, respectively (Table 2).
| Count (%) | |
|---|---|
| |
| AMA note present | 276 (94.8) |
| Primary AMA note author | |
| Physician | 163 (56) |
| Nurse, without physician note | 110 (37.8) |
| Other (ie, social worker) | 3 (1.0) |
| Warning of impending AMA | 217 (74.6) |
| Informed consent signed | |
| Yes | 88 (30.2) |
| No | 92 (31.6) |
| Absenta | 111 (38.1) |
| Documentation of decision‐making capacity | 108 (37.1) |
| Documentation of health literacy | 75 (25.8) |
| Documentation of follow‐up plan | 91 (31.3) |
| Documentation of medications at discharge | 71 (24.4) |
Patients with documentation of medications given did not have decreased 30‐day ED revisits (33.8% vs 44.3%, P = 0.12) or 30‐day hospital readmission (23.9% vs 32.4%, P = 0.18). Similarly, there was no relationship between documentation of follow‐up plans and 30‐day ED revisits (37.4% vs 43.7%, P = 0.31) or 30‐day hospital readmission (29.7% vs 30.7%, P = 0.87). Finally, there was no relationship between physician versus nurse authorship of AMA notes and 30‐day ED revisits (37.4% vs 46.4%, P = 0.14) or 30‐day hospital readmission (28.2% vs 31.8%, P = 0.52) (Table 3).
| Yes, % | No, % | P Value | |
|---|---|---|---|
| |||
| Documentation of discharge medicationsa | |||
| 30‐day ED revisit | 33.8 | 44.3 | 0.12 |
| 30‐day rehospitalization | 23.9 | 32.4 | 0.18 |
| Documentation of follow‐up | |||
| 30‐day ED revisit | 37.4 | 43.7 | 0.31 |
| 30‐day rehospitalization | 29.7 | 30.7 | 0.87 |
| Physician author of AMA note | |||
| 30‐day ED revisit | 37.4 | 46.4 | 0.14 |
| 30‐day rehospitalization | 28.2 | 31.8 | 0.52 |
| Documentation of medications | 36.2 | 10.0 | 0.001 |
| Documentation of follow‐up plan | 43.6 | 16.4 | 0.001 |
| Warning of AMA | |||
| Documentation of medications | 30.4 | 6.8 | 0.001 |
| Documentation of follow‐up plan | 37.3 | 13.5 | 0.001 |
Physician documentation of the AMA was associated with an increased frequency of discharge medication being prescribed (36.2% vs 10.0%, P 0.001) and with an increased finding of documented follow‐up plans (43.6% vs 16.4%, P 0.001). A documented warning of impending AMA was associated with an increased frequency of discharge medication being prescribed (30.4% vs 6.8%, P 0.001) and increased frequency of follow‐up plans being documented (37.3% vs 13.5%, P 0.001) (Table 3).
DISCUSSION
To gain insights into opportunities for discharge transition interventions in this potentially more vulnerable population,[1, 5] we analyzed AMA documentation and what interventions were carried out at the time of discharge. Our intent was a quantitative assessment of discharge interventions, but we also found stated reasons for leaving AMA that were similar to those previously reported.[5, 6, 10]
We identified several opportunities for improved documentation as well as targeted discharge intervention among AMA patients. Documentation in the charts of AMA patients was often suboptimal. In our study, a physician's AMA note was present only half of the time. Mention of the patient's mental status or health literacy was present in only one‐fourth of cases. Protection from litigation in AMA cases is enhanced when these elements and others, like informed consent, are present in the medical record.[11]
Physician documentation of the AMA was associated with an increased frequency of discharge medication being prescribed and with an increased finding of documented follow‐up plans. This association might be confounded by the fact that physicians can prescribe whereas most nurses cannot. The findings that a documented warning of impending AMA was associated with an increased frequency of discharge medication being prescribed (30.4% vs 6.8%, P 0.001) and increased frequency of follow‐up plans being documented (37.3% vs 13.5%, P 0.001) suggest opportunities for improvement through early inquiry about potential for AMA as well as early responses when patients threaten to leave AMA.
An important focus of our study was on documentation of discharge medications and follow‐up plans. These elements were documented in 31% and 25% of charts, respectively. A warning of impending AMA was present in 74.6% of encounters, yet medications and follow‐up plans were documented at a much lower rate. This represents an area where caregivers have the possibility to intervene, but are not documenting that they are doing so. We found no relationship between the documentation of giving prescriptions and giving explicit follow‐up plans with decreased rates of return to the ED or readmission, but that possibility may still warrant future prospective study.
Our study did not attempt to explain why only a minority of AMA discharges include medication prescription or follow‐up plans, but a number of potential explanations are possible. Some AMA discharges may occur unannounced with a patient simply walking off the ward giving little or no advance notice. It is also possible that provider perceptions and attitudes toward AMA patients may influence potential interventions.[12] An AMA discharge is against the caregiver's preferred advice for the patient, and it may seem illogical to offer patients second‐best advice. Perhaps some providers have the misconception that medications cannot or must not be prescribed for an AMA discharge. However, second‐best therapy may be better than no therapy, and some follow‐up better than no follow‐up plan.
Given the high rates of ED return and 30‐day readmission, the associated increased healthcare costs as well as increased morbidity and mortality associated with AMA dispositions, a continued search for effective intervention strategies and opportunities is warranted. Recently, programs for transition of care/discharge have demonstrated improved outcomes including reduced rates of readmission with standard discharges.[13] At the time of our study, effective programs such as Project BOOST (Better Outcomes for Older adult through Safe Transitions),[14] the Care Transitions Program,[15] and RED (Project Re‐engineered Discharge)[16] were not yet routinely employed, but their common elements may be applicable to the AMA population. In general, these programs focus on elements we investigated (patient understanding, follow‐up plans, medications prescribed) but add a number of additional components. Additional elements include written discharge instructions, patient education, teach‐back process, decision support, emergency plans, caregiver education, telephone follow‐up, and transition coaches to coordinate home and office follow‐up visits. Most potential interventions add significant time (and cost) to the discharge process. Thus, future studies applying these components to AMA discharges should emphasize timely identification of threatened AMA and prioritized interventions. Future studies should focus on which interventions are the most cost‐effective with AMA patients.
Limitations of our study include not being able to access information from area hospitals not in our hospital network, and thus we may not have identified all ED returns and readmissions. Additionally, interventions at the time of discharge (like prescription of medications or provider assessment of decision‐making capacity) may not have been documented and thus not available for our review. Also, our study was a retrospective review at a single institution and included a relatively small population of patients; consequently, our findings may not apply to other healthcare providers in other hospitals or settings. Our study was strengthened by reviewing all consecutive AMA cases over a 2‐year period encompassing a diverse group of healthcare providers.
CONCLUSION
In the majority of cases reviewed, some advance warning of impending AMA is apparent, affording an opportunity for interventions that may improve health outcomes. Despite this advance warning, only a minority of cases result in key interventions such as prescription of medications or development of follow‐up plans. Medical documentation of AMA dispositions is often inadequate, suggesting missed opportunities for potential intervention as well as suboptimal medicolegal scenarios. Future prospective studies examining cost‐effective interventions at the time of AMA discharge and transition of care may provide valuable insight into lowering rates of ED return and rehospitalization.
Disclosures: The views and opinions expressed in this article are those of the author(s) and do not reflect official policy or position of the United States Air Force, Department of Defense, or US government. The authors report no conflicts of interest.
Postdischarge Clinics
Transitions of care, which encompass the patient experience of hospital discharge to the community, are frequently associated with clinically and financially costly adverse events.[1, 2] One important element for reducing the risk of postdischarge adverse events is provision of timely follow‐up by a clinician familiar with the patient and hospital course.[3, 4]
However, achieving this ideal is becoming more difficult because of an increased demand for primary care services (due to expanding coverage of Medicare and Medicaid) and the decreased supply of primary care physicians.[5, 6] When a timely visit with a clinician is available postdischarge, the widening discontinuity between inpatient and outpatient care providers often means this clinician is lacking essential details of the hospitalization.[7, 8]
One increasingly common innovation to improve postdischarge care access and continuity is to extend the role of inpatient providers (usually hospitalists) to provide care after discharge in a postdischarge clinic (PDC).[9, 10, 11] These clinics require an expansion of a hospitalist's duties to the outpatient setting, a requirement that has met with hospitalist resistance in initial reports.[12] However, little is known about hospitalists' experience with PDCs or attitudes toward postdischarge care. We aimed to explore these attitudes and experiences surrounding postdischarge care and PDCs.
METHODS
We conducted a cross‐sectional 17‐question Web‐based survey of hospitalists at 20 academic and 17 VA medical centers across the United States. Hospital medicine faculty at each site were identified by their group leader; members of each group then received an email survey up to 3 times. To collect responses from nonacademic hospitalists, the survey was also distributed to a large national private hospitalist employer. Due to internal limitations at the employer site, sampling was not feasible, and thus a convenience sample was obtained. Hospitalists who were not clinically active or did not have computer access to complete the survey were excluded. Responses were initially gathered on a 4‐point Likert scale; for comparisons between groups the scale was collapsed to a binary comparison using Fisher exact or 2 tests. We included questions answered in partially completed surveys in both the numerator and denominator; questions not answered were excluded from both numerator and denominator. The denominator of all responses was noted. All analyses were conducted using SAS 9.3 (SAS Institute, Inc., Cary, NC). The study was approved by the Colorado Multiple Institutional Review Board.
RESULTS
Of 814 hospitalists, 228 responded to the survey (28.3%). Table 1 illustrates characteristics of responding hospitalists, who were divided between university hospitals, community teaching hospitals, and community nonteaching hospitals in diverse practices in terms of location and group size.
| Characteristic | Respondents, No. (%) |
|---|---|
| |
| Employing institution | |
| University hospital | 79 (37.4) |
| Community, nonteaching | 62 (29.4) |
| Community, teaching | 70 (33.2) |
| Care environment | |
| Hospitalist providers | 98 (46.4) |
| Housestaff providers | 94 (44.6) |
| Primary care providers | 10 (4.7) |
| Combination | 9 (4.3) |
| Hospitalist group size (number of hospitalists) | |
| 15 | 39 (18.5) |
| 610 | 50 (23.7) |
| 1120 | 52 (24.6) |
| 2150 | 59 (28.0) |
| >50 | 9 (4.3) |
| Hospital locationpopulation | |
| Rural | 20 (9.5) |
| Suburban | 47 (22.3) |
| Urban | 144 (68.2) |
| Hospital locationgeographic | |
| West Coast | 11 (5.2) |
| Midwest | 47 (22.3) |
| Southern | 57 (27.1) |
| East Coast | 21 (10) |
| Southwest | 36 (17.1) |
| Mountain | 32 (15.2) |
Sixty‐one percent of responding hospitalists believed most patient problems after discharge were due to poor follow‐up with primary care providers, and 55% found it difficult to arrange timely primary care follow up (Table 2). Despite this, 87% thought patient problems after discharge should be cared for by primary care physicians, and 62% opposed the idea of hospitalists seeing patients in the clinic after discharge.
| Agree, No. (%) | Disagree, No. (%) | |
|---|---|---|
| ||
| Hospitalists should see patients in clinic after discharge | 87 (38.2) | 141 (61.8) |
| Primary care responsible for problems after discharge | 198 (86.8) | 30 (13.2) |
| Hospitalists responsible for patients after discharge | 113 (49.6) | 115 (50.4) |
| Would welcome a PDC if employer required | 113 (49.6) | 115 (50.4) |
| Would require extra compensation to work in a PDC | 175 (76.8) | 53 (23.2) |
| Believe a PDC would reduce ED visits after discharge | 168 (73.7) | 60 (26.3) |
| Would discharge patients earlier if could see after discharge | 116 (50.9) | 112 (49.1) |
| Most postdischarge problems due to poor PCP access | 138 (60.5) | 90 (39.5) |
| Easy to arrange timely follow‐up with patient's PCP | 100 (44.2) | 126 (55.3) |
When asked if hospitalists were responsible for patients after discharge from the hospital, only 50% responded positively. However, when asked how long hospitalists were responsible for patients after discharge, 71% gave a response longer than hospital discharge, including 60% who believed this responsibility ended at 1 week or less following discharge. A minority (12%) felt it extended to 1 month following discharge (Table 3).
| Respondents, No. (%) | |
|---|---|
| |
| Length of time inpatient providers responsible after discharge | |
| Responsibility ends at time of discharge | 65 (28.5) |
| 13 days | 40 (17.5) |
| 47 days | 57 (25.0) |
| 2 weeks | 41 (18.0) |
| 4 weeks | 20 (8.8) |
| 3 months | 3 (1.3) |
| 3 months | 2 (0.9) |
| Postdischarge clinic present | 20 (8.8) |
| Considered starting a postdischarge clinica | 62 (30.5) |
| Starting in next yearb | 6 (3.3) |
| Are satisfied with experience in postdischarge clinicc | 17 (85) |
| Think patients are satisfied/highly satisfiedc | 14 (70) |
Responding hospitalists expressed confidence in a PDC to reduce postdischarge emergency department visits (74%). However, most felt they would require extra compensation to staff a PDC (77%). They were divided on whether they would discharge patients from the hospital earlier if they could see those patients in postdischarge follow‐up (51% would discharge patients earlier).
Compared to those who had not experienced a PDC, responding hospitalists who had provided care in a PDC trended toward responding more positively that hospitalists should provide postdischarge care (P = 0.054). Few responding hospitalists had such exposure (8.8%) at the time of the survey. Although 31% had considering starting a PDC, only 3% were starting in the next year. Of responding hospitalists with exposure to a PDC, 70% were satisfied with the experience and 85% felt their patients were satisfied. Responses did not vary by type of practice (academic vs nonacademic), group size, geographic location, or by exposure to a PDC except as above.
DISCUSSION
Responding hospitalists reported encountering significant difficulty arranging appropriate postdischarge appointments with primary care providers and feel this contributes to postdischarge complications. Nearly 75% of those surveyed felt a hospitalist‐run PDC would be effective in reducing postdischarge emergency department visits, presumably in part due to improved access to postdischarge care. However, 62% of responding hospitalists opposed providing this type of care, though those who had experienced a PDC were somewhat more likely to view providing care in a PDC favorably. Survey responses largely reflect attitudes rather than experience with PDCs, because very few respondents had ever worked in a PDC.
The juxtaposition of the confidence expressed in PDCs to reduce postdischarge emergency department visits with the less enthusiastic views of respondents about providing care in a PDC was surprising. Several explanations are possible. First, providing such care is outside the usual scope of practice of most hospitalists, and preliminary reports indicate hospitalists, as self‐selected inpatient providers, may not initially welcome this opportunity.[12] Second, responding hospitalists identified the need for extra compensation for providing this care, suggesting they would see staffing a PDC as a burden requiring extra payment. Third, only 12% of respondents felt their responsibility to their discharged patients extended to 1 month following discharge. Given this, hospitalists may not feel enough personal ownership over 30‐day readmission rates to justify the additional clinical demand of staffing a PDC.[13]
In fact, 29% of responding hospitalists felt their responsibility to the patient ended at the time of discharge. Respondents may have interpreted responsibility differently, and we cannot rule out response bias given our lower‐than‐expected response rate. However, we had anticipated many fewer hospitalists would respond this way given professional hospitalist societies have endorsed guidelines for improved transitions of care, which clearly delineate the key role hospitalists play in care transitions.[14]
Although fewer than 10% of respondents had worked in a PDC, nearly one‐third reported considering starting such a practice in the future, underscoring the importance of understanding hospitalist attitudes and experiences when creating a PDC and the significant barriers to arranging appropriate postdischarge care identified by survey respondents. The barriers to establishing a PDC may explain why few planned to start a PDC in the next year.
This study should be interpreted in the context of its design. Due to limitations in survey delivery, more rigorous sampling designs could not be used, and efforts were instead made to deliver the survey to a diverse group of hospitalists. The survey response rate was lower than anticipated and this increases the risk of response bias. Though this response rate is characteristic of other surveys of hospitalists, responses may have been from a selected population and therefore not representative of all hospitalists.[15] We sampled from a variety of practice venues, locations, academic and community practices, and practice group sizes to try to minimize this bias. Due to the low exposure rate to PDCs, hospitalist responses to experiences with PDCs should be considered exploratory.
We asked about similar content areas in the survey in multiple questions to maximize content validity; this resulted in variations in the degree of agreement or disagreement to similar prompts. For example, 62% of hospitalists opposed seeing patients in the clinic after discharge when directly asked, but nearly 50% said they would welcome the opportunity to work in a PDC if their employer required it. In another example, 50% of respondents said their responsibility for the patient ended at time of discharge, but when asked about duration of responsibility, 30% identified time of discharge as the limit. When reporting and interpreting results, we have tried to highlight responses to questions that ask most clearly and directly about the content of interest (rather than general themes), but this interpretation may also be subject to bias.
The time after hospital discharge is one of heightened risk for adverse events for the recently discharged patient. Hospitalist‐run postdischarge clinics may offer improved postdischarge care access and continuity; more research is needed on the effects of such clinics on patient outcomes, including postdischarge utilization. Until then, physicians and hospitals considering establishing PDCs should consider the barriers responding hospitalists identified to working in such a clinic, as well as the confidence they expressed in PDCs to reduce subsequent utilization.
Disclosures: Dr. Burke had full access to all of the data in the study and takes responsibility for the integrity of the data and the accuracy of the data analysis. The views expressed in this article are those of the authors and do not necessarily represent the views of the Department of Veterans Affairs. Dr. Burke was supported by grant funding from the Colorado Research Enhancement Award Program to Improve Care Coordination for Veterans. Dr. Ryan has no conflicts of interest to disclose.
- , , , , . The incidence and severity of adverse events affecting patients after discharge from the hospital. Ann Intern Med. 2003;138(3):161–167.
- , , . Rehospitalizations among patients in the Medicare fee‐for‐service program. N Engl J Med. 2009;360(14):1418–1428.
- , , , et al. Relationship between early physician follow‐up and 30‐day readmission among Medicare beneficiaries hospitalized for heart failure. JAMA. 2010;303(17):1716–1722.
- , , . Post‐hospitalization transitions: Examining the effects of timing of primary care provider follow‐up. J Hosp Med. 2010;5(7):392–397.
- , , . Will generalist physician supply meet demands of an increasing and aging population? Health Aff (Millwood). 2008;27(3):w232–w241.
- Association of American Medical Colleges. June 2010.The impact of health care reform on the future supply and demand for physicians updated projections through 2025. Available at: http://www.aamc.org/download/158076/data/updated_projections_through_2025.pdf. Accessed May 1, 2012.
- , , , , , . Continuity of outpatient and inpatient care by primary care physicians for hospitalized older adults. JAMA. 2009;301(16):1671–1680.
- , , , , . Trends in inpatient continuity of care for a cohort of Medicare patients 1996–2006. J Hosp Med. 2011;6(8):438–444.
- . Is a post‐discharge clinic in your hospital's future? The Hospitalist. December 2011 Available at: http://www.the‐hospitalist.org/details/article/1409011/Is_a_Post_Discharge_Clinic_in_Your_Hospitals_future.html. Accessed May 1, 2013.
- , , , . Continuity of care and patient outcomes after hospital discharge. J Gen Intern Med. 2004;19(6):624–631.
- , , , . Effects of a postdischarge clinic on housestaff satisfaction and utilization of hospital services. J Gen Intern Med. 1996;11(3):179–181.
- . Interval examination: establishment of a hospitalist‐staffed discharge clinic. J Gen Intern Med. 2012;27(10):1377–1382.
- Patient Protection and Affordable Care Act (PPACA).Public Law 111–148 2010. Available at: http://www.gpo.gov/fdsys/pkg/PLAW‐111publ148/pdf/PLAW‐111publ148.pdf. Accessed January 10, 2013.
- , , , et al. Transitions of Care Consensus policy statement: American College of Physicians, Society of General Internal Medicine, Society of Hospital Medicine, American Geriatrics Society, American College of Emergency Physicians, and Society for Academic Emergency Medicine. J Hosp Med. 2009;4(6):364–370.
- , , , , . Person‐job fit: an exploratory cross‐sectional analysis of hospitalists. J Hosp Med. 2013;8(2):96–101.
Transitions of care, which encompass the patient experience of hospital discharge to the community, are frequently associated with clinically and financially costly adverse events.[1, 2] One important element for reducing the risk of postdischarge adverse events is provision of timely follow‐up by a clinician familiar with the patient and hospital course.[3, 4]
However, achieving this ideal is becoming more difficult because of an increased demand for primary care services (due to expanding coverage of Medicare and Medicaid) and the decreased supply of primary care physicians.[5, 6] When a timely visit with a clinician is available postdischarge, the widening discontinuity between inpatient and outpatient care providers often means this clinician is lacking essential details of the hospitalization.[7, 8]
One increasingly common innovation to improve postdischarge care access and continuity is to extend the role of inpatient providers (usually hospitalists) to provide care after discharge in a postdischarge clinic (PDC).[9, 10, 11] These clinics require an expansion of a hospitalist's duties to the outpatient setting, a requirement that has met with hospitalist resistance in initial reports.[12] However, little is known about hospitalists' experience with PDCs or attitudes toward postdischarge care. We aimed to explore these attitudes and experiences surrounding postdischarge care and PDCs.
METHODS
We conducted a cross‐sectional 17‐question Web‐based survey of hospitalists at 20 academic and 17 VA medical centers across the United States. Hospital medicine faculty at each site were identified by their group leader; members of each group then received an email survey up to 3 times. To collect responses from nonacademic hospitalists, the survey was also distributed to a large national private hospitalist employer. Due to internal limitations at the employer site, sampling was not feasible, and thus a convenience sample was obtained. Hospitalists who were not clinically active or did not have computer access to complete the survey were excluded. Responses were initially gathered on a 4‐point Likert scale; for comparisons between groups the scale was collapsed to a binary comparison using Fisher exact or 2 tests. We included questions answered in partially completed surveys in both the numerator and denominator; questions not answered were excluded from both numerator and denominator. The denominator of all responses was noted. All analyses were conducted using SAS 9.3 (SAS Institute, Inc., Cary, NC). The study was approved by the Colorado Multiple Institutional Review Board.
RESULTS
Of 814 hospitalists, 228 responded to the survey (28.3%). Table 1 illustrates characteristics of responding hospitalists, who were divided between university hospitals, community teaching hospitals, and community nonteaching hospitals in diverse practices in terms of location and group size.
| Characteristic | Respondents, No. (%) |
|---|---|
| |
| Employing institution | |
| University hospital | 79 (37.4) |
| Community, nonteaching | 62 (29.4) |
| Community, teaching | 70 (33.2) |
| Care environment | |
| Hospitalist providers | 98 (46.4) |
| Housestaff providers | 94 (44.6) |
| Primary care providers | 10 (4.7) |
| Combination | 9 (4.3) |
| Hospitalist group size (number of hospitalists) | |
| 15 | 39 (18.5) |
| 610 | 50 (23.7) |
| 1120 | 52 (24.6) |
| 2150 | 59 (28.0) |
| >50 | 9 (4.3) |
| Hospital locationpopulation | |
| Rural | 20 (9.5) |
| Suburban | 47 (22.3) |
| Urban | 144 (68.2) |
| Hospital locationgeographic | |
| West Coast | 11 (5.2) |
| Midwest | 47 (22.3) |
| Southern | 57 (27.1) |
| East Coast | 21 (10) |
| Southwest | 36 (17.1) |
| Mountain | 32 (15.2) |
Sixty‐one percent of responding hospitalists believed most patient problems after discharge were due to poor follow‐up with primary care providers, and 55% found it difficult to arrange timely primary care follow up (Table 2). Despite this, 87% thought patient problems after discharge should be cared for by primary care physicians, and 62% opposed the idea of hospitalists seeing patients in the clinic after discharge.
| Agree, No. (%) | Disagree, No. (%) | |
|---|---|---|
| ||
| Hospitalists should see patients in clinic after discharge | 87 (38.2) | 141 (61.8) |
| Primary care responsible for problems after discharge | 198 (86.8) | 30 (13.2) |
| Hospitalists responsible for patients after discharge | 113 (49.6) | 115 (50.4) |
| Would welcome a PDC if employer required | 113 (49.6) | 115 (50.4) |
| Would require extra compensation to work in a PDC | 175 (76.8) | 53 (23.2) |
| Believe a PDC would reduce ED visits after discharge | 168 (73.7) | 60 (26.3) |
| Would discharge patients earlier if could see after discharge | 116 (50.9) | 112 (49.1) |
| Most postdischarge problems due to poor PCP access | 138 (60.5) | 90 (39.5) |
| Easy to arrange timely follow‐up with patient's PCP | 100 (44.2) | 126 (55.3) |
When asked if hospitalists were responsible for patients after discharge from the hospital, only 50% responded positively. However, when asked how long hospitalists were responsible for patients after discharge, 71% gave a response longer than hospital discharge, including 60% who believed this responsibility ended at 1 week or less following discharge. A minority (12%) felt it extended to 1 month following discharge (Table 3).
| Respondents, No. (%) | |
|---|---|
| |
| Length of time inpatient providers responsible after discharge | |
| Responsibility ends at time of discharge | 65 (28.5) |
| 13 days | 40 (17.5) |
| 47 days | 57 (25.0) |
| 2 weeks | 41 (18.0) |
| 4 weeks | 20 (8.8) |
| 3 months | 3 (1.3) |
| 3 months | 2 (0.9) |
| Postdischarge clinic present | 20 (8.8) |
| Considered starting a postdischarge clinica | 62 (30.5) |
| Starting in next yearb | 6 (3.3) |
| Are satisfied with experience in postdischarge clinicc | 17 (85) |
| Think patients are satisfied/highly satisfiedc | 14 (70) |
Responding hospitalists expressed confidence in a PDC to reduce postdischarge emergency department visits (74%). However, most felt they would require extra compensation to staff a PDC (77%). They were divided on whether they would discharge patients from the hospital earlier if they could see those patients in postdischarge follow‐up (51% would discharge patients earlier).
Compared to those who had not experienced a PDC, responding hospitalists who had provided care in a PDC trended toward responding more positively that hospitalists should provide postdischarge care (P = 0.054). Few responding hospitalists had such exposure (8.8%) at the time of the survey. Although 31% had considering starting a PDC, only 3% were starting in the next year. Of responding hospitalists with exposure to a PDC, 70% were satisfied with the experience and 85% felt their patients were satisfied. Responses did not vary by type of practice (academic vs nonacademic), group size, geographic location, or by exposure to a PDC except as above.
DISCUSSION
Responding hospitalists reported encountering significant difficulty arranging appropriate postdischarge appointments with primary care providers and feel this contributes to postdischarge complications. Nearly 75% of those surveyed felt a hospitalist‐run PDC would be effective in reducing postdischarge emergency department visits, presumably in part due to improved access to postdischarge care. However, 62% of responding hospitalists opposed providing this type of care, though those who had experienced a PDC were somewhat more likely to view providing care in a PDC favorably. Survey responses largely reflect attitudes rather than experience with PDCs, because very few respondents had ever worked in a PDC.
The juxtaposition of the confidence expressed in PDCs to reduce postdischarge emergency department visits with the less enthusiastic views of respondents about providing care in a PDC was surprising. Several explanations are possible. First, providing such care is outside the usual scope of practice of most hospitalists, and preliminary reports indicate hospitalists, as self‐selected inpatient providers, may not initially welcome this opportunity.[12] Second, responding hospitalists identified the need for extra compensation for providing this care, suggesting they would see staffing a PDC as a burden requiring extra payment. Third, only 12% of respondents felt their responsibility to their discharged patients extended to 1 month following discharge. Given this, hospitalists may not feel enough personal ownership over 30‐day readmission rates to justify the additional clinical demand of staffing a PDC.[13]
In fact, 29% of responding hospitalists felt their responsibility to the patient ended at the time of discharge. Respondents may have interpreted responsibility differently, and we cannot rule out response bias given our lower‐than‐expected response rate. However, we had anticipated many fewer hospitalists would respond this way given professional hospitalist societies have endorsed guidelines for improved transitions of care, which clearly delineate the key role hospitalists play in care transitions.[14]
Although fewer than 10% of respondents had worked in a PDC, nearly one‐third reported considering starting such a practice in the future, underscoring the importance of understanding hospitalist attitudes and experiences when creating a PDC and the significant barriers to arranging appropriate postdischarge care identified by survey respondents. The barriers to establishing a PDC may explain why few planned to start a PDC in the next year.
This study should be interpreted in the context of its design. Due to limitations in survey delivery, more rigorous sampling designs could not be used, and efforts were instead made to deliver the survey to a diverse group of hospitalists. The survey response rate was lower than anticipated and this increases the risk of response bias. Though this response rate is characteristic of other surveys of hospitalists, responses may have been from a selected population and therefore not representative of all hospitalists.[15] We sampled from a variety of practice venues, locations, academic and community practices, and practice group sizes to try to minimize this bias. Due to the low exposure rate to PDCs, hospitalist responses to experiences with PDCs should be considered exploratory.
We asked about similar content areas in the survey in multiple questions to maximize content validity; this resulted in variations in the degree of agreement or disagreement to similar prompts. For example, 62% of hospitalists opposed seeing patients in the clinic after discharge when directly asked, but nearly 50% said they would welcome the opportunity to work in a PDC if their employer required it. In another example, 50% of respondents said their responsibility for the patient ended at time of discharge, but when asked about duration of responsibility, 30% identified time of discharge as the limit. When reporting and interpreting results, we have tried to highlight responses to questions that ask most clearly and directly about the content of interest (rather than general themes), but this interpretation may also be subject to bias.
The time after hospital discharge is one of heightened risk for adverse events for the recently discharged patient. Hospitalist‐run postdischarge clinics may offer improved postdischarge care access and continuity; more research is needed on the effects of such clinics on patient outcomes, including postdischarge utilization. Until then, physicians and hospitals considering establishing PDCs should consider the barriers responding hospitalists identified to working in such a clinic, as well as the confidence they expressed in PDCs to reduce subsequent utilization.
Disclosures: Dr. Burke had full access to all of the data in the study and takes responsibility for the integrity of the data and the accuracy of the data analysis. The views expressed in this article are those of the authors and do not necessarily represent the views of the Department of Veterans Affairs. Dr. Burke was supported by grant funding from the Colorado Research Enhancement Award Program to Improve Care Coordination for Veterans. Dr. Ryan has no conflicts of interest to disclose.
- , , , , . The incidence and severity of adverse events affecting patients after discharge from the hospital. Ann Intern Med. 2003;138(3):161–167.
- , , . Rehospitalizations among patients in the Medicare fee‐for‐service program. N Engl J Med. 2009;360(14):1418–1428.
- , , , et al. Relationship between early physician follow‐up and 30‐day readmission among Medicare beneficiaries hospitalized for heart failure. JAMA. 2010;303(17):1716–1722.
- , , . Post‐hospitalization transitions: Examining the effects of timing of primary care provider follow‐up. J Hosp Med. 2010;5(7):392–397.
- , , . Will generalist physician supply meet demands of an increasing and aging population? Health Aff (Millwood). 2008;27(3):w232–w241.
- Association of American Medical Colleges. June 2010.The impact of health care reform on the future supply and demand for physicians updated projections through 2025. Available at: http://www.aamc.org/download/158076/data/updated_projections_through_2025.pdf. Accessed May 1, 2012.
- , , , , , . Continuity of outpatient and inpatient care by primary care physicians for hospitalized older adults. JAMA. 2009;301(16):1671–1680.
- , , , , . Trends in inpatient continuity of care for a cohort of Medicare patients 1996–2006. J Hosp Med. 2011;6(8):438–444.
- . Is a post‐discharge clinic in your hospital's future? The Hospitalist. December 2011 Available at: http://www.the‐hospitalist.org/details/article/1409011/Is_a_Post_Discharge_Clinic_in_Your_Hospitals_future.html. Accessed May 1, 2013.
- , , , . Continuity of care and patient outcomes after hospital discharge. J Gen Intern Med. 2004;19(6):624–631.
- , , , . Effects of a postdischarge clinic on housestaff satisfaction and utilization of hospital services. J Gen Intern Med. 1996;11(3):179–181.
- . Interval examination: establishment of a hospitalist‐staffed discharge clinic. J Gen Intern Med. 2012;27(10):1377–1382.
- Patient Protection and Affordable Care Act (PPACA).Public Law 111–148 2010. Available at: http://www.gpo.gov/fdsys/pkg/PLAW‐111publ148/pdf/PLAW‐111publ148.pdf. Accessed January 10, 2013.
- , , , et al. Transitions of Care Consensus policy statement: American College of Physicians, Society of General Internal Medicine, Society of Hospital Medicine, American Geriatrics Society, American College of Emergency Physicians, and Society for Academic Emergency Medicine. J Hosp Med. 2009;4(6):364–370.
- , , , , . Person‐job fit: an exploratory cross‐sectional analysis of hospitalists. J Hosp Med. 2013;8(2):96–101.
Earlier Thrombolysis, Better Outcome for Stroke Patients
Clinical question
For patients presenting with acute ischemic stroke, is earlier onset of thrombolytic therapy associated with better outcomes?
Bottom line
Earlier thrombolytic therapy in patients with acute ischemic stroke is associated with improved outcomes, including reduced inpatient mortality, fewer intracranial bleeds, higher rates of independent ambulation at discharge, and increased number of discharges to home. These findings support continued efforts to accelerate the process of acute stroke care delivery and to promote earlier patient presentation after stroke symptom onset. (LOE = 2b)
Reference
Study design
Cohort (retrospective)
Funding source
Industry
Allocation
Uncertain
Setting
Inpatient (any location)
Synopsis
Previous data from 8 clinical trials of almost 2000 patients suggests that earlier thrombolytic therapy for ischemic stroke is most beneficial. The authors of the current study aimed to confirm the generalizability of these findings in patients treated for stroke in routine clinical practice. Using data from the American Heart Association's Get with the Guidelines stroke registry, these investigators examined the association between onset to treatment (OTT) time with intravenous tissue-type plasminogen activator (tPA) and outcomes for patients presenting with acute ischemic stroke. Almost 60,000 patients who received tPA within the guideline-recommended maximum of 4.5 hours of symptom onset were included in the analysis. Of this group, the median age was 72 years, 50% were women, and the median OTT time was 144 minutes. OTT times were further subdivided into 0 to 90-minute, 91- to 180-minute, and 181- to 270-minute intervals. Overall, 77% of the patients had an OTT time within 91 to 180 minutes while14% were treated between 181 and 270 minutes and 9% were treated within 90 minutes. Patients with earlier OTT times had higher stroke severity, were more likely to arrive by emergency medical service transport, and were more likely to present during regular weekday hours. Hospitals with higher volumes of tPA cases also had earlier OTT times. Out of the total study population, 33% were walking independently at discharge and almost 40% were discharged to home; 9% died in the hospital prior to discharge and 5% experienced intracranial bleeds. After adjusting for patient factors including stroke severity and hospital factors including volume of tPA-treated patients, the authors noted that earlier OTT times were associated with better outcomes. Among 1000 patients, every 15-minute-faster interval of treatment resulted in 8 more patients walking independently at discharge, 7 more patients being discharged to home, and 4 fewer patients dying in the hospital. Additionally, for every 15-minute decrease in OTT, bleeding events such as symptomatic intracranial bleeds and serious systemic bleeds were less likely to occur.
Dr. Kulkarni is an assistant professor of hospital medicine at Northwestern University in Chicago.