User login
Ethnic Differences in Hospice Enrollment
Studies have documented the persisting lower rates of hospice enrollment among ethnic minority groups.[1, 2] Given the positive outcomes related to hospice enrollment,[3] investigating interventions that may reduce these disparities is critical.
Inpatient palliative care (IPC) programs were developed to improve pain and symptom management, provide patients with holistic and comprehensive prognosis and treatment options, and help patient and families clarify goals of care.[4] Although significant evidence of IPC program effectiveness in improving patient outcomes exists,[5] studies have not examined the ability of IPC programs to diminish ethnic disparities in access to hospice. We conducted a retrospective cohort study to determine if ethnic differences in hospice enrollment are experienced among patients following receipt of IPC consultation.
METHODS
A retrospective study was conducted in a nonprofit health maintenance organization medical center. The sample included seriously ill patients aged 65 years and over who received an IPC consultation and survived to hospital discharge. Data were collected from IPC databases, IPC consultation checklist (which included recording of code status discussion), and electronic medical records. The IPC team recorded discharge disposition including discharge to hospice care, home‐based palliative care (a standard program similar to hospice but offered for patients with an estimated prognosis of 1 year or less and without the caveat of foregoing curative care),[6] home with home healthcare, nursing facility, and home with standard outpatient care. Ethnicity was collected via patient report.
2 and t tests were conducted to compare those admitted to hospice with those who were not. We used logistic regression to determine the effects of ethnicity on enrollment in hospice, adjusting for demographics and clinical factors. We conducted analysis using IBM SPSS 19 (IBM, Armonk, NY).
FINDINGS
From 2007 to 2009, 408 patients received IPC consults and were subsequently discharged from the hospital. Forty‐four had missing data on ethnicity or discharge disposition, leaving 364 in the analytic sample. The mean age was 80.1 years (standard deviation [SD]=8.2), and 48.9% were female. The sample was diverse; 42.6% were white, 25.5% Latino, 23.1% black, and 8.8% of other ethnic background. Primary diagnosis included cancer (33.8%), congestive heart failure (CHF) (17.4%), coronary artery disease (12.6%), dementia (12.4%), chronic obstructive pulmonary disease (6%), cerebral vascular accident (CVA) (5.2%), and other conditions (13.6%). More than half (57.7%) were discharged to hospice, 15.4% to home‐based palliative care,[6] 14.6% to a nursing facility, 8.2% to home with usual outpatient care, and 4.1% to home with home healthcare. Code status was discussed by the IPC team among 81% of the patients, with no difference between ethnic groups.
Those discharged to hospice were older (80.8, SD=8.4 vs 79.1, SD=7.8), more likely to have cancer (71.5%) or CVA (79.5%) and less likely to have end stage renal disease (28.6%) or CHF (39%), and more likely to have had a code discussion (85.8%). There were no differences between hospice users and nonusers in gender, marital status, ethnicity, and number of chronic conditions (Table 1).
| Variable | All, N=364 | Hospice Users, n=210 | Nonhospice Users, n=154 | P Value |
|---|---|---|---|---|
| ||||
| Age, y, mean (SD) | 80.1 (8.2) | 80.8 (8.4) | 79.1 (7.8) | 0.049 |
| Gender (female), % | 48.9 | 56.2 | 43.8 | 0.568 |
| Ethnicity, % | 0.702 | |||
| White | 42.6 | 43.3 | 41.6 | |
| Latino | 25.5 | 27.1 | 23.4 | |
| African American | 23.1 | 21.4 | 25.3 | |
| Other | 8.8 | 8.1 | 9.7 | |
| Marital status, % | 0.809 | |||
| Married | 45.6 | 43.8 | 48.1 | |
| Widowed | 36.0 | 38.1 | 33.1 | |
| Divorced | 7.7 | 7.6 | 7.8 | |
| Other | 7.7 | 7.6 | 7.8 | |
| Missing | 3.0 | 2.9 | 3.2 | |
| Diagnosis, % | 0.001 | |||
| Cancer | 33.8 | 42.1 | 22.9 | |
| CHF | 16.2 | 11.0 | 23.5 | |
| CAD | 12.6 | 12.4 | 13.1 | |
| Dementia | 12.4 | 12.4 | 12.4 | |
| COPD | 6.0 | 5.3 | 7.2 | |
| CVA | 5.2 | 7.2 | 2.6 | |
| Other | 13.6 | 9.6 | 18.3 | |
| Number of chronic conditions, mean (SD) | 1.0 | 1.7 (0.8) | 1.7 (0.9) | 0.949 |
| Code status discussed, % | 81.1 | 87.0 | 72.8 | 0.001 |
Significant differences between hospice users and nonusers were controlled in a regression adjusting for age, gender, marital status, and number of chronic conditions. Compared to whites, no significant differences in hospice use were found for blacks (odds ratio [OR]: 0.67; 95% confidence interval [CI]: 0.37‐1.21), Latinos (OR: 1.24; 95% CI: 0.68‐2.25), or other ethnic groups (OR: 0.78; 95% CI: 0.34‐1.56). Compared with other diagnoses, those with cancer (OR: 3.66; 95% CI: 1.77‐7.59) and older patients (OR: 1.05; 95% CI: 1.01‐1.08) were significantly more likely to receive hospice care following IPC consult. Those discussing code status were twice as likely to be discharged to hospice (OR: 2.14; 95% CI: 1.20‐3.79).
DISCUSSION
This study found similar rates of hospice enrollment following IPC consult among Latinos, blacks, and other ethnic groups as compared with whites. Others found comparable rates of advance directive completion between whites and African Americans following IPC consultation,[7]and that IPC intensity resulting in a plan of care was highly associated with receipt of hospice care.[8] Likewise, our study found that discussion of code status, another marker of intensity, was positively associated with hospice use.
Our findings among patients receiving IPC consultation contrast with previous studies examining ethnic variation in hospice use among general samples of decedents. A study of California dual eligibles found that blacks were 26% and Asians 34% less likely than whites to use hospice. Others have found similar results among patients with CHF and lung cancer.[9, 10]
Misconceptions and lack of awareness, knowledge, and trust in healthcare providers serve as barriers to hospice care for minorities.[11, 12] IPC consultations may overcome these barriers by discussing goals of care including discussing the condition, eliciting patient/family understanding of the condition, and presenting options for code status.
This study employed a single‐cohort design without a comparison group. It was conducted within a health maintenance organization with strong hospice and palliative care programs and may not represent other settings. Nevertheless, this study provides promise for IPC consultation to increase equitable access to hospice care among minority groups. Further studies are needed to confirm the preliminary findings reported here.
Disclosures: Supported in part by a career development award from the National Palliative Care Research Center and by a grant from the Archstone Foundation. Evie Vesper and Dr. Rebecca Goldstein were employees of the healthcare organization at the time of the study. Susan Enguidanos received compensation for project evaluation during the original study. The sponsors had no role in the design, implementation, or analysis of the study. The authors report no conflicts of interest.
- , , . Ethnic variation in site of death among Medicaid/Medicare dually eligible older adults. J Am Geriatr Soc. 2005;53(8):1411–1416.
- . Racial/ethnic disparities in hospice care: a systematic review. J Palliat Med. 2008;11(5):763–768.
- . The Medicare hospice benefit: 15 years of success. J Palliat Med. 1998;1(2):139–146.
- . Palliative care in hospitals. J Hosp Med. 2006;1(1):21–28.
- , , , et al. Impact of an inpatient palliative care team: a randomized control trial. J Palliat Med. 2008;11(2):180–190.
- , , , et al. Increased satisfaction with care and lower costs: results of a randomized trial of in‐home palliative care. J Am Geriatr Soc. 2007;55(7):993–1000.
- , , , et al. Ethnicity, race, and advance directives in an inpatient palliative care consultation service. Palliat Support Care. 2012;6(1):1–7.
- , , . Hospice referrals and code status: outcomes of inpatient palliative care consultations among Asian Americans and Pacific Islanders with cancer. J Pain Symptom Manage. 2011;42(4):557–564.
- , , , , . Racial differences in hospice use and patterns of care after enrollment in hospice among Medicare beneficiaries with heart failure. Am Heart J. 2012;163(6):987–993.
- , , , et al. Racial disparities in length of stay in hospice care by tumor stage in a large elderly cohort with non‐small cell lung cancer. Palliat Med. 2012;26(1):61–71.
- , , , , . Knowledge, attitudes and beliefs about end‐of‐life care among inner‐city African Americans and Latino/Hispanic Americans. J Palliat Med. 2004;7(2):247–256.
- , , . Does caregiver knowledge matter for hospice enrollment and beyond? Pilot study of minority hospice patients. Am J Hospice Palliat Med. 2009;26(3):165–171.
Studies have documented the persisting lower rates of hospice enrollment among ethnic minority groups.[1, 2] Given the positive outcomes related to hospice enrollment,[3] investigating interventions that may reduce these disparities is critical.
Inpatient palliative care (IPC) programs were developed to improve pain and symptom management, provide patients with holistic and comprehensive prognosis and treatment options, and help patient and families clarify goals of care.[4] Although significant evidence of IPC program effectiveness in improving patient outcomes exists,[5] studies have not examined the ability of IPC programs to diminish ethnic disparities in access to hospice. We conducted a retrospective cohort study to determine if ethnic differences in hospice enrollment are experienced among patients following receipt of IPC consultation.
METHODS
A retrospective study was conducted in a nonprofit health maintenance organization medical center. The sample included seriously ill patients aged 65 years and over who received an IPC consultation and survived to hospital discharge. Data were collected from IPC databases, IPC consultation checklist (which included recording of code status discussion), and electronic medical records. The IPC team recorded discharge disposition including discharge to hospice care, home‐based palliative care (a standard program similar to hospice but offered for patients with an estimated prognosis of 1 year or less and without the caveat of foregoing curative care),[6] home with home healthcare, nursing facility, and home with standard outpatient care. Ethnicity was collected via patient report.
2 and t tests were conducted to compare those admitted to hospice with those who were not. We used logistic regression to determine the effects of ethnicity on enrollment in hospice, adjusting for demographics and clinical factors. We conducted analysis using IBM SPSS 19 (IBM, Armonk, NY).
FINDINGS
From 2007 to 2009, 408 patients received IPC consults and were subsequently discharged from the hospital. Forty‐four had missing data on ethnicity or discharge disposition, leaving 364 in the analytic sample. The mean age was 80.1 years (standard deviation [SD]=8.2), and 48.9% were female. The sample was diverse; 42.6% were white, 25.5% Latino, 23.1% black, and 8.8% of other ethnic background. Primary diagnosis included cancer (33.8%), congestive heart failure (CHF) (17.4%), coronary artery disease (12.6%), dementia (12.4%), chronic obstructive pulmonary disease (6%), cerebral vascular accident (CVA) (5.2%), and other conditions (13.6%). More than half (57.7%) were discharged to hospice, 15.4% to home‐based palliative care,[6] 14.6% to a nursing facility, 8.2% to home with usual outpatient care, and 4.1% to home with home healthcare. Code status was discussed by the IPC team among 81% of the patients, with no difference between ethnic groups.
Those discharged to hospice were older (80.8, SD=8.4 vs 79.1, SD=7.8), more likely to have cancer (71.5%) or CVA (79.5%) and less likely to have end stage renal disease (28.6%) or CHF (39%), and more likely to have had a code discussion (85.8%). There were no differences between hospice users and nonusers in gender, marital status, ethnicity, and number of chronic conditions (Table 1).
| Variable | All, N=364 | Hospice Users, n=210 | Nonhospice Users, n=154 | P Value |
|---|---|---|---|---|
| ||||
| Age, y, mean (SD) | 80.1 (8.2) | 80.8 (8.4) | 79.1 (7.8) | 0.049 |
| Gender (female), % | 48.9 | 56.2 | 43.8 | 0.568 |
| Ethnicity, % | 0.702 | |||
| White | 42.6 | 43.3 | 41.6 | |
| Latino | 25.5 | 27.1 | 23.4 | |
| African American | 23.1 | 21.4 | 25.3 | |
| Other | 8.8 | 8.1 | 9.7 | |
| Marital status, % | 0.809 | |||
| Married | 45.6 | 43.8 | 48.1 | |
| Widowed | 36.0 | 38.1 | 33.1 | |
| Divorced | 7.7 | 7.6 | 7.8 | |
| Other | 7.7 | 7.6 | 7.8 | |
| Missing | 3.0 | 2.9 | 3.2 | |
| Diagnosis, % | 0.001 | |||
| Cancer | 33.8 | 42.1 | 22.9 | |
| CHF | 16.2 | 11.0 | 23.5 | |
| CAD | 12.6 | 12.4 | 13.1 | |
| Dementia | 12.4 | 12.4 | 12.4 | |
| COPD | 6.0 | 5.3 | 7.2 | |
| CVA | 5.2 | 7.2 | 2.6 | |
| Other | 13.6 | 9.6 | 18.3 | |
| Number of chronic conditions, mean (SD) | 1.0 | 1.7 (0.8) | 1.7 (0.9) | 0.949 |
| Code status discussed, % | 81.1 | 87.0 | 72.8 | 0.001 |
Significant differences between hospice users and nonusers were controlled in a regression adjusting for age, gender, marital status, and number of chronic conditions. Compared to whites, no significant differences in hospice use were found for blacks (odds ratio [OR]: 0.67; 95% confidence interval [CI]: 0.37‐1.21), Latinos (OR: 1.24; 95% CI: 0.68‐2.25), or other ethnic groups (OR: 0.78; 95% CI: 0.34‐1.56). Compared with other diagnoses, those with cancer (OR: 3.66; 95% CI: 1.77‐7.59) and older patients (OR: 1.05; 95% CI: 1.01‐1.08) were significantly more likely to receive hospice care following IPC consult. Those discussing code status were twice as likely to be discharged to hospice (OR: 2.14; 95% CI: 1.20‐3.79).
DISCUSSION
This study found similar rates of hospice enrollment following IPC consult among Latinos, blacks, and other ethnic groups as compared with whites. Others found comparable rates of advance directive completion between whites and African Americans following IPC consultation,[7]and that IPC intensity resulting in a plan of care was highly associated with receipt of hospice care.[8] Likewise, our study found that discussion of code status, another marker of intensity, was positively associated with hospice use.
Our findings among patients receiving IPC consultation contrast with previous studies examining ethnic variation in hospice use among general samples of decedents. A study of California dual eligibles found that blacks were 26% and Asians 34% less likely than whites to use hospice. Others have found similar results among patients with CHF and lung cancer.[9, 10]
Misconceptions and lack of awareness, knowledge, and trust in healthcare providers serve as barriers to hospice care for minorities.[11, 12] IPC consultations may overcome these barriers by discussing goals of care including discussing the condition, eliciting patient/family understanding of the condition, and presenting options for code status.
This study employed a single‐cohort design without a comparison group. It was conducted within a health maintenance organization with strong hospice and palliative care programs and may not represent other settings. Nevertheless, this study provides promise for IPC consultation to increase equitable access to hospice care among minority groups. Further studies are needed to confirm the preliminary findings reported here.
Disclosures: Supported in part by a career development award from the National Palliative Care Research Center and by a grant from the Archstone Foundation. Evie Vesper and Dr. Rebecca Goldstein were employees of the healthcare organization at the time of the study. Susan Enguidanos received compensation for project evaluation during the original study. The sponsors had no role in the design, implementation, or analysis of the study. The authors report no conflicts of interest.
- , , . Ethnic variation in site of death among Medicaid/Medicare dually eligible older adults. J Am Geriatr Soc. 2005;53(8):1411–1416.
- . Racial/ethnic disparities in hospice care: a systematic review. J Palliat Med. 2008;11(5):763–768.
- . The Medicare hospice benefit: 15 years of success. J Palliat Med. 1998;1(2):139–146.
- . Palliative care in hospitals. J Hosp Med. 2006;1(1):21–28.
- , , , et al. Impact of an inpatient palliative care team: a randomized control trial. J Palliat Med. 2008;11(2):180–190.
- , , , et al. Increased satisfaction with care and lower costs: results of a randomized trial of in‐home palliative care. J Am Geriatr Soc. 2007;55(7):993–1000.
- , , , et al. Ethnicity, race, and advance directives in an inpatient palliative care consultation service. Palliat Support Care. 2012;6(1):1–7.
- , , . Hospice referrals and code status: outcomes of inpatient palliative care consultations among Asian Americans and Pacific Islanders with cancer. J Pain Symptom Manage. 2011;42(4):557–564.
- , , , , . Racial differences in hospice use and patterns of care after enrollment in hospice among Medicare beneficiaries with heart failure. Am Heart J. 2012;163(6):987–993.
- , , , et al. Racial disparities in length of stay in hospice care by tumor stage in a large elderly cohort with non‐small cell lung cancer. Palliat Med. 2012;26(1):61–71.
- , , , , . Knowledge, attitudes and beliefs about end‐of‐life care among inner‐city African Americans and Latino/Hispanic Americans. J Palliat Med. 2004;7(2):247–256.
- , , . Does caregiver knowledge matter for hospice enrollment and beyond? Pilot study of minority hospice patients. Am J Hospice Palliat Med. 2009;26(3):165–171.
Drug Resistance in Pneumonia and BSI
Administration of initially appropriate antimicrobial therapy represents a key determinant of outcome in patients with severe infection.[1, 2, 3, 4, 5, 6, 7, 8, 9] The variable patterns of antimicrobial resistance seen between and within healthcare institutions complicate the process of antibiotic selection. Although much attention has historically focused on Staphylococcus aureus, resistance among Gram‐negative pathogens has emerged as a major challenge in the care of hospitalized, and particularly critically ill, patients.[2, 10, 11] Multidrug, and more specifically carbapenem resistance, among such common organisms as Pseudomonas aeruginosa (PA) and Enterobacteriaceae represents a major treatment challenge.[2] A recent US‐based surveillance study reported that a quarter of device‐related infections in hospitalized patients were caused by carbapenem‐resistant PA.[10]
In addition to changes in resistance patterns seen among PA isolates, increasing rates of nonsusceptibility have been described among Enterobacteriaceae. Resistance rates to third‐generation cephalosporins in these pathogens have risen steadily since 1988, reaching 20% among Klebsiella pneumoniae and 5% among Escherichia coli isolates by 2004.[11] In response to this, clinicians have increasingly utilized carbapenems to treat patients with serious Gram‐negative infections. However, the development of several types of carbapenemases by Enterobacteriaceae has led to a greater prevalence of carbapenem‐resistant Enterobacteriaceae species (CRE).[12, 13, 14, 15, 16, 17, 18] In fact, a recent report from the Centers for Disease Control and Prevention (CDC) documents a rapid rise in both the prevalence and extent of CRE in the United States.[19]
These Gram‐negative multidrug‐resistant (MDR) organisms frequently cause serious infections including pneumonia and bloodstream infections (BSI). The fact that these conditions, if not addressed in a timely and appropriate manner, lead to high morbidity, mortality, and costs, makes understanding the patterns of resistance that much more critical. To gain a better understanding of the prevalence and characteristics of MDR rates among PA and carbapenem resistance in Enterobacteriaceae in patients hospitalized in the United States with pneumonia and BSI, we conducted a multicenter survey of microbiology data.
METHODS
To determine the prevalence of predefined resistance patterns among PA and Enterobacteriaceae in pneumonia and BSI specimens, we examined The Surveillance Network (TSN) database from Eurofins between years 2000 and 2009. The database has been used extensively for surveillance purposes since 1994 and has previously been described in detail.[17, 20, 21, 22, 23] Briefly, TSN is a warehouse of routine clinical microbiology data collected from a nationally representative sample of microbiology laboratories in 217 hospitals in the United States. To minimize selection bias, laboratories are included based on their geography and the demographics of the populations they serve.[20] Only clinically significant samples are reported. No personal identifying information for source patients is available in this database. Only source laboratories that perform antimicrobial susceptibility testing according standard US Food and Drug Administration‐approved testing methods and interpret susceptibility in accordance with the Clinical Laboratory Standards Institute breakpoints are included.[24] All enrolled laboratories undergo a pre‐enrollment site visit. Logical filters are used for routine quality control to detect unusual susceptibility profiles and to ensure appropriate testing methods. Repeat testing and reporting are done as necessary.[20]
Laboratory samples are reported as susceptible, intermediate, or resistant.[24] We required that samples have susceptibility data for each of the antimicrobials needed to determine their resistance phenotype. These susceptibility patterns served as phenotypic surrogates for resistance. We grouped intermediate samples together with the resistant ones for the purposes of the current analysis. Duplicate isolates were excluded. Only samples representing 1 of the 2 infections of interest, pneumonia and BSI, were included.
We defined MDR‐PA as any isolate resistant to 3 of the following drug classes: aminoglycoside (gentamicin), antipseudomonal penicillin (piperacillin‐tazobactam), antipseudomonal cephalosporin (ceftazidime), carbapenems (imipenem, meropenem), and fluoroquinolone (ciprofloxacin). Enterobacteriaceae were considered CRE if resistant to both a third‐generation cephalosporin and a carbapenem. We examined the data by infection type, year, the 9 US Census geographical divisions, and intensive care unit (ICU) origin.
We did not pursue hypothesis testing due to a high risk of type I error in this large dataset. Therefore, only clinically important trends are highlighted.
RESULTS
Source specimen characteristics for the 205,526 PA (187,343 pneumonia and 18,183 BSI) and 95,566 Enterobacteriaceae specimens (58,810 pneumonia and 36,756 BSI) identified are presented in Table 1. The median age of the patients from which the isolates derive was similar among the PA pneumonia, Enterobacteriaceae pneumonia, and Enterobacteriaceae BSI groups, but higher in the PA BSI group. Similarly, there were differences in the gender distribution of source patients between the organisms and infections. Namely, although females represented a stable 42% of each of the infections with PA, the proportions of females with Enterobacteriaceae pneumonia (36.2%) differed from that in the BSI group (48.6%). Pneumonia specimens (34.0% PA and 39.0% Enterobacteriaceae) were more likely to originate in the ICU than those from BSI (28.4% PA and 21.1% Enterobacteriaceae).
| Pseudomonas aeruginosa, N=205,526 | Enterobacteriaceae, N=95,566 | |
|---|---|---|
| ||
| Pneumonia, n | 187,343 | 58,810 |
| Age, y, median (IQR 25, 75) | 54 (23, 71) | 55 (21, 71) |
| Gender, female, n (%) | 78,418 (41.9) | 21,305 (36.2) |
| ICU origin, n (%) | 63,755 (34.0) | 22,942 (39.0) |
| Meeting definitions of resistance, n (%) | 41,180 (22.0) | 930 (1.6) |
| BSI, n | 18,183 | 36,756 |
| Age, y, median (IQR 25, 75) | 59 (31, 75) | 55 (24, 71) |
| Gender, female, n (%) | 7,448 (41.8) | 17,871 (48.6) |
| ICU origin, n (%) | 5,170 (28.4) | 7,751 (21.1) |
| Meeting definitions of resistance, n (%) | 2,668 (14.7) | 394 (1.1) |
The prevalence of resistance among PA isolates was approximately 15‐fold higher than among Enterobacteriaceae specimens in both infection types (Table 1). This pattern persisted when stratified by infection type (pneumonia: 22.0% MDR‐PA vs 1.6% CRE; BSI: 14.7% MDR‐PA vs 1.1% CRE).
Over the time frame of the study, we detected variable patterns of resistance in the 2 groups of organisms (Figure 1). Namely, among PA in both pneumonia and BSI there was an initial rise in the proportion of MDR specimens between 2000 and 2003, followed by a stabilization until 2005, an additional rise in 2006, and a gradual decline and stabilization through 2009. These fluctuations notwithstanding, there was a net rise in MDR‐PA as a proportion of all PA from 10.7% in 2000 to 13.5% in 2009 among BSI, and from 19.2% in 2000 to 21.7% in 2009 among pneumonia specimens. Among Enterobacteriaceae, the CRE phenotype emerged in 2002 in both infection types and peaked in 2008 at 3.6% in BSI and 5.3% in pneumonia. This peak was followed by a stabilization in 2009 in BSI (3.5%) and a further decline, albeit minor, to 4.6% in pneumonia.

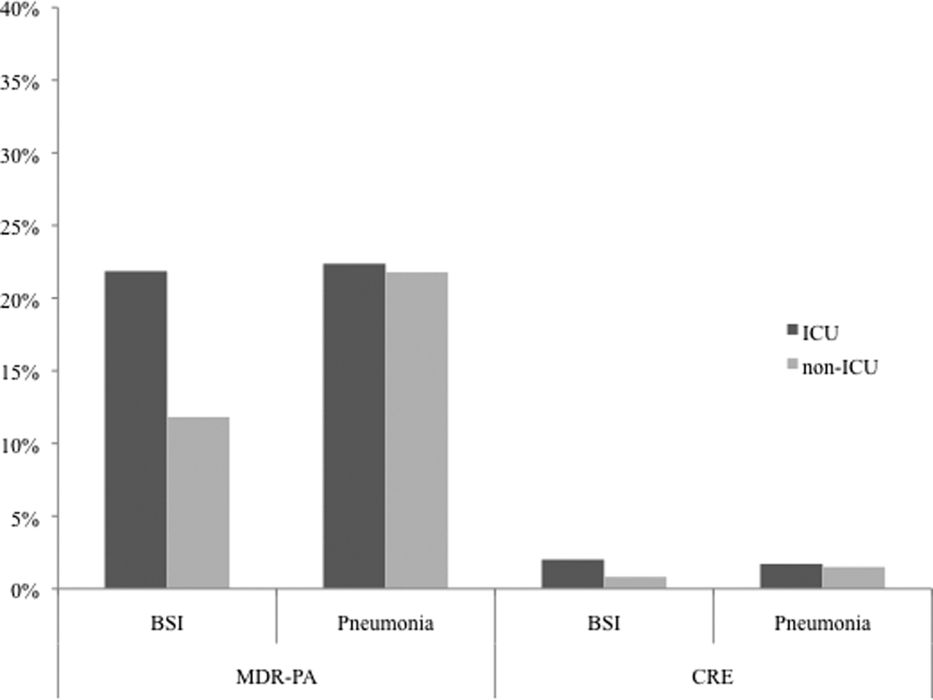
We noted geographic differences in the distribution of resistance (Table 2). Although MDR‐PA was more likely to originate from the East and West North Central divisions, and least likely from the New England and Mountain states, most CRE was detected in the specimens from the latter 2 regions. When stratified by ICU as the location of specimen origin, there were differences in the prevalence of resistant organisms of both types, but these differences were observed only in BSI specimens and not in pneumonia (Figure 2). That is, in BSI, the likelihood of a resistant organism originating from the ICU was approximately double that from a non‐ICU location for both MDR‐PA (21.9% vs 11.8%) and CRE (2.0% vs 0.8%).
| Census Division | MDR‐PA | CRE | ||
|---|---|---|---|---|
| BSI | Pneumonia | BSI | Pneumonia | |
| ||||
| East North Central | 20.8% | 26.9% | 2.0% | 1.9% |
| West North Central | 18.0% | 22.1% | 0.8% | 0.7% |
| East South Central | 15.8% | 20.5% | 0.1% | 0.1% |
| West South Central | 13.5% | 21.7% | 0.3% | 0.5% |
| Pacific | 13.1% | 20.3% | 0.3% | 0.3% |
| Mid‐Atlantic | 12.6% | 20.5% | 2.5% | 3.8% |
| South Atlantic | 12.6% | 21.6% | 0.9% | 1.5% |
| New England | 10.7% | 19.7% | 1.3% | 2.9% |
| Mountain | 8.5% | 19.4% | 0.4% | 1.1% |
DISCUSSION
We have demonstrated that among both pneumonia and BSI specimens, PA and Enterobacteriaceae have a high prevalence of multidrug resistance. When examined cross‐sectionally, in both pneumonia and BSI, the prevalence of MDR‐PA was approximately 15‐fold higher than the prevalence of CRE among Enterobacteriaceae. Over the time frame of the study, MDR‐PA rose and then fell and stabilized to levels only slightly higher than those observed at the beginning of the observation period. In contrast, CRE emerged and rose precipitously between 2006 and 2008, and appeared to stabilize in 2009 in both infection types. Interestingly, we observed geographic variability among resistant isolates. Specifically, the prevalence of CRE was highest in the region with a relatively low prevalence of MDR‐PA. Despite this heterogeneity geographically, resistance for both isolate types in BSI but not in pneumonia was substantially higher in the ICU than outside the ICU.
Our data enhance the current understanding of distribution of Gram‐negative resistance in the United States. A recent study by Braykov and colleagues examined time trends in the development of CRE phenotype among Klebsiella pneumoniae in the United States.[17] By focusing on this single pathogen in various infections within Eurofin's TSN database between 1999 and 2010, they pinpointed its initial emergence to year 2002, with a notably steep rise between 2006 and 2009, with some reduction in the pace of growth in 2010. We have documented an analogous rise in the CRE phenotype among all Enterobacteriaceae, particularly in pneumonia and BSI within a similar time period. Thus, our data on the 1 hand broaden the concern about this pathogen beyond just a single organism within Enterobacteraceae and a single antimicrobial class, and on the other hand serve to focus attention on 2 clinically burdensome infection types, pneumonia and BSI.
Another recent investigation reported a rise in carbapenem‐resistant Enterobacteriaceae in US hospitals over the past decade.[19] Drawing on data from multiple sources, including the dataset used for the current analysis, this study examined the patterns of single‐class resistance to carbapenems among central line‐associated BSI (CLABSI) and catheter‐associated urinary tract infection specimens. Consistent with our findings, these authors noted that the highest percentage of hospitals reporting such single‐class carbapenem‐resistant specimens were located in the Northeastern United States. They also described that the proportion of Enterobacteriaceae with single‐class carbapenem resistance rose from 0% in 2001 to 1.4% in 2010. An additional CDC analysis reported that single‐class carbapenem resistance now exists in 4.2% of Enterobacteraciae as compared to 1.2% of isolates in 2001. We confirm that this rise in single‐class resistance is echoed by a rise in the prevalence of the CRE phenotype, and provides further granularity to this problem, specifically in the setting of pneumonia and BSI.
Although CRE has become an important concern in the treatment of patients with pneumonia and BSI, MDR‐PA remains a far larger challenge in these infections. CREs appear to occur more frequently than in the past but remain relatively dwarfed by the prevalence of MDR‐PA. Our data are generally in agreement with the 2009 to 2010 data from the National Healthcare Safety Network (NHSN) maintained by the CDC, which focuses on CLABSI and ventilator‐associated pneumonia (VAP) rather than general BSI and pneumonia in US hospitals.[25] In this report, the proportion of PA that were classified as MDR according to a definition similar to ours was 15.4% in CLABSI and 17.7% in VAP. In contrast, we document that 13.5% of PA causing BSI and 21.7% causing pneumonia were due to MDR‐PA organisms. This mild divergence likely reflects the slightly different antimicrobials utilized to define MDR‐PA in the 2 studies, as well as variance in the populations examined. An additional data point reported in the NHSN study is the proportion of MDR‐PA CLABSI originating in the ICU (16.8%) versus non‐ICU hospital locations (13.3%). Although the difference we found in the prevalence of BSI by the location in the hospital was greater, we confirm that ICU specimens carry a higher risk of harboring MDR‐PA.
Our study has a number of strengths and limitations. Because we used a nationally representative database to derive our estimates, our results are highly generalizable.
The TSN database consists of microbiology samples from hospital laboratories. Although we attempted to reduce the risk of duplication, because of how samples are numbered in the database, repeat sampling remains a possibility. The definitions of resistance were based on phenotypic patterns of resistance to various antimicrobial classes. This makes our resistant organisms subject to misclassification.
In summary, although carbapenem resistance among Enterobacteriaceae has emerged as an important phenomenon, multidrug resistance among PA remains relatively more prevalent in the United States. Furthermore, over the decade examined, MDR‐PA has remained an important pathogen in pneumonia and BSI that persists across all geographic regions of the United States. Although CRE is rightfully receiving a disproportionate share of attention from public health officials, it would be shortsighted to ignore the importance of MDR‐PA as a target, not only for transmission prevention and antimicrobial stewardship, but also for new therapeutic development. Because the patterns of resistance are rapidly evolving, it is incumbent upon our public health enterprise to perform more granular real‐time surveillance to allow changes in epidemiology to inform policy and treatment decisions.
ACKNOWLEDGEMENTS
Disclosures: This study was supported by a grant from Cubist Pharmaceuticals. The authors report no conflicts of interest.
- National Nosocomial Infections Surveillance (NNIS) System Report. Am J Infect Control. 2004;32:470.
- , , , . National surveillance of antimicrobial resistance in Pseudomonas aeruginosa isolates obtained from intensive care unit patients from 1993 to 2002. Antimicrob Agents Chemother. 2004;48:4606–4610.
- , , , et al. Health care‐associated pneumonia and community‐acquired pneumonia: a single‐center experience. Antimicrob Agents Chemother. 2007;51:3568–3573.
- , , , et al. Clinical importance of delays in the initiation of appropriate antibiotic treatment for ventilator‐associated pneumonia. Chest. 2002;122:262–268.
- . Modification of empiric antibiotic treatment in patients with pneumonia acquired in the intensive care unit. ICU‐Acquired Pneumonia Study Group. Intensive Care Med. 1996;22:387–394.
- , , , , . Antimicrobial therapy escalation and hospital mortality among patients with HCAP: a single center experience. Chest. 2008:134:963–968.
- , , , et al. Surviving Sepsis Campaign: international guidelines for management of severe sepsis and septic shock: 2008. Crit Care Med. 2008;36:296–327.
- , , , , , . Inappropriate antibiotic therapy in Gram‐negative sepsis increases hospital length of stay. Crit Care Med. 2011;39:46–51.
- , , , . Inadequate antimicrobial treatment of infections: a risk factor for hospital mortality among critically ill patients. Chest. 1999;115:462–474.
- , , , et al. Antimicrobial‐resistant pathogens associated with healthcare‐associated infections: annual summary of data reported to the National Healthcare Safety Network at the Centers for Disease Control and Prevention, 2006–2007. Infect Control Hospital Epidemiol. 2008;29:996–1011.
- , ; National Nosocomial Infections Surveillance (NNIS) System. Overview of nosocomial infections caused by Gram‐negative bacilli. Clin Infect Dis. 2005;41:848–854.
- , , . The real threat of Klebsiella pneumoniae carbapenemase‐producing bacteria. Lancet Infect Dis. 2009;9:228–236.
- , , , . Household transmission of carbapenemase‐producing Klebsiella pneumoniae. Emerg Infect Dis. 2008;14:859–860.
- , , , . Isolation of imipenem‐resistant Enterobacter species: emergence of KPC‐2 carbapenemase, molecular characterization, epidemiology, and outcomes. Antimicrob Agents Chemother. 2008;52:1413–1418.
- , , , , . Outcomes of carbapenem‐resistant Klebsiella pneumoniae infection and the impact of antimicrobial and adjunctive therapies. Infect Control Hosp Epidemiol. 2008;29:1099–1106.
- , , , , , ; for the Centers for Disease Control and Prevention Epicenter Program. Emergence and rapid regional spread of Klebsiella pneumoniae carbapenemase‐producing Enterobacteriaceae. Clin Infect Dis. 2011;53:532–540.
- , , , , . Trends in resistance to carbapenems and third‐generation cephalosporins among clinical isolates of Klebsiella pneumoniae in the United States, 1999–2010. Infect Control Hosp Epidemiol. 2013;34:259–268.
- , , , . Population‐based incidence of carbapenem‐resistant Klebsiella pneumoniae along the continuum of care, Los Angeles County. Infect Control Hosp Epidemiol. 2013;34:144–150.
- Centers for Disease Control and Prevention (CDC). Vital signs: carbapenem‐resistant enterobacteriaceae. MMWR Morb Mortal Wkly Rep. 2013;62:165–170.
- , , . Antimicrobial resistance in key bloodstream bacterial isolates: electronic surveillance with the Surveillance Network Database–USA. Clin Infect Dis. 1999;29:259–263.
- , , . Community‐associated methicillin‐resistant Staphylococcus aureus in outpatients, United States, 1999–2006. Emerg Infect Dis. 2009;15:1925–1930.
- , , . Increasing resistance of Acinetobacter species to imipenem in United States hospitals, 1999–2006. Infect Control Hosp Epidemiol. 2010;31:196–197.
- , , , , . Prevalence of antimicrobial resistance in bacteria isolated from central nervous system specimens as reported by U.S. hospital laboratories from 2000 to 2002. Ann Clin Microbiol Antimicrob. 2004;3:3.
- Clinical Laboratory Standards Institute. Available at: http://www.clsi.org. Accessed July 8, 2013.
- , , , et al. Antimicrobial‐resistant pathogens associates with healthcare‐associated infections: Summary of data reported to the National Healthcare Safety Network at the Centers for Disease Control and Prevention, 2009–2010. Infect Control Hosp Epidemiol. 2013;34:1–14.
Administration of initially appropriate antimicrobial therapy represents a key determinant of outcome in patients with severe infection.[1, 2, 3, 4, 5, 6, 7, 8, 9] The variable patterns of antimicrobial resistance seen between and within healthcare institutions complicate the process of antibiotic selection. Although much attention has historically focused on Staphylococcus aureus, resistance among Gram‐negative pathogens has emerged as a major challenge in the care of hospitalized, and particularly critically ill, patients.[2, 10, 11] Multidrug, and more specifically carbapenem resistance, among such common organisms as Pseudomonas aeruginosa (PA) and Enterobacteriaceae represents a major treatment challenge.[2] A recent US‐based surveillance study reported that a quarter of device‐related infections in hospitalized patients were caused by carbapenem‐resistant PA.[10]
In addition to changes in resistance patterns seen among PA isolates, increasing rates of nonsusceptibility have been described among Enterobacteriaceae. Resistance rates to third‐generation cephalosporins in these pathogens have risen steadily since 1988, reaching 20% among Klebsiella pneumoniae and 5% among Escherichia coli isolates by 2004.[11] In response to this, clinicians have increasingly utilized carbapenems to treat patients with serious Gram‐negative infections. However, the development of several types of carbapenemases by Enterobacteriaceae has led to a greater prevalence of carbapenem‐resistant Enterobacteriaceae species (CRE).[12, 13, 14, 15, 16, 17, 18] In fact, a recent report from the Centers for Disease Control and Prevention (CDC) documents a rapid rise in both the prevalence and extent of CRE in the United States.[19]
These Gram‐negative multidrug‐resistant (MDR) organisms frequently cause serious infections including pneumonia and bloodstream infections (BSI). The fact that these conditions, if not addressed in a timely and appropriate manner, lead to high morbidity, mortality, and costs, makes understanding the patterns of resistance that much more critical. To gain a better understanding of the prevalence and characteristics of MDR rates among PA and carbapenem resistance in Enterobacteriaceae in patients hospitalized in the United States with pneumonia and BSI, we conducted a multicenter survey of microbiology data.
METHODS
To determine the prevalence of predefined resistance patterns among PA and Enterobacteriaceae in pneumonia and BSI specimens, we examined The Surveillance Network (TSN) database from Eurofins between years 2000 and 2009. The database has been used extensively for surveillance purposes since 1994 and has previously been described in detail.[17, 20, 21, 22, 23] Briefly, TSN is a warehouse of routine clinical microbiology data collected from a nationally representative sample of microbiology laboratories in 217 hospitals in the United States. To minimize selection bias, laboratories are included based on their geography and the demographics of the populations they serve.[20] Only clinically significant samples are reported. No personal identifying information for source patients is available in this database. Only source laboratories that perform antimicrobial susceptibility testing according standard US Food and Drug Administration‐approved testing methods and interpret susceptibility in accordance with the Clinical Laboratory Standards Institute breakpoints are included.[24] All enrolled laboratories undergo a pre‐enrollment site visit. Logical filters are used for routine quality control to detect unusual susceptibility profiles and to ensure appropriate testing methods. Repeat testing and reporting are done as necessary.[20]
Laboratory samples are reported as susceptible, intermediate, or resistant.[24] We required that samples have susceptibility data for each of the antimicrobials needed to determine their resistance phenotype. These susceptibility patterns served as phenotypic surrogates for resistance. We grouped intermediate samples together with the resistant ones for the purposes of the current analysis. Duplicate isolates were excluded. Only samples representing 1 of the 2 infections of interest, pneumonia and BSI, were included.
We defined MDR‐PA as any isolate resistant to 3 of the following drug classes: aminoglycoside (gentamicin), antipseudomonal penicillin (piperacillin‐tazobactam), antipseudomonal cephalosporin (ceftazidime), carbapenems (imipenem, meropenem), and fluoroquinolone (ciprofloxacin). Enterobacteriaceae were considered CRE if resistant to both a third‐generation cephalosporin and a carbapenem. We examined the data by infection type, year, the 9 US Census geographical divisions, and intensive care unit (ICU) origin.
We did not pursue hypothesis testing due to a high risk of type I error in this large dataset. Therefore, only clinically important trends are highlighted.
RESULTS
Source specimen characteristics for the 205,526 PA (187,343 pneumonia and 18,183 BSI) and 95,566 Enterobacteriaceae specimens (58,810 pneumonia and 36,756 BSI) identified are presented in Table 1. The median age of the patients from which the isolates derive was similar among the PA pneumonia, Enterobacteriaceae pneumonia, and Enterobacteriaceae BSI groups, but higher in the PA BSI group. Similarly, there were differences in the gender distribution of source patients between the organisms and infections. Namely, although females represented a stable 42% of each of the infections with PA, the proportions of females with Enterobacteriaceae pneumonia (36.2%) differed from that in the BSI group (48.6%). Pneumonia specimens (34.0% PA and 39.0% Enterobacteriaceae) were more likely to originate in the ICU than those from BSI (28.4% PA and 21.1% Enterobacteriaceae).
| Pseudomonas aeruginosa, N=205,526 | Enterobacteriaceae, N=95,566 | |
|---|---|---|
| ||
| Pneumonia, n | 187,343 | 58,810 |
| Age, y, median (IQR 25, 75) | 54 (23, 71) | 55 (21, 71) |
| Gender, female, n (%) | 78,418 (41.9) | 21,305 (36.2) |
| ICU origin, n (%) | 63,755 (34.0) | 22,942 (39.0) |
| Meeting definitions of resistance, n (%) | 41,180 (22.0) | 930 (1.6) |
| BSI, n | 18,183 | 36,756 |
| Age, y, median (IQR 25, 75) | 59 (31, 75) | 55 (24, 71) |
| Gender, female, n (%) | 7,448 (41.8) | 17,871 (48.6) |
| ICU origin, n (%) | 5,170 (28.4) | 7,751 (21.1) |
| Meeting definitions of resistance, n (%) | 2,668 (14.7) | 394 (1.1) |
The prevalence of resistance among PA isolates was approximately 15‐fold higher than among Enterobacteriaceae specimens in both infection types (Table 1). This pattern persisted when stratified by infection type (pneumonia: 22.0% MDR‐PA vs 1.6% CRE; BSI: 14.7% MDR‐PA vs 1.1% CRE).
Over the time frame of the study, we detected variable patterns of resistance in the 2 groups of organisms (Figure 1). Namely, among PA in both pneumonia and BSI there was an initial rise in the proportion of MDR specimens between 2000 and 2003, followed by a stabilization until 2005, an additional rise in 2006, and a gradual decline and stabilization through 2009. These fluctuations notwithstanding, there was a net rise in MDR‐PA as a proportion of all PA from 10.7% in 2000 to 13.5% in 2009 among BSI, and from 19.2% in 2000 to 21.7% in 2009 among pneumonia specimens. Among Enterobacteriaceae, the CRE phenotype emerged in 2002 in both infection types and peaked in 2008 at 3.6% in BSI and 5.3% in pneumonia. This peak was followed by a stabilization in 2009 in BSI (3.5%) and a further decline, albeit minor, to 4.6% in pneumonia.
We noted geographic differences in the distribution of resistance (Table 2). Although MDR‐PA was more likely to originate from the East and West North Central divisions, and least likely from the New England and Mountain states, most CRE was detected in the specimens from the latter 2 regions. When stratified by ICU as the location of specimen origin, there were differences in the prevalence of resistant organisms of both types, but these differences were observed only in BSI specimens and not in pneumonia (Figure 2). That is, in BSI, the likelihood of a resistant organism originating from the ICU was approximately double that from a non‐ICU location for both MDR‐PA (21.9% vs 11.8%) and CRE (2.0% vs 0.8%).
| Census Division | MDR‐PA | CRE | ||
|---|---|---|---|---|
| BSI | Pneumonia | BSI | Pneumonia | |
| ||||
| East North Central | 20.8% | 26.9% | 2.0% | 1.9% |
| West North Central | 18.0% | 22.1% | 0.8% | 0.7% |
| East South Central | 15.8% | 20.5% | 0.1% | 0.1% |
| West South Central | 13.5% | 21.7% | 0.3% | 0.5% |
| Pacific | 13.1% | 20.3% | 0.3% | 0.3% |
| Mid‐Atlantic | 12.6% | 20.5% | 2.5% | 3.8% |
| South Atlantic | 12.6% | 21.6% | 0.9% | 1.5% |
| New England | 10.7% | 19.7% | 1.3% | 2.9% |
| Mountain | 8.5% | 19.4% | 0.4% | 1.1% |
DISCUSSION
We have demonstrated that among both pneumonia and BSI specimens, PA and Enterobacteriaceae have a high prevalence of multidrug resistance. When examined cross‐sectionally, in both pneumonia and BSI, the prevalence of MDR‐PA was approximately 15‐fold higher than the prevalence of CRE among Enterobacteriaceae. Over the time frame of the study, MDR‐PA rose and then fell and stabilized to levels only slightly higher than those observed at the beginning of the observation period. In contrast, CRE emerged and rose precipitously between 2006 and 2008, and appeared to stabilize in 2009 in both infection types. Interestingly, we observed geographic variability among resistant isolates. Specifically, the prevalence of CRE was highest in the region with a relatively low prevalence of MDR‐PA. Despite this heterogeneity geographically, resistance for both isolate types in BSI but not in pneumonia was substantially higher in the ICU than outside the ICU.
Our data enhance the current understanding of distribution of Gram‐negative resistance in the United States. A recent study by Braykov and colleagues examined time trends in the development of CRE phenotype among Klebsiella pneumoniae in the United States.[17] By focusing on this single pathogen in various infections within Eurofin's TSN database between 1999 and 2010, they pinpointed its initial emergence to year 2002, with a notably steep rise between 2006 and 2009, with some reduction in the pace of growth in 2010. We have documented an analogous rise in the CRE phenotype among all Enterobacteriaceae, particularly in pneumonia and BSI within a similar time period. Thus, our data on the 1 hand broaden the concern about this pathogen beyond just a single organism within Enterobacteraceae and a single antimicrobial class, and on the other hand serve to focus attention on 2 clinically burdensome infection types, pneumonia and BSI.
Another recent investigation reported a rise in carbapenem‐resistant Enterobacteriaceae in US hospitals over the past decade.[19] Drawing on data from multiple sources, including the dataset used for the current analysis, this study examined the patterns of single‐class resistance to carbapenems among central line‐associated BSI (CLABSI) and catheter‐associated urinary tract infection specimens. Consistent with our findings, these authors noted that the highest percentage of hospitals reporting such single‐class carbapenem‐resistant specimens were located in the Northeastern United States. They also described that the proportion of Enterobacteriaceae with single‐class carbapenem resistance rose from 0% in 2001 to 1.4% in 2010. An additional CDC analysis reported that single‐class carbapenem resistance now exists in 4.2% of Enterobacteraciae as compared to 1.2% of isolates in 2001. We confirm that this rise in single‐class resistance is echoed by a rise in the prevalence of the CRE phenotype, and provides further granularity to this problem, specifically in the setting of pneumonia and BSI.
Although CRE has become an important concern in the treatment of patients with pneumonia and BSI, MDR‐PA remains a far larger challenge in these infections. CREs appear to occur more frequently than in the past but remain relatively dwarfed by the prevalence of MDR‐PA. Our data are generally in agreement with the 2009 to 2010 data from the National Healthcare Safety Network (NHSN) maintained by the CDC, which focuses on CLABSI and ventilator‐associated pneumonia (VAP) rather than general BSI and pneumonia in US hospitals.[25] In this report, the proportion of PA that were classified as MDR according to a definition similar to ours was 15.4% in CLABSI and 17.7% in VAP. In contrast, we document that 13.5% of PA causing BSI and 21.7% causing pneumonia were due to MDR‐PA organisms. This mild divergence likely reflects the slightly different antimicrobials utilized to define MDR‐PA in the 2 studies, as well as variance in the populations examined. An additional data point reported in the NHSN study is the proportion of MDR‐PA CLABSI originating in the ICU (16.8%) versus non‐ICU hospital locations (13.3%). Although the difference we found in the prevalence of BSI by the location in the hospital was greater, we confirm that ICU specimens carry a higher risk of harboring MDR‐PA.
Our study has a number of strengths and limitations. Because we used a nationally representative database to derive our estimates, our results are highly generalizable.
The TSN database consists of microbiology samples from hospital laboratories. Although we attempted to reduce the risk of duplication, because of how samples are numbered in the database, repeat sampling remains a possibility. The definitions of resistance were based on phenotypic patterns of resistance to various antimicrobial classes. This makes our resistant organisms subject to misclassification.
In summary, although carbapenem resistance among Enterobacteriaceae has emerged as an important phenomenon, multidrug resistance among PA remains relatively more prevalent in the United States. Furthermore, over the decade examined, MDR‐PA has remained an important pathogen in pneumonia and BSI that persists across all geographic regions of the United States. Although CRE is rightfully receiving a disproportionate share of attention from public health officials, it would be shortsighted to ignore the importance of MDR‐PA as a target, not only for transmission prevention and antimicrobial stewardship, but also for new therapeutic development. Because the patterns of resistance are rapidly evolving, it is incumbent upon our public health enterprise to perform more granular real‐time surveillance to allow changes in epidemiology to inform policy and treatment decisions.
ACKNOWLEDGEMENTS
Disclosures: This study was supported by a grant from Cubist Pharmaceuticals. The authors report no conflicts of interest.
- National Nosocomial Infections Surveillance (NNIS) System Report. Am J Infect Control. 2004;32:470.
- , , , . National surveillance of antimicrobial resistance in Pseudomonas aeruginosa isolates obtained from intensive care unit patients from 1993 to 2002. Antimicrob Agents Chemother. 2004;48:4606–4610.
- , , , et al. Health care‐associated pneumonia and community‐acquired pneumonia: a single‐center experience. Antimicrob Agents Chemother. 2007;51:3568–3573.
- , , , et al. Clinical importance of delays in the initiation of appropriate antibiotic treatment for ventilator‐associated pneumonia. Chest. 2002;122:262–268.
- . Modification of empiric antibiotic treatment in patients with pneumonia acquired in the intensive care unit. ICU‐Acquired Pneumonia Study Group. Intensive Care Med. 1996;22:387–394.
- , , , , . Antimicrobial therapy escalation and hospital mortality among patients with HCAP: a single center experience. Chest. 2008:134:963–968.
- , , , et al. Surviving Sepsis Campaign: international guidelines for management of severe sepsis and septic shock: 2008. Crit Care Med. 2008;36:296–327.
- , , , , , . Inappropriate antibiotic therapy in Gram‐negative sepsis increases hospital length of stay. Crit Care Med. 2011;39:46–51.
- , , , . Inadequate antimicrobial treatment of infections: a risk factor for hospital mortality among critically ill patients. Chest. 1999;115:462–474.
- , , , et al. Antimicrobial‐resistant pathogens associated with healthcare‐associated infections: annual summary of data reported to the National Healthcare Safety Network at the Centers for Disease Control and Prevention, 2006–2007. Infect Control Hospital Epidemiol. 2008;29:996–1011.
- , ; National Nosocomial Infections Surveillance (NNIS) System. Overview of nosocomial infections caused by Gram‐negative bacilli. Clin Infect Dis. 2005;41:848–854.
- , , . The real threat of Klebsiella pneumoniae carbapenemase‐producing bacteria. Lancet Infect Dis. 2009;9:228–236.
- , , , . Household transmission of carbapenemase‐producing Klebsiella pneumoniae. Emerg Infect Dis. 2008;14:859–860.
- , , , . Isolation of imipenem‐resistant Enterobacter species: emergence of KPC‐2 carbapenemase, molecular characterization, epidemiology, and outcomes. Antimicrob Agents Chemother. 2008;52:1413–1418.
- , , , , . Outcomes of carbapenem‐resistant Klebsiella pneumoniae infection and the impact of antimicrobial and adjunctive therapies. Infect Control Hosp Epidemiol. 2008;29:1099–1106.
- , , , , , ; for the Centers for Disease Control and Prevention Epicenter Program. Emergence and rapid regional spread of Klebsiella pneumoniae carbapenemase‐producing Enterobacteriaceae. Clin Infect Dis. 2011;53:532–540.
- , , , , . Trends in resistance to carbapenems and third‐generation cephalosporins among clinical isolates of Klebsiella pneumoniae in the United States, 1999–2010. Infect Control Hosp Epidemiol. 2013;34:259–268.
- , , , . Population‐based incidence of carbapenem‐resistant Klebsiella pneumoniae along the continuum of care, Los Angeles County. Infect Control Hosp Epidemiol. 2013;34:144–150.
- Centers for Disease Control and Prevention (CDC). Vital signs: carbapenem‐resistant enterobacteriaceae. MMWR Morb Mortal Wkly Rep. 2013;62:165–170.
- , , . Antimicrobial resistance in key bloodstream bacterial isolates: electronic surveillance with the Surveillance Network Database–USA. Clin Infect Dis. 1999;29:259–263.
- , , . Community‐associated methicillin‐resistant Staphylococcus aureus in outpatients, United States, 1999–2006. Emerg Infect Dis. 2009;15:1925–1930.
- , , . Increasing resistance of Acinetobacter species to imipenem in United States hospitals, 1999–2006. Infect Control Hosp Epidemiol. 2010;31:196–197.
- , , , , . Prevalence of antimicrobial resistance in bacteria isolated from central nervous system specimens as reported by U.S. hospital laboratories from 2000 to 2002. Ann Clin Microbiol Antimicrob. 2004;3:3.
- Clinical Laboratory Standards Institute. Available at: http://www.clsi.org. Accessed July 8, 2013.
- , , , et al. Antimicrobial‐resistant pathogens associates with healthcare‐associated infections: Summary of data reported to the National Healthcare Safety Network at the Centers for Disease Control and Prevention, 2009–2010. Infect Control Hosp Epidemiol. 2013;34:1–14.
© 2013 Society of Hospital Medicine
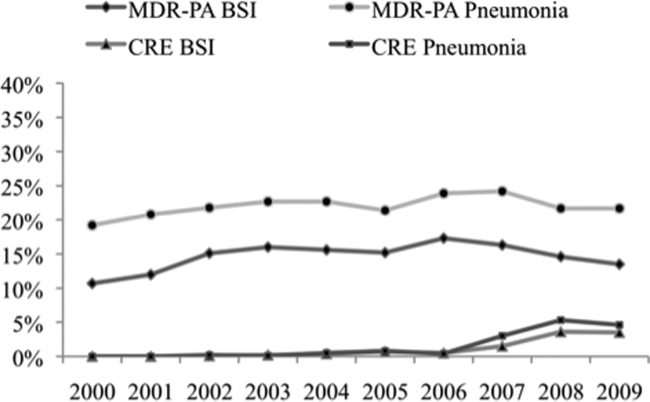
Mitral replacement may grow with infant
NEW YORK – Physicians at Boston Children’s Hospital replaced the mitral valves of eight infants with irreparable mitral valve disease with a valve that offers the opportunity of sequential expansion as the child grows, according to Dr. Sitaram M. Emani. The results were presented at the 2013 Mitral Valve Conclave earlier this year.
"The Melody valve retains its competence if you expand it before putting it in. We asked whether the valve retains the ability to maintain competence even if expansion is performed after implantation as the patient grows," said Dr. Emani, a pediatric cardiac surgeon at Boston Children’s Hospital.
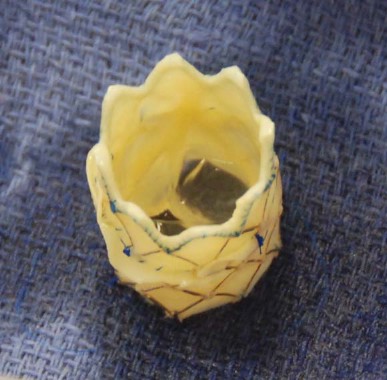
According to Dr. Emani, the current options for infants with damaged mitral valves that are beyond repair are replacement with mechanical or bioprosthetic valves or the Ross mitral procedure. Perhaps the main disadvantage of these options is the lack of a prosthetic valve small enough for an infant, one that is less than 12 mm in diameter. Another problem is the possibility of stenosis developing as the child grows, since the diameters of the prosthetics are fixed. Other drawbacks are that supra-annular fixation is generally associated with poor outcomes and that annular fixation limits the ability to upsize at reoperation.
The Melody valve is an externally stented bovine jugular vein graft that was designed for transcatheter pulmonary valve replacement. In this study, the valve was inserted surgically. The valve maintains competence over a range of sizes up to 22 mm. Although this valve is not approved for use for mitral valve replacement, the hope of using such a prosthetic is that it can be enlarged in the catheterization laboratory as the child grows.
Dr. Emani did a retrospective study of his experience with the Melody valve for mitral valve replacement in eight infants less than 12 months of age. The median age at implantation was 6 months (range, 1-9 months). Four infants had an atrioventricular canal (AVC) defect and four had congenital mitral valve stenosis. Most of the children had two prior operations for mitral valve repair. The longest follow-up to date has been 2 years.
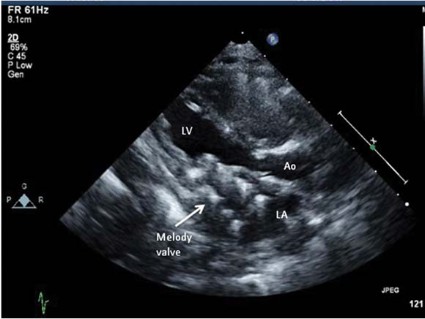
At a median follow-up of 8 months, regurgitation on the echocardiogram was considered to be mild or less in all patients. The median gradient was 3 mm Hg (range, 2-7 mm Hg) on the immediate postoperative echocardiogram. Three patients developed a mild paravalvular leak; one of these patients had undergone aggressive stent resection, a modification Dr. Emani does not recommend. One patient developed left ventricular outflow tract obstruction (LVOTO), which Dr. Emani attributed to the lack of distal stent fixation in this patient. Another patient with an AVC defect developed complete heart block.
One patient who died 3 days postoperatively had heterotaxy, severe mitral regurgitation, and prior ventricular failure on extracorporeal membrane oxygenation support. That patient had undergone valve implantation as a last resort.
Three patients underwent sequential expansion about 6 months after implantation. After valve expansion, the median balloon size was 12 mm, ranging from 12 to 16 mm. None of the patients developed worsening valvular function and all had relief of obstruction. Transcatheter intervention was used to correct a paravalvular leak in one patient and to treat a left ventricular outflow tract problem in another. None of the patients developed endocarditis or a strut fracture, "although I worry about strut fracture if aggressive stent resection and manipulation is performed," he said at the meeting, which was sponsored by the AATS.
Dr. Emani offered some procedural tips. First, the Melody valve must be optimized for surgical implantation in infants. The length of the valve must be reduced by trimming it to reduce the chance of LVOTO or pulmonary vein obstruction. He recommends sizing the valves by echocardiogram and fixating the distal stent to the inferior free wall of the ventricle.
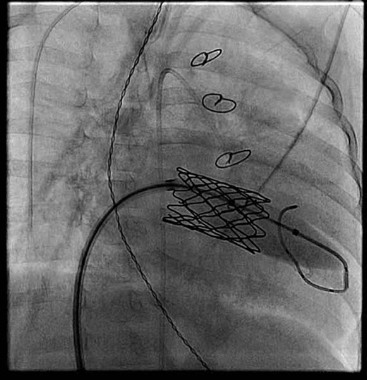
He reported that friction of the stent against the annulus prevents leakage. Early on he used a pericardial cuff to anchor to the annulus, particularly in patients who had undergone failed AVC repair. He tries to preserve at least part of the anterior leaflet to facilitate suture placement and create a "stand-off" from the LVOTO.
Dr. Emani also advised limiting intraoperative dilation to no more than 1 mm greater than the measured annulus. "Try not to overdilate at implantation to avoid heart block, LVOTO, and coronary compression. The nice thing is you don’t have to decide then and there what size you want. You can go back to the cath lab and, under direct visualization with the coronary view, you can dilate it under more controlled circumstances.
"The hope is that we will be able to dilate these valves as the patients grow into adolescence. If we can dilate them up to 22 mm, hopefully we will decrease the number of repeat replacements, delay the time to reoperation, and perhaps modify our thresholds for tolerating significant disease after unsuccessful repairs."
Dr. Emani reported no disclosures.
NEW YORK – Physicians at Boston Children’s Hospital replaced the mitral valves of eight infants with irreparable mitral valve disease with a valve that offers the opportunity of sequential expansion as the child grows, according to Dr. Sitaram M. Emani. The results were presented at the 2013 Mitral Valve Conclave earlier this year.
"The Melody valve retains its competence if you expand it before putting it in. We asked whether the valve retains the ability to maintain competence even if expansion is performed after implantation as the patient grows," said Dr. Emani, a pediatric cardiac surgeon at Boston Children’s Hospital.
According to Dr. Emani, the current options for infants with damaged mitral valves that are beyond repair are replacement with mechanical or bioprosthetic valves or the Ross mitral procedure. Perhaps the main disadvantage of these options is the lack of a prosthetic valve small enough for an infant, one that is less than 12 mm in diameter. Another problem is the possibility of stenosis developing as the child grows, since the diameters of the prosthetics are fixed. Other drawbacks are that supra-annular fixation is generally associated with poor outcomes and that annular fixation limits the ability to upsize at reoperation.
The Melody valve is an externally stented bovine jugular vein graft that was designed for transcatheter pulmonary valve replacement. In this study, the valve was inserted surgically. The valve maintains competence over a range of sizes up to 22 mm. Although this valve is not approved for use for mitral valve replacement, the hope of using such a prosthetic is that it can be enlarged in the catheterization laboratory as the child grows.
Dr. Emani did a retrospective study of his experience with the Melody valve for mitral valve replacement in eight infants less than 12 months of age. The median age at implantation was 6 months (range, 1-9 months). Four infants had an atrioventricular canal (AVC) defect and four had congenital mitral valve stenosis. Most of the children had two prior operations for mitral valve repair. The longest follow-up to date has been 2 years.
At a median follow-up of 8 months, regurgitation on the echocardiogram was considered to be mild or less in all patients. The median gradient was 3 mm Hg (range, 2-7 mm Hg) on the immediate postoperative echocardiogram. Three patients developed a mild paravalvular leak; one of these patients had undergone aggressive stent resection, a modification Dr. Emani does not recommend. One patient developed left ventricular outflow tract obstruction (LVOTO), which Dr. Emani attributed to the lack of distal stent fixation in this patient. Another patient with an AVC defect developed complete heart block.
One patient who died 3 days postoperatively had heterotaxy, severe mitral regurgitation, and prior ventricular failure on extracorporeal membrane oxygenation support. That patient had undergone valve implantation as a last resort.
Three patients underwent sequential expansion about 6 months after implantation. After valve expansion, the median balloon size was 12 mm, ranging from 12 to 16 mm. None of the patients developed worsening valvular function and all had relief of obstruction. Transcatheter intervention was used to correct a paravalvular leak in one patient and to treat a left ventricular outflow tract problem in another. None of the patients developed endocarditis or a strut fracture, "although I worry about strut fracture if aggressive stent resection and manipulation is performed," he said at the meeting, which was sponsored by the AATS.
Dr. Emani offered some procedural tips. First, the Melody valve must be optimized for surgical implantation in infants. The length of the valve must be reduced by trimming it to reduce the chance of LVOTO or pulmonary vein obstruction. He recommends sizing the valves by echocardiogram and fixating the distal stent to the inferior free wall of the ventricle.
He reported that friction of the stent against the annulus prevents leakage. Early on he used a pericardial cuff to anchor to the annulus, particularly in patients who had undergone failed AVC repair. He tries to preserve at least part of the anterior leaflet to facilitate suture placement and create a "stand-off" from the LVOTO.
Dr. Emani also advised limiting intraoperative dilation to no more than 1 mm greater than the measured annulus. "Try not to overdilate at implantation to avoid heart block, LVOTO, and coronary compression. The nice thing is you don’t have to decide then and there what size you want. You can go back to the cath lab and, under direct visualization with the coronary view, you can dilate it under more controlled circumstances.
"The hope is that we will be able to dilate these valves as the patients grow into adolescence. If we can dilate them up to 22 mm, hopefully we will decrease the number of repeat replacements, delay the time to reoperation, and perhaps modify our thresholds for tolerating significant disease after unsuccessful repairs."
Dr. Emani reported no disclosures.

Mentored Implementation Program Highlights Need for Improved Medication Reconciliation
What is the best possible medication history? How is it done? Who should do it? When should it be done during a patient’s journey in and out of the hospital? What medication discrepancies—and potential adverse drug events—are most likely?
Those are questions veteran hospitalist Jason Stein, MD, tried to answer during an HM13 breakout session on medication reconciliation at the Gaylord National Resort and Conference Center in National Harbor, Md.
"How do you know as the discharging provider if the medication list you’re looking at is gold or garbage?" said Dr. Stein, associate director for quality improvement (QI) at Emory University in Atlanta and a mentor for SHM’s Multi-Center Medication Reconciliation Quality Improvement Study (MARQUIS) quality-research initiative.

“Sometimes it’s impossible to know what the patient was or wasn’t taking, but it doesn’t mean you don’t do your best,” he said, adding that hospitalists should attempt to get at least one reliable, corroborating source of information for a patient’s medical history.
Sometimes it is necessary to speak to family members or the community pharmacy, Dr. Schnipper said, because many patients can’t remember all of the drugs they are taking. Trying to do medication reconciliation at the time of discharge when BPMH has not been done can lead to more work for the provider, medication errors, or rehospitalizations. Ideally, knowledge of what the patient was taking before admission, as well as the patient’s health literacy and adherence history, should be gathered and documented once, early, and well during the hospitalization by a trained provider, according to Dr. Schnipper.
An SHM survey, however, showed 50% to 70% percent of front-line providers have never received BPMH training, and 60% say they are not given the time.1
“Not knowing means a diligent provider would need to take a BPMH at discharge, which is a waste,” Dr. Stein said. It would be nice to tell from the electronic health record whether a true BPMH had been taken for every hospitalized patient—or at least every high-risk patient—but this goal is not well-supported by current information technology, MARQUIS investigators said they have learned.
The MARQUIS program was launched in 2011 with a grant from the federal Agency for Healthcare Research and Quality. It began with a thorough review of the literature on medication reconciliation and the development of a toolkit of best practices. In 2012, six pilot sites were offered a menu of 11 MARQUIS medication-reconciliation interventions to choose from and help in implementing them from an SHM mentor, with expertise in both QI and medication safety.
Listen to more of our interview with MARQUIS principal investigator Jeffrey Schnipper MD, MPH, FHM.
Participating sites have mobilized high-level hospital leadership and utilize a local champion, usually a hospitalist, tools for assessing high-risk patients, medication-reconciliation assistants or counselors, and pharmacist involvement. Different sites have employed different professional staff to take medication histories.
Dr. Schnipper said he expects another round of MARQUIS-mentored implementation, probably in 2014, after data from the first round have been analyzed. The program is tracking such outcomes as the number of potentially harmful, unintentional medication discrepancies per patient at participating sites.
The MARQUIS toolkit is available on the SHM website. TH
Larry Beresford is a freelance writer in San Francisco.
Reference
1. Schnipper JL, Mueller SK, Salanitro AH, Stein J. Got Med Wreck? Targeted Repairs from the Multi-Center Medication Reconciliation Quality Improvement Study (MARQUIS). PowerPoint presentation at Society of Hospital Medicine annual meeting, May 16-19, 2013, National Harbor, Md.
What is the best possible medication history? How is it done? Who should do it? When should it be done during a patient’s journey in and out of the hospital? What medication discrepancies—and potential adverse drug events—are most likely?
Those are questions veteran hospitalist Jason Stein, MD, tried to answer during an HM13 breakout session on medication reconciliation at the Gaylord National Resort and Conference Center in National Harbor, Md.
"How do you know as the discharging provider if the medication list you’re looking at is gold or garbage?" said Dr. Stein, associate director for quality improvement (QI) at Emory University in Atlanta and a mentor for SHM’s Multi-Center Medication Reconciliation Quality Improvement Study (MARQUIS) quality-research initiative.
“Sometimes it’s impossible to know what the patient was or wasn’t taking, but it doesn’t mean you don’t do your best,” he said, adding that hospitalists should attempt to get at least one reliable, corroborating source of information for a patient’s medical history.
Sometimes it is necessary to speak to family members or the community pharmacy, Dr. Schnipper said, because many patients can’t remember all of the drugs they are taking. Trying to do medication reconciliation at the time of discharge when BPMH has not been done can lead to more work for the provider, medication errors, or rehospitalizations. Ideally, knowledge of what the patient was taking before admission, as well as the patient’s health literacy and adherence history, should be gathered and documented once, early, and well during the hospitalization by a trained provider, according to Dr. Schnipper.
An SHM survey, however, showed 50% to 70% percent of front-line providers have never received BPMH training, and 60% say they are not given the time.1
“Not knowing means a diligent provider would need to take a BPMH at discharge, which is a waste,” Dr. Stein said. It would be nice to tell from the electronic health record whether a true BPMH had been taken for every hospitalized patient—or at least every high-risk patient—but this goal is not well-supported by current information technology, MARQUIS investigators said they have learned.
The MARQUIS program was launched in 2011 with a grant from the federal Agency for Healthcare Research and Quality. It began with a thorough review of the literature on medication reconciliation and the development of a toolkit of best practices. In 2012, six pilot sites were offered a menu of 11 MARQUIS medication-reconciliation interventions to choose from and help in implementing them from an SHM mentor, with expertise in both QI and medication safety.
Listen to more of our interview with MARQUIS principal investigator Jeffrey Schnipper MD, MPH, FHM.
Participating sites have mobilized high-level hospital leadership and utilize a local champion, usually a hospitalist, tools for assessing high-risk patients, medication-reconciliation assistants or counselors, and pharmacist involvement. Different sites have employed different professional staff to take medication histories.
Dr. Schnipper said he expects another round of MARQUIS-mentored implementation, probably in 2014, after data from the first round have been analyzed. The program is tracking such outcomes as the number of potentially harmful, unintentional medication discrepancies per patient at participating sites.
The MARQUIS toolkit is available on the SHM website. TH
Larry Beresford is a freelance writer in San Francisco.
Reference
1. Schnipper JL, Mueller SK, Salanitro AH, Stein J. Got Med Wreck? Targeted Repairs from the Multi-Center Medication Reconciliation Quality Improvement Study (MARQUIS). PowerPoint presentation at Society of Hospital Medicine annual meeting, May 16-19, 2013, National Harbor, Md.
Getting a handle on goals of care
She presented to the trauma bay after transfer from another hospital. She had fallen out of bed at the nursing home, and they had sent her to the emergency department for evaluation. Her head CT demonstrated a subacute chronic subdural hematoma. She had fallen a month ago and had been seen at the same hospital and was transferred to us then, too, but not as a trauma. Admitted to another service for a few days, she had subsequently been sent to the nursing home with weekly head CT scans for follow-up. Today’s CT showed continued resolution of her subdural hematoma, but since she had fallen and had an abnormal CT scan, she was transferred to us as a trauma for further evaluation.

The patient was elderly, in her 90s, with end-stage dementia. The trauma team descended on her as we do with all traumas – to evaluate for life-threatening injuries. Airway, breathing, circulation. Does she need to be intubated? What is her blood pressure? Place IVs and draw blood. Put her quickly on the monitors, undress her completely. Roll her on her side to examine her back. Make sure she is in a rigid C-collar and cannot move her neck until we are sure it isn’t fractured. She cannot sit up despite her desire to do so, thus requiring us to hold her down, so she doesn’t injure herself or others. In the midst of all this, she kept screaming, "Why do you keep doing this to me?" That was all she said. Repeatedly. As I sorted out the events of the past month, read the radiologist report from the referring institution that documented improvement in her scans, and reviewed all the CTs on disc, I wondered the same, "Why are we doing this to you?" She didn’t need a trauma center or the trauma team. What she needed was a goals of care discussion and POLST (Physician Orders for Life-Sustaining Treatment) document.
We, as doctors, are poor at discussing goals of care. Even for those patients who are expected to do well, we do not address code status, or ask them what they want if things go poorly. Recently, the University of California published their results with a quality improvement program to document advance care planning discussions. Between July 2011 and May 2012 on the medical service, they created an incentive program for documentation of goals of care and identification of a surrogate decision maker. If 75% of patients had the two items documented in the medical record, then the residents received a $400 incentive. Documentation (and likely actual discussion) increased from 22% in July to 90% by October and remained at that level. There were reminders and feedback, and it seems likely a component of peer pressure among the residents to ensure everyone received the incentive. The study did not track outcomes or documentation rates after the program was over. The study did show that behavior of initiating difficult end-of-life (EOL) planning discussions can be improved in a quality improvement program. (JAMA Intern. Med. 2013 [doi: 10.1001/jamainternmed.2013.8158]).
Ideally, the next step would be to document the use of POLST (www.polst.org) orders. POLST is a bright pink form that documents the patient’s preferences for code status, treatment options (full including ICU, limited, or comfort measures including no transport to hospital) artificial nutrition and hydration, and antibiotics. POLST is signed by a physician and, therefore, it can be applied across care settings. If it is signed by the patient, it cannot be overridden by the surrogate, and there are legal protections for health care providers.
We admitted the patient in the trauma bay, not because she needed acute care, but because she needed goals of care defined. We consulted Palliative Medicine and had the social worker identify a decision maker. Palliative Medicine worked with the surrogate decision maker to set goals of care: feeding tube, follow-up scans, code status, and most importantly POLST orders. Regrettably, it took a trip to the Trauma Bay after multiple interactions with the health care system to evaluate what really was in the best interest of the patient and what she would have wanted. She told us as best she could that she did not want what we were doing to her. This time, we listened.
Dr Toevs is a trauma critical care surgeon at Allegheny General Hospital in Pittsburgh, Pa. She has a Masters degree in bioethics and board-certification in hospice and palliative medicine.
She presented to the trauma bay after transfer from another hospital. She had fallen out of bed at the nursing home, and they had sent her to the emergency department for evaluation. Her head CT demonstrated a subacute chronic subdural hematoma. She had fallen a month ago and had been seen at the same hospital and was transferred to us then, too, but not as a trauma. Admitted to another service for a few days, she had subsequently been sent to the nursing home with weekly head CT scans for follow-up. Today’s CT showed continued resolution of her subdural hematoma, but since she had fallen and had an abnormal CT scan, she was transferred to us as a trauma for further evaluation.
The patient was elderly, in her 90s, with end-stage dementia. The trauma team descended on her as we do with all traumas – to evaluate for life-threatening injuries. Airway, breathing, circulation. Does she need to be intubated? What is her blood pressure? Place IVs and draw blood. Put her quickly on the monitors, undress her completely. Roll her on her side to examine her back. Make sure she is in a rigid C-collar and cannot move her neck until we are sure it isn’t fractured. She cannot sit up despite her desire to do so, thus requiring us to hold her down, so she doesn’t injure herself or others. In the midst of all this, she kept screaming, "Why do you keep doing this to me?" That was all she said. Repeatedly. As I sorted out the events of the past month, read the radiologist report from the referring institution that documented improvement in her scans, and reviewed all the CTs on disc, I wondered the same, "Why are we doing this to you?" She didn’t need a trauma center or the trauma team. What she needed was a goals of care discussion and POLST (Physician Orders for Life-Sustaining Treatment) document.
We, as doctors, are poor at discussing goals of care. Even for those patients who are expected to do well, we do not address code status, or ask them what they want if things go poorly. Recently, the University of California published their results with a quality improvement program to document advance care planning discussions. Between July 2011 and May 2012 on the medical service, they created an incentive program for documentation of goals of care and identification of a surrogate decision maker. If 75% of patients had the two items documented in the medical record, then the residents received a $400 incentive. Documentation (and likely actual discussion) increased from 22% in July to 90% by October and remained at that level. There were reminders and feedback, and it seems likely a component of peer pressure among the residents to ensure everyone received the incentive. The study did not track outcomes or documentation rates after the program was over. The study did show that behavior of initiating difficult end-of-life (EOL) planning discussions can be improved in a quality improvement program. (JAMA Intern. Med. 2013 [doi: 10.1001/jamainternmed.2013.8158]).
Ideally, the next step would be to document the use of POLST (www.polst.org) orders. POLST is a bright pink form that documents the patient’s preferences for code status, treatment options (full including ICU, limited, or comfort measures including no transport to hospital) artificial nutrition and hydration, and antibiotics. POLST is signed by a physician and, therefore, it can be applied across care settings. If it is signed by the patient, it cannot be overridden by the surrogate, and there are legal protections for health care providers.
We admitted the patient in the trauma bay, not because she needed acute care, but because she needed goals of care defined. We consulted Palliative Medicine and had the social worker identify a decision maker. Palliative Medicine worked with the surrogate decision maker to set goals of care: feeding tube, follow-up scans, code status, and most importantly POLST orders. Regrettably, it took a trip to the Trauma Bay after multiple interactions with the health care system to evaluate what really was in the best interest of the patient and what she would have wanted. She told us as best she could that she did not want what we were doing to her. This time, we listened.
Dr Toevs is a trauma critical care surgeon at Allegheny General Hospital in Pittsburgh, Pa. She has a Masters degree in bioethics and board-certification in hospice and palliative medicine.

Hospitals Strategies to Reduce Readmissions
With US hospital readmission rates within 30 days of discharge approaching 20%,[1] reducing readmissions has become a national priority. Hospitalists are frequently involved in quality improvement efforts to improve transitions from hospital to home,[2, 3] and they play critical roles in implementing recommended strategies to support effective discharge transitions.[4, 5] Initiatives such as Better Outcomes for Older Adults through Safe Transitions[6] and the adaptable Transitions Tool[7] from the Society of Hospital Medicine provide important approaches and checklists for helping hospitals improve strategies.[8]
In addition to these initiatives, multiple quality collaboratives and campaigns are underway to help hospitals reduce their readmission rates. Two of the more prominent efforts are the STAAR (STate Action on Avoidable Rehospitalization) initiative,[9] a learning collaborative launched in the fall of 2009 and led by the Institute for Healthcare Improvement (IHI) and funded in part by The Commonwealth Fund, and H2H (Hospital‐to‐Home), a national quality campaign led by the American College of Cardiology and IHI with support from several professional associations and partners. Together, these serve more than 1000 hospitals nationally. The STAAR initiative is a state‐based collaborative that partnered with more than 500 community groups across 4 states selected for their diverse readmissions performance and support for improvement efforts, including Massachusetts, Michigan, and Washington. After July 2011, efforts expanded to include Ohio. STAAR was designed to work with leadership at the state level including representatives from hospital associations, government payers, private payers, state governments, provider organizations, employers, and business groups. H2H, in contrast, employs a national quality campaign model and focuses on the care of patients with heart failure or acute myocardial infarction. H2H hospitals are encouraged to participate in a set of H2H Challenges, which provide hospitals with recommended strategies and tools for reducing unnecessary readmission and improve transitions of care. Each Challenge project is 6 to 8 months and consists of success metrics, 3 webinars, and 1 tool kit.
Although previous research has examined strategies used by hospitals enrolled in H2H,10 we know little about strategies used by STAAR hospitals within 1 year of enrollment. Such data across these 2 prominent initiatives at baseline can provide a snapshot of strategies used prior to the major efforts to reduce readmission rates nationally and identify gaps in practice to target for improvement. Furthermore, given the distinct designs of STAAR (a state‐based learning collaborative in selected regions) and H2H (an open, national campaign), future evaluations will likely compare the effectiveness of these alternative approaches for reducing readmissions.
Accordingly, we sought to describe and compare the reported use of recommended strategies to reduce readmission strategies among STAAR and H2H hospitals. Our findings provide a contemporary view of a large set of hospitals working to reduce readmissions. Findings from this study can provide insight into the strategies used by hospitals that enrolled in a state‐based learning collaborative versus a national campaign as well as document a baseline against which future improvements can be measured and evaluated.
METHODS
Study Design and Sample
We conducted a national Web‐based survey of all hospitals that had enrolled in H2H and/or STAAR from May 2009 through June 2010 (n=658 hospitals); the survey was conducted from November 1, 2010 through June 30, 2011 and completed by 599 hospitals (response rate of 91%) (see the survey tool in the Supporting Information, Appendix, in the online version of this article). To initiate contact with each hospital, we emailed the primary liaison person for the initiative at the hospital (n=594 hospitals enrolled in the H2H campaign and n=64 hospitals from Massachusetts, Michigan, and Washington enrolled in STAAR). Respondents were instructed to coordinate with other relevant staff to complete a single survey reflecting the hospital's response. Of the total 658 hospitals, 599 completed the survey, for a response rate of 91%. A total of 532 of these 599 hospitals were enrolled in H2H, 55 hospitals were enrolled in STAAR, and 12 hospitals were enrolled in both STAAR and H2H. We excluded the 12 hospitals that were enrolled in both campaigns from our analysis. All research procedures were approved by the institutional review board at the Yale School of Medicine.
Measures
We examined hospital strategies in 3 areas: quality improvement resources and performance monitoring, medication management, and discharge and follow‐up procedures. In addition, consistent with our earlier work,[10] we summarized strategies using an index of 10 specific strategies across the 3 domains. The first domain (quality improvement resources and performance monitoring) includes having a quality improvement team for reducing readmissions for heart failure, or for acute myocardial infarction, or for both; monitoring the percent of patients with follow‐up appointments within 7 days of discharge; and monitoring 30‐day readmission rates. The second domain (medication management) includes providing patient education about the purpose of each medication and any alterations to the medication list, having a pharmacist primarily responsible for conducting medication reconciliation at discharge, and having a pharmacy technician primarily responsible for obtaining medication history as part of medication reconciliation process. The third domain (discharge and follow‐up procedures) includes discharge processes in which patients or their caregivers receive an emergency plan, patients usually or always leave the hospital with an outpatient follow‐up appointment already arranged, a process is in place to ensure the outpatient physicians are alerted to the patient's discharge status within 48 hours of discharge, and patients are called after discharge to follow up on postdischarge needs or to provide additional patient education. The summary score ranged from 0 to 10, and its items are supported by a number of studies,[3, 11, 12, 13, 14, 15, 16, 17, 18, 19, 20, 21, 22, 23, 24, 25, 26, 27, 28] although definitive evidence on their effectiveness is lacking.
We also examined hospital characteristics including the number of staffed hospital beds, teaching status (hospital that is a member of Council of Teaching Hospitals [COTH], non‐COTH teaching hospital with residency approved by the Accreditation Council for Graduate Medical Education, or nonteaching hospital), multihospital affiliation (yes or no), and ownership (for profit, nonprofit, or government) using data from the Annual Survey of the American Hospital Association from 2009. We determined census regions from the US Census Bureau and urban/suburban/rural location from the 2003 Urban Influence Codes. Hospital 30‐day risk‐standardized readmission rates (RSRRs) were derived from the most recent year of data (July 2010 to June 2011) collected by the Centers for Medicare and Medicaid Services (CMS). RSRRs were calculated using the statistical model as specified by the CMS for public reporting of 30‐day RSRRs.[29, 30]
Data Analysis
We used standard frequency analysis to describe the sample of hospitals, the prevalence of each hospital strategy, and the distribution of summary variables, for both H2H and the STAAR hospitals. We examined the statistical significance of differences between the reported use of strategies to reduce readmissions in H2H versus STARR hospitals using logistic and linear regression, adjusted for hospital characteristics that differed significantly between the 2 groups in the bivariate analyses (ownership type and census region). We adjusted for hospital characteristics to isolate the independent association between the initiative (H2H or STAAR) and hospital strategies being employed. This was important given the significant differences in types of hospitals (by ownership and census region) in the H2H versus STAAR initiatives and reported variation of strategies used by hospital characteristics. Because hospitals completed the questionnaire at different times during the survey period, we adjusted for month of survey completion, but this variable was nonsignificant and therefore eliminated from the final model. We employed P<0.01 as our significance level to adjust for multiple comparisons conducted. This research was funded by the Commonwealth Fund, which had no influence on the methodology, findings, or interpretation. All analyses were conducted in SAS version 9.3 (SAS Institute Inc., Cary, NC).
RESULTS
Characteristics of Hospital Sample
Of the 587 hospitals in our sample, 55 hospitals (9%) were enrolled in STAAR and 532 hospitals (91%) were enrolled in H2H. The roles reported by respondents varied, and many respondents reported having more than 1 role; nearly 60% were from quality management departments, 24% were from cardiology departments, 24% had other clinical roles, 17% were from case management or care coordination, and 7% reported working in nonclinical roles. Hospital characteristics are reported in Table 1.
| Characteristic | H2H, N=532 | STAAR, N=55 | 2 P Value |
|---|---|---|---|
| |||
| Teaching status, N (%) | 0.185 | ||
| COTH teaching | 70 (13.2) | 12 (22.2) | |
| Non‐COTH teaching | 105 (19.7) | 9 (16.7) | |
| Nonteaching | 357 (67.1) | 33 (61.1) | |
| Number of staffed beds, N (%) | 0.598 | ||
| <200 beds | 180 (34.2) | 22 (42.3) | |
| 200399 beds | 199 (37.8) | 19 (36.5) | |
| 400599 beds | 90 (17.1) | 6 (11.5) | |
| 600+ beds | 58 (11.0) | 5 (9.6) | |
| Mean (SD) | 315 (218) | 254 (206) | 0.056a |
| Census region, N (%) | <0.001 | ||
| New England | 21 (4.0) | 14 (26.4) | |
| Middle Atlantic | 58 (10.9) | 0 | |
| East North Central | 95 (17.9) | 27 (50.9) | |
| West North Central | 45 (8.5) | 0 | |
| South Atlantic | 122 (23.0) | 0 | |
| East South Central | 52 (9.8) | 0 | |
| West South Central | 54 (10.2) | 0 | |
| Mountain | 33 (6.2) | 0 | |
| Pacific | 50 (9.4) | 12 (22.6) | |
| Puerto Rico | 1 (0.2) | 0 | |
| Geographic location, N (%) | 0.184 | ||
| Urban | 451 (85.1) | 40 (75.5) | |
| Suburban | 53 (10.0) | 9 (17.0) | |
| Rural | 26 (4.9) | 4 (7.6) | |
| Ownership type, N (%) | <0.001 | ||
| For profit | 129 (24.3) | 1 (1.9) | |
| Nonprofit | 355 (66.9) | 44 (83.0) | |
| Government | 47 (8.9) | 8 (15.1) | |
| Multihospital affiliation, N (%) | 0.032 | ||
| Yes | 385 (72.5) | 31 (58.5) | |
| No | 146 (27.5) | 22 (41.5) | |
| Risk‐standardized readmission rate (per 100 patients)b | |||
| For patients with HF, Mean (SD) | 24.7 (0.06) | 25.1 (0.06) | 0.088a |
| For patients with AMI, Mean (SD) | 19.5 (0.06) | 19.6 (0.07) | 0.722a |
Hospital Strategies to Reduce Readmission Rates
Many hospitals were not implementing recommended strategies at the time of enrollment. Only 52.7% of STAAR hospitals and 53.4% of H2H hospitals had a quality improvement team devoted to reducing readmissions for patients with AMI (Table 2). Half or fewer hospitals in either initiative reported that they monitored the proportion of discharge summaries sent to the primary care physician or the percent of patients with follow‐up appointments within 7 days. Less than 20% of hospitals in either initiative were monitoring readmissions to another hospital (Table 2). Most hospitals in STAAR and in H2H did not have the pharmacists responsible for medication reconciliation, with most assigning nurses this task, and few employed a third‐party database regularly for checking historical fill and current refill information (Table 3). In both initiatives, a small minority of hospitals reported that patients were always discharged with a follow‐up appointment already made, and less than half of hospitals had assigned someone to follow up on test results that return after the patient was discharged (Table 4).
| H2H, N=532 | STAAR, N=55 | |
|---|---|---|
| ||
| Hospital has reducing preventable readmissions as a written objective | ||
| Strongly agree/agree | 478 (89.9%) | 53 (96.4%) |
| Not sure/disagree/strongly disagree | 54 (10.2%) | 2 (3.6%) |
| Hospital has a reliable process in place to identify patients with HF at the time they are admitted | 438 (82.6%) | 50 (90.9%) |
| Hospital has quality improvement teams devoted to reducing preventable readmissions for patients with HF | 462 (86.8%) | 49 (89.1%) |
| Hospital has quality improvement teams devoted to reducing preventable readmissions for patients with AMI | 284 (53.4%) | 29 (52.7%) |
| Hospital has a multidisciplinary team to manage the care of patients who are at high risk of readmission | 299 (56.4%) | 42 (76.4%)a |
| Hospital has partnered with the following to reduce readmission rates | ||
| Community homecare agencies and/or skilled nursing facilities | 358 (67.6%) | 48 (87.3%)a |
| Community physicians or physician groups | 262 (49.6%) | 42 (76.4%)a |
| Other local hospitals | 123 (23.3%) | 23 (41.8%)a |
| Hospital tracks the following for quality improvement efforts: | ||
| Timeliness of discharge summary | 373 (70.6%) | 40 (72.7%) |
| Proportion of discharge summaries sent to primary physician | 121 (23.0%) | 17 (31.5%) |
| Percent of patients discharged with follow‐up appointment 7 days | 168 (31.9%) | 27 (50.0%) |
| Accuracy of medication reconciliation | 385 (72.9%) | 36 (66.7%) |
| 30‐day readmission rate | 499 (94.5%) | 54 (98.2%) |
| Early (<7 day) readmission rate | 293 (55.5%) | 26 (48.2%)a |
| Proportion of patients readmitted to another hospital | 61 (11.6%) | 9 (16.7%) |
| Has a designated person or group to review unplanned readmissions that occur within 30 days of the original discharge | 338 (63.9%) | 43 (78.2%) |
| Estimates risk of readmission in a formal way and uses it in clinical care during patient hospitalization | 118 (22.3%) | 22 (40.0%)a |
| H2H, N=532 | STAAR, N=55 | |
|---|---|---|
| ||
| Who is responsible for medication reconciliation at discharge? | ||
| Nurse | ||
| Never | 53 (10.0%) | 12 (22.2%)b |
| Sometimes | 51 (9.6%) | 13 (24.1%) |
| Usually | 49 (9.3%) | 5 (9.3%) |
| Always | 376 (71.1%) | 24 (44.4%) |
| Pharmacist | ||
| Never | 309 (58.5%) | 30 (55.6%) |
| Sometimes | 163 (30.9%) | 21 (38.9%) |
| Usually | 21 (4.0%) | 1 (1.9%) |
| Always | 35 (6.6%) | 2 (3.7%) |
| Responsibility is not formally assigned | ||
| Never | 453 (86.1%) | 41 (77.4%) |
| Sometimes | 23 (4.4%) | 6 (11.3%) |
| Usually | 21 (4.0%) | 4 (7.6%) |
| Always | 29 (5.5%) | 2 (3.8%) |
| Tools in place to facilitate medication reconciliationc | ||
| Paper‐based standardization form | 290 (54.5%) | 31 (56.4%) |
| Electronic medical record/Web‐based form | 392 (73.7%) | 38 (69.1%) |
| How often does each of the following occur as part of the medication reconciliation process at your hospital? | ||
| Emergency medicine staff obtains medication history | ||
| Never | 3 (0.6%) | 0 |
| Sometimes | 39 (7.4%) | 5 (9.1%) |
| Usually | 152 (28.7%) | 20 (36.4%) |
| Always | 336 (63.4%) | 30 (54.6%) |
| Admitting medical team obtains medication history | ||
| Never | 8 (1.5%) | 1 (1.8%) |
| Sometimes | 33 (6.2%) | 6 (10.9%) |
| Usually | 97 (18.3%) | 15 (27.3%) |
| Always | 392 (74.0%) | 33 (60.0%) |
| Pharmacist or pharmacy technician obtains medication history | ||
| Never | 244 (46.1%) | 19 (34.6%) |
| Sometimes | 160 (30.3%) | 16 (29.1%) |
| Usually | 47 (8.9%) | 10 (18.2%) |
| Always | 78 (14.7%) | 10 (18.2%) |
| Contact is made with outside pharmacies | ||
| Never | 76 (14.4%) | 3 (5.5%) |
| Sometimes | 366 (69.3%) | 42 (76.4%) |
| Usually | 69 (13.1%) | 6 (10.9%) |
| Always | 17 (3.2%) | 4 (7.3%) |
| Contact is made with primary physician | ||
| Never | 27 (5.1%) | 2 (3.6%) |
| Sometimes | 280 (52.9%) | 30 (54.6%) |
| Usually | 148 (28.0%) | 18 (32.7%) |
| Always | 74 (14.0%) | 5 (9.1%) |
| Outpatient and inpatient prescription records are linked electronically | ||
| Never | 324 (61.4%) | 28 (50.9%) |
| Sometimes | 91 (17.2%) | 14 (25.5%) |
| Usually | 61 (11.6%) | 8 (14.6%) |
| Always | 52 (9.9%) | 5 (9.1%) |
| Third‐party prescription database that provides historical fill and refill information (eg, Health Care Systems) | ||
| Never | 441 (83.5%) | 37 (67.3%) |
| Sometimes | 54 (10.2%) | 10 (18.2%) |
| Usually | 14 (2.7%) | 4 (7.3%) |
| Always | 19 (3.6%) | 4 (7.3%) |
| All patients (or their caregivers) receive at the time of discharge information about the purpose of each medication, which medications are new, which medications have changed in dose or frequency, and/or which medications are to be stopped | 407 (76.9%) | 35 (63.6%) |
| Hospital promotes use of teach‐back techniques (having the patient teach new information back to educator) | 371 (69.9%) | 48 (87.3%)a |
| H2H, N=532 | STAAR, N=55 | |
|---|---|---|
| ||
| For all patients | ||
| All patients (or their caregivers) receive the following in written form at the time of discharge: | ||
| Discharge instructions | 485 (91.3%) | 45 (81.8%) |
| Names, doses, and frequency of all discharge medications | 463 (87.4%) | 42 (76.4%) |
| Educational information about heart failure, when relevant | 385 (72.5%) | 37 (67.3%) |
| Symptoms that prompt an immediate call to a physician or return to hospital | 352 (66.4%) | 33 (60.0%) |
| Educational information about AMI | 348 (65.5%) | 36 (66.7%) |
| Any type of emergency plana | 312 (58.8%) | 26 (47.3%) |
| Action plan for heart failure patients for managing changes in condition | 282 (53.1%) | 28 (50.9%) |
| Personal health record | 139 (26.3%) | 23 (41.8%) |
| Discharge summary | 104 (19.6%) | 12 (21.8%) |
| Patients are discharged from the hospital with an outpatient follow‐up appointment already arranged | ||
| Never | 20 (3.8%) | 1 (1.8%) |
| Sometimes | 222 (41.9%) | 26 (47.3%) |
| Usually | 233 (44.0%) | 26 (47.3%) |
| Always | 55 (10.4%) | 2 (3.6%) |
| Patients with home health services are provided direct contact information for a specific inpatient physician in case of questions | 249 (47.1%) | 35 (63.6%) |
| Process is in place to ensure outpatient physicians are alerted to the patient's discharge within 48 hours of discharge | 199 (37.6%) | 37 (67.3%)b |
| Proportion of patients for whom a paper or electronic discharge summary is sent directly to the patient's primary physician | ||
| None | 43 (8.1%) | 3 (5.5%) |
| Some | 153 (28.9%) | 14 (25.5%) |
| Most | 200 (37.8%) | 18 (32.7%) |
| All | 133 (25.1%) | 20 (36.4%) |
| Patient's discharge summary typically completed and available for viewing | ||
| Upon discharge | 42 (8.0%) | 5 (9.1%) |
| Within 48 hours of discharge | 222 (42.1%) | 33 (60.0%) |
| Within 7 days | 94 (17.8%) | 10 (18.2%) |
| Within 30 days | 157 (29.7%) | 7 (12.7%) |
| There are no explicit goals or policies defining a time‐frame for completing the discharge summary | 13 (2.5%) | 0 |
| Someone in the hospital is assigned to follow up on test results that return after the patient is discharged | 191 (36.2%) | 27 (49.1%) |
| Patients are regularly called after discharge to either follow up on postdischarge needs or to provide additional education | 334 (63.0%) | 38 (69.1%) |
| Home visits are arranged for all or most patients after discharge | 114 (21.5%) | 9 (16.4%) |
| After discharge, patients: | ||
| Receive telemonitoring | ||
| None | 241 (45.5%) | 12 (21.8%)a |
| Some | 265 (50.0%) | 41 (74.6%) |
| Most | 23 (4.3%) | 1 (1.8%) |
| All | 1 (0.2%) | 1 (1.8%) |
| Receive referrals to cardiac rehabilitation | ||
| None | 27 (5.1%) | 4 (7.4%)b |
| Some | 190 (36.0%) | 28 (51.9%) |
| Most | 203 (38.5%) | 17 (31.5%) |
| All | 108 (20.5%) | 5 (9.3%) |
| Are enrolled in chronic disease management programs | ||
| None | 161 (30.4%) | 13 (23.6%) |
| Some | 321 (60.7%) | 34 (61.8%) |
| Most | 41 (7.8%) | 7 (12.7%) |
| All | 6 (1.1%) | 1 (1.8%) |
| For patients transferred to skilled nursing facilities | ||
| Nurse‐to‐nurse report is always conducted prior to transfer | 326 (61.5%) | 22 (40.0%)a |
| Information always provided to the facility upon discharge | ||
| Completed discharge summary | 252 (47.6%) | 27 (49.1%) |
| Reconciled medication list | 436 (82.3%) | 46 (83.6%) |
| Medication administration record | 352 (66.4%) | 38 (69.1%) |
| Direct contact number of inpatient treating physician | 180 (34.0%) | 29 (52.7%)b |
Differences in the use of strategies by STAAR versus H2H hospitals were significant (P<0.01) in unadjusted analysis for several strategies that were attenuated and nonsignificant after adjustment for census region and ownership type (Tables 24). STAAR compared with H2H hospitals were more likely to have: (1) used a multidisciplinary team to care for patients at high risk of readmission, (2) partnered with community homecare agencies and/or skilled nursing facilities, (3) partnered with community physicians or physician groups, (4) partnered with other local hospitals to reduce preventable readmissions, (5) estimated risk of readmission in a formal way and used it in clinical care, (6) used teach‐back techniques, and (7) used telemonitoring. In contrast, H2H hospitals were more likely than STAAR hospitals to have monitored 7‐day readmission rates and to have conducted nurse‐to‐nurse report usually or always prior to discharge to nursing home facilities.
In multivariable analysis, STAAR and H2H hospitals differed significantly (P<0.01) for 4 additional strategies. STAAR hospitals were more likely to have (1) ensured outpatient physicians were alerted within 48 hours of patient discharge, and (2) provided skilled nursing facilities the direct contact number of the inpatient treating physician for patients transferred. H2H hospitals were more likely to have (1) assigned responsibility for medication reconciliation to nurses, and (2) referred discharged patients to cardiac rehabilitation services.
DISCUSSION
We found that many hospitals enrolled in the STAAR or the H2H initiative were not implementing strategies commonly recommended to reduce readmission in 2010 to 2011, indicating substantial opportunities for improvement. The gaps were apparent among both the STAAR and the H2H hospitals. Previous literature has shown that discharged patients often do not have timely posthospitalization follow‐up visits, and that discharge summaries are infrequently completed prior to the follow‐up visit.[4, 19, 31] Studies have also demonstrated weaknesses in the medication reconciliation process[32] and overall communication between hospital‐based and primary care physicians.[33, 34] Our survey adds to this existing literature by employing a more comprehensive survey of hospital strategies and reporting results for a larger, national sample of hospitals.
Encouraging the use of strategies recommended by quality initiatives is difficult for several reasons. First, the evidence base for their effectiveness is not yet solid, making it difficult for institutions to prioritize and select interventions and to foster enthusiasm for change. Second, the organizational challenges of these interventions are often substantial, requiring coordination across disciplines, departments, and settings (hospital, home, nursing facility). Third, some literature suggests[3] that multipronged strategies may be most effective, increasing the complexity of readmission reduction activities. Last, important financial barriers must be overcome, including the cost of interventions as well as lost revenue from reduced readmissions. Input from hospitalists who are often critical links among inpatient and outpatient care and between patients and their families is strongly needed to ensure hospitals focus on what strategies are most effective for successful transitions from hospital to home.
The prevalence of several strategies differed between STAAR and H2H hospitals; however, these differences were largely attenuated by geographic region. The finding that significant differences among hospitals in strategies was explained in large part by geographical region is consistent with previous research that has documented substantial regional differences in many kinds of practice patterns[35, 36, 37] as well as geographic differences in readmission rates.[38, 39, 40] The results suggest regionally focused initiatives may be most effective in tailoring interventions to practice needs and norms within specific areas.
Among the strategies that differed significantly between the hospitals in STAAR compared with H2H, the variation may be attributable in part to the focus of the initiatives themselves. For instance, 1 strategy that was significantly more prevalent among H2H compared with STAAR hospitals is central to the quality of care for patients with heart failure and acute myocardial infarction, the focus of H2H: referral patterns to cardiac rehabilitation services after discharge. H2H hospitals may have been particularly attuned to this practice, as H2H focused on cardiovascular‐related readmissions, whereas STAAR focused on all readmissions.
The study has several limitations. First, data were self‐reported, and we did not have the resources to verify these reports with onsite evaluations. Nevertheless, the methods for obtaining the data were the same for H2H and STAAR hospitals, and therefore measurement errors are unlikely to have varied systematically between the 2 groups of hospitals. Second, a single respondent at each hospital completed the survey; however, we did instruct respondents to attain information from a broad range of relevant staff to reflect a more comprehensive perspective in the survey. Third, the sample size of STAAR hospitals was modest and therefore may have lacked statistical power to detect important differences; however, we did include all hospitals that had enrolled in STAAR by the study date. Fourth, hospitals that enrolled in STAAR and H2H initiatives represent a selected group, and results may differ among nonenrolled hospitals. Last, we have data on strategies used during the 2010 to 2011 time frame and therefore cannot evaluate the impact of the quality initiatives from these baseline data. Studies that examine the associations between changes in the use of strategies and subsequent changes in readmission rates would be valuable. Nevertheless, this study establishes a baseline against which future progress can be evaluated.
In sum, we found that many STAAR and H2H hospitals were not implementing many of the recommended strategies for reducing readmissions as of 2010 to 2011, suggesting continued opportunities for improvement. Hospitalists will have opportunities to play leadership roles as hospitals look for meaningful ways to reduce readmissions. At the same time, although hospitalists have a key role in implementing hospital‐based programs, much of the care transitions work must also engage teams across the continuum of care. Furthermore, priority should be given to augmenting the evidence base about which strategies are most effective in reducing readmissions, as this evidence is currently underdeveloped.
Disclosures
This work was funded by the Commonwealth Fund and the Donaghue Foundation. Dr. Krumholz is supported by grant U01 HL105270‐03 (Center for Cardiovascular Outcomes Research at Yale University) from the National Heart, Lung, and Blood Institute in Bethesda, Maryland. Dr. Horwitz is supported by the National Institute on Aging (K08 AG038336) and by the American Federation for Aging Research through the Paul B. Beeson Career Development Award Program. Dr. Horwitz is also a Pepper Scholar with support from the Claude D. Pepper Older Americans Independence Center at Yale University School of Medicine (#P30AG021342 NIH/NIA). Dr. Krumholz discloses that he is the recipient of a research grant from Medtronic, Inc. through Yale University and is chair of a cardiac scientific advisory board for UnitedHealth.
- , , . Rehospitalizations among patients in the Medicare fee‐for‐service program. N Engl J Med. 2009;360:1418–1428.
- , , , , . “Learning by doing”—resident perspectives on developing competency in high‐quality discharge care. J Gen Intern Med. 2012;27:1188–1194.
- , , , , . Interventions to reduce 30‐day rehospitalization: a systematic review. Ann Intern Med. 2011;155:520–528.
- , , , . Promoting effective transitions of care at hospital discharge: a review of key issues for hospitalists. J Hosp Med. 2007;2:314–323.
- . The role of the hospitalist in quality improvement: systems for improving the care of patients with acute coronary syndrome. J Hosp Med. 2010;5(suppl 4):S1–S7.
- Society of Hospital Medicine. Project BOOST: Better Outcomes by Optimizing Safe Transitions Available at: http://www.hospitalmedicine.org/ResourceRoomRedesign/RR_CareTransitions/CT_Home.cfm. Accessed January 19, 2013.
- Society of Hospital Medicine. The BOOST Tools. Available at: http://www.hospitalmedicine.org/ResourceRoomRedesign/RR_CareTransitions/html_CC/06Boost/07_Boost_Tools.cfm. Accessed January 19, 2013.
- , , , et al. Transition of care for hospitalized elderly patients—development of a discharge checklist for hospitalists. J Hosp Med. 2006;1:354–360.
- Institute for Healthcare Improvement. Overview: STate action on avoidable rehospitalizations (STAAR) initiative. Available at: http://www.ihi.org/offerings/Initiatives/STAAR/Pages/default.aspx. Accessed February 20, 2010.
- , , , et al. Contemporary evidence about hospital strategies for reducing 30‐day readmissions: a national study. J Am Coll Cardiol. 2012;60:607–614.
- , , . Effectiveness and feasibility of pharmacist‐led admission medication reconciliation for geriatric patients. J Pharm Pract. 2012;25:136–141.
- , , , et al. Effect of admission medication reconciliation on adverse drug events from admission medication changes. Arch Intern Med. 2011;171:860–861.
- , , , . Potential risk of medication discrepancies and reconciliation errors at admission and discharge from an inpatient medical service. Ann Pharmacother. 2010;44:1747–1754.
- , . Measuring patient safety performance. In: Spath PL, ed. Error Reduction in Health Care: A Systems Approach to Improving Patient Safety. 2nd ed. Hoboken, NJ: Jossey‐Bass; 2010:59–102.
- , . Analyzing patient safety performance. In: Spath PL, ed. Error Reduction in Health Care: A Systems Approach to Improving Patient Safety. 2nd ed. Hoboken, NJ: Jossey‐Bass; 2010:103–118.
- , . Pharmacists' medication reconciliation‐related clinical interventions in a children's hospital. Jt Comm J Qual Patient Saf. 2009;35:278–282.
- , , , et al. Results of the Medications at Transitions and Clinical Handoffs (MATCH) study: an analysis of medication reconciliation errors and risk factors at hospital admission. J Gen Intern Med. 2010;25:441–447.
- , , BS, . Pharmacist‐conducted medication reconciliation in an emergency department. Am J Health Syst Pharm. 2007;64:1720–1723.
- , , , et al. Relationship between early physician follow‐up and 30‐day readmission among Medicare beneficiaries hospitalized for heart failure. JAMA. 2010;303:1716–1722.
- , , , et al. A reengineered hospital discharge program to decrease rehospitalization: a randomized trial. Ann Intern Med. 2009;150:178–187.
- , , , et al. Randomized trial of an education and support intervention to prevent readmission of patients with heart failure. J Am Coll Cardiol. 2002;39:83–89.
- . Using performance data to prioritize safety improvements. In: Spath PL, ed. Error Reduction in Health Care: A Systems Approach to Improving Patient Safety. 2nd ed. Hoboken, NJ: Jossey‐Bass; 2010:119–142.
- , . Medication reconciliation at an academic medical center: Implementation of a comprehensive program from admission to discharge. Emer Med J. 2010;27:911–915.
- , , , , . Medication reconciliation at an academic medical center: implementation of a comprehensive program from admission to discharge. Am J Health Syst Pharm. 2009;66:2126–2131.
- National Quality Forum (NQF). Safe practices for better healthcare—2010 update: A consensus report. 2010. Available at: http://www. qualityforum.org/Publications/2010/04/Safe_Practices_for_Better_Health care_%Ed%80%93_2010_Update.aspx. Accessed September 28, 2012.
- , , , et al. Role of pharmacist counseling in preventing adverse drug events after hospitalization. Arch Intern Med. 2006;166:565–571.
- , , , et al. Medication history reconciliation by clinical pharmacists in elderly inpatients admitted from home or a nursing home. Ann Pharmacother. 2010;44:1596–1603.
- , , . A review of the literature on heart failure and discharge education. Crit Care Nurs Q. 2011;34:235–245.
- , , , et al. An administrative claims measure suitable for profiling hospital performance on the basis of 30‐day all‐cause readmission rates among patients with heart failure. Circ Cardiovasc Qual Outcomes. 2008;1:29–37.
- , , , et al. An administrative claims measure suitable for profiling hospital performance based on 30‐day all‐cause readmission rates among patients with acute myocardial infarction. Circ Cardiovasc Qual Outcomes. 2011;4:243–252.
- , , , et al. Comprehensive quality of discharge summaries at an academic medical center [published online ahead of print [March 22, 2013]. J Hosp Med. doi: 10.1002/jhm.2021.
- , , , et al. Quality of discharge practices and patient understanding at an academic medical center. JAMA Intern Med. In press.
- , , , et al. Association of communication between hospital‐based physicians and primary care providers with patient outcomes. J Gen Intern Med. 2009;24:381–386.
- , , , et al. Patient‐physician communication at hospital discharge and patients' understanding of the postdischarge treatment plan. Arch Intern Med. 1997;157:1026–1030.
- , , , , , . Quality of care for acute myocardial infarction in rural and urban US hospitals. J Rural Health. 2004;20:99–108.
- , , , , . Regional variation in the treatment and outcomes of myocardial infarction: investigating New England's advantage. Am Heart J. 2003;146:242–249.
- , , , , . Outcomes of percutaneous coronary interventions performed at centers without and with onsite coronary artery bypass graft surgery. JAMA. 2004;292:1961–1968.
- , , , et al. Patterns of hospital performance in acute myocardial infarction and heart failure 30‐day mortality and readmission. Circ Cardiovasc Qual Outcomes. 2009;2:407–413.
- , , , et al. Recent national trends in readmission rates after heart failure hospitalization. Circ Heart Fail. 2010;3:97–103.
- , , , et al. National patterns of risk‐standardized mortality and readmission for acute myocardial infarction and heart failure. Update on publicly reported outcomes measures based on the 2010 release. Circ Cardiovasc Qual Outcomes. 2010;3:459–467.
With US hospital readmission rates within 30 days of discharge approaching 20%,[1] reducing readmissions has become a national priority. Hospitalists are frequently involved in quality improvement efforts to improve transitions from hospital to home,[2, 3] and they play critical roles in implementing recommended strategies to support effective discharge transitions.[4, 5] Initiatives such as Better Outcomes for Older Adults through Safe Transitions[6] and the adaptable Transitions Tool[7] from the Society of Hospital Medicine provide important approaches and checklists for helping hospitals improve strategies.[8]
In addition to these initiatives, multiple quality collaboratives and campaigns are underway to help hospitals reduce their readmission rates. Two of the more prominent efforts are the STAAR (STate Action on Avoidable Rehospitalization) initiative,[9] a learning collaborative launched in the fall of 2009 and led by the Institute for Healthcare Improvement (IHI) and funded in part by The Commonwealth Fund, and H2H (Hospital‐to‐Home), a national quality campaign led by the American College of Cardiology and IHI with support from several professional associations and partners. Together, these serve more than 1000 hospitals nationally. The STAAR initiative is a state‐based collaborative that partnered with more than 500 community groups across 4 states selected for their diverse readmissions performance and support for improvement efforts, including Massachusetts, Michigan, and Washington. After July 2011, efforts expanded to include Ohio. STAAR was designed to work with leadership at the state level including representatives from hospital associations, government payers, private payers, state governments, provider organizations, employers, and business groups. H2H, in contrast, employs a national quality campaign model and focuses on the care of patients with heart failure or acute myocardial infarction. H2H hospitals are encouraged to participate in a set of H2H Challenges, which provide hospitals with recommended strategies and tools for reducing unnecessary readmission and improve transitions of care. Each Challenge project is 6 to 8 months and consists of success metrics, 3 webinars, and 1 tool kit.
Although previous research has examined strategies used by hospitals enrolled in H2H,10 we know little about strategies used by STAAR hospitals within 1 year of enrollment. Such data across these 2 prominent initiatives at baseline can provide a snapshot of strategies used prior to the major efforts to reduce readmission rates nationally and identify gaps in practice to target for improvement. Furthermore, given the distinct designs of STAAR (a state‐based learning collaborative in selected regions) and H2H (an open, national campaign), future evaluations will likely compare the effectiveness of these alternative approaches for reducing readmissions.
Accordingly, we sought to describe and compare the reported use of recommended strategies to reduce readmission strategies among STAAR and H2H hospitals. Our findings provide a contemporary view of a large set of hospitals working to reduce readmissions. Findings from this study can provide insight into the strategies used by hospitals that enrolled in a state‐based learning collaborative versus a national campaign as well as document a baseline against which future improvements can be measured and evaluated.
METHODS
Study Design and Sample
We conducted a national Web‐based survey of all hospitals that had enrolled in H2H and/or STAAR from May 2009 through June 2010 (n=658 hospitals); the survey was conducted from November 1, 2010 through June 30, 2011 and completed by 599 hospitals (response rate of 91%) (see the survey tool in the Supporting Information, Appendix, in the online version of this article). To initiate contact with each hospital, we emailed the primary liaison person for the initiative at the hospital (n=594 hospitals enrolled in the H2H campaign and n=64 hospitals from Massachusetts, Michigan, and Washington enrolled in STAAR). Respondents were instructed to coordinate with other relevant staff to complete a single survey reflecting the hospital's response. Of the total 658 hospitals, 599 completed the survey, for a response rate of 91%. A total of 532 of these 599 hospitals were enrolled in H2H, 55 hospitals were enrolled in STAAR, and 12 hospitals were enrolled in both STAAR and H2H. We excluded the 12 hospitals that were enrolled in both campaigns from our analysis. All research procedures were approved by the institutional review board at the Yale School of Medicine.
Measures
We examined hospital strategies in 3 areas: quality improvement resources and performance monitoring, medication management, and discharge and follow‐up procedures. In addition, consistent with our earlier work,[10] we summarized strategies using an index of 10 specific strategies across the 3 domains. The first domain (quality improvement resources and performance monitoring) includes having a quality improvement team for reducing readmissions for heart failure, or for acute myocardial infarction, or for both; monitoring the percent of patients with follow‐up appointments within 7 days of discharge; and monitoring 30‐day readmission rates. The second domain (medication management) includes providing patient education about the purpose of each medication and any alterations to the medication list, having a pharmacist primarily responsible for conducting medication reconciliation at discharge, and having a pharmacy technician primarily responsible for obtaining medication history as part of medication reconciliation process. The third domain (discharge and follow‐up procedures) includes discharge processes in which patients or their caregivers receive an emergency plan, patients usually or always leave the hospital with an outpatient follow‐up appointment already arranged, a process is in place to ensure the outpatient physicians are alerted to the patient's discharge status within 48 hours of discharge, and patients are called after discharge to follow up on postdischarge needs or to provide additional patient education. The summary score ranged from 0 to 10, and its items are supported by a number of studies,[3, 11, 12, 13, 14, 15, 16, 17, 18, 19, 20, 21, 22, 23, 24, 25, 26, 27, 28] although definitive evidence on their effectiveness is lacking.
We also examined hospital characteristics including the number of staffed hospital beds, teaching status (hospital that is a member of Council of Teaching Hospitals [COTH], non‐COTH teaching hospital with residency approved by the Accreditation Council for Graduate Medical Education, or nonteaching hospital), multihospital affiliation (yes or no), and ownership (for profit, nonprofit, or government) using data from the Annual Survey of the American Hospital Association from 2009. We determined census regions from the US Census Bureau and urban/suburban/rural location from the 2003 Urban Influence Codes. Hospital 30‐day risk‐standardized readmission rates (RSRRs) were derived from the most recent year of data (July 2010 to June 2011) collected by the Centers for Medicare and Medicaid Services (CMS). RSRRs were calculated using the statistical model as specified by the CMS for public reporting of 30‐day RSRRs.[29, 30]
Data Analysis
We used standard frequency analysis to describe the sample of hospitals, the prevalence of each hospital strategy, and the distribution of summary variables, for both H2H and the STAAR hospitals. We examined the statistical significance of differences between the reported use of strategies to reduce readmissions in H2H versus STARR hospitals using logistic and linear regression, adjusted for hospital characteristics that differed significantly between the 2 groups in the bivariate analyses (ownership type and census region). We adjusted for hospital characteristics to isolate the independent association between the initiative (H2H or STAAR) and hospital strategies being employed. This was important given the significant differences in types of hospitals (by ownership and census region) in the H2H versus STAAR initiatives and reported variation of strategies used by hospital characteristics. Because hospitals completed the questionnaire at different times during the survey period, we adjusted for month of survey completion, but this variable was nonsignificant and therefore eliminated from the final model. We employed P<0.01 as our significance level to adjust for multiple comparisons conducted. This research was funded by the Commonwealth Fund, which had no influence on the methodology, findings, or interpretation. All analyses were conducted in SAS version 9.3 (SAS Institute Inc., Cary, NC).
RESULTS
Characteristics of Hospital Sample
Of the 587 hospitals in our sample, 55 hospitals (9%) were enrolled in STAAR and 532 hospitals (91%) were enrolled in H2H. The roles reported by respondents varied, and many respondents reported having more than 1 role; nearly 60% were from quality management departments, 24% were from cardiology departments, 24% had other clinical roles, 17% were from case management or care coordination, and 7% reported working in nonclinical roles. Hospital characteristics are reported in Table 1.
| Characteristic | H2H, N=532 | STAAR, N=55 | 2 P Value |
|---|---|---|---|
| |||
| Teaching status, N (%) | 0.185 | ||
| COTH teaching | 70 (13.2) | 12 (22.2) | |
| Non‐COTH teaching | 105 (19.7) | 9 (16.7) | |
| Nonteaching | 357 (67.1) | 33 (61.1) | |
| Number of staffed beds, N (%) | 0.598 | ||
| <200 beds | 180 (34.2) | 22 (42.3) | |
| 200399 beds | 199 (37.8) | 19 (36.5) | |
| 400599 beds | 90 (17.1) | 6 (11.5) | |
| 600+ beds | 58 (11.0) | 5 (9.6) | |
| Mean (SD) | 315 (218) | 254 (206) | 0.056a |
| Census region, N (%) | <0.001 | ||
| New England | 21 (4.0) | 14 (26.4) | |
| Middle Atlantic | 58 (10.9) | 0 | |
| East North Central | 95 (17.9) | 27 (50.9) | |
| West North Central | 45 (8.5) | 0 | |
| South Atlantic | 122 (23.0) | 0 | |
| East South Central | 52 (9.8) | 0 | |
| West South Central | 54 (10.2) | 0 | |
| Mountain | 33 (6.2) | 0 | |
| Pacific | 50 (9.4) | 12 (22.6) | |
| Puerto Rico | 1 (0.2) | 0 | |
| Geographic location, N (%) | 0.184 | ||
| Urban | 451 (85.1) | 40 (75.5) | |
| Suburban | 53 (10.0) | 9 (17.0) | |
| Rural | 26 (4.9) | 4 (7.6) | |
| Ownership type, N (%) | <0.001 | ||
| For profit | 129 (24.3) | 1 (1.9) | |
| Nonprofit | 355 (66.9) | 44 (83.0) | |
| Government | 47 (8.9) | 8 (15.1) | |
| Multihospital affiliation, N (%) | 0.032 | ||
| Yes | 385 (72.5) | 31 (58.5) | |
| No | 146 (27.5) | 22 (41.5) | |
| Risk‐standardized readmission rate (per 100 patients)b | |||
| For patients with HF, Mean (SD) | 24.7 (0.06) | 25.1 (0.06) | 0.088a |
| For patients with AMI, Mean (SD) | 19.5 (0.06) | 19.6 (0.07) | 0.722a |
Hospital Strategies to Reduce Readmission Rates
Many hospitals were not implementing recommended strategies at the time of enrollment. Only 52.7% of STAAR hospitals and 53.4% of H2H hospitals had a quality improvement team devoted to reducing readmissions for patients with AMI (Table 2). Half or fewer hospitals in either initiative reported that they monitored the proportion of discharge summaries sent to the primary care physician or the percent of patients with follow‐up appointments within 7 days. Less than 20% of hospitals in either initiative were monitoring readmissions to another hospital (Table 2). Most hospitals in STAAR and in H2H did not have the pharmacists responsible for medication reconciliation, with most assigning nurses this task, and few employed a third‐party database regularly for checking historical fill and current refill information (Table 3). In both initiatives, a small minority of hospitals reported that patients were always discharged with a follow‐up appointment already made, and less than half of hospitals had assigned someone to follow up on test results that return after the patient was discharged (Table 4).
| H2H, N=532 | STAAR, N=55 | |
|---|---|---|
| ||
| Hospital has reducing preventable readmissions as a written objective | ||
| Strongly agree/agree | 478 (89.9%) | 53 (96.4%) |
| Not sure/disagree/strongly disagree | 54 (10.2%) | 2 (3.6%) |
| Hospital has a reliable process in place to identify patients with HF at the time they are admitted | 438 (82.6%) | 50 (90.9%) |
| Hospital has quality improvement teams devoted to reducing preventable readmissions for patients with HF | 462 (86.8%) | 49 (89.1%) |
| Hospital has quality improvement teams devoted to reducing preventable readmissions for patients with AMI | 284 (53.4%) | 29 (52.7%) |
| Hospital has a multidisciplinary team to manage the care of patients who are at high risk of readmission | 299 (56.4%) | 42 (76.4%)a |
| Hospital has partnered with the following to reduce readmission rates | ||
| Community homecare agencies and/or skilled nursing facilities | 358 (67.6%) | 48 (87.3%)a |
| Community physicians or physician groups | 262 (49.6%) | 42 (76.4%)a |
| Other local hospitals | 123 (23.3%) | 23 (41.8%)a |
| Hospital tracks the following for quality improvement efforts: | ||
| Timeliness of discharge summary | 373 (70.6%) | 40 (72.7%) |
| Proportion of discharge summaries sent to primary physician | 121 (23.0%) | 17 (31.5%) |
| Percent of patients discharged with follow‐up appointment 7 days | 168 (31.9%) | 27 (50.0%) |
| Accuracy of medication reconciliation | 385 (72.9%) | 36 (66.7%) |
| 30‐day readmission rate | 499 (94.5%) | 54 (98.2%) |
| Early (<7 day) readmission rate | 293 (55.5%) | 26 (48.2%)a |
| Proportion of patients readmitted to another hospital | 61 (11.6%) | 9 (16.7%) |
| Has a designated person or group to review unplanned readmissions that occur within 30 days of the original discharge | 338 (63.9%) | 43 (78.2%) |
| Estimates risk of readmission in a formal way and uses it in clinical care during patient hospitalization | 118 (22.3%) | 22 (40.0%)a |
| H2H, N=532 | STAAR, N=55 | |
|---|---|---|
| ||
| Who is responsible for medication reconciliation at discharge? | ||
| Nurse | ||
| Never | 53 (10.0%) | 12 (22.2%)b |
| Sometimes | 51 (9.6%) | 13 (24.1%) |
| Usually | 49 (9.3%) | 5 (9.3%) |
| Always | 376 (71.1%) | 24 (44.4%) |
| Pharmacist | ||
| Never | 309 (58.5%) | 30 (55.6%) |
| Sometimes | 163 (30.9%) | 21 (38.9%) |
| Usually | 21 (4.0%) | 1 (1.9%) |
| Always | 35 (6.6%) | 2 (3.7%) |
| Responsibility is not formally assigned | ||
| Never | 453 (86.1%) | 41 (77.4%) |
| Sometimes | 23 (4.4%) | 6 (11.3%) |
| Usually | 21 (4.0%) | 4 (7.6%) |
| Always | 29 (5.5%) | 2 (3.8%) |
| Tools in place to facilitate medication reconciliationc | ||
| Paper‐based standardization form | 290 (54.5%) | 31 (56.4%) |
| Electronic medical record/Web‐based form | 392 (73.7%) | 38 (69.1%) |
| How often does each of the following occur as part of the medication reconciliation process at your hospital? | ||
| Emergency medicine staff obtains medication history | ||
| Never | 3 (0.6%) | 0 |
| Sometimes | 39 (7.4%) | 5 (9.1%) |
| Usually | 152 (28.7%) | 20 (36.4%) |
| Always | 336 (63.4%) | 30 (54.6%) |
| Admitting medical team obtains medication history | ||
| Never | 8 (1.5%) | 1 (1.8%) |
| Sometimes | 33 (6.2%) | 6 (10.9%) |
| Usually | 97 (18.3%) | 15 (27.3%) |
| Always | 392 (74.0%) | 33 (60.0%) |
| Pharmacist or pharmacy technician obtains medication history | ||
| Never | 244 (46.1%) | 19 (34.6%) |
| Sometimes | 160 (30.3%) | 16 (29.1%) |
| Usually | 47 (8.9%) | 10 (18.2%) |
| Always | 78 (14.7%) | 10 (18.2%) |
| Contact is made with outside pharmacies | ||
| Never | 76 (14.4%) | 3 (5.5%) |
| Sometimes | 366 (69.3%) | 42 (76.4%) |
| Usually | 69 (13.1%) | 6 (10.9%) |
| Always | 17 (3.2%) | 4 (7.3%) |
| Contact is made with primary physician | ||
| Never | 27 (5.1%) | 2 (3.6%) |
| Sometimes | 280 (52.9%) | 30 (54.6%) |
| Usually | 148 (28.0%) | 18 (32.7%) |
| Always | 74 (14.0%) | 5 (9.1%) |
| Outpatient and inpatient prescription records are linked electronically | ||
| Never | 324 (61.4%) | 28 (50.9%) |
| Sometimes | 91 (17.2%) | 14 (25.5%) |
| Usually | 61 (11.6%) | 8 (14.6%) |
| Always | 52 (9.9%) | 5 (9.1%) |
| Third‐party prescription database that provides historical fill and refill information (eg, Health Care Systems) | ||
| Never | 441 (83.5%) | 37 (67.3%) |
| Sometimes | 54 (10.2%) | 10 (18.2%) |
| Usually | 14 (2.7%) | 4 (7.3%) |
| Always | 19 (3.6%) | 4 (7.3%) |
| All patients (or their caregivers) receive at the time of discharge information about the purpose of each medication, which medications are new, which medications have changed in dose or frequency, and/or which medications are to be stopped | 407 (76.9%) | 35 (63.6%) |
| Hospital promotes use of teach‐back techniques (having the patient teach new information back to educator) | 371 (69.9%) | 48 (87.3%)a |
| H2H, N=532 | STAAR, N=55 | |
|---|---|---|
| ||
| For all patients | ||
| All patients (or their caregivers) receive the following in written form at the time of discharge: | ||
| Discharge instructions | 485 (91.3%) | 45 (81.8%) |
| Names, doses, and frequency of all discharge medications | 463 (87.4%) | 42 (76.4%) |
| Educational information about heart failure, when relevant | 385 (72.5%) | 37 (67.3%) |
| Symptoms that prompt an immediate call to a physician or return to hospital | 352 (66.4%) | 33 (60.0%) |
| Educational information about AMI | 348 (65.5%) | 36 (66.7%) |
| Any type of emergency plana | 312 (58.8%) | 26 (47.3%) |
| Action plan for heart failure patients for managing changes in condition | 282 (53.1%) | 28 (50.9%) |
| Personal health record | 139 (26.3%) | 23 (41.8%) |
| Discharge summary | 104 (19.6%) | 12 (21.8%) |
| Patients are discharged from the hospital with an outpatient follow‐up appointment already arranged | ||
| Never | 20 (3.8%) | 1 (1.8%) |
| Sometimes | 222 (41.9%) | 26 (47.3%) |
| Usually | 233 (44.0%) | 26 (47.3%) |
| Always | 55 (10.4%) | 2 (3.6%) |
| Patients with home health services are provided direct contact information for a specific inpatient physician in case of questions | 249 (47.1%) | 35 (63.6%) |
| Process is in place to ensure outpatient physicians are alerted to the patient's discharge within 48 hours of discharge | 199 (37.6%) | 37 (67.3%)b |
| Proportion of patients for whom a paper or electronic discharge summary is sent directly to the patient's primary physician | ||
| None | 43 (8.1%) | 3 (5.5%) |
| Some | 153 (28.9%) | 14 (25.5%) |
| Most | 200 (37.8%) | 18 (32.7%) |
| All | 133 (25.1%) | 20 (36.4%) |
| Patient's discharge summary typically completed and available for viewing | ||
| Upon discharge | 42 (8.0%) | 5 (9.1%) |
| Within 48 hours of discharge | 222 (42.1%) | 33 (60.0%) |
| Within 7 days | 94 (17.8%) | 10 (18.2%) |
| Within 30 days | 157 (29.7%) | 7 (12.7%) |
| There are no explicit goals or policies defining a time‐frame for completing the discharge summary | 13 (2.5%) | 0 |
| Someone in the hospital is assigned to follow up on test results that return after the patient is discharged | 191 (36.2%) | 27 (49.1%) |
| Patients are regularly called after discharge to either follow up on postdischarge needs or to provide additional education | 334 (63.0%) | 38 (69.1%) |
| Home visits are arranged for all or most patients after discharge | 114 (21.5%) | 9 (16.4%) |
| After discharge, patients: | ||
| Receive telemonitoring | ||
| None | 241 (45.5%) | 12 (21.8%)a |
| Some | 265 (50.0%) | 41 (74.6%) |
| Most | 23 (4.3%) | 1 (1.8%) |
| All | 1 (0.2%) | 1 (1.8%) |
| Receive referrals to cardiac rehabilitation | ||
| None | 27 (5.1%) | 4 (7.4%)b |
| Some | 190 (36.0%) | 28 (51.9%) |
| Most | 203 (38.5%) | 17 (31.5%) |
| All | 108 (20.5%) | 5 (9.3%) |
| Are enrolled in chronic disease management programs | ||
| None | 161 (30.4%) | 13 (23.6%) |
| Some | 321 (60.7%) | 34 (61.8%) |
| Most | 41 (7.8%) | 7 (12.7%) |
| All | 6 (1.1%) | 1 (1.8%) |
| For patients transferred to skilled nursing facilities | ||
| Nurse‐to‐nurse report is always conducted prior to transfer | 326 (61.5%) | 22 (40.0%)a |
| Information always provided to the facility upon discharge | ||
| Completed discharge summary | 252 (47.6%) | 27 (49.1%) |
| Reconciled medication list | 436 (82.3%) | 46 (83.6%) |
| Medication administration record | 352 (66.4%) | 38 (69.1%) |
| Direct contact number of inpatient treating physician | 180 (34.0%) | 29 (52.7%)b |
Differences in the use of strategies by STAAR versus H2H hospitals were significant (P<0.01) in unadjusted analysis for several strategies that were attenuated and nonsignificant after adjustment for census region and ownership type (Tables 24). STAAR compared with H2H hospitals were more likely to have: (1) used a multidisciplinary team to care for patients at high risk of readmission, (2) partnered with community homecare agencies and/or skilled nursing facilities, (3) partnered with community physicians or physician groups, (4) partnered with other local hospitals to reduce preventable readmissions, (5) estimated risk of readmission in a formal way and used it in clinical care, (6) used teach‐back techniques, and (7) used telemonitoring. In contrast, H2H hospitals were more likely than STAAR hospitals to have monitored 7‐day readmission rates and to have conducted nurse‐to‐nurse report usually or always prior to discharge to nursing home facilities.
In multivariable analysis, STAAR and H2H hospitals differed significantly (P<0.01) for 4 additional strategies. STAAR hospitals were more likely to have (1) ensured outpatient physicians were alerted within 48 hours of patient discharge, and (2) provided skilled nursing facilities the direct contact number of the inpatient treating physician for patients transferred. H2H hospitals were more likely to have (1) assigned responsibility for medication reconciliation to nurses, and (2) referred discharged patients to cardiac rehabilitation services.
DISCUSSION
We found that many hospitals enrolled in the STAAR or the H2H initiative were not implementing strategies commonly recommended to reduce readmission in 2010 to 2011, indicating substantial opportunities for improvement. The gaps were apparent among both the STAAR and the H2H hospitals. Previous literature has shown that discharged patients often do not have timely posthospitalization follow‐up visits, and that discharge summaries are infrequently completed prior to the follow‐up visit.[4, 19, 31] Studies have also demonstrated weaknesses in the medication reconciliation process[32] and overall communication between hospital‐based and primary care physicians.[33, 34] Our survey adds to this existing literature by employing a more comprehensive survey of hospital strategies and reporting results for a larger, national sample of hospitals.
Encouraging the use of strategies recommended by quality initiatives is difficult for several reasons. First, the evidence base for their effectiveness is not yet solid, making it difficult for institutions to prioritize and select interventions and to foster enthusiasm for change. Second, the organizational challenges of these interventions are often substantial, requiring coordination across disciplines, departments, and settings (hospital, home, nursing facility). Third, some literature suggests[3] that multipronged strategies may be most effective, increasing the complexity of readmission reduction activities. Last, important financial barriers must be overcome, including the cost of interventions as well as lost revenue from reduced readmissions. Input from hospitalists who are often critical links among inpatient and outpatient care and between patients and their families is strongly needed to ensure hospitals focus on what strategies are most effective for successful transitions from hospital to home.
The prevalence of several strategies differed between STAAR and H2H hospitals; however, these differences were largely attenuated by geographic region. The finding that significant differences among hospitals in strategies was explained in large part by geographical region is consistent with previous research that has documented substantial regional differences in many kinds of practice patterns[35, 36, 37] as well as geographic differences in readmission rates.[38, 39, 40] The results suggest regionally focused initiatives may be most effective in tailoring interventions to practice needs and norms within specific areas.
Among the strategies that differed significantly between the hospitals in STAAR compared with H2H, the variation may be attributable in part to the focus of the initiatives themselves. For instance, 1 strategy that was significantly more prevalent among H2H compared with STAAR hospitals is central to the quality of care for patients with heart failure and acute myocardial infarction, the focus of H2H: referral patterns to cardiac rehabilitation services after discharge. H2H hospitals may have been particularly attuned to this practice, as H2H focused on cardiovascular‐related readmissions, whereas STAAR focused on all readmissions.
The study has several limitations. First, data were self‐reported, and we did not have the resources to verify these reports with onsite evaluations. Nevertheless, the methods for obtaining the data were the same for H2H and STAAR hospitals, and therefore measurement errors are unlikely to have varied systematically between the 2 groups of hospitals. Second, a single respondent at each hospital completed the survey; however, we did instruct respondents to attain information from a broad range of relevant staff to reflect a more comprehensive perspective in the survey. Third, the sample size of STAAR hospitals was modest and therefore may have lacked statistical power to detect important differences; however, we did include all hospitals that had enrolled in STAAR by the study date. Fourth, hospitals that enrolled in STAAR and H2H initiatives represent a selected group, and results may differ among nonenrolled hospitals. Last, we have data on strategies used during the 2010 to 2011 time frame and therefore cannot evaluate the impact of the quality initiatives from these baseline data. Studies that examine the associations between changes in the use of strategies and subsequent changes in readmission rates would be valuable. Nevertheless, this study establishes a baseline against which future progress can be evaluated.
In sum, we found that many STAAR and H2H hospitals were not implementing many of the recommended strategies for reducing readmissions as of 2010 to 2011, suggesting continued opportunities for improvement. Hospitalists will have opportunities to play leadership roles as hospitals look for meaningful ways to reduce readmissions. At the same time, although hospitalists have a key role in implementing hospital‐based programs, much of the care transitions work must also engage teams across the continuum of care. Furthermore, priority should be given to augmenting the evidence base about which strategies are most effective in reducing readmissions, as this evidence is currently underdeveloped.
Disclosures
This work was funded by the Commonwealth Fund and the Donaghue Foundation. Dr. Krumholz is supported by grant U01 HL105270‐03 (Center for Cardiovascular Outcomes Research at Yale University) from the National Heart, Lung, and Blood Institute in Bethesda, Maryland. Dr. Horwitz is supported by the National Institute on Aging (K08 AG038336) and by the American Federation for Aging Research through the Paul B. Beeson Career Development Award Program. Dr. Horwitz is also a Pepper Scholar with support from the Claude D. Pepper Older Americans Independence Center at Yale University School of Medicine (#P30AG021342 NIH/NIA). Dr. Krumholz discloses that he is the recipient of a research grant from Medtronic, Inc. through Yale University and is chair of a cardiac scientific advisory board for UnitedHealth.
- , , . Rehospitalizations among patients in the Medicare fee‐for‐service program. N Engl J Med. 2009;360:1418–1428.
- , , , , . “Learning by doing”—resident perspectives on developing competency in high‐quality discharge care. J Gen Intern Med. 2012;27:1188–1194.
- , , , , . Interventions to reduce 30‐day rehospitalization: a systematic review. Ann Intern Med. 2011;155:520–528.
- , , , . Promoting effective transitions of care at hospital discharge: a review of key issues for hospitalists. J Hosp Med. 2007;2:314–323.
- . The role of the hospitalist in quality improvement: systems for improving the care of patients with acute coronary syndrome. J Hosp Med. 2010;5(suppl 4):S1–S7.
- Society of Hospital Medicine. Project BOOST: Better Outcomes by Optimizing Safe Transitions Available at: http://www.hospitalmedicine.org/ResourceRoomRedesign/RR_CareTransitions/CT_Home.cfm. Accessed January 19, 2013.
- Society of Hospital Medicine. The BOOST Tools. Available at: http://www.hospitalmedicine.org/ResourceRoomRedesign/RR_CareTransitions/html_CC/06Boost/07_Boost_Tools.cfm. Accessed January 19, 2013.
- , , , et al. Transition of care for hospitalized elderly patients—development of a discharge checklist for hospitalists. J Hosp Med. 2006;1:354–360.
- Institute for Healthcare Improvement. Overview: STate action on avoidable rehospitalizations (STAAR) initiative. Available at: http://www.ihi.org/offerings/Initiatives/STAAR/Pages/default.aspx. Accessed February 20, 2010.
- , , , et al. Contemporary evidence about hospital strategies for reducing 30‐day readmissions: a national study. J Am Coll Cardiol. 2012;60:607–614.
- , , . Effectiveness and feasibility of pharmacist‐led admission medication reconciliation for geriatric patients. J Pharm Pract. 2012;25:136–141.
- , , , et al. Effect of admission medication reconciliation on adverse drug events from admission medication changes. Arch Intern Med. 2011;171:860–861.
- , , , . Potential risk of medication discrepancies and reconciliation errors at admission and discharge from an inpatient medical service. Ann Pharmacother. 2010;44:1747–1754.
- , . Measuring patient safety performance. In: Spath PL, ed. Error Reduction in Health Care: A Systems Approach to Improving Patient Safety. 2nd ed. Hoboken, NJ: Jossey‐Bass; 2010:59–102.
- , . Analyzing patient safety performance. In: Spath PL, ed. Error Reduction in Health Care: A Systems Approach to Improving Patient Safety. 2nd ed. Hoboken, NJ: Jossey‐Bass; 2010:103–118.
- , . Pharmacists' medication reconciliation‐related clinical interventions in a children's hospital. Jt Comm J Qual Patient Saf. 2009;35:278–282.
- , , , et al. Results of the Medications at Transitions and Clinical Handoffs (MATCH) study: an analysis of medication reconciliation errors and risk factors at hospital admission. J Gen Intern Med. 2010;25:441–447.
- , , BS, . Pharmacist‐conducted medication reconciliation in an emergency department. Am J Health Syst Pharm. 2007;64:1720–1723.
- , , , et al. Relationship between early physician follow‐up and 30‐day readmission among Medicare beneficiaries hospitalized for heart failure. JAMA. 2010;303:1716–1722.
- , , , et al. A reengineered hospital discharge program to decrease rehospitalization: a randomized trial. Ann Intern Med. 2009;150:178–187.
- , , , et al. Randomized trial of an education and support intervention to prevent readmission of patients with heart failure. J Am Coll Cardiol. 2002;39:83–89.
- . Using performance data to prioritize safety improvements. In: Spath PL, ed. Error Reduction in Health Care: A Systems Approach to Improving Patient Safety. 2nd ed. Hoboken, NJ: Jossey‐Bass; 2010:119–142.
- , . Medication reconciliation at an academic medical center: Implementation of a comprehensive program from admission to discharge. Emer Med J. 2010;27:911–915.
- , , , , . Medication reconciliation at an academic medical center: implementation of a comprehensive program from admission to discharge. Am J Health Syst Pharm. 2009;66:2126–2131.
- National Quality Forum (NQF). Safe practices for better healthcare—2010 update: A consensus report. 2010. Available at: http://www. qualityforum.org/Publications/2010/04/Safe_Practices_for_Better_Health care_%Ed%80%93_2010_Update.aspx. Accessed September 28, 2012.
- , , , et al. Role of pharmacist counseling in preventing adverse drug events after hospitalization. Arch Intern Med. 2006;166:565–571.
- , , , et al. Medication history reconciliation by clinical pharmacists in elderly inpatients admitted from home or a nursing home. Ann Pharmacother. 2010;44:1596–1603.
- , , . A review of the literature on heart failure and discharge education. Crit Care Nurs Q. 2011;34:235–245.
- , , , et al. An administrative claims measure suitable for profiling hospital performance on the basis of 30‐day all‐cause readmission rates among patients with heart failure. Circ Cardiovasc Qual Outcomes. 2008;1:29–37.
- , , , et al. An administrative claims measure suitable for profiling hospital performance based on 30‐day all‐cause readmission rates among patients with acute myocardial infarction. Circ Cardiovasc Qual Outcomes. 2011;4:243–252.
- , , , et al. Comprehensive quality of discharge summaries at an academic medical center [published online ahead of print [March 22, 2013]. J Hosp Med. doi: 10.1002/jhm.2021.
- , , , et al. Quality of discharge practices and patient understanding at an academic medical center. JAMA Intern Med. In press.
- , , , et al. Association of communication between hospital‐based physicians and primary care providers with patient outcomes. J Gen Intern Med. 2009;24:381–386.
- , , , et al. Patient‐physician communication at hospital discharge and patients' understanding of the postdischarge treatment plan. Arch Intern Med. 1997;157:1026–1030.
- , , , , , . Quality of care for acute myocardial infarction in rural and urban US hospitals. J Rural Health. 2004;20:99–108.
- , , , , . Regional variation in the treatment and outcomes of myocardial infarction: investigating New England's advantage. Am Heart J. 2003;146:242–249.
- , , , , . Outcomes of percutaneous coronary interventions performed at centers without and with onsite coronary artery bypass graft surgery. JAMA. 2004;292:1961–1968.
- , , , et al. Patterns of hospital performance in acute myocardial infarction and heart failure 30‐day mortality and readmission. Circ Cardiovasc Qual Outcomes. 2009;2:407–413.
- , , , et al. Recent national trends in readmission rates after heart failure hospitalization. Circ Heart Fail. 2010;3:97–103.
- , , , et al. National patterns of risk‐standardized mortality and readmission for acute myocardial infarction and heart failure. Update on publicly reported outcomes measures based on the 2010 release. Circ Cardiovasc Qual Outcomes. 2010;3:459–467.
Copyright © 2013 Society of Hospital Medicine
Estimating Hospital Costs of CAUTI
Healthcare‐associated infections affect 5% to 10% of all hospitalized patients each year in the United States, account for nearly $45 billion in direct hospital costs, and cause nearly 100,000 deaths annually.[1, 2] Because catheter‐associated urinary tract infection (CAUTI) is one of the most common healthcare‐associated infections in the United States and is reasonably preventable, the Centers for Medicare and Medicaid Services stopped reimbursing hospitals in 2008 for the additional costs of caring for patients who develop CAUTI during hospitalization.[3] Still, strategies for reducing inappropriate urinary catheterization are infrequently implemented in practice; this is despite a consensus that such strategies are effective.[4]
To help motivate hospitals to reduce inappropriate urinary catheter use, we present a tool for estimating costs of CAUTI for individual hospitals. Although other tools for estimating the excess costs of healthcare‐associated infections are available (eg, the APIC Cost of Healthcare‐Associated Infections Model available at
METHODS
General Setup
We consider 4 possible events after urinary catheter placement: bacteriuria, symptomatic urinary tract infection (SUTI), bloodstream infection (BSI), and catheter removal. Conservatively, assuming that bacteriuria must precede SUTI and BSI, there are 5 possible trajectories for any hospitalized patient (Figure 1): (1) no infection, (2) only bacteriuria, (3) bacteriuria and SUTI, (4) bacteriuria and BSI, or (5) bacteriuria, SUTI, and BSI. The cost of CAUTI for a particular hospital is therefore the per‐patient cost of each trajectory multiplied by the number of patients experiencing each trajectory. Our approach for estimating hospital costs is based on factorizing the number of patients experiencing each trajectory into a product of terms for which estimates are available from the literature (see the Supporting Information, Appendix, in the online version of this article for all technical details).
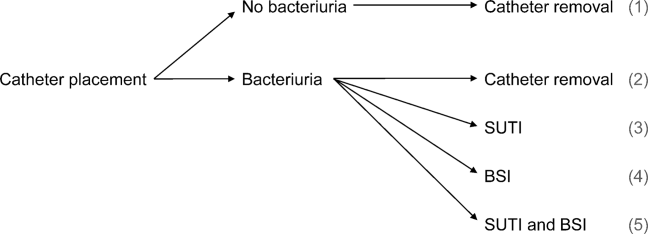
Deriving Estimates of Current Costs
We start with 2 minor simplifying assumptions. First, because the presence of asymptomatic bacteriuria is typically unknown, we only consider costs to the hospital due to SUTI and BSI[6]; in other words, we assume hospitals do not incur costs for patients with trajectories 1 or 2. This assumption should only bias cost estimates conservatively. Second, we assume that patients with both SUTI and BSI (trajectory 5) incur costs equal to those for patients with only BSI (trajectory 4). Further, because the joint risk of SUTI and BSI is unknown, we conservatively assume SUTI must precede BSI. Under these assumptions we can write: (total CAUTI costs)=(per‐patient SUTI cost) (number with SUTI but no BSI)+(perpatient BSI cost) (number with BSI).
We use per‐patient hospital costs of SUTI and BSI of $911 and $3824, respectively, which were determined using a microcosting approach[6] and adjusted for inflation using the general Consumer Price Index.[7] Although an alternative strategy for estimating costs would be to enter the hospital‐specific, per‐patient costs of SUTI and BSI into the above equation, these quantities are often difficult to measure or otherwise unavailable. Thus, it remains to factorize the number of hospitalized patients who develop SUTI and BSI into component terms for which we have accessible estimates. First note that the number with only SUTI (or any BSI) equals the total number of patients hospitalized times the proportion of hospitalizations with only SUTI (or any BSI). The former quantity depends on the particular hospital and so is specified as an input by the user. The latter quantity can be factorized further under our aforementioned conservative assumption that bacteriuria must precede SUTI and BSI.
Specifically, for SUTI:
(Proportion SUTI but no BSI)={(SUTI risk among those catheterized with bacteriuria)(BSI risk among those catheterized with bacteriuria)} (bacteriuria risk among those catheterized) (proportion catheterized).
And for BSI:
(Proportion BSI)=(BSI risk among those catheterized with bacteriuria) (bacteriuria risk among those catheterized) (proportion catheterized).
The risks of SUTI and BSI among those catheterized with bacteriuria, along with the risk of bacteriuria among those catheterized, have been estimated previously via a meta‐analytic approach.[6] The proportion catheterized depends on the particular hospital, such as the total number of patients hospitalized, and so is also specified as a user input. Therefore, we have now factorized the total hospital costs due to CAUTI as a product of either user‐specified terms or terms for which we have estimates from the literature. All estimates and corresponding standard errors derived from the literature are listed together in Table 1 (see the Supporting Information, Appendix Section 1, for further details in the online version of this article).
| Quantity | Estimate (SE) |
|---|---|
| |
| Overall risk of bacteriuria among those catheterized | 26.0% (1.53%) |
| Per‐day risk of bacteriuria among those catheterized | 5.0% |
| days | 6.68 |
| Risk of SUTI among those catheterized with bacteriuria | 24.0% (4.08%) |
| Risk of BSI among those catheterized with bacteriuria | 3.6% (0.10%) |
| Per‐patient SUTI cost | $911 ($911) |
| Per‐patient BSI cost | $3824 ($3824) |
Deriving Projected Costs After Intervention
The approach described above permits estimation of current costs for managing patients with CAUTI for a particular hospital. To estimate projected costs after participation in an intervention to reduce infection risk, we characterize interventions of interest and introduce additional factorization. Specifically, following previous work,[8] we consider interventions that reduce (1) placement (ie, the proportion catheterized) and (2) duration (ie, the mean duration of catheterization). Incorporating reductions in placement is straightforward, because our above expression for costs already contains a term for the proportion catheterized. However, incorporating reductions in duration requires further factorization. Under the assumptions of constant per‐day risks of bacteriuria and of catheter removal, we can write the postintervention risk of bacteriuria among the catheterized as a function of (1) the percent decrease in mean duration of catheterization due to intervention, and (2) the preintervention risk of bacteriuria among the catheterized (see the Supporting Information, Appendix Section 2, for further details in the online version of this article). This means we can fully characterize postintervention costs as a function of user‐specified quantities, quantities specific to the intervention (which are varied across plausible ranges), and quantities for which we have estimates from the literature. Therefore, we can estimate savings by subtracting postintervention costs from current costs.
Because our estimators of current costs, projected costs, and savings are all formulated as functions of other estimators, we use the standard delta method approach[9] to derive appropriate variance estimates (see the Supporting Information, Appendix Section 3, for further details in the online version of this article).
Online Implementation
Customized results (based on annual admissions, urinary catheter prevalence, and other inputs) can be computed using online implementation of our proposed method at
RESULTS
Figure 2 shows the projected savings in hospital costs due to CAUTI across a range of interventions defined by percent decreases in placement and duration, for a hypothetical hospital with 3000 total patients, 15% with urinary catheters preintervention, and with all other default values listed in Table 1. The current costs for this hospital (ie, the costs when the percent reduction in placement and duration is zero) are estimated to be $37,868 (95% confidence interval [CI]: $9159‐$156,564). After an intervention resulting in 40% reductions in both urinary catheter placement and duration, this hospital would be expected to save $22,653 (95% CI: $5479‐$93,656). A less effective intervention yielding a 10% reduction in both urinary catheter placement and duration would result in more modest savings of $6376 (95% CI: $1542‐$26,360).
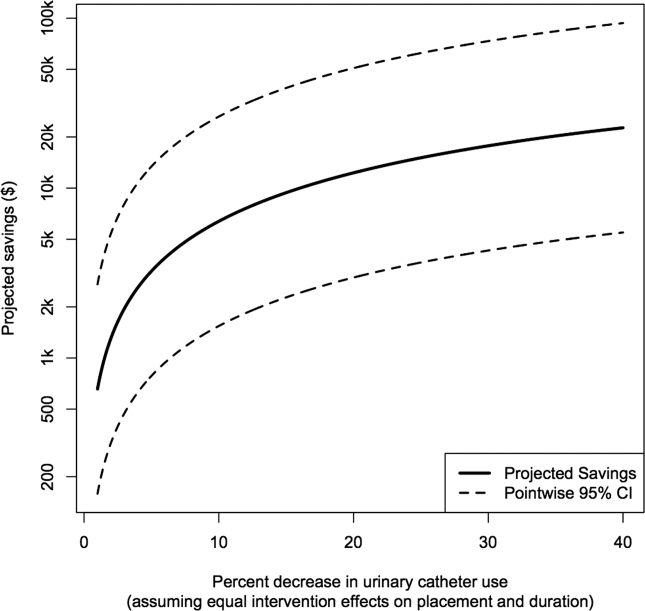
After an intervention resulting in 29% and 37% reductions in placement and duration, respectively, reflecting reductions seen in practice,[10, 11] our hypothetical hospital is estimated to save $19,126 (95% CI: $4626‐$79,074). This reflects an estimated savings of nearly 50%.
DISCUSSION
We have presented a tool for estimating customized hospital costs of CAUTI, both before and after a hypothetical intervention to reduce risk of infection. Our approach relies on mostly conservative assumptions, incorporates published risk estimates (properly accounting for their associated variability), and has easy‐to‐use online implementation. We believe this can play an important role in motivating hospitals to reduce inappropriate urinary catheter use.
The methodology employed here does have a few limitations. First and foremost, our results depend on the reliability of the input values, which are either provided by users or are based on estimates from the literature (see Table 1 for a complete list of suggested defaults). New information could potentially be incorporated if and when available. For example, substitution of more precise risk estimates could help reduce confidence interval length. Second, our approach essentially averages over hospital quality; we do not directly take into account quality of care or variation in underlying infection risk across hospitals in computing estimated costs. Finally, we only compute direct costs due to infection; other costs (eg, intervention costs) would typically also need to be considered for decision making.
Despite these limitations, we believe that our tool can help infection control professionals demonstrate the values of CAUTI prevention efforts to key administrators, particularly at a time where it has become increasingly necessary to develop a business case to initiate new interventions or justify the continued support for ongoing programs.[12] Additionally, we believe the proposed approach can be an important supplement to initiatives like the Society of Hospital Medicine's Choosing Wisely campaign, which aims to help reduce inappropriate urinary catheter use. Reducing catheter utilization has the potential to reduce costs associated with caring for CAUTI patients, but more importantly would help reduce CAUTI incidence as well as catheter‐related, noninfectious complications.[13, 14] We hope that our tool will greatly assist hospitals in promoting their CAUTI prevention efforts and improve the overall safety of hospitalized patients.
Disclosures
This project was supported by the Ann Arbor VA Medical Center/University of Michigan Patient Safety Enhancement Program (PSEP) and a subcontract to implement multistate CAUTI prevention with the Agency for Healthcare Research and Quality/Health Educational and Research Trust. Mr. Kennedy has no conflicts of interest to report. Drs. Saint and Greene are subcontracted to implement multistate CAUTI prevention with the Agency for Healthcare Research and Quality/Health Educational and Research Trust. Dr. Saint has received numerous honoraria and speaking fees for lectures on healthcare‐associated infection prevention, implementation science, and patient safety from hospitals, academic medical centers, professional societies, and nonprofit foundations. None of these activities are related to speaker's bureaus. Dr. Saint is also on the medical advisory board of Doximity, a new social networking site for physicians. The views expressed in this article are those of the authors and do not necessarily reflect the position or policy of the Department of Veterans Affairs.
- , , , et al. Estimating health care‐associated infections and deaths in U.S. hospitals, 2002. Public Health Rep. 2007;122:160–166.
- The direct medical costs of healthcare‐associated infections in US hospitals and the benefits of prevention. US Centers for Disease Control and Prevention Web site. Published 2009. Available at: http://www.cdc.gov/HAI/pdfs/hai/Scott_CostPaper.pdf. Accessed March 24, 2013.
- , , , , . Catheter‐associated urinary tract infection and the Medicare rule changes. Ann Intern Med. 2009;150(12):877–884.
- , . Improving use of the other catheter. Arch Intern Med. 2012;172(3):260–261.
- Choosing Wisely: five things patients and physicians should question. Society of Hospital Medicine. Published 2012. Available at: http://www.hospitalmedicine.org/AM/pdf/SHM‐Adult_5things_List_Web.pdf. Accessed March 24, 2013.
- . Clinical and economic consequences of nosocomial catheter‐related bacteriuria. Am J Infect Control. 2000;28(1):68–75.
- CPI Inflation Calculator. United States Department of Labor, Bureau of Labor Statistics Web site. Published 2013. Available at: http://www.bls.gov/data/inflation_calculator.htm. Accessed March 24, 2013.
- , , , et al. Introducing a population‐based outcome measure to evaluate the effect of interventions to reduce catheter‐associated urinary tract infection. Am J Infect Control. 2012;40(4):359–364.
- . Asymptotic Statistics. Cambridge, UK: Cambridge University Press; 2000.
- , , , et al. Effect of establishing guidelines on appropriate urinary catheter placement. Acad Emerg Med. 2010;17:337–340.
- , , , . Systematic review and meta‐analysis: reminder systems to reduce catheter‐associated urinary tract infections and urinary catheter use in hospitalized patients. Clin Infect Dis. 2010;51(5):550–560.
- , , , et al. Raising standards while watching the bottom line: making a business case for infection control. Infect Control Hosp Epidemiol. 2007;28:1121–1133.
- , , , , . Urinary catheters: what type do men and their nurses prefer? J Am Geriatr Soc. 1999;47(12):1453–1457.
- , , . Indwelling urinary catheters: a one‐point restraint? Ann Intern Med. 2002;137(2):125–127.
Healthcare‐associated infections affect 5% to 10% of all hospitalized patients each year in the United States, account for nearly $45 billion in direct hospital costs, and cause nearly 100,000 deaths annually.[1, 2] Because catheter‐associated urinary tract infection (CAUTI) is one of the most common healthcare‐associated infections in the United States and is reasonably preventable, the Centers for Medicare and Medicaid Services stopped reimbursing hospitals in 2008 for the additional costs of caring for patients who develop CAUTI during hospitalization.[3] Still, strategies for reducing inappropriate urinary catheterization are infrequently implemented in practice; this is despite a consensus that such strategies are effective.[4]
To help motivate hospitals to reduce inappropriate urinary catheter use, we present a tool for estimating costs of CAUTI for individual hospitals. Although other tools for estimating the excess costs of healthcare‐associated infections are available (eg, the APIC Cost of Healthcare‐Associated Infections Model available at
METHODS
General Setup
We consider 4 possible events after urinary catheter placement: bacteriuria, symptomatic urinary tract infection (SUTI), bloodstream infection (BSI), and catheter removal. Conservatively, assuming that bacteriuria must precede SUTI and BSI, there are 5 possible trajectories for any hospitalized patient (Figure 1): (1) no infection, (2) only bacteriuria, (3) bacteriuria and SUTI, (4) bacteriuria and BSI, or (5) bacteriuria, SUTI, and BSI. The cost of CAUTI for a particular hospital is therefore the per‐patient cost of each trajectory multiplied by the number of patients experiencing each trajectory. Our approach for estimating hospital costs is based on factorizing the number of patients experiencing each trajectory into a product of terms for which estimates are available from the literature (see the Supporting Information, Appendix, in the online version of this article for all technical details).
Deriving Estimates of Current Costs
We start with 2 minor simplifying assumptions. First, because the presence of asymptomatic bacteriuria is typically unknown, we only consider costs to the hospital due to SUTI and BSI[6]; in other words, we assume hospitals do not incur costs for patients with trajectories 1 or 2. This assumption should only bias cost estimates conservatively. Second, we assume that patients with both SUTI and BSI (trajectory 5) incur costs equal to those for patients with only BSI (trajectory 4). Further, because the joint risk of SUTI and BSI is unknown, we conservatively assume SUTI must precede BSI. Under these assumptions we can write: (total CAUTI costs)=(per‐patient SUTI cost) (number with SUTI but no BSI)+(perpatient BSI cost) (number with BSI).
We use per‐patient hospital costs of SUTI and BSI of $911 and $3824, respectively, which were determined using a microcosting approach[6] and adjusted for inflation using the general Consumer Price Index.[7] Although an alternative strategy for estimating costs would be to enter the hospital‐specific, per‐patient costs of SUTI and BSI into the above equation, these quantities are often difficult to measure or otherwise unavailable. Thus, it remains to factorize the number of hospitalized patients who develop SUTI and BSI into component terms for which we have accessible estimates. First note that the number with only SUTI (or any BSI) equals the total number of patients hospitalized times the proportion of hospitalizations with only SUTI (or any BSI). The former quantity depends on the particular hospital and so is specified as an input by the user. The latter quantity can be factorized further under our aforementioned conservative assumption that bacteriuria must precede SUTI and BSI.
Specifically, for SUTI:
(Proportion SUTI but no BSI)={(SUTI risk among those catheterized with bacteriuria)(BSI risk among those catheterized with bacteriuria)} (bacteriuria risk among those catheterized) (proportion catheterized).
And for BSI:
(Proportion BSI)=(BSI risk among those catheterized with bacteriuria) (bacteriuria risk among those catheterized) (proportion catheterized).
The risks of SUTI and BSI among those catheterized with bacteriuria, along with the risk of bacteriuria among those catheterized, have been estimated previously via a meta‐analytic approach.[6] The proportion catheterized depends on the particular hospital, such as the total number of patients hospitalized, and so is also specified as a user input. Therefore, we have now factorized the total hospital costs due to CAUTI as a product of either user‐specified terms or terms for which we have estimates from the literature. All estimates and corresponding standard errors derived from the literature are listed together in Table 1 (see the Supporting Information, Appendix Section 1, for further details in the online version of this article).
| Quantity | Estimate (SE) |
|---|---|
| |
| Overall risk of bacteriuria among those catheterized | 26.0% (1.53%) |
| Per‐day risk of bacteriuria among those catheterized | 5.0% |
| days | 6.68 |
| Risk of SUTI among those catheterized with bacteriuria | 24.0% (4.08%) |
| Risk of BSI among those catheterized with bacteriuria | 3.6% (0.10%) |
| Per‐patient SUTI cost | $911 ($911) |
| Per‐patient BSI cost | $3824 ($3824) |
Deriving Projected Costs After Intervention
The approach described above permits estimation of current costs for managing patients with CAUTI for a particular hospital. To estimate projected costs after participation in an intervention to reduce infection risk, we characterize interventions of interest and introduce additional factorization. Specifically, following previous work,[8] we consider interventions that reduce (1) placement (ie, the proportion catheterized) and (2) duration (ie, the mean duration of catheterization). Incorporating reductions in placement is straightforward, because our above expression for costs already contains a term for the proportion catheterized. However, incorporating reductions in duration requires further factorization. Under the assumptions of constant per‐day risks of bacteriuria and of catheter removal, we can write the postintervention risk of bacteriuria among the catheterized as a function of (1) the percent decrease in mean duration of catheterization due to intervention, and (2) the preintervention risk of bacteriuria among the catheterized (see the Supporting Information, Appendix Section 2, for further details in the online version of this article). This means we can fully characterize postintervention costs as a function of user‐specified quantities, quantities specific to the intervention (which are varied across plausible ranges), and quantities for which we have estimates from the literature. Therefore, we can estimate savings by subtracting postintervention costs from current costs.
Because our estimators of current costs, projected costs, and savings are all formulated as functions of other estimators, we use the standard delta method approach[9] to derive appropriate variance estimates (see the Supporting Information, Appendix Section 3, for further details in the online version of this article).
Online Implementation
Customized results (based on annual admissions, urinary catheter prevalence, and other inputs) can be computed using online implementation of our proposed method at
RESULTS
Figure 2 shows the projected savings in hospital costs due to CAUTI across a range of interventions defined by percent decreases in placement and duration, for a hypothetical hospital with 3000 total patients, 15% with urinary catheters preintervention, and with all other default values listed in Table 1. The current costs for this hospital (ie, the costs when the percent reduction in placement and duration is zero) are estimated to be $37,868 (95% confidence interval [CI]: $9159‐$156,564). After an intervention resulting in 40% reductions in both urinary catheter placement and duration, this hospital would be expected to save $22,653 (95% CI: $5479‐$93,656). A less effective intervention yielding a 10% reduction in both urinary catheter placement and duration would result in more modest savings of $6376 (95% CI: $1542‐$26,360).
After an intervention resulting in 29% and 37% reductions in placement and duration, respectively, reflecting reductions seen in practice,[10, 11] our hypothetical hospital is estimated to save $19,126 (95% CI: $4626‐$79,074). This reflects an estimated savings of nearly 50%.
DISCUSSION
We have presented a tool for estimating customized hospital costs of CAUTI, both before and after a hypothetical intervention to reduce risk of infection. Our approach relies on mostly conservative assumptions, incorporates published risk estimates (properly accounting for their associated variability), and has easy‐to‐use online implementation. We believe this can play an important role in motivating hospitals to reduce inappropriate urinary catheter use.
The methodology employed here does have a few limitations. First and foremost, our results depend on the reliability of the input values, which are either provided by users or are based on estimates from the literature (see Table 1 for a complete list of suggested defaults). New information could potentially be incorporated if and when available. For example, substitution of more precise risk estimates could help reduce confidence interval length. Second, our approach essentially averages over hospital quality; we do not directly take into account quality of care or variation in underlying infection risk across hospitals in computing estimated costs. Finally, we only compute direct costs due to infection; other costs (eg, intervention costs) would typically also need to be considered for decision making.
Despite these limitations, we believe that our tool can help infection control professionals demonstrate the values of CAUTI prevention efforts to key administrators, particularly at a time where it has become increasingly necessary to develop a business case to initiate new interventions or justify the continued support for ongoing programs.[12] Additionally, we believe the proposed approach can be an important supplement to initiatives like the Society of Hospital Medicine's Choosing Wisely campaign, which aims to help reduce inappropriate urinary catheter use. Reducing catheter utilization has the potential to reduce costs associated with caring for CAUTI patients, but more importantly would help reduce CAUTI incidence as well as catheter‐related, noninfectious complications.[13, 14] We hope that our tool will greatly assist hospitals in promoting their CAUTI prevention efforts and improve the overall safety of hospitalized patients.
Disclosures
This project was supported by the Ann Arbor VA Medical Center/University of Michigan Patient Safety Enhancement Program (PSEP) and a subcontract to implement multistate CAUTI prevention with the Agency for Healthcare Research and Quality/Health Educational and Research Trust. Mr. Kennedy has no conflicts of interest to report. Drs. Saint and Greene are subcontracted to implement multistate CAUTI prevention with the Agency for Healthcare Research and Quality/Health Educational and Research Trust. Dr. Saint has received numerous honoraria and speaking fees for lectures on healthcare‐associated infection prevention, implementation science, and patient safety from hospitals, academic medical centers, professional societies, and nonprofit foundations. None of these activities are related to speaker's bureaus. Dr. Saint is also on the medical advisory board of Doximity, a new social networking site for physicians. The views expressed in this article are those of the authors and do not necessarily reflect the position or policy of the Department of Veterans Affairs.
- , , , et al. Estimating health care‐associated infections and deaths in U.S. hospitals, 2002. Public Health Rep. 2007;122:160–166.
- The direct medical costs of healthcare‐associated infections in US hospitals and the benefits of prevention. US Centers for Disease Control and Prevention Web site. Published 2009. Available at: http://www.cdc.gov/HAI/pdfs/hai/Scott_CostPaper.pdf. Accessed March 24, 2013.
- , , , , . Catheter‐associated urinary tract infection and the Medicare rule changes. Ann Intern Med. 2009;150(12):877–884.
- , . Improving use of the other catheter. Arch Intern Med. 2012;172(3):260–261.
- Choosing Wisely: five things patients and physicians should question. Society of Hospital Medicine. Published 2012. Available at: http://www.hospitalmedicine.org/AM/pdf/SHM‐Adult_5things_List_Web.pdf. Accessed March 24, 2013.
- . Clinical and economic consequences of nosocomial catheter‐related bacteriuria. Am J Infect Control. 2000;28(1):68–75.
- CPI Inflation Calculator. United States Department of Labor, Bureau of Labor Statistics Web site. Published 2013. Available at: http://www.bls.gov/data/inflation_calculator.htm. Accessed March 24, 2013.
- , , , et al. Introducing a population‐based outcome measure to evaluate the effect of interventions to reduce catheter‐associated urinary tract infection. Am J Infect Control. 2012;40(4):359–364.
- . Asymptotic Statistics. Cambridge, UK: Cambridge University Press; 2000.
- , , , et al. Effect of establishing guidelines on appropriate urinary catheter placement. Acad Emerg Med. 2010;17:337–340.
- , , , . Systematic review and meta‐analysis: reminder systems to reduce catheter‐associated urinary tract infections and urinary catheter use in hospitalized patients. Clin Infect Dis. 2010;51(5):550–560.
- , , , et al. Raising standards while watching the bottom line: making a business case for infection control. Infect Control Hosp Epidemiol. 2007;28:1121–1133.
- , , , , . Urinary catheters: what type do men and their nurses prefer? J Am Geriatr Soc. 1999;47(12):1453–1457.
- , , . Indwelling urinary catheters: a one‐point restraint? Ann Intern Med. 2002;137(2):125–127.

Avoiding Unplanned Resections of Wrist Sarcomas: An Algorithm for Evaluating Dorsal Wrist Masses
Fecal incontinence: New therapies, age-old problem
Fecal incontinence is a socially embarrassing condition that affects approximately 18 million adults in the United States.1 Its true incidence is likely much higher than reported, however, as many patients are reluctant to discuss it.
A recent study found that nearly 20% of women experience fecal incontinence at least once a year, and 9.5% experience it al least once a month.2 Only 28% of these women had ever discussed their symptoms with a physician, however.3 Women who did seek care were more likely to consult a family physician or internist (75%) than a gynecologist (7%).3
Until recently, few options were available for patients with fecal incontinence who had not benefited from conservative measures. Many patients simply had to live with their symptoms or undergo a diverting ostomy to control the chronic involuntary drainage.
Recent years have seen the development of new minimally invasive and highly successful techniques to treat fecal incontinence. Greater awareness of the prevalence of fecal incontinence and its devastating impact on quality of life is needed for this problem to be fully addressed, however. In this article, we review the recommended evaluation of a patient who reports fecal incontinence and describe the range of treatment options.
Fecal incontinence is a symptom, not a diagnosis
Although the most common historical factor contributing to fecal incontinence is obstetric trauma, there are several other causes of this condition. A detailed history and physical examination are vital to determine whether the patient is experiencing true fecal incontinence, or whether she is leaking for other reasons—so-called pseudo-incontinence.
Conditions that can mimic fecal incontinence include:
- prolapsing hemorrhoids
- anal fistula
- sexually transmitted infection
- benign or malignant anorectal neoplasms
- dermatologic conditions.
True fecal incontinence may be active (loss of stool despite the patient’s best effort to control it) or passive (loss of stool without the patient’s awareness). Among the causes of true fecal incontinence are:
- anal sphincter injury (obstetric tear, anorectal surgery such as fistulotomy, or trauma)
- denervation of the pelvic floor from pudendal nerve injury during childbirth
- chronic rectal prolapse
- neurologic conditions (spina bifida, myelomeningocele)
- noncompliant rectum from inflammatory bowel disease
- radiation proctitis.
The maintenance of continence requires a complex interaction between the sphincter muscle, the puborectalis muscle (which acts as a sling), rectal capacity and compliance, stool volume and frequency, and neurologic mechanisms.
Diagnosis and management require an experienced physician
We believe that patients reporting fecal incontinence are best worked up and managed by a physician who is well versed in the various diagnoses associated with fecal incontinence, as well as the most current treatments.
Diagnosis entails some detective work
When a patient reports fecal incontinence, she should be asked to elaborate on the circumstances surrounding the complaint and the frequency of its occurrence, duration of symptoms, and nature of the incontinence (gas, liquid, or solid).
Validated quality-of-life instruments, such as the Cleveland Clinic Florida Fecal Incontinence Score (CCF-FIS) may be helpful in documenting the severity of the symptoms and improvement after treatment (TABLE).4
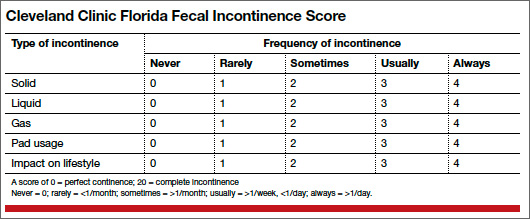
One factor that current scoring systems fail to capture is urgency. In many instances, urgency is the symptom most distressing to the patient. Be sure to ask about it.
A detailed obstetric history also is important. It is not uncommon for a patient to develop symptoms 20 years or longer after the injury. Also review the patient’s medical history for inflammatory bowel disease, neurologic disorders, and any history of pelvic radiation for help in determining the cause of symptoms.
In addition, ask the patient about any other pelvic floor symptoms, such as voiding dysfunction and problems with pelvic organ prolapse. And question her about stool consistency and frequency. In some cases, diarrhea can lead to fecal incontinence and is usually managed conservatively.
Physical exam: Focus on the perineum and anus
A detailed physical examination is warranted to determine the state of the patient’s sphincter musculature and rule out other causes of pseudo-incontinence, such as hemorrhoids or anal fistula. Inspect the perineum for thinning of the perineal body and scars from prior surgery.
A patulous anus may be a sign of rectal prolapse. To check for it, ask the patient to strain on the commode. If rectal prolapse is present, it will become apparent upon straining. If prolapse is detected, surgical treatment of the prolapse would be the first step in managing the incontinence.
A simple test of neurologic function is to try to elicit an anal “wink” in response to a pinprick.
A digital rectal exam allows the assessment of resting and squeeze tone, as well as the use of accessory muscles, such as the gluteus maximus, during squeezing.
Rigid or flexible proctoscopy may be indicated to rule out inflammatory bowel disease, radiation proctitis, and rectal neoplasm, depending on the patient’s history.
A few diagnostic adjuncts can help
Several adjuncts to physical examination can provide more detailed information about the patient’s condition and facilitate the development of an individualized treatment plan. For example, if rectal prolapse, rectocele with delayed emptying, or enterocele is suspected, consider defecography. If voiding dysfunction coexists with the fecal incontinence, urodynamic testing and cystoscopy may be indicated.
We routinely perform physiology testing and endoanal ultrasound if surgery is planned to address the fecal incontinence, although routine use of these adjuncts is controversial. Because many patients can be managed with conservative medical measures, we do not find it necessary to perform these tests at the time of the first visit.
Anal physiology testing includes manometry (a measure of both resting and squeeze tone) and pudendal nerve terminal motor latency testing.
Manometry can help quantify the severity of muscle weakness and determine the presence or absence of normal anal reflexes. Pudendal nerve testing assesses the innervation of the anal sphincter. There is some evidence that patients who have a pudendal neuropathy have a poor outcome with sphincteroplasty,5 although that evidence is controversial. The findings from physiology studies have not been correlated with outcomes of newer treatments, such as sacral neuromodulation (InterStim, Medtronic, Minneapolis, Minnesota). Each physiology lab uses different equipment, so “normal” values vary between institutions.
Endoanal ultrasound is easily performed in an office setting. It is well tolerated and provides anatomic detail of the sphincter musculature. We use a 13-MHz rotating probe to provide 3D imaging of the anal canal. The internal sphincter is represented by a hypoechoic circle surrounded by the hyperechoic external sphincter (FIGURE 1).
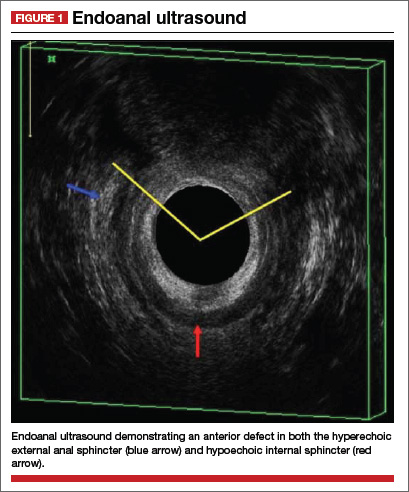
In the hands of an experienced examiner, the sensitivity and specificity of endoanal ultrasound in detecting sphincter defects approaches 100%.6,7 Ultrasound also enables measurement of the perineal body. A normal perineal body measures 10 to 15 mm.
For treatment, try conservative measures first
Bulking agents (fiber), constipating agents (loperamide, etc.), or a laxative regimen with scheduled disimpactions (in patients who have pelvic outlet constipation and overflow incontinence) often can control the symptoms of fecal incontinence, making further interventions unnecessary.
Biofeedback is another option. It uses visual, auditory, and sensory information to train patients to better control anal sphincter muscle function.
A recent randomized study found manometric biofeedback to be superior to simple Kegel exercises in improving fecal continence.8 In this study, 76% of patients in the biofeedback group experienced symptom improvement, compared with 41% of patients in the pelvic floor exercise group (P <.001). The long-term benefits of biofeedback are less clear, and patients often need to be reminded to perform their exercises at home and to attend occasional refresher-training sessions. Nevertheless, biofeedback is an important noninvasive option for patients in whom medical management has failed.
Minimally invasive options are now available
Over the past 2 years, minimally invasive treatments for fecal incontinence have emerged, including an implantable sacral neuromodulation device (InterStim) and an injectable dextranomer (Solesta; Salix Pharmaceuticals, Raleigh, North Carolina). Previously, the only surgical option for fecal incontinence was a sphincter repair if a defect was present. The new options may help patients improve their quality of life without having to undergo major surgery.
No one has directly compared the outcomes of these procedures when they are performed by a colorectal surgeon versus a physician of another specialty. It is our belief that the treating physician should have a strong interest in caring for these complex patients and a good working knowledge of the various treatment options.
Related Article Obstetric anal sphincter injury: 7 critical questions about care Ranee Thakar, MD, MRCOG (February 2008)
Sacral neuromodulation
This technique initially was developed for the treatment of overactive bladder and nonobstructive urinary retention and has been used in the United States for the past 15 years for these indications. Improvement in fecal continence was observed in these patients, prompting further studies of its efficacy. In 2011, it was approved by the US Food and Drug Administration (FDA) for the treatment of fecal incontinence. It has since revolutionized the treatment of this disorder, offering a minimally invasive and highly successful alternative to sphincteroplasty.
The InterStim procedure is the only therapeutic modality to include a test phase. The outpatient procedure involves sterile placement of an electrode through the S3 foramen to stimulate the S3 nerve root using fluoroscopic guidance (FIGURES 2 and 3). Patients who experience at least 50% improvement in symptoms are then offered placement of a permanent stimulator.
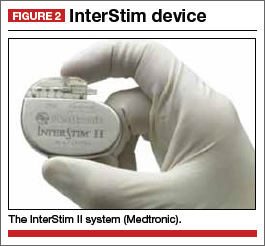
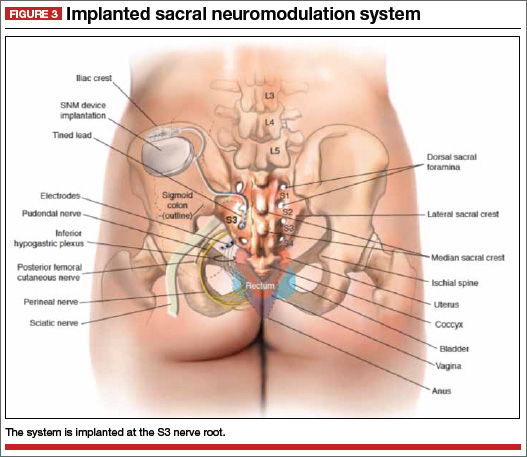
In most series, approximately 90% of patients have a positive test and progress to implantation. A recent US multicenter clinical trial indicated that 86% of patients achieved an improvement in continence of at least 50%, and 40% of patients were completely continent at 3 years.9 The number of episodes of incontinence decreased from a mean of 9.4/week to 1.7/week.9 Quality of life also improved greatly. Few complications have been reported, the most notable of which is infection (10.8% in the US multicenter trial9).
Another advantage of sacral neuromodulation: It can be used successfully in patients with external sphincter defects as large as 120º. A study by Tjandra and colleagues found that 65% of patients experienced improvement in symptoms of at least 50%, and 47% of patients (more than 50% of whom had external sphincter defects as large as 120º) became completely continent.10
The only variable shown to predict success with sacral neuromodulation is a positive response to the test implant procedure.
In our experience, this procedure is easy to perform and well tolerated, even in elderly patients with multiple comorbidities. The procedure has the additional advantage of potentially improving concomitant urinary symptoms as well.
The major disadvantage of sacral neuromodulation is its cost, although most major insurance carriers cover it. There is no well-conducted cost-effectiveness analysis comparing this modality to other treatments.
Related Article Interstim: An implantable device for implacable urinary symptoms Deborah L. Myers, MD (October 2006)
Injectable agents
Several biocompatible bulking agents have been tested in the treatment of fecal incontinence. These compounds traditionally have been used to treat mild fecal incontinence, or to treat patients with isolated internal sphincter defects.
More recently, an injectable dextranomer in stabilized hyaluronic acid was approved by the FDA and marketed as Solesta. Graf and colleagues randomly allocated 136 patients to injection and 70 patients to sham injection. Patients with external sphincter defects were excluded. At 6 months, 52% of patients in the active treatment group experienced an improvement in continence of at least 50%, compared with 31% of patients injected with placebo.11
The advantage of this procedure is its minimally invasive nature (submucosal injection performed in the office). The disadvantage: a lack of long-term efficacy data, although unpublished data suggest that patients who improve after an injection see a durable response at 3 years.
This easy, office-based treatment is ideal for patients with minor incontinence or persistent symptoms after another procedure.
Sphincter repair
Anterior sphincteroplasty has been the mainstay of surgical treatment for patients with a sphincter defect. With the patient in a dorsal lithotomy or prone position on the operating-room table, a transverse perineal incision is made, and the ends of the severed sphincter muscle are located and mobilized. The repair then can be performed in an end-to-end manner or by overlapping the muscles in the anterior midline (FIGURE 4).
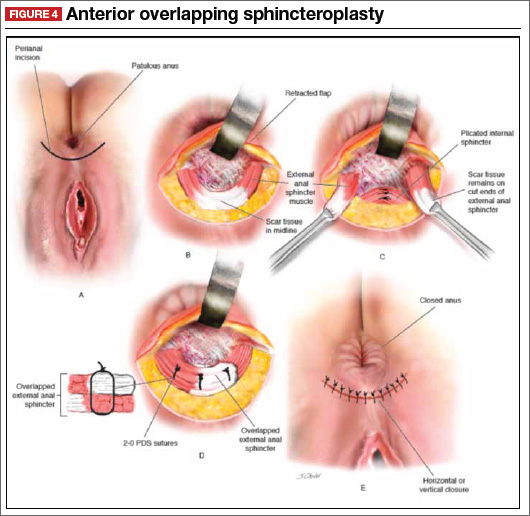
Some of the debatable technical issues of this procedure include:
- whether to overlap the muscles or scar tissue
- whether to repair internal and external defects together or separately
- how the age of the patient affects the outcome.
In regard to the first issue, there may be a superior outcome with overlapping repairs, but they carry a higher risk of dyspareunia and evacuation difficulties. Some surgeons will attempt a separate repair of the internal and external sphincter muscles if it appears feasible. Most often, both muscles are tethered together with scar tissue and separate repair is not possible. There are no conclusive data to demonstrate the superiority of either approach.
As for age, the traditional teaching was that older patients do not benefit from this procedure as much as younger patients do. However, a recent study found no differences in the CCF-FIS score in patients older than age 60, compared with younger patients.12 Investigators concluded that sphincteroplasty can be offered to both young and older patients.12
Although sphincteroplasty often leads to excellent short-term improvement, with 60% to 90% of patients experiencing a good or excellent outcome, nearly all series indicate a decline over the long term (>5 years). A recent systematic review found that as few as 12% of patients experience a good or excellent result, depending on the series.13
We offer sphincter repair to young women with a new sphincter defect after delivery. For older patients, we offer sacral neuromodulation as a first-line treatment.
Other surgical options
We believe that most patients with fecal incontinence can be managed using conservative measures, sacral neuromodulation, injectable dextranomer, or sphincter repair. However, several other options are available.
Artificial bowel sphincter
The artificial bowel sphincter was first described in 1987 and has been modified over the years. The system currently is marketed as the Acticon Neosphincter (American Medical Systems, Minnetonka, Minnesota). The procedure involves the creation of a subcutaneous tunnel around the anus so that an inflatable cuff can be positioned there. A pump then is tunneled through a Pfannenstiel incision to the labia or scrotum, and a reservoir is positioned in the space of Retzius. The device maintains continence by keeping the cuff inflated during the resting state and by pumping fluid from the cuff to the reservoir when the patient needs to evacuate.
The major barrier to utilization of the artificial bowel sphincter is infection. In a series of 112 patients who were implanted with the sphincter, 384 device-related adverse events occurred in 99 patients.14 A total of 73 revision operations were required in 51 patients (46%). Twenty-five percent of patients developed infection that required surgical revision, and 37% had the device explanted. Eighty-five percent of patients with a functional device had a successful outcome.14
Given the device-related challenges and infectious complications, patients should be considered for less invasive treatments before being offered an artificial bowel
sphincter.
Radiofrequency current
The Secca procedure (Curon Medical, Fremont, California) involves the application of radiofrequency current to the anal canal to generate thermal energy. This procedure causes contraction of collagen fibers, which are permanently shortened, and leads to tightening of the muscle. It is performed under intravenous sedation on an outpatient basis.
This approach is indicated for patients with mild to moderate fecal incontinence who have not responded to conservative management. An external sphincter defect is a contraindication.
Small, nonrandomized studies have found improvement in the CCF-FIS score in patients treated with this approach.15 The major limitation of this treatment is the lack of high-level clinical evidence demonstrating its efficacy and safety.
Antegrade continence enema
This approach, also known as the Malone procedure, is usually reserved for debilitating incontinence or constipation in the pediatric population. An appendicostomy is constructed at the navel, allowing daily introduction of a catheter and antegrade enema. The purpose is to perform rapid, controlled emptying of the colon at times chosen by the patient. It is also reserved as a last resort for patients considering an ostomy.
Adult patients with neurologic problems, such as spina bifida, may be candidates for this procedure, provided they are highly motivated.
Fecal diversion
Creation of a colostomy or ileostomy is usually the last resort for a patient with fecal incontinence. We are fortunate that there are an increasing number of options that may improve the patient’s condition before colostomy is required.
If fecal diversion is chosen by the patient, it is important to involve an enterostomal therapist for site marking and patient education. A well-constructed ostomy is essential, as this option often is permanent.
Up and coming options
A novel treatment approach for fecal incontinence is the magnetic anal sphincter. The device, marketed as the FENIX Continence Restoration System (Torax Medical, Shoreview, Minnesota) consists of a series of titanium beads with magnetic cores that are interlinked with titanium wires. The device is designed to encircle the external anal sphincter muscle, reinforce the sphincter, and expand to allow passage of stool at a socially appropriate time.
Preliminary data from 16 patients indicate a mean decrease in the number of episodes of incontinence from 7.2/week to 0.7/week, as well as a mean reduction in the CCF-FIS score from 17.2 to 8.7.16 Two devices were removed due to infection, and one device passed spontaneously after disconnection of the suture.16
This device is not approved by the FDA, but it may become a promising treatment if its safety and efficacy can be established in larger clinical trials.
The TOPAS sling (American Medical Systems) is currently being studied in a Phase 3, multicenter, nonrandomized, clinical trial (NCT01090739) for the treatment of fecal incontinence.17 The sling is implanted using a minimally invasive transobturator approach; two needle-passers deliver the sling assembly. Two small posterior incisions facilitate the postanal placement of the mesh.
This procedure replicates the anorectal angle created by the puborectalis muscle. Although it may become a minimally invasive treatment in the future, final results of the Phase 3 trial are not expected until 2016.
Tibial nerve stimulation is commonly used for urinary urge incontinence. Several small series have documented modest success with its application to fecal incontinence.18
The outpatient procedure involves the insertion of a needle electrode three fingerbreadths above the medial malleolus, followed by electrical stimulation. The current is slowly increased until a sensory or motor response (tingling under the sole of the foot or great toe plantar flexion) is elicited. Treatment necessitates several outpatient sessions.
In a recent series, the mean CCF-FIS decreased from 12.2/20 at baseline to 9.1/20 after treatment (P <.0001).18
The role of this procedure in the treatment algorithm for fecal incontinence remains to be determined.
What we offer patients
Fecal incontinence is a debilitating condition with an increasing number of potential therapeutic options. It clearly is under-recognized by patients and physicians alike.
After a thorough work-up, conservative treatment options should be offered first. When those fail, we generally recommend a trial of sacral neuromodulation for patients with no sphincter defect. When a sphincter defect is present, we counsel the patient about the merits of sphincter repair versus a trial of neuromodulation. These options have the most robust data supporting their clinical use, and have been used successfully in our own practices.
Given the continuous development of other therapeutic modalities, it is likely that future treatments will involve a stepwise progression of approaches. The need for colostomy should diminish in coming years as more minimally invasive techniques become available.
- Whitehead WE, Borrud L, Goode PS, et al. Fecal incontinence in US adults: epidemiology and risk factors. Gastroenterology. 2009;137(2):512–517.
- Brown HW, Wexner SD, Segall MM, et al. Accidental bowel leakage in the mature women’s health study: prevalence and predictors. Int Clin Pract. 2012;66(11):1101–1108.
- Brown HW, Wexner SD, Segall MM, et al. Quality of life in women with accidental bowel leakage. Int Clin Pract. 2012;66(11):1109–1116.
- Jorge JM, Wexner SD. Etiology and management of fecal incontinence. Dis Colon Rectum. 1993;36(1):77–97.
- Sangwan YP, Collar JA, Barrett RC, et al. Unilateral pudendal neuropathy. Impact on outcomes of anal sphincter repair. Dis Colon Rectum. 1996;39(6):686–689.
- Deen KI, Kumar D, Williams JG, et al. Anal sphincter defects. Correlation between endoanal ultrasound and surgery. Ann Surg. 1993;218(2):201–205.
- Oberwalder M, Thaler K, Baig MK, et al. Anal ultrasound and endosonographic measurement of perineal body thickness: a new evaluation for fecal incontinence in females. Surg Endosc. 2004;18(4):650–654.
- Heymen S, Scarlett Y, Jones K, et al. Randomized controlled trial shows biofeedback to be superior to pelvic floor exercises for fecal incontinence. Dis Colon Rectum. 2009;52(10):1730–1737.
- Mellgren AF, Wexner SD, Coller JA, et al. Long-term efficacy and safety of sacral nerve stimulation for fecal incontinence. Dis Colon Rectum. 2011:54(9):1065–1075.
- Tjandra JJ, Chan MK, Yeh CH, et al. Sacral nerve stimulation is more effective than optimal medical therapy for severe fecal incontinence: a randomized, controlled study. Dis Colon Rectum. 2008;51(5):494–502.
- Graf W, Mellgren A, Matzel K, et al. Efficacy of a dextranomer in stabilized hyaluronic acid for treatment of faecal incontinence: a randomized, sham-controlled trial. Lancet. 2011;377(9770):997–1003.
- El-Gazzaz G, Zutshi M, Hannaway C, Gurland B, Hull T. Overlapping sphincter repair: does age matter? Dis Colon Rectum. 2012;55(3):256–261.
- Glasgow SC, Lowry AC. Long-term outcomes of anal sphincter repair for fecal incontinence: a systematic review. Dis Colon Rectum. 2012;55(4):482–490.
- Wong WD, Congliosi SM, Spencer MP, et al. The safety and efficacy of the artificial bowel sphincter for fecal incontinence: results from a multicenter cohort study. Dis Colon Rectum. 2002;45(9):1139–1153.
- Takahashi T, Morales M, Garcia-Osogobio S, et al. Secca procedure for the treatment of fecal incontinence: results of five-year follow-up. Dis Colon Rectum. 2008;51(3):355–359.
- Lehur PA, McNevin S, Buntzen S, et al. Magnetic anal sphincter augmentation for the treatment of fecal incontinence: a preliminary report from a feasibility study. Dis Colon Rectum. 2010;53(12):1604–1610.
- TOPAS sling. http://clinicaltrials.gov/ct2/show/NCT01090739. Accessed August 26, 2013.
- Hotouras A, Thaha MA, Allison ME, et al. Percutaneous tibial nerve stimulation (PTNS) in females with faecal incontinence: the impact of sphincter morphology and rectal sensation on the clinical outcome. Int J Colorectal Dis. 2012;27(7):927–930.
Fecal incontinence is a socially embarrassing condition that affects approximately 18 million adults in the United States.1 Its true incidence is likely much higher than reported, however, as many patients are reluctant to discuss it.
A recent study found that nearly 20% of women experience fecal incontinence at least once a year, and 9.5% experience it al least once a month.2 Only 28% of these women had ever discussed their symptoms with a physician, however.3 Women who did seek care were more likely to consult a family physician or internist (75%) than a gynecologist (7%).3
Until recently, few options were available for patients with fecal incontinence who had not benefited from conservative measures. Many patients simply had to live with their symptoms or undergo a diverting ostomy to control the chronic involuntary drainage.
Recent years have seen the development of new minimally invasive and highly successful techniques to treat fecal incontinence. Greater awareness of the prevalence of fecal incontinence and its devastating impact on quality of life is needed for this problem to be fully addressed, however. In this article, we review the recommended evaluation of a patient who reports fecal incontinence and describe the range of treatment options.
Fecal incontinence is a symptom, not a diagnosis
Although the most common historical factor contributing to fecal incontinence is obstetric trauma, there are several other causes of this condition. A detailed history and physical examination are vital to determine whether the patient is experiencing true fecal incontinence, or whether she is leaking for other reasons—so-called pseudo-incontinence.
Conditions that can mimic fecal incontinence include:
- prolapsing hemorrhoids
- anal fistula
- sexually transmitted infection
- benign or malignant anorectal neoplasms
- dermatologic conditions.
True fecal incontinence may be active (loss of stool despite the patient’s best effort to control it) or passive (loss of stool without the patient’s awareness). Among the causes of true fecal incontinence are:
- anal sphincter injury (obstetric tear, anorectal surgery such as fistulotomy, or trauma)
- denervation of the pelvic floor from pudendal nerve injury during childbirth
- chronic rectal prolapse
- neurologic conditions (spina bifida, myelomeningocele)
- noncompliant rectum from inflammatory bowel disease
- radiation proctitis.
The maintenance of continence requires a complex interaction between the sphincter muscle, the puborectalis muscle (which acts as a sling), rectal capacity and compliance, stool volume and frequency, and neurologic mechanisms.
Diagnosis and management require an experienced physician
We believe that patients reporting fecal incontinence are best worked up and managed by a physician who is well versed in the various diagnoses associated with fecal incontinence, as well as the most current treatments.
Diagnosis entails some detective work
When a patient reports fecal incontinence, she should be asked to elaborate on the circumstances surrounding the complaint and the frequency of its occurrence, duration of symptoms, and nature of the incontinence (gas, liquid, or solid).
Validated quality-of-life instruments, such as the Cleveland Clinic Florida Fecal Incontinence Score (CCF-FIS) may be helpful in documenting the severity of the symptoms and improvement after treatment (TABLE).4
One factor that current scoring systems fail to capture is urgency. In many instances, urgency is the symptom most distressing to the patient. Be sure to ask about it.
A detailed obstetric history also is important. It is not uncommon for a patient to develop symptoms 20 years or longer after the injury. Also review the patient’s medical history for inflammatory bowel disease, neurologic disorders, and any history of pelvic radiation for help in determining the cause of symptoms.
In addition, ask the patient about any other pelvic floor symptoms, such as voiding dysfunction and problems with pelvic organ prolapse. And question her about stool consistency and frequency. In some cases, diarrhea can lead to fecal incontinence and is usually managed conservatively.
Physical exam: Focus on the perineum and anus
A detailed physical examination is warranted to determine the state of the patient’s sphincter musculature and rule out other causes of pseudo-incontinence, such as hemorrhoids or anal fistula. Inspect the perineum for thinning of the perineal body and scars from prior surgery.
A patulous anus may be a sign of rectal prolapse. To check for it, ask the patient to strain on the commode. If rectal prolapse is present, it will become apparent upon straining. If prolapse is detected, surgical treatment of the prolapse would be the first step in managing the incontinence.
A simple test of neurologic function is to try to elicit an anal “wink” in response to a pinprick.
A digital rectal exam allows the assessment of resting and squeeze tone, as well as the use of accessory muscles, such as the gluteus maximus, during squeezing.
Rigid or flexible proctoscopy may be indicated to rule out inflammatory bowel disease, radiation proctitis, and rectal neoplasm, depending on the patient’s history.
A few diagnostic adjuncts can help
Several adjuncts to physical examination can provide more detailed information about the patient’s condition and facilitate the development of an individualized treatment plan. For example, if rectal prolapse, rectocele with delayed emptying, or enterocele is suspected, consider defecography. If voiding dysfunction coexists with the fecal incontinence, urodynamic testing and cystoscopy may be indicated.
We routinely perform physiology testing and endoanal ultrasound if surgery is planned to address the fecal incontinence, although routine use of these adjuncts is controversial. Because many patients can be managed with conservative medical measures, we do not find it necessary to perform these tests at the time of the first visit.
Anal physiology testing includes manometry (a measure of both resting and squeeze tone) and pudendal nerve terminal motor latency testing.
Manometry can help quantify the severity of muscle weakness and determine the presence or absence of normal anal reflexes. Pudendal nerve testing assesses the innervation of the anal sphincter. There is some evidence that patients who have a pudendal neuropathy have a poor outcome with sphincteroplasty,5 although that evidence is controversial. The findings from physiology studies have not been correlated with outcomes of newer treatments, such as sacral neuromodulation (InterStim, Medtronic, Minneapolis, Minnesota). Each physiology lab uses different equipment, so “normal” values vary between institutions.
Endoanal ultrasound is easily performed in an office setting. It is well tolerated and provides anatomic detail of the sphincter musculature. We use a 13-MHz rotating probe to provide 3D imaging of the anal canal. The internal sphincter is represented by a hypoechoic circle surrounded by the hyperechoic external sphincter (FIGURE 1).
In the hands of an experienced examiner, the sensitivity and specificity of endoanal ultrasound in detecting sphincter defects approaches 100%.6,7 Ultrasound also enables measurement of the perineal body. A normal perineal body measures 10 to 15 mm.
For treatment, try conservative measures first
Bulking agents (fiber), constipating agents (loperamide, etc.), or a laxative regimen with scheduled disimpactions (in patients who have pelvic outlet constipation and overflow incontinence) often can control the symptoms of fecal incontinence, making further interventions unnecessary.
Biofeedback is another option. It uses visual, auditory, and sensory information to train patients to better control anal sphincter muscle function.
A recent randomized study found manometric biofeedback to be superior to simple Kegel exercises in improving fecal continence.8 In this study, 76% of patients in the biofeedback group experienced symptom improvement, compared with 41% of patients in the pelvic floor exercise group (P <.001). The long-term benefits of biofeedback are less clear, and patients often need to be reminded to perform their exercises at home and to attend occasional refresher-training sessions. Nevertheless, biofeedback is an important noninvasive option for patients in whom medical management has failed.
Minimally invasive options are now available
Over the past 2 years, minimally invasive treatments for fecal incontinence have emerged, including an implantable sacral neuromodulation device (InterStim) and an injectable dextranomer (Solesta; Salix Pharmaceuticals, Raleigh, North Carolina). Previously, the only surgical option for fecal incontinence was a sphincter repair if a defect was present. The new options may help patients improve their quality of life without having to undergo major surgery.
No one has directly compared the outcomes of these procedures when they are performed by a colorectal surgeon versus a physician of another specialty. It is our belief that the treating physician should have a strong interest in caring for these complex patients and a good working knowledge of the various treatment options.
Related Article Obstetric anal sphincter injury: 7 critical questions about care Ranee Thakar, MD, MRCOG (February 2008)
Sacral neuromodulation
This technique initially was developed for the treatment of overactive bladder and nonobstructive urinary retention and has been used in the United States for the past 15 years for these indications. Improvement in fecal continence was observed in these patients, prompting further studies of its efficacy. In 2011, it was approved by the US Food and Drug Administration (FDA) for the treatment of fecal incontinence. It has since revolutionized the treatment of this disorder, offering a minimally invasive and highly successful alternative to sphincteroplasty.
The InterStim procedure is the only therapeutic modality to include a test phase. The outpatient procedure involves sterile placement of an electrode through the S3 foramen to stimulate the S3 nerve root using fluoroscopic guidance (FIGURES 2 and 3). Patients who experience at least 50% improvement in symptoms are then offered placement of a permanent stimulator.
In most series, approximately 90% of patients have a positive test and progress to implantation. A recent US multicenter clinical trial indicated that 86% of patients achieved an improvement in continence of at least 50%, and 40% of patients were completely continent at 3 years.9 The number of episodes of incontinence decreased from a mean of 9.4/week to 1.7/week.9 Quality of life also improved greatly. Few complications have been reported, the most notable of which is infection (10.8% in the US multicenter trial9).
Another advantage of sacral neuromodulation: It can be used successfully in patients with external sphincter defects as large as 120º. A study by Tjandra and colleagues found that 65% of patients experienced improvement in symptoms of at least 50%, and 47% of patients (more than 50% of whom had external sphincter defects as large as 120º) became completely continent.10
The only variable shown to predict success with sacral neuromodulation is a positive response to the test implant procedure.
In our experience, this procedure is easy to perform and well tolerated, even in elderly patients with multiple comorbidities. The procedure has the additional advantage of potentially improving concomitant urinary symptoms as well.
The major disadvantage of sacral neuromodulation is its cost, although most major insurance carriers cover it. There is no well-conducted cost-effectiveness analysis comparing this modality to other treatments.
Related Article Interstim: An implantable device for implacable urinary symptoms Deborah L. Myers, MD (October 2006)
Injectable agents
Several biocompatible bulking agents have been tested in the treatment of fecal incontinence. These compounds traditionally have been used to treat mild fecal incontinence, or to treat patients with isolated internal sphincter defects.
More recently, an injectable dextranomer in stabilized hyaluronic acid was approved by the FDA and marketed as Solesta. Graf and colleagues randomly allocated 136 patients to injection and 70 patients to sham injection. Patients with external sphincter defects were excluded. At 6 months, 52% of patients in the active treatment group experienced an improvement in continence of at least 50%, compared with 31% of patients injected with placebo.11
The advantage of this procedure is its minimally invasive nature (submucosal injection performed in the office). The disadvantage: a lack of long-term efficacy data, although unpublished data suggest that patients who improve after an injection see a durable response at 3 years.
This easy, office-based treatment is ideal for patients with minor incontinence or persistent symptoms after another procedure.
Sphincter repair
Anterior sphincteroplasty has been the mainstay of surgical treatment for patients with a sphincter defect. With the patient in a dorsal lithotomy or prone position on the operating-room table, a transverse perineal incision is made, and the ends of the severed sphincter muscle are located and mobilized. The repair then can be performed in an end-to-end manner or by overlapping the muscles in the anterior midline (FIGURE 4).
Some of the debatable technical issues of this procedure include:
- whether to overlap the muscles or scar tissue
- whether to repair internal and external defects together or separately
- how the age of the patient affects the outcome.
In regard to the first issue, there may be a superior outcome with overlapping repairs, but they carry a higher risk of dyspareunia and evacuation difficulties. Some surgeons will attempt a separate repair of the internal and external sphincter muscles if it appears feasible. Most often, both muscles are tethered together with scar tissue and separate repair is not possible. There are no conclusive data to demonstrate the superiority of either approach.
As for age, the traditional teaching was that older patients do not benefit from this procedure as much as younger patients do. However, a recent study found no differences in the CCF-FIS score in patients older than age 60, compared with younger patients.12 Investigators concluded that sphincteroplasty can be offered to both young and older patients.12
Although sphincteroplasty often leads to excellent short-term improvement, with 60% to 90% of patients experiencing a good or excellent outcome, nearly all series indicate a decline over the long term (>5 years). A recent systematic review found that as few as 12% of patients experience a good or excellent result, depending on the series.13
We offer sphincter repair to young women with a new sphincter defect after delivery. For older patients, we offer sacral neuromodulation as a first-line treatment.
Other surgical options
We believe that most patients with fecal incontinence can be managed using conservative measures, sacral neuromodulation, injectable dextranomer, or sphincter repair. However, several other options are available.
Artificial bowel sphincter
The artificial bowel sphincter was first described in 1987 and has been modified over the years. The system currently is marketed as the Acticon Neosphincter (American Medical Systems, Minnetonka, Minnesota). The procedure involves the creation of a subcutaneous tunnel around the anus so that an inflatable cuff can be positioned there. A pump then is tunneled through a Pfannenstiel incision to the labia or scrotum, and a reservoir is positioned in the space of Retzius. The device maintains continence by keeping the cuff inflated during the resting state and by pumping fluid from the cuff to the reservoir when the patient needs to evacuate.
The major barrier to utilization of the artificial bowel sphincter is infection. In a series of 112 patients who were implanted with the sphincter, 384 device-related adverse events occurred in 99 patients.14 A total of 73 revision operations were required in 51 patients (46%). Twenty-five percent of patients developed infection that required surgical revision, and 37% had the device explanted. Eighty-five percent of patients with a functional device had a successful outcome.14
Given the device-related challenges and infectious complications, patients should be considered for less invasive treatments before being offered an artificial bowel
sphincter.
Radiofrequency current
The Secca procedure (Curon Medical, Fremont, California) involves the application of radiofrequency current to the anal canal to generate thermal energy. This procedure causes contraction of collagen fibers, which are permanently shortened, and leads to tightening of the muscle. It is performed under intravenous sedation on an outpatient basis.
This approach is indicated for patients with mild to moderate fecal incontinence who have not responded to conservative management. An external sphincter defect is a contraindication.
Small, nonrandomized studies have found improvement in the CCF-FIS score in patients treated with this approach.15 The major limitation of this treatment is the lack of high-level clinical evidence demonstrating its efficacy and safety.
Antegrade continence enema
This approach, also known as the Malone procedure, is usually reserved for debilitating incontinence or constipation in the pediatric population. An appendicostomy is constructed at the navel, allowing daily introduction of a catheter and antegrade enema. The purpose is to perform rapid, controlled emptying of the colon at times chosen by the patient. It is also reserved as a last resort for patients considering an ostomy.
Adult patients with neurologic problems, such as spina bifida, may be candidates for this procedure, provided they are highly motivated.
Fecal diversion
Creation of a colostomy or ileostomy is usually the last resort for a patient with fecal incontinence. We are fortunate that there are an increasing number of options that may improve the patient’s condition before colostomy is required.
If fecal diversion is chosen by the patient, it is important to involve an enterostomal therapist for site marking and patient education. A well-constructed ostomy is essential, as this option often is permanent.
Up and coming options
A novel treatment approach for fecal incontinence is the magnetic anal sphincter. The device, marketed as the FENIX Continence Restoration System (Torax Medical, Shoreview, Minnesota) consists of a series of titanium beads with magnetic cores that are interlinked with titanium wires. The device is designed to encircle the external anal sphincter muscle, reinforce the sphincter, and expand to allow passage of stool at a socially appropriate time.
Preliminary data from 16 patients indicate a mean decrease in the number of episodes of incontinence from 7.2/week to 0.7/week, as well as a mean reduction in the CCF-FIS score from 17.2 to 8.7.16 Two devices were removed due to infection, and one device passed spontaneously after disconnection of the suture.16
This device is not approved by the FDA, but it may become a promising treatment if its safety and efficacy can be established in larger clinical trials.
The TOPAS sling (American Medical Systems) is currently being studied in a Phase 3, multicenter, nonrandomized, clinical trial (NCT01090739) for the treatment of fecal incontinence.17 The sling is implanted using a minimally invasive transobturator approach; two needle-passers deliver the sling assembly. Two small posterior incisions facilitate the postanal placement of the mesh.
This procedure replicates the anorectal angle created by the puborectalis muscle. Although it may become a minimally invasive treatment in the future, final results of the Phase 3 trial are not expected until 2016.
Tibial nerve stimulation is commonly used for urinary urge incontinence. Several small series have documented modest success with its application to fecal incontinence.18
The outpatient procedure involves the insertion of a needle electrode three fingerbreadths above the medial malleolus, followed by electrical stimulation. The current is slowly increased until a sensory or motor response (tingling under the sole of the foot or great toe plantar flexion) is elicited. Treatment necessitates several outpatient sessions.
In a recent series, the mean CCF-FIS decreased from 12.2/20 at baseline to 9.1/20 after treatment (P <.0001).18
The role of this procedure in the treatment algorithm for fecal incontinence remains to be determined.
What we offer patients
Fecal incontinence is a debilitating condition with an increasing number of potential therapeutic options. It clearly is under-recognized by patients and physicians alike.
After a thorough work-up, conservative treatment options should be offered first. When those fail, we generally recommend a trial of sacral neuromodulation for patients with no sphincter defect. When a sphincter defect is present, we counsel the patient about the merits of sphincter repair versus a trial of neuromodulation. These options have the most robust data supporting their clinical use, and have been used successfully in our own practices.
Given the continuous development of other therapeutic modalities, it is likely that future treatments will involve a stepwise progression of approaches. The need for colostomy should diminish in coming years as more minimally invasive techniques become available.
- Whitehead WE, Borrud L, Goode PS, et al. Fecal incontinence in US adults: epidemiology and risk factors. Gastroenterology. 2009;137(2):512–517.
- Brown HW, Wexner SD, Segall MM, et al. Accidental bowel leakage in the mature women’s health study: prevalence and predictors. Int Clin Pract. 2012;66(11):1101–1108.
- Brown HW, Wexner SD, Segall MM, et al. Quality of life in women with accidental bowel leakage. Int Clin Pract. 2012;66(11):1109–1116.
- Jorge JM, Wexner SD. Etiology and management of fecal incontinence. Dis Colon Rectum. 1993;36(1):77–97.
- Sangwan YP, Collar JA, Barrett RC, et al. Unilateral pudendal neuropathy. Impact on outcomes of anal sphincter repair. Dis Colon Rectum. 1996;39(6):686–689.
- Deen KI, Kumar D, Williams JG, et al. Anal sphincter defects. Correlation between endoanal ultrasound and surgery. Ann Surg. 1993;218(2):201–205.
- Oberwalder M, Thaler K, Baig MK, et al. Anal ultrasound and endosonographic measurement of perineal body thickness: a new evaluation for fecal incontinence in females. Surg Endosc. 2004;18(4):650–654.
- Heymen S, Scarlett Y, Jones K, et al. Randomized controlled trial shows biofeedback to be superior to pelvic floor exercises for fecal incontinence. Dis Colon Rectum. 2009;52(10):1730–1737.
- Mellgren AF, Wexner SD, Coller JA, et al. Long-term efficacy and safety of sacral nerve stimulation for fecal incontinence. Dis Colon Rectum. 2011:54(9):1065–1075.
- Tjandra JJ, Chan MK, Yeh CH, et al. Sacral nerve stimulation is more effective than optimal medical therapy for severe fecal incontinence: a randomized, controlled study. Dis Colon Rectum. 2008;51(5):494–502.
- Graf W, Mellgren A, Matzel K, et al. Efficacy of a dextranomer in stabilized hyaluronic acid for treatment of faecal incontinence: a randomized, sham-controlled trial. Lancet. 2011;377(9770):997–1003.
- El-Gazzaz G, Zutshi M, Hannaway C, Gurland B, Hull T. Overlapping sphincter repair: does age matter? Dis Colon Rectum. 2012;55(3):256–261.
- Glasgow SC, Lowry AC. Long-term outcomes of anal sphincter repair for fecal incontinence: a systematic review. Dis Colon Rectum. 2012;55(4):482–490.
- Wong WD, Congliosi SM, Spencer MP, et al. The safety and efficacy of the artificial bowel sphincter for fecal incontinence: results from a multicenter cohort study. Dis Colon Rectum. 2002;45(9):1139–1153.
- Takahashi T, Morales M, Garcia-Osogobio S, et al. Secca procedure for the treatment of fecal incontinence: results of five-year follow-up. Dis Colon Rectum. 2008;51(3):355–359.
- Lehur PA, McNevin S, Buntzen S, et al. Magnetic anal sphincter augmentation for the treatment of fecal incontinence: a preliminary report from a feasibility study. Dis Colon Rectum. 2010;53(12):1604–1610.
- TOPAS sling. http://clinicaltrials.gov/ct2/show/NCT01090739. Accessed August 26, 2013.
- Hotouras A, Thaha MA, Allison ME, et al. Percutaneous tibial nerve stimulation (PTNS) in females with faecal incontinence: the impact of sphincter morphology and rectal sensation on the clinical outcome. Int J Colorectal Dis. 2012;27(7):927–930.
Oops! Did we miss something?
Attention deficit is a common diagnosis with which many pediatricians are faced. In the more common scenario, the child presents anywhere from age 5 to 10 years with parental and teacher complaint of hyperactivity or academic underachievement. But, what do you do with the child who presents at age 11 years or high school age with no significant history of school failure or behavior issues? Is this a child whose symptoms were overlooked? New-onset inattention? Are they seeking medication to augment their intellectual ability to become more competitive? Or are they just drug seeking? Well, the truth is that any one of the above could be true, and only through careful analysis can you obtain the proper diagnosis.
For the adolescent that meets the DSM-IV criteria for attention-deficit/hyperactivity disorder (ADHD), it is possible that they have learned to compensate for their inattention and have been successful in maintaining a good grade-point average. Through detailed questioning about study habits and home environment, they likely required a lot of support from their parents to maintain organization and from tutors. Many children without comorbid conditions are very intelligent and are able to keep up with the course load until they reach high school. The demands for independence and the amount of class work required start to become overwhelming and grades start to decline. These children tend to do very well on stimulant medication.

Now for the child who presents with absolutely no past history of inattention, disorganization, hyperactivity, or impulsive behavior, it is important to do a detailed physical exam looking for symptoms that are consistent with Wilson’s disease, hyperthyroidism, or drug use. A careful social history will identify symptoms of depression, anxiety, and disruption within the home such as divorce, domestic violence, etc. Questions regarding school and social pressure such as bullying also are important to ask to identify a cause for the acute onset of inattention.
Red flags should be raised with a teen who has socially withdrawn, has defiant or high risk taking behaviors, and a history of illicit drug use. According to a study published in the British Journal of Psychiatry, stimulant used as prescribed actually lowers the risk of substance abuse (Br. J. Psychiatry 2013 [doi:10.1192/bjp.bp.112.124784]). But according to the National Institute of Drug Abuse, teens are using the stimulants to get a high by snorting or injecting the stimulant, making Adderall a hot commodity on college campuses. Stimulants are also used to "cram" for tests so teens are taking them to stay awake to study. Stimulants coupled with excessive caffeine lead to increased heart rates and blood pressure, as well as panic attacks. The DAWN Report (Drug Abuse Warning Network) published a warning on Jan. 24, 2013, stating that the number of emergency room visits increased threefold in young adults over the age of 18 years. Only a small increase was noted in teens aged 12-17 years, but they all were related to using stimulants improperly.
Choosing the right stimulant for the adolescent must take into consideration their social environment and their risk of drug abuse. Given that Adderall is an amphetamine, it should be used with caution and careful supervision, but since all stimulants can be abused, the same caution applies to them as well.
ADHD prevalence in adolescents aged 11-17 years is 10%-15% (CDC Weekly; Nov.12, 2010;59:1439-43). So evaluation and proper treatment can mean school success and continuing on to college. The diagnosis should not be excluded because it was not identified earlier, but other diagnoses must be considered.
Dr Pearce is a pediatrician in Frankfort, Ill.
Attention deficit is a common diagnosis with which many pediatricians are faced. In the more common scenario, the child presents anywhere from age 5 to 10 years with parental and teacher complaint of hyperactivity or academic underachievement. But, what do you do with the child who presents at age 11 years or high school age with no significant history of school failure or behavior issues? Is this a child whose symptoms were overlooked? New-onset inattention? Are they seeking medication to augment their intellectual ability to become more competitive? Or are they just drug seeking? Well, the truth is that any one of the above could be true, and only through careful analysis can you obtain the proper diagnosis.
For the adolescent that meets the DSM-IV criteria for attention-deficit/hyperactivity disorder (ADHD), it is possible that they have learned to compensate for their inattention and have been successful in maintaining a good grade-point average. Through detailed questioning about study habits and home environment, they likely required a lot of support from their parents to maintain organization and from tutors. Many children without comorbid conditions are very intelligent and are able to keep up with the course load until they reach high school. The demands for independence and the amount of class work required start to become overwhelming and grades start to decline. These children tend to do very well on stimulant medication.
Now for the child who presents with absolutely no past history of inattention, disorganization, hyperactivity, or impulsive behavior, it is important to do a detailed physical exam looking for symptoms that are consistent with Wilson’s disease, hyperthyroidism, or drug use. A careful social history will identify symptoms of depression, anxiety, and disruption within the home such as divorce, domestic violence, etc. Questions regarding school and social pressure such as bullying also are important to ask to identify a cause for the acute onset of inattention.
Red flags should be raised with a teen who has socially withdrawn, has defiant or high risk taking behaviors, and a history of illicit drug use. According to a study published in the British Journal of Psychiatry, stimulant used as prescribed actually lowers the risk of substance abuse (Br. J. Psychiatry 2013 [doi:10.1192/bjp.bp.112.124784]). But according to the National Institute of Drug Abuse, teens are using the stimulants to get a high by snorting or injecting the stimulant, making Adderall a hot commodity on college campuses. Stimulants are also used to "cram" for tests so teens are taking them to stay awake to study. Stimulants coupled with excessive caffeine lead to increased heart rates and blood pressure, as well as panic attacks. The DAWN Report (Drug Abuse Warning Network) published a warning on Jan. 24, 2013, stating that the number of emergency room visits increased threefold in young adults over the age of 18 years. Only a small increase was noted in teens aged 12-17 years, but they all were related to using stimulants improperly.
Choosing the right stimulant for the adolescent must take into consideration their social environment and their risk of drug abuse. Given that Adderall is an amphetamine, it should be used with caution and careful supervision, but since all stimulants can be abused, the same caution applies to them as well.
ADHD prevalence in adolescents aged 11-17 years is 10%-15% (CDC Weekly; Nov.12, 2010;59:1439-43). So evaluation and proper treatment can mean school success and continuing on to college. The diagnosis should not be excluded because it was not identified earlier, but other diagnoses must be considered.
Dr Pearce is a pediatrician in Frankfort, Ill.
