User login
Woman, 45, With Red, Scaly Nipple
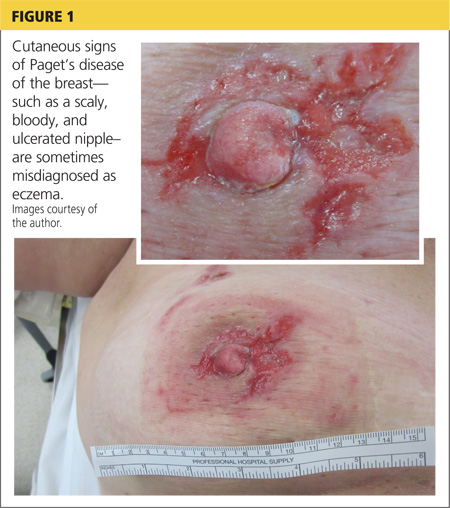
A 45-year-old woman noticed some redness and scaling around her right nipple. She applied peroxide and OTC antibiotic ointment for approximately seven months with mixed results. She sought medical attention when pain developed in the breast, along with some bloody discharge from the nipple (see Figure 1). Around that time, she also noticed three small nodules in the upper outer portion of the breast.
A mammogram and ultrasound revealed a 1.7 × 2.0–cm spiculated mass in the axillary tail, as well as two smaller breast lesions. A PET/CT scan ordered subsequently revealed intense uptake in the periareolar region and a suspicious axillary node. By then, the biopsy results had confirmed invasive ductal carcinoma, later determined to be Paget’s disease of the breast (PDB).
The patient’s previous medical history was significant for cystic breasts (never biopsied), chronic back pain, anxiety, and obesity. She was perimenopausal with irregular periods, the last one about 10 months ago. Her obstetric history included two pregnancies resulting in live births and no history of abortion; her menarche occurred at age 14 and her first pregnancy at 27. Family history was significant for leukemia in her maternal grandmother and niece. She did not use tobacco, alcohol, or illicit drugs. She lived at home with her husband and two daughters, who were all very supportive.
The patient elected to undergo a right modified radical mastectomy (MRM) and prophylactic left total mastectomy. MRM was performed on the right breast because sentinel lymph node identification was unsuccessful. This may have been due to involvement of the right subareolar plexus. Five of eight lymph nodes later tested positive for malignancy. The surgery was completed by placement of bilateral tissue expanders for eventual breast reconstruction.
Chemotherapy was started six weeks after surgery and included 15 weeks (five cycles) of docetaxel, carboplatin, and trastuzumab (a combination known as TCH), followed by 51 weeks (17 cycles) of trastuzumab, along with daily tamoxifen. The TCH regimen was followed by four weekly cycles of external beam radiation therapy (EBRT). Adverse effects of treatment have included chest wall dermatitis, right upper extremity lymphedema, nausea/vomiting, dyspnea, peripheral neuropathy, alopecia, and fatigue.
Discussion
Nearly 150 years ago, James Paget recognized a connection between skin changes around the nipple and deeper lesions in the breast.1 The disease that Paget identified is defined as the presence of intraepithelial adenocarcinoma cells (ie, Paget’s cells) within the epidermis of the nipple, with or without an underlying carcinoma.
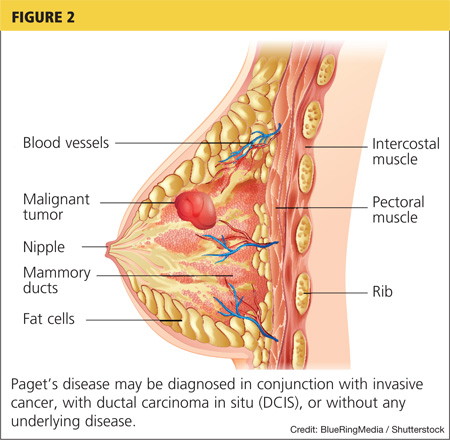
An underlying breast cancer is present 85% to 95% of the time but is palpable in only approximately 50% of cases (see Figure 2). However, 25% of the time there is neither a palpable mass nor a mammographic abnormality. In these cases particularly, timely diagnosis depends on recognition of suspicious nipple changes, followed by a prompt and thorough diagnostic workup. Unfortunately, the accurate diagnosis of Paget’s disease still takes an average of several months.2
Paget’s disease is rare; it represents only 1% to 3% of new cases of female breast cancer, or about 2,250 cases a year.2-4 (The number of Paget’s disease cases per year was calculated by the author, based on the reported incidence of all breast cancers.) It is even more rare among men. For both genders, the peak age for this disease is between 50 and 60.2
Paget’s disease is an important entity for primary care PAs and NPs because it presents an opportunity to make a timely and life-changing diagnosis, and because it provides an elegant model for understanding current diagnostic and therapeutic approaches to breast cancer.
Clinical Presentation and Pathophysiology
The hallmark of PDB is scaly, vesicular, or ulcerated changes that begin in the nipple and spread to the areola. These changes are most often unilateral and may occur with pruritus, burning pain, and/or oozing from the nipple.5 This presentation is often mistaken for common skin conditions, such as eczema. Like eczema, changes in PDB may improve spontaneously and fluctuate over time, which is confusing for both the patient and clinician. A clinical pearl is that eczema is more likely to spread from the areola to the nipple, and will usually respond to topical corticosteroids. By contrast, changes in PDB tend to spread from the nipple to the areola, and corticosteroids do not provide a sustained response. Of note, Paget’s lesions may heal spontaneously even as the underlying malignancy progresses.6
PDB is unique because the underlying lesion and skin changes are not just coincidental. The cutaneous changes and the malignancy that lies beneath have a causal, not merely co-occurring, relationship. Paget himself believed that the nipple changes were both a precursor, and a promoter, of the underlying cancer.1 This transformation theory states that normal nipple epidermis turns into Paget’s cells spontaneously, before there is any underlying disease. This theory is supported by the fact that, occasionally (though rarely), no underlying breast cancer is ever found. Also, the concomitant tumor may be some distance (> 2 cm) from the nipple-areolar complex (NAC), suggesting a synchronous but causally unrelated lesion.6-8
Modern immunochemistry has turned PDB inside out. Today, PDB is believed to begin within the breast and then to spread “upward” to the NAC, called the epidermotrophic theory. This theory is supported by the fact that Paget’s cells share several molecular markers with their respective parenchymal tumors. Some researchers now propose that there is a single Paget’s progenitor cell with a motility factor that allows it to traverse the ductal system, resulting in nipple and skin changes that have come to be recognized as PDB.6-8
The invasive cancers that are associated with PDB are most likely to be both estrogen- and progesterone-receptor–negative and of a high histologic grade.3,7 Estrogen- and progesterone-sensitive tumors respond to hormonal manipulation therapy. Tumors that are receptor-negative and that have a more aggressive grade are more difficult to treat.
Differential Diagnosis
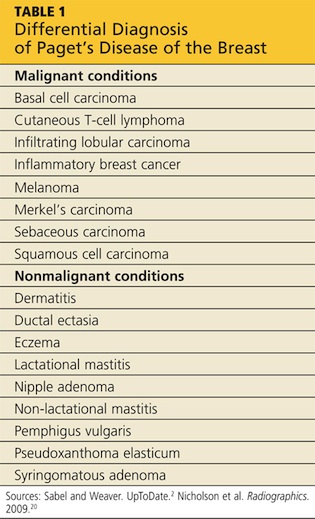
PDB may be confused with the early stages of inflammatory breast cancer (IBC), an aggressive malignant disease (see Table 1). Both conditions may present with erythema and skin thickening and may be mistaken for mastitis. However, IBC spreads rapidly through the entire breast, and clinical features may include tenderness, a feeling of heat or heaviness, breast enlargement, and significant lymphadenopathy. Current recommendations call for a biopsy of any area of breast inflammation that does not respond to antibiotics within seven days.9
PDB is not the only cutaneous manifestation of breast cancer. Others include carcinoma erysipeloides (inflammatory changes that resemble cellulitis), carcinoma telangiectaticum (vascularized plaques), and/or inflammatory papules or nodules appearing on the breast, back, neck, or scalp. Each of these non–Paget’s conditions involves lymphatic (versus ductal) spread and signifies advanced malignancy.10
Diagnosis and Staging
After biopsy of the nipple lesion(s), diagnosis proceeds to the assessment of the breast itself and ultimately to cancer staging. PDB may occur (in order of incidence):
• In conjunction with an invasive cancer
• With underlying ductal carcinoma in situ (DCIS)
• Without any underlying disease.7
Mammography is used to determine the extent and location of the underlying lesion(s), which is more likely to be peripheral and/or multicentric. However, in some cases, there are no mammographic changes, which is now recognized as an indication for performing a breast MRI.11 Once the lesion is located, direct or image-guided biopsy confirms whether it is invasive cancer or DCIS. Palpable masses that occur with PDB are usually invasive and signal advanced disease.2,6,12,13 Sentinel lymph node biopsy (SLNB), which is usually performed at the time of surgery, plays a critical role in cancer staging and treatment planning. SLNB reliably diagnoses axillary metastasis in approximately 98% of patients.14
Like other breast cancers, PDB is also categorized by the expression of molecular markers, including HER2 (human epidermal growth factor receptor 2). Cancer cells in which HER2 gene is overexpressed tend to proliferate more rapidly than others. HER-status can also provide a clue as to which chemotherapy agents are likely to be most effective.2
Treatment and Management
The primary treatment for breast cancer is surgery, which serves both diagnostic and therapeutic purposes. To be effective, surgical treatment of PDB requires excision of the NAC, also called central lumpectomy. This may be sufficient treatment in those rare cases in which the disease is confined to the NAC.11,12
For underlying tumors, partial mastectomy is an option when the tumor is small (< 2 cm) and located close enough to the NAC to achieve negative margins, while leaving a cosmetically acceptable breast. Partial mastectomy is usually followed by whole breast irradiation. A few centers offer intraoperative radiation therapy (IORT)—performed before the surgeon closes the incision—for patients who wish to avoid or limit the duration of postoperative radiation treatment.15-17
Complete mastectomy (including excision of the NAC) should be considered when:
• The distance between the NAC and the underlying tumor is significant
• Multicentric disease and/or diffuse calcifications exist
• Achieving negative margins would remove too much tissue to leave a cosmetically acceptable breast.
Evaluation of the axillary nodes is the same in PDB as with other breast cancers. Patients with disease localized to the NAC and no underlying carcinoma may choose to forego lymph node biopsy. The same is true for patients who have PDB with a single underlying DCIS. However, lymph node biopsy is always recommended in cases of multicentric DCIS or invasive disease, or if a mastectomy is planned.18,19
Sentinel node biopsy results determine whether the mastectomy should be simple (excision of the breast alone) or modified radical (breast and axillary nodes). Today, complete radical mastectomy (excision of the breast, axillary nodes, and pectoral muscle) is reserved for cases in which disease invades the chest wall.18,19
The use of adjuvant (postoperative) therapy in patients with DCIS (whether or not related to PDB) is still debated. For patients with invasive cancers, both radiation therapy and chemotherapy are usually indicated. The decision to use neoadjuvant (preoperative) chemotherapy is made on a case-by-case basis. All decisions are based on the nature of the underlying cancer, regardless of whether the diagnosis is PDB.
Because PDB is categorized as invasive in at least 85% of cases, and because all invasive breast cancers carry about twice the risk for newly diagnosed contralateral disease, systematic follow-up is extremely important for patients with PDB. A clinical exam and updated history should be performed every four to six months during the first two years and at least annually after that. Screening recommendations, including a yearly mammogram, remain the same for asymptomatic patients. Patients with new or recurring symptoms—because they are at high risk for cancer recurrence—or who are undergoing treatment may have additional testing, including assessing for tumor markers, ultrasound, or MRI.2
PDB is treated with the same chemotherapy regimens as other breast cancers. In the early stages, chemotherapy reduces the risk for recurrence. In advanced breast cancer, the goal of chemotherapy is to reduce tumor size and achieve local control.
Prognosis
Patients with negative lymph node biopsy results have survival rates of 85% and 79% at five and 10 years, respectively. Patients with positive node results face survival rates of 32% at five years and 28% at 10 years. As with other cancers, anything that contributes to disease progression (including delayed diagnosis or treatment) decreases the patient’s survival rate.2,3 The overall prognosis for PDB is based on the nature of the underlying breast cancer, including its stage and other predictive factors—not on the fact that it is PDB.
Patient Outcome
Nearing the end of her treatment with trastuzumab, the patient became concerned about new-onset vaginal and left pelvic pain, along with some lower back discomfort. She mentioned these symptoms to her oncologist immediately. A transvaginal ultrasound could not rule out an ovarian neoplasm.
The patient elected to undergo total abdominal hysterectomy and bilateral salpingo-oophorectomy (TAH/BSO). This option allowed for removal of a mass discovered during the procedure, minimized the risk for subsequent endometrial cancer, and reduced the chance of recurrence of the patient’s estrogen/progesterone receptor–positive breast cancer. The mass itself turned out to be a benign pedunculated fibroid tumor.
The patient was relieved and continues to recover well. A follow-up PET/CT scan is scheduled for three months from now.
Conclusion
PDB is a complex disease that challenges our current understanding of breast cancer and its diagnosis and treatment. It depends uniquely upon ductal (versus blood or lymphatic) spread. Little did Paget and his contemporaries realize they had opened up such a porthole into modern histology. Nor did they appreciate the fact that they had identified an insidious breast cancer that declares itself through the skin.
Today, it is understood that by the time nipple changes of PDB appear, an underlying breast cancer most likely exists. In at least 25% of cases, there is neither a palpable mass nor a positive mammogram finding. For this reason, clinicians must maintain a high level of clinical suspicion and a low threshold for biopsy when there are skin changes at the nipple. This is especially true because the underlying lesions are more likely to be invasive cancers.
Surgical treatment will often mean complete mastectomy, whether simple, modified radical, or radical. This choice will be driven by the extent and location of the underlying disease. There is a role for partial mastectomy followed by radiation therapy in those rare cases in which PDB is confined to the NAC with no underlying tumor. Partial mastectomy is also a consideration when the underlying tumor is small and/or located close to the NAC. Patients with PDB may consider whole-breast or NAC reconstruction once radiation therapy and/or chemotherapy are completed.
PDB remains a poignant reminder for all clinicians of the importance of a thorough clinical exam and a well-focused history in all patients at risk for breast cancer. Moreover, it is an enduring example of the fact that common symptoms sometimes do signify something uncommon and potentially life- changing.
References
1. Paget J. On disease of the mammary areola preceding cancer of the mammary gland. In: Paget S, ed. Selected Essays and Addresses by Sir James Paget. London: Longmans, Green and Co.; 1902:145-148.
2. Sabel MS, Weaver DL. Paget disease of the breast. In: UpToDate. Chagpar AE, Hayes DF, Pierce LJ, eds. www.uptodate.com/contents/paget-disease-of-the-breast. Updated November 27, 2012. Accessed September 9, 2013.
3. Ortiz-Pagan S, Cunto-Amesty G, Narayan S. Effect of Paget’s disease on survival in breast cancer. Arch Surg. 2001;146:1267-1270.
4. American Cancer Society. Cancer facts & figures 2012. www.cancer.org/research/cancerfactsfigures/cancerfactsfigures/cancer-facts-figures-2012. Accessed September 9, 2013.
5. Ashikari R, Park K, Huvos AG, Urban JA. Paget’s disease of the breast. Cancer. 1970;3:680-685.
6. Sakorafas GH, Blanchard K, Sarr MG, Farley DR. Paget’s disease of the breast. Cancer Treatment Rev. 2001;27:9-18.
7. Chen C-Y, Sun L-M, Anderson BO. Paget disease of the breast: changing patterns of incidence, clinical presentation, and treatment in the U.S. Cancer. 2006;107:1448-1458.
8. Paone JF, Baker R. Pathogenesis and treatment of Paget’s disease of the breast. Cancer. 1981;48:825-829.
9. Nelson JA, Patel D, Mancuso P. Inflammatory breast cancer. ADVANCE for NPs and PAs. 2011;2(10):25-28.
10. Ngan V. Skin metastasis. DermNet NZ. New Zealand Dermatological Society. http://dermnetnz.org/lesions/metastasis.html. Accessed September 9, 2013.
11. Amano G, Yajima M, Moroboshi Y, et al. MRI accurately depicts underlying DCIS in a patient with Paget’s disease of the breast without palpable mass and mammography findings. Jpn J Clin Oncol. 2005;35:149-153.
12. Burrell HC, Evans AJ. Radiological assessment of the breast: what the surgical oncologist needs to know. Eur J Surg Oncol. 2001;27:689-691.
13. Muttarak M, Siriya B, Kongmebhol P. Paget’s disease of the breast: clinical, imaging and pathologic findings: a review of 16 patients. Biomed Imaging Interv J. 2001;7:e16, 1-7.
14. Laronga C, Hasson D, Hoover S, et al. Paget’s disease in the era of sentinel lymph node biopsy. Am J Surg. 2006;192:481-483.
15. Pezzi CM, Kukora JS, Audet IM. Breast conservation surgery using nipple-areolar resection for central breast cancers. Arch Surg. 2004;139:32-37.
16. Polgar C, Zsolt O, Tibor K, Janos F. Breast-conserving therapy for Paget disease of the nipple. Cancer. 2002;94:1904-1905.
17. Marshall JK, Griffith KA, Haffty BG, Solin LJ. Conservative management of Paget disease of the breast with radiotherapy. Cancer. 2003;97:2142-2149.
18. Vasquez B, Rousseau D, Hurd TC. Surgical management of breast cancer. Sem Oncol. 2007;34:234-240.
19. Mamounas EP. Continuing evolution in breast cancer surgical management. J Clin Oncol. 2005;23:1603-1606.
20. Nicholson BT, Harvey JA, Cohen MA. Nipple-areolar complex: normal anatomy and benign and malignant processes. Radiographics. 2009;29:509-523.
A 45-year-old woman noticed some redness and scaling around her right nipple. She applied peroxide and OTC antibiotic ointment for approximately seven months with mixed results. She sought medical attention when pain developed in the breast, along with some bloody discharge from the nipple (see Figure 1). Around that time, she also noticed three small nodules in the upper outer portion of the breast.
A mammogram and ultrasound revealed a 1.7 × 2.0–cm spiculated mass in the axillary tail, as well as two smaller breast lesions. A PET/CT scan ordered subsequently revealed intense uptake in the periareolar region and a suspicious axillary node. By then, the biopsy results had confirmed invasive ductal carcinoma, later determined to be Paget’s disease of the breast (PDB).
The patient’s previous medical history was significant for cystic breasts (never biopsied), chronic back pain, anxiety, and obesity. She was perimenopausal with irregular periods, the last one about 10 months ago. Her obstetric history included two pregnancies resulting in live births and no history of abortion; her menarche occurred at age 14 and her first pregnancy at 27. Family history was significant for leukemia in her maternal grandmother and niece. She did not use tobacco, alcohol, or illicit drugs. She lived at home with her husband and two daughters, who were all very supportive.
The patient elected to undergo a right modified radical mastectomy (MRM) and prophylactic left total mastectomy. MRM was performed on the right breast because sentinel lymph node identification was unsuccessful. This may have been due to involvement of the right subareolar plexus. Five of eight lymph nodes later tested positive for malignancy. The surgery was completed by placement of bilateral tissue expanders for eventual breast reconstruction.
Chemotherapy was started six weeks after surgery and included 15 weeks (five cycles) of docetaxel, carboplatin, and trastuzumab (a combination known as TCH), followed by 51 weeks (17 cycles) of trastuzumab, along with daily tamoxifen. The TCH regimen was followed by four weekly cycles of external beam radiation therapy (EBRT). Adverse effects of treatment have included chest wall dermatitis, right upper extremity lymphedema, nausea/vomiting, dyspnea, peripheral neuropathy, alopecia, and fatigue.
Discussion
Nearly 150 years ago, James Paget recognized a connection between skin changes around the nipple and deeper lesions in the breast.1 The disease that Paget identified is defined as the presence of intraepithelial adenocarcinoma cells (ie, Paget’s cells) within the epidermis of the nipple, with or without an underlying carcinoma.
An underlying breast cancer is present 85% to 95% of the time but is palpable in only approximately 50% of cases (see Figure 2). However, 25% of the time there is neither a palpable mass nor a mammographic abnormality. In these cases particularly, timely diagnosis depends on recognition of suspicious nipple changes, followed by a prompt and thorough diagnostic workup. Unfortunately, the accurate diagnosis of Paget’s disease still takes an average of several months.2
Paget’s disease is rare; it represents only 1% to 3% of new cases of female breast cancer, or about 2,250 cases a year.2-4 (The number of Paget’s disease cases per year was calculated by the author, based on the reported incidence of all breast cancers.) It is even more rare among men. For both genders, the peak age for this disease is between 50 and 60.2
Paget’s disease is an important entity for primary care PAs and NPs because it presents an opportunity to make a timely and life-changing diagnosis, and because it provides an elegant model for understanding current diagnostic and therapeutic approaches to breast cancer.
Clinical Presentation and Pathophysiology
The hallmark of PDB is scaly, vesicular, or ulcerated changes that begin in the nipple and spread to the areola. These changes are most often unilateral and may occur with pruritus, burning pain, and/or oozing from the nipple.5 This presentation is often mistaken for common skin conditions, such as eczema. Like eczema, changes in PDB may improve spontaneously and fluctuate over time, which is confusing for both the patient and clinician. A clinical pearl is that eczema is more likely to spread from the areola to the nipple, and will usually respond to topical corticosteroids. By contrast, changes in PDB tend to spread from the nipple to the areola, and corticosteroids do not provide a sustained response. Of note, Paget’s lesions may heal spontaneously even as the underlying malignancy progresses.6
PDB is unique because the underlying lesion and skin changes are not just coincidental. The cutaneous changes and the malignancy that lies beneath have a causal, not merely co-occurring, relationship. Paget himself believed that the nipple changes were both a precursor, and a promoter, of the underlying cancer.1 This transformation theory states that normal nipple epidermis turns into Paget’s cells spontaneously, before there is any underlying disease. This theory is supported by the fact that, occasionally (though rarely), no underlying breast cancer is ever found. Also, the concomitant tumor may be some distance (> 2 cm) from the nipple-areolar complex (NAC), suggesting a synchronous but causally unrelated lesion.6-8
Modern immunochemistry has turned PDB inside out. Today, PDB is believed to begin within the breast and then to spread “upward” to the NAC, called the epidermotrophic theory. This theory is supported by the fact that Paget’s cells share several molecular markers with their respective parenchymal tumors. Some researchers now propose that there is a single Paget’s progenitor cell with a motility factor that allows it to traverse the ductal system, resulting in nipple and skin changes that have come to be recognized as PDB.6-8
The invasive cancers that are associated with PDB are most likely to be both estrogen- and progesterone-receptor–negative and of a high histologic grade.3,7 Estrogen- and progesterone-sensitive tumors respond to hormonal manipulation therapy. Tumors that are receptor-negative and that have a more aggressive grade are more difficult to treat.
Differential Diagnosis
PDB may be confused with the early stages of inflammatory breast cancer (IBC), an aggressive malignant disease (see Table 1). Both conditions may present with erythema and skin thickening and may be mistaken for mastitis. However, IBC spreads rapidly through the entire breast, and clinical features may include tenderness, a feeling of heat or heaviness, breast enlargement, and significant lymphadenopathy. Current recommendations call for a biopsy of any area of breast inflammation that does not respond to antibiotics within seven days.9
PDB is not the only cutaneous manifestation of breast cancer. Others include carcinoma erysipeloides (inflammatory changes that resemble cellulitis), carcinoma telangiectaticum (vascularized plaques), and/or inflammatory papules or nodules appearing on the breast, back, neck, or scalp. Each of these non–Paget’s conditions involves lymphatic (versus ductal) spread and signifies advanced malignancy.10
Diagnosis and Staging
After biopsy of the nipple lesion(s), diagnosis proceeds to the assessment of the breast itself and ultimately to cancer staging. PDB may occur (in order of incidence):
• In conjunction with an invasive cancer
• With underlying ductal carcinoma in situ (DCIS)
• Without any underlying disease.7
Mammography is used to determine the extent and location of the underlying lesion(s), which is more likely to be peripheral and/or multicentric. However, in some cases, there are no mammographic changes, which is now recognized as an indication for performing a breast MRI.11 Once the lesion is located, direct or image-guided biopsy confirms whether it is invasive cancer or DCIS. Palpable masses that occur with PDB are usually invasive and signal advanced disease.2,6,12,13 Sentinel lymph node biopsy (SLNB), which is usually performed at the time of surgery, plays a critical role in cancer staging and treatment planning. SLNB reliably diagnoses axillary metastasis in approximately 98% of patients.14
Like other breast cancers, PDB is also categorized by the expression of molecular markers, including HER2 (human epidermal growth factor receptor 2). Cancer cells in which HER2 gene is overexpressed tend to proliferate more rapidly than others. HER-status can also provide a clue as to which chemotherapy agents are likely to be most effective.2
Treatment and Management
The primary treatment for breast cancer is surgery, which serves both diagnostic and therapeutic purposes. To be effective, surgical treatment of PDB requires excision of the NAC, also called central lumpectomy. This may be sufficient treatment in those rare cases in which the disease is confined to the NAC.11,12
For underlying tumors, partial mastectomy is an option when the tumor is small (< 2 cm) and located close enough to the NAC to achieve negative margins, while leaving a cosmetically acceptable breast. Partial mastectomy is usually followed by whole breast irradiation. A few centers offer intraoperative radiation therapy (IORT)—performed before the surgeon closes the incision—for patients who wish to avoid or limit the duration of postoperative radiation treatment.15-17
Complete mastectomy (including excision of the NAC) should be considered when:
• The distance between the NAC and the underlying tumor is significant
• Multicentric disease and/or diffuse calcifications exist
• Achieving negative margins would remove too much tissue to leave a cosmetically acceptable breast.
Evaluation of the axillary nodes is the same in PDB as with other breast cancers. Patients with disease localized to the NAC and no underlying carcinoma may choose to forego lymph node biopsy. The same is true for patients who have PDB with a single underlying DCIS. However, lymph node biopsy is always recommended in cases of multicentric DCIS or invasive disease, or if a mastectomy is planned.18,19
Sentinel node biopsy results determine whether the mastectomy should be simple (excision of the breast alone) or modified radical (breast and axillary nodes). Today, complete radical mastectomy (excision of the breast, axillary nodes, and pectoral muscle) is reserved for cases in which disease invades the chest wall.18,19
The use of adjuvant (postoperative) therapy in patients with DCIS (whether or not related to PDB) is still debated. For patients with invasive cancers, both radiation therapy and chemotherapy are usually indicated. The decision to use neoadjuvant (preoperative) chemotherapy is made on a case-by-case basis. All decisions are based on the nature of the underlying cancer, regardless of whether the diagnosis is PDB.
Because PDB is categorized as invasive in at least 85% of cases, and because all invasive breast cancers carry about twice the risk for newly diagnosed contralateral disease, systematic follow-up is extremely important for patients with PDB. A clinical exam and updated history should be performed every four to six months during the first two years and at least annually after that. Screening recommendations, including a yearly mammogram, remain the same for asymptomatic patients. Patients with new or recurring symptoms—because they are at high risk for cancer recurrence—or who are undergoing treatment may have additional testing, including assessing for tumor markers, ultrasound, or MRI.2
PDB is treated with the same chemotherapy regimens as other breast cancers. In the early stages, chemotherapy reduces the risk for recurrence. In advanced breast cancer, the goal of chemotherapy is to reduce tumor size and achieve local control.
Prognosis
Patients with negative lymph node biopsy results have survival rates of 85% and 79% at five and 10 years, respectively. Patients with positive node results face survival rates of 32% at five years and 28% at 10 years. As with other cancers, anything that contributes to disease progression (including delayed diagnosis or treatment) decreases the patient’s survival rate.2,3 The overall prognosis for PDB is based on the nature of the underlying breast cancer, including its stage and other predictive factors—not on the fact that it is PDB.
Patient Outcome
Nearing the end of her treatment with trastuzumab, the patient became concerned about new-onset vaginal and left pelvic pain, along with some lower back discomfort. She mentioned these symptoms to her oncologist immediately. A transvaginal ultrasound could not rule out an ovarian neoplasm.
The patient elected to undergo total abdominal hysterectomy and bilateral salpingo-oophorectomy (TAH/BSO). This option allowed for removal of a mass discovered during the procedure, minimized the risk for subsequent endometrial cancer, and reduced the chance of recurrence of the patient’s estrogen/progesterone receptor–positive breast cancer. The mass itself turned out to be a benign pedunculated fibroid tumor.
The patient was relieved and continues to recover well. A follow-up PET/CT scan is scheduled for three months from now.
Conclusion
PDB is a complex disease that challenges our current understanding of breast cancer and its diagnosis and treatment. It depends uniquely upon ductal (versus blood or lymphatic) spread. Little did Paget and his contemporaries realize they had opened up such a porthole into modern histology. Nor did they appreciate the fact that they had identified an insidious breast cancer that declares itself through the skin.
Today, it is understood that by the time nipple changes of PDB appear, an underlying breast cancer most likely exists. In at least 25% of cases, there is neither a palpable mass nor a positive mammogram finding. For this reason, clinicians must maintain a high level of clinical suspicion and a low threshold for biopsy when there are skin changes at the nipple. This is especially true because the underlying lesions are more likely to be invasive cancers.
Surgical treatment will often mean complete mastectomy, whether simple, modified radical, or radical. This choice will be driven by the extent and location of the underlying disease. There is a role for partial mastectomy followed by radiation therapy in those rare cases in which PDB is confined to the NAC with no underlying tumor. Partial mastectomy is also a consideration when the underlying tumor is small and/or located close to the NAC. Patients with PDB may consider whole-breast or NAC reconstruction once radiation therapy and/or chemotherapy are completed.
PDB remains a poignant reminder for all clinicians of the importance of a thorough clinical exam and a well-focused history in all patients at risk for breast cancer. Moreover, it is an enduring example of the fact that common symptoms sometimes do signify something uncommon and potentially life- changing.
References
1. Paget J. On disease of the mammary areola preceding cancer of the mammary gland. In: Paget S, ed. Selected Essays and Addresses by Sir James Paget. London: Longmans, Green and Co.; 1902:145-148.
2. Sabel MS, Weaver DL. Paget disease of the breast. In: UpToDate. Chagpar AE, Hayes DF, Pierce LJ, eds. www.uptodate.com/contents/paget-disease-of-the-breast. Updated November 27, 2012. Accessed September 9, 2013.
3. Ortiz-Pagan S, Cunto-Amesty G, Narayan S. Effect of Paget’s disease on survival in breast cancer. Arch Surg. 2001;146:1267-1270.
4. American Cancer Society. Cancer facts & figures 2012. www.cancer.org/research/cancerfactsfigures/cancerfactsfigures/cancer-facts-figures-2012. Accessed September 9, 2013.
5. Ashikari R, Park K, Huvos AG, Urban JA. Paget’s disease of the breast. Cancer. 1970;3:680-685.
6. Sakorafas GH, Blanchard K, Sarr MG, Farley DR. Paget’s disease of the breast. Cancer Treatment Rev. 2001;27:9-18.
7. Chen C-Y, Sun L-M, Anderson BO. Paget disease of the breast: changing patterns of incidence, clinical presentation, and treatment in the U.S. Cancer. 2006;107:1448-1458.
8. Paone JF, Baker R. Pathogenesis and treatment of Paget’s disease of the breast. Cancer. 1981;48:825-829.
9. Nelson JA, Patel D, Mancuso P. Inflammatory breast cancer. ADVANCE for NPs and PAs. 2011;2(10):25-28.
10. Ngan V. Skin metastasis. DermNet NZ. New Zealand Dermatological Society. http://dermnetnz.org/lesions/metastasis.html. Accessed September 9, 2013.
11. Amano G, Yajima M, Moroboshi Y, et al. MRI accurately depicts underlying DCIS in a patient with Paget’s disease of the breast without palpable mass and mammography findings. Jpn J Clin Oncol. 2005;35:149-153.
12. Burrell HC, Evans AJ. Radiological assessment of the breast: what the surgical oncologist needs to know. Eur J Surg Oncol. 2001;27:689-691.
13. Muttarak M, Siriya B, Kongmebhol P. Paget’s disease of the breast: clinical, imaging and pathologic findings: a review of 16 patients. Biomed Imaging Interv J. 2001;7:e16, 1-7.
14. Laronga C, Hasson D, Hoover S, et al. Paget’s disease in the era of sentinel lymph node biopsy. Am J Surg. 2006;192:481-483.
15. Pezzi CM, Kukora JS, Audet IM. Breast conservation surgery using nipple-areolar resection for central breast cancers. Arch Surg. 2004;139:32-37.
16. Polgar C, Zsolt O, Tibor K, Janos F. Breast-conserving therapy for Paget disease of the nipple. Cancer. 2002;94:1904-1905.
17. Marshall JK, Griffith KA, Haffty BG, Solin LJ. Conservative management of Paget disease of the breast with radiotherapy. Cancer. 2003;97:2142-2149.
18. Vasquez B, Rousseau D, Hurd TC. Surgical management of breast cancer. Sem Oncol. 2007;34:234-240.
19. Mamounas EP. Continuing evolution in breast cancer surgical management. J Clin Oncol. 2005;23:1603-1606.
20. Nicholson BT, Harvey JA, Cohen MA. Nipple-areolar complex: normal anatomy and benign and malignant processes. Radiographics. 2009;29:509-523.
Man Has “a Couple of Blocks Somewhere”
ANSWER
The correct interpretation includes sinus bradycardia with first-degree block, a single premature atrial beat with aberrancy, right bundle branch block, left anterior fascicular block (bifascicular block), left ventricular hypertrophy, and T-wave inversions in the inferior leads.
In sinus bradycardia, there is a P wave for every QRS complex with a rate less than 60 beats/min. First-degree block is evidenced by a PR interval ≥ 200 ms.
A single premature atrial contraction is seen as the ninth beat on the ECG. Aberrancy refers to the appearance of the QRS complex; the impulse arises above the AV node but propagates down the AV node and His-Purkinje system to the ventricles before the conduction system is fully repolarized. This results in a QRS complex with intrinsic conduction similar to a normally conducted beat, which then becomes wide and uncharacteristic. Additionally, it resets the sinus node, resulting in a pause before the next normally conducted P wave.
A right bundle branch block is evidenced by the presence of normal conduction with a QRS duration > 120 ms, a terminal R wave in lead V1 (R, rR’, rsR’, or qR), and slurred S waves in leads I and V6.
The presence of left anterior fascicular block is confirmed by the left-axis deviation (–59° in this ECG), a qR complex in leads I and aVL, and an rS pattern in leads II, III, and aVF. The presence of both a right bundle and left anterior fascicular block constitutes bifascicular block. (This is a conduction problem and does not refer to blockage in the arteries, as the patient believed!)
Criteria for left ventricular hypertrophy are met when the sum of the S wave in V1 and the R wave in either V5 or V6 is ≥ 35 mm and the R wave in aVL is ≥ 11 mm.
Two other things to note in this ECG are the presence of T-wave inversions in the inferior leads (II, III, aVF) which are of unclear reason; and the presence of biphasic P waves that do not meet criteria for either right or left atrial hypertrophy.

A 69-year-old man presents for a routine appointment. His cardiac history is remarkable for systemic hypertension, nonischemic cardiomyopathy, pulmonary hypertension, and dyspnea on exertion. He says a previous provider told him his ECG had “a couple of blocks,” which he believes are “somewhere in the arteries.” He regularly feels lightheaded if he rises from a lying or sitting position too quickly, but he has never lost consciousness. He denies any history of chest pain or symptoms suggestive of angina. Reviewing his prior cardiac workup, you find an echocardiogram that shows moderate left ventricular enlargement with a left ventricular ejection fraction estimated at 35% to 40%; a severely enlarged left atrium; and mild thickening of the mitral leaflets as well as mild mitral regurgitation. A report from an old ECG (conducted at an outside institution) reveals sinus bradycardia, bifascicular block, and left ventricular hypertrophy. Cardiac catheterization performed two years ago showed diffuse disease with no lesions > 30%. Pulmonary function testing showed mild airflow obstruction, no restrictive component, and mildly decreased diffusing capacity. Medical history is positive for two benign colonic polyps that were removed during his last colonoscopy and a remote history of malaria while traveling in Africa 10 years ago. He also has a history of depression, which has been well controlled by medication. His list of medications includes carvedilol, fluoxetine, melatonin, and lisinopril. He is allergic to atenolol and metoprolol. His family history is remarkable for type 1 diabetes (mother). He is a retired baggage handler for a major airline at a nearby international airport. Since high school, he has smoked between one-half and one pack of cigarettes per day. He typically consumes a 12-pack of beer on the weekends. The review of systems is remarkable for corrective lenses, occasional headaches, and dyspnea. The patient denies any other symptoms. Physical examination reveals a blood pressure of 138/80 mm Hg; pulse, 64 beats/min; respiratory rate, 14 breaths/min-1; and O2 saturation, 97%. His height is 188 cm; weight, 107 kg; and BMI, 30. The lungs are clear to auscultation and percussion. The cardiac exam reveals no jugular venous distention, a normal rate and rhythm with occasional skipped beats, and a soft, grade II/VI blowing systolic murmur best heard at the left lower sternal border. The point of maximum impulse is palpable in the left anterior axillary line. The abdomen is soft and nontender, with no organomegaly. The genitourinary exam is normal. Peripheral pulses are 2+ bilaterally in both upper and lower extremities. There is no peripheral edema, and the neurologic exam is grossly intact. The patient is sent for a chest x-ray and an ECG. The latter reveals the following: a ventricular rate of 59 beats/min; PR interval, 284 ms; QRS duration, 130 ms; QT/QTc interval, 472/467 ms; P axis, 70°; R axis, –59°; and T axis, –29°. What is your interpretation of this ECG?
Lifelong Problem Has Caused Embarrassment
ANSWER
The correct answer is discoid lupus (choice “d”); see discussion for further details.
Sarcoidosis (choice “a”) is a worthy item in this differential, since it can be chronic, often affects the face (especially in African-Americans), and frequently defies ready diagnosis. But the biopsy was totally inconsistent with this diagnosis; in a case of sarcoidosis, it instead would have shown noncaseating granulomas, which are characteristic of the condition.
Lichen planus (choice “b”) is likewise worth consideration, since it can present in a similar fashion (although the chronicity of this patient’s lesions would have been atypical). Moreover, lichen planus is almost invariably symptomatic (itch). Biopsy would have shown obliteration of the dermoepidermal junction by an intense lymphocytic infiltrate—findings totally at odds with what was seen.
Polymorphous light eruption (PMLE; choice “c”) is the name given to a variety of photosensitivities that, true to the term polymorphous (or polymorphic), can present in numerous ways—although the lesions on any given patient tend to be monomorphic. These can take the form of vesicles, papules, and even erythema multiforme–like targetoid lesions, most commonly (as expected) on sun-exposed skin. Curiously, though, PMLE seldom affects the face or hands. It can manifest early in a patient’s life, but it would have been “seasonal,” disappearing in winter, and would have revealed a totally different picture on biopsy.
DISCUSSION
This patient suffered needlessly for more than half his life for lack of one simple thing: a correct diagnosis. Truth be known, the patient and his family probably bear some responsibility—but at some point, one of his many providers should have either obtained a punch biopsy or sent him to someone who would do so.
Instead, as is often the case, the emphasis was on treatment: trying one thing after another. The lack of success with these endeavors speaks loudly for the need for a definitive diagnosis. This could only be established one way: with a biopsy.
All the items mentioned in the above differential were legitimately considered. So was the possibility of infection, especially atypical types such as mycobacterial, deep fungal, or those involving other unusual organisms (eg, Nocardia, Actinomycetes). As in this case, tissue can be collected and submitted for culture, but the usual formalin preservative will kill any organism, necessitating prompt processing in saline.
Discoid lupus erythematosus (DLE) can be purely cutaneous (as seen here) or can be a manifestation of more serious systemic lupus. In any case, it is an autoimmune process, made worse by the sun, and can be chronic (though this case is exceptional in that regard).
This patient’s chance of developing systemic lupus erythematosus is slight, at most, since his antinuclear antibody test was negative. But his lifetime risk for another autoimmune disease is high.
TREATMENT
DLE is usually treated successfully with a combination of sun avoidance and a course of oral hydroxychloroquine (200 mg QD to bid, depending on the patient’s body habitus and the severity of the disease). Given the advanced state of this patient’s condition, he received the more frequent dosage, which should yield positive results. However, he will likely be on this regimen for some time.

Since the fourth grade, this 22-year-old African-American man has had facial lesions that, although constantly present, worsen in the summer. The problem is so severe that it has greatly affected his quality of life: In school and in his neighborhood, he has been subjected to rumors that his condition might be contagious. Despite numerous treatment attempts—including topical and oral anti-acne medications, topical and oral antifungal medications, and oral antibiotics—the condition has persisted. Once, at his mother’s urging, the patient even sought the assistance of a faith healer at a religious revival. Initially seen by a primary care provider at a free clinic, he was then referred to a dermatology clinician at the same facility. History taking reveals that the lesions are asymptomatic and appear in additional locations (eg, arms, ears, and neck). The patient denies any family history of similar problems, as well as persistent fever, cough, or shortness of breath. Lab studies obtained by his primary care provider, including a complete blood count and chem screen, were within normal limits. Most of the lesions on the patient’s face are round areas of slightly erythematous erosion covered by eschar. They range in size from 3 mm to more than 1 cm. Focal postinflammatory hyperpigmentation is noted (a common finding in those with type V/VI skin). Focal hyperpigmentation is also seen on both ears, in some cases with scaling and faint erosion on the surface. A KOH prep is performed with scale collected from perilesional skin; results are negative for fungal elements. There are no palpable nodes in the adjacent nodal locations. Two punch biopsies are done, with samples taken from the active margins of the lesions. One is submitted for routine H&E (hematoxylin and eosin) handling and the other in saline for bacterial, acid-fast bacilli (AFB), and fungal cultures. The biopsy shows hyperkeratosis, follicular plugging, and epidermal atrophy. Marked vacuolar degeneration of the dermoepidermal junction is also noted, along with mucin deposition. Stains for bacteria, AFB, and fungi yield negative results.

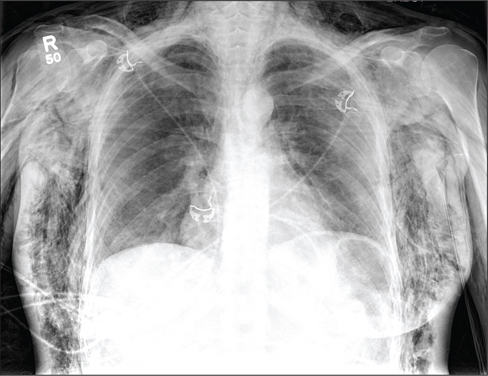
Woman Assaulted on Street
The chest radiograph demonstrates a massive amount of soft tissue and subcutaneous emphysema extending from the neck down through the chest and into the lower chest/upper abdomen. In addition, there are several fractured posterior ribs bilaterally. No large pneumothorax or pneumomediastinum is noted.
Because of the extent and mechanism of injury, CT of the chest, abdomen, and pelvis had already been ordered. Arrangements were also made for the patient to be admitted to the ICU for closer observation.

A 40-year-old woman is brought in by EMS for evaluation of injuries secondary to being assaulted. She was out walking late last night when she was approached by two men who pushed her to the ground and began punching and kicking her repeatedly on her face, chest, and back. She is primarily complaining of chest wall and back pain. Her medical history is significant for hypertension, diet-controlled diabetes, and “some sort of heart problem” for which she takes medication. Surgical history is significant for hysterectomy, cholecystectomy, and appendectomy. She smokes more than a pack of cigarettes per day and consumes at least a six-pack of beer daily. Initial exam shows an anxious female who appears somewhat uncomfortable but is in no obvious distress. Her vital signs are as follows: blood pressure, 130/88 mm Hg; pulse, 120 beats/min; respiratory rate, 22 breaths/min; and O2 saturation, 100% on room air. Physical exam reveals extensive facial/periorbital swelling, as well as swelling in the neck. Some splinting is noted. There is extensive crepitus noted within the soft tissue of the face, neck, and chest wall. Also, there is moderate tenderness bilaterally over the ribs. Chest radiograph is obtained (shown). What is your impression?
Observation Status Not So Well-Defined in Hospitals
New research suggests use of the designation "observation status" for admitted hospital patients varies in clinical practice, despite rigid criteria the Centers for Medicare & Medicaid Services (CMS) uses to define the term.
CMS defines observation status as "well-defined sets of specific, clinically appropriate services." In most cases, the status applies to inpatient stays of less than 24 hours. Longer than 48 hours is dubbed "rare and exceptional" by the federal agency.
But in the report, “Hospitalized But Not Admitted: Characteristics of Patients With ‘Observation Status’ at an Academic Medical Center," lead author and hospitalist Ann Sheehy, MD, MS, of Wisconsin School of Medicine and Public Health in Madison found that patients' mean length of stay (LOS) in observation was 33.3 hours, but it was longer than 48 hours in 16.5% of cases. Dr. Sheehy adds that 1,141 distinct observation diagnosis codes were used for observation stays during the study period, which ran from July 1, 2010, to Dec. 31, 2011.
"What CMS has as a definition for observation status is clearly not what's happening in clinical practice, based on the length of stay and the wide variety of diagnosis codes," Dr. Sheehy says. "We had over 1,000 diagnosis codes for something CMS says is well-defined."
The issue is of particular note to hospital medicine groups as observation status disproportionately affects the general-medicine population, Dr. Sheehy says. Just over 52% of all observation stays in the study were adult general-medicine patients.
The paper adds that while the cost per encounter for observation care was less than that for inpatient care, the average reimbursement for observation care failed to cover it. The net loss per encounter for an observation stay was $331, compared with a net gain of $2,163 for an inpatient stay.
"We don't want to have hospitals operating on a huge profit margin," Dr. Sheehy says, but "you can't have hospitals delivering care at a loss consistently and have them stay solvent. It's just not going to work."
Visit our website for more information on observation status rules.
CMS Allows Residents, Advanced Practitioners to Admit Inpatients
A federal rule that some hospitalists feared would bar nonstaff physicians from writing admission orders for hospital inpatients has been clarified to extend those privileges to resident physicians and advanced practitioners.
On Aug. 19, the Centers for Medicare & Medicaid Services (CMS) published its fiscal 2014 hospital Inpatient Prospective Payment System (IPPS) Final Rule, which is effective Oct. 1. Although this document impacts a number of important areas for hospitals, including the use of inpatient admission and observation status, hospitalists also were left with the impression that resident physicians and advanced practitioners (NPs and PAs) were being barred from writing admission orders.
Medical residents, NPs, and PAs do not have admitting privileges in most hospitals, and their inability to write admission orders would pose significant logistical and financial hurdles for many hospitals and physician groups, including hospitalists.
In most academic centers, residents have the opportunity and responsibility to evaluate patients at the time of hospitalization, write initial hospitalization orders, and then discuss patients with the attending physician. The "staffing" of patients typically occurs either later the same day or the following morning. The provision requiring an attending physician knowledgeable of the case to furnish the admission order, and not allowing delegation of this order to their residents, could fundamentally change the way our physicians are trained.
Many hospitals rely on NPs and PAs for the care of hospitalized patients under the supervision of a staff physician. These nonphysician providers often care for hospitalized patients, admit patients, and provide overnight coverage. Requiring admission orders to be placed by physicians with admitting privileges would require a greater presence of staff physicians, which would increase costs.
Some of these concerns were voiced Aug. 15 on CMS' Special Open Door Forum on CMS Rule 1599-F. While clarification was not offered, it was indicated that CMS did not intend to place such limitations on residents, NPs, and PAs. On Sept. 5, CMS released clarifications to some of these provisions in the IPPS Final Rule, and noted that admission orders may come from a physician or other practitioner.
This clarification suggests that when a resident, NP, or PA writes admission orders, they are doing so at the direction of a physician with admitting privileges. This may occur in the form of a verbal order, which requires documentation of the name of the admitting physician, as well as the date and time of the verbal order. This verbal order must then be countersigned by a qualified physician prior to patient discharge.
Failures to obtain appropriate orders co-signed by an appropriate physician are likely at high risk for Medicare payment denial. This clarification appears to address previously held concerns about this new rule.
Cranial radiotherapy for acute lymphoblastic leukemia linked to impaired neurocognition
Reduced white matter and impaired neuropsychological function were seen 20-30 years later in childhood acute lymphoblastic leukemia and lymphoma survivors who received cranial radiotherapy.
Survivors treated with chemotherapy alone appeared to have milder impairments, with measures that were within one standard deviation of the measures seen in healthy controls, reported Ilse Schuitema of the University of Leiden and her associates.
They also found that a young age at the time of cranial radiotherapy and the radiation dosage were associated with poorer results on the MRI measure used to evaluate the white matter's microstructure. Decreases in this measure were associated with neuropsychological dysfunction. The study was published in the Sept. 20 issue of the Journal of Clinical Oncology (2013;31:3378-88).
The finding "warrants a recommendation to use CRT [cranial radiotherapy] only as a last resort," since chemotherapy is just as effective, based on survival and recurrence rates in patients with acute lymphoblastic leukemia (ALL). Further, indications of accelerated aging seen in survivors given cranial radiotherapy may support screening for early-onset dementia as well as recommending lifestyle modifications such as not smoking and getting regular physical exercise to slow the progress of dementia.
Ms. Schuitema of the department of clinical child and adolescent studies, faculty of social sciences at Leiden (the Netherlands) University, and her co-investigators, followed up with 93 survivors of ALL or lymphoma who had been treated between 1978 and 1990 with cranial radiotherapy or CNS-directed chemotherapy, and compared them with 49 healthy controls. The mean age of patients given chemotherapy only was 27 years and the mean age of those treated with radiotherapy was 31 years.
Testing included magnetic resonance diffusion tensor imaging and neuropsychological tests. Differences in fractional anisotropy on the MRI test were used to analyze white matter microstructure, and whole-brain, voxel-based analysis was performed.
Survivors treated with chemotherapy only had reductions in the MRI measure and neuropsychological performance, but the measures were no more than one standard deviation below the mean values of controls.
When compared with controls, survivors who had cranial radiotherapy had significant reductions in white matter integrity and lower neurocognitive function, with effects that included lower IQ, poorer visuomotor accuracy, and poorer work flow during sustained attention.
Further, there was a "steep decline," in the MRI measure within the frontal and parietal white matter, which "is a strong indication of accelerated aging" the researchers wrote. Some of the anatomical findings among those treated with CRT were similar to those found in people with Alzheimer's disease, suggesting that "the irradiated survivors could be at increased risk of developing early-onset dementia."
The study results highlight the importance of long-term follow-up of children who receive neurotoxic treatments and increase support "for the concept of accelerated aging after CRT implicates screening for early-onset dementia,"the researchers said.
The tests used in the study included the computerized Amsterdam Neuropsychological Tasks (ANT) program, used to assess executive functions, and the four subtest short-form of the Wechsler Adult Intelligence Scale Revised (WAIS-R III).
Ms. Schuitema's coauthors are from the University of Leiden; University Hospitals Leuven, Belgium; and Academic Medical Center, Amsterdam. The authors had no disclosures. The study was funded by grants, including one from the Dutch Cancer Society.
This is one of the first studies to look at the long-term effects of treatment in childhood ALL survivors. These findings raise a significant concern about the long-term CNS and neurocognitive integrity of children who have been treated and are currently being treated with cranial radiotherapy. A significant number of children continue to receive radiation doses that are similar to or higher than the doses that were used to treat the patients in this study. Additional confirmatory studies are needed as is research that may bring about changes in treatment and long-term outcomes for the children we are treating today.
F. Daniel Armstrong, Ph.D., is director of the Mailman Center for Child Development, and professor of pediatrics & psychology at the University of Miami. He made his remarks in an editorial that accompanied the study (J. Clin. Oncol 2013;31:3309-11). He had no relevant disclosures.
Reduced white matter and impaired neuropsychological function were seen 20-30 years later in childhood acute lymphoblastic leukemia and lymphoma survivors who received cranial radiotherapy.
Survivors treated with chemotherapy alone appeared to have milder impairments, with measures that were within one standard deviation of the measures seen in healthy controls, reported Ilse Schuitema of the University of Leiden and her associates.
They also found that a young age at the time of cranial radiotherapy and the radiation dosage were associated with poorer results on the MRI measure used to evaluate the white matter's microstructure. Decreases in this measure were associated with neuropsychological dysfunction. The study was published in the Sept. 20 issue of the Journal of Clinical Oncology (2013;31:3378-88).
The finding "warrants a recommendation to use CRT [cranial radiotherapy] only as a last resort," since chemotherapy is just as effective, based on survival and recurrence rates in patients with acute lymphoblastic leukemia (ALL). Further, indications of accelerated aging seen in survivors given cranial radiotherapy may support screening for early-onset dementia as well as recommending lifestyle modifications such as not smoking and getting regular physical exercise to slow the progress of dementia.
Ms. Schuitema of the department of clinical child and adolescent studies, faculty of social sciences at Leiden (the Netherlands) University, and her co-investigators, followed up with 93 survivors of ALL or lymphoma who had been treated between 1978 and 1990 with cranial radiotherapy or CNS-directed chemotherapy, and compared them with 49 healthy controls. The mean age of patients given chemotherapy only was 27 years and the mean age of those treated with radiotherapy was 31 years.
Testing included magnetic resonance diffusion tensor imaging and neuropsychological tests. Differences in fractional anisotropy on the MRI test were used to analyze white matter microstructure, and whole-brain, voxel-based analysis was performed.
Survivors treated with chemotherapy only had reductions in the MRI measure and neuropsychological performance, but the measures were no more than one standard deviation below the mean values of controls.
When compared with controls, survivors who had cranial radiotherapy had significant reductions in white matter integrity and lower neurocognitive function, with effects that included lower IQ, poorer visuomotor accuracy, and poorer work flow during sustained attention.
Further, there was a "steep decline," in the MRI measure within the frontal and parietal white matter, which "is a strong indication of accelerated aging" the researchers wrote. Some of the anatomical findings among those treated with CRT were similar to those found in people with Alzheimer's disease, suggesting that "the irradiated survivors could be at increased risk of developing early-onset dementia."
The study results highlight the importance of long-term follow-up of children who receive neurotoxic treatments and increase support "for the concept of accelerated aging after CRT implicates screening for early-onset dementia,"the researchers said.
The tests used in the study included the computerized Amsterdam Neuropsychological Tasks (ANT) program, used to assess executive functions, and the four subtest short-form of the Wechsler Adult Intelligence Scale Revised (WAIS-R III).
Ms. Schuitema's coauthors are from the University of Leiden; University Hospitals Leuven, Belgium; and Academic Medical Center, Amsterdam. The authors had no disclosures. The study was funded by grants, including one from the Dutch Cancer Society.
FROM THE JOURNAL OF CLINICAL ONCOLOGY
Major finding: Compared with controls, survivors who had cranial radiotherapy had significant reductions in white matter integrity and lower neurocognitive function, with effects that included lower IQ, poorer visuomotor accuracy, and poorer work flow during sustained attention.
Data source: Magnetic resonance imaging and neuropsychological test results in 93 survivors of childhood ALL or lymphoma and 49 healthy controls.
Disclosures: The study was supported with grants, including one from the Dutch Cancer Society. The authors had no disclosures.
Ten tips for chronic venous ulcers
The underlying pathophysiology of chronic venous insufficiency is complex and involves many factors. Studies have shown that average venous ulcers may need 6-12 months for complete healing with an anticipated recurrence rate exceeding 2/3 cases in 5 years. These numbers reflect the magnitude of the problem and mandate deploying all efforts to stop progression of the disease. Our group has found the following 10 tips have significantly improved our healing rates.
1. First, rule out any associated arterial, immunologic, endocrine, or other systemic causes for leg/foot ulceration.
2. Be aggressive to stop progression of the disease (fight CEAP 6): any local tenderness at the site of discolored skin at the gaiter area for venous ulcers should initiate a prompt reflux study to evaluate for incompetent perforators.

3. Venous ulcers are associated with an incompetent perforator within 2 cm of the ulcer area.
4. Recurrent venous ulcers at the same location may be associated with venous outflow obstruction, (May-Thurner syndrome is an underestimated pathology) which affects mainly the left leg.
5. When performing iliac vein venograms, make liberal use of intravascular ultrasound.
6. Exudative venous ulcers need multilayer compression dressings and appropriate antibiotics if infection exists.
7. Pentoxifylline (Trental) 800 mg, 3 times daily.
8. Frequent debridement and frequent objective evaluation for ulcer area with each office visit.
9. Bi-layered living cell treatment (Apligraf?) to promote healing.
10. Office/clinic visit every 3 months after complete healing (CEAP 5) and further testing as needed.
Dr. Mousa is an associate professor at the Department of Surgery, West Virginia University, Morgantown.
The underlying pathophysiology of chronic venous insufficiency is complex and involves many factors. Studies have shown that average venous ulcers may need 6-12 months for complete healing with an anticipated recurrence rate exceeding 2/3 cases in 5 years. These numbers reflect the magnitude of the problem and mandate deploying all efforts to stop progression of the disease. Our group has found the following 10 tips have significantly improved our healing rates.
1. First, rule out any associated arterial, immunologic, endocrine, or other systemic causes for leg/foot ulceration.
2. Be aggressive to stop progression of the disease (fight CEAP 6): any local tenderness at the site of discolored skin at the gaiter area for venous ulcers should initiate a prompt reflux study to evaluate for incompetent perforators.
3. Venous ulcers are associated with an incompetent perforator within 2 cm of the ulcer area.
4. Recurrent venous ulcers at the same location may be associated with venous outflow obstruction, (May-Thurner syndrome is an underestimated pathology) which affects mainly the left leg.
5. When performing iliac vein venograms, make liberal use of intravascular ultrasound.
6. Exudative venous ulcers need multilayer compression dressings and appropriate antibiotics if infection exists.
7. Pentoxifylline (Trental) 800 mg, 3 times daily.
8. Frequent debridement and frequent objective evaluation for ulcer area with each office visit.
9. Bi-layered living cell treatment (Apligraf?) to promote healing.
10. Office/clinic visit every 3 months after complete healing (CEAP 5) and further testing as needed.
Dr. Mousa is an associate professor at the Department of Surgery, West Virginia University, Morgantown.

Peripheral neuropathy linked to obstructive sleep apnea?
CASE A 57-year-old white woman presented with symptoms of bilateral “stocking-like numbness” and the sensation of “wearing socks for a few weeks” but denied any injury, previous chemotherapy, or diabetes. Her medical history was positive for untreated obstructive sleep apnea (OSA), obesity (body mass index, 36 kg/m2), osteoarthritis in various joints, impaired fasting glucose with normal glycosylated hemoglobin (HbA1c), hypertension, gastroesophageal reflux disease, hypothyroidism, hypercholesterolemia, and osteoporosis.
Our initial examination revealed decreased sensation to light palpation and pin prick over the distal portion of her lower extremities in a stocking-like fashion. Proprioception was decreased at the distal joint of the big toe. Her deep tendon reflex pattern was symmetric with 2+ at the knees, ankles, and toes. The rest of her lower extremity exam was within normal limits and there were no obvious vascular abnormalities.
Given the suspicion of peripheral neuropathy, the patient underwent laboratory tests and a nerve conduction study. Vitamin B12, vitamin B1, methylmalonic acid (MMA), thyroid function, thyroid peroxidase (TPO), serum protein electrophoresis (SPEP), rapid plasma reagin (RPR), sedimentation rate, vitamin D, complete blood count, and chemistry profile 24 were all negative. The antinuclear antibody test revealed a homogenous 1:80 titer with a negative nuclear deoxyribonucleic acid. Her fasting glucose had been elevated between 107 to 117 mg/dL in the last 5 years but HbA1c was normal (5.8%). The patient had not been diagnosed with diabetes and her latest glucose values had been stable.
However, electromyography and a nerve conduction study were abnormal, with electrophysiological evidence of mild axonal polyneuropathy. During the month prior to her presentation, she had developed burning pain in addition to the numbness/stocking sensation. Pregabalin, gabapentin, duloxetine, celecoxib, hydrocodone, methadone, and other medications were ineffective. Eventually the foot pain became so severe—she described it as “walking on tacks”—that she was unable to walk.
Our team decided to do a nerve block to relieve the pain. Initially she underwent right and later left peroneal and posterior tibial nerve blocks, which gave her immediate relief that lasted about 2 months.
Relief from the pain, but what about the OSA symptoms?
In the meantime, our patient developed increasing OSA symptoms, including snoring, nonrestorative sleep, daytime somnolence, and fatigue. (To learn more about OSA, see “Obstructive sleep apnea: A diagnostic and treatment guide” on page 565.)
Her history of mild-to-moderate OSA dated back 2 years, and included an apnea-hypopnea index (AHI) of 20 events per hour and 133 episodes of oxygen desaturation with a low O2 desaturation of 83%. The patient had never been treated, however, because she felt that she couldn’t tolerate the continuous positive airway pressure (CPAP) mask.
The patient finally agreed to a CPAP titration study. Her AHI improved from 20 to <2 events per hour; the oxygen desaturation dropped from 133 to 104 episodes; and the lowest O2 desaturation went from 83% to 85%.
When we initially started CPAP, our patient did not tolerate it very well. However, after consulting with our sleep clinic, she was placed on bilevel positive airway pressure, which she did tolerate. Surprisingly, she also noticed immediate improvement of the neuropathic foot pain; after a few weeks it resolved completely.
Still no foot pain…We continue to follow the patient’s progress and, after 3 years, she remains free of foot pain. Her initial numbness remains, however. She has not developed diabetes, with similar fasting sugar levels and an HbA1c of 5.4%. She is not taking any medication for neuropathic pain, but remains on methadone for unrelated severe intractable osteoarthritic pain of the lumbar spine, bilateral knee joints, and left hip.
The link between sleep apnea and neuropathy
Our case report suggests that clinicians should consider OSA as a cause of neuropathic pain. A recent review of the literature supports the relationship between the 2 conditions.
The prevalence of neuropathy in the general population is 2.4%, rising to 8% with advancing age.1 Many different types of peripheral neuropathy have been described; they have different symptoms and characteristics, depending on the specific part of the nervous system that is affected.2
The literature reveals a strong association between OSA and peripheral neuropathy and sight-threatening retinopathy.3 One study found that nearly 60% of patients with diabetes and OSA also have peripheral neuropathy.4 Another report found that OSA is an independent risk factor for axonal damage of peripheral nerves.5 Furthermore, a case-control study revealed that the impaired neural function is at least partly reversible with treatment for sleep apnea.4 Finally, Tahrani et al6 have found that “neuropathy prevalence was higher in patients with OSA than those without” (60% vs 27%; P<.001), which supports our case finding.
The specific mechanism linking OSA and neuropathy remains elusive, but the evidence suggests that peripheral nervous tissue is affected by chronic endoneural hypoxia in this patient population.7 In patients with OSA, 2 types of nerve dysfunction are apparent: ischemia-related axonal degeneration and resistance to ischemic nerve failure.8
An approach worth considering. While nerve blocks did provide some relief for our patient, they are not a long-term solution. To our knowledge, this case report is the first one published in the United States describing resolution of neuropathic pain by treatment of OSA. This approach is certainly worth considering in patients who have not responded to more traditional therapy.
Correspondence
Fong Wong, DDS, MS, Associate Professor, Department of Restorative Dental Sciences, College of Dentistry, University of Florida, 1395 Center Drive, PO Box 100435, Gainesville, FL 32610; [email protected]
1. Martyn C, Hughes R. Epidemiology of peripheral neuropathy. J Neurol Neurosurg Psychiatry. 1997;62:310-318.
2. NINDS peripheral neuropathy information page. Available at: http://www.ninds.nih.gov/disorders/peripheralneuropathy/peripheralneuropathy.htm. Last updated September 19, 2012. Accessed September 16, 2013.
3. Waller E, Bendel R, Kaplan J. Sleep disorders and the eye. Mayo Clin Proc. 2008;83:1251-1261.
4. Dziewas R, Schilling M, Engel P, et al. Treatment for obstructive sleep apnoea: effect on peripheral nerve function. J Neurol Neurosurg Psychiatry. 2007;78:295-297.
5. Ludemann P, Dziewas R, Soros P, et al. Axonal polyneuropathy in obstructive sleep apnoea. J Neurol Neurosurg Psychiatry. 2001;70:685-687.
6. Tahrani AA, Ali A, Raymond NT, et al. Obstructive sleep apnea and diabetic neuropathy: a novel association in patients with type 2 diabetes. Am J Respir Crit Care Med. 2012;186:434-441.
7. Pfeiffer G, Kunze K, Bruch M, et al. Polyneuropathy associated with chronic hypoxaemia: prevalence in patients with chronic obstructive pulmonary disease. J Neurol. 1990;237:230-233.
8. Mayer P, Dematteis M, Pepin J, et al. Peripheral neuropathy in sleep apnea. A tissue marker of the severity of nocturnal desaturation. Am J Respir Crit Care Med. 1999;159:213-219.
CASE A 57-year-old white woman presented with symptoms of bilateral “stocking-like numbness” and the sensation of “wearing socks for a few weeks” but denied any injury, previous chemotherapy, or diabetes. Her medical history was positive for untreated obstructive sleep apnea (OSA), obesity (body mass index, 36 kg/m2), osteoarthritis in various joints, impaired fasting glucose with normal glycosylated hemoglobin (HbA1c), hypertension, gastroesophageal reflux disease, hypothyroidism, hypercholesterolemia, and osteoporosis.
Our initial examination revealed decreased sensation to light palpation and pin prick over the distal portion of her lower extremities in a stocking-like fashion. Proprioception was decreased at the distal joint of the big toe. Her deep tendon reflex pattern was symmetric with 2+ at the knees, ankles, and toes. The rest of her lower extremity exam was within normal limits and there were no obvious vascular abnormalities.
Given the suspicion of peripheral neuropathy, the patient underwent laboratory tests and a nerve conduction study. Vitamin B12, vitamin B1, methylmalonic acid (MMA), thyroid function, thyroid peroxidase (TPO), serum protein electrophoresis (SPEP), rapid plasma reagin (RPR), sedimentation rate, vitamin D, complete blood count, and chemistry profile 24 were all negative. The antinuclear antibody test revealed a homogenous 1:80 titer with a negative nuclear deoxyribonucleic acid. Her fasting glucose had been elevated between 107 to 117 mg/dL in the last 5 years but HbA1c was normal (5.8%). The patient had not been diagnosed with diabetes and her latest glucose values had been stable.
However, electromyography and a nerve conduction study were abnormal, with electrophysiological evidence of mild axonal polyneuropathy. During the month prior to her presentation, she had developed burning pain in addition to the numbness/stocking sensation. Pregabalin, gabapentin, duloxetine, celecoxib, hydrocodone, methadone, and other medications were ineffective. Eventually the foot pain became so severe—she described it as “walking on tacks”—that she was unable to walk.
Our team decided to do a nerve block to relieve the pain. Initially she underwent right and later left peroneal and posterior tibial nerve blocks, which gave her immediate relief that lasted about 2 months.
Relief from the pain, but what about the OSA symptoms?
In the meantime, our patient developed increasing OSA symptoms, including snoring, nonrestorative sleep, daytime somnolence, and fatigue. (To learn more about OSA, see “Obstructive sleep apnea: A diagnostic and treatment guide” on page 565.)
Her history of mild-to-moderate OSA dated back 2 years, and included an apnea-hypopnea index (AHI) of 20 events per hour and 133 episodes of oxygen desaturation with a low O2 desaturation of 83%. The patient had never been treated, however, because she felt that she couldn’t tolerate the continuous positive airway pressure (CPAP) mask.
The patient finally agreed to a CPAP titration study. Her AHI improved from 20 to <2 events per hour; the oxygen desaturation dropped from 133 to 104 episodes; and the lowest O2 desaturation went from 83% to 85%.
When we initially started CPAP, our patient did not tolerate it very well. However, after consulting with our sleep clinic, she was placed on bilevel positive airway pressure, which she did tolerate. Surprisingly, she also noticed immediate improvement of the neuropathic foot pain; after a few weeks it resolved completely.
Still no foot pain…We continue to follow the patient’s progress and, after 3 years, she remains free of foot pain. Her initial numbness remains, however. She has not developed diabetes, with similar fasting sugar levels and an HbA1c of 5.4%. She is not taking any medication for neuropathic pain, but remains on methadone for unrelated severe intractable osteoarthritic pain of the lumbar spine, bilateral knee joints, and left hip.
The link between sleep apnea and neuropathy
Our case report suggests that clinicians should consider OSA as a cause of neuropathic pain. A recent review of the literature supports the relationship between the 2 conditions.
The prevalence of neuropathy in the general population is 2.4%, rising to 8% with advancing age.1 Many different types of peripheral neuropathy have been described; they have different symptoms and characteristics, depending on the specific part of the nervous system that is affected.2
The literature reveals a strong association between OSA and peripheral neuropathy and sight-threatening retinopathy.3 One study found that nearly 60% of patients with diabetes and OSA also have peripheral neuropathy.4 Another report found that OSA is an independent risk factor for axonal damage of peripheral nerves.5 Furthermore, a case-control study revealed that the impaired neural function is at least partly reversible with treatment for sleep apnea.4 Finally, Tahrani et al6 have found that “neuropathy prevalence was higher in patients with OSA than those without” (60% vs 27%; P<.001), which supports our case finding.
The specific mechanism linking OSA and neuropathy remains elusive, but the evidence suggests that peripheral nervous tissue is affected by chronic endoneural hypoxia in this patient population.7 In patients with OSA, 2 types of nerve dysfunction are apparent: ischemia-related axonal degeneration and resistance to ischemic nerve failure.8
An approach worth considering. While nerve blocks did provide some relief for our patient, they are not a long-term solution. To our knowledge, this case report is the first one published in the United States describing resolution of neuropathic pain by treatment of OSA. This approach is certainly worth considering in patients who have not responded to more traditional therapy.
Correspondence
Fong Wong, DDS, MS, Associate Professor, Department of Restorative Dental Sciences, College of Dentistry, University of Florida, 1395 Center Drive, PO Box 100435, Gainesville, FL 32610; [email protected]
1. Martyn C, Hughes R. Epidemiology of peripheral neuropathy. J Neurol Neurosurg Psychiatry. 1997;62:310-318.
2. NINDS peripheral neuropathy information page. Available at: http://www.ninds.nih.gov/disorders/peripheralneuropathy/peripheralneuropathy.htm. Last updated September 19, 2012. Accessed September 16, 2013.
3. Waller E, Bendel R, Kaplan J. Sleep disorders and the eye. Mayo Clin Proc. 2008;83:1251-1261.
4. Dziewas R, Schilling M, Engel P, et al. Treatment for obstructive sleep apnoea: effect on peripheral nerve function. J Neurol Neurosurg Psychiatry. 2007;78:295-297.
5. Ludemann P, Dziewas R, Soros P, et al. Axonal polyneuropathy in obstructive sleep apnoea. J Neurol Neurosurg Psychiatry. 2001;70:685-687.
6. Tahrani AA, Ali A, Raymond NT, et al. Obstructive sleep apnea and diabetic neuropathy: a novel association in patients with type 2 diabetes. Am J Respir Crit Care Med. 2012;186:434-441.
7. Pfeiffer G, Kunze K, Bruch M, et al. Polyneuropathy associated with chronic hypoxaemia: prevalence in patients with chronic obstructive pulmonary disease. J Neurol. 1990;237:230-233.
8. Mayer P, Dematteis M, Pepin J, et al. Peripheral neuropathy in sleep apnea. A tissue marker of the severity of nocturnal desaturation. Am J Respir Crit Care Med. 1999;159:213-219.
Democracy - best, but only if....
A stated goal of the United States is to support and promote democracy throughout the world. This seems reasonable, because democracy has often worked well in our own and other Western countries, and because no other form of government has consistently been better. So is democracy the best form of government? I submit that it is the best only if certain conditions are met.
For democracy to work, the public must be well informed and willing to consider, at least to some extent, the country’s interests in addition to their own self-interests. If a major fraction of the public does not care about or know what is good for the country or is totally motivated by self-interest, the government and the country will fail. Sadly this appears to be the case in the U.S. today as evidenced by Jay Leno’s "JayWalking Segments" in which most young people interviewed – even college graduates – have no idea about issues important to our country. They appear to be more interested in sports and their social life and more knowledgeable about TV sitcoms and reality shows.
How can such individuals be relied upon to pick government leaders who will take care of our country’s interests in the trying times it faces politically and economically? An ill-informed and non-caring public is more likely to pick leaders who are the slickest talkers and who promise the most despite the impossibility or negative effects of keeping these promises. This know-nothing or self-interested nature of our electorate contributes importantly to the ever expanding entitlement culture in the U.S. and the resulting dangerous expansion of our national debt.

Another related requirement for democracy to be an effective form of government is the need for an honest and objective media and press. A controlled or biased source of information contributes hugely to an ill-informed public. Whoever controls the media and the press controls the minds of the voters. For democracy to work effectively, the public must not only want to be informed, they must also be given the necessary objective facts to make valid judgments. The press has a vital responsibility to provide such facts with minimal bias. There is considerable doubt about whether or not this is occurring today in the U.S.
Of even greater importance to a successful democracy is the ethical stature of its leaders and their motivation – once elected – to act in the best interests of the country. Many forces act upon our leaders and are counter to these interests. These include obligations to those who helped elect them, ideology, personal gain, a desire to be re-elected, and most importantly the corrupting requirement to solicit campaign financing. In the U.S. currently, the need to finance expensive campaigns is a major flaw in our democracy, and is really a veiled form of bribery.
For a democratic leader to be successful in terms of doing a good job of leading the country, all these forces must be overridden by the desire to do what is right and best for the whole country. This means the leader must not serve solely special or self-interests, and must have the courage and inner strength to do what may at the moment be unpopular with his or her electoral base. He or she must unite the country rather than divide it for short-term political or parochial gain. Unfortunately many of our recently elected U.S. leaders have not met any of these requirements. If this trend continues, our democracy will serve the country’s interests poorly, and the U.S. will decline rather than gain in stature and strength.
Efforts at democracy in the Middle East and elsewhere have failed because some or all of the requirements discussed here have not been met. A similar decline awaits our U.S. democracy if the current flaws in the underlying system cannot be corrected.
So far this discussion has largely been related to the U.S. federal government. However, the same considerations apply to effective governments at the county, state, and city levels, and to governing bodies of other entities which purport to be managed in a democratic fashion. This even applies to our vascular societies. The ethics and character of the leaders and those choosing them are important to effective governance and the success of the organization. If special interests, financial conflicts, and self-interest prevail over the needs of the organization, the latter will fail and decline.
Dr. Veith is Professor of Surgery at New York University Medical Center and the Cleveland Clinic. He is an associate medical editor for Vascular Specialist.
The ideas and opinions expressed in Vascular Specialist do not necessarily reflect those of the Society or Publisher.
A stated goal of the United States is to support and promote democracy throughout the world. This seems reasonable, because democracy has often worked well in our own and other Western countries, and because no other form of government has consistently been better. So is democracy the best form of government? I submit that it is the best only if certain conditions are met.
For democracy to work, the public must be well informed and willing to consider, at least to some extent, the country’s interests in addition to their own self-interests. If a major fraction of the public does not care about or know what is good for the country or is totally motivated by self-interest, the government and the country will fail. Sadly this appears to be the case in the U.S. today as evidenced by Jay Leno’s "JayWalking Segments" in which most young people interviewed – even college graduates – have no idea about issues important to our country. They appear to be more interested in sports and their social life and more knowledgeable about TV sitcoms and reality shows.
How can such individuals be relied upon to pick government leaders who will take care of our country’s interests in the trying times it faces politically and economically? An ill-informed and non-caring public is more likely to pick leaders who are the slickest talkers and who promise the most despite the impossibility or negative effects of keeping these promises. This know-nothing or self-interested nature of our electorate contributes importantly to the ever expanding entitlement culture in the U.S. and the resulting dangerous expansion of our national debt.
Another related requirement for democracy to be an effective form of government is the need for an honest and objective media and press. A controlled or biased source of information contributes hugely to an ill-informed public. Whoever controls the media and the press controls the minds of the voters. For democracy to work effectively, the public must not only want to be informed, they must also be given the necessary objective facts to make valid judgments. The press has a vital responsibility to provide such facts with minimal bias. There is considerable doubt about whether or not this is occurring today in the U.S.
Of even greater importance to a successful democracy is the ethical stature of its leaders and their motivation – once elected – to act in the best interests of the country. Many forces act upon our leaders and are counter to these interests. These include obligations to those who helped elect them, ideology, personal gain, a desire to be re-elected, and most importantly the corrupting requirement to solicit campaign financing. In the U.S. currently, the need to finance expensive campaigns is a major flaw in our democracy, and is really a veiled form of bribery.
For a democratic leader to be successful in terms of doing a good job of leading the country, all these forces must be overridden by the desire to do what is right and best for the whole country. This means the leader must not serve solely special or self-interests, and must have the courage and inner strength to do what may at the moment be unpopular with his or her electoral base. He or she must unite the country rather than divide it for short-term political or parochial gain. Unfortunately many of our recently elected U.S. leaders have not met any of these requirements. If this trend continues, our democracy will serve the country’s interests poorly, and the U.S. will decline rather than gain in stature and strength.
Efforts at democracy in the Middle East and elsewhere have failed because some or all of the requirements discussed here have not been met. A similar decline awaits our U.S. democracy if the current flaws in the underlying system cannot be corrected.
So far this discussion has largely been related to the U.S. federal government. However, the same considerations apply to effective governments at the county, state, and city levels, and to governing bodies of other entities which purport to be managed in a democratic fashion. This even applies to our vascular societies. The ethics and character of the leaders and those choosing them are important to effective governance and the success of the organization. If special interests, financial conflicts, and self-interest prevail over the needs of the organization, the latter will fail and decline.
Dr. Veith is Professor of Surgery at New York University Medical Center and the Cleveland Clinic. He is an associate medical editor for Vascular Specialist.
The ideas and opinions expressed in Vascular Specialist do not necessarily reflect those of the Society or Publisher.