User login
Tailored therapy needed to conquer IPV
Conducting effective family therapy is never a one-size-fits-all proposition. In our work with families, we must keep in mind that, just as the dynamics in each family are different, so, too, must be our approaches. This is particularly the case for people who are experiencing intimate partner violence, or IPV.
The cases of three patients described below illustrate that point well; I’ve changed the patients’ names to protect their anonymity.
Belkis

She is a hardworking immigrant making minimum wage as a housekeeper. She presents to her psychiatric outpatient appointment with complaints of being sad and anxious. When asked about her husband and their relationship, she says tentatively that they disagree about things. She doesn’t acknowledge any abuse until she is asked directly, then she hangs her head down and looks ashamed. "He tells me I am not a good wife." With encouragement, she admits that she would like to leave him but has nowhere to go and is afraid that he will really hurt her if she tries to leave. "I tried before, and he threatened to kill me if I tried again."
Melanie
She is a well-educated women working as a writer and has a good income. She presents to her psychiatric outpatient appointment with complaints of being sad and anxious. When asked about her husband and their relationship, she says that he is abusive to her. She states that she would like to come into therapy to figure out why she has not been able to leave him. "What ties me to him?" She says her friends tell her she should leave. "There must be a reason I stay; can you help me figure it out? I cannot move to another relationship without understanding what is going on in this one."
Zelda
She is a successful saleswoman and comes into the office with the complaint that she and her husband are having problems. On direct questioning, she affirms that that two do engage in direct fighting that gets physical at times. She says she often initiates the violence. She wants to stay with her husband and says they both want to make a go of things. They want to come into couples therapy and work on improving their relationship. But they fear that if they do go to a therapist together, as soon as she says there is violence in their relationship, she will be refused treatment.
Different cases, different approaches
Belkis benefits from treatment that focuses on support, education about domestic violence, and help with developing a safety plan. She wants to leave but needs the help and structure to do so.
Melanie enters individual therapy, and comes to understand that in her relationship with her husband, she is reenacting the relationship she had as a child with her parents. As a child, she felt like she was there only to help her mother clean and care for her sibling and that her needs and desires did not matter.
She felt that her elder brother was the favorite and that she had to support him as he pursued his studies. In her current relationship, she strives to "matter as a person" and not be seen as someone to do the cooking and the chores. She speaks back to her husband and challenges him when he demeans her. When she understands that the dynamic that binds her to her husband is the same dynamic that she experienced growing up, she feels relieved. "Now I can begin to think about taking care of myself and setting my own goals for my life. Now I can leave my past behind," she said.
Zelda and her husband want couples therapy. Both are committed to the relationship and stopping the violence as well as learning how to solve problems, communicate better, and meet each other’s needs by asking and negotiating. Before entering couples therapy, they agree to stop any violence while in treatment. The therapist teaches them skills to "take a time out" when conflict arises. As I’ve written previously, if patients are unable to discuss the issue calmly, they bring it to therapy (Adv. Psychiatric Treat. 2007;13:376-83).
How common is IPV?
Violence against women was not viewed as a serious issue until the second wave of feminism increased awareness, pushed for legislation, and increased resources.
How should we understand IPV? This phenomenon is often bidirectional, where each partner is both an aggressor and a victim, although women remain much more likely to be injured by partner violence than are men (Am. J. Public Health 2007;97:941-7).
In an outpatient sample of couples seeking marital therapy, 64% of wives and 61% of husbands were classified as aggressive (Violence Vict. 1994;9:107-24). In 272 engaged couples, 44% of women and 31% of men reported physical violence toward their partners (J. Consult. Clin. Psychol. 1989;57:263-8). As illustrated by the three cases above, IPV occurs across a range, from the classic male perpetrator and female victim, to the couple that engages in mutual violence.
Why do women stay?
Researchers such as Virginia Goldner, Ph.D., of the Ackerman Institute for the Family in New York, have contributed significantly to the understanding of why women stay in violent relationships. Dr. Goldner describes a generational imperative that is passed from mothers to daughters (Fam. Process 1990;29:343-64). This often includes the view that the role of women is to preserve the family, regardless of either the personal cost or the presence of abuse or violence.
Daughters raised in a highly patriarchal family might suffer existential neglect and be undervalued except in their capacity as caregiver to others in the family. Therefore, staying in a relationship protects the woman against guilt that she might feel if she gives up her caretaking role. These daughters may grow up with the belief that "being loved" is contingent upon denial of their self, being selfless. They may see the opposite as "being selfish" and not compatible with their self-image. Melanie certainly identified this guilt and had difficulty thinking about meeting her own needs.
Asking women about their mothers and the internalized view of themselves as independent agents can expose this dilemma. These daughters may see their mothers as powerless, devalued, and depressed. Being loyal to their mothers means accepting a subjugated role, while allying with their fathers means betraying their mothers and their own sense of themselves, as a woman.
If you decide to take a couple into therapy, it is important to interview each member of the couple individually before starting couples therapy. The information you glean from these interviews also will help determine when to offer and when not to offer couples therapy.
Factors that should encourage you not to proceed with couples therapy include the uncontrolled, continuous use of alcohol or drugs; fear of serious injury from the patient’s partner; severe violence that has resulted in the victim requiring medical attention; conviction for a violent crime or violation of a restraining order; prior use of a weapon against the partner; prior threat to kill the partner; stalking or other partner-focused obsessional behavior; and bizarre forms of violence, such as sadistic violence.
Here are a few guidelines for assessing intimate partner violence:
• Ask about relationship violence. Consider use of a questionnaire.
• If present, determine severity and ask about fear of partner.
• Identify risk factors for the potentially lethal relationship.
• If substance misuse is present, recommend abstinence and refer for treatment.
• If the couple wishes to stay together and to resolve the intimate partner violence, refer for conjoint treatment with a specialized family therapist.
• Assess and treat common comorbidities such as major depressive disorder and post-traumatic stress disorder.
Belkis, Melanie, and Zelda are three different women in abusive relationships who require three different solutions. Each patient requires a treatment based on their unique history and goals. Make sure that you are a family psychiatrist who understands the differences between your patients – and that you are able to provide a solution tailored to teach patient’s needs.
Elements of a safety plan
Encourage patients who in the midst of intimate partner violence to take the following steps to keep them and their families safe:
• Memorize phone numbers of people to call in emergency.
• Teach older children important phone numbers and when to dial 911.
• Keep information about domestic violence shelters in a safe place where you can get it quickly when you need it.
• Buy a cell phone that the abuser does not know about.
• Try to open your own bank account.
• Stay in touch with friends and neighbors. Do not cut yourself off from people.
• Rehearse your escape plan until you know it by heart.
• Leave a set of car keys, extra money, a change of clothes, and copies of important documents with a trusted friend or relative.
Dr. Heru is with the department of psychiatry at the University of Colorado at Denver, Aurora. She is editor of the recently published book, "Working With Families in Medical Settings: A Multidisciplinary Guide for Psychiatrists and Other Health Professionals" (New York: Routledge, 2013).
Conducting effective family therapy is never a one-size-fits-all proposition. In our work with families, we must keep in mind that, just as the dynamics in each family are different, so, too, must be our approaches. This is particularly the case for people who are experiencing intimate partner violence, or IPV.
The cases of three patients described below illustrate that point well; I’ve changed the patients’ names to protect their anonymity.
Belkis
She is a hardworking immigrant making minimum wage as a housekeeper. She presents to her psychiatric outpatient appointment with complaints of being sad and anxious. When asked about her husband and their relationship, she says tentatively that they disagree about things. She doesn’t acknowledge any abuse until she is asked directly, then she hangs her head down and looks ashamed. "He tells me I am not a good wife." With encouragement, she admits that she would like to leave him but has nowhere to go and is afraid that he will really hurt her if she tries to leave. "I tried before, and he threatened to kill me if I tried again."
Melanie
She is a well-educated women working as a writer and has a good income. She presents to her psychiatric outpatient appointment with complaints of being sad and anxious. When asked about her husband and their relationship, she says that he is abusive to her. She states that she would like to come into therapy to figure out why she has not been able to leave him. "What ties me to him?" She says her friends tell her she should leave. "There must be a reason I stay; can you help me figure it out? I cannot move to another relationship without understanding what is going on in this one."
Zelda
She is a successful saleswoman and comes into the office with the complaint that she and her husband are having problems. On direct questioning, she affirms that that two do engage in direct fighting that gets physical at times. She says she often initiates the violence. She wants to stay with her husband and says they both want to make a go of things. They want to come into couples therapy and work on improving their relationship. But they fear that if they do go to a therapist together, as soon as she says there is violence in their relationship, she will be refused treatment.
Different cases, different approaches
Belkis benefits from treatment that focuses on support, education about domestic violence, and help with developing a safety plan. She wants to leave but needs the help and structure to do so.
Melanie enters individual therapy, and comes to understand that in her relationship with her husband, she is reenacting the relationship she had as a child with her parents. As a child, she felt like she was there only to help her mother clean and care for her sibling and that her needs and desires did not matter.
She felt that her elder brother was the favorite and that she had to support him as he pursued his studies. In her current relationship, she strives to "matter as a person" and not be seen as someone to do the cooking and the chores. She speaks back to her husband and challenges him when he demeans her. When she understands that the dynamic that binds her to her husband is the same dynamic that she experienced growing up, she feels relieved. "Now I can begin to think about taking care of myself and setting my own goals for my life. Now I can leave my past behind," she said.
Zelda and her husband want couples therapy. Both are committed to the relationship and stopping the violence as well as learning how to solve problems, communicate better, and meet each other’s needs by asking and negotiating. Before entering couples therapy, they agree to stop any violence while in treatment. The therapist teaches them skills to "take a time out" when conflict arises. As I’ve written previously, if patients are unable to discuss the issue calmly, they bring it to therapy (Adv. Psychiatric Treat. 2007;13:376-83).
How common is IPV?
Violence against women was not viewed as a serious issue until the second wave of feminism increased awareness, pushed for legislation, and increased resources.
How should we understand IPV? This phenomenon is often bidirectional, where each partner is both an aggressor and a victim, although women remain much more likely to be injured by partner violence than are men (Am. J. Public Health 2007;97:941-7).
In an outpatient sample of couples seeking marital therapy, 64% of wives and 61% of husbands were classified as aggressive (Violence Vict. 1994;9:107-24). In 272 engaged couples, 44% of women and 31% of men reported physical violence toward their partners (J. Consult. Clin. Psychol. 1989;57:263-8). As illustrated by the three cases above, IPV occurs across a range, from the classic male perpetrator and female victim, to the couple that engages in mutual violence.
Why do women stay?
Researchers such as Virginia Goldner, Ph.D., of the Ackerman Institute for the Family in New York, have contributed significantly to the understanding of why women stay in violent relationships. Dr. Goldner describes a generational imperative that is passed from mothers to daughters (Fam. Process 1990;29:343-64). This often includes the view that the role of women is to preserve the family, regardless of either the personal cost or the presence of abuse or violence.
Daughters raised in a highly patriarchal family might suffer existential neglect and be undervalued except in their capacity as caregiver to others in the family. Therefore, staying in a relationship protects the woman against guilt that she might feel if she gives up her caretaking role. These daughters may grow up with the belief that "being loved" is contingent upon denial of their self, being selfless. They may see the opposite as "being selfish" and not compatible with their self-image. Melanie certainly identified this guilt and had difficulty thinking about meeting her own needs.
Asking women about their mothers and the internalized view of themselves as independent agents can expose this dilemma. These daughters may see their mothers as powerless, devalued, and depressed. Being loyal to their mothers means accepting a subjugated role, while allying with their fathers means betraying their mothers and their own sense of themselves, as a woman.
If you decide to take a couple into therapy, it is important to interview each member of the couple individually before starting couples therapy. The information you glean from these interviews also will help determine when to offer and when not to offer couples therapy.
Factors that should encourage you not to proceed with couples therapy include the uncontrolled, continuous use of alcohol or drugs; fear of serious injury from the patient’s partner; severe violence that has resulted in the victim requiring medical attention; conviction for a violent crime or violation of a restraining order; prior use of a weapon against the partner; prior threat to kill the partner; stalking or other partner-focused obsessional behavior; and bizarre forms of violence, such as sadistic violence.
Here are a few guidelines for assessing intimate partner violence:
• Ask about relationship violence. Consider use of a questionnaire.
• If present, determine severity and ask about fear of partner.
• Identify risk factors for the potentially lethal relationship.
• If substance misuse is present, recommend abstinence and refer for treatment.
• If the couple wishes to stay together and to resolve the intimate partner violence, refer for conjoint treatment with a specialized family therapist.
• Assess and treat common comorbidities such as major depressive disorder and post-traumatic stress disorder.
Belkis, Melanie, and Zelda are three different women in abusive relationships who require three different solutions. Each patient requires a treatment based on their unique history and goals. Make sure that you are a family psychiatrist who understands the differences between your patients – and that you are able to provide a solution tailored to teach patient’s needs.
Elements of a safety plan
Encourage patients who in the midst of intimate partner violence to take the following steps to keep them and their families safe:
• Memorize phone numbers of people to call in emergency.
• Teach older children important phone numbers and when to dial 911.
• Keep information about domestic violence shelters in a safe place where you can get it quickly when you need it.
• Buy a cell phone that the abuser does not know about.
• Try to open your own bank account.
• Stay in touch with friends and neighbors. Do not cut yourself off from people.
• Rehearse your escape plan until you know it by heart.
• Leave a set of car keys, extra money, a change of clothes, and copies of important documents with a trusted friend or relative.
Dr. Heru is with the department of psychiatry at the University of Colorado at Denver, Aurora. She is editor of the recently published book, "Working With Families in Medical Settings: A Multidisciplinary Guide for Psychiatrists and Other Health Professionals" (New York: Routledge, 2013).

New and Noteworthy Information—October 2013
By lowering homocysteine levels, vitamin B supplementation may reduce the risk of stroke significantly for some individuals, according to research published online ahead of print September 18 in Neurology. Investigators analyzed data from 14 randomized controlled trials published before August 2012. The trials included 54,913 participants, and the investigators measured the association between B vitamin supplementation and end point events using a fixed-effects model and χ2 tests. The group observed a reduction in overall stroke events resulting from reduction in homocysteine levels following B vitamin supplementation, but not in subgroups divided according to primary or secondary prevention measures, ischemic versus hemorrhagic stroke, or occurrence of fatal stroke. Vitamin B reduced stroke events in subgroups with three or more years of follow-up and without cereal folate fortification or chronic kidney disease.
The deletion of information from chromosome 22 may be a genetic risk factor for early-onset Parkinson’s disease, researchers reported online ahead of print September 9 in JAMA Neurology. The investigators conducted an observational study of the occurrence of Parkinson’s disease in a cohort of 159 adults with a molecularly confirmed diagnosis of 22q11.2 deletion syndrome. The group examined postmortem brain tissue from patients with 22q11.2 deletion syndrome and a clinical history of Parkinson’s disease for neurodegenerative changes and compared it with tissue from persons with no history of a movement disorder. Adults with 22q11.2 deletion syndrome had a significantly elevated occurrence of Parkinson’s disease, compared with standard population estimates. Individuals with early-onset Parkinson’s disease and classic features of 22q11.2 deletion syndrome should be considered for genetic testing, said the authors.
High levels of lipid-depleted (LD) apolipoproteins are associated with cognitive difficulties but may be mitigated by diet, according to research published in the August issue of JAMA Neurology. Investigators randomized 20 adults with normal cognition (mean age, 69) and 27 adults with amnestic mild cognitive impairment (mean age, 67) to a diet high in saturated fat content and with a high glycemic index or to a diet low in saturated fat content and with a low glycemic index. Baseline levels of LD b-amyloid were greater for adults with mild cognitive impairment, compared with adults with normal cognition. The diet low in saturated fat tended to decrease LD b-amyloid levels, and the diet high in saturated fat increased these fractions.
The parkin protein may trigger the destruction of the bacterium that causes tuberculosis, according to research published online ahead of print September 4 in Nature. Genetic polymorphisms in the PARK2 regulatory region are associated with increased susceptibility to intracellular bacterial pathogens in humans. In mouse and human macrophages infected with Mycobacterium tuberculosis, parkin played a role in fighting the bacteria. Mice genetically engineered to lack parkin died after being infected by M. tuberculosis, while control mice survived the infection. In addition, parkin-deficient mice and flies were more sensitive to intracellular bacterial infections. The study results reveal an unexpected functional link between mitophagy and infectious disease, said the researchers. Strategies under investigation for combating Parkinson’s disease also might help fight tuberculosis, the authors added.
Low cardiovascular fitness early in life may be associated with an increased risk of epilepsy in adulthood, according to research published September 17 in Neurology. Investigators examined a population-based cohort study of approximately 1.2 million Swedish male conscripts born from 1950 to 1987 who were followed for as many as 40 years. Data on cardiovascular fitness were collected during conscription exams, and researchers linked the data with hospital registers to calculate later risk of epilepsy using Cox proportional hazard models. Low and medium cardiovascular fitness (compared with high cardiovascular fitness) at age 18 was associated with increased risk of future epilepsy (hazard ratios 1.79 and 1.36, respectively). The associations changed marginally after adjustment for familial influences and prior severe traumatic brain injury, cerebrovascular disease, or diabetes.
Whole-body MRI may predict cardiac and cerebrovascular events in patients with diabetes, according to a study published online ahead of print September 10 in Radiology. Researchers followed up 65 patients with types 1 and 2 diabetes who underwent a comprehensive, contrast-enhanced whole-body MRI protocol at baseline. Follow-up was performed by phone interview. The primary end point was a major adverse cardiac and cerebrovascular event (MACCE), which was defined as composite cardiac-cerebrovascular death, myocardial infarction, cerebrovascular event, or revascularization. Follow-up was completed in 61 patients. Normal whole-body MRI excluded MACCE during the follow-up period, but detectable ischemic or atherosclerotic changes at whole-body MRI were associated with a cumulative event rate of 20% at three years and 35% at six years. Whole-body MRI summary estimate of disease was strongly predictive for MACCE.
Obese individuals may have an elevated risk of episodic migraine, compared with healthy persons, according to research published online ahead of print September 11 in Neurology. Investigators analyzed data for 3,862 adult participants (including African Americans and Caucasians) in the National Comorbidity Survey Replication. Diagnostic criteria for episodic migraine were based on the International Classification of Headache Disorders. BMI was classified as underweight (<18.5 kg/m2), normal (18.5 to 24.9 kg/m2), overweight (25 to 29.9 kg/m2), or obese (≥30 kg/m2). The adjusted odds of episodic migraine were 81% greater in individuals who were obese, compared with those of normal weight. Stratified analyses demonstrated that the odds of episodic migraine were greater in obese, compared with normal-weight individuals, who were younger than 50, Caucasian, or female.
Approximately 15% of all ischemic strokes occur in young adults and adolescents, according to a consensus document developed by an expert panel of the American Academy of Neurology and published September 17 in Neurology. Few public-health and research initiatives have focused on stroke in the young, said the authors. Early diagnosis of ischemic stroke is challenging because of the lack of awareness and the relative infrequency of stroke, compared with stroke mimics. The heterogeneity and relative rarity of the causes of ischemic stroke in the young result in uncertainties about diagnostic evaluation and cause-specific management. For these reasons, it is important to formulate and enact strategies to increase awareness and access to resources for young patients with stroke, their caregivers and families, and health care professionals, said the authors.
Retired National Football League (NFL) players may have an increased prevalence of late-life cognitive impairment indicative of diminished cerebral reserve, according to research published in the September issue of the Journal of the International Neuropsychological Society. After examining informant AD8 inventory data for a sample of 513 retired NFL players, the researchers found that 35.1% of the sample had possible cognitive impairment. When the researchers compared neurocognitive profiles in a subsample of this group to those in a clinical sample of patients with a diagnosis of mild cognitive impairment due to Alzheimer’s disease, they found a highly similar profile of impairments. However, said lead author Christopher Randolph, PhD, “there is essentially no evidence to support the existence of any unique clinical disorder such as CTE.” The findings emphasize the need for larger, controlled studies on this issue, he added.
Treatment with 4 g/day of ascorbic acid may not improve neuropathy in subjects with Charcot-Marie-Tooth disease type 1A, according to research published in the August issue of JAMA Neurology. Researchers randomized 110 patients with Charcot-Marie-Tooth disease type 1A to oral ascorbic acid (87 subjects) or matching placebo (23 individuals). Patients’ mean two-year change in Charcot-Marie-Tooth Neuropathy Score (CMTNS) was −0.21 for the ascorbic acid group and −0.92 for the placebo group. The mean two-year change according to natural history is +1.33. Because the results were well below 50% reduction of CMTNS worsening from natural history, the investigators could not declare the study futile. It is unlikely that the results support undertaking a larger trial of 4 g/day of ascorbic acid, said the researchers.
Pilots with occupational exposure to hypobaria may have significantly greater volume and number of white-matter hyperintensity (WMH) lesions, compared with controls, according to data published August 20 in Neurology. Researchers used a 3-T MRI scanner to collect three-dimensional, T2-weighted, high-resolution imaging data for 102 U-2 pilots and 91 controls matched for age, health, and education levels. The investigators compared whole-brain and regional WMH volume and number between groups using a two-tailed Wilcoxon rank sum test. U-2 pilots had an increase in volume (394%) and number (295%) of WMH. Also, WMH were more uniformly distributed throughout the brain in U-2 pilots, compared with a predominantly frontal distribution in controls. Further studies will be necessary to clarify the pathologic mechanisms responsible for the damage, said the researchers.
Nine independent risk factors that can be traced to adolescence, most of which are modifiable, may account for most cases of young-onset dementia in men, according to a study published online ahead of print August 12 in JAMA Internal Medicine. Investigators analyzed data for 488,484 Swedish men from the Swedish Military Service Conscription Register. Multivariate Cox regression analysis indicated that alcohol intoxication, stroke, antipsychotic use, depression, father’s dementia, intoxication with drugs other than alcohol, low cognitive function at conscription, low height at conscription, and high systolic blood pressure at conscription were significant risk factors for young-onset dementia. The population-attributable risk associated with all nine risk factors was 68%. The study results suggest excellent opportunities for early prevention, according to the researchers.
Researchers observed a novel brain phenomenon in humans and animals in a coma and with an isoelectric (ie, “flat”) EEG, according to research published September 18 in PLOS One. The researchers first detected the state in a human in postanoxic coma who had received medication. They replicated the state by applying high doses of isoflurane in cats. All subjects had an EEG activity of quasi-rhythmic sharp waves that the investigators propose to call Nu-complexes. Simultaneous intracellular recordings in vivo in the cortex and hippocampus, especially in the CA3 region, demonstrated that Nu-complexes arise in the hippocampus and are transmitted to the cortex. The creation of a hippocampal Nu-complex depends on another hippocampal activity (ie, ripple activity), which is not overtly detectable at the cortical level.
—Erik Greb
Senior Associate Editor
Drug can prevent CMV in HSCT recipients
A new drug can prevent cytomegalovirus (CMV) in patients undergoing hematopoietic stem cell transplant (HSCT), according to a study published in The New England Journal of Medicine.
The drug, called CMX001, is an oral nucleotide analog lipid-conjugate that blocks replication of double-stranded DNA viruses.
HSCT recipients who took CMX001 after engraftment were less likely to develop CMV than HSCT patients who received placebo, researchers found.
“With current agents, between 3% and 5% of allogeneic transplant patients develop CMV disease within 6 months of transplantation, and a small number of them may die of it,” said investigator Francisco Marty, MD, of the Dana-Farber Cancer Institute in Boston.
“There clearly is a need for better treatments with fewer adverse effects. This clinical trial examined whether the disease can be prevented, rather than waiting for blood tests to show that treatment is needed.”
The phase 2 trial involved 230 HSCT recipients treated at 27 centers across the US. The patients were randomized to receive placebo or CMX001 at doses ranging from 40 mg a week to 200 mg twice a week.
Treatment began after engraftment, at about 2 to 3 weeks post-transplant, and continued for 9 to 11 weeks.
The study’s primary efficacy outcome was a “CMV event,” which was defined as CMV that affects the lung, digestive tract, or other organs, or a detectable amount of CMV in the blood at the end of treatment.
CMV events occurred in 25% (43/171) of patients who received CMX001 and 37% (22/59) of patients who received placebo. However, when CMX001 was given at the optimal dose—100 mg twice a week—only 10% of patients had a CMV event.
“The results show the effectiveness of CMX001 in preventing CMV infections in this group of patients,” Dr Marty said. “Because CMX001 is known to be active against other herpes viruses and against adenoviruses that sometimes affect transplant patients, it may be useful as a preventive or treatment agent for those infections as well.”
Most of the side effects associated with CMX001 were gastrointestinal in nature. Diarrhea was common and often serious in patients who received the drug at 200 mg twice a week.
Patients in this dose group were more likely to experience elevated alanine aminotransferase levels as well. But this was not associated with increases in levels of bilirubin or aspartate aminotransferase.
This research was funded by Chimerix, the company developing CMX001.![]()
Autoantibodies play role in myositis classification, treatment
LAS VEGAS – Autoantibodies and autoantibody subsets can be particularly helpful for classifying and treating patients with myositis, including those with myositis-associated interstitial lung disease, according to Dr. Chester V. Oddis.
Many autoantibody subsets are phenotypically and clinically well defined, and have clinical relevance, said Dr. Oddis, professor of medicine and associate director of the rheumatology fellowship training program at the University of Pittsburgh.
Serological classification isn’t always accurate or routinely available for all clinicians, but this may change in the near future as improved techniques for autoantibody detection become available, he said at Perspectives in Rheumatic Diseases 2013.
Anti-MDA-5 and interstitial lung disease
One autoantibody that has gained attention in recent years is anti-MDA-5, also known as anti-CADM-140, which is often seen in patients with amyopathic dermatomyositis (ADM).
Patients with ADM represent a subset of dermatomyositis patients who have cutaneous manifestations of dermatomyositis for 6 months or longer and have no clinical evidence of proximal muscle weakness but may have mild serum muscle enzyme abnormalities. More extensive muscle testing in these patients generally demonstrates no or minimal abnormalities. However, these patients should not be considered to have simply a benign cutaneous form of disease; in fact, they have a frequency of malignancy similar to that of patients with classic dermatomyositis (14% in one series of nearly 300 patients, compared with 15% in classic dermatomyositis).
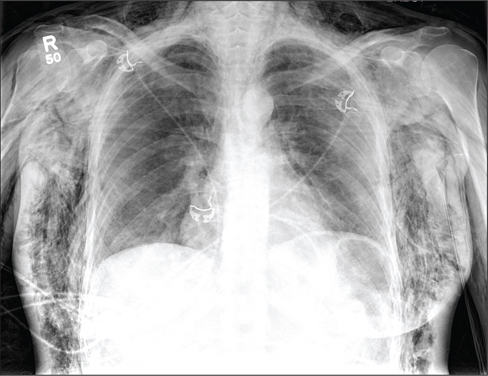
In addition, ADM patients also have a relatively high frequency of lung disease, Dr. Oddis said. In a published review of the literature of nearly 200 patients with ADM, 10% had interstitial lung disease (ILD) – an important point given that the rash of dermatomyositis may be subtle and missed, he noted.
The Asian population seems to be particularly at risk for this complication. Two studies in recent years have demonstrated that Japanese ADM patients with anti-MDA-5 present with rapidly progressive ILD. A 2011 study showed an increased incidence of acute or subacute interstitial pneumonitis in Chinese patients. Other studies have shown similar findings in Korean and other Asian populations, Dr. Oddis noted.
The presence of anti-MDA-5 represents a novel cutaneous phenotype involving palmar papules and cutaneous ulcerations, severe vasculopathy, and rapidly progressive ILD. The target autoantigen in these cases is MDA-5, which is involved in innate immune defense against viruses, he explained, noting that this supports the possibility that a viral trigger plays a role in the disease.
"I think this complication is filtering into the U.S. population, as we have seen it in our myositis cohort," Dr. Oddis said of the anti-MDA-5 association with ADM and severe ILD. He noted that he recently cared for a 70-year-old white male with "double pneumonia" (a finding that "should always raise suspicion of autoimmune ILD") in June of 2012, a rash of dermatomyositis in September of 2012, and vasculitic skin changes in January of 2013. He presented without muscle weakness.
Anti-synthetase syndrome and ILD
Another autoantibody myositis subset involves the anti-synthetases, including PL-7, PL-12, EJ, and Jo-1.
Patients with anti-synthetase syndrome are generally a clinically homogeneous patient population characterized by fever, myositis, arthritis, Raynaud’s phenomenon, mechanic’s hands, and ILD. About 30%-40% of myositis patients have ILD, which is a significant contributor to morbidity and mortality.
Anti-Jo-1 is found in 50%-75% of these patients, and the coexistence of Ro52 may portend worse prognosis, Dr. Oddis said.
There are certain clinical features of ILD in polymyositis and dermatomyositis, including progressive dyspnea with or without nonproductive cough, lack of digital clubbing (unlike in idiopathic pulmonary fibrosis), and lack of pleuritis and pleural effusion in most cases (unlike in systemic lupus erythematosus). However, presentation can be variable, with about one-third of patients developing ILD before muscle or skin manifestations are apparent. Some patients present with acute disease (acute respiratory distress syndrome), and others present with subacute disease that is chronic and slowly progressing or asymptomatic.
It is important to understand when making a diagnosis of autoimmune ILD that not all patients will present with the classic anti-synthetase syndrome, Dr. Oddis said.
In some cases, patients will have an "incomplete" clinical syndrome with ILD alone or ILD with only subtle connective tissue disease findings, myositis-specific autoantibodies in the absence of myositis, and/or a negative antinuclear antibody (ANA) test, he explained.
The initial symptoms in patients may vary depending on the anti-synthetase autoantibody that is present. In a University of Pittsburgh study, for example, Jo-1 was found in 60% of cases; non-Jo-1 synthetase positive cases more often experienced Raynaud’s as their initial symptom, less often experienced muscle and joint problems as their initial symptom, and had a longer delay in diagnosis, compared with Jo-1 patients. Survival was also decreased, compared with Jo-1 patients.
As for ANA, about half of patients tested positive, whereas 72% demonstrated positive anti-cytoplasmic staining on indirect immunofluorescence.
The diagnosis of autoimmune ILD can be missed when there is a failure to recognize "incomplete" clinical syndromes, when there is a failure to order or detect myositis-specific autoantibodies – even in patients without myositis – and when a negative ANA is considered to be reassuring, Dr. Oddis said.
Dr. Oddis has served on an advisory board for Questcor.
The meeting was held by Global Academy for Medical Education. GAME and this news organization are owned by Frontline Medical Communications.
LAS VEGAS – Autoantibodies and autoantibody subsets can be particularly helpful for classifying and treating patients with myositis, including those with myositis-associated interstitial lung disease, according to Dr. Chester V. Oddis.
Many autoantibody subsets are phenotypically and clinically well defined, and have clinical relevance, said Dr. Oddis, professor of medicine and associate director of the rheumatology fellowship training program at the University of Pittsburgh.
Serological classification isn’t always accurate or routinely available for all clinicians, but this may change in the near future as improved techniques for autoantibody detection become available, he said at Perspectives in Rheumatic Diseases 2013.
Anti-MDA-5 and interstitial lung disease
One autoantibody that has gained attention in recent years is anti-MDA-5, also known as anti-CADM-140, which is often seen in patients with amyopathic dermatomyositis (ADM).
Patients with ADM represent a subset of dermatomyositis patients who have cutaneous manifestations of dermatomyositis for 6 months or longer and have no clinical evidence of proximal muscle weakness but may have mild serum muscle enzyme abnormalities. More extensive muscle testing in these patients generally demonstrates no or minimal abnormalities. However, these patients should not be considered to have simply a benign cutaneous form of disease; in fact, they have a frequency of malignancy similar to that of patients with classic dermatomyositis (14% in one series of nearly 300 patients, compared with 15% in classic dermatomyositis).
In addition, ADM patients also have a relatively high frequency of lung disease, Dr. Oddis said. In a published review of the literature of nearly 200 patients with ADM, 10% had interstitial lung disease (ILD) – an important point given that the rash of dermatomyositis may be subtle and missed, he noted.
The Asian population seems to be particularly at risk for this complication. Two studies in recent years have demonstrated that Japanese ADM patients with anti-MDA-5 present with rapidly progressive ILD. A 2011 study showed an increased incidence of acute or subacute interstitial pneumonitis in Chinese patients. Other studies have shown similar findings in Korean and other Asian populations, Dr. Oddis noted.
The presence of anti-MDA-5 represents a novel cutaneous phenotype involving palmar papules and cutaneous ulcerations, severe vasculopathy, and rapidly progressive ILD. The target autoantigen in these cases is MDA-5, which is involved in innate immune defense against viruses, he explained, noting that this supports the possibility that a viral trigger plays a role in the disease.
"I think this complication is filtering into the U.S. population, as we have seen it in our myositis cohort," Dr. Oddis said of the anti-MDA-5 association with ADM and severe ILD. He noted that he recently cared for a 70-year-old white male with "double pneumonia" (a finding that "should always raise suspicion of autoimmune ILD") in June of 2012, a rash of dermatomyositis in September of 2012, and vasculitic skin changes in January of 2013. He presented without muscle weakness.
Anti-synthetase syndrome and ILD
Another autoantibody myositis subset involves the anti-synthetases, including PL-7, PL-12, EJ, and Jo-1.
Patients with anti-synthetase syndrome are generally a clinically homogeneous patient population characterized by fever, myositis, arthritis, Raynaud’s phenomenon, mechanic’s hands, and ILD. About 30%-40% of myositis patients have ILD, which is a significant contributor to morbidity and mortality.
Anti-Jo-1 is found in 50%-75% of these patients, and the coexistence of Ro52 may portend worse prognosis, Dr. Oddis said.
There are certain clinical features of ILD in polymyositis and dermatomyositis, including progressive dyspnea with or without nonproductive cough, lack of digital clubbing (unlike in idiopathic pulmonary fibrosis), and lack of pleuritis and pleural effusion in most cases (unlike in systemic lupus erythematosus). However, presentation can be variable, with about one-third of patients developing ILD before muscle or skin manifestations are apparent. Some patients present with acute disease (acute respiratory distress syndrome), and others present with subacute disease that is chronic and slowly progressing or asymptomatic.
It is important to understand when making a diagnosis of autoimmune ILD that not all patients will present with the classic anti-synthetase syndrome, Dr. Oddis said.
In some cases, patients will have an "incomplete" clinical syndrome with ILD alone or ILD with only subtle connective tissue disease findings, myositis-specific autoantibodies in the absence of myositis, and/or a negative antinuclear antibody (ANA) test, he explained.
The initial symptoms in patients may vary depending on the anti-synthetase autoantibody that is present. In a University of Pittsburgh study, for example, Jo-1 was found in 60% of cases; non-Jo-1 synthetase positive cases more often experienced Raynaud’s as their initial symptom, less often experienced muscle and joint problems as their initial symptom, and had a longer delay in diagnosis, compared with Jo-1 patients. Survival was also decreased, compared with Jo-1 patients.
As for ANA, about half of patients tested positive, whereas 72% demonstrated positive anti-cytoplasmic staining on indirect immunofluorescence.
The diagnosis of autoimmune ILD can be missed when there is a failure to recognize "incomplete" clinical syndromes, when there is a failure to order or detect myositis-specific autoantibodies – even in patients without myositis – and when a negative ANA is considered to be reassuring, Dr. Oddis said.
Dr. Oddis has served on an advisory board for Questcor.
The meeting was held by Global Academy for Medical Education. GAME and this news organization are owned by Frontline Medical Communications.
AT PERSPECTIVES IN RHEUMATIC DISEASES 2013

Doctoring in the information age
Many of my patients come in having already looked up their symptoms. Frequently, this admission is accompanied by a mumbled apology, an acknowledgment that doctors "hate that."
I do not disapprove of patients looking up their symptoms at all. I find that their online forays only enrich the discussion because they are prepared for the meeting and have excellent questions. I appreciate their curiosity; it serves the pedant in me well. Not only do I get to explain what is not clear, I also get to correct misinformation.
It also indicates a sense of ownership, participation rather than passivity. The patients are engaged in coming up with a treatment plan, and hopefully this translates into compliance. Patients have asked about dietary modifications for their gout, pool exercises for their osteoarthritis, or the wisdom of biologic treatments in light of their past breast cancer. I think it provides patients with a sense of some degree, however small, of control over their disease and its treatment.
But not all information is created equal, and I think some information may be more fraught for a nonmedical consumer.
At the moment, there are some electronic health record (EHR) software programs that give patients access to some lab results. This can be quite handy; for example, I’ve been saved the trouble of interrupting a patient visit to track down lab results because the patient could access the results using his smartphone.
But it can be pernicious, too. The fine art of medicine does not always lend itself to discrete labeling. Think of all the slightly elevated creatine kinases, erythrocyte sedimentation rates, and antinuclear antibodies that you encounter daily, as well as the training that you went through to understand what to do with these mildly abnormal labs. For all our focus on evidence-based medicine, there is a great deal of nuance to what we do, and nominal "normal" vs "abnormal" results can be misleading at best and anxiety-provoking at worst.
In addition, we may someday be required to allow patients to see office notes. Already I’ve received a handful of angry phone calls from patients because they got a copy of my note. One patient was mad because he thought I called him anorexic (he calmed down when I explained what anorexia meant). Another patient was angry because I used obesity as a diagnosis (she, on the other hand, did not calm down at all). I had a patient come in for her follow-up visit with a copy of my first note, which she had very heavily annotated with details that were irrelevant in a medical context, demanding that I modify my first note.
You may have heard of the study published last October in the Annals of Internal Medicine (2012;157:461-70), in which 105 doctors in three different health care systems allowed more than 13,000 patients to read their notes for a year. Overall, the results were not bad. Doctors felt that it improved transparency and shared decision making, and patients agreed that it fostered trust.
But a minority of patients did report feeling anxious or offended. One out of three felt that they ought to be able to approve the note. And doctors reported having to modify their note – not discussing alternative diagnoses, for example, or not being as candid about obesity. Which belies the idea that the system "improved transparency," no?
I have an old mentor who used to say that in order for consent to be truly informed, the patient should have also gone to medical school. If we are being frank, we ought to admit that there are limits to what a patient can understand, and full disclosure may not be always be appropriate.
Dr. Chan practices rheumatology in Pawtucket, R.I.

A nondrug approach to dementia
› Attempt nonpharmacologic treatment for dementia behavioral problems before moving on to medications, which are of questionable efficacy for symptoms other than aggression and psychosis. A
› Obtain informed consent from patients and/or their caregivers if you plan to use antipsychotic medications because their use increases morbidity and mortality in the elderly. A
Strength of recommendation (SOR)
A Good-quality patient-oriented evidence
B Inconsistent or limited-quality patient-oriented evidence
C Consensus, usual practice, opinion, disease-oriented evidence, case series
CASE Ms. M, 86 years old, lives with her daughter, son-in-law, and granddaughter. For several years she has been forgetful, but she has never had a formal work-up for dementia. Her daughter finally brings her to their primary care physician because she was refusing to take showers, was increasingly irritable, and had tried to hit her daughter’s husband.
In the office, however, Ms. M is calm and pleasant. The family says that most nights Ms. M gets up and wanders around the house. She denies feeling depressed or anxious, but her Folstein Mini-Mental State Exam score is 22/30, indicating moderate dementia. (For more on assessment, see “Tools for assessing patients with dementia—and their caregivers” on page 552.)
The physician offers a trial of risperidone 0.25 mg at bedtime to assist with sleep and behavior.
Was this prescription a wise decision? What other questions should this physician have asked?
Understanding the behavioral symptoms
Noncognitive symptoms of dementia, sometimes referred to as behavioral and psychological symptoms, are common, affecting almost 90% of patients with dementia,1-3 which itself can be classified as early, intermediate, and late.
In early dementia, sociability is usually not affected, but patients may repeat questions, misplace items, use poor judgment, and begin to have difficulty with more complex daily tasks like finances and driving.
In intermediate dementia, basic activities of daily living become impaired and normal social and environmental cues may not register.
In late dementia, patients become entirely dependent on others; they may lose the ability to speak, walk, and eventually, eat. Long- and short-term memory is lost.
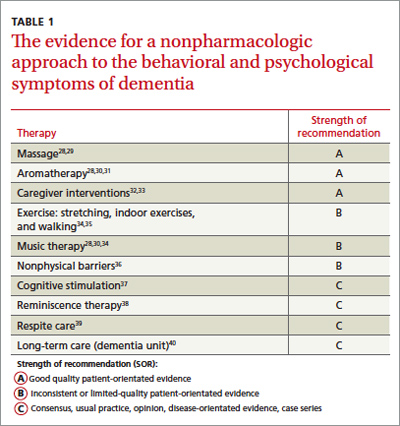
Behavioral symptoms most often occur when the condition enters the intermediate phase, but they may occur at any time during the course of the disease.4 Behaviors may include refusal of care, yelling, aggressive behavior, agitation, restlessness, reversal of the normal sleep-wake cycle, wandering, hoarding, sexual disinhibition, culturally inappropriate behaviors, hallucinations, delusions, anxiety, depression, apathy, and psychosis.2,5
Behavioral disturbances often overwhelm families, and lack of treatment increases patient morbidity, may result in physical harm, and almost always precipitates institutionalization.2 Dementia-related behavioral disturbances also increase the risk of caregiver burnout and depression.2
These symptoms are difficult to treat with medications or nonpharmacologic therapy and strong evidence for most therapies is lacking. Physicians have historically prescribed either typical or atypical antipsychotics in an attempt to control these behaviors. In fact, medication is often still considered first-line therapy.6,7
CASE Ms. M’s daughter calls the clinic 2 weeks after the initial visit to tell the physician that her mother has been sleeping much better, but had a fall and was admitted to the hospital for a hip fracture. That’s not surprising; typical and atypical antipsychotics increase the risk of falls in the elderly.8
The risks associated with the use of antipsychotics
In 2005, the US Food and Drug Administration (FDA) issued a black box warning for atypical antipsychotics because they were found to increase mortality in the elderly. The increased mortality is due to cardiac events or infection.9,10 In 2008, the FDA warning was added to typical antipsychotics, as well.11,12 Both typical and atypical antipsychotics have been found to increase the risk of falls and strokes in the elderly,8,13 and their efficacy in treating the behavioral and psychological symptoms of dementia has recently been questioned.13-16
Trazodone and medications approved for the specific treatment of cognitive decline, such as donepezil or memantine, are also prescribed for behavioral disturbances, but evidence to support their efficacy is limited.14,17-20 More recently, a meta-analysis of selective serotonin reuptake inhibitors (SSRIs) suggests that they may be effective for treating agitation associated with dementia.21 However, SSRIs may also contribute to falls and to hyponatremia in the elderly.22,23
Pharmacologic Tx is not your only option
Considering the questionable safety and efficacy of pharmacologic treatment, physicians should consider nondrug therapies first, or at least concurrently with medication.2,15,16,24
But before you get started, be sure to look for and treat medical conditions that cause or contribute to behavioral disturbances, including infection, pain, and adverse effects of medication.6,7,25 Similarly, it is essential that unmet needs, such as hunger, thirst, or desire for attention or socialization, be addressed.6,7,26 Also, discuss disturbing environmental factors, including loud noises, poorly lit quarters, and strong smells, with patients and their caregivers.5-7 In complex situations, you may need to seek assistance from a geriatrician, neurologist, geropsychiatrist, or psychologist, although their availability may be limited.6
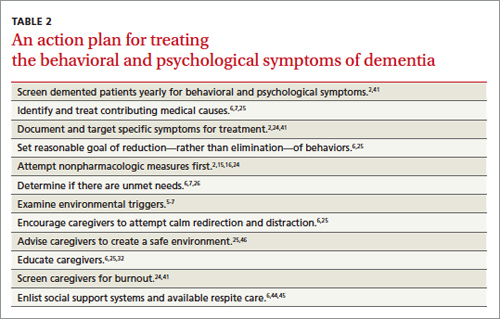
CASE Ms. M becomes markedly delirious while in the hospital after hip surgery, and a geriatrics consultation is requested. This is not surprising, given that underlying dementia increases a patient’s risk of delirium in the hospital.27 The geriatrician recommends several measures to reduce the likelihood of delirium—providing good pain control, minimizing night time wake-ups, minimizing Foley catheter use, Hep-locking the IV to encourage mobility, and having staff reorient her frequently by referring to a large print clock and calendar on the wall.
Specific interventions
Most specific nonpharmacologic therapies have not been robustly studied in randomized controlled trials. But a series of smaller studies have been evaluated in systematic reviews. The level of evidence for each intervention is summarized in TABLE 1.28-40
As you review the options that follow, keep 2 things in mind: (1) It is important to set realistic expectations when considering these approaches (as well as pharmacologic ones). Reducing the frequency or severity of problematic behaviors may be more reasonable than their total elimination.6,25 (2) Consider targeting specific symptoms when treating behavioral Behavioral symptoms most often occur when dementia enters the intermediate phase, but they may occur at any time during the course of the disease. disturbances.2,24,41 Such targeting allows physicians and families to better evaluate the effectiveness of interventions because it helps to focus the discussion of the patient’s progress at follow-up visits.
Massage/touch therapy. A 2006 Cochrane review concluded that improvement in nutritional intake and hand massage, when combined with positive encouragement during a meal, may produce a short-term positive effect on agitation.29 Similarly, a meta-analysis of randomized controlled and randomized crossover studies found a statistically significant improvement in agitation with hand massage, although this finding was based on the same single study referenced in the 2006 review.30 Opinions differ among 5 high-quality guidelines included in the systematic review by Azermai et al regarding the value of massage, with 2 of the 5 practice guidelines recommending its use.28
Aromatherapy. Several trials suggest that aroma therapy may reduce agitated behaviors. Lemon balm and lavender oils have been the most commonly studied agents. Two systematic reviews cite the same 2002 randomized controlled trial, which found a reduction in behavioral problems in people who received arm massage with lemon balm compared with those who received arm massage with an odorless cream.30,31 A systematic review by Holt et al also cites a study that found lavender oil placed in a sachet on each side of the pillow for at least one hour during sleep seemed to reduce problem behaviors.31 Several evidence-based guidelines have concluded that aromatherapy may be helpful, and 2 of the 5 practice guidelines reviewed by Azermai et al recommend it.28
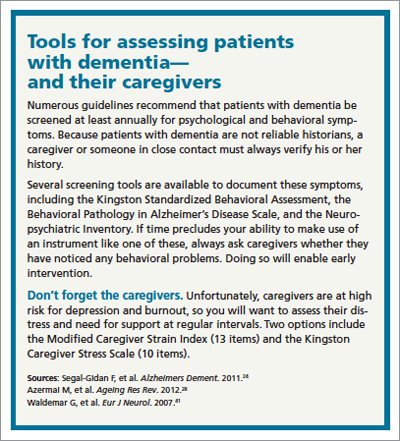
Exercise has been shown to benefit patients of all ages, even those with terminal diseases.42 Some studies have indicated a positive effect of physical activities on behaviors ranging from wandering to aggression and agitation. Activities have included group gentle stretches, indoor exercises, and a volunteer-led walking program that encouraged hand holding and singing.34 However, a 2008 Cochrane review concluded that the effect of exercise on behavioral disturbances in dementia has not been adequately studied.35
Music therapy. Numerous types of music therapy have been studied, including listening to music picked out by a patient’s family based on known patient preference, classical music, pleasant sounds such as ocean waves, and even stories and comforting prayer recorded by family members. While most of these smaller studies yielded positive results,34 a 2003 Cochrane review concluded there is not enough evidence to recommend for or against music therapy.43 A more recent meta-analysis suggests that music may be effective for agitation.30 A systematic review of quality guidelines also indicates that most of these guidelines rate the evidence as moderate to high in favor of music and 3 of 5 practice guidelines recommend it.28
Nonphysical barriers have long been used as a creative nonrestraining method of preventing wandering. They include such tricks as camouflaging exits by painting them to look like bookcases, painting a black square in front of an elevator to make it look like a hole, and placing a thin Velcro strip across doorways. Although it would appear from a limited number of small studies and anecdotal evidence that nonphysical barriers work, a Cochrane review concluded that they have not been studied enough to perform a meta-analysis.36
Cognitive stimulation typically consists of activities such as reviewing current events, promoting sensory awareness, drawing, associating words, discussion of hobbies, and planning daily activities. This type of therapy has been shown to improve cognition in patients with dementia, as well as well-being and quality of life. It does not improve behavioral problems, per se.37
Reminiscence therapy is a popular modality that involves stimulating memories of the past by looking at personal photos and newspaper clippings and discussing the past. It is well received by patients and caregivers. It has been shown to improve mood in elderly patients without dementia, but studies of reminiscence therapy have been too dissimilar to draw conclusions regarding its effect on behavioral disturbances in patients with dementia.38
Other therapies that are common in dementia care, such as respite care and specialized dementia units, have simply not been studied well enough to provide any conclusions as to their effectiveness.39,40
CASE When Ms. M is discharged from the hospital, her family enrolls her in an adult day care program, where Ms. M will be able to participate in social activities, exercise, and communal meals. Her daughter asks the family physician what other steps they can take in the home to make things easier on her mother. And as an aside, the daughter admits that while she is glad that she and her family can “be there” for her mother, there have been times when she has simply not felt up to the task.
Help family members care for the patient—and themselves
A recent meta-analysis suggests that caregiver interventions have a positive effect on behavioral problems in patients with dementia.32 Successful programs are tailored to the individual needs of the patient and caregiver and delivered over multiple sessions. Unfortunately, the aforementioned meta-analysis did not provide evidenced-based interventions for specific problems.32 With this in mind, the following are some practical caregiver “do’s and don’ts” that are based on reviews and consensus guidelines.
Don’t take it personally. It is extremely important to help caregivers understand that the disturbing behaviors of patients with dementia lack intentionality and are part of the normal progression of the disorder.25 Caregivers also need to appreciate that hallucinations are normal in these patients and do not require medications if they don’t disturb the patient or place the patient or anyone else at risk.
Don’t try to reason with the patient; redirect him or her instead. Clinicians should offer caregivers suggestions for reassuring, redirecting, or distracting agitated patients rather than trying to reason with them. Encourage caregivers to develop and maintain routines and consistency.6,25 Using a calm, low tone of voice, giving very simple instructions, and leaving and then reattempting care that is refused the first time may also be effective.5 Some experts have suggested techniques such as giving positive rewards for desired behaviors and not rewarding negative behaviors.6,26
Do create a safe environment. Recommend that caregivers create a safe environment. Make sure that they lock up all guns. Also, encourage them to use locks, alarms, or ID bracelets when patients are prone to wandering.25
Do consider a caregiver support program. Caregivers can make a big difference in the lives of patients with dementia, Help caregivers understand that the disturbing behaviors of patients with dementia lack intentionality and are part of the normal progression of the disorder. but only if they have support, as well.
A recent meta-analysis concluded that active involvement of caregivers in making choices about treatments distinguishes effective from ineffective support programs, decreases the odds of institutionalization, and may lengthen time to institutionalization.33 To ease caregiver strain and depression, encourage them to make use of resources such as nursing home respite care and community agencies that include the Alzheimer’s Association (http://www.alz.org).6,44,45
CASE Ms. M’s daughter joins a local support group for families of patients with dementia, where she learns redirection techniques to try when her mother refuses care. The exercise and daytime social stimulation that Ms. M receives through the adult day care program helps her to sleep at night. When Ms. M refuses to take a shower—a challenge the family had before her hospitalization—the daughter does not argue with her. Instead, she returns 10 to 20 minutes later and asks again, or tries a bedside sponge bath with a lavender soap that Ms. M seems to like.
Ms. M’s nighttime wandering is markedly reduced and the family no longer uses any antipsychotic medications. The family physician counsels them, however, about the progressive nature of the disease and encourages them to set up periodic follow-up visits, so that he can see how everyone—patient and caregivers alike—are doing.
Welcoming the reprieves, recognizing the realities
The behavioral and psychological symptoms of dementia are the most challenging aspect of dementia care. Unacceptable behaviors sometimes persist even when aggressively addressing modifiable factors and attempting behavioral interventions (TABLE 2).2,5-7,15,16,24-26,32,41,44-46 Patients with behavioral disturbances frequently require a pharmacologic agent or transfer to a different care setting.
But clinicians need to use psychotropic medications with informed patient and/or caregiver consent.7 On a case-by-case basis, a trial of antipsychotics is often justified, despite the black box warning. A family may choose to try an antipsychotic despite the risk to help manage the patient at home in the hope of delaying or preventing institutionalization.
However, even with good home support, in conjunction with nonpharmacologic and/or pharmacologic therapies, most patients with dementia will eventually require institutionalization.47 Because patients and families often rely on family physicians to guide them through these difficult challenges and decisions, you’ll need to remain well versed on the available On a case-by- case basis, a trial of antipsychotics is often justified, despite the black box warning. treatments for the psychological and behavioral symptoms of dementia, as well as the resources available in your community.
CORRESPONDENCE
Jaqueline Raetz, MD, 331 NE Thornton Place, Seattle, WA 98125; [email protected]
1. Mega MS, Cummings JL, Fiorello T, et al. The spectrum of behavioral changes in Alzheimer’s disease. Neurology. 1996;46:130-135.
2. Feil DG, MacLean C, Sultzer D. Quality indicators for the care of dementia in vulnerable elders. J Am Geriatr Soc. 2007;55(suppl 2):S293-S301.
3. Hort J, O’Brien JT, Gainotti G, et al. EFNS guidelines for the diagnosis and management of Alzheimer’s disease. Eur J Neurol. 2010;17:1236-1248.
4. Lyketsos CG, Lopez O, Jones B, et al. Prevalence of neuropsychiatric symptoms in dementia and mild cognitive impairment: results from the cardiovascular health study. JAMA. 2002;288:1475-1483.
5. Omelan C. Approach to managing behavioural disturbances in dementia. Can Fam Physician. 2006;52:191-199.
6. Sadowsky CH, Galvin JE. Guidelines for the management of cognitive and behavioral problems in dementia. J Am Board Fam Med. 2012;25:350-366.
7. Salzman C, Jeste DV, Meyer RE, et al. Elderly patients with dementia-related symptoms of severe agitation and aggression: consensus statement on treatment options, clinical trials methodology, and policy. J Clin Psychiatry. 2008;69:889-898.
8. Hill KD, Wee R. Psychotropic drug-induced falls in older people: a review of interventions aimed at reducing the problem. Drugs Aging. 2012;29:15-30.
9. US Food and Drug Administration. Public health advisory: deaths with antipsychotics in elderly patients with behavioral disturbances. April 11, 2005. Available at: http://www.fda.gov/Drugs/DrugSafety/PostmarketDrugSafetyInformationforPatientsandProviders/DrugSafetyInformationforHeathcareProfessionals/PublicHealthAdvisories/ucm053171.htm. Accessed September 16, 2013.
10. Schneider LS, Dagerman KS, Insel P. Risk of death with atypical antipsychotic drug treatment for dementia: meta-analysis of randomized placebo-controlled trials. JAMA. 2005;294:1934-1943.
11. US Food and Drug Administration. Antipsychotics, conventional and atypical. June 16, 2008. Available at: http://www.fda.gov/Safety/MedWatch/SafetyInformation/SafetyAlertsforHumanMedicalProducts/ucm110212.htm. Accessed September 16, 2013.
12. Wang PS, Schneeweiss S, Avorn J, et al. Risk of death in elderly users of conventional vs. atypical antipsychotic medications. N Engl J Med. 2005;353:2335-2341.
13. Ballard C, Waite J. The effectiveness of atypical antipsychotics for the treatment of aggression and psychosis in Alzheimer’s disease. Cochrane Database Syst Rev. 2006;(1):CD003476.
14. Sink KM, Holden KF, Yaffe K. Pharmacological treatment of neuropsychiatric symptoms of dementia: a review of the evidence. JAMA. 2005;293:596-608.
15. Lonergan E, Luxenberg J, Colford JM. Haloperidol for agitation in dementia. Cochrane Database Syst Rev. 2002;(2):CD002852.
16. Schneider LS, Tariot PN, Dagerman KS, et al; CATIE-AD Study Group. Effectiveness of atypical antipsychotic drugs in patients with Alzheimer’s disease. N Engl J Med. 2006;355:1525-1538.
17. Martinón-Torres G, Fioravanti M, Grimley EJ. Trazodone for agitation in dementia. Cochrane Database Syst Rev. 2004;(4):CD004990.
18. Birks J, Harvey RJ. Donepezil for dementia due to Alzheimer’s disease. Cochrane Database Syst Rev. 2006;(1):CD001190.
19. McShane R, Areosa Sastre A, Minakaran N. Memantine for dementia. Cochrane Database Syst Rev. 2006;(2):CD003154.
20. Raina P, Santaguida P, Ismaila A, et al. Effectiveness of cholinesterase inhibitors and memantine for treating dementia: evidence review for a clinical practice guideline. Ann Intern Med. 2008;148:379-397.
21. Seitz DP, Adunuri N, Gill SS, et al. Antidepressants for agitation and psychosis in dementia. Cochrane Database Syst Rev. 2011;(2): CD008191.
22. Sterke CS, Ziere G, van Beeck EF, et al. Dose-response relationship between selective serotonin re-uptake inhibitors and injurious falls: a study in nursing home residents with dementia. Br J Clin Pharmacol. 2012;73:812-820.
23. Jacob S, Spinler SA. Hyponatremia associated with selective serotonin-reuptake inhibitors in older adults. Ann Pharmacother. 2006;40:1618-1622.
24. Segal-Gidan F, Cherry D, Jones R, et al. Alzheimer’s disease management guideline: update 2008. Alzheimers Dement. 2011;7:e51-e59.
25. Rayner A, O’Brien J, Shoenbachler B. Behavior disorders of dementia: recognition and treatment. Am Fam Physician. 2006;73:647-652.
26. Ayalon L, Gum AM, Feliciano L, et al. Effectiveness of nonpharmacological interventions for the management of neuropsychiatric symptoms in patients with dementia: a systematic review. Arch Intern Med. 2006;166:2182-2188.
27. Elie M, Cole MG, Primeau FJ, et al. Delirium risk factors in elderly hospitalized patients. J Gen Intern Med. 1998;13:204-212.
28. Azermai M, Petrovic M, Elseviers MM, et al. Systematic appraisal of dementia guidelines for the management of behavioural and psychological symptoms. Aging Res Rev. 2012;11:78-86.
29. Viggo Hansen N, Jørgensen T, Ørtenblad L. Massage and touch for dementia. Cochrane Database Syst Rev. 2006;(4):CD004989.
30. Kong EH, Evans LK, Guevara JP. Nonpharmacological intervention for agitation in dementia: a systematic review and meta-analysis. Aging Ment Health. 2009;13:512-520.
31. Thorgrimsen LM, Spector A, Wiles A, et al. Aroma therapy for dementia. Cochrane Database Syst Rev. 2003;(3):CD003150.
32. Brodaty H, Arasaratnam C. Review of meta-analysis of nonpharmacological interventions for neuropsychiatric symptoms of dementia. Am J Psychiatry 2012;169:946-953.
33. Spijker A, Vernooij-Dassen M, Vasse E, et al. Effectiveness of nonpharmacological interventions in delaying the institutionalization of patients with dementia: A meta-analysis. J Am Geriatr Soc. 2008;56:1116-1128.
34. Opie J, Rosewarne R, O’Connor DW. The efficacy of psychosocial approaches to behaviour disorders in dementia: a systematic literature review. Aust N Z J Psychiatry. 1999;33:789-799.
35. Forbes D, Forbes S, Morgan DG, et al. Physical activity programs for persons with dementia. Cochrane Database Syst Rev. 2008;(3):CD006489.
36. Price JD, Hermans DG, Grimley Evans J. Subjective barriers to prevent wandering of cognitively impaired people. Cochrane Database Syst Rev. 2000;(4):CD001932.
37. Woods B, Aguirre E, Spector AE, et al. Cognitive stimulation to improve cognitive functioning in people with dementia. Cochrane Database Syst Rev. 2012;(2):CD005562.
38. Woods B, Spector A, Jones C, et al. Reminiscence therapy for dementia. Cochrane Database Syst Rev. 2005;(2):CD001120.
39. Lee H, Cameron M. Respite care for people with dementia and their carers. Cochrane Database Syst Rev. 2004;(2):CD004396.
40. Lai CK, Yeung JH, Mok V, et al. Special care units for dementia individuals with behavioural problems. Cochrane Database Syst Rev. 2009;(4):CD006470.
41. Waldemar G, Dubois B, Emre M, et al. Recommendations for the diagnosis and management of Alzheimer’s disease and other disorders associated with dementia: EFNS guideline. Eur J Neurol. 2007;14:e1-e26.
42. Oldervoll LM, Loge JH, Paltiel H, et al. The effect of a physical exercise program in palliative care: a phase II study. J Pain Symptom Manage. 2006;31:421-430.
43. Vink AC, Birks JS, Bruinsma MS, et al. Music therapy for people with dementia. Cochrane Database Syst Rev. 2004;(3):CD003477.
44. Gitlin LN, Kales HC, Lyketsos CG. Nonpharmacologic management of behavioral symptoms in dementia. JAMA. 2012;308:2020-2029.
45. Bass DM, Clark PA, Looman WJ, et al. The Cleveland Alzheimer’s managed care demonstration: outcomes after 12 months of implementation. Gerontologist. 2003;43:73-85.
46. Gitlin LN, Winter L, Dennis MP, et al.. A biobehavioral home-based intervention and the well-being of patients with dementia and their caregivers: the COPE randomized trial. JAMA. 2010;304:983-991.
47. Smith GE, Kokmen E, O’Brien PC. Risk factors for nursing home placement in a population-based dementia cohort. J Am Geriatr Soc. 2000;48:519-525.
› Attempt nonpharmacologic treatment for dementia behavioral problems before moving on to medications, which are of questionable efficacy for symptoms other than aggression and psychosis. A
› Obtain informed consent from patients and/or their caregivers if you plan to use antipsychotic medications because their use increases morbidity and mortality in the elderly. A
Strength of recommendation (SOR)
A Good-quality patient-oriented evidence
B Inconsistent or limited-quality patient-oriented evidence
C Consensus, usual practice, opinion, disease-oriented evidence, case series
CASE Ms. M, 86 years old, lives with her daughter, son-in-law, and granddaughter. For several years she has been forgetful, but she has never had a formal work-up for dementia. Her daughter finally brings her to their primary care physician because she was refusing to take showers, was increasingly irritable, and had tried to hit her daughter’s husband.
In the office, however, Ms. M is calm and pleasant. The family says that most nights Ms. M gets up and wanders around the house. She denies feeling depressed or anxious, but her Folstein Mini-Mental State Exam score is 22/30, indicating moderate dementia. (For more on assessment, see “Tools for assessing patients with dementia—and their caregivers” on page 552.)
The physician offers a trial of risperidone 0.25 mg at bedtime to assist with sleep and behavior.
Was this prescription a wise decision? What other questions should this physician have asked?
Understanding the behavioral symptoms
Noncognitive symptoms of dementia, sometimes referred to as behavioral and psychological symptoms, are common, affecting almost 90% of patients with dementia,1-3 which itself can be classified as early, intermediate, and late.
In early dementia, sociability is usually not affected, but patients may repeat questions, misplace items, use poor judgment, and begin to have difficulty with more complex daily tasks like finances and driving.
In intermediate dementia, basic activities of daily living become impaired and normal social and environmental cues may not register.
In late dementia, patients become entirely dependent on others; they may lose the ability to speak, walk, and eventually, eat. Long- and short-term memory is lost.
Behavioral symptoms most often occur when the condition enters the intermediate phase, but they may occur at any time during the course of the disease.4 Behaviors may include refusal of care, yelling, aggressive behavior, agitation, restlessness, reversal of the normal sleep-wake cycle, wandering, hoarding, sexual disinhibition, culturally inappropriate behaviors, hallucinations, delusions, anxiety, depression, apathy, and psychosis.2,5
Behavioral disturbances often overwhelm families, and lack of treatment increases patient morbidity, may result in physical harm, and almost always precipitates institutionalization.2 Dementia-related behavioral disturbances also increase the risk of caregiver burnout and depression.2
These symptoms are difficult to treat with medications or nonpharmacologic therapy and strong evidence for most therapies is lacking. Physicians have historically prescribed either typical or atypical antipsychotics in an attempt to control these behaviors. In fact, medication is often still considered first-line therapy.6,7
CASE Ms. M’s daughter calls the clinic 2 weeks after the initial visit to tell the physician that her mother has been sleeping much better, but had a fall and was admitted to the hospital for a hip fracture. That’s not surprising; typical and atypical antipsychotics increase the risk of falls in the elderly.8
The risks associated with the use of antipsychotics
In 2005, the US Food and Drug Administration (FDA) issued a black box warning for atypical antipsychotics because they were found to increase mortality in the elderly. The increased mortality is due to cardiac events or infection.9,10 In 2008, the FDA warning was added to typical antipsychotics, as well.11,12 Both typical and atypical antipsychotics have been found to increase the risk of falls and strokes in the elderly,8,13 and their efficacy in treating the behavioral and psychological symptoms of dementia has recently been questioned.13-16
Trazodone and medications approved for the specific treatment of cognitive decline, such as donepezil or memantine, are also prescribed for behavioral disturbances, but evidence to support their efficacy is limited.14,17-20 More recently, a meta-analysis of selective serotonin reuptake inhibitors (SSRIs) suggests that they may be effective for treating agitation associated with dementia.21 However, SSRIs may also contribute to falls and to hyponatremia in the elderly.22,23
Pharmacologic Tx is not your only option
Considering the questionable safety and efficacy of pharmacologic treatment, physicians should consider nondrug therapies first, or at least concurrently with medication.2,15,16,24
But before you get started, be sure to look for and treat medical conditions that cause or contribute to behavioral disturbances, including infection, pain, and adverse effects of medication.6,7,25 Similarly, it is essential that unmet needs, such as hunger, thirst, or desire for attention or socialization, be addressed.6,7,26 Also, discuss disturbing environmental factors, including loud noises, poorly lit quarters, and strong smells, with patients and their caregivers.5-7 In complex situations, you may need to seek assistance from a geriatrician, neurologist, geropsychiatrist, or psychologist, although their availability may be limited.6
CASE Ms. M becomes markedly delirious while in the hospital after hip surgery, and a geriatrics consultation is requested. This is not surprising, given that underlying dementia increases a patient’s risk of delirium in the hospital.27 The geriatrician recommends several measures to reduce the likelihood of delirium—providing good pain control, minimizing night time wake-ups, minimizing Foley catheter use, Hep-locking the IV to encourage mobility, and having staff reorient her frequently by referring to a large print clock and calendar on the wall.
Specific interventions
Most specific nonpharmacologic therapies have not been robustly studied in randomized controlled trials. But a series of smaller studies have been evaluated in systematic reviews. The level of evidence for each intervention is summarized in TABLE 1.28-40
As you review the options that follow, keep 2 things in mind: (1) It is important to set realistic expectations when considering these approaches (as well as pharmacologic ones). Reducing the frequency or severity of problematic behaviors may be more reasonable than their total elimination.6,25 (2) Consider targeting specific symptoms when treating behavioral Behavioral symptoms most often occur when dementia enters the intermediate phase, but they may occur at any time during the course of the disease. disturbances.2,24,41 Such targeting allows physicians and families to better evaluate the effectiveness of interventions because it helps to focus the discussion of the patient’s progress at follow-up visits.
Massage/touch therapy. A 2006 Cochrane review concluded that improvement in nutritional intake and hand massage, when combined with positive encouragement during a meal, may produce a short-term positive effect on agitation.29 Similarly, a meta-analysis of randomized controlled and randomized crossover studies found a statistically significant improvement in agitation with hand massage, although this finding was based on the same single study referenced in the 2006 review.30 Opinions differ among 5 high-quality guidelines included in the systematic review by Azermai et al regarding the value of massage, with 2 of the 5 practice guidelines recommending its use.28
Aromatherapy. Several trials suggest that aroma therapy may reduce agitated behaviors. Lemon balm and lavender oils have been the most commonly studied agents. Two systematic reviews cite the same 2002 randomized controlled trial, which found a reduction in behavioral problems in people who received arm massage with lemon balm compared with those who received arm massage with an odorless cream.30,31 A systematic review by Holt et al also cites a study that found lavender oil placed in a sachet on each side of the pillow for at least one hour during sleep seemed to reduce problem behaviors.31 Several evidence-based guidelines have concluded that aromatherapy may be helpful, and 2 of the 5 practice guidelines reviewed by Azermai et al recommend it.28
Exercise has been shown to benefit patients of all ages, even those with terminal diseases.42 Some studies have indicated a positive effect of physical activities on behaviors ranging from wandering to aggression and agitation. Activities have included group gentle stretches, indoor exercises, and a volunteer-led walking program that encouraged hand holding and singing.34 However, a 2008 Cochrane review concluded that the effect of exercise on behavioral disturbances in dementia has not been adequately studied.35
Music therapy. Numerous types of music therapy have been studied, including listening to music picked out by a patient’s family based on known patient preference, classical music, pleasant sounds such as ocean waves, and even stories and comforting prayer recorded by family members. While most of these smaller studies yielded positive results,34 a 2003 Cochrane review concluded there is not enough evidence to recommend for or against music therapy.43 A more recent meta-analysis suggests that music may be effective for agitation.30 A systematic review of quality guidelines also indicates that most of these guidelines rate the evidence as moderate to high in favor of music and 3 of 5 practice guidelines recommend it.28
Nonphysical barriers have long been used as a creative nonrestraining method of preventing wandering. They include such tricks as camouflaging exits by painting them to look like bookcases, painting a black square in front of an elevator to make it look like a hole, and placing a thin Velcro strip across doorways. Although it would appear from a limited number of small studies and anecdotal evidence that nonphysical barriers work, a Cochrane review concluded that they have not been studied enough to perform a meta-analysis.36
Cognitive stimulation typically consists of activities such as reviewing current events, promoting sensory awareness, drawing, associating words, discussion of hobbies, and planning daily activities. This type of therapy has been shown to improve cognition in patients with dementia, as well as well-being and quality of life. It does not improve behavioral problems, per se.37
Reminiscence therapy is a popular modality that involves stimulating memories of the past by looking at personal photos and newspaper clippings and discussing the past. It is well received by patients and caregivers. It has been shown to improve mood in elderly patients without dementia, but studies of reminiscence therapy have been too dissimilar to draw conclusions regarding its effect on behavioral disturbances in patients with dementia.38
Other therapies that are common in dementia care, such as respite care and specialized dementia units, have simply not been studied well enough to provide any conclusions as to their effectiveness.39,40
CASE When Ms. M is discharged from the hospital, her family enrolls her in an adult day care program, where Ms. M will be able to participate in social activities, exercise, and communal meals. Her daughter asks the family physician what other steps they can take in the home to make things easier on her mother. And as an aside, the daughter admits that while she is glad that she and her family can “be there” for her mother, there have been times when she has simply not felt up to the task.
Help family members care for the patient—and themselves
A recent meta-analysis suggests that caregiver interventions have a positive effect on behavioral problems in patients with dementia.32 Successful programs are tailored to the individual needs of the patient and caregiver and delivered over multiple sessions. Unfortunately, the aforementioned meta-analysis did not provide evidenced-based interventions for specific problems.32 With this in mind, the following are some practical caregiver “do’s and don’ts” that are based on reviews and consensus guidelines.
Don’t take it personally. It is extremely important to help caregivers understand that the disturbing behaviors of patients with dementia lack intentionality and are part of the normal progression of the disorder.25 Caregivers also need to appreciate that hallucinations are normal in these patients and do not require medications if they don’t disturb the patient or place the patient or anyone else at risk.
Don’t try to reason with the patient; redirect him or her instead. Clinicians should offer caregivers suggestions for reassuring, redirecting, or distracting agitated patients rather than trying to reason with them. Encourage caregivers to develop and maintain routines and consistency.6,25 Using a calm, low tone of voice, giving very simple instructions, and leaving and then reattempting care that is refused the first time may also be effective.5 Some experts have suggested techniques such as giving positive rewards for desired behaviors and not rewarding negative behaviors.6,26
Do create a safe environment. Recommend that caregivers create a safe environment. Make sure that they lock up all guns. Also, encourage them to use locks, alarms, or ID bracelets when patients are prone to wandering.25
Do consider a caregiver support program. Caregivers can make a big difference in the lives of patients with dementia, Help caregivers understand that the disturbing behaviors of patients with dementia lack intentionality and are part of the normal progression of the disorder. but only if they have support, as well.
A recent meta-analysis concluded that active involvement of caregivers in making choices about treatments distinguishes effective from ineffective support programs, decreases the odds of institutionalization, and may lengthen time to institutionalization.33 To ease caregiver strain and depression, encourage them to make use of resources such as nursing home respite care and community agencies that include the Alzheimer’s Association (http://www.alz.org).6,44,45
CASE Ms. M’s daughter joins a local support group for families of patients with dementia, where she learns redirection techniques to try when her mother refuses care. The exercise and daytime social stimulation that Ms. M receives through the adult day care program helps her to sleep at night. When Ms. M refuses to take a shower—a challenge the family had before her hospitalization—the daughter does not argue with her. Instead, she returns 10 to 20 minutes later and asks again, or tries a bedside sponge bath with a lavender soap that Ms. M seems to like.
Ms. M’s nighttime wandering is markedly reduced and the family no longer uses any antipsychotic medications. The family physician counsels them, however, about the progressive nature of the disease and encourages them to set up periodic follow-up visits, so that he can see how everyone—patient and caregivers alike—are doing.
Welcoming the reprieves, recognizing the realities
The behavioral and psychological symptoms of dementia are the most challenging aspect of dementia care. Unacceptable behaviors sometimes persist even when aggressively addressing modifiable factors and attempting behavioral interventions (TABLE 2).2,5-7,15,16,24-26,32,41,44-46 Patients with behavioral disturbances frequently require a pharmacologic agent or transfer to a different care setting.
But clinicians need to use psychotropic medications with informed patient and/or caregiver consent.7 On a case-by-case basis, a trial of antipsychotics is often justified, despite the black box warning. A family may choose to try an antipsychotic despite the risk to help manage the patient at home in the hope of delaying or preventing institutionalization.
However, even with good home support, in conjunction with nonpharmacologic and/or pharmacologic therapies, most patients with dementia will eventually require institutionalization.47 Because patients and families often rely on family physicians to guide them through these difficult challenges and decisions, you’ll need to remain well versed on the available On a case-by- case basis, a trial of antipsychotics is often justified, despite the black box warning. treatments for the psychological and behavioral symptoms of dementia, as well as the resources available in your community.
CORRESPONDENCE
Jaqueline Raetz, MD, 331 NE Thornton Place, Seattle, WA 98125; [email protected]
1. Mega MS, Cummings JL, Fiorello T, et al. The spectrum of behavioral changes in Alzheimer’s disease. Neurology. 1996;46:130-135.
2. Feil DG, MacLean C, Sultzer D. Quality indicators for the care of dementia in vulnerable elders. J Am Geriatr Soc. 2007;55(suppl 2):S293-S301.
3. Hort J, O’Brien JT, Gainotti G, et al. EFNS guidelines for the diagnosis and management of Alzheimer’s disease. Eur J Neurol. 2010;17:1236-1248.
4. Lyketsos CG, Lopez O, Jones B, et al. Prevalence of neuropsychiatric symptoms in dementia and mild cognitive impairment: results from the cardiovascular health study. JAMA. 2002;288:1475-1483.
5. Omelan C. Approach to managing behavioural disturbances in dementia. Can Fam Physician. 2006;52:191-199.
6. Sadowsky CH, Galvin JE. Guidelines for the management of cognitive and behavioral problems in dementia. J Am Board Fam Med. 2012;25:350-366.
7. Salzman C, Jeste DV, Meyer RE, et al. Elderly patients with dementia-related symptoms of severe agitation and aggression: consensus statement on treatment options, clinical trials methodology, and policy. J Clin Psychiatry. 2008;69:889-898.
8. Hill KD, Wee R. Psychotropic drug-induced falls in older people: a review of interventions aimed at reducing the problem. Drugs Aging. 2012;29:15-30.
9. US Food and Drug Administration. Public health advisory: deaths with antipsychotics in elderly patients with behavioral disturbances. April 11, 2005. Available at: http://www.fda.gov/Drugs/DrugSafety/PostmarketDrugSafetyInformationforPatientsandProviders/DrugSafetyInformationforHeathcareProfessionals/PublicHealthAdvisories/ucm053171.htm. Accessed September 16, 2013.
10. Schneider LS, Dagerman KS, Insel P. Risk of death with atypical antipsychotic drug treatment for dementia: meta-analysis of randomized placebo-controlled trials. JAMA. 2005;294:1934-1943.
11. US Food and Drug Administration. Antipsychotics, conventional and atypical. June 16, 2008. Available at: http://www.fda.gov/Safety/MedWatch/SafetyInformation/SafetyAlertsforHumanMedicalProducts/ucm110212.htm. Accessed September 16, 2013.
12. Wang PS, Schneeweiss S, Avorn J, et al. Risk of death in elderly users of conventional vs. atypical antipsychotic medications. N Engl J Med. 2005;353:2335-2341.
13. Ballard C, Waite J. The effectiveness of atypical antipsychotics for the treatment of aggression and psychosis in Alzheimer’s disease. Cochrane Database Syst Rev. 2006;(1):CD003476.
14. Sink KM, Holden KF, Yaffe K. Pharmacological treatment of neuropsychiatric symptoms of dementia: a review of the evidence. JAMA. 2005;293:596-608.
15. Lonergan E, Luxenberg J, Colford JM. Haloperidol for agitation in dementia. Cochrane Database Syst Rev. 2002;(2):CD002852.
16. Schneider LS, Tariot PN, Dagerman KS, et al; CATIE-AD Study Group. Effectiveness of atypical antipsychotic drugs in patients with Alzheimer’s disease. N Engl J Med. 2006;355:1525-1538.
17. Martinón-Torres G, Fioravanti M, Grimley EJ. Trazodone for agitation in dementia. Cochrane Database Syst Rev. 2004;(4):CD004990.
18. Birks J, Harvey RJ. Donepezil for dementia due to Alzheimer’s disease. Cochrane Database Syst Rev. 2006;(1):CD001190.
19. McShane R, Areosa Sastre A, Minakaran N. Memantine for dementia. Cochrane Database Syst Rev. 2006;(2):CD003154.
20. Raina P, Santaguida P, Ismaila A, et al. Effectiveness of cholinesterase inhibitors and memantine for treating dementia: evidence review for a clinical practice guideline. Ann Intern Med. 2008;148:379-397.
21. Seitz DP, Adunuri N, Gill SS, et al. Antidepressants for agitation and psychosis in dementia. Cochrane Database Syst Rev. 2011;(2): CD008191.
22. Sterke CS, Ziere G, van Beeck EF, et al. Dose-response relationship between selective serotonin re-uptake inhibitors and injurious falls: a study in nursing home residents with dementia. Br J Clin Pharmacol. 2012;73:812-820.
23. Jacob S, Spinler SA. Hyponatremia associated with selective serotonin-reuptake inhibitors in older adults. Ann Pharmacother. 2006;40:1618-1622.
24. Segal-Gidan F, Cherry D, Jones R, et al. Alzheimer’s disease management guideline: update 2008. Alzheimers Dement. 2011;7:e51-e59.
25. Rayner A, O’Brien J, Shoenbachler B. Behavior disorders of dementia: recognition and treatment. Am Fam Physician. 2006;73:647-652.
26. Ayalon L, Gum AM, Feliciano L, et al. Effectiveness of nonpharmacological interventions for the management of neuropsychiatric symptoms in patients with dementia: a systematic review. Arch Intern Med. 2006;166:2182-2188.
27. Elie M, Cole MG, Primeau FJ, et al. Delirium risk factors in elderly hospitalized patients. J Gen Intern Med. 1998;13:204-212.
28. Azermai M, Petrovic M, Elseviers MM, et al. Systematic appraisal of dementia guidelines for the management of behavioural and psychological symptoms. Aging Res Rev. 2012;11:78-86.
29. Viggo Hansen N, Jørgensen T, Ørtenblad L. Massage and touch for dementia. Cochrane Database Syst Rev. 2006;(4):CD004989.
30. Kong EH, Evans LK, Guevara JP. Nonpharmacological intervention for agitation in dementia: a systematic review and meta-analysis. Aging Ment Health. 2009;13:512-520.
31. Thorgrimsen LM, Spector A, Wiles A, et al. Aroma therapy for dementia. Cochrane Database Syst Rev. 2003;(3):CD003150.
32. Brodaty H, Arasaratnam C. Review of meta-analysis of nonpharmacological interventions for neuropsychiatric symptoms of dementia. Am J Psychiatry 2012;169:946-953.
33. Spijker A, Vernooij-Dassen M, Vasse E, et al. Effectiveness of nonpharmacological interventions in delaying the institutionalization of patients with dementia: A meta-analysis. J Am Geriatr Soc. 2008;56:1116-1128.
34. Opie J, Rosewarne R, O’Connor DW. The efficacy of psychosocial approaches to behaviour disorders in dementia: a systematic literature review. Aust N Z J Psychiatry. 1999;33:789-799.
35. Forbes D, Forbes S, Morgan DG, et al. Physical activity programs for persons with dementia. Cochrane Database Syst Rev. 2008;(3):CD006489.
36. Price JD, Hermans DG, Grimley Evans J. Subjective barriers to prevent wandering of cognitively impaired people. Cochrane Database Syst Rev. 2000;(4):CD001932.
37. Woods B, Aguirre E, Spector AE, et al. Cognitive stimulation to improve cognitive functioning in people with dementia. Cochrane Database Syst Rev. 2012;(2):CD005562.
38. Woods B, Spector A, Jones C, et al. Reminiscence therapy for dementia. Cochrane Database Syst Rev. 2005;(2):CD001120.
39. Lee H, Cameron M. Respite care for people with dementia and their carers. Cochrane Database Syst Rev. 2004;(2):CD004396.
40. Lai CK, Yeung JH, Mok V, et al. Special care units for dementia individuals with behavioural problems. Cochrane Database Syst Rev. 2009;(4):CD006470.
41. Waldemar G, Dubois B, Emre M, et al. Recommendations for the diagnosis and management of Alzheimer’s disease and other disorders associated with dementia: EFNS guideline. Eur J Neurol. 2007;14:e1-e26.
42. Oldervoll LM, Loge JH, Paltiel H, et al. The effect of a physical exercise program in palliative care: a phase II study. J Pain Symptom Manage. 2006;31:421-430.
43. Vink AC, Birks JS, Bruinsma MS, et al. Music therapy for people with dementia. Cochrane Database Syst Rev. 2004;(3):CD003477.
44. Gitlin LN, Kales HC, Lyketsos CG. Nonpharmacologic management of behavioral symptoms in dementia. JAMA. 2012;308:2020-2029.
45. Bass DM, Clark PA, Looman WJ, et al. The Cleveland Alzheimer’s managed care demonstration: outcomes after 12 months of implementation. Gerontologist. 2003;43:73-85.
46. Gitlin LN, Winter L, Dennis MP, et al.. A biobehavioral home-based intervention and the well-being of patients with dementia and their caregivers: the COPE randomized trial. JAMA. 2010;304:983-991.
47. Smith GE, Kokmen E, O’Brien PC. Risk factors for nursing home placement in a population-based dementia cohort. J Am Geriatr Soc. 2000;48:519-525.
Woman, 45, With Red, Scaly Nipple
A 45-year-old woman noticed some redness and scaling around her right nipple. She applied peroxide and OTC antibiotic ointment for approximately seven months with mixed results. She sought medical attention when pain developed in the breast, along with some bloody discharge from the nipple (see Figure 1). Around that time, she also noticed three small nodules in the upper outer portion of the breast.
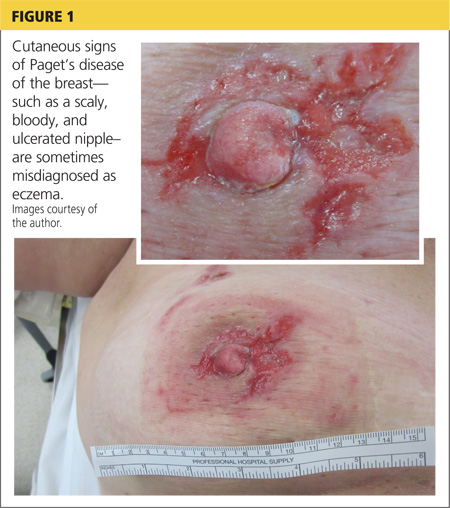
A mammogram and ultrasound revealed a 1.7 × 2.0–cm spiculated mass in the axillary tail, as well as two smaller breast lesions. A PET/CT scan ordered subsequently revealed intense uptake in the periareolar region and a suspicious axillary node. By then, the biopsy results had confirmed invasive ductal carcinoma, later determined to be Paget’s disease of the breast (PDB).
The patient’s previous medical history was significant for cystic breasts (never biopsied), chronic back pain, anxiety, and obesity. She was perimenopausal with irregular periods, the last one about 10 months ago. Her obstetric history included two pregnancies resulting in live births and no history of abortion; her menarche occurred at age 14 and her first pregnancy at 27. Family history was significant for leukemia in her maternal grandmother and niece. She did not use tobacco, alcohol, or illicit drugs. She lived at home with her husband and two daughters, who were all very supportive.
The patient elected to undergo a right modified radical mastectomy (MRM) and prophylactic left total mastectomy. MRM was performed on the right breast because sentinel lymph node identification was unsuccessful. This may have been due to involvement of the right subareolar plexus. Five of eight lymph nodes later tested positive for malignancy. The surgery was completed by placement of bilateral tissue expanders for eventual breast reconstruction.
Chemotherapy was started six weeks after surgery and included 15 weeks (five cycles) of docetaxel, carboplatin, and trastuzumab (a combination known as TCH), followed by 51 weeks (17 cycles) of trastuzumab, along with daily tamoxifen. The TCH regimen was followed by four weekly cycles of external beam radiation therapy (EBRT). Adverse effects of treatment have included chest wall dermatitis, right upper extremity lymphedema, nausea/vomiting, dyspnea, peripheral neuropathy, alopecia, and fatigue.
Discussion
Nearly 150 years ago, James Paget recognized a connection between skin changes around the nipple and deeper lesions in the breast.1 The disease that Paget identified is defined as the presence of intraepithelial adenocarcinoma cells (ie, Paget’s cells) within the epidermis of the nipple, with or without an underlying carcinoma.
An underlying breast cancer is present 85% to 95% of the time but is palpable in only approximately 50% of cases (see Figure 2). However, 25% of the time there is neither a palpable mass nor a mammographic abnormality. In these cases particularly, timely diagnosis depends on recognition of suspicious nipple changes, followed by a prompt and thorough diagnostic workup. Unfortunately, the accurate diagnosis of Paget’s disease still takes an average of several months.2
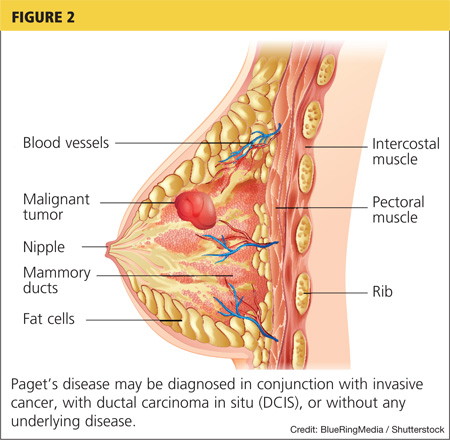
Paget’s disease is rare; it represents only 1% to 3% of new cases of female breast cancer, or about 2,250 cases a year.2-4 (The number of Paget’s disease cases per year was calculated by the author, based on the reported incidence of all breast cancers.) It is even more rare among men. For both genders, the peak age for this disease is between 50 and 60.2
Paget’s disease is an important entity for primary care PAs and NPs because it presents an opportunity to make a timely and life-changing diagnosis, and because it provides an elegant model for understanding current diagnostic and therapeutic approaches to breast cancer.
Clinical Presentation and Pathophysiology
The hallmark of PDB is scaly, vesicular, or ulcerated changes that begin in the nipple and spread to the areola. These changes are most often unilateral and may occur with pruritus, burning pain, and/or oozing from the nipple.5 This presentation is often mistaken for common skin conditions, such as eczema. Like eczema, changes in PDB may improve spontaneously and fluctuate over time, which is confusing for both the patient and clinician. A clinical pearl is that eczema is more likely to spread from the areola to the nipple, and will usually respond to topical corticosteroids. By contrast, changes in PDB tend to spread from the nipple to the areola, and corticosteroids do not provide a sustained response. Of note, Paget’s lesions may heal spontaneously even as the underlying malignancy progresses.6
PDB is unique because the underlying lesion and skin changes are not just coincidental. The cutaneous changes and the malignancy that lies beneath have a causal, not merely co-occurring, relationship. Paget himself believed that the nipple changes were both a precursor, and a promoter, of the underlying cancer.1 This transformation theory states that normal nipple epidermis turns into Paget’s cells spontaneously, before there is any underlying disease. This theory is supported by the fact that, occasionally (though rarely), no underlying breast cancer is ever found. Also, the concomitant tumor may be some distance (> 2 cm) from the nipple-areolar complex (NAC), suggesting a synchronous but causally unrelated lesion.6-8
Modern immunochemistry has turned PDB inside out. Today, PDB is believed to begin within the breast and then to spread “upward” to the NAC, called the epidermotrophic theory. This theory is supported by the fact that Paget’s cells share several molecular markers with their respective parenchymal tumors. Some researchers now propose that there is a single Paget’s progenitor cell with a motility factor that allows it to traverse the ductal system, resulting in nipple and skin changes that have come to be recognized as PDB.6-8
The invasive cancers that are associated with PDB are most likely to be both estrogen- and progesterone-receptor–negative and of a high histologic grade.3,7 Estrogen- and progesterone-sensitive tumors respond to hormonal manipulation therapy. Tumors that are receptor-negative and that have a more aggressive grade are more difficult to treat.
Differential Diagnosis
PDB may be confused with the early stages of inflammatory breast cancer (IBC), an aggressive malignant disease (see Table 1). Both conditions may present with erythema and skin thickening and may be mistaken for mastitis. However, IBC spreads rapidly through the entire breast, and clinical features may include tenderness, a feeling of heat or heaviness, breast enlargement, and significant lymphadenopathy. Current recommendations call for a biopsy of any area of breast inflammation that does not respond to antibiotics within seven days.9
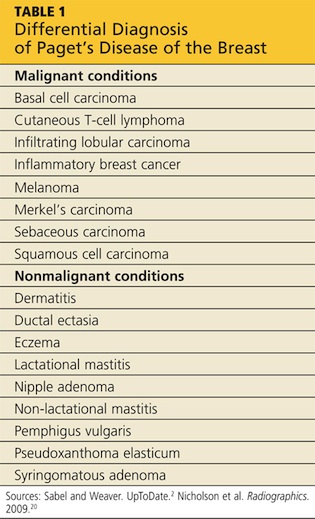
PDB is not the only cutaneous manifestation of breast cancer. Others include carcinoma erysipeloides (inflammatory changes that resemble cellulitis), carcinoma telangiectaticum (vascularized plaques), and/or inflammatory papules or nodules appearing on the breast, back, neck, or scalp. Each of these non–Paget’s conditions involves lymphatic (versus ductal) spread and signifies advanced malignancy.10
Diagnosis and Staging
After biopsy of the nipple lesion(s), diagnosis proceeds to the assessment of the breast itself and ultimately to cancer staging. PDB may occur (in order of incidence):
• In conjunction with an invasive cancer
• With underlying ductal carcinoma in situ (DCIS)
• Without any underlying disease.7
Mammography is used to determine the extent and location of the underlying lesion(s), which is more likely to be peripheral and/or multicentric. However, in some cases, there are no mammographic changes, which is now recognized as an indication for performing a breast MRI.11 Once the lesion is located, direct or image-guided biopsy confirms whether it is invasive cancer or DCIS. Palpable masses that occur with PDB are usually invasive and signal advanced disease.2,6,12,13 Sentinel lymph node biopsy (SLNB), which is usually performed at the time of surgery, plays a critical role in cancer staging and treatment planning. SLNB reliably diagnoses axillary metastasis in approximately 98% of patients.14
Like other breast cancers, PDB is also categorized by the expression of molecular markers, including HER2 (human epidermal growth factor receptor 2). Cancer cells in which HER2 gene is overexpressed tend to proliferate more rapidly than others. HER-status can also provide a clue as to which chemotherapy agents are likely to be most effective.2
Treatment and Management
The primary treatment for breast cancer is surgery, which serves both diagnostic and therapeutic purposes. To be effective, surgical treatment of PDB requires excision of the NAC, also called central lumpectomy. This may be sufficient treatment in those rare cases in which the disease is confined to the NAC.11,12
For underlying tumors, partial mastectomy is an option when the tumor is small (< 2 cm) and located close enough to the NAC to achieve negative margins, while leaving a cosmetically acceptable breast. Partial mastectomy is usually followed by whole breast irradiation. A few centers offer intraoperative radiation therapy (IORT)—performed before the surgeon closes the incision—for patients who wish to avoid or limit the duration of postoperative radiation treatment.15-17
Complete mastectomy (including excision of the NAC) should be considered when:
• The distance between the NAC and the underlying tumor is significant
• Multicentric disease and/or diffuse calcifications exist
• Achieving negative margins would remove too much tissue to leave a cosmetically acceptable breast.
Evaluation of the axillary nodes is the same in PDB as with other breast cancers. Patients with disease localized to the NAC and no underlying carcinoma may choose to forego lymph node biopsy. The same is true for patients who have PDB with a single underlying DCIS. However, lymph node biopsy is always recommended in cases of multicentric DCIS or invasive disease, or if a mastectomy is planned.18,19
Sentinel node biopsy results determine whether the mastectomy should be simple (excision of the breast alone) or modified radical (breast and axillary nodes). Today, complete radical mastectomy (excision of the breast, axillary nodes, and pectoral muscle) is reserved for cases in which disease invades the chest wall.18,19
The use of adjuvant (postoperative) therapy in patients with DCIS (whether or not related to PDB) is still debated. For patients with invasive cancers, both radiation therapy and chemotherapy are usually indicated. The decision to use neoadjuvant (preoperative) chemotherapy is made on a case-by-case basis. All decisions are based on the nature of the underlying cancer, regardless of whether the diagnosis is PDB.
Because PDB is categorized as invasive in at least 85% of cases, and because all invasive breast cancers carry about twice the risk for newly diagnosed contralateral disease, systematic follow-up is extremely important for patients with PDB. A clinical exam and updated history should be performed every four to six months during the first two years and at least annually after that. Screening recommendations, including a yearly mammogram, remain the same for asymptomatic patients. Patients with new or recurring symptoms—because they are at high risk for cancer recurrence—or who are undergoing treatment may have additional testing, including assessing for tumor markers, ultrasound, or MRI.2
PDB is treated with the same chemotherapy regimens as other breast cancers. In the early stages, chemotherapy reduces the risk for recurrence. In advanced breast cancer, the goal of chemotherapy is to reduce tumor size and achieve local control.
Prognosis
Patients with negative lymph node biopsy results have survival rates of 85% and 79% at five and 10 years, respectively. Patients with positive node results face survival rates of 32% at five years and 28% at 10 years. As with other cancers, anything that contributes to disease progression (including delayed diagnosis or treatment) decreases the patient’s survival rate.2,3 The overall prognosis for PDB is based on the nature of the underlying breast cancer, including its stage and other predictive factors—not on the fact that it is PDB.
Patient Outcome
Nearing the end of her treatment with trastuzumab, the patient became concerned about new-onset vaginal and left pelvic pain, along with some lower back discomfort. She mentioned these symptoms to her oncologist immediately. A transvaginal ultrasound could not rule out an ovarian neoplasm.
The patient elected to undergo total abdominal hysterectomy and bilateral salpingo-oophorectomy (TAH/BSO). This option allowed for removal of a mass discovered during the procedure, minimized the risk for subsequent endometrial cancer, and reduced the chance of recurrence of the patient’s estrogen/progesterone receptor–positive breast cancer. The mass itself turned out to be a benign pedunculated fibroid tumor.
The patient was relieved and continues to recover well. A follow-up PET/CT scan is scheduled for three months from now.
Conclusion
PDB is a complex disease that challenges our current understanding of breast cancer and its diagnosis and treatment. It depends uniquely upon ductal (versus blood or lymphatic) spread. Little did Paget and his contemporaries realize they had opened up such a porthole into modern histology. Nor did they appreciate the fact that they had identified an insidious breast cancer that declares itself through the skin.
Today, it is understood that by the time nipple changes of PDB appear, an underlying breast cancer most likely exists. In at least 25% of cases, there is neither a palpable mass nor a positive mammogram finding. For this reason, clinicians must maintain a high level of clinical suspicion and a low threshold for biopsy when there are skin changes at the nipple. This is especially true because the underlying lesions are more likely to be invasive cancers.
Surgical treatment will often mean complete mastectomy, whether simple, modified radical, or radical. This choice will be driven by the extent and location of the underlying disease. There is a role for partial mastectomy followed by radiation therapy in those rare cases in which PDB is confined to the NAC with no underlying tumor. Partial mastectomy is also a consideration when the underlying tumor is small and/or located close to the NAC. Patients with PDB may consider whole-breast or NAC reconstruction once radiation therapy and/or chemotherapy are completed.
PDB remains a poignant reminder for all clinicians of the importance of a thorough clinical exam and a well-focused history in all patients at risk for breast cancer. Moreover, it is an enduring example of the fact that common symptoms sometimes do signify something uncommon and potentially life- changing.
References
1. Paget J. On disease of the mammary areola preceding cancer of the mammary gland. In: Paget S, ed. Selected Essays and Addresses by Sir James Paget. London: Longmans, Green and Co.; 1902:145-148.
2. Sabel MS, Weaver DL. Paget disease of the breast. In: UpToDate. Chagpar AE, Hayes DF, Pierce LJ, eds. www.uptodate.com/contents/paget-disease-of-the-breast. Updated November 27, 2012. Accessed September 9, 2013.
3. Ortiz-Pagan S, Cunto-Amesty G, Narayan S. Effect of Paget’s disease on survival in breast cancer. Arch Surg. 2001;146:1267-1270.
4. American Cancer Society. Cancer facts & figures 2012. www.cancer.org/research/cancerfactsfigures/cancerfactsfigures/cancer-facts-figures-2012. Accessed September 9, 2013.
5. Ashikari R, Park K, Huvos AG, Urban JA. Paget’s disease of the breast. Cancer. 1970;3:680-685.
6. Sakorafas GH, Blanchard K, Sarr MG, Farley DR. Paget’s disease of the breast. Cancer Treatment Rev. 2001;27:9-18.
7. Chen C-Y, Sun L-M, Anderson BO. Paget disease of the breast: changing patterns of incidence, clinical presentation, and treatment in the U.S. Cancer. 2006;107:1448-1458.
8. Paone JF, Baker R. Pathogenesis and treatment of Paget’s disease of the breast. Cancer. 1981;48:825-829.
9. Nelson JA, Patel D, Mancuso P. Inflammatory breast cancer. ADVANCE for NPs and PAs. 2011;2(10):25-28.
10. Ngan V. Skin metastasis. DermNet NZ. New Zealand Dermatological Society. http://dermnetnz.org/lesions/metastasis.html. Accessed September 9, 2013.
11. Amano G, Yajima M, Moroboshi Y, et al. MRI accurately depicts underlying DCIS in a patient with Paget’s disease of the breast without palpable mass and mammography findings. Jpn J Clin Oncol. 2005;35:149-153.
12. Burrell HC, Evans AJ. Radiological assessment of the breast: what the surgical oncologist needs to know. Eur J Surg Oncol. 2001;27:689-691.
13. Muttarak M, Siriya B, Kongmebhol P. Paget’s disease of the breast: clinical, imaging and pathologic findings: a review of 16 patients. Biomed Imaging Interv J. 2001;7:e16, 1-7.
14. Laronga C, Hasson D, Hoover S, et al. Paget’s disease in the era of sentinel lymph node biopsy. Am J Surg. 2006;192:481-483.
15. Pezzi CM, Kukora JS, Audet IM. Breast conservation surgery using nipple-areolar resection for central breast cancers. Arch Surg. 2004;139:32-37.
16. Polgar C, Zsolt O, Tibor K, Janos F. Breast-conserving therapy for Paget disease of the nipple. Cancer. 2002;94:1904-1905.
17. Marshall JK, Griffith KA, Haffty BG, Solin LJ. Conservative management of Paget disease of the breast with radiotherapy. Cancer. 2003;97:2142-2149.
18. Vasquez B, Rousseau D, Hurd TC. Surgical management of breast cancer. Sem Oncol. 2007;34:234-240.
19. Mamounas EP. Continuing evolution in breast cancer surgical management. J Clin Oncol. 2005;23:1603-1606.
20. Nicholson BT, Harvey JA, Cohen MA. Nipple-areolar complex: normal anatomy and benign and malignant processes. Radiographics. 2009;29:509-523.
A 45-year-old woman noticed some redness and scaling around her right nipple. She applied peroxide and OTC antibiotic ointment for approximately seven months with mixed results. She sought medical attention when pain developed in the breast, along with some bloody discharge from the nipple (see Figure 1). Around that time, she also noticed three small nodules in the upper outer portion of the breast.
A mammogram and ultrasound revealed a 1.7 × 2.0–cm spiculated mass in the axillary tail, as well as two smaller breast lesions. A PET/CT scan ordered subsequently revealed intense uptake in the periareolar region and a suspicious axillary node. By then, the biopsy results had confirmed invasive ductal carcinoma, later determined to be Paget’s disease of the breast (PDB).
The patient’s previous medical history was significant for cystic breasts (never biopsied), chronic back pain, anxiety, and obesity. She was perimenopausal with irregular periods, the last one about 10 months ago. Her obstetric history included two pregnancies resulting in live births and no history of abortion; her menarche occurred at age 14 and her first pregnancy at 27. Family history was significant for leukemia in her maternal grandmother and niece. She did not use tobacco, alcohol, or illicit drugs. She lived at home with her husband and two daughters, who were all very supportive.
The patient elected to undergo a right modified radical mastectomy (MRM) and prophylactic left total mastectomy. MRM was performed on the right breast because sentinel lymph node identification was unsuccessful. This may have been due to involvement of the right subareolar plexus. Five of eight lymph nodes later tested positive for malignancy. The surgery was completed by placement of bilateral tissue expanders for eventual breast reconstruction.
Chemotherapy was started six weeks after surgery and included 15 weeks (five cycles) of docetaxel, carboplatin, and trastuzumab (a combination known as TCH), followed by 51 weeks (17 cycles) of trastuzumab, along with daily tamoxifen. The TCH regimen was followed by four weekly cycles of external beam radiation therapy (EBRT). Adverse effects of treatment have included chest wall dermatitis, right upper extremity lymphedema, nausea/vomiting, dyspnea, peripheral neuropathy, alopecia, and fatigue.
Discussion
Nearly 150 years ago, James Paget recognized a connection between skin changes around the nipple and deeper lesions in the breast.1 The disease that Paget identified is defined as the presence of intraepithelial adenocarcinoma cells (ie, Paget’s cells) within the epidermis of the nipple, with or without an underlying carcinoma.
An underlying breast cancer is present 85% to 95% of the time but is palpable in only approximately 50% of cases (see Figure 2). However, 25% of the time there is neither a palpable mass nor a mammographic abnormality. In these cases particularly, timely diagnosis depends on recognition of suspicious nipple changes, followed by a prompt and thorough diagnostic workup. Unfortunately, the accurate diagnosis of Paget’s disease still takes an average of several months.2
Paget’s disease is rare; it represents only 1% to 3% of new cases of female breast cancer, or about 2,250 cases a year.2-4 (The number of Paget’s disease cases per year was calculated by the author, based on the reported incidence of all breast cancers.) It is even more rare among men. For both genders, the peak age for this disease is between 50 and 60.2
Paget’s disease is an important entity for primary care PAs and NPs because it presents an opportunity to make a timely and life-changing diagnosis, and because it provides an elegant model for understanding current diagnostic and therapeutic approaches to breast cancer.
Clinical Presentation and Pathophysiology
The hallmark of PDB is scaly, vesicular, or ulcerated changes that begin in the nipple and spread to the areola. These changes are most often unilateral and may occur with pruritus, burning pain, and/or oozing from the nipple.5 This presentation is often mistaken for common skin conditions, such as eczema. Like eczema, changes in PDB may improve spontaneously and fluctuate over time, which is confusing for both the patient and clinician. A clinical pearl is that eczema is more likely to spread from the areola to the nipple, and will usually respond to topical corticosteroids. By contrast, changes in PDB tend to spread from the nipple to the areola, and corticosteroids do not provide a sustained response. Of note, Paget’s lesions may heal spontaneously even as the underlying malignancy progresses.6
PDB is unique because the underlying lesion and skin changes are not just coincidental. The cutaneous changes and the malignancy that lies beneath have a causal, not merely co-occurring, relationship. Paget himself believed that the nipple changes were both a precursor, and a promoter, of the underlying cancer.1 This transformation theory states that normal nipple epidermis turns into Paget’s cells spontaneously, before there is any underlying disease. This theory is supported by the fact that, occasionally (though rarely), no underlying breast cancer is ever found. Also, the concomitant tumor may be some distance (> 2 cm) from the nipple-areolar complex (NAC), suggesting a synchronous but causally unrelated lesion.6-8
Modern immunochemistry has turned PDB inside out. Today, PDB is believed to begin within the breast and then to spread “upward” to the NAC, called the epidermotrophic theory. This theory is supported by the fact that Paget’s cells share several molecular markers with their respective parenchymal tumors. Some researchers now propose that there is a single Paget’s progenitor cell with a motility factor that allows it to traverse the ductal system, resulting in nipple and skin changes that have come to be recognized as PDB.6-8
The invasive cancers that are associated with PDB are most likely to be both estrogen- and progesterone-receptor–negative and of a high histologic grade.3,7 Estrogen- and progesterone-sensitive tumors respond to hormonal manipulation therapy. Tumors that are receptor-negative and that have a more aggressive grade are more difficult to treat.
Differential Diagnosis
PDB may be confused with the early stages of inflammatory breast cancer (IBC), an aggressive malignant disease (see Table 1). Both conditions may present with erythema and skin thickening and may be mistaken for mastitis. However, IBC spreads rapidly through the entire breast, and clinical features may include tenderness, a feeling of heat or heaviness, breast enlargement, and significant lymphadenopathy. Current recommendations call for a biopsy of any area of breast inflammation that does not respond to antibiotics within seven days.9
PDB is not the only cutaneous manifestation of breast cancer. Others include carcinoma erysipeloides (inflammatory changes that resemble cellulitis), carcinoma telangiectaticum (vascularized plaques), and/or inflammatory papules or nodules appearing on the breast, back, neck, or scalp. Each of these non–Paget’s conditions involves lymphatic (versus ductal) spread and signifies advanced malignancy.10
Diagnosis and Staging
After biopsy of the nipple lesion(s), diagnosis proceeds to the assessment of the breast itself and ultimately to cancer staging. PDB may occur (in order of incidence):
• In conjunction with an invasive cancer
• With underlying ductal carcinoma in situ (DCIS)
• Without any underlying disease.7
Mammography is used to determine the extent and location of the underlying lesion(s), which is more likely to be peripheral and/or multicentric. However, in some cases, there are no mammographic changes, which is now recognized as an indication for performing a breast MRI.11 Once the lesion is located, direct or image-guided biopsy confirms whether it is invasive cancer or DCIS. Palpable masses that occur with PDB are usually invasive and signal advanced disease.2,6,12,13 Sentinel lymph node biopsy (SLNB), which is usually performed at the time of surgery, plays a critical role in cancer staging and treatment planning. SLNB reliably diagnoses axillary metastasis in approximately 98% of patients.14
Like other breast cancers, PDB is also categorized by the expression of molecular markers, including HER2 (human epidermal growth factor receptor 2). Cancer cells in which HER2 gene is overexpressed tend to proliferate more rapidly than others. HER-status can also provide a clue as to which chemotherapy agents are likely to be most effective.2
Treatment and Management
The primary treatment for breast cancer is surgery, which serves both diagnostic and therapeutic purposes. To be effective, surgical treatment of PDB requires excision of the NAC, also called central lumpectomy. This may be sufficient treatment in those rare cases in which the disease is confined to the NAC.11,12
For underlying tumors, partial mastectomy is an option when the tumor is small (< 2 cm) and located close enough to the NAC to achieve negative margins, while leaving a cosmetically acceptable breast. Partial mastectomy is usually followed by whole breast irradiation. A few centers offer intraoperative radiation therapy (IORT)—performed before the surgeon closes the incision—for patients who wish to avoid or limit the duration of postoperative radiation treatment.15-17
Complete mastectomy (including excision of the NAC) should be considered when:
• The distance between the NAC and the underlying tumor is significant
• Multicentric disease and/or diffuse calcifications exist
• Achieving negative margins would remove too much tissue to leave a cosmetically acceptable breast.
Evaluation of the axillary nodes is the same in PDB as with other breast cancers. Patients with disease localized to the NAC and no underlying carcinoma may choose to forego lymph node biopsy. The same is true for patients who have PDB with a single underlying DCIS. However, lymph node biopsy is always recommended in cases of multicentric DCIS or invasive disease, or if a mastectomy is planned.18,19
Sentinel node biopsy results determine whether the mastectomy should be simple (excision of the breast alone) or modified radical (breast and axillary nodes). Today, complete radical mastectomy (excision of the breast, axillary nodes, and pectoral muscle) is reserved for cases in which disease invades the chest wall.18,19
The use of adjuvant (postoperative) therapy in patients with DCIS (whether or not related to PDB) is still debated. For patients with invasive cancers, both radiation therapy and chemotherapy are usually indicated. The decision to use neoadjuvant (preoperative) chemotherapy is made on a case-by-case basis. All decisions are based on the nature of the underlying cancer, regardless of whether the diagnosis is PDB.
Because PDB is categorized as invasive in at least 85% of cases, and because all invasive breast cancers carry about twice the risk for newly diagnosed contralateral disease, systematic follow-up is extremely important for patients with PDB. A clinical exam and updated history should be performed every four to six months during the first two years and at least annually after that. Screening recommendations, including a yearly mammogram, remain the same for asymptomatic patients. Patients with new or recurring symptoms—because they are at high risk for cancer recurrence—or who are undergoing treatment may have additional testing, including assessing for tumor markers, ultrasound, or MRI.2
PDB is treated with the same chemotherapy regimens as other breast cancers. In the early stages, chemotherapy reduces the risk for recurrence. In advanced breast cancer, the goal of chemotherapy is to reduce tumor size and achieve local control.
Prognosis
Patients with negative lymph node biopsy results have survival rates of 85% and 79% at five and 10 years, respectively. Patients with positive node results face survival rates of 32% at five years and 28% at 10 years. As with other cancers, anything that contributes to disease progression (including delayed diagnosis or treatment) decreases the patient’s survival rate.2,3 The overall prognosis for PDB is based on the nature of the underlying breast cancer, including its stage and other predictive factors—not on the fact that it is PDB.
Patient Outcome
Nearing the end of her treatment with trastuzumab, the patient became concerned about new-onset vaginal and left pelvic pain, along with some lower back discomfort. She mentioned these symptoms to her oncologist immediately. A transvaginal ultrasound could not rule out an ovarian neoplasm.
The patient elected to undergo total abdominal hysterectomy and bilateral salpingo-oophorectomy (TAH/BSO). This option allowed for removal of a mass discovered during the procedure, minimized the risk for subsequent endometrial cancer, and reduced the chance of recurrence of the patient’s estrogen/progesterone receptor–positive breast cancer. The mass itself turned out to be a benign pedunculated fibroid tumor.
The patient was relieved and continues to recover well. A follow-up PET/CT scan is scheduled for three months from now.
Conclusion
PDB is a complex disease that challenges our current understanding of breast cancer and its diagnosis and treatment. It depends uniquely upon ductal (versus blood or lymphatic) spread. Little did Paget and his contemporaries realize they had opened up such a porthole into modern histology. Nor did they appreciate the fact that they had identified an insidious breast cancer that declares itself through the skin.
Today, it is understood that by the time nipple changes of PDB appear, an underlying breast cancer most likely exists. In at least 25% of cases, there is neither a palpable mass nor a positive mammogram finding. For this reason, clinicians must maintain a high level of clinical suspicion and a low threshold for biopsy when there are skin changes at the nipple. This is especially true because the underlying lesions are more likely to be invasive cancers.
Surgical treatment will often mean complete mastectomy, whether simple, modified radical, or radical. This choice will be driven by the extent and location of the underlying disease. There is a role for partial mastectomy followed by radiation therapy in those rare cases in which PDB is confined to the NAC with no underlying tumor. Partial mastectomy is also a consideration when the underlying tumor is small and/or located close to the NAC. Patients with PDB may consider whole-breast or NAC reconstruction once radiation therapy and/or chemotherapy are completed.
PDB remains a poignant reminder for all clinicians of the importance of a thorough clinical exam and a well-focused history in all patients at risk for breast cancer. Moreover, it is an enduring example of the fact that common symptoms sometimes do signify something uncommon and potentially life- changing.
References
1. Paget J. On disease of the mammary areola preceding cancer of the mammary gland. In: Paget S, ed. Selected Essays and Addresses by Sir James Paget. London: Longmans, Green and Co.; 1902:145-148.
2. Sabel MS, Weaver DL. Paget disease of the breast. In: UpToDate. Chagpar AE, Hayes DF, Pierce LJ, eds. www.uptodate.com/contents/paget-disease-of-the-breast. Updated November 27, 2012. Accessed September 9, 2013.
3. Ortiz-Pagan S, Cunto-Amesty G, Narayan S. Effect of Paget’s disease on survival in breast cancer. Arch Surg. 2001;146:1267-1270.
4. American Cancer Society. Cancer facts & figures 2012. www.cancer.org/research/cancerfactsfigures/cancerfactsfigures/cancer-facts-figures-2012. Accessed September 9, 2013.
5. Ashikari R, Park K, Huvos AG, Urban JA. Paget’s disease of the breast. Cancer. 1970;3:680-685.
6. Sakorafas GH, Blanchard K, Sarr MG, Farley DR. Paget’s disease of the breast. Cancer Treatment Rev. 2001;27:9-18.
7. Chen C-Y, Sun L-M, Anderson BO. Paget disease of the breast: changing patterns of incidence, clinical presentation, and treatment in the U.S. Cancer. 2006;107:1448-1458.
8. Paone JF, Baker R. Pathogenesis and treatment of Paget’s disease of the breast. Cancer. 1981;48:825-829.
9. Nelson JA, Patel D, Mancuso P. Inflammatory breast cancer. ADVANCE for NPs and PAs. 2011;2(10):25-28.
10. Ngan V. Skin metastasis. DermNet NZ. New Zealand Dermatological Society. http://dermnetnz.org/lesions/metastasis.html. Accessed September 9, 2013.
11. Amano G, Yajima M, Moroboshi Y, et al. MRI accurately depicts underlying DCIS in a patient with Paget’s disease of the breast without palpable mass and mammography findings. Jpn J Clin Oncol. 2005;35:149-153.
12. Burrell HC, Evans AJ. Radiological assessment of the breast: what the surgical oncologist needs to know. Eur J Surg Oncol. 2001;27:689-691.
13. Muttarak M, Siriya B, Kongmebhol P. Paget’s disease of the breast: clinical, imaging and pathologic findings: a review of 16 patients. Biomed Imaging Interv J. 2001;7:e16, 1-7.
14. Laronga C, Hasson D, Hoover S, et al. Paget’s disease in the era of sentinel lymph node biopsy. Am J Surg. 2006;192:481-483.
15. Pezzi CM, Kukora JS, Audet IM. Breast conservation surgery using nipple-areolar resection for central breast cancers. Arch Surg. 2004;139:32-37.
16. Polgar C, Zsolt O, Tibor K, Janos F. Breast-conserving therapy for Paget disease of the nipple. Cancer. 2002;94:1904-1905.
17. Marshall JK, Griffith KA, Haffty BG, Solin LJ. Conservative management of Paget disease of the breast with radiotherapy. Cancer. 2003;97:2142-2149.
18. Vasquez B, Rousseau D, Hurd TC. Surgical management of breast cancer. Sem Oncol. 2007;34:234-240.
19. Mamounas EP. Continuing evolution in breast cancer surgical management. J Clin Oncol. 2005;23:1603-1606.
20. Nicholson BT, Harvey JA, Cohen MA. Nipple-areolar complex: normal anatomy and benign and malignant processes. Radiographics. 2009;29:509-523.
Man Has “a Couple of Blocks Somewhere”
ANSWER
The correct interpretation includes sinus bradycardia with first-degree block, a single premature atrial beat with aberrancy, right bundle branch block, left anterior fascicular block (bifascicular block), left ventricular hypertrophy, and T-wave inversions in the inferior leads.
In sinus bradycardia, there is a P wave for every QRS complex with a rate less than 60 beats/min. First-degree block is evidenced by a PR interval ≥ 200 ms.
A single premature atrial contraction is seen as the ninth beat on the ECG. Aberrancy refers to the appearance of the QRS complex; the impulse arises above the AV node but propagates down the AV node and His-Purkinje system to the ventricles before the conduction system is fully repolarized. This results in a QRS complex with intrinsic conduction similar to a normally conducted beat, which then becomes wide and uncharacteristic. Additionally, it resets the sinus node, resulting in a pause before the next normally conducted P wave.
A right bundle branch block is evidenced by the presence of normal conduction with a QRS duration > 120 ms, a terminal R wave in lead V1 (R, rR’, rsR’, or qR), and slurred S waves in leads I and V6.
The presence of left anterior fascicular block is confirmed by the left-axis deviation (–59° in this ECG), a qR complex in leads I and aVL, and an rS pattern in leads II, III, and aVF. The presence of both a right bundle and left anterior fascicular block constitutes bifascicular block. (This is a conduction problem and does not refer to blockage in the arteries, as the patient believed!)
Criteria for left ventricular hypertrophy are met when the sum of the S wave in V1 and the R wave in either V5 or V6 is ≥ 35 mm and the R wave in aVL is ≥ 11 mm.
Two other things to note in this ECG are the presence of T-wave inversions in the inferior leads (II, III, aVF) which are of unclear reason; and the presence of biphasic P waves that do not meet criteria for either right or left atrial hypertrophy.

A 69-year-old man presents for a routine appointment. His cardiac history is remarkable for systemic hypertension, nonischemic cardiomyopathy, pulmonary hypertension, and dyspnea on exertion. He says a previous provider told him his ECG had “a couple of blocks,” which he believes are “somewhere in the arteries.” He regularly feels lightheaded if he rises from a lying or sitting position too quickly, but he has never lost consciousness. He denies any history of chest pain or symptoms suggestive of angina. Reviewing his prior cardiac workup, you find an echocardiogram that shows moderate left ventricular enlargement with a left ventricular ejection fraction estimated at 35% to 40%; a severely enlarged left atrium; and mild thickening of the mitral leaflets as well as mild mitral regurgitation. A report from an old ECG (conducted at an outside institution) reveals sinus bradycardia, bifascicular block, and left ventricular hypertrophy. Cardiac catheterization performed two years ago showed diffuse disease with no lesions > 30%. Pulmonary function testing showed mild airflow obstruction, no restrictive component, and mildly decreased diffusing capacity. Medical history is positive for two benign colonic polyps that were removed during his last colonoscopy and a remote history of malaria while traveling in Africa 10 years ago. He also has a history of depression, which has been well controlled by medication. His list of medications includes carvedilol, fluoxetine, melatonin, and lisinopril. He is allergic to atenolol and metoprolol. His family history is remarkable for type 1 diabetes (mother). He is a retired baggage handler for a major airline at a nearby international airport. Since high school, he has smoked between one-half and one pack of cigarettes per day. He typically consumes a 12-pack of beer on the weekends. The review of systems is remarkable for corrective lenses, occasional headaches, and dyspnea. The patient denies any other symptoms. Physical examination reveals a blood pressure of 138/80 mm Hg; pulse, 64 beats/min; respiratory rate, 14 breaths/min-1; and O2 saturation, 97%. His height is 188 cm; weight, 107 kg; and BMI, 30. The lungs are clear to auscultation and percussion. The cardiac exam reveals no jugular venous distention, a normal rate and rhythm with occasional skipped beats, and a soft, grade II/VI blowing systolic murmur best heard at the left lower sternal border. The point of maximum impulse is palpable in the left anterior axillary line. The abdomen is soft and nontender, with no organomegaly. The genitourinary exam is normal. Peripheral pulses are 2+ bilaterally in both upper and lower extremities. There is no peripheral edema, and the neurologic exam is grossly intact. The patient is sent for a chest x-ray and an ECG. The latter reveals the following: a ventricular rate of 59 beats/min; PR interval, 284 ms; QRS duration, 130 ms; QT/QTc interval, 472/467 ms; P axis, 70°; R axis, –59°; and T axis, –29°. What is your interpretation of this ECG?
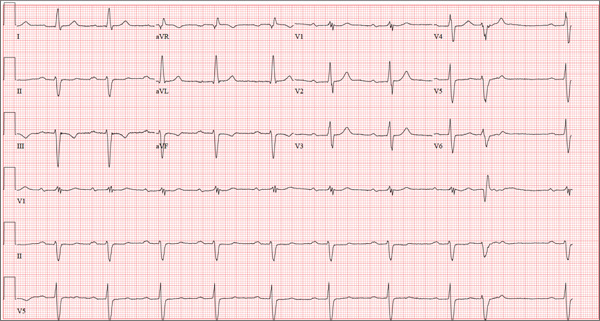
Lifelong Problem Has Caused Embarrassment
ANSWER
The correct answer is discoid lupus (choice “d”); see discussion for further details.
Sarcoidosis (choice “a”) is a worthy item in this differential, since it can be chronic, often affects the face (especially in African-Americans), and frequently defies ready diagnosis. But the biopsy was totally inconsistent with this diagnosis; in a case of sarcoidosis, it instead would have shown noncaseating granulomas, which are characteristic of the condition.
Lichen planus (choice “b”) is likewise worth consideration, since it can present in a similar fashion (although the chronicity of this patient’s lesions would have been atypical). Moreover, lichen planus is almost invariably symptomatic (itch). Biopsy would have shown obliteration of the dermoepidermal junction by an intense lymphocytic infiltrate—findings totally at odds with what was seen.
Polymorphous light eruption (PMLE; choice “c”) is the name given to a variety of photosensitivities that, true to the term polymorphous (or polymorphic), can present in numerous ways—although the lesions on any given patient tend to be monomorphic. These can take the form of vesicles, papules, and even erythema multiforme–like targetoid lesions, most commonly (as expected) on sun-exposed skin. Curiously, though, PMLE seldom affects the face or hands. It can manifest early in a patient’s life, but it would have been “seasonal,” disappearing in winter, and would have revealed a totally different picture on biopsy.
DISCUSSION
This patient suffered needlessly for more than half his life for lack of one simple thing: a correct diagnosis. Truth be known, the patient and his family probably bear some responsibility—but at some point, one of his many providers should have either obtained a punch biopsy or sent him to someone who would do so.
Instead, as is often the case, the emphasis was on treatment: trying one thing after another. The lack of success with these endeavors speaks loudly for the need for a definitive diagnosis. This could only be established one way: with a biopsy.
All the items mentioned in the above differential were legitimately considered. So was the possibility of infection, especially atypical types such as mycobacterial, deep fungal, or those involving other unusual organisms (eg, Nocardia, Actinomycetes). As in this case, tissue can be collected and submitted for culture, but the usual formalin preservative will kill any organism, necessitating prompt processing in saline.
Discoid lupus erythematosus (DLE) can be purely cutaneous (as seen here) or can be a manifestation of more serious systemic lupus. In any case, it is an autoimmune process, made worse by the sun, and can be chronic (though this case is exceptional in that regard).
This patient’s chance of developing systemic lupus erythematosus is slight, at most, since his antinuclear antibody test was negative. But his lifetime risk for another autoimmune disease is high.
TREATMENT
DLE is usually treated successfully with a combination of sun avoidance and a course of oral hydroxychloroquine (200 mg QD to bid, depending on the patient’s body habitus and the severity of the disease). Given the advanced state of this patient’s condition, he received the more frequent dosage, which should yield positive results. However, he will likely be on this regimen for some time.

Since the fourth grade, this 22-year-old African-American man has had facial lesions that, although constantly present, worsen in the summer. The problem is so severe that it has greatly affected his quality of life: In school and in his neighborhood, he has been subjected to rumors that his condition might be contagious. Despite numerous treatment attempts—including topical and oral anti-acne medications, topical and oral antifungal medications, and oral antibiotics—the condition has persisted. Once, at his mother’s urging, the patient even sought the assistance of a faith healer at a religious revival. Initially seen by a primary care provider at a free clinic, he was then referred to a dermatology clinician at the same facility. History taking reveals that the lesions are asymptomatic and appear in additional locations (eg, arms, ears, and neck). The patient denies any family history of similar problems, as well as persistent fever, cough, or shortness of breath. Lab studies obtained by his primary care provider, including a complete blood count and chem screen, were within normal limits. Most of the lesions on the patient’s face are round areas of slightly erythematous erosion covered by eschar. They range in size from 3 mm to more than 1 cm. Focal postinflammatory hyperpigmentation is noted (a common finding in those with type V/VI skin). Focal hyperpigmentation is also seen on both ears, in some cases with scaling and faint erosion on the surface. A KOH prep is performed with scale collected from perilesional skin; results are negative for fungal elements. There are no palpable nodes in the adjacent nodal locations. Two punch biopsies are done, with samples taken from the active margins of the lesions. One is submitted for routine H&E (hematoxylin and eosin) handling and the other in saline for bacterial, acid-fast bacilli (AFB), and fungal cultures. The biopsy shows hyperkeratosis, follicular plugging, and epidermal atrophy. Marked vacuolar degeneration of the dermoepidermal junction is also noted, along with mucin deposition. Stains for bacteria, AFB, and fungi yield negative results.

Woman Assaulted on Street
The chest radiograph demonstrates a massive amount of soft tissue and subcutaneous emphysema extending from the neck down through the chest and into the lower chest/upper abdomen. In addition, there are several fractured posterior ribs bilaterally. No large pneumothorax or pneumomediastinum is noted.
Because of the extent and mechanism of injury, CT of the chest, abdomen, and pelvis had already been ordered. Arrangements were also made for the patient to be admitted to the ICU for closer observation.

A 40-year-old woman is brought in by EMS for evaluation of injuries secondary to being assaulted. She was out walking late last night when she was approached by two men who pushed her to the ground and began punching and kicking her repeatedly on her face, chest, and back. She is primarily complaining of chest wall and back pain. Her medical history is significant for hypertension, diet-controlled diabetes, and “some sort of heart problem” for which she takes medication. Surgical history is significant for hysterectomy, cholecystectomy, and appendectomy. She smokes more than a pack of cigarettes per day and consumes at least a six-pack of beer daily. Initial exam shows an anxious female who appears somewhat uncomfortable but is in no obvious distress. Her vital signs are as follows: blood pressure, 130/88 mm Hg; pulse, 120 beats/min; respiratory rate, 22 breaths/min; and O2 saturation, 100% on room air. Physical exam reveals extensive facial/periorbital swelling, as well as swelling in the neck. Some splinting is noted. There is extensive crepitus noted within the soft tissue of the face, neck, and chest wall. Also, there is moderate tenderness bilaterally over the ribs. Chest radiograph is obtained (shown). What is your impression?