User login
A History of Observation Hospital Stays in Pediatrics

Physicians once admitted patients to observation status when they were unsure whether the hospitalization ultimately would lead to a stay longer than 24 hours. In 1978, InterQual published its first severity-of-illness/intensity-of-service criteria for evaluating appropriateness of admission and level of service.1 These originated from a government contract to develop a quality-assurance program addressing variability in length of stay that became apparent after Medicare was implemented in 1967. Charles Jacobs, an attorney who was once an associate director at The Joint Commission, assembled a team that once worked out of an apartment in Chicago that would become InterQual.2 Over the years, InterQual evolved and was eventually acquired by McKesson.
In a study published in the May 2013 issue of Pediatrics, Fieldston et al used data obtained from the Pediatric Health Information System (PHIS) 2010 database to demonstrate that observation-status designation is used inconsistently in pediatric hospitals.3 The researchers showed that costs for observation-status stays overlap substantially with costs for inpatient-status stays. Although the results of this study may be disappointing to those who seek to reduce cost or increase value, they should not be surprising.
A previous study from several of the same authors showed that significant variation exists in how observation status is assigned versus inpatient status.4 Observation status was found to be based on duration of expected treatment or on level of care criteria (i.e. InterQual or Millman). In fact, within an individual hospital, variation could be present in the assignment of status between individual payors. For example, a short stay for asthma exacerbation could be assigned inpatient status for one payor and observation status for another payor. Patients likely received the same care and costs, especially in hospitals with standardized-treatment-care plans or protocols.
In that same study, the authors discovered that only 12 of 31 (39%) freestanding children’s hospitals had a designated observation unit. Many hospitals reported that observation patients were scattered across the ED and inpatient units (e.g. “virtual” observation unit). A majority of hospitals (14 of 16) reported that there were no differences in the delivery of clinical care to patients admitted under virtual observation compared with inpatient status. They concluded that observation status largely is a common billing designation that does not represent care in a distinct unit, nor does it represent a difference in clinical care compared with inpatient status. Therefore, it would not seem surprising to discover that the costs for observation stays are similar to those for inpatient stays.
In a second study by the same authors, they examined trends in observation-status utilization, again using the PHIS database. Patient characteristics and outcomes in observation status were compared to those of inpatient status. During the study period, with a stable Case Mix Index (CMI), an increase in proportion of patients in observation status occurred concurrently with a corresponding decrease in proportion of patients in inpatient status. For short stays, common diagnoses in observation status were similar to those for inpatient status.5 The data suggest that the patients received similar clinical care and therefore similar cost of care for these short stays.
Given the variation in how observation status is determined, and the significant overlap in clinical care seen in observation status compared with inpatient status, it would stand to reason that costs for observation stays would be similar to those for inpatients stays, especially for short stays of common diagnoses. Moving forward, the challenge for the medical community is to decide how to consistently determine which patients or clinical conditions are appropriate for observation status. Addressing additional costs incurred by patients and their families that accompany the designation of observation status will be critical. Only then can pediatric hospitalists be expected to optimize the use of observation status, with the goals of decreasing clinical costs and improving quality outcomes.
Dr. O’Callaghan is a pediatric hospitalist and clinical assistant professor of pediatrics at Seattle Children’s Hospital and the University of Washington School of Medicine. He also is a Team Hospitalist member.
References
- Mitus AJ. The birth of InterQual: evidence-based decision support criteria that helped change healthcare. Prof Case Manag. 2008;13:228-233.
- Fieldston ES, Shah SS, Hall M, et al. Resource utilization for observation-status stays at children’s hospitals. Pediatrics. 2013;131:1050-1058.
- Macy ML, Hall M, Shah SS, et al. Differences in designations of observation care in US freestanding children’s hospitals: are they virtual or real? J Hosp Med. 2012;7:287-293.
- Macy ML, Hall M, Shah SS, et al. Pediatric observation status: are we overlooking a growing population in children’s hospitals? J Hosp Med. 2012;7:530-536.
How to Manage Pain in Patients with Renal Insufficiency or End-Stage Renal Disease on Dialysis?

Case
A 70-year-old male with ESRD on hemodialysis presents with methicillin-resistant Staphylococcus aureus (MRSA) bacteremia and ankle pain after a fall. An MRI of his ankle is negative, and he is started on acetaminophen and lidocaine patches, which result in adequate pain relief of the ankle. He later develops significant neuropathic pain in both arms, and a CT scan of the cervical spine reveals a cervical abscess and osteomyelitis. The patient desires pain relief but adamantly refuses narcotics, stating: “I don’t want to get addicted.” How can his pain be managed?
Overview
Pain is a common problem in patients with renal insufficiency and end-stage renal disease (ESRD) and can have a significant effect on the patient’s quality of life.1 When assessing a patient’s pain, assess both the severity of the pain (such as on an analogue scale, 0-10) and the characteristics of the pain. Pain is most commonly characterized as nociceptive, neuropathic, or both. Nociceptive pain can be further classified as arising from either somatic or visceral sources, and is often described as dull, throbbing, cramping, and/or pressurelike.1 Neuropathic pain is often described as tingling, numbing, burning, and/or stabbing.
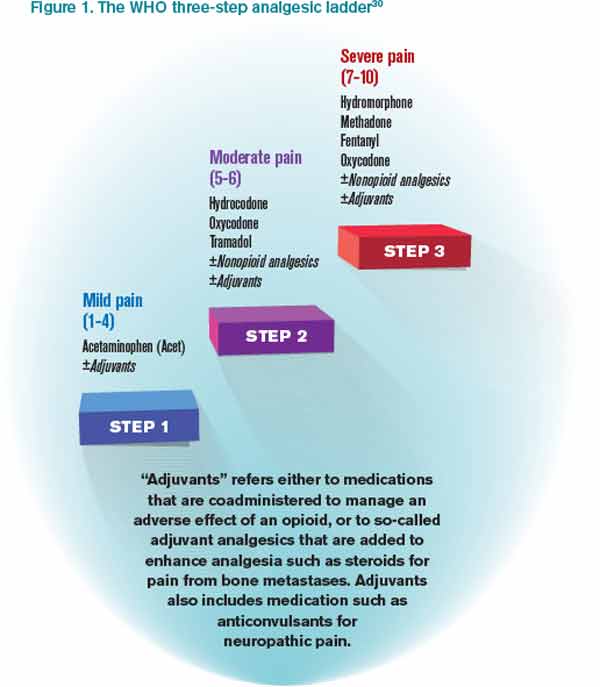
It is a challenge to manage pain in patients with renal insufficiency and dialysis. Renal insufficiency affects the pharmacokinetic properties of most pain medications, including their distribution, clearance, and excretion. The magnitude of the effect of renal insufficiency on drug metabolism varies depending on the agent itself, its metabolite, and the extent of renal failure.3 Multiple factors should be considered when prescribing pain medications for patients on dialysis, including the properties of the parent drug and its metabolites; the physical properties of the dialysis equipment, such as the filter pore size, the flow rate, and the efficiency of the technique used; and the dialysis method (intermittent versus continuous).3 Table 1 provides the recommended dosing of the most commonly prescribed agents, based on the degree of renal impairment. A modified World Health Organization (WHO) ladder has been suggested to treat pain in patients with ESRD, which can lead to effective pain relief in as many as 96% of patients (see Figure 1).2

*Beginning dose: If switching from IR to ER, calculate 24-hour total dose.
**For patients with creatinine clearances (CrCl) of 15 mL/min or less, the daily dosage should be adjusted proportionally (e.g. patients with a CrCl of 7.5 mL/min should receive one-half the dose of a patient with a CrCl of 15 mL/min).
Review of Data
Nonopioid options. Nonopioids, such as acetaminophen and NSAIDs, have no associated tolerance but have a ceiling effect for analgesia, and NSAIDs are associated with dose-dependent acute renal failure, gastrointestinal ulceration and bleeding, and cardiac events. The nonopioids that are considered safe options in patients with renal insufficiency include acetaminophen, ibuprofen, and fenoprofen (Nalfon). However, in the elderly, American Geriatric Society (AGS) guidelines currently recommend avoiding all NSAIDs due to their safety profile in the geriatric population.4 Although all NSAIDs can potentially be used for pain, selected NSAIDs with an FDA indication for acute or chronic pain were included for this review.
Acetaminophen (APAP) is a dialyzable compound that is metabolized in the liver to five inactive metabolites. The terminal elimination half-life of its sulfate and glucuronide metabolites are prolonged in patients with renal failure; therefore, the dosing interval of APAP should be increased to six to eight hours in renally impaired patients.5,6,7 Overall, acetaminophen is considered one of the safest agents to use for the treatment of pain, in renal patients and otherwise, as long as dosing is below the minimal daily dose (see Table 1).
Ibuprofen is metabolized in the liver to inactive compounds. It does not accumulate in renal insufficiency, and two of the inactive compounds are dialyzable.8 It is considered a safe option for the treatment of pain in patients with renal insufficiency or dialysis.9
Fenoprofen is metabolized in the liver to inactive compounds. Renal impairment is likely to cause the accumulation of the inactive metabolites but not the parent compound, so dose reduction is not necessary with the use of this agent in renal insufficiency or dialysis.6
Mefenamic acid (Ponstel) is metabolized in the liver. Mefenamic acid can further deteriorate renal function in patients with underlying renal disease.12 However, the nephrotoxic potential of this agent is of little consideration in ESRD patients on dialysis, and therefore no dosage adjustments are necessary in these patients.6
Ketoprofen is metabolized in the liver, where approximately 80% of the dose is excreted in the urine as a glucuronide metabolite. Dose reduction is recommended in renal insufficiency and dialysis, as it not dialyzable.8
Ketorolac accumulates in renal insufficiency; therefore, it is contraindicated in these patients and in patients at risk for renal failure, including those with volume depletion.10 Ketorolac is unlikely to be removed by dialysis and so should be avoided.10,11
Naproxen is metabolized in the liver to inactive compounds. Use of naproxen is not recommended in patients with moderate to severe renal impairment. If therapy must be initiated, close monitoring of the patient’s renal function is recommended.13
Celecoxib is the only cyclooxygenase-2 (COX-2) inhibitor available in the U.S. It is metabolized extensively by the liver and is unlikely to be removed by dialysis. Therefore, use of COX-2 inhibitors should be avoided in severe renal impairment and in those on dialysis.14,15
Opioid options. The use of opioids in the renally impaired population is challenging, as one must balance opioid-related adverse events with adequate pain control. As such, it is recommended to start with lower-than-recommended doses and slowly titrate up the dose while extending the dosing interval. This will help limit adverse effects, such as respiratory depression and hypotension.3
Hydrocodone is metabolized to hydromorphone (Dilaudid), which is then metabolized to its major metabolite hydromorphine-3-glucuronide (H3G) and minor metabolite hydromorphine-6-hydroxy, all of which are excreted renally along with the parent compound. H3G has no analgesic properties, but it can potentially cause neuroexcitation, agitation, confusion, and hallucination. Hydromorphone has been used safely in patients with renal insufficiency and dialysis, as it is expected to be dialyzable. 16,17
Tramadol is metabolized in the liver, producing one active compound. Approximately 30% of the tramadol dose is excreted unchanged in the urine, whereas 60% of the dose is excreted as metabolites. It is recommended to reduce the dose and increase the dosing interval in patients with renal insufficiency, but tramadol is generally well-tolerated in patients with renal insufficiency and dialysis. It is significantly removed by hemodialysis; therefore, redosing after a session may be necessary.18,19
Oxycodone can be used in patients with mild to moderate renal insufficiency but should be used at reduced dosing; it has been associated with significant sedation with usual doses in renal failure patients.16 Its use is generally not recommended in dialysis patients due to lack of data.3
Methadone and its metabolites are excreted in the urine and feces. Methadone has been used safely in patients with renal insufficiency, but it is poorly removed by dialysis and no specific recommendations are available regarding its dosing in dialysis.3,16
Fentanyl is primarily metabolized in the liver to inactive metabolites. Fentanyl clearance is reduced in patients with moderate to severe uremia (BUN >60 mg/dL). It is not expected that fentanyl be dialyzable because of its pharmacokinetic properties (high protein-binding, low water solubility, high molecular weight, and high volume of distribution). Data suggests that fentanyl can be used at usual doses in mild to moderate renal insufficiency and in dialysis patients, although reduced doses may be prudent. Such patients should be monitored for signs of gradual accumulation of the parent drug.3,16
Morphine is metabolized in the liver to morphine-6-glucuronide (M6G) and morphine-3-glucuronide (M3G), all of which are excreted renally, along with the parent compound. Only M6G has analgesic properties, and when it accumulates, it can lead to CNS depression. M3G is associated with behavioral excitation, a side effect that is further magnified in patients with renal insufficiency. Although morphine is dialyzable, it should generally be avoided in patients with any level of renal insufficiency.16,17,20,21
Codeine is metabolized to several active metabolites, all of which are renally excreted. Lower-than-usual doses are recommended in patients with renal insufficiency, and it should be avoided altogether in dialysis patients.3,16
Meperidine is metabolized in the liver to various metabolites, primarily normeperidine, which is toxic and has a long half-life, five to 10 times longer then meperidine. Meperidine should not be used in patients with renal insufficiency or dialysis.3
Adjunctive therapeutic options. Lidocaine patches currently are only FDA-indicated for postherpetic neuralgia but are used for a wide variety of local pain syndromes. Absorption of lidocaine is determined by the duration of application and the surface area over which it is applied. There is no appreciable accumulation of lidocaine or its metabolites in renal insufficiency; therefore, dose adjustments are not required.22,23
Gabapentin is FDA-indicated for partial seizures and postherpetic neuralgia but is also used for a wide variety of neuropathic pain syndromes, including postoperative pain.24 Gabapentin is not metabolized and is excreted in the urine unchanged. Renal clearance of gabapentin is reduced by 40% and the elimination half-life is increased up to 52 hours in renal insufficiency, but it is dialyzable. Therefore, dose adjustments are required with gabapentin in patients with moderate to severe renal insufficiency, and supplemental doses should be administered in patients after receiving dialysis.25-27
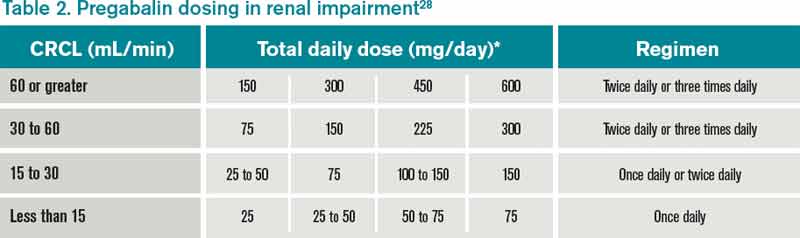
Pregabalin is structurally related to gabapentin and is indicated for a variety of neuropathic pain conditions. Pregabalin is 90% excreted unchanged in the urine, and approximately 50% of drug is removed after four hours of hemodialysis. Dose adjustments are required in patients with moderate to severe renal insufficiency, and supplemental doses should be administered in patients after receiving dialysis.28
Antidepressant options. Amitriptyline, nortryptiline, and desipramine are the tricyclic antidepressants (TCAs) commonly used for neuropathic pain. TCAs are metabolized in the liver to inactive metabolites, with the exception of amitriptyline, which is metabolized to nortryptiline. Common side effects reported with TCAs include postural hypotension and anticholinergic side effects, such as constipation, urinary retention, blurred vision, dry mouth, delirium, and sedation. It is unlikely that the TCAs can be removed by dialysis. It is suggested that the dosage be reduced in renal insufficiency and that anticholinergic side effects be monitored.29
Back to the Case
The patient’s ankle pain was controlled with acetaminophen and lidocaine patches. For the neuropathic pain in his upper extremities, tramadol was started at 25 mg oral every 12 hours and increased to 50 mg oral every eight hours (below the maximum of 200 mg a day). The tramadol did not result in adequate pain relief, so gabapentin 100 mg at bedtime was initiated, then increased to twice daily over three days with some relief.
A geriatric consult was obtained to help educate him regarding addiction to opioids, as well as to explore goals of care, but he continued to insist on the use of a non-narcotic regimen for his pain.
Bottom Line
Pain management in patients with renal insufficiency and dialysis can be challenging, but there are a number of safe non-narcotic and narcotic pain regimens that can be safely used in this patient population.
Dr. Harisingani is a board-certified hospitalist at Long Island Jewish Medical Center in New Hyde Park, N.Y., and Drs. Saad and Cassagnol are assistant clinical professors at St. Johns University College of Pharmacy and Health Sciences in Jamaica, N.Y., and clinical pharmacy coordinators at Long Island Jewish Medical Center.
References
- Mid-Atlantic Renal Coalition and the Kidney End-of-Life Coalition. Clinical algorithm & preferred medications to treat pain in dialysis patients. Coalition for Supportive Care of Kidney Patients website. Available at: http://www.kidneysupportivecare.org/Physicians-Clinicians/Pain—Symptom-Management.aspx. Accessed Nov. 18, 2012.
- Barakzoy AS, Moss AH. Efficacy of the World Health Organization analgesic ladder to treat pain in end-stage renal disease. J Am Soc Nephrol. 2006;17(11):3198-3203.
- Johnson SJ. Opioid safety in patients with renal or hepatic dysfunction. Pain Treatment Topics website. Available at: http://pain-topics.org/pdf/Opioids-Renal-Hepatic-Dysfunction.pdf. Accessed Nov. 28, 2012.
- Ferrell B, Argoff CE, Epplin J, et al. American Geriatrics Society Panel on Pharmacological Management of Persistent Pain in Older Persons. Pharmacological management of persistent pain in older persons. J Am Geriatr Soc. 2009;57(8):1331-1346.
- Prescott LF, Speirs GC, Critchley JA, Temple RM, Winney RJ. Paracetamol disposition and metabolite kinetics in patients with chronic renal failure. Eur J Clin Pharmacol. 1989;36(3):291-297.
- Launay-Vacher V, Karie S, Fau JB, Izzedine H, Deray G. Treatment of pain in patients with renal insufficiency: the World Health Organization three-step ladder adapted. J Pain. 2006;6(3):137-148.
- Berg KJ, Djøseland O, Gjellan A, et al. Acute effects of paracetamol on prostaglandin synthesis and renal function in normal man and in patients with renal failure. Clin Nephrol. 1990;34:255-262.
- Delbarre F, Roucayrol JC, Amor B, et al. Pharmacokinetic study of ketoprofen (19.583 R.P.) in man using the tritiated compound. Scand J Rheumatol Suppl. 1976;1976(0):45-52.
- Shen CH, Hung CJ, Wu CC, Huang HW, Ho WM. Rhabdomyolysis-induced acute renal failure after morphine overdose—a case report. Acta Anaesthesiol Sin. 1999;37(3):159-162.
- Ketorolac tromethamine oral tablets [package insert]. St. Louis: Ethex Corp.: 2008.
- Brocks DR, Jamali F. Clinical pharmacokinetics of ketorolac tromethamine. Clin Pharmacokinet. 1992;23:415-427. Erratum in: Clin Pharmacokinet. 1999;24(3):270.
- Ponstel [package insert]. Alpharetta, GA: First Horizon Pharmaceutical Corp.; 2006.
- Naprosyn [package insert]. Nutley, NJ: Roche Laboratories Inc.; 2008.
- Celebrex [package insert]. New York: G.D. Searle LLC; 2011.
- Catella-Lawson F, McAdam B, Morrison BW, et al. Effects of specific inhibition of cyclooygenase-2 on sodium balance, hemodynamics, and vasoactive eicosanoids. J Pharmacol Exp Ther. 1999;289:735-741.
- Dean M. Opioids in renal failure and dialysis patients. J Pain Symptom Manage. 2004;28(5):497-504.
- Lee MA, Leng ME, Tiernan EJ. Retrospective study of the use of hydromorphone in palliative care patients with normal and abnormal urea and creatinine. Palliat Med. 2001;15(1):26-34.
- Gibson TP. Pharmacokinetics, efficacy, and safety of analgesia with a focus on tramadol HCI. Am J. Med. 1996;101(1A):47S-53S.
- Izzedine H, Launay-Vacher V, Abbara C, Aymard G, Bassilios N, Deray G. Pharmacokinetics of tramadol in a hemodialysis patient. Nephron. 2002;92(3):755-756.
- Hasselström J, Säwe J. Morphine pharmacokinetics and metabolism in humans. Enterohepatic cycling and relative contribution of metabolites to active opioid concentrations. Clin Pharmacokinet. 1993;24(4):344-354.
- Andersen G, Christrup L, Sjøgren P. Relationships among morphine metabolism, pain and side effects during long-term treatment: an update. J Pain Symptom Manage. 2003;25(1):74-91.
- Lidoderm [package insert]. Chadds Ford, PA: Endo Pharmaceuticals Inc.; 2010.
- Carter GT, Galer BS. Advances in the management of neuropathic pain. Phys Med Rehabil Clin N Am. 2001;12(2):447-459.
- Ho KY, Gan TJ, Habib AS. Gabapentin and postoperative pain—a systematic review of randomized controlled trials. Pain. 2006;15:126(1-3):91-101.
- Neurontin [package insert]. New York: Parke-Davis; 2010.
- Pandey CK, Priye S, Singh S, et al. Preemptive use of gabapentin significantly decreases postoperative pain and rescue analgesic requirements in laparoscopic cholecystectomy. Can J Anaesth. 2004;51(4):358-363.
- Srivastava U, Kumar A, Saxena S, et al: Effect of preoperative gabapentin on postoperative pain and tramadol consumption after minilap open cholecystectomy: a randomized double-blind, placebo-controlled trial. Eur J Anaesthesiol. 2010;27(N4):331-335.
- Lyrica [package insert]. New York: Pfizer Inc.; 2012.
- Broadbent A, Khor K, Heaney A. Palliation and chronic renal failure: opioid and other palliative medications—dosage guidelines. Progress in Palliative Care. 2003;11(4):183-190(8).
- Nayak-Rao S. Achieving effective pain relief in patients with chronic kidney disease: a review of analgesics in renal failure. J Nephrol. 2011;24(1):35-40.
- Wolters Kluwer Health. Facts & comparisons. Wolters Kluwer Health website. Available at: http://www.factsandcomparisons.com. Accessed Jan. 14, 2013.
- Lexicomp. Lexicomp Online. Lexicomp website. Available at: http://www.lexi.com/institutions/products/online/.
Case
A 70-year-old male with ESRD on hemodialysis presents with methicillin-resistant Staphylococcus aureus (MRSA) bacteremia and ankle pain after a fall. An MRI of his ankle is negative, and he is started on acetaminophen and lidocaine patches, which result in adequate pain relief of the ankle. He later develops significant neuropathic pain in both arms, and a CT scan of the cervical spine reveals a cervical abscess and osteomyelitis. The patient desires pain relief but adamantly refuses narcotics, stating: “I don’t want to get addicted.” How can his pain be managed?
Overview
Pain is a common problem in patients with renal insufficiency and end-stage renal disease (ESRD) and can have a significant effect on the patient’s quality of life.1 When assessing a patient’s pain, assess both the severity of the pain (such as on an analogue scale, 0-10) and the characteristics of the pain. Pain is most commonly characterized as nociceptive, neuropathic, or both. Nociceptive pain can be further classified as arising from either somatic or visceral sources, and is often described as dull, throbbing, cramping, and/or pressurelike.1 Neuropathic pain is often described as tingling, numbing, burning, and/or stabbing.
It is a challenge to manage pain in patients with renal insufficiency and dialysis. Renal insufficiency affects the pharmacokinetic properties of most pain medications, including their distribution, clearance, and excretion. The magnitude of the effect of renal insufficiency on drug metabolism varies depending on the agent itself, its metabolite, and the extent of renal failure.3 Multiple factors should be considered when prescribing pain medications for patients on dialysis, including the properties of the parent drug and its metabolites; the physical properties of the dialysis equipment, such as the filter pore size, the flow rate, and the efficiency of the technique used; and the dialysis method (intermittent versus continuous).3 Table 1 provides the recommended dosing of the most commonly prescribed agents, based on the degree of renal impairment. A modified World Health Organization (WHO) ladder has been suggested to treat pain in patients with ESRD, which can lead to effective pain relief in as many as 96% of patients (see Figure 1).2
*Beginning dose: If switching from IR to ER, calculate 24-hour total dose.
**For patients with creatinine clearances (CrCl) of 15 mL/min or less, the daily dosage should be adjusted proportionally (e.g. patients with a CrCl of 7.5 mL/min should receive one-half the dose of a patient with a CrCl of 15 mL/min).
Review of Data
Nonopioid options. Nonopioids, such as acetaminophen and NSAIDs, have no associated tolerance but have a ceiling effect for analgesia, and NSAIDs are associated with dose-dependent acute renal failure, gastrointestinal ulceration and bleeding, and cardiac events. The nonopioids that are considered safe options in patients with renal insufficiency include acetaminophen, ibuprofen, and fenoprofen (Nalfon). However, in the elderly, American Geriatric Society (AGS) guidelines currently recommend avoiding all NSAIDs due to their safety profile in the geriatric population.4 Although all NSAIDs can potentially be used for pain, selected NSAIDs with an FDA indication for acute or chronic pain were included for this review.
Acetaminophen (APAP) is a dialyzable compound that is metabolized in the liver to five inactive metabolites. The terminal elimination half-life of its sulfate and glucuronide metabolites are prolonged in patients with renal failure; therefore, the dosing interval of APAP should be increased to six to eight hours in renally impaired patients.5,6,7 Overall, acetaminophen is considered one of the safest agents to use for the treatment of pain, in renal patients and otherwise, as long as dosing is below the minimal daily dose (see Table 1).
Ibuprofen is metabolized in the liver to inactive compounds. It does not accumulate in renal insufficiency, and two of the inactive compounds are dialyzable.8 It is considered a safe option for the treatment of pain in patients with renal insufficiency or dialysis.9
Fenoprofen is metabolized in the liver to inactive compounds. Renal impairment is likely to cause the accumulation of the inactive metabolites but not the parent compound, so dose reduction is not necessary with the use of this agent in renal insufficiency or dialysis.6
Mefenamic acid (Ponstel) is metabolized in the liver. Mefenamic acid can further deteriorate renal function in patients with underlying renal disease.12 However, the nephrotoxic potential of this agent is of little consideration in ESRD patients on dialysis, and therefore no dosage adjustments are necessary in these patients.6
Ketoprofen is metabolized in the liver, where approximately 80% of the dose is excreted in the urine as a glucuronide metabolite. Dose reduction is recommended in renal insufficiency and dialysis, as it not dialyzable.8
Ketorolac accumulates in renal insufficiency; therefore, it is contraindicated in these patients and in patients at risk for renal failure, including those with volume depletion.10 Ketorolac is unlikely to be removed by dialysis and so should be avoided.10,11
Naproxen is metabolized in the liver to inactive compounds. Use of naproxen is not recommended in patients with moderate to severe renal impairment. If therapy must be initiated, close monitoring of the patient’s renal function is recommended.13
Celecoxib is the only cyclooxygenase-2 (COX-2) inhibitor available in the U.S. It is metabolized extensively by the liver and is unlikely to be removed by dialysis. Therefore, use of COX-2 inhibitors should be avoided in severe renal impairment and in those on dialysis.14,15
Opioid options. The use of opioids in the renally impaired population is challenging, as one must balance opioid-related adverse events with adequate pain control. As such, it is recommended to start with lower-than-recommended doses and slowly titrate up the dose while extending the dosing interval. This will help limit adverse effects, such as respiratory depression and hypotension.3
Hydrocodone is metabolized to hydromorphone (Dilaudid), which is then metabolized to its major metabolite hydromorphine-3-glucuronide (H3G) and minor metabolite hydromorphine-6-hydroxy, all of which are excreted renally along with the parent compound. H3G has no analgesic properties, but it can potentially cause neuroexcitation, agitation, confusion, and hallucination. Hydromorphone has been used safely in patients with renal insufficiency and dialysis, as it is expected to be dialyzable. 16,17
Tramadol is metabolized in the liver, producing one active compound. Approximately 30% of the tramadol dose is excreted unchanged in the urine, whereas 60% of the dose is excreted as metabolites. It is recommended to reduce the dose and increase the dosing interval in patients with renal insufficiency, but tramadol is generally well-tolerated in patients with renal insufficiency and dialysis. It is significantly removed by hemodialysis; therefore, redosing after a session may be necessary.18,19
Oxycodone can be used in patients with mild to moderate renal insufficiency but should be used at reduced dosing; it has been associated with significant sedation with usual doses in renal failure patients.16 Its use is generally not recommended in dialysis patients due to lack of data.3
Methadone and its metabolites are excreted in the urine and feces. Methadone has been used safely in patients with renal insufficiency, but it is poorly removed by dialysis and no specific recommendations are available regarding its dosing in dialysis.3,16
Fentanyl is primarily metabolized in the liver to inactive metabolites. Fentanyl clearance is reduced in patients with moderate to severe uremia (BUN >60 mg/dL). It is not expected that fentanyl be dialyzable because of its pharmacokinetic properties (high protein-binding, low water solubility, high molecular weight, and high volume of distribution). Data suggests that fentanyl can be used at usual doses in mild to moderate renal insufficiency and in dialysis patients, although reduced doses may be prudent. Such patients should be monitored for signs of gradual accumulation of the parent drug.3,16
Morphine is metabolized in the liver to morphine-6-glucuronide (M6G) and morphine-3-glucuronide (M3G), all of which are excreted renally, along with the parent compound. Only M6G has analgesic properties, and when it accumulates, it can lead to CNS depression. M3G is associated with behavioral excitation, a side effect that is further magnified in patients with renal insufficiency. Although morphine is dialyzable, it should generally be avoided in patients with any level of renal insufficiency.16,17,20,21
Codeine is metabolized to several active metabolites, all of which are renally excreted. Lower-than-usual doses are recommended in patients with renal insufficiency, and it should be avoided altogether in dialysis patients.3,16
Meperidine is metabolized in the liver to various metabolites, primarily normeperidine, which is toxic and has a long half-life, five to 10 times longer then meperidine. Meperidine should not be used in patients with renal insufficiency or dialysis.3
Adjunctive therapeutic options. Lidocaine patches currently are only FDA-indicated for postherpetic neuralgia but are used for a wide variety of local pain syndromes. Absorption of lidocaine is determined by the duration of application and the surface area over which it is applied. There is no appreciable accumulation of lidocaine or its metabolites in renal insufficiency; therefore, dose adjustments are not required.22,23
Gabapentin is FDA-indicated for partial seizures and postherpetic neuralgia but is also used for a wide variety of neuropathic pain syndromes, including postoperative pain.24 Gabapentin is not metabolized and is excreted in the urine unchanged. Renal clearance of gabapentin is reduced by 40% and the elimination half-life is increased up to 52 hours in renal insufficiency, but it is dialyzable. Therefore, dose adjustments are required with gabapentin in patients with moderate to severe renal insufficiency, and supplemental doses should be administered in patients after receiving dialysis.25-27
Pregabalin is structurally related to gabapentin and is indicated for a variety of neuropathic pain conditions. Pregabalin is 90% excreted unchanged in the urine, and approximately 50% of drug is removed after four hours of hemodialysis. Dose adjustments are required in patients with moderate to severe renal insufficiency, and supplemental doses should be administered in patients after receiving dialysis.28
Antidepressant options. Amitriptyline, nortryptiline, and desipramine are the tricyclic antidepressants (TCAs) commonly used for neuropathic pain. TCAs are metabolized in the liver to inactive metabolites, with the exception of amitriptyline, which is metabolized to nortryptiline. Common side effects reported with TCAs include postural hypotension and anticholinergic side effects, such as constipation, urinary retention, blurred vision, dry mouth, delirium, and sedation. It is unlikely that the TCAs can be removed by dialysis. It is suggested that the dosage be reduced in renal insufficiency and that anticholinergic side effects be monitored.29
Back to the Case
The patient’s ankle pain was controlled with acetaminophen and lidocaine patches. For the neuropathic pain in his upper extremities, tramadol was started at 25 mg oral every 12 hours and increased to 50 mg oral every eight hours (below the maximum of 200 mg a day). The tramadol did not result in adequate pain relief, so gabapentin 100 mg at bedtime was initiated, then increased to twice daily over three days with some relief.
A geriatric consult was obtained to help educate him regarding addiction to opioids, as well as to explore goals of care, but he continued to insist on the use of a non-narcotic regimen for his pain.
Bottom Line
Pain management in patients with renal insufficiency and dialysis can be challenging, but there are a number of safe non-narcotic and narcotic pain regimens that can be safely used in this patient population.
Dr. Harisingani is a board-certified hospitalist at Long Island Jewish Medical Center in New Hyde Park, N.Y., and Drs. Saad and Cassagnol are assistant clinical professors at St. Johns University College of Pharmacy and Health Sciences in Jamaica, N.Y., and clinical pharmacy coordinators at Long Island Jewish Medical Center.
References
- Mid-Atlantic Renal Coalition and the Kidney End-of-Life Coalition. Clinical algorithm & preferred medications to treat pain in dialysis patients. Coalition for Supportive Care of Kidney Patients website. Available at: http://www.kidneysupportivecare.org/Physicians-Clinicians/Pain—Symptom-Management.aspx. Accessed Nov. 18, 2012.
- Barakzoy AS, Moss AH. Efficacy of the World Health Organization analgesic ladder to treat pain in end-stage renal disease. J Am Soc Nephrol. 2006;17(11):3198-3203.
- Johnson SJ. Opioid safety in patients with renal or hepatic dysfunction. Pain Treatment Topics website. Available at: http://pain-topics.org/pdf/Opioids-Renal-Hepatic-Dysfunction.pdf. Accessed Nov. 28, 2012.
- Ferrell B, Argoff CE, Epplin J, et al. American Geriatrics Society Panel on Pharmacological Management of Persistent Pain in Older Persons. Pharmacological management of persistent pain in older persons. J Am Geriatr Soc. 2009;57(8):1331-1346.
- Prescott LF, Speirs GC, Critchley JA, Temple RM, Winney RJ. Paracetamol disposition and metabolite kinetics in patients with chronic renal failure. Eur J Clin Pharmacol. 1989;36(3):291-297.
- Launay-Vacher V, Karie S, Fau JB, Izzedine H, Deray G. Treatment of pain in patients with renal insufficiency: the World Health Organization three-step ladder adapted. J Pain. 2006;6(3):137-148.
- Berg KJ, Djøseland O, Gjellan A, et al. Acute effects of paracetamol on prostaglandin synthesis and renal function in normal man and in patients with renal failure. Clin Nephrol. 1990;34:255-262.
- Delbarre F, Roucayrol JC, Amor B, et al. Pharmacokinetic study of ketoprofen (19.583 R.P.) in man using the tritiated compound. Scand J Rheumatol Suppl. 1976;1976(0):45-52.
- Shen CH, Hung CJ, Wu CC, Huang HW, Ho WM. Rhabdomyolysis-induced acute renal failure after morphine overdose—a case report. Acta Anaesthesiol Sin. 1999;37(3):159-162.
- Ketorolac tromethamine oral tablets [package insert]. St. Louis: Ethex Corp.: 2008.
- Brocks DR, Jamali F. Clinical pharmacokinetics of ketorolac tromethamine. Clin Pharmacokinet. 1992;23:415-427. Erratum in: Clin Pharmacokinet. 1999;24(3):270.
- Ponstel [package insert]. Alpharetta, GA: First Horizon Pharmaceutical Corp.; 2006.
- Naprosyn [package insert]. Nutley, NJ: Roche Laboratories Inc.; 2008.
- Celebrex [package insert]. New York: G.D. Searle LLC; 2011.
- Catella-Lawson F, McAdam B, Morrison BW, et al. Effects of specific inhibition of cyclooygenase-2 on sodium balance, hemodynamics, and vasoactive eicosanoids. J Pharmacol Exp Ther. 1999;289:735-741.
- Dean M. Opioids in renal failure and dialysis patients. J Pain Symptom Manage. 2004;28(5):497-504.
- Lee MA, Leng ME, Tiernan EJ. Retrospective study of the use of hydromorphone in palliative care patients with normal and abnormal urea and creatinine. Palliat Med. 2001;15(1):26-34.
- Gibson TP. Pharmacokinetics, efficacy, and safety of analgesia with a focus on tramadol HCI. Am J. Med. 1996;101(1A):47S-53S.
- Izzedine H, Launay-Vacher V, Abbara C, Aymard G, Bassilios N, Deray G. Pharmacokinetics of tramadol in a hemodialysis patient. Nephron. 2002;92(3):755-756.
- Hasselström J, Säwe J. Morphine pharmacokinetics and metabolism in humans. Enterohepatic cycling and relative contribution of metabolites to active opioid concentrations. Clin Pharmacokinet. 1993;24(4):344-354.
- Andersen G, Christrup L, Sjøgren P. Relationships among morphine metabolism, pain and side effects during long-term treatment: an update. J Pain Symptom Manage. 2003;25(1):74-91.
- Lidoderm [package insert]. Chadds Ford, PA: Endo Pharmaceuticals Inc.; 2010.
- Carter GT, Galer BS. Advances in the management of neuropathic pain. Phys Med Rehabil Clin N Am. 2001;12(2):447-459.
- Ho KY, Gan TJ, Habib AS. Gabapentin and postoperative pain—a systematic review of randomized controlled trials. Pain. 2006;15:126(1-3):91-101.
- Neurontin [package insert]. New York: Parke-Davis; 2010.
- Pandey CK, Priye S, Singh S, et al. Preemptive use of gabapentin significantly decreases postoperative pain and rescue analgesic requirements in laparoscopic cholecystectomy. Can J Anaesth. 2004;51(4):358-363.
- Srivastava U, Kumar A, Saxena S, et al: Effect of preoperative gabapentin on postoperative pain and tramadol consumption after minilap open cholecystectomy: a randomized double-blind, placebo-controlled trial. Eur J Anaesthesiol. 2010;27(N4):331-335.
- Lyrica [package insert]. New York: Pfizer Inc.; 2012.
- Broadbent A, Khor K, Heaney A. Palliation and chronic renal failure: opioid and other palliative medications—dosage guidelines. Progress in Palliative Care. 2003;11(4):183-190(8).
- Nayak-Rao S. Achieving effective pain relief in patients with chronic kidney disease: a review of analgesics in renal failure. J Nephrol. 2011;24(1):35-40.
- Wolters Kluwer Health. Facts & comparisons. Wolters Kluwer Health website. Available at: http://www.factsandcomparisons.com. Accessed Jan. 14, 2013.
- Lexicomp. Lexicomp Online. Lexicomp website. Available at: http://www.lexi.com/institutions/products/online/.
American College of Gastroenterology Releases C. Diff Recommendations
Clostridium difficile infection (CDI) is a common and costly bacterial illness in hospitalized patients, involving 1% of U.S. hospital stays with an aggregate cost of $8.2 billion annually.1 The spore-forming, gram-positive bacillus is spread by the fecal-oral route; in health-care settings, it is often transmitted by hand carriage and contamination of environmental surfaces. C. diff produces toxins that can cause a spectrum of diseases, including asymptomatic carriage, mild to severe diarrhea, colitis, and pseudomembranous colitis, which in severe cases can lead to sepsis, colectomy, or death.
CDI is defined as the acute onset of diarrhea in a patient with documented toxigenic C. diff or C. diff toxin, without any other clear cause of diarrhea.2 In the past decade, CDI has increased in frequency and severity, with most experts thinking it is related to a particularly virulent strain known as BI/NAP1/027.3 Antibiotic exposure is the most significant and modifiable risk factor for CDI, with increasing age, gastric acid suppression, and immunocompromised states also placing patients at increased risk for developing infection.
Guideline Analysis
In February, the American College of Gastroenterology (ACG) released guidelines for diagnostic testing and pharmacologic therapy for CDI, management of complicated and recurrent disease, and infection control and prevention.2 Previous recommendations for the prevention, diagnosis, and treatment of CDI have been provided by the European Society of Clinical Microbiology and Infectious Diseases (ESCMID) and a collaboration of the Society for Healthcare Epidemiology of America (SHEA) and the Infectious Diseases Society of America (IDSA).4,5 Recommendations addressing CDI in infants and children are also available.6 The 2013 ACG guidelines are the first from this group to address CDI and are intended to supplement previously published guidelines.
Diagnostic testing. The ACG guidelines emphasize that only stools from patients with diarrhea be tested for C. diff and/or its toxin. Colonization with C. diff is common, and performing tests in asymptomatic patients may complicate clinical care. Rarely, patients with CDI will develop ileus, and in those cases, rectal swab may be performed, but in nearly all circumstances, only diarrheal stools warrant testing. The authors also strongly discourage repeat testing after a negative test and testing for cure following treatment and resolution of symptoms. All of these recommendations are consistent with the SHEA-IDSA guidelines and reflect moderate- to high-quality evidence.
Recognizing that diagnostic testing for C. diff continues to evolve, the ACG makes specific recommendations regarding the use of newer tests, such as nucleic acid amplification and glutamate dehydrogenase detection. These are favored over toxin A and B enzyme immunoassay testing due to higher sensitivity.
Management of mild, moderate, and severe CDI. As with prior guidelines, the 2013 ACG guidelines stratify treatment recommendations by disease severity. Mild to moderate disease, which includes diarrhea only (mild) or diarrhea with signs and symptoms not meeting criteria for severe or complicated CDI (moderate), should be treated with metronidazole 500 mg orally three times daily for 10 days. Oral vancomycin should only be used in patients with mild to moderate disease who fail to respond after five to seven days of metronidazole or in those who are intolerant to metronidazole, or pregnant or breastfeeding. Although fidaxomicin is FDA-approved to treat mild to moderate CDI, the ACG does not make a formal recommendation on its use, given its high cost and limited data to support its effectiveness.
The ACG defines severe disease as CDI in patients with albumin <3 g/dL, and either WBC ≥15,000 cells/mm3 or abdominal tenderness. Though this definition of severe disease differs from the ESCMID and SHEA-IDSA definitions, which include elevated creatinine (>50% greater than premorbid level) instead of low albumin, the treatment recommendation is the same: vancomycin 125 mg orally four times daily for 10 days. While vancomycin and metronidazole are equally effective in mild to moderate CDI, there is some evidence to suggest that vancomycin is more effective in severe disease.7
Regardless of disease severity, one of the strongest recommendations is to discontinue any inciting antibiotics. This point, along with the recommendation to avoid anti-peristaltic agents, has also been emphasized in prior guidelines. Additionally, the authors note that although providers commonly prescribe treatment for 14 days, there is no evidence to suggest that a 14-day treatment course is more efficacious than a 10-day course for either metronidazole or vancomycin.
Management of severe and complicated CDI. Severe and complicated disease refers to CDI in patients meeting at least one of the following criteria: admission to the ICU, hypotension, fever ≥38.5°C, ileus or significant abdominal distention, mental status changes, WBC ≥35,000 or <2,000 cells/mm3, serum lactate >2.2 mmol/L, or end-stage organ failure. This definition is more specific than the SHEA-IDSA guidelines, which categorize severe and complicated disease as situations where shock, ileus, or megacolon are present. The recommended treatment is combined therapy with oral vancomycin 125 mg four times daily, plus intravenous metronidazole 500 mg three times daily. Surgical consultation should be obtained in all patients with complicated CDI. Colectomy should be considered in patients with evidence of severe sepsis, leukocytosis of ≥50,000, lactate ≥5 mmol/L, and failure to improve with medical therapy.
Patients with ileus or history of bowel surgery in whom oral antibiotics may not reach the colon should have vancomycin per rectum (enema of 500 mg in 100 mL to 500 mL of normal saline every six hours) added to the above treatments, regardless of disease severity.
Management of recurrent CDI. Consistent with previously published guidelines, the ACG recommends that the first recurrence of CDI be treated with the same regimen that was used for the initial episode. Second recurrences should be treated with a pulsed oral vancomycin regimen. Data are lacking regarding specific taper regimens, but the ACG suggests vancomycin 125 mg four times daily for 10 days, followed by a 125 mg dose every three days for 10 doses. For additional recurrences, fecal microbiota transplant may be considered. Reports suggest that this practice is safe and effective, but data from randomized controlled trials are lacking.
There is limited evidence to support the use of other antibiotics (e.g. rifampin, rifamixin), probiotics, or immunotherapy in the prevention of recurrent CDI.
Management of CDI in patients with comorbid conditions. A unique feature of the 2013 ACG guidelines is the incorporation of recommendations for patient groups who are at elevated risk for developing CDI or associated complications. Patients with inflammatory bowel disease (IBD) are one such group, as they often have underlying colonic inflammation and ongoing immunosuppression. The authors recommend that patients presenting with IBD flares be tested for C. diff. Other immunocompromised populations, including patients with malignancy, exposure to chemotherapy or corticosteroids, organ transplantation, and cirrhosis, should also be tested for CDI when presenting with diarrheal illness. Similarly, pregnant and peripartum women are considered high-risk and should undergo early testing and prompt initiation of treatment for CDI in the setting of diarrhea.
Infection control and prevention. Like SHEA-IDSA, the ACG recommends a hospital-based infection control program, antibiotic stewardship, and strict use of contact precautions for patients with known or suspected CDI. Contact precautions should be continued at minimum for the duration of diarrhea. Patients should be placed in private rooms and disposable equipment should be used, when possible. Disinfection of environmental surfaces is critical, as the environment is a common source of nosocomial infection. Disinfectants should have an Environmental Protection Agency-registered C. diff sporicidal label claim or contain a minimum concentration of chlorine solution. Important: Hand-washing with soap and water is required, as alcohol-based antiseptics are not active against C. diff spores.
HM Takeaways
The 2013 ACG guidelines for the diagnosis, treatment, and prevention of CDI are generally consistent with previously published guidelines from ESCMID and SHEA-IDSA. Ongoing points of emphasis are the following:
- Only test patients with diarrhea;
- Do not repeat testing after a negative test or after completion of treatment;
- Promptly discontinue any inciting antibiotics;
- Avoid use of anti-peristaltic agents; and
- Treat based on disease severity.
Hospitalists should be aware of criteria that place patients into the severe and complicated category, and understand that initial treatment should be provided for a 10-day course. These guidelines also highlight the need for a high index of suspicion and low threshold for empiric treatment in immunocompromised patients.
Finally, hospitalists should be attentive to antibiotic stewardship and strictly adhere to contact precautions and hand hygiene with soap and water, as these behaviors have been shown to prevent and control CDI.
Dr. Cunningham Sponsler is a hospitalist in the section of hospital medicine at Vanderbilt University in Nashville, Tenn.
References 1. Lucado J, Gould C, Elixhauser A. Clostridium difficile infections (CDI) in hospital stays, 2009. Healthcare Cost and Utilization Project website. Available at: http://www.hcup-us.ahrq.gov/reports/statbriefs/sb124.pdf. Accessed June 17, 2013.
2. Surawicz CM, Brandt LJ, Binion DJ, et al. Guidelines for diagnosis, treatment and prevention of Clostridium difficile infections. Am J Gastroenterol. 2013;108:478-498.
3. Freeman J, Bauer MP, Baines SD, et al. The changing epidemiology of Clostridium difficile infections. Clin Microbiol Rev. 2010;23:529-549.
4. Bauer MP, Kuijper EJ, van Dissel JT. European Society of Clinical Microbiology and Infectious Diseases (ESCMID): treatment guidance for Clostridium difficile infection (CDI). Clin Microbiol Infect. 2009;15:1067-1079.
5. Cohen SH, Gerding DN, Johnson S, et al. Clinical practice guidelines for Clostridium difficile infection in adults: 2010 update by the Society for Healthcare Epidemiology of America (SHEA) and the Infectious Diseases Society of America (IDSA). Infect Control and Hosp Epidemiol. 2010;31:431-455.
6. Committee on Infectious Diseases. Clostridium difficile infection in infants and children. Pediatrics. 2013;131:196-200.
7. Zar FA, Bakkanagari SR, Moorthi KM, et al. A comparison of vancomycin and metronidazole for the treatment of Clostridium difficile-associated diarrhea, stratified by disease severity. Clin Infect Dis. 2007;45:302-307.
The Pros and Cons of Electronic Health Records

An electronic health record (EHR)—sometimes called an electronic medical record (EMR)—allows health-care providers to record patient information electronically instead of using paper records.1 It also has the capability to perform various tasks that can assist in health-care delivery while maintaining standards of practice. The Health Information Technology for Economic and Clinical Health (HITECH) Act, enacted under the American Recovery and Reinvestment Act of 2009 (Recovery Act), established a provision for incentive payments for eligible professionals (EPs), critical-access hospitals (CAHs), and eligible hospitals if they can demonstrate meaningful use of certified EHR technology:2
- The use of a certified EHR in a meaningful manner (e.g. e-prescribing);
- The use of certified EHR technology for electronic exchange of health information to improve quality of health care; and
- The use of certified EHR technology to submit clinical quality and other measures.
Eligible professionals must satisfy 20 of 25 meaningful-use objectives (15 required core objectives and five objectives chosen from a list of 10 menu-set objectives).3 Eligible hospitals and CAHs must achieve 19 of 24 objectives (14 required core objectives and five objectives chosen from a list of 10 menu-set objectives).3
It seems that any program implementation with the potential to generate new or additional payment also has the potential to generate new or additional scrutiny of its application to ensure the generated payment is appropriate.5 Issues with EHR that recently have been highlighted include copy-and-paste, pulling notes forward, and upcoding based on volume instead of necessity.
Consider the Case
A patient is admitted to the hospital for pain, warmth, and swelling in the left lower extremity; r/o deep vein thrombosis (DVT) versus cellulitis. The patient’s history includes peripheral vascular disease (PVD), chronic renal insufficiency (CRI), and allergic rhinitis (AR). Testing confirms DVT, and the patient begins anticoagulation therapy. To achieve a therapeutic balance and prevent adverse reactions, the hospitalist orders INR monitoring.
On admission, the complexity of the patient’s condition may be considered high given the nature of the presenting problem.4 The hospitalist receives extensive credit for developing a care plan involving differential diagnoses with additional testing in anticipation of confirming a diagnosis. The patient’s presenting problem elevates the risk of morbidity/mortality, while the determined course of anticoagulation therapy places the patient at increased (i.e. “high”) risk for bleeding and requires intensive monitoring for toxicity. In this instance, 99223 may be warranted if the documentation requirements corresponding to this visit level have been satisfied.
As subsequent hospital days ensue, the complexity of the patient’s condition may not be as high. Even though the risk of anticoagulation remains high, the number of diagnoses and/or data ordered/reviewed may be less extensive than the initial encounter. Therefore, without any new or additional factors, the overall complexity of decision-making may be more appropriately categorized as moderate or low (e.g. 99232 or 99231, respectively).4
Do not fall victim to shortcuts that may falsely ease the workload of the overburdened physician. For example, the patient’s co-existing conditions of PVD, CRI, and AR likely were addressed during the initial encounter for DVT with inclusion in the plan of care. When using an electronic documentation system, it might be possible to copy the previously entered information from the initial encounter into the current encounter to save time. However, the previously entered information could include elements that do not need to be re-addressed during a subsequent encounter (e.g., AR) or yield information involving care for conditions that are being managed concurrently by another specialist (e.g. CRI being managed by the nephrologist).
Leaving the pasted information unaltered, without modification, can misrepresent the patient’s condition or the care provided by the hospitalist during the subsequent encounter.
Preventative Measures
Documentation should support the service provided on a given date, and the information included in the entry should reflect the content that was rendered and/or considered for assessment and management. Information that is pulled forward or copied and pasted from a previous entry should be modified to demonstrate updated content and nonoverlapping care with relevance for that date.
Do not use coding tools, or EHR “service calculators,” that override medical decision-making to determine the service level. Determining the service level for a particular CPT code category depends upon the key components of history, exam, and medical decision-making (MDM).4 For some code categories, each of the three key components must meet the documentation guidelines for the corresponding visit level (i.e. initial hospital care, initial observation care, and consultations). If all three components do not satisfy the requirements for a particular visit level, code selection is determined by the lowest component. For example, the physician must select 99221 when documenting a detailed history despite having also documented a comprehensive exam and high complexity decision-making. In other code categories, coding principles require that only two key components need to meet the documentation guidelines (i.e. subsequent hospital care and subsequent observation care) for code selection.
More specifically, code selection is determined by the second-lowest component. For example, the physician may appropriately select 99233 when only documenting a brief history after having also documented a detailed exam and high complexity decision-making. Based on this “two of three” stipulation, 99233 is acceptable. Service calculators that override MDM as one of the two supporting components in subsequent care services could generate 99233 for a service involving a detailed history and a detailed exam but only low complexity decision-making. Such coding practice can leave the hospitalist vulnerable to external inquiries involving medical necessity and upcoding. Despite this “two component” technicality with subsequent services (99231-99233 and 99224-99226), MDM always should be one of the two key components considered during subsequent visit level selection as it most clearly conveys the medical necessity of the encounter.
References
- Centers for Medicare & Medicaid Services. The official web site for the Medicare and Medicaid electronic health records (EHR) incentive programs. Centers for Medicare & Medicaid Services website. Available at: http://www.cms.gov/Regulations-and-Guidance/Legislation/EHRIncentivePrograms/index.html?redirect=/ehrincentiveprograms/. Accessed March 10, 2013.
- Centers for Medicare & Medicaid Services. Frequently asked questions (FAQs). Centers for Medicare & Medicaid Services website. Available at: http://www.cms.gov/Regulations-and-Guidance/Legislation/EHRIncentivePrograms/FAQ.html. Accessed March 10, 2013.
- Centers for Medicare & Medicaid Services. Meaningful use. Centers for Medicare & Medicaid Services website. Available at: http://www.cms.gov/Regulations-and-Guidance/Legislation/EHRIncentivePrograms/Meaningful_Use.html. Accessed March 10, 2013.
- Abraham M, Ahlman J, Anderson C, Boudreau A, Connelly J. Current Procedural Terminology 2012 Professional Edition. Chicago: American Medical Association Press; 2011:13-17.
- U.S. Department of Health and Human Services. Office of Inspector General work plan fiscal year 2013. U.S. Department of Health and Human Services website. Available at: http://oig.hhs.gov/reports-and-publications/archives/workplan/2013/Work-Plan-2013.pdf. Accessed March 11, 2013.
Bundled-Payment Program Basics

With general agreement that health-care costs in the U.S. are unsustainable, the Centers for Medicare & Medicaid Services (CMS), through the Center for Medicare and Medicaid Innovation (CMMI), and the private sector are embarking on new approaches to cost containment. On the one hand, we have value-based purchasing (VBP), which rests on the existing fee-for-service system and aims for incremental change. On the other hand, we have accountable-care organizations (ACOs), which provide a global payment for a population of patients, and bundled-payment programs, which provide a single payment for an episode of care. These reimbursement models represent a fundamental change in how we pay for health care.
On a broad scale, ACOs may be further along in development than bundled-payment programs, even though pockets of bundling prototypes have existed for years. Examples include the Prometheus payment system, Geisinger’s ProvenCare, and CMS’ Acute Care Episode demonstration project, which bundled Part A (hospital) and Part B (doctors, others) payments for cardiac and orthopedic surgery procedures. Over the past two years, we have seen a dramatic uptick in bundling activity, including programs in a number of states (including Arkansas, California, and Massachusetts). Here at Baystate Health in Massachusetts, we kicked off a total-hip-replacement bundle with our subsidiary health plan in January 2011.


Perhaps most notably, bundled payments are part of the Affordable Care Act. The Bundled Payments for Care Improvement initiative, launched earlier this year by CMMI, is enrolling traditional Medicare patients in bundled-payment programs across the country at more than 400 health systems.
How Bundled Payments Work
Bundled-payment programs provide a single payment to hospitals, doctors, post-acute providers, and other providers (for home care, lab, medical equipment, etc.) for a defined episode of care. Most bundles encompass at least an acute hospital episode and physician payments for the episode; many include some period after hospitalization, covering rehabilitation at a facility or at home and doctors’ visits during recovery. Bundling goes beyond Medicare’s diagnosis-related group (DRG) payments, which reimburse hospitals for all elements of an inpatient hospital stay for a given diagnosis but do not include services performed by nonhospital providers.
How do the finances work in a bundled-payment program? A single price for an episode of care is determined based on historical performance, factoring in all the services one wishes to include in a bundle (e.g. hospital, doctor visits in hospital, home physical therapy, follow-up doctor visits, follow up X-ray and labs for a defined time period). If the hospital, doctors, and others in the bundle generate new efficiencies in care (e.g. due to better care coordination, less wasteful test ordering, or lower implant/device costs), the savings are then distributed to these providers. What if spending exceeds the predetermined price? In some instances, the health plan bears the financial risk; in other instances, the hospital, physicians, and other bundle providers must pay back the shortfall. Important to note is that all sharing of savings is contingent on attainment of or improvement in demonstrated quality-of-care measures relevant to the bundle. In the future, bundling will evolve from shared savings to a single prospective payment for a care episode.
For now, most bundles encompass surgical procedures, although CMMI is working with health systems on several medical bundles, including acute MI, COPD, and stroke. All of these bundles are initiated by an acute hospitalization. Other types of bundles exist, such as with chronic conditions or with post-acute care only. In Massachusetts, a pediatric asthma bundle is being implemented through Medicaid, covering that population for a year or longer. The aim is to redirect dollars that normally would pay for ED visits and inpatient care to pay for interventions that promote better control of the disease and prevent acute flare-ups that lead to hospital visits.
How Hospitalists Fit In
To date, there has been little discussion of how physicians other than the surgeons doing the procedure (most bundles are for surgeries) fit into the clinical or financial model underpinning the program. However, with most patients in surgical or medical bundles being discharged to home, we now recognize that primary-care physicians (PCPs) will be essential to the success of a bundle.
Similarly, with medically complex patients enrolling in surgical bundles, hospitalists will be essential to the pre- and perioperative care of these patients. Also, transitioning bundle patients to home or to a rehabilitation will benefit from the involvement of a hospitalist.
What You Can Do Today
Although this might seem abstract for hospitalists practicing in the here and now, there are compelling opportunities for hospitalists who get involved in bundled-payment programs. Here’s what I suggest:
Find out if your hospital or post-acute facility is participating in bundling by looking at a map of CMMI bundle programs here: http://innovation.cms.gov/initiatives/bundled-payments;
- Get a seat at the table working on the bundle; and
- Negotiate a portion of the bundle’s shared savings on the basis of 1) increased efficiency and quality resulting from hospitalist involvement and 2) hospitalist direct oversight of bundled patients in post-acute facilities (if you choose).
Post-acute care may be new for your hospitalist program. Bundling programs are an important new business case for hospitalists in this setting.
Dr. Whitcomb is medical director of healthcare quality at Baystate Medical Center in Springfield, Mass. He is co-founder and past president of SHM. Email him at [email protected].
With general agreement that health-care costs in the U.S. are unsustainable, the Centers for Medicare & Medicaid Services (CMS), through the Center for Medicare and Medicaid Innovation (CMMI), and the private sector are embarking on new approaches to cost containment. On the one hand, we have value-based purchasing (VBP), which rests on the existing fee-for-service system and aims for incremental change. On the other hand, we have accountable-care organizations (ACOs), which provide a global payment for a population of patients, and bundled-payment programs, which provide a single payment for an episode of care. These reimbursement models represent a fundamental change in how we pay for health care.
On a broad scale, ACOs may be further along in development than bundled-payment programs, even though pockets of bundling prototypes have existed for years. Examples include the Prometheus payment system, Geisinger’s ProvenCare, and CMS’ Acute Care Episode demonstration project, which bundled Part A (hospital) and Part B (doctors, others) payments for cardiac and orthopedic surgery procedures. Over the past two years, we have seen a dramatic uptick in bundling activity, including programs in a number of states (including Arkansas, California, and Massachusetts). Here at Baystate Health in Massachusetts, we kicked off a total-hip-replacement bundle with our subsidiary health plan in January 2011.
Perhaps most notably, bundled payments are part of the Affordable Care Act. The Bundled Payments for Care Improvement initiative, launched earlier this year by CMMI, is enrolling traditional Medicare patients in bundled-payment programs across the country at more than 400 health systems.
How Bundled Payments Work
Bundled-payment programs provide a single payment to hospitals, doctors, post-acute providers, and other providers (for home care, lab, medical equipment, etc.) for a defined episode of care. Most bundles encompass at least an acute hospital episode and physician payments for the episode; many include some period after hospitalization, covering rehabilitation at a facility or at home and doctors’ visits during recovery. Bundling goes beyond Medicare’s diagnosis-related group (DRG) payments, which reimburse hospitals for all elements of an inpatient hospital stay for a given diagnosis but do not include services performed by nonhospital providers.
How do the finances work in a bundled-payment program? A single price for an episode of care is determined based on historical performance, factoring in all the services one wishes to include in a bundle (e.g. hospital, doctor visits in hospital, home physical therapy, follow-up doctor visits, follow up X-ray and labs for a defined time period). If the hospital, doctors, and others in the bundle generate new efficiencies in care (e.g. due to better care coordination, less wasteful test ordering, or lower implant/device costs), the savings are then distributed to these providers. What if spending exceeds the predetermined price? In some instances, the health plan bears the financial risk; in other instances, the hospital, physicians, and other bundle providers must pay back the shortfall. Important to note is that all sharing of savings is contingent on attainment of or improvement in demonstrated quality-of-care measures relevant to the bundle. In the future, bundling will evolve from shared savings to a single prospective payment for a care episode.
For now, most bundles encompass surgical procedures, although CMMI is working with health systems on several medical bundles, including acute MI, COPD, and stroke. All of these bundles are initiated by an acute hospitalization. Other types of bundles exist, such as with chronic conditions or with post-acute care only. In Massachusetts, a pediatric asthma bundle is being implemented through Medicaid, covering that population for a year or longer. The aim is to redirect dollars that normally would pay for ED visits and inpatient care to pay for interventions that promote better control of the disease and prevent acute flare-ups that lead to hospital visits.
How Hospitalists Fit In
To date, there has been little discussion of how physicians other than the surgeons doing the procedure (most bundles are for surgeries) fit into the clinical or financial model underpinning the program. However, with most patients in surgical or medical bundles being discharged to home, we now recognize that primary-care physicians (PCPs) will be essential to the success of a bundle.
Similarly, with medically complex patients enrolling in surgical bundles, hospitalists will be essential to the pre- and perioperative care of these patients. Also, transitioning bundle patients to home or to a rehabilitation will benefit from the involvement of a hospitalist.
What You Can Do Today
Although this might seem abstract for hospitalists practicing in the here and now, there are compelling opportunities for hospitalists who get involved in bundled-payment programs. Here’s what I suggest:
Find out if your hospital or post-acute facility is participating in bundling by looking at a map of CMMI bundle programs here: http://innovation.cms.gov/initiatives/bundled-payments;
- Get a seat at the table working on the bundle; and
- Negotiate a portion of the bundle’s shared savings on the basis of 1) increased efficiency and quality resulting from hospitalist involvement and 2) hospitalist direct oversight of bundled patients in post-acute facilities (if you choose).
Post-acute care may be new for your hospitalist program. Bundling programs are an important new business case for hospitalists in this setting.
Dr. Whitcomb is medical director of healthcare quality at Baystate Medical Center in Springfield, Mass. He is co-founder and past president of SHM. Email him at [email protected].
Congressional Budget Office Says Health-Care Inflation Is Slowing
The Congressional Budget Office in May sharply lowered its projections for the next decade’s outlays on Medicare, Medicaid, and the extension of coverage for 25 million uninsured Americans under the Affordable Care Act.1
“During the past several years, health-care spending has grown much more slowly, both nationally and for federal programs, than it did historically and more slowly than CBO had projected,” according to the CBO report.
Health-care spending in 2012 was 5% below the amount the nonpartisan budgetary analysts had estimated in a 2010 projection for 2012. If these trends continue, commentators note, that could lessen budgetary pressures and perhaps strengthen the economy, as well as reduce the urgency for Congress to achieve a “grand bargain” confronting national debt issues.
However, CBO notes, budgetary shortfalls are expected to increase later this decade under the pressures of an aging population, expanded federal subsidies for health insurance, and the resumption of health-care cost inflation.
Larry Beresford is a freelance writer in San Francisco.
Reference
Technology Developers Encouraged to Make Hospital Pricing More Transparent
In June, the Robert Wood Johnson Foundation announced a national competition for technology developers to help consumers understand and utilize data for comparing the prices of hospital procedures. Winners of the foundation’s Hospital Price Transparency Challenge, to be announced later this year, will share $120,000 in prizes for intuitive, actionable tools leading to more transparent hospital pricing in two categories.
One category involves the creation of visual aids that would help consumers and others better understand the Centers for Medicare & Medicaid Services’ (CMS) hospital-cost data, which was released in May and compares widely variable hospital prices for 100 common inpatient procedures. The other category involves developing applications and tools that could help consumers price-shop.
The foundation is offering support and opportunities for submitters to interact with experts and technical innovators. The deadline for applications is Aug. 25.
Joint Commission Tackles Alarm-Fatigue Risks from Medical Devices

A Joint Commission Sentinel Event Alert released this spring tackles “alarm fatigue” resulting from the constant beeping of medical-device alarms and information being broadcast from these devices. If not properly managed, the proliferation of alarms can put hospitalized patients at serious risk because the barrage of warning noises can desensitize professional caregivers or distract them from truly critical alarms. U.S. Food and Drug Administration data show that 566 hospital deaths from 2005 to 2008 were alarm-related, while the Joint Commission’s own sentinel-events database lists 80 alarm-related deaths in the same period.
The commission urges hospital leaders to look at this serious patient-safety issue. “By making alarm safety a priority, lives can be saved,” said Ana McKee, MD, the commission’s executive vice president and chief medical officer.
Among its recommendations:
- Ensure that there is a process for safe alarm management and response in high-risk areas;
- Prepare an inventory of alarm-equipped medical devices in these high-risk areas;
- Regularly inspect, check, and maintain the devices; and
- Establish guidelines for alarm settings, including situations in which alarm signals are not clinically necessary.
The commission, which participated in a 2011 summit of national safety and medical-technology organizations seeking solutions to the problem, is considering the possible promulgation of a national patient-safety goal on alarm fatigue, a draft of which was field-tested in February and released for public comment.
Larry Beresford is a freelance writer in San Francisco.
Leadership Skills a Priority for Future Hospitalists
A common theme among abstracts presented at HM13 was the need for more leadership training, as current and future hospitalists take on bigger roles in their hospitalist groups and institutions.
In an oral abstract presentation at the annual meeting in May in National Harbor, Md., lead author Darlene Tad-y, MD, assistant professor of medicine at the University of Colorado School of Medicine in Aurora, described the Hospitalist Training Program Leaders Track (HTP-LT), which launched in 2012 for hospitalist residents interested in program-level leadership.1 Dr. Tad-y notes that a generation ago, one-third of hospitals were led by physician CEOs; today, that figure is only 4%, even though quality metrics suggest that clinical outcomes might be better at physician-led facilities.
Faculty at the University of Colorado were inspired to create the program after learning that graduates of its nine-year-old hospitalist residency program were being thrust into clinical, operational, and quality-improvement (QI) leadership positions. Most were forced to learn how to be a leader on the fly.
“That got us thinking: We should be more deliberate about leadership training and the gap around the development of hospitalist leaders,” says co-author Read Pierce, MD, HTP-LT director. “We started asking those in medical leadership positions: How did you learn leadership and what would you teach to residents in the pipeline?”
HTP-LT guides residents through an intensive curriculum offering mentorship and opportunities to observe, practice, and reflect upon clinical leadership in real-world settings. It emphasizes hospital operations, finance, and change management within large, complex organizations. All HTP-LT residents complete a leadership project.
The same faculty also developed the Young Hospitalist Academy, a summer program for medical students from across the country; the goal of the academy is to spur interest in hospital medicine at an earlier stage of medical training.
“We thought it’s never too early for medical students to start thinking about what it means to be a hospitalist and to be a medical leader,” Dr. Tad-y says.
Larry Beresford is a freelance writer in San Francisco.
Reference
Hospitalist Advocate Finds Niche in Hospital Medicine

Bryan Weiss, MBA, likes to say he’s “passionate” about HM. The twist? He isn’t even a practicing physician. Nevertheless, he’s been involved in medicine for 25 years, having worked with hospitals, health plans, and multispecialty groups before joining IPC: The Hospitalist Company in 2003. During his first few years working in the field, he realized the specialty had a bright future.
“I enjoy working with the hospitalists and assisting them to become the cornerstone of the hospitals they work in,” says Weiss, managing director of the consulting services practice at Irving, Texas-based MedSynergies. “Creating the open communications among the hospital administration, emergency room, nursing, case management, consultants, and PCPs—as well as moving the specialty forward with actionable, balanced scorecards—is the most satisfying component.”
Weiss previously was president of the hospitalist division at Hospital Physician Partners of Hollywood, Fla., and COO of inpatient services at Dallas-based EmCare. He graduated with a bachelor’s degree in business administration from California State University and earned his master’s degree from California Lutheran University.
He is one of nine new Team Hospitalist members, The Hospitalist’s volunteer group of editorial advisors. He sees challenges ahead for hospitalists, administrators, and the health-care system, but he also has faith the specialty will be up to the task.
“I think the incredibly rapid growth of the specialty is huge,” he says. “The acceptance of the specialty has gone from needing to explain what a hospitalist is to insurance companies and hospitals and other physicians to [knowing] the value of a hospitalist program and how disadvantaged a hospital is without a program.”

Question: As a nonphysician, explain your role in the health-care system and HM.
Answer: I want to make sure the hospitalist team truly operates as a team and not a bunch of physicians who happen to work in the same hospital. The bottom line is it is about the patient experience and how hospitalists will be pivotal as health care moves to more risk-based and population health.
Q: What is your biggest professional challenge?
A: Ensuring the alignment of the goals of the hospital and the hospitalists are translated to measurable outcomes is probably the biggest challenge in the current state of health care.
Q: What is your biggest professional reward?
A: The number of hospital administrators who value my contribution and commitment to making the hospitalist program at their facilities the best they can become.
Q: When you aren’t working, what is important to you?
A: My family time and the balance of work and life have become the most important as I have matured professionally.
Q: What’s next professionally?
A: I am doing my ideal professional position.
Q: If you had to do it all over again, what career would you be doing right now?
A: If I wasn’t an executive in healthcare, I would have probably been a lawyer since I contemplated law school over my MBA.
Q: What’s the best book you’ve read recently?
A: New Orleans Saints quarterback Drew Brees’ book, “Coming Back Stronger.” As an avid sports fan, I appreciate what this athlete experienced personally and professionally, and still was able to pick himself back up from situations that many of us would have struggled to overcome. He is one of the biggest class acts in sports and the book just solidified that opinion. We can apply what he says to our own lives and make ourselves better in what we do as leaders.
Q: How many Apple products (phones, iPods, tablets, iTunes, etc.) do you interface with in a given week?
A: I am constantly on my iPad and use iTunes regularly during my weekly travels. My cellphone is an Android, so only two Apple products, but I use Apple countless times a week.
Richard Quinn is a freelance author in New Jersey.
Bryan Weiss, MBA, likes to say he’s “passionate” about HM. The twist? He isn’t even a practicing physician. Nevertheless, he’s been involved in medicine for 25 years, having worked with hospitals, health plans, and multispecialty groups before joining IPC: The Hospitalist Company in 2003. During his first few years working in the field, he realized the specialty had a bright future.
“I enjoy working with the hospitalists and assisting them to become the cornerstone of the hospitals they work in,” says Weiss, managing director of the consulting services practice at Irving, Texas-based MedSynergies. “Creating the open communications among the hospital administration, emergency room, nursing, case management, consultants, and PCPs—as well as moving the specialty forward with actionable, balanced scorecards—is the most satisfying component.”
Weiss previously was president of the hospitalist division at Hospital Physician Partners of Hollywood, Fla., and COO of inpatient services at Dallas-based EmCare. He graduated with a bachelor’s degree in business administration from California State University and earned his master’s degree from California Lutheran University.
He is one of nine new Team Hospitalist members, The Hospitalist’s volunteer group of editorial advisors. He sees challenges ahead for hospitalists, administrators, and the health-care system, but he also has faith the specialty will be up to the task.
“I think the incredibly rapid growth of the specialty is huge,” he says. “The acceptance of the specialty has gone from needing to explain what a hospitalist is to insurance companies and hospitals and other physicians to [knowing] the value of a hospitalist program and how disadvantaged a hospital is without a program.”
Question: As a nonphysician, explain your role in the health-care system and HM.
Answer: I want to make sure the hospitalist team truly operates as a team and not a bunch of physicians who happen to work in the same hospital. The bottom line is it is about the patient experience and how hospitalists will be pivotal as health care moves to more risk-based and population health.
Q: What is your biggest professional challenge?
A: Ensuring the alignment of the goals of the hospital and the hospitalists are translated to measurable outcomes is probably the biggest challenge in the current state of health care.
Q: What is your biggest professional reward?
A: The number of hospital administrators who value my contribution and commitment to making the hospitalist program at their facilities the best they can become.
Q: When you aren’t working, what is important to you?
A: My family time and the balance of work and life have become the most important as I have matured professionally.
Q: What’s next professionally?
A: I am doing my ideal professional position.
Q: If you had to do it all over again, what career would you be doing right now?
A: If I wasn’t an executive in healthcare, I would have probably been a lawyer since I contemplated law school over my MBA.
Q: What’s the best book you’ve read recently?
A: New Orleans Saints quarterback Drew Brees’ book, “Coming Back Stronger.” As an avid sports fan, I appreciate what this athlete experienced personally and professionally, and still was able to pick himself back up from situations that many of us would have struggled to overcome. He is one of the biggest class acts in sports and the book just solidified that opinion. We can apply what he says to our own lives and make ourselves better in what we do as leaders.
Q: How many Apple products (phones, iPods, tablets, iTunes, etc.) do you interface with in a given week?
A: I am constantly on my iPad and use iTunes regularly during my weekly travels. My cellphone is an Android, so only two Apple products, but I use Apple countless times a week.
Richard Quinn is a freelance author in New Jersey.