User login
Continuous imatinib therapy in patients with gastrointestinal stromal tumors
Patients with gastrointestinal stromal tumors (GIST) used to have a poor prognosis due to the very low response rate of these tumors to conventional chemotherapy and radiation therapy. However, following the introduction of imatinib as a targeted therapeutic agent with efficacy in GIST, survival outcomes have improved remarkably for patients in the advanced/metastatic and adjuvant settings. Imatinib is now approved for both indications and has become the standard of care for patients with GIST. Despite the mounting evidence demonstrating the clinical benefits of extending imatinib treatment beyond 1 year, the optimal duration of imatinib therapy has not yet been determined. Similarly, whether chronic or extended adjuvant imatinib therapy can further improve clinical outcomes in patients with GIST remains to be determined. In this review, we present recent findings from various clinical trials which indicate that prolonged, uninterrupted imatinib treatment can have durable clinical benefits in patients who underwent resection of primary, operable GIST, as well as patients with advanced, unresectable, or metastatic GIST. We also summarize data showing that treatment interruption can result in disease progression in both the adjuvant and advanced/metastatic settings. Finally, we present evidence from different trials that long-term imatinib therapy is feasible and safe (ie, without cumulative toxicities) in patients with GIST.
*Click on the link to the left for a PDF of the full article.
Hospitalists Take Care Transitions Into Their Own Hands
How can hospitalists know if the care-transition plans they’ve put in place to get their discharged patients back to their PCPs are working out? For the 18-member inpatient medicine group at Aultman Hospital in Canton, Ohio, the answer is simple: Ask the PCPs.
“It’s more important than ever for the transition from one service to the next to be smooth, with a very good handoff. That’s where our hospitalist group and what we are doing comes in,” says group leader O. George Mitri, MD, FACP, FHM.
Dr. Mitri, along with Lewis Humble, MD, the group’s designated outreach champion, and Katie Wright, MSN, RN, the group’s practice administrator, visit PCPs in their offices once or twice a month. They meet with the physicians and practice managers, sharing data and exchanging stories about care transitions.
They recently held a three-hour summit in a conference room in the hospital, where PCPs were treated to dinner and discussion about transitions of care. Annually, PCPs are sent a satisfaction survey, which, like the office visits, asks if they are getting the information they need, in the format they need, and the right amount of it in order to take care of their patients post-discharge.

“We’ve taken that feedback and implemented changes at our end to better meet the needs of the patients and PCPs,” Dr. Mitri says. “It’s a lost opportunity if you’re not visiting PCPs in their offices. You lose touch.”
Changes implemented by the hospitalist group include making the admitting hospitalist for the day responsible for forwarding to PCPs any test results for discharged patients that require immediate attention, as well as revising the group’s discharge report to include a cover sheet summarizing the most pertinent information, discharge medications, and an assessment of the patient’s risk of readmission using Project BOOST’s “8Ps” risk assessment tool.
The goal is to dictate the discharge summary within 24 hours and fax it to the PCP the next business day, Wright says. The group’s rounding nurses also schedule the patient’s first medical office visit before the discharge, even if that means finding a PCP for the patient or making an appointment with a local community clinic. Patients identified as at-risk, including those with congestive heart failure (CHF) or COPD, also get a post-discharge follow-up call.
Other hospitalist groups are employing similar techniques to close the loop with PCPs for discharged patients. Bronson Internal Medicine Hospitalist Specialist Group in Kalamazoo, Mich., just hired three phone nurses to help with care transitions, using Dr. Eric Coleman’s Care Transitions model, says practice manager Joshua Hill. The nurses also call the PCPs. Paying particular attention to new heart-failure cases, they will accompany patients to follow-up appointments with PCPs and specialists and will make home visits if needed.
“For every readmission within 60 days, we also call the PCP,” Hill says.
Listen to Dr. O. George Mitri and Katie Wright discuss improving communication with PCPs
At Aultman, the hospitalists and support staff, including nurse practitioners, rounding nurses and office staff, are employed by the health system, whereas the PCPs they work with mostly belong to small, independent groups. The changes described above mostly apply to patients managed in the hospital by the hospitalists. But if the metrics—such as a decline in readmissions to 11 percent from 13 percent since they started making follow-up appointments for patients—continue to show improvements, Dr. Mitri says they might become hospital standards.

—O. George Mitri, MD, FACP, FHM
Next on the quality hit list at Aultman is a greater focus on medication safety. “How do we get what happens in the hospital to the PCP and to the patient at home? Is it a nurse visit to address what really goes on in the home, including the shoebox full of medications in the closet?” he asks.
Wright adds that the hospitalist group has started meeting with partner specialist groups in the hospital, including cardiology, neurology, and general surgery, and is working on relationships with nursing homes. That might mean another set of regular sit-down meetings to talk about how to make transitions to post-acute care work better. TH
Larry Beresford is a freelance writer in Oakland, Calif.
How can hospitalists know if the care-transition plans they’ve put in place to get their discharged patients back to their PCPs are working out? For the 18-member inpatient medicine group at Aultman Hospital in Canton, Ohio, the answer is simple: Ask the PCPs.
“It’s more important than ever for the transition from one service to the next to be smooth, with a very good handoff. That’s where our hospitalist group and what we are doing comes in,” says group leader O. George Mitri, MD, FACP, FHM.
Dr. Mitri, along with Lewis Humble, MD, the group’s designated outreach champion, and Katie Wright, MSN, RN, the group’s practice administrator, visit PCPs in their offices once or twice a month. They meet with the physicians and practice managers, sharing data and exchanging stories about care transitions.
They recently held a three-hour summit in a conference room in the hospital, where PCPs were treated to dinner and discussion about transitions of care. Annually, PCPs are sent a satisfaction survey, which, like the office visits, asks if they are getting the information they need, in the format they need, and the right amount of it in order to take care of their patients post-discharge.
“We’ve taken that feedback and implemented changes at our end to better meet the needs of the patients and PCPs,” Dr. Mitri says. “It’s a lost opportunity if you’re not visiting PCPs in their offices. You lose touch.”
Changes implemented by the hospitalist group include making the admitting hospitalist for the day responsible for forwarding to PCPs any test results for discharged patients that require immediate attention, as well as revising the group’s discharge report to include a cover sheet summarizing the most pertinent information, discharge medications, and an assessment of the patient’s risk of readmission using Project BOOST’s “8Ps” risk assessment tool.
The goal is to dictate the discharge summary within 24 hours and fax it to the PCP the next business day, Wright says. The group’s rounding nurses also schedule the patient’s first medical office visit before the discharge, even if that means finding a PCP for the patient or making an appointment with a local community clinic. Patients identified as at-risk, including those with congestive heart failure (CHF) or COPD, also get a post-discharge follow-up call.
Other hospitalist groups are employing similar techniques to close the loop with PCPs for discharged patients. Bronson Internal Medicine Hospitalist Specialist Group in Kalamazoo, Mich., just hired three phone nurses to help with care transitions, using Dr. Eric Coleman’s Care Transitions model, says practice manager Joshua Hill. The nurses also call the PCPs. Paying particular attention to new heart-failure cases, they will accompany patients to follow-up appointments with PCPs and specialists and will make home visits if needed.
“For every readmission within 60 days, we also call the PCP,” Hill says.
Listen to Dr. O. George Mitri and Katie Wright discuss improving communication with PCPs
At Aultman, the hospitalists and support staff, including nurse practitioners, rounding nurses and office staff, are employed by the health system, whereas the PCPs they work with mostly belong to small, independent groups. The changes described above mostly apply to patients managed in the hospital by the hospitalists. But if the metrics—such as a decline in readmissions to 11 percent from 13 percent since they started making follow-up appointments for patients—continue to show improvements, Dr. Mitri says they might become hospital standards.
—O. George Mitri, MD, FACP, FHM
Next on the quality hit list at Aultman is a greater focus on medication safety. “How do we get what happens in the hospital to the PCP and to the patient at home? Is it a nurse visit to address what really goes on in the home, including the shoebox full of medications in the closet?” he asks.
Wright adds that the hospitalist group has started meeting with partner specialist groups in the hospital, including cardiology, neurology, and general surgery, and is working on relationships with nursing homes. That might mean another set of regular sit-down meetings to talk about how to make transitions to post-acute care work better. TH
Larry Beresford is a freelance writer in Oakland, Calif.
Tips and techniques for robot-assisted laparoscopic myomectomy
CASE: IS OPEN MYOMECTOMY THE BEST OPTION FOR THIS PATIENT?
In her only pregnancy, a 34-year-old patient experienced a spontaneous first-trimester loss and underwent dilation and curettage. She had noted an increase in her abdominal girth, as well as pelvic pressure, but had attributed both to the pregnancy. Three months after the pregnancy loss, however, neither had resolved. Because she hopes to conceive again and deliver a healthy infant, the patient consulted a gynecologist. After ultrasonography revealed multiple fibroids, that physician recommended open myomectomy. The patient, a Jehovah’s Witness, comes to your office for a second opinion.
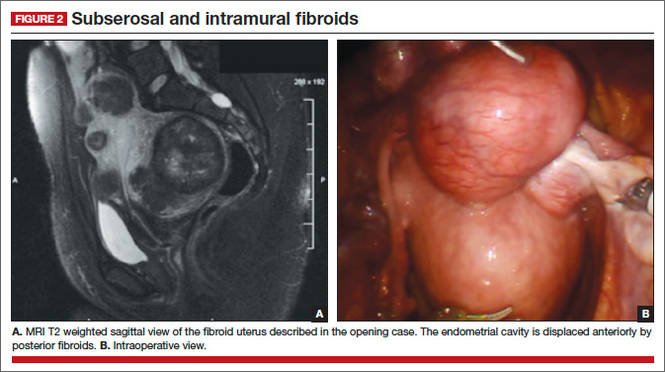
On physical examination, she has a 16-weeks’ sized irregular uterus with the cervix displaced behind the pubic symphysis. T2 weighted scans from magnetic resonance imaging (MRI) of the pelvis in the sagittal view reveal multiple subserosal and intramural fibroids that displace, but do not involve, the uterine cavity (FIGURE 2). The MRI results confirm that the uterus extends beyond the pelvis above the sacral promontory, the fundus lies a few centimeters below the umbilicus, and there is no evidence of adenomyosis. The patient’s hemoglobin level is normal (12.2 g/dL).
What surgical approach would you recommend?
Endometrial ablation, uterine artery embolization, MRI-guided focused ultrasound, hysterectomy, and myomectomy are all treatments for symptomatic uterine fibroids. For women desiring uterine preservation and future fertility, however, myomectomy is the preferred option of many experts.
Myomectomy traditionally has been performed via an open laparotomy approach. With the rise of minimally invasive surgery in gynecology, safe endoscopic surgical approaches and techniques have evolved.
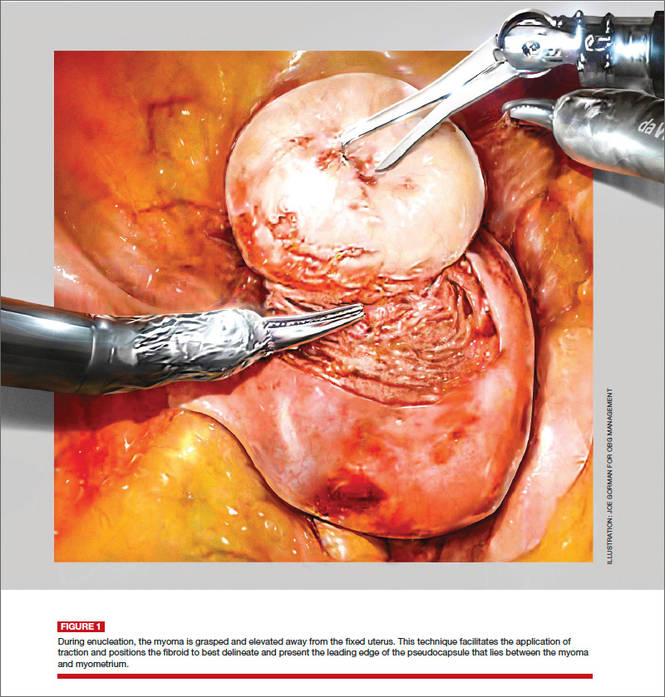
The EndoWrist technology from the da Vinci Surgical System (Intuitive Surgical, Sunnyvale, California) provides increased instrument range of motion, enabling the surgeon to mimic open surgical technique, thereby simplifying the technical challenges of conventional laparoscopic suturing and knot-tying. However, this technology does not minimize or simplify the challenges that leiomyomas can pose, including enucleation (FIGURE 1). Although it has facilitated the progression and adoption of endoscopic myomectomy, the da Vinci system requires an experienced gynecologic endoscopic surgeon.
In this article, we outline the essential steps and offer some clinical surgical pearls to make robot-assisted laparoscopic myomectomy a systematic, safe, and efficient procedure.
Benefits of the robotic approach
Compared with open abdominal myomectomy, the robot-assisted laparoscopic approach is associated with less blood loss, lower complication rates, and shorter hospitalization.1 A retrospective case study from the Cleveland Clinic confirmed these findings when investigators compared surgical outcomes between the robot-assisted laparoscopic approach, standard laparoscopy, and open myomectomy.2 In an assessment of 575 cases (393 open, 93 laparoscopic, and 89 robot-assisted laparoscopic), they found the robot-assisted laparoscopic approach to be associated with the removal of significantly larger myomas (vs standard laparoscopy), as well as lower blood loss and shorter hospitalization (vs open myomectomy).2
Related Article: The robot is gaining ground in gynecologic surgery. Should you be using it?
Comprehensive preoperative assessment is critical
Careful patient selection and thorough preoperative assessment are the cornerstones of successful robot-assisted laparoscopic myomectomy. Among the variables that should be considered in selecting patients are uterine size, the patient’s body habitus, and the quantity, size, consistency, type, and location of fibroids.
Size of the uterus, body habitus, and laxity of the abdominal wall all influence the surgeon’s ability to create the necessary operating space. Intraperitoneal space is required during myomectomy because of the need to apply traction and countertraction during enucleation of fibroids. If the necessary space cannot be obtained, a minilaparotomy technique is one alternative. This technique, described by Glasser, limits the skin incision to 3 to 6 cm in myomectomies for large fibroids that can be accessed easily anteriorly.3
Number and location of fibroids. Women with a solitary fibroid, a few dominant fibroids, or multiple pedunculated fibroids are excellent candidates for an endoscopic approach. Although there are no limits on the number of fibroids that can be removed, women with what we have termed “miliary fibroids,” or multiple fibroids disseminated throughout the entire myometrium, with very little normal myometrium, are poor surgical candidates. Not only does the presence of these fibroids leave some concern about the functional ability of the remaining myometrium in pregnancy, but it may be technically difficult to adequately resect all of the critical fibroids and reapproximate the myometrial defects.
The consistency of fibroids also affects the ease of the enucleation process during myomectomy. Due to the soft, spongy nature of degenerating fibroids and their tendency to fragment and shred when manipulated, these cases are more challenging and should not be attempted without a solid foundation of surgical experience.
MRI serves several purposes
Fibroids can be localized and identified as pedunculated, subserosal, intramural, or submucosal via MRI. Measurements and spatial orientation of the fibroids within the uterus can be formulated using T2 weighted coronal, axial, and sagittal images.
The risk of entering the uterine cavity, as well as the risk of synechiae, may be significantly greater if leiomyomas abut and distort the cavity. Surgical strategies, such as planning the location of the hysterotomy or the inclusion of other procedures (eg, hysteroscopic resection for type 0 or type 1 submucosal fibroids), can be formulated with the information provided by MRI. In cases involving multiple fibroids or intramural fibroids, in particular, MRI serves as a surgical “treasure map” or “GPS.” Preoperative MRI is also one way to offset the lack of haptic feedback during surgery to locate the myomas for removal. As we mentioned earlier, important characteristics, such as degeneration or calcification, also can be readily observed on MRI.
Most important, MRI can distinguish adenomyosis from leiomyomas. Adenomyosis can mimic leiomyomas—both clinically and on sonographic imaging—particularly when it is focal in nature. MRI can make the distinction between these two entities so that patients can be counseled appropriately.
SURGICAL TECHNIQUES
Use a uterine manipulator
This device will facilitate the enucleation process, providing another focal point for traction and countertraction. A variety of uterine manipulators are available. We use the Advincula Arch (Cooper Surgical, Trumball, Connecticut) in conjunction with the Uterine Positioning System (Cooper Surgical). The latter attaches to the operating table and to the Advincula Arch to secure the uterus in a steady position throughout the procedure.
During enucleation, the manipulator is crucial to hold the uterus within the pelvis and the field of vision and to act as countertraction as traction is applied to the fibroid.
Individualize port placement
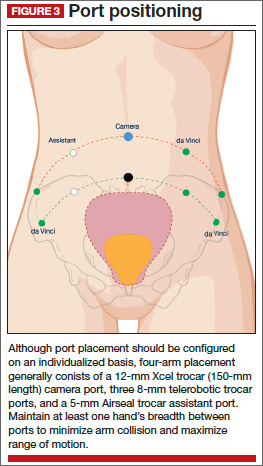
Rather than premeasure port placement on the abdomen, we individualize it, based on a variety of characteristics, including body habitus and uterine pathology (FIGURE 3). However, we follow some basic principles:
- We insert a Veress needle through the umbilicus to achieve pneumoperitoneum
- After insufflation, we use an upper quadrant entry (right or left, depending on which side the robot patient side cart is docked) under direct visualization using a 5-mm laparoscope and optical trocar. This entry will serve as the assistant port for surgery.
- Before placing the rest of the ports under direct visualization, relative to uterine pathology, we elevate the uterus out of the pelvis. This step ensures that enough distance is placed between the camera and the instrument arms to adequately visualize and perform the surgery.
- In patients with a uterus larger than approximately 14- to 16-weeks’ size, a supraumbilical camera port often is necessary.
- We generally employ a four-arm technique using a 12-mm Xcel trocar (Ethicon Endo-Surgery, Blue Ash, Ohio) that is 150 mm in length for the camera port, three 8-mm telerobotic trocar ports, and a 5-mm Airseal trocar (SurgiQuest, Orange, Connecticut) for the assistant port. There should be at least one hand’s breadth between the ports to minimize arm collision and maximize range of motion.
- Although the 12-mm Xcel trocar comes in a variety of lengths (75–150 mm), we strongly recommend, and exclusively use, the longest length for the camera. Once the camera is docked high on the neck of the longer trocar, more space is created between the setup joints of the robotic arms, enabling greater range of motion and fewer instrument and arm collisions.
- We generally use the following wristed robotic instruments to perform myomectomy: tenaculum, monopolar scissors, and PlasmaKinetic (PK) bipolar forceps.
Inject vasopressin into the myometrium
Vasopressin causes vasospasm and uterine muscle contraction and decreases blood loss during myomectomy. It should be diluted (20 U in 50–200 mL of normal saline), introduced with a 7-inch, 22-gauge spinal needle through the anterior abdominal wall, and injected into the myometrium and serosa overlying the fibroid (VIDEO 1 and VIDEO 2).
Perform this step with care, with aspiration prior to injection, to avoid intravascular injection. Although vasopressin is safe overall, serious complications and rare cases of life-threatening hypotension, pulmonary edema, bradycardia, and cardiac arrest have been reported after the injection of as little as 3 U into the myometrium.4–7
Relative contraindications to vasopressin, such as hypertension, should be discussed with anesthesia prior to use of the drug during surgery.
Enucleate the fibroid
Although either a vertical or a horizontal-transverse incision can be made overlying the uterus, a transverse incision allows for technical optimization of wristed movements for suturing and efficient closure. Whenever possible, therefore, we favor a transverse hysterotomy.
During enucleation, keep the use of thermal energy to a minimum. The same holds true for the uterine incision, although its length can be extended as needed.
Using the wristed robotic tenaculum (or an assistant using a laparoscopic tenaculum or corkscrew), grasp and elevate the myoma away from the fixed uterus (FIGURE 1). This step is not intended to enucleate the myoma through force, but to apply traction and position the fibroid to best delineate and present the leading edge of the pseudocapsule that lies between the myoma and the myometrium. Dissection then can proceed using a “push and spread” technique, bluntly separating the natural plane between the fibroid and the myometrium. Occasionally, fibrous attachments of the pseudocapsule can be transected sharply using the bipolar forceps and monopolar scissors.
Again, we encourage the intermittent use of minimal thermal energy to facilitate this process and achieve temporary hemostasis. As the dissection progresses, the fibroid can be regrasped closer to its leading edge, causing the myoma to be rolled out (VIDEO 3 and VIDEO 4).
Close the myometrium We advocate multilayer closure with reapproximation of the myometrium and serosal edges to achieve hemostasis and prevent hematoma (VIDEO 5).
The half-life of vasopressin ranges from 20 to 40 minutes. By this point of the procedure, assuming that the use of thermal energy has been minimal, the myometrial edges should be bleeding slightly, demonstrating adequate reperfusion. The myometrial defect then can be repaired using delayed absorbable suture, such as 2-0 V-Loc 180 (Covidien, Mansfield, Massachusetts).
Barbed suture has revolutionized laparoscopy and minimally invasive surgery, eliminating the need for endoscopic knot-tying. Quill suture (Angiotech, Vancouver, British Columbia, Canada) and V-Loc suture are used safely throughout gynecology, myomectomy included.8,9 However, when the endometrial cavity has been entered, avoid using barbed suture to reapproximate this initial layer to prevent synechiae.
No closure technique has been shown to prevent uterine rupture. Uterine rupture during pregnancy is one of the most serious potential complications following myomectomy. The precise risk of rupture after laparoscopic or robot-assisted laparoscopic myomectomy has not been determined.
Parker and colleagues evaluated case reports of uterine rupture after laparoscopic myomectomy in an attempt to identify a common causal risk factor. In their review of 19 uterine ruptures, however, they were unable to identify a single plausible risk factor. Uterine rupture has occurred in cases involving three-layer closure, removal of pedunculated fibroids, removal of fibroids as small as 1 cm, and in cases where no thermal energy was used.10
Pregnancy rates and outcomes have not been well-established because of confounding variables, such as a high prevalence of infertility and difficulty with long-term follow-up. One of the largest retrospective case studies on this topic involved 872 women who underwent robot-assisted myomectomy.11 Preterm delivery was correlated with the number of myomas removed and an anterior location of the largest incision.11
Undock the robot for morcellation
We strongly recommend that fibroids be morcellated using the 5-mm laparoscope while the robot is undocked, for several reasons. First, we advocate use of the robotic camera port site for morcellation. In the umbilicus, or midline, patients generally experience less pain. And with insufflation, the camera port site is the highest point on the abdomen, allowing greater distance between the morcellator and the iliac vessels and other major structures.
Second, the 12-mm robotic camera is heavy and cumbersome, easily causing fatigue when held separately. The robotic arms and patient side cart are bulky and can be limiting, physically impeding the range of motion necessary to morcellate safely, effectively, and efficiently.
After undocking the robot, remove the midline camera port to introduce the morcellator with the aid of a 5-mm laparoscope through a lateral port. We recommend taking the patient out of a steep Trendelenberg position and placing her in minimal Trendelenberg during morcellation to keep the specimen and fragments from falling to the upper abdomen.
Perfect the art of morcellation
A number of morcellators use electrical or mechanical energy. Blades ranging in diameter from 12 to 20 mm also are available. We favor the reusable MOREsolution tissue-extraction system (Blue Endo, Lenexa, Kansas) with a disposable 20-mm blade, particularly for large or multiple myomas.
The art of morcellation can be learned (VIDEO 6 and VIDEO 7). We recommend the following strategies:
- Slower morcellation speeds cause less fragmentation but may prolong the surgery significantly when the myomas are large. For such myomas, as well as cases that involve significant calcification, we recommend morcellation speeds of at least 600 rpm.
- A beveled trocar is preferred because it allows for longer continuous morcellation along the surface of the myoma and less fragmentation and coring.
- As morcellation nears completion and the specimen begins to fragment more, use short bursts of activation with increased traction, and ask the assistant to help stabilize the end pieces. This approach will help minimize the dissemination of fragments throughout the entire abdominal and pelvic cavity.
- Reapproximate the fascia for all trocar sites larger than 10 mm to prevent incisional hernias. When you exchange the robotic camera port with the morcellator, only one port site will require fascial closure because all other trocar sites typically are 8 mm or smaller.
It is critical that you inspect and remove all fragments and debris after morcellation to prevent iatrogenic multiple peritoneal parasitic myomas. First described in 2006,12 this unusual complication, leiomyomatosis peritonealis disseminate, has been reported with greater frequency as minimally invasive surgery and morcellation have become more common. This complication is thought to arise from small fragments left behind after morcellation of a uterus or myoma. Although spontaneous cases can occur, they are rare.
Place an adhesion barrier
Myomectomy can induce the formation of significant adhesions. For that reason, as the final step before fascial closure, we recommend that an adhesion barrier be placed over any hysterotomy sites. Although they are indicated and FDA-approved only for laparotomy, we typically place Interceed (Ethicon, Cornelia, Georgia) or Seprafilm (Genzyme, Framingham, Massachusetts) over hysterotomy sites.
CODING FOR ROBOT-ASSISTED MYOMECTOMY: ADDITIONAL REIMBURSEMENT MAY NOT BE FORTHCOMING
Robot-assisted surgery is an emerging technology. As such, many health insurance companies, the American Congress of Obstetricians and Gynecologists (ACOG), and Current Procedural Terminology (CPT) editorial staff have weighed in on it. In essence, many payers have indicated that they will not provide the physician with additional reimbursement for performing a surgical procedure using robotic assistance. That is not to say that all payers will rule out additional reimbursement, although most of the larger payers have indicated that additional reimbursement is not going to happen.
Both ACOG and CPT officials have indicated that robot-assisted surgical procedures should be reported using existing CPT codes, based on the procedure and the surgical approach used, rather than coding them as an unlisted procedure. These organizations also have indicated that use of the modifier –22 on the basic laparoscopic procedure would be inappropriate because robotic assistance does not represent an unusual procedure, based on the patient’s condition.
However, if there is a chance that you can gain additional reimbursement for robotic surgery, how can you inform the payer that it was performed? The only currently accepted way to do so is to report code S2900, Surgical techniques requiring use of robotic surgical system (list separately in addition to the code for the primary procedure), in addition to the basic code for the laparoscopic approach. Code S2900 was added by CPT to the national code set in 2005 at the request of Blue Cross/Blue Shield so that the payer could track the incidence of robotic surgery. Because it is not a “regular” CPT code, S2900 was never assigned a relative value, so it is up to the surgeon to set a surgical charge for use of the robot. In doing so, the surgeon must be able to provide supporting documentation as to why additional reimbursement is being requested and on what basis the charge was calculated.
Therefore, if a robot-assisted laparoscopic myomectomy is performed, the first CPT code listed on the claim should be 58545, Laparoscopy, surgical, myomectomy, excision; 1 to 4 intramural myomas with total weight of 250 g or less and/or removal of surface myomas. An alternative would be code 58546, Laparoscopy, surgical, myomectomy, excision; 5 or more intramural myomas and/or intramural myomas with total weight greater than 250 g.
Code S2900 then would be listed second. No modifiers (such as modifier –59 [distinct procedure] or –51 [multiple procedures]) should be added to S2900 because this code does not represent either a distinct or multiple surgical procedure.
—MELANIE WITT, RN, CPC, COBGC, MA
Ms. Witt is an independent coding and documentation consultant and former program manager, department of coding and nomenclature, American Congress of Obstetricians and Gynecologists.
CASE: RESOLVED
Because of the patient’s religious beliefs, minimal blood loss is an important goal for any surgery she undergoes. Consequently, you recommend robot-assisted laparoscopic myomectomy, and the operation is completed without complications.
TAKE-HOME MESSAGE
The success of minimally invasive myomectomy requires a careful preoperative work-up and thorough understanding of surgical dissection and suturing techniques. In combination with this knowledge, advanced surgical technology, such as robotics and barbed suture, can truly transform the way myomectomy is performed, providing both patients and physicians with additional options for the conservative management of symptomatic uterine fibroids.
KEY POINTS FOR SUCCESS WITH THE ROBOT
Select patients with care for robot-assisted laparoscopic myomectomy, and perform thorough preoperative assessment. When planning a surgical approach, keep in mind the patient’s uterine size and body habitus and the quantity, size, consistency, type, and location of fibroids.
Use preoperative magnetic resonance imaging to characterize and locate fibroids and differentiate adenomyosis from leiomyomas.
In patients with a uterus larger than approximately 14- to 16-weeks’ size, consider a supraumbilical camera port.
Although the 12-mm Xcel trocar comes in a variety of lengths (75–150 mm), use the 150-mm length for the camera port. Once the camera is docked high on the neck of the longer trocar, more space is created between the setup joints of the robotic arms, enabling greater range of motion and fewer instrument and arm collisions.
Whenever possible, perform a transverse hysterotomy, keeping the length of the incision as short as possible and minimizing use of thermal energy during enucleation of fibroids.
Do not enucleate myomas through force, but apply traction and position each fibroid in order to best delineate and pre-sent the leading edge between the myoma and the myometrium.
Use multilayer closure with reapproximation of the myometrium and serosal edges to achieve hemostasis and prevent hematoma.
Perform morcellation through a 5-mm laparoscope with the robot undocked, using the camera port site for morcellation.
Take the patient out of a steep Trendelenberg position and place her in minimal Trendelenberg during morcellation to optimize ergonomics and prevent fragments from falling into the upper
abdomen.
Inspect the abdomen and remove all fragments and debris after morcellation to help prevent leiomyomatosis peritonealis disseminate.
- Advincula AP, Xu X, Goudeau S 4th, Ransom SB. Robot-assisted laparoscopic myomectomy versus abdominal myomectomy: a comparison of short-term surgical outcomes and immediate costs. J Minim Invasive Gynecol. 2007;14(6):698–705.
- Barakat EE, Bedaiwy MA, Zimberg S, Nutter B, Nosseir M, Falcone T. Robotic-assisted, laparoscopic, and abdominal myomectomy: a comparison of surgical outcomes. Obstet Gynecol. 2011;117(2 Pt 1):256–265.
- Glasser MH. Minilaparotomy myomectomy: a minimally invasive alternative for the large fibroid uterus. J Minim Invasive Gynecol. 2005;12(3):275–283.
- Hung MH, Wang YM, Chia YY, Liu K. Intramyometrial injection of vasopressin causes bradycardia and cardiac arrest—report of two cases. Acta Anaesthesiol Taiwan. 2006;44(4):243–247.
- Tulandi T, Beique F, Kimia M. Pulmonary edema: a complication of local injection of. Fertil Steril. 1996;66(3):478–480.
- Nezhat F, Admon D Nezhat CH, Dicorpo JE, Nezhat C. Life-threatening hypotension after vasopressin injection during operative laparoscopy, followed by uneventful repeat laparoscopy. J Am Assoc Gynecol Laparosc. 1994;2(1):83–86.
- Riess ML, Ulrichs JG, Pagel PS, Woehlck HJ. Case report: Severe vasospasm mimics hypotension after high-dose intrauterine vasopressin. Anesth Analg. 2011;113(5):1103–1105.
- Einarsson JI, Chavan NR, Suzuki Y, Jonsdottir G, Vellinga TT, Greenberg JA. Use of bidirectional barbed suture in laparoscopic myomectomy: evaluation of perioperative outcomes, safety and efficacy. J Minim Invasive Gynecol. 2011;18(1):92–95.
- Angioli R, Plotti F, Montera R, et al. A new type of absorbable barbed suture for use in laparoscopic myomectomy. Int J Gynaecol Obstet. 2012;117(3):220–223.
- Parker WH, Einarsson J, Istre O, Dubuisson J. Risk factors for uterine rupture after laparoscopic myomectomy. J Minim Invasive Gynecol. 2010;17(5):551–554.
- Pitter MC, Gargiulo AR, Bonaventura LM, Lehman JS, Srouji SS. Pregnancy outcomes following robot-assisted myomectomy. Hum Reprod. 2013;28(1):99–108.
- Paul PG, Koshy AK. Multiple peritoneal parasitic myomas after laparoscopic myomectomy and morcellation. Fertil Steril. 2006;85(2):492–493.

Arnold P. Advincula, MD, is Professor of Obstetrics and Gynecology at the University of Central Florida College of Medicine in Orlando, Florida. He is Medical Director of the Center for Specialized Gynecology at Florida Hospital Celebration Health in Celebration, Florida, and oversees its Fellowship Program in Minimally Invasive Gynecologic Surgery.

Bich-Van Tran, MD, is an AAGL Fellow in Minimally Invasive Gynecologic Surgery at the Center for Specialized Gynecology at Florida Hospital Celebration Health in Celebration, Florida.
Dr. Advincula reports that he is a consultant to Blue Endo, Cooper Surgical, Covidien, Intuitive Surgical, and Surgiquest. Dr. Tran reports no financial relationships relevant to this article.
Arnold P. Advincula, MD, is Professor of Obstetrics and Gynecology at the University of Central Florida College of Medicine in Orlando, Florida. He is Medical Director of the Center for Specialized Gynecology at Florida Hospital Celebration Health in Celebration, Florida, and oversees its Fellowship Program in Minimally Invasive Gynecologic Surgery.
Bich-Van Tran, MD, is an AAGL Fellow in Minimally Invasive Gynecologic Surgery at the Center for Specialized Gynecology at Florida Hospital Celebration Health in Celebration, Florida.
Dr. Advincula reports that he is a consultant to Blue Endo, Cooper Surgical, Covidien, Intuitive Surgical, and Surgiquest. Dr. Tran reports no financial relationships relevant to this article.
CASE: IS OPEN MYOMECTOMY THE BEST OPTION FOR THIS PATIENT?
In her only pregnancy, a 34-year-old patient experienced a spontaneous first-trimester loss and underwent dilation and curettage. She had noted an increase in her abdominal girth, as well as pelvic pressure, but had attributed both to the pregnancy. Three months after the pregnancy loss, however, neither had resolved. Because she hopes to conceive again and deliver a healthy infant, the patient consulted a gynecologist. After ultrasonography revealed multiple fibroids, that physician recommended open myomectomy. The patient, a Jehovah’s Witness, comes to your office for a second opinion.
On physical examination, she has a 16-weeks’ sized irregular uterus with the cervix displaced behind the pubic symphysis. T2 weighted scans from magnetic resonance imaging (MRI) of the pelvis in the sagittal view reveal multiple subserosal and intramural fibroids that displace, but do not involve, the uterine cavity (FIGURE 2). The MRI results confirm that the uterus extends beyond the pelvis above the sacral promontory, the fundus lies a few centimeters below the umbilicus, and there is no evidence of adenomyosis. The patient’s hemoglobin level is normal (12.2 g/dL).
What surgical approach would you recommend?
Endometrial ablation, uterine artery embolization, MRI-guided focused ultrasound, hysterectomy, and myomectomy are all treatments for symptomatic uterine fibroids. For women desiring uterine preservation and future fertility, however, myomectomy is the preferred option of many experts.
Myomectomy traditionally has been performed via an open laparotomy approach. With the rise of minimally invasive surgery in gynecology, safe endoscopic surgical approaches and techniques have evolved.
The EndoWrist technology from the da Vinci Surgical System (Intuitive Surgical, Sunnyvale, California) provides increased instrument range of motion, enabling the surgeon to mimic open surgical technique, thereby simplifying the technical challenges of conventional laparoscopic suturing and knot-tying. However, this technology does not minimize or simplify the challenges that leiomyomas can pose, including enucleation (FIGURE 1). Although it has facilitated the progression and adoption of endoscopic myomectomy, the da Vinci system requires an experienced gynecologic endoscopic surgeon.
In this article, we outline the essential steps and offer some clinical surgical pearls to make robot-assisted laparoscopic myomectomy a systematic, safe, and efficient procedure.
Benefits of the robotic approach
Compared with open abdominal myomectomy, the robot-assisted laparoscopic approach is associated with less blood loss, lower complication rates, and shorter hospitalization.1 A retrospective case study from the Cleveland Clinic confirmed these findings when investigators compared surgical outcomes between the robot-assisted laparoscopic approach, standard laparoscopy, and open myomectomy.2 In an assessment of 575 cases (393 open, 93 laparoscopic, and 89 robot-assisted laparoscopic), they found the robot-assisted laparoscopic approach to be associated with the removal of significantly larger myomas (vs standard laparoscopy), as well as lower blood loss and shorter hospitalization (vs open myomectomy).2
Related Article: The robot is gaining ground in gynecologic surgery. Should you be using it?
Comprehensive preoperative assessment is critical
Careful patient selection and thorough preoperative assessment are the cornerstones of successful robot-assisted laparoscopic myomectomy. Among the variables that should be considered in selecting patients are uterine size, the patient’s body habitus, and the quantity, size, consistency, type, and location of fibroids.
Size of the uterus, body habitus, and laxity of the abdominal wall all influence the surgeon’s ability to create the necessary operating space. Intraperitoneal space is required during myomectomy because of the need to apply traction and countertraction during enucleation of fibroids. If the necessary space cannot be obtained, a minilaparotomy technique is one alternative. This technique, described by Glasser, limits the skin incision to 3 to 6 cm in myomectomies for large fibroids that can be accessed easily anteriorly.3
Number and location of fibroids. Women with a solitary fibroid, a few dominant fibroids, or multiple pedunculated fibroids are excellent candidates for an endoscopic approach. Although there are no limits on the number of fibroids that can be removed, women with what we have termed “miliary fibroids,” or multiple fibroids disseminated throughout the entire myometrium, with very little normal myometrium, are poor surgical candidates. Not only does the presence of these fibroids leave some concern about the functional ability of the remaining myometrium in pregnancy, but it may be technically difficult to adequately resect all of the critical fibroids and reapproximate the myometrial defects.
The consistency of fibroids also affects the ease of the enucleation process during myomectomy. Due to the soft, spongy nature of degenerating fibroids and their tendency to fragment and shred when manipulated, these cases are more challenging and should not be attempted without a solid foundation of surgical experience.
MRI serves several purposes
Fibroids can be localized and identified as pedunculated, subserosal, intramural, or submucosal via MRI. Measurements and spatial orientation of the fibroids within the uterus can be formulated using T2 weighted coronal, axial, and sagittal images.
The risk of entering the uterine cavity, as well as the risk of synechiae, may be significantly greater if leiomyomas abut and distort the cavity. Surgical strategies, such as planning the location of the hysterotomy or the inclusion of other procedures (eg, hysteroscopic resection for type 0 or type 1 submucosal fibroids), can be formulated with the information provided by MRI. In cases involving multiple fibroids or intramural fibroids, in particular, MRI serves as a surgical “treasure map” or “GPS.” Preoperative MRI is also one way to offset the lack of haptic feedback during surgery to locate the myomas for removal. As we mentioned earlier, important characteristics, such as degeneration or calcification, also can be readily observed on MRI.
Most important, MRI can distinguish adenomyosis from leiomyomas. Adenomyosis can mimic leiomyomas—both clinically and on sonographic imaging—particularly when it is focal in nature. MRI can make the distinction between these two entities so that patients can be counseled appropriately.
SURGICAL TECHNIQUES
Use a uterine manipulator
This device will facilitate the enucleation process, providing another focal point for traction and countertraction. A variety of uterine manipulators are available. We use the Advincula Arch (Cooper Surgical, Trumball, Connecticut) in conjunction with the Uterine Positioning System (Cooper Surgical). The latter attaches to the operating table and to the Advincula Arch to secure the uterus in a steady position throughout the procedure.
During enucleation, the manipulator is crucial to hold the uterus within the pelvis and the field of vision and to act as countertraction as traction is applied to the fibroid.
Individualize port placement
Rather than premeasure port placement on the abdomen, we individualize it, based on a variety of characteristics, including body habitus and uterine pathology (FIGURE 3). However, we follow some basic principles:
- We insert a Veress needle through the umbilicus to achieve pneumoperitoneum
- After insufflation, we use an upper quadrant entry (right or left, depending on which side the robot patient side cart is docked) under direct visualization using a 5-mm laparoscope and optical trocar. This entry will serve as the assistant port for surgery.
- Before placing the rest of the ports under direct visualization, relative to uterine pathology, we elevate the uterus out of the pelvis. This step ensures that enough distance is placed between the camera and the instrument arms to adequately visualize and perform the surgery.
- In patients with a uterus larger than approximately 14- to 16-weeks’ size, a supraumbilical camera port often is necessary.
- We generally employ a four-arm technique using a 12-mm Xcel trocar (Ethicon Endo-Surgery, Blue Ash, Ohio) that is 150 mm in length for the camera port, three 8-mm telerobotic trocar ports, and a 5-mm Airseal trocar (SurgiQuest, Orange, Connecticut) for the assistant port. There should be at least one hand’s breadth between the ports to minimize arm collision and maximize range of motion.
- Although the 12-mm Xcel trocar comes in a variety of lengths (75–150 mm), we strongly recommend, and exclusively use, the longest length for the camera. Once the camera is docked high on the neck of the longer trocar, more space is created between the setup joints of the robotic arms, enabling greater range of motion and fewer instrument and arm collisions.
- We generally use the following wristed robotic instruments to perform myomectomy: tenaculum, monopolar scissors, and PlasmaKinetic (PK) bipolar forceps.
Inject vasopressin into the myometrium
Vasopressin causes vasospasm and uterine muscle contraction and decreases blood loss during myomectomy. It should be diluted (20 U in 50–200 mL of normal saline), introduced with a 7-inch, 22-gauge spinal needle through the anterior abdominal wall, and injected into the myometrium and serosa overlying the fibroid (VIDEO 1 and VIDEO 2).
Perform this step with care, with aspiration prior to injection, to avoid intravascular injection. Although vasopressin is safe overall, serious complications and rare cases of life-threatening hypotension, pulmonary edema, bradycardia, and cardiac arrest have been reported after the injection of as little as 3 U into the myometrium.4–7
Relative contraindications to vasopressin, such as hypertension, should be discussed with anesthesia prior to use of the drug during surgery.
Enucleate the fibroid
Although either a vertical or a horizontal-transverse incision can be made overlying the uterus, a transverse incision allows for technical optimization of wristed movements for suturing and efficient closure. Whenever possible, therefore, we favor a transverse hysterotomy.
During enucleation, keep the use of thermal energy to a minimum. The same holds true for the uterine incision, although its length can be extended as needed.
Using the wristed robotic tenaculum (or an assistant using a laparoscopic tenaculum or corkscrew), grasp and elevate the myoma away from the fixed uterus (FIGURE 1). This step is not intended to enucleate the myoma through force, but to apply traction and position the fibroid to best delineate and present the leading edge of the pseudocapsule that lies between the myoma and the myometrium. Dissection then can proceed using a “push and spread” technique, bluntly separating the natural plane between the fibroid and the myometrium. Occasionally, fibrous attachments of the pseudocapsule can be transected sharply using the bipolar forceps and monopolar scissors.
Again, we encourage the intermittent use of minimal thermal energy to facilitate this process and achieve temporary hemostasis. As the dissection progresses, the fibroid can be regrasped closer to its leading edge, causing the myoma to be rolled out (VIDEO 3 and VIDEO 4).
Close the myometrium We advocate multilayer closure with reapproximation of the myometrium and serosal edges to achieve hemostasis and prevent hematoma (VIDEO 5).
The half-life of vasopressin ranges from 20 to 40 minutes. By this point of the procedure, assuming that the use of thermal energy has been minimal, the myometrial edges should be bleeding slightly, demonstrating adequate reperfusion. The myometrial defect then can be repaired using delayed absorbable suture, such as 2-0 V-Loc 180 (Covidien, Mansfield, Massachusetts).
Barbed suture has revolutionized laparoscopy and minimally invasive surgery, eliminating the need for endoscopic knot-tying. Quill suture (Angiotech, Vancouver, British Columbia, Canada) and V-Loc suture are used safely throughout gynecology, myomectomy included.8,9 However, when the endometrial cavity has been entered, avoid using barbed suture to reapproximate this initial layer to prevent synechiae.
No closure technique has been shown to prevent uterine rupture. Uterine rupture during pregnancy is one of the most serious potential complications following myomectomy. The precise risk of rupture after laparoscopic or robot-assisted laparoscopic myomectomy has not been determined.
Parker and colleagues evaluated case reports of uterine rupture after laparoscopic myomectomy in an attempt to identify a common causal risk factor. In their review of 19 uterine ruptures, however, they were unable to identify a single plausible risk factor. Uterine rupture has occurred in cases involving three-layer closure, removal of pedunculated fibroids, removal of fibroids as small as 1 cm, and in cases where no thermal energy was used.10
Pregnancy rates and outcomes have not been well-established because of confounding variables, such as a high prevalence of infertility and difficulty with long-term follow-up. One of the largest retrospective case studies on this topic involved 872 women who underwent robot-assisted myomectomy.11 Preterm delivery was correlated with the number of myomas removed and an anterior location of the largest incision.11
Undock the robot for morcellation
We strongly recommend that fibroids be morcellated using the 5-mm laparoscope while the robot is undocked, for several reasons. First, we advocate use of the robotic camera port site for morcellation. In the umbilicus, or midline, patients generally experience less pain. And with insufflation, the camera port site is the highest point on the abdomen, allowing greater distance between the morcellator and the iliac vessels and other major structures.
Second, the 12-mm robotic camera is heavy and cumbersome, easily causing fatigue when held separately. The robotic arms and patient side cart are bulky and can be limiting, physically impeding the range of motion necessary to morcellate safely, effectively, and efficiently.
After undocking the robot, remove the midline camera port to introduce the morcellator with the aid of a 5-mm laparoscope through a lateral port. We recommend taking the patient out of a steep Trendelenberg position and placing her in minimal Trendelenberg during morcellation to keep the specimen and fragments from falling to the upper abdomen.
Perfect the art of morcellation
A number of morcellators use electrical or mechanical energy. Blades ranging in diameter from 12 to 20 mm also are available. We favor the reusable MOREsolution tissue-extraction system (Blue Endo, Lenexa, Kansas) with a disposable 20-mm blade, particularly for large or multiple myomas.
The art of morcellation can be learned (VIDEO 6 and VIDEO 7). We recommend the following strategies:
- Slower morcellation speeds cause less fragmentation but may prolong the surgery significantly when the myomas are large. For such myomas, as well as cases that involve significant calcification, we recommend morcellation speeds of at least 600 rpm.
- A beveled trocar is preferred because it allows for longer continuous morcellation along the surface of the myoma and less fragmentation and coring.
- As morcellation nears completion and the specimen begins to fragment more, use short bursts of activation with increased traction, and ask the assistant to help stabilize the end pieces. This approach will help minimize the dissemination of fragments throughout the entire abdominal and pelvic cavity.
- Reapproximate the fascia for all trocar sites larger than 10 mm to prevent incisional hernias. When you exchange the robotic camera port with the morcellator, only one port site will require fascial closure because all other trocar sites typically are 8 mm or smaller.
It is critical that you inspect and remove all fragments and debris after morcellation to prevent iatrogenic multiple peritoneal parasitic myomas. First described in 2006,12 this unusual complication, leiomyomatosis peritonealis disseminate, has been reported with greater frequency as minimally invasive surgery and morcellation have become more common. This complication is thought to arise from small fragments left behind after morcellation of a uterus or myoma. Although spontaneous cases can occur, they are rare.
Place an adhesion barrier
Myomectomy can induce the formation of significant adhesions. For that reason, as the final step before fascial closure, we recommend that an adhesion barrier be placed over any hysterotomy sites. Although they are indicated and FDA-approved only for laparotomy, we typically place Interceed (Ethicon, Cornelia, Georgia) or Seprafilm (Genzyme, Framingham, Massachusetts) over hysterotomy sites.
CODING FOR ROBOT-ASSISTED MYOMECTOMY: ADDITIONAL REIMBURSEMENT MAY NOT BE FORTHCOMING
Robot-assisted surgery is an emerging technology. As such, many health insurance companies, the American Congress of Obstetricians and Gynecologists (ACOG), and Current Procedural Terminology (CPT) editorial staff have weighed in on it. In essence, many payers have indicated that they will not provide the physician with additional reimbursement for performing a surgical procedure using robotic assistance. That is not to say that all payers will rule out additional reimbursement, although most of the larger payers have indicated that additional reimbursement is not going to happen.
Both ACOG and CPT officials have indicated that robot-assisted surgical procedures should be reported using existing CPT codes, based on the procedure and the surgical approach used, rather than coding them as an unlisted procedure. These organizations also have indicated that use of the modifier –22 on the basic laparoscopic procedure would be inappropriate because robotic assistance does not represent an unusual procedure, based on the patient’s condition.
However, if there is a chance that you can gain additional reimbursement for robotic surgery, how can you inform the payer that it was performed? The only currently accepted way to do so is to report code S2900, Surgical techniques requiring use of robotic surgical system (list separately in addition to the code for the primary procedure), in addition to the basic code for the laparoscopic approach. Code S2900 was added by CPT to the national code set in 2005 at the request of Blue Cross/Blue Shield so that the payer could track the incidence of robotic surgery. Because it is not a “regular” CPT code, S2900 was never assigned a relative value, so it is up to the surgeon to set a surgical charge for use of the robot. In doing so, the surgeon must be able to provide supporting documentation as to why additional reimbursement is being requested and on what basis the charge was calculated.
Therefore, if a robot-assisted laparoscopic myomectomy is performed, the first CPT code listed on the claim should be 58545, Laparoscopy, surgical, myomectomy, excision; 1 to 4 intramural myomas with total weight of 250 g or less and/or removal of surface myomas. An alternative would be code 58546, Laparoscopy, surgical, myomectomy, excision; 5 or more intramural myomas and/or intramural myomas with total weight greater than 250 g.
Code S2900 then would be listed second. No modifiers (such as modifier –59 [distinct procedure] or –51 [multiple procedures]) should be added to S2900 because this code does not represent either a distinct or multiple surgical procedure.
—MELANIE WITT, RN, CPC, COBGC, MA
Ms. Witt is an independent coding and documentation consultant and former program manager, department of coding and nomenclature, American Congress of Obstetricians and Gynecologists.
CASE: RESOLVED
Because of the patient’s religious beliefs, minimal blood loss is an important goal for any surgery she undergoes. Consequently, you recommend robot-assisted laparoscopic myomectomy, and the operation is completed without complications.
TAKE-HOME MESSAGE
The success of minimally invasive myomectomy requires a careful preoperative work-up and thorough understanding of surgical dissection and suturing techniques. In combination with this knowledge, advanced surgical technology, such as robotics and barbed suture, can truly transform the way myomectomy is performed, providing both patients and physicians with additional options for the conservative management of symptomatic uterine fibroids.
KEY POINTS FOR SUCCESS WITH THE ROBOT
Select patients with care for robot-assisted laparoscopic myomectomy, and perform thorough preoperative assessment. When planning a surgical approach, keep in mind the patient’s uterine size and body habitus and the quantity, size, consistency, type, and location of fibroids.
Use preoperative magnetic resonance imaging to characterize and locate fibroids and differentiate adenomyosis from leiomyomas.
In patients with a uterus larger than approximately 14- to 16-weeks’ size, consider a supraumbilical camera port.
Although the 12-mm Xcel trocar comes in a variety of lengths (75–150 mm), use the 150-mm length for the camera port. Once the camera is docked high on the neck of the longer trocar, more space is created between the setup joints of the robotic arms, enabling greater range of motion and fewer instrument and arm collisions.
Whenever possible, perform a transverse hysterotomy, keeping the length of the incision as short as possible and minimizing use of thermal energy during enucleation of fibroids.
Do not enucleate myomas through force, but apply traction and position each fibroid in order to best delineate and pre-sent the leading edge between the myoma and the myometrium.
Use multilayer closure with reapproximation of the myometrium and serosal edges to achieve hemostasis and prevent hematoma.
Perform morcellation through a 5-mm laparoscope with the robot undocked, using the camera port site for morcellation.
Take the patient out of a steep Trendelenberg position and place her in minimal Trendelenberg during morcellation to optimize ergonomics and prevent fragments from falling into the upper
abdomen.
Inspect the abdomen and remove all fragments and debris after morcellation to help prevent leiomyomatosis peritonealis disseminate.
- Advincula AP, Xu X, Goudeau S 4th, Ransom SB. Robot-assisted laparoscopic myomectomy versus abdominal myomectomy: a comparison of short-term surgical outcomes and immediate costs. J Minim Invasive Gynecol. 2007;14(6):698–705.
- Barakat EE, Bedaiwy MA, Zimberg S, Nutter B, Nosseir M, Falcone T. Robotic-assisted, laparoscopic, and abdominal myomectomy: a comparison of surgical outcomes. Obstet Gynecol. 2011;117(2 Pt 1):256–265.
- Glasser MH. Minilaparotomy myomectomy: a minimally invasive alternative for the large fibroid uterus. J Minim Invasive Gynecol. 2005;12(3):275–283.
- Hung MH, Wang YM, Chia YY, Liu K. Intramyometrial injection of vasopressin causes bradycardia and cardiac arrest—report of two cases. Acta Anaesthesiol Taiwan. 2006;44(4):243–247.
- Tulandi T, Beique F, Kimia M. Pulmonary edema: a complication of local injection of. Fertil Steril. 1996;66(3):478–480.
- Nezhat F, Admon D Nezhat CH, Dicorpo JE, Nezhat C. Life-threatening hypotension after vasopressin injection during operative laparoscopy, followed by uneventful repeat laparoscopy. J Am Assoc Gynecol Laparosc. 1994;2(1):83–86.
- Riess ML, Ulrichs JG, Pagel PS, Woehlck HJ. Case report: Severe vasospasm mimics hypotension after high-dose intrauterine vasopressin. Anesth Analg. 2011;113(5):1103–1105.
- Einarsson JI, Chavan NR, Suzuki Y, Jonsdottir G, Vellinga TT, Greenberg JA. Use of bidirectional barbed suture in laparoscopic myomectomy: evaluation of perioperative outcomes, safety and efficacy. J Minim Invasive Gynecol. 2011;18(1):92–95.
- Angioli R, Plotti F, Montera R, et al. A new type of absorbable barbed suture for use in laparoscopic myomectomy. Int J Gynaecol Obstet. 2012;117(3):220–223.
- Parker WH, Einarsson J, Istre O, Dubuisson J. Risk factors for uterine rupture after laparoscopic myomectomy. J Minim Invasive Gynecol. 2010;17(5):551–554.
- Pitter MC, Gargiulo AR, Bonaventura LM, Lehman JS, Srouji SS. Pregnancy outcomes following robot-assisted myomectomy. Hum Reprod. 2013;28(1):99–108.
- Paul PG, Koshy AK. Multiple peritoneal parasitic myomas after laparoscopic myomectomy and morcellation. Fertil Steril. 2006;85(2):492–493.
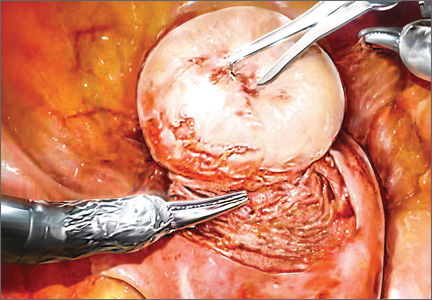
Investigational vaccine can prevent malaria
Changing the route of administration has significantly improved the efficacy of an investigational malaria vaccine, according to a study published in Science.
The vaccine, called PfSPZ, is composed of live but weakened sporozoites of Plasmodium falciparum.
In a previous clinical trial, the vaccine proved largely ineffective at preventing malaria. But in that study, PfSPZ was administered either intradermally or subcutaneously.
In a new phase 1 study, researchers administered the vaccine intravenously at varying doses. And they found that, at high doses, PfSPZ offered protection against malaria in most subjects.
“In this trial, we showed, in principle, that sporozoites can be developed into a malaria vaccine that confers high levels of protection . . . ,” said study author Robert A. Seder, MD, chief of the Cellular Immunology Section of the NIAID Vaccine Research Center in Bethesda, Maryland.
Dr Seder and his colleagues tested the vaccine in 57 healthy adult volunteers, aged 18 to 45 years, who never had malaria. Forty of the subjects received the vaccine, and 17 did not.
Adverse reactions
To evaluate safety, the researchers divided recipients into groups receiving 2 to 6 intravenous doses of PfSPZ vaccine at increasing dosages. After vaccination, the team monitored subjects closely for 7 days.
There were no malaria infections related to vaccination. However, there were a number of adverse events.
Nine subjects had mild pain/tenderness or bruising, and 1 had moderate bruising at the injection site. Sixteen participants had mild solicited systemic reactogenicity, 4 had moderate, and 1 had severe reactogenicity.
Sixteen subjects also had transient, asymptomatic increases in aspartate aminotransferase and/or alanine aminotransferase that was possibly related to vaccination.
Response and protection
Based on blood measurements, the researchers found that subjects who received a higher total dosage of PfSPZ vaccine generated more antibodies against malaria and more T cells specific to the vaccine.
To evaluate whether and how well the PfSPZ vaccine prevented malaria infection, each participant—both vaccinated individuals and the control group—was exposed to bites by 5 mosquitoes carrying the P falciparum strain.
This took place 3 weeks after participants received their final vaccination. The researchers monitored the subjects as outpatients for 7 days and then admitted them to the clinic, where they stayed until they were diagnosed with malaria, treated with antimalarial drugs and cured of infection, or shown to be free of infection.
The researchers found that higher dosages of PfSPZ vaccine were associated with protection against malaria infection. Three of the 15 participants who received higher dosages of the vaccine became infected, compared to 16 of 17 subjects in the lower-dosage group.
Among the 12 participants who received no vaccine, 11 became infected with malaria after the mosquito challenge.
“[T]hese trial results are a promising first step in generating high-level protection against malaria, and they allow for future studies to optimize the dose, schedule, and delivery route of the candidate vaccine,” Dr Seder said.
A number of follow-up studies are planned, including research to evaluate the vaccine’s different dose schedules, possible protection against other Plasmodium strains, and the durability of protection.
The researchers may also evaluate whether higher doses administered subcutaneously or intradermally provide the same level of protection as that found in this study.
The PfSPZ vaccine was developed by scientists at Sanaria Inc., of Rockville, Maryland. ![]()
Inconsideration
"My friend took your elective," read the e-mail from Adam, a medical student I didn’t know. "I need one more rotation before I graduate and would love to get some dermatology experience, which I expect I’ll need for Family Medicine. Could you possibly accommodate me?"
Sure, no problem.
The day before he was to start, I e-mailed Adam with the time and place to show up, along with parking suggestions.
"Oh, sorry," came the reply. "I found another elective. Hope this causes no inconvenience."
Thanks, pal.
People, you may have noticed, are not always considerate. This includes patients. Take Irene. Please.
Irene is 28 years old. One of my associates diagnosed pyoderma and gave Irene oral antibiotics. She called Friday afternoon to report headaches and vomiting. Because of a scheduling mix-up, not one colleague – but both of them – thought they were covering and called her back. They each phoned Friday night and left messages on Irene’s home and cell numbers. And again on Saturday, twice each. Ditto on Sunday.
Irene finally did call back. Tuesday. She said she was fine.
Gee, thanks, Irene.
Or consider Zoe. Or more precisely, consider Zoe’s mother, Hildegard. Their family had just returned from Panama, a rain-forest jaunt being just the thing for a 2-year-old. Zoe had returned with a souvenir collection of bizarre, bull’s-eye–shaped plaques all over her face and torso. I had never seen anything like them. Perhaps bites? No one else in the travel party had them.
Because the child did not seem ill, I suggested to Hildegard that we spare Zoe a biopsy and see what happened over the next few days. I photographed the spots and said I would share the pictures with an academic specialist I know. Perhaps Hildegard would send me an e-mail update in 2 days? She would.
My academic friend looked at the photos and also had no idea. And from Hildegard? Radio silence. Was Zoe OK? Was she in an ICU?
I e-mailed Hildegard. No response. Not a good sign. I called and left a message, referring to the e-mail. No response. I wrote the referring pediatrician. No answer there either.
Three weeks later, Hortense, a nurse practitioner from the pediatrician’s office, came in as a patient. With some trepidation, I asked whether she was familiar with Zoe’s condition. She wasn’t. She would check and get back. She didn’t.
But I did, when I called Hortense a couple of days later with her own biopsy results. Had she perhaps checked on Zoe? Oh, right, she had. Zoe was fine. The spots had just gone away. Must have been bites or something.
Think I’ll just up my Valium.
Of course, more prosaic examples of this sort of thing happen all the time. Like the patient who calls for an emergency appointment. He has to come in. Right away.
"9:00 o’clock?" Not convenient. Staff meeting at work.
"2:00 o’clock?" Sorry, can’t make it then.
"5:30?" OK, I’ll be there! Thanks!
Then he doesn’t show. The rash went away. Or he got a better offer. Who knows?
After all these years, I should be used to this behavior by now, but sometimes, annoyance still gets the better of me. There are people – many, actually, and not just in the office – who really need you. Really, really. Their needs are urgent, overwhelming.
Your needs, less so.
There is no point in being cranky about this. We are in the people business, which means taking people as they come. It may mean following through when we worry about the consequences of not doing so, even if the patients themselves seem oblivious. It also means not taking it for granted when people do act with consideration.
Adam’s e-mail that he hoped I was not inconvenienced really steamed me. Then I thought, "I never met this guy, and I never will. He may find this kind of behavior unhelpful in his future professional dealings. But that will be his problem, won’t it?" So I decided not to respond.
Then I changed my mind.
"Inconvenience, no," I e-mailed back. "Inconsideration, for sure."
He apologized again, and I left it at that. There’s no emoticon for a Bronx cheer, anyway.
Dr. Rockoff practices dermatology in Brookline, Mass. To respond to this column, e-mail him at our editorial offices at [email protected].

High-Pressure Paint Gun Injection Injury to the Palm
Prolactin measure didn’t help localize pituitary adenoma
SAN FRANCISCO – Measurements of prolactin levels during inferior petrosal sinus sampling did not help localize pituitary adenomas in patients with Cushing’s disease in a study of 28 patients, contradicting findings from a previous study of 28 patients.
The value of prolactin measurements in tumor localization using inferior petrosal sinus sampling (IPSS) remains unclear and needs further study in a larger, prospective study, Dr. Susmeeta T. Sharma said at the Endocrine Society’s Annual Meeting. The current and previous studies were retrospective analyses.

Although IPSS has been considered the standard test in patients with ACTH-dependent Cushing’s syndrome to differentiate between ectopic ACTH secretion and Cushing’s disease, there has been controversy about its value in localizing adenomas within the pituitary gland once a biochemical diagnosis of Cushing’s disease has been made. Various studies that used an intersinus ACTH ratio of 1.4 or greater before or after corticotropin-releasing hormone (CRH) stimulation have reported success rates as low as 50% and as high as 100% for tumor location.
A previous retrospective study of 28 patients with Cushing’s disease reported that adjusting the ACTH intersinus gradient by levels of prolactin before or after CRH stimulation, and combining the prolactin-adjusted ACTH intersinus ratio, improved pituitary adenoma localization. Magnetic resonance imaging (MRI) alone correctly localized the pituitary adenoma in 17 patients (61%), a prolactin-adjusted ACTH intersinus ratio of at least 1.4 improved the localization rate to 21 patients (75%), and combining MRI and the prolactin-adjusted ACTH intersinus ratio improved localization further to 23 patients, or 82% (Clin. Endocrinol. 2012;77:268-74).
The findings inspired the current retrospective study. The investigators looked at prolactin levels measured in stored petrosal and peripheral venous samples at baseline and at the time of peak ACTH levels after CRH stimulation for 28 patients with Cushing’s disease and ACTH-positive pituitary adenomas who underwent IPSS in 2007-2013. The investigators calculated prolactin-adjusted values by dividing each ACTH value by the concomitant ipsilateral prolactin value. They used an intersinus ACTH ratio of 1.4 or greater to predict tumor location.
At surgery, 26 patients had a single lateral tumor (meaning its epicenter was not in the midline), 1 patient had a central microadenoma, and 1 patient had a macroadenoma, reported Dr. Sharma of the National Institute of Child Health and Human Development, Bethesda, Md.
MRI findings accurately identified the location of 21 of the 26 lateral tumors (81%), compared with accurate localization in 18 patients using either the unadjusted ACTH intersinus ratio or the prolactin-adjusted ACTH intersinus ratio (69% for each), she said.
Incorrect tumor localization occurred with one patient using MRI alone and seven patients using either ratio. In four patients whose tumors could not be localized by MRI, the uncorrected and prolactin-adjusted ratios localized one tumor correctly and three tumors incorrectly. Only MRI correctly localized the one central microadenoma.
"We did not find any difference in localization rates by measurement of prolactin during IPSS," she said. The small size of the study and its retrospective design invite further research in a more robust study.
Dr. Sharma reported having no financial disclosures.
On Twitter @sherryboschert
SAN FRANCISCO – Measurements of prolactin levels during inferior petrosal sinus sampling did not help localize pituitary adenomas in patients with Cushing’s disease in a study of 28 patients, contradicting findings from a previous study of 28 patients.
The value of prolactin measurements in tumor localization using inferior petrosal sinus sampling (IPSS) remains unclear and needs further study in a larger, prospective study, Dr. Susmeeta T. Sharma said at the Endocrine Society’s Annual Meeting. The current and previous studies were retrospective analyses.
Although IPSS has been considered the standard test in patients with ACTH-dependent Cushing’s syndrome to differentiate between ectopic ACTH secretion and Cushing’s disease, there has been controversy about its value in localizing adenomas within the pituitary gland once a biochemical diagnosis of Cushing’s disease has been made. Various studies that used an intersinus ACTH ratio of 1.4 or greater before or after corticotropin-releasing hormone (CRH) stimulation have reported success rates as low as 50% and as high as 100% for tumor location.
A previous retrospective study of 28 patients with Cushing’s disease reported that adjusting the ACTH intersinus gradient by levels of prolactin before or after CRH stimulation, and combining the prolactin-adjusted ACTH intersinus ratio, improved pituitary adenoma localization. Magnetic resonance imaging (MRI) alone correctly localized the pituitary adenoma in 17 patients (61%), a prolactin-adjusted ACTH intersinus ratio of at least 1.4 improved the localization rate to 21 patients (75%), and combining MRI and the prolactin-adjusted ACTH intersinus ratio improved localization further to 23 patients, or 82% (Clin. Endocrinol. 2012;77:268-74).
The findings inspired the current retrospective study. The investigators looked at prolactin levels measured in stored petrosal and peripheral venous samples at baseline and at the time of peak ACTH levels after CRH stimulation for 28 patients with Cushing’s disease and ACTH-positive pituitary adenomas who underwent IPSS in 2007-2013. The investigators calculated prolactin-adjusted values by dividing each ACTH value by the concomitant ipsilateral prolactin value. They used an intersinus ACTH ratio of 1.4 or greater to predict tumor location.
At surgery, 26 patients had a single lateral tumor (meaning its epicenter was not in the midline), 1 patient had a central microadenoma, and 1 patient had a macroadenoma, reported Dr. Sharma of the National Institute of Child Health and Human Development, Bethesda, Md.
MRI findings accurately identified the location of 21 of the 26 lateral tumors (81%), compared with accurate localization in 18 patients using either the unadjusted ACTH intersinus ratio or the prolactin-adjusted ACTH intersinus ratio (69% for each), she said.
Incorrect tumor localization occurred with one patient using MRI alone and seven patients using either ratio. In four patients whose tumors could not be localized by MRI, the uncorrected and prolactin-adjusted ratios localized one tumor correctly and three tumors incorrectly. Only MRI correctly localized the one central microadenoma.
"We did not find any difference in localization rates by measurement of prolactin during IPSS," she said. The small size of the study and its retrospective design invite further research in a more robust study.
Dr. Sharma reported having no financial disclosures.
On Twitter @sherryboschert
AT ENDO 2013
Major finding: The unadjusted and prolactin-adjusted ACTH intersinus ratios correctly localized 18 of 26 lateral pituitary adenomas (69%), compared with 21 localized by MRI (81%).
Data source: Retrospective study of 28 patients with Cushing’s disease and ACTH-positive pituitary adenomas who underwent IPSS in 2007-2013.
Disclosures: Dr. Sharma reported having no financial disclosures.

TSFRE announces a new Awards Program
Dear Colleague,
This is to officially announce the launch of the Thoracic Surgery Foundation for Research and Education (TSFRE) 2014 Awards Program. Please view the TSFRE Summer Newsletter with information about the 2014 Awards Program, including award descriptions, a timeline, links to download award applications, and a list of 2014 Research and Education Committee members (http://tinyurl.com/kfzdjz9).
Inside the issue you’ll find a special tribute to Dr. Carolyn E. Reed, a timely essay concerning the need to support cardiothoracic surgery research in today’s climate, and information about TSFRE’s mission and history of supporting cardiothoracic surgery research and education initiatives. You’ll also see the faces of many TSFRE supporters and friends.

I’d also like to mention that 2013 marks the 25th Anniversary of TSFRE. Since 1988, we have supported over $11 million toward cardiothoracic surgery research projects. We could not have accomplished this without the partnership of our society friends, the American Association for Thoracic Surgery (AATS), The Society of Thoracic Surgeons (STS), the Southern Thoracic Surgical Association (STSA), and the Western Thoracic Surgical Association (WTSA). And, we especially could not have achieved this without your support.
The quality and quantity of TSFRE-funded projects over the past 25 years have been phenomenal. Please join me today in making a contribution to the TSFRE 25th Anniversary Campaign by clicking on the link in the newsletter. Your donation will help ensure that TSFRE can continue funding important cardiothoracic surgery research and education for the next 25 years.
Thank you for your generosity as we head into our 25th year!
G. Alexander Patterson, M.D.
TSFRE President
Dear Colleague,
This is to officially announce the launch of the Thoracic Surgery Foundation for Research and Education (TSFRE) 2014 Awards Program. Please view the TSFRE Summer Newsletter with information about the 2014 Awards Program, including award descriptions, a timeline, links to download award applications, and a list of 2014 Research and Education Committee members (http://tinyurl.com/kfzdjz9).
Inside the issue you’ll find a special tribute to Dr. Carolyn E. Reed, a timely essay concerning the need to support cardiothoracic surgery research in today’s climate, and information about TSFRE’s mission and history of supporting cardiothoracic surgery research and education initiatives. You’ll also see the faces of many TSFRE supporters and friends.
I’d also like to mention that 2013 marks the 25th Anniversary of TSFRE. Since 1988, we have supported over $11 million toward cardiothoracic surgery research projects. We could not have accomplished this without the partnership of our society friends, the American Association for Thoracic Surgery (AATS), The Society of Thoracic Surgeons (STS), the Southern Thoracic Surgical Association (STSA), and the Western Thoracic Surgical Association (WTSA). And, we especially could not have achieved this without your support.
The quality and quantity of TSFRE-funded projects over the past 25 years have been phenomenal. Please join me today in making a contribution to the TSFRE 25th Anniversary Campaign by clicking on the link in the newsletter. Your donation will help ensure that TSFRE can continue funding important cardiothoracic surgery research and education for the next 25 years.
Thank you for your generosity as we head into our 25th year!
G. Alexander Patterson, M.D.
TSFRE President

An ounce of prevention is worth thousands of lives
Vaccinations and other preventive medicine issues are commonly felt to be the responsibility of primary care physicians.
After all, we are far too busy at the hospital putting out fires and dealing with acute, life-threatening emergencies to address routine matters, no matter how significant they may be, right? And, of course, our office-based colleagues have a lot of extra time on their hands. They merely have to see an unending stream of sick patients, return phone calls, refill prescriptions, and keep up with government regulations, implement new EHRs, ad nauseam. (Do any of these tasks remind you of why you steered clear of primary care in the first place?)
We all know that primary preventive issues often fall through the cracks for one reason or another. Many physicians have argued that "preventive services are not billable." Fortunately, with new regulations and the push for quality, accountable care, more primary care physicians will be forced to take preventive services more seriously.
But what about us?

In our day-to-day activities on the wards, do we really spend enough time on how we can prevent the potentially easy-to-prevent hospitalizations, or is our focus lost in the demands of meeting core measures and discharging patients as efficiently and safely as possible, pulling out our hair while trying to input orders electronically, or meeting a myriad of other challenges to using the latest EHR we need to learn? Or maybe the task of screening patients for vaccines is simply left up to the nursing staff.
A recent article titled "U.S. Hospitalizations for Pneumonia after a Decade of Pneumococcal Vaccination" gives us strong reason to rethink our sometimes laissez-faire attitude toward immunization (N. Engl. J. Med. 2013;369:155-63).
Specifically, investigators compared the average annual rates of pneumonia-related hospitalizations from 1997 through 1999 (prior to the introduction of the 7-valent pneumococcal conjugate vaccine [PCV7] into the U.S. childhood immunization schedule in 2000) to rates from 2007 through 2009, after its introduction. They calculated that there were 47,000 fewer annual hospitalizations than expected among children younger than 2 years of age and 73,000 fewer hospitalizations annually for adults 85 years of age or older, based on the rates of hospitalization prior to introduction of PCV7. When all age groups were evaluated, investigators reported a total of 168,000 fewer hospitalizations annually.
That is a tremendous disease burden that has been prevented thus far, and it provides undeniable proof that we should all take vaccination very seriously, no matter how busy we may be.
Dr. Hester is a hospitalist with Baltimore-Washington Medical Center who has a passion for empowering patients to partner in their health care. She is the creator of the Patient Whiz, a patient-engagement app for iOS.
Vaccinations and other preventive medicine issues are commonly felt to be the responsibility of primary care physicians.
After all, we are far too busy at the hospital putting out fires and dealing with acute, life-threatening emergencies to address routine matters, no matter how significant they may be, right? And, of course, our office-based colleagues have a lot of extra time on their hands. They merely have to see an unending stream of sick patients, return phone calls, refill prescriptions, and keep up with government regulations, implement new EHRs, ad nauseam. (Do any of these tasks remind you of why you steered clear of primary care in the first place?)
We all know that primary preventive issues often fall through the cracks for one reason or another. Many physicians have argued that "preventive services are not billable." Fortunately, with new regulations and the push for quality, accountable care, more primary care physicians will be forced to take preventive services more seriously.
But what about us?
In our day-to-day activities on the wards, do we really spend enough time on how we can prevent the potentially easy-to-prevent hospitalizations, or is our focus lost in the demands of meeting core measures and discharging patients as efficiently and safely as possible, pulling out our hair while trying to input orders electronically, or meeting a myriad of other challenges to using the latest EHR we need to learn? Or maybe the task of screening patients for vaccines is simply left up to the nursing staff.
A recent article titled "U.S. Hospitalizations for Pneumonia after a Decade of Pneumococcal Vaccination" gives us strong reason to rethink our sometimes laissez-faire attitude toward immunization (N. Engl. J. Med. 2013;369:155-63).
Specifically, investigators compared the average annual rates of pneumonia-related hospitalizations from 1997 through 1999 (prior to the introduction of the 7-valent pneumococcal conjugate vaccine [PCV7] into the U.S. childhood immunization schedule in 2000) to rates from 2007 through 2009, after its introduction. They calculated that there were 47,000 fewer annual hospitalizations than expected among children younger than 2 years of age and 73,000 fewer hospitalizations annually for adults 85 years of age or older, based on the rates of hospitalization prior to introduction of PCV7. When all age groups were evaluated, investigators reported a total of 168,000 fewer hospitalizations annually.
That is a tremendous disease burden that has been prevented thus far, and it provides undeniable proof that we should all take vaccination very seriously, no matter how busy we may be.
Dr. Hester is a hospitalist with Baltimore-Washington Medical Center who has a passion for empowering patients to partner in their health care. She is the creator of the Patient Whiz, a patient-engagement app for iOS.

A Validated Delirium Prediction Rule
Delirium is characterized by fluctuating disturbances in cognition and consciousness and is a common complication of hospitalization in medical and surgical patients. Studies estimate the prevalence of delirium in hospitalized patients[1] to be 14% to 56%, and up to 70% in critically ill elderly patients.[2] Estimates of total healthcare costs associated with delirium range from $38 to $152 billion per year in the United States.[3] Delirious patients are more likely to be discharged to a nursing home and have increased hospital mortality and longer lengths of stay.[4, 5, 6] Recent data suggest long‐term effects of delirium including cognitive impairments up to 1 year following the illness[7] and an increased likelihood of developing[8] or worsening dementia.[9]
It is estimated that one‐third of hospital‐acquired delirium cases could be prevented with appropriate interventions.[10] A prediction rule that easily and accurately identifies high‐risk patients upon admission could therefore have a substantial clinical impact. In addition, a prediction rule could be used to identify patients in whom new targeted interventions for delirium prevention could be investigated. A number of risk factors for delirium have been identified, including older age, preexisting cognitive dysfunction, vision and hearing impairment, severe illness, dehydration, electrolyte abnormalities, overmedication, and alcohol abuse.[11, 12, 13, 14, 15, 16] Existing prediction rules using various combinations of these measures have been limited by their complexity,[17] do not predict incident delirium,[18, 19] or are restricted to surgical[20, 21, 22] or intensive care[23] patients and therefore are not broadly applicable to the general medical population, which is particularly susceptible to developing delirium.
We conducted this study to develop a simple, efficient, and accurate prediction rule for hospital‐acquired delirium in adult medical inpatients assessed at the time of admission. Our a priori hypothesis was that a delirium prediction rule would consist of a combination of known risk factors and most likely incorporate old age, illness severity, and preexisting cognitive dysfunction.
METHODS
Design and Setting
This was a prospective cohort study with a derivation phase from May 2010 to November 2010 at 2 hospitals at the University of California, San Francisco (UCSF) (Moffitt‐Long and Mount Zion Hospitals) and a validation phase from October 2011 to March 2012 at the San Francisco Veterans Affairs Medical Center (SFVAMC).
Participants and Measurements
Subject identification, recruitment, and inclusion and exclusion criteria were identical for the derivation and validation cohorts. Subjects were identified by reviewing daily admission logs. All non‐intensive care unit patients aged 50 years or older admitted through the emergency department to the medicine, cardiology, or neurology services were screened for eligibility through chart review or in person within 24 hours of admission by a trained research assistant. One research assistant, a college graduate, conducted all screening for the derivation cohort, and 2 research assistants, 1 a fourth‐year medical student and the other a third‐year psychology graduate student, conducted screening for the validation cohort. In‐person screening included an assessment for delirium using the long version of the Confusion Assessment Method (CAM).[24] To minimize the possibility of enrolling delirious subjects, research assistants were instructed to notify the study supervisor (V.C.D.), a board‐certified neurologist, to discuss every case in which any yes checkbox was marked on the CAM score sheet. Subjects delirious upon initial evaluation, admitted for alcohol withdrawal, admitted for comfort care, who were aphasic or who could not speak English were excluded. For all patients, or if they were unable to provide consent, their surrogates provided written informed consent, and the study was approved by the institutional review boards at UCSF and SFVAMC.
In the derivation cohort, 1241 patients were screened, and 439 were eligible for enrollment. Of these, 180 declined, 50 were discharged prior to the first follow‐up visit, and 209 were included. In the validation cohort, 420 patients were screened, and 368 were eligible for enrollment. Of these, 144 declined, 59 were discharged prior to the first follow‐up visit, and 165 were included.
Baseline data regarding known delirium risk factors[11, 12, 13, 14, 15, 16] were collected from subjects in the derivation cohort. Cognitive performance was assessed with the Mini Mental Status Examination (MMSE),[25] forward digit span,[26] and clock draw.[27] Permission for administration of the MMSE was granted by Psychological Assessment Resources, Inc., and each administration was paid for. A structured interview was conducted with validated questions regarding visual and hearing impairment, pain, mobility, place of residence, and alcohol, tobacco, and drug use.[28, 29, 30, 31] A whisper test for hearing loss was performed.[32] Subjects' charts were reviewed for demographic, clinical, and laboratory data. Illness severity was assessed by asking each subject's nurse to rate their patient on a scale from not ill to mildly ill, moderately ill, severely ill, or moribund.[33] Each nurse was shown these 5 choices, but more specific definitions of what each level of illness severity meant were not provided. We chose this method to assess illness severity because this rating scale was incorporated into a previous validated and widely cited delirium prediction rule.[17] This illness severity scale has been validated as a predictor of outcomes and correlates with other measures of illness severity and comorbidity when graded by physicians.[33, 34] Nurse and physician ratings of illness severity have been shown to be comparable,[35] and therefore if the scale were incorporated into the prediction rule it would allow nurses to perform it independently. In the validation cohort, only data required to complete the baseline CAM and apply the prediction rule were collected.
Assessment of Outcomes
All subjects were assessed for delirium daily for 6 days after enrollment or until discharge, whichever came first. Follow‐up was limited to 6 days, based on the assumption that delirium occurring beyond 1 week is more likely due to events during the hospitalization as opposed to factors measurable at admission. Delirium was assessed using the short CAM, an internationally recognized and validated tool.[24] To complete the CAM during follow‐up visits, subjects and their nurses were interviewed using a written script, and an MMSE and forward digit span were performed.
Daily follow‐up assessments were performed by research assistants who were not blinded to the initial assessment but who, in the validation phase, were blinded to the prediction rule score. Some weekend follow‐ups were performed by postgraduate year 2, 3, or 4 neurology residents, or internal medicine faculty experienced in the assessment of delirium and blinded to both the initial assessment and prediction rule score. Neurology residents and internists read the CAM training manual and were educated in the administration and scoring of the CAM by 1 of the senior investigators (V.C.D.) prior to their first shift; these nonstudy personnel covered 17 of 189 days of follow‐up in the derivation cohort and 21 of 169 days of follow‐up in the validation cohort. To maximize sensitivity of delirium detection, for any change in cognition, MMSE score, or forward digit span compared to baseline, a board‐certified neurologist blinded to the initial assessment was notified to discuss the case and validate the diagnosis of delirium in person (derivation cohort) or over the phone (validation cohort). All research assistants were trained by a board‐certified neurologist (V.C.D.) in the administration and interpretation of the CAM using published methods prior to enrollment of any subjects.[36] Training included the performance of independent long‐version CAMs by the trainer and the trainee on a series of delirious and nondelirious patients until there was consistent agreement for each item on the CAM in 5 consecutive patients. In addition, a board‐certified neurologist supervised the first 5 administrations of the CAM performed by each research assistant.
Statistical Analysis
Sample size for the derivation cohort was based on the predicted ability to detect a difference in rates of delirium among those with and without cognitive impairment, the strongest risk factor for delirium. Using a [2] test with an of 0.05 and of 0.80, we estimated we would need to enroll 260 subjects, assuming a prevalence of cognitive dysfunction in our cohort of 10% and an estimated rate of delirium of 24% and 6% among those with and without cognitive dysfunction respectively.[14, 16, 17, 20] We were unable to reach enrollment targets because of a short funding period and slower than expected recruitment.
To construct the prediction rule in the derivation cohort, all variables were dichotomized. Age was dichotomized at 80 years because old age is a known risk factor for delirium, and only 1 of 46 subjects between the ages of 70 and 80 years became delirious in the derivation cohort. Components of the MMSE were dichotomized as correct/emncorrect, with a correct response requiring perfect performance based on expert consensus. For 3 subjects who would not attempt to spell world backward (2 in the derivation and 1 in the validation cohort), their score on serial 7s was used instead. The total MMSE score was not used because our objective was to develop a prediction rule using elements that could be assessed quickly in the fast‐paced environment of the hospital. Illness severity was dichotomized at moderate or worse/mild or better because there were only 15 subjects in the severe illness category, and the majority of delirium (22 outcomes) occurred in the moderate illness category. High blood urea nitrogen:creatinine ratio was defined as >18.[37]
The association between predictor variables and occurrence of delirium was analyzed using univariate logistic regression. A forward stepwise logistic regression was then performed using the variables associated with the outcome at a significance level of P<0.05 in univariate analysis. Variables were eligible for addition to the multivariable model if they were associated with the outcome at a significance level of <0.05. The 4 independent predictors thus identified were combined into a prediction rule by assigning each predictor 1 point if present. The performance of the prediction rule was assessed by using Cuzick's nonparametric test for a trend across groups ordered by score.[38]
The prediction rule was tested in the validation cohort using the nonparametric test for trend. Receiver operating characteristic (ROC) curves were compared between the derivation and validation cohorts. All statistical analysis was performed using Stata software (StataCorp, College Station, TX).
RESULTS
The derivation cohort consisted of elderly patients (mean age, 68.0811.96 years; interquartile range, 5096 years), and included more males than females (54.1% vs 45.9%). Subjects were predominantly white (73.7%) and lived at home (90%) (Table 1). The mean admission MMSE score was 27.0 (standard deviation [SD], 3.4; range, 730). Median follow‐up was 2 days (interquartile range, 13). Delirium developed in 12% (n=25) of the cohort.
| Derivation Cohort, N=209 | Validation Cohort, N=165 | |
|---|---|---|
| ||
| Gender, No. (%) | ||
| Male | 113 (54) | 157 (95) |
| Female | 96 (46) | 8 (4.8) |
| Race, No. (%) | ||
| White | 154 (74) | 125 (76) |
| African American | 34 (16) | 25 (15) |
| Asian | 21 (10.0) | 13 (7.9) |
| Native American | 0 | 2 (1.2) |
| Illness severity, No. (%) | ||
| Not ill | 1 (0.5) | 0 |
| Mildly ill | 49 (23) | 62 (38) |
| Moderately ill | 129 (62) | 86 (52) |
| Severely ill | 15 (7.2) | 17 (10) |
| Moribund | 0 | 0 |
| Living situation, No. (%) | ||
| Home | 188 (90) | 147 (89) |
| Assisted living | 11 (5.3) | 6 (3.6) |
| Hotel | 4 (1.9) | 5 (3.0) |
| SNF | 1 (0.5) | 3 (1.8) |
| Homeless | 4 (1.9) | 4 (2.4) |
| Developed delirium | 25 (12) | 14 (8.5) |
Univariate analysis of the derivation study identified 10 variables significantly associated (P<0.05) with delirium (Table 2). Predictors of delirium included abnormal scores on 4 subtests of the MMSE, low score on the Mini‐Cog, living in an assisted living or skilled nursing facility, moderate to severe illness, old age, a past history of dementia, and hearing loss as assessed by the whisper test. These predictors were then entered into a stepwise logistic regression analysis that identified 4 independent predictors of delirium (Table 3).
| Variable | No. (%) Without Delirium | No. (%) With Delirium | Odds Ratio | P Value | 95% Confidence Interval |
|---|---|---|---|---|---|
| |||||
| Age 80 years | 30 (16) | 13 (52) | 5.6 | <0.001 | 2.313.4 |
| Male sex | 99 (54) | 14 (56) | 1.1 | 0.84 | 0.52.5 |
| White race | 135 (73) | 19 (76) | 1.2 | 0.78 | 0.433.1 |
| Score <5 on date questions of MMSE | 37 (20) | 12 (48) | 3.7 | 0.003 | 1.68.7 |
| Score <5 on place questions of MMSE | 50 (27) | 14 (56) | 3.4 | 0.005 | 1.58.0 |
| Score <3 on MMSE recall | 89 (48) | 18 (72) | 2.7 | 0.03 | 1.16.9 |
| Score <5 on MMSE W‐O‐R‐L‐D backward | 37 (20) | 13 (52) | 4.3 | 0.001 | 1.810.2 |
| Score 0 on MMSE pentagon copy, n=203 | 53 (30) | 12 (48) | 2.2 | 0.07 | 0.935.1 |
| Score 0 on clock draw, n=203 | 70 (39) | 15 (60) | 2.3 | 0.05 | 0.985.4 |
| MiniCog score 02, n=203[27] | 46 (26) | 12 (48) | 2.7 | 0.03 | 1.16.2 |
| Self‐rated vision fair, poor, or very poor | 55 (30) | 8 (32) | 1.1 | 0.83 | 0.452.7 |
| Endorses hearing loss | 89 (48) | 12 (48) | 0.99 | 0.97 | 0.432.3 |
| Uses hearing aid | 19 (10) | 2 (8) | 0.76 | 0.72 | 0.173.5 |
| Fails whisper test in either ear | 39 (21) | 10 (40) | 2.5 | 0.04 | 1.05.9 |
| Prior episode of delirium per patient or informant | 70 (38) | 13 (52) | 1.8 | 0.19 | 0.764.1 |
| Dementia in past medical history | 3 (2) | 3 (12) | 8.2 | 0.01 | 1.643.3 |
| Depression in past medical history | 16 (9) | 1 (4) | 0.44 | 0.43 | 0.063.5 |
| Lives in assisted living or SNF | 8 (4) | 4 (16) | 4.2 | 0.03 | 1.215.1 |
| Endorses pain | 82 (45) | 7 (28) | 0.48 | 0.12 | 0.191.2 |
| Less than independent for transfers | 11 (6) | 3 (12) | 2.1 | 0.27 | 0.568.3 |
| Less than independent for mobility on a level surface | 36 (20) | 7 (28) | 1.6 | 0.33 | 0.624.1 |
| Score of 24 on CAGE questionnaire[29] | 5 (3) | 0 (0) | No outcomes | ||
| Drinks any alcohol | 84 (46) | 10 (40) | 0.79 | 0.60 | 0.341.9 |
| Current smoker | 20 (11) | 2 (8) | 0.71 | 0.66 | 0.164.1 |
| Uses illicit drugs | 13 (7) | 2 (8) | 1.2 | 0.83 | 0.255.6 |
| Moderately or severely ill on nursing assessment, n=194 | 121 (71) | 23 (96) | 9.3 | 0.031 | 1.270.9 |
| Fever | 8 (4) | 0 (0) | No outcomes | ||
| Serum sodium <134mmol/L | 38 (21) | 3 (12) | 0.52 | 0.31 | 0.151.8 |
| WBC count>10109/L, n=208 | 57 (31) | 6 (24) | 0.70 | 0.47 | 0.261.8 |
| AST>41 U/L, n=131 | 27 (23) | 2 (15) | 0.61 | 0.54 | 0.132.9 |
| BUN:Cr>18, n=208 | 66 (36) | 13 (52) | 1.9 | 0.13 | 0.834.5 |
| Infection as admission diagnosis | 28 (15) | 4 (16) | 1.1 | 0.92 | 0.343.3 |
| Variable | Odds Ratio | 95% Confidence Interval | P Value | Points Toward AWOL Score |
|---|---|---|---|---|
| Age 80 years | 5.7 | 2.115.6 | 0.001 | 1 |
| Unable to correctly spell world backward | 3.5 | 1.39.6 | 0.01 | 1 |
| Not oriented to city, state, county, hospital name, and floor | 2.9 | 1.17.9 | 0.03 | 1 |
| Nursing illness severity assessment of moderately ill, severely ill, or moribund (as opposed to not ill or mildly ill) | 10.5 | 1.386.9 | 0.03 | 1 |
These 4 independent predictors were assigned 1 point each if present to create a prediction rule with a range of possible scores from 0 to 4. There was a significant trend predicting higher rates of delirium with higher scores, with no subjects who scored 0 becoming delirious, compared to 40% of those subjects scoring 3 or 4 (P for trend<0.001) (Table 4).
| Derivation Cohorta | Validation Cohort | Combined Cohorts | ||||
|---|---|---|---|---|---|---|
| AWOL Score | Not Delirious | Delirious | Not Delirious | Delirious | Not Delirious | Delirious |
| ||||||
| 0 | 26 (100%) | 0 (0%) | 24 (96%) | 1 (4%) | 49 (98%) | 1 (2%) |
| 1 | 86 (95%) | 5 (5%) | 57 (97%) | 2 (3%) | 136 (96%) | 5 (4%) |
| 2 | 41 (85%) | 7 (15%) | 44 (90%) | 5 (10%) | 92 (86%) | 15 (14%) |
| 3 | 17 (74%) | 6 (26%) | 22 (79%) | 6 (21%) | 40 (80%) | 10 (20%) |
| 4 | 0 (0%) | 6 (100%) | 4 (100%) | 0 (0%) | 4 (36%) | 7 (64%) |
| Total | 170 | 24 | 151 | 14 | 321 | 38 |
| P<0.001 | P=0.025 | P<0.001 | ||||
The validation cohort consisted of adults with a mean age of 70.7210.6 years, (interquartile range, 5194 years), who were predominantly white (75.8%) and overwhelmingly male (95.2%) (Table 1). The mean admission MMSE score was 26.75 (SD, 2.8; range, 1730). Median follow‐up was 2 days (interquartile range, 15). Delirium developed in 8.5% (n=14) of the cohort. In the validation cohort, 4% of subjects with a score of 0 became delirious, whereas 19% of those scoring 3 or 4 became delirious (P for trend 0.025) (Table 4).
ROC curves were compared for the derivation and validation cohorts. The area under the ROC curve for the derivation cohort (0.81, 95% confidence interval [CI]: 0.720.90) was slightly better than that in the validation cohort (0.69, 95% CI: 0.540.83), but the difference did not reach statistical significance (P=0.14) (Figure 1).

DISCUSSION
We derived and validated a prediction rule to assess the risk of developing delirium in hospitalized adult medical patients. Four variables easily assessed on admission in a screen lasting less than 2 minutes were independently associated with the development of delirium. The prediction rule can be remembered with the following mnemonic: AWOL (Age80 years; unable to spell World backward; not fully Oriented to place; and moderate or severe iLlness severity).
It is estimated up to a third of hospital acquired delirium cases can be prevented.[10] Recent guidelines recommend the use of a multicomponent intervention to prevent delirium and provide evidence that such a strategy would be cost‐effective.[39] Nevertheless, such interventions are resource intense, requiring specialized nurse training and staffing[40] and have not been widely implemented. Acute care for the elderly units, where interventions to prevent delirium might logically be implemented, also require physical remodeling to provide carpeted hallways, handrails, and elevated toilet seats and door levers.[41] A method of risk stratification to identify the patients who would benefit most from resource‐intensive prevention strategies would be valuable.
The AWOL tool may provide a practical alternative to existing delirium prediction rules for adult medical inpatients. Because it can be completed by a nurse in <2 minutes, the AWOL tool may be easier to apply and disseminate than a previously described score relying on the MMSE, Acute Physiology and Chronic Health Evaluation scores, and measured visual acuity.[17] Two other tools, 1 based on chart abstraction[18] and the other based on clinical variables measured at admission,[19] are similarly easy to apply but only predict prevalent and not incident delirium, making them less clinically useful.
This study's strengths include its prospective cohort design and the derivation and validation being performed in different hospitals. The derivation cohort consisted of patients admitted to a tertiary care academic medical center or an affiliated hospital where routine mixed gender general medical patients are treated, whereas validation was performed at the SFVAMC, where patients are predominantly older men with a high incidence of vascular risk factors. The outcome was assessed on a daily basis, and the likelihood any cases were missed was low. Although there is some potential for bias because the outcome was assessed by a research assistant not blinded to baseline characteristics, this was mitigated by having each outcome validated by a blinded neurologist and in the validation cohort having the research assistant blinded to the AWOL score. Other strengths are the broad inclusion criteria, with both middle‐aged and elderly patients having a wide range of medical and neurological conditions, allowing for wide application of the results. Although many studies of delirium focus on patients over age 70 years, we chose to include patients aged 50 years or older because hospital‐acquired delirium still occurs in this age group (17 of 195 [8%] patients aged 5069 years became delirious in this study), and risk factors such as severe illness and cognitive dysfunction are likely to be predictors of delirium even at younger ages. Additionally, the inclusion of nurses' clinical judgment to assess illness severity using a straightforward rating scale allows bedside nurses to readily administer the prediction rule in practice.[34]
This study has several potential limitations. The number of outcomes in the derivation cohort was small compared to the number of predictors chosen for the prediction rule. This could potentially have led to overfitting the model in the derivation cohort and thus an overly optimistic estimation of the model's performance. In the validation cohort, the area under the ROC curve was lower than in the derivation cohort, and although the difference did not reach statistical significance, this may have been due to the small sample size. In addition, none of the 4 subjects with an AWOL score of 4 became delirious, potentially reflecting poor calibration of the prediction rule. However, the trend of higher rates of delirium among subjects with higher AWOL scores still reached statistical significance, and the prediction rule demonstrated good discrimination between patients at high and low risk for developing delirium.
To test whether a better prediction tool could be derived from our data, we combined the derivation and validation cohorts and repeated a stepwise multivariable logistic regression with the same variables used for derivation of the AWOL tool (with the exception of the whisper test of hearing and a past medical history of dementia, because these data were not collected in the validation cohort). This model produced the same 4 independent predictors of delirium used in the AWOL tool. We then used bootstrapping to internally validate the prediction rule, suggesting that the predictors in the AWOL tool were the best fit for the available data. However, given the small number of outcomes in our study, the AWOL tool may benefit from further validation in a larger independent cohort to more precisely calibrate the number of expected outcomes with each score.
Although the majority of medical inpatients were eligible for enrollment in our study, some populations were excluded, and our results may not generalize to these populations. Non‐English speaking patients were excluded to preserve the validity of our study instruments. In addition, patients with profound aphasia or an admission diagnosis of alcohol withdrawal were excluded. Patients discharged on the first day of their hospitalization were excluded either because they were discharged prior to screening or prior to their first follow‐up visit. Therefore, our results may only be valid in patients who remained in the hospital for over 24 hours. In addition, because we only included medical patients, our results cannot necessarily be generalized to the surgical population.
Finally, parts of the prediction rule (orientation and spelling world backward) are also components of the CAM and were used in the assessment of the outcome, and this may introduce a potential tautology: if patients are disoriented or have poor attention because they cannot spell world backward at admission, they already have fulfilled part of the criteria for delirium. However, a diagnosis of delirium using the CAM involves a comprehensive patient and caregiver interview, and in addition to poor attention, requires the presence of an acute change in mental status and disorganized thinking or altered level of consciousness. Therefore, it is possible, and common, for patients to be disoriented to place and/or unable to spell world backward, yet not be delirious, and predicting a subsequent change in cognition during the hospitalization is still clinically important. It is possible the AWOL tool works by identifying patients with impaired attention and subclinical delirium, but one could argue this makes a strong case for its validity because these patients especially should be triaged to an inpatient unit that specializes in delirium prevention. It is also possible the cognitive tasks that are part of the AWOL tool detect preexisting cognitive impairment, which is in turn a major risk factor for delirium.
Recognizing and classifying the risk of delirium during hospitalization is imperative, considering the illness' significant contribution to healthcare costs, morbidity, and mortality. The cost‐effectiveness of proven interventions to detect and prevent delirium could be magnified with focused implementation in those patients at highest risk.[39, 40, 41] Further research is required to determine whether the combination of delirium prediction rules such as those developed here and prevention strategies will result in decreased rates of delirium and economic savings for the healthcare system.
Acknowledgments
The following University of California, San Francisco neurology residents provided follow‐up of study subjects on weekends and were financially compensated: Amar Dhand, MD, DPhil; Tim West, MD; Sarah Shalev, MD; Karen DaSilva, MD; Mark Burish, MD, PhD; Maggie Waung, MD, PhD; Raquel Gardner, MD; Molly Burnett, MD; Adam Ziemann, MD, PhD; Kathryn Kvam, MD; Neel Singhal, MD, PhD; James Orengo, MD, PhD; Kelly Mills, MD; and Joanna Hellmuth, MD, MHS. The authors are grateful to Dr. Douglas Bauer for assisting with the study design.
Disclosures
Drs. Douglas, Hessler, Dhaliwal, Betjemann, Lucatorto, Johnston, Josephson, and Ms. Fukuda and Ms. Alameddine have no conflicts of interest or financial disclosures. This research was made possible by the Ruth E. Raskin Fund and a UCSF Dean's Research Scholarship. These funding agencies had no role in the design and conduct of the study; collection, management, analysis, and interpretation of the data; and preparation, review, or approval of the manuscript.
- , , . Occurrence and outcome of delirium in medical in‐patients: a systematic literature review. Age Ageing. 2006;35(4):350–364.
- , , , , , . Delirium in the intensive care unit: occurrence and clinical course in older patients. J Am Geriatr Soc. 2003;51(5):591–598.
- , , , , . One‐year health care costs associated with delirium in the elderly population. Arch Intern Med. 2008;168(1):27–32.
- , , , , . Does delirium contribute to poor hospital outcomes? A three‐site epidemiologic study. J Gen Intern Med. 1998;13(4):234–242.
- , , , , , . Delirium duration and mortality in lightly sedated, mechanically ventilated intensive care patients. Crit Care Med. 2010;38(12):2311–2318.
- , , , et al. Delirium epidemiology in critical care (DECCA): an international study. Crit Care. 2010;14(6):R210.
- , , , et al. Delirium as a predictor of long‐term cognitive impairment in survivors of critical illness. Crit Care Med. 2010;38(7):1513–1520.
- , , , , , . Delirium in elderly patients and the risk of postdischarge mortality, institutionalization, and dementia: a meta‐analysis. JAMA. 2010;304(4):443–451.
- , , , et al. Adverse outcomes after hospitalization and delirium in persons with Alzheimer disease. Ann Intern Med. 2012;156(12):848–856.
- , , , et al. A multicomponent intervention to prevent delirium in hospitalized older patients. N Engl J Med. 1999;340(9):669–676.
- , , , et al. Simple cognitive testing (Mini‐Cog) predicts in‐hospital delirium in the elderly. J Am Geriatr Soc. 2007;55(2):314–316.
- , , . A prospective study of delirium in hospitalized elderly. JAMA. 1990;263(8):1097–1101.
- , . Precipitating factors for delirium in hospitalized elderly persons. Predictive model and interrelationship with baseline vulnerability. JAMA. 1996;275(11):852–857.
- , , , , , . Risk factors for delirium at discharge: development and validation of a predictive model. Arch Intern Med. 2007;167(13):1406–1413.
- , . Delirium in vascular surgery. Eur J Vasc Endovasc Surg. 2007;34(2):131–134.
- , , , , , . Delirium in hospitalized older persons: outcomes and predictors. J Am Geriatr Soc. 1994;42(8):809–815.
- , , , , . A predictive model for delirium in hospitalized elderly medical patients based on admission characteristics. Ann Intern Med. 1993;119(6):474–481.
- , , , , , . Validation of a medical record‐based delirium risk assessment. J Am Geriatr Soc. 2011;59(suppl 2):S289–S294.
- , , , et al. Derivation and validation of a clinical prediction rule for delirium in patients admitted to a medical ward: an observational study. BMJ Open. 2012;2(5) pii: e001599.
- , , , et al. A clinical prediction rule for delirium after elective noncardiac surgery. JAMA. 1994;271(2):134–139.
- , , , , , . Prediction of postoperative delirium after abdominal surgery in the elderly. J Anesth. 2009;23(1):51–56.
- , , , et al. Derivation and validation of a preoperative prediction rule for delirium after cardiac surgery. Circulation. 2009;119(2):229–236.
- , , , et al. Development and validation of PRE‐DELIRIC (PREdiction of DELIRium in ICu patients) delirium prediction model for intensive care patients: observational multicentre study. BMJ. 2012;344:e420.
- , , , , , . Clarifying confusion: the confusion assessment method. A new method for detection of delirium. Ann Intern Med. 1990;113(12):941–948.
- , , . “Mini‐mental state”. A practical method for grading the cognitive state of patients for the clinician. J Psychiatr Res. 1975;12(3):189–198.
- . Wechsler Memory Scale‐III. New York, NY: Psychological Corp.; 1997.
- , , , , . The mini‐cog: a cognitive 'vital signs' measure for dementia screening in multi‐lingual elderly. Int J Geriatr Psychiatry. 2000;15(11):1021–1027.
- , . Functional evaluation: the Barthel index. Md State Med J. 1965;14:61–65.
- , , . The CAGE questionnaire: validation of a new alcoholism screening instrument. Am J Psychiatry. 1974;131(10):1121–1123.
- , , , , , . Is the NEI‐VFQ‐25 a useful tool in identifying visual impairment in an elderly population? BMC Ophthalmol. 2006;6:24.
- , , , et al. Validation of self‐reported hearing loss. The Blue Mountains Hearing Study. Int J Epidemiol. 2001;30(6):1371–1378.
- , , . Does this patient have hearing impairment? JAMA. 2006;295(4):416–428.
- , , , , , . Realizing the potential of clinical judgment: a real‐time strategy for predicting outcomes and cost for medical inpatients. Am J Med. 2000;109(3):189–195.
- , , , , , . Assessing illness severity: does clinical judgment work? J Chronic Dis. 1986;39(6):439–452.
- , , , , , . Prognostication in acutely admitted older patients by nurses and physicians. J Gen Intern Med. 2008;23(11):1883–1889.
- . The Confusion Assessment Method (CAM): Training Manual and Coding Guide. New Haven, CT: Yale University School of Medicine; 2003.
- , , , . Acute confusional states and dementia in the elderly: the role of dehydration/volume depletion, physical illness and age. Age Ageing. 1980;9(3):137–146.
- . A Wilcoxon‐type test for trend. Stat Med. 1985;4(1):87–90.
- , , , . Synopsis of the National Institute for Health and Clinical Excellence guideline for prevention of delirium. Ann Intern Med. 2011;154(11):746–751.
- , , , , . The Hospital Elder Life Program: a model of care to prevent cognitive and functional decline in older hospitalized patients. Hospital Elder Life Program. J Am Geriatr Soc. 2000;48(12):1697–1706.
- , , , , . A randomized trial of care in a hospital medical unit especially designed to improve the functional outcomes of acutely ill older patients. N Engl J Med. 1995;332(20):1338–1344.
Delirium is characterized by fluctuating disturbances in cognition and consciousness and is a common complication of hospitalization in medical and surgical patients. Studies estimate the prevalence of delirium in hospitalized patients[1] to be 14% to 56%, and up to 70% in critically ill elderly patients.[2] Estimates of total healthcare costs associated with delirium range from $38 to $152 billion per year in the United States.[3] Delirious patients are more likely to be discharged to a nursing home and have increased hospital mortality and longer lengths of stay.[4, 5, 6] Recent data suggest long‐term effects of delirium including cognitive impairments up to 1 year following the illness[7] and an increased likelihood of developing[8] or worsening dementia.[9]
It is estimated that one‐third of hospital‐acquired delirium cases could be prevented with appropriate interventions.[10] A prediction rule that easily and accurately identifies high‐risk patients upon admission could therefore have a substantial clinical impact. In addition, a prediction rule could be used to identify patients in whom new targeted interventions for delirium prevention could be investigated. A number of risk factors for delirium have been identified, including older age, preexisting cognitive dysfunction, vision and hearing impairment, severe illness, dehydration, electrolyte abnormalities, overmedication, and alcohol abuse.[11, 12, 13, 14, 15, 16] Existing prediction rules using various combinations of these measures have been limited by their complexity,[17] do not predict incident delirium,[18, 19] or are restricted to surgical[20, 21, 22] or intensive care[23] patients and therefore are not broadly applicable to the general medical population, which is particularly susceptible to developing delirium.
We conducted this study to develop a simple, efficient, and accurate prediction rule for hospital‐acquired delirium in adult medical inpatients assessed at the time of admission. Our a priori hypothesis was that a delirium prediction rule would consist of a combination of known risk factors and most likely incorporate old age, illness severity, and preexisting cognitive dysfunction.
METHODS
Design and Setting
This was a prospective cohort study with a derivation phase from May 2010 to November 2010 at 2 hospitals at the University of California, San Francisco (UCSF) (Moffitt‐Long and Mount Zion Hospitals) and a validation phase from October 2011 to March 2012 at the San Francisco Veterans Affairs Medical Center (SFVAMC).
Participants and Measurements
Subject identification, recruitment, and inclusion and exclusion criteria were identical for the derivation and validation cohorts. Subjects were identified by reviewing daily admission logs. All non‐intensive care unit patients aged 50 years or older admitted through the emergency department to the medicine, cardiology, or neurology services were screened for eligibility through chart review or in person within 24 hours of admission by a trained research assistant. One research assistant, a college graduate, conducted all screening for the derivation cohort, and 2 research assistants, 1 a fourth‐year medical student and the other a third‐year psychology graduate student, conducted screening for the validation cohort. In‐person screening included an assessment for delirium using the long version of the Confusion Assessment Method (CAM).[24] To minimize the possibility of enrolling delirious subjects, research assistants were instructed to notify the study supervisor (V.C.D.), a board‐certified neurologist, to discuss every case in which any yes checkbox was marked on the CAM score sheet. Subjects delirious upon initial evaluation, admitted for alcohol withdrawal, admitted for comfort care, who were aphasic or who could not speak English were excluded. For all patients, or if they were unable to provide consent, their surrogates provided written informed consent, and the study was approved by the institutional review boards at UCSF and SFVAMC.
In the derivation cohort, 1241 patients were screened, and 439 were eligible for enrollment. Of these, 180 declined, 50 were discharged prior to the first follow‐up visit, and 209 were included. In the validation cohort, 420 patients were screened, and 368 were eligible for enrollment. Of these, 144 declined, 59 were discharged prior to the first follow‐up visit, and 165 were included.
Baseline data regarding known delirium risk factors[11, 12, 13, 14, 15, 16] were collected from subjects in the derivation cohort. Cognitive performance was assessed with the Mini Mental Status Examination (MMSE),[25] forward digit span,[26] and clock draw.[27] Permission for administration of the MMSE was granted by Psychological Assessment Resources, Inc., and each administration was paid for. A structured interview was conducted with validated questions regarding visual and hearing impairment, pain, mobility, place of residence, and alcohol, tobacco, and drug use.[28, 29, 30, 31] A whisper test for hearing loss was performed.[32] Subjects' charts were reviewed for demographic, clinical, and laboratory data. Illness severity was assessed by asking each subject's nurse to rate their patient on a scale from not ill to mildly ill, moderately ill, severely ill, or moribund.[33] Each nurse was shown these 5 choices, but more specific definitions of what each level of illness severity meant were not provided. We chose this method to assess illness severity because this rating scale was incorporated into a previous validated and widely cited delirium prediction rule.[17] This illness severity scale has been validated as a predictor of outcomes and correlates with other measures of illness severity and comorbidity when graded by physicians.[33, 34] Nurse and physician ratings of illness severity have been shown to be comparable,[35] and therefore if the scale were incorporated into the prediction rule it would allow nurses to perform it independently. In the validation cohort, only data required to complete the baseline CAM and apply the prediction rule were collected.
Assessment of Outcomes
All subjects were assessed for delirium daily for 6 days after enrollment or until discharge, whichever came first. Follow‐up was limited to 6 days, based on the assumption that delirium occurring beyond 1 week is more likely due to events during the hospitalization as opposed to factors measurable at admission. Delirium was assessed using the short CAM, an internationally recognized and validated tool.[24] To complete the CAM during follow‐up visits, subjects and their nurses were interviewed using a written script, and an MMSE and forward digit span were performed.
Daily follow‐up assessments were performed by research assistants who were not blinded to the initial assessment but who, in the validation phase, were blinded to the prediction rule score. Some weekend follow‐ups were performed by postgraduate year 2, 3, or 4 neurology residents, or internal medicine faculty experienced in the assessment of delirium and blinded to both the initial assessment and prediction rule score. Neurology residents and internists read the CAM training manual and were educated in the administration and scoring of the CAM by 1 of the senior investigators (V.C.D.) prior to their first shift; these nonstudy personnel covered 17 of 189 days of follow‐up in the derivation cohort and 21 of 169 days of follow‐up in the validation cohort. To maximize sensitivity of delirium detection, for any change in cognition, MMSE score, or forward digit span compared to baseline, a board‐certified neurologist blinded to the initial assessment was notified to discuss the case and validate the diagnosis of delirium in person (derivation cohort) or over the phone (validation cohort). All research assistants were trained by a board‐certified neurologist (V.C.D.) in the administration and interpretation of the CAM using published methods prior to enrollment of any subjects.[36] Training included the performance of independent long‐version CAMs by the trainer and the trainee on a series of delirious and nondelirious patients until there was consistent agreement for each item on the CAM in 5 consecutive patients. In addition, a board‐certified neurologist supervised the first 5 administrations of the CAM performed by each research assistant.
Statistical Analysis
Sample size for the derivation cohort was based on the predicted ability to detect a difference in rates of delirium among those with and without cognitive impairment, the strongest risk factor for delirium. Using a [2] test with an of 0.05 and of 0.80, we estimated we would need to enroll 260 subjects, assuming a prevalence of cognitive dysfunction in our cohort of 10% and an estimated rate of delirium of 24% and 6% among those with and without cognitive dysfunction respectively.[14, 16, 17, 20] We were unable to reach enrollment targets because of a short funding period and slower than expected recruitment.
To construct the prediction rule in the derivation cohort, all variables were dichotomized. Age was dichotomized at 80 years because old age is a known risk factor for delirium, and only 1 of 46 subjects between the ages of 70 and 80 years became delirious in the derivation cohort. Components of the MMSE were dichotomized as correct/emncorrect, with a correct response requiring perfect performance based on expert consensus. For 3 subjects who would not attempt to spell world backward (2 in the derivation and 1 in the validation cohort), their score on serial 7s was used instead. The total MMSE score was not used because our objective was to develop a prediction rule using elements that could be assessed quickly in the fast‐paced environment of the hospital. Illness severity was dichotomized at moderate or worse/mild or better because there were only 15 subjects in the severe illness category, and the majority of delirium (22 outcomes) occurred in the moderate illness category. High blood urea nitrogen:creatinine ratio was defined as >18.[37]
The association between predictor variables and occurrence of delirium was analyzed using univariate logistic regression. A forward stepwise logistic regression was then performed using the variables associated with the outcome at a significance level of P<0.05 in univariate analysis. Variables were eligible for addition to the multivariable model if they were associated with the outcome at a significance level of <0.05. The 4 independent predictors thus identified were combined into a prediction rule by assigning each predictor 1 point if present. The performance of the prediction rule was assessed by using Cuzick's nonparametric test for a trend across groups ordered by score.[38]
The prediction rule was tested in the validation cohort using the nonparametric test for trend. Receiver operating characteristic (ROC) curves were compared between the derivation and validation cohorts. All statistical analysis was performed using Stata software (StataCorp, College Station, TX).
RESULTS
The derivation cohort consisted of elderly patients (mean age, 68.0811.96 years; interquartile range, 5096 years), and included more males than females (54.1% vs 45.9%). Subjects were predominantly white (73.7%) and lived at home (90%) (Table 1). The mean admission MMSE score was 27.0 (standard deviation [SD], 3.4; range, 730). Median follow‐up was 2 days (interquartile range, 13). Delirium developed in 12% (n=25) of the cohort.
| Derivation Cohort, N=209 | Validation Cohort, N=165 | |
|---|---|---|
| ||
| Gender, No. (%) | ||
| Male | 113 (54) | 157 (95) |
| Female | 96 (46) | 8 (4.8) |
| Race, No. (%) | ||
| White | 154 (74) | 125 (76) |
| African American | 34 (16) | 25 (15) |
| Asian | 21 (10.0) | 13 (7.9) |
| Native American | 0 | 2 (1.2) |
| Illness severity, No. (%) | ||
| Not ill | 1 (0.5) | 0 |
| Mildly ill | 49 (23) | 62 (38) |
| Moderately ill | 129 (62) | 86 (52) |
| Severely ill | 15 (7.2) | 17 (10) |
| Moribund | 0 | 0 |
| Living situation, No. (%) | ||
| Home | 188 (90) | 147 (89) |
| Assisted living | 11 (5.3) | 6 (3.6) |
| Hotel | 4 (1.9) | 5 (3.0) |
| SNF | 1 (0.5) | 3 (1.8) |
| Homeless | 4 (1.9) | 4 (2.4) |
| Developed delirium | 25 (12) | 14 (8.5) |
Univariate analysis of the derivation study identified 10 variables significantly associated (P<0.05) with delirium (Table 2). Predictors of delirium included abnormal scores on 4 subtests of the MMSE, low score on the Mini‐Cog, living in an assisted living or skilled nursing facility, moderate to severe illness, old age, a past history of dementia, and hearing loss as assessed by the whisper test. These predictors were then entered into a stepwise logistic regression analysis that identified 4 independent predictors of delirium (Table 3).
| Variable | No. (%) Without Delirium | No. (%) With Delirium | Odds Ratio | P Value | 95% Confidence Interval |
|---|---|---|---|---|---|
| |||||
| Age 80 years | 30 (16) | 13 (52) | 5.6 | <0.001 | 2.313.4 |
| Male sex | 99 (54) | 14 (56) | 1.1 | 0.84 | 0.52.5 |
| White race | 135 (73) | 19 (76) | 1.2 | 0.78 | 0.433.1 |
| Score <5 on date questions of MMSE | 37 (20) | 12 (48) | 3.7 | 0.003 | 1.68.7 |
| Score <5 on place questions of MMSE | 50 (27) | 14 (56) | 3.4 | 0.005 | 1.58.0 |
| Score <3 on MMSE recall | 89 (48) | 18 (72) | 2.7 | 0.03 | 1.16.9 |
| Score <5 on MMSE W‐O‐R‐L‐D backward | 37 (20) | 13 (52) | 4.3 | 0.001 | 1.810.2 |
| Score 0 on MMSE pentagon copy, n=203 | 53 (30) | 12 (48) | 2.2 | 0.07 | 0.935.1 |
| Score 0 on clock draw, n=203 | 70 (39) | 15 (60) | 2.3 | 0.05 | 0.985.4 |
| MiniCog score 02, n=203[27] | 46 (26) | 12 (48) | 2.7 | 0.03 | 1.16.2 |
| Self‐rated vision fair, poor, or very poor | 55 (30) | 8 (32) | 1.1 | 0.83 | 0.452.7 |
| Endorses hearing loss | 89 (48) | 12 (48) | 0.99 | 0.97 | 0.432.3 |
| Uses hearing aid | 19 (10) | 2 (8) | 0.76 | 0.72 | 0.173.5 |
| Fails whisper test in either ear | 39 (21) | 10 (40) | 2.5 | 0.04 | 1.05.9 |
| Prior episode of delirium per patient or informant | 70 (38) | 13 (52) | 1.8 | 0.19 | 0.764.1 |
| Dementia in past medical history | 3 (2) | 3 (12) | 8.2 | 0.01 | 1.643.3 |
| Depression in past medical history | 16 (9) | 1 (4) | 0.44 | 0.43 | 0.063.5 |
| Lives in assisted living or SNF | 8 (4) | 4 (16) | 4.2 | 0.03 | 1.215.1 |
| Endorses pain | 82 (45) | 7 (28) | 0.48 | 0.12 | 0.191.2 |
| Less than independent for transfers | 11 (6) | 3 (12) | 2.1 | 0.27 | 0.568.3 |
| Less than independent for mobility on a level surface | 36 (20) | 7 (28) | 1.6 | 0.33 | 0.624.1 |
| Score of 24 on CAGE questionnaire[29] | 5 (3) | 0 (0) | No outcomes | ||
| Drinks any alcohol | 84 (46) | 10 (40) | 0.79 | 0.60 | 0.341.9 |
| Current smoker | 20 (11) | 2 (8) | 0.71 | 0.66 | 0.164.1 |
| Uses illicit drugs | 13 (7) | 2 (8) | 1.2 | 0.83 | 0.255.6 |
| Moderately or severely ill on nursing assessment, n=194 | 121 (71) | 23 (96) | 9.3 | 0.031 | 1.270.9 |
| Fever | 8 (4) | 0 (0) | No outcomes | ||
| Serum sodium <134mmol/L | 38 (21) | 3 (12) | 0.52 | 0.31 | 0.151.8 |
| WBC count>10109/L, n=208 | 57 (31) | 6 (24) | 0.70 | 0.47 | 0.261.8 |
| AST>41 U/L, n=131 | 27 (23) | 2 (15) | 0.61 | 0.54 | 0.132.9 |
| BUN:Cr>18, n=208 | 66 (36) | 13 (52) | 1.9 | 0.13 | 0.834.5 |
| Infection as admission diagnosis | 28 (15) | 4 (16) | 1.1 | 0.92 | 0.343.3 |
| Variable | Odds Ratio | 95% Confidence Interval | P Value | Points Toward AWOL Score |
|---|---|---|---|---|
| Age 80 years | 5.7 | 2.115.6 | 0.001 | 1 |
| Unable to correctly spell world backward | 3.5 | 1.39.6 | 0.01 | 1 |
| Not oriented to city, state, county, hospital name, and floor | 2.9 | 1.17.9 | 0.03 | 1 |
| Nursing illness severity assessment of moderately ill, severely ill, or moribund (as opposed to not ill or mildly ill) | 10.5 | 1.386.9 | 0.03 | 1 |
These 4 independent predictors were assigned 1 point each if present to create a prediction rule with a range of possible scores from 0 to 4. There was a significant trend predicting higher rates of delirium with higher scores, with no subjects who scored 0 becoming delirious, compared to 40% of those subjects scoring 3 or 4 (P for trend<0.001) (Table 4).
| Derivation Cohorta | Validation Cohort | Combined Cohorts | ||||
|---|---|---|---|---|---|---|
| AWOL Score | Not Delirious | Delirious | Not Delirious | Delirious | Not Delirious | Delirious |
| ||||||
| 0 | 26 (100%) | 0 (0%) | 24 (96%) | 1 (4%) | 49 (98%) | 1 (2%) |
| 1 | 86 (95%) | 5 (5%) | 57 (97%) | 2 (3%) | 136 (96%) | 5 (4%) |
| 2 | 41 (85%) | 7 (15%) | 44 (90%) | 5 (10%) | 92 (86%) | 15 (14%) |
| 3 | 17 (74%) | 6 (26%) | 22 (79%) | 6 (21%) | 40 (80%) | 10 (20%) |
| 4 | 0 (0%) | 6 (100%) | 4 (100%) | 0 (0%) | 4 (36%) | 7 (64%) |
| Total | 170 | 24 | 151 | 14 | 321 | 38 |
| P<0.001 | P=0.025 | P<0.001 | ||||
The validation cohort consisted of adults with a mean age of 70.7210.6 years, (interquartile range, 5194 years), who were predominantly white (75.8%) and overwhelmingly male (95.2%) (Table 1). The mean admission MMSE score was 26.75 (SD, 2.8; range, 1730). Median follow‐up was 2 days (interquartile range, 15). Delirium developed in 8.5% (n=14) of the cohort. In the validation cohort, 4% of subjects with a score of 0 became delirious, whereas 19% of those scoring 3 or 4 became delirious (P for trend 0.025) (Table 4).
ROC curves were compared for the derivation and validation cohorts. The area under the ROC curve for the derivation cohort (0.81, 95% confidence interval [CI]: 0.720.90) was slightly better than that in the validation cohort (0.69, 95% CI: 0.540.83), but the difference did not reach statistical significance (P=0.14) (Figure 1).
DISCUSSION
We derived and validated a prediction rule to assess the risk of developing delirium in hospitalized adult medical patients. Four variables easily assessed on admission in a screen lasting less than 2 minutes were independently associated with the development of delirium. The prediction rule can be remembered with the following mnemonic: AWOL (Age80 years; unable to spell World backward; not fully Oriented to place; and moderate or severe iLlness severity).
It is estimated up to a third of hospital acquired delirium cases can be prevented.[10] Recent guidelines recommend the use of a multicomponent intervention to prevent delirium and provide evidence that such a strategy would be cost‐effective.[39] Nevertheless, such interventions are resource intense, requiring specialized nurse training and staffing[40] and have not been widely implemented. Acute care for the elderly units, where interventions to prevent delirium might logically be implemented, also require physical remodeling to provide carpeted hallways, handrails, and elevated toilet seats and door levers.[41] A method of risk stratification to identify the patients who would benefit most from resource‐intensive prevention strategies would be valuable.
The AWOL tool may provide a practical alternative to existing delirium prediction rules for adult medical inpatients. Because it can be completed by a nurse in <2 minutes, the AWOL tool may be easier to apply and disseminate than a previously described score relying on the MMSE, Acute Physiology and Chronic Health Evaluation scores, and measured visual acuity.[17] Two other tools, 1 based on chart abstraction[18] and the other based on clinical variables measured at admission,[19] are similarly easy to apply but only predict prevalent and not incident delirium, making them less clinically useful.
This study's strengths include its prospective cohort design and the derivation and validation being performed in different hospitals. The derivation cohort consisted of patients admitted to a tertiary care academic medical center or an affiliated hospital where routine mixed gender general medical patients are treated, whereas validation was performed at the SFVAMC, where patients are predominantly older men with a high incidence of vascular risk factors. The outcome was assessed on a daily basis, and the likelihood any cases were missed was low. Although there is some potential for bias because the outcome was assessed by a research assistant not blinded to baseline characteristics, this was mitigated by having each outcome validated by a blinded neurologist and in the validation cohort having the research assistant blinded to the AWOL score. Other strengths are the broad inclusion criteria, with both middle‐aged and elderly patients having a wide range of medical and neurological conditions, allowing for wide application of the results. Although many studies of delirium focus on patients over age 70 years, we chose to include patients aged 50 years or older because hospital‐acquired delirium still occurs in this age group (17 of 195 [8%] patients aged 5069 years became delirious in this study), and risk factors such as severe illness and cognitive dysfunction are likely to be predictors of delirium even at younger ages. Additionally, the inclusion of nurses' clinical judgment to assess illness severity using a straightforward rating scale allows bedside nurses to readily administer the prediction rule in practice.[34]
This study has several potential limitations. The number of outcomes in the derivation cohort was small compared to the number of predictors chosen for the prediction rule. This could potentially have led to overfitting the model in the derivation cohort and thus an overly optimistic estimation of the model's performance. In the validation cohort, the area under the ROC curve was lower than in the derivation cohort, and although the difference did not reach statistical significance, this may have been due to the small sample size. In addition, none of the 4 subjects with an AWOL score of 4 became delirious, potentially reflecting poor calibration of the prediction rule. However, the trend of higher rates of delirium among subjects with higher AWOL scores still reached statistical significance, and the prediction rule demonstrated good discrimination between patients at high and low risk for developing delirium.
To test whether a better prediction tool could be derived from our data, we combined the derivation and validation cohorts and repeated a stepwise multivariable logistic regression with the same variables used for derivation of the AWOL tool (with the exception of the whisper test of hearing and a past medical history of dementia, because these data were not collected in the validation cohort). This model produced the same 4 independent predictors of delirium used in the AWOL tool. We then used bootstrapping to internally validate the prediction rule, suggesting that the predictors in the AWOL tool were the best fit for the available data. However, given the small number of outcomes in our study, the AWOL tool may benefit from further validation in a larger independent cohort to more precisely calibrate the number of expected outcomes with each score.
Although the majority of medical inpatients were eligible for enrollment in our study, some populations were excluded, and our results may not generalize to these populations. Non‐English speaking patients were excluded to preserve the validity of our study instruments. In addition, patients with profound aphasia or an admission diagnosis of alcohol withdrawal were excluded. Patients discharged on the first day of their hospitalization were excluded either because they were discharged prior to screening or prior to their first follow‐up visit. Therefore, our results may only be valid in patients who remained in the hospital for over 24 hours. In addition, because we only included medical patients, our results cannot necessarily be generalized to the surgical population.
Finally, parts of the prediction rule (orientation and spelling world backward) are also components of the CAM and were used in the assessment of the outcome, and this may introduce a potential tautology: if patients are disoriented or have poor attention because they cannot spell world backward at admission, they already have fulfilled part of the criteria for delirium. However, a diagnosis of delirium using the CAM involves a comprehensive patient and caregiver interview, and in addition to poor attention, requires the presence of an acute change in mental status and disorganized thinking or altered level of consciousness. Therefore, it is possible, and common, for patients to be disoriented to place and/or unable to spell world backward, yet not be delirious, and predicting a subsequent change in cognition during the hospitalization is still clinically important. It is possible the AWOL tool works by identifying patients with impaired attention and subclinical delirium, but one could argue this makes a strong case for its validity because these patients especially should be triaged to an inpatient unit that specializes in delirium prevention. It is also possible the cognitive tasks that are part of the AWOL tool detect preexisting cognitive impairment, which is in turn a major risk factor for delirium.
Recognizing and classifying the risk of delirium during hospitalization is imperative, considering the illness' significant contribution to healthcare costs, morbidity, and mortality. The cost‐effectiveness of proven interventions to detect and prevent delirium could be magnified with focused implementation in those patients at highest risk.[39, 40, 41] Further research is required to determine whether the combination of delirium prediction rules such as those developed here and prevention strategies will result in decreased rates of delirium and economic savings for the healthcare system.
Acknowledgments
The following University of California, San Francisco neurology residents provided follow‐up of study subjects on weekends and were financially compensated: Amar Dhand, MD, DPhil; Tim West, MD; Sarah Shalev, MD; Karen DaSilva, MD; Mark Burish, MD, PhD; Maggie Waung, MD, PhD; Raquel Gardner, MD; Molly Burnett, MD; Adam Ziemann, MD, PhD; Kathryn Kvam, MD; Neel Singhal, MD, PhD; James Orengo, MD, PhD; Kelly Mills, MD; and Joanna Hellmuth, MD, MHS. The authors are grateful to Dr. Douglas Bauer for assisting with the study design.
Disclosures
Drs. Douglas, Hessler, Dhaliwal, Betjemann, Lucatorto, Johnston, Josephson, and Ms. Fukuda and Ms. Alameddine have no conflicts of interest or financial disclosures. This research was made possible by the Ruth E. Raskin Fund and a UCSF Dean's Research Scholarship. These funding agencies had no role in the design and conduct of the study; collection, management, analysis, and interpretation of the data; and preparation, review, or approval of the manuscript.
- , , . Occurrence and outcome of delirium in medical in‐patients: a systematic literature review. Age Ageing. 2006;35(4):350–364.
- , , , , , . Delirium in the intensive care unit: occurrence and clinical course in older patients. J Am Geriatr Soc. 2003;51(5):591–598.
- , , , , . One‐year health care costs associated with delirium in the elderly population. Arch Intern Med. 2008;168(1):27–32.
- , , , , . Does delirium contribute to poor hospital outcomes? A three‐site epidemiologic study. J Gen Intern Med. 1998;13(4):234–242.
- , , , , , . Delirium duration and mortality in lightly sedated, mechanically ventilated intensive care patients. Crit Care Med. 2010;38(12):2311–2318.
- , , , et al. Delirium epidemiology in critical care (DECCA): an international study. Crit Care. 2010;14(6):R210.
- , , , et al. Delirium as a predictor of long‐term cognitive impairment in survivors of critical illness. Crit Care Med. 2010;38(7):1513–1520.
- , , , , , . Delirium in elderly patients and the risk of postdischarge mortality, institutionalization, and dementia: a meta‐analysis. JAMA. 2010;304(4):443–451.
- , , , et al. Adverse outcomes after hospitalization and delirium in persons with Alzheimer disease. Ann Intern Med. 2012;156(12):848–856.
- , , , et al. A multicomponent intervention to prevent delirium in hospitalized older patients. N Engl J Med. 1999;340(9):669–676.
- , , , et al. Simple cognitive testing (Mini‐Cog) predicts in‐hospital delirium in the elderly. J Am Geriatr Soc. 2007;55(2):314–316.
- , , . A prospective study of delirium in hospitalized elderly. JAMA. 1990;263(8):1097–1101.
- , . Precipitating factors for delirium in hospitalized elderly persons. Predictive model and interrelationship with baseline vulnerability. JAMA. 1996;275(11):852–857.
- , , , , , . Risk factors for delirium at discharge: development and validation of a predictive model. Arch Intern Med. 2007;167(13):1406–1413.
- , . Delirium in vascular surgery. Eur J Vasc Endovasc Surg. 2007;34(2):131–134.
- , , , , , . Delirium in hospitalized older persons: outcomes and predictors. J Am Geriatr Soc. 1994;42(8):809–815.
- , , , , . A predictive model for delirium in hospitalized elderly medical patients based on admission characteristics. Ann Intern Med. 1993;119(6):474–481.
- , , , , , . Validation of a medical record‐based delirium risk assessment. J Am Geriatr Soc. 2011;59(suppl 2):S289–S294.
- , , , et al. Derivation and validation of a clinical prediction rule for delirium in patients admitted to a medical ward: an observational study. BMJ Open. 2012;2(5) pii: e001599.
- , , , et al. A clinical prediction rule for delirium after elective noncardiac surgery. JAMA. 1994;271(2):134–139.
- , , , , , . Prediction of postoperative delirium after abdominal surgery in the elderly. J Anesth. 2009;23(1):51–56.
- , , , et al. Derivation and validation of a preoperative prediction rule for delirium after cardiac surgery. Circulation. 2009;119(2):229–236.
- , , , et al. Development and validation of PRE‐DELIRIC (PREdiction of DELIRium in ICu patients) delirium prediction model for intensive care patients: observational multicentre study. BMJ. 2012;344:e420.
- , , , , , . Clarifying confusion: the confusion assessment method. A new method for detection of delirium. Ann Intern Med. 1990;113(12):941–948.
- , , . “Mini‐mental state”. A practical method for grading the cognitive state of patients for the clinician. J Psychiatr Res. 1975;12(3):189–198.
- . Wechsler Memory Scale‐III. New York, NY: Psychological Corp.; 1997.
- , , , , . The mini‐cog: a cognitive 'vital signs' measure for dementia screening in multi‐lingual elderly. Int J Geriatr Psychiatry. 2000;15(11):1021–1027.
- , . Functional evaluation: the Barthel index. Md State Med J. 1965;14:61–65.
- , , . The CAGE questionnaire: validation of a new alcoholism screening instrument. Am J Psychiatry. 1974;131(10):1121–1123.
- , , , , , . Is the NEI‐VFQ‐25 a useful tool in identifying visual impairment in an elderly population? BMC Ophthalmol. 2006;6:24.
- , , , et al. Validation of self‐reported hearing loss. The Blue Mountains Hearing Study. Int J Epidemiol. 2001;30(6):1371–1378.
- , , . Does this patient have hearing impairment? JAMA. 2006;295(4):416–428.
- , , , , , . Realizing the potential of clinical judgment: a real‐time strategy for predicting outcomes and cost for medical inpatients. Am J Med. 2000;109(3):189–195.
- , , , , , . Assessing illness severity: does clinical judgment work? J Chronic Dis. 1986;39(6):439–452.
- , , , , , . Prognostication in acutely admitted older patients by nurses and physicians. J Gen Intern Med. 2008;23(11):1883–1889.
- . The Confusion Assessment Method (CAM): Training Manual and Coding Guide. New Haven, CT: Yale University School of Medicine; 2003.
- , , , . Acute confusional states and dementia in the elderly: the role of dehydration/volume depletion, physical illness and age. Age Ageing. 1980;9(3):137–146.
- . A Wilcoxon‐type test for trend. Stat Med. 1985;4(1):87–90.
- , , , . Synopsis of the National Institute for Health and Clinical Excellence guideline for prevention of delirium. Ann Intern Med. 2011;154(11):746–751.
- , , , , . The Hospital Elder Life Program: a model of care to prevent cognitive and functional decline in older hospitalized patients. Hospital Elder Life Program. J Am Geriatr Soc. 2000;48(12):1697–1706.
- , , , , . A randomized trial of care in a hospital medical unit especially designed to improve the functional outcomes of acutely ill older patients. N Engl J Med. 1995;332(20):1338–1344.
Copyright © 2013 Society of Hospital Medicine