User login
Bugs, Drugs, and You: HM13 Pre-Course Reviews Infectious Disease Essentials for the Hospitalist
This ID focused pre-course was a jam-packed, practical, and high-yield review of relevant ID topics encountered by practicing hospitalists. Here are some of the key takeaways:
HIV and the Hospitalist in 2013
John Flaherty, MD, prof. of medicine at Northwestern University Feinberg School of Medicine
• Lower the threshold for HIV testing; don’t limit to “high-risk” behaviors, 20% of those living with HIV/AID are unaware—so TEST!
• Recognize clinical clues to HIV infection: acute mono-like syndrome, unexplained chronic illness, comm.-acquired pneumonia.

Thomas Fraser, MD, FACP, FSHEA, vice chairman, Dept. of Infectious Disease, Medical Director for Infection Prevention, Cleveland Clinic
• Risk Factors for CDI: disease severity (sicker patients=higher risk), antibiotics, PPI use, NG tubes and tube feeds, stool softeners and enemas, GI surgery, increasing age.
• Treatment: stop abx if possible, no antiperistaltics, metronidazole 500mg po tid x 10d- 1st line, alt. vancomycin 125-150mg po qid x 10d, vancomycin preferred rx for seriously ill (wbc>20k, ARF, abd.distention, hemodynamic instability).
• Do not treat asymptomatic patient with stool sample + for C. diff.
Emerging Antimicrobial Resistance Issues
COL Glenn Wortmann, MD Chief of integrated Infectious Diseases Services Walter Reed army Medical Center and Bethesda Naval National Naval Center, Program Director of National Capital Consortium Infectious Diseases Fellowship Program, Assoc. Prof. of Medicine Uniformed Services University of the Health Sciences
• Global trends in rising antimicrobial resistance suggest that the antibiotic era may be ending.
• Emphasis shifting from infection treatment to prevention.
• Maximize hand washing: Wash in, wash out and lead by example.
• Consider chlorhexidine washes in high-risk patients as well as environmental decontamination devices.
• Judicious Use of Antimicrobial Agents: use narrow spectrum agents for shortest duration of therapy feasible, formulary restriction, mandatory ID or pharmacy consultation.
How to be a Leader in Antimicrobial Stewardship in Your Hospital
Arjun Srinivasan, MD FSHEA Assoc. Dir. for Healthcare Associated Infection Prevention Programs in the Div. of Healthcare Quality Promotion at the Centers for Disease Control and Prevention (CDC)
• Hospitalists have the greatest influence over how abx are used in hospitals.
• Hospitalists have the background, experience and strong interest in QI work to affect change; know that up to 50% of all antibiotic use is inappropriate.
• Hospitalists can help tackle issues of abx misuse with signouts, handoffs, and care transitions.
•
ID Emergencies: Diagnoses you can’t afford to miss
James Pile, MD FACP SFHM practicing hospitalist and ID specialist at Cleveland Clinic
• Acute Bacterial Meningitis: LP and Brain Imaging, subset of low-risk patients appears not to require imaging prior to LP, even pts with mild mass effects can probably be safely tapped, herniation may occur even with normal CT-if clinical evidence suggests increasing icp, consider deferring lp or using small gauge needle
• Rx: all adults-cover pneumococcus and meningococcus, empiric coverage of resistant S. pneumoniae is standard of care; cover for listeria for age >50, immunocompromised, alcoholic, pregnant, diabetic; recent head trauma or neurosurgery cover S. aureus and GNB (including pseudomonas).
• Steroids are recommended for suspected BM give dexamethasone with or before antibiotics.
• Spinal Epidural Abscess: It’s easy to miss!
• Necrotizing Fasciitis/Necrotizing Soft Tissue Infections (NSTI): Pain out of proportion to physical findings, systemic findings (delirium, fever, diaphoresis, tachycardia) out of proportion to physical findings; consider Dx to make Dx, easy to miss or delay diagnosis→worsening outcomes. Have low threshold for surgical consultation and/or CT in patients with what appears to be severe cellulitis; include clindamycin (with other abx) for empiric coverage
ID Pearls Every Hospitalist Should Know
John Flaherty, MD
• Re: Perioperative Abx, “Better late than never” does NOT apply. Ensure appropriate timing of peri-op abx.
• Fever ≠ Infection, No Fever ≠ No Infection.
• Sepsis and Hypotension: start broad-spectrum abx NOW.
• Persistent pna despite empiric rx and neg cx, think TB and blastomycoses.
• Fatigue, low-grade fever, and anemia- r/o infective endocarditis.
• Single+blood cx is not always a contaminant; is IS a source of prolonged hospitalization and further testing, so choose wisely when ordering blood cx.
Implementing Socio-Adaptive Change: The role of leaders, followers and bundles in preventing infection
Sanjay Saint, MD MPH Prof. of Int. Medicine University of Michigan, Dir. of the VA/Univeristy of Michigan Patient Safety Enhancement Program, Assoc. Chief of Medicine Ann Arbor VAMC
• Successful implementation of change requires recognition of both the technical and socio-adaptive barriers.
• The key to good leadership is good followership—very little written on subject of followership.
Infective Endocarditis and Intravascular Device Infections
Thomas Fraser, MD FACP FSHEA
• Management Highlights: If patient is sick, pull the line out. If patient has a bad bug, pull the line out. Most people with lines are health care experienced—start broad-spectrum abx and tailor rx once cx available. If you do not pull the line, follow very closely, have low threshold to call ID consult, S. aureus is in a class all its own.
• When can line be replaced? Timing depends on clinical need ultimately, clinically well with resolving syndrome, receiving effective rx, blood cx neg for 72 hrs; maybe longer for Candida species.
• Who should get a TEE for HCA S. aureus bacteremia? Patients with prolonged bacteremia; >4 days; presence of an intracardiac device (valve, icd, ppm); metastatic complication; vertebral or other osteomyelitis, etc. TH
Dr. Lindsey is a COO at Strategist Synergy Surgicalists, lead consultant at Asynd Consulting, and a Team Hospitalist member.
This ID focused pre-course was a jam-packed, practical, and high-yield review of relevant ID topics encountered by practicing hospitalists. Here are some of the key takeaways:
HIV and the Hospitalist in 2013
John Flaherty, MD, prof. of medicine at Northwestern University Feinberg School of Medicine
• Lower the threshold for HIV testing; don’t limit to “high-risk” behaviors, 20% of those living with HIV/AID are unaware—so TEST!
• Recognize clinical clues to HIV infection: acute mono-like syndrome, unexplained chronic illness, comm.-acquired pneumonia.
Thomas Fraser, MD, FACP, FSHEA, vice chairman, Dept. of Infectious Disease, Medical Director for Infection Prevention, Cleveland Clinic
• Risk Factors for CDI: disease severity (sicker patients=higher risk), antibiotics, PPI use, NG tubes and tube feeds, stool softeners and enemas, GI surgery, increasing age.
• Treatment: stop abx if possible, no antiperistaltics, metronidazole 500mg po tid x 10d- 1st line, alt. vancomycin 125-150mg po qid x 10d, vancomycin preferred rx for seriously ill (wbc>20k, ARF, abd.distention, hemodynamic instability).
• Do not treat asymptomatic patient with stool sample + for C. diff.
Emerging Antimicrobial Resistance Issues
COL Glenn Wortmann, MD Chief of integrated Infectious Diseases Services Walter Reed army Medical Center and Bethesda Naval National Naval Center, Program Director of National Capital Consortium Infectious Diseases Fellowship Program, Assoc. Prof. of Medicine Uniformed Services University of the Health Sciences
• Global trends in rising antimicrobial resistance suggest that the antibiotic era may be ending.
• Emphasis shifting from infection treatment to prevention.
• Maximize hand washing: Wash in, wash out and lead by example.
• Consider chlorhexidine washes in high-risk patients as well as environmental decontamination devices.
• Judicious Use of Antimicrobial Agents: use narrow spectrum agents for shortest duration of therapy feasible, formulary restriction, mandatory ID or pharmacy consultation.
How to be a Leader in Antimicrobial Stewardship in Your Hospital
Arjun Srinivasan, MD FSHEA Assoc. Dir. for Healthcare Associated Infection Prevention Programs in the Div. of Healthcare Quality Promotion at the Centers for Disease Control and Prevention (CDC)
• Hospitalists have the greatest influence over how abx are used in hospitals.
• Hospitalists have the background, experience and strong interest in QI work to affect change; know that up to 50% of all antibiotic use is inappropriate.
• Hospitalists can help tackle issues of abx misuse with signouts, handoffs, and care transitions.
•
ID Emergencies: Diagnoses you can’t afford to miss
James Pile, MD FACP SFHM practicing hospitalist and ID specialist at Cleveland Clinic
• Acute Bacterial Meningitis: LP and Brain Imaging, subset of low-risk patients appears not to require imaging prior to LP, even pts with mild mass effects can probably be safely tapped, herniation may occur even with normal CT-if clinical evidence suggests increasing icp, consider deferring lp or using small gauge needle
• Rx: all adults-cover pneumococcus and meningococcus, empiric coverage of resistant S. pneumoniae is standard of care; cover for listeria for age >50, immunocompromised, alcoholic, pregnant, diabetic; recent head trauma or neurosurgery cover S. aureus and GNB (including pseudomonas).
• Steroids are recommended for suspected BM give dexamethasone with or before antibiotics.
• Spinal Epidural Abscess: It’s easy to miss!
• Necrotizing Fasciitis/Necrotizing Soft Tissue Infections (NSTI): Pain out of proportion to physical findings, systemic findings (delirium, fever, diaphoresis, tachycardia) out of proportion to physical findings; consider Dx to make Dx, easy to miss or delay diagnosis→worsening outcomes. Have low threshold for surgical consultation and/or CT in patients with what appears to be severe cellulitis; include clindamycin (with other abx) for empiric coverage
ID Pearls Every Hospitalist Should Know
John Flaherty, MD
• Re: Perioperative Abx, “Better late than never” does NOT apply. Ensure appropriate timing of peri-op abx.
• Fever ≠ Infection, No Fever ≠ No Infection.
• Sepsis and Hypotension: start broad-spectrum abx NOW.
• Persistent pna despite empiric rx and neg cx, think TB and blastomycoses.
• Fatigue, low-grade fever, and anemia- r/o infective endocarditis.
• Single+blood cx is not always a contaminant; is IS a source of prolonged hospitalization and further testing, so choose wisely when ordering blood cx.
Implementing Socio-Adaptive Change: The role of leaders, followers and bundles in preventing infection
Sanjay Saint, MD MPH Prof. of Int. Medicine University of Michigan, Dir. of the VA/Univeristy of Michigan Patient Safety Enhancement Program, Assoc. Chief of Medicine Ann Arbor VAMC
• Successful implementation of change requires recognition of both the technical and socio-adaptive barriers.
• The key to good leadership is good followership—very little written on subject of followership.
Infective Endocarditis and Intravascular Device Infections
Thomas Fraser, MD FACP FSHEA
• Management Highlights: If patient is sick, pull the line out. If patient has a bad bug, pull the line out. Most people with lines are health care experienced—start broad-spectrum abx and tailor rx once cx available. If you do not pull the line, follow very closely, have low threshold to call ID consult, S. aureus is in a class all its own.
• When can line be replaced? Timing depends on clinical need ultimately, clinically well with resolving syndrome, receiving effective rx, blood cx neg for 72 hrs; maybe longer for Candida species.
• Who should get a TEE for HCA S. aureus bacteremia? Patients with prolonged bacteremia; >4 days; presence of an intracardiac device (valve, icd, ppm); metastatic complication; vertebral or other osteomyelitis, etc. TH
Dr. Lindsey is a COO at Strategist Synergy Surgicalists, lead consultant at Asynd Consulting, and a Team Hospitalist member.
CME, Procedures, and Advocacy Highlight Hospital Medicine 2013 Kickoff
Top 10 Strategies to Improve Patient Safety
Clinical question
What are the most effective strategies in improving patient safety?
Bottom line
This group of experts, commissioned by the Agency for Healthcare Research and Quality (AHRQ), outlined the top 10 strategies for improved patient safety. These strategies, which are "strongly encouraged" for adoption in all health care systems, consist primarily of interventions that help prevent health care-associated infections and avoid medical errors. LOE = 5
Reference
Study design
Systematic review
Funding source
Government
Allocation
Uncertain
Setting
Various (guideline)
Synopsis
Previous publications by the Institute of Medicine and the AHRQ have highlighted the importance of patient safety practices. A group of researchers, supported by the AHRQ, evaluated the data on current strategies to improve patient safety. The group assessed the quality of existing systematic reviews on these topics and performed new literature searches when needed. The focus was on data that reported on implementation and adoption of these strategies, as well as on the context in which they have been used. Individual studies on safety interventions were examined for quality and risk of bias. The authors rated the strength of evidence of the effectiveness of each intervention, reported evidence on possible harmful consequences, assessed difficulty in implementation, and estimated costs. Of the 41 safety strategies that were evaluated, the following 10 were chosen as strategies that are "strongly encouraged" for adoption now: 1. Preoperative and anesthesia checklists to prevent perioperative events 2. Bundles that include checklists to prevent central line-associated bloodstream infections 3. Interventions to reduce urinary catheter use, including catheter reminders, stop orders , or nurse-initiated removal protocols 4. Bundles that include head-of-bed elevation, sedation vacations, oral care with chlorhexidine, and subglottic suctioning endotracheal tubes to prevent ventilator-associated pneumonia 5. Hand hygiene 6. The do-not-use list for hazardous abbreviations 7. Multicomponent interventions to reduce pressure ulcers 8. Barrier precautions to prevent health care-associated infections 9. Use of real-time ultrasonography for central line placement 10. Interventions to improve prophylaxis for venous thromboembolism.
Dr. Kulkarni is an assistant professor of hospital medicine at Northwestern University in Chicago.
No Reduction in Mortality or Readmission with Addition of Aliskiren for HF Patients (ASTRONAUT)
Clinical question
Does the addition of aliskiren, a direct renin inhibitor, to standard therapy decrease mortality and readmission in patients hospitalized for worsening heart failure?
Bottom line
The addition of aliskiren to standard therapy in patients hospitalized with heart failure (HF) does not reduce cardiovascular mortality or HF readmission rates. LOE = 1b
Reference
Study design
Randomized controlled trial (double-blinded)
Funding source
Industry
Allocation
Uncertain
Setting
Inpatient (any location) with outpatient follow-up
Synopsis
Despite current standard therapy, postdischarge mortality and rehospitalizations remain high for patients hospitalized for HF. To study the effect of direct renin inhibitors on these outcomes, investigators enrolled adults hospitalized for worsening HF with a left ventricular ejection fraction (LVEF) of 40% or less. Once these patients were clinically and hemodynamically stable, they were randomized to receive aliskiren 150 mg daily or placebo. Study patients were followed up at regular intervals and the aliskiren dose was increased to 300 mg daily as long as the initial dose was tolerated. Aliskiren, either 150 mg or 300 mg, was then continued up to a maximum follow-up time of 12 months. All patients also received standard HF therapy at the discretion of their treating physicians. The 2 groups had similar baseline characteristics. The patients' mean age was 65 years, mean LVEF was 28%, and the majority were New York Heart Association Class III-IV at randomization. For the primary end point of either cardiovascular death or HF rehospitalization at 6 months, there was no significant difference between the aliskiren and placebo groups. Events rates between the 2 groups were also similar at 12 months. The aliskiren group was more likely to experience hyperkalemia, hypotension, and renal impairment or renal failure. Additionally, a subgroup analysis showed that patients with diabetes fared worse with aliskiren, with a greater risk of all-cause mortality at 12 months, than those who took placebo.
Dr. Kulkarni is an assistant professor of hospital medicine at Northwestern University in Chicago.
Golimumab indication expanded to include ulcerative colitis
The approval of the biologic drug golimumab has been expanded to include the treatment of adults with moderate to severe ulcerative colitis that is refractory to prior treatment or requires continuous steroid therapy, the Food and Drug Administration announced on May 15.
Golimumab (Simponi), a tumor necrosis factor–blocker, was approved in 2009 for treatment of moderate to severe active rheumatoid arthritis, psoriatic arthritis, and ankylosing spondylitis, all in adults. Simponi is marketed by Janssen Ortho Biotech.
The approval for ulcerative colitis was based on two studies of patients with moderate to severe ulcerative colitis, according to the FDA statement announcing the approval. In one study, which enrolled 513 patients who could not tolerate or had not responded to other treatments, "a greater proportion of Simponi-treated patients achieved clinical response, clinical remission and, as seen during endoscopy, had improved appearance of the colon after 6 weeks," compared with those on placebo, the statement said.
In a study of 310 patients who had responded to golimumab and were then randomized to continue treatment with golimumab or were switched to placebo, "a greater proportion of Simponi-treated patients maintained clinical response through week 54, had clinical remission at both weeks 30 and 54 and, as seen during endoscopy, had improved appearance of the colon at both weeks 30 and 54 compared with the placebo group," the FDA said. The most common adverse effects associated with golimumab are upper respiratory infection and redness at the injection site.
The risks of serious infections, invasive fungal infections, reactivation of hepatitis B infection, lymphoma, heart failure, nervous system disorders, and allergic reactions are increased with treatment.
Serious adverse events associated with golimumab should be reported to the FDA at 800-332-1088 or www.fda.gov/medwatch/.
Pulley stitch: A go-to for defects under tension
EDITOR'S NOTE: August 26, 2013: This article has been amended since it was first published to make it clear that Dr. Kelley Pagliai Redbord's description of the pulley stitch procedure was taken directly from an article published by Dr. Cyndi Yag-Howard in Dermatologic Surgery (Dermatol. Surg.2011;37:1503-5). In her presentation, Dr. Redbord credited Dr. Yag-Howard and her article. However, this credit and attribution to Dr. Yag-Howard was not included in the article published.
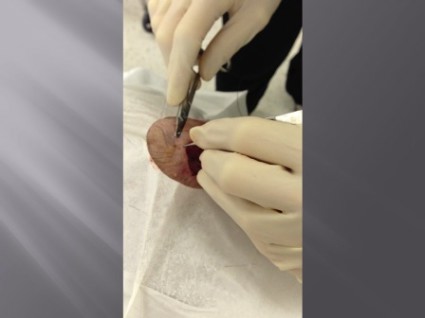
WASHINGTON – The pulley stitch "is my go-to stitch for defects under tension," said Dr. Kelley Pagliai Redbord.
The pulley stitch allows for considerable reduction in the surface area of a large defect that can’t be closed by side-to-side stitches alone, making it an excellent choice for use on the scalp and legs, Dr. Redbord said at the Atlantic Dermatological Conference.
"When the tension across the wound is decreased, buried dermal sutures can be placed more easily and accurately," she said. "I use it a lot as an intraoperative tissue expander."
Dr. Redbord said that her description of the pulley stitch was taken from an article by Dr. Cyndi Yag-Howard in Dermatologic Surgery (Dermatol. Surg. 2011; 37:1503-5).*
The pulley stitch can serve as a temporary suture that can be left in place or removed, said Dr. Redbord, a dermatologist in group practice in Rockville, Md.
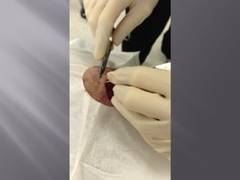
The technique follows a far-near-near-far pattern, starting the stitch 8 mm from the wound edge (far), then bringing it to the opposite side just 4 mm from the wound edge (near). Dr. Redbord then reenters the stitch 4 mm from the wound edge on the initial side (near), and makes another pass to the opposite side 8 mm from the wound edge (far).
Multiple passes through the tissue create resistance that keeps the suture from slipping. "The loops of the stitch are placed at an oblique angle so that the inner and outer loops are offset and do not override each other," she noted. This technique minimizes potential skin damage from pressure necrosis caused by overriding loop sutures. The pulley stitch has a 2:1 mechanical advantage over an interrupted suture, and the additional friction of a second loop prevents the knot from slipping.
A modification of the pulley stitch is to loop the suture through an external loop on the opposite side of the incision, and pull across. "This new loop functions as a pulley and directs the tension away from the other strands," she said.
Another stitch with excellent eversion, in which the pulley stitch plays a key role, is the subcutaneous inverted cross mattress stitch (SICM). The SCIM is entirely subcutaneous, and combines the buried vertical mattress stitch and the buried pulley stitch.
The SCIM "uses the buried vertical mattress’s ability to evert wound edges and combines it with the pulley stitch’s ability to decrease tension at the wound edge," she said.
The four-step process is as follows:
• 1. Insert the needle into the dermis 3-5 mm lateral to the wound edge. Advance the needle into the upper reticular dermis, and then curve down to exit through the lower reticular dermis.
• 2. Insert the needle into the opposite edge of the wound at the lower reticular dermis and advance into the upper reticular dermis, then curve down and exit intradermally.
• 3. Insert the needle across the defect using an intradermal approach 1-2 mm lateral to the initial needle insertion point. Then, create a second buried vertical mattress stitch.
• 4. Pull the two stitches to close, which "creates a pulley effect with minimal recoil, and tie off," Dr. Redbord said.
"The pulley system locks the wound edges so that a knot can be tied without slipping," she added.
Dr. Redbord said she had no relevant financial disclosures.
EDITOR'S NOTE: August 26, 2013: This article has been amended since it was first published to make it clear that Dr. Kelley Pagliai Redbord's description of the pulley stitch procedure was taken directly from an article published by Dr. Cyndi Yag-Howard in Dermatologic Surgery (Dermatol. Surg.2011;37:1503-5). In her presentation, Dr. Redbord credited Dr. Yag-Howard and her article. However, this credit and attribution to Dr. Yag-Howard was not included in the article published.
WASHINGTON – The pulley stitch "is my go-to stitch for defects under tension," said Dr. Kelley Pagliai Redbord.
The pulley stitch allows for considerable reduction in the surface area of a large defect that can’t be closed by side-to-side stitches alone, making it an excellent choice for use on the scalp and legs, Dr. Redbord said at the Atlantic Dermatological Conference.
"When the tension across the wound is decreased, buried dermal sutures can be placed more easily and accurately," she said. "I use it a lot as an intraoperative tissue expander."
Dr. Redbord said that her description of the pulley stitch was taken from an article by Dr. Cyndi Yag-Howard in Dermatologic Surgery (Dermatol. Surg. 2011; 37:1503-5).*
The pulley stitch can serve as a temporary suture that can be left in place or removed, said Dr. Redbord, a dermatologist in group practice in Rockville, Md.
The technique follows a far-near-near-far pattern, starting the stitch 8 mm from the wound edge (far), then bringing it to the opposite side just 4 mm from the wound edge (near). Dr. Redbord then reenters the stitch 4 mm from the wound edge on the initial side (near), and makes another pass to the opposite side 8 mm from the wound edge (far).
Multiple passes through the tissue create resistance that keeps the suture from slipping. "The loops of the stitch are placed at an oblique angle so that the inner and outer loops are offset and do not override each other," she noted. This technique minimizes potential skin damage from pressure necrosis caused by overriding loop sutures. The pulley stitch has a 2:1 mechanical advantage over an interrupted suture, and the additional friction of a second loop prevents the knot from slipping.
A modification of the pulley stitch is to loop the suture through an external loop on the opposite side of the incision, and pull across. "This new loop functions as a pulley and directs the tension away from the other strands," she said.
Another stitch with excellent eversion, in which the pulley stitch plays a key role, is the subcutaneous inverted cross mattress stitch (SICM). The SCIM is entirely subcutaneous, and combines the buried vertical mattress stitch and the buried pulley stitch.
The SCIM "uses the buried vertical mattress’s ability to evert wound edges and combines it with the pulley stitch’s ability to decrease tension at the wound edge," she said.
The four-step process is as follows:
• 1. Insert the needle into the dermis 3-5 mm lateral to the wound edge. Advance the needle into the upper reticular dermis, and then curve down to exit through the lower reticular dermis.
• 2. Insert the needle into the opposite edge of the wound at the lower reticular dermis and advance into the upper reticular dermis, then curve down and exit intradermally.
• 3. Insert the needle across the defect using an intradermal approach 1-2 mm lateral to the initial needle insertion point. Then, create a second buried vertical mattress stitch.
• 4. Pull the two stitches to close, which "creates a pulley effect with minimal recoil, and tie off," Dr. Redbord said.
"The pulley system locks the wound edges so that a knot can be tied without slipping," she added.
Dr. Redbord said she had no relevant financial disclosures.
EXPERT ANALYSIS FROM THE ATLANTIC DERMATOLOGICAL CONFERENCE
Major finding: Key numerical finding (e.g., number needed to treat to prevent one death/event; number lived or died as result of intervention). Maximum 10 words/1 sentence.
Data source: Include type of study (e.g., randomized, placebo controlled trial; retrospective case-control study). Include number in the study.
Disclosures: Sponsor of study, funding source, relevant disclosures. If author has no relevant disclosures, "Dr. X reported having no financial disclosures." If necessary, "Meeting Y did not require reports of financial disclosures." Check meeting website because many list disclosures. Written in sentence form.
Social marketing
You’ve heard it before: Social media is the new marketing. Chances are good that you’re already using social media to market your practice. The question is: Are you using it effectively?
Traditional marketing – buying ads through newspapers, magazines, radio, et cetera – is still alive. But more and more, companies, including medical practices, are turning to social media marketing or "media marketing." Why? Social marketing costs less, helps build your brand, is interactive, is less obtrusive, provides real-time results, and can be adjusted or tailored quickly to meet your current needs.
As health care providers, we know that the best form of advertising is positive word of mouth. Turns out the same is true online. A 2012 Nielsen Global Trust in Advertising report found that of 28,000 Internet respondents in 56 countries, 92% of consumers said they trusted earned media (media recommended by family and friends) above all other forms of advertising.
The same is true with health care. Health care consumers want more, not fewer, online reviews of doctors and medical centers because they trust word of mouth. According to a May 2011 report from the Pew Research Center, 16% of Internet users, or 12% of adults, have consulted online rankings or reviews of doctors or other health care providers. These numbers will only rise as more patients post reviews.
Despite its benefits, social marketing won’t work for your practice if you don’t use it correctly. Unlike traditional marketing, which relies on a one-way message from the company (you) to the consumer (your current and prospective patients), social marketing is a two-way message. You are connecting with and sharing information with others on different social media platforms on a regular basis.
Successful marketing is a multistep process. It’s not good enough to simply attract. You also need to convert. The online world is full of clutter, so to attract people’s attention, you need to provide value. You do this by creating compelling, credible content that can be easily shared on many social platforms, such as Twitter, Facebook, and Pinterest. The hub of your social media marketing content should be your website/blog.
Your practice website should include a blog that is continually updated with fresh, original material that can be shared on social platforms. That way, when people find you on Facebook or Twitter, they can click through to your practice website where conversion takes place. Keep in mind it often takes more than one visit to convert.
For social marketing to be effective, you need a strong brand and message. Are you the acne expert? The technologically tricked-out Mohs surgeon? The bilingual pediatrician?
Let’s look at an example: You’re a pediatric dermatologist who specializes in eczema. You write engaging, useful, medically accurate blog posts that you share on different social media platforms. A mom of a child with eczema finds a link to one of your posts on natural remedies for eczema. She clicks through to your practice website, where she posts a comment on the blog and shares the post on Pinterest.
Here’s what she should find while she’s on your practice’s website:
• A clean, updated site with information about you and your practice.
• More blog posts for visitors to read and comment on.
• An RSS feed to subscribe to your blog.
• The ability to sign up for your newsletter or do one-click shopping (if applicable).
• The ability to make an appointment by phone or by using an online booking service (such as ZocDoc.com).
• Links to your other social media platforms (Facebook page, twitter feed).
• Any details that make your practice stand out, such as when and whether you offer night or weekend appointments, descriptions of your latest technology, or the presence of multilingual staff.
She will likely start consuming your information. She might comment on a blog post, begin following you on Twitter, or sign up for your RSS feed that will provide her with updates every time you post new content. Over time, she will come to value your brand and see you as a trusted source of information. She may eventually schedule an appointment, refer you to a friend, or buy one of your products. Likely, she’ll share her positive experiences online, helping to spread the good word about you.
If you’ve tried social media marketing in the past and didn’t find it successful, then ask yourself these questions: Did you misuse your social media platforms by constantly promoting yourself or criticizing others? Did you spam people with unwanted ads or add people to your e-mail list without their permission? Ignore questions and comments? Forget to make it about them, not you?
Today, there is no successful marketing without successful social media. By following these steps, not only will you attract new clients, you will also convert them, leading to more satisfied patients and a more satisfied you.
Dr. Benabio is in private practice in San Diego. Visit his consumer health blog at http://thedermblog.com; connect with him on Twitter @Dermdoc, and on Facebook (DermDoc).

Resolving patients' complaints
For most physicians, the resolution of patients’ complaints ranks second only to firing an employee on the Least Favorite Tasks List. With so many potential problems, and so many ways patients can react to them, it seems impossible to construct any sort of template for consistent, mutually satisfactory resolutions.
But it can be done, and it’s not as complex as it appears, once you realize that the vast majority of complaints have the same basic root: The patient’s expectations have not been met. Sometimes it’s your fault, sometimes the patient’s, and often a bit of both, but either way, the result is the same: You have an unhappy patient, and you must deal with it.
I have distilled this unpleasant duty down to a simple, three-part strategy:
• Discover which expectations went unmet and why.
• Agree on a solution.
• Learn from the experience, to prevent similar future complaints.
In most cases, this is not a job you should delegate. Unless the complaint is trivial or purely administrative, you should address it yourself. It’s what you would want if you were the complainant, and it’s often too important to trust to a subordinate.
At this point, you may be asking, "Why should I care?" Is the personal expenditure of your time and effort necessary to resolve complaints really worth it? Absolutely, because the old cliché is true: A satisfied patient will refer 5 new ones, but a dissatisfied one will frighten away 20 or more. Besides, if the complaint is significant and you don’t resolve it, the patient is likely to find someone who will; and chances are you won’t like their choice, or the eventual resolution.
Of course, the easiest way to deal with complaints is to prevent as many as possible in the first place. Try to nip unrealistic expectations in the bud. Take the time in advance to explain all treatments and procedures, and their most likely outcomes, in a clear and honest manner. And since even the most astute patients will not absorb everything you tell them, make liberal use of written handouts and other visual aids.
And, of course, document everything you have explained. Documentation is like garlic: There is no such thing as too much of it.
But despite your best efforts, there will always be complaints, and handling them is a skill set worth honing. The most important skill in that set is the one most people – especially physicians – do poorly: Listening to the complaint. Before you can resolve a problem, you have to know what it is, and this is precisely the wrong time to make assumptions or jump to conclusions.
So listen to the entire complaint without interrupting, defending, or justifying. Angry patients don’t care why the problem occurred, and they are not interested in your side of the story. This is not about you, so listen and understand.
As you listen, the unmet expectations will become clear. When the patient is finished, I like to summarize the complaint in that context: "So, if I understand you correctly, you expected "X" to happen, but "Y" happened instead." If I’m wrong, I modify my summary until the patient agrees that I understand the problem.
Once you know the problem, you can talk about a solution. The patient usually has one in mind – additional treatment, a referral elsewhere, a fee adjustment, or sometimes simply an apology. Consider it.
If the patient’s solution is reasonable, by all means, agree to it; if it is unreasonable, try to offer a reasonable alternative. The temptation is to think more about protecting yourself than about making the patient happy, but that often leads to bigger problems. Don’t be defensive. Remember, this is not about you.
I am often asked if refunding a fee is a reasonable solution. Some patients (and lawyers) will interpret a refund as a tacit admission of guilt, so I generally try to avoid them. However, cancelling a small fee for an angry patient can be very prudent, and in my opinion that looks exactly like what it is: an honest effort to rectify the situation. But in general, free (or reduced-fee) additional materials or services are a better alternative than refunding money.
Once you have arrived at a mutually satisfactory solution, again, document everything, but consider reserving a "private" chart area for such documentation (unless it is a bona fide clinical issue) so that it won’t go out to referrers and other third parties with copies of your clinical notes. Also, consider having the patient sign off on the documentation, acknowledging that the complaint has been resolved.
Finally, always try to learn something from the experience. Ask yourself how you might prevent a repetition of the complaint, what you did that you can avoid doing next time, and how you might prevent unrealistic expectations in a similar future situation.
Above all, don’t take complaints personally – even when they are personal. It’s always worth remembering that no matter how hard you try, you can never please everyone.
Dr. Eastern practices dermatology and dermatologic surgery in Belleville, N.J.

MDS: What Do Hospitalists Need to Know?
Myelodysplastic syndromes (MDS) comprise a heterogeneous group of clonal hematopoietic stem cell neoplasms characterized by dysplasia, ineffective hematopoiesis resulting in peripheral blood (PB) cytopenias affecting one or more cell lines, and a variable risk of progression to acute myeloid leukemia (AML). The last 15 years have witnessed significant advances in our understanding of the complex pathogenesis, classification and prognostication, and therapeutic approaches to MDS. As more elderly patients are diagnosed with MDS, encounters with hospitalized MDS patients or patients in whom MDS should be considered in the differential diagnosis are common events for today's hospitalists. In this review, we discuss the epidemiology, diagnosis, pathogenesis, prognostication, and therapies for MDS, with an emphasis on practical aspects that would be useful for hospitalists caring for these patients.
EPIDEMIOLOGY OF MDS
Although MDS is one of the most common hematologic malignancies, MDS remains understudied epidemiologically.[1, 2] Our understanding of the epidemiology improved after the implementation of reporting requirements to cancer registries, especially the Surveillance, Epidemiology, and End Results (SEER) database in 2001.[1, 2, 3] Age‐adjusted incidence of MDS in the United States ranged between 3.3 to 4.6 per 100,000 persons per year in the period between 2001 and 2008.[1, 2, 4] The majority of MDS patients are elderly, and because MDS incidence increases with age, the number of patients diagnosed with MDS is expected to continue to rise with the aging population.[1, 2, 5] MDS is more common in men compared to women, and in Caucasians compared to African Americans.[1, 2] Different estimates put MDS prevalence in the United States somewhere between 60,000 and 170,000 persons.[2, 6]
DIAGNOSIS OF MDS
Many patients with MDS are asymptomatic at diagnosis and only come to medical attention due to abnormal blood counts done routinely or for other reasons. This contributes to MDS being underdiagnosed. When cytopenias are not severe enough to cause symptoms, it is also frequently overlooked in patients with mild anemia or other cytopenias.[7] Together, being asymptomatic and having relatively mild cytopenias are probably the most important factors that lead to under‐recognition of MDS among primary care physicians (PCPs).[7, 8, 9] There is a misconception that anemia is normal in the elderly, and when patients are not symptomatic that a workup is not needed.[6, 7] This is compounded by a lack of awareness of the importance of making a diagnosis in these patients and of currently available therapies for MDS.[7, 8, 9]
Anemia is not a normal consequence of aging and is always a pathologic state with an underlying etiology.[6, 7] Because a significant number of elderly patients with unexplained anemia could have MDS, patients with symptomatic or progressive anemia, especially if associated with other cytopenias, should be considered for further evaluation.[7, 9] Diagnosis is important given the recent availability of effective therapies for MDS that can improve anemia, decrease transfusion needs, improve life quality, and potentially increase survival. MDS is generally an indolent disease with a relative stability of blood counts in comparison to AML, so prior blood counts and the tempo of the process is an important consideration.[9, 10] The National Comprehensive Cancer Network clinical practice guidelines recommend exclusion of nutritional deficiencies (iron, vitamin B12, folate) and other causes of anemia (eg, gastrointestinal bleeding, renal insufficiency, and anemia of inflammation), assessment of reticulocyte count and serum erythropoietin level, and evaluation of a PB smear for evidence of dysplasia as important initial steps.[10, 11] Eventually the diagnosis of MDS requires a bone marrow (BM) evaluation to confirm the diagnosis and exclude other BM failure states by evaluating for BM cellularity, cell maturation, dysplasia (which should be present in at least 10% of any the myeloid lineages), percentage of blasts (20%), iron stores and sideroblasts, cytogenetics, MDS‐specific fluorescence in situ hybridization (FISH) panels, flow cytometry, and other special testing.[9, 10] Despite extensive testing, MDS can sometimes be very difficult to differentiate from other bone marrow failure states (eg, hypoplastic MDS from aplastic anemia) (Table 1).[10, 11] In the absence of significant morbidity related to MDS, the definitive diagnosis of MDS can be usually made on an outpatient basis. It is important to ensure adequate follow‐up with PCPs postdischarge and/or outpatient hematologist referral for patients with unexplained cytopenias.
|
| Idiopathic cytopenia of undetermined significance: no significant dysplasia or MDS‐associated karyotypic aberrations |
| Acute myeloid leukemia: BM blasts 20%, presence of core‐binding characteristic cytogenetic aberrations: t(8;21), t(15;17), inv(16) defines AML regardless of BM blast count; AML can be associated with hepatosplenomegaly or myeloid sarcomas |
| Chronic myeloid leukemia: presence of Philadelphia chromosome t(9;22) positive, basophilia, and splenomegaly |
| Myelofibrosis: significant BM fibrosis, splenomegaly, and leukoerythroblastic picture in PB (teardrop and nucleated RBCs, left‐shifted myeloid cells) |
| Chronic myelomonocytic leukemia: significant PB monocytosis |
| MDS/MPN overlap syndromes: dysplasia with myeloproliferative characteristics such as splenomegaly, thrombocytosis, or leukocytosis |
| Infections: for example, HIV and parvovirus B19 infections |
| Myelophthisis: infiltration of BM with other tumors (eg, melanoma) with resultant PB cytopenias |
| Nutritional disturbances: B12, folate, and copper deficiency, and zinc and arsenic excess can mimic MDS |
| Medications: drugs that interfere with DNA synthesis such as HIV medications, chemotherapeutic agents, cotrimoxazole, methotrexate, azathioprine, and G‐CSF |
| Immune disorders: for example, LGL leukemia, lupus, or rheumatoid arthritis |
| Other acquired or congenital hematological disorders: for example, paroxysmal nocturnal hemoglobinuria, congenital dyserythropoietic anemia, dyskeratosis congenita |
PATHOGENESIS AND ETIOLOGY OF MDS
Ineffective hematopoiesis due to excessive apoptosis of hematopoietic precursors is a prominent feature of MDS, which explains the apparent paradox of hypercellular BM and PB cytopenias. Although not fully understood, complex epigenetic, genetic, and immunologic mechanisms contribute to the pathogenesis of MDS and account for disease heterogeneity. Aberrant silencing of tumor‐suppressor and DNA repair genes mediated by hypermethylation of their promoters is believed to play an important part in the pathogenesis of MDS.[12] This theory is supported by the unique sensitivity of MDS to drugs that reverse DNA methylation. Genetic abnormalities not only contribute to the pathogenesis of MDS, but are also among the strongest prognostic indicators for MDS patients, and can also affect therapeutic decisions. Clonal karyotypic abnormalities are observed in 50% of patients with MDS using conventional karyotyping.[12, 13] The most common chromosomal aberrations in MDS include deletions of the long arm of chromosome 5 (del5q), monosomy Y, monosomy 7 (del7) or deletion of its long arm (del7q), trisomy 8, del20q, and complex karyotypes (3 chromosomal aberrations).[12, 13] These cytogenetic abnormalities correlate with the prognosis of MDS (eg, poor prognosis with complex karyotypes and chromosome 7 deletions vs better prognosis with isolated del5q).[12, 13]
Recently, FISH assays and genome‐wide screening techniques (eg, single nucleotide polymorphism arrays, array‐based comparative genomic hybridization, whole genome or exome sequencing) have enabled detection of an increasing number of genetic aberrations and recurrent somatic molecular abnormalities in a significant number of MDS patients (eg, abnormalities of ASXL1, IDH1/IDH2, DNMT3, EZH2, TET2, and SF3B1 genes).[12, 14] Most affected genes are involved in the epigenetic regulation of transcription (DNA methylation and demethylation, histone posttranslational modification) or mRNA splicing.[12, 13, 14]
Immunologic aberrations have also been proposed to contribute to pathogenesis of MDS. For example, in early‐stage MDS, an aberrant immune attack on myeloid progenitors resulting in increased apoptosis can contribute to BM failure.[15] This is supported by association of some forms of MDS with autoimmune diseases and observed responses in some patients to immunosuppressive therapies. The relative contribution of pathogenetic mechanisms varies between the different MDS subtypes. For example, haploinsufficiency of cell‐cycle regulatory and ribosomal protein genes located in the commonly deleted region of 5q play an important role in the pathogenesis of MDS with isolated del5q (5q syndrome).[16] Mutations in the RNA spliceosomal machinery gene SF3B have been shown to play a role in the pathogenesis of the MDS subtype refractory anemia with ringed sideroblasts (RARS), with those patients with RARS carrying this mutation having a more favorable prognosis than those with the wild‐type gene.[14] Several excellent recent reviews provide detailed discussion of the complex pathophysiology of MDS.[12, 13, 14, 17]
Approximately 10% of MDS patients have secondary MDS (MDS occurring after chemotherapy or radiation therapy administration for treatment of another malignancy).[2] Aside from advancing age, the causative factors for the other 90% of cases (primary MDS) are unknown in most patients, although environmental and occupational exposures (eg, smoking, painting, insecticides, pesticides, organic solvents), and genetic syndromes (eg, DNA repair defects such as Fanconi's anemia) are implicated in some patients.[2, 10] Recently, an epidemiologic study found an increased MDS risk with obesity.[18]
PROGNOSTICATION OF MDS
MDS is a form of cancer, and most affected patients eventually die from cytopenic complications or leukemic progression. MDS is not a single disease but rather encompasses a group of heterogeneous subtypes with significantly different natural histories and pace of progression. Therefore, accurate risk stratification of MDS is necessary not only to predict survival and risk of leukemic progression, but also to help choose the most appropriate therapeutic option for individual patients. Information about prognosis should also be utilized when making management decisions with patients for other comorbid conditions (eg, major surgery). Two morphologically based classification systems are commonly used for MDS: the French‐American‐British (FAB) system and the World Health Organization (WHO) classification (Table 2), which most recently has supplanted the FAB system as the primary pathologic classification system.[19, 20, 21] Several prognostic models have been developed around the morphologic classifications to better account for relevant clinical and cytogenetic modifiers of this disease. Although some of these models have been validated by different groups, each of these models has limitations. Although the predictions generated by these models are generally accurate for the different prognostic categories to which the patient is assigned, the extent to which the prediction applies to an individual MDS patient can vary significantly. In addition, comorbid conditions affect survival of MDS patients and are not included in the specific scoring systems. For example, congestive heart failure and chronic obstructive lung disease were associated with shortened survival in MDS patients.[18]
| MDS WHO Class | PB Findings | BM Findings |
|---|---|---|
| ||
| Refractory cytopenias with unilineage dysplasia: includes refractory anemia; refractory neutropenia; refractory thrombocytopenia | Unicytopenia or bicytopenia; PB blasts 1% | BM blasts 5%; unilineage dysplasia (10% of cells in any myeloid lineage); 15% of erythroid precursors are ringed sideroblasts |
| Refractory anemia with ring sideroblasts | Anemia; PB blasts 1% | BM blasts 5%; erythroid dysplasia only; 15% of erythroid precursors are ringed sideroblasts |
| Refractory cytopenia with multilineage dysplasia | Cytopenia(s); PB blasts 1%; no Auer rods; 1 106/L monocytes | BM blasts 5% ; dysplasia (10% of cells in at least 2 myeloid lineages); no Auer rods |
| Refractory anemia with excess blasts‐1 | Cytopenia(s); PB blasts 5%; no Auer rods; 1 106/L monocytes | BM blasts 5%9%; unilineage or multilineage dysplasia; no Auer rods |
| Refractory anemia with excess blasts‐2 | Cytopenia(s); PB blasts 5%19%; Auer rods; 1 106/L monocytes | BM blasts 10%19%; unilineage or multilineage dysplasia; Auer rods |
| Myelodysplastic syndromeunclassified | Cytopenias; PB blasts 1% | BM blasts 5%; unequivocal dysplasia in 10% of cells at least one myeloid cell lines when accompanied by a cytogenetic abnormality considered as presumptive evidence for a diagnosis of MDS |
| MDS associated with isolated del5q | Anemia; normal to elevated platelet count; PB blasts 1% | BM blasts 5%; normal to elevated megakaryocytes with hypolobated nuclei; isolated del5q karyotypic abnormality; no Auer rods |
The International Prognostic Scoring System (IPSS) is the most widely used prognostic tool for MDS (Table 3).[22] In this model, an aggregate score is calculated based on points assigned to the percentage of blasts in BM, the number of PB cell lines affected by cytopenias, and the karyotype. Based on this point score, the patient is assigned to 1 of 4 categories that portend significantly different outcomes: low, intermediate‐1 (INT‐1), intermediate‐2 (INT‐2), and high risk. The IPSS was developed from a database of mostly untreated MDS patients and does not account for other important prognostic parameters such as transfusion dependence, depth of cytopenias, and extent/severity of lineage dysplasia.[22] The WHO Prognostic Scoring System was proposed to overcome some of these shortcomings.[23, 24] Efforts to continue to improve the prognostic models further led to a large international collaboration that compiled a much larger database and resulted in the development of a revised IPSS (IPSS‐R).[25] New discoveries of novel prognostic epigenetic, genetic, and immunologic determinants will likely result in the ongoing evolution of the current prognostic systems to further improve their discriminatory power.[26]
| Calculation of Score Value Based on Prognostic Variables | |||||
|---|---|---|---|---|---|
| Score Value | |||||
| 0 | 0.5 | 1.0 | 1.5 | 2.0 | |
| |||||
| Prognostic variable | |||||
| Bone marrow blasts (%)a | 5 | 510 | 1120 | 2130 | |
| Karyotypeb | Good | Intermediate | Poor | ||
| Number of peripheral blood cell line affected by cytopeniasc | 0 or 1 | 2 or 3 | |||
| Median Survival and Risk of Progression to AML According to the IPSS Risk Category in Absence of Therapy | |||||
| Overall Score | Risk Category | Percentage in the IPSS Population | Median Survival (Years) | Median Time From Diagnosis at Which 25% of Patients Progress to AML (Years) | |
| 0 | Low | 33% | 5.7 | 9.4 | |
| 0.51.0 | INT‐1 | 38% | 3.5 | 3.3 | |
| 1.52.0 | INT‐2 | 22% | 1.1 | 1.1 | |
| >2.5 | High | 7% | 0.4 | 0.2 | |
MANAGEMENT OF MDS
Most patients with MDS were treated historically with supportive measures only. The approval of 3 agents for treatment of MDS including the DNA methyltransferase inhibitors (DNMTi) azacitidine and decitabine, as well as the immunomodulatory agent lenalidomide, in the last decade advanced the care of MDS patients significantly (Table 4). Nonetheless, the use of allogeneic hematopoietic stem cell transplantation (alloHSCT) remains the only known curative modality for patients with MDS and should always be considered as a possible therapeutic option.[27] Unfortunately, the majority of patients with MDS are not considered candidates for alloHSCT due to age, comorbidities, and lack of suitable donors.[27] Therefore, most patients with MDS are managed with noncurative treatment and supportive paradigms. Treatment goals generally depend on the risk stratification for the particular individual, age, functional status, comorbidities, and importantly, the patient's individual preference. For medical decision‐making purposes, MDS is traditionally divided into 2 major risk categories: low‐risk (LR) and high‐risk (HR) groups. LR‐MDS includes the IPSS risk categories of low or INT‐1, whereas HR‐MDS is usually defined by the IPSS risk categories of INT‐2 and high. Newer classification tools (eg, IPSS‐R) and better molecular markers are expected to impact such categories as well as treatment recommendations in the future.[26]
|
| Azacitidine (5‐azacytidine, Vidaza) and decitabine (5‐aza,2‐deoxycytidine, Dacogen) |
| Class |
| Hypomethylating agents, azanucleosides |
| Mechanism of action |
| Epigenetic modulation by inhibition of DNA methyltransferase enzymes and other mechanisms |
| Indication |
| First line therapy for HR‐MDS, second line therapy for LR‐MDS after failure of other therapies such as ESAs, lenalidomide, or immunosuppressive agents |
| Approved regimens for MDS |
| Azacitidine: 75 mg/m2/day IV or SC for 7 days Q 4 weeks |
| Decitabine: 15 mg/m2 IV infusion over 3 hours, Q 8 hours for 3 days, Q 6 weeks or 20 mg/m2 IV infusion over 1 hour daily for 5 days Q 4 weeks |
| Common side effects |
| Fatigue |
| Development of or worsening cytopenias (neutropenia, thrombocytopenia, and anemia) and their complications (eg, infections, bleeding) |
| Gastrointestinal disturbances (nausea, vomiting, or diarrhea) |
| Oral ulcers and rarely mucositis |
| Injection site reactions (redness, pain) |
| Lenalidomide (Revlimid) |
| Class |
| Immunomodulatory agent |
| Mechanism of action |
| Modulation of immune responses, gene expression, angiogenesis, cytokines and cell‐cycle regulatory phosphatases, and possibly other mechanisms |
| Indication |
| First line therapy for LR‐MDS with del5q (also used commonly off label for LR‐MDS without del5q as second line of therapy after ESAs) |
| Approved regimens for MDS |
| 10 mg orally once daily |
| Common side effects |
| Skin rash, dryness, and pruritus |
| Fatigue |
| Muscle cramps |
| Development of or worsening cytopenias (neutropenia, thrombocytopenia, and anemia) and their complications (eg, infections, bleeding) |
| Gastrointestinal disturbances (nausea, vomiting, or diarrhea) |
Despite recent advances, supportive care for all patients with MDS remains a very important aspect of management, either in combination with other therapies or as sole therapy for frail patients who cannot tolerate further interventions. Supportive therapy focuses on maintaining a high quality of life and includes careful blood count monitoring, use of growth factors, use of transfusions and antibiotics as needed, and use of iron chelation therapy in some patients. Some of the common situations in which hospitalists encounter patients with MDS are listed in Table 5.
|
| Complications of cytopenias |
| Bleeding: local management based on bleeding site, platelet transfusions, and other blood products (eg, red blood cells, fresh frozen plasma) as appropriate, antifibrinolytics |
| Infections and neutropenic fevers: Antibiotics, antifungals, use of colony granulocyte‐stimulating factors or granulocyte infusions advised only in cases of uncontrolled severe infections or sepsis |
| Severe or symptomatic anemia: red blood transfusions as appropriate based on patient's comorbidities, all disease‐modifying drugs (lenalidomide, azacitidine, decitabine) and ESAs are slow acting and can take weeks to months before improving anemia |
| Complications of therapies |
| Neutropenic fevers: as above plus holding therapy |
| Most other side effects (see Table 4) are well tolerated and are managed symptomatically without requiring hospitalization. If needed hospitalization for side effects: symptomatic management and holding the drug |
| Other medical or surgical condition in a patient with MDS |
| Therapy as per the underlying medical condition. For therapeutic decisions (eg, decision to undergo major surgery), prognostication tools such as the IPSS and newer models can be used to inform medical decision making in consultation with an experienced hematologist |
MANAGEMENT OF LR‐MDS
In addition to supportive care or enrollment in clinical trials, therapies for LR‐MDS include erythropoiesis‐stimulating agents, lenalidomide, and immunosuppressive therapy.
Erythropoiesis‐Stimulating Agents
Anemia in MDS is a multifactorial process that includes ineffective erythropoiesis and suboptimal serum erythropoietin responses.[10, 28, 29] There are no randomized studies to suggest that erythropoiesis‐stimulating agents (ESA) therapy prolongs survival in MDS patients. Nonetheless, ESAs improve anemia significantly in some patients and are widely used.[30, 31] Approximately 20% to 30% of unselected MDS patients and about 40% of LR‐MDS patients achieve clinically meaningful erythroid responses with ESA therapy with a median response duration of 2 years.[30, 31] It is important to correct coexisting nutritional deficiencies (eg, iron or folate deficiency) to optimize responses to ESA.[10] Granulocyte colony‐stimulating factor can be synergistic with ESAs especially in patients with RARS.[10] Patients with LR‐MDS who have low endogenous serum erythropoietin levels (200500 mU/mL) and lower red blood cell (RBC) transfusion requirements (2 U per month) are more likely to respond to ESA therapy.[32, 33] Compared to certain solid tumors, ESA therapy in MDS has not been associated with an increased risk of thromboembolic events.[34]
Lenalidomide
5q syndrome is a subtype of MDS characterized by refractory macrocytic anemia, normal or elevated platelet counts, low BM blast percentage, small hypolobated dysplastic megakaryocytes, an isolated interstitial deletion in 5q, and an indolent natural history.[17, 35] Lenalidomide, an oral derivative of thalidomide, induces high response rates in LR‐MDS patients with 5q deletions, including hematologic improvements, RBC transfusion independence (TI) (56%67%, median duration >104 weeks), cytogenetic responses (50%76%), and complete remissions.[35, 36] These findings resulted in approval of lenalidomide (Revlimid; Celgene Corp., Summit, NJ) for patients with IPSS low or INT‐1 MDS with transfusion‐dependent anemia and 5q deletions with or without additional cytogenetic abnormalities. In addition, lenalidomide has some activity against LR‐MDS without 5q deletions (TI, 26%, median duration 41 weeks) and some patients with HR‐MDS and 5q deletions (TI, 25.5%, median duration 26 weeks.[37, 38] Therefore, lenalidomide is a reasonable consideration in some patients with LR‐MDS without 5q deletions with primary or secondary resistance to ESA therapy.[10]
Immunosuppressive Therapy
Some patients with LR‐MDS respond to immunosuppressive therapy with antithymocyte globulin with or without cyclosporine. Characteristics that correlate with higher response rates: LR‐MDS, younger age (60 years), hypoplastic MDS, normal karyotype, human leukocyte antigen‐DR15 histocompatibility type, and presence of a paroxysmal nocturnal hemoglobinuria clone.[10, 39]
MANAGEMENT OF HR‐MDS
The goal of management for HR‐MDS is to modify the natural history of the disease and to prolong survival. In addition to a supportive care‐only approach or clinical trial referral, 3 standard therapeutic approaches are used for patients with HR‐MDS: alloHSCT, intensive chemotherapy, and DNMTi therapy. The use of intensive AML‐like chemotherapy for HR‐MDS is associated with high toxicity and very limited long‐term success. Despite recent innovations in the field of transplantation, only a minority of MDS patients undergo alloHSCT, as most patients with HR‐MDS are elderly and/or medically infirm. Even for the minority of patients who do undergo alloHSCT, relapse after alloHSCT remains a major challenge.
DNA Methyltransferase Inhibitor Therapy
5‐azacitidine (AZA), (Vidaza; Celgene Corp.) and decitabine (DAC) (Dacogen; Eisai, Inc.) are potent inhibitors of DNA methyltransferases, which are enzymes responsible for cytosine methylation.[38, 40] These so‐called differentiation agents appear to restore normal hematopoiesis for many MDS patients, and the approved regimens of DNMTi in MDS result in overall response rates in about 40% to 60% of patients. Unfortunately, complete remissions (CR) are rare (10%20%) and the duration of responses are also somewhat limited (median CR duration, 10 to 14 months).[41, 42, 43, 44] In randomized clinical trials, both AZA and DAC resulted in significant improvements in blood counts, reduction in transfusion needs, reduced infection rates, decreased risk of progression to AML, and improvements in patient‐reported quality‐of‐life measures.[41, 42, 43, 44] AZA, but not DAC, prolonged survival in HR‐MDS patients in a large randomized trial (median overall survival for the AZA group was 24.5 months compared to 15 months for a group of patients treated with 1 of 3 conventional care regimens).[41, 42, 43, 44] AZA and DAC have not been compared head to head in trials, but most experts recommend AZA for first‐line use in HR‐MDS based on its effect on survival.[10]
AZA and DAC have also been studied as treatments for patients with AML. These agents differ from traditional intensive chemotherapy, as both agents are commonly administered on an outpatient basis, and hematologic responses are generally expected after 4 to 6 cycles of treatment as compared to a single course of intensive cytarabine‐based induction chemotherapy used to treat AML.[45] Additionally, the impact on survival may not require the achievement of a CR based on the finding that MDS patients saw improved survival even in patients whose best responses were hematologic improvements.[46] However, therapy with DNMTi is not curative, and patients are maintained on treatment as long as they are responding and not experiencing major side effects. Still, all patients will eventually lose response to DNMTi.
CONCLUSIONS
MDS is a form of cancer that largely affects elderly patients and leads to a BM failure state and increased risk of leukemic transformation. MDS is underdiagnosed and is frequently overlooked in the differential diagnosis of anemia in the elderly. DNMTi, lenalidomide, and ESA therapy offer effective therapeutic options for many MDS patients, including some considered too old or frail for intensive medical interventions. The use of prognostic models help physicians and patients better understand the common course of patients with MDS and facilitate tailoring of risk‐adapted therapy. It is expected that our improved understanding of the genetic, epigenetic, and immunologic mechanisms that operate in MDS will help develop better classification tools and rationally design effective new therapies.
Acknowledgments
The authors thank Dr. Balazs Zsenits (Medical Director of the Rochester General Hospitalist Group, Rochester General Hospital, Rochester, NY) for his critical review of the article.
Disclosures: Dr. Steven Gore owned stock in Celgene until November 2011, received research support from Celgene and Novartis, and consulted for Celgene. Drs. B. Douglas Smith, Amer Zeidan, and Bishoy Faltas have no relevant disclosures.
- . Epidemiology of myelodysplastic syndromes. Am J Med. 2012;125:S2–S5.
- . Epidemiology, natural history, and practice patterns of patients with myelodysplastic syndromes in 2010. J Natl Compr Canc Netw. 2011;9:57–63.
- . Myelodysplastic syndromes: increasing disease awareness. Introduction. Am J Med. 2012;125:S1.
- , , , et al. Epidemiology of myelodysplastic syndromes and chronic myeloproliferative disorders in the United States, 2001–2004, using data from the NAACCR and SEER programs. Blood. 2008;112:45–52.
- , , , . Myelodysplastic syndromes: incidence and survival in the United States. Cancer. 2007;109:1536–1542.
- , , , , . Prevalence of anemia in persons 65 years and older in the United States: evidence for a high rate of unexplained anemia. Blood. 2004;104:2263–2268.
- . Myelodysplastic syndromes: increasing disease awareness. Discussion. Am J Med. 2012;125:S33–S34.
- . Why are myelodysplastic syndromes unrecognized and underdiagnosed? A primary care perspective. Am J Med. 2012;125:S15–S17.
- , . Clinical presentation, diagnosis, and prognosis of myelodysplastic syndromes. Am J Med. 2012;125:S6–S13.
- , , , et al. NCCN Clinical Practice Guidelines in Oncology: myelodysplastic syndromes. J Natl Compr Canc Netw. 2011;9:30–56.
- . Dysplasia has A differential diagnosis: distinguishing genuine myelodysplastic syndromes (MDS) from mimics, imitators, copycats and impostors. Curr Hematol Malig Rep. 2012;7:310–320.
- , . Interpreting new molecular genetics in myelodysplastic syndromes. Hematology Am Soc Hematol Educ Program. 2012;2012:56–64.
- , , , , . Updates in cytogenetics and molecular markers in MDS. Curr Hematol Malig Rep. 2011;6:126–135.
- , , , . Emerging roles of the spliceosomal machinery in myelodysplastic syndromes and other hematological disorders. Leukemia. 2012;26:2447–2454.
- , , , et al. Reduced natural killer (NK) function associated with high‐risk myelodysplastic syndrome (MDS) and reduced expression of activating NK receptors. Blood. 2007;109:4816–4824.
- , , , et al. Identification of RPS14 as a 5q− syndrome gene by RNA interference screen. Nature. 2008;451:335–339.
- , , . Unraveling the molecular pathophysiology of myelodysplastic syndromes. J Clin Oncol. 2011;29:504–515.
- , , , et al. Obesity, lifestyle factors, and risk of myelodysplastic syndromes in a large US cohort. Am J Epidemiol. 2009;169:1492–1499.
- , , , et al. Proposals for the classification of the myelodysplastic syndromes. Br J Haematol. 1982;51:189–199.
- , , , et al. World Health Organization classification of neoplastic diseases of the hematopoietic and lymphoid tissues: report of the Clinical Advisory Committee Meeting–Airlie House, Virginia, November 1997. J Clin Oncol. 1999;17:3835–3849.
- , , , et al. WHO classification of MDS. In: World Health Organization Classification of Tumours of Haematopoietic and Lymphoid Tissues. Lyon, France: IARC Press; 2008.
- , , , et al. International scoring system for evaluating prognosis in myelodysplastic syndromes. Blood. 1997;89:2079–2088.
- , , , et al. Time‐dependent prognostic scoring system for predicting survival and leukemic evolution in myelodysplastic syndromes. J Clin Oncol. 2007;25:3503–3510.
- , , , et al. Impact of the degree of anemia on the outcome of patients with myelodysplastic syndrome and its integration into the WHO classification‐based Prognostic Scoring System (WPSS). Haematologica. 2011;96:1433–1440.
- , , , et al. Revised international prognostic scoring system for myelodysplastic syndromes. Blood. 2012;120:2454–2465.
- , , , . Prognostication in myelodysplastic syndromes: beyond the International Prognostic Scoring System (IPSS). Am J Med. 2013;126:e25.
- , . Myelodysplastic syndromes: who and when in the course of disease to transplant. Hematology Am Soc Hematol Educ Program. 2012;2012:49–55.
- , , , , , . “Low‐risk” myelodysplastic syndrome is associated with excessive apoptosis and an increased ratio of pro‐ versus anti‐apoptotic bcl‐2‐related proteins. Br J Haematol. 1998;103:1075–1082.
- , . Ineffective haemopoiesis and apoptosis in myelodysplastic syndromes. Br J Haematol. 1998;101:220–230.
- . Hematopoietic growth factors in myelodysplastic syndromes. Semin Oncol. 2011;38:635–647.
- , , , et al. Patient and physician characteristics associated with erythropoiesis‐stimulating agent use in patients with myelodysplastic syndromes. Haematologica. 2012;97:128–132.
- , , , et al. Predictive factors of response and survival in myelodysplastic syndrome treated with erythropoietin and G‐CSF: the GFM experience. Blood. 2008;111:574–582.
- , , , et al. Erythroid response to treatment with G‐CSF plus erythropoietin for the anaemia of patients with myelodysplastic syndromes: proposal for a predictive model. Br J Haematol. 1997;99:344–351.
- , , , et al. Erythropoiesis‐stimulating agents are not associated with increased risk of thrombosis in patients with myelodysplastic syndromes. Haematologica. 2012;97:15–20.
- , , , et al. Lenalidomide in the myelodysplastic syndrome with chromosome 5q deletion. N Engl J Med. 2006;355:1456–1465.
- , , , et al. A randomized phase 3 study of lenalidomide versus placebo in RBC transfusion‐dependent patients with low‐/‐ntermediate‐1‐risk myelodysplastic syndromes with del5q. Blood. 2011;118:3765–3776.
- , , , et al. Phase 2 study of lenalidomide in transfusion‐dependent, low‐risk, and intermediate‐1 risk myelodysplastic syndromes with karyotypes other than deletion 5q. Blood. 2008;111:86–93.
- , , , et al. Efficacy and safety of lenalidomide in intermediate‐2 or high‐risk myelodysplastic syndromes with 5q deletion: results of a phase 2 study. Blood. 2009;113:3947–3952.
- , , , , . Factors affecting response and survival in patients with myelodysplasia treated with immunosuppressive therapy. J Clin Oncol. 2008;26:2505–2511.
- , . DNA methyltransferase and histone deacetylase inhibitors in the treatment of myelodysplastic syndromes. Semin Hematol. 2008;45:23–30.
- , , , et al. Efficacy of azacitidine compared with that of conventional care regimens in the treatment of higher‐risk myelodysplastic syndromes: a randomised, open‐label, phase III study. Lancet Oncol. 2009;10:223–232.
- , , , et al. Randomized controlled trial of azacitidine in patients with the myelodysplastic syndrome: a study of the cancer and leukemia group B. J Clin Oncol. 2002;20:2429–2440.
- , , , et al. Decitabine improves patient outcomes in myelodysplastic syndromes: results of a phase III randomized study. Cancer. 2006;106:1794–1803.
- , , , et al. Low‐dose decitabine versus best supportive care in elderly patients with intermediate‐ or high‐risk myelodysplastic syndrome (MDS) ineligible for intensive chemotherapy: final results of the randomized phase III study of the European Organisation for Research and Treatment of Cancer Leukemia Group and the German MDS Study Group. J Clin Oncol. 2011;29:1987–1996.
- , , , et al. Further analysis of trials with azacitidine in patients with myelodysplastic syndrome: studies 8421, 8921, and 9221 by the Cancer and Leukemia Group B. J Clin Oncol. 2006;24:3895–3903.
- , , , et al. Prognostic factors for response and overall survival in 282 patients with higher‐risk myelodysplastic syndromes treated with azacitidine. Blood. 2011;117:403–411.
Myelodysplastic syndromes (MDS) comprise a heterogeneous group of clonal hematopoietic stem cell neoplasms characterized by dysplasia, ineffective hematopoiesis resulting in peripheral blood (PB) cytopenias affecting one or more cell lines, and a variable risk of progression to acute myeloid leukemia (AML). The last 15 years have witnessed significant advances in our understanding of the complex pathogenesis, classification and prognostication, and therapeutic approaches to MDS. As more elderly patients are diagnosed with MDS, encounters with hospitalized MDS patients or patients in whom MDS should be considered in the differential diagnosis are common events for today's hospitalists. In this review, we discuss the epidemiology, diagnosis, pathogenesis, prognostication, and therapies for MDS, with an emphasis on practical aspects that would be useful for hospitalists caring for these patients.
EPIDEMIOLOGY OF MDS
Although MDS is one of the most common hematologic malignancies, MDS remains understudied epidemiologically.[1, 2] Our understanding of the epidemiology improved after the implementation of reporting requirements to cancer registries, especially the Surveillance, Epidemiology, and End Results (SEER) database in 2001.[1, 2, 3] Age‐adjusted incidence of MDS in the United States ranged between 3.3 to 4.6 per 100,000 persons per year in the period between 2001 and 2008.[1, 2, 4] The majority of MDS patients are elderly, and because MDS incidence increases with age, the number of patients diagnosed with MDS is expected to continue to rise with the aging population.[1, 2, 5] MDS is more common in men compared to women, and in Caucasians compared to African Americans.[1, 2] Different estimates put MDS prevalence in the United States somewhere between 60,000 and 170,000 persons.[2, 6]
DIAGNOSIS OF MDS
Many patients with MDS are asymptomatic at diagnosis and only come to medical attention due to abnormal blood counts done routinely or for other reasons. This contributes to MDS being underdiagnosed. When cytopenias are not severe enough to cause symptoms, it is also frequently overlooked in patients with mild anemia or other cytopenias.[7] Together, being asymptomatic and having relatively mild cytopenias are probably the most important factors that lead to under‐recognition of MDS among primary care physicians (PCPs).[7, 8, 9] There is a misconception that anemia is normal in the elderly, and when patients are not symptomatic that a workup is not needed.[6, 7] This is compounded by a lack of awareness of the importance of making a diagnosis in these patients and of currently available therapies for MDS.[7, 8, 9]
Anemia is not a normal consequence of aging and is always a pathologic state with an underlying etiology.[6, 7] Because a significant number of elderly patients with unexplained anemia could have MDS, patients with symptomatic or progressive anemia, especially if associated with other cytopenias, should be considered for further evaluation.[7, 9] Diagnosis is important given the recent availability of effective therapies for MDS that can improve anemia, decrease transfusion needs, improve life quality, and potentially increase survival. MDS is generally an indolent disease with a relative stability of blood counts in comparison to AML, so prior blood counts and the tempo of the process is an important consideration.[9, 10] The National Comprehensive Cancer Network clinical practice guidelines recommend exclusion of nutritional deficiencies (iron, vitamin B12, folate) and other causes of anemia (eg, gastrointestinal bleeding, renal insufficiency, and anemia of inflammation), assessment of reticulocyte count and serum erythropoietin level, and evaluation of a PB smear for evidence of dysplasia as important initial steps.[10, 11] Eventually the diagnosis of MDS requires a bone marrow (BM) evaluation to confirm the diagnosis and exclude other BM failure states by evaluating for BM cellularity, cell maturation, dysplasia (which should be present in at least 10% of any the myeloid lineages), percentage of blasts (20%), iron stores and sideroblasts, cytogenetics, MDS‐specific fluorescence in situ hybridization (FISH) panels, flow cytometry, and other special testing.[9, 10] Despite extensive testing, MDS can sometimes be very difficult to differentiate from other bone marrow failure states (eg, hypoplastic MDS from aplastic anemia) (Table 1).[10, 11] In the absence of significant morbidity related to MDS, the definitive diagnosis of MDS can be usually made on an outpatient basis. It is important to ensure adequate follow‐up with PCPs postdischarge and/or outpatient hematologist referral for patients with unexplained cytopenias.
|
| Idiopathic cytopenia of undetermined significance: no significant dysplasia or MDS‐associated karyotypic aberrations |
| Acute myeloid leukemia: BM blasts 20%, presence of core‐binding characteristic cytogenetic aberrations: t(8;21), t(15;17), inv(16) defines AML regardless of BM blast count; AML can be associated with hepatosplenomegaly or myeloid sarcomas |
| Chronic myeloid leukemia: presence of Philadelphia chromosome t(9;22) positive, basophilia, and splenomegaly |
| Myelofibrosis: significant BM fibrosis, splenomegaly, and leukoerythroblastic picture in PB (teardrop and nucleated RBCs, left‐shifted myeloid cells) |
| Chronic myelomonocytic leukemia: significant PB monocytosis |
| MDS/MPN overlap syndromes: dysplasia with myeloproliferative characteristics such as splenomegaly, thrombocytosis, or leukocytosis |
| Infections: for example, HIV and parvovirus B19 infections |
| Myelophthisis: infiltration of BM with other tumors (eg, melanoma) with resultant PB cytopenias |
| Nutritional disturbances: B12, folate, and copper deficiency, and zinc and arsenic excess can mimic MDS |
| Medications: drugs that interfere with DNA synthesis such as HIV medications, chemotherapeutic agents, cotrimoxazole, methotrexate, azathioprine, and G‐CSF |
| Immune disorders: for example, LGL leukemia, lupus, or rheumatoid arthritis |
| Other acquired or congenital hematological disorders: for example, paroxysmal nocturnal hemoglobinuria, congenital dyserythropoietic anemia, dyskeratosis congenita |
PATHOGENESIS AND ETIOLOGY OF MDS
Ineffective hematopoiesis due to excessive apoptosis of hematopoietic precursors is a prominent feature of MDS, which explains the apparent paradox of hypercellular BM and PB cytopenias. Although not fully understood, complex epigenetic, genetic, and immunologic mechanisms contribute to the pathogenesis of MDS and account for disease heterogeneity. Aberrant silencing of tumor‐suppressor and DNA repair genes mediated by hypermethylation of their promoters is believed to play an important part in the pathogenesis of MDS.[12] This theory is supported by the unique sensitivity of MDS to drugs that reverse DNA methylation. Genetic abnormalities not only contribute to the pathogenesis of MDS, but are also among the strongest prognostic indicators for MDS patients, and can also affect therapeutic decisions. Clonal karyotypic abnormalities are observed in 50% of patients with MDS using conventional karyotyping.[12, 13] The most common chromosomal aberrations in MDS include deletions of the long arm of chromosome 5 (del5q), monosomy Y, monosomy 7 (del7) or deletion of its long arm (del7q), trisomy 8, del20q, and complex karyotypes (3 chromosomal aberrations).[12, 13] These cytogenetic abnormalities correlate with the prognosis of MDS (eg, poor prognosis with complex karyotypes and chromosome 7 deletions vs better prognosis with isolated del5q).[12, 13]
Recently, FISH assays and genome‐wide screening techniques (eg, single nucleotide polymorphism arrays, array‐based comparative genomic hybridization, whole genome or exome sequencing) have enabled detection of an increasing number of genetic aberrations and recurrent somatic molecular abnormalities in a significant number of MDS patients (eg, abnormalities of ASXL1, IDH1/IDH2, DNMT3, EZH2, TET2, and SF3B1 genes).[12, 14] Most affected genes are involved in the epigenetic regulation of transcription (DNA methylation and demethylation, histone posttranslational modification) or mRNA splicing.[12, 13, 14]
Immunologic aberrations have also been proposed to contribute to pathogenesis of MDS. For example, in early‐stage MDS, an aberrant immune attack on myeloid progenitors resulting in increased apoptosis can contribute to BM failure.[15] This is supported by association of some forms of MDS with autoimmune diseases and observed responses in some patients to immunosuppressive therapies. The relative contribution of pathogenetic mechanisms varies between the different MDS subtypes. For example, haploinsufficiency of cell‐cycle regulatory and ribosomal protein genes located in the commonly deleted region of 5q play an important role in the pathogenesis of MDS with isolated del5q (5q syndrome).[16] Mutations in the RNA spliceosomal machinery gene SF3B have been shown to play a role in the pathogenesis of the MDS subtype refractory anemia with ringed sideroblasts (RARS), with those patients with RARS carrying this mutation having a more favorable prognosis than those with the wild‐type gene.[14] Several excellent recent reviews provide detailed discussion of the complex pathophysiology of MDS.[12, 13, 14, 17]
Approximately 10% of MDS patients have secondary MDS (MDS occurring after chemotherapy or radiation therapy administration for treatment of another malignancy).[2] Aside from advancing age, the causative factors for the other 90% of cases (primary MDS) are unknown in most patients, although environmental and occupational exposures (eg, smoking, painting, insecticides, pesticides, organic solvents), and genetic syndromes (eg, DNA repair defects such as Fanconi's anemia) are implicated in some patients.[2, 10] Recently, an epidemiologic study found an increased MDS risk with obesity.[18]
PROGNOSTICATION OF MDS
MDS is a form of cancer, and most affected patients eventually die from cytopenic complications or leukemic progression. MDS is not a single disease but rather encompasses a group of heterogeneous subtypes with significantly different natural histories and pace of progression. Therefore, accurate risk stratification of MDS is necessary not only to predict survival and risk of leukemic progression, but also to help choose the most appropriate therapeutic option for individual patients. Information about prognosis should also be utilized when making management decisions with patients for other comorbid conditions (eg, major surgery). Two morphologically based classification systems are commonly used for MDS: the French‐American‐British (FAB) system and the World Health Organization (WHO) classification (Table 2), which most recently has supplanted the FAB system as the primary pathologic classification system.[19, 20, 21] Several prognostic models have been developed around the morphologic classifications to better account for relevant clinical and cytogenetic modifiers of this disease. Although some of these models have been validated by different groups, each of these models has limitations. Although the predictions generated by these models are generally accurate for the different prognostic categories to which the patient is assigned, the extent to which the prediction applies to an individual MDS patient can vary significantly. In addition, comorbid conditions affect survival of MDS patients and are not included in the specific scoring systems. For example, congestive heart failure and chronic obstructive lung disease were associated with shortened survival in MDS patients.[18]
| MDS WHO Class | PB Findings | BM Findings |
|---|---|---|
| ||
| Refractory cytopenias with unilineage dysplasia: includes refractory anemia; refractory neutropenia; refractory thrombocytopenia | Unicytopenia or bicytopenia; PB blasts 1% | BM blasts 5%; unilineage dysplasia (10% of cells in any myeloid lineage); 15% of erythroid precursors are ringed sideroblasts |
| Refractory anemia with ring sideroblasts | Anemia; PB blasts 1% | BM blasts 5%; erythroid dysplasia only; 15% of erythroid precursors are ringed sideroblasts |
| Refractory cytopenia with multilineage dysplasia | Cytopenia(s); PB blasts 1%; no Auer rods; 1 106/L monocytes | BM blasts 5% ; dysplasia (10% of cells in at least 2 myeloid lineages); no Auer rods |
| Refractory anemia with excess blasts‐1 | Cytopenia(s); PB blasts 5%; no Auer rods; 1 106/L monocytes | BM blasts 5%9%; unilineage or multilineage dysplasia; no Auer rods |
| Refractory anemia with excess blasts‐2 | Cytopenia(s); PB blasts 5%19%; Auer rods; 1 106/L monocytes | BM blasts 10%19%; unilineage or multilineage dysplasia; Auer rods |
| Myelodysplastic syndromeunclassified | Cytopenias; PB blasts 1% | BM blasts 5%; unequivocal dysplasia in 10% of cells at least one myeloid cell lines when accompanied by a cytogenetic abnormality considered as presumptive evidence for a diagnosis of MDS |
| MDS associated with isolated del5q | Anemia; normal to elevated platelet count; PB blasts 1% | BM blasts 5%; normal to elevated megakaryocytes with hypolobated nuclei; isolated del5q karyotypic abnormality; no Auer rods |
The International Prognostic Scoring System (IPSS) is the most widely used prognostic tool for MDS (Table 3).[22] In this model, an aggregate score is calculated based on points assigned to the percentage of blasts in BM, the number of PB cell lines affected by cytopenias, and the karyotype. Based on this point score, the patient is assigned to 1 of 4 categories that portend significantly different outcomes: low, intermediate‐1 (INT‐1), intermediate‐2 (INT‐2), and high risk. The IPSS was developed from a database of mostly untreated MDS patients and does not account for other important prognostic parameters such as transfusion dependence, depth of cytopenias, and extent/severity of lineage dysplasia.[22] The WHO Prognostic Scoring System was proposed to overcome some of these shortcomings.[23, 24] Efforts to continue to improve the prognostic models further led to a large international collaboration that compiled a much larger database and resulted in the development of a revised IPSS (IPSS‐R).[25] New discoveries of novel prognostic epigenetic, genetic, and immunologic determinants will likely result in the ongoing evolution of the current prognostic systems to further improve their discriminatory power.[26]
| Calculation of Score Value Based on Prognostic Variables | |||||
|---|---|---|---|---|---|
| Score Value | |||||
| 0 | 0.5 | 1.0 | 1.5 | 2.0 | |
| |||||
| Prognostic variable | |||||
| Bone marrow blasts (%)a | 5 | 510 | 1120 | 2130 | |
| Karyotypeb | Good | Intermediate | Poor | ||
| Number of peripheral blood cell line affected by cytopeniasc | 0 or 1 | 2 or 3 | |||
| Median Survival and Risk of Progression to AML According to the IPSS Risk Category in Absence of Therapy | |||||
| Overall Score | Risk Category | Percentage in the IPSS Population | Median Survival (Years) | Median Time From Diagnosis at Which 25% of Patients Progress to AML (Years) | |
| 0 | Low | 33% | 5.7 | 9.4 | |
| 0.51.0 | INT‐1 | 38% | 3.5 | 3.3 | |
| 1.52.0 | INT‐2 | 22% | 1.1 | 1.1 | |
| >2.5 | High | 7% | 0.4 | 0.2 | |
MANAGEMENT OF MDS
Most patients with MDS were treated historically with supportive measures only. The approval of 3 agents for treatment of MDS including the DNA methyltransferase inhibitors (DNMTi) azacitidine and decitabine, as well as the immunomodulatory agent lenalidomide, in the last decade advanced the care of MDS patients significantly (Table 4). Nonetheless, the use of allogeneic hematopoietic stem cell transplantation (alloHSCT) remains the only known curative modality for patients with MDS and should always be considered as a possible therapeutic option.[27] Unfortunately, the majority of patients with MDS are not considered candidates for alloHSCT due to age, comorbidities, and lack of suitable donors.[27] Therefore, most patients with MDS are managed with noncurative treatment and supportive paradigms. Treatment goals generally depend on the risk stratification for the particular individual, age, functional status, comorbidities, and importantly, the patient's individual preference. For medical decision‐making purposes, MDS is traditionally divided into 2 major risk categories: low‐risk (LR) and high‐risk (HR) groups. LR‐MDS includes the IPSS risk categories of low or INT‐1, whereas HR‐MDS is usually defined by the IPSS risk categories of INT‐2 and high. Newer classification tools (eg, IPSS‐R) and better molecular markers are expected to impact such categories as well as treatment recommendations in the future.[26]
|
| Azacitidine (5‐azacytidine, Vidaza) and decitabine (5‐aza,2‐deoxycytidine, Dacogen) |
| Class |
| Hypomethylating agents, azanucleosides |
| Mechanism of action |
| Epigenetic modulation by inhibition of DNA methyltransferase enzymes and other mechanisms |
| Indication |
| First line therapy for HR‐MDS, second line therapy for LR‐MDS after failure of other therapies such as ESAs, lenalidomide, or immunosuppressive agents |
| Approved regimens for MDS |
| Azacitidine: 75 mg/m2/day IV or SC for 7 days Q 4 weeks |
| Decitabine: 15 mg/m2 IV infusion over 3 hours, Q 8 hours for 3 days, Q 6 weeks or 20 mg/m2 IV infusion over 1 hour daily for 5 days Q 4 weeks |
| Common side effects |
| Fatigue |
| Development of or worsening cytopenias (neutropenia, thrombocytopenia, and anemia) and their complications (eg, infections, bleeding) |
| Gastrointestinal disturbances (nausea, vomiting, or diarrhea) |
| Oral ulcers and rarely mucositis |
| Injection site reactions (redness, pain) |
| Lenalidomide (Revlimid) |
| Class |
| Immunomodulatory agent |
| Mechanism of action |
| Modulation of immune responses, gene expression, angiogenesis, cytokines and cell‐cycle regulatory phosphatases, and possibly other mechanisms |
| Indication |
| First line therapy for LR‐MDS with del5q (also used commonly off label for LR‐MDS without del5q as second line of therapy after ESAs) |
| Approved regimens for MDS |
| 10 mg orally once daily |
| Common side effects |
| Skin rash, dryness, and pruritus |
| Fatigue |
| Muscle cramps |
| Development of or worsening cytopenias (neutropenia, thrombocytopenia, and anemia) and their complications (eg, infections, bleeding) |
| Gastrointestinal disturbances (nausea, vomiting, or diarrhea) |
Despite recent advances, supportive care for all patients with MDS remains a very important aspect of management, either in combination with other therapies or as sole therapy for frail patients who cannot tolerate further interventions. Supportive therapy focuses on maintaining a high quality of life and includes careful blood count monitoring, use of growth factors, use of transfusions and antibiotics as needed, and use of iron chelation therapy in some patients. Some of the common situations in which hospitalists encounter patients with MDS are listed in Table 5.
|
| Complications of cytopenias |
| Bleeding: local management based on bleeding site, platelet transfusions, and other blood products (eg, red blood cells, fresh frozen plasma) as appropriate, antifibrinolytics |
| Infections and neutropenic fevers: Antibiotics, antifungals, use of colony granulocyte‐stimulating factors or granulocyte infusions advised only in cases of uncontrolled severe infections or sepsis |
| Severe or symptomatic anemia: red blood transfusions as appropriate based on patient's comorbidities, all disease‐modifying drugs (lenalidomide, azacitidine, decitabine) and ESAs are slow acting and can take weeks to months before improving anemia |
| Complications of therapies |
| Neutropenic fevers: as above plus holding therapy |
| Most other side effects (see Table 4) are well tolerated and are managed symptomatically without requiring hospitalization. If needed hospitalization for side effects: symptomatic management and holding the drug |
| Other medical or surgical condition in a patient with MDS |
| Therapy as per the underlying medical condition. For therapeutic decisions (eg, decision to undergo major surgery), prognostication tools such as the IPSS and newer models can be used to inform medical decision making in consultation with an experienced hematologist |
MANAGEMENT OF LR‐MDS
In addition to supportive care or enrollment in clinical trials, therapies for LR‐MDS include erythropoiesis‐stimulating agents, lenalidomide, and immunosuppressive therapy.
Erythropoiesis‐Stimulating Agents
Anemia in MDS is a multifactorial process that includes ineffective erythropoiesis and suboptimal serum erythropoietin responses.[10, 28, 29] There are no randomized studies to suggest that erythropoiesis‐stimulating agents (ESA) therapy prolongs survival in MDS patients. Nonetheless, ESAs improve anemia significantly in some patients and are widely used.[30, 31] Approximately 20% to 30% of unselected MDS patients and about 40% of LR‐MDS patients achieve clinically meaningful erythroid responses with ESA therapy with a median response duration of 2 years.[30, 31] It is important to correct coexisting nutritional deficiencies (eg, iron or folate deficiency) to optimize responses to ESA.[10] Granulocyte colony‐stimulating factor can be synergistic with ESAs especially in patients with RARS.[10] Patients with LR‐MDS who have low endogenous serum erythropoietin levels (200500 mU/mL) and lower red blood cell (RBC) transfusion requirements (2 U per month) are more likely to respond to ESA therapy.[32, 33] Compared to certain solid tumors, ESA therapy in MDS has not been associated with an increased risk of thromboembolic events.[34]
Lenalidomide
5q syndrome is a subtype of MDS characterized by refractory macrocytic anemia, normal or elevated platelet counts, low BM blast percentage, small hypolobated dysplastic megakaryocytes, an isolated interstitial deletion in 5q, and an indolent natural history.[17, 35] Lenalidomide, an oral derivative of thalidomide, induces high response rates in LR‐MDS patients with 5q deletions, including hematologic improvements, RBC transfusion independence (TI) (56%67%, median duration >104 weeks), cytogenetic responses (50%76%), and complete remissions.[35, 36] These findings resulted in approval of lenalidomide (Revlimid; Celgene Corp., Summit, NJ) for patients with IPSS low or INT‐1 MDS with transfusion‐dependent anemia and 5q deletions with or without additional cytogenetic abnormalities. In addition, lenalidomide has some activity against LR‐MDS without 5q deletions (TI, 26%, median duration 41 weeks) and some patients with HR‐MDS and 5q deletions (TI, 25.5%, median duration 26 weeks.[37, 38] Therefore, lenalidomide is a reasonable consideration in some patients with LR‐MDS without 5q deletions with primary or secondary resistance to ESA therapy.[10]
Immunosuppressive Therapy
Some patients with LR‐MDS respond to immunosuppressive therapy with antithymocyte globulin with or without cyclosporine. Characteristics that correlate with higher response rates: LR‐MDS, younger age (60 years), hypoplastic MDS, normal karyotype, human leukocyte antigen‐DR15 histocompatibility type, and presence of a paroxysmal nocturnal hemoglobinuria clone.[10, 39]
MANAGEMENT OF HR‐MDS
The goal of management for HR‐MDS is to modify the natural history of the disease and to prolong survival. In addition to a supportive care‐only approach or clinical trial referral, 3 standard therapeutic approaches are used for patients with HR‐MDS: alloHSCT, intensive chemotherapy, and DNMTi therapy. The use of intensive AML‐like chemotherapy for HR‐MDS is associated with high toxicity and very limited long‐term success. Despite recent innovations in the field of transplantation, only a minority of MDS patients undergo alloHSCT, as most patients with HR‐MDS are elderly and/or medically infirm. Even for the minority of patients who do undergo alloHSCT, relapse after alloHSCT remains a major challenge.
DNA Methyltransferase Inhibitor Therapy
5‐azacitidine (AZA), (Vidaza; Celgene Corp.) and decitabine (DAC) (Dacogen; Eisai, Inc.) are potent inhibitors of DNA methyltransferases, which are enzymes responsible for cytosine methylation.[38, 40] These so‐called differentiation agents appear to restore normal hematopoiesis for many MDS patients, and the approved regimens of DNMTi in MDS result in overall response rates in about 40% to 60% of patients. Unfortunately, complete remissions (CR) are rare (10%20%) and the duration of responses are also somewhat limited (median CR duration, 10 to 14 months).[41, 42, 43, 44] In randomized clinical trials, both AZA and DAC resulted in significant improvements in blood counts, reduction in transfusion needs, reduced infection rates, decreased risk of progression to AML, and improvements in patient‐reported quality‐of‐life measures.[41, 42, 43, 44] AZA, but not DAC, prolonged survival in HR‐MDS patients in a large randomized trial (median overall survival for the AZA group was 24.5 months compared to 15 months for a group of patients treated with 1 of 3 conventional care regimens).[41, 42, 43, 44] AZA and DAC have not been compared head to head in trials, but most experts recommend AZA for first‐line use in HR‐MDS based on its effect on survival.[10]
AZA and DAC have also been studied as treatments for patients with AML. These agents differ from traditional intensive chemotherapy, as both agents are commonly administered on an outpatient basis, and hematologic responses are generally expected after 4 to 6 cycles of treatment as compared to a single course of intensive cytarabine‐based induction chemotherapy used to treat AML.[45] Additionally, the impact on survival may not require the achievement of a CR based on the finding that MDS patients saw improved survival even in patients whose best responses were hematologic improvements.[46] However, therapy with DNMTi is not curative, and patients are maintained on treatment as long as they are responding and not experiencing major side effects. Still, all patients will eventually lose response to DNMTi.
CONCLUSIONS
MDS is a form of cancer that largely affects elderly patients and leads to a BM failure state and increased risk of leukemic transformation. MDS is underdiagnosed and is frequently overlooked in the differential diagnosis of anemia in the elderly. DNMTi, lenalidomide, and ESA therapy offer effective therapeutic options for many MDS patients, including some considered too old or frail for intensive medical interventions. The use of prognostic models help physicians and patients better understand the common course of patients with MDS and facilitate tailoring of risk‐adapted therapy. It is expected that our improved understanding of the genetic, epigenetic, and immunologic mechanisms that operate in MDS will help develop better classification tools and rationally design effective new therapies.
Acknowledgments
The authors thank Dr. Balazs Zsenits (Medical Director of the Rochester General Hospitalist Group, Rochester General Hospital, Rochester, NY) for his critical review of the article.
Disclosures: Dr. Steven Gore owned stock in Celgene until November 2011, received research support from Celgene and Novartis, and consulted for Celgene. Drs. B. Douglas Smith, Amer Zeidan, and Bishoy Faltas have no relevant disclosures.
- . Epidemiology of myelodysplastic syndromes. Am J Med. 2012;125:S2–S5.
- . Epidemiology, natural history, and practice patterns of patients with myelodysplastic syndromes in 2010. J Natl Compr Canc Netw. 2011;9:57–63.
- . Myelodysplastic syndromes: increasing disease awareness. Introduction. Am J Med. 2012;125:S1.
- , , , et al. Epidemiology of myelodysplastic syndromes and chronic myeloproliferative disorders in the United States, 2001–2004, using data from the NAACCR and SEER programs. Blood. 2008;112:45–52.
- , , , . Myelodysplastic syndromes: incidence and survival in the United States. Cancer. 2007;109:1536–1542.
- , , , , . Prevalence of anemia in persons 65 years and older in the United States: evidence for a high rate of unexplained anemia. Blood. 2004;104:2263–2268.
- . Myelodysplastic syndromes: increasing disease awareness. Discussion. Am J Med. 2012;125:S33–S34.
- . Why are myelodysplastic syndromes unrecognized and underdiagnosed? A primary care perspective. Am J Med. 2012;125:S15–S17.
- , . Clinical presentation, diagnosis, and prognosis of myelodysplastic syndromes. Am J Med. 2012;125:S6–S13.
- , , , et al. NCCN Clinical Practice Guidelines in Oncology: myelodysplastic syndromes. J Natl Compr Canc Netw. 2011;9:30–56.
- . Dysplasia has A differential diagnosis: distinguishing genuine myelodysplastic syndromes (MDS) from mimics, imitators, copycats and impostors. Curr Hematol Malig Rep. 2012;7:310–320.
- , . Interpreting new molecular genetics in myelodysplastic syndromes. Hematology Am Soc Hematol Educ Program. 2012;2012:56–64.
- , , , , . Updates in cytogenetics and molecular markers in MDS. Curr Hematol Malig Rep. 2011;6:126–135.
- , , , . Emerging roles of the spliceosomal machinery in myelodysplastic syndromes and other hematological disorders. Leukemia. 2012;26:2447–2454.
- , , , et al. Reduced natural killer (NK) function associated with high‐risk myelodysplastic syndrome (MDS) and reduced expression of activating NK receptors. Blood. 2007;109:4816–4824.
- , , , et al. Identification of RPS14 as a 5q− syndrome gene by RNA interference screen. Nature. 2008;451:335–339.
- , , . Unraveling the molecular pathophysiology of myelodysplastic syndromes. J Clin Oncol. 2011;29:504–515.
- , , , et al. Obesity, lifestyle factors, and risk of myelodysplastic syndromes in a large US cohort. Am J Epidemiol. 2009;169:1492–1499.
- , , , et al. Proposals for the classification of the myelodysplastic syndromes. Br J Haematol. 1982;51:189–199.
- , , , et al. World Health Organization classification of neoplastic diseases of the hematopoietic and lymphoid tissues: report of the Clinical Advisory Committee Meeting–Airlie House, Virginia, November 1997. J Clin Oncol. 1999;17:3835–3849.
- , , , et al. WHO classification of MDS. In: World Health Organization Classification of Tumours of Haematopoietic and Lymphoid Tissues. Lyon, France: IARC Press; 2008.
- , , , et al. International scoring system for evaluating prognosis in myelodysplastic syndromes. Blood. 1997;89:2079–2088.
- , , , et al. Time‐dependent prognostic scoring system for predicting survival and leukemic evolution in myelodysplastic syndromes. J Clin Oncol. 2007;25:3503–3510.
- , , , et al. Impact of the degree of anemia on the outcome of patients with myelodysplastic syndrome and its integration into the WHO classification‐based Prognostic Scoring System (WPSS). Haematologica. 2011;96:1433–1440.
- , , , et al. Revised international prognostic scoring system for myelodysplastic syndromes. Blood. 2012;120:2454–2465.
- , , , . Prognostication in myelodysplastic syndromes: beyond the International Prognostic Scoring System (IPSS). Am J Med. 2013;126:e25.
- , . Myelodysplastic syndromes: who and when in the course of disease to transplant. Hematology Am Soc Hematol Educ Program. 2012;2012:49–55.
- , , , , , . “Low‐risk” myelodysplastic syndrome is associated with excessive apoptosis and an increased ratio of pro‐ versus anti‐apoptotic bcl‐2‐related proteins. Br J Haematol. 1998;103:1075–1082.
- , . Ineffective haemopoiesis and apoptosis in myelodysplastic syndromes. Br J Haematol. 1998;101:220–230.
- . Hematopoietic growth factors in myelodysplastic syndromes. Semin Oncol. 2011;38:635–647.
- , , , et al. Patient and physician characteristics associated with erythropoiesis‐stimulating agent use in patients with myelodysplastic syndromes. Haematologica. 2012;97:128–132.
- , , , et al. Predictive factors of response and survival in myelodysplastic syndrome treated with erythropoietin and G‐CSF: the GFM experience. Blood. 2008;111:574–582.
- , , , et al. Erythroid response to treatment with G‐CSF plus erythropoietin for the anaemia of patients with myelodysplastic syndromes: proposal for a predictive model. Br J Haematol. 1997;99:344–351.
- , , , et al. Erythropoiesis‐stimulating agents are not associated with increased risk of thrombosis in patients with myelodysplastic syndromes. Haematologica. 2012;97:15–20.
- , , , et al. Lenalidomide in the myelodysplastic syndrome with chromosome 5q deletion. N Engl J Med. 2006;355:1456–1465.
- , , , et al. A randomized phase 3 study of lenalidomide versus placebo in RBC transfusion‐dependent patients with low‐/‐ntermediate‐1‐risk myelodysplastic syndromes with del5q. Blood. 2011;118:3765–3776.
- , , , et al. Phase 2 study of lenalidomide in transfusion‐dependent, low‐risk, and intermediate‐1 risk myelodysplastic syndromes with karyotypes other than deletion 5q. Blood. 2008;111:86–93.
- , , , et al. Efficacy and safety of lenalidomide in intermediate‐2 or high‐risk myelodysplastic syndromes with 5q deletion: results of a phase 2 study. Blood. 2009;113:3947–3952.
- , , , , . Factors affecting response and survival in patients with myelodysplasia treated with immunosuppressive therapy. J Clin Oncol. 2008;26:2505–2511.
- , . DNA methyltransferase and histone deacetylase inhibitors in the treatment of myelodysplastic syndromes. Semin Hematol. 2008;45:23–30.
- , , , et al. Efficacy of azacitidine compared with that of conventional care regimens in the treatment of higher‐risk myelodysplastic syndromes: a randomised, open‐label, phase III study. Lancet Oncol. 2009;10:223–232.
- , , , et al. Randomized controlled trial of azacitidine in patients with the myelodysplastic syndrome: a study of the cancer and leukemia group B. J Clin Oncol. 2002;20:2429–2440.
- , , , et al. Decitabine improves patient outcomes in myelodysplastic syndromes: results of a phase III randomized study. Cancer. 2006;106:1794–1803.
- , , , et al. Low‐dose decitabine versus best supportive care in elderly patients with intermediate‐ or high‐risk myelodysplastic syndrome (MDS) ineligible for intensive chemotherapy: final results of the randomized phase III study of the European Organisation for Research and Treatment of Cancer Leukemia Group and the German MDS Study Group. J Clin Oncol. 2011;29:1987–1996.
- , , , et al. Further analysis of trials with azacitidine in patients with myelodysplastic syndrome: studies 8421, 8921, and 9221 by the Cancer and Leukemia Group B. J Clin Oncol. 2006;24:3895–3903.
- , , , et al. Prognostic factors for response and overall survival in 282 patients with higher‐risk myelodysplastic syndromes treated with azacitidine. Blood. 2011;117:403–411.
The chargemaster speaketh
Who knew?
I was almost speechless when the federal government released data that show striking variation across America, and even within individual communities, in what hospitals charge patients. The 100 most frequently billed discharges of 2011 are represented in the data, and the associated DRGs represent close to 7 million discharges.
President Obama promised more transparency in and by government, and this headline from the Washington Post about CMS’s data-sharing move makes it crystal clear for all to see: "One hospital charges $8,000 – another, $38,000." Yes, for the same service. But that is just the tip of the iceberg. The article goes on to note that, according to hospitals’ once-secret "chargemaster" lists, the cost of joint replacements ranged from $5,304 in Ada, Okla., to a whopping $223,373 in Monterey, Calif. And, while a case of uncomplicated pneumonia may cost only $5,093 in Water Valley, Miss., you better hope you are not visiting Philadelphia when you get sick, or you can plan to tack on additional $119,000 to that bill. Surely, it is not the cost of the medications that accounts for this vast difference. National guidelines for treating pneumonia apply to all 50 states, so the care should be comparable. So what accounts for the extremes in hospital charges?
Okay, there’s the cost-of-living factor, and thus the hospitals’ overhead is undoubtedly drastically different in small-town U.S.A. vs. a popular metropolis, but it is shocking that this gap is so huge. While I have always known that there were differences in charges for medical services based on where you go, I never imagined such a stark contrast in the price tag for the same service in the same country – and sometimes even in the same city. As if the medical profession were not already struggling with its reputation eyes of the public. These data really paint of negative picture of the medical community.
So, what is the real significance of the discrepancy in these charges? For many with good insurance, nothing. Insurance companies decide what they are willing to pay for a given billing code and, typically, the rest is written off. Patients are not liable for the difference. Not quite true if you are uninsured.
Though the American Hospital Association states that centers often provide assistance to patients with meager finances, those who are most vulnerable and least able to pay for medical care may end up with the entire bill, frequently a bill that they will never be able to pay. That bill may eventually cause them to file for bankruptcy, which will adversely affect their lives and their children’s lives for many years to come – all because they became sick and assumed that the quality of care and the price for services rendered would be reasonable and comparable across all institutions.
While some may cringe at the revelation of the price discrepancy, I am glad this information came to light. Now consumers will be able to compare hospitals’ pricing as well as their quality measures and make better decisions about which hospital is best for them.
Dr. Hester is a hospitalist with Baltimore-Washington Medical Center, Glen Burnie, Md., who has a passion for empowering patients to partner in their health care. She is the creator of the Patient Whiz, a mobile app for iOS. This blog, "Teachable Moments," appears regularly in Hospitalist News.