User login
The ‘T’ in ITP remains

The “I” has changed its meaning, the “P” is not necessary to make the diagnosis, and the syndrome is not strikingly common in adults. But the disease formerly known as idiopathic thrombocytopenic purpura (ITP) remains important for internists to diagnose because thrombocytopenia is extremely common.
ITP has long been recognized in children (in whom it is often self-limited but severe) and in adults (in whom it is often more insidious and chronic, with a wider differential diagnosis).
The “I” used to stand for “idiopathic” but now it stands for “immune,” following a half decade of work by many investigators. The seminal experimental work of Dr. William J. Harrington and others while the former was a hematology fellow with Carl Moore at Washington University is the stuff of legend and ethical debate. Harrington had himself injected with a pint of serum from a patient with ITP and nearly died, demonstrating that the patient’s blood contained a substance or substances capable of inducing reversible profound thrombocytopenia in the recipient.1 Today, this classic experiment would probably not be performed, nor would the many more infusions that Harrington subsequently gave himself, other physicians, and support staff.2
Understanding the immunologic basis for ITP has led to treatments that are usually but not uniformly successful. Prednisone remains the main initial therapy, but its myriad side effects have led to the strategy of turning sooner to other therapies, such as intravenous immunoglobulin, splenectomy, rituximab (Rituxan), and, most recently, thrombopoietin agonists, in order to control the disease or even put it into remission.
Treatment decisions are often assigned to the hematologist or rheumatologist, but recognizing ITP and distinguishing it from other causes of thrombocytopenia remain the province of primary care providers, as discussed by Thota et al in this issue of the Journal.3 The diagnosis of ITP does not require the presence of purpura, which most adults ITP patients probably do not have, nor does it always require a bone marrow biopsy. It is important that ITP be distinguished from thrombocytopenia that is induced by drugs (particularly heparin) and myelodysplastic and other marrow processes (potential clues being other cytopenias, an unexplained elevated mean corpuscular volume, or constitutional symptoms). Undiagnosed thyroid disease and HIV infection should be tested for routinely, once drug-associated and other obvious causes are excluded.
- Harrington WJ, Minnich V, Hollingsworth JW, Moore CV. Demonstration of a thrombocytopenic factor in the blood of patients with thrombocytopenic purpura. J Lab Clin Med 1961; 38:1–10.
- Altman LK. Who Goes First? The Story Of Self-Experimentation. Berkeley, CA; University of California Press, 1987.
- Thota S, Kistangari G, Daw H, Spiro T. Immune thrombocytopenia in adults: an update. Cleve Clin J Med 2012; 79:641–650.
The “I” has changed its meaning, the “P” is not necessary to make the diagnosis, and the syndrome is not strikingly common in adults. But the disease formerly known as idiopathic thrombocytopenic purpura (ITP) remains important for internists to diagnose because thrombocytopenia is extremely common.
ITP has long been recognized in children (in whom it is often self-limited but severe) and in adults (in whom it is often more insidious and chronic, with a wider differential diagnosis).
The “I” used to stand for “idiopathic” but now it stands for “immune,” following a half decade of work by many investigators. The seminal experimental work of Dr. William J. Harrington and others while the former was a hematology fellow with Carl Moore at Washington University is the stuff of legend and ethical debate. Harrington had himself injected with a pint of serum from a patient with ITP and nearly died, demonstrating that the patient’s blood contained a substance or substances capable of inducing reversible profound thrombocytopenia in the recipient.1 Today, this classic experiment would probably not be performed, nor would the many more infusions that Harrington subsequently gave himself, other physicians, and support staff.2
Understanding the immunologic basis for ITP has led to treatments that are usually but not uniformly successful. Prednisone remains the main initial therapy, but its myriad side effects have led to the strategy of turning sooner to other therapies, such as intravenous immunoglobulin, splenectomy, rituximab (Rituxan), and, most recently, thrombopoietin agonists, in order to control the disease or even put it into remission.
Treatment decisions are often assigned to the hematologist or rheumatologist, but recognizing ITP and distinguishing it from other causes of thrombocytopenia remain the province of primary care providers, as discussed by Thota et al in this issue of the Journal.3 The diagnosis of ITP does not require the presence of purpura, which most adults ITP patients probably do not have, nor does it always require a bone marrow biopsy. It is important that ITP be distinguished from thrombocytopenia that is induced by drugs (particularly heparin) and myelodysplastic and other marrow processes (potential clues being other cytopenias, an unexplained elevated mean corpuscular volume, or constitutional symptoms). Undiagnosed thyroid disease and HIV infection should be tested for routinely, once drug-associated and other obvious causes are excluded.
- Harrington WJ, Minnich V, Hollingsworth JW, Moore CV. Demonstration of a thrombocytopenic factor in the blood of patients with thrombocytopenic purpura. J Lab Clin Med 1961; 38:1–10.
- Altman LK. Who Goes First? The Story Of Self-Experimentation. Berkeley, CA; University of California Press, 1987.
- Thota S, Kistangari G, Daw H, Spiro T. Immune thrombocytopenia in adults: an update. Cleve Clin J Med 2012; 79:641–650.
Immune thrombocytopenia in adults: An update
Immune thrombocytopenia (ITP), formerly known as idiopathic thrombocytopenic purpura, is an autoimmune disorder characterized by a low platelet count and increased risk of mucocutaneous bleeding. During the last decade its management has changed, with the advent of new medications and with increased awareness of treatment side effects. This article will focus on the pathophysiology, diagnosis, and management of ITP in adults.
A SLIGHT FEMALE PREDOMINANCE UNTIL AGE 65
The estimated age-adjusted prevalence of ITP in the United States is 9.5 to 23.6 cases per 100,000.1 In a recent study in the United Kingdom, the incidence was 4.4 per 100,000 patient-years among women and 3.4 among men.2 A slight female predominance was seen until age 65; thereafter, the incidence rates in men and women were about equal.
INCREASED PLATELET DESTRUCTION AND DECREASED PRODUCTION
ITP is a complex immune process in which cellular and humoral immunity are involved in the destruction of platelets3 as well as impaired platelet production. Several theories have emerged in the last decade to explain this autoimmune process.
Autoantibodies form against platelets
The triggering event for antibody initiation in ITP is unknown.3 Autoantibodies (mostly immunoglobulin G [IgG] but sometimes IgM and IgA) are produced against the platelet membrane glycoprotein GPIIb-IIIa. The antibody-coated platelets are rapidly cleared by the reticuloendothelial system in the spleen and liver, in a process mediated by Fc-receptor expression on macrophages and dendritic cells. Autoantibodies may also affect platelet production by inhibiting megakaryocyte maturation and inducing apoptosis.4,5
Patients with ITP also have CD4+ T cells that are autoreactive to GPIIb-IIIa and that stimulate B-cell clones to produce antiplatelet antibodies. Although autoreactive T cells are present in healthy individuals, they appear to be activated in patients with ITP by exposure to fragments of GPIIb-IIIa rather than native GPIIb-IIIa proteins.6 Activated macrophages internalize antibody-coated platelets and degrade GPIIb-IIIa and other glycoproteins to form “cryptic” epitopes that are expressed on the macrophage surface as novel peptides that induce further proliferation of CD4+ T-cell clones. Epitope spread thereby sustains a continuous loop that amplifies the production of GPIIb-IIIa antibodies.7
Defective T-regulatory cells appear to be critical to the pathogenesis of ITP by breaking self-tolerance, allowing the autoimmune process to progress.8 This, together with several other immune mechanisms such as molecular mimicry, abnormal cytokine profile, and B-cell abnormalities, may lead to enhanced platelet clearance.9
In addition to destroying platelets, antibodies may impair platelet production.10 Good evidence for platelets being underproduced in patients with ITP is that treating with thrombopoietin agonists results in increased platelet counts.
A DIAGNOSIS OF EXCLUSION
ITP is defined as isolated thrombocytopenia with no clinically apparent associated conditions or other causes of thrombocytopenia.11 No diagnostic criteria currently exist, and the diagnosis is established only after excluding other causes of thrombocytopenia.
A recent report12 from an international working group established a platelet count threshold of less than 100 × 109/L for diagnosing ITP, down from the previous threshold of 150 × 109/L. The panel also recommended using the term “immune” rather than “idiopathic” thrombocytopenia, emphasizing the role of underlying immune mechanisms. The term “purpura” was removed, because many patients have no or minimal signs of bleeding at the time of diagnosis.12
The 2011 American Society of Hematology’s evidenced-based guidelines for the treatment of ITP present the most recent authoritative diagnostic and therapeutic recommendations.13
ITP is considered to be primary if it occurs in isolation, and secondary if it is associated with an underlying disorder. It is further classified according to its duration since diagnosis: newly diagnosed (< 3 months), persistent (3−12 months), and chronic (> 12 months).
In adults, ITP tends to be chronic, presenting with a more indolent course than in childhood, and unlike childhood ITP, infrequently following a viral infection.
Clinical features associated with ITP are related to thrombocytopenia: petechiae (pinpoint microvascular hemorrhages that do not blanch with pressure), purpura (appearing like large bruises), epistaxis (nosebleeds), menorrhagia, gum bleeding, and other types of mucocutaneous bleeding. Other common clinical features include fatigue, impaired quality of life, and treatment-related side effects (eg, infection).14
A low platelet count may be the sole initial manifestation. The patient’s history, physical examination, blood counts, and findings on blood smear are essential to rule out other diagnoses. Few diagnostic tests are useful in the initial evaluation (Table 1). Abnormalities in the blood count or blood smear may be further investigated with bone marrow biopsy but is not required if the patient has typical features of ITP, regardless of age.
Because there are no specific criteria for diagnosing ITP, other causes of thrombocytopenia must be excluded. The differential diagnosis can be further classified as ITP due to other underlying disease (ie, secondary ITP) vs nonautoimmune causes that are frequently encountered in clinical practice.
SECONDARY ITP
The differential diagnosis of thrombocytopenia due to known underlying immune disease includes the following:
Drug-induced ITP
Recurrent episodes of acute thrombocytopenia not explained by other causes should trigger consideration of drug-induced thrombocytopenia. 11 Patients should be questioned about drug use, especially of sulfonamides, antiepileptics, and quinine. Thrombocytopenia usually occurs 5 to 7 days after beginning the inciting drug for the first time and more quickly when the drug is given intermittently. Heparin is the most common cause of drug-related thrombocytopenia among hospitalized patients; the mechanism is unique and involves formation of a heparin-PF4 immune complex.
Human immunodeficiency virus infection
Approximately 40% of patients with human immunodeficiency virus (HIV) infection develop thrombocytopenia at some time.15 HIV infection can initially manifest as isolated thrombocytopenia and is sometimes clinically indistinguishable from chronic ITP, making it an important consideration in a newly diagnosed case of thrombocytopenia.
The mechanism of thrombocytopenia in early HIV is similar to that in primary ITP: as the disease progresses, low platelet counts can result from ineffective hematopoiesis due to megakaryocyte infection and marrow infiltration.16
Hepatitis C virus infection
Hepatitis C virus (HCV) infection can also cause immune thrombocytopenia. A recent study demonstrated the potential of the HCV core envelope protein 1 to induce antiplatelet antibodies (to platelet surface integrin GPIIIa49-66) by molecular mimicry.17 Other causes of thrombocytopenia in HCV infection may be related to chronic liver disease, such as portal hypertension-related hypersplenism, as well as decreased thrombopoietin production.18 Antiviral treatment with pegylated interferon may also cause mild thrombocytopenia.19
Helicobacter pylori
The association between H pylori infection and ITP remains uncertain. Eradication of infection appears to completely correct ITP in some places where the prevalence of H pylori is high (eg, Italy and Japan) but not in the United States and Canada, where the prevalence is low.20 The different response may be due not only to the differences in prevalence, but to different H pylori genotypes: most H pylori strains in Japan express CagA, whereas the frequency of CagA-positive strains is much lower in western countries.20
In areas where eradication therapy may be useful, the presence of H pylori infection should be determined by either a urea breath test or stool antigen testing.
Lymphoproliferative disorders
Secondary forms of ITP can occur in association with chronic lymphocytic leukemia, non-Hodgkin lymphoma, and Hodgkin lymphoma. These diagnoses should especially be considered in patients presenting with thrombocytopenia accompanied by systemic illness. ITP occurs in at least 2% of patients with chronic lymphocytic leukemia and is usually difficult to distinguish from thrombocytopenia secondary to marrow infiltration or from fludarabine (Fludora) therapy.21
It is especially important to determine if a lymphoproliferative disorder is present because it changes the treatment of ITP. Treatment of ITP complicating chronic lymphocytic leukemia is challenging and includes corticosteroids and steroid-sparing agents such as cyclosporine (Gengraf, Neoral, Sandimmune), rituximab (Rituxan), and intravenous immunoglobulin.22
Systemic lupus erythematosus and other autoimmune diseases
Thrombocytopenia is a frequent clinical manifestation of systemic lupus erythematosus, occurring in 7% to 30% of patients,23 and is an independent risk factor for death.24 Lupus should be suspected in patients with ITP who have multiorgan involvement and other clinical and laboratory abnormalities. A small percentage of patients with ITP (about 2%−5%) develop lupus after several years.21
Thrombocytopenia can also result from other autoimmune disorders such as antiphospholipid antibody syndrome25 and autoimmune thyroid diseases as well as immunodeficient states such as IgA deficiency and common variable immunodeficiency with low IgG levels.
NONAUTOIMMUNE THROMBOCYTOPENIA
Thrombocytopenia can also be caused by a number of nonautoimmune conditions.
Pseudothrombocytopenia
Pseudothrombocytopenia can occur if ex-vivo agglutination of platelets is induced by antiplatelet antibodies to EDTA, a standard blood anticoagulant. Automated counters cannot differentiate the agglutinated platelet clumps from individual cells such as red cells. This can frequently be overcome by running the counts in a citrate or ACD reagent tube. A peripheral blood smear can demonstrate whether platelet clumps are present.
Thrombotic thrombocytopenic purpura
Thrombotic thrombocytopenic purpura presents with thrombocytopenia, purpura, and anemia. Associated clinical abnormalities (fever, neurologic symptoms, and renal failure) and the presence of fragmented red cells on blood smear help to distinguish it from ITP. Plasma exchange is the treatment of choice.
Gestational thrombocytopenia
Five percent of pregnant women develop mild thrombocytopenia (platelet counts typically > 70 × 109/L) near the end of gestation.26 It requires no treatment and resolves after delivery. The fetus’ platelet count remains unaffected.
Gestational thrombocytopenia should be differentiated from the severe thrombocytopenia of preeclampsia and HELLP syndrome (hemolysis, elevated liver enzymes, and low platelet count), which requires immediate attention.
Myelodysplastic syndrome
Myelodysplastic syndrome is common among elderly patients and should be considered in cases of unexplained cytopenia and abnormalities in the peripheral blood smear suggestive of dysplastic cytologic features. It can be diagnosed by bone marrow biopsy. Thrombocytopenia occurs in about 40% to 65% of cases of myelodysplastic syndrome.27
MANAGE ITP TO KEEP PLATELET COUNT ABOVE 30 × 109/L
ITP does not necessarily require treatment, and the initial challenge is to determine whether treatment or observation is indicated. Treatment is based on two major factors: the platelet count and degree of bleeding. The goals of management are to achieve a safe platelet count to prevent serious bleeding while minimizing treatment-related toxicity.7
Adults with platelet counts of less than 30 × 109/L are usually treated. In multiple large cohort studies, patients with platelet counts above that level have been safely observed without treatment.11,28
Table 2 outlines a comprehensive approach to therapy.
INITIAL TREATMENT: STEROIDS AND IMMUNOGLOBULINS
Oral corticosteroids are the initial agents of choice
Oral prednisone 1 mg/kg/day in tapering doses for 4 to 6 weeks is the most common initial regimen. Other regimens, such as high-dose dexamethasone (Decadron) (40 mg daily for 4 days per month) for several cycles, have been reported to be more effective29 but have not been studied in head-to-head trials with oral prednisone.
Due to their effectiveness, low cost, and convenience of use, corticosteroids have been the backbone of initial treatment in ITP. However, in most patients the platelet count decreases once the dose is tapered or stopped; remission is sustained in only 10% to 30% of cases.30 Continuation of corticosteroids is limited by long-term complications such as opportunistic infections, osteoporosis, and emotional lability.31
Intravenous immunoglobulin and anti-D immunoglobulin are alternatives
Intravenous immunoglobulin is recommended for patients who have not responded to corticosteroids and is often used in pregnancy. It is thought to act by blocking Fc receptors in the reticuloendothelial system. Intravenous immunoglobulin rapidly increases platelet counts in 65% to 80% of patients,32 but the effect is transient and the drug requires frequent administration. It is usually well tolerated, although about 5% of patients experience headache, chills, myalgias, arthralgias, and back pain. Rare, serious complications include thrombotic events, anaphylaxis (in IgA-deficient patients), and renal failure.
Anti-D immunoglobulin, a pooled IgG product, is derived from the plasma of Rh(D)-negative donors and can be given only to patients who are Rh(D)-positive. Response rates as high as 70% have been reported, with platelet effects lasting for more than 21 days.33 Studies have shown better results at a high dose (75 μg/kg) than with the approved dose of 50 μg/kg.34
Anti-D immunoglobulin can also be given intermittently whenever the platelet count falls below a specific level (ie, 30 × 109/L). This allows some patients to avoid splenectomy and may even trigger long-term remission.32
Common side effects of anti-D immunoglobulin include fever and chills; these can be prevented by premedication with acetaminophen or corticosteroids. Rare but fatal cases of intravascular hemolysis, renal failure, and disseminated intravascular coagulation have been reported, precluding its use for ITP in some countries, including those of the European Union.
Emergency treatment: Combination therapy
Evidence-based guidelines are limited for treating patients with active bleeding or who are at high risk of bleeding. For uncontrolled bleeding, a combination of first-line therapies is recommended, using prednisone and intravenous immunoglobulin.35 Other options include high-dose methylprednisolone and platelet transfusions, alone or in combination with intravenous immunoglobulin.36
SECOND-LINE TREATMENTS
Splenectomy produces complete remission in most patients
Patients who relapse and have a platelet count of less than 20 × 109/L are traditionally considered for splenectomy. More than two-thirds of patients respond with no need for further treatment.37
Although splenectomy has the highest rate of durable platelet response, the risks associated with surgery are an important concern. Even with a laparoscopic splenectomy, complications occur in 10% of patients and death in 0.2%. Long-term risks include the rare occurrence of sepsis with an estimated mortality rate of 0.73 per 1,000 patient-years, and possible increased risk of thrombosis.38,39
Adherence to recommended vaccination protocols and early administration of antibiotics for systemic febrile illness reduce the risk of sepsis.40 Patients are advised to receive immunization against encapsulated bacteria with pneumococcal, Haemophilus influenzae type b, and meningococcal vaccines. These vaccines should be given at least 2 weeks before elective splenectomy.41
Treatment of patients refractory to splenectomy is challenging and requires further immunosuppressive therapy, which is associated with an increased risk of infections and infection-related deaths.42
Rituximab in addition to or possibly instead of splenectomy
Rituximab (Rituxan) is a chimeric anti-CD20 monoclonal antibody that targets B cells. Although initially approved for treatment of lymphomas, rituximab has gained popularity in treating ITP due to its safety profile and ability to deplete CD20+ B cells responsible for antiplatelet antibody production by Fc-mediated cell lysis.
In the largest systematic review of published reports of rituximab use in ITP (19 studies, 313 patients), Arnold and colleagues43 reported an overall platelet response (defined as platelet count > 50 × 109/L) in 62.5% (95% confidence interval [CI] 52.6%−72.5%) of patients. The median duration of response was 10.5 months (range 3–20), and median follow-up was 9.5 months (range 2–25). Nearly all patients had received corticosteroid treatment and half of them had undergone splenectomy.
Rituximab has also been investigated as an alternative to splenectomy. In a prospective, single-arm, phase 2 trial, 60 patients with chronic ITP (platelet counts < 30 × 109/L) for whom one or more previous treatments had failed received rituximab infusions and were followed for up to 2 years. A good response (defined as a platelet count ≥ 50 × 109/L, with at least a doubling from baseline) was obtained in 24 (40%) of 60 patients (95% CI 28%–52%) at 1 year and 33.3% at 2 years. The authors concluded that rituximab could be used as a presplenectomy therapeutic option, particularly in patients with chronic ITP who are at increased surgical risk or who are reluctant to undergo surgery.44 Based on these results, rituximab may spare some patients from splenectomy, or at least delay it. However, it has never been tested in randomized controlled trials to establish its role as a splenectomy-sparing agent in ITP.
Side effects include infusion reactions, which are usually mild but in rare cases can be severe. Recently, progressive multifocal leukoencephalopathy has been recognized as a complication of rituximab treatment in patients with lymphoproliferative and autoimmune disorders.45 Although this complication is rare in patients with ITP, careful monitoring is required until additional long-term safety data are available.
Thrombopoietic receptor agonists require continuous treatment
In the early 1990s, recombinant thrombopoietin was tested in clinical studies. These were halted when antibodies developed to recombinant thrombopoietin that cross-reacted with endogenous thrombopoietin, resulting in severe thrombocytopenia.46
This led to the development of nonimmunogenic thrombopoietin receptor agonists that mimic the effect of thrombopoietin and stimulate the production of platelets. In 2008, the US Food and Drug Administration approved two drugs of this class for treating ITP: romiplostim (Nplate) and eltrombopag (Promacta). They are mainly used to treat patients with chronic ITP who have had an insufficient response to corticosteroids, immunoglobulins, or splenectomy.
Although well tolerated and effective in increasing platelet counts, these agents share common drawbacks. They do not modify the course of the disease, they are used only to sustain the platelet count, they require repeated administration, and they must be given for about 7 days to achieve an adequate platelet response, so they cannot be used in emergencies. Long-term adverse effects include bone marrow fibrosis and thrombosis.
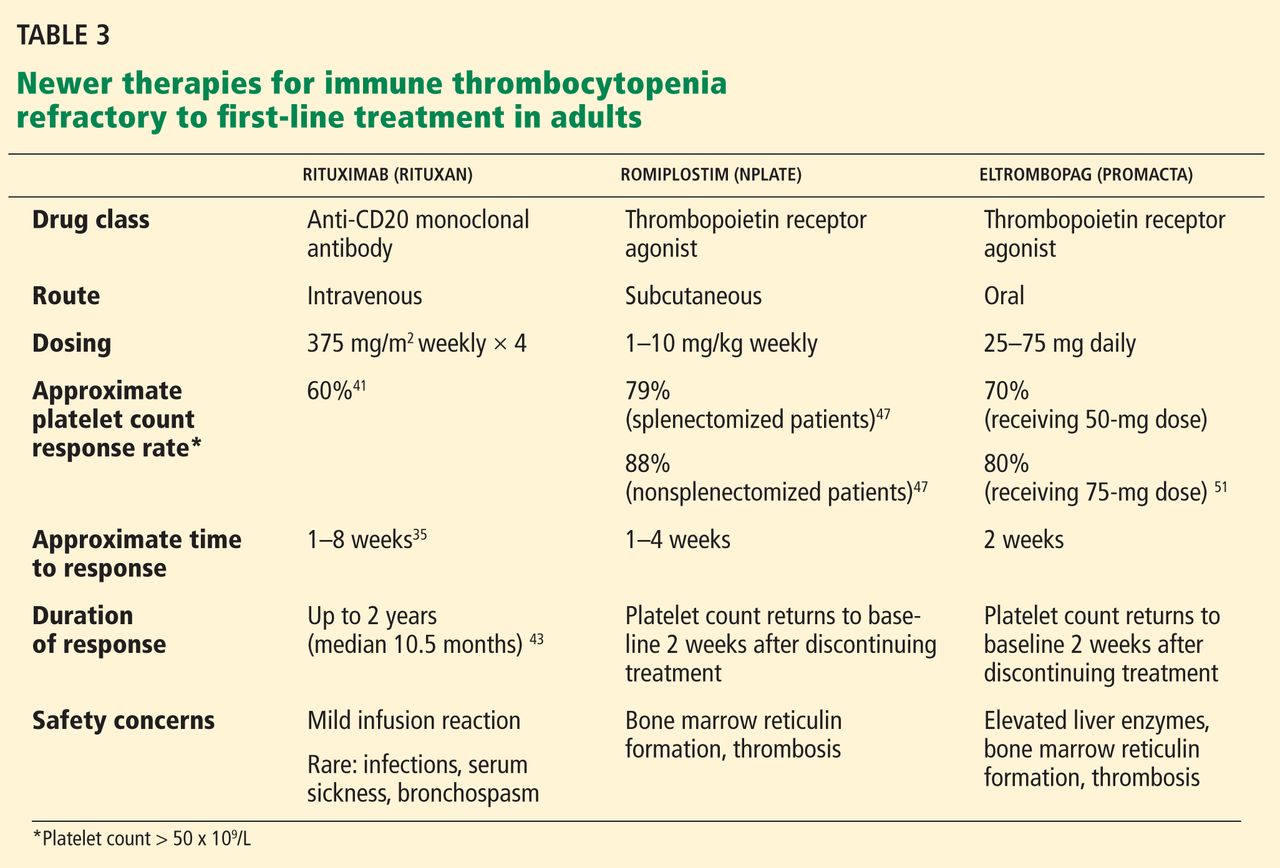
Romiplostim is a synthetic peptide capable of binding to the thrombopoietin receptor c-Mpl. It has no sequence homology with endogenous thrombopoietin,47 so does not induce cross-reacting antibodies. It has a half-life of 120 to 160 hours and is usually given subcutaneously 1 to 10 μg/kg weekly.
Phase III clinical trials have shown the effectiveness of romiplostim in attaining a durable platelet response (platelet count > 50 × 109/L) in splenectomized and nonsplenectomized populations. It is well tolerated, and only two uncommon serious adverse effects have been reported: bone marrow reticulin formation and thromboembolism.48
A long-term open-label extension study of 142 patients treated with romiplostim for up to 156 weeks showed that 124 (87%) achieved a platelet count of more than 50 × 109/L at some point, and 84% of patients were able to reduce or discontinue concurrent medications for ITP.49
Kuter et al,50 in a randomized controlled trial, confirmed the efficacy of romiplostim in attaining durable increased platelet counts. Patients treated with romiplostim at a mean weekly dose of 3.9 μg/kg ± 2.1 μg/kg demonstrated a higher rate of platelet response, lower incidence of treatment failure, and improved quality of life vs patients treated with standard care.
Eltrombopag is a nonpeptide thrombopoietin agonist that binds to the transmembrane domain of the thrombopoietin receptor and stimulates the proliferation and differentiation of megakaryocytes in bone marrow. It is given orally in doses of 25 to 75 mg daily.
Eltrombopag has been shown to be effective in increasing platelet counts in chronic ITP.51 In a phase III trial conducted by Cheng and colleagues, 197 patients were randomized to eltrombopag or placebo.52 Patients treated with eltrombopag were eight times more likely to achieve platelet counts of more than 50 × 109/L during the 6-month treatment period (odds ratio 8.2, 95% CI 4.32–15.38, P < .001) vs placebo. Patients treated with eltrombopag had fewer bleeding episodes and were more likely to reduce or discontinue the dose of concurrent ITP medications. The only significant side effect seen was a rise in aminotransferases (seen in 7% of eltrombopag recipients vs 2% with placebo).52
Additional thrombopoietin agonists under investigation include ARK-501, totrombopag, and LGD-4665. MDX-33, a monoclonal antibody against the Fc-receptor, is also being studied; it acts by preventing opsonization of autoantibody-coated platelets.53
THIRD-LINE TREATMENTS FOR REFRACTORY CASES
Patients with ITP that is resistant to standard therapies have an increased risk of death, disease, and treatment-related complications.28,42
Combination chemotherapy
Immunosuppressants such as azathioprine (Imuran), cyclosporine (Neoral, Sandimmune), cyclophosphamide (Cytoxan), and mycophenolate (CellCept) were used in the past in single-agent regimens with some efficacy, but their use was limited due to drug-related toxicity and a low safety profile.3 However, there is increasing evidence for a role of combination chemotherapy to treat chronic refractory ITP to achieve greater efficacy and fewer adverse effects.54
Arnold and colleagues55 reported that combined azathioprine, mycophenolate, and cyclosporine achieved an overall response (platelet count > 30 × 109/L and doubling of the baseline) in 14 (73.7%) of 19 patients with chronic refractory ITP, lasting a median of 24 months.
Hematopoietic stem cell transplantation
Hematopoietic stem cell transplantation has provided remission in a limited number of patients. However, it is associated with fatal toxicities such as graft-vs-host disease and septicemia, and therefore it is reserved for severe refractory ITP with bleeding complications unresponsive to other therapies.56,57
THERAPY FOR SECONDARY ITP DEPENDS ON THE CAUSE
Treatments for secondary ITP vary depending on the cause of thrombocytopenia and are often more complex than therapy for primary disease. Optimal management involves treating the underlying condition (eg, chronic lymphocytic leukemia or systemic lupus erythematosus).
Drug-induced thrombocytopenia requires prompt recognition and withdrawal of the inciting agent.
Treating ITP due to HCV infection primarily involves antiviral agents to suppress viral replication. If treating ITP is required, then intravenous immunoglobulin is preferable to glucocorticoids because of the risk of increasing viral load with the latter.58 Eltrombopag may effectively increase platelet counts, allowing patients to receive interferon therapy for HCV.59 However, a recent study was halted due to increased incidence of portal vein thrombosis, raising concerns about the safety of eltrombopag for patients with chronic liver disease.60
Secondary ITP due to HIV infection should always be treated first with antivirals targeting HIV unless thrombocytopenia-related bleeding complications warrant treatment. If treatment for ITP is necessary, it should include corticosteroids, intravenous immunoglobulin, or anti-D immunoglobulin as first-line therapy.
Eradication therapy for H pylori is recommended for patients who are positive for the organism based on urea breath testing, stool antigen testing, or endoscopic biopsies.
- Feudjo-Tepie MA, Robinson NJ, Bennett D. Prevalence of diagnosed chronic immune thrombocytopenic purpura in the US: analysis of a large US claim database: a rebuttal. J Thromb Haemost 2008; 6:711–712.
- Abrahamson PE, Hall SA, Feudjo-Tepie M, Mitrani-Gold FS, Logie J. The incidence of idiopathic thrombocytopenic purpura among adults: a population-based study and literature review. Eur J Haematol 2009; 83:83–89.
- Gernsheimer T. Chronic idiopathic thrombocytopenic purpura: mechanisms of pathogenesis. Oncologist 2009; 14:12–21.
- McMillan R, Wang L, Tomer A, Nichol J, Pistillo J. Suppression of in vitro megakaryocyte production by antiplatelet auto-antibodies from adult patients with chronic ITP. Blood 2004; 103:1364–1369.
- Houwerzijl EJ, Blom NR, van der Want JJ, et al. Ultrastructural study shows morphologic features of apoptosis and para-apoptosis in megakaryocytes from patients with idiopathic thrombocytopenic purpura. Blood 2004; 103:500–506.
- Kuwana M, Kaburaki J, Kitasato H, et al. Immunodominant epitopes on glycoprotein IIb-IIIa recognized by autoreactive T cells in patients with immune thrombocytopenic purpura. Blood 2001; 98:130–139.
- Cines DB, Blanchette VS. Immune thrombocytopenic purpura. N Engl J Med 2002; 346:995–1008.
- Littman DR, Rudensky AY. Th17 and regulatory T cells in mediating and restraining inflammation. Cell 2010; 140:845–858.
- Semple JW, Provan D, Garvey MB, Freedman J. Recent progress in understanding the pathogenesis of immune thrombocytopenia. Curr Opin Hematol 2010; 17:590–595.
- Ballem PJ, Segal GM, Stratton JR, Gernsheimer T, Adamson JW, Slichter SJ. Mechanisms of thrombocytopenia in chronic autoimmune thrombocytopenic purpura. Evidence of both impaired platelet production and increased platelet clearance. J Clin Invest 1987; 80:33–40.
- George JN. Definition, diagnosis and treatment of immune thrombocytopenic purpura. Haematologica 2009; 94:759–762.
- Rodeghiero F, Stasi R, Gernsheimer T, et al. Standardization of terminology, definitions and outcome criteria in immune thrombocytopenic purpura of adults and children: report from an international working group. Blood 2009; 113:2386–2393.
- Neunert C, Lim W, Crowther M, Cohen A, Solberg L, Crowther MA; American Society of Hematology. The American Society of Hematology 2011 evidence-based practice guideline for immune thrombocytopenia. Blood 2011; 117:4190–4207.
- Newton JL, Reese JA, Watson SI, et al. Fatigue in adult patients with primary immune thrombocytopenia. Eur J Haematol 2011; 86:420–429.
- Stasi R, Willis F, Shannon MS, Gordon-Smith EC. Infectious causes of chronic immune thrombocytopenia. Hematol Oncol Clin North Am 2009; 23:1275–1297.
- Moses A, Nelson J, Bagby GC. The influence of human immunodeficiency virus-1 on hematopoiesis. Blood 1998; 91:1479–1495.
- Zhang W, Nardi MA, Borkowsky W, Li Z, Karpatkin S. Role of molecular mimicry of hepatitis C virus protein with platelet GPIIIa in hepatitis C-related immunologic thrombocytopenia. Blood 2009; 113:4086–4093.
- Peck-Radosavljevic M. Thrombocytopenia in liver disease. Can J Gastroenterol 2000; 14(suppl D):60D–66D.
- Roomer R, Hansen BE, Janssen HL, de Knegt RJ. Thrombocytopenia and the risk of bleeding during treatment with peginterferon alfa and ribavirin for chronic hepatitis C. J Hepatol 2010; 53:455–459.
- Stasi R, Sarpatwari A, Segal JB, et al. Effects of eradication of Helicobacter pylori infection in patients with immune thrombocytopenic purpura: a systematic review. Blood 2009; 113:1231–1240.
- Cines DB, Bussel JB, Liebman HA, Luning Prak ET. The ITP syndrome: pathogenic and clinical diversity. Blood 2009; 113:6511–6521.
- Zent CS, Kay NE. Autoimmune complications in chronic lymphocytic leukaemia (CLL). Best Pract Res Clin Haematol 2010; 23:47–59.
- Hepburn AL, Narat S, Mason JC. The management of peripheral blood cytopenias in systemic lupus erythematosus. Rheumatology (Oxford) 2010; 49:2243–2254.
- Mok CC, Lee KW, Ho CT, Lau CS, Wong RW. A prospective study of survival and prognostic indicators of systemic lupus erythematosus in a southern Chinese population. Rheumatology (Oxford) 2000; 39:399–406.
- Cervera R, Piette JC, Font J, et al; Euro-Phospholipid Project Group. Antiphospholipid syndrome: clinical and immunologic manifestations and patterns of disease expression in a cohort of 1,000 patients. Arthritis Rheum 2002; 46:1019–1027.
- Burrows RF, Kelton JG. Fetal thrombocytopenia and its relation to maternal thrombocytopenia. N Engl J Med 1993; 329:1463–1466.
- Kantarjian H, Giles F, List A, et al. The incidence and impact of thrombocytopenia in myelodysplastic syndromes. Cancer 2007; 109:1705–1714.
- Portielje JE, Westendorp RG, Kluin-Nelemans HC, Brand A. Morbidity and mortality in adults with idiopathic thrombocytopenic purpura. Blood 2001; 97:2549–2554.
- Cheng Y, Wong RS, Soo YO, et al. Initial treatment of immune thrombocytopenic purpura with high-dose dexamethasone. N Engl J Med 2003; 349:831–836.
- Bromberg ME. Immune thrombocytopenic purpura—the changing therapeutic landscape. N Engl J Med 2006; 355:1643–1645.
- Guidry JA, George JN, Vesely SK, Kennison SM, Terrell DR. Corticosteroid side-effects and risk for bleeding in immune thrombocytopenic purpura: patient and hematologist perspectives. Eur J Haematol 2009; 83:175–182.
- Cooper N. Intravenous immunoglobulin and anti-RhD therapy in the management of immune thrombocytopenia. Hematol Oncol Clin North Am 2009; 23:1317–1327.
- Scaradavou A, Woo B, Woloski BM, et al. Intravenous anti-D treatment of immune thrombocytopenic purpura: experience in 272 patients. Blood 1997; 89:2689–2700.
- Newman GC, Novoa MV, Fodero EM, Lesser ML, Woloski BM, Bussel JB. A dose of 75 microg/kg/d of i.v. anti-D increases the platelet count more rapidly and for a longer period of time than 50 microg/kg/d in adults with immune thrombocytopenic purpura. Br J Haematol 2001; 112:1076–1078.
- Provan D, Stasi R, Newland AC, et al. International consensus report on the investigation and management of primary immune thrombocytopenia. Blood 2010; 115:168–186.
- Spahr JE, Rodgers GM. Treatment of immune-mediated thrombocytopenia purpura with concurrent intravenous immunoglobulin and platelet transfusion: a retrospective review of 40 patients. Am J Hematol 2008; 83:122–125.
- Kojouri K, Vesely SK, Terrell DR, George JN. Splenectomy for adult patients with idiopathic thrombocytopenic purpura: a systematic review to assess long-term platelet count responses, prediction of response, and surgical complications. Blood 2004; 104:2623–2634.
- Schilling RF. Estimating the risk for sepsis after splenectomy in hereditary spherocytosis. Ann Intern Med 1995; 122:187–188.
- Crary SE, Buchanan GR. Vascular complications after splenectomy for hematologic disorders. Blood 2009; 114:2861–2868.
- Davies JM, Barnes R, Milligan D; British Committee for Standards in Haematology. Update of guidelines for the prevention and treatment of infection in patients with an absent or dysfunctional spleen. Clin Med 2002; 2:440–443.
- Centers for Disease Control and Prevention (CDC). Recommended adult immunization schedule—United States, 2011. MMWR Morb Mortal Wkly Rep 2011; 60:1–4.
- McMillan R, Durette C. Long-term outcomes in adults with chronic ITP after splenectomy failure. Blood 2004; 104:956–960.
- Arnold DM, Dentali F, Crowther MA, et al. Systematic review: efficacy and safety of rituximab for adults with idiopathic thrombocytopenic purpura. Ann Intern Med 2007; 146:25–33.
- Godeau B, Porcher R, Fain O, et al. Rituximab efficacy and safety in adult splenectomy candidates with chronic immune thrombocytopenic purpura: results of a prospective multicenter phase 2 study. Blood 2008; 112:999–1004.
- Carson KR, Evens AM, Richey EA, et al. Progressive multifocal leukoencephalopathy after rituximab therapy in HIV-negative patients: a report of 57 cases from the Research on Adverse Drug Events and Reports project. Blood 2009; 113:4834–4840.
- Li J, Yang C, Xia Y, et al. Thrombocytopenia caused by the development of antibodies to thrombopoietin. Blood 2001; 98:3241–3248.
- Kuter DJ. New thrombopoietic growth factors. Blood 2007; 109:4607–4616.
- Kuter DJ, Bussel JB, Lyons RM, et al. Efficacy of romiplostim in patients with chronic immune thrombocytopenic purpura: a double-blind randomised controlled trial. Lancet 2008; 371:395–403.
- Bussel JB, Kuter DJ, Pullarkat V, Lyons RM, Guo M, Nichol JL. Safety and efficacy of long-term treatment with romiplostim in thrombocytopenic patients with chronic ITP. Blood 2009; 113:2161–2171.
- Kuter DJ, Rummel M, Boccia R, et al. Romiplostim or standard of care in patients with immune thrombocytopenia. N Engl J Med 2010; 363:1889–1899.
- Bussel JB, Provan D, Shamsi T, et al. Effect of eltrombopag on platelet counts and bleeding during treatment of chronic idiopathic thrombocytopenic purpura: a randomised, double-blind, placebo-controlled trial. Lancet 2009; 373:641–648.
- Cheng G, Saleh MN, Marcher C, et al. Eltrombopag for management of chronic immune thrombocytopenia (RAISE): a 6-month, randomised, phase 3 study. Lancet 2011; 377:393–402.
- Arnold DM, Nazi I, Kelton JG. New treatments for idiopathic thrombocytopenic purpura: rethinking old hypotheses. Expert Opin Investig Drugs 2009; 18:805–819.
- Boruchov DM, Gururangan S, Driscoll MC, Bussel JB. Multiagent induction and maintenance therapy for patients with refractory immune thrombocytopenic purpura (ITP). Blood 2007; 110:3526–3531.
- Arnold DM, Nazi I, Santos A, et al. Combination immunosuppressant therapy for patients with chronic refractory immune thrombocytopenic purpura. Blood 2010; 115:29–31.
- Passweg JR, Rabusin M. Hematopoetic stem cell transplantation for immune thrombocytopenia and other refractory autoimmune cytopenias. Autoimmunity 2008; 41:660–665.
- Huhn RD, Fogarty PF, Nakamura R, et al. High-dose cyclophosphamide with autologous lymphocyte-depleted peripheral blood stem cell (PBSC) support for treatment of refractory chronic autoimmune thrombocytopenia. Blood 2003; 101:71–77.
- Magrin S, Craxi A, Fabiano C, et al. Hepatitis C viremia in chronic liver disease: relationship to interferon-alpha or corticosteroid treatment. Hepatology 1994; 19:273–279.
- McHutchison JG, Dusheiko G, Shiffman ML, et al; TPL102357 Study Group. Eltrombopag for thrombocytopenia in patients with cirrhosis associated with hepatitis C. N Engl J Med 2007; 357:2227–2236.
- US Department of Health & Human Services. Promacta (eltrombopag): Portal Venous System Thromboses in Study of Patients With Chronic Liver Disease http://www.fda.gov/Safety/MedWatch/SafetyInformation/SafetyAlertsforHumanMedicalProducts/ucm211796.htm. Accessed June 27, 2012.
Immune thrombocytopenia (ITP), formerly known as idiopathic thrombocytopenic purpura, is an autoimmune disorder characterized by a low platelet count and increased risk of mucocutaneous bleeding. During the last decade its management has changed, with the advent of new medications and with increased awareness of treatment side effects. This article will focus on the pathophysiology, diagnosis, and management of ITP in adults.
A SLIGHT FEMALE PREDOMINANCE UNTIL AGE 65
The estimated age-adjusted prevalence of ITP in the United States is 9.5 to 23.6 cases per 100,000.1 In a recent study in the United Kingdom, the incidence was 4.4 per 100,000 patient-years among women and 3.4 among men.2 A slight female predominance was seen until age 65; thereafter, the incidence rates in men and women were about equal.
INCREASED PLATELET DESTRUCTION AND DECREASED PRODUCTION
ITP is a complex immune process in which cellular and humoral immunity are involved in the destruction of platelets3 as well as impaired platelet production. Several theories have emerged in the last decade to explain this autoimmune process.
Autoantibodies form against platelets
The triggering event for antibody initiation in ITP is unknown.3 Autoantibodies (mostly immunoglobulin G [IgG] but sometimes IgM and IgA) are produced against the platelet membrane glycoprotein GPIIb-IIIa. The antibody-coated platelets are rapidly cleared by the reticuloendothelial system in the spleen and liver, in a process mediated by Fc-receptor expression on macrophages and dendritic cells. Autoantibodies may also affect platelet production by inhibiting megakaryocyte maturation and inducing apoptosis.4,5
Patients with ITP also have CD4+ T cells that are autoreactive to GPIIb-IIIa and that stimulate B-cell clones to produce antiplatelet antibodies. Although autoreactive T cells are present in healthy individuals, they appear to be activated in patients with ITP by exposure to fragments of GPIIb-IIIa rather than native GPIIb-IIIa proteins.6 Activated macrophages internalize antibody-coated platelets and degrade GPIIb-IIIa and other glycoproteins to form “cryptic” epitopes that are expressed on the macrophage surface as novel peptides that induce further proliferation of CD4+ T-cell clones. Epitope spread thereby sustains a continuous loop that amplifies the production of GPIIb-IIIa antibodies.7
Defective T-regulatory cells appear to be critical to the pathogenesis of ITP by breaking self-tolerance, allowing the autoimmune process to progress.8 This, together with several other immune mechanisms such as molecular mimicry, abnormal cytokine profile, and B-cell abnormalities, may lead to enhanced platelet clearance.9
In addition to destroying platelets, antibodies may impair platelet production.10 Good evidence for platelets being underproduced in patients with ITP is that treating with thrombopoietin agonists results in increased platelet counts.
A DIAGNOSIS OF EXCLUSION
ITP is defined as isolated thrombocytopenia with no clinically apparent associated conditions or other causes of thrombocytopenia.11 No diagnostic criteria currently exist, and the diagnosis is established only after excluding other causes of thrombocytopenia.
A recent report12 from an international working group established a platelet count threshold of less than 100 × 109/L for diagnosing ITP, down from the previous threshold of 150 × 109/L. The panel also recommended using the term “immune” rather than “idiopathic” thrombocytopenia, emphasizing the role of underlying immune mechanisms. The term “purpura” was removed, because many patients have no or minimal signs of bleeding at the time of diagnosis.12
The 2011 American Society of Hematology’s evidenced-based guidelines for the treatment of ITP present the most recent authoritative diagnostic and therapeutic recommendations.13
ITP is considered to be primary if it occurs in isolation, and secondary if it is associated with an underlying disorder. It is further classified according to its duration since diagnosis: newly diagnosed (< 3 months), persistent (3−12 months), and chronic (> 12 months).
In adults, ITP tends to be chronic, presenting with a more indolent course than in childhood, and unlike childhood ITP, infrequently following a viral infection.
Clinical features associated with ITP are related to thrombocytopenia: petechiae (pinpoint microvascular hemorrhages that do not blanch with pressure), purpura (appearing like large bruises), epistaxis (nosebleeds), menorrhagia, gum bleeding, and other types of mucocutaneous bleeding. Other common clinical features include fatigue, impaired quality of life, and treatment-related side effects (eg, infection).14
A low platelet count may be the sole initial manifestation. The patient’s history, physical examination, blood counts, and findings on blood smear are essential to rule out other diagnoses. Few diagnostic tests are useful in the initial evaluation (Table 1). Abnormalities in the blood count or blood smear may be further investigated with bone marrow biopsy but is not required if the patient has typical features of ITP, regardless of age.
Because there are no specific criteria for diagnosing ITP, other causes of thrombocytopenia must be excluded. The differential diagnosis can be further classified as ITP due to other underlying disease (ie, secondary ITP) vs nonautoimmune causes that are frequently encountered in clinical practice.
SECONDARY ITP
The differential diagnosis of thrombocytopenia due to known underlying immune disease includes the following:
Drug-induced ITP
Recurrent episodes of acute thrombocytopenia not explained by other causes should trigger consideration of drug-induced thrombocytopenia. 11 Patients should be questioned about drug use, especially of sulfonamides, antiepileptics, and quinine. Thrombocytopenia usually occurs 5 to 7 days after beginning the inciting drug for the first time and more quickly when the drug is given intermittently. Heparin is the most common cause of drug-related thrombocytopenia among hospitalized patients; the mechanism is unique and involves formation of a heparin-PF4 immune complex.
Human immunodeficiency virus infection
Approximately 40% of patients with human immunodeficiency virus (HIV) infection develop thrombocytopenia at some time.15 HIV infection can initially manifest as isolated thrombocytopenia and is sometimes clinically indistinguishable from chronic ITP, making it an important consideration in a newly diagnosed case of thrombocytopenia.
The mechanism of thrombocytopenia in early HIV is similar to that in primary ITP: as the disease progresses, low platelet counts can result from ineffective hematopoiesis due to megakaryocyte infection and marrow infiltration.16
Hepatitis C virus infection
Hepatitis C virus (HCV) infection can also cause immune thrombocytopenia. A recent study demonstrated the potential of the HCV core envelope protein 1 to induce antiplatelet antibodies (to platelet surface integrin GPIIIa49-66) by molecular mimicry.17 Other causes of thrombocytopenia in HCV infection may be related to chronic liver disease, such as portal hypertension-related hypersplenism, as well as decreased thrombopoietin production.18 Antiviral treatment with pegylated interferon may also cause mild thrombocytopenia.19
Helicobacter pylori
The association between H pylori infection and ITP remains uncertain. Eradication of infection appears to completely correct ITP in some places where the prevalence of H pylori is high (eg, Italy and Japan) but not in the United States and Canada, where the prevalence is low.20 The different response may be due not only to the differences in prevalence, but to different H pylori genotypes: most H pylori strains in Japan express CagA, whereas the frequency of CagA-positive strains is much lower in western countries.20
In areas where eradication therapy may be useful, the presence of H pylori infection should be determined by either a urea breath test or stool antigen testing.
Lymphoproliferative disorders
Secondary forms of ITP can occur in association with chronic lymphocytic leukemia, non-Hodgkin lymphoma, and Hodgkin lymphoma. These diagnoses should especially be considered in patients presenting with thrombocytopenia accompanied by systemic illness. ITP occurs in at least 2% of patients with chronic lymphocytic leukemia and is usually difficult to distinguish from thrombocytopenia secondary to marrow infiltration or from fludarabine (Fludora) therapy.21
It is especially important to determine if a lymphoproliferative disorder is present because it changes the treatment of ITP. Treatment of ITP complicating chronic lymphocytic leukemia is challenging and includes corticosteroids and steroid-sparing agents such as cyclosporine (Gengraf, Neoral, Sandimmune), rituximab (Rituxan), and intravenous immunoglobulin.22
Systemic lupus erythematosus and other autoimmune diseases
Thrombocytopenia is a frequent clinical manifestation of systemic lupus erythematosus, occurring in 7% to 30% of patients,23 and is an independent risk factor for death.24 Lupus should be suspected in patients with ITP who have multiorgan involvement and other clinical and laboratory abnormalities. A small percentage of patients with ITP (about 2%−5%) develop lupus after several years.21
Thrombocytopenia can also result from other autoimmune disorders such as antiphospholipid antibody syndrome25 and autoimmune thyroid diseases as well as immunodeficient states such as IgA deficiency and common variable immunodeficiency with low IgG levels.
NONAUTOIMMUNE THROMBOCYTOPENIA
Thrombocytopenia can also be caused by a number of nonautoimmune conditions.
Pseudothrombocytopenia
Pseudothrombocytopenia can occur if ex-vivo agglutination of platelets is induced by antiplatelet antibodies to EDTA, a standard blood anticoagulant. Automated counters cannot differentiate the agglutinated platelet clumps from individual cells such as red cells. This can frequently be overcome by running the counts in a citrate or ACD reagent tube. A peripheral blood smear can demonstrate whether platelet clumps are present.
Thrombotic thrombocytopenic purpura
Thrombotic thrombocytopenic purpura presents with thrombocytopenia, purpura, and anemia. Associated clinical abnormalities (fever, neurologic symptoms, and renal failure) and the presence of fragmented red cells on blood smear help to distinguish it from ITP. Plasma exchange is the treatment of choice.
Gestational thrombocytopenia
Five percent of pregnant women develop mild thrombocytopenia (platelet counts typically > 70 × 109/L) near the end of gestation.26 It requires no treatment and resolves after delivery. The fetus’ platelet count remains unaffected.
Gestational thrombocytopenia should be differentiated from the severe thrombocytopenia of preeclampsia and HELLP syndrome (hemolysis, elevated liver enzymes, and low platelet count), which requires immediate attention.
Myelodysplastic syndrome
Myelodysplastic syndrome is common among elderly patients and should be considered in cases of unexplained cytopenia and abnormalities in the peripheral blood smear suggestive of dysplastic cytologic features. It can be diagnosed by bone marrow biopsy. Thrombocytopenia occurs in about 40% to 65% of cases of myelodysplastic syndrome.27
MANAGE ITP TO KEEP PLATELET COUNT ABOVE 30 × 109/L
ITP does not necessarily require treatment, and the initial challenge is to determine whether treatment or observation is indicated. Treatment is based on two major factors: the platelet count and degree of bleeding. The goals of management are to achieve a safe platelet count to prevent serious bleeding while minimizing treatment-related toxicity.7
Adults with platelet counts of less than 30 × 109/L are usually treated. In multiple large cohort studies, patients with platelet counts above that level have been safely observed without treatment.11,28
Table 2 outlines a comprehensive approach to therapy.
INITIAL TREATMENT: STEROIDS AND IMMUNOGLOBULINS
Oral corticosteroids are the initial agents of choice
Oral prednisone 1 mg/kg/day in tapering doses for 4 to 6 weeks is the most common initial regimen. Other regimens, such as high-dose dexamethasone (Decadron) (40 mg daily for 4 days per month) for several cycles, have been reported to be more effective29 but have not been studied in head-to-head trials with oral prednisone.
Due to their effectiveness, low cost, and convenience of use, corticosteroids have been the backbone of initial treatment in ITP. However, in most patients the platelet count decreases once the dose is tapered or stopped; remission is sustained in only 10% to 30% of cases.30 Continuation of corticosteroids is limited by long-term complications such as opportunistic infections, osteoporosis, and emotional lability.31
Intravenous immunoglobulin and anti-D immunoglobulin are alternatives
Intravenous immunoglobulin is recommended for patients who have not responded to corticosteroids and is often used in pregnancy. It is thought to act by blocking Fc receptors in the reticuloendothelial system. Intravenous immunoglobulin rapidly increases platelet counts in 65% to 80% of patients,32 but the effect is transient and the drug requires frequent administration. It is usually well tolerated, although about 5% of patients experience headache, chills, myalgias, arthralgias, and back pain. Rare, serious complications include thrombotic events, anaphylaxis (in IgA-deficient patients), and renal failure.
Anti-D immunoglobulin, a pooled IgG product, is derived from the plasma of Rh(D)-negative donors and can be given only to patients who are Rh(D)-positive. Response rates as high as 70% have been reported, with platelet effects lasting for more than 21 days.33 Studies have shown better results at a high dose (75 μg/kg) than with the approved dose of 50 μg/kg.34
Anti-D immunoglobulin can also be given intermittently whenever the platelet count falls below a specific level (ie, 30 × 109/L). This allows some patients to avoid splenectomy and may even trigger long-term remission.32
Common side effects of anti-D immunoglobulin include fever and chills; these can be prevented by premedication with acetaminophen or corticosteroids. Rare but fatal cases of intravascular hemolysis, renal failure, and disseminated intravascular coagulation have been reported, precluding its use for ITP in some countries, including those of the European Union.
Emergency treatment: Combination therapy
Evidence-based guidelines are limited for treating patients with active bleeding or who are at high risk of bleeding. For uncontrolled bleeding, a combination of first-line therapies is recommended, using prednisone and intravenous immunoglobulin.35 Other options include high-dose methylprednisolone and platelet transfusions, alone or in combination with intravenous immunoglobulin.36
SECOND-LINE TREATMENTS
Splenectomy produces complete remission in most patients
Patients who relapse and have a platelet count of less than 20 × 109/L are traditionally considered for splenectomy. More than two-thirds of patients respond with no need for further treatment.37
Although splenectomy has the highest rate of durable platelet response, the risks associated with surgery are an important concern. Even with a laparoscopic splenectomy, complications occur in 10% of patients and death in 0.2%. Long-term risks include the rare occurrence of sepsis with an estimated mortality rate of 0.73 per 1,000 patient-years, and possible increased risk of thrombosis.38,39
Adherence to recommended vaccination protocols and early administration of antibiotics for systemic febrile illness reduce the risk of sepsis.40 Patients are advised to receive immunization against encapsulated bacteria with pneumococcal, Haemophilus influenzae type b, and meningococcal vaccines. These vaccines should be given at least 2 weeks before elective splenectomy.41
Treatment of patients refractory to splenectomy is challenging and requires further immunosuppressive therapy, which is associated with an increased risk of infections and infection-related deaths.42
Rituximab in addition to or possibly instead of splenectomy
Rituximab (Rituxan) is a chimeric anti-CD20 monoclonal antibody that targets B cells. Although initially approved for treatment of lymphomas, rituximab has gained popularity in treating ITP due to its safety profile and ability to deplete CD20+ B cells responsible for antiplatelet antibody production by Fc-mediated cell lysis.
In the largest systematic review of published reports of rituximab use in ITP (19 studies, 313 patients), Arnold and colleagues43 reported an overall platelet response (defined as platelet count > 50 × 109/L) in 62.5% (95% confidence interval [CI] 52.6%−72.5%) of patients. The median duration of response was 10.5 months (range 3–20), and median follow-up was 9.5 months (range 2–25). Nearly all patients had received corticosteroid treatment and half of them had undergone splenectomy.
Rituximab has also been investigated as an alternative to splenectomy. In a prospective, single-arm, phase 2 trial, 60 patients with chronic ITP (platelet counts < 30 × 109/L) for whom one or more previous treatments had failed received rituximab infusions and were followed for up to 2 years. A good response (defined as a platelet count ≥ 50 × 109/L, with at least a doubling from baseline) was obtained in 24 (40%) of 60 patients (95% CI 28%–52%) at 1 year and 33.3% at 2 years. The authors concluded that rituximab could be used as a presplenectomy therapeutic option, particularly in patients with chronic ITP who are at increased surgical risk or who are reluctant to undergo surgery.44 Based on these results, rituximab may spare some patients from splenectomy, or at least delay it. However, it has never been tested in randomized controlled trials to establish its role as a splenectomy-sparing agent in ITP.
Side effects include infusion reactions, which are usually mild but in rare cases can be severe. Recently, progressive multifocal leukoencephalopathy has been recognized as a complication of rituximab treatment in patients with lymphoproliferative and autoimmune disorders.45 Although this complication is rare in patients with ITP, careful monitoring is required until additional long-term safety data are available.
Thrombopoietic receptor agonists require continuous treatment
In the early 1990s, recombinant thrombopoietin was tested in clinical studies. These were halted when antibodies developed to recombinant thrombopoietin that cross-reacted with endogenous thrombopoietin, resulting in severe thrombocytopenia.46
This led to the development of nonimmunogenic thrombopoietin receptor agonists that mimic the effect of thrombopoietin and stimulate the production of platelets. In 2008, the US Food and Drug Administration approved two drugs of this class for treating ITP: romiplostim (Nplate) and eltrombopag (Promacta). They are mainly used to treat patients with chronic ITP who have had an insufficient response to corticosteroids, immunoglobulins, or splenectomy.
Although well tolerated and effective in increasing platelet counts, these agents share common drawbacks. They do not modify the course of the disease, they are used only to sustain the platelet count, they require repeated administration, and they must be given for about 7 days to achieve an adequate platelet response, so they cannot be used in emergencies. Long-term adverse effects include bone marrow fibrosis and thrombosis.
Romiplostim is a synthetic peptide capable of binding to the thrombopoietin receptor c-Mpl. It has no sequence homology with endogenous thrombopoietin,47 so does not induce cross-reacting antibodies. It has a half-life of 120 to 160 hours and is usually given subcutaneously 1 to 10 μg/kg weekly.
Phase III clinical trials have shown the effectiveness of romiplostim in attaining a durable platelet response (platelet count > 50 × 109/L) in splenectomized and nonsplenectomized populations. It is well tolerated, and only two uncommon serious adverse effects have been reported: bone marrow reticulin formation and thromboembolism.48
A long-term open-label extension study of 142 patients treated with romiplostim for up to 156 weeks showed that 124 (87%) achieved a platelet count of more than 50 × 109/L at some point, and 84% of patients were able to reduce or discontinue concurrent medications for ITP.49
Kuter et al,50 in a randomized controlled trial, confirmed the efficacy of romiplostim in attaining durable increased platelet counts. Patients treated with romiplostim at a mean weekly dose of 3.9 μg/kg ± 2.1 μg/kg demonstrated a higher rate of platelet response, lower incidence of treatment failure, and improved quality of life vs patients treated with standard care.
Eltrombopag is a nonpeptide thrombopoietin agonist that binds to the transmembrane domain of the thrombopoietin receptor and stimulates the proliferation and differentiation of megakaryocytes in bone marrow. It is given orally in doses of 25 to 75 mg daily.
Eltrombopag has been shown to be effective in increasing platelet counts in chronic ITP.51 In a phase III trial conducted by Cheng and colleagues, 197 patients were randomized to eltrombopag or placebo.52 Patients treated with eltrombopag were eight times more likely to achieve platelet counts of more than 50 × 109/L during the 6-month treatment period (odds ratio 8.2, 95% CI 4.32–15.38, P < .001) vs placebo. Patients treated with eltrombopag had fewer bleeding episodes and were more likely to reduce or discontinue the dose of concurrent ITP medications. The only significant side effect seen was a rise in aminotransferases (seen in 7% of eltrombopag recipients vs 2% with placebo).52
Additional thrombopoietin agonists under investigation include ARK-501, totrombopag, and LGD-4665. MDX-33, a monoclonal antibody against the Fc-receptor, is also being studied; it acts by preventing opsonization of autoantibody-coated platelets.53
THIRD-LINE TREATMENTS FOR REFRACTORY CASES
Patients with ITP that is resistant to standard therapies have an increased risk of death, disease, and treatment-related complications.28,42
Combination chemotherapy
Immunosuppressants such as azathioprine (Imuran), cyclosporine (Neoral, Sandimmune), cyclophosphamide (Cytoxan), and mycophenolate (CellCept) were used in the past in single-agent regimens with some efficacy, but their use was limited due to drug-related toxicity and a low safety profile.3 However, there is increasing evidence for a role of combination chemotherapy to treat chronic refractory ITP to achieve greater efficacy and fewer adverse effects.54
Arnold and colleagues55 reported that combined azathioprine, mycophenolate, and cyclosporine achieved an overall response (platelet count > 30 × 109/L and doubling of the baseline) in 14 (73.7%) of 19 patients with chronic refractory ITP, lasting a median of 24 months.
Hematopoietic stem cell transplantation
Hematopoietic stem cell transplantation has provided remission in a limited number of patients. However, it is associated with fatal toxicities such as graft-vs-host disease and septicemia, and therefore it is reserved for severe refractory ITP with bleeding complications unresponsive to other therapies.56,57
THERAPY FOR SECONDARY ITP DEPENDS ON THE CAUSE
Treatments for secondary ITP vary depending on the cause of thrombocytopenia and are often more complex than therapy for primary disease. Optimal management involves treating the underlying condition (eg, chronic lymphocytic leukemia or systemic lupus erythematosus).
Drug-induced thrombocytopenia requires prompt recognition and withdrawal of the inciting agent.
Treating ITP due to HCV infection primarily involves antiviral agents to suppress viral replication. If treating ITP is required, then intravenous immunoglobulin is preferable to glucocorticoids because of the risk of increasing viral load with the latter.58 Eltrombopag may effectively increase platelet counts, allowing patients to receive interferon therapy for HCV.59 However, a recent study was halted due to increased incidence of portal vein thrombosis, raising concerns about the safety of eltrombopag for patients with chronic liver disease.60
Secondary ITP due to HIV infection should always be treated first with antivirals targeting HIV unless thrombocytopenia-related bleeding complications warrant treatment. If treatment for ITP is necessary, it should include corticosteroids, intravenous immunoglobulin, or anti-D immunoglobulin as first-line therapy.
Eradication therapy for H pylori is recommended for patients who are positive for the organism based on urea breath testing, stool antigen testing, or endoscopic biopsies.
- Feudjo-Tepie MA, Robinson NJ, Bennett D. Prevalence of diagnosed chronic immune thrombocytopenic purpura in the US: analysis of a large US claim database: a rebuttal. J Thromb Haemost 2008; 6:711–712.
- Abrahamson PE, Hall SA, Feudjo-Tepie M, Mitrani-Gold FS, Logie J. The incidence of idiopathic thrombocytopenic purpura among adults: a population-based study and literature review. Eur J Haematol 2009; 83:83–89.
- Gernsheimer T. Chronic idiopathic thrombocytopenic purpura: mechanisms of pathogenesis. Oncologist 2009; 14:12–21.
- McMillan R, Wang L, Tomer A, Nichol J, Pistillo J. Suppression of in vitro megakaryocyte production by antiplatelet auto-antibodies from adult patients with chronic ITP. Blood 2004; 103:1364–1369.
- Houwerzijl EJ, Blom NR, van der Want JJ, et al. Ultrastructural study shows morphologic features of apoptosis and para-apoptosis in megakaryocytes from patients with idiopathic thrombocytopenic purpura. Blood 2004; 103:500–506.
- Kuwana M, Kaburaki J, Kitasato H, et al. Immunodominant epitopes on glycoprotein IIb-IIIa recognized by autoreactive T cells in patients with immune thrombocytopenic purpura. Blood 2001; 98:130–139.
- Cines DB, Blanchette VS. Immune thrombocytopenic purpura. N Engl J Med 2002; 346:995–1008.
- Littman DR, Rudensky AY. Th17 and regulatory T cells in mediating and restraining inflammation. Cell 2010; 140:845–858.
- Semple JW, Provan D, Garvey MB, Freedman J. Recent progress in understanding the pathogenesis of immune thrombocytopenia. Curr Opin Hematol 2010; 17:590–595.
- Ballem PJ, Segal GM, Stratton JR, Gernsheimer T, Adamson JW, Slichter SJ. Mechanisms of thrombocytopenia in chronic autoimmune thrombocytopenic purpura. Evidence of both impaired platelet production and increased platelet clearance. J Clin Invest 1987; 80:33–40.
- George JN. Definition, diagnosis and treatment of immune thrombocytopenic purpura. Haematologica 2009; 94:759–762.
- Rodeghiero F, Stasi R, Gernsheimer T, et al. Standardization of terminology, definitions and outcome criteria in immune thrombocytopenic purpura of adults and children: report from an international working group. Blood 2009; 113:2386–2393.
- Neunert C, Lim W, Crowther M, Cohen A, Solberg L, Crowther MA; American Society of Hematology. The American Society of Hematology 2011 evidence-based practice guideline for immune thrombocytopenia. Blood 2011; 117:4190–4207.
- Newton JL, Reese JA, Watson SI, et al. Fatigue in adult patients with primary immune thrombocytopenia. Eur J Haematol 2011; 86:420–429.
- Stasi R, Willis F, Shannon MS, Gordon-Smith EC. Infectious causes of chronic immune thrombocytopenia. Hematol Oncol Clin North Am 2009; 23:1275–1297.
- Moses A, Nelson J, Bagby GC. The influence of human immunodeficiency virus-1 on hematopoiesis. Blood 1998; 91:1479–1495.
- Zhang W, Nardi MA, Borkowsky W, Li Z, Karpatkin S. Role of molecular mimicry of hepatitis C virus protein with platelet GPIIIa in hepatitis C-related immunologic thrombocytopenia. Blood 2009; 113:4086–4093.
- Peck-Radosavljevic M. Thrombocytopenia in liver disease. Can J Gastroenterol 2000; 14(suppl D):60D–66D.
- Roomer R, Hansen BE, Janssen HL, de Knegt RJ. Thrombocytopenia and the risk of bleeding during treatment with peginterferon alfa and ribavirin for chronic hepatitis C. J Hepatol 2010; 53:455–459.
- Stasi R, Sarpatwari A, Segal JB, et al. Effects of eradication of Helicobacter pylori infection in patients with immune thrombocytopenic purpura: a systematic review. Blood 2009; 113:1231–1240.
- Cines DB, Bussel JB, Liebman HA, Luning Prak ET. The ITP syndrome: pathogenic and clinical diversity. Blood 2009; 113:6511–6521.
- Zent CS, Kay NE. Autoimmune complications in chronic lymphocytic leukaemia (CLL). Best Pract Res Clin Haematol 2010; 23:47–59.
- Hepburn AL, Narat S, Mason JC. The management of peripheral blood cytopenias in systemic lupus erythematosus. Rheumatology (Oxford) 2010; 49:2243–2254.
- Mok CC, Lee KW, Ho CT, Lau CS, Wong RW. A prospective study of survival and prognostic indicators of systemic lupus erythematosus in a southern Chinese population. Rheumatology (Oxford) 2000; 39:399–406.
- Cervera R, Piette JC, Font J, et al; Euro-Phospholipid Project Group. Antiphospholipid syndrome: clinical and immunologic manifestations and patterns of disease expression in a cohort of 1,000 patients. Arthritis Rheum 2002; 46:1019–1027.
- Burrows RF, Kelton JG. Fetal thrombocytopenia and its relation to maternal thrombocytopenia. N Engl J Med 1993; 329:1463–1466.
- Kantarjian H, Giles F, List A, et al. The incidence and impact of thrombocytopenia in myelodysplastic syndromes. Cancer 2007; 109:1705–1714.
- Portielje JE, Westendorp RG, Kluin-Nelemans HC, Brand A. Morbidity and mortality in adults with idiopathic thrombocytopenic purpura. Blood 2001; 97:2549–2554.
- Cheng Y, Wong RS, Soo YO, et al. Initial treatment of immune thrombocytopenic purpura with high-dose dexamethasone. N Engl J Med 2003; 349:831–836.
- Bromberg ME. Immune thrombocytopenic purpura—the changing therapeutic landscape. N Engl J Med 2006; 355:1643–1645.
- Guidry JA, George JN, Vesely SK, Kennison SM, Terrell DR. Corticosteroid side-effects and risk for bleeding in immune thrombocytopenic purpura: patient and hematologist perspectives. Eur J Haematol 2009; 83:175–182.
- Cooper N. Intravenous immunoglobulin and anti-RhD therapy in the management of immune thrombocytopenia. Hematol Oncol Clin North Am 2009; 23:1317–1327.
- Scaradavou A, Woo B, Woloski BM, et al. Intravenous anti-D treatment of immune thrombocytopenic purpura: experience in 272 patients. Blood 1997; 89:2689–2700.
- Newman GC, Novoa MV, Fodero EM, Lesser ML, Woloski BM, Bussel JB. A dose of 75 microg/kg/d of i.v. anti-D increases the platelet count more rapidly and for a longer period of time than 50 microg/kg/d in adults with immune thrombocytopenic purpura. Br J Haematol 2001; 112:1076–1078.
- Provan D, Stasi R, Newland AC, et al. International consensus report on the investigation and management of primary immune thrombocytopenia. Blood 2010; 115:168–186.
- Spahr JE, Rodgers GM. Treatment of immune-mediated thrombocytopenia purpura with concurrent intravenous immunoglobulin and platelet transfusion: a retrospective review of 40 patients. Am J Hematol 2008; 83:122–125.
- Kojouri K, Vesely SK, Terrell DR, George JN. Splenectomy for adult patients with idiopathic thrombocytopenic purpura: a systematic review to assess long-term platelet count responses, prediction of response, and surgical complications. Blood 2004; 104:2623–2634.
- Schilling RF. Estimating the risk for sepsis after splenectomy in hereditary spherocytosis. Ann Intern Med 1995; 122:187–188.
- Crary SE, Buchanan GR. Vascular complications after splenectomy for hematologic disorders. Blood 2009; 114:2861–2868.
- Davies JM, Barnes R, Milligan D; British Committee for Standards in Haematology. Update of guidelines for the prevention and treatment of infection in patients with an absent or dysfunctional spleen. Clin Med 2002; 2:440–443.
- Centers for Disease Control and Prevention (CDC). Recommended adult immunization schedule—United States, 2011. MMWR Morb Mortal Wkly Rep 2011; 60:1–4.
- McMillan R, Durette C. Long-term outcomes in adults with chronic ITP after splenectomy failure. Blood 2004; 104:956–960.
- Arnold DM, Dentali F, Crowther MA, et al. Systematic review: efficacy and safety of rituximab for adults with idiopathic thrombocytopenic purpura. Ann Intern Med 2007; 146:25–33.
- Godeau B, Porcher R, Fain O, et al. Rituximab efficacy and safety in adult splenectomy candidates with chronic immune thrombocytopenic purpura: results of a prospective multicenter phase 2 study. Blood 2008; 112:999–1004.
- Carson KR, Evens AM, Richey EA, et al. Progressive multifocal leukoencephalopathy after rituximab therapy in HIV-negative patients: a report of 57 cases from the Research on Adverse Drug Events and Reports project. Blood 2009; 113:4834–4840.
- Li J, Yang C, Xia Y, et al. Thrombocytopenia caused by the development of antibodies to thrombopoietin. Blood 2001; 98:3241–3248.
- Kuter DJ. New thrombopoietic growth factors. Blood 2007; 109:4607–4616.
- Kuter DJ, Bussel JB, Lyons RM, et al. Efficacy of romiplostim in patients with chronic immune thrombocytopenic purpura: a double-blind randomised controlled trial. Lancet 2008; 371:395–403.
- Bussel JB, Kuter DJ, Pullarkat V, Lyons RM, Guo M, Nichol JL. Safety and efficacy of long-term treatment with romiplostim in thrombocytopenic patients with chronic ITP. Blood 2009; 113:2161–2171.
- Kuter DJ, Rummel M, Boccia R, et al. Romiplostim or standard of care in patients with immune thrombocytopenia. N Engl J Med 2010; 363:1889–1899.
- Bussel JB, Provan D, Shamsi T, et al. Effect of eltrombopag on platelet counts and bleeding during treatment of chronic idiopathic thrombocytopenic purpura: a randomised, double-blind, placebo-controlled trial. Lancet 2009; 373:641–648.
- Cheng G, Saleh MN, Marcher C, et al. Eltrombopag for management of chronic immune thrombocytopenia (RAISE): a 6-month, randomised, phase 3 study. Lancet 2011; 377:393–402.
- Arnold DM, Nazi I, Kelton JG. New treatments for idiopathic thrombocytopenic purpura: rethinking old hypotheses. Expert Opin Investig Drugs 2009; 18:805–819.
- Boruchov DM, Gururangan S, Driscoll MC, Bussel JB. Multiagent induction and maintenance therapy for patients with refractory immune thrombocytopenic purpura (ITP). Blood 2007; 110:3526–3531.
- Arnold DM, Nazi I, Santos A, et al. Combination immunosuppressant therapy for patients with chronic refractory immune thrombocytopenic purpura. Blood 2010; 115:29–31.
- Passweg JR, Rabusin M. Hematopoetic stem cell transplantation for immune thrombocytopenia and other refractory autoimmune cytopenias. Autoimmunity 2008; 41:660–665.
- Huhn RD, Fogarty PF, Nakamura R, et al. High-dose cyclophosphamide with autologous lymphocyte-depleted peripheral blood stem cell (PBSC) support for treatment of refractory chronic autoimmune thrombocytopenia. Blood 2003; 101:71–77.
- Magrin S, Craxi A, Fabiano C, et al. Hepatitis C viremia in chronic liver disease: relationship to interferon-alpha or corticosteroid treatment. Hepatology 1994; 19:273–279.
- McHutchison JG, Dusheiko G, Shiffman ML, et al; TPL102357 Study Group. Eltrombopag for thrombocytopenia in patients with cirrhosis associated with hepatitis C. N Engl J Med 2007; 357:2227–2236.
- US Department of Health & Human Services. Promacta (eltrombopag): Portal Venous System Thromboses in Study of Patients With Chronic Liver Disease http://www.fda.gov/Safety/MedWatch/SafetyInformation/SafetyAlertsforHumanMedicalProducts/ucm211796.htm. Accessed June 27, 2012.
KEY POINTS
- Secondary ITP can be drug-induced or be a manifestation of human immunodeficiency virus (HIV), hepatitis C virus (HCV), a lymphoproliferative disorder, or systemic lupus erythematosus.
- Nonautoimmune conditions should also be considered, including pseudothrombocytopenia (a laboratory artifact induced by EDTA), thrombotic thrombocytopenic purpura, thrombocytopenia in pregnancy, and myelodysplastic syndrome (common in the elderly).
- Treatment is indicated to keep the platelet count above 30 × 109/L or to control bleeding.
- Initial treatment usually begins with glucocorticoids, with the duration limited by side effects.
- Patients for whom glucocorticoids fail generally require splenectomy, rituximab, or thrombopoietin receptor agonists.
New and Noteworthy Information—September
Persons who are obese and who also have metabolic abnormalities are likely to have faster cognitive decline, according to a study published in the August 21 Neurology. Researchers gathered data on BMI and metabolic status at the start of the study and then administered four cognitive tests throughout the next decade. Of the 6,401 adults (ages 39 to 63) who provided data on BMI, 31% had metabolic abnormalities, which were defined as having two or more of several risk factors, including high blood pressure. In the metabolically normal group, the 10-year decline in the global cognitive score was similar among the normal weight, overweight, and obese persons. The investigators observed the fastest cognitive decline in those who were both obese and metabolically abnormal.
Patients with atrial fibrillation and chronic kidney disease have an increased risk of stroke or systemic thromboembolism and bleeding, researchers reported in the August 16 New England Journal of Medicine. The study included 132,372 patients who were discharged from the hospital with a diagnosis of nonvalvular atrial fibrillation. Among this group, 3,587 had non–end stage chronic kidney disease and 901 required
renal-replacement therapy at time of inclusion. Compared with patients who did not have renal disease, those with non–end stage chronic kidney disease and those who required renal-replacement therapy had an increased risk of stroke or systemic thromboembolism. Patients in both renal disease groups who took warfarin but not aspirin significantly decreased this risk. However, warfarin and aspirin were associated with an increased risk of bleeding, the researchers noted.
Patients with Alzheimer’s disease who are hospitalized are more likely to experience delirium, which is associated with an increased risk of cognitive decline for up to five years, researchers reported in the online August 20 Archives of Internal Medicine. The investigators prospectively collected data from 263 patients with Alzheimer’s disease between 1991 and 2006 and found that 56% of patients with Alzheimer’s disease developed delirium during hospitalization. Before hospitalization, patients showed no difference in rates of cognitive decline, but patients who developed delirium had greater cognitive deterioration in the year after hospitalization than those who did not. In addition, this increased rate of deterioration was observed throughout the five-year period following hospitalization. “Strategies to prevent delirium may represent a promising avenue to explore for ameliorating cognitive deterioration in Alzheimer’s disease,” the researchers concluded.
Chronic cerebrospinal venous insufficiency (CCSVI) does not have an impact on the neurologic function or disability progression of patients with multiple sclerosis (MS), though it does play a role in cerebral hemodynamic changes, according to a study published in the online August 21 Radiology. Using MRI, researchers assessed cerebral blood volume and flow in 39 patients with MS (25 with CCSVI), and 26 healthy controls (14 with CCSVI). Results showed that persons with CCSVI in both the MS and control groups displayed cerebral hemodynamic anomalies, but no significant relationship was observed between MS and CCSVI for any of the hemodynamic parameters. Furthermore, no correlations were found between cerebral blood flow and volume values in normal-appearing white matter or for severity of disability in patients with MS. “The data support a role of CCSVI in cerebral hemodynamic changes … regardless of the presence of MS,” the researchers concluded.
Relatives of persons who are cognitively intact during late old age and who have high levels of C-reactive protein are more likely to avoid dementia, according to a study published in the August 15 online Neurology. Researchers identified a primary sample of 1,329 patients and siblings of 277 male veteran probands who were cognitively intact and at least 75 years old. The study also included a replication sample of 202 relatives of 51 cognitively intact, community-ascertained probands who were at least 85 years old. Results from both the primary and replication samples showed that relatives with higher levels of C-reactive protein were less likely to develop dementia (hazard ratio, 0.55). “High C-reactive protein in successful cognitive aging individuals may constitute a phenotype for familial—and thus possibly genetic—successful cognitive aging,” the study authors concluded.
More cases of West Nile virus have been documented in the United States thus far in 2012 than in any year since 1999, when the disease was first detected in the US, according to the CDC. As of August 14, 700 cases of West Nile virus had been reported, and 26 people had died from the disease. The increase in cases may be a result of last year’s mild winter and this year’s wet spring, researchers theorize. Among people bitten by an infected mosquito, 20% have symptoms that last from a few days to several weeks, and approximately one in 150 of those infected with West Nile have a severe and potentially fatal illness. Severe symptoms include high fever, headache, neck stiffness, stupor, disorientation, coma, tremors, convulsions, muscle weakness, vision loss, numbness, and paralysis. The neurologic effects from these severe symptoms may be permanent.
Speech therapy reorganizes the brains of patients with persistent developmental stuttering, according to a study published in the August 14 Neurology. Researchers examined resting-state functional connectivity (RSFC) and cortical thickness before and after therapy in 15 patients with stuttering who received the intervention, 13 patients with stuttering who did not receive the intervention, and 13 fluent controls. Before the therapeutic intervention, both groups of patients who stuttered had significant reductions in RSFC in the left pars opercularis as well as RSFC increases in the cerebellum. After the intervention, patients who stuttered showed decreases in stuttering and displayed RSFC levels in the cerebellum that matched those of fluent controls, though there was no change in the RSFC levels or cortical thickness of the left pars opercularis. This research suggests that the left pars opercularis and the cerebellum may play a role in stuttering, the study authors said.
Daily caffeine use provides only borderline improvement in excessive sleepiness in patients with Parkinson’s disease, but it does show benefits for motor function, researchers reported in the August 14 Neurology. In this six-week, randomized controlled clinical trial, 31 patients received placebo and 61 patients received 100 mg of caffeine supplements twice a day for three weeks, followed by 200 mg of caffeine supplements twice a day for three weeks. Analysis showed that caffeine led to a nonsignificant reduction in Epworth Sleepiness Scale score on the primary intention-to-treat analysis and a significant reduction in the Epworth Sleepiness Scale score on per-protocol analysis. In addition, use of caffeine reduced the total Unified Parkinson’s Disease Rating Scale score as well as the objective motor component. “These potential benefits suggest that a larger, long-term trial of caffeine is warranted,” the researchers concluded.
Black survivors of intracerebral hemorrhage are more likely than whites to have high blood pressure a year after stroke, which puts them at higher risk of another stroke, researchers reported in the August 16 online Stroke. The study included 162 patients (mean age, 59) with spontaneous intracerebral hemorrhage—77% of patients were black and 53% were male. At presentation, the mean arterial blood pressure in blacks was 9.6 mm Hg higher than in whites, even after adjusting for confounders. Furthermore, blacks were more likely than whites to have stage I/II hypertension one year following stroke, though there was no difference between blacks and whites at 30 days. Fewer than 20% of the overall patient group had normal blood pressure at 30 days or one year, leading researchers to conclude that “long-term blood pressure control is inadequate in patients after intracerebral hemorrhage, particularly in blacks.”
—Lauren LeBano