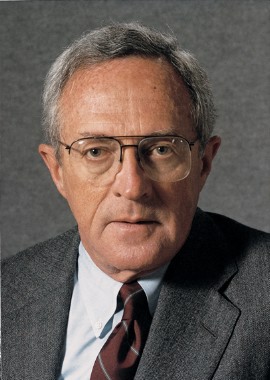
User login
Mortality and Readmission Correlations
The Centers for Medicare & Medicaid Services (CMS) publicly reports hospital‐specific, 30‐day risk‐standardized mortality and readmission rates for Medicare fee‐for‐service patients admitted with acute myocardial infarction (AMI), heart failure (HF), and pneumonia.1 These measures are intended to reflect hospital performance on quality of care provided to patients during and after hospitalization.2, 3
Quality‐of‐care measures for a given disease are often assumed to reflect the quality of care for that particular condition. However, studies have found limited association between condition‐specific process measures and either mortality or readmission rates for those conditions.46 Mortality and readmission rates may instead reflect broader hospital‐wide or specialty‐wide structure, culture, and practice. For example, studies have previously found that hospitals differ in mortality or readmission rates according to organizational structure,7 financial structure,8 culture,9, 10 information technology,11 patient volume,1214 academic status,12 and other institution‐wide factors.12 There is now a strong policy push towards developing hospital‐wide (all‐condition) measures, beginning with readmission.15
It is not clear how much of the quality of care for a given condition is attributable to hospital‐wide influences that affect all conditions rather than disease‐specific factors. If readmission or mortality performance for a particular condition reflects, in large part, broader institutional characteristics, then improvement efforts might better be focused on hospital‐wide activities, such as team training or implementing electronic medical records. On the other hand, if the disease‐specific measures reflect quality strictly for those conditions, then improvement efforts would be better focused on disease‐specific care, such as early identification of the relevant patient population or standardizing disease‐specific care. As hospitals work to improve performance across an increasingly wide variety of conditions, it is becoming more important for hospitals to prioritize and focus their activities effectively and efficiently.
One means of determining the relative contribution of hospital versus disease factors is to explore whether outcome rates are consistent among different conditions cared for in the same hospital. If mortality (or readmission) rates across different conditions are highly correlated, it would suggest that hospital‐wide factors may play a substantive role in outcomes. Some studies have found that mortality for a particular surgical condition is a useful proxy for mortality for other surgical conditions,16, 17 while other studies have found little correlation among mortality rates for various medical conditions.18, 19 It is also possible that correlation varies according to hospital characteristics; for example, smaller or nonteaching hospitals might be more homogenous in their care than larger, less homogeneous institutions. No studies have been performed using publicly reported estimates of risk‐standardized mortality or readmission rates. In this study we use the publicly reported measures of 30‐day mortality and 30‐day readmission for AMI, HF, and pneumonia to examine whether, and to what degree, mortality rates track together within US hospitals, and separately, to what degree readmission rates track together within US hospitals.
METHODS
Data Sources
CMS calculates risk‐standardized mortality and readmission rates, and patient volume, for all acute care nonfederal hospitals with one or more eligible case of AMI, HF, and pneumonia annually based on fee‐for‐service (FFS) Medicare claims. CMS publicly releases the rates for the large subset of hospitals that participate in public reporting and have 25 or more cases for the conditions over the 3‐year period between July 2006 and June 2009. We estimated the rates for all hospitals included in the measure calculations, including those with fewer than 25 cases, using the CMS methodology and data obtained from CMS. The distribution of these rates has been previously reported.20, 21 In addition, we used the 2008 American Hospital Association (AHA) Survey to obtain data about hospital characteristics, including number of beds, hospital ownership (government, not‐for‐profit, for‐profit), teaching status (member of Council of Teaching Hospitals, other teaching hospital, nonteaching), presence of specialized cardiac capabilities (coronary artery bypass graft surgery, cardiac catheterization lab without cardiac surgery, neither), US Census Bureau core‐based statistical area (division [subarea of area with urban center >2.5 million people], metropolitan [urban center of at least 50,000 people], micropolitan [urban center of between 10,000 and 50,000 people], and rural [<10,000 people]), and safety net status22 (yes/no). Safety net status was defined as either public hospitals or private hospitals with a Medicaid caseload greater than one standard deviation above their respective state's mean private hospital Medicaid caseload using the 2007 AHA Annual Survey data.
Study Sample
This study includes 2 hospital cohorts, 1 for mortality and 1 for readmission. Hospitals were eligible for the mortality cohort if the dataset included risk‐standardized mortality rates for all 3 conditions (AMI, HF, and pneumonia). Hospitals were eligible for the readmission cohort if the dataset included risk‐standardized readmission rates for all 3 of these conditions.
Risk‐Standardized Measures
The measures include all FFS Medicare patients who are 65 years old, have been enrolled in FFS Medicare for the 12 months before the index hospitalization, are admitted with 1 of the 3 qualifying diagnoses, and do not leave the hospital against medical advice. The mortality measures include all deaths within 30 days of admission, and all deaths are attributable to the initial admitting hospital, even if the patient is then transferred to another acute care facility. Therefore, for a given hospital, transfers into the hospital are excluded from its rate, but transfers out are included. The readmission measures include all readmissions within 30 days of discharge, and all readmissions are attributable to the final discharging hospital, even if the patient was originally admitted to a different acute care facility. Therefore, for a given hospital, transfers in are included in its rate, but transfers out are excluded. For mortality measures, only 1 hospitalization for a patient in a specific year is randomly selected if the patient has multiple hospitalizations in the year. For readmission measures, admissions in which the patient died prior to discharge, and admissions within 30 days of an index admission, are not counted as index admissions.
Outcomes for all measures are all‐cause; however, for the AMI readmission measure, planned admissions for cardiac procedures are not counted as readmissions. Patients in observation status or in non‐acute care facilities are not counted as readmissions. Detailed specifications for the outcomes measures are available at the National Quality Measures Clearinghouse.23
The derivation and validation of the risk‐standardized outcome measures have been previously reported.20, 21, 2327 The measures are derived from hierarchical logistic regression models that include age, sex, clinical covariates, and a hospital‐specific random effect. The rates are calculated as the ratio of the number of predicted outcomes (obtained from a model applying the hospital‐specific effect) to the number of expected outcomes (obtained from a model applying the average effect among hospitals), multiplied by the unadjusted overall 30‐day rate.
Statistical Analysis
We examined patterns and distributions of hospital volume, risk‐standardized mortality rates, and risk‐standardized readmission rates among included hospitals. To measure the degree of association among hospitals' risk‐standardized mortality rates for AMI, HF, and pneumonia, we calculated Pearson correlation coefficients, resulting in 3 correlations for the 3 pairs of conditions (AMI and HF, AMI and pneumonia, HF and pneumonia), and tested whether they were significantly different from 0. We also conducted a factor analysis using the principal component method with a minimum eigenvalue of 1 to retain factors to determine whether there was a single common factor underlying mortality performance for the 3 conditions.28 Finally, we divided hospitals into quartiles of performance for each outcome based on the point estimate of risk‐standardized rate, and compared quartile of performance between condition pairs for each outcome. For each condition pair, we assessed the percent of hospitals in the same quartile of performance in both conditions, the percent of hospitals in either the top quartile of performance or the bottom quartile of performance for both, and the percent of hospitals in the top quartile for one and the bottom quartile for the other. We calculated the weighted kappa for agreement on quartile of performance between condition pairs for each outcome and the Spearman correlation for quartiles of performance. Then, we examined Pearson correlation coefficients in different subgroups of hospitals, including by size, ownership, teaching status, cardiac procedure capability, statistical area, and safety net status. In order to determine whether these correlations differed by hospital characteristics, we tested if the Pearson correlation coefficients were different between any 2 subgroups using the method proposed by Fisher.29 We repeated all of these analyses separately for the risk‐standardized readmission rates.
To determine whether correlations between mortality rates were significantly different than correlations between readmission rates for any given condition pair, we used the method recommended by Raghunathan et al.30 For these analyses, we included only hospitals reporting both mortality and readmission rates for the condition pairs. We used the same methods to determine whether correlations between mortality rates were significantly different than correlations between readmission rates for any given condition pair among subgroups of hospital characteristics.
All analyses and graphing were performed using the SAS statistical package version 9.2 (SAS Institute, Cary, NC). We considered a P‐value < 0.05 to be statistically significant, and all statistical tests were 2‐tailed.
RESULTS
The mortality cohort included 4559 hospitals, and the readmission cohort included 4468 hospitals. The majority of hospitals was small, nonteaching, and did not have advanced cardiac capabilities such as cardiac surgery or cardiac catheterization (Table 1).
| Description | Mortality Measures | Readmission Measures |
|---|---|---|
| Hospital N = 4559 | Hospital N = 4468 | |
| N (%)* | N (%)* | |
| ||
| No. of beds | ||
| >600 | 157 (3.4) | 156 (3.5) |
| 300600 | 628 (13.8) | 626 (14.0) |
| <300 | 3588 (78.7) | 3505 (78.5) |
| Unknown | 186 (4.08) | 181 (4.1) |
| Mean (SD) | 173.24 (189.52) | 175.23 (190.00) |
| Ownership | ||
| Not‐for‐profit | 2650 (58.1) | 2619 (58.6) |
| For‐profit | 672 (14.7) | 663 (14.8) |
| Government | 1051 (23.1) | 1005 (22.5) |
| Unknown | 186 (4.1) | 181 (4.1) |
| Teaching status | ||
| COTH | 277 (6.1) | 276 (6.2) |
| Teaching | 505 (11.1) | 503 (11.3) |
| Nonteaching | 3591 (78.8) | 3508 (78.5) |
| Unknown | 186 (4.1) | 181 (4.1) |
| Cardiac facility type | ||
| CABG | 1471 (32.3) | 1467 (32.8) |
| Cath lab | 578 (12.7) | 578 (12.9) |
| Neither | 2324 (51.0) | 2242 (50.2) |
| Unknown | 186 (4.1) | 181 (4.1) |
| Core‐based statistical area | ||
| Division | 621 (13.6) | 618 (13.8) |
| Metro | 1850 (40.6) | 1835 (41.1) |
| Micro | 801 (17.6) | 788 (17.6) |
| Rural | 1101 (24.2) | 1046 (23.4) |
| Unknown | 186 (4.1) | 181 (4.1) |
| Safety net status | ||
| No | 2995 (65.7) | 2967 (66.4) |
| Yes | 1377 (30.2) | 1319 (29.5) |
| Unknown | 187 (4.1) | 182 (4.1) |
For mortality measures, the smallest median number of cases per hospital was for AMI (48; interquartile range [IQR], 13,171), and the greatest number was for pneumonia (178; IQR, 87, 336). The same pattern held for readmission measures (AMI median 33; IQR; 9, 150; pneumonia median 191; IQR, 95, 352.5). With respect to mortality measures, AMI had the highest rate and HF the lowest rate; however, for readmission measures, HF had the highest rate and pneumonia the lowest rate (Table 2).
| Description | Mortality Measures (N = 4559) | Readmission Measures (N = 4468) | ||||
|---|---|---|---|---|---|---|
| AMI | HF | PN | AMI | HF | PN | |
| ||||||
| Total discharges | 558,653 | 1,094,960 | 1,114,706 | 546,514 | 1,314,394 | 1,152,708 |
| Hospital volume | ||||||
| Mean (SD) | 122.54 (172.52) | 240.18 (271.35) | 244.51 (220.74) | 122.32 (201.78) | 294.18 (333.2) | 257.99 (228.5) |
| Median (IQR) | 48 (13, 171) | 142 (56, 337) | 178 (87, 336) | 33 (9, 150) | 172.5 (68, 407) | 191 (95, 352.5) |
| Range min, max | 1, 1379 | 1, 2814 | 1, 2241 | 1, 1611 | 1, 3410 | 2, 2359 |
| 30‐Day risk‐standardized rate* | ||||||
| Mean (SD) | 15.7 (1.8) | 10.9 (1.6) | 11.5 (1.9) | 19.9 (1.5) | 24.8 (2.1) | 18.5 (1.7) |
| Median (IQR) | 15.7 (14.5, 16.8) | 10.8 (9.9, 11.9) | 11.3 (10.2, 12.6) | 19.9 (18.9, 20.8) | 24.7 (23.4, 26.1) | 18.4 (17.3, 19.5) |
| Range min, max | 10.3, 24.6 | 6.6, 18.2 | 6.7, 20.9 | 15.2, 26.3 | 17.3, 32.4 | 13.6, 26.7 |
Every mortality measure was significantly correlated with every other mortality measure (range of correlation coefficients, 0.270.41, P < 0.0001 for all 3 correlations). For example, the correlation between risk‐standardized mortality rates (RSMR) for HF and pneumonia was 0.41. Similarly, every readmission measure was significantly correlated with every other readmission measure (range of correlation coefficients, 0.320.47; P < 0.0001 for all 3 correlations). Overall, the lowest correlation was between risk‐standardized mortality rates for AMI and pneumonia (r = 0.27), and the highest correlation was between risk‐standardized readmission rates (RSRR) for HF and pneumonia (r = 0.47) (Table 3).
| Description | Mortality Measures | Readmission Measures | ||||||||||||
|---|---|---|---|---|---|---|---|---|---|---|---|---|---|---|
| N | AMI and HF | AMI and PN | HF and PN | AMI and HF | AMI and PN | HF and PN | ||||||||
| r | P | r | P | r | P | N | r | P | r | P | r | P | ||
| ||||||||||||||
| All | 4559 | 0.30 | 0.27 | 0.41 | 4468 | 0.38 | 0.32 | 0.47 | ||||||
| Hospitals with 25 patients | 2872 | 0.33 | 0.30 | 0.44 | 2467 | 0.44 | 0.38 | 0.51 | ||||||
| No. of beds | 0.15 | 0.005 | 0.0009 | <0.0001 | <0.0001 | <0.0001 | ||||||||
| >600 | 157 | 0.38 | 0.43 | 0.51 | 156 | 0.67 | 0.50 | 0.66 | ||||||
| 300600 | 628 | 0.29 | 0.30 | 0.49 | 626 | 0.54 | 0.45 | 0.58 | ||||||
| <300 | 3588 | 0.27 | 0.23 | 0.37 | 3505 | 0.30 | 0.26 | 0.44 | ||||||
| Ownership | 0.021 | 0.05 | 0.39 | 0.0004 | 0.0004 | 0.003 | ||||||||
| Not‐for‐profit | 2650 | 0.32 | 0.28 | 0.42 | 2619 | 0.43 | 0.36 | 0.50 | ||||||
| For‐profit | 672 | 0.30 | 0.23 | 0.40 | 663 | 0.29 | 0.22 | 0.40 | ||||||
| Government | 1051 | 0.24 | 0.22 | 0.39 | 1005 | 0.32 | 0.29 | 0.45 | ||||||
| Teaching status | 0.11 | 0.08 | 0.0012 | <0.0001 | 0.0002 | 0.0003 | ||||||||
| COTH | 277 | 0.31 | 0.34 | 0.54 | 276 | 0.54 | 0.47 | 0.59 | ||||||
| Teaching | 505 | 0.22 | 0.28 | 0.43 | 503 | 0.52 | 0.42 | 0.56 | ||||||
| Nonteaching | 3591 | 0.29 | 0.24 | 0.39 | 3508 | 0.32 | 0.26 | 0.44 | ||||||
| Cardiac facility type | 0.022 | 0.006 | <0.0001 | <0.0001 | 0.0006 | 0.004 | ||||||||
| CABG | 1471 | 0.33 | 0.29 | 0.47 | 1467 | 0.48 | 0.37 | 0.52 | ||||||
| Cath lab | 578 | 0.25 | 0.26 | 0.36 | 578 | 0.32 | 0.37 | 0.47 | ||||||
| Neither | 2324 | 0.26 | 0.21 | 0.36 | 2242 | 0.28 | 0.27 | 0.44 | ||||||
| Core‐based statistical area | 0.0001 | <0.0001 | 0.002 | <0.0001 | <0.0001 | <0.0001 | ||||||||
| Division | 621 | 0.38 | 0.34 | 0.41 | 618 | 0.46 | 0.40 | 0.56 | ||||||
| Metro | 1850 | 0.26 | 0.26 | 0.42 | 1835 | 0.38 | 0.30 | 0.40 | ||||||
| Micro | 801 | 0.23 | 0.22 | 0.34 | 788 | 0.32 | 0.30 | 0.47 | ||||||
| Rural | 1101 | 0.21 | 0.13 | 0.32 | 1046 | 0.22 | 0.21 | 0.44 | ||||||
| Safety net status | 0.001 | 0.027 | 0.68 | 0.029 | 0.037 | 0.28 | ||||||||
| No | 2995 | 0.33 | 0.28 | 0.41 | 2967 | 0.40 | 0.33 | 0.48 | ||||||
| Yes | 1377 | 0.23 | 0.21 | 0.40 | 1319 | 0.34 | 0.30 | 0.45 | ||||||
Both the factor analysis for the mortality measures and the factor analysis for the readmission measures yielded only one factor with an eigenvalue >1. In each factor analysis, this single common factor kept more than half of the data based on the cumulative eigenvalue (55% for mortality measures and 60% for readmission measures). For the mortality measures, the pattern of RSMR for myocardial infarction (MI), heart failure (HF), and pneumonia (PN) in the factor was high (0.68 for MI, 0.78 for HF, and 0.76 for PN); the same was true of the RSRR in the readmission measures (0.72 for MI, 0.81 for HF, and 0.78 for PN).
For all condition pairs and both outcomes, a third or more of hospitals were in the same quartile of performance for both conditions of the pair (Table 4). Hospitals were more likely to be in the same quartile of performance if they were in the top or bottom quartile than if they were in the middle. Less than 10% of hospitals were in the top quartile for one condition in the mortality or readmission pair and in the bottom quartile for the other condition in the pair. Kappa scores for same quartile of performance between pairs of outcomes ranged from 0.16 to 0.27, and were highest for HF and pneumonia for both mortality and readmission rates.
| Condition Pair | Same Quartile (Any) (%) | Same Quartile (Q1 or Q4) (%) | Q1 in One and Q4 in Another (%) | Weighted Kappa | Spearman Correlation |
|---|---|---|---|---|---|
| |||||
| Mortality | |||||
| MI and HF | 34.8 | 20.2 | 7.9 | 0.19 | 0.25 |
| MI and PN | 32.7 | 18.8 | 8.2 | 0.16 | 0.22 |
| HF and PN | 35.9 | 21.8 | 5.0 | 0.26 | 0.36 |
| Readmission | |||||
| MI and HF | 36.6 | 21.0 | 7.5 | 0.22 | 0.28 |
| MI and PN | 34.0 | 19.6 | 8.1 | 0.19 | 0.24 |
| HF and PN | 37.1 | 22.6 | 5.4 | 0.27 | 0.37 |
In subgroup analyses, the highest mortality correlation was between HF and pneumonia in hospitals with more than 600 beds (r = 0.51, P = 0.0009), and the highest readmission correlation was between AMI and HF in hospitals with more than 600 beds (r = 0.67, P < 0.0001). Across both measures and all 3 condition pairs, correlations between conditions increased with increasing hospital bed size, presence of cardiac surgery capability, and increasing population of the hospital's Census Bureau statistical area. Furthermore, for most measures and condition pairs, correlations between conditions were highest in not‐for‐profit hospitals, hospitals belonging to the Council of Teaching Hospitals, and non‐safety net hospitals (Table 3).
For all condition pairs, the correlation between readmission rates was significantly higher than the correlation between mortality rates (P < 0.01). In subgroup analyses, readmission correlations were also significantly higher than mortality correlations for all pairs of conditions among moderate‐sized hospitals, among nonprofit hospitals, among teaching hospitals that did not belong to the Council of Teaching Hospitals, and among non‐safety net hospitals (Table 5).
| Description | AMI and HF | AMI and PN | HF and PN | |||||||||
|---|---|---|---|---|---|---|---|---|---|---|---|---|
| N | MC | RC | P | N | MC | RC | P | N | MC | RC | P | |
| ||||||||||||
| All | 4457 | 0.31 | 0.38 | <0.0001 | 4459 | 0.27 | 0.32 | 0.007 | 4731 | 0.41 | 0.46 | 0.0004 |
| Hospitals with 25 patients | 2472 | 0.33 | 0.44 | <0.001 | 2463 | 0.31 | 0.38 | 0.01 | 4104 | 0.42 | 0.47 | 0.001 |
| No. of beds | ||||||||||||
| >600 | 156 | 0.38 | 0.67 | 0.0002 | 156 | 0.43 | 0.50 | 0.48 | 160 | 0.51 | 0.66 | 0.042 |
| 300600 | 626 | 0.29 | 0.54 | <0.0001 | 626 | 0.31 | 0.45 | 0.003 | 630 | 0.49 | 0.58 | 0.033 |
| <300 | 3494 | 0.28 | 0.30 | 0.21 | 3496 | 0.23 | 0.26 | 0.17 | 3733 | 0.37 | 0.43 | 0.003 |
| Ownership | ||||||||||||
| Not‐for‐profit | 2614 | 0.32 | 0.43 | <0.0001 | 2617 | 0.28 | 0.36 | 0.003 | 2697 | 0.42 | 0.50 | 0.0003 |
| For‐profit | 662 | 0.30 | 0.29 | 0.90 | 661 | 0.23 | 0.22 | 0.75 | 699 | 0.40 | 0.40 | 0.99 |
| Government | 1000 | 0.25 | 0.32 | 0.09 | 1000 | 0.22 | 0.29 | 0.09 | 1127 | 0.39 | 0.43 | 0.21 |
| Teaching status | ||||||||||||
| COTH | 276 | 0.31 | 0.54 | 0.001 | 277 | 0.35 | 0.46 | 0.10 | 278 | 0.54 | 0.59 | 0.41 |
| Teaching | 504 | 0.22 | 0.52 | <0.0001 | 504 | 0.28 | 0.42 | 0.012 | 508 | 0.43 | 0.56 | 0.005 |
| Nonteaching | 3496 | 0.29 | 0.32 | 0.18 | 3497 | 0.24 | 0.26 | 0.46 | 3737 | 0.39 | 0.43 | 0.016 |
| Cardiac facility type | ||||||||||||
| CABG | 1465 | 0.33 | 0.48 | <0.0001 | 1467 | 0.30 | 0.37 | 0.018 | 1483 | 0.47 | 0.51 | 0.103 |
| Cath lab | 577 | 0.25 | 0.32 | 0.18 | 577 | 0.26 | 0.37 | 0.046 | 579 | 0.36 | 0.47 | 0.022 |
| Neither | 2234 | 0.26 | 0.28 | 0.48 | 2234 | 0.21 | 0.27 | 0.037 | 2461 | 0.36 | 0.44 | 0.002 |
| Core‐based statistical area | ||||||||||||
| Division | 618 | 0.38 | 0.46 | 0.09 | 620 | 0.34 | 0.40 | 0.18 | 630 | 0.41 | 0.56 | 0.001 |
| Metro | 1833 | 0.26 | 0.38 | <0.0001 | 1832 | 0.26 | 0.30 | 0.21 | 1896 | 0.42 | 0.40 | 0.63 |
| Micro | 787 | 0.24 | 0.32 | 0.08 | 787 | 0.22 | 0.30 | 0.11 | 820 | 0.34 | 0.46 | 0.003 |
| Rural | 1038 | 0.21 | 0.22 | 0.83 | 1039 | 0.13 | 0.21 | 0.056 | 1177 | 0.32 | 0.43 | 0.002 |
| Safety net status | ||||||||||||
| No | 2961 | 0.33 | 0.40 | 0.001 | 2963 | 0.28 | 0.33 | 0.036 | 3062 | 0.41 | 0.48 | 0.001 |
| Yes | 1314 | 0.23 | 0.34 | 0.003 | 1314 | 0.22 | 0.30 | 0.015 | 1460 | 0.40 | 0.45 | 0.14 |
DISCUSSION
In this study, we found that risk‐standardized mortality rates for 3 common medical conditions were moderately correlated within institutions, as were risk‐standardized readmission rates. Readmission rates were more strongly correlated than mortality rates, and all rates tracked closest together in large, urban, and/or teaching hospitals. Very few hospitals were in the top quartile of performance for one condition and in the bottom quartile for a different condition.
Our findings are consistent with the hypothesis that 30‐day risk‐standardized mortality and 30‐day risk‐standardized readmission rates, in part, capture broad aspects of hospital quality that transcend condition‐specific activities. In this study, readmission rates tracked better together than mortality rates for every pair of conditions, suggesting that there may be a greater contribution of hospital‐wide environment, structure, and processes to readmission rates than to mortality rates. This difference is plausible because services specific to readmission, such as discharge planning, care coordination, medication reconciliation, and discharge communication with patients and outpatient clinicians, are typically hospital‐wide processes.
Our study differs from earlier studies of medical conditions in that the correlations we found were higher.18, 19 There are several possible explanations for this difference. First, during the intervening 1525 years since those studies were performed, care for these conditions has evolved substantially, such that there are now more standardized protocols available for all 3 of these diseases. Hospitals that are sufficiently organized or acculturated to systematically implement care protocols may have the infrastructure or culture to do so for all conditions, increasing correlation of performance among conditions. In addition, there are now more technologies and systems available that span care for multiple conditions, such as electronic medical records and quality committees, than were available in previous generations. Second, one of these studies utilized less robust risk‐adjustment,18 and neither used the same methodology of risk standardization. Nonetheless, it is interesting to note that Rosenthal and colleagues identified the same increase in correlation with higher volumes than we did.19 Studies investigating mortality correlations among surgical procedures, on the other hand, have generally found higher correlations than we found in these medical conditions.16, 17
Accountable care organizations will be assessed using an all‐condition readmission measure,31 several states track all‐condition readmission rates,3234 and several countries measure all‐condition mortality.35 An all‐condition measure for quality assessment first requires that there be a hospital‐wide quality signal above and beyond disease‐specific care. This study suggests that a moderate signal exists for readmission and, to a slightly lesser extent, for mortality, across 3 common conditions. There are other considerations, however, in developing all‐condition measures. There must be adequate risk adjustment for the wide variety of conditions that are included, and there must be a means of accounting for the variation in types of conditions and procedures cared for by different hospitals. Our study does not address these challenges, which have been described to be substantial for mortality measures.35
We were surprised by the finding that risk‐standardized rates correlated more strongly within larger institutions than smaller ones, because one might assume that care within smaller hospitals might be more homogenous. It may be easier, however, to detect a quality signal in hospitals with higher volumes of patients for all 3 conditions, because estimates for these hospitals are more precise. Consequently, we have greater confidence in results for larger volumes, and suspect a similar quality signal may be present but more difficult to detect statistically in smaller hospitals. Overall correlations were higher when we restricted the sample to hospitals with at least 25 cases, as is used for public reporting. It is also possible that the finding is real given that large‐volume hospitals have been demonstrated to provide better care for these conditions and are more likely to adopt systems of care that affect multiple conditions, such as electronic medical records.14, 36
The kappa scores comparing quartile of national performance for pairs of conditions were only in the fair range. There are several possible explanations for this fact: 1) outcomes for these 3 conditions are not measuring the same constructs; 2) they are all measuring the same construct, but they are unreliable in doing so; and/or 3) hospitals have similar latent quality for all 3 conditions, but the national quality of performance differs by condition, yielding variable relative performance per hospital for each condition. Based solely on our findings, we cannot distinguish which, if any, of these explanations may be true.31
Our study has several limitations. First, all 3 conditions currently publicly reported by CMS are medical diagnoses, although AMI patients may be cared for in distinct cardiology units and often undergo procedures; therefore, we cannot determine the degree to which correlations reflect hospital‐wide quality versus medicine‐wide quality. An institution may have a weak medicine department but a strong surgical department or vice versa. Second, it is possible that the correlations among conditions for readmission and among conditions for mortality are attributable to patient characteristics that are not adequately adjusted for in the risk‐adjustment model, such as socioeconomic factors, or to hospital characteristics not related to quality, such as coding practices or inter‐hospital transfer rates. For this to be true, these unmeasured characteristics would have to be consistent across different conditions within each hospital and have a consistent influence on outcomes. Third, it is possible that public reporting may have prompted disease‐specific focus on these conditions. We do not have data from non‐publicly reported conditions to test this hypothesis. Fourth, there are many small‐volume hospitals in this study; their estimates for readmission and mortality are less reliable than for large‐volume hospitals, potentially limiting our ability to detect correlations in this group of hospitals.
This study lends credence to the hypothesis that 30‐day risk‐standardized mortality and readmission rates for individual conditions may reflect aspects of hospital‐wide quality or at least medicine‐wide quality, although the correlations are not large enough to conclude that hospital‐wide factors play a dominant role, and there are other possible explanations for the correlations. Further work is warranted to better understand the causes of the correlations, and to better specify the nature of hospital factors that contribute to correlations among outcomes.
Acknowledgements
Disclosures: Dr Horwitz is supported by the National Institute on Aging (K08 AG038336) and by the American Federation of Aging Research through the Paul B. Beeson Career Development Award Program. Dr Horwitz is also a Pepper Scholar with support from the Claude D. Pepper Older Americans Independence Center at Yale University School of Medicine (P30 AG021342 NIH/NIA). Dr Krumholz is supported by grant U01 HL105270‐01 (Center for Cardiovascular Outcomes Research at Yale University) from the National Heart, Lung, and Blood Institute. Dr Krumholz chairs a cardiac scientific advisory board for UnitedHealth. Authors Drye, Krumholz, and Wang receive support from the Centers for Medicare & Medicaid Services (CMS) to develop and maintain performance measures that are used for public reporting. The analyses upon which this publication is based were performed under Contract Number HHSM‐500‐2008‐0025I Task Order T0001, entitled Measure & Instrument Development and Support (MIDS)Development and Re‐evaluation of the CMS Hospital Outcomes and Efficiency Measures, funded by the Centers for Medicare & Medicaid Services, an agency of the US Department of Health and Human Services. The Centers for Medicare & Medicaid Services reviewed and approved the use of its data for this work, and approved submission of the manuscript. The content of this publication does not necessarily reflect the views or policies of the Department of Health and Human Services, nor does mention of trade names, commercial products, or organizations imply endorsement by the US Government. The authors assume full responsibility for the accuracy and completeness of the ideas presented.
- US Department of Health and Human Services. Hospital Compare.2011. Available at: http://www.hospitalcompare.hhs.gov. Accessed March 5, 2011.
- ,,.Early readmissions to the department of medicine as a screening tool for monitoring quality of care problems.Medicine (Baltimore).2008;87(5):294–300.
- ,,,,.Hospital inpatient mortality. Is it a predictor of quality?N Engl J Med.1987;317(26):1674–1680.
- ,.Relationship between Medicare's hospital compare performance measures and mortality rates.JAMA.2006;296(22):2694–2702.
- ,,.Public reporting of discharge planning and rates of readmissions.N Engl J Med.2009;361(27):2637–2645.
- ,,, et al.Process of care performance measures and long‐term outcomes in patients hospitalized with heart failure.Med Care.2010;48(3):210–216.
- ,,,,,.Variations in inpatient mortality among hospitals in different system types, 1995 to 2000.Med Care.2009;47(4):466–473.
- ,,, et al.A systematic review and meta‐analysis of studies comparing mortality rates of private for‐profit and private not‐for‐profit hospitals.Can Med Assoc J.2002;166(11):1399–1406.
- ,,, et al.What distinguishes top‐performing hospitals in acute myocardial infarction mortality rates? A qualitative study.Ann Intern Med.2011;154(6):384–390.
- ,,.Perceptions of hospital safety climate and incidence of readmission.Health Serv Res.2011;46(2):596–616.
- ,,, et al.Decrease in hospital‐wide mortality rate after implementation of a commercially sold computerized physician order entry system.Pediatrics.2010;126(1):14–21.
- ,,.The condition of the literature on differences in hospital mortality.Med Care.1989;27(4):315–336.
- ,,.Threshold volumes associated with higher survival in health care: a systematic review.Med Care.2003;41(10):1129–1141.
- ,,, et al.Hospital volume and 30‐day mortality for three common medical conditions.N Engl J Med.2010;362(12):1110–1118.
- Patient Protection and Affordable Care Act Pub. L. No. 111–148, 124 Stat, §3025.2010. Available at: http://www.gpo.gov/fdsys/pkg/PLAW‐111publ148/content‐detail.html. Accessed on July 26, year="2012"2012.
- ,,.Are mortality rates for different operations related? Implications for measuring the quality of noncardiac surgery.Med Care.2006;44(8):774–778.
- ,,,.Do hospitals with low mortality rates in coronary artery bypass also perform well in valve replacement?Ann Thorac Surg.2003;76(4):1131–1137.
- ,,,,.Differences among hospitals in Medicare patient mortality.Health Serv Res.1989;24(1):1–31.
- ,,,.Variations in standardized hospital mortality rates for six common medical diagnoses: implications for profiling hospital quality.Med Care.1998;36(7):955–964.
- ,,, et al.Development, validation, and results of a measure of 30‐day readmission following hospitalization for pneumonia.J Hosp Med.2011;6(3):142–150.
- ,,, et al.An administrative claims measure suitable for profiling hospital performance on the basis of 30‐day all‐cause readmission rates among patients with heart failure.Circ Cardiovasc Qual Outcomes.2008;1:29–37.
- ,,, et al.Quality of care for acute myocardial infarction at urban safety‐net hospitals.Health Aff (Millwood).2007;26(1):238–248.
- National Quality Measures Clearinghouse.2011. Available at: http://www.qualitymeasures.ahrq.gov/. Accessed February 21,year="2011"2011.
- ,,, et al.An administrative claims model suitable for profiling hospital performance based on 30‐day mortality rates among patients with an acute myocardial infarction.Circulation.2006;113(13):1683–1692.
- ,,, et al.An administrative claims model suitable for profiling hospital performance based on 30‐day mortality rates among patients with heart failure.Circulation.2006;113(13):1693–1701.
- ,,, et al.An administrative claims model for profiling hospital 30‐day mortality rates for pneumonia patients.PLoS One.2011;6(4):e17401.
- ,,, et al.An administrative claims measure suitable for profiling hospital performance based on 30‐day all‐cause readmission rates among patients with acute myocardial infarction.Circ Cardiovasc Qual Outcomes.2011;4(2):243–252.
- .The application of electronic computers to factor analysis.Educ Psychol Meas.1960;20:141–151.
- .On the ‘probable error’ of a coefficient of correlation deduced from a small sample.Metron.1921;1:3–32.
- ,,.Comparing correlated but nonoverlapping correlations.Psychol Methods.1996;1(2):178–183.
- Centers for Medicare and Medicaid Services.Medicare Shared Savings Program: Accountable Care Organizations, Final Rule.Fed Reg.2011;76:67802–67990.
- Massachusetts Healthcare Quality and Cost Council. Potentially Preventable Readmissions.2011. Available at: http://www.mass.gov/hqcc/the‐hcqcc‐council/data‐submission‐information/potentially‐preventable‐readmissions‐ppr.html. Accessed February 29, 2012.
- Texas Medicaid. Potentially Preventable Readmission (PPR).2012. Available at: http://www.tmhp.com/Pages/Medicaid/Hospital_PPR.aspx. Accessed February 29, 2012.
- New York State. Potentially Preventable Readmissions.2011. Available at: http://www.health.ny.gov/regulations/recently_adopted/docs/2011–02‐23_potentially_preventable_readmissions.pdf. Accessed February 29, 2012.
- ,,,,.Variability in the measurement of hospital‐wide mortality rates.N Engl J Med.2010;363(26):2530–2539.
- ,,, et al.Use of electronic health records in U.S. hospitals.N Engl J Med.2009;360(16):1628–1638.
The Centers for Medicare & Medicaid Services (CMS) publicly reports hospital‐specific, 30‐day risk‐standardized mortality and readmission rates for Medicare fee‐for‐service patients admitted with acute myocardial infarction (AMI), heart failure (HF), and pneumonia.1 These measures are intended to reflect hospital performance on quality of care provided to patients during and after hospitalization.2, 3
Quality‐of‐care measures for a given disease are often assumed to reflect the quality of care for that particular condition. However, studies have found limited association between condition‐specific process measures and either mortality or readmission rates for those conditions.46 Mortality and readmission rates may instead reflect broader hospital‐wide or specialty‐wide structure, culture, and practice. For example, studies have previously found that hospitals differ in mortality or readmission rates according to organizational structure,7 financial structure,8 culture,9, 10 information technology,11 patient volume,1214 academic status,12 and other institution‐wide factors.12 There is now a strong policy push towards developing hospital‐wide (all‐condition) measures, beginning with readmission.15
It is not clear how much of the quality of care for a given condition is attributable to hospital‐wide influences that affect all conditions rather than disease‐specific factors. If readmission or mortality performance for a particular condition reflects, in large part, broader institutional characteristics, then improvement efforts might better be focused on hospital‐wide activities, such as team training or implementing electronic medical records. On the other hand, if the disease‐specific measures reflect quality strictly for those conditions, then improvement efforts would be better focused on disease‐specific care, such as early identification of the relevant patient population or standardizing disease‐specific care. As hospitals work to improve performance across an increasingly wide variety of conditions, it is becoming more important for hospitals to prioritize and focus their activities effectively and efficiently.
One means of determining the relative contribution of hospital versus disease factors is to explore whether outcome rates are consistent among different conditions cared for in the same hospital. If mortality (or readmission) rates across different conditions are highly correlated, it would suggest that hospital‐wide factors may play a substantive role in outcomes. Some studies have found that mortality for a particular surgical condition is a useful proxy for mortality for other surgical conditions,16, 17 while other studies have found little correlation among mortality rates for various medical conditions.18, 19 It is also possible that correlation varies according to hospital characteristics; for example, smaller or nonteaching hospitals might be more homogenous in their care than larger, less homogeneous institutions. No studies have been performed using publicly reported estimates of risk‐standardized mortality or readmission rates. In this study we use the publicly reported measures of 30‐day mortality and 30‐day readmission for AMI, HF, and pneumonia to examine whether, and to what degree, mortality rates track together within US hospitals, and separately, to what degree readmission rates track together within US hospitals.
METHODS
Data Sources
CMS calculates risk‐standardized mortality and readmission rates, and patient volume, for all acute care nonfederal hospitals with one or more eligible case of AMI, HF, and pneumonia annually based on fee‐for‐service (FFS) Medicare claims. CMS publicly releases the rates for the large subset of hospitals that participate in public reporting and have 25 or more cases for the conditions over the 3‐year period between July 2006 and June 2009. We estimated the rates for all hospitals included in the measure calculations, including those with fewer than 25 cases, using the CMS methodology and data obtained from CMS. The distribution of these rates has been previously reported.20, 21 In addition, we used the 2008 American Hospital Association (AHA) Survey to obtain data about hospital characteristics, including number of beds, hospital ownership (government, not‐for‐profit, for‐profit), teaching status (member of Council of Teaching Hospitals, other teaching hospital, nonteaching), presence of specialized cardiac capabilities (coronary artery bypass graft surgery, cardiac catheterization lab without cardiac surgery, neither), US Census Bureau core‐based statistical area (division [subarea of area with urban center >2.5 million people], metropolitan [urban center of at least 50,000 people], micropolitan [urban center of between 10,000 and 50,000 people], and rural [<10,000 people]), and safety net status22 (yes/no). Safety net status was defined as either public hospitals or private hospitals with a Medicaid caseload greater than one standard deviation above their respective state's mean private hospital Medicaid caseload using the 2007 AHA Annual Survey data.
Study Sample
This study includes 2 hospital cohorts, 1 for mortality and 1 for readmission. Hospitals were eligible for the mortality cohort if the dataset included risk‐standardized mortality rates for all 3 conditions (AMI, HF, and pneumonia). Hospitals were eligible for the readmission cohort if the dataset included risk‐standardized readmission rates for all 3 of these conditions.
Risk‐Standardized Measures
The measures include all FFS Medicare patients who are 65 years old, have been enrolled in FFS Medicare for the 12 months before the index hospitalization, are admitted with 1 of the 3 qualifying diagnoses, and do not leave the hospital against medical advice. The mortality measures include all deaths within 30 days of admission, and all deaths are attributable to the initial admitting hospital, even if the patient is then transferred to another acute care facility. Therefore, for a given hospital, transfers into the hospital are excluded from its rate, but transfers out are included. The readmission measures include all readmissions within 30 days of discharge, and all readmissions are attributable to the final discharging hospital, even if the patient was originally admitted to a different acute care facility. Therefore, for a given hospital, transfers in are included in its rate, but transfers out are excluded. For mortality measures, only 1 hospitalization for a patient in a specific year is randomly selected if the patient has multiple hospitalizations in the year. For readmission measures, admissions in which the patient died prior to discharge, and admissions within 30 days of an index admission, are not counted as index admissions.
Outcomes for all measures are all‐cause; however, for the AMI readmission measure, planned admissions for cardiac procedures are not counted as readmissions. Patients in observation status or in non‐acute care facilities are not counted as readmissions. Detailed specifications for the outcomes measures are available at the National Quality Measures Clearinghouse.23
The derivation and validation of the risk‐standardized outcome measures have been previously reported.20, 21, 2327 The measures are derived from hierarchical logistic regression models that include age, sex, clinical covariates, and a hospital‐specific random effect. The rates are calculated as the ratio of the number of predicted outcomes (obtained from a model applying the hospital‐specific effect) to the number of expected outcomes (obtained from a model applying the average effect among hospitals), multiplied by the unadjusted overall 30‐day rate.
Statistical Analysis
We examined patterns and distributions of hospital volume, risk‐standardized mortality rates, and risk‐standardized readmission rates among included hospitals. To measure the degree of association among hospitals' risk‐standardized mortality rates for AMI, HF, and pneumonia, we calculated Pearson correlation coefficients, resulting in 3 correlations for the 3 pairs of conditions (AMI and HF, AMI and pneumonia, HF and pneumonia), and tested whether they were significantly different from 0. We also conducted a factor analysis using the principal component method with a minimum eigenvalue of 1 to retain factors to determine whether there was a single common factor underlying mortality performance for the 3 conditions.28 Finally, we divided hospitals into quartiles of performance for each outcome based on the point estimate of risk‐standardized rate, and compared quartile of performance between condition pairs for each outcome. For each condition pair, we assessed the percent of hospitals in the same quartile of performance in both conditions, the percent of hospitals in either the top quartile of performance or the bottom quartile of performance for both, and the percent of hospitals in the top quartile for one and the bottom quartile for the other. We calculated the weighted kappa for agreement on quartile of performance between condition pairs for each outcome and the Spearman correlation for quartiles of performance. Then, we examined Pearson correlation coefficients in different subgroups of hospitals, including by size, ownership, teaching status, cardiac procedure capability, statistical area, and safety net status. In order to determine whether these correlations differed by hospital characteristics, we tested if the Pearson correlation coefficients were different between any 2 subgroups using the method proposed by Fisher.29 We repeated all of these analyses separately for the risk‐standardized readmission rates.
To determine whether correlations between mortality rates were significantly different than correlations between readmission rates for any given condition pair, we used the method recommended by Raghunathan et al.30 For these analyses, we included only hospitals reporting both mortality and readmission rates for the condition pairs. We used the same methods to determine whether correlations between mortality rates were significantly different than correlations between readmission rates for any given condition pair among subgroups of hospital characteristics.
All analyses and graphing were performed using the SAS statistical package version 9.2 (SAS Institute, Cary, NC). We considered a P‐value < 0.05 to be statistically significant, and all statistical tests were 2‐tailed.
RESULTS
The mortality cohort included 4559 hospitals, and the readmission cohort included 4468 hospitals. The majority of hospitals was small, nonteaching, and did not have advanced cardiac capabilities such as cardiac surgery or cardiac catheterization (Table 1).
| Description | Mortality Measures | Readmission Measures |
|---|---|---|
| Hospital N = 4559 | Hospital N = 4468 | |
| N (%)* | N (%)* | |
| ||
| No. of beds | ||
| >600 | 157 (3.4) | 156 (3.5) |
| 300600 | 628 (13.8) | 626 (14.0) |
| <300 | 3588 (78.7) | 3505 (78.5) |
| Unknown | 186 (4.08) | 181 (4.1) |
| Mean (SD) | 173.24 (189.52) | 175.23 (190.00) |
| Ownership | ||
| Not‐for‐profit | 2650 (58.1) | 2619 (58.6) |
| For‐profit | 672 (14.7) | 663 (14.8) |
| Government | 1051 (23.1) | 1005 (22.5) |
| Unknown | 186 (4.1) | 181 (4.1) |
| Teaching status | ||
| COTH | 277 (6.1) | 276 (6.2) |
| Teaching | 505 (11.1) | 503 (11.3) |
| Nonteaching | 3591 (78.8) | 3508 (78.5) |
| Unknown | 186 (4.1) | 181 (4.1) |
| Cardiac facility type | ||
| CABG | 1471 (32.3) | 1467 (32.8) |
| Cath lab | 578 (12.7) | 578 (12.9) |
| Neither | 2324 (51.0) | 2242 (50.2) |
| Unknown | 186 (4.1) | 181 (4.1) |
| Core‐based statistical area | ||
| Division | 621 (13.6) | 618 (13.8) |
| Metro | 1850 (40.6) | 1835 (41.1) |
| Micro | 801 (17.6) | 788 (17.6) |
| Rural | 1101 (24.2) | 1046 (23.4) |
| Unknown | 186 (4.1) | 181 (4.1) |
| Safety net status | ||
| No | 2995 (65.7) | 2967 (66.4) |
| Yes | 1377 (30.2) | 1319 (29.5) |
| Unknown | 187 (4.1) | 182 (4.1) |
For mortality measures, the smallest median number of cases per hospital was for AMI (48; interquartile range [IQR], 13,171), and the greatest number was for pneumonia (178; IQR, 87, 336). The same pattern held for readmission measures (AMI median 33; IQR; 9, 150; pneumonia median 191; IQR, 95, 352.5). With respect to mortality measures, AMI had the highest rate and HF the lowest rate; however, for readmission measures, HF had the highest rate and pneumonia the lowest rate (Table 2).
| Description | Mortality Measures (N = 4559) | Readmission Measures (N = 4468) | ||||
|---|---|---|---|---|---|---|
| AMI | HF | PN | AMI | HF | PN | |
| ||||||
| Total discharges | 558,653 | 1,094,960 | 1,114,706 | 546,514 | 1,314,394 | 1,152,708 |
| Hospital volume | ||||||
| Mean (SD) | 122.54 (172.52) | 240.18 (271.35) | 244.51 (220.74) | 122.32 (201.78) | 294.18 (333.2) | 257.99 (228.5) |
| Median (IQR) | 48 (13, 171) | 142 (56, 337) | 178 (87, 336) | 33 (9, 150) | 172.5 (68, 407) | 191 (95, 352.5) |
| Range min, max | 1, 1379 | 1, 2814 | 1, 2241 | 1, 1611 | 1, 3410 | 2, 2359 |
| 30‐Day risk‐standardized rate* | ||||||
| Mean (SD) | 15.7 (1.8) | 10.9 (1.6) | 11.5 (1.9) | 19.9 (1.5) | 24.8 (2.1) | 18.5 (1.7) |
| Median (IQR) | 15.7 (14.5, 16.8) | 10.8 (9.9, 11.9) | 11.3 (10.2, 12.6) | 19.9 (18.9, 20.8) | 24.7 (23.4, 26.1) | 18.4 (17.3, 19.5) |
| Range min, max | 10.3, 24.6 | 6.6, 18.2 | 6.7, 20.9 | 15.2, 26.3 | 17.3, 32.4 | 13.6, 26.7 |
Every mortality measure was significantly correlated with every other mortality measure (range of correlation coefficients, 0.270.41, P < 0.0001 for all 3 correlations). For example, the correlation between risk‐standardized mortality rates (RSMR) for HF and pneumonia was 0.41. Similarly, every readmission measure was significantly correlated with every other readmission measure (range of correlation coefficients, 0.320.47; P < 0.0001 for all 3 correlations). Overall, the lowest correlation was between risk‐standardized mortality rates for AMI and pneumonia (r = 0.27), and the highest correlation was between risk‐standardized readmission rates (RSRR) for HF and pneumonia (r = 0.47) (Table 3).
| Description | Mortality Measures | Readmission Measures | ||||||||||||
|---|---|---|---|---|---|---|---|---|---|---|---|---|---|---|
| N | AMI and HF | AMI and PN | HF and PN | AMI and HF | AMI and PN | HF and PN | ||||||||
| r | P | r | P | r | P | N | r | P | r | P | r | P | ||
| ||||||||||||||
| All | 4559 | 0.30 | 0.27 | 0.41 | 4468 | 0.38 | 0.32 | 0.47 | ||||||
| Hospitals with 25 patients | 2872 | 0.33 | 0.30 | 0.44 | 2467 | 0.44 | 0.38 | 0.51 | ||||||
| No. of beds | 0.15 | 0.005 | 0.0009 | <0.0001 | <0.0001 | <0.0001 | ||||||||
| >600 | 157 | 0.38 | 0.43 | 0.51 | 156 | 0.67 | 0.50 | 0.66 | ||||||
| 300600 | 628 | 0.29 | 0.30 | 0.49 | 626 | 0.54 | 0.45 | 0.58 | ||||||
| <300 | 3588 | 0.27 | 0.23 | 0.37 | 3505 | 0.30 | 0.26 | 0.44 | ||||||
| Ownership | 0.021 | 0.05 | 0.39 | 0.0004 | 0.0004 | 0.003 | ||||||||
| Not‐for‐profit | 2650 | 0.32 | 0.28 | 0.42 | 2619 | 0.43 | 0.36 | 0.50 | ||||||
| For‐profit | 672 | 0.30 | 0.23 | 0.40 | 663 | 0.29 | 0.22 | 0.40 | ||||||
| Government | 1051 | 0.24 | 0.22 | 0.39 | 1005 | 0.32 | 0.29 | 0.45 | ||||||
| Teaching status | 0.11 | 0.08 | 0.0012 | <0.0001 | 0.0002 | 0.0003 | ||||||||
| COTH | 277 | 0.31 | 0.34 | 0.54 | 276 | 0.54 | 0.47 | 0.59 | ||||||
| Teaching | 505 | 0.22 | 0.28 | 0.43 | 503 | 0.52 | 0.42 | 0.56 | ||||||
| Nonteaching | 3591 | 0.29 | 0.24 | 0.39 | 3508 | 0.32 | 0.26 | 0.44 | ||||||
| Cardiac facility type | 0.022 | 0.006 | <0.0001 | <0.0001 | 0.0006 | 0.004 | ||||||||
| CABG | 1471 | 0.33 | 0.29 | 0.47 | 1467 | 0.48 | 0.37 | 0.52 | ||||||
| Cath lab | 578 | 0.25 | 0.26 | 0.36 | 578 | 0.32 | 0.37 | 0.47 | ||||||
| Neither | 2324 | 0.26 | 0.21 | 0.36 | 2242 | 0.28 | 0.27 | 0.44 | ||||||
| Core‐based statistical area | 0.0001 | <0.0001 | 0.002 | <0.0001 | <0.0001 | <0.0001 | ||||||||
| Division | 621 | 0.38 | 0.34 | 0.41 | 618 | 0.46 | 0.40 | 0.56 | ||||||
| Metro | 1850 | 0.26 | 0.26 | 0.42 | 1835 | 0.38 | 0.30 | 0.40 | ||||||
| Micro | 801 | 0.23 | 0.22 | 0.34 | 788 | 0.32 | 0.30 | 0.47 | ||||||
| Rural | 1101 | 0.21 | 0.13 | 0.32 | 1046 | 0.22 | 0.21 | 0.44 | ||||||
| Safety net status | 0.001 | 0.027 | 0.68 | 0.029 | 0.037 | 0.28 | ||||||||
| No | 2995 | 0.33 | 0.28 | 0.41 | 2967 | 0.40 | 0.33 | 0.48 | ||||||
| Yes | 1377 | 0.23 | 0.21 | 0.40 | 1319 | 0.34 | 0.30 | 0.45 | ||||||
Both the factor analysis for the mortality measures and the factor analysis for the readmission measures yielded only one factor with an eigenvalue >1. In each factor analysis, this single common factor kept more than half of the data based on the cumulative eigenvalue (55% for mortality measures and 60% for readmission measures). For the mortality measures, the pattern of RSMR for myocardial infarction (MI), heart failure (HF), and pneumonia (PN) in the factor was high (0.68 for MI, 0.78 for HF, and 0.76 for PN); the same was true of the RSRR in the readmission measures (0.72 for MI, 0.81 for HF, and 0.78 for PN).
For all condition pairs and both outcomes, a third or more of hospitals were in the same quartile of performance for both conditions of the pair (Table 4). Hospitals were more likely to be in the same quartile of performance if they were in the top or bottom quartile than if they were in the middle. Less than 10% of hospitals were in the top quartile for one condition in the mortality or readmission pair and in the bottom quartile for the other condition in the pair. Kappa scores for same quartile of performance between pairs of outcomes ranged from 0.16 to 0.27, and were highest for HF and pneumonia for both mortality and readmission rates.
| Condition Pair | Same Quartile (Any) (%) | Same Quartile (Q1 or Q4) (%) | Q1 in One and Q4 in Another (%) | Weighted Kappa | Spearman Correlation |
|---|---|---|---|---|---|
| |||||
| Mortality | |||||
| MI and HF | 34.8 | 20.2 | 7.9 | 0.19 | 0.25 |
| MI and PN | 32.7 | 18.8 | 8.2 | 0.16 | 0.22 |
| HF and PN | 35.9 | 21.8 | 5.0 | 0.26 | 0.36 |
| Readmission | |||||
| MI and HF | 36.6 | 21.0 | 7.5 | 0.22 | 0.28 |
| MI and PN | 34.0 | 19.6 | 8.1 | 0.19 | 0.24 |
| HF and PN | 37.1 | 22.6 | 5.4 | 0.27 | 0.37 |
In subgroup analyses, the highest mortality correlation was between HF and pneumonia in hospitals with more than 600 beds (r = 0.51, P = 0.0009), and the highest readmission correlation was between AMI and HF in hospitals with more than 600 beds (r = 0.67, P < 0.0001). Across both measures and all 3 condition pairs, correlations between conditions increased with increasing hospital bed size, presence of cardiac surgery capability, and increasing population of the hospital's Census Bureau statistical area. Furthermore, for most measures and condition pairs, correlations between conditions were highest in not‐for‐profit hospitals, hospitals belonging to the Council of Teaching Hospitals, and non‐safety net hospitals (Table 3).
For all condition pairs, the correlation between readmission rates was significantly higher than the correlation between mortality rates (P < 0.01). In subgroup analyses, readmission correlations were also significantly higher than mortality correlations for all pairs of conditions among moderate‐sized hospitals, among nonprofit hospitals, among teaching hospitals that did not belong to the Council of Teaching Hospitals, and among non‐safety net hospitals (Table 5).
| Description | AMI and HF | AMI and PN | HF and PN | |||||||||
|---|---|---|---|---|---|---|---|---|---|---|---|---|
| N | MC | RC | P | N | MC | RC | P | N | MC | RC | P | |
| ||||||||||||
| All | 4457 | 0.31 | 0.38 | <0.0001 | 4459 | 0.27 | 0.32 | 0.007 | 4731 | 0.41 | 0.46 | 0.0004 |
| Hospitals with 25 patients | 2472 | 0.33 | 0.44 | <0.001 | 2463 | 0.31 | 0.38 | 0.01 | 4104 | 0.42 | 0.47 | 0.001 |
| No. of beds | ||||||||||||
| >600 | 156 | 0.38 | 0.67 | 0.0002 | 156 | 0.43 | 0.50 | 0.48 | 160 | 0.51 | 0.66 | 0.042 |
| 300600 | 626 | 0.29 | 0.54 | <0.0001 | 626 | 0.31 | 0.45 | 0.003 | 630 | 0.49 | 0.58 | 0.033 |
| <300 | 3494 | 0.28 | 0.30 | 0.21 | 3496 | 0.23 | 0.26 | 0.17 | 3733 | 0.37 | 0.43 | 0.003 |
| Ownership | ||||||||||||
| Not‐for‐profit | 2614 | 0.32 | 0.43 | <0.0001 | 2617 | 0.28 | 0.36 | 0.003 | 2697 | 0.42 | 0.50 | 0.0003 |
| For‐profit | 662 | 0.30 | 0.29 | 0.90 | 661 | 0.23 | 0.22 | 0.75 | 699 | 0.40 | 0.40 | 0.99 |
| Government | 1000 | 0.25 | 0.32 | 0.09 | 1000 | 0.22 | 0.29 | 0.09 | 1127 | 0.39 | 0.43 | 0.21 |
| Teaching status | ||||||||||||
| COTH | 276 | 0.31 | 0.54 | 0.001 | 277 | 0.35 | 0.46 | 0.10 | 278 | 0.54 | 0.59 | 0.41 |
| Teaching | 504 | 0.22 | 0.52 | <0.0001 | 504 | 0.28 | 0.42 | 0.012 | 508 | 0.43 | 0.56 | 0.005 |
| Nonteaching | 3496 | 0.29 | 0.32 | 0.18 | 3497 | 0.24 | 0.26 | 0.46 | 3737 | 0.39 | 0.43 | 0.016 |
| Cardiac facility type | ||||||||||||
| CABG | 1465 | 0.33 | 0.48 | <0.0001 | 1467 | 0.30 | 0.37 | 0.018 | 1483 | 0.47 | 0.51 | 0.103 |
| Cath lab | 577 | 0.25 | 0.32 | 0.18 | 577 | 0.26 | 0.37 | 0.046 | 579 | 0.36 | 0.47 | 0.022 |
| Neither | 2234 | 0.26 | 0.28 | 0.48 | 2234 | 0.21 | 0.27 | 0.037 | 2461 | 0.36 | 0.44 | 0.002 |
| Core‐based statistical area | ||||||||||||
| Division | 618 | 0.38 | 0.46 | 0.09 | 620 | 0.34 | 0.40 | 0.18 | 630 | 0.41 | 0.56 | 0.001 |
| Metro | 1833 | 0.26 | 0.38 | <0.0001 | 1832 | 0.26 | 0.30 | 0.21 | 1896 | 0.42 | 0.40 | 0.63 |
| Micro | 787 | 0.24 | 0.32 | 0.08 | 787 | 0.22 | 0.30 | 0.11 | 820 | 0.34 | 0.46 | 0.003 |
| Rural | 1038 | 0.21 | 0.22 | 0.83 | 1039 | 0.13 | 0.21 | 0.056 | 1177 | 0.32 | 0.43 | 0.002 |
| Safety net status | ||||||||||||
| No | 2961 | 0.33 | 0.40 | 0.001 | 2963 | 0.28 | 0.33 | 0.036 | 3062 | 0.41 | 0.48 | 0.001 |
| Yes | 1314 | 0.23 | 0.34 | 0.003 | 1314 | 0.22 | 0.30 | 0.015 | 1460 | 0.40 | 0.45 | 0.14 |
DISCUSSION
In this study, we found that risk‐standardized mortality rates for 3 common medical conditions were moderately correlated within institutions, as were risk‐standardized readmission rates. Readmission rates were more strongly correlated than mortality rates, and all rates tracked closest together in large, urban, and/or teaching hospitals. Very few hospitals were in the top quartile of performance for one condition and in the bottom quartile for a different condition.
Our findings are consistent with the hypothesis that 30‐day risk‐standardized mortality and 30‐day risk‐standardized readmission rates, in part, capture broad aspects of hospital quality that transcend condition‐specific activities. In this study, readmission rates tracked better together than mortality rates for every pair of conditions, suggesting that there may be a greater contribution of hospital‐wide environment, structure, and processes to readmission rates than to mortality rates. This difference is plausible because services specific to readmission, such as discharge planning, care coordination, medication reconciliation, and discharge communication with patients and outpatient clinicians, are typically hospital‐wide processes.
Our study differs from earlier studies of medical conditions in that the correlations we found were higher.18, 19 There are several possible explanations for this difference. First, during the intervening 1525 years since those studies were performed, care for these conditions has evolved substantially, such that there are now more standardized protocols available for all 3 of these diseases. Hospitals that are sufficiently organized or acculturated to systematically implement care protocols may have the infrastructure or culture to do so for all conditions, increasing correlation of performance among conditions. In addition, there are now more technologies and systems available that span care for multiple conditions, such as electronic medical records and quality committees, than were available in previous generations. Second, one of these studies utilized less robust risk‐adjustment,18 and neither used the same methodology of risk standardization. Nonetheless, it is interesting to note that Rosenthal and colleagues identified the same increase in correlation with higher volumes than we did.19 Studies investigating mortality correlations among surgical procedures, on the other hand, have generally found higher correlations than we found in these medical conditions.16, 17
Accountable care organizations will be assessed using an all‐condition readmission measure,31 several states track all‐condition readmission rates,3234 and several countries measure all‐condition mortality.35 An all‐condition measure for quality assessment first requires that there be a hospital‐wide quality signal above and beyond disease‐specific care. This study suggests that a moderate signal exists for readmission and, to a slightly lesser extent, for mortality, across 3 common conditions. There are other considerations, however, in developing all‐condition measures. There must be adequate risk adjustment for the wide variety of conditions that are included, and there must be a means of accounting for the variation in types of conditions and procedures cared for by different hospitals. Our study does not address these challenges, which have been described to be substantial for mortality measures.35
We were surprised by the finding that risk‐standardized rates correlated more strongly within larger institutions than smaller ones, because one might assume that care within smaller hospitals might be more homogenous. It may be easier, however, to detect a quality signal in hospitals with higher volumes of patients for all 3 conditions, because estimates for these hospitals are more precise. Consequently, we have greater confidence in results for larger volumes, and suspect a similar quality signal may be present but more difficult to detect statistically in smaller hospitals. Overall correlations were higher when we restricted the sample to hospitals with at least 25 cases, as is used for public reporting. It is also possible that the finding is real given that large‐volume hospitals have been demonstrated to provide better care for these conditions and are more likely to adopt systems of care that affect multiple conditions, such as electronic medical records.14, 36
The kappa scores comparing quartile of national performance for pairs of conditions were only in the fair range. There are several possible explanations for this fact: 1) outcomes for these 3 conditions are not measuring the same constructs; 2) they are all measuring the same construct, but they are unreliable in doing so; and/or 3) hospitals have similar latent quality for all 3 conditions, but the national quality of performance differs by condition, yielding variable relative performance per hospital for each condition. Based solely on our findings, we cannot distinguish which, if any, of these explanations may be true.31
Our study has several limitations. First, all 3 conditions currently publicly reported by CMS are medical diagnoses, although AMI patients may be cared for in distinct cardiology units and often undergo procedures; therefore, we cannot determine the degree to which correlations reflect hospital‐wide quality versus medicine‐wide quality. An institution may have a weak medicine department but a strong surgical department or vice versa. Second, it is possible that the correlations among conditions for readmission and among conditions for mortality are attributable to patient characteristics that are not adequately adjusted for in the risk‐adjustment model, such as socioeconomic factors, or to hospital characteristics not related to quality, such as coding practices or inter‐hospital transfer rates. For this to be true, these unmeasured characteristics would have to be consistent across different conditions within each hospital and have a consistent influence on outcomes. Third, it is possible that public reporting may have prompted disease‐specific focus on these conditions. We do not have data from non‐publicly reported conditions to test this hypothesis. Fourth, there are many small‐volume hospitals in this study; their estimates for readmission and mortality are less reliable than for large‐volume hospitals, potentially limiting our ability to detect correlations in this group of hospitals.
This study lends credence to the hypothesis that 30‐day risk‐standardized mortality and readmission rates for individual conditions may reflect aspects of hospital‐wide quality or at least medicine‐wide quality, although the correlations are not large enough to conclude that hospital‐wide factors play a dominant role, and there are other possible explanations for the correlations. Further work is warranted to better understand the causes of the correlations, and to better specify the nature of hospital factors that contribute to correlations among outcomes.
Acknowledgements
Disclosures: Dr Horwitz is supported by the National Institute on Aging (K08 AG038336) and by the American Federation of Aging Research through the Paul B. Beeson Career Development Award Program. Dr Horwitz is also a Pepper Scholar with support from the Claude D. Pepper Older Americans Independence Center at Yale University School of Medicine (P30 AG021342 NIH/NIA). Dr Krumholz is supported by grant U01 HL105270‐01 (Center for Cardiovascular Outcomes Research at Yale University) from the National Heart, Lung, and Blood Institute. Dr Krumholz chairs a cardiac scientific advisory board for UnitedHealth. Authors Drye, Krumholz, and Wang receive support from the Centers for Medicare & Medicaid Services (CMS) to develop and maintain performance measures that are used for public reporting. The analyses upon which this publication is based were performed under Contract Number HHSM‐500‐2008‐0025I Task Order T0001, entitled Measure & Instrument Development and Support (MIDS)Development and Re‐evaluation of the CMS Hospital Outcomes and Efficiency Measures, funded by the Centers for Medicare & Medicaid Services, an agency of the US Department of Health and Human Services. The Centers for Medicare & Medicaid Services reviewed and approved the use of its data for this work, and approved submission of the manuscript. The content of this publication does not necessarily reflect the views or policies of the Department of Health and Human Services, nor does mention of trade names, commercial products, or organizations imply endorsement by the US Government. The authors assume full responsibility for the accuracy and completeness of the ideas presented.
- US Department of Health and Human Services. Hospital Compare.2011. Available at: http://www.hospitalcompare.hhs.gov. Accessed March 5, 2011.
- ,,.Early readmissions to the department of medicine as a screening tool for monitoring quality of care problems.Medicine (Baltimore).2008;87(5):294–300.
- ,,,,.Hospital inpatient mortality. Is it a predictor of quality?N Engl J Med.1987;317(26):1674–1680.
- ,.Relationship between Medicare's hospital compare performance measures and mortality rates.JAMA.2006;296(22):2694–2702.
- ,,.Public reporting of discharge planning and rates of readmissions.N Engl J Med.2009;361(27):2637–2645.
- ,,, et al.Process of care performance measures and long‐term outcomes in patients hospitalized with heart failure.Med Care.2010;48(3):210–216.
- ,,,,,.Variations in inpatient mortality among hospitals in different system types, 1995 to 2000.Med Care.2009;47(4):466–473.
- ,,, et al.A systematic review and meta‐analysis of studies comparing mortality rates of private for‐profit and private not‐for‐profit hospitals.Can Med Assoc J.2002;166(11):1399–1406.
- ,,, et al.What distinguishes top‐performing hospitals in acute myocardial infarction mortality rates? A qualitative study.Ann Intern Med.2011;154(6):384–390.
- ,,.Perceptions of hospital safety climate and incidence of readmission.Health Serv Res.2011;46(2):596–616.
- ,,, et al.Decrease in hospital‐wide mortality rate after implementation of a commercially sold computerized physician order entry system.Pediatrics.2010;126(1):14–21.
- ,,.The condition of the literature on differences in hospital mortality.Med Care.1989;27(4):315–336.
- ,,.Threshold volumes associated with higher survival in health care: a systematic review.Med Care.2003;41(10):1129–1141.
- ,,, et al.Hospital volume and 30‐day mortality for three common medical conditions.N Engl J Med.2010;362(12):1110–1118.
- Patient Protection and Affordable Care Act Pub. L. No. 111–148, 124 Stat, §3025.2010. Available at: http://www.gpo.gov/fdsys/pkg/PLAW‐111publ148/content‐detail.html. Accessed on July 26, year="2012"2012.
- ,,.Are mortality rates for different operations related? Implications for measuring the quality of noncardiac surgery.Med Care.2006;44(8):774–778.
- ,,,.Do hospitals with low mortality rates in coronary artery bypass also perform well in valve replacement?Ann Thorac Surg.2003;76(4):1131–1137.
- ,,,,.Differences among hospitals in Medicare patient mortality.Health Serv Res.1989;24(1):1–31.
- ,,,.Variations in standardized hospital mortality rates for six common medical diagnoses: implications for profiling hospital quality.Med Care.1998;36(7):955–964.
- ,,, et al.Development, validation, and results of a measure of 30‐day readmission following hospitalization for pneumonia.J Hosp Med.2011;6(3):142–150.
- ,,, et al.An administrative claims measure suitable for profiling hospital performance on the basis of 30‐day all‐cause readmission rates among patients with heart failure.Circ Cardiovasc Qual Outcomes.2008;1:29–37.
- ,,, et al.Quality of care for acute myocardial infarction at urban safety‐net hospitals.Health Aff (Millwood).2007;26(1):238–248.
- National Quality Measures Clearinghouse.2011. Available at: http://www.qualitymeasures.ahrq.gov/. Accessed February 21,year="2011"2011.
- ,,, et al.An administrative claims model suitable for profiling hospital performance based on 30‐day mortality rates among patients with an acute myocardial infarction.Circulation.2006;113(13):1683–1692.
- ,,, et al.An administrative claims model suitable for profiling hospital performance based on 30‐day mortality rates among patients with heart failure.Circulation.2006;113(13):1693–1701.
- ,,, et al.An administrative claims model for profiling hospital 30‐day mortality rates for pneumonia patients.PLoS One.2011;6(4):e17401.
- ,,, et al.An administrative claims measure suitable for profiling hospital performance based on 30‐day all‐cause readmission rates among patients with acute myocardial infarction.Circ Cardiovasc Qual Outcomes.2011;4(2):243–252.
- .The application of electronic computers to factor analysis.Educ Psychol Meas.1960;20:141–151.
- .On the ‘probable error’ of a coefficient of correlation deduced from a small sample.Metron.1921;1:3–32.
- ,,.Comparing correlated but nonoverlapping correlations.Psychol Methods.1996;1(2):178–183.
- Centers for Medicare and Medicaid Services.Medicare Shared Savings Program: Accountable Care Organizations, Final Rule.Fed Reg.2011;76:67802–67990.
- Massachusetts Healthcare Quality and Cost Council. Potentially Preventable Readmissions.2011. Available at: http://www.mass.gov/hqcc/the‐hcqcc‐council/data‐submission‐information/potentially‐preventable‐readmissions‐ppr.html. Accessed February 29, 2012.
- Texas Medicaid. Potentially Preventable Readmission (PPR).2012. Available at: http://www.tmhp.com/Pages/Medicaid/Hospital_PPR.aspx. Accessed February 29, 2012.
- New York State. Potentially Preventable Readmissions.2011. Available at: http://www.health.ny.gov/regulations/recently_adopted/docs/2011–02‐23_potentially_preventable_readmissions.pdf. Accessed February 29, 2012.
- ,,,,.Variability in the measurement of hospital‐wide mortality rates.N Engl J Med.2010;363(26):2530–2539.
- ,,, et al.Use of electronic health records in U.S. hospitals.N Engl J Med.2009;360(16):1628–1638.
Copyright © 2012 Society of Hospital Medicine
Antibiotic Decisions in the ICU
Antimicrobial use provides the selective pressure that cause bacteria to develop antimicrobial resistance.1 Currently, clones of bacteria with very limited antimicrobial sensitivity are gradually spreading around the world.2 The intensive care unit (ICU) is a focus of resistant bacteria within the hospital3 as a result of high illness severity, widespread use of invasive monitoring or therapeutic devices, frequency of bacterial infection (found in approximately 51% of patients4), and consequent extensive use of broad‐spectrum antimicrobials (in 71% of patients).4
When prescribing antimicrobials, the ICU clinician often faces a dilemma. First, the traditional symptoms and signs of infection (such as characteristic patient history, fever, increased white cell count, etc) are common in ICU patients even in the absence of infection, making distinction of infectious and noninfectious causes of patient deterioration difficult. Second, delaying antimicrobial therapy, prescribing inadequate antimicrobials, or allowing bacterial infections to go untreated, increases patient mortality,57 resulting in guideline recommendations to start broad‐spectrum antimicrobials as soon as possible in the presence of suspected severe sepsis.8 While third, and in contrast, unnecessary antimicrobial therapy increases the risk of antimicrobial‐related complications, such as Clostridium difficile colitis (with a crude mortality of up to 20%9), and potentially endangers the greater population of ICU patients by increasing the prevalence of resistant organisms. Choosing between delaying necessary antimicrobial therapy and exposing the patient to unnecessary therapy requires that 2 contrasting risks be balancedthat of untreated infection versus late antimicrobial complications.
The main aim of this study was to assess how often administration of antimicrobials for suspected infection could be justified by the presence of infection. The primary outcome measure was accuracy of antimicrobial administration, defined as the proportion of antimicrobials started for suspected infection where infection was later proven to have been present. Secondary outcome measures examined: (1) whether clinician suspicion of infection correlated with the presence of defined infection; (2) the ID specialist's accuracy for empiric antimicrobial administration; (3) whether common clinical parameters were associated with clinician certainty regarding the presence of infection; and (4) use of antimicrobials in the presence or absence of infection. These data are important in order to identify possibilities for improving antimicrobial administration.
METHODS
Setting
Data were collected on all ICU patients staying >48 hours in the 12‐bed general (mainly surgical) ICU of a 775‐bed academic tertiary referral center (the Hadassah Hebrew University Medical Center, Jerusalem, Israel) from May to August 2009. The hospital ethics committee approved the study and waived the requirement for informed consent.
Clinical antimicrobial decision‐making was at the final discretion of the ICU attending clinician. During office hours, decisions to start antimicrobials with any but first line agents (ampicillin, ampicillin/clavulanic acid, azithromycin, cefazolin, cefuroxime, ciprofloxacin, clindamycin, cloxacillin, gentamicin, and metronidazole) required authorization by the clinical ID specialist on attachment to the ICU (who performed a daily round). Out of office hours, decisions required authorization by an on‐call ID specialist (usually by phone). There was no availability of a clinical pharmacist. Microbiological studies were obtained as follows: sputum and urine cultures routinely 3 times per week, while other cultures (including blood, wound, site‐specific cultures, etc) according to clinical indications.
Antimicrobial Administration Decisions
Start and stop dates were recorded for all intravenous antimicrobials administered during the patient's ICU stay. Antimicrobial start decisions were divided into 3 groups: empirical (where antimicrobials were started for a new suspected infection), prophylaxis‐driven (antimicrobials given peri‐procedurally), and targeted therapy (antimicrobials started or changed based on receipt of culture results, or antimicrobials continued from a previous department). Although multiple antimicrobials were often started together, these were considered as a single antimicrobial start decision, if started for the same reason.
Empirical decisions represent the main focus of this study, and further data were collected for these decisions. For each empiric decision, the attending ICU clinician's name was recorded, as well as a measure of his certainty that a new infection was actually present. Certainty was determined at the time that the antimicrobials were started and was entirely subjective. The clinician was asked to categorize his certainty that an infection was present when starting empiric antimicrobials on a scale from 0 to 5: 0no infection; 1infection unlikely; 2infection possible; 3infection probable; 4infection very likely; and 5infection certain. The number of systemic inflammatory response syndrome (SIRS) criteria10 and Sequential Organ Failure Assessment (SOFA)11 score were calculated at the time each decision was made (using the last available data prior to starting antimicrobials), and for the previous 2 days (using the worst values on each calendar day). Data on demographics, admission history, comorbid conditions, Acute Physiology and Chronic Health Evaluation II (APACHE II) score, and outcome were collected for each patient.
Antimicrobial Start Decisions and Definitions of Infection by the Study ID Specialist
Approximately 1 week after each empiric antimicrobial decision, the need for antimicrobial therapy and the presence of infection were analyzed and defined by the study ID specialist (S.B.). He was not involved in clinical decision‐making and was not acquainted with patient details. Each analysis included 2 steps: Step 1 concerning the overall requirement for antimicrobial therapy, and Step 2 regarding the presence of infection. For Step 1, data from the patient's clinical course up until the time the antimicrobial start decision was made were presented. At that point, the study ID specialist decided whether, if presented the case as a consultant, he would have recommended starting antimicrobials. For Step 2, the patient's clinical course following the antimicrobial decision point as well as laboratory, imaging, and microbiological results from the subsequent days were reviewed. The presence or absence of infection was defined by integrating all of this data, and based on the Centers for Disease Control and Prevention (CDC) surveillance criteria for the diagnosis of nosocomial infections.12 The study ID specialist used the same certainty score regarding the presence of infection as the clinicians. A certainty of a probable infection (score 3) or higher represented the cutoff to define the presence of infection. The study ID specialist's determination of the presence of infection was considered the gold standard for the presence of infection for analyses and is termed defined infection.
Accuracy of Antimicrobial Start Decisions
Accuracy was calculated for both the clinicians and the study ID specialist, and expressed as a proportion. The denominator for ICU clinician accuracy was the total number of antibiotic start decisions for suspected infection, and the numerator was the number of decisions where infection was defined by the ID specialist. For the study ID specialist, the denominator was the number of occasions when antibiotic administration was considered justified in the Step 1 analysis, and the numerator was the number of these cases where infection was defined (Figure 1). The correlation between clinician certainty and the study‐defined presence of infection was examined. The accuracy of clinical antimicrobial decisions made during the first 48 hours of ICU admission was compared to decisions made after 48 hours.
In order to assess the robustness of the study findings, the ICU clinician accuracy was examined in a sensitivity analysis. Accuracy was calculated using a lower cutoff for the study ID specialist's definition of infectionpossible infection (score 2) or above, rather than probable infection or above.
Physiological Parameters
To examine the effect of physiological variables on physician certainty, empiric antimicrobial start decisions were divided into 2 groupsa high clinician certainty group (certainty score 3) and a low certainty score (<3). Each physiological parameter comprising the SIRS and SOFA scores, the scores themselves, and changes from the previous 24 and 48 hours were compared for the 2 groups. Data used for the decision day were the last available observations prior to starting the antimicrobials. Data for the previous 2 days were the worst values present during each calendar day.
Antimicrobial Course Length
The total course given after each empirical antibiotic start decision was measured in days. The course length started with the empiric antimicrobial start decision, and ended either when antimicrobial therapy was stopped, or when a subsequent empirical start decision was made. Course length for start decisions where infection was subsequently defined was compared to decisions where infection was not defined.
Statistical Analysis
Continuous variables were compared using the Student t test, while categorical variables were compared using the chi‐square test. All P values are 2‐tailed and P < 0.05 was considered statistically significant. SAS version 8.2 (SAS Institute, Inc, Cary, NC) was used for statistical analysis.
RESULTS
Data were collected on 119 consecutive ICU patients over 4 months (Table 1). Antimicrobials were started for suspected infection in 80/119 (67%) patients, for prophylaxis in 55/119 (46%) patients, and for other reasons in 42/119 (35%) patients. More than one indication was present during the patient's ICU admission among 41/119 (34%) patients, while for 6/119 (5%) patients, no antimicrobials were prescribed at all. Among these patients, antimicrobials were administered on 250 occasions, including 125/250 (50%) occasions for suspected infection (empirical decisions), 62/250 (25%) occasions for procedural prophylaxis (prophylaxis‐driven), and on 63/250 (25%) occasions for other reasons (antimicrobial changes following receipt of culture results, or continuation of antimicrobials prescribed prior to ICU admission). Microbiological cultures were obtained from the study population on 2132 occasions, including 395 blood cultures in which significant organisms (not reflecting contamination) grew on 57/395 (14%) occasions.
| No. (%) or Mean SD | |
|---|---|
| N = 119 | |
| |
| Demographics | |
| Male gender | 66 (55) |
| Age (years) | 53 25 |
| Hospital admission prior to ICU admission | 62 (52) |
| Independent functional capacity | 99 (83) |
| Etiology for ICU admission* | |
| Surgery | 82 (69) |
| Elective | 12 (10) |
| Emergency | 70 (59) |
| Trauma | 41 (34) |
| Medical | 26 (22) |
| Comorbidities | |
| Prior antimicrobial therapy | 48 (40) |
| Severe cardiac disease | 12 (10) |
| Severe respiratory disease | 5 (4) |
| Diabetes mellitus | 22 (18) |
| Liver disease | 10 (8) |
| Dialysis | 5 (4) |
| APACHE II score | 15 8 |
| Outcome | |
| ICU length of stay (days) | 13 15 |
| Hospital length of stay (days) | 36 32 |
| ICU mortality | 16 (13) |
| Hospital mortality | 22 (18) |
Among the empiric antimicrobial start decisions, infection was defined by the study ID specialist on 67/125 (54%) occasions, representing the clinicians' diagnostic accuracy. These infections included 17 (25%) respiratory, 16 (24%) abdominal, 13 (19%) soft tissue, 11 (16%) blood stream, 6 (9%) urinary, and 4 (6%) other infections.
Three attending clinicians treated patients during the study period, and their accuracies were similar (21 infections defined/44 start decisions for suspected infection, 48%; 24/38, 63%; 22/43, 51%, for each attending; P = ns for all comparisons). Clinician accuracy was higher for empirical antimicrobial start decisions, made within 48 hours of ICU admission, compared to later decisions (35 defined infections/53 early antibiotic start decisions [66%] vs 32 defined infections/72 late antibiotic start decisions [44%]; P = 0.02).
In a sensitivity analysis, decreasing the cutoff for the study ID specialist's definition of infection from probable (and above) to possible (and above) lead to reclassification of 14/125 (11%) antimicrobial start decisions from no infection defined to infection defined. This increased physician accuracy from 67/125 (54%) to 78/125 (62%), and conversely decreased potential antimicrobial overuse from 58/125 (46%) to 47/125 (38%) decisions (P = ns).
When starting antimicrobials for suspected infection, the clinicians were asked to record their certainty in the presence of infection. Infections were defined on 6/19 (31%) occasions when the clinician certainty score was low (2) versus 61/106 (57%) when the clinician certainty score was high (3, P = 0.037; Figure 2). Correlation between the clinician certainty score and the presence of defined infection was good (r2 = 0.78).
The study ID specialist agreed with the clinician's decision to start antimicrobial therapy on 87/125 (70%) occasions. Infection was subsequently defined on 66/87 (76%) occasions, representing the study ID specialist's diagnostic accuracy. The study ID specialist's accuracy was significantly higher than the clinician's (66/87 [76%] versus 67/125 [54%]; P = 0.001). Notably, there was only 1 case (3%) where empiric therapy was deemed unnecessary by the study ID specialist, and where infection was subsequently defined. In this case, the clinicians started antibiotic therapy for suspected ventilator‐associated pneumonia in a 66‐year‐old patient on the 28th day of an ICU admission for head and spinal cord trauma. The ID specialist's certainty for the presence of infection was 3probable. The patient ultimately survived and was discharged to a rehabilitation facility.
Comparing physiological data for antimicrobial start decisions with high clinician certainty (score 3) versus low certainty of infection (score 2), revealed that none of the physiological data, nor changes over time were significantly associated with clinician certainty. Further use of high doses of vasopressors (>0.1 mcg/kg/min, SOFA score 4) was present at 42/106 (40%) high certainty decisions versus 7/19 (37%) low certainty decisions (P = 0.819). This underscores the physicians' difficulty in distinguishing between infectious and inflammatory causes of deterioration (Table 2).
| Low Certainty* N = 19 | High Certainty N = 106 | ||
|---|---|---|---|
| Mean SD | Mean SD | P Value | |
| |||
| SIRS elements | |||
| Temperature (C) | 37.7 1.2 | 37.3 1.6 | 0.28 |
| WBC count ( 109/liter) | 16.7 8.1 | 15.9 10.5 | 0.72 |
| Pulse (rate/min) | 112 23 | 110 21 | 0.58 |
| Respiratory rate (rate/min) | 22 8 | 22 8 | 0.90 |
| Number of SIRS criteria (at antimicrobial start) | 3.0 0.9 | 3.2 0.9 | 0.24 |
| Change in number of SIRS criteria (24 h) | 0.1 0.9 | 0.0 0.9 | 0.68 |
| Change in number of SIRS criteria (48 h) | 0.0 0.7 | 0.3 0.9 | 0.36 |
| SOFA score elements (points) | |||
| Respiratory | 1.6 1.1 | 1.9 1.2 | 0.45 |
| Neurological | 1.8 1.7 | 2.0 1.6 | 0.50 |
| Coagulation | 0.6 1.1 | 0.6 1.1 | 0.85 |
| Hepatic | 0.6 0.8 | 0.4 0.8 | 0.37 |
| Renal | 0.7 1.1 | 0.8 1.1 | 0.51 |
| Cardiovascular | 1.5 1.9 | 1.8 1.9 | 0.47 |
| SOFA score day at antimicrobial start | 6.7 3.1 | 7.3 4.6 | 0.58 |
| SOFA score change (previous 24 h) | 1.5 3.2 | 1.0 2.9 | 0.56 |
| SOFA score change (previous 48 h) | 3.1 4.4 | 1.5 4.3 | 0.25 |
During the study period, 2541 days of antimicrobial therapy were given of which 1677 (66%), 413 (16%), and 451 (18%) were given, respectively, empirically (for suspected infection), for procedural prophylaxis, and as targeted therapy. Antimicrobial course length was 11.5 9.2 days in the presence of defined infection versus 10.7 9.1 days in the absence of defined infection (P = 0.655). Overall, 658/2541 (26%) days of therapy could potentially have been saved by reducing antimicrobial prescriptions for suspected infections which were not defined.
DISCUSSION
The use of empirical antimicrobials could be justified by the presence of defined infection on only 54% of occasions when they were administered, suggesting considerable potential overuse of these drugs. ICU‐clinician certainty for the presence of infection correlated well with the number of infections actually defined, however, infections were defined when certainty was low (Figure 2) and antimicrobials prescribed even when clinician certainty was minimal. Common clinical physiological and laboratory parameters did not seem to assist in the clinicians' decision‐making, as there were no significant differences in any of these values between empiric decisions with high or low certainty. The study ID specialist showed significantly better accuracy in antimicrobial decision‐making than the ICU clinicians. He agreed with antimicrobial administration on only 70% of occasions that clinicians started empiric therapy, and had a higher diagnostic accuracy at a cost of only 1 untreated infection.
Two main possibilities are suggested to explain the potential antimicrobial overuse. First, ICU physicians are loath to leave infections untreated and potentially cause immediate increases in mortality.8 This leads to uncertainty avoidance or risk aversive behavior that is demonstrated in our study by the inclusion of antimicrobial administration decisions made even when physicians' certainty regarding the presence of infection was low. Uncertainty avoidance has been shown to be significantly associated with antimicrobial prescribing practices,13 however, it discounts the risk of antimicrobial complications associated with unnecessary antimicrobial therapy. Second, the diagnosis of infection, and particularly nosocomial infection, in ICU patients is difficult. Symptoms cannot be elicited in obtunded ventilated ICU patients, the physical exam can be equivocal, bacterial growth in cultures (with the exception of blood cultures) often reflects colonization rather than infection, and the laboratory and imaging findings of inflammation and infection are very similar. Our data demonstrated some of these difficulties. Diagnostic accuracy was higher in infections suspected during the first 48 hours of ICU admission when compared to later, presumably as infection leading to ICU admission is associated with symptoms, signs, and an acute change in the patient's condition, factors that may be absent when a patient develops a nosocomial infection. Further, physiological parameters did not correlate with the certainty that ICU clinicians expressed in their decision, indicating the difficulty in interpreting these data. Finally, infection was defined in 30% of low certainty decisions, indicating that clinical impression alone is not a reliable tool for determining the presence of infection.
Three sets of interventions could be suggested to improve antimicrobial decision‐makingincreased use of the ID consult, improved laboratory tests for the diagnosis of infection, and a policy of de‐escalation. Use of antimicrobial stewardship (often through involvement of an ID physician) reduces antimicrobial usage and the occurrence of resistant bacteria without adverse patient outcomes.14 Indeed, our study ID consult showed more accurate antimicrobial prescribing than the ICU clinicians, although he may have been subject to the potential biases described below. All antimicrobial administration decisions taken during the study were, however, made in consultation with the clinical ID consult. The lower performance of the clinical ID consult (when compared to the study ID consult) may have resulted from difficulties in the real‐time interaction with the clinicians or from decisions taken during non‐office hours. During non‐office hours, the on‐call ICU resident presented cases to an on‐call ID specialist, neither of whom may have been familiar with all the complex case details and therefore may have preferred to err by commission than by omission.
More accurate laboratory tests, such as procalcitonin or real‐time bacterial polymerase chain reaction (PCR),15 could be beneficial as they might increase physician confidence in decision‐making. Procalcitonin has been used in a wide variety of settings1618 (including the ICU1921) to safely decrease antimicrobial starts and/or antimicrobial course length. Despite this, in a large multicenter study of procalcitonin use in ICU patients,19 compliance with the antibiotic start protocol was very low. Antibiotics were administered by the participating physicians in 73/93 (78%) cases where the procalcitonin tests indicated that antimicrobials were not required, representing protocol violations. In parallel to our study, this demonstrates the reluctance of physicians to abstain from prescribing antimicrobial therapy for suspected infection even when the likelihood of infection may be low.
A strategy of de‐escalation offers the possibility of starting broad‐spectrum antimicrobials early and, subsequently, narrowing or stopping therapy according to the clinical course and the microbiological results.22, 23 This strategy allows clinicians to start antimicrobials even when the suspicion of infection is low, but to stop them rapidly as the clinical picture clarifies. Unfortunately, the mean antimicrobial course length in this study was not influenced by the presence of infection, indicating that this strategy was not employed successfully.
The proportion of patients prescribed antimicrobials for suspected infection in our study is similar to that found in others (eg, 34% of patients in a large French survey24). The proportion of potentially unnecessary antimicrobials in other studies is also similar, ranging from 14% to 50%.2428 In the ICU, the majority of antimicrobial usage studies are microbiology‐based and examine whether bacteria cultured are resistant to the antimicrobials chosen. They have shown that inappropriate antimicrobial therapy occurs on 20%36% of occasions.6, 7, 29 The current study furthers knowledge on antimicrobials decision‐making in the ICU, by examining the actual requirement for antimicrobial therapy based on the presence of infection, ie, whether antimicrobials were needed at all.
The principal limitation of the study concerns the determination of the presence of infection. The study premise was that antimicrobials are overused, and this may have biased the study ID consult to underestimate appropriateness of antimicrobial therapy and to define fewer infections. Further, making theoretical decisions in the research office avoids the medical, ethical, and legal issues related to clinical practice, as there is no risk associated with error. This may have allowed the study ID specialist to be overly conservative in his definitions of infections. A wider team of decision‐makers to determine the presence of infection, including both ID and ICU specialists, would have lent more weight to their determinations, however, this was logistically impossible. To limit the potential bias, infections were defined as objectively as possible based on the CDC criteria.12 Further, the sensitivity analysis showed that while decreasing the study ID specialist's threshold for the definition of infection from probable and above to possible and above improved physician accuracy, over a third of antimicrobial start decisions remained unjustified by the presence of defined infection. The study was performed in only 1 center and may not reflect general ICU practice, although, as discussed above, the antibiotic decision‐making accuracy is in the same orders of magnitude as those found in other somewhat similar studies. Finally, even if unnecessary antimicrobial use was overestimated, the possibility for significant improvement in antimicrobial administration accuracy remains.
In conclusion, our data suggest that on up to 46% of occasions, empirical antimicrobials are prescribed in the absence of infection. We suggest that the potential antibiotic overuse results from difficulties in diagnosing ICU‐related infections, and from the high perceived risk of untreated infection as compared to the risks of potentially unnecessary antimicrobial therapy, representing a type of risk aversive behavior. As antimicrobial use is the primary factor promoting antibiotic resistance and may be a cause of other patient complications, efforts to improve antimicrobial‐related decision‐making should be mandatory.
- ,.Antimicrobial‐drug resistance.N Engl J Med.1996;335:1445–1453.
- ,,, et al.Emergence of a new antibiotic resistance mechanism in India, Pakistan, and the UK: a molecular, biological, and epidemiological study.Lancet Infect Dis.2010;10:597–602.
- ,,, et al.Surveillance of antimicrobial use and antimicrobial resistance in United States hospitals: project ICARE phase 2. Project Intensive Care Antimicrobial Resistance Epidemiology (ICARE) hospitals.Clin Infect Dis.1999;29:245–252.
- ,,, et al.International study of the prevalence and outcomes of infection in intensive care units.JAMA.2009;302:2323–2329.
- ,,,,.Clinical importance of delays in the initiation of appropriate antibiotic treatment for ventilator‐associated pneumonia.Chest.2002;122:262–268.
- ,,,.Inadequate antimicrobial treatment of infections: a risk factor for hospital mortality among critically ill patients.Chest.1999;115:462–474.
- ,,, et al.Initiation of inappropriate antimicrobial therapy results in a fivefold reduction of survival in human septic shock.Chest.2009;136:1237–1248.
- ,,, et al.Surviving Sepsis Campaign: international guidelines for management of severe sepsis and septic shock: 2008.Crit Care Med.2008;36:296–327.
- ,,,,.Investigation of critical care unit utilization and mortality in patients infected with Clostridium difficile.J Crit Care.2010;25:282–286.
- American College of Chest Physicians/Society of Critical Care Medicine Consensus Conference:definitions for sepsis and organ failure and guidelines for the use of innovative therapies in sepsis.Crit Care Med.1992;20:864–874.
- ,,, et al.The SOFA (Sepsis‐related Organ Failure Assessment) score to describe organ dysfunction/failure. On behalf of the Working Group on Sepsis‐Related Problems of the European Society of Intensive Care Medicine.Intensive Care Med.1996;22:707–710.
- ,,.CDC/NHSN surveillance definition of health care‐associated infection and criteria for specific types of infections in the acute care setting.Am J Infect Control.2008;36:309–332.
- ,,, et al.Are cultural dimensions relevant for explaining cross‐national differences in antibiotic use in Europe?BMC Health Serv Res.2008;8:123.
- ,,,,,.Impact of antimicrobial stewardship in critical care: a systematic review.J Antimicrob Chemother.2011;66:1223–1230.
- ,,, et al.A multicenter trial to compare blood culture with polymerase chain reaction in severe human sepsis.Intensive Care Med.2010;36:241–247.
- ,,, et al.Procalcitonin guidance of antibiotic therapy in community‐acquired pneumonia: a randomized trial.Am J Respir Crit Care Med.2006;174:84–93.
- ,,, et al.Effect of procalcitonin‐based guidelines vs standard guidelines on antibiotic use in lower respiratory tract infections: the ProHOSP randomized controlled trial.JAMA.2009;302:1059–1066.
- ,,, et al.Antibiotic treatment of exacerbations of COPD: a randomized, controlled trial comparing procalcitonin‐guidance with standard therapy.Chest.2007;131:9–19.
- ,,, et al.Use of procalcitonin to reduce patients' exposure to antibiotics in intensive care units (PRORATA trial): a multicentre randomised controlled trial.Lancet.2010;375:463–474.
- ,,,,.Use of procalcitonin to shorten antibiotic treatment duration in septic patients: a randomized trial.Am J Respir Crit Care Med.2008;177:498–505.
- ,,, et al.Procalcitonin for reduced antibiotic exposure in ventilator‐associated pneumonia: a randomised study.Eur Respir J.2009;34:1364–1375.
- ,,, et al.Consensus document on controversial issues for the treatment of hospital‐associated pneumonia.Int J Infect Dis.2010;14(suppl 4):S55–S65.
- ,, et al.Guidelines for the management of adults with hospital‐acquired, ventilator‐associated, and healthcare‐associated pneumonia.Am Respir Crit Care Med.2005;171:388–416.
- ,,, et al.Strategies of initiation and streamlining of antibiotic therapy in 41 French intensive care units.Crit Care.2011;15:R17.
- ,,,.Antibiotic use at Duke University Medical Center.JAMA.1977;237:2819–2822.
- ,.A study of antimicrobial misuse in a university hospital.Am J Med Sci.1978;275:271–282.
- ,,,,.Unnecessary use of antimicrobials in hospitalized patients: current patterns of misuse with an emphasis on the antianaerobic spectrum of activity.Arch Intern Med.2003;163:972–978.
- ,,, et al.Interventions to improve antibiotic prescribing practices for hospital inpatients.Cochrane Database Syst Rev.2005;CD003543.
- ,,, et al.Patterns of antimicrobial therapy in severe nosocomial infections: empiric choices, proportion of appropriate therapy, and adaptation rates—a multicentre, observational survey in critically ill patients.Int J Antimicrob Agents.2010;35:375–381.
Antimicrobial use provides the selective pressure that cause bacteria to develop antimicrobial resistance.1 Currently, clones of bacteria with very limited antimicrobial sensitivity are gradually spreading around the world.2 The intensive care unit (ICU) is a focus of resistant bacteria within the hospital3 as a result of high illness severity, widespread use of invasive monitoring or therapeutic devices, frequency of bacterial infection (found in approximately 51% of patients4), and consequent extensive use of broad‐spectrum antimicrobials (in 71% of patients).4
When prescribing antimicrobials, the ICU clinician often faces a dilemma. First, the traditional symptoms and signs of infection (such as characteristic patient history, fever, increased white cell count, etc) are common in ICU patients even in the absence of infection, making distinction of infectious and noninfectious causes of patient deterioration difficult. Second, delaying antimicrobial therapy, prescribing inadequate antimicrobials, or allowing bacterial infections to go untreated, increases patient mortality,57 resulting in guideline recommendations to start broad‐spectrum antimicrobials as soon as possible in the presence of suspected severe sepsis.8 While third, and in contrast, unnecessary antimicrobial therapy increases the risk of antimicrobial‐related complications, such as Clostridium difficile colitis (with a crude mortality of up to 20%9), and potentially endangers the greater population of ICU patients by increasing the prevalence of resistant organisms. Choosing between delaying necessary antimicrobial therapy and exposing the patient to unnecessary therapy requires that 2 contrasting risks be balancedthat of untreated infection versus late antimicrobial complications.
The main aim of this study was to assess how often administration of antimicrobials for suspected infection could be justified by the presence of infection. The primary outcome measure was accuracy of antimicrobial administration, defined as the proportion of antimicrobials started for suspected infection where infection was later proven to have been present. Secondary outcome measures examined: (1) whether clinician suspicion of infection correlated with the presence of defined infection; (2) the ID specialist's accuracy for empiric antimicrobial administration; (3) whether common clinical parameters were associated with clinician certainty regarding the presence of infection; and (4) use of antimicrobials in the presence or absence of infection. These data are important in order to identify possibilities for improving antimicrobial administration.
METHODS
Setting
Data were collected on all ICU patients staying >48 hours in the 12‐bed general (mainly surgical) ICU of a 775‐bed academic tertiary referral center (the Hadassah Hebrew University Medical Center, Jerusalem, Israel) from May to August 2009. The hospital ethics committee approved the study and waived the requirement for informed consent.
Clinical antimicrobial decision‐making was at the final discretion of the ICU attending clinician. During office hours, decisions to start antimicrobials with any but first line agents (ampicillin, ampicillin/clavulanic acid, azithromycin, cefazolin, cefuroxime, ciprofloxacin, clindamycin, cloxacillin, gentamicin, and metronidazole) required authorization by the clinical ID specialist on attachment to the ICU (who performed a daily round). Out of office hours, decisions required authorization by an on‐call ID specialist (usually by phone). There was no availability of a clinical pharmacist. Microbiological studies were obtained as follows: sputum and urine cultures routinely 3 times per week, while other cultures (including blood, wound, site‐specific cultures, etc) according to clinical indications.
Antimicrobial Administration Decisions
Start and stop dates were recorded for all intravenous antimicrobials administered during the patient's ICU stay. Antimicrobial start decisions were divided into 3 groups: empirical (where antimicrobials were started for a new suspected infection), prophylaxis‐driven (antimicrobials given peri‐procedurally), and targeted therapy (antimicrobials started or changed based on receipt of culture results, or antimicrobials continued from a previous department). Although multiple antimicrobials were often started together, these were considered as a single antimicrobial start decision, if started for the same reason.
Empirical decisions represent the main focus of this study, and further data were collected for these decisions. For each empiric decision, the attending ICU clinician's name was recorded, as well as a measure of his certainty that a new infection was actually present. Certainty was determined at the time that the antimicrobials were started and was entirely subjective. The clinician was asked to categorize his certainty that an infection was present when starting empiric antimicrobials on a scale from 0 to 5: 0no infection; 1infection unlikely; 2infection possible; 3infection probable; 4infection very likely; and 5infection certain. The number of systemic inflammatory response syndrome (SIRS) criteria10 and Sequential Organ Failure Assessment (SOFA)11 score were calculated at the time each decision was made (using the last available data prior to starting antimicrobials), and for the previous 2 days (using the worst values on each calendar day). Data on demographics, admission history, comorbid conditions, Acute Physiology and Chronic Health Evaluation II (APACHE II) score, and outcome were collected for each patient.
Antimicrobial Start Decisions and Definitions of Infection by the Study ID Specialist
Approximately 1 week after each empiric antimicrobial decision, the need for antimicrobial therapy and the presence of infection were analyzed and defined by the study ID specialist (S.B.). He was not involved in clinical decision‐making and was not acquainted with patient details. Each analysis included 2 steps: Step 1 concerning the overall requirement for antimicrobial therapy, and Step 2 regarding the presence of infection. For Step 1, data from the patient's clinical course up until the time the antimicrobial start decision was made were presented. At that point, the study ID specialist decided whether, if presented the case as a consultant, he would have recommended starting antimicrobials. For Step 2, the patient's clinical course following the antimicrobial decision point as well as laboratory, imaging, and microbiological results from the subsequent days were reviewed. The presence or absence of infection was defined by integrating all of this data, and based on the Centers for Disease Control and Prevention (CDC) surveillance criteria for the diagnosis of nosocomial infections.12 The study ID specialist used the same certainty score regarding the presence of infection as the clinicians. A certainty of a probable infection (score 3) or higher represented the cutoff to define the presence of infection. The study ID specialist's determination of the presence of infection was considered the gold standard for the presence of infection for analyses and is termed defined infection.
Accuracy of Antimicrobial Start Decisions
Accuracy was calculated for both the clinicians and the study ID specialist, and expressed as a proportion. The denominator for ICU clinician accuracy was the total number of antibiotic start decisions for suspected infection, and the numerator was the number of decisions where infection was defined by the ID specialist. For the study ID specialist, the denominator was the number of occasions when antibiotic administration was considered justified in the Step 1 analysis, and the numerator was the number of these cases where infection was defined (Figure 1). The correlation between clinician certainty and the study‐defined presence of infection was examined. The accuracy of clinical antimicrobial decisions made during the first 48 hours of ICU admission was compared to decisions made after 48 hours.
In order to assess the robustness of the study findings, the ICU clinician accuracy was examined in a sensitivity analysis. Accuracy was calculated using a lower cutoff for the study ID specialist's definition of infectionpossible infection (score 2) or above, rather than probable infection or above.
Physiological Parameters
To examine the effect of physiological variables on physician certainty, empiric antimicrobial start decisions were divided into 2 groupsa high clinician certainty group (certainty score 3) and a low certainty score (<3). Each physiological parameter comprising the SIRS and SOFA scores, the scores themselves, and changes from the previous 24 and 48 hours were compared for the 2 groups. Data used for the decision day were the last available observations prior to starting the antimicrobials. Data for the previous 2 days were the worst values present during each calendar day.
Antimicrobial Course Length
The total course given after each empirical antibiotic start decision was measured in days. The course length started with the empiric antimicrobial start decision, and ended either when antimicrobial therapy was stopped, or when a subsequent empirical start decision was made. Course length for start decisions where infection was subsequently defined was compared to decisions where infection was not defined.
Statistical Analysis
Continuous variables were compared using the Student t test, while categorical variables were compared using the chi‐square test. All P values are 2‐tailed and P < 0.05 was considered statistically significant. SAS version 8.2 (SAS Institute, Inc, Cary, NC) was used for statistical analysis.
RESULTS
Data were collected on 119 consecutive ICU patients over 4 months (Table 1). Antimicrobials were started for suspected infection in 80/119 (67%) patients, for prophylaxis in 55/119 (46%) patients, and for other reasons in 42/119 (35%) patients. More than one indication was present during the patient's ICU admission among 41/119 (34%) patients, while for 6/119 (5%) patients, no antimicrobials were prescribed at all. Among these patients, antimicrobials were administered on 250 occasions, including 125/250 (50%) occasions for suspected infection (empirical decisions), 62/250 (25%) occasions for procedural prophylaxis (prophylaxis‐driven), and on 63/250 (25%) occasions for other reasons (antimicrobial changes following receipt of culture results, or continuation of antimicrobials prescribed prior to ICU admission). Microbiological cultures were obtained from the study population on 2132 occasions, including 395 blood cultures in which significant organisms (not reflecting contamination) grew on 57/395 (14%) occasions.
| No. (%) or Mean SD | |
|---|---|
| N = 119 | |
| |
| Demographics | |
| Male gender | 66 (55) |
| Age (years) | 53 25 |
| Hospital admission prior to ICU admission | 62 (52) |
| Independent functional capacity | 99 (83) |
| Etiology for ICU admission* | |
| Surgery | 82 (69) |
| Elective | 12 (10) |
| Emergency | 70 (59) |
| Trauma | 41 (34) |
| Medical | 26 (22) |
| Comorbidities | |
| Prior antimicrobial therapy | 48 (40) |
| Severe cardiac disease | 12 (10) |
| Severe respiratory disease | 5 (4) |
| Diabetes mellitus | 22 (18) |
| Liver disease | 10 (8) |
| Dialysis | 5 (4) |
| APACHE II score | 15 8 |
| Outcome | |
| ICU length of stay (days) | 13 15 |
| Hospital length of stay (days) | 36 32 |
| ICU mortality | 16 (13) |
| Hospital mortality | 22 (18) |
Among the empiric antimicrobial start decisions, infection was defined by the study ID specialist on 67/125 (54%) occasions, representing the clinicians' diagnostic accuracy. These infections included 17 (25%) respiratory, 16 (24%) abdominal, 13 (19%) soft tissue, 11 (16%) blood stream, 6 (9%) urinary, and 4 (6%) other infections.
Three attending clinicians treated patients during the study period, and their accuracies were similar (21 infections defined/44 start decisions for suspected infection, 48%; 24/38, 63%; 22/43, 51%, for each attending; P = ns for all comparisons). Clinician accuracy was higher for empirical antimicrobial start decisions, made within 48 hours of ICU admission, compared to later decisions (35 defined infections/53 early antibiotic start decisions [66%] vs 32 defined infections/72 late antibiotic start decisions [44%]; P = 0.02).
In a sensitivity analysis, decreasing the cutoff for the study ID specialist's definition of infection from probable (and above) to possible (and above) lead to reclassification of 14/125 (11%) antimicrobial start decisions from no infection defined to infection defined. This increased physician accuracy from 67/125 (54%) to 78/125 (62%), and conversely decreased potential antimicrobial overuse from 58/125 (46%) to 47/125 (38%) decisions (P = ns).
When starting antimicrobials for suspected infection, the clinicians were asked to record their certainty in the presence of infection. Infections were defined on 6/19 (31%) occasions when the clinician certainty score was low (2) versus 61/106 (57%) when the clinician certainty score was high (3, P = 0.037; Figure 2). Correlation between the clinician certainty score and the presence of defined infection was good (r2 = 0.78).
The study ID specialist agreed with the clinician's decision to start antimicrobial therapy on 87/125 (70%) occasions. Infection was subsequently defined on 66/87 (76%) occasions, representing the study ID specialist's diagnostic accuracy. The study ID specialist's accuracy was significantly higher than the clinician's (66/87 [76%] versus 67/125 [54%]; P = 0.001). Notably, there was only 1 case (3%) where empiric therapy was deemed unnecessary by the study ID specialist, and where infection was subsequently defined. In this case, the clinicians started antibiotic therapy for suspected ventilator‐associated pneumonia in a 66‐year‐old patient on the 28th day of an ICU admission for head and spinal cord trauma. The ID specialist's certainty for the presence of infection was 3probable. The patient ultimately survived and was discharged to a rehabilitation facility.
Comparing physiological data for antimicrobial start decisions with high clinician certainty (score 3) versus low certainty of infection (score 2), revealed that none of the physiological data, nor changes over time were significantly associated with clinician certainty. Further use of high doses of vasopressors (>0.1 mcg/kg/min, SOFA score 4) was present at 42/106 (40%) high certainty decisions versus 7/19 (37%) low certainty decisions (P = 0.819). This underscores the physicians' difficulty in distinguishing between infectious and inflammatory causes of deterioration (Table 2).
| Low Certainty* N = 19 | High Certainty N = 106 | ||
|---|---|---|---|
| Mean SD | Mean SD | P Value | |
| |||
| SIRS elements | |||
| Temperature (C) | 37.7 1.2 | 37.3 1.6 | 0.28 |
| WBC count ( 109/liter) | 16.7 8.1 | 15.9 10.5 | 0.72 |
| Pulse (rate/min) | 112 23 | 110 21 | 0.58 |
| Respiratory rate (rate/min) | 22 8 | 22 8 | 0.90 |
| Number of SIRS criteria (at antimicrobial start) | 3.0 0.9 | 3.2 0.9 | 0.24 |
| Change in number of SIRS criteria (24 h) | 0.1 0.9 | 0.0 0.9 | 0.68 |
| Change in number of SIRS criteria (48 h) | 0.0 0.7 | 0.3 0.9 | 0.36 |
| SOFA score elements (points) | |||
| Respiratory | 1.6 1.1 | 1.9 1.2 | 0.45 |
| Neurological | 1.8 1.7 | 2.0 1.6 | 0.50 |
| Coagulation | 0.6 1.1 | 0.6 1.1 | 0.85 |
| Hepatic | 0.6 0.8 | 0.4 0.8 | 0.37 |
| Renal | 0.7 1.1 | 0.8 1.1 | 0.51 |
| Cardiovascular | 1.5 1.9 | 1.8 1.9 | 0.47 |
| SOFA score day at antimicrobial start | 6.7 3.1 | 7.3 4.6 | 0.58 |
| SOFA score change (previous 24 h) | 1.5 3.2 | 1.0 2.9 | 0.56 |
| SOFA score change (previous 48 h) | 3.1 4.4 | 1.5 4.3 | 0.25 |
During the study period, 2541 days of antimicrobial therapy were given of which 1677 (66%), 413 (16%), and 451 (18%) were given, respectively, empirically (for suspected infection), for procedural prophylaxis, and as targeted therapy. Antimicrobial course length was 11.5 9.2 days in the presence of defined infection versus 10.7 9.1 days in the absence of defined infection (P = 0.655). Overall, 658/2541 (26%) days of therapy could potentially have been saved by reducing antimicrobial prescriptions for suspected infections which were not defined.
DISCUSSION
The use of empirical antimicrobials could be justified by the presence of defined infection on only 54% of occasions when they were administered, suggesting considerable potential overuse of these drugs. ICU‐clinician certainty for the presence of infection correlated well with the number of infections actually defined, however, infections were defined when certainty was low (Figure 2) and antimicrobials prescribed even when clinician certainty was minimal. Common clinical physiological and laboratory parameters did not seem to assist in the clinicians' decision‐making, as there were no significant differences in any of these values between empiric decisions with high or low certainty. The study ID specialist showed significantly better accuracy in antimicrobial decision‐making than the ICU clinicians. He agreed with antimicrobial administration on only 70% of occasions that clinicians started empiric therapy, and had a higher diagnostic accuracy at a cost of only 1 untreated infection.
Two main possibilities are suggested to explain the potential antimicrobial overuse. First, ICU physicians are loath to leave infections untreated and potentially cause immediate increases in mortality.8 This leads to uncertainty avoidance or risk aversive behavior that is demonstrated in our study by the inclusion of antimicrobial administration decisions made even when physicians' certainty regarding the presence of infection was low. Uncertainty avoidance has been shown to be significantly associated with antimicrobial prescribing practices,13 however, it discounts the risk of antimicrobial complications associated with unnecessary antimicrobial therapy. Second, the diagnosis of infection, and particularly nosocomial infection, in ICU patients is difficult. Symptoms cannot be elicited in obtunded ventilated ICU patients, the physical exam can be equivocal, bacterial growth in cultures (with the exception of blood cultures) often reflects colonization rather than infection, and the laboratory and imaging findings of inflammation and infection are very similar. Our data demonstrated some of these difficulties. Diagnostic accuracy was higher in infections suspected during the first 48 hours of ICU admission when compared to later, presumably as infection leading to ICU admission is associated with symptoms, signs, and an acute change in the patient's condition, factors that may be absent when a patient develops a nosocomial infection. Further, physiological parameters did not correlate with the certainty that ICU clinicians expressed in their decision, indicating the difficulty in interpreting these data. Finally, infection was defined in 30% of low certainty decisions, indicating that clinical impression alone is not a reliable tool for determining the presence of infection.
Three sets of interventions could be suggested to improve antimicrobial decision‐makingincreased use of the ID consult, improved laboratory tests for the diagnosis of infection, and a policy of de‐escalation. Use of antimicrobial stewardship (often through involvement of an ID physician) reduces antimicrobial usage and the occurrence of resistant bacteria without adverse patient outcomes.14 Indeed, our study ID consult showed more accurate antimicrobial prescribing than the ICU clinicians, although he may have been subject to the potential biases described below. All antimicrobial administration decisions taken during the study were, however, made in consultation with the clinical ID consult. The lower performance of the clinical ID consult (when compared to the study ID consult) may have resulted from difficulties in the real‐time interaction with the clinicians or from decisions taken during non‐office hours. During non‐office hours, the on‐call ICU resident presented cases to an on‐call ID specialist, neither of whom may have been familiar with all the complex case details and therefore may have preferred to err by commission than by omission.
More accurate laboratory tests, such as procalcitonin or real‐time bacterial polymerase chain reaction (PCR),15 could be beneficial as they might increase physician confidence in decision‐making. Procalcitonin has been used in a wide variety of settings1618 (including the ICU1921) to safely decrease antimicrobial starts and/or antimicrobial course length. Despite this, in a large multicenter study of procalcitonin use in ICU patients,19 compliance with the antibiotic start protocol was very low. Antibiotics were administered by the participating physicians in 73/93 (78%) cases where the procalcitonin tests indicated that antimicrobials were not required, representing protocol violations. In parallel to our study, this demonstrates the reluctance of physicians to abstain from prescribing antimicrobial therapy for suspected infection even when the likelihood of infection may be low.
A strategy of de‐escalation offers the possibility of starting broad‐spectrum antimicrobials early and, subsequently, narrowing or stopping therapy according to the clinical course and the microbiological results.22, 23 This strategy allows clinicians to start antimicrobials even when the suspicion of infection is low, but to stop them rapidly as the clinical picture clarifies. Unfortunately, the mean antimicrobial course length in this study was not influenced by the presence of infection, indicating that this strategy was not employed successfully.
The proportion of patients prescribed antimicrobials for suspected infection in our study is similar to that found in others (eg, 34% of patients in a large French survey24). The proportion of potentially unnecessary antimicrobials in other studies is also similar, ranging from 14% to 50%.2428 In the ICU, the majority of antimicrobial usage studies are microbiology‐based and examine whether bacteria cultured are resistant to the antimicrobials chosen. They have shown that inappropriate antimicrobial therapy occurs on 20%36% of occasions.6, 7, 29 The current study furthers knowledge on antimicrobials decision‐making in the ICU, by examining the actual requirement for antimicrobial therapy based on the presence of infection, ie, whether antimicrobials were needed at all.
The principal limitation of the study concerns the determination of the presence of infection. The study premise was that antimicrobials are overused, and this may have biased the study ID consult to underestimate appropriateness of antimicrobial therapy and to define fewer infections. Further, making theoretical decisions in the research office avoids the medical, ethical, and legal issues related to clinical practice, as there is no risk associated with error. This may have allowed the study ID specialist to be overly conservative in his definitions of infections. A wider team of decision‐makers to determine the presence of infection, including both ID and ICU specialists, would have lent more weight to their determinations, however, this was logistically impossible. To limit the potential bias, infections were defined as objectively as possible based on the CDC criteria.12 Further, the sensitivity analysis showed that while decreasing the study ID specialist's threshold for the definition of infection from probable and above to possible and above improved physician accuracy, over a third of antimicrobial start decisions remained unjustified by the presence of defined infection. The study was performed in only 1 center and may not reflect general ICU practice, although, as discussed above, the antibiotic decision‐making accuracy is in the same orders of magnitude as those found in other somewhat similar studies. Finally, even if unnecessary antimicrobial use was overestimated, the possibility for significant improvement in antimicrobial administration accuracy remains.
In conclusion, our data suggest that on up to 46% of occasions, empirical antimicrobials are prescribed in the absence of infection. We suggest that the potential antibiotic overuse results from difficulties in diagnosing ICU‐related infections, and from the high perceived risk of untreated infection as compared to the risks of potentially unnecessary antimicrobial therapy, representing a type of risk aversive behavior. As antimicrobial use is the primary factor promoting antibiotic resistance and may be a cause of other patient complications, efforts to improve antimicrobial‐related decision‐making should be mandatory.
- ,.Antimicrobial‐drug resistance.N Engl J Med.1996;335:1445–1453.
- ,,, et al.Emergence of a new antibiotic resistance mechanism in India, Pakistan, and the UK: a molecular, biological, and epidemiological study.Lancet Infect Dis.2010;10:597–602.
- ,,, et al.Surveillance of antimicrobial use and antimicrobial resistance in United States hospitals: project ICARE phase 2. Project Intensive Care Antimicrobial Resistance Epidemiology (ICARE) hospitals.Clin Infect Dis.1999;29:245–252.
- ,,, et al.International study of the prevalence and outcomes of infection in intensive care units.JAMA.2009;302:2323–2329.
- ,,,,.Clinical importance of delays in the initiation of appropriate antibiotic treatment for ventilator‐associated pneumonia.Chest.2002;122:262–268.
- ,,,.Inadequate antimicrobial treatment of infections: a risk factor for hospital mortality among critically ill patients.Chest.1999;115:462–474.
- ,,, et al.Initiation of inappropriate antimicrobial therapy results in a fivefold reduction of survival in human septic shock.Chest.2009;136:1237–1248.
- ,,, et al.Surviving Sepsis Campaign: international guidelines for management of severe sepsis and septic shock: 2008.Crit Care Med.2008;36:296–327.
- ,,,,.Investigation of critical care unit utilization and mortality in patients infected with Clostridium difficile.J Crit Care.2010;25:282–286.
- American College of Chest Physicians/Society of Critical Care Medicine Consensus Conference:definitions for sepsis and organ failure and guidelines for the use of innovative therapies in sepsis.Crit Care Med.1992;20:864–874.
- ,,, et al.The SOFA (Sepsis‐related Organ Failure Assessment) score to describe organ dysfunction/failure. On behalf of the Working Group on Sepsis‐Related Problems of the European Society of Intensive Care Medicine.Intensive Care Med.1996;22:707–710.
- ,,.CDC/NHSN surveillance definition of health care‐associated infection and criteria for specific types of infections in the acute care setting.Am J Infect Control.2008;36:309–332.
- ,,, et al.Are cultural dimensions relevant for explaining cross‐national differences in antibiotic use in Europe?BMC Health Serv Res.2008;8:123.
- ,,,,,.Impact of antimicrobial stewardship in critical care: a systematic review.J Antimicrob Chemother.2011;66:1223–1230.
- ,,, et al.A multicenter trial to compare blood culture with polymerase chain reaction in severe human sepsis.Intensive Care Med.2010;36:241–247.
- ,,, et al.Procalcitonin guidance of antibiotic therapy in community‐acquired pneumonia: a randomized trial.Am J Respir Crit Care Med.2006;174:84–93.
- ,,, et al.Effect of procalcitonin‐based guidelines vs standard guidelines on antibiotic use in lower respiratory tract infections: the ProHOSP randomized controlled trial.JAMA.2009;302:1059–1066.
- ,,, et al.Antibiotic treatment of exacerbations of COPD: a randomized, controlled trial comparing procalcitonin‐guidance with standard therapy.Chest.2007;131:9–19.
- ,,, et al.Use of procalcitonin to reduce patients' exposure to antibiotics in intensive care units (PRORATA trial): a multicentre randomised controlled trial.Lancet.2010;375:463–474.
- ,,,,.Use of procalcitonin to shorten antibiotic treatment duration in septic patients: a randomized trial.Am J Respir Crit Care Med.2008;177:498–505.
- ,,, et al.Procalcitonin for reduced antibiotic exposure in ventilator‐associated pneumonia: a randomised study.Eur Respir J.2009;34:1364–1375.
- ,,, et al.Consensus document on controversial issues for the treatment of hospital‐associated pneumonia.Int J Infect Dis.2010;14(suppl 4):S55–S65.
- ,, et al.Guidelines for the management of adults with hospital‐acquired, ventilator‐associated, and healthcare‐associated pneumonia.Am Respir Crit Care Med.2005;171:388–416.
- ,,, et al.Strategies of initiation and streamlining of antibiotic therapy in 41 French intensive care units.Crit Care.2011;15:R17.
- ,,,.Antibiotic use at Duke University Medical Center.JAMA.1977;237:2819–2822.
- ,.A study of antimicrobial misuse in a university hospital.Am J Med Sci.1978;275:271–282.
- ,,,,.Unnecessary use of antimicrobials in hospitalized patients: current patterns of misuse with an emphasis on the antianaerobic spectrum of activity.Arch Intern Med.2003;163:972–978.
- ,,, et al.Interventions to improve antibiotic prescribing practices for hospital inpatients.Cochrane Database Syst Rev.2005;CD003543.
- ,,, et al.Patterns of antimicrobial therapy in severe nosocomial infections: empiric choices, proportion of appropriate therapy, and adaptation rates—a multicentre, observational survey in critically ill patients.Int J Antimicrob Agents.2010;35:375–381.
Copyright © 2012 Society of Hospital Medicine
Applying Education Theory to Vascular Training
Citing a revolution in the way surgeons learn their craft, Dr. Erica L. Mitchell and Dr. Sonal Arora present an analysis of vascular training to identify key learning points and needs as residents move from novice to expert. Their report is in the August issue of the Journal of Vascular Surgery.
A shift toward competency-based training programs is now reflecting a growing emphasis on outcomes-based medical education, according to Dr. Mitchell and Dr. Arora. They discuss how pedagogy and adult learning tools can be applied to vascular training and the development of technical expertise (J Vasc Surg 2012;56:530-7).
"Surgical educators should use training and assessment methods soundly based in educational principles to develop and deliver curricula that will allow trainees to acquire the skills befitting the modern vascular surgeon," they concluded.
Find the original article by clicking here.
FROM THE JOURNAL OF VASCULAR SURGERY
Labs Find Evidence of Cancer Stem Cells
In an era of targeted cancer therapies, laboratory scientists working with mice may have found the ultimate target – a reservoir of stem cells that drive cancers to grow and metastasize.
Separate reports in the journals Science and Nature document the presence of cancer stem cells in intestinal adenomas (Science 2012 Aug. 1 [doi:10.1126/science.1224676]), squamous skin cancer, (Nature 2012 Aug. 1 [doi:10.1038/nature11344]), and glioblastoma multiforme (Nature 2012 Aug. 1 [doi:10.1038/nature11287]).
In the last study, mice with these highly lethal brain tumors were given temozolomide (Temodar), an approved treatment in humans, along with ganciclovir, an antiviral. Despite a transient therapeutic response to chemotherapy, the cancers continued to grow, driven by "a relatively quiescent subset of endogenous glioma cells, with properties similar to those proposed for cancer stem cells," the authors wrote.
Whether these reports will resolve controversy over the existence of stem cells or lead to clinically meaningful treatments remains to be seen. There is no doubt, however, that they will lead to further investigation.
Drug-Drug Interactions Added to Hepatitis C Drug Label
New information about interactions between boceprevir and several other drugs has been added to the prescribing information for the antiviral drug, the Food and Drug Administration announced Aug. 1.
Boceprevir (Victrelis), a protease inhibitor approved for treating hepatitis C in 2011, interacts with cyclosporine, tacrolimus (Prograf), escitalopram (Lexapro), atorvastatin (Lipitor), and pravastatin (Pravachol), according to the FDA statement.
The new information states that, when administered with boceprevir, exposure to atorvastatin increases. When the two drugs are used together, the lowest effective dose of atorvastatin should be used, not to exceed a daily dose of 40 mg, according to the FDA.
Dose adjustments of cyclosporine should be anticipated when it is given with boceprevir, and "should be guided by close monitoring of cyclosporine blood concentrations, and frequent assessments of renal function and cyclosporine-related side effects."
When administered with boceprevir, exposure of escitalopram "was slightly decreased," the statement said. Although selective serotonin reuptake inhibitors (SSRIs) such as escitalopram have a wide therapeutic index, it may be necessary to adjust the dosage when it is administered with boceprevir.
Coadministration of boceprevir with pravastatin increases exposure to pravastatin, but pravastatin can be started at the recommended dosage when coadministered with boceprevir. "Close clinical monitoring is warranted," the statement said.
Giving tacrolimus and boceprevir together "requires significant dose reduction and prolongation of the dosing interval for tacrolimus, with close monitoring of tacrolimus blood concentrations and frequent assessments of renal function and tacrolimus-related side effects," the statement said.
Boceprevir is manufactured in a capsule formulation by Merck Sharp & Dohme Corp., a subsidiary of Merck & Co., and is taken by mouth three times a day.
The drug-drug interaction data are from in vivo drug interaction trials, which the company conducted as part of its postmarketing commitments.
At a meeting in April 2011, an FDA advisory panel enthusiastically supported the approval of boceprevir for treating hepatitis C infection because of the antiviral’s efficacy but emphasized that postmarketing studies on interactions with other drugs, including antidepressants, were needed.
Serious adverse events associated with boceprevir should be reported to MedWatch or by phone at 800-332-1088.
Report: Pharmacist-Led Interventions Don’t Reduce Medication Errors Post-Discharge
At first blush, some hospitalists might see it as bad news that a recent report found a pharmacist-assisted medication reconciliation ("med rec") intervention did not significantly reduce clinically important medication errors after discharge. But a deeper reading of the study tells a different story, says a hospitalist who worked on the report.
"This is the latest in our growing understanding of the roles of certain interventions on transitions of care," says Jeffrey Schnipper, MD, MPH, FHM, director of clinical research and an associate physician in the general medicine division at Brigham and Women's Hospitalist Service in Boston, and co-author of the study "Effect of a Pharmacist Intervention on Clinically Important Medication Errors after Hospital Discharge." "What I don't want to have happen is for people to read this article ... and say, 'Oh, pharmacists don't make a difference.' They absolutely make a difference. This is a more nuanced issue of who do they have the biggest impact with, and 'On top of what other interventions are you doing this?'"
The researchers set out to determine whether a pharmacist-delivered intervention on patients with low health literacy (including a post-discharge telephone call) would lower adverse drug events and other clinically important medication errors. They concluded that it did not (unadjusted incidence rate ratio, 0.92 [95% CI, 0.77 to 1.10]).
Dr. Schnipper says the impact was likely muted because the patients studied had higher health-literacy levels than researchers expected. Also, because most follow-up phone calls occurred within a few days of discharge, the intervention failed to capture any events that happened in the 30 days after discharge.
He also notes that the institutions that participated in the study have already implemented multiple med-rec interventions over the past few years. Hospitals that have not focused intently on the issue could find much larger gains from implementing pharmacist-led programs.
"If you're a hospital that has not been fixated on improving medication safety and transitions of care, I think pharmacists are huge," Dr. Schnipper says. "The key, then, is to focus them on the highest-risk patients."
Insurers Promote Collaborative Approach to 30-Day Readmission Reductions
Although Medicare's looming financial penalties for hospitals with excessive readmissions might seem like a blunt weapon, private health plans often have the flexibility to negotiate with partnering hospitals around incentives for readmissions prevention.
"We have arrangements with private insurance companies where we put at risk future compensation, based on achieving negotiated readmissions results," says Mark Carley, vice president of managed care and network development for Centura Health, a 13-hospital system in Colorado.
Payors, including United Healthcare, have developed their own readmissions programs and reporting mechanisms, although each program’s incentives are a little different, Carley says. Target rates are negotiated based on each hospital's readmissions in the previous 12-month period and national averages. The plan can also provide helpful data on its beneficiaries and other forms of assistance, because it wants to see the hospital hit the target, he adds. "If the target has been set too high, they may be willing to renegotiate."
But the plan doesn't tell the hospital how to reach that target.
"Where the complexity comes in is how we as a system implement internal policies and procedures to improve our care coordination, discharge processes, follow-up, and communication with downstream providers," says Carley. Centura Health's approach to readmissions has included close study of past performance data in search of opportunities for improvement, fine-tuning of the discharge planning process, and follow-up phone calls to patients and providers.
"In addition, we are working with post-acute providers to provide smoother transitions in the discharge process," he says.
Transfusion Rates Vary Widely at Academic Hospitals
Wide variations in perioperative blood transfusion rates among patients undergoing major noncardiac procedures across U.S. hospitals highlight the need to further investigate evidence-based "transfusion triggers" in this population of surgical patients, according to a study published ahead of print in Annals of Surgery.
"In light of the increased risk of mortality and major complications associated with blood transfusion, the extensive variability in hospital transfusion practice in noncardiac surgery may represent an important opportunity to improve surgical outcomes," wrote Feng Qian, Ph.D., of the University of Rochester (N.Y.), and associates.
The researchers used the University HealthSystem Consortium hospital database to compare transfusion rates of allogeneic red blood cells, fresh frozen plasma, and platelets in patients undergoing elective primary total hip replacement (54,405 patients), colectomy (21,334), or pancreaticoduodenectomy (7,929) at 77 hospitals between June 2006 and September 2010. Most of the hospitals were teaching hospitals with at least 500 beds.
Transfusion rates varied widely before and after adjustment for comorbidities and other patient risk factors. Patients who were treated in hospitals with high rates of transfusions were about twice as likely to receive a blood transfusion as were patients at hospitals with average transfusion rates (Ann. Surg. 2012 July 13[doi:10.1097/SLA.0b013e31825ffc37]).
In hospitals where the transfusion rate for one procedure was high, transfusion rates also tended to be high for the other two procedures. There was some evidence indicating that a higher volume of surgical cases was associated with lower transfusion rates.
After adjusting for patient risk factors, the authors determined that transfusion rates for the different blood components among those undergoing a total hip replacement ranged from 1.3% to almost 75% (red blood cells), from 0.1% to 7.7% (fresh frozen plasma), and from 0.1% to 2% (platelets). Among colectomy patients, transfusion rates ranged from 1.9% to 47.8% (RBCs), from 1.4% to 17.7% (fresh frozen plasma), and from 1.3% to 6.2% (platelets). Among those undergoing a pancreaticoduodenectomy, the rates ranged from 3% to 78.6% (RBCs), from 1% to 47% (fresh frozen plasma), and from 1.4% to 12.6% (platelets).
The variability, the authors said, "reflects, in part, the complexity of the medical decision-making process underlying transfusion therapy." Because the data included patients from 90% of academic medical centers in the United States, the results provide "a broad and contemporary picture of transfusion practices in academic surgical centers" and "reflect transfusion practices that are being taught to the next generation of academic and private-practice clinicians during residency training," they noted.
To the best of their knowledge, the authors said, there are no large randomized studies that have compared liberal and restrictive transfusion strategies in noncardiac surgery patients, and they believe that such trials are "urgently needed to better define evidence-based transfusion triggers for patients undergoing noncardiac surgery."
The study was supported by a grant from the Agency for Healthcare and Quality Research and funding from the department of anesthesiology at the University of Rochester. No disclosures were reported by the authors.
FROM THE ANNALS OF SURGERY
Major Finding: Transfusion rates of red blood cells, fresh frozen plasma, and platelets among patients undergoing noncardiac procedures varied widely across different U.S. academic-affiliated hospitals.
Data Source: Data from a national database of academic medical centers were used to compare transfusions in patients undergoing one of three elective noncardiac surgical procedures at 77 academic hospitals between June 2006 and September 2010.
Disclosures: The study was supported by a grant from the Agency for Healthcare and Quality Research and funding from the department of anesthesiology at the University of Rochester (N.Y.). The authors reported no disclosures.
Understanding PTSD
Getting to Goal: How Thiazide-Type Diuretics, Following the Guidelines, and Improving Patient Adherence Can Help
An estimated 1 of every 3 Americans has hypertension, putting them at an increased risk for cardiovascular disease, heart failure, stroke, and kidney disease. Despite the availability of effective medications to control high blood pressure, only half of the patients with hypertension under treatment are meeting their blood pressure goals. To address these gaps in the quality of care patients receive, this supplement will focus on the following topics in hypertension management: key clinical trials and their influence on sequencing algorithms; the differences between thiazide-type diuretics; the use of thiazide-type diuretics in African American patients; and strategies to improve patient adherence to hypertensive therapy.
Webcast—October 2012