User login
The Laborist Movement

It is hard to think of medical hospitalists as the establishment, but with more than 30,000 hospitalists nationwide working at most U.S. hospitals, HM is a firm part of today’s medical practice. While, dare I say, “traditional” HM is still very much in its evolution, other specialties of HM have not only cropped up on the scene, but some also have developed enough of a presence to be worthy of drawing some early conclusions.
OB-GYN hospitalists, also known as laborists, now practice at more than 100 hospitals in more than 35 states, according to http://obgynhospitalist.com. In many ways, the OB hospitalist movement is tracking the HM movement of 10 years ago. Although there are several similarities, there are more differences than just what the doctors do in their medical practices.
New “Partners” Drive Down Costs
HM has been driven as much by hospital payment by DRGs as anything else. As hospitals realized that hospitalists could better utilize resources and still maintain quality, the ability to reduce length of stay allowed hospitals to have the capital to support the early development of HM groups.
In obstetrics, the ability of laborists to reduce liability risks, and therefore malpractice premiums, for the hospital is a major driver of the recent growth in OB-GYN hospitalist groups. Some hospitals have been able to reduce the amount they must hold in reserve for future OB-related malpractice claims by more than $1 million after the first year of starting a laborist program. Additionally, hospitals’ annual malpractice premiums have dropped significantly.
Availability of on-site hospitalists has played a crucial role in this new delivery model for most of the hospitalist specialties. For hospitals with laborists, this has meant a significant decrease (for some, a total relief) in unattended deliveries, which in some hospitals was as high as 10% before the new breed of hospitalist arrived on the scene. This 24/7 obstetrician presence has reduced complications from many labor and delivery emergencies, and has led to improved patient safety and improved overall performance at the crucial moment of delivery. This is especially true for high-risk and emergency situations.
Just as in the rest of HM, the 24/7 availability has been complementary, not competitive, to community-based obstetricians: Unassigned patients now have someone to deliver their baby; community obstetricians have a hospital-based “partner” who is ready to fill any gaps in the community obstetricians’ presence in the hospital; and there is a ready assistant surgeon to those patients who require a C-section delivery.
Solution to the Insane Schedule?
The advent of laborists also has created some key professional options for established OB-GYN physicians, as well as for those just coming out of training. Some older obstetricians would stop delivering babies altogether, even though they enjoyed that part of their practice, because of the time demands on having to simultaneously deliver babies randomly in the middle of the night, then show up the next day for a full gynecology surgery schedule or office practice. Their only option seemed to be to concentrate on gynecology and shelve the obstetrics. Now, community obstetricians can partner with the laborists and still provide prenatal care and perform some deliveries, or they can leave their private OB-GYN practice altogether and become full-time OB hospitalists.
This point was driven home recently when a hospital in Oregon started an OB hospitalist group and needed only four hospitalists. The hospital received more than 40 applications, most from practicing obstetricians.
This points to another difference with laborists. You can start a fully staffed group with just four OB hospitalists, each working a 24-hour shift every third day. Medical HM groups might start out with four hospitalists, but they quickly need to grow to 10, 15, or more as responsibilities for more unassigned patients, surgical comanagement, etc., require more hands on deck.
The similarities between OB hospitalists and the rest of HM include the increased demand for accountability for patient safety and for meeting measureable performance standards, which are difficult to achieve while practicing both in the acute setting of the hospital and the more chronic setting of an office-based practice. In addition, there is a clear movement afoot for significant evolution in medical practice more broadly, where younger, and even established, physicians are looking for a more predictable lifestyle and compensation in a medical world that is clearly shifting to a new model.
Change Is All Around
In some specialties, predictability has led to the narrowing of practice by setting or subspecialty. For example, OB-GYNs are selecting to focus solely on gynecology, OB hospital medicine, or prenatal care. In general internal medicine, there are those who only do office-based medicine and those who are hospitalists. Some surgeons are now doing shifts as acute-care surgeons and limiting their practice to just inpatient care.
As much as a change in practice style, there is a resurgence of employment of physicians, either by medical groups, independent physician organizations, or hospitals. Even the strong, revenue-producing specialties like cardiology are seeing a new paradigm. Today, almost 60% of cardiologists are employed by some entity, and 38% of cardiologists are employed by the hospital.
As healthcare reform, payment reform, and new entities like accountable care organizations (ACOs) take shape, physician-provided medical care is moving from a cottage industry of individual and small group private practice to employment and amalgamation.
Change is inevitable, and it is coming from a variety of viewpoints. Patients want better access to the best and safest care available. America’s businesses and the government, which fund healthcare, want predictable costs and measurable quality for the care they buy. Physicians want help in meeting new standards, predictable compensation for their work, and a lifestyle that meets their professional and personal aspirations.
The movement to the hospitalist model, first in the care of medical patients, and more recently for obstetrical, surgical, and other patients, is just one piece of a medical system in evolution. Stay tuned. We are still very much at the early stages of this course change. We all still have much work to do to create a future that works for our patients, our funders, and our providers of healthcare. TH
Dr. Wellikson is CEO of SHM.
Words Forever Lost

She couldn’t have been more than two weeks old, a newborn. Tussling in her mother’s arms just outside the patient’s room, she let out a gurgle of a cry. Her two brothers, twins by the look of it, clung to Mom’s pant leg for answers. Mom was speechless, tears burning lava tracks down her face. Her husband lay splayed as the centerpiece on display. Cords draped his chest, radioing green tachycardia to an overhead monitor. The man’s breathing was a tangle of labored dyspnea, harsh coughing and raw panic. A nurse suctioned his mouth while an intern vultured over his wrist, eagerly attempting his first arterial line.
I surveyed this scene through the unsullied eyes of a medical student, figuratively clinging to my resident’s pant leg for answers. I was young, confused, and scared by the drama. I didn’t know it yet, but by morning light, this “great case” would morph from “a 29-year-old with acute lymphoblastic leukemia complicated by severe community-acquired pneumonia” to one of the most powerful lessons of my career.
A lesson I wasn’t intended to learn.
Hidden Curriculum
For those of you unfamiliar with the term, the “hidden curriculum” is the things we are “taught” when no one thinks they are teaching. It’s not what teachers necessarily say; it’s how they say it, how they act, what they do. It’s nearly always unconscious, unintentional. We learn these things by watching people interact, the inflections and tone of their voices, their bedside manner, the way they treat staff and patients.
This is not just an issue for teaching hospitalists who are imparting these unwitting lessons daily. Rather, it is important to recognize that all of us have been exposed to, and our careers and practices shaped by, these hidden messages. Sometimes these lessons impart such helpful tools as noting how a skilled clinician puts a patient at ease before palpating their abdomen. Other times, the tutorial is less beneficial (e.g. subconsciously teaching bias or impatience). And sometimes the message conveyed is much more malignant.
I, unfortunately, was about to be taught the latter.
Room 118
The man, stripped of his shirt, his pants, his dignity, winced with the pain of the third radial art-line attempt. He tried to hitch himself up in bed, drawing a scowl from the intern who had to readjust his sterile field—a rebuke from the nurse who got lubricant on her shirt. “Can’t you see that I’m trying to place a catheter in your penis?” she implored. Of course he could—as could I, his family, and much of the ICU. That was part of the lesson.
To be fair, I honestly doubt that anyone in room 118 intended to treat Mr. Davis in such a callous way. They didn’t intend to depersonalize the situation—make him an object, another cog in the wheel of their daily grind. They simply were trying to do their jobs—to save this new admission’s life. A noble intention, indeed.
However, in doing this, they employed a career’s worth of defense mechanisms aimed at fending off the stress of a life-threatening situation. And each of these actions moved them ever so slightly away from the compassion that defines our field and toward the seemingly uncaring automatons they had become.
The Lesson Continues
By now, Mr. Davis was breathing 40 times a minute. A neb of medications, a drip of antibiotics, and a facemask of oxygen did little to prevent his slide. Exposed, shivering, lights reflecting off the paunch of his naked stomach, he cried out for his wife. Coming to him, she was halted by the icy stare of the grizzled charge nurse called in to hold the combatant down. “You’re lucky we even allow you in the ICU with those kids,” she thundered.
The ABG was still pending, but the critical-care fellow was confident of its results. To nobody, he declared, “We have to tube this guy.” Terror was etched in the “guy’s” eyes as he searched the room for answers. What does “tubing” mean? he must have wondered. Am I going to die? Would my sons remember me? Would my daughter be OK? How will my wife do it without me?
Again, he called out for his wife.
It didn’t take long for the excitement to reverberate throughout the hospital. A surgical intern stopped by room 118 to see if he could put in any lines, while the respiratory therapist prepared a vent and a few more medical students rubbernecked in the hall. The oncology fellow took a moment to teach us about a recent article she read that showed that pneumonia was uniformly fatal in acute leukemic patients who got intubated. “Do you mean tubing him is essentially a death sentence?” I asked, death confronting me for the first time in my career. Meeting the patient’s eyes, she turned and lowered her voice to reply, leaving me to wonder if this was the kind of thing we should keep secret.
The wife, managing to momentarily penetrate the critical-care zone defense, was holding Mr. Davis’ hand while she filled his ear with whispers. With his daughter’s face mere inches from his, he appeared calmer. He tried to speak but was drowned out by the charge nurse who demanded he remove his wedding band. “But … I … don’t … want … ”
“I know you don’t want to take it off, sir, but you have to,” she demanded, shooing the wife from the bedside. “Your hands are going to get edematous in the next few days and you don’t want me to have to cut it off, do you?” she asked rhetorically. Crestfallen, he extended his ring finger to his wife, as he no doubt did years earlier, an understanding of his fate crossing his face. Missing the cue, the nurse deftly intercepted the ring off his finger, placing it in her pocket as she swooped out of the room to get the intubation kit, leaving Mr. Davis further agitated.
The critical-care fellow lowered the head of the bed, leaving Mr. Davis upright and calling for his wife. “My … ring … ” he panted, his breathing worsening by the breath. “I … need … to tell … my … wife … ” he gasped as the charge nurse thrust him a bit too harshly to the bed, adding that there wasn’t time to talk now—his message would have to wait. “But … ” the patient protested as the sedative coursed into this vein. “I need … her … to … know … ”
“Quiet now, sir, you have to calm down, you’re just making this harder.” The wife tore closer to him, no doubt wondering what could possibly make this harder. “I love you, John,” she said. “I … ” he replied.
The tube slipped in.
Reflections
It’s been 15 years, but I think of this night often. In some ways, I am haunted by it; in many ways, my practice style was fashioned by it; in all ways, I was changed by it. I wonder if the same can be said for the other providers.
I also wonder about Mr. Davis. How did the world look through his eyes? Did he see us as his saviors or his tormentors? Did he worry for his well-being, or was he too absorbed in the welfare of his kids and wife to fret about himself? Did he worry about his kids seeing him sick, the impact that might have on them? Was he scared? How must he have felt to be left so powerless? To have no control over his situation. To have his wedding band taken by a complete stranger. To not be able to give his wife an urgent message.
Did it have to be this way? Could we have better balanced the urgency of the situation with the humanity it required? In doing our jobs, did we have to dismiss the one person who entrusted us to help him?
I also think about how that night influenced me. How it shaped my approach to the patients who privilege me to care for them during their most vulnerable times. I wonder what came of the Davis family. That newborn daughter is learning to drive, the boys preparing for college. And I also wonder what it was John so urgently wanted to tell his wife that night. As, no doubt, does she.
For Mr. Davis died that night, his words forever lost. TH
Dr. Glasheen is associate professor of medicine at the University of Colorado at Denver, where he serves as director of the Hospital Medicine Program and the Hospitalist Training Program, and as associate program director of the Internal Medicine Residency Program.
Health IT Hurdles

I rent cars regularly, and only occasionally do I get the same model twice. I’m ready to roll after spending a couple of minutes becoming familiar with a car that is new to me. I adjust the seat and climate control, etc. I resist fiddling with the radio until later. This seems OK to me.
The last time I started clinical practice in a new hospital, I did almost the same thing: I jumped right in and started seeing patients. Other than being provided with my password to the computer system and a dictation code, I had no orientation at all, not even to the hospital floor plan. This, too, seemed reasonable to me at the time. Now I see it differently.
Levels of Complexity
Years ago, learning a new hospital might not have been a lot more difficult than familiarizing yourself with a new rental car, so there didn’t seem to be much need for a detailed orientation. I’m generalizing here, but if you go back far enough in time, the general idea was that it was almost entirely up to the hospital and its staff to get to know the new doctor and how he or she practiced, rather than the doctor adapting to the hospital’s way of doing things.
While at one time hospitals and their systems might have been as similar to one another as a four-door Chevy is to a four-door Ford, today’s hospitals are far more complex. The appropriate transportation analogy might be one type of airplane to another.
The basics of what keeps a two-seat Cessna and a huge 747 flying are the same, but there are so many critical differences that specific training and certification are required for each. Even an accomplished professional pilot who is an ace in a 747 isn’t automatically certified to pilot a smaller 737. In fact, few professional pilots are certified to fly more than one type of commercial airplane at a time. One way to look at this is that the orientation to the plane is so complex that one person can’t be expected to maintain a high level of familiarity with the systems and operation of more than one at a time.
EHR: A Tipping Point
The complexity and unique attributes of hospitals have been increasing steadily for decades, but it seems to me that electronic health records (EHR) represent a huge increase in complexity. No longer can a doctor simply arrive at the hospital confident in her ability to fly this new plane. She will require a reasonably detailed introduction to the hospital’s EHR as part of an orientation that should ideally take place prior to seeing patients.
I worry that it will be increasingly difficult, and potentially unwise, for a doctor in any specialty to practice at more than one or two hospitals that don’t share the same EHR. If a doctor is not proficient in the use of the EHR at a particular site, two things are likely to happen: First, and most alarmingly, the new doctor would probably unintentionally miss important information in the EHR, or might not have time to contemplate the series of buttons to click to check all potentially relevant information. For example, he might not realize the patient already had a series of blood tests, because accessing them requires some unfamiliar clicks of the mouse.
The other thing that might happen if a doctor is not proficient in the use of the hospital’s EHR is that he might be inclined to consult the hospitalist “just to cover all the bases.” In this case, that might be the same as asking the hospitalist to be involved as an EHR expert, rather than for medical expertise that the patient needs.
I practice at a hospital that recently installed a new information system, and some doctors have joked that if they can’t figure out how to use it, they will just consult a hospitalist to look up historical data, etc. I’m not aware of any study looking at this issue, but I suspect “soft” hospitalist consults increase when a hospital installs a new information system.
Rethink New Employee Orientation
I’m convinced that new doctors in all specialties that anticipate having a hospital patient volume above a predetermined threshold should be required to have a formal orientation to the hospital, especially for its information system. This is really important for hospitalists. Every practice should think carefully about a meaningful process of orientation to the hospital and the hospitalist practice itself. The latter would include things like scheduling issues, training in CPT coding, group governance and culture, etc.
My experience is that multistate hospitalist companies have pretty detailed orientation programs; for one thing, they can use this as a differentiator when marketing their services. But private hospitalist practices and groups employed by a single hospital usually have a pretty loose orientation process. It is tricky to find the sweet spot between valuable orientation activities and so much detail that the new doctor is overwhelmed or bored, and unlikely to remember much of what is presented.
And there certainly is a role for waiting to learn some things as the new doctor begins seeing patients. For example, my feeling is that a general orientation to the floor plan is sufficient and the new hire can best learn the details independently during the course of patient care. However, all hospitalists should have some reasonable level of proficiency in the EHR before seeing their first patients.
Hospital-Certified?
If you accept my premise that hospitals were once reasonably similar, like one rental car to another, but have now become as complex and different as jumbo jets, then we’re led to another question: Will we one day decide that a doctor must be certified to practice in a particular hospital by demonstrating knowledge and competence in that particular hospital’s systems and procedures?
Nearly all present-day credentialing and privileging related to a doctor’s work in a hospital focus on that doctor’s prior training and experience. In the case of pilots, there is a requirement to demonstrate proficiency when making a transition to a new airplane.
Maybe an analogous system of certification for a doctor to “fly” each hospital would be valuable for our patients. If training might not make sense for all doctors, then perhaps limit it to those, such as hospitalists, who will have a really high patient volume at the facility.
It would be dizzyingly complex to create and referee such a certification system, so I’m not sure anything like this will happen in my career. And the last thing I want is another set of bureaucratic hurdles.
But it might be worth thinking about how to ensure doctors at a particular hospital are expert enough in that hospital’s unique systems and operations. Start with your group’s orientation process. TH
Dr. Nelson has been a practicing hospitalist since 1988 and is cofounder and past president of SHM. He is a principal in Nelson Flores Hospital Medicine Consultants, a national hospitalist practice management consulting firm (www.nelsonflores.com). He is also course co-director and faculty for SHM’s “Best Practices in Managing a Hospital Medicine Program” course. This column represents his views and is not intended to reflect an official position of SHM.
ONLINE EXCLUSIVE: Listen to Dr. Ammann discuss the FPHM exam and the reasons she wanted to be among the first to recertify through the focused practice MOC
Click here to listen to Dr. Ammann's interview with TH editor Jason Carris
Click here to listen to Dr. Ammann's interview with TH editor Jason Carris
Click here to listen to Dr. Ammann's interview with TH editor Jason Carris
ONLINE EXCLUSIVE: Listen to HM program directors and hospital execs discuss strategies for negotiating your group's next contract
The Journal at 80 years: ‘Same as it ever was’—sort of

The Journal is currently received by more than 100,000 general internists, cardiologists, hospitalists, and medical subspecialists. It is fully peer-reviewed, listed in MEDLINE, and freely available in complete format at www.ccjm.org. Cleveland Clinic supports the production and distribution of the Journal and provides free CME credits linked to selected articles in an effort to enhance the delivery of high-quality medical care to patients everywhere. The Journal is housed within Cleveland Clinic’s Education Institute, distinct from any direct influence of our marketing or public relations departments—a distinction that I, as editor-in-chief, take extremely seriously. Our primary editorial goal is, and has been, to provide relevant and useful clinical knowledge to the medical community.
The Journal began as the Cleveland Clinic Bulletin in 1931, morphing into the Cleveland Clinic Quarterly the following year and into the Cleveland Clinic Journal of Medicine in 1987. The Quarterly published reprints of papers published elsewhere, as well as case reports and scholarly work presented by Clinic physicians at their staff meetings. Perhaps the latter content was intended to compete with that published in the Proceedings of the Staff Meetings of the Mayo Clinic (first appearing in 1926). Dr. George Crile, one of the founders of Cleveland Clinic, was intent on putting the medical and scientific work of the Clinic in the limelight of American medicine. He felt back in 1931 the same as we feel now, 80 years later, that the Journal contributes to the three pillar missions of the Clinic: better care of the sick, investigation of their problems, and further education of those who serve.
In 1934, the Quarterly ceased publishing reprints from other journals, and Clinic staff were encouraged to publish their case reports, topic reviews, and clinical series in the Quarterly. Over the years, some articles reflected practice at the Clinic and included a description of 1,000 consecutive patients with irritable colon (1941), a description of 10,744 patients who underwent coronary revascularization (1976), and a report of cardiac complications in 951 patients who underwent peripheral vascular surgery (1982). Also notable was the description of the “LE prep test” for the diagnosis of systemic lupus erythematosus (1949).
I am the eighth physician editor-in-chief of the Journal. Three of us have been rheumatologists (perhaps we read more, and cost less). We each have had the opportunity, along with input from the Journal editorial staff, to change the appearance, the content, and sometimes the editorial direction of the Journal. Following the lead of my preceding editor Dr. John Clough and former publisher Linda K. Hengstler, we publish monthly, continue to expand our online content, and publish only peer-reviewed teaching articles and reviews—no longer case reports or original research. We try to address the practical challenges faced by our readers as they strive to deliver quality medical care. We continue to expand our CME offerings, linking with our CME center and working with Dr. Tim Gilligan (our deputy editor) to enhance the educational quality of the Journal-related CME activities.
And always, we emphasize the need for articles to be accurate, timely, relevant to our readership, and perhaps most important, readable. To accomplish the last, our editorial staff includes several talented medical editors and writers—notably Ray Borazanian, Phil Canuto, and Dave Huddleston—who work with our authors on every article we publish. Art directors Joe Pangrace and Ross Papalardo, our medical illustration department, and our production manager Bruce Marich continue to provide the high-quality images that enhance the written word. Our authors and our peer-reviewers include both experienced Clinic staff and nationally recognized clinical content experts.
The Journal in 2011 faces challenges. Advertising income, which has supported a significant portion of our expenses, has decreased, as it has for almost all medical journals. The complicated relationships between industry, academia, physicians, and medical education companies at times strain our ability to provide full disclosure and adequate peer review. The time constraints of authors and the widespread availability of cut-and-paste-ready electronic publications have led us to utilize duplication-recognition software in an effort to limit plagiarism and duplicate publication. The costs and complexity of production and publication of online and print versions of the Journal continue to rise. At the same time, the advances in technology offer the possibility of increased interactivity between reader and content, and we welcome this opportunity. But despite all the challenges, the spirit of the Clinic’s mission to further the education of those who serve is maintained, the same as it ever was.
In this 80th anniversary issue, we kick off a series of articles on the overall care of patients with cancer. Coincidentally, the 1931 seminal issue of the Cleveland Clinic Bulletin started with an article on page 1 by Dr. George Crile entitled, “Treatment of malignancy.” Fortunately, the care of patients with cancer in 2011 is not the same as it was in 1931.
As we start our 80th anniversary year, I offer our sincere wishes to all of you, our readers, for a year of peace and good health.
“Once in a Lifetime” is a song by Talking Heads, from their album Remain in Light. Written by David Byrne, Brian Eno, Chris Frantz, Jerry Harrison, and Tina Weymouth, it was named one of the 100 most important American musical works of the 20th century by National Public Radio. It made #14 in the UK charts and #31 in the Netherlands (Wikipedia).
To better manage cancer symptoms
A striking change in cancer medicine over the past several decades has been the rising amplitude of the voices of cancer patients and survivors and their loved ones. Increasingly, they have organized as advocates for better cancer treatment, better research, and better attention to the experience of those directly affected by cancer.
At the same time, despite a somewhat delirious period in the 1970s when it was expected that cancer could be cured, or at least that the mortality rate could be cut in half, it has become clear that progress in eliminating the disease is a long, slow slog with no guarantee of success. Nowhere is this lack of major progress clearer than in the US Food and Drug Administration’s decision a few years ago to approve a drug for pancreatic cancer based on a 10-day increase in median survival.1
These two factors, the rising voices of those affected by cancer and the failure of cancer research to deliver a cure, have helped fuel a dramatic increase in the attention paid to the symptoms caused by cancer and its treatments. Improving quality of life has become recognized as an additional important goal worthy of rigorous study. Alleviating symptoms is often the most we have to offer patients with advanced cancer, and palliative medicine services are now found at many if not all major cancer centers. To help ensure a supply of well-trained palliative medicine doctors, accredited palliative medicine fellowships have been started at institutions around the country. These programs produce physicians with a higher level of expertise in managing pain, nausea, constipation, fatigue, psychosocial distress, dyspnea, and a wide variety of other symptoms. And while the needs of cancer patients have helped accelerate the growth of palliative medicine, the specialty has a role to play with almost any patient with intractable symptoms, regardless of the nature of the underlying disease.
With the growing recognition of a need to better manage cancer patients’ symptoms, research in palliative care has grown rapidly, and an evidence-based approach to symptom management has become possible. Meanwhile, a variety of substantial advances has occurred. For instance, modern antiemetics have dramatically reduced chemotherapy-related vomiting, and long-acting narcotics have allowed patients to achieve better pain control with milder side effects.
In other areas such as cancer-related fatigue or chemotherapy-induced neuropathy, there is very limited evidence that our interventions are effective at alleviating symptoms or improving quality of life. In these and a number of other areas, more research and better treatments are urgently needed.
In order to keep our readers up to date on the progress that is being made in palliative medicine for cancer patients, the Cleveland Clinic Journal of Medicine is presenting a series of articles on the topic. The series begins this issue with an article on the principles of symptom management and a review of the current state of knowledge about alleviating fatigue, nausea, constipation, and dyspnea. Future articles will focus on pain and bowel obstruction.
Our goal is to give our readers practical information that will help them provide better symptom management for their patients, particularly their cancer patients. This series will deal with one of the most important problems of cancer medicine.
- Moore MJ, Goldstein D, Hamm J, et al. Erlotinib plus gemcitabine compared with gemcitabine alone in patients with advanced pancreatic cancer: a phase III trial of the National Cancer Institute of Canada Clinical Trials Group. J Clin Oncol 2007; 25:1960–1966.
A striking change in cancer medicine over the past several decades has been the rising amplitude of the voices of cancer patients and survivors and their loved ones. Increasingly, they have organized as advocates for better cancer treatment, better research, and better attention to the experience of those directly affected by cancer.
At the same time, despite a somewhat delirious period in the 1970s when it was expected that cancer could be cured, or at least that the mortality rate could be cut in half, it has become clear that progress in eliminating the disease is a long, slow slog with no guarantee of success. Nowhere is this lack of major progress clearer than in the US Food and Drug Administration’s decision a few years ago to approve a drug for pancreatic cancer based on a 10-day increase in median survival.1
These two factors, the rising voices of those affected by cancer and the failure of cancer research to deliver a cure, have helped fuel a dramatic increase in the attention paid to the symptoms caused by cancer and its treatments. Improving quality of life has become recognized as an additional important goal worthy of rigorous study. Alleviating symptoms is often the most we have to offer patients with advanced cancer, and palliative medicine services are now found at many if not all major cancer centers. To help ensure a supply of well-trained palliative medicine doctors, accredited palliative medicine fellowships have been started at institutions around the country. These programs produce physicians with a higher level of expertise in managing pain, nausea, constipation, fatigue, psychosocial distress, dyspnea, and a wide variety of other symptoms. And while the needs of cancer patients have helped accelerate the growth of palliative medicine, the specialty has a role to play with almost any patient with intractable symptoms, regardless of the nature of the underlying disease.
With the growing recognition of a need to better manage cancer patients’ symptoms, research in palliative care has grown rapidly, and an evidence-based approach to symptom management has become possible. Meanwhile, a variety of substantial advances has occurred. For instance, modern antiemetics have dramatically reduced chemotherapy-related vomiting, and long-acting narcotics have allowed patients to achieve better pain control with milder side effects.
In other areas such as cancer-related fatigue or chemotherapy-induced neuropathy, there is very limited evidence that our interventions are effective at alleviating symptoms or improving quality of life. In these and a number of other areas, more research and better treatments are urgently needed.
In order to keep our readers up to date on the progress that is being made in palliative medicine for cancer patients, the Cleveland Clinic Journal of Medicine is presenting a series of articles on the topic. The series begins this issue with an article on the principles of symptom management and a review of the current state of knowledge about alleviating fatigue, nausea, constipation, and dyspnea. Future articles will focus on pain and bowel obstruction.
Our goal is to give our readers practical information that will help them provide better symptom management for their patients, particularly their cancer patients. This series will deal with one of the most important problems of cancer medicine.
- Moore MJ, Goldstein D, Hamm J, et al. Erlotinib plus gemcitabine compared with gemcitabine alone in patients with advanced pancreatic cancer: a phase III trial of the National Cancer Institute of Canada Clinical Trials Group. J Clin Oncol 2007; 25:1960–1966.
- Moore MJ, Goldstein D, Hamm J, et al. Erlotinib plus gemcitabine compared with gemcitabine alone in patients with advanced pancreatic cancer: a phase III trial of the National Cancer Institute of Canada Clinical Trials Group. J Clin Oncol 2007; 25:1960–1966.
Do patients with prosthetic joints require dental antimicrobial prophylaxis?
We believe the available evidence does not support routine antimicrobial prophylaxis before dental procedures in patients who have undergone total joint replacement, even though the practice is very common1 and even though professional societies recommend it in patients at high risk,2 or even in all patients.3
On the other hand, good oral hygiene prevents dental disease and decreases the frequency of bacteremia from routine daily activities, and thus should be especially encouraged in patients with prosthetic joints or in those undergoing total joint arthroplasty.
AN UNCOMMON BUT SERIOUS PROBLEM
By 2030, an estimated 4 million total hip or total knee replacements per year will be performed in the United States.4 Most patients have a satisfactory outcome, but in a small percentage the prosthesis fails prematurely.
Prosthetic joint infection is the second most common cause of prosthetic failure leading to loss of joint function, after aseptic loosening.5 Its treatment often requires removal of the infected prosthesis and prolonged intravenous antimicrobial therapy. The cost incurred with each episode of prosthetic joint infection is estimated to exceed $50,000.1
Because of the morbidity and substantial cost associated with managing this condition, investigators have focused on identifying preventable risk factors for it.
RISK FACTORS FOR PROSTHETIC JOINT INFECTION
Factors associated with a higher risk of prosthetic joint infection include prior joint surgery, failure to give antimicrobial prophylaxis during surgery, immunosuppression, perioperative wound complications, a high American Society of Anesthesiologists (ASA) score, prolonged operative time, and a history of prosthetic joint infection.6,7 The primary predisposing factors are related to the foreign body itself and to the opportunities for and the degree of exposure of the prosthesis to microorganisms during surgery. Bacteremia, especially with Staphylococcus aureus, has been recognized as a risk factor for hematogenous prosthetic joint infection.6
Whether dental procedures pose a risk of prosthetic joint infection has been debated for decades. Common daily activities such as toothbrushing and chewing can cause transient bacteremia in up to 40% of episodes.8
Extrapolating from the guidelines for preventing endocarditis, the American Dental Association (ADA)2 and the American Academy of Orthopaedic Surgeons (AAOS)3 have issued guidelines favoring antimicrobial prophylaxis in patients with prosthetic joints. However, given the significant differences in the pathophysiology, microbiology, and anatomy of infection between infective endocarditis and prosthetic joint infection, extrapolating the recommendations may not be valid.
MICROBIOLOGY OF PROSTHETIC JOINT INFECTION AND DENTAL FLORA
Staphylococci, the most common cause of prosthetic joint infection, are uncommon commensals of the oral flora and have been rarely implicated in bacteremia occurring after dental procedures.9 In contrast, viridans-group streptococci constitute most of the facultative oral flora and are the most common cause of transient bacteremia after dental procedures that result in trauma to the gingival or oral mucosa.10 However, viridans-group streptococci account for only 2% of all hematogenous prosthetic joint infections.9
DO DENTAL PROCEDURES INCREASE THE RISK OF PROSTHETIC JOINT INFECTION?
Prolonged or high-grade bacteremia is associated with prosthetic joint infection. On the other hand, data are scant on the association between low-grade or transient bacteremia and prosthetic joint infection.
After dental procedures, bacteria can be found in the blood, but at much lower levels (< 104 cfu/mL) than that needed for hematogenous seeding of prostheses in animal studies (3–5 × 10⁸ cfu/mL).11 Transient, low-grade bacteremia occurs not only after dental procedures but also, as mentioned, after common activities such as chewing, brushing, or flossing.1 The cumulative exposure to transient bacteremia through these daily activities is several times higher than the single exposure that a person is subjected to during dental procedures.12
WHAT IS THE EVIDENCE?
Most of the current evidence linking dental procedures or dental manipulation to prosthetic joint infection is based on reports of single cases of infections that occurred after dental procedures.
In two retrospective reviews, late hematogenous prosthetic joint infection associated with a dental source occurred after 0.2% of primary knee arthroplasties11 and 6% of primary hip arthroplasties.13
Ainscow and Denham14 followed 1,000 patients who underwent total joint replacement over 6 years. Of these, 226 subsequently underwent dental procedures without receiving antimicrobial prophylaxis, and none developed a prosthetic joint infection.
In a recently published case-control study,1 our group assessed 339 patients with prosthetic joint infection and 339 patients with prosthetic joints that did not become infected. In this study, neither low-risk nor high-risk dental procedures were associated with an increased risk of prosthetic knee or hip infections (odds ratio [OR] 0.8; 95% confidence interval [CI] 0.4–1.6). Moreover, prophylactic use of antimicrobials before dental procedures was not associated with a lower risk.
However, a factor that was associated with a lower risk of prosthetic joint infection was good oral hygiene (OR 0.7; 95% CI 0.5–1.03). Good oral hygiene and prevention of dental disease could potentially decrease the frequency of bacteremia from daily activities and may even protect against prosthetic joint infection. Further study of the association of poor dental health and the risk of prosthetic joint infection is warranted.
GUIDELINES AND RECOMMENDATIONS
Despite the lack of evidence suggesting an association between prosthetic joint infection and dental procedure, surveys of orthopedists, dentists, infectious disease specialists, and other health care professionals show that a significant number of them recommend antimicrobial prophylaxis for patients with a prosthetic joint prior to a dental procedure.1
In 2003, a consensus panel of the AAOS and the ADA recommended routine consideration of antimicrobial prophylaxis in patients at high risk due to both patient factors and the type of dental procedure.2 Patient factors thought to confer high risk are immunosuppression, diabetes, malnourishment, human immunodeficiency virus infection, prior prosthetic joint infection, hemophilia, malignancy, and a prosthesis less than 2 years old. High-risk dental procedures are tooth extractions, periodontal procedures, root canal surgery, and dental cleaning in which bleeding is anticipated.
In a recent statement, the AAOS recommended antimicrobial prophylaxis in all patients with prosthetic joints.3
Concerns about promoting antimicrobial resistance and about adverse reactions from antimicrobial use may outweigh any hypothetic benefit related to prevention of prosthetic joint infection. Analyses of cost, risks, and benefits argue against this practice.3
In summary, the current evidence does not support the use of antimicrobial therapy to prevent prosthetic joint infection in patients with total joint replacement undergoing dental procedures. However, good oral hygiene should be encouraged to prevent dental disease and to decrease the frequency of bacteremia from routine daily activities in patients who have undergone or will be undergoing total joint arthroplasty.
- Berbari EF, Osmon DR, Carr A, et al. Dental procedures as risk factors for prosthetic hip or knee infection: a hospital-based prospective case-control study. Clin Infect Dis 2010; 50:8–16.
- American Dental Association. Antibiotic prophylaxis for dental patients with total joint replacements. J Am Dent Assoc 2003; 134:895–899.
- American Academy of Orthopaedic Surgeons. Information statement: antibiotic prophylaxis for bacteremia in patients with joint replacements. http://www.aaos.org/about/papers/advistmt/1033.asp. Accessed October 28, 2010.
- Kurtz S, Ong K, Lau E, Mowat F, Halpern M. Projections of primary and revision hip and knee arthroplasty in the United States from 2005 to 2030. J Bone Joint Surg Am 2007; 89:780–785.
- Roberts VI, Esler CN, Harper WM. A 15-year follow-up study of 4606 primary total knee replacements. J Bone Joint Surg Br 2007; 89:1452–1456.
- Del Pozo JL, Patel R. Clinical practice. Infection associated with prosthetic joints. N Engl J Med 2009; 361:787–794.
- Berbari EF, Hanssen AD, Duffy MC, et al. Risk factors for prosthetic joint infection: case-control study. Clin Infect Dis 1998; 27:1247–1254.
- Durack DT. Prevention of infective endocarditis. N Engl J Med 1995; 332:38–44.
- Deacon JM, Pagliaro AJ, Zelicof SB, Horowitz HW. Prophylactic use of antibiotics for procedures after total joint replacement. Bone Joint Surg Am 1996; 78:1755–1770.
- Kaye D. Infective endocarditis. In:Rose LF, Kaye D, editors. Internal Medicine for Dentistry, 2nd ed. Mosby: St. Louis, MO; 1990:156–161.
- Waldman BJ, Mont MA, Hungerford DS. Total knee arthroplasty infections associated with dental procedures. Clin Orthop Relat Res 1997; 343:164–172.
- Guntheroth WG. How important are dental procedures as a cause of infective endocarditis? Am J Cardiol 1984; 54:797–801.
- LaPorte DM, Waldman BJ, Mont MA, Hungerford DS. Infections associated with dental procedures in total hip arthroplasty. J Bone Joint Surg Br 1999; 81:56–59.
- Ainscow DA, Denham RA. The risk of haematogenous infection in total joint replacements. J Bone Joint Surg Br 1984; 66:580–582.
We believe the available evidence does not support routine antimicrobial prophylaxis before dental procedures in patients who have undergone total joint replacement, even though the practice is very common1 and even though professional societies recommend it in patients at high risk,2 or even in all patients.3
On the other hand, good oral hygiene prevents dental disease and decreases the frequency of bacteremia from routine daily activities, and thus should be especially encouraged in patients with prosthetic joints or in those undergoing total joint arthroplasty.
AN UNCOMMON BUT SERIOUS PROBLEM
By 2030, an estimated 4 million total hip or total knee replacements per year will be performed in the United States.4 Most patients have a satisfactory outcome, but in a small percentage the prosthesis fails prematurely.
Prosthetic joint infection is the second most common cause of prosthetic failure leading to loss of joint function, after aseptic loosening.5 Its treatment often requires removal of the infected prosthesis and prolonged intravenous antimicrobial therapy. The cost incurred with each episode of prosthetic joint infection is estimated to exceed $50,000.1
Because of the morbidity and substantial cost associated with managing this condition, investigators have focused on identifying preventable risk factors for it.
RISK FACTORS FOR PROSTHETIC JOINT INFECTION
Factors associated with a higher risk of prosthetic joint infection include prior joint surgery, failure to give antimicrobial prophylaxis during surgery, immunosuppression, perioperative wound complications, a high American Society of Anesthesiologists (ASA) score, prolonged operative time, and a history of prosthetic joint infection.6,7 The primary predisposing factors are related to the foreign body itself and to the opportunities for and the degree of exposure of the prosthesis to microorganisms during surgery. Bacteremia, especially with Staphylococcus aureus, has been recognized as a risk factor for hematogenous prosthetic joint infection.6
Whether dental procedures pose a risk of prosthetic joint infection has been debated for decades. Common daily activities such as toothbrushing and chewing can cause transient bacteremia in up to 40% of episodes.8
Extrapolating from the guidelines for preventing endocarditis, the American Dental Association (ADA)2 and the American Academy of Orthopaedic Surgeons (AAOS)3 have issued guidelines favoring antimicrobial prophylaxis in patients with prosthetic joints. However, given the significant differences in the pathophysiology, microbiology, and anatomy of infection between infective endocarditis and prosthetic joint infection, extrapolating the recommendations may not be valid.
MICROBIOLOGY OF PROSTHETIC JOINT INFECTION AND DENTAL FLORA
Staphylococci, the most common cause of prosthetic joint infection, are uncommon commensals of the oral flora and have been rarely implicated in bacteremia occurring after dental procedures.9 In contrast, viridans-group streptococci constitute most of the facultative oral flora and are the most common cause of transient bacteremia after dental procedures that result in trauma to the gingival or oral mucosa.10 However, viridans-group streptococci account for only 2% of all hematogenous prosthetic joint infections.9
DO DENTAL PROCEDURES INCREASE THE RISK OF PROSTHETIC JOINT INFECTION?
Prolonged or high-grade bacteremia is associated with prosthetic joint infection. On the other hand, data are scant on the association between low-grade or transient bacteremia and prosthetic joint infection.
After dental procedures, bacteria can be found in the blood, but at much lower levels (< 104 cfu/mL) than that needed for hematogenous seeding of prostheses in animal studies (3–5 × 10⁸ cfu/mL).11 Transient, low-grade bacteremia occurs not only after dental procedures but also, as mentioned, after common activities such as chewing, brushing, or flossing.1 The cumulative exposure to transient bacteremia through these daily activities is several times higher than the single exposure that a person is subjected to during dental procedures.12
WHAT IS THE EVIDENCE?
Most of the current evidence linking dental procedures or dental manipulation to prosthetic joint infection is based on reports of single cases of infections that occurred after dental procedures.
In two retrospective reviews, late hematogenous prosthetic joint infection associated with a dental source occurred after 0.2% of primary knee arthroplasties11 and 6% of primary hip arthroplasties.13
Ainscow and Denham14 followed 1,000 patients who underwent total joint replacement over 6 years. Of these, 226 subsequently underwent dental procedures without receiving antimicrobial prophylaxis, and none developed a prosthetic joint infection.
In a recently published case-control study,1 our group assessed 339 patients with prosthetic joint infection and 339 patients with prosthetic joints that did not become infected. In this study, neither low-risk nor high-risk dental procedures were associated with an increased risk of prosthetic knee or hip infections (odds ratio [OR] 0.8; 95% confidence interval [CI] 0.4–1.6). Moreover, prophylactic use of antimicrobials before dental procedures was not associated with a lower risk.
However, a factor that was associated with a lower risk of prosthetic joint infection was good oral hygiene (OR 0.7; 95% CI 0.5–1.03). Good oral hygiene and prevention of dental disease could potentially decrease the frequency of bacteremia from daily activities and may even protect against prosthetic joint infection. Further study of the association of poor dental health and the risk of prosthetic joint infection is warranted.
GUIDELINES AND RECOMMENDATIONS
Despite the lack of evidence suggesting an association between prosthetic joint infection and dental procedure, surveys of orthopedists, dentists, infectious disease specialists, and other health care professionals show that a significant number of them recommend antimicrobial prophylaxis for patients with a prosthetic joint prior to a dental procedure.1
In 2003, a consensus panel of the AAOS and the ADA recommended routine consideration of antimicrobial prophylaxis in patients at high risk due to both patient factors and the type of dental procedure.2 Patient factors thought to confer high risk are immunosuppression, diabetes, malnourishment, human immunodeficiency virus infection, prior prosthetic joint infection, hemophilia, malignancy, and a prosthesis less than 2 years old. High-risk dental procedures are tooth extractions, periodontal procedures, root canal surgery, and dental cleaning in which bleeding is anticipated.
In a recent statement, the AAOS recommended antimicrobial prophylaxis in all patients with prosthetic joints.3
Concerns about promoting antimicrobial resistance and about adverse reactions from antimicrobial use may outweigh any hypothetic benefit related to prevention of prosthetic joint infection. Analyses of cost, risks, and benefits argue against this practice.3
In summary, the current evidence does not support the use of antimicrobial therapy to prevent prosthetic joint infection in patients with total joint replacement undergoing dental procedures. However, good oral hygiene should be encouraged to prevent dental disease and to decrease the frequency of bacteremia from routine daily activities in patients who have undergone or will be undergoing total joint arthroplasty.
- Berbari EF, Osmon DR, Carr A, et al. Dental procedures as risk factors for prosthetic hip or knee infection: a hospital-based prospective case-control study. Clin Infect Dis 2010; 50:8–16.
- American Dental Association. Antibiotic prophylaxis for dental patients with total joint replacements. J Am Dent Assoc 2003; 134:895–899.
- American Academy of Orthopaedic Surgeons. Information statement: antibiotic prophylaxis for bacteremia in patients with joint replacements. http://www.aaos.org/about/papers/advistmt/1033.asp. Accessed October 28, 2010.
- Kurtz S, Ong K, Lau E, Mowat F, Halpern M. Projections of primary and revision hip and knee arthroplasty in the United States from 2005 to 2030. J Bone Joint Surg Am 2007; 89:780–785.
- Roberts VI, Esler CN, Harper WM. A 15-year follow-up study of 4606 primary total knee replacements. J Bone Joint Surg Br 2007; 89:1452–1456.
- Del Pozo JL, Patel R. Clinical practice. Infection associated with prosthetic joints. N Engl J Med 2009; 361:787–794.
- Berbari EF, Hanssen AD, Duffy MC, et al. Risk factors for prosthetic joint infection: case-control study. Clin Infect Dis 1998; 27:1247–1254.
- Durack DT. Prevention of infective endocarditis. N Engl J Med 1995; 332:38–44.
- Deacon JM, Pagliaro AJ, Zelicof SB, Horowitz HW. Prophylactic use of antibiotics for procedures after total joint replacement. Bone Joint Surg Am 1996; 78:1755–1770.
- Kaye D. Infective endocarditis. In:Rose LF, Kaye D, editors. Internal Medicine for Dentistry, 2nd ed. Mosby: St. Louis, MO; 1990:156–161.
- Waldman BJ, Mont MA, Hungerford DS. Total knee arthroplasty infections associated with dental procedures. Clin Orthop Relat Res 1997; 343:164–172.
- Guntheroth WG. How important are dental procedures as a cause of infective endocarditis? Am J Cardiol 1984; 54:797–801.
- LaPorte DM, Waldman BJ, Mont MA, Hungerford DS. Infections associated with dental procedures in total hip arthroplasty. J Bone Joint Surg Br 1999; 81:56–59.
- Ainscow DA, Denham RA. The risk of haematogenous infection in total joint replacements. J Bone Joint Surg Br 1984; 66:580–582.
Managing bloodstream infections in patients who have short-term central venous catheters
Vascular catheters are very common in everyday inpatient and, increasingly, outpatient care. Nearly 300 million catheters are estimated to be used annually in the United States, and approximately 3 million of these are central venous catheters (CVCs).1
Although significant gains have been made in preventing CVC-related bloodstream infections, these infections continue to occur, with estimated rates ranging from 1.3 per 1,000 catheter days on inpatient medical-surgical wards to 5.6 per 1,000 catheter days in intensive care burn units.2
CVCs are classified as either long-term or short-term. Long-term CVCs are surgically implanted or tunneled and used for prolonged chemotherapy, home infusion therapy, or hemodialysis. Short-term CVCs do not require surgical implantation. They are more common than long-term CVCs and account for most CVC-related bloodstream infections. Given the frequency of short-term CVC use, a growing number of health care providers from mid-level practitioners to intensivists are faced with deciding how to manage bloodstream infection related to short-term CVCs.
At baseline, management decisions about bloodstream infections from short-term CVCs can be challenging. Questions that regularly arise include:
- Should a potentially infected catheter be removed?
- Which empiric antibiotic therapy should be started pending a microbiologic diagnosis?
- How should therapy be tailored (eg, antibiotic choice and course and whether to remove or retain the catheter) based on the specific pathogen identified?
Adding to the complexity of these decisions are increasingly resistant microorganisms, heterogeneity of affected patient populations, and variability in the quality and availability of evidence.
This review provides a concise guide to managing bloodstream infections related to short-term CVCs in adults, based on updated guidelines from the Infectious Diseases Society of America (IDSA).3
DEFINITION AND DIAGNOSTIC CRITERIA
We have adapted the following definition and diagnostic criteria from the general definition and diagnostic criteria for catheter-related bloodstream infections proposed by the IDSA.
Bloodstream infection related to a short-term CVC is defined as bacteremia or fungemia in a patient with the CVC in place, clinical manifestations of infection (eg, fever, chills, hypotension), and no apparent source of the bloodstream infection aside from the catheter. At least one of the three diagnostic criteria should be met:
- Cultures of the catheter tip and of the peripheral blood grow the same organism. Catheter tip culture should be quantitative, with more than 102 colony-forming units (cfu) per catheter segment, or semiquantitative, with more than 15 cfu per catheter segment.
- Blood drawn from the catheter lumen grows the same organism as blood drawn from a peripheral vein (or less optimally, a different lumen), but at three times the amount by quantitative culture.
- Blood drawn simultaneously from the catheter lumen and from a peripheral vein (or less optimally, a different lumen) grows the same organism, and growth from the CVC lumen sample is detected (by automated blood culture system) at least 2 hours before growth from the peripheral vein sample.
MANAGING BLOODSTREAM INFECTIONS IN PATIENTS WITH SHORT-TERM CVCs
When to remove a potentially infected short-term CVC
In a nonneutropenic intensive care population, Bouza et al4 found that, of 204 episodes of clinically suspected bloodstream infection from a short-term CVC, only 28 (14%) were confirmed to be catheter-related, 27 (13%) were bloodstream infections that were not catheter-related, 36 (18%) involved catheter-tip colonization with negative blood cultures, and the remainder were cases with negative catheter-tip and blood cultures.
Rijnders et al,5 in a study of 100 adult medical-surgical intensive care patients with a clinically suspected bloodstream infection related to a short-term CVC, found only three confirmed cases.
A randomized clinical trial comparing early removal of short-term CVCs and watchful waiting in an adult intensive care population with clinically suspected bloodstream infections showed no difference between treatment groups in length of stay in the intensive care unit or in the mortality rate.6 This trial included a low-risk subset of adult medical-surgical intensive care patients (ie, immunocompetent, no intravascular foreign body, no evidence of severe sepsis or septic shock, no evidence of infection at the catheter insertion site, no proven bacteremia or fungemia). These results suggest that a similar subset of patients can be safely monitored without catheter removal while being assessed for possible catheter-related bloodstream infection.
Empiric catheter removal vs watchful waiting has not and likely will not be studied in higher-risk populations. In this group, clinical judgment should outweigh any specific management algorithm. In patients who are in shock or who are otherwise hemodynamically unstable, early catheter removal should be a priority; however, in some circumstances the risks of immediate catheter removal (eg, coagulopathy with risk of bleeding diathesis, or lack of site to replace the catheter) may outweigh the potential benefits.
Empiric antibiotic therapy for bloodstream infection from a short-term CVC
In order of prevalence, the four most common pathogens are coagulase-negative staphylococci, Staphylococcus aureus, Candida species, and enteric gram-negative bacilli.7
Gram-positive pathogens. A recent randomized clinical trial comparing vancomycin and linezolid (Zyvox) treatment for CVC-related bloodstream infections showed that 89 (57%) of 157 S aureus isolates and 95 (80%) of 119 coagulase-negative staphylococcal isolates were resistant to methicillin.8 Given the prevalence of gram-positive infections and the regularity of methicillin-resistant isolates, vancomycin should be started empirically in cases of suspected bloodstream infection related to short-term CVCs. In institutions where methicillin-resistant S aureus (MRSA) isolates regularly have a vancomycin minimum inhibitory concentration (MIC) of greater than 2 μg/mL, an alternative agent such as daptomycin (Cubicin) should be used.9,10
Gram-negative pathogens. Infections due to resistant gram-negative pathogens have become more common in the past 10 years.11,12 Prospective cohort studies have shown that resistant gram-negative infections and inadequate empiric antimicrobial therapy of bloodstream infections independently predict the risk of death.13,14 Risk factors for resistant gram-negative infections include critical illness, neutropenia, prior antibiotic therapy, and femoral insertion of the CVC.15–18 Patients with these risk factors should receive empiric antibiotic therapy for gram-negative bacilli.
No randomized controlled trial has been done to guide the choice of empiric gram-negative antibiotic coverage. The initial choice should be based on local antimicrobial patterns and susceptibility data and on the severity of the patient’s illness. Initial options include fourth-generation cephalosporins, carbapenems, or combined beta-lactam and beta-lactamase inhibitors. Patients with neutropenia, severe sepsis, or known multiple-drug-resistant gram-negative bacilli colonization or prior infection should receive empiric combination therapy with two different classes of antibiotics.
Candida. Risk factors for CVC-related bloodstream infections due to Candida species include total parenteral nutrition, prolonged use of broad-spectrum antibiotics, hematologic malignancy, solid organ or bone marrow transplantation, colonization with Candida species at multiple sites, and femoral catheter insertion. Empiric treatment with an echinocandin is recommended for patients with these risk factors. Fluconazole (Diflucan) can be substituted for an echinocandin in patients without azole exposure in the previous 3 months and in settings where the prevalence of Candida krusei and Candida glabrata is low.
PATHOGEN-SPECIFIC MANAGEMENT: RECOMMENDATIONS
Coagulase-negative staphylococci
Most patients with coagulase-negative staphylococcal infections have a benign clinical course.
Although no randomized trial has evaluated different treatment approaches, most experts recommend removing the catheter and giving a short course of antibiotics (ie, 5–7 days). Longer courses of antibiotics may be required for patients with endovascular hardware in place or persistent fever or bacteremia after catheter removal. The IDSA guidelines recommend 5 to 7 days of antibiotic therapy if the catheter is removed, and 10 to 14 days of systemic antibiotic therapy in combination with “antibiotic lock therapy” if the catheter is retained. Antibiotic lock therapy involves instilling a high concentration of an antibiotic to which the organism is susceptible into the catheter lumen and allowing it to dwell.
Not all patients are good candidates for antibiotic lock therapy, and neither are all organisms. In general, patients should be at low risk (immunocompetent, without hardware in place), and organisms should have a low risk of causing metastatic infection.
Staphylococcus lugdunensis can cause endocarditis and metastatic infections similar to those caused by S aureus and so should be managed similarly to S aureus.19
Staphylococcus aureus
Short-term CVCs infected with S aureus should be removed immediately. Removal of vascular catheters infected with S aureus has been associated with more rapid clinical response and higher cure rates compared with catheter retention.20–23S aureus bacteremia results in hematogenous complications in 20% to 30% of patients, and failure to remove or a delay in removing the catheter increases the risk of complications.21,24–27
There are no data from randomized clinical trials on the optimal duration of antibiotic therapy for S aureus bloodstream infections related to short-term CVCs. Traditionally, 4 weeks have been recommended out of concern for the risk of infective endocarditis,28,29 and the IDSA recommends 4 to 6 weeks unless patients meet certain low-risk criteria.
Factors associated with a higher risk of hematogenous complications include the presence of a retained foreign body, an intravascular prosthetic device, retained catheter, immune suppression, diabetes, persistent bacteremia at 72 hours despite catheter removal and appropriate antibiotics, skin changes consistent with septic emboli, or evidence of endocarditis or suppurative thrombophlebitis on transesophageal echocardiography (TEE) or ultrasonography, respectively.21,25–27 TEE is superior to transthoracic echocardiography and is most sensitive when performed 5 to 7 days after the onset of bacteremia.28,30 Patients who have had the catheter removed and who do not have any of these risk factors, and in whom TEE performed 5 to 7 days after the onset of bacteremia is negative, can be considered for a shorter duration of therapy (but a minimum of 14 days).
Patients with catheters colonized with S aureus (ie, those with positive catheter-tip cultures and negative blood cultures) are at risk of subsequent bacteremia. This risk may be reduced with anti-staphylococcal therapy started within 24 hours of catheter removal.31,32 Therapy should be continued for 5 to 7 days, and patients should be closely monitored for signs or symptoms of ongoing infection.
Oxacillin or nafcillin should be the first-line therapy for susceptible S aureus isolates. Vancomycin should be used to treat MRSA. Patients with MRSA isolates with a vancomycin MIC greater than 2 μg/mL should receive daptomycin or linezolid, depending on susceptibility data.
Enterococcal species
Up to 10% of nosocomially acquired bloodstream infections are due to enterococci, and many are related to intravascular catheters.33,34 Although the risk of endocarditis as a complication of enterococcal CVC-related bloodstream infection is relatively low, estimated at 1.5% in a multicenter prospective study, enterococcal bacteremia lasting longer than 4 days has been independently associated with risk of death.35,36 These observational data support routine removal of short-term CVCs infected with enterococci.
The choice of antibiotics for enterococcal infections depends on the susceptibility of the isolate. Sixty percent of Enterococcus faecium isolates and 2% of Enterococcus faecalis isolates are vancomycin-resistant, and reports of resistance to newer agents, including linezolid, have been published.34,37,38 Ampicillin is the preferred antibiotic for treatment of ampicillin-susceptible enterococci. Vancomycin should be used if the pathogen is ampicillin-resistant and vancomycin-susceptible. Enterococci resistant to both ampicillin and vancomycin can be treated with linezolid or daptomycin, based on susceptibility data.
For combination therapy with an aminoglycoside, the data are mixed. Retrospective observational studies have shown no difference in outcomes in uncomplicated enterococcal bacteremia with combination therapy vs monotherapy.39,40 However, in a large series of patients with enterococcal infections in which the catheter was retained, the combination of gentamicin and ampicillin was more effective than monotherapy.41
No controlled trial has been done to define the optimal duration of antibiotic therapy for enterococcal bloodstream infections related to short-term CVCs, but the IDSA recommends 7 to 14 days. If catheter salvage is attempted, concurrent antimicrobial lock therapy is recommended based on expert opinion. Catheters should be removed if complications arise (eg, insertion site or pocket infection, suppurative thrombophlebitis, sepsis, endocarditis, persistent bacteremia, metastatic infection). Signs and symptoms of endocarditis, persistent bacteremia, or the presence of a prosthetic heart valve should prompt evaluation with TEE.42,43
Gram-negative bacilli
Given the propensity of many gram-negative bacilli to form a biofilm, a number of studies have advocated removing CVCs infected with gram-negative bacilli.15,16,44 Recent studies examining the role of combination systemic antibiotic therapy and antibiotic lock therapy of gram-negative infections have found high success rates.45,46
The IDSA recommends routine removal of short-term CVCs infected with gram-negative bacilli and 7 to 14 days of systemic antibiotic therapy based on microbial susceptibility data. Antibiotic options generally include fourth-generation cephalosporins, carbapenems, or a combination beta-lactam and beta-lactamase inhibitor. The first-line treatment for Stenotrophomonas maltophilia and Burkholderia cepacia is trimethoprim-sulfamethoxazole (Bactrim). Extended-spectrum beta-lactamase-producing Klebsiella pneumoniae and Escherichia coli should not be treated with cephalosporins or piperacillin-tazobactam (Zosyn) even if the organisms are susceptible in vitro, as doing so has been associated with poor clinical outcomes.11,47
There is growing concern over multiple-drug-resistant gram-negative bacilli with carbapenemases that confer resistance to carbapenems. No controlled study has evaluated treatment of multiple-drug-resistant gram-negative bacilli that require therapy with polymyxin (Colistin).
Candida species
The benefit of removing the CVC in the setting of candidemia is supported by six prospective studies.48–53 Patients with catheter-related bloodstream infections due to Candida species should have the catheter removed. C albicans and azole-susceptible candidal strains can be effectively treated with fluconazole at a dosage of 400 mg daily, continued for 14 days following the first negative blood culture.54 Echinocandins as first-line therapy and lipid formulations of amphotericin B (Abelcet) as an alternative are both highly effective for the treatment of Candida species with decreased susceptibility to azoles (eg, C glabrata and C krusei).55–57
Other gram-positive microorganisms
The isolation of Corynebacterium, Bacillus, and Micrococcus species from a single blood culture does not prove bloodstream infection, and confirmation requires at least two positive results drawn from different sites. CVC infections with these organisms are difficult to treat unless the infected catheter is removed.58,59
ADDITIONAL RECOMMENDATIONS
Infectious disease consultation should be considered for patients with complicated bloodstream infection related to a short-term CVC. Complicated cases include catheter infections in patients with hemodynamic instability, endocarditis, suppurative thrombophlebitis, persistent bloodstream infection despite 72 hours of appropriate antimicrobial therapy, osteomyelitis, active malignancy, or immunosuppression.
Infectious disease consultation should also be sought for assistance with determining if a patient is a candidate for antibiotic lock therapy; for management, dosing, and course of antibiotic lock therapy; for assistance with antibiotic choice and course for multiple-drug-resistant gram-negative bacilli; and for recommendations on management of infections due to uncommon pathogens (eg, Corynebacterium jeikeium, Chryseobacterium species, Malassezia furfur, and Mycobacterium species).
- Edgeworth J. Intravascular catheter infections. J Hosp Infect 2009; 73:323–330.
- Edwards JR, Peterson KD, Mu Y, et al. National Healthcare Safety Network (NHSN) report: data summary for 2006 through 2008, issued December 2009. Am J Infect Control 2009; 37:783–805.
- Mermel LA, Allon M, Bouza E, et al. Clinical practice guidelines for the diagnosis and management of intravascular catheter-related infection: 2009 Update by the Infectious Diseases Society of America. Clin Infect Dis 2009; 49:1–45.
- Bouza E, Alvarado N, Alcalá L, Pérez MJ, Rincón C, Muñoz P. A randomized and prospective study of 3 procedures for the diagnosis of catheter-related bloodstream infection without catheter withdrawal. Clin Infect Dis 2007; 44:820–826.
- Rijnders BJ, Verwaest C, Peetermans WE, et al. Difference in time to positivity of hub-blood versus nonhub-blood cultures is not useful for the diagnosis of catheter-related bloodstream infection in critically ill patients. Crit Care Med 2001; 29:1399–1403.
- Rijnders BJ, Peetermans WE, Verwaest C, Wilmer A, Van Wijngaerden E. Watchful waiting versus immediate catheter removal in ICU patients with suspected catheter-related infection: a randomized trial. Intensive Care Med 2004; 30:1073–1080.
- Safdar A, Mermel LA, Maki DG. The epidemiology of catheter-related infection in the critically ill. In:O’Grady NP, Pittet D, editors. Catheter-Related Infections in the Critically Ill. Boston: Kluwer, 2004:1–22.
- Wilcox MH, Tack KJ, Bouza E, et al. Complicated skin and skin-structure infections and catheter-related bloodstream infections: noninferiority of linezolid in a phase 3 study. Clin Infect Dis 2009; 48:203–212.
- Sakoulas G, Moise-Broder PA, Schentag J, Forrest A, Moellering RC, Eliopoulos GM. Relationship of MIC and bactericidal activity to efficacy of vancomycin for treatment of methicillin-resistant Staphylococcus aureus bacteremia. J Clin Microbiol 2004; 42:2398–2402.
- Moise PA, Sakoulas G, Forrest A, Schentag JJ. Vancomycin in vitro bactericidal activity and its relationship to efficacy in clearance of methicillin-resistant Staphylococcus aureus bacteremia. Antimicrob Agents Chemother 2007; 51:2582–2586.
- Jacoby GA, Munoz-Price LS. The new beta-lactamases. N Engl J Med 2005; 352:380–391.
- National Nosocomial Infections Surveillance System. National Nosocomial Infections Surveillance (NNIS) System Report, data summary from January 1992 through June 2004, issued October 2004. Am J Infect Control 2004; 32:470–485.
- Ibrahim EH, Sherman G, Ward S, Fraser VJ, Kollef MH. The influence of inadequate antimicrobial treatment of bloodstream infections on patient outcomes in the ICU setting. Chest 2000; 118:146–155.
- Raymond DP, Pelletier SJ, Crabtree TD, Evans HL, Pruett TL, Sawyer RG. Impact of antibiotic-resistant Gram-negative bacilli infections on outcome in hospitalized patients. Crit Care Med 2003; 31:1035–1041.
- Friedman ND, Korman TM, Fairley CK, Franklin JC, Spelman DW. Bacteraemia due to Stenotrophomonas maltophilia: an analysis of 45 episodes. J Infect 2002; 45:47–53.
- Seifert H, Strate A, Pulverer G. Nosocomial bacteremia due to Acinetobacter baumannii. Clinical features, epidemiology, and predictors of mortality. Medicine (Baltimore) 1995; 74:340–349.
- Seifert H. Catheter-related infections due to gram-negative bacilli. In:Seifert H, Jansen B, Farr BM, editors. Catheter-Related infections. New York: M. Dekker, 1997:111–138.
- Lorente L, Jiménez A, Santana M, et al. Microorganisms responsible for intravascular catheter-related bloodstream infection according to the catheter site. Crit Care Med 2007; 35:2424–2427.
- Zinkernagel AS, Zinkernagel MS, Elzi MV, et al. Significance of Staphylococcus lugdunensis bacteremia: report of 28 cases and review of the literature. Infection 2008; 36:314–321.
- Malanoski GJ, Samore MH, Pefanis A, Karchmer AW. Staphylococcus aureus catheter-associated bacteremia. Minimal effective therapy and unusual infectious complications associated with arterial sheath catheters. Arch Intern Med 1995; 155:1161–1166.
- Fowler VG, Justice A, Moore C, et al. Risk factors for hematogenous complications of intravascular catheter-associated Staphylococcus aureus bacteremia. Clin Infect Dis 2005; 40:695–703.
- Fowler VG, Sanders LL, Sexton DJ, et al. Outcome of Staphylococcus aureus bacteremia according to compliance with recommendations of infectious diseases specialists: experience with 244 patients. Clin Infect Dis 1998; 27:478–486.
- Reilly JJ, Steed DL, Ritter PS. Indwelling venous access catheters in patients with acute leukemia. Cancer 1984; 53:219–223.
- Abraham J, Mansour C, Veledar E, Khan B, Lerakis S. Staphylococcus aureus bacteremia and endocarditis: the Grady Memorial Hospital experience with methicillin-sensitive S aureus and methicillin-resistant S aureus bacteremia. Am Heart J 2004; 147:536–539.
- Fowler VG, Miro JM, Hoen B, et al; ICE Investigators. Staphylococcus aureus endocarditis: a consequence of medical progress. JAMA 2005; 293:3012–3021.
- Fowler VG, Olsen MK, Corey GR, et al. Clinical identifiers of complicated Staphylococcus aureus bacteremia. Arch Intern Med 2003; 163:2066–2072.
- Chang FY, MacDonald BB, Peacock JE, et al. A prospective multicenter study of Staphylococcus aureus bacteremia: incidence of endocarditis, risk factors for mortality, and clinical impact of methicillin resistance. Medicine (Baltimore) 2003; 82:322–332.
- Rosen AB, Fowler VG, Corey GR, et al. Cost-effectiveness of transesophageal echocardiography to determine the duration of therapy for intravascular catheter-associated Staphylococcus aureus bacteremia. Ann Intern Med 1999; 130:810–820.
- Pigrau C, Rodríguez D, Planes AM, et al. Management of catheter-related Staphylococcus aureus bacteremia: when may sonographic study be unnecessary? Eur J Clin Microbiol Infect Dis 2003; 22:713–719.
- Sochowski RA, Chan KL. Implication of negative results on a monoplane transesophageal echocardiographic study in patients with suspected infective endocarditis. J Am Coll Cardiol 1993; 21:216–221.
- Koh DB, Gowardman JR, Rickard CM, Robertson IK, Brown A. Prospective study of peripheral arterial catheter infection and comparison with concurrently sited central venous catheters. Crit Care Med 2008; 36:397–402.
- Ruhe JJ, Menon A. Clinical significance of isolated Staphylococcus aureus central venous catheter tip cultures. Clin Microbiol Infect 2006; 12:933–936.
- Wisplinghoff H, Bischoff T, Tallent SM, Seifert H, Wenzel RP, Edmond MB. Nosocomial bloodstream infections in US hospitals: analysis of 24,179 cases from a prospective nationwide surveillance study. Clin Infect Dis 2004; 39:309–317.
- Jones RN, Marshall SA, Pfaller MA, et al. Nosocomial enterococcal blood stream infections in the SCOPE Program: antimicrobial resistance, species occurrence, molecular testing results, and laboratory testing accuracy. SCOPE Hospital Study Group. Diagn Microbiol Infect Dis 1997; 29:95–102.
- DiazGranados CA, Jernigan JA. Impact of vancomycin resistance on mortality among patients with neutropenia and enterococcal bloodstream infection. J Infect Dis 2005; 191:588–595.
- Bhavnani SM, Drake JA, Forrest A, et al. A nationwide, multicenter, case-control study comparing risk factors, treatment, and outcome for vancomycin-resistant and -susceptible enterococcal bacteremia. Diagn Microbiol Infect Dis 2000; 36:145–158.
- Gonzales RD, Schreckenberger PC, Graham MB, Kelkar S, DenBesten K, Quinn JP. Infections due to vancomycin-resistant Enterococcus faecium resistant to linezolid. Lancet 2001; 357:1179.
- Kanafani ZA, Federspiel JJ, Fowler VG. Infective endocarditis caused by daptomycin-resistant Enterococcus faecalis: a case report. Scand J Infect Dis 2007; 39:75–77.
- Maki DG, Agger WA. Enterococcal bacteremia: clinical features, the risk of endocarditis, and management. Medicine (Baltimore) 1988; 67:248–269.
- Gray J, Marsh PJ, Stewart D, Pedler SJ. Enterococcal bacteraemia: a prospective study of 125 episodes. J Hosp Infect 1994; 27:179–186.
- Sandoe JA, Witherden IR, Au-Yeung HK, Kite P, Kerr KG, Wilcox MH. Enterococcal intravascular catheter-related bloodstream infection: management and outcome of 61 consecutive cases. J Antimicrob Chemother 2002; 50:577–582.
- Anderson DJ, Murdoch DR, Sexton DJ, et al. Risk factors for infective endocarditis in patients with enterococcal bacteremia: a case-control study. Infection 2004; 32:72–77.
- Fernández-Guerrero ML, Herrero L, Bellver M, Gadea I, Roblas RF, de Górgolas M. Nosocomial enterococcal endocarditis: a serious hazard for hospitalized patients with enterococcal bacteraemia. J Intern Med 2002; 252:510–515.
- Elting LS, Bodey GP. Septicemia due to Xanthomonas species and non-aeruginosa Pseudomonas species: increasing incidence of catheter-related infections. Medicine (Baltimore) 1990; 69:296–306.
- Fernandez-Hidalgo N, Almirante B, Calleja R, et al. Antibiotic-lock therapy for long-term intravascular catheter-related bacteraemia: results of an open, non-comparative study. J Antimicrob Chemother 2006; 57:1172–1180.
- Poole CV, Carlton D, Bimbo L, Allon M. Treatment of catheter-related bacteraemia with an antibiotic lock protocol: effect of bacterial pathogen. Nephrol Dial Transplant 2004; 19:1237–1244.
- Paterson DL, Ko WC, Von Gottberg A, et al. Outcome of cephalosporin treatment for serious infections due to apparently susceptible organisms producing extended-spectrum beta-lactamases: implications for the clinical microbiology laboratory. J Clin Microbiol 2001; 39:2206–2212.
- Nguyen MH, Peacock JE, Tanner DC, et al. Therapeutic approaches in patients with candidemia. Evaluation in a multicenter, prospective, observational study. Arch Intern Med 1995; 155:2429–2435.
- Hung CC, Chen YC, Chang SC, Luh KT, Hsieh WC. Nosocomial candidemia in a university hospital in Taiwan. J Formos Med Assoc 1996; 95:19–28.
- Rex JH, Bennett JE, Sugar AM, et al. Intravascular catheter exchange and duration of candidemia. NIAID Mycoses Study Group and the Candidemia Study Group. Clin Infect Dis 1995; 21:994–996.
- Karlowicz MG, Hashimoto LN, Kelly RE, Buescher ES. Should central venous catheters be removed as soon as candidemia is detected in neonates? Pediatrics 2000; 106:E63.
- Nucci M, Colombo AL, Silveira F, et al. Risk factors for death in patients with candidemia. Infect Control Hosp Epidemiol 1998; 19:846–850.
- Almirante B, Rodríguez D, Park BJ, et al; Barcelona Candidemia Project Study Group. Epidemiology and predictors of mortality in cases of Candida bloodstream infection: results from population-based surveillance, Barcelona, Spain, from 2002 to 2003. J Clin Microbiol 2005; 43:1829–1835.
- Rex JH, Bennett JE, Sugar AM, et al. A randomized trial comparing fluconazole with amphotericin B for the treatment of candidemia in patients without neutropenia. Candidemia Study Group and the National Institute. N Engl J Med 1994; 331:1325–1330.
- Kuse ER, Chetchotisakd P, da Cunha CA, et al; Micafungin Invasive Candidiasis Working Group. Micafungin versus liposomal amphotericin B for candidaemia and invasive candidosis: a phase III randomised double-blind trial. Lancet 2007; 369:1519–1527.
- Reboli AC, Rotstein C, Pappas PG, et al; Anidulafungin Study Group. Anidulafungin versus fluconazole for invasive candidiasis. N Engl J Med 2007; 356:2472–2482.
- Mora-Duarte J, Betts R, Rotstein C, et al; Caspofungin Invasive Candidiasis Study Group. Comparison of caspofungin and amphotericin B for invasive candidiasis. N Engl J Med 2002; 347:2020–2029.
- Peces R, Gago E, Tejada F, Laures AS, Alvarez-Grande J. Relapsing bacteraemia due to Micrococcus luteus in a haemodialysis patient with a Perm-Cath catheter. Nephrol Dial Transplant 1997; 12:2428–2429.
- Cotton DJ, Gill VJ, Marshall DJ, Gress J, Thaler M, Pizzo PA. Clinical features and therapeutic interventions in 17 cases of Bacillus bacteremia in an immunosuppressed patient population. J Clin Microbiol 1987; 25:672–674.
Vascular catheters are very common in everyday inpatient and, increasingly, outpatient care. Nearly 300 million catheters are estimated to be used annually in the United States, and approximately 3 million of these are central venous catheters (CVCs).1
Although significant gains have been made in preventing CVC-related bloodstream infections, these infections continue to occur, with estimated rates ranging from 1.3 per 1,000 catheter days on inpatient medical-surgical wards to 5.6 per 1,000 catheter days in intensive care burn units.2
CVCs are classified as either long-term or short-term. Long-term CVCs are surgically implanted or tunneled and used for prolonged chemotherapy, home infusion therapy, or hemodialysis. Short-term CVCs do not require surgical implantation. They are more common than long-term CVCs and account for most CVC-related bloodstream infections. Given the frequency of short-term CVC use, a growing number of health care providers from mid-level practitioners to intensivists are faced with deciding how to manage bloodstream infection related to short-term CVCs.
At baseline, management decisions about bloodstream infections from short-term CVCs can be challenging. Questions that regularly arise include:
- Should a potentially infected catheter be removed?
- Which empiric antibiotic therapy should be started pending a microbiologic diagnosis?
- How should therapy be tailored (eg, antibiotic choice and course and whether to remove or retain the catheter) based on the specific pathogen identified?
Adding to the complexity of these decisions are increasingly resistant microorganisms, heterogeneity of affected patient populations, and variability in the quality and availability of evidence.
This review provides a concise guide to managing bloodstream infections related to short-term CVCs in adults, based on updated guidelines from the Infectious Diseases Society of America (IDSA).3
DEFINITION AND DIAGNOSTIC CRITERIA
We have adapted the following definition and diagnostic criteria from the general definition and diagnostic criteria for catheter-related bloodstream infections proposed by the IDSA.
Bloodstream infection related to a short-term CVC is defined as bacteremia or fungemia in a patient with the CVC in place, clinical manifestations of infection (eg, fever, chills, hypotension), and no apparent source of the bloodstream infection aside from the catheter. At least one of the three diagnostic criteria should be met:
- Cultures of the catheter tip and of the peripheral blood grow the same organism. Catheter tip culture should be quantitative, with more than 102 colony-forming units (cfu) per catheter segment, or semiquantitative, with more than 15 cfu per catheter segment.
- Blood drawn from the catheter lumen grows the same organism as blood drawn from a peripheral vein (or less optimally, a different lumen), but at three times the amount by quantitative culture.
- Blood drawn simultaneously from the catheter lumen and from a peripheral vein (or less optimally, a different lumen) grows the same organism, and growth from the CVC lumen sample is detected (by automated blood culture system) at least 2 hours before growth from the peripheral vein sample.
MANAGING BLOODSTREAM INFECTIONS IN PATIENTS WITH SHORT-TERM CVCs
When to remove a potentially infected short-term CVC
In a nonneutropenic intensive care population, Bouza et al4 found that, of 204 episodes of clinically suspected bloodstream infection from a short-term CVC, only 28 (14%) were confirmed to be catheter-related, 27 (13%) were bloodstream infections that were not catheter-related, 36 (18%) involved catheter-tip colonization with negative blood cultures, and the remainder were cases with negative catheter-tip and blood cultures.
Rijnders et al,5 in a study of 100 adult medical-surgical intensive care patients with a clinically suspected bloodstream infection related to a short-term CVC, found only three confirmed cases.
A randomized clinical trial comparing early removal of short-term CVCs and watchful waiting in an adult intensive care population with clinically suspected bloodstream infections showed no difference between treatment groups in length of stay in the intensive care unit or in the mortality rate.6 This trial included a low-risk subset of adult medical-surgical intensive care patients (ie, immunocompetent, no intravascular foreign body, no evidence of severe sepsis or septic shock, no evidence of infection at the catheter insertion site, no proven bacteremia or fungemia). These results suggest that a similar subset of patients can be safely monitored without catheter removal while being assessed for possible catheter-related bloodstream infection.
Empiric catheter removal vs watchful waiting has not and likely will not be studied in higher-risk populations. In this group, clinical judgment should outweigh any specific management algorithm. In patients who are in shock or who are otherwise hemodynamically unstable, early catheter removal should be a priority; however, in some circumstances the risks of immediate catheter removal (eg, coagulopathy with risk of bleeding diathesis, or lack of site to replace the catheter) may outweigh the potential benefits.
Empiric antibiotic therapy for bloodstream infection from a short-term CVC
In order of prevalence, the four most common pathogens are coagulase-negative staphylococci, Staphylococcus aureus, Candida species, and enteric gram-negative bacilli.7
Gram-positive pathogens. A recent randomized clinical trial comparing vancomycin and linezolid (Zyvox) treatment for CVC-related bloodstream infections showed that 89 (57%) of 157 S aureus isolates and 95 (80%) of 119 coagulase-negative staphylococcal isolates were resistant to methicillin.8 Given the prevalence of gram-positive infections and the regularity of methicillin-resistant isolates, vancomycin should be started empirically in cases of suspected bloodstream infection related to short-term CVCs. In institutions where methicillin-resistant S aureus (MRSA) isolates regularly have a vancomycin minimum inhibitory concentration (MIC) of greater than 2 μg/mL, an alternative agent such as daptomycin (Cubicin) should be used.9,10
Gram-negative pathogens. Infections due to resistant gram-negative pathogens have become more common in the past 10 years.11,12 Prospective cohort studies have shown that resistant gram-negative infections and inadequate empiric antimicrobial therapy of bloodstream infections independently predict the risk of death.13,14 Risk factors for resistant gram-negative infections include critical illness, neutropenia, prior antibiotic therapy, and femoral insertion of the CVC.15–18 Patients with these risk factors should receive empiric antibiotic therapy for gram-negative bacilli.
No randomized controlled trial has been done to guide the choice of empiric gram-negative antibiotic coverage. The initial choice should be based on local antimicrobial patterns and susceptibility data and on the severity of the patient’s illness. Initial options include fourth-generation cephalosporins, carbapenems, or combined beta-lactam and beta-lactamase inhibitors. Patients with neutropenia, severe sepsis, or known multiple-drug-resistant gram-negative bacilli colonization or prior infection should receive empiric combination therapy with two different classes of antibiotics.
Candida. Risk factors for CVC-related bloodstream infections due to Candida species include total parenteral nutrition, prolonged use of broad-spectrum antibiotics, hematologic malignancy, solid organ or bone marrow transplantation, colonization with Candida species at multiple sites, and femoral catheter insertion. Empiric treatment with an echinocandin is recommended for patients with these risk factors. Fluconazole (Diflucan) can be substituted for an echinocandin in patients without azole exposure in the previous 3 months and in settings where the prevalence of Candida krusei and Candida glabrata is low.
PATHOGEN-SPECIFIC MANAGEMENT: RECOMMENDATIONS
Coagulase-negative staphylococci
Most patients with coagulase-negative staphylococcal infections have a benign clinical course.
Although no randomized trial has evaluated different treatment approaches, most experts recommend removing the catheter and giving a short course of antibiotics (ie, 5–7 days). Longer courses of antibiotics may be required for patients with endovascular hardware in place or persistent fever or bacteremia after catheter removal. The IDSA guidelines recommend 5 to 7 days of antibiotic therapy if the catheter is removed, and 10 to 14 days of systemic antibiotic therapy in combination with “antibiotic lock therapy” if the catheter is retained. Antibiotic lock therapy involves instilling a high concentration of an antibiotic to which the organism is susceptible into the catheter lumen and allowing it to dwell.
Not all patients are good candidates for antibiotic lock therapy, and neither are all organisms. In general, patients should be at low risk (immunocompetent, without hardware in place), and organisms should have a low risk of causing metastatic infection.
Staphylococcus lugdunensis can cause endocarditis and metastatic infections similar to those caused by S aureus and so should be managed similarly to S aureus.19
Staphylococcus aureus
Short-term CVCs infected with S aureus should be removed immediately. Removal of vascular catheters infected with S aureus has been associated with more rapid clinical response and higher cure rates compared with catheter retention.20–23S aureus bacteremia results in hematogenous complications in 20% to 30% of patients, and failure to remove or a delay in removing the catheter increases the risk of complications.21,24–27
There are no data from randomized clinical trials on the optimal duration of antibiotic therapy for S aureus bloodstream infections related to short-term CVCs. Traditionally, 4 weeks have been recommended out of concern for the risk of infective endocarditis,28,29 and the IDSA recommends 4 to 6 weeks unless patients meet certain low-risk criteria.
Factors associated with a higher risk of hematogenous complications include the presence of a retained foreign body, an intravascular prosthetic device, retained catheter, immune suppression, diabetes, persistent bacteremia at 72 hours despite catheter removal and appropriate antibiotics, skin changes consistent with septic emboli, or evidence of endocarditis or suppurative thrombophlebitis on transesophageal echocardiography (TEE) or ultrasonography, respectively.21,25–27 TEE is superior to transthoracic echocardiography and is most sensitive when performed 5 to 7 days after the onset of bacteremia.28,30 Patients who have had the catheter removed and who do not have any of these risk factors, and in whom TEE performed 5 to 7 days after the onset of bacteremia is negative, can be considered for a shorter duration of therapy (but a minimum of 14 days).
Patients with catheters colonized with S aureus (ie, those with positive catheter-tip cultures and negative blood cultures) are at risk of subsequent bacteremia. This risk may be reduced with anti-staphylococcal therapy started within 24 hours of catheter removal.31,32 Therapy should be continued for 5 to 7 days, and patients should be closely monitored for signs or symptoms of ongoing infection.
Oxacillin or nafcillin should be the first-line therapy for susceptible S aureus isolates. Vancomycin should be used to treat MRSA. Patients with MRSA isolates with a vancomycin MIC greater than 2 μg/mL should receive daptomycin or linezolid, depending on susceptibility data.
Enterococcal species
Up to 10% of nosocomially acquired bloodstream infections are due to enterococci, and many are related to intravascular catheters.33,34 Although the risk of endocarditis as a complication of enterococcal CVC-related bloodstream infection is relatively low, estimated at 1.5% in a multicenter prospective study, enterococcal bacteremia lasting longer than 4 days has been independently associated with risk of death.35,36 These observational data support routine removal of short-term CVCs infected with enterococci.
The choice of antibiotics for enterococcal infections depends on the susceptibility of the isolate. Sixty percent of Enterococcus faecium isolates and 2% of Enterococcus faecalis isolates are vancomycin-resistant, and reports of resistance to newer agents, including linezolid, have been published.34,37,38 Ampicillin is the preferred antibiotic for treatment of ampicillin-susceptible enterococci. Vancomycin should be used if the pathogen is ampicillin-resistant and vancomycin-susceptible. Enterococci resistant to both ampicillin and vancomycin can be treated with linezolid or daptomycin, based on susceptibility data.
For combination therapy with an aminoglycoside, the data are mixed. Retrospective observational studies have shown no difference in outcomes in uncomplicated enterococcal bacteremia with combination therapy vs monotherapy.39,40 However, in a large series of patients with enterococcal infections in which the catheter was retained, the combination of gentamicin and ampicillin was more effective than monotherapy.41
No controlled trial has been done to define the optimal duration of antibiotic therapy for enterococcal bloodstream infections related to short-term CVCs, but the IDSA recommends 7 to 14 days. If catheter salvage is attempted, concurrent antimicrobial lock therapy is recommended based on expert opinion. Catheters should be removed if complications arise (eg, insertion site or pocket infection, suppurative thrombophlebitis, sepsis, endocarditis, persistent bacteremia, metastatic infection). Signs and symptoms of endocarditis, persistent bacteremia, or the presence of a prosthetic heart valve should prompt evaluation with TEE.42,43
Gram-negative bacilli
Given the propensity of many gram-negative bacilli to form a biofilm, a number of studies have advocated removing CVCs infected with gram-negative bacilli.15,16,44 Recent studies examining the role of combination systemic antibiotic therapy and antibiotic lock therapy of gram-negative infections have found high success rates.45,46
The IDSA recommends routine removal of short-term CVCs infected with gram-negative bacilli and 7 to 14 days of systemic antibiotic therapy based on microbial susceptibility data. Antibiotic options generally include fourth-generation cephalosporins, carbapenems, or a combination beta-lactam and beta-lactamase inhibitor. The first-line treatment for Stenotrophomonas maltophilia and Burkholderia cepacia is trimethoprim-sulfamethoxazole (Bactrim). Extended-spectrum beta-lactamase-producing Klebsiella pneumoniae and Escherichia coli should not be treated with cephalosporins or piperacillin-tazobactam (Zosyn) even if the organisms are susceptible in vitro, as doing so has been associated with poor clinical outcomes.11,47
There is growing concern over multiple-drug-resistant gram-negative bacilli with carbapenemases that confer resistance to carbapenems. No controlled study has evaluated treatment of multiple-drug-resistant gram-negative bacilli that require therapy with polymyxin (Colistin).
Candida species
The benefit of removing the CVC in the setting of candidemia is supported by six prospective studies.48–53 Patients with catheter-related bloodstream infections due to Candida species should have the catheter removed. C albicans and azole-susceptible candidal strains can be effectively treated with fluconazole at a dosage of 400 mg daily, continued for 14 days following the first negative blood culture.54 Echinocandins as first-line therapy and lipid formulations of amphotericin B (Abelcet) as an alternative are both highly effective for the treatment of Candida species with decreased susceptibility to azoles (eg, C glabrata and C krusei).55–57
Other gram-positive microorganisms
The isolation of Corynebacterium, Bacillus, and Micrococcus species from a single blood culture does not prove bloodstream infection, and confirmation requires at least two positive results drawn from different sites. CVC infections with these organisms are difficult to treat unless the infected catheter is removed.58,59
ADDITIONAL RECOMMENDATIONS
Infectious disease consultation should be considered for patients with complicated bloodstream infection related to a short-term CVC. Complicated cases include catheter infections in patients with hemodynamic instability, endocarditis, suppurative thrombophlebitis, persistent bloodstream infection despite 72 hours of appropriate antimicrobial therapy, osteomyelitis, active malignancy, or immunosuppression.
Infectious disease consultation should also be sought for assistance with determining if a patient is a candidate for antibiotic lock therapy; for management, dosing, and course of antibiotic lock therapy; for assistance with antibiotic choice and course for multiple-drug-resistant gram-negative bacilli; and for recommendations on management of infections due to uncommon pathogens (eg, Corynebacterium jeikeium, Chryseobacterium species, Malassezia furfur, and Mycobacterium species).
- Edgeworth J. Intravascular catheter infections. J Hosp Infect 2009; 73:323–330.
- Edwards JR, Peterson KD, Mu Y, et al. National Healthcare Safety Network (NHSN) report: data summary for 2006 through 2008, issued December 2009. Am J Infect Control 2009; 37:783–805.
- Mermel LA, Allon M, Bouza E, et al. Clinical practice guidelines for the diagnosis and management of intravascular catheter-related infection: 2009 Update by the Infectious Diseases Society of America. Clin Infect Dis 2009; 49:1–45.
- Bouza E, Alvarado N, Alcalá L, Pérez MJ, Rincón C, Muñoz P. A randomized and prospective study of 3 procedures for the diagnosis of catheter-related bloodstream infection without catheter withdrawal. Clin Infect Dis 2007; 44:820–826.
- Rijnders BJ, Verwaest C, Peetermans WE, et al. Difference in time to positivity of hub-blood versus nonhub-blood cultures is not useful for the diagnosis of catheter-related bloodstream infection in critically ill patients. Crit Care Med 2001; 29:1399–1403.
- Rijnders BJ, Peetermans WE, Verwaest C, Wilmer A, Van Wijngaerden E. Watchful waiting versus immediate catheter removal in ICU patients with suspected catheter-related infection: a randomized trial. Intensive Care Med 2004; 30:1073–1080.
- Safdar A, Mermel LA, Maki DG. The epidemiology of catheter-related infection in the critically ill. In:O’Grady NP, Pittet D, editors. Catheter-Related Infections in the Critically Ill. Boston: Kluwer, 2004:1–22.
- Wilcox MH, Tack KJ, Bouza E, et al. Complicated skin and skin-structure infections and catheter-related bloodstream infections: noninferiority of linezolid in a phase 3 study. Clin Infect Dis 2009; 48:203–212.
- Sakoulas G, Moise-Broder PA, Schentag J, Forrest A, Moellering RC, Eliopoulos GM. Relationship of MIC and bactericidal activity to efficacy of vancomycin for treatment of methicillin-resistant Staphylococcus aureus bacteremia. J Clin Microbiol 2004; 42:2398–2402.
- Moise PA, Sakoulas G, Forrest A, Schentag JJ. Vancomycin in vitro bactericidal activity and its relationship to efficacy in clearance of methicillin-resistant Staphylococcus aureus bacteremia. Antimicrob Agents Chemother 2007; 51:2582–2586.
- Jacoby GA, Munoz-Price LS. The new beta-lactamases. N Engl J Med 2005; 352:380–391.
- National Nosocomial Infections Surveillance System. National Nosocomial Infections Surveillance (NNIS) System Report, data summary from January 1992 through June 2004, issued October 2004. Am J Infect Control 2004; 32:470–485.
- Ibrahim EH, Sherman G, Ward S, Fraser VJ, Kollef MH. The influence of inadequate antimicrobial treatment of bloodstream infections on patient outcomes in the ICU setting. Chest 2000; 118:146–155.
- Raymond DP, Pelletier SJ, Crabtree TD, Evans HL, Pruett TL, Sawyer RG. Impact of antibiotic-resistant Gram-negative bacilli infections on outcome in hospitalized patients. Crit Care Med 2003; 31:1035–1041.
- Friedman ND, Korman TM, Fairley CK, Franklin JC, Spelman DW. Bacteraemia due to Stenotrophomonas maltophilia: an analysis of 45 episodes. J Infect 2002; 45:47–53.
- Seifert H, Strate A, Pulverer G. Nosocomial bacteremia due to Acinetobacter baumannii. Clinical features, epidemiology, and predictors of mortality. Medicine (Baltimore) 1995; 74:340–349.
- Seifert H. Catheter-related infections due to gram-negative bacilli. In:Seifert H, Jansen B, Farr BM, editors. Catheter-Related infections. New York: M. Dekker, 1997:111–138.
- Lorente L, Jiménez A, Santana M, et al. Microorganisms responsible for intravascular catheter-related bloodstream infection according to the catheter site. Crit Care Med 2007; 35:2424–2427.
- Zinkernagel AS, Zinkernagel MS, Elzi MV, et al. Significance of Staphylococcus lugdunensis bacteremia: report of 28 cases and review of the literature. Infection 2008; 36:314–321.
- Malanoski GJ, Samore MH, Pefanis A, Karchmer AW. Staphylococcus aureus catheter-associated bacteremia. Minimal effective therapy and unusual infectious complications associated with arterial sheath catheters. Arch Intern Med 1995; 155:1161–1166.
- Fowler VG, Justice A, Moore C, et al. Risk factors for hematogenous complications of intravascular catheter-associated Staphylococcus aureus bacteremia. Clin Infect Dis 2005; 40:695–703.
- Fowler VG, Sanders LL, Sexton DJ, et al. Outcome of Staphylococcus aureus bacteremia according to compliance with recommendations of infectious diseases specialists: experience with 244 patients. Clin Infect Dis 1998; 27:478–486.
- Reilly JJ, Steed DL, Ritter PS. Indwelling venous access catheters in patients with acute leukemia. Cancer 1984; 53:219–223.
- Abraham J, Mansour C, Veledar E, Khan B, Lerakis S. Staphylococcus aureus bacteremia and endocarditis: the Grady Memorial Hospital experience with methicillin-sensitive S aureus and methicillin-resistant S aureus bacteremia. Am Heart J 2004; 147:536–539.
- Fowler VG, Miro JM, Hoen B, et al; ICE Investigators. Staphylococcus aureus endocarditis: a consequence of medical progress. JAMA 2005; 293:3012–3021.
- Fowler VG, Olsen MK, Corey GR, et al. Clinical identifiers of complicated Staphylococcus aureus bacteremia. Arch Intern Med 2003; 163:2066–2072.
- Chang FY, MacDonald BB, Peacock JE, et al. A prospective multicenter study of Staphylococcus aureus bacteremia: incidence of endocarditis, risk factors for mortality, and clinical impact of methicillin resistance. Medicine (Baltimore) 2003; 82:322–332.
- Rosen AB, Fowler VG, Corey GR, et al. Cost-effectiveness of transesophageal echocardiography to determine the duration of therapy for intravascular catheter-associated Staphylococcus aureus bacteremia. Ann Intern Med 1999; 130:810–820.
- Pigrau C, Rodríguez D, Planes AM, et al. Management of catheter-related Staphylococcus aureus bacteremia: when may sonographic study be unnecessary? Eur J Clin Microbiol Infect Dis 2003; 22:713–719.
- Sochowski RA, Chan KL. Implication of negative results on a monoplane transesophageal echocardiographic study in patients with suspected infective endocarditis. J Am Coll Cardiol 1993; 21:216–221.
- Koh DB, Gowardman JR, Rickard CM, Robertson IK, Brown A. Prospective study of peripheral arterial catheter infection and comparison with concurrently sited central venous catheters. Crit Care Med 2008; 36:397–402.
- Ruhe JJ, Menon A. Clinical significance of isolated Staphylococcus aureus central venous catheter tip cultures. Clin Microbiol Infect 2006; 12:933–936.
- Wisplinghoff H, Bischoff T, Tallent SM, Seifert H, Wenzel RP, Edmond MB. Nosocomial bloodstream infections in US hospitals: analysis of 24,179 cases from a prospective nationwide surveillance study. Clin Infect Dis 2004; 39:309–317.
- Jones RN, Marshall SA, Pfaller MA, et al. Nosocomial enterococcal blood stream infections in the SCOPE Program: antimicrobial resistance, species occurrence, molecular testing results, and laboratory testing accuracy. SCOPE Hospital Study Group. Diagn Microbiol Infect Dis 1997; 29:95–102.
- DiazGranados CA, Jernigan JA. Impact of vancomycin resistance on mortality among patients with neutropenia and enterococcal bloodstream infection. J Infect Dis 2005; 191:588–595.
- Bhavnani SM, Drake JA, Forrest A, et al. A nationwide, multicenter, case-control study comparing risk factors, treatment, and outcome for vancomycin-resistant and -susceptible enterococcal bacteremia. Diagn Microbiol Infect Dis 2000; 36:145–158.
- Gonzales RD, Schreckenberger PC, Graham MB, Kelkar S, DenBesten K, Quinn JP. Infections due to vancomycin-resistant Enterococcus faecium resistant to linezolid. Lancet 2001; 357:1179.
- Kanafani ZA, Federspiel JJ, Fowler VG. Infective endocarditis caused by daptomycin-resistant Enterococcus faecalis: a case report. Scand J Infect Dis 2007; 39:75–77.
- Maki DG, Agger WA. Enterococcal bacteremia: clinical features, the risk of endocarditis, and management. Medicine (Baltimore) 1988; 67:248–269.
- Gray J, Marsh PJ, Stewart D, Pedler SJ. Enterococcal bacteraemia: a prospective study of 125 episodes. J Hosp Infect 1994; 27:179–186.
- Sandoe JA, Witherden IR, Au-Yeung HK, Kite P, Kerr KG, Wilcox MH. Enterococcal intravascular catheter-related bloodstream infection: management and outcome of 61 consecutive cases. J Antimicrob Chemother 2002; 50:577–582.
- Anderson DJ, Murdoch DR, Sexton DJ, et al. Risk factors for infective endocarditis in patients with enterococcal bacteremia: a case-control study. Infection 2004; 32:72–77.
- Fernández-Guerrero ML, Herrero L, Bellver M, Gadea I, Roblas RF, de Górgolas M. Nosocomial enterococcal endocarditis: a serious hazard for hospitalized patients with enterococcal bacteraemia. J Intern Med 2002; 252:510–515.
- Elting LS, Bodey GP. Septicemia due to Xanthomonas species and non-aeruginosa Pseudomonas species: increasing incidence of catheter-related infections. Medicine (Baltimore) 1990; 69:296–306.
- Fernandez-Hidalgo N, Almirante B, Calleja R, et al. Antibiotic-lock therapy for long-term intravascular catheter-related bacteraemia: results of an open, non-comparative study. J Antimicrob Chemother 2006; 57:1172–1180.
- Poole CV, Carlton D, Bimbo L, Allon M. Treatment of catheter-related bacteraemia with an antibiotic lock protocol: effect of bacterial pathogen. Nephrol Dial Transplant 2004; 19:1237–1244.
- Paterson DL, Ko WC, Von Gottberg A, et al. Outcome of cephalosporin treatment for serious infections due to apparently susceptible organisms producing extended-spectrum beta-lactamases: implications for the clinical microbiology laboratory. J Clin Microbiol 2001; 39:2206–2212.
- Nguyen MH, Peacock JE, Tanner DC, et al. Therapeutic approaches in patients with candidemia. Evaluation in a multicenter, prospective, observational study. Arch Intern Med 1995; 155:2429–2435.
- Hung CC, Chen YC, Chang SC, Luh KT, Hsieh WC. Nosocomial candidemia in a university hospital in Taiwan. J Formos Med Assoc 1996; 95:19–28.
- Rex JH, Bennett JE, Sugar AM, et al. Intravascular catheter exchange and duration of candidemia. NIAID Mycoses Study Group and the Candidemia Study Group. Clin Infect Dis 1995; 21:994–996.
- Karlowicz MG, Hashimoto LN, Kelly RE, Buescher ES. Should central venous catheters be removed as soon as candidemia is detected in neonates? Pediatrics 2000; 106:E63.
- Nucci M, Colombo AL, Silveira F, et al. Risk factors for death in patients with candidemia. Infect Control Hosp Epidemiol 1998; 19:846–850.
- Almirante B, Rodríguez D, Park BJ, et al; Barcelona Candidemia Project Study Group. Epidemiology and predictors of mortality in cases of Candida bloodstream infection: results from population-based surveillance, Barcelona, Spain, from 2002 to 2003. J Clin Microbiol 2005; 43:1829–1835.
- Rex JH, Bennett JE, Sugar AM, et al. A randomized trial comparing fluconazole with amphotericin B for the treatment of candidemia in patients without neutropenia. Candidemia Study Group and the National Institute. N Engl J Med 1994; 331:1325–1330.
- Kuse ER, Chetchotisakd P, da Cunha CA, et al; Micafungin Invasive Candidiasis Working Group. Micafungin versus liposomal amphotericin B for candidaemia and invasive candidosis: a phase III randomised double-blind trial. Lancet 2007; 369:1519–1527.
- Reboli AC, Rotstein C, Pappas PG, et al; Anidulafungin Study Group. Anidulafungin versus fluconazole for invasive candidiasis. N Engl J Med 2007; 356:2472–2482.
- Mora-Duarte J, Betts R, Rotstein C, et al; Caspofungin Invasive Candidiasis Study Group. Comparison of caspofungin and amphotericin B for invasive candidiasis. N Engl J Med 2002; 347:2020–2029.
- Peces R, Gago E, Tejada F, Laures AS, Alvarez-Grande J. Relapsing bacteraemia due to Micrococcus luteus in a haemodialysis patient with a Perm-Cath catheter. Nephrol Dial Transplant 1997; 12:2428–2429.
- Cotton DJ, Gill VJ, Marshall DJ, Gress J, Thaler M, Pizzo PA. Clinical features and therapeutic interventions in 17 cases of Bacillus bacteremia in an immunosuppressed patient population. J Clin Microbiol 1987; 25:672–674.
KEY POINTS
- Most bloodstream infections related to central venous catheters occur in patients with short-term central venous catheters; these infections result in significant morbidity and health care costs.
- Initial management of suspected cases requires decisions about whether to retain or remove the catheter and the choice of empiric antibiotic therapy.
- Management should be based on the specific pathogen isolated.
- An infectious disease specialist should be consulted in complicated cases or when multidrug-resistant bacteria or uncommon pathogens are isolated.
Proton pump inhibitor side effects and drug interactions: Much ado about nothing?
The development and introduction of the first proton pump inhibitor (PPI), omeprazole (Prilosec), for the management of acid-peptic disorders marks one of the great success stories in gastroenterology. Until the latter part of the 20th century, complications of acid-peptic disease were among the most common problems faced in gastroenterology. Severe peptic strictures were once a highly prevalent cause of dysphagia, and operations for peptic ulcer disease were routinely learned by surgical trainees.
The success of these drugs, with sales total-ling $13.6 billion worldwide in 2009,1 is not just a result of their potency and effectiveness in improving symptoms and complications of acid-peptic disease. Their safety among pharmacologic agents has been unparalleled. When the drugs were first introduced, their use was limited to short courses out of concern that gastric carcinoids could develop, but decades of use have not shown this issue to be of clinical relevance. Serious, acute adverse effects are also exceedingly uncommon.
However, recent reports have questioned the long-term safety of PPIs. Furthermore, these drugs are too often used in patients who have no valid indication for them,2,3 exposing these patients to unnecessary risks.
The goals of this review are to analyze the recent literature about the risks of PPIs and to provide a rational approach for managing patients on PPI therapy in light of these concerns.
DO PPIs REDUCE THE EFFECT OF CLOPIDOGREL?
Clopidogrel (Plavix) is a potent antiplatelet agent commonly used in patients with atherosclerotic cardiac or cerebrovascular disease, sometimes in combination with aspirin. Because of the risk of significant gastrointestinal bleeding, a 2008 multisociety task force recommended prescribing a PPI when both clopidogrel and aspirin are used as dual antiplatelet therapy.4
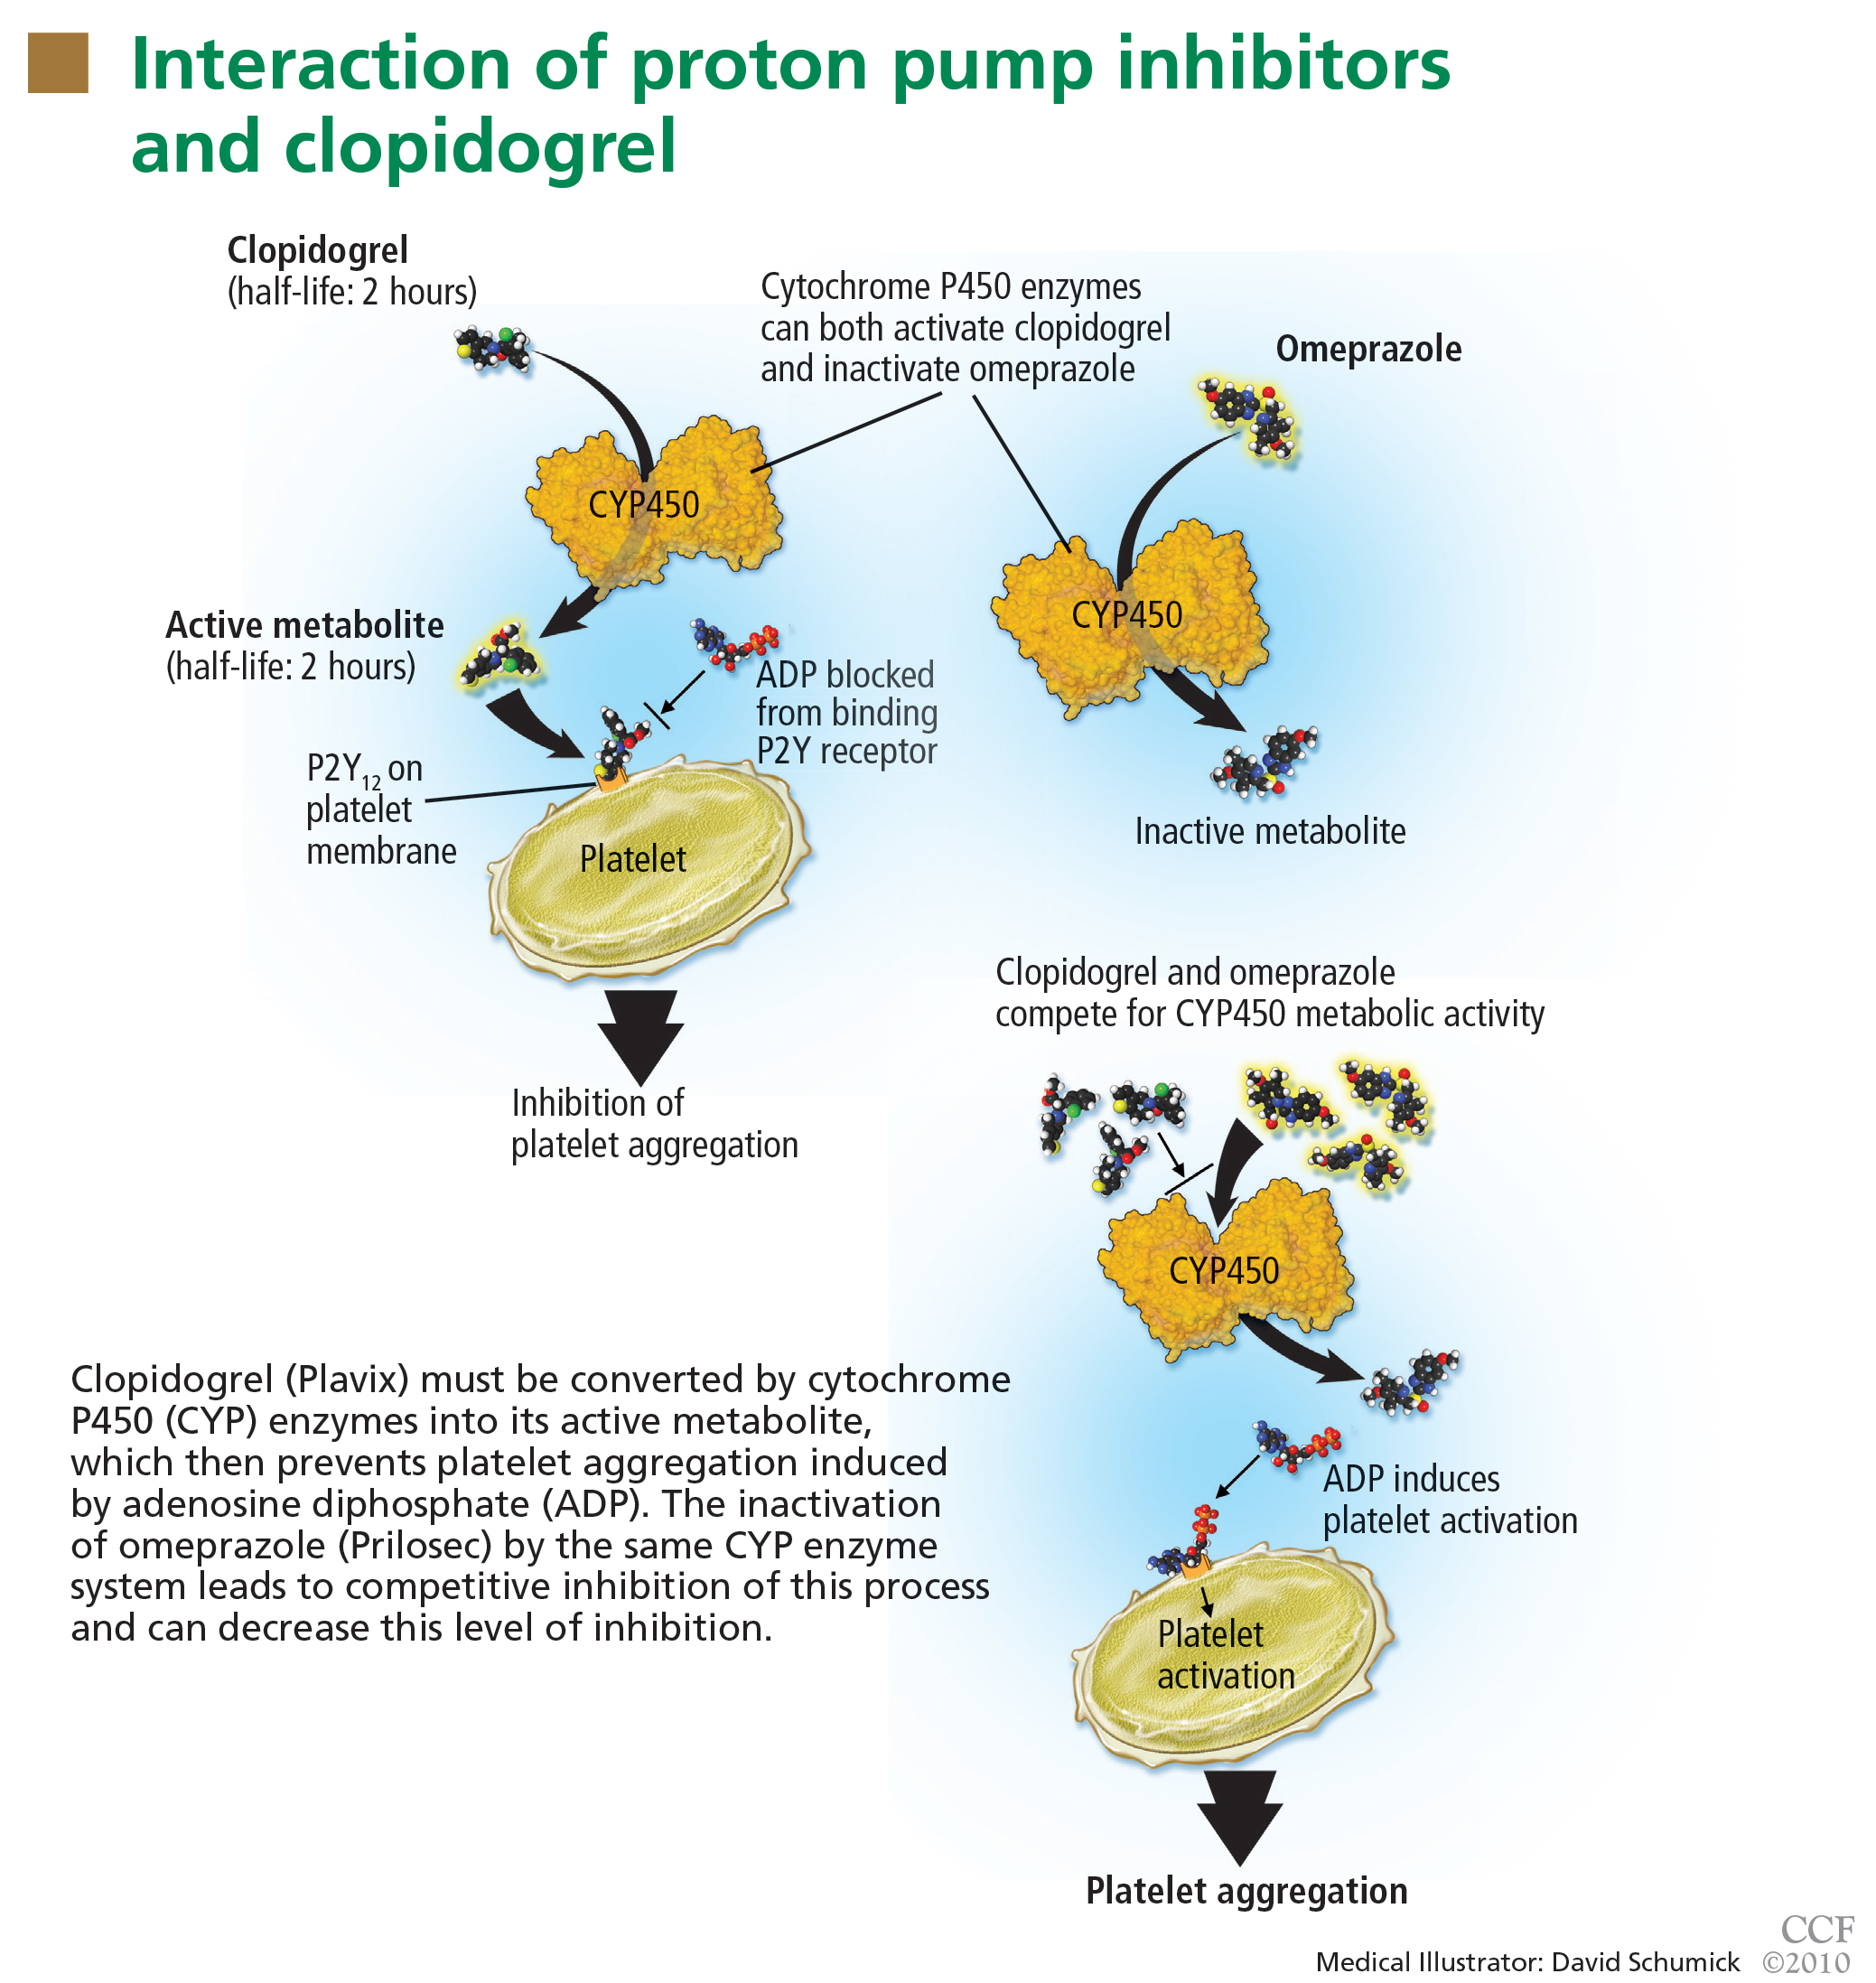
Studies of clopidogrel plus PPIs: Discrepant results
To date, only one prospective randomized controlled trial has specifically investigated the effect of PPIs on cardiovascular outcomes in patients using clopidogrel. In this trial, patients on dual antiplatelet therapy with clopidogrel and aspirin were randomized to receive either omeprazole 20 mg or placebo. Analysis of the data revealed no significant increase in the composite end point of cardiovascular events (hazard ratio [HR] 0.99, 95% confidence interval [CI] 0.68–1.44, P = .96), but a statistically significant decrease in composite gastrointestinal events (HR 0.34, 95% CI 0.18–0.63, P < .001).17
Unfortunately, this trial had to be terminated before the prespecified sample size and duration of follow-up were reached because the study sponsor declared bankruptcy.
One additional recent retrospective cohort study16 likewise found no significant risk of serious cardiovascular disease related to PPI use in clopidogrel users. It also found that the adjusted incidence of hospitalization for upper gastrointestinal bleeding was 50% lower in patients who used PPIs than in those who did not (HR 0.50, 95% CI 0.39–0.65).
Do factors other than PPIs account for the higher risk in some of the studies?
The discrepant results of these studies suggest that the higher risk of cardiovascular events may be due, either completely or in part, to a factor other than the pharmacologic interaction of PPIs and clopidogrel. It is difficult to infer causality from the available data. In situations in which no randomized controlled trials exist, one looks to observational (case-control or cohort) studies to try to obtain the best estimate of the actual risk. With PPIs and clopidogrel, a randomized controlled trial was performed but terminated before patient enrollment was complete.
The increased risk found in some of these studies may be real, may be due to chance, or may even represent an increased risk from PPIs alone (although data do not support this possibility).18 However, the major concern in observational studies is the inability to account for unmeasured confounders, a problem virtually eliminated by randomization strategies in prospective studies.
In the studies that found a higher risk with the combination of omeprazole plus clopidogrel, the principal concern is confounding by indication, in which distortions of the risk estimates arise from an imbalance in prognostic factors between compared treatment groups that remains unmeasured.19 Stated another way, physicians who believed some patients to be “sicker” or to have a higher risk of serious events may have treated them with a PPI on the basis of factors that remained unaccounted for in the epidemiologic investigation.
This possibility has been reinforced by findings from a nonrandomized subgroup analysis of a randomized controlled trial in which patients who had been receiving a PPI had a higher rate of cardiovascular events whether they received clopidogrel or placebo.20
FDA alert: Avoid using omeprazole or esomeprazole with clopidogrel
Nonetheless, on November 17, 2009, the US Food and Drug Administration (FDA) issued an alert to health care professionals and the public about the potential interaction between clopidogrel and omeprazole.21 In this alert, the FDA stated that the use of omeprazole or esomeprazole (Nexium) with clopidogrel should be avoided.
An algorithm to use when considering clopidogrel plus a PPI
Physicians are now left in a bind between the minimal, if any, pooled risk seen in the available data and the FDA recommendation. What is the best action to take?
First, assess the need for dual antiplatelet therapy. If dual antiplatelet therapy (clopidogrel plus aspirin) is required, then a PPI is warranted for gastric protection because the risk of life-threatening bleeding outweighs any increased risk of cardiovascular events.4
If antiplatelet monotherapy (clopidogrel alone) is required, then assess the reason for antisecretory therapy.
For complicated disease, such as gastroesophageal reflux disease with Barrett esophagus or peptic strictures, PPI therapy is warranted to prevent progression or recurrence of complications. If the antisecretory therapy is being provided for noncomplicated symptomatic disorders such as nonerosive gastroesophageal reflux disease or dyspepsia, then one should try to “step down” the therapy by lowering the PPI dose as much as possible while still controlling symptoms to the patient’s tolerance, then possibly stepping further by substituting a histamine-2-receptor antagonist, an antacid, or “on-demand” use of PPIs.22,23
However, if the rationale for antisecretory therapy is simply for gastrointestinal protection, then further risk stratification for gastro intestinal bleeding should be undertaken.4 For patients with a high risk of future gastrointestinal bleeding, such as those with prior episodes of bleeding or concurrent use of nonsteroidal anti-inflammatory drugs, antisecretory therapy is still recommended. Therefore, if a patient is on monotherapy with clopidogrel, has no complicated or symptomatic gastrointestinal disorder, and does not have a high risk of gastrointestinal bleeding, then therapy with a PPI should be reconsidered.
There are no strong data to indicate that one particular PPI should be used or avoided if one of the above criteria indicates the concurrent need for clopidogrel and a PPI. In their health alert about the potential interaction, the FDA did not issue the same warning for PPIs other than omeprazole and esomeprazole, but fell short of recommending a change to another PPI because of a lack of data to support or refute a similar interaction.
Because the half-lives of clopidogrel and PPIs are short, separating their administration could in theory decrease or eliminate the risk of competitive inhibition. The PPI could be given in the morning before breakfast and the clopidogrel could be given at night, or the clopidogrel could be given at lunchtime and the PPI before dinner. Although the FDA does not believe this strategy will reduce this interaction,21 one expert in the field has suggested it.18
DO PPIs CAUSE OSTEOPOROSIS, FRACTURES?
In a widely publicized paper published in 2006, Yang and colleagues25 reported the results of a large nested case-control study in the United Kingdom. The risk of hip fracture was significantly greater in patients who had been using PPIs for at least 1 year than in those who had not. The risk appeared to increase with longer use and higher doses of PPIs.
A similar risk of hip fracture was seen in a larger Danish case-control study published the same year.26 This study also found an increased odds ratio for PPI use in patients with spine fractures as well as in patients with any type of fracture. Interestingly, this study found a lower risk of fracture in patients using a histamine-2-receptor antagonist instead of a PPI.
Targownik et al27 found that the risk of hip fracture was not significantly higher until after 5 years of PPI exposure, with an even stronger risk after 7 years.
However, the data on both association and causal relationship are not uniform.
The Women’s Health Initiative,30 with more than 1 million person-years of followup, found no association between PPI use and hip fracture, but a modest association between PPI use and spine, arm, and wrist fractures, as well as total fractures.
A study in the United Kingdom found that patients without any major risk factors for hip fracture (defined by a risk ratio > 2) accounted for only 25% of cases but 53% of controls. When only these two average-risk groups were compared, the risk of hip fracture was similar in cases and controls.31
Corley et al32 also found that the risk of fracture associated with PPI use was only significant in the presence of another risk factor. These findings suggest that residual confounding may be to blame, at least in part, for the estimates of increased risk in the prior studies.
Another way to interpret these data is that PPIs increase the risk in patients at high risk to begin with, but not in those at average risk. This is an example of interaction (or effect modification) in which the risk is unequally distributed across groups with different characteristics.
A recently published study refutes the theory that impaired calcium absorption is responsible for the increase in fractures.33 In this study, investigators queried the Manitoba Bone Mineral Density Database to determine the relationship between antisecretory therapy with PPIs and osteoporosis or loss of bone mineral density—and they found none. This study may support the theory that residual confounding is the reason for the finding of an increased risk, but it also leaves open the possibility that PPIs induce other changes in bone microstructure that could increase the risk of fracture.
FDA labeling: Possible risk of fracture with PPIs
Based on the data so far, it appears possible that there is a small, albeit statistically significant, association between PPI use and fracture risk. The association is indeed biologically plausible, but it remains to be seen if this association is clinically significant, as the risk is relatively low. Even though the studies had methodologic limitations, on May 25, 2010, the FDA announced a change in the required labeling information for PPIs to indicate a possible risk of fracture with these drugs.34
Reassess the need for chronic PPI therapy
Although patients may worry that they will develop osteoporosis and fractures if they take PPIs, the data do not support a strong risk. Nevertheless, when faced with a patient on chronic PPI therapy, especially with a high dose, providers should use the opportunity to reassess the indication for the PPI to decide if chronic therapy is required, in a matter similar to the algorithm provided for PPI-clopidogrel cotherapy (FIGURE 2). Providers should educate patients about the data, and limit new and recurring PPI prescriptions to patients who require a PPI for appropriate indications, at the lowest dose, and for the shortest time possible.
DO PPIs INCREASE THE RISK OF PNEUMONIA?
Several recent studies have also raised concern about an association between PPI use and pneumonia.
Normally, the stomach remains free of bacteria (except for Helicobacter pylori) because its acidic milieu destroys nearly all bacteria swallowed. If the stomach becomes less acidic, it loses this protective mechanism, and ingested organisms can survive and proliferate.35 In theory, when gastroesophageal reflux occurs, these bacteria could be carried up to the hypopharynx where microaspiration into the lower airways could lead to pneumonia, especially in patients with compromised oropharyngeal protective reflexes (eg, patients on mechanical ventilation).
This possible association came to the attention of the general medical community when a Dutch study,36 in which 5,551 cases of community-acquired pneumonia developed in 364,683 people, found that the incidence of pneumonia was about 4.5 times higher in people exposed to acid-suppressive drugs (both PPIs and histamine-2-receptor antagonists) than in unexposed individuals. Patients who developed pneumonia also had higher odds of significant comorbid conditions, including heart failure and chronic obstructive pulmonary disease. The authors calculated that about one case of pneumonia per 226 patients treated with a PPI would be attributable to the PPI. A major limitation of this study, however, was that only 18% of the patients diagnosed with pneumonia actually had radiologic or microbiologic confirmation of pneumonia.
Other studies later examined the relationship between PPIs and community-acquired pneumonia,37–41 and most have revealed a modestly higher risk of community-acquired pneumonia in patients exposed to PPIs.
This risk was confirmed in a recent metaanalysis, which found a higher risk of community-acquired pneumonia with PPI use (odds ratio 1.36, 95% CI 1.12–1.65).42 However, the authors refrained from drawing definitive conclusions from these data because of significant heterogeneity between the studies. One study37 found that recent onset of use (within 7 days) had a much stronger association with community-acquired pneumonia than longer-term use, which is contradictory to a causal association, since longer-term use should lead to more cases of pneumonia.
Another study investigated the association between acid-suppressive drugs and hospital-acquired pneumonia in nonventilated patients.43 In a 4-year period, there were 63,878 admissions in 42,093 unique patients. Acid-suppressive drugs were prescribed in 32,922 admissions (52%); the drugs included PPIs in 83% of these. Hospital-acquired pneumonia occurred in 2,219 admissions (3.5%), with a higher incidence in patients exposed to acid-suppressive drugs than in the unexposed group (4.6% vs 2.0%). The adjusted odds ratio for pneumonia was 1.3 (95% CI 1.1–1.4) in the exposed group. Subgroup analysis revealed that the association remained significant for PPIs but not for histamine-2-receptor antagonists.
Adequate studies of mechanically ventilated patients in the current era of intravenous PPI use are lacking. Older studies in this group of patients may not be generalizable to current practice because of the reduction in gastric volume with intravenous PPIs that may offset the theoretical risk of aspiration.35
Although the data supporting the association are not exceedingly strong, the relationship is biologically plausible. If there is a risk, it seems to be greatest in the sickest patients, who can least afford to develop pneumonia. Therefore, prudent prescribing should be the rule for both inpatients and outpatients, especially in patients with comorbidities, in whom pneumonia could have serious consequences.
PPIs AND ENTERIC INFECTIONS
Traditionally, gastric acid was not believed to be important in protecting against Clostridium difficile infection because acid-resistant spores were presumed to be the principal vector of transmission.44 Recently, this thought has been challenged, as several studies have found a higher risk of C difficile infection in PPI users. In theory, PPIs may increase the risk of C difficile infection by increasing the ability of the spore to convert to the vegetative form and to survive intraluminally.
A recent meta-analysis of 11 papers, including nearly 127,000 patients, found a significant relationship between PPI use and C difficile infection, with an odds ratio of 2.05 (95% CI 1.47–2.85).45 Further supporting the hypothesis of a direct causative association, a recent study found a significant dose-response, with more aggressive acid-suppression associated with higher odds ratios.46 In view of this association, patients using PPIs who develop diarrhea should be evaluated for C difficile, perhaps even in the absence of other risk factors.
Other enteric infections have been found to be associated with PPIs.44,45 Small intestinal bacterial overgrowth, a condition that is associated with bloating, diarrhea, and malabsorption, has recently been associated with PPI use, although the significance of the association is uncertain.47
Based on a change in the intestinal flora, recent reports have additionally implied that there is a relationship between PPI use and the development of spontaneous bacterial peritonitis in hospitalized cirrhotic patients with ascites. One study found a strong association (odds ratio 4.3, 95% CI 1.3–11.7) between PPIs and spontaneous bacterial pneumonitis,48 whereas another study found no significant association (odds ratio 1.0, 95% CI 0.4–2.6).49
Both studies were small case-control studies of hospitalized patients. No firm conclusion can be drawn about the relevance of this association from these investigations at this point.
PPIs AND ACUTE INTERSTITIAL NEPHRITIS
Several case reports have implicated PPIs as a cause of acute interstitial nephritis.
A systematic review from 2007 found 64 cases documented in the literature, 12 of which were considered certainly associated, and 9 of which were probably associated.50 Initial symptoms were nonspecific and included nausea, malaise, and fever. With such extensive use worldwide as the denominator, the authors concluded that acute interstitial nephritis was a rare, idiosyncratic occurrence related to PPI use, but did not find enough evidence to support a causative relationship. Despite the rarity of the syndrome, they recommended maintaining a high level of clinical suspicion to detect acute interstitial nephritis early in its course, especially soon after the initiation of PPI therapy.
POSSIBLE ASSOCIATIONS WITH IRON AND B12 DEFICIENCIES
Long-term PPI therapy has been thought to be associated with micronutrient deficiencies, especially of iron and vitamin B12. Hydrochloric acid in the stomach assists in the dissociation of iron salts from food and the reduction of ferric iron to the more soluble ferrous iron.51 Gastric acid also facilitates the release of vitamin B12 bound to proteins within ingested foodstuffs to permit binding to R-proteins for eventual absorption in the terminal ileum.51,52
Despite the biologic plausibility of these deficiencies, there is currently little evidence to support a clinically relevant association to recommend a change in current practice.
NO THERAPY IS COMPLETELY WITHOUT RISK
Although concerns have been raised about the long-term safety of PPIs, the preponderance of the evidence does not strongly support the apprehensions publicized over the last few years. When translating these studies into the routine management of patients, it is important to recall some very basic tenets of good patient care.
No therapy is completely without risk—whether pharmacologic, surgical, or psychological, and no matter how benign or straightforward. Consequently, no drug, procedure, or treatment plan should be ordered without a valid indication. Even with an indication, the risk-benefit ratio of the therapy prescribed should always be considered. If the indication for the PPI is weak or uncertain, then even a slight risk tips the balance away from the drug, and the drug should be discontinued.
When seeing patients in long-term care, the indication and necessity for all drugs, including PPIs, should be reviewed. The algorithm proposed in Figure 2 can be adapted for virtually any of the possible associations.
Consider the indication for the PPI. Was the PPI started during a hospitalization and then routinely continued after discharge? This is one situation in which the use of a PPI could potentially be discontinued.2
For complicated acid-peptic disease, dose reduction or cessation of PPI therapy may not be possible.
If the PPI was prescribed only for symptom relief, as in cases of dyspepsia or nonerosive gastroesophageal reflux disease, reduce the dose of PPI to as low as possible to maintain symptom control. Should chronic therapy still be required, no specific monitoring is recommended, apart from routine monitoring that takes place in the course of patient care.
Lastly, because of the media attention that several of these concerns have garnered, patients may still harbor significant concerns about PPIs, even their short-term use. In such cases, the prescriber should take the opportunity to communicate the reason for the decision to prescribe the PPI, as well as the best available data about the risks PPIs may pose. None of these outcomes is very common in the absence of PPIs, with the possible exception of recurrent cardiovascular events, and the risks provided in all of these studies are relative to the baseline risk. Even if the risk of a particular outcome doubles with long-term PPI use, twice a small risk remains a small risk.
- Gatyas G. IMS Health reports U.S. prescription sales grew 5.1 percent in 2009, to $300.3 Billion. IMS Health. http://www.imshealth.com/portal/site/imshealth/menuitem.a46c6d4df3db4b3d88f611019418c22a/?vgnextoid=d690a27e9d5b7210VgnVCM100000ed152ca2RCRD&vgnextfmt=default. Accessed 10/7/2010.
- Zink DA, Pohlman M, Barnes M, Cannon ME. Long-term use of acid suppression started inappropriately during hospitalization. Aliment Pharmacol Ther 2005; 21:1203–1209.
- Heidelbaugh JJ, Inadomi JM. Magnitude and economic impact of inappropriate use of stress ulcer prophylaxis in non-ICU hospitalized patients. Am J Gastroenterol 2006; 101:2200–2205.
- Bhatt DL, Scheiman J, Abraham NS, et al; American College of Cardiology Foundation Task Force on Clinical Expert Consensus Documents. ACCF/ACG/AHA 2008 expert consensus document on reducing the gastrointestinal risks of antiplatelet therapy and NSAID use: a report of the American College of Cardiology Foundation Task Force on Clinical Expert Consensus Documents. Circulation 2008; 118:1894–1909.
- Klotz U, Schwab M, Treiber G. CYP2C19 polymorphism and proton pump inhibitors. Basic Clin Pharmacol Toxicol 2004; 95:2–8.
- Gilard M, Arnaud B, Cornily JC, et al. Influence of omeprazole on the antiplatelet action of clopidogrel associated with aspirin: the randomized, double-blind OCLA (Omeprazole CLopidogrel Aspirin) study. J Am Coll Cardiol 2008; 51:256–260.
- Small DS, Farid NA, Payne CD, et al. Effects of the proton pump inhibitor lansoprazole on the pharmacokinetics and pharmacodynamics of prasugrel and clopidogrel. J Clin Pharmacol 2008; 48:475–484.
- Sibbing D, Morath T, Stegherr J, et al. Impact of proton pump inhibitors on the antiplatelet effects of clopidogrel. Thromb Haemost 2009; 101:714–719.
- O’Donoghue ML, Braunwald E, Antman EM, et al. Pharmacodynamic effect and clinical efficacy of clopidogrel and prasugrel with or without a proton-pump inhibitor: an analysis of two randomised trials. Lancet 2009; 374:989–997.
- Ho PM, Maddox TM, Wang L, et al. Risk of adverse outcomes associated with concomitant use of clopidogrel and proton pump inhibitors following acute coronary syndrome. JAMA 2009; 301:937–944.
- Juurlink DN, Gomes T, Ko DT, et al. A population-based study of the drug interaction between proton pump inhibitors and clopidogrel. CMAJ 2009; 180:713–718.
- Stanek EJ, Aubert RE, Flockhart DA, et al. A national study of the effect of individual proton pump inhibitors on cardiovascular outcomes in patients treated with clopidogrel following coronary stenting: the Clopidogrel Medco Outcomes Study. Program and abstracts of the 32nd Annual SCAI Scientific Sessions May 6, 2009; Las Vegas, Nevada.
- Simon T, Verstuyft C, Mary-Krause M, et al; French Registry of Acute ST-Elevation and Non-ST-Elevation Myocardial Infarction (FAST-MI) Investigators. Genetic determinants of response to clopidogrel and cardiovascular events. N Engl J Med 2009; 360:363–375.
- Collet JP, Hulot JS, Pena A, et al. Cytochrome P450 2C19 polymorphism in young patients treated with clopidogrel after myocardial infarction: a cohort study. Lancet 2009; 373:309–317.
- Ramirez JF, Selzer F, Chakaprani R, et al. Proton pump inhibitor and clopidogrel combination is not associated with adverse clinical outcomes after PCI: the NHLBI dynamic registry (abstract). J Am Coll Cardiol 2009; 53(suppl 1):A27.
- Ray WA, Murray KT, Griffin MR, et al. Outcomes with concurrent use of clopidogrel and proton-pump inhibitors: a cohort study. Ann Intern Med 2010; 152:337–345.
- Bhatt DL, Cryer B, Contant CF, et al. Clopidogrel with or without omeprazole in coronary artery disease. N Engl J Med 2010; 363:1909–1917.
- Laine L, Hennekens C. Proton pump inhibitor and clopidogrel interaction: fact or fiction? Am J Gastroenterol 2010; 105:34–41.
- Walker AM. Confounding by indication. Epidemiology 1996; 7:335–336.
- Dunn SP, Macaulay TE, Brennan DM, et al. Baseline proton pump inhibitor use is associated with increased cardiovascular events with and without the use of clopidogrel in the CREDO trial (abstract). Circulation 2008; 118:S815.
- US Food and Drug Administration. Information for healthcare professionals: update to the labeling of clopidogrel bisulfate (marketed as Plavix) to alert healthcare professionals about a drug interaction with omeprazole (marketed as Prilosec and Prilosec OTC). U.S. Department of Health and Human Services, 11/17/2009. http://www.fda.gov/Drugs/DrugSafety/PostmarketDrugSafetyInformationforPatientsandProviders/DrugSafetyInformationforHeathcareProfessionals/ucm190787.htm. Accessed 9/23/2010.
- Inadomi JM, Jamal R, Murata GH, et al. Step-down management of gastroesophageal reflux disease. Gastroenterology 2001; 121:1095–1100.
- Inadomi JM, McIntyre L, Bernard L, Fendrick AM. Step-down from multiple- to single-dose proton pump inhibitors (PPIs): a prospective study of patients with heartburn or acid regurgitation completely relieved with PPIs. Am J Gastroenterol 2003; 98:1940–1944.
- O’Connell MB, Madden DM, Murray AM, Heaney RP, Kerzner LJ. Effects of proton pump inhibitors on calcium carbonate absorption in women: a randomized crossover trial. Am J Med 2005; 118:778–781.
- Yang YX, Lewis JD, Epstein S, Metz DC. Long-term proton pump inhibitor therapy and risk of hip fracture. JAMA 2006; 296:2947–2953.
- Vestergaard P, Rejnmark L, Mosekilde L. Proton pump inhibitors, histamine H2 receptor antagonists, and other antacid medications and the risk of fracture. Calcif Tissue Int 2006; 79:76–83.
- Targownik LE, Lix LM, Metge CJ, Prior HJ, Leung S, Leslie WD. Use of proton pump inhibitors and risk of osteoporosis-related fractures. CMAJ 2008; 179:319–326.
- Roux C, Briot K, Gossec L, et al. Increase in vertebral fracture risk in postmenopausal women using omeprazole. Calcif Tissue Int 2009; 84:13–19.
- Yu EW, Blackwell T, Ensrud KE, et al. Acid-suppressive medications and risk of bone loss and fracture in older adults. Calcif Tissue Int 2008; 83:251–259.
- Gray SL, LaCroix AZ, Larson J, et al. Proton pump inhibitor use, hip fracture, and change in bone mineral density in postmenopausal women: results from the Women’s Health Initiative. Arch Intern Med 2010; 170:765–771.
- Kaye JA, Jick H. Proton pump inhibitor use and risk of hip fractures in patients without major risk factors. Pharmacotherapy 2008; 28:951–959.
- Corley DA, Kubo A, Zhao W, Quesenberry C. Proton pump inhibitors and histamine-2 receptor antagonists are associated with hip fractures among at-risk patients. Gastroenterology 2010; 139:93–101.
- Targownik LE, Lix LM, Leung S, Leslie WD. Proton-pump inhibitor use is not associated with osteoporosis or accelerated bone mineral density loss. Gastroenterology 2010; 138:896–904.
- US Food and Drug Administration. FDA Drug Safety Communication: possible increased risk of fractures of the hip, wrist, and spine with the use of proton pump inhibitors. U.S. Department of Health and Human Services, 5/25/2010. http://www.fda.gov/Drugs/DrugSafety/PostmarketDrugSafetyInformationforPatientsandProviders/ucm213206.htm. Accessed 12/7/2010.
- Vakil N. Acid inhibition and infections outside the gastrointestinal tract. Am J Gastroenterol 2009; 104(suppl 2):S17–S20.
- Laheij RJ, Sturkenboom MC, Hassing RJ, Dieleman J, Stricker BH, Jansen JB. Risk of community-acquired pneumonia and use of gastric acid-suppressive drugs. JAMA 2004; 292:1955–1960.
- Gulmez SE, Holm A, Frederiksen H, Jensen TG, Pedersen C, Hallas J. Use of proton pump inhibitors and the risk of community-acquired pneumonia: a population-based case-control study. Arch Intern Med 2007; 167:950–955.
- Sarkar M, Hennessy S, Yang YX. Proton-pump inhibitor use and the risk for community-acquired pneumonia. Ann Intern Med 2008; 149:391–398.
- Myles PR, Hubbard RB, McKeever TM, Pogson Z, Smith CJ, Gibson JE. Risk of community-acquired pneumonia and the use of statins, ACE inhibitors and gastric acid suppressants: a population-based case-control study. Pharmacoepidemiol Drug Saf 2009; 18:269–275.
- Rodríguez LA, Ruigómez A, Wallander MA, Johansson S. Acid-suppressive drugs and community-acquired pneumonia. Epidemiology 2009; 20:800–806.
- Eurich DT, Sadowski CA, Simpson SH, Marrie TJ, Majumdar SR. Recurrent community-acquired pneumonia in patients starting acid-suppressing drugs. Am J Med 2010; 123:47–53.
- Johnstone J, Nerenberg K, Loeb M. Meta-analysis: proton pump inhibitor use and the risk of community-acquired pneumonia. Aliment Pharmacol Ther 2010; 31:1165–1177.
- Herzig SJ, Howell MD, Ngo LH, Marcantonio ER. Acid-suppressive medication use and the risk for hospital-acquired pneumonia. JAMA 2009; 301:2120–2128.
- Dial MS. Proton pump inhibitor use and enteric infections. Am J Gastroenterol 2009; 104(suppl 2):S10–S16.
- Leonard J, Marshall JK, Moayyedi P. Systematic review of the risk of enteric infection in patients taking acid suppression. Am J Gastroenterol 2007; 102:2047–2056.
- Howell MD, Novack V, Grgurich P, et al. Iatrogenic gastric acid suppression and the risk of nosocomial Clostridium difficile infection. Arch Intern Med 2010; 170:784–790.
- Lombardo L, Foti M, Ruggia O, Chiecchio A. Increased incidence of small intestinal bacterial overgrowth during proton pump inhibitor therapy. Clin Gastroenterol Hepatol 2010; 8:504–508.
- Bajaj JS, Zadvornova Y, Heuman DM, et al. Association of proton pump inhibitor therapy with spontaneous bacterial peritonitis in cirrhotic patients with ascites. Am J Gastroenterol 2009; 104:1130–1134.
- Campbell MS, Obstein K, Reddy KR, Yang YX. Association between proton pump inhibitor use and spontaneous bacterial peritonitis. Dig Dis Sci 2008; 53:394–398.
- Sierra F, Suarez M, Rey M, Vela MF. Systematic review: proton pump inhibitor-associated acute interstitial nephritis. Aliment Pharmacol Ther 2007; 26:545–553.
- McColl KE. Effect of proton pump inhibitors on vitamins and iron. Am J Gastroenterol 2009; 104(suppl 2):S5–S9.
- Ali T, Roberts DN, Tierney WM. Long-term safety concerns with proton pump inhibitors. Am J Med 2009; 122:896–903.
The development and introduction of the first proton pump inhibitor (PPI), omeprazole (Prilosec), for the management of acid-peptic disorders marks one of the great success stories in gastroenterology. Until the latter part of the 20th century, complications of acid-peptic disease were among the most common problems faced in gastroenterology. Severe peptic strictures were once a highly prevalent cause of dysphagia, and operations for peptic ulcer disease were routinely learned by surgical trainees.
The success of these drugs, with sales total-ling $13.6 billion worldwide in 2009,1 is not just a result of their potency and effectiveness in improving symptoms and complications of acid-peptic disease. Their safety among pharmacologic agents has been unparalleled. When the drugs were first introduced, their use was limited to short courses out of concern that gastric carcinoids could develop, but decades of use have not shown this issue to be of clinical relevance. Serious, acute adverse effects are also exceedingly uncommon.
However, recent reports have questioned the long-term safety of PPIs. Furthermore, these drugs are too often used in patients who have no valid indication for them,2,3 exposing these patients to unnecessary risks.
The goals of this review are to analyze the recent literature about the risks of PPIs and to provide a rational approach for managing patients on PPI therapy in light of these concerns.
DO PPIs REDUCE THE EFFECT OF CLOPIDOGREL?
Clopidogrel (Plavix) is a potent antiplatelet agent commonly used in patients with atherosclerotic cardiac or cerebrovascular disease, sometimes in combination with aspirin. Because of the risk of significant gastrointestinal bleeding, a 2008 multisociety task force recommended prescribing a PPI when both clopidogrel and aspirin are used as dual antiplatelet therapy.4
Studies of clopidogrel plus PPIs: Discrepant results
To date, only one prospective randomized controlled trial has specifically investigated the effect of PPIs on cardiovascular outcomes in patients using clopidogrel. In this trial, patients on dual antiplatelet therapy with clopidogrel and aspirin were randomized to receive either omeprazole 20 mg or placebo. Analysis of the data revealed no significant increase in the composite end point of cardiovascular events (hazard ratio [HR] 0.99, 95% confidence interval [CI] 0.68–1.44, P = .96), but a statistically significant decrease in composite gastrointestinal events (HR 0.34, 95% CI 0.18–0.63, P < .001).17
Unfortunately, this trial had to be terminated before the prespecified sample size and duration of follow-up were reached because the study sponsor declared bankruptcy.
One additional recent retrospective cohort study16 likewise found no significant risk of serious cardiovascular disease related to PPI use in clopidogrel users. It also found that the adjusted incidence of hospitalization for upper gastrointestinal bleeding was 50% lower in patients who used PPIs than in those who did not (HR 0.50, 95% CI 0.39–0.65).
Do factors other than PPIs account for the higher risk in some of the studies?
The discrepant results of these studies suggest that the higher risk of cardiovascular events may be due, either completely or in part, to a factor other than the pharmacologic interaction of PPIs and clopidogrel. It is difficult to infer causality from the available data. In situations in which no randomized controlled trials exist, one looks to observational (case-control or cohort) studies to try to obtain the best estimate of the actual risk. With PPIs and clopidogrel, a randomized controlled trial was performed but terminated before patient enrollment was complete.
The increased risk found in some of these studies may be real, may be due to chance, or may even represent an increased risk from PPIs alone (although data do not support this possibility).18 However, the major concern in observational studies is the inability to account for unmeasured confounders, a problem virtually eliminated by randomization strategies in prospective studies.
In the studies that found a higher risk with the combination of omeprazole plus clopidogrel, the principal concern is confounding by indication, in which distortions of the risk estimates arise from an imbalance in prognostic factors between compared treatment groups that remains unmeasured.19 Stated another way, physicians who believed some patients to be “sicker” or to have a higher risk of serious events may have treated them with a PPI on the basis of factors that remained unaccounted for in the epidemiologic investigation.
This possibility has been reinforced by findings from a nonrandomized subgroup analysis of a randomized controlled trial in which patients who had been receiving a PPI had a higher rate of cardiovascular events whether they received clopidogrel or placebo.20
FDA alert: Avoid using omeprazole or esomeprazole with clopidogrel
Nonetheless, on November 17, 2009, the US Food and Drug Administration (FDA) issued an alert to health care professionals and the public about the potential interaction between clopidogrel and omeprazole.21 In this alert, the FDA stated that the use of omeprazole or esomeprazole (Nexium) with clopidogrel should be avoided.
An algorithm to use when considering clopidogrel plus a PPI
Physicians are now left in a bind between the minimal, if any, pooled risk seen in the available data and the FDA recommendation. What is the best action to take?
First, assess the need for dual antiplatelet therapy. If dual antiplatelet therapy (clopidogrel plus aspirin) is required, then a PPI is warranted for gastric protection because the risk of life-threatening bleeding outweighs any increased risk of cardiovascular events.4
If antiplatelet monotherapy (clopidogrel alone) is required, then assess the reason for antisecretory therapy.
For complicated disease, such as gastroesophageal reflux disease with Barrett esophagus or peptic strictures, PPI therapy is warranted to prevent progression or recurrence of complications. If the antisecretory therapy is being provided for noncomplicated symptomatic disorders such as nonerosive gastroesophageal reflux disease or dyspepsia, then one should try to “step down” the therapy by lowering the PPI dose as much as possible while still controlling symptoms to the patient’s tolerance, then possibly stepping further by substituting a histamine-2-receptor antagonist, an antacid, or “on-demand” use of PPIs.22,23
However, if the rationale for antisecretory therapy is simply for gastrointestinal protection, then further risk stratification for gastro intestinal bleeding should be undertaken.4 For patients with a high risk of future gastrointestinal bleeding, such as those with prior episodes of bleeding or concurrent use of nonsteroidal anti-inflammatory drugs, antisecretory therapy is still recommended. Therefore, if a patient is on monotherapy with clopidogrel, has no complicated or symptomatic gastrointestinal disorder, and does not have a high risk of gastrointestinal bleeding, then therapy with a PPI should be reconsidered.
There are no strong data to indicate that one particular PPI should be used or avoided if one of the above criteria indicates the concurrent need for clopidogrel and a PPI. In their health alert about the potential interaction, the FDA did not issue the same warning for PPIs other than omeprazole and esomeprazole, but fell short of recommending a change to another PPI because of a lack of data to support or refute a similar interaction.
Because the half-lives of clopidogrel and PPIs are short, separating their administration could in theory decrease or eliminate the risk of competitive inhibition. The PPI could be given in the morning before breakfast and the clopidogrel could be given at night, or the clopidogrel could be given at lunchtime and the PPI before dinner. Although the FDA does not believe this strategy will reduce this interaction,21 one expert in the field has suggested it.18
DO PPIs CAUSE OSTEOPOROSIS, FRACTURES?
In a widely publicized paper published in 2006, Yang and colleagues25 reported the results of a large nested case-control study in the United Kingdom. The risk of hip fracture was significantly greater in patients who had been using PPIs for at least 1 year than in those who had not. The risk appeared to increase with longer use and higher doses of PPIs.
A similar risk of hip fracture was seen in a larger Danish case-control study published the same year.26 This study also found an increased odds ratio for PPI use in patients with spine fractures as well as in patients with any type of fracture. Interestingly, this study found a lower risk of fracture in patients using a histamine-2-receptor antagonist instead of a PPI.
Targownik et al27 found that the risk of hip fracture was not significantly higher until after 5 years of PPI exposure, with an even stronger risk after 7 years.
However, the data on both association and causal relationship are not uniform.
The Women’s Health Initiative,30 with more than 1 million person-years of followup, found no association between PPI use and hip fracture, but a modest association between PPI use and spine, arm, and wrist fractures, as well as total fractures.
A study in the United Kingdom found that patients without any major risk factors for hip fracture (defined by a risk ratio > 2) accounted for only 25% of cases but 53% of controls. When only these two average-risk groups were compared, the risk of hip fracture was similar in cases and controls.31
Corley et al32 also found that the risk of fracture associated with PPI use was only significant in the presence of another risk factor. These findings suggest that residual confounding may be to blame, at least in part, for the estimates of increased risk in the prior studies.
Another way to interpret these data is that PPIs increase the risk in patients at high risk to begin with, but not in those at average risk. This is an example of interaction (or effect modification) in which the risk is unequally distributed across groups with different characteristics.
A recently published study refutes the theory that impaired calcium absorption is responsible for the increase in fractures.33 In this study, investigators queried the Manitoba Bone Mineral Density Database to determine the relationship between antisecretory therapy with PPIs and osteoporosis or loss of bone mineral density—and they found none. This study may support the theory that residual confounding is the reason for the finding of an increased risk, but it also leaves open the possibility that PPIs induce other changes in bone microstructure that could increase the risk of fracture.
FDA labeling: Possible risk of fracture with PPIs
Based on the data so far, it appears possible that there is a small, albeit statistically significant, association between PPI use and fracture risk. The association is indeed biologically plausible, but it remains to be seen if this association is clinically significant, as the risk is relatively low. Even though the studies had methodologic limitations, on May 25, 2010, the FDA announced a change in the required labeling information for PPIs to indicate a possible risk of fracture with these drugs.34
Reassess the need for chronic PPI therapy
Although patients may worry that they will develop osteoporosis and fractures if they take PPIs, the data do not support a strong risk. Nevertheless, when faced with a patient on chronic PPI therapy, especially with a high dose, providers should use the opportunity to reassess the indication for the PPI to decide if chronic therapy is required, in a matter similar to the algorithm provided for PPI-clopidogrel cotherapy (FIGURE 2). Providers should educate patients about the data, and limit new and recurring PPI prescriptions to patients who require a PPI for appropriate indications, at the lowest dose, and for the shortest time possible.
DO PPIs INCREASE THE RISK OF PNEUMONIA?
Several recent studies have also raised concern about an association between PPI use and pneumonia.
Normally, the stomach remains free of bacteria (except for Helicobacter pylori) because its acidic milieu destroys nearly all bacteria swallowed. If the stomach becomes less acidic, it loses this protective mechanism, and ingested organisms can survive and proliferate.35 In theory, when gastroesophageal reflux occurs, these bacteria could be carried up to the hypopharynx where microaspiration into the lower airways could lead to pneumonia, especially in patients with compromised oropharyngeal protective reflexes (eg, patients on mechanical ventilation).
This possible association came to the attention of the general medical community when a Dutch study,36 in which 5,551 cases of community-acquired pneumonia developed in 364,683 people, found that the incidence of pneumonia was about 4.5 times higher in people exposed to acid-suppressive drugs (both PPIs and histamine-2-receptor antagonists) than in unexposed individuals. Patients who developed pneumonia also had higher odds of significant comorbid conditions, including heart failure and chronic obstructive pulmonary disease. The authors calculated that about one case of pneumonia per 226 patients treated with a PPI would be attributable to the PPI. A major limitation of this study, however, was that only 18% of the patients diagnosed with pneumonia actually had radiologic or microbiologic confirmation of pneumonia.
Other studies later examined the relationship between PPIs and community-acquired pneumonia,37–41 and most have revealed a modestly higher risk of community-acquired pneumonia in patients exposed to PPIs.
This risk was confirmed in a recent metaanalysis, which found a higher risk of community-acquired pneumonia with PPI use (odds ratio 1.36, 95% CI 1.12–1.65).42 However, the authors refrained from drawing definitive conclusions from these data because of significant heterogeneity between the studies. One study37 found that recent onset of use (within 7 days) had a much stronger association with community-acquired pneumonia than longer-term use, which is contradictory to a causal association, since longer-term use should lead to more cases of pneumonia.
Another study investigated the association between acid-suppressive drugs and hospital-acquired pneumonia in nonventilated patients.43 In a 4-year period, there were 63,878 admissions in 42,093 unique patients. Acid-suppressive drugs were prescribed in 32,922 admissions (52%); the drugs included PPIs in 83% of these. Hospital-acquired pneumonia occurred in 2,219 admissions (3.5%), with a higher incidence in patients exposed to acid-suppressive drugs than in the unexposed group (4.6% vs 2.0%). The adjusted odds ratio for pneumonia was 1.3 (95% CI 1.1–1.4) in the exposed group. Subgroup analysis revealed that the association remained significant for PPIs but not for histamine-2-receptor antagonists.
Adequate studies of mechanically ventilated patients in the current era of intravenous PPI use are lacking. Older studies in this group of patients may not be generalizable to current practice because of the reduction in gastric volume with intravenous PPIs that may offset the theoretical risk of aspiration.35
Although the data supporting the association are not exceedingly strong, the relationship is biologically plausible. If there is a risk, it seems to be greatest in the sickest patients, who can least afford to develop pneumonia. Therefore, prudent prescribing should be the rule for both inpatients and outpatients, especially in patients with comorbidities, in whom pneumonia could have serious consequences.
PPIs AND ENTERIC INFECTIONS
Traditionally, gastric acid was not believed to be important in protecting against Clostridium difficile infection because acid-resistant spores were presumed to be the principal vector of transmission.44 Recently, this thought has been challenged, as several studies have found a higher risk of C difficile infection in PPI users. In theory, PPIs may increase the risk of C difficile infection by increasing the ability of the spore to convert to the vegetative form and to survive intraluminally.
A recent meta-analysis of 11 papers, including nearly 127,000 patients, found a significant relationship between PPI use and C difficile infection, with an odds ratio of 2.05 (95% CI 1.47–2.85).45 Further supporting the hypothesis of a direct causative association, a recent study found a significant dose-response, with more aggressive acid-suppression associated with higher odds ratios.46 In view of this association, patients using PPIs who develop diarrhea should be evaluated for C difficile, perhaps even in the absence of other risk factors.
Other enteric infections have been found to be associated with PPIs.44,45 Small intestinal bacterial overgrowth, a condition that is associated with bloating, diarrhea, and malabsorption, has recently been associated with PPI use, although the significance of the association is uncertain.47
Based on a change in the intestinal flora, recent reports have additionally implied that there is a relationship between PPI use and the development of spontaneous bacterial peritonitis in hospitalized cirrhotic patients with ascites. One study found a strong association (odds ratio 4.3, 95% CI 1.3–11.7) between PPIs and spontaneous bacterial pneumonitis,48 whereas another study found no significant association (odds ratio 1.0, 95% CI 0.4–2.6).49
Both studies were small case-control studies of hospitalized patients. No firm conclusion can be drawn about the relevance of this association from these investigations at this point.
PPIs AND ACUTE INTERSTITIAL NEPHRITIS
Several case reports have implicated PPIs as a cause of acute interstitial nephritis.
A systematic review from 2007 found 64 cases documented in the literature, 12 of which were considered certainly associated, and 9 of which were probably associated.50 Initial symptoms were nonspecific and included nausea, malaise, and fever. With such extensive use worldwide as the denominator, the authors concluded that acute interstitial nephritis was a rare, idiosyncratic occurrence related to PPI use, but did not find enough evidence to support a causative relationship. Despite the rarity of the syndrome, they recommended maintaining a high level of clinical suspicion to detect acute interstitial nephritis early in its course, especially soon after the initiation of PPI therapy.
POSSIBLE ASSOCIATIONS WITH IRON AND B12 DEFICIENCIES
Long-term PPI therapy has been thought to be associated with micronutrient deficiencies, especially of iron and vitamin B12. Hydrochloric acid in the stomach assists in the dissociation of iron salts from food and the reduction of ferric iron to the more soluble ferrous iron.51 Gastric acid also facilitates the release of vitamin B12 bound to proteins within ingested foodstuffs to permit binding to R-proteins for eventual absorption in the terminal ileum.51,52
Despite the biologic plausibility of these deficiencies, there is currently little evidence to support a clinically relevant association to recommend a change in current practice.
NO THERAPY IS COMPLETELY WITHOUT RISK
Although concerns have been raised about the long-term safety of PPIs, the preponderance of the evidence does not strongly support the apprehensions publicized over the last few years. When translating these studies into the routine management of patients, it is important to recall some very basic tenets of good patient care.
No therapy is completely without risk—whether pharmacologic, surgical, or psychological, and no matter how benign or straightforward. Consequently, no drug, procedure, or treatment plan should be ordered without a valid indication. Even with an indication, the risk-benefit ratio of the therapy prescribed should always be considered. If the indication for the PPI is weak or uncertain, then even a slight risk tips the balance away from the drug, and the drug should be discontinued.
When seeing patients in long-term care, the indication and necessity for all drugs, including PPIs, should be reviewed. The algorithm proposed in Figure 2 can be adapted for virtually any of the possible associations.
Consider the indication for the PPI. Was the PPI started during a hospitalization and then routinely continued after discharge? This is one situation in which the use of a PPI could potentially be discontinued.2
For complicated acid-peptic disease, dose reduction or cessation of PPI therapy may not be possible.
If the PPI was prescribed only for symptom relief, as in cases of dyspepsia or nonerosive gastroesophageal reflux disease, reduce the dose of PPI to as low as possible to maintain symptom control. Should chronic therapy still be required, no specific monitoring is recommended, apart from routine monitoring that takes place in the course of patient care.
Lastly, because of the media attention that several of these concerns have garnered, patients may still harbor significant concerns about PPIs, even their short-term use. In such cases, the prescriber should take the opportunity to communicate the reason for the decision to prescribe the PPI, as well as the best available data about the risks PPIs may pose. None of these outcomes is very common in the absence of PPIs, with the possible exception of recurrent cardiovascular events, and the risks provided in all of these studies are relative to the baseline risk. Even if the risk of a particular outcome doubles with long-term PPI use, twice a small risk remains a small risk.
- Gatyas G. IMS Health reports U.S. prescription sales grew 5.1 percent in 2009, to $300.3 Billion. IMS Health. http://www.imshealth.com/portal/site/imshealth/menuitem.a46c6d4df3db4b3d88f611019418c22a/?vgnextoid=d690a27e9d5b7210VgnVCM100000ed152ca2RCRD&vgnextfmt=default. Accessed 10/7/2010.
- Zink DA, Pohlman M, Barnes M, Cannon ME. Long-term use of acid suppression started inappropriately during hospitalization. Aliment Pharmacol Ther 2005; 21:1203–1209.
- Heidelbaugh JJ, Inadomi JM. Magnitude and economic impact of inappropriate use of stress ulcer prophylaxis in non-ICU hospitalized patients. Am J Gastroenterol 2006; 101:2200–2205.
- Bhatt DL, Scheiman J, Abraham NS, et al; American College of Cardiology Foundation Task Force on Clinical Expert Consensus Documents. ACCF/ACG/AHA 2008 expert consensus document on reducing the gastrointestinal risks of antiplatelet therapy and NSAID use: a report of the American College of Cardiology Foundation Task Force on Clinical Expert Consensus Documents. Circulation 2008; 118:1894–1909.
- Klotz U, Schwab M, Treiber G. CYP2C19 polymorphism and proton pump inhibitors. Basic Clin Pharmacol Toxicol 2004; 95:2–8.
- Gilard M, Arnaud B, Cornily JC, et al. Influence of omeprazole on the antiplatelet action of clopidogrel associated with aspirin: the randomized, double-blind OCLA (Omeprazole CLopidogrel Aspirin) study. J Am Coll Cardiol 2008; 51:256–260.
- Small DS, Farid NA, Payne CD, et al. Effects of the proton pump inhibitor lansoprazole on the pharmacokinetics and pharmacodynamics of prasugrel and clopidogrel. J Clin Pharmacol 2008; 48:475–484.
- Sibbing D, Morath T, Stegherr J, et al. Impact of proton pump inhibitors on the antiplatelet effects of clopidogrel. Thromb Haemost 2009; 101:714–719.
- O’Donoghue ML, Braunwald E, Antman EM, et al. Pharmacodynamic effect and clinical efficacy of clopidogrel and prasugrel with or without a proton-pump inhibitor: an analysis of two randomised trials. Lancet 2009; 374:989–997.
- Ho PM, Maddox TM, Wang L, et al. Risk of adverse outcomes associated with concomitant use of clopidogrel and proton pump inhibitors following acute coronary syndrome. JAMA 2009; 301:937–944.
- Juurlink DN, Gomes T, Ko DT, et al. A population-based study of the drug interaction between proton pump inhibitors and clopidogrel. CMAJ 2009; 180:713–718.
- Stanek EJ, Aubert RE, Flockhart DA, et al. A national study of the effect of individual proton pump inhibitors on cardiovascular outcomes in patients treated with clopidogrel following coronary stenting: the Clopidogrel Medco Outcomes Study. Program and abstracts of the 32nd Annual SCAI Scientific Sessions May 6, 2009; Las Vegas, Nevada.
- Simon T, Verstuyft C, Mary-Krause M, et al; French Registry of Acute ST-Elevation and Non-ST-Elevation Myocardial Infarction (FAST-MI) Investigators. Genetic determinants of response to clopidogrel and cardiovascular events. N Engl J Med 2009; 360:363–375.
- Collet JP, Hulot JS, Pena A, et al. Cytochrome P450 2C19 polymorphism in young patients treated with clopidogrel after myocardial infarction: a cohort study. Lancet 2009; 373:309–317.
- Ramirez JF, Selzer F, Chakaprani R, et al. Proton pump inhibitor and clopidogrel combination is not associated with adverse clinical outcomes after PCI: the NHLBI dynamic registry (abstract). J Am Coll Cardiol 2009; 53(suppl 1):A27.
- Ray WA, Murray KT, Griffin MR, et al. Outcomes with concurrent use of clopidogrel and proton-pump inhibitors: a cohort study. Ann Intern Med 2010; 152:337–345.
- Bhatt DL, Cryer B, Contant CF, et al. Clopidogrel with or without omeprazole in coronary artery disease. N Engl J Med 2010; 363:1909–1917.
- Laine L, Hennekens C. Proton pump inhibitor and clopidogrel interaction: fact or fiction? Am J Gastroenterol 2010; 105:34–41.
- Walker AM. Confounding by indication. Epidemiology 1996; 7:335–336.
- Dunn SP, Macaulay TE, Brennan DM, et al. Baseline proton pump inhibitor use is associated with increased cardiovascular events with and without the use of clopidogrel in the CREDO trial (abstract). Circulation 2008; 118:S815.
- US Food and Drug Administration. Information for healthcare professionals: update to the labeling of clopidogrel bisulfate (marketed as Plavix) to alert healthcare professionals about a drug interaction with omeprazole (marketed as Prilosec and Prilosec OTC). U.S. Department of Health and Human Services, 11/17/2009. http://www.fda.gov/Drugs/DrugSafety/PostmarketDrugSafetyInformationforPatientsandProviders/DrugSafetyInformationforHeathcareProfessionals/ucm190787.htm. Accessed 9/23/2010.
- Inadomi JM, Jamal R, Murata GH, et al. Step-down management of gastroesophageal reflux disease. Gastroenterology 2001; 121:1095–1100.
- Inadomi JM, McIntyre L, Bernard L, Fendrick AM. Step-down from multiple- to single-dose proton pump inhibitors (PPIs): a prospective study of patients with heartburn or acid regurgitation completely relieved with PPIs. Am J Gastroenterol 2003; 98:1940–1944.
- O’Connell MB, Madden DM, Murray AM, Heaney RP, Kerzner LJ. Effects of proton pump inhibitors on calcium carbonate absorption in women: a randomized crossover trial. Am J Med 2005; 118:778–781.
- Yang YX, Lewis JD, Epstein S, Metz DC. Long-term proton pump inhibitor therapy and risk of hip fracture. JAMA 2006; 296:2947–2953.
- Vestergaard P, Rejnmark L, Mosekilde L. Proton pump inhibitors, histamine H2 receptor antagonists, and other antacid medications and the risk of fracture. Calcif Tissue Int 2006; 79:76–83.
- Targownik LE, Lix LM, Metge CJ, Prior HJ, Leung S, Leslie WD. Use of proton pump inhibitors and risk of osteoporosis-related fractures. CMAJ 2008; 179:319–326.
- Roux C, Briot K, Gossec L, et al. Increase in vertebral fracture risk in postmenopausal women using omeprazole. Calcif Tissue Int 2009; 84:13–19.
- Yu EW, Blackwell T, Ensrud KE, et al. Acid-suppressive medications and risk of bone loss and fracture in older adults. Calcif Tissue Int 2008; 83:251–259.
- Gray SL, LaCroix AZ, Larson J, et al. Proton pump inhibitor use, hip fracture, and change in bone mineral density in postmenopausal women: results from the Women’s Health Initiative. Arch Intern Med 2010; 170:765–771.
- Kaye JA, Jick H. Proton pump inhibitor use and risk of hip fractures in patients without major risk factors. Pharmacotherapy 2008; 28:951–959.
- Corley DA, Kubo A, Zhao W, Quesenberry C. Proton pump inhibitors and histamine-2 receptor antagonists are associated with hip fractures among at-risk patients. Gastroenterology 2010; 139:93–101.
- Targownik LE, Lix LM, Leung S, Leslie WD. Proton-pump inhibitor use is not associated with osteoporosis or accelerated bone mineral density loss. Gastroenterology 2010; 138:896–904.
- US Food and Drug Administration. FDA Drug Safety Communication: possible increased risk of fractures of the hip, wrist, and spine with the use of proton pump inhibitors. U.S. Department of Health and Human Services, 5/25/2010. http://www.fda.gov/Drugs/DrugSafety/PostmarketDrugSafetyInformationforPatientsandProviders/ucm213206.htm. Accessed 12/7/2010.
- Vakil N. Acid inhibition and infections outside the gastrointestinal tract. Am J Gastroenterol 2009; 104(suppl 2):S17–S20.
- Laheij RJ, Sturkenboom MC, Hassing RJ, Dieleman J, Stricker BH, Jansen JB. Risk of community-acquired pneumonia and use of gastric acid-suppressive drugs. JAMA 2004; 292:1955–1960.
- Gulmez SE, Holm A, Frederiksen H, Jensen TG, Pedersen C, Hallas J. Use of proton pump inhibitors and the risk of community-acquired pneumonia: a population-based case-control study. Arch Intern Med 2007; 167:950–955.
- Sarkar M, Hennessy S, Yang YX. Proton-pump inhibitor use and the risk for community-acquired pneumonia. Ann Intern Med 2008; 149:391–398.
- Myles PR, Hubbard RB, McKeever TM, Pogson Z, Smith CJ, Gibson JE. Risk of community-acquired pneumonia and the use of statins, ACE inhibitors and gastric acid suppressants: a population-based case-control study. Pharmacoepidemiol Drug Saf 2009; 18:269–275.
- Rodríguez LA, Ruigómez A, Wallander MA, Johansson S. Acid-suppressive drugs and community-acquired pneumonia. Epidemiology 2009; 20:800–806.
- Eurich DT, Sadowski CA, Simpson SH, Marrie TJ, Majumdar SR. Recurrent community-acquired pneumonia in patients starting acid-suppressing drugs. Am J Med 2010; 123:47–53.
- Johnstone J, Nerenberg K, Loeb M. Meta-analysis: proton pump inhibitor use and the risk of community-acquired pneumonia. Aliment Pharmacol Ther 2010; 31:1165–1177.
- Herzig SJ, Howell MD, Ngo LH, Marcantonio ER. Acid-suppressive medication use and the risk for hospital-acquired pneumonia. JAMA 2009; 301:2120–2128.
- Dial MS. Proton pump inhibitor use and enteric infections. Am J Gastroenterol 2009; 104(suppl 2):S10–S16.
- Leonard J, Marshall JK, Moayyedi P. Systematic review of the risk of enteric infection in patients taking acid suppression. Am J Gastroenterol 2007; 102:2047–2056.
- Howell MD, Novack V, Grgurich P, et al. Iatrogenic gastric acid suppression and the risk of nosocomial Clostridium difficile infection. Arch Intern Med 2010; 170:784–790.
- Lombardo L, Foti M, Ruggia O, Chiecchio A. Increased incidence of small intestinal bacterial overgrowth during proton pump inhibitor therapy. Clin Gastroenterol Hepatol 2010; 8:504–508.
- Bajaj JS, Zadvornova Y, Heuman DM, et al. Association of proton pump inhibitor therapy with spontaneous bacterial peritonitis in cirrhotic patients with ascites. Am J Gastroenterol 2009; 104:1130–1134.
- Campbell MS, Obstein K, Reddy KR, Yang YX. Association between proton pump inhibitor use and spontaneous bacterial peritonitis. Dig Dis Sci 2008; 53:394–398.
- Sierra F, Suarez M, Rey M, Vela MF. Systematic review: proton pump inhibitor-associated acute interstitial nephritis. Aliment Pharmacol Ther 2007; 26:545–553.
- McColl KE. Effect of proton pump inhibitors on vitamins and iron. Am J Gastroenterol 2009; 104(suppl 2):S5–S9.
- Ali T, Roberts DN, Tierney WM. Long-term safety concerns with proton pump inhibitors. Am J Med 2009; 122:896–903.
KEY POINTS
- The US Food and Drug Administration has issued alerts that PPIs may increase the rate of osteoporosis-related fractures and may decrease the effectiveness of clopidogrel (Plavix) for preventing serious cardiovascular events.
- Other concerns include increased rates of pneumonia, Clostridium difficile infection, and other infections.
- A prudent approach to managing these concerns in day-to-day practice is required: PPIs, like any other drugs, should be prescribed only if indicated.