User login
In the Literature
In This Edition
Literature at a Glance
A guide to this month’s studies
- Stress testing in young patients with chest pain.
- Family presence during CPR.
- Achieving rate control in rapid atrial fibrillation.
- D-dimer in aortic dissection.
- Acute kidney injury outcomes.
- Statins after stroke.
- Low-dose steroids in septic shock.
- Genetic testing for VTE.
1) Utility of Cardiac Stress Testing Is Limited for Young Patients with Chest Pain
Clinical question: Does routine, provocative cardiac testing in low-risk adult patients younger than 40 years of age add to the diagnostic evaluation for acute coronary syndrome?
Background: In EDs, aggressive evaluation of chest pain is the standard of care due to high morbidity, mortality, and liability associated with acute coronary syndrome (ACS). Guidelines recommend provocative cardiac testing for all patients for whom ACS is suspected, yet the prevalence is low in patients younger than 40.
Study design: Retrospective observational study.
Setting: ED chest pain observation unit of an urban academic tertiary-care center in New York City.
Synopsis: Two hundred twenty patients between 22 and 39 years old admitted for ACS evaluation between March 2004 and September 2007 were eligible. Patients with known coronary artery disease, diagnostic ECG findings, or evidence of cocaine use were excluded. Provocative cardiac testing for the presence of myocardial ischemia followed serial cardiac biomarker testing to rule out myocardial infarction.
Six patients had positive stress tests. Four underwent subsequent coronary angiography, which demonstrated no evidence of obstructive coronary disease. One refused catheterization, and the other was lost to followup. Age younger than 40 years, nondiagnostic or normal ECG, and two sets of negative cardiac biomarker results at least six hours apart identified a patient group with a low rate of true-positive provocative testing.
This study is limited by its retrospective, single-centered nature; it was unable to include patients admitted to the hospital or those who left the chest-pain unit without provocative testing or against medical advice. The possibility of false-negative provocative testing results was not excluded. The methods of provocative testing were limited to those available prior to 2007.
Bottom line: Cardiac stress testing adds little to the diagnostic evaluation for patients younger than 40 years having nondiagnostic ECG and negative serial biomarker results. However, routine provocative testing is unlikely to decrease until better clinical risk-stratification tools exist for this very-low-prevalence population.
Citation: Hermann LK, Weingart SD, Duvall WL, Henzlova MJ. The limited utility of routine cardiac stress testing in emergency department chest pain patients younger than 40 years. Ann Emerg Med. 2009;54(1):12-16.
2) Family Witness Behavior Impacts Physician Performance during CPR
Clinical question: Does the presence or behavior of a family witness to cardiopulmonary resuscitation (CPR) alter the critical actions performed by physicians?
Background: Because few patients undergoing in-hospital CPR survive to hospital discharge, many hospitals allow at least one family member of the dying patient to be present during the resuscitation attempt. There is little evidence concerning the bereavement outcomes for the family witness or effect on the resuscitation environment and physician performance.
Study design: Randomized controlled study.
Setting: Human patient simulator-based medical resuscitation environment with standardized actors in an academic medical center.
Synopsis: Sixty second- and third-year emergency medicine residents were randomized in pairs and assigned to one of three groups: no family witness, a non-obstructive witness, or a witness displaying overt grief reactions. Trained actors played the roles of social worker and family member. All groups were joined by the social worker and participated in identical cardiac-arrest-code scenarios ending in asystole. The nurse in each group was scripted to make a potentially harmful medication error. Outcomes studied were physician-performance-based, such as length of the resuscitation attempt, time to critical events, and recognition of a potential drug administration error.
Delay in initiation of defibrillator shocks and decrease in the number of shocks delivered occurred in the overt grief reaction group. Failure to recognize the medication error occurred only once, and it was in the control group. No other significant differences were observed between groups.
Limitations to this study are its small size and possibility that physician behavior in simulated environments might not reflect that of real patient-care situations.
Bottom line: Overt grief reactions from family members witnessing CPR attempts might negatively impact important procedural events and decisions made by physicians, specifically the use of defibrillation, which could negatively affect outcomes of CPR.
Citation: Fernandez R, Compton S, Jones KA, Velilla MA. The presence of a family witness impacts physician performance during simulated medical codes. Crit Care Med. 2009;37(6): 1956-1960.
3) Diltiazem Is a Better Choice in Uncomplicated Atrial Fibrillation than Amiodarone or Digoxin
Clinical question: How does IV diltiazem compare to IV amiodarone or digoxin in achieving ventricular rate control in patients hospitalized for acute uncomplicated atrial fibrillation (AF)?
Background: Current guidelines for acute AF management are based on expert opinion and recommend calcium antagonists, beta-blockers, or digoxin for initial ventricular rate control in hemodynamically stable patients. Recommendations lead to wide clinical variations in the first 24 hours of presentation.
Study design: Randomized, open-label trial.
Setting: Single-center study in Hong Kong.
Synopsis: One hundred fifty patients presenting with acute symptomatic AF of <48 hours duration with a rapid ventricular rate were enrolled. The study endpoints were ventricular rate control within the first 24 hours defined as a sustained heart rate of <90 beats per minute for less than four hours. The time to ventricular rate control in patients assigned to the diltiazem group (three hours) was significantly shorter than that of the digoxin group (six hours) or the amiodarone group (seven hours). The percentage of patients who achieved ventricular rate control in the diltiazem group was 90%, compared with 74% in both the digoxin and amiodarone groups. Length of stay was shorter in diltiazem group (3.9 days) when compared with the digoxin group (4.7 days) and amiodarone group (4.7 days).
Major limitations of the study were the lack of beta-blockers as an option for rate control and the exclusion of patients with hemodynamic instability, heart failure, and myocardial infarction. As patients with underlying heart disease were excluded, these results cannot be applied to all patients presenting with acute AF.
Bottom line: Compared with digoxin and amidarone, intravenous diltiazem is safe and effective in achieving ventricular rate control to improve symptoms and to reduce length of hospital stay in acute uncomplicated AF.
Citation: Siu CW, Lau CP, Lee WL, Lam KF, Tse HF. Intravenous diltiazem is superior to intravenous amiodarone or digoxin for achieving ventricular rate control in patients with acute uncomplicated atrial fibrillation. Crit Care Med. 2009;37(7):2174-2179.
4) D-dimer Might Be a Reliable Assay to Determine Likelihood of Acute Aortic Dissection
Clinical question: Is the D-dimer assay beneficial in the evaluation of acute aortic dissection (AD)?
Background: Aortic dissection is a potentially lethal disorder that is included in the differential diagnosis of chest pain. No studies exist that specifically examine the use of the D-dimer assay to exclude or predict AD. D-dimer has been proven to be a useful tool to help rule out pulmonary embolism (PE) and DVT.
Study design: Prospective.
Setting: Fourteen centers in the U.S., Europe, and Japan.
Synopsis: Of 220 patients enrolled in the study, 87 had radiologically proven AD, and 133 had an initial suspicion of AD but a different final diagnosis. D-dimer assay was obtained on patients with a suspicion of AD within 24 hours of symptom onset. Additionally, appropriate imaging was performed on all patients to identify AD presence.
D-dimer was found to be a useful “rule out” test. At a cutoff level of 500 ng/mL, the negative likelihood ratio was 0.07 (<0.1 being suggestive of a good rule-out tool) and the negative predictive value was >90%. D-dimer was not shown to be as useful to predict the presence of AD in this study.
A major limitation of the study was a relatively small sample size, especially when subgroups were analyzed, therefore decreasing the overall accuracy of the study. Although this study shows promise for the D-dimer assay in the evaluation of suspected AD, it does not establish D-dimer as a reliable enough test to rule out AD without further imaging or evaluation.
Bottom line: Though this study illustrated a high negative predictive value for D-dimer in AD evaluation, physicians are cautioned against allowing a negative D-dimer to affect their management of a patient with a suspected acute aortic dissection.
Citation: Suzuki T, Distante A, Zizza A, et al. Diagnosis of acute aortic dissection by D-dimer: the International Registry of Acute Aortic Dissection Substudy on Biomarkers (IRAD-bio) experience. Circulation. 2009;119(20):2702-2707.
5) Acute Kidney Injury Predicts Outcomes of Non-Critically-Ill Patients
Clinical question: Does acute kidney injury affect in-hospital mortality, need for renal replacement therapy, and length of stay in patients who are not critically ill?
Background: Using the Acute Kidney Injury Network’s definition of acute kidney injury (AKI), including an abrupt increase in creatinine of 0.3 mg/dL, the authors previously showed an association with poor outcomes in critically ill patients. There is less evidence as to whether it predicts outcomes in non-critically-ill patients.
Study design: Retrospective cohort and a case-control study.
Setting: Bridgeport (Conn.) Hospital, a 350-bed community teaching hospital affiliated with Yale New Haven Health System.
Synopsis: Seven hundred thirty-five patients admitted to a medical unit who developed AKI, defined as a serum creatinine increase of 0.3 mg/dL or more within a 48-hour period, were compared to 5,089 controls. Patients who were admitted to critical care or who received RRT within the first 48 hours were excluded. AKI patients had higher in-hospital mortality of 14.8%, compared with 1.5% of controls, longer hospital stays of 7.9 versus 3.7 days, higher rates of transfer to the ICU of 28.6% versus 4.3%, and 73 versus zero patients who required renal replacement therapy. All findings were statistically significant (P<0.001). Some patients were omitted because of inadequate data collection.
Two hundred eighty-two patients were randomly selected from each group and matched based on age and demographic characteristics to perform a case-control study. AKI patients were eight times more likely to die in the hospital and five times more likely to have prolonged lengths of stay and transfer to the ICU.
This study does not differentiate between types of AKI and does not show a causal relationship.
Bottom line: AKI, defined as a serum creatinine increase of 0.3 mg/dL or more within a 48-hour period, predicts worse outcomes in non-critically-ill patients.
Citation: Barrantes F, Feng Y, Ivanov O, et al. Acute kidney injury predicts outcomes of non-critically ill patients. Mayo Clin Proc. 2009;84(5):410-416.
6) Statin Therapy after First Stroke Reduces Recurrence and Improves Survival
Clinical question: Does statin therapy after first ischemic stroke reduce recurrence and long-term mortality?
Background: Statin treatment has been shown to reduce primary stroke incidence, but there is less evidence on secondary prevention.
Study design: Retrospective observational study.
Setting: Acute stroke, general medicine, and neurology units at the hospitals affiliated with the University of Ioannina School of Medicine in Athens, Greece.
Synopsis: Seven hundred ninety-four primary ischemic stroke patients were admitted and followed for a 10-year period. Of those, 596 patients were discharged without a statin; 198 patients were discharged on statin therapy. One hundred twelve, or 14.1%, of the 794 patients had a recurrent event. The recurrence rate was 16.3% among those who did not receive a statin versus 7.6% among those who did receive a statin post-discharge (P=0.002).
Bottom line: Post-discharge statin therapy after an initial stroke appears to reduce the risk of recurrence.
Citation: Milionis HJ, Giannopoulos S, Kosmidou M, et al. Statin therapy after first stroke reduces 10-year stroke recurrence and improves survival. Neurology. 2009;72(21):1816-1822.
7) Low-Dose Corticosteroids Provide Modest Benefit to Patients with Vasopressor-Dependent Sepsis and Septic Shock
Clinical question: What are the risks and benefits of corticosteroid treatment in severe sepsis and septic shock?
Background: For more than 50 years, corticosteroids have been used as an adjuvant treatment for sepsis with conflicting benefits on mortality.
Study design: Meta-analysis. Literature Search of Cochrane Library, MEDLINE, EMBASE, and LILACS.
Synopsis: Seventeen randomized controlled trials and three quasi-randomized controlled trials of 3,384 patients were selected for statistical analysis. Overall, corticosteroids did not improve 28-day, all-cause mortality in severe sepsis and septic shock. There was a statistically significant reduction in 28-day mortality only for the subgroup of patients receiving prolonged low-dose steroid treatment (37.5% vs. 44% in the control group).
There was no increased risk of gastrointestinal hemorrhage, superinfection, or neuromuscular weakness seen in treated patients.
The trials differed in the types of corticosteroid used, the time to institution of therapy, bolus versus continuous administration, duration of therapy, and abrupt versus gradual interruption of treatment. All of these factors make the clinical application of the data challenging.
Bottom line: Many questions remain about the optimal dose, timing, and duration of corticosteroids in patients with vasopressor-dependent sepsis and septic shock, but there appears to be a modest mortality benefit with prolonged low-dose corticosteroid therapy.
Citation: Annane D, Bellissant E, Bollaert P, et al. Corticosteroids in the treatment of severe sepsis and septic shock in adults: a systematic review. JAMA. 2009;301(22): 2362-2375.
8) Testing for FVL Mutation but Not 20210A Predicts Recurrent VTE Risk
Clinical question: Are the rates of recurrent VTE higher in adults with VTE who possess either the factor V Leiden (FVL) or Prothrombin G20210A mutation, and what are the rates of VTE among family members?
Background: Clinicians commonly test for genetic mutations when treating patients who have a thrombotic event. However, the utility of such tests on predicting the risk for recurrent events and on outcomes needs review.
Study design: Meta-analysis.
Setting: Literature search of MEDLINE, EMBASE, the Cochrane Library, CINAHL, and PsycInfo.
Synopsis: Forty-six articles were selected for statistical analysis. The presence of either homozygous or heterozygous FVL mutation increased the risk of recurrent VTE compared with individuals without the FVL mutation (OR 2.65 and 1.56, respectively).
Compared with family members of adults without the FVL mutation, the presence of either homozygous or heterozygous FVL mutation predicts VTE in family members (OR 18 and 3.5, respectively).
The presence of G20210A is not predictive of recurrent VTE compared with individuals without this mutation. There is not sufficient evidence regarding the predictive value of the G20210A mutation on the risk of VTE in family members.
No studies directly address the effect of testing on outcomes other than recurrent VTE. In family members who were tested, there did not seem to be any impact on daily behavior, recognition of VTE risk factors, or perceived stress from testing.
Bottom line: FVL mutation increases the risk of recurrent VTE and predicts VTE in family members. The benefits of testing family members remain unclear.
Citation: Segal J, Brotman, D, Necochea, A, et al. Predictive value of factor V Leiden and prothrombin G20210A in adults with venous thromboembolism and in family members of those with a mutation: a systematic review. JAMA. 2009;301 (23):2472-2485. TH
PEDIATRIC HM LITERATURE
Lower Rates of Serious Bacterial Infection in Young Febrile Infants with Influenza
By Mark Shen, MD

Clinical question: What is the risk of serious bacterial infection (SBI) in febrile infants ≤60 days of age with influenza virus infections?
Background: Febrile infants with documented viral infections have a lower rate of SBI than febrile infants who do not have a positive test for a specific virus. The literature strongly supports this finding with respiratory syncytial virus (RSV), although the specific association with influenza is less clear, particularly as there is an increased risk of secondary bacterial infections in patients of all ages with influenza.
Study design: Secondary analysis of a prior prospective study.
Setting: Five pediatric EDs.
Synopsis: This was a secondary analysis of a prior prospective study (1998-2001) that examined the relationship between RSV infection and SBI in febrile infants ≤60 days of age. This analysis was restricted to centers in which bacterial cultures were obtained and the standard evaluation included testing for influenza. Of 844 infants tested for influenza, SBI status could be determined in 809 (95.9%), and 123 tested positive for influenza. Of those with influenza, only three (2.5%) were found to have an SBI, and all three had a urinary tract infection (UTI). By comparison, 13.3% of the influenza-negative patients had SBIs, 10.8% of which were UTIs.
The primary study limitation is the secondary nature of the analysis. The enrollment period was October through March of each year, and influenza virus peaked in December and January of each year studied. In addition, the authors were able to refer to prospectively collected data on SBI status. These data are consistent with other studies demonstrating a lower likelihood of SBI in documented viral infections.
Bottom line: Febrile infants with influenza virus infection are at lower risk of serious bacterial infection.
Citation: Krief WI, Levine DA, Platt SL, et al. Influenza virus infection and the risk of serious bacterial infections in young febrile infants. Pediatrics. 2009;124:30-39.
In This Edition
Literature at a Glance
A guide to this month’s studies
- Stress testing in young patients with chest pain.
- Family presence during CPR.
- Achieving rate control in rapid atrial fibrillation.
- D-dimer in aortic dissection.
- Acute kidney injury outcomes.
- Statins after stroke.
- Low-dose steroids in septic shock.
- Genetic testing for VTE.
1) Utility of Cardiac Stress Testing Is Limited for Young Patients with Chest Pain
Clinical question: Does routine, provocative cardiac testing in low-risk adult patients younger than 40 years of age add to the diagnostic evaluation for acute coronary syndrome?
Background: In EDs, aggressive evaluation of chest pain is the standard of care due to high morbidity, mortality, and liability associated with acute coronary syndrome (ACS). Guidelines recommend provocative cardiac testing for all patients for whom ACS is suspected, yet the prevalence is low in patients younger than 40.
Study design: Retrospective observational study.
Setting: ED chest pain observation unit of an urban academic tertiary-care center in New York City.
Synopsis: Two hundred twenty patients between 22 and 39 years old admitted for ACS evaluation between March 2004 and September 2007 were eligible. Patients with known coronary artery disease, diagnostic ECG findings, or evidence of cocaine use were excluded. Provocative cardiac testing for the presence of myocardial ischemia followed serial cardiac biomarker testing to rule out myocardial infarction.
Six patients had positive stress tests. Four underwent subsequent coronary angiography, which demonstrated no evidence of obstructive coronary disease. One refused catheterization, and the other was lost to followup. Age younger than 40 years, nondiagnostic or normal ECG, and two sets of negative cardiac biomarker results at least six hours apart identified a patient group with a low rate of true-positive provocative testing.
This study is limited by its retrospective, single-centered nature; it was unable to include patients admitted to the hospital or those who left the chest-pain unit without provocative testing or against medical advice. The possibility of false-negative provocative testing results was not excluded. The methods of provocative testing were limited to those available prior to 2007.
Bottom line: Cardiac stress testing adds little to the diagnostic evaluation for patients younger than 40 years having nondiagnostic ECG and negative serial biomarker results. However, routine provocative testing is unlikely to decrease until better clinical risk-stratification tools exist for this very-low-prevalence population.
Citation: Hermann LK, Weingart SD, Duvall WL, Henzlova MJ. The limited utility of routine cardiac stress testing in emergency department chest pain patients younger than 40 years. Ann Emerg Med. 2009;54(1):12-16.
2) Family Witness Behavior Impacts Physician Performance during CPR
Clinical question: Does the presence or behavior of a family witness to cardiopulmonary resuscitation (CPR) alter the critical actions performed by physicians?
Background: Because few patients undergoing in-hospital CPR survive to hospital discharge, many hospitals allow at least one family member of the dying patient to be present during the resuscitation attempt. There is little evidence concerning the bereavement outcomes for the family witness or effect on the resuscitation environment and physician performance.
Study design: Randomized controlled study.
Setting: Human patient simulator-based medical resuscitation environment with standardized actors in an academic medical center.
Synopsis: Sixty second- and third-year emergency medicine residents were randomized in pairs and assigned to one of three groups: no family witness, a non-obstructive witness, or a witness displaying overt grief reactions. Trained actors played the roles of social worker and family member. All groups were joined by the social worker and participated in identical cardiac-arrest-code scenarios ending in asystole. The nurse in each group was scripted to make a potentially harmful medication error. Outcomes studied were physician-performance-based, such as length of the resuscitation attempt, time to critical events, and recognition of a potential drug administration error.
Delay in initiation of defibrillator shocks and decrease in the number of shocks delivered occurred in the overt grief reaction group. Failure to recognize the medication error occurred only once, and it was in the control group. No other significant differences were observed between groups.
Limitations to this study are its small size and possibility that physician behavior in simulated environments might not reflect that of real patient-care situations.
Bottom line: Overt grief reactions from family members witnessing CPR attempts might negatively impact important procedural events and decisions made by physicians, specifically the use of defibrillation, which could negatively affect outcomes of CPR.
Citation: Fernandez R, Compton S, Jones KA, Velilla MA. The presence of a family witness impacts physician performance during simulated medical codes. Crit Care Med. 2009;37(6): 1956-1960.
3) Diltiazem Is a Better Choice in Uncomplicated Atrial Fibrillation than Amiodarone or Digoxin
Clinical question: How does IV diltiazem compare to IV amiodarone or digoxin in achieving ventricular rate control in patients hospitalized for acute uncomplicated atrial fibrillation (AF)?
Background: Current guidelines for acute AF management are based on expert opinion and recommend calcium antagonists, beta-blockers, or digoxin for initial ventricular rate control in hemodynamically stable patients. Recommendations lead to wide clinical variations in the first 24 hours of presentation.
Study design: Randomized, open-label trial.
Setting: Single-center study in Hong Kong.
Synopsis: One hundred fifty patients presenting with acute symptomatic AF of <48 hours duration with a rapid ventricular rate were enrolled. The study endpoints were ventricular rate control within the first 24 hours defined as a sustained heart rate of <90 beats per minute for less than four hours. The time to ventricular rate control in patients assigned to the diltiazem group (three hours) was significantly shorter than that of the digoxin group (six hours) or the amiodarone group (seven hours). The percentage of patients who achieved ventricular rate control in the diltiazem group was 90%, compared with 74% in both the digoxin and amiodarone groups. Length of stay was shorter in diltiazem group (3.9 days) when compared with the digoxin group (4.7 days) and amiodarone group (4.7 days).
Major limitations of the study were the lack of beta-blockers as an option for rate control and the exclusion of patients with hemodynamic instability, heart failure, and myocardial infarction. As patients with underlying heart disease were excluded, these results cannot be applied to all patients presenting with acute AF.
Bottom line: Compared with digoxin and amidarone, intravenous diltiazem is safe and effective in achieving ventricular rate control to improve symptoms and to reduce length of hospital stay in acute uncomplicated AF.
Citation: Siu CW, Lau CP, Lee WL, Lam KF, Tse HF. Intravenous diltiazem is superior to intravenous amiodarone or digoxin for achieving ventricular rate control in patients with acute uncomplicated atrial fibrillation. Crit Care Med. 2009;37(7):2174-2179.
4) D-dimer Might Be a Reliable Assay to Determine Likelihood of Acute Aortic Dissection
Clinical question: Is the D-dimer assay beneficial in the evaluation of acute aortic dissection (AD)?
Background: Aortic dissection is a potentially lethal disorder that is included in the differential diagnosis of chest pain. No studies exist that specifically examine the use of the D-dimer assay to exclude or predict AD. D-dimer has been proven to be a useful tool to help rule out pulmonary embolism (PE) and DVT.
Study design: Prospective.
Setting: Fourteen centers in the U.S., Europe, and Japan.
Synopsis: Of 220 patients enrolled in the study, 87 had radiologically proven AD, and 133 had an initial suspicion of AD but a different final diagnosis. D-dimer assay was obtained on patients with a suspicion of AD within 24 hours of symptom onset. Additionally, appropriate imaging was performed on all patients to identify AD presence.
D-dimer was found to be a useful “rule out” test. At a cutoff level of 500 ng/mL, the negative likelihood ratio was 0.07 (<0.1 being suggestive of a good rule-out tool) and the negative predictive value was >90%. D-dimer was not shown to be as useful to predict the presence of AD in this study.
A major limitation of the study was a relatively small sample size, especially when subgroups were analyzed, therefore decreasing the overall accuracy of the study. Although this study shows promise for the D-dimer assay in the evaluation of suspected AD, it does not establish D-dimer as a reliable enough test to rule out AD without further imaging or evaluation.
Bottom line: Though this study illustrated a high negative predictive value for D-dimer in AD evaluation, physicians are cautioned against allowing a negative D-dimer to affect their management of a patient with a suspected acute aortic dissection.
Citation: Suzuki T, Distante A, Zizza A, et al. Diagnosis of acute aortic dissection by D-dimer: the International Registry of Acute Aortic Dissection Substudy on Biomarkers (IRAD-bio) experience. Circulation. 2009;119(20):2702-2707.
5) Acute Kidney Injury Predicts Outcomes of Non-Critically-Ill Patients
Clinical question: Does acute kidney injury affect in-hospital mortality, need for renal replacement therapy, and length of stay in patients who are not critically ill?
Background: Using the Acute Kidney Injury Network’s definition of acute kidney injury (AKI), including an abrupt increase in creatinine of 0.3 mg/dL, the authors previously showed an association with poor outcomes in critically ill patients. There is less evidence as to whether it predicts outcomes in non-critically-ill patients.
Study design: Retrospective cohort and a case-control study.
Setting: Bridgeport (Conn.) Hospital, a 350-bed community teaching hospital affiliated with Yale New Haven Health System.
Synopsis: Seven hundred thirty-five patients admitted to a medical unit who developed AKI, defined as a serum creatinine increase of 0.3 mg/dL or more within a 48-hour period, were compared to 5,089 controls. Patients who were admitted to critical care or who received RRT within the first 48 hours were excluded. AKI patients had higher in-hospital mortality of 14.8%, compared with 1.5% of controls, longer hospital stays of 7.9 versus 3.7 days, higher rates of transfer to the ICU of 28.6% versus 4.3%, and 73 versus zero patients who required renal replacement therapy. All findings were statistically significant (P<0.001). Some patients were omitted because of inadequate data collection.
Two hundred eighty-two patients were randomly selected from each group and matched based on age and demographic characteristics to perform a case-control study. AKI patients were eight times more likely to die in the hospital and five times more likely to have prolonged lengths of stay and transfer to the ICU.
This study does not differentiate between types of AKI and does not show a causal relationship.
Bottom line: AKI, defined as a serum creatinine increase of 0.3 mg/dL or more within a 48-hour period, predicts worse outcomes in non-critically-ill patients.
Citation: Barrantes F, Feng Y, Ivanov O, et al. Acute kidney injury predicts outcomes of non-critically ill patients. Mayo Clin Proc. 2009;84(5):410-416.
6) Statin Therapy after First Stroke Reduces Recurrence and Improves Survival
Clinical question: Does statin therapy after first ischemic stroke reduce recurrence and long-term mortality?
Background: Statin treatment has been shown to reduce primary stroke incidence, but there is less evidence on secondary prevention.
Study design: Retrospective observational study.
Setting: Acute stroke, general medicine, and neurology units at the hospitals affiliated with the University of Ioannina School of Medicine in Athens, Greece.
Synopsis: Seven hundred ninety-four primary ischemic stroke patients were admitted and followed for a 10-year period. Of those, 596 patients were discharged without a statin; 198 patients were discharged on statin therapy. One hundred twelve, or 14.1%, of the 794 patients had a recurrent event. The recurrence rate was 16.3% among those who did not receive a statin versus 7.6% among those who did receive a statin post-discharge (P=0.002).
Bottom line: Post-discharge statin therapy after an initial stroke appears to reduce the risk of recurrence.
Citation: Milionis HJ, Giannopoulos S, Kosmidou M, et al. Statin therapy after first stroke reduces 10-year stroke recurrence and improves survival. Neurology. 2009;72(21):1816-1822.
7) Low-Dose Corticosteroids Provide Modest Benefit to Patients with Vasopressor-Dependent Sepsis and Septic Shock
Clinical question: What are the risks and benefits of corticosteroid treatment in severe sepsis and septic shock?
Background: For more than 50 years, corticosteroids have been used as an adjuvant treatment for sepsis with conflicting benefits on mortality.
Study design: Meta-analysis. Literature Search of Cochrane Library, MEDLINE, EMBASE, and LILACS.
Synopsis: Seventeen randomized controlled trials and three quasi-randomized controlled trials of 3,384 patients were selected for statistical analysis. Overall, corticosteroids did not improve 28-day, all-cause mortality in severe sepsis and septic shock. There was a statistically significant reduction in 28-day mortality only for the subgroup of patients receiving prolonged low-dose steroid treatment (37.5% vs. 44% in the control group).
There was no increased risk of gastrointestinal hemorrhage, superinfection, or neuromuscular weakness seen in treated patients.
The trials differed in the types of corticosteroid used, the time to institution of therapy, bolus versus continuous administration, duration of therapy, and abrupt versus gradual interruption of treatment. All of these factors make the clinical application of the data challenging.
Bottom line: Many questions remain about the optimal dose, timing, and duration of corticosteroids in patients with vasopressor-dependent sepsis and septic shock, but there appears to be a modest mortality benefit with prolonged low-dose corticosteroid therapy.
Citation: Annane D, Bellissant E, Bollaert P, et al. Corticosteroids in the treatment of severe sepsis and septic shock in adults: a systematic review. JAMA. 2009;301(22): 2362-2375.
8) Testing for FVL Mutation but Not 20210A Predicts Recurrent VTE Risk
Clinical question: Are the rates of recurrent VTE higher in adults with VTE who possess either the factor V Leiden (FVL) or Prothrombin G20210A mutation, and what are the rates of VTE among family members?
Background: Clinicians commonly test for genetic mutations when treating patients who have a thrombotic event. However, the utility of such tests on predicting the risk for recurrent events and on outcomes needs review.
Study design: Meta-analysis.
Setting: Literature search of MEDLINE, EMBASE, the Cochrane Library, CINAHL, and PsycInfo.
Synopsis: Forty-six articles were selected for statistical analysis. The presence of either homozygous or heterozygous FVL mutation increased the risk of recurrent VTE compared with individuals without the FVL mutation (OR 2.65 and 1.56, respectively).
Compared with family members of adults without the FVL mutation, the presence of either homozygous or heterozygous FVL mutation predicts VTE in family members (OR 18 and 3.5, respectively).
The presence of G20210A is not predictive of recurrent VTE compared with individuals without this mutation. There is not sufficient evidence regarding the predictive value of the G20210A mutation on the risk of VTE in family members.
No studies directly address the effect of testing on outcomes other than recurrent VTE. In family members who were tested, there did not seem to be any impact on daily behavior, recognition of VTE risk factors, or perceived stress from testing.
Bottom line: FVL mutation increases the risk of recurrent VTE and predicts VTE in family members. The benefits of testing family members remain unclear.
Citation: Segal J, Brotman, D, Necochea, A, et al. Predictive value of factor V Leiden and prothrombin G20210A in adults with venous thromboembolism and in family members of those with a mutation: a systematic review. JAMA. 2009;301 (23):2472-2485. TH
PEDIATRIC HM LITERATURE
Lower Rates of Serious Bacterial Infection in Young Febrile Infants with Influenza
By Mark Shen, MD
Clinical question: What is the risk of serious bacterial infection (SBI) in febrile infants ≤60 days of age with influenza virus infections?
Background: Febrile infants with documented viral infections have a lower rate of SBI than febrile infants who do not have a positive test for a specific virus. The literature strongly supports this finding with respiratory syncytial virus (RSV), although the specific association with influenza is less clear, particularly as there is an increased risk of secondary bacterial infections in patients of all ages with influenza.
Study design: Secondary analysis of a prior prospective study.
Setting: Five pediatric EDs.
Synopsis: This was a secondary analysis of a prior prospective study (1998-2001) that examined the relationship between RSV infection and SBI in febrile infants ≤60 days of age. This analysis was restricted to centers in which bacterial cultures were obtained and the standard evaluation included testing for influenza. Of 844 infants tested for influenza, SBI status could be determined in 809 (95.9%), and 123 tested positive for influenza. Of those with influenza, only three (2.5%) were found to have an SBI, and all three had a urinary tract infection (UTI). By comparison, 13.3% of the influenza-negative patients had SBIs, 10.8% of which were UTIs.
The primary study limitation is the secondary nature of the analysis. The enrollment period was October through March of each year, and influenza virus peaked in December and January of each year studied. In addition, the authors were able to refer to prospectively collected data on SBI status. These data are consistent with other studies demonstrating a lower likelihood of SBI in documented viral infections.
Bottom line: Febrile infants with influenza virus infection are at lower risk of serious bacterial infection.
Citation: Krief WI, Levine DA, Platt SL, et al. Influenza virus infection and the risk of serious bacterial infections in young febrile infants. Pediatrics. 2009;124:30-39.
Survey Says...
For a moment, put yourself in a hospital administrator’s shoes—more specifically, those of a hospital administrator who is looking to hire a handful of new hospitalists. You know the job duties you need to fill. You know what qualifications a candidate should have. You even know the hours you need covered.
But there remains one gaping hole in the job description: compensation.
—Tex Landis, MD, FHM, SHM Practice Analysis Committee chairman
The question of how much to offer hospitalists who are in the market for a new job—and, conversely, how much they can demand—has bedeviled the specialty since its inception. And, as HM continues its exponential growth throughout the national healthcare landscape, the devil is in the details. How does an administrator or HM group leader take into account years of experience in compensation? Do nocturnists demand more or less? What about shift work?
That picture will get clearer in 2010, thanks to a new partnership between SHM and the Medical Group Management Association (MGMA). Together, the two groups are embarking on an ambitious new research project to provide hospital administrators and hospitalist practice leaders a comprehensive—and credible—set of data on hospitalist compensation and productivity. The data will be published in an annual report issued jointly by SHM and MGMA.
Previously, data available to hospitalists about the state of HM were researched and published by SHM every two years. The new partnership builds on the society’s original work by using questions similar to the SHM survey, but will add MGMA’s authority on such subjects and analytical firepower.
Big Changes
The SHM-MGMA partnership will provide two major improvements to HM and hospital administrators: the annual publication of results and MGMA’s stamp of approval to the research.
New data every year is a welcome change for David Friar, MD, president of Hospitalists of Northwest Michigan in Traverse City. “Things in hospital medicine continue to change very quickly. By the time new data is published, it’s already a few months old,” Dr. Friar says. “Doing the survey on the annual basis will be very useful to us.”
Credibility from an independent source, which MGMA has cultivated through nearly 80 years of organizational performance research, should go a long way when hospitalists are negotiating with hospital administrators. The original SHM-produced survey carried major weight within HM; this new collaborative survey will build on that success by expanding the survey’s credibility in hospitals across the country. Hospital administrators have been turning to MGMA data for other management metrics for years; now they will be able to use the same trusted source for decisions about their HM programs.
“When we negotiate with hospital administrators, we use the current data as a benchmark for comparison,” Dr. Friar says. “[Administrators] are much more familiar with MGMA. The marriage of the two should be very helpful.”
The combination also helps alleviate some confusion in the marketplace, which was the goal of both organizations, according to Crystal Taylor, MGMA’s assistant director for survey operations. “Our survey has been the gold standard for compensation but hasn’t had a high degree of detail around hospitalist-specific metrics,” Taylor says. “SHM’s research has always had more detail in this area because it was more specialized.”
Subtle Change
Although the research will be published in mid-2010, SHM members will notice changes long before then. In fact, many hospitalists already have taken advantage of the partnership, says Leslie Flores, MHA, the director of SHM’s Practice Management Institute.
“SHM and MGMA have already done a number of collaborative things,” she says. “We’ve presented a webinar together, and SHM is now offering MGMA books on its online store.”
In the near future, SHM and MGMA members can expect to hear from both organizations. MGMA has invited SHM to present at MGMA’s national conference, and MGMA will be presenting at HM09 in Washington, D.C., in April. For other SHM members, their first contact with MGMA will be through the survey, which will begin in January, according to Flores. SHM will issue e-mail invitations to group leaders to participate in the survey. The link in the e-mail will take members to MGMA’s data-gathering Web site. SHM and MGMA will present webinars and other educational tools to help practice administrators and others understand the new survey instrument.
Enthusiastic Partner
Like any other promising relationship, both parties are animated about the potential the partnership has for the future. MGMA hopes working with SHM brings them into a new and growing marketplace.
“The hospitalist market is new to us, which is another benefit of the relationship,” says Steve Hellebush, an MGMA vice president who is responsible for the association’s work with SHM. “By being able to interact with experts at SHM who really understand that segment of the healthcare industry, we’re learning more about it. As we learn more, we’ll find more opportunities.”
Both groups agree the joint project will better define the marketplace for hospitalist jobs and compensation. Those familiar with the challenges of administrating a hospitalist practice know that those changes will have a deep impact on healthcare.
“This is about giving our members the best, most valuable information available,” says Tex Landis, MD, FHM, chairman of SHM’s Practice Analysis Committee. “By enabling hospital medicine groups to make better decisions, this partnership will ultimately translate into better care for patients.”TH
Brandon Shank is a freelance writer based in Philadelphia.
Chapter Updates
Arizona

The Arizona chapter had a well-attended meeting Aug. 13 at Ruth’s Chris Steak House in Phoenix. Hospitalists, medical students, and several chief medical officers from local hospitals listened as chapter president Tochukwu S. Nwafor, MD, of Maricopa Medical Center in Phoenix, gave a lecture on VTE prophylaxis in the hospitalized patient. He discussed the pivotal role hospitalists provide in treating this medical condition and the leadership they can provide because of their accessibility and knowledge. The France Foundation sponsored the discussion.
After the lecture, VTE prevention strategies were discussed. The chapter agreed to continue such work on VTE in the future.
Chapter business was discussed after the lecture. Plans for the coming year include another weekend continuing medical education (CME) activity on pertinent hospitalist topics. The chapter also plans to continue its outreach to such outlying areas as Tucson and Flagstaff.
Northern Nevada
The Northern Nevada chapter met Aug. 18 at the Washow Grill in Reno. The 38 attendees represented four HM groups. Chapter president Phil Goodman provided an overview of SHM and its resources, meetings, fellowship, and membership costs. The chapter elected officers based on nominations submitted via e-mail and nominations at the chapter meeting. A written ballot was conducted, and the officers elected for 2009-2010 are:
- President: Sukumar Gargya, MD, Renown Hospitalists;
- VP Logistics/Secretary (president-elect): Levente Levai, MD, president, Sierra Hospitalists;
- VP Membership: Lynda Malloy, director, NNMC EmCare;
- VP Education: Nagesh Gullapalli, UNSOM Hospitalists; and
- VP Projects: Jose Aguirre, president, Lake Tahoe Regional Hospitalists.
The next meeting is Nov. 3. The agenda includes a talk on “Difficult Decisions in Afib Management.” The chapter also plans to resume a journal club that aims to publish two to three times per year, starting in late November or early December.
Primary Piedmont Triad Chapter
The Primary Piedmont Triad SHM chapter had its first meeting June 23 at Wake Forest University Baptist Medical Center in Winston-Salem, N.C. The meeting was hosted by the Wake Forest Inpatient Physicians group of Wake Forest University Health Sciences and sponsored by Schering-Plough. The chapter had dissolved a few years ago, so this meeting was a “meet and greet.”
Ten hospitalists attended the meeting, which included the selection of new officers. There was no special presentation. The evening was spent socializing, reviewing survey results and deciding on a new vision for the chapter. The group was extremely enthusiastic and excited about the future of HM, even in the current economic climate and uncertainty surrounding healthcare reform. The chapter is planning to have quarterly meetings.
Southern Illinois

The Southern Illinois chapter met July 23 at the Hilton Garden Inn in O’Fallon. The meeting was attended by 16 hospitalists from four HM groups. Theresa Murphy, a PharmD in neuro ICU at Barnes Jewish Hospital, presented on “Euvolemic and Hypervolemic Hyponatremia and AVP Antagonishm with Vapris.” The event was a success; attendees were pleased with the topics that were discussed.
Chicago
SHM’s Chicago chapter hosted a dinner July 29 at the Reel Club in Oakbrook, Ill. The speaker was Gary Shaer, MD, professor of medicine at Rush University. The topic for Dr. Shaer’s presentation was “Managing Patients with ACS in the Acute Setting: An Interventional Cardiologist’s Perspective.” The talk generated an excellent discussion. Various HM topics were debated, including healthcare reform and the hospitalist.
The chapter also welcomed new members and newly designated Fellows in Hospital Medicine. Attendees included hospitalists from Advocate Medical Group, Loyola Medical Center, Resurrection Hospitals, Northwestern Medical Center, and Signature Group.
The next chapter meeting will be in November; the date and location are to be announced. For more information about the Chicago chapter, contact Aziz Ansari, DO, FHM, at [email protected], or Ana Nowell, MD, FHM, at [email protected].
Fellow in Hospital Medicine Spotlight
Eugene Chu, MD, FHM

Dr. Chu is the chief of the division of hospital medicine at the Denver Health and Hospital Authority, and is an associate professor of medicine at the University of Colorado School of Medicine.
Undergraduate Education: Stanford University, Palo Alto, Calif.
Medical School: Tufts University School of Medicine, Boston
Notable: Outstanding instructor, University of Colorado School of Medicine, 2001; co-author of Hospital Medicine Secrets (Elsevier, 2006); ACF Surge Capacity Hospital Discharge expert panel member.
SHM: Dr. Chu is an active member of SHM, serving as president of the Rocky Mountain chapter.
FYI: Outside the hospital, Dr. Chu enjoys spending time with his 3-year-old daughter, traveling, cycling, and training for triathlons.
For more information about the FHM designation, visit www.hospitalmedicine.org/fellows.
For a moment, put yourself in a hospital administrator’s shoes—more specifically, those of a hospital administrator who is looking to hire a handful of new hospitalists. You know the job duties you need to fill. You know what qualifications a candidate should have. You even know the hours you need covered.
But there remains one gaping hole in the job description: compensation.
—Tex Landis, MD, FHM, SHM Practice Analysis Committee chairman
The question of how much to offer hospitalists who are in the market for a new job—and, conversely, how much they can demand—has bedeviled the specialty since its inception. And, as HM continues its exponential growth throughout the national healthcare landscape, the devil is in the details. How does an administrator or HM group leader take into account years of experience in compensation? Do nocturnists demand more or less? What about shift work?
That picture will get clearer in 2010, thanks to a new partnership between SHM and the Medical Group Management Association (MGMA). Together, the two groups are embarking on an ambitious new research project to provide hospital administrators and hospitalist practice leaders a comprehensive—and credible—set of data on hospitalist compensation and productivity. The data will be published in an annual report issued jointly by SHM and MGMA.
Previously, data available to hospitalists about the state of HM were researched and published by SHM every two years. The new partnership builds on the society’s original work by using questions similar to the SHM survey, but will add MGMA’s authority on such subjects and analytical firepower.
Big Changes
The SHM-MGMA partnership will provide two major improvements to HM and hospital administrators: the annual publication of results and MGMA’s stamp of approval to the research.
New data every year is a welcome change for David Friar, MD, president of Hospitalists of Northwest Michigan in Traverse City. “Things in hospital medicine continue to change very quickly. By the time new data is published, it’s already a few months old,” Dr. Friar says. “Doing the survey on the annual basis will be very useful to us.”
Credibility from an independent source, which MGMA has cultivated through nearly 80 years of organizational performance research, should go a long way when hospitalists are negotiating with hospital administrators. The original SHM-produced survey carried major weight within HM; this new collaborative survey will build on that success by expanding the survey’s credibility in hospitals across the country. Hospital administrators have been turning to MGMA data for other management metrics for years; now they will be able to use the same trusted source for decisions about their HM programs.
“When we negotiate with hospital administrators, we use the current data as a benchmark for comparison,” Dr. Friar says. “[Administrators] are much more familiar with MGMA. The marriage of the two should be very helpful.”
The combination also helps alleviate some confusion in the marketplace, which was the goal of both organizations, according to Crystal Taylor, MGMA’s assistant director for survey operations. “Our survey has been the gold standard for compensation but hasn’t had a high degree of detail around hospitalist-specific metrics,” Taylor says. “SHM’s research has always had more detail in this area because it was more specialized.”
Subtle Change
Although the research will be published in mid-2010, SHM members will notice changes long before then. In fact, many hospitalists already have taken advantage of the partnership, says Leslie Flores, MHA, the director of SHM’s Practice Management Institute.
“SHM and MGMA have already done a number of collaborative things,” she says. “We’ve presented a webinar together, and SHM is now offering MGMA books on its online store.”
In the near future, SHM and MGMA members can expect to hear from both organizations. MGMA has invited SHM to present at MGMA’s national conference, and MGMA will be presenting at HM09 in Washington, D.C., in April. For other SHM members, their first contact with MGMA will be through the survey, which will begin in January, according to Flores. SHM will issue e-mail invitations to group leaders to participate in the survey. The link in the e-mail will take members to MGMA’s data-gathering Web site. SHM and MGMA will present webinars and other educational tools to help practice administrators and others understand the new survey instrument.
Enthusiastic Partner
Like any other promising relationship, both parties are animated about the potential the partnership has for the future. MGMA hopes working with SHM brings them into a new and growing marketplace.
“The hospitalist market is new to us, which is another benefit of the relationship,” says Steve Hellebush, an MGMA vice president who is responsible for the association’s work with SHM. “By being able to interact with experts at SHM who really understand that segment of the healthcare industry, we’re learning more about it. As we learn more, we’ll find more opportunities.”
Both groups agree the joint project will better define the marketplace for hospitalist jobs and compensation. Those familiar with the challenges of administrating a hospitalist practice know that those changes will have a deep impact on healthcare.
“This is about giving our members the best, most valuable information available,” says Tex Landis, MD, FHM, chairman of SHM’s Practice Analysis Committee. “By enabling hospital medicine groups to make better decisions, this partnership will ultimately translate into better care for patients.”TH
Brandon Shank is a freelance writer based in Philadelphia.
Chapter Updates
Arizona
The Arizona chapter had a well-attended meeting Aug. 13 at Ruth’s Chris Steak House in Phoenix. Hospitalists, medical students, and several chief medical officers from local hospitals listened as chapter president Tochukwu S. Nwafor, MD, of Maricopa Medical Center in Phoenix, gave a lecture on VTE prophylaxis in the hospitalized patient. He discussed the pivotal role hospitalists provide in treating this medical condition and the leadership they can provide because of their accessibility and knowledge. The France Foundation sponsored the discussion.
After the lecture, VTE prevention strategies were discussed. The chapter agreed to continue such work on VTE in the future.
Chapter business was discussed after the lecture. Plans for the coming year include another weekend continuing medical education (CME) activity on pertinent hospitalist topics. The chapter also plans to continue its outreach to such outlying areas as Tucson and Flagstaff.
Northern Nevada
The Northern Nevada chapter met Aug. 18 at the Washow Grill in Reno. The 38 attendees represented four HM groups. Chapter president Phil Goodman provided an overview of SHM and its resources, meetings, fellowship, and membership costs. The chapter elected officers based on nominations submitted via e-mail and nominations at the chapter meeting. A written ballot was conducted, and the officers elected for 2009-2010 are:
- President: Sukumar Gargya, MD, Renown Hospitalists;
- VP Logistics/Secretary (president-elect): Levente Levai, MD, president, Sierra Hospitalists;
- VP Membership: Lynda Malloy, director, NNMC EmCare;
- VP Education: Nagesh Gullapalli, UNSOM Hospitalists; and
- VP Projects: Jose Aguirre, president, Lake Tahoe Regional Hospitalists.
The next meeting is Nov. 3. The agenda includes a talk on “Difficult Decisions in Afib Management.” The chapter also plans to resume a journal club that aims to publish two to three times per year, starting in late November or early December.
Primary Piedmont Triad Chapter
The Primary Piedmont Triad SHM chapter had its first meeting June 23 at Wake Forest University Baptist Medical Center in Winston-Salem, N.C. The meeting was hosted by the Wake Forest Inpatient Physicians group of Wake Forest University Health Sciences and sponsored by Schering-Plough. The chapter had dissolved a few years ago, so this meeting was a “meet and greet.”
Ten hospitalists attended the meeting, which included the selection of new officers. There was no special presentation. The evening was spent socializing, reviewing survey results and deciding on a new vision for the chapter. The group was extremely enthusiastic and excited about the future of HM, even in the current economic climate and uncertainty surrounding healthcare reform. The chapter is planning to have quarterly meetings.
Southern Illinois
The Southern Illinois chapter met July 23 at the Hilton Garden Inn in O’Fallon. The meeting was attended by 16 hospitalists from four HM groups. Theresa Murphy, a PharmD in neuro ICU at Barnes Jewish Hospital, presented on “Euvolemic and Hypervolemic Hyponatremia and AVP Antagonishm with Vapris.” The event was a success; attendees were pleased with the topics that were discussed.
Chicago
SHM’s Chicago chapter hosted a dinner July 29 at the Reel Club in Oakbrook, Ill. The speaker was Gary Shaer, MD, professor of medicine at Rush University. The topic for Dr. Shaer’s presentation was “Managing Patients with ACS in the Acute Setting: An Interventional Cardiologist’s Perspective.” The talk generated an excellent discussion. Various HM topics were debated, including healthcare reform and the hospitalist.
The chapter also welcomed new members and newly designated Fellows in Hospital Medicine. Attendees included hospitalists from Advocate Medical Group, Loyola Medical Center, Resurrection Hospitals, Northwestern Medical Center, and Signature Group.
The next chapter meeting will be in November; the date and location are to be announced. For more information about the Chicago chapter, contact Aziz Ansari, DO, FHM, at [email protected], or Ana Nowell, MD, FHM, at [email protected].
Fellow in Hospital Medicine Spotlight
Eugene Chu, MD, FHM
Dr. Chu is the chief of the division of hospital medicine at the Denver Health and Hospital Authority, and is an associate professor of medicine at the University of Colorado School of Medicine.
Undergraduate Education: Stanford University, Palo Alto, Calif.
Medical School: Tufts University School of Medicine, Boston
Notable: Outstanding instructor, University of Colorado School of Medicine, 2001; co-author of Hospital Medicine Secrets (Elsevier, 2006); ACF Surge Capacity Hospital Discharge expert panel member.
SHM: Dr. Chu is an active member of SHM, serving as president of the Rocky Mountain chapter.
FYI: Outside the hospital, Dr. Chu enjoys spending time with his 3-year-old daughter, traveling, cycling, and training for triathlons.
For more information about the FHM designation, visit www.hospitalmedicine.org/fellows.
Unclear Expectations
As flu season descends on North America, hospitalists from Boston to the San Francisco Bay are concerned about what might happen when normal seasonal influenza hospital admissions are added to new cases of the novel influenza A (H1N1) virus.
Perhaps the most basic, still-unanswered question is how the addition of novel H1N1 virus affects the severity of the upcoming flu season. From April 15 to July 24 of this year, states reported 43,771 confirmed and probable cases of novel H1N1 infection. Of the cases reported, 5,011 people were hospitalized and 302 died. After July 24, the CDC stopped counting novel H1N1 as separate flu cases.
“We are expecting increased illness during the regular flu season, because we think both the novel H1N1 and seasonal flu strains will cause illness in the population,” says Artealia Gilliard, a spokesperson for the U.S. Centers for Disease Control and Prevention (CDC) in Atlanta. “The biggest problem we are having is that there is no set number we can give for planning purposes. We can’t say go out and prepare for X percent more illness, because there is no scientifically sound way to arrive at a number.”
Another concern is that little guidance is available on how severe the novel virus will be. Gilliard notes that the World Health Organization (WHO) gave novel H1N1 the pandemic designation because of its ease of transmission, not the severity of the disease. Although the CDC expects more illness, it is not yet clear how many people will be made sick enough to be cared for by a hospitalist.
“The epidemiology of this illness and prevention issues related to this newly emerging virus are still being studied, making it very difficult to anticipate the staffing needs for the upcoming flu season,” says Irina Schiopescu, MD, a hospitalist and infectious-disease specialist at Roane Medical Center in Harriman, Tenn. “Hospitalists will be among the many front-line healthcare workers who provide direct, bedside clinical care to patients with suspected or confirmed H1N1 influenza.”
Most of the nation’s hospitals spent the summer preparing for another pandemic. Hospitalists have assessed their needs, too, and HM programs are focusing on a diverse set of concerns: prevention education for hospital-based employees, patient management updates, and expected personnel shortages.
“We have been planning for the worst but hoping for the best,” says Julia Wright, MD, FHM, head of the section of hospital medicine at the University of Wisconsin Hospitals in Madison and a member of Team Hospitalist. “Our task group for the upcoming flu season includes all critical-care services, nursing, supply-chain management, and human resources, as well as other appropriate specialties, such as infection control.”
Another Wild Card
How well the vaccination campaign works will have an impact on the incidence of novel H1N1 influenza. Some have expressed concerns about compliance issues in the community, as individuals will need an extra flu shot in addition to the yearly vaccination for seasonal flu strains. The concerns could double if current ongoing clinical trials suggest that two vaccine administrations are required for full protection from the H1N1 virus.
There also is concern about the availability of vaccines, especially in the early stages. As of early September, Robin Robinson, PhD, director of the Biological Advanced Research and Development Authority (BARDA) at the U.S. Department of Health and Human Services (HHS), announced that manufacturing problems would mean only 45 million doses would be available by Oct. 15, compared with the 120 million doses originally projected. However, HHS says the 195 million doses the U.S. government ordered should be available by the December deadline for final delivery.1
Nevertheless, physicians should expect large-scale vaccination initiatives at their hospitals this fall. Additionally, hospitals are expected to require that healthcare workers, including hospitalists, receive their shots during the first wave of inoculations. “At our facility, we have the potential to give 100,000 or more vaccinations over a very short period of time,” says Patty Skoglund, RN, administrative director for disaster preparedness at Scripps Health in San Diego. “This is in addition to supporting vaccination efforts in the community.”
Southern Hemisphere
The Southern Hemisphere is wrapping up its flu season, and often, experiences south of the equator are a harbinger of what might come in the Northern Hemisphere. So far, the WHO says the Southern Hemisphere’s flu season has been characterized by normal respiratory disease numbers. The impact and severity is still being
evaluated, but it appeared only slightly worse than normal in most places. Hospitals did see increased admissions (see Figure 1, p. 5) requiring respiratory critical care.2 Yet the lack of firm guidance has made planning difficult for HM groups and the U.S. hospitals they work in.
It will be important for hospitalists to stay up to date with a potentially developing situation, especially in the early stages of the flu season. Many current CDC guidelines for treatment, prevention, and control are in interim stages, with more guidance to come as the science firms up. (see “Vaccination Priorities,” right)
“As we get closer to the flu season, we should be able to make specific suggestions and get a better idea of the probable incidence,” says Gilliard. “Novel H1N1 has caused significant illness outside of the regular season. When the temperature changes, will the incidence increase or decrease? We have to get more experience before we will know.”
Information Hotline
Hospitals are working to ensure that there are open lines of communication with key personnel, an important first step in infectious-disease control. It will be necessary to facilitate the timely dispersal of new information on guidelines and treatment considerations to multiple audiences throughout the hospital as they are released. In addition, flu incidence and severity updates will be vital.
“It is imperative that physicians know what is going on in their community and beyond,” says Dr. Schiopescu. “The CDC and the Infectious Disease Society of America (IDSA) are resources for treatment guidelines and information on the spread and severity of both the novel H1N1 and seasonal virus strains. Closer to home, both state and local health boards can help with a more focused view of what is happening in the community.”
Patient placement will be another concern for hospitalists in the event of a widespread outbreak. The current CDC patient care guidelines say that all patients with confirmed or suspected H1N1 infection must be isolated. Although they can be scattered in rooms throughout the hospital, it is strongly suggested that they be placed together as a cohort, if possible.
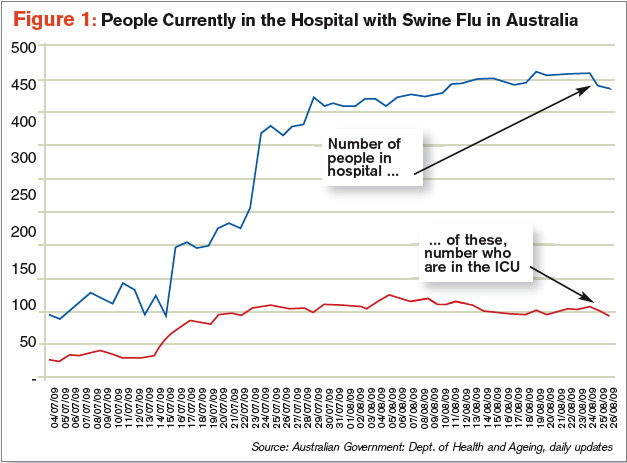
“Our hospital is looking into designating special areas of the hospital to accept influenza patients,” Dr. Wright says. “We can then give the staff special training on treatment and prevention, give better access to materials and supplies in a single location, and also minimize the time lost to physicians going from one patient to another.”
Staffing Concerns
One of the biggest concerns to HM groups is keeping their own areas of the hospital properly staffed. In addition to the possibility of higher acuity and admissions affecting coverage needs, most experts are suggesting employee absentee rates upward of 40%. To further complicate the picture, interim CDC guidelines say healthcare workers should be off work 24 hours after a fever subsides or seven days, whichever is longer. This guidance, however, could change as the CDC obtains and reviews more information.
“We are a small group of only four physicians,” says Dr. Schiopescu, whose HM group works a six-day on, six-day off schedule for about 85 encounters per week at her 50-bed hospital. “We may need to work additional shifts and be available to be called in early, should the need arise. We have also done some cross-training so that community physicians can help if needed. At worst, we can pull resources from our sister hospitals in the system.”
—Irina Schiopescu, MD, infectious-disease specialist, Roane Medical Center, Harriman, Tenn.
Some hospitals have been able to flex up and increase staffing levels before the season begins. “In addition to adding three full-time equivalent staff, we have actively looked for other specialties, such as internal medicine or family practice, that have the proper skill sets should the need arise,” says Dr. Wright, whose program covers 75% of the 471 medical beds at UW Hospital. “We have also developed a set of protocols to streamline treatment of these patients, no matter who may be taking care of them.”
Scripps is surveying its employees to identify family and other outside obligations that could lead to call-outs and staffing shortages. Hospital administrators expect that the information will identify physicians who might not be able to come to work. The hospital also implemented systems that will allow them to bring in extra people—and get them deployed quickly—from such state and federal support resources as the Public Health Service and the National Disaster Medical System staffs.
“Balancing the needs of the various areas will be tricky at times,” Dr. Wright says. “We have to move people around while making sure we are not leaving one area dangerously understaffed.”
Education Imperative
Educating health workers is of the utmost importance before and during the flu season. A wide range of staff training will be required: reinforcing cough etiquette and hand-washing requirements through completely new procedures. This will be important for patient treatment and patient safety, two areas that intersect in hospitalists every day. In addition, this flu season will require a heightened level of personal responsibility from health workers. “Teaching needs are adding to the burden,” says Skoglund, the administrative director at Scripps. “Unfortunately, it is not as simple as sending out a memo to the staff and affiliated physicians.”
Training is a moving target, at least initially. Clinical employees will need to be trained on treatment and prevention guidelines as they are released, with special emphasis on keeping up with changes as the season progresses and lessons are learned.
“In the past, the CDC suggested using a N-95 respirator for all patients with novel H1N1,” Dr. Schiopescu says. “Currently, that has changed to approved use of a regular surgical mask, unless performing intubation or bronchoscopy.”
Despite the best efforts of the CDC, WHO, and other health organizations, there is no real clear idea of what to expect during the next flu season.
“What is known is that the hospitalist will be on the front lines, involved in the treatment of the sickest patients,” Dr. Wright says. TH
Kurt Ullman is a freelance writer based in Indiana.
Image Source: MAMMAMAART/ISTOCKPHOTO.COM
References
- Officials lower expectations for size of first novel flu vaccine deliveries. Center for Infectious Disease Research & Policy Web site. Available at: www.cidrap.umn.edu/cidrap/content/influenza/swineflu/news/aug1409vaccine.html. Accessed Aug. 20, 2009.
- Pandemic (H1N1) 2009: update 61. WHO Web site. Available at: www.who.int/csr/don/2009_08_12/en/index.html. Accessed Aug. 24, 2009.
As flu season descends on North America, hospitalists from Boston to the San Francisco Bay are concerned about what might happen when normal seasonal influenza hospital admissions are added to new cases of the novel influenza A (H1N1) virus.
Perhaps the most basic, still-unanswered question is how the addition of novel H1N1 virus affects the severity of the upcoming flu season. From April 15 to July 24 of this year, states reported 43,771 confirmed and probable cases of novel H1N1 infection. Of the cases reported, 5,011 people were hospitalized and 302 died. After July 24, the CDC stopped counting novel H1N1 as separate flu cases.
“We are expecting increased illness during the regular flu season, because we think both the novel H1N1 and seasonal flu strains will cause illness in the population,” says Artealia Gilliard, a spokesperson for the U.S. Centers for Disease Control and Prevention (CDC) in Atlanta. “The biggest problem we are having is that there is no set number we can give for planning purposes. We can’t say go out and prepare for X percent more illness, because there is no scientifically sound way to arrive at a number.”
Another concern is that little guidance is available on how severe the novel virus will be. Gilliard notes that the World Health Organization (WHO) gave novel H1N1 the pandemic designation because of its ease of transmission, not the severity of the disease. Although the CDC expects more illness, it is not yet clear how many people will be made sick enough to be cared for by a hospitalist.
“The epidemiology of this illness and prevention issues related to this newly emerging virus are still being studied, making it very difficult to anticipate the staffing needs for the upcoming flu season,” says Irina Schiopescu, MD, a hospitalist and infectious-disease specialist at Roane Medical Center in Harriman, Tenn. “Hospitalists will be among the many front-line healthcare workers who provide direct, bedside clinical care to patients with suspected or confirmed H1N1 influenza.”
Most of the nation’s hospitals spent the summer preparing for another pandemic. Hospitalists have assessed their needs, too, and HM programs are focusing on a diverse set of concerns: prevention education for hospital-based employees, patient management updates, and expected personnel shortages.
“We have been planning for the worst but hoping for the best,” says Julia Wright, MD, FHM, head of the section of hospital medicine at the University of Wisconsin Hospitals in Madison and a member of Team Hospitalist. “Our task group for the upcoming flu season includes all critical-care services, nursing, supply-chain management, and human resources, as well as other appropriate specialties, such as infection control.”
Another Wild Card
How well the vaccination campaign works will have an impact on the incidence of novel H1N1 influenza. Some have expressed concerns about compliance issues in the community, as individuals will need an extra flu shot in addition to the yearly vaccination for seasonal flu strains. The concerns could double if current ongoing clinical trials suggest that two vaccine administrations are required for full protection from the H1N1 virus.
There also is concern about the availability of vaccines, especially in the early stages. As of early September, Robin Robinson, PhD, director of the Biological Advanced Research and Development Authority (BARDA) at the U.S. Department of Health and Human Services (HHS), announced that manufacturing problems would mean only 45 million doses would be available by Oct. 15, compared with the 120 million doses originally projected. However, HHS says the 195 million doses the U.S. government ordered should be available by the December deadline for final delivery.1
Nevertheless, physicians should expect large-scale vaccination initiatives at their hospitals this fall. Additionally, hospitals are expected to require that healthcare workers, including hospitalists, receive their shots during the first wave of inoculations. “At our facility, we have the potential to give 100,000 or more vaccinations over a very short period of time,” says Patty Skoglund, RN, administrative director for disaster preparedness at Scripps Health in San Diego. “This is in addition to supporting vaccination efforts in the community.”
Southern Hemisphere
The Southern Hemisphere is wrapping up its flu season, and often, experiences south of the equator are a harbinger of what might come in the Northern Hemisphere. So far, the WHO says the Southern Hemisphere’s flu season has been characterized by normal respiratory disease numbers. The impact and severity is still being
evaluated, but it appeared only slightly worse than normal in most places. Hospitals did see increased admissions (see Figure 1, p. 5) requiring respiratory critical care.2 Yet the lack of firm guidance has made planning difficult for HM groups and the U.S. hospitals they work in.
It will be important for hospitalists to stay up to date with a potentially developing situation, especially in the early stages of the flu season. Many current CDC guidelines for treatment, prevention, and control are in interim stages, with more guidance to come as the science firms up. (see “Vaccination Priorities,” right)
“As we get closer to the flu season, we should be able to make specific suggestions and get a better idea of the probable incidence,” says Gilliard. “Novel H1N1 has caused significant illness outside of the regular season. When the temperature changes, will the incidence increase or decrease? We have to get more experience before we will know.”
Information Hotline
Hospitals are working to ensure that there are open lines of communication with key personnel, an important first step in infectious-disease control. It will be necessary to facilitate the timely dispersal of new information on guidelines and treatment considerations to multiple audiences throughout the hospital as they are released. In addition, flu incidence and severity updates will be vital.
“It is imperative that physicians know what is going on in their community and beyond,” says Dr. Schiopescu. “The CDC and the Infectious Disease Society of America (IDSA) are resources for treatment guidelines and information on the spread and severity of both the novel H1N1 and seasonal virus strains. Closer to home, both state and local health boards can help with a more focused view of what is happening in the community.”
Patient placement will be another concern for hospitalists in the event of a widespread outbreak. The current CDC patient care guidelines say that all patients with confirmed or suspected H1N1 infection must be isolated. Although they can be scattered in rooms throughout the hospital, it is strongly suggested that they be placed together as a cohort, if possible.
“Our hospital is looking into designating special areas of the hospital to accept influenza patients,” Dr. Wright says. “We can then give the staff special training on treatment and prevention, give better access to materials and supplies in a single location, and also minimize the time lost to physicians going from one patient to another.”
Staffing Concerns
One of the biggest concerns to HM groups is keeping their own areas of the hospital properly staffed. In addition to the possibility of higher acuity and admissions affecting coverage needs, most experts are suggesting employee absentee rates upward of 40%. To further complicate the picture, interim CDC guidelines say healthcare workers should be off work 24 hours after a fever subsides or seven days, whichever is longer. This guidance, however, could change as the CDC obtains and reviews more information.
“We are a small group of only four physicians,” says Dr. Schiopescu, whose HM group works a six-day on, six-day off schedule for about 85 encounters per week at her 50-bed hospital. “We may need to work additional shifts and be available to be called in early, should the need arise. We have also done some cross-training so that community physicians can help if needed. At worst, we can pull resources from our sister hospitals in the system.”
—Irina Schiopescu, MD, infectious-disease specialist, Roane Medical Center, Harriman, Tenn.
Some hospitals have been able to flex up and increase staffing levels before the season begins. “In addition to adding three full-time equivalent staff, we have actively looked for other specialties, such as internal medicine or family practice, that have the proper skill sets should the need arise,” says Dr. Wright, whose program covers 75% of the 471 medical beds at UW Hospital. “We have also developed a set of protocols to streamline treatment of these patients, no matter who may be taking care of them.”
Scripps is surveying its employees to identify family and other outside obligations that could lead to call-outs and staffing shortages. Hospital administrators expect that the information will identify physicians who might not be able to come to work. The hospital also implemented systems that will allow them to bring in extra people—and get them deployed quickly—from such state and federal support resources as the Public Health Service and the National Disaster Medical System staffs.
“Balancing the needs of the various areas will be tricky at times,” Dr. Wright says. “We have to move people around while making sure we are not leaving one area dangerously understaffed.”
Education Imperative
Educating health workers is of the utmost importance before and during the flu season. A wide range of staff training will be required: reinforcing cough etiquette and hand-washing requirements through completely new procedures. This will be important for patient treatment and patient safety, two areas that intersect in hospitalists every day. In addition, this flu season will require a heightened level of personal responsibility from health workers. “Teaching needs are adding to the burden,” says Skoglund, the administrative director at Scripps. “Unfortunately, it is not as simple as sending out a memo to the staff and affiliated physicians.”
Training is a moving target, at least initially. Clinical employees will need to be trained on treatment and prevention guidelines as they are released, with special emphasis on keeping up with changes as the season progresses and lessons are learned.
“In the past, the CDC suggested using a N-95 respirator for all patients with novel H1N1,” Dr. Schiopescu says. “Currently, that has changed to approved use of a regular surgical mask, unless performing intubation or bronchoscopy.”
Despite the best efforts of the CDC, WHO, and other health organizations, there is no real clear idea of what to expect during the next flu season.
“What is known is that the hospitalist will be on the front lines, involved in the treatment of the sickest patients,” Dr. Wright says. TH
Kurt Ullman is a freelance writer based in Indiana.
Image Source: MAMMAMAART/ISTOCKPHOTO.COM
References
- Officials lower expectations for size of first novel flu vaccine deliveries. Center for Infectious Disease Research & Policy Web site. Available at: www.cidrap.umn.edu/cidrap/content/influenza/swineflu/news/aug1409vaccine.html. Accessed Aug. 20, 2009.
- Pandemic (H1N1) 2009: update 61. WHO Web site. Available at: www.who.int/csr/don/2009_08_12/en/index.html. Accessed Aug. 24, 2009.
Green Giant
The Hippocratic Oath has served as the foundation of ethical medical practice since the fourth century B.C. Today, one of the oath’s core principles—the promise to do no harm—is guiding more than just bedside care. It is the cornerstone of the green movement in healthcare, a rapidly growing effort to help the profession evolve from one that simply cares for the sick to one that serves as a broader force for healing in society.
Some experts note the medical industry has been slow to understand the effects of its practices on public health. Barely a decade ago, U.S. Environmental Protection Agency (EPA) reports revealed staggering statistics: Medical waste incinerators were the leading producer of airborne carcinogenic dioxins, asthma rates for healthcare workers were among the highest of any profession, and healthcare waste was responsible for 10% of mercury air emissions.1
The incredible irony produced “a teachable moment,” says Gary Cohen, co-executive director of Health Care Without Harm in Arlington, Va., an international coalition established in 1996 to help make the industry more ecologically sustainable. Since then, hospitals have eliminated mercury from many of their supplies, including blood-pressure cuffs and thermometers. Additionally, the efforts to transform buying practices and lessen reliance on fossil fuels have gained considerable traction. And the number of medical waste incinerators in the U.S. has dropped from 5,000 to less than 100.
—ALICE ST. CLAIR / METRO HEALTH
“The healthcare sector began to understand the links between the environment and disease. They realized they were both addressing the collateral damage of a poisoned environment, and they were contributing to it,” Cohen says.
Now, even those who are critical of the profession’s past practices are lauding industry leaders’ efforts to build more efficient facilities, reduce waste, and modify day-to-day practices to lessen their environmental footprint.
“Hospitals have been so focused, rightly so, on patient safety,” Cohen says. “Now we’re at the point where we’re talking about patient safety, worker safety, and environmental safety. It’s changing the architecture of how things are done, and it is becoming much more accepted as a mainstream concern.”
Concern should stretch beyond the C-suite to those on the front lines, says Don Williams, MD, a pediatric hospitalist at Dell Children’s Medical Center in Austin, Texas, and a board member of Austin Physicians for Social Responsibility. “Although it is rare for us to see the direct effects of green choices on the health of individual patients, I think it is important to recognize that less air pollution and less global warming leads to less illness,” says Dr. Williams, who works in the only platinum-rated Leadership in Environmental Energy and Design certified hospital in the U.S. The certification, through the U.S. Green Building Council (www.usgbc.org), means the hospital meets the highest of standards in sustainable site development, water savings, energy efficiency, materials selection, and indoor environmental quality.
Hospitalists should be engaged in environmental stewardship because they often are seen as role models for hospital staff, residents, students, patients, and families, Dr. Williams says. “We are also frequently in positions of influence when it comes to instituting hospital policy,” he adds. “Hospital administration officials usually like to keep a friendly relationship with us, and are therefore typically open to our thoughts and concerns on everything from recycling programs to new hospital design.”

New Ways to Build
The most visible sign of American hospitals’ commitment to environmental responsibility is evident in construction. About 81% of hospital building projects last year included environmentally friendly materials, according to a survey by the American Society for Healthcare Engineering. That’s up from 55% in 2006.
Kaiser Permanente, an integrated managed-care organization that operates 37 medical centers in nine Western states, is among the industry leaders in green construction. Its Modesto (Calif.) Medical Center, which opened in October 2008, has received national recognition as one of the greenest healthcare facilities in North America. How green? Permeable pavement in the parking area allows rainwater to filter into the ground, and solar panels generate enough electricity to power up to 20 homes. Building materials were selected with an eye toward patient and employee health. Kaiser worked with a carpet manufacturer to create a product free of potentially harmful polyvinyl chloride. It installed cabinetry made from medium-density fiberboard that did not contain formaldehyde, and it chose paints low in volatile organic compounds.
“People would walk into the hospital and say, ‘This place doesn’t smell new,’ ” says project director Jeffrey Deane. “That’s because people are used to smelling new carpet and new paint, because those materials are outgassing huge quantities of nauseous gases.”
Deane acknowledges it is difficult to create a truly green hospital, given the presence of chemicals and pharmaceuticals, and the way the facility must be cleaned to fight infectious bacteria. But the effort to make the environment within the building less harmful didn’t break the bank. The paint and essentially toxin-free fabrics cost the same or less than traditional materials, and a two-duct air system—which draws air solely from the outside, eliminating recirculation—is easier to maintain and costs less to operate.
“One of the biggest hurdles is getting people past the idea that it’s going to cost too much money,” Deane says. “We have a tendency to value-engineer things because they are cheaper up front. Even in cases when they aren’t, there are ramifications down the road that are pretty significant. For every dollar you spend upgrading your system to be more efficient and environmentally friendly, you’ll get paid back several times over.”
Energy Efficiency
Although new construction provides a clean slate for hospitals to go green, administrations at existing facilities have identified several ways to lessen their environmental footprint. One of the quickest—and most cost-effective—is to improve energy efficiency.
Hospitals are the second-most energy-intensive type of structure in the U.S. behind food service, according to the U.S. Department of Energy.1 That consumption costs inpatient healthcare facilities about $5.3 billion annually—about 3% of the average hospital’s operating budget—and results in about 30 pounds of carbon dioxide emissions per square foot, more than double the emissions of standard commercial office buildings, the department estimates.
Energy savings provide an immediate boost to the bottom line, says Clark Reed, director of the Healthcare Facilities Division at the EPA’s Energy Star program. Based on average profit margins, every dollar a nonprofit hospital saves on its energy costs is equivalent to generating $20 in new revenue, Reed says.
“Because of the dollars involved, energy management is getting C-suite attention,” says Nick DeDominicis of Arlington, Va.-based Practice Greenhealth, a networking organization for healthcare institutions that have committed to eco-friendly practices. “We see an increasing number of hospitals thinking about developing strategic master energy plans, looking at facility management in much the same way they’d look at asset management at the boardroom level.”
That’s why Practice Greenhealth created its Healthcare Clean Energy Exchange, an electronic marketplace in which more than 250 suppliers compete to meet healthcare facilities’ energy needs. The program debuted in 2008 and is operated in a reverse-auction format, with suppliers bidding downward to compete for contracts. It is designed to help healthcare entities lock in stable pricing and increase their percentage of green or renewable energy purchases. The auctions carry no upfront fees, and if a healthcare entity doesn’t like the results, it is not forced to sign a contract.
Ingalls Health System in Harvey, Ill., explored the exchange program after energy prices skyrocketed last summer. Before participating in the exchange, Ingalls used 100% “brown”—or conventionally produced—electricity. During the auction, it sought bids for varying mixes of conventional and renewable power. “I actually was very skeptical we would be able to get green energy at a lower cost,” says chief financial officer Vince Pryor. “Frankly, I was hoping to break even.”
The results surpassed expectations. Ingalls signed a three-year contract for electricity, 5% of which now comes from renewable sources. It’s a small step, one the health system believes is in the right direction, as they expect to save $375,000 over the contract period and cut carbon dioxide emissions by 3,433 tons. “I think we would have been happy if we had kept costs neutral and gotten a bit of a green footprint,” Pryor says. “But the process worked out far better than that. It’s obviously a win-win for us.”

—Paul Rosenau, MD, pediatric hospitalist, Fletcher Allen Health Care, Burlington, Vt.
Waste Reduction
U.S. hospitals generate approximately 6,600 tons of waste per day, and they pay more than $106 million each year to dispose of it, Practice Greenhealth reports. About 80% of waste generated in hospitals is nonhazardous solid material (i.e., paper, cardboard, food, and plastics), according to the Green Guide for Health Care, which offers recommendations for sustainable construction, operations, and maintenance of healthcare facilities (www.gghc.org).
Some health systems are putting pressure on vendors to reduce the amount of packaging materials they use. Others are finding alternative homes for items that ordinarily would go straight into dumpsters.
During construction of Kaiser’s Modesto hospital, Deane and his colleagues found one firm that turns Styrofoam into crown molding. They identified another company that recycles bubble wrap and foam, and a third that pays for certain nonrecyclable products. Their efforts prevented about 40 tons of waste from entering the landfill.
“It’s tough for some organizations to get past the culture of doing things the way they’ve always been done,” Deane says. “There’s a lot of opportunity if people just push their comfort level.”
The same holds true for hospital departments. Diane Imrie, director of nutrition services at Fletcher Allen Health Care in Burlington, Vt., led efforts to replace foam and plastic dishware with products that fully degrade when composted. A shift to reusable catering trays saved $1,000 a year.
“The key is to think about what would make a positive impact within your department,” Imrie says. “If there’s something that irritates you or you don’t feel comfortable doing because you know it’s not great for the environment, start there. If you don’t like it, your staff probably doesn’t like it, either.”
HM’s Role
Some hospitals are creating sustainability councils or “green teams” that involve many specialties rather than hiring one sustainability coordinator. The groups usually meet monthly or quarterly. Conversations range from how to reduce waste and promote alternative transportation, to how to utilize alternative energy sources, conserve water, and purchase environmentally friendly products. Such panels provide an excellent opportunity for hospitalists to take an active role in the greening of their facilities, says Paul Rosenau, MD, a pediatric hospitalist at Vermont Children’s Hospital at Fletcher Allen Health Care in Burlington. Dr. Rosenau has served on Fletcher Allen’s sustainability council since its inception more than a year ago.
As the only physician on the roughly 15-person panel, Dr. Rosenau represents what he calls “the clinical interface” with what otherwise would be operational issues. Consequently, when Fletcher Allen recently launched a program to begin collecting recyclables in patient rooms, physicians did not view the initiative simply as a directive coming down from the top. Instead, they embraced the effort, helping to legitimize the program and make it more efficient.
“We will counsel families about how to use these bins,” Dr. Rosenau says. “We identify areas where it isn’t working. We know where waste streams are getting mixed. We know where they are a hindrance and not a help because we’re in there day in and day out.”
Hospitalists who work at facilities where sustainability councils don’t exist still can play their part in the green movement. They can start by following the same rules they teach their children, such as turning out the lights when they leave the room.
“Hospitals use an incredible amount of equipment,” says Louis Dinneen, director of facilities management for Fletcher Allen Health Care, which reduced energy consumption at its main campus by 8% last year. “The next big drive is to improve awareness of the staff. … Developing a sense of ownership is a big part of it, especially in a large organization. We’re asking ourselves, ‘What equipment do we have on all the time?’ If it isn’t necessary to leave it on, make sure it gets turned off.”
Hospitalists also can look at program operations and QI projects with an eye toward environmental responsibility. Dr. Rosenau outlines several strategies:
- Begin with something that enables early success. “It really enforces the idea that this is a multidisciplinary effort,” he says. “It makes people feel like they are part of a team working to make the place better. It’s not this external, foreign idea that, ‘We’re going to green things.’ ”
- Be prepared to establish new relationships. For example, get to know the person who does the purchasing in your group if you are concerned about the environmental lifecycle of certain products. “We aren’t experts in these areas, and it’s important that we not take on a completely new activity. We need to be cognizant of the realities of time, burnout, and quality of care,” Dr. Rosenau says. “But having a dialogue with administrators or other key people who can help assess the environmental impact of healthcare delivery is part of the QI role we play. Some of these things probably are not going to change if the initial interest does not come from a clinician who says, ‘I’m concerned about X.’ ”
- Don’t reinvent the wheel. Take advantage of the growing number of resources (e.g., Practice Greenhealth and Health Care Without Harm) that explore the relationship between healthcare and the environment (see “Help Your Hospital Get Green,” p. 25).
The Next Step
Thanks to a shift in attitudes and practices among those in healthcare, including HM, the industry has taken significant steps to reduce its environmental footprint. The future, experts say, is to make sure physicians have the tools they need to improve the relationship between care delivery and the environment.
“We have a lot of growing to do on the physician side,” Dr. Rosenau says. “That’s not to say we need to have a PhD in ecotoxicology, but we do need to learn some. … We’re in this to be healers. We say ‘Do no harm.’ We try to avoid adverse drug effects. We also have to avoid adverse environmental impacts.”
Cohen, Health Care Without Harm’s co-executive director, agrees. “Doctors get four hours in four years of environmental education, and most of that is about things like smoking,” he says. “If someone comes to a physician and says, ‘My child has asthma,’ most doctors have no idea to ask, ‘Do you apply pesticides at your home? Do you use toxic cleaners? Are you living down the street from a diesel truck route or incinerator?’ ”
The bottom line: Sustainable medicine goes beyond changing light bulbs or implementing recycling programs.
“We’re at a tipping point, and we feel these issues will become mainstream,” Cohen says. The business case has been made for a number of these initiatives, and I think the rapidly rising costs of healthcare and the epidemic of chronic disease is pushing the sector to realize it needs to move upstream and focus on prevention a little bit more.” TH
Mark Leiser is a freelance writer based in New Jersey.
Reference
- Principal Building Activities in the Commercial Buildings Energy Consumption Survey. Energy Information Administration Web site. Available at: www.eia.doe.gov/emeu/consumptionbriefs/cbecs/pbawebsite/contents.htm. Accessed Sept. 10, 2009.
New Building Designs Equal Energy Savings


An estimated $200 billion will be spent on new hospital construction in the U.S. in the next decade, according to the U.S. Department of Health and Human Services. Many of those new facilities will showcase innovative design elements (e.g., displaced ventilation systems, geothermal power, and green roofs) intended to conserve energy and save money.
Although starting with a clean slate might make such efforts easier and more affordable, there are steps existing hospitals can take to reduce their environmental footprint and improve their bottom line.
The best place to start is to calculate your facility’s energy performance rating, says Clark Reed, director of the Healthcare Facilities Division at the U.S. Environmental Protection Agency’s Energy Star program. The rating shows how efficient a hospital is compared with others around the nation. It’s calculated on a scale of 1 to 100, with 50 being the industry average. The calculator is available at www.energystar.gov/benchmark.
“You don’t really know what steps you need to take at your facility unless you know how your hospital compares to your peers across the country,” Reed said.
If you have access to a year’s worth of utility bills, plus some basic information about your facility—square footage, the number of licensed beds, and the number of floors in the tallest building on your campus—you can get a rating in as little as an hour.
The rating serves as a “line in the sand” that helps hospitals determine where they are, where they want to be, and what steps they must take to get there. Steps can range from capital upgrades to business arrangements with new vendors.
To simplify the process, the Energy Star program recommends a five-step solution that, if followed chronologically, often helps hospitals save up to 30% on their energy bills, Reed says.
“When you’re looking at energy bills running into the millions of dollars a year, saving 10%, 20%, or 30% of that—and saving it pretty quickly—becomes significant,” he says. “That’s money that hospitals, rather than paying out to utilities, can put back into doing the work of their mission statement.”—ML
The Hippocratic Oath has served as the foundation of ethical medical practice since the fourth century B.C. Today, one of the oath’s core principles—the promise to do no harm—is guiding more than just bedside care. It is the cornerstone of the green movement in healthcare, a rapidly growing effort to help the profession evolve from one that simply cares for the sick to one that serves as a broader force for healing in society.
Some experts note the medical industry has been slow to understand the effects of its practices on public health. Barely a decade ago, U.S. Environmental Protection Agency (EPA) reports revealed staggering statistics: Medical waste incinerators were the leading producer of airborne carcinogenic dioxins, asthma rates for healthcare workers were among the highest of any profession, and healthcare waste was responsible for 10% of mercury air emissions.1
The incredible irony produced “a teachable moment,” says Gary Cohen, co-executive director of Health Care Without Harm in Arlington, Va., an international coalition established in 1996 to help make the industry more ecologically sustainable. Since then, hospitals have eliminated mercury from many of their supplies, including blood-pressure cuffs and thermometers. Additionally, the efforts to transform buying practices and lessen reliance on fossil fuels have gained considerable traction. And the number of medical waste incinerators in the U.S. has dropped from 5,000 to less than 100.
—ALICE ST. CLAIR / METRO HEALTH
“The healthcare sector began to understand the links between the environment and disease. They realized they were both addressing the collateral damage of a poisoned environment, and they were contributing to it,” Cohen says.
Now, even those who are critical of the profession’s past practices are lauding industry leaders’ efforts to build more efficient facilities, reduce waste, and modify day-to-day practices to lessen their environmental footprint.
“Hospitals have been so focused, rightly so, on patient safety,” Cohen says. “Now we’re at the point where we’re talking about patient safety, worker safety, and environmental safety. It’s changing the architecture of how things are done, and it is becoming much more accepted as a mainstream concern.”
Concern should stretch beyond the C-suite to those on the front lines, says Don Williams, MD, a pediatric hospitalist at Dell Children’s Medical Center in Austin, Texas, and a board member of Austin Physicians for Social Responsibility. “Although it is rare for us to see the direct effects of green choices on the health of individual patients, I think it is important to recognize that less air pollution and less global warming leads to less illness,” says Dr. Williams, who works in the only platinum-rated Leadership in Environmental Energy and Design certified hospital in the U.S. The certification, through the U.S. Green Building Council (www.usgbc.org), means the hospital meets the highest of standards in sustainable site development, water savings, energy efficiency, materials selection, and indoor environmental quality.
Hospitalists should be engaged in environmental stewardship because they often are seen as role models for hospital staff, residents, students, patients, and families, Dr. Williams says. “We are also frequently in positions of influence when it comes to instituting hospital policy,” he adds. “Hospital administration officials usually like to keep a friendly relationship with us, and are therefore typically open to our thoughts and concerns on everything from recycling programs to new hospital design.”
New Ways to Build
The most visible sign of American hospitals’ commitment to environmental responsibility is evident in construction. About 81% of hospital building projects last year included environmentally friendly materials, according to a survey by the American Society for Healthcare Engineering. That’s up from 55% in 2006.
Kaiser Permanente, an integrated managed-care organization that operates 37 medical centers in nine Western states, is among the industry leaders in green construction. Its Modesto (Calif.) Medical Center, which opened in October 2008, has received national recognition as one of the greenest healthcare facilities in North America. How green? Permeable pavement in the parking area allows rainwater to filter into the ground, and solar panels generate enough electricity to power up to 20 homes. Building materials were selected with an eye toward patient and employee health. Kaiser worked with a carpet manufacturer to create a product free of potentially harmful polyvinyl chloride. It installed cabinetry made from medium-density fiberboard that did not contain formaldehyde, and it chose paints low in volatile organic compounds.
“People would walk into the hospital and say, ‘This place doesn’t smell new,’ ” says project director Jeffrey Deane. “That’s because people are used to smelling new carpet and new paint, because those materials are outgassing huge quantities of nauseous gases.”
Deane acknowledges it is difficult to create a truly green hospital, given the presence of chemicals and pharmaceuticals, and the way the facility must be cleaned to fight infectious bacteria. But the effort to make the environment within the building less harmful didn’t break the bank. The paint and essentially toxin-free fabrics cost the same or less than traditional materials, and a two-duct air system—which draws air solely from the outside, eliminating recirculation—is easier to maintain and costs less to operate.
“One of the biggest hurdles is getting people past the idea that it’s going to cost too much money,” Deane says. “We have a tendency to value-engineer things because they are cheaper up front. Even in cases when they aren’t, there are ramifications down the road that are pretty significant. For every dollar you spend upgrading your system to be more efficient and environmentally friendly, you’ll get paid back several times over.”
Energy Efficiency
Although new construction provides a clean slate for hospitals to go green, administrations at existing facilities have identified several ways to lessen their environmental footprint. One of the quickest—and most cost-effective—is to improve energy efficiency.
Hospitals are the second-most energy-intensive type of structure in the U.S. behind food service, according to the U.S. Department of Energy.1 That consumption costs inpatient healthcare facilities about $5.3 billion annually—about 3% of the average hospital’s operating budget—and results in about 30 pounds of carbon dioxide emissions per square foot, more than double the emissions of standard commercial office buildings, the department estimates.
Energy savings provide an immediate boost to the bottom line, says Clark Reed, director of the Healthcare Facilities Division at the EPA’s Energy Star program. Based on average profit margins, every dollar a nonprofit hospital saves on its energy costs is equivalent to generating $20 in new revenue, Reed says.
“Because of the dollars involved, energy management is getting C-suite attention,” says Nick DeDominicis of Arlington, Va.-based Practice Greenhealth, a networking organization for healthcare institutions that have committed to eco-friendly practices. “We see an increasing number of hospitals thinking about developing strategic master energy plans, looking at facility management in much the same way they’d look at asset management at the boardroom level.”
That’s why Practice Greenhealth created its Healthcare Clean Energy Exchange, an electronic marketplace in which more than 250 suppliers compete to meet healthcare facilities’ energy needs. The program debuted in 2008 and is operated in a reverse-auction format, with suppliers bidding downward to compete for contracts. It is designed to help healthcare entities lock in stable pricing and increase their percentage of green or renewable energy purchases. The auctions carry no upfront fees, and if a healthcare entity doesn’t like the results, it is not forced to sign a contract.
Ingalls Health System in Harvey, Ill., explored the exchange program after energy prices skyrocketed last summer. Before participating in the exchange, Ingalls used 100% “brown”—or conventionally produced—electricity. During the auction, it sought bids for varying mixes of conventional and renewable power. “I actually was very skeptical we would be able to get green energy at a lower cost,” says chief financial officer Vince Pryor. “Frankly, I was hoping to break even.”
The results surpassed expectations. Ingalls signed a three-year contract for electricity, 5% of which now comes from renewable sources. It’s a small step, one the health system believes is in the right direction, as they expect to save $375,000 over the contract period and cut carbon dioxide emissions by 3,433 tons. “I think we would have been happy if we had kept costs neutral and gotten a bit of a green footprint,” Pryor says. “But the process worked out far better than that. It’s obviously a win-win for us.”
—Paul Rosenau, MD, pediatric hospitalist, Fletcher Allen Health Care, Burlington, Vt.
Waste Reduction
U.S. hospitals generate approximately 6,600 tons of waste per day, and they pay more than $106 million each year to dispose of it, Practice Greenhealth reports. About 80% of waste generated in hospitals is nonhazardous solid material (i.e., paper, cardboard, food, and plastics), according to the Green Guide for Health Care, which offers recommendations for sustainable construction, operations, and maintenance of healthcare facilities (www.gghc.org).
Some health systems are putting pressure on vendors to reduce the amount of packaging materials they use. Others are finding alternative homes for items that ordinarily would go straight into dumpsters.
During construction of Kaiser’s Modesto hospital, Deane and his colleagues found one firm that turns Styrofoam into crown molding. They identified another company that recycles bubble wrap and foam, and a third that pays for certain nonrecyclable products. Their efforts prevented about 40 tons of waste from entering the landfill.
“It’s tough for some organizations to get past the culture of doing things the way they’ve always been done,” Deane says. “There’s a lot of opportunity if people just push their comfort level.”
The same holds true for hospital departments. Diane Imrie, director of nutrition services at Fletcher Allen Health Care in Burlington, Vt., led efforts to replace foam and plastic dishware with products that fully degrade when composted. A shift to reusable catering trays saved $1,000 a year.
“The key is to think about what would make a positive impact within your department,” Imrie says. “If there’s something that irritates you or you don’t feel comfortable doing because you know it’s not great for the environment, start there. If you don’t like it, your staff probably doesn’t like it, either.”
HM’s Role
Some hospitals are creating sustainability councils or “green teams” that involve many specialties rather than hiring one sustainability coordinator. The groups usually meet monthly or quarterly. Conversations range from how to reduce waste and promote alternative transportation, to how to utilize alternative energy sources, conserve water, and purchase environmentally friendly products. Such panels provide an excellent opportunity for hospitalists to take an active role in the greening of their facilities, says Paul Rosenau, MD, a pediatric hospitalist at Vermont Children’s Hospital at Fletcher Allen Health Care in Burlington. Dr. Rosenau has served on Fletcher Allen’s sustainability council since its inception more than a year ago.
As the only physician on the roughly 15-person panel, Dr. Rosenau represents what he calls “the clinical interface” with what otherwise would be operational issues. Consequently, when Fletcher Allen recently launched a program to begin collecting recyclables in patient rooms, physicians did not view the initiative simply as a directive coming down from the top. Instead, they embraced the effort, helping to legitimize the program and make it more efficient.
“We will counsel families about how to use these bins,” Dr. Rosenau says. “We identify areas where it isn’t working. We know where waste streams are getting mixed. We know where they are a hindrance and not a help because we’re in there day in and day out.”
Hospitalists who work at facilities where sustainability councils don’t exist still can play their part in the green movement. They can start by following the same rules they teach their children, such as turning out the lights when they leave the room.
“Hospitals use an incredible amount of equipment,” says Louis Dinneen, director of facilities management for Fletcher Allen Health Care, which reduced energy consumption at its main campus by 8% last year. “The next big drive is to improve awareness of the staff. … Developing a sense of ownership is a big part of it, especially in a large organization. We’re asking ourselves, ‘What equipment do we have on all the time?’ If it isn’t necessary to leave it on, make sure it gets turned off.”
Hospitalists also can look at program operations and QI projects with an eye toward environmental responsibility. Dr. Rosenau outlines several strategies:
- Begin with something that enables early success. “It really enforces the idea that this is a multidisciplinary effort,” he says. “It makes people feel like they are part of a team working to make the place better. It’s not this external, foreign idea that, ‘We’re going to green things.’ ”
- Be prepared to establish new relationships. For example, get to know the person who does the purchasing in your group if you are concerned about the environmental lifecycle of certain products. “We aren’t experts in these areas, and it’s important that we not take on a completely new activity. We need to be cognizant of the realities of time, burnout, and quality of care,” Dr. Rosenau says. “But having a dialogue with administrators or other key people who can help assess the environmental impact of healthcare delivery is part of the QI role we play. Some of these things probably are not going to change if the initial interest does not come from a clinician who says, ‘I’m concerned about X.’ ”
- Don’t reinvent the wheel. Take advantage of the growing number of resources (e.g., Practice Greenhealth and Health Care Without Harm) that explore the relationship between healthcare and the environment (see “Help Your Hospital Get Green,” p. 25).
The Next Step
Thanks to a shift in attitudes and practices among those in healthcare, including HM, the industry has taken significant steps to reduce its environmental footprint. The future, experts say, is to make sure physicians have the tools they need to improve the relationship between care delivery and the environment.
“We have a lot of growing to do on the physician side,” Dr. Rosenau says. “That’s not to say we need to have a PhD in ecotoxicology, but we do need to learn some. … We’re in this to be healers. We say ‘Do no harm.’ We try to avoid adverse drug effects. We also have to avoid adverse environmental impacts.”
Cohen, Health Care Without Harm’s co-executive director, agrees. “Doctors get four hours in four years of environmental education, and most of that is about things like smoking,” he says. “If someone comes to a physician and says, ‘My child has asthma,’ most doctors have no idea to ask, ‘Do you apply pesticides at your home? Do you use toxic cleaners? Are you living down the street from a diesel truck route or incinerator?’ ”
The bottom line: Sustainable medicine goes beyond changing light bulbs or implementing recycling programs.
“We’re at a tipping point, and we feel these issues will become mainstream,” Cohen says. The business case has been made for a number of these initiatives, and I think the rapidly rising costs of healthcare and the epidemic of chronic disease is pushing the sector to realize it needs to move upstream and focus on prevention a little bit more.” TH
Mark Leiser is a freelance writer based in New Jersey.
Reference
- Principal Building Activities in the Commercial Buildings Energy Consumption Survey. Energy Information Administration Web site. Available at: www.eia.doe.gov/emeu/consumptionbriefs/cbecs/pbawebsite/contents.htm. Accessed Sept. 10, 2009.
New Building Designs Equal Energy Savings
An estimated $200 billion will be spent on new hospital construction in the U.S. in the next decade, according to the U.S. Department of Health and Human Services. Many of those new facilities will showcase innovative design elements (e.g., displaced ventilation systems, geothermal power, and green roofs) intended to conserve energy and save money.
Although starting with a clean slate might make such efforts easier and more affordable, there are steps existing hospitals can take to reduce their environmental footprint and improve their bottom line.
The best place to start is to calculate your facility’s energy performance rating, says Clark Reed, director of the Healthcare Facilities Division at the U.S. Environmental Protection Agency’s Energy Star program. The rating shows how efficient a hospital is compared with others around the nation. It’s calculated on a scale of 1 to 100, with 50 being the industry average. The calculator is available at www.energystar.gov/benchmark.
“You don’t really know what steps you need to take at your facility unless you know how your hospital compares to your peers across the country,” Reed said.
If you have access to a year’s worth of utility bills, plus some basic information about your facility—square footage, the number of licensed beds, and the number of floors in the tallest building on your campus—you can get a rating in as little as an hour.
The rating serves as a “line in the sand” that helps hospitals determine where they are, where they want to be, and what steps they must take to get there. Steps can range from capital upgrades to business arrangements with new vendors.
To simplify the process, the Energy Star program recommends a five-step solution that, if followed chronologically, often helps hospitals save up to 30% on their energy bills, Reed says.
“When you’re looking at energy bills running into the millions of dollars a year, saving 10%, 20%, or 30% of that—and saving it pretty quickly—becomes significant,” he says. “That’s money that hospitals, rather than paying out to utilities, can put back into doing the work of their mission statement.”—ML
Dr. Hospitalist

Think Twice About an Expert Witness Offer
A medical malpractice attorney recently asked me if I would be interested in reviewing a case. They are looking for a hospitalist “expert witness.” I have never done this before and don’t know if I am qualified. Can you tell me more about the benefits and risks of being a medical expert witness?
R. Jones, MD, Miami
Dr. Hospitalist responds: Most physicians complete medical school and postgraduate training without firsthand knowledge of our legal system. Unfortunately, a large number of physicians become defendants in medical lawsuits during their professional careers. Hospitalists are no different than physicians in other medical fields. I hear with increasing frequency about hospitalists being sued for alleged medical malpractice. I am not surprised. This is not an indictment against hospital HM, but more a matter of probability. There are at least tenfold more hospitalists today than 10 years ago.
To be clear, I am not an attorney, nor do I have any formal legal training. I suggest you speak with an attorney if you have questions about the law.
Laws vary from state to state, but it is my understanding that expert witnesses are an absolute necessity in our legal system. Plaintiff attorneys and defense attorneys retain expert witnesses to help them determine the merits of a lawsuit. Did the defendant have a duty to treat the patient? Was there a breach of the standard of care? What were the damages, and were they due to the defendant’s actions or lack of action?
Understand that our judicial system holds that a physician in the same field as the defendant is the most qualified to determine whether the defendant met the standard of care. Standard of care is what is reasonably expected of a physician in that field given the circumstances. So if the defendant is a hospitalist, the attorneys are looking for an expert witness who is also a hospitalist. Seems like a reasonable system, right? Individuals are judged by their peers. But the system is far from perfect.
Critics point out the system is inherently flawed when we rely on “experts” to help us determine the standard of care. Aside from working in a given field of medicine, there are no specific qualifications to be an expert witness. Unfortunately, not all experts are experts, and not all experts are completely honest. And there can be a lot of money at stake. Plaintiffs attorneys and defense attorneys, along with expert witnesses for both sides, stand to profit from lawsuits. All of this drives up the cost of medical malpractice premiums.
I will not tell you not to become an expert witness. Until we see real, sustainable tort reform, we have to live with the present system. If I am sued for alleged medical malpractice, my defense attorney would seek an expert witness’s opinion. If a patient is hurt because of alleged negligence, the patient’s attorney would seek the opinion of an expert witness. So we need honest physicians to provide honest opinions as expert witnesses. This goes for defendants and plaintiffs.
Many expert witnesses find gratification in knowing they helped a patient or a physician. As I mentioned previously, an expert-witness gig can be financially lucrative, but it is not without its drawbacks. Expert witnesses are subject to the code of ethics set forth by the medical society and state board of registration in medicine. Any sworn testimony you provide is discoverable. It is easier than you might think for others (e.g., opposition attorneys) to believe you have contradicted yourself when you give your opinion on the same subject in more than one case. As an expert witness, know that you will be cross-examined by an attorney, either in deposition or at trial. Testifying under oath can be a grueling experience.
Most expert witnesses are reputable physicians in their fields. You should feel honored for being asked to participate as an expert witness, but think carefully before you accept the offer. Understand what is being asked of you before you take on this responsibility. TH
A middle-aged man with progressive fatigue
A 61-year-old white man presents with progressive fatigue, which began several months ago and has accelerated in severity over the past week. He says he has had no shortness of breath, chest pain, or symptoms of heart failure, but he has noticed a decrease in exertional capacity and now has trouble completing his daily 5-mile walk.
He saw his primary physician, who obtained an electrocardiogram that showed a new left bundle branch block. Transthoracic echocardiography indicated that his left ventricular ejection fraction, which was 60% a year earlier, was now 35%.
He has hypertension, dyslipidemia, type 2 diabetes, and chronic kidney disease. Although he was previously morbidly obese, he has lost more than 100 pounds with diet and exercise over the past 10 years. He also used to smoke; in fact, he has a 30-pack-year history, but he quit in 1987. He has a family history of premature coronary artery disease.
Physical examination. His heart rate is 75 beats per minute, blood pressure 142/85 mm Hg, and blood oxygen saturation 96% while breathing room air. He weighs 169 pounds (76.6 kg) and he is 6 feet tall (182.9 cm), so his body mass index is 22.9 kg/m2.
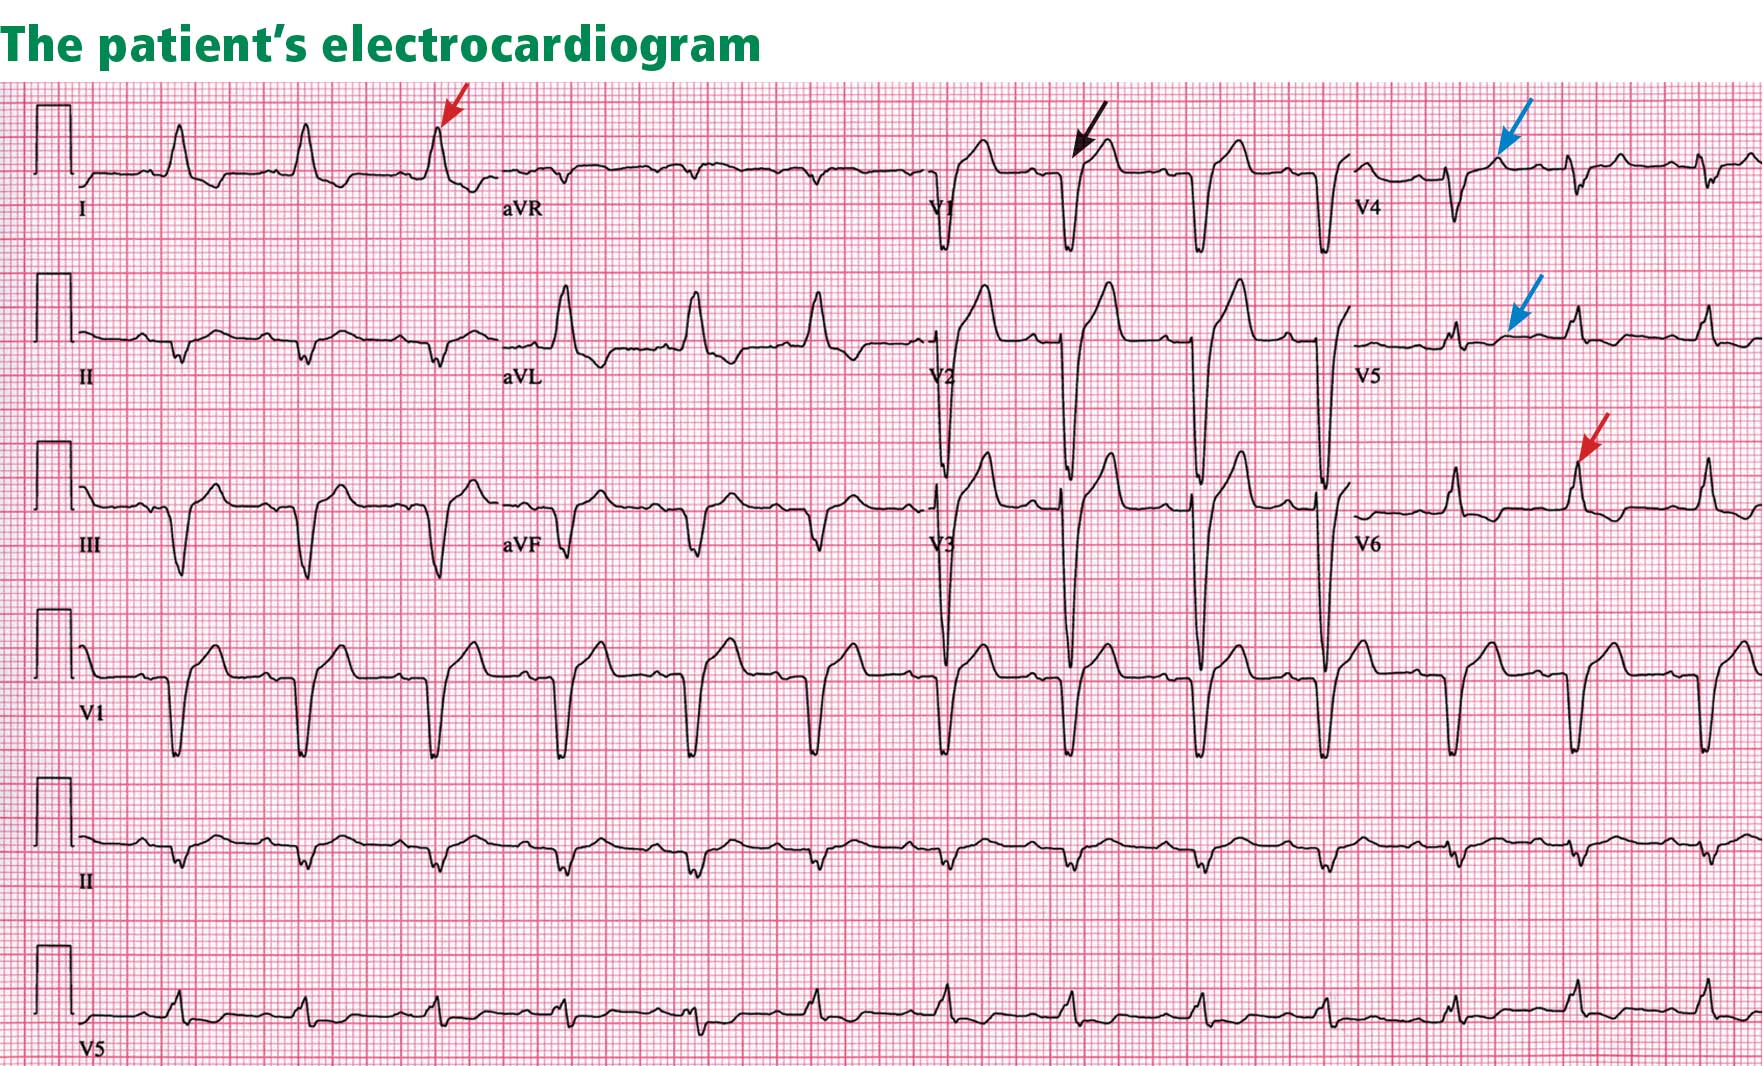
Electrocardiography reveals sinus rhythm with a left bundle branch block and left axis deviation (Figure 1), which were not present 1 year ago.
Chest roentgenography is normal.
A WORRISOME PICTURE
1. Which of the following is associated with left bundle branch block?
- Myocardial injury
- Hypertension
- Aortic stenosis
- Intrinsic conduction system disease
- All of the above
All of the above are true. For left bundle branch block to be diagnosed, the rhythm must be supraventricular and the QRS duration must be 120 ms or more. There should be a QS or RS complex in V1 and a monophasic R wave in I and V6. Also, the T wave should be deflected opposite the terminal deflection of the QRS complex. This is known as appropriate T-wave discordance with bundle branch block. A concordant T wave is nonspecific but suggests ischemia or myocardial infarction.
Potential causes of a new left bundle branch block include hypertension, acute myocardial infarction, aortic stenosis, and conduction system disease. A new left bundle branch block with a concomitant decrease in ejection fraction, especially in a patient with cardiac risk factors, is very worrisome, raising the possibility of ischemic heart disease.
MORE CARDIAC TESTING
The patient undergoes more cardiac testing.
Transthoracic echocardiography is done again. The left ventricle is normal in size, but the ejection fraction is 35%. In addition, stage 1 diastolic dysfunction (abnormal relaxation) and evidence of mechanical dyssynchrony (disruption in the normal sequence of activation and contraction of segments of the left ventricular wall) are seen. The right ventricle is normal in size and function. There is trivial mitral regurgitation and mild tricuspid regurgitation with normal right-sided pressures.
A gated rubidium-82 dipyridamole stress test yields no evidence of a fixed or reversible perfusion defect.
Left heart catheterization reveals angiographically normal coronary arteries.
Magnetic resonance imaging (MRI) shows a moderately hypertrophied left ventricle with moderately to severely depressed systolic function (left ventricular ejection fraction 27%). The left ventricle appears dyssynchronous. Delayed-enhancement imaging reveals patchy delayed enhancement in the basal septum and the basal inferolateral walls. These findings suggest cardiac sarcoidosis, with a sensitivity of nearly 100% and a specificity of approximately 78%.1
SARCOIDOSIS IS A MULTISYSTEM DISEASE
Sarcoidosis is a multisystem disease characterized by noncaseating granulomas. Almost any organ can be affected, but it most commonly involves the respiratory and lymphatic systems.2 Although infectious, environmental, and genetic factors have been implicated, the cause remains unknown. The prevalence is approximately 20 per 100,000, being higher in black3 and Japanese 4 populations.
CARDIAC SARCOIDOSIS
2. What percentage of patients with sarcoidosis have cardiac involvement?
- 10%–20%
- 20%–30%
- 50%
- 80%
Cardiac involvement is seen in 20% to 30% of patients with sarcoidosis.5–7 However, most cases are subclinical, and symptomatic cardiac involvement is present in only about 5% of patients with systemic sarcoidosis.8 Isolated cardiac sarcoidosis has been described in case reports but is rare.9
The clinical manifestations of cardiac sarcoidosis depend on the location and extent of granulomatous inflammation. In a necropsy study of 113 patients with cardiac sarcoidosis, the left ventricular free wall was the most common location, followed by the interventricular septum.10
3. How does cardiac sarcoidosis most commonly present?
- Conduction abnormalities
- Ventricular tachycardia
- Cardiomyopathy
- Sudden death
- None of the above
Common presentations of cardiac sarcoidosis include conduction system disease and arrhythmias (which can sometimes result in sudden death), and heart failure.
Conduction abnormalities due to granulomas (in the active phase of sarcoidosis) and fibrosis (in the fibrotic phase) in the atrioventricular node or bundle of His are the most common presentation of cardiac sarcoidosis.9 These lesions may result in relatively benign first-degree heart block or may be as potentially devastating as complete heart block.
In almost all patients with conduction abnormalities, the basal interventricular septum is involved.11 Patients who develop complete heart block from sarcoidosis tend to be younger than those with idiopathic heart block. Therefore, complete heart block in a young patient should raise the possibility of this diagnosis. 12
Ventricular tachycardia (sustained or nonsustained) and ventricular premature beats are the second most common presentation. Up to 22% of patients with sarcoidosis have electrocardiographic evidence of ventricular arrythmias. 13 The cause is believed to be myocardial scar tissue resulting from the sarcoid granulomas, leading to electrical reentry.14 Sudden death due to ventricular tachyarrhythmias or conduction blocks accounts for 25% to 65% of deaths from cardiac sarcoidosis.9,15,16
Heart failure may result from sarcoidosis when there is extensive granulomatous disease in the myocardium. Depending on the location of the granulomas, both systolic and diastolic dysfunction can occur. In severe cases, extensive granulomas can cause left ventricular aneurysms.
The diagnosis of cardiac sarcoidosis as the cause of heart failure can be difficult to establish, especially in patients without evidence of sarcoidosis elsewhere. Such patients are often given a diagnosis of idiopathic dilated cardiomyopathy. However, compared with patients with idiopathic dilated cardiomyopathy, those with cardiac sarcoidosis have a greater incidence of advanced atrioventricular block, abnormal wall thickness, focal wall motion abnormalities, and perfusion defects of the anteroseptal and apical regions.17
Progressive heart failure is the second most frequent cause of death (after sudden death) and accounts for 25% to 75% of sarcoid-related cardiac deaths.9,18,19
DIAGNOSING CARDIAC SARCOIDOSIS
4. How is cardiac sarcoidosis diagnosed?
- Electrocardiography
- Echocardiography
- Computed tomography
- Endomyocardial biopsy
- There are no guidelines for diagnosis
Given the variable extent and location of granulomas in sarcoidosis, the diagnosis of cardiac sarcoidosis is often challenging.
To make the diagnosis of sarcoidosis in general, the American Thoracic Society2 says that the clinical picture should be compatible with this diagnosis, noncaseating granulomas should be histologically confirmed, and other diseases capable of producing a similar clinical or histologic picture should be excluded.
A newer diagnostic tool, the Sarcoidosis Three-Dimensional Assessment Instrument,20 incorporates two earlier tools.20,21 It assesses three axes: organ involvement, sarcoidosis severity, and sarcoidosis activity and categorizes the diagnosis of sarcoidosis as “definite,” “probable,” or “possible.”20
In Japan, where sarcoidosis is more common, the Ministry of Health and Welfare22 says that cardiac sarcoidosis can be diagnosed histologically if operative or endomyocardial biopsy specimens contain noncaseating granuloma. In addition, the diagnosis can be suspected in patients who have a histologic diagnosis of extracardiac sarcoidosis if the first item in the list below and one or more of the rest are present:
- Complete right bundle branch block, left axis deviation, atrioventricular block, ventricular tachycardia, premature ventricular contractions (> grade 2 of the Lown classification), or Q or ST-T wave abnormalities
- Abnormal wall motion, regional wall thinning, or dilation of the left ventricle on echocardiography
- Perfusion defects on thallium 201 myocardial scintigraphy or abnormal accumulation of gallium citrate Ga 67 or technetium 99m on myocardial scintigraphy
- Abnormal intracardiac pressure, low cardiac output, or abnormal wall motion or depressed left ventricular ejection fraction on cardiac catheterization
- Nonspecific interstitial fibrosis or cellular infiltration on myocardial biopsy.
The current diagnostic guidelines from the American Thoracic Society2 and the Japanese Ministry of Health and Welfare22 and the Sarcoidosis Three-Dimensional Assessment Instrument,20 however, do not incorporate newer imaging studies as part of their criteria.
A DEFINITIVE DIAGNOSIS
5. Endomyocardial biopsy often provides the definitive diagnosis of cardiac sarcoidosis.
- True
- False
False. Endomyocardial biopsy often fails to reveal noncaseating granulomas, which have a patchy distribution.13 Table 2 summarizes the accuracy of tests for cardiac sarcoidosis.
Electrocardiography is abnormal in up to 50% of patients with sarcoidosis,23 reflecting the conduction disease or arrhythmias commonly seen in cardiac involvement.
Chest radiography classically shows hilar lymphadenopathy and interstitial disease, and may show cardiomegaly, pericardial effusion, or left ventricular aneurysm.
Echocardiography is nonspecific for sarcoid disease, but granulomatous involvement and scar tissue of cardiac tissue may appear hyperechogenic, particularly in the ventricular septum or left ventricular free wall.24
Angiography. Primary sarcoidosis rarely involves the coronary arteries,25 so angiography is most useful in excluding the diagnosis of atherosclerotic coronary artery disease.
Radionuclide imaging with thallium 201 in patients with suspected cardiac sarcoidosis may be useful to suggest myocardial involvement and to exclude cardiac dysfunction secondary to coronary artery disease. Segmental areas with defective thallium 201 uptake correspond to fibrogranulomatous tissue. In resting images, the pattern may be similar to that seen in coronary artery disease. However, during exercise, perfusion defects increase in patients who have ischemia but actually decrease in those with cardiac sarcoidosis.26
Nevertheless, some conclude that thallium scanning is too nonspecific for it to be used as a diagnostic or screening test.27,28 The combined use of thallium 201 and gallium 67 may better detect cardiac sarcoidosis, as gallium is taken up in areas of active inflammation.
Positron-emission tomography (PET) with fluorodeoxyglucose F 18 (FDG), with the patient fasting, appears to be useful in detecting the early inflammation of cardiac sarcoidosis29–34 and monitoring disease activity.30,31 FDG is a glucose analogue that is taken up by granulomatous tissue in the myocardium.34 The uptake in cardiac sarcoidosis is in a focal distribution.30,31,34 The abnormal FDG uptake resolves with steroid treatment.31,32
MRI has promise for diagnosing cardiac sarcoidosis. With gadolinium contrast, MRI has superior image resolution and can detect cardiac involvement early in its course.27,29,35–44
Inflammation of the myocardium due to sarcoid involvement appears as focal zones of increased signal intensity on both T2-weighted and early gadolinium T1-weighted images. Late myocardial enhancement after gadolinium infusion is the most typical finding of cardiac sarcoidosis on MRI, and likely represents fibrogranulomatous tissue.27 Delayed gadolinium enhancement is also seen in myocardial infarction but differs in its distribution.1,35,45 Cardiac sarcoidosis most commonly affects the basal and lateral segments. In one study, the finding of delayed enhancement had a sensitivity of 100% and a specificity of 78%,1,27 though it may not sufficiently differentiate active inflammation from scar.30
Like FDG-PET, MRI has also been shown to be useful for monitoring treatment.33,46 However, PET is more useful for follow-up in patients who receive a pacemaker or implantable cardioverter-defibrillator, in whom MRI is contraindicated. One case report29 described using both delayed-enhancement MRI and FDG-PET to diagnose cardiac sarcoidosis.
TREATMENT
6. How is cardiac sarcoidosis currently treated?
- Implantable cardioverter-defibrillator
- Corticosteroids
- Heart transplantation
- All of the above
- None of the above
Corticosteroids
Corticosteroids are the mainstay of treatment of cardiac sarcoidosis, as they attenuate the characteristic inflammation and fibrosis of sarcoid granulomas. The goal is to prevent compromise of cardiac structure or function.47 Although most of the supporting data are anecdotal, steroids have been shown to improve ventricular contractility,48 arrhythmias,49 and conduction abnormalities.50 MRI and FDG-PET studies have shown cardiac lesions resolving after steroids were started.31,45,46
The optimal dosage remains unknown. Initial doses of 30 to 60 mg daily, gradually tapered over 6 to 12 months to maintenance doses of 5 to 10 mg daily, have been effective.45,51
Relapses are common and require vigilant monitoring.
Alternative agents such as cyclophosphamide (Cytoxan),52 methotrexate (Rheumatrex), 53 and cyclosporine (Sandimmune)54 can be given to patients whose disease does not respond to corticosteroids or who cannot tolerate their side effects.
Implantable cardioverter-defibrillator
Sudden death due to ventricular tachyarrhythmias or conduction block accounts for 30% to 65% of deaths in patients with cardiac sarcoidosis.10 The rates of recurrent ventricular tachycardia and sudden death are high, even with antiarrhythmic drug therapy.55
Although experience with implantable cardiac defibrillators is limited in patients with cardiac sarcoidosis,55–58 some have argued that they be strongly considered to prevent sudden cardiac death in this high-risk group.57,58
Heart transplantation
The largest body of data on transplantation comes from the United Network for Organ Sharing database. In the 65 patients with cardiac sarcoidosis who underwent cardiac transplantation in the 18 years from October 1987 to September 2005, the 1-year post-transplant survival rate was 88%, which was better than in patients with all other diagnoses (85%). The 5-year survival rate was 80%.59,60
Recurrence of sarcoidosis within the cardiac allograft and transmission of sarcoidosis from donor to recipient have both been documented after heart transplantation.61,62
CAUSES OF DEATH
7. What is the most common cause of death in patients with cardiac sarcoidosis?
- Respiratory failure
- Conduction disturbances
- Progressive heart failure
- Ventricular tachyarrhythmias
- None of the above
The prognosis of symptomatic cardiac sarcoidosis is not well defined, owing to the variable extent and severity of the disease. The mortality rate in sarcoidosis without cardiac involvement is about 1% to 5% per year.63,64 Cardiac involvement portends a worse prognosis, with a 55% survival rate at 5 years and 44% at 10 years.17,65 Most patients in the reported series ultimately died of cardiac complications of sarcoidosis, including ventricular tachyarrhythmias, conduction disturbances, and progressive cardiomyopathy.10,17
Since corticosteroids, pacemakers, and implantable cardioverter-defibrillators have begun to be used, the cause of death has shifted from sudden death to progressive heart failure.66
CASE CONTINUED
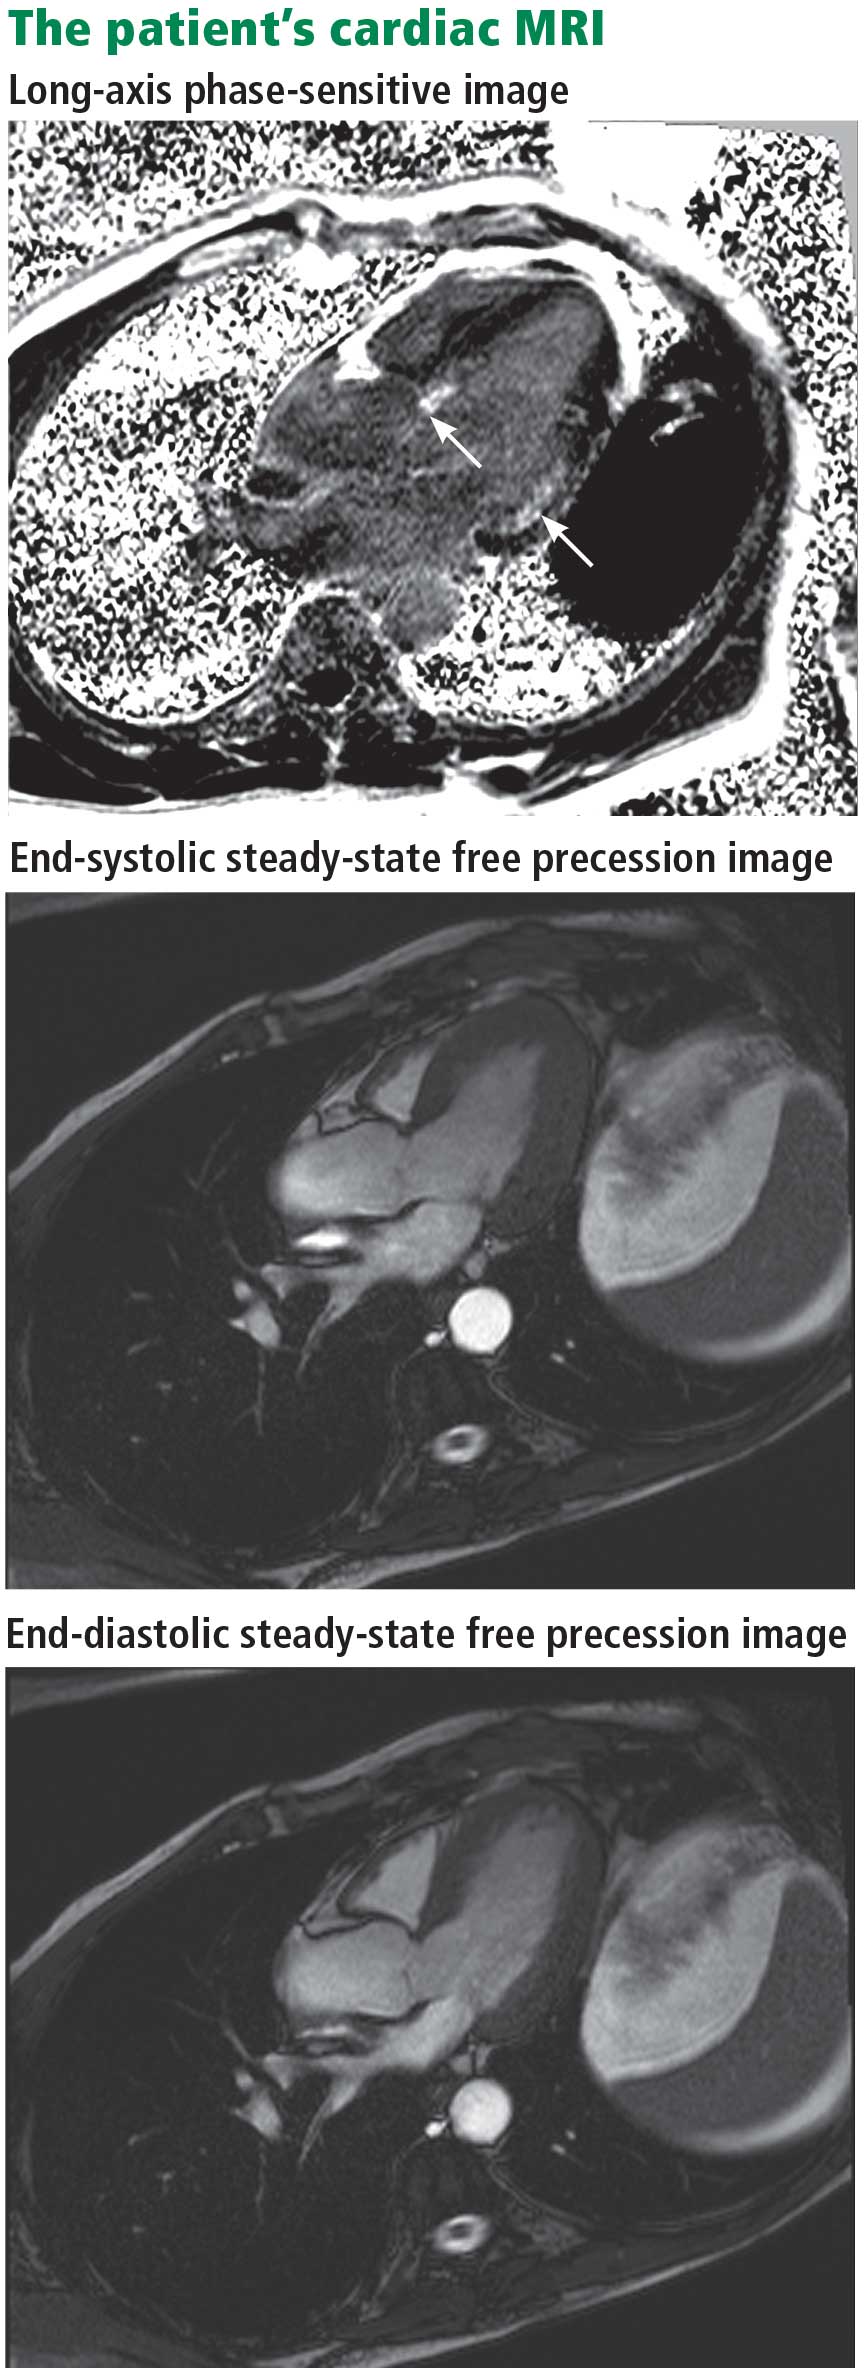
Electrophysiologic testing revealed inducible monomorphic sustained ventricular tachycardia. The patient subsequently had a biventricular cardioverter-defibrillator implanted. He was started on an angiotensin-converting enzyme inhibitor and a beta-blocker for his heart failure. Further imaging of his chest and abdomen revealed lesions in his thyroid and liver. As of this writing, he is undergoing further workup. Because of active infection with Clostridium difficile, steroid therapy was deferred.
- Smedema JP, Snoep G, van Kroonenburgh MP, et al. Evaluation of the accuracy of gadolinium-enhanced cardiovascular magnetic resonance in the diagnosis of cardiac sarcoidosis. J Am Coll Cardiol 2005; 45:1683–1690.
- Statement on sarcoidosis. Joint statement of the American Thoracic Society (ATS), the European Respiratory Society (ERS) and the World Association of Sarcoidosis and Other Granulomatous Disorders (WASOG) adopted by the ATS Board of Directors and by the ERS Executive Committee, February 1999. Am J Respir Crit Care Med 1999; 160:736–755.
- Rybicki BA, Major M, Popovich J, Maliarik MJ, Iannuzzi MC. Racial differences in sarcoidosis incidence: a 5-year study in a health maintenance organization. Am J Epidemiol 1997; 145:234–241.
- Matsui Y, Iwai K, Tachibana T, et al. Clinicopathological study of fatal myocardial sarcoidosis. Ann NY Acad Sci 1976; 278:455–469.
- Chapelon-Abric C, de Zuttere D, Duhaut P, et al. Cardiac sarcoidosis: a retrospective study of 41 cases. Medicine (Baltimore) 2004; 83:315–334.
- Iwai K, Sekiguti M, Hosoda Y, et al. Racial difference in cardiac sarcoidosis incidence observed at autopsy. Sarcoidosis 1994; 11:26–31.
- Thomsen TK, Eriksson T. Myocardial sarcoidosis in forensic medicine. Am J Forensic Med Pathol 1999; 20:52–56.
- Silverman KJ, Hutchins GM, Buckley BH. Cardiac sarcoid: a clinicopathologic study of 84 unselected patients with systemic sarcoidosis. Circulation 1978; 58:1204–1211.
- Roberts WC, McAllister HA, Ferrans VJ. Sarcoidosis of the heart. A clinicopathologic study of 35 necropsy patients (group 1) and review of 78 previously described necropsy patients (group 11). Am J Med 1977; 63:86–108.
- Bargout R, Kelly R. Sarcoid heart disease: clinical course and treatment. Int J Cardiol 2004; 97:173–182.
- Abeler V. Sarcoidosis of the cardiac conducting system. Am Heart J 1979; 97:701–707.
- Fleming HA, Bailey SM. Sarcoid heart disease. J R Coll Physicians Lond 1981; 15:245–253.
- Sekiguchi M, Numao Y, Imai M, Furuie T, Mikami R. Clinical and histological profile of sarcoidosis of the heart and acute idiopathic myocarditis. Concepts through a study employing endomyocardial biopsy. I. Sarcoidosis. Jpn Circ J 1980; 44:249–263.
- Furushima H, Chinushi M, Sugiura H, Kasai H, Washizuka T, Aizawa Y. Ventricular tachyarrhythmia associated with cardiac sarcoidosis: its mechanisms and outcome. Clin Cardiol 2004; 27:217–222.
- Yazaki Y, Isobe M, Hiroe M, et al. Prognostic determinants of long-term survival in Japanese patients with cardiac sarcoidosis treated with prednisone. Am J Cardiol 2001; 88:1006–1010.
- Reuhl J, Schneider M, Sievert H, Lutz FU, Zieger G. Myocardial sarcoidosis as a rare cause of sudden cardiac death. Forensic Sci Int 1997; 89:145–153.
- Yazaki Y, Isobe M, Hiramitsu S, et al. Comparison of clinical features and prognosis of cardiac sarcoidosis and idiopathic dilated cardiomyopathy. Am J Cardiol 1998; 82:537–540.
- Fleming H. Cardiac sarcoidosis. In:James DG, editor. Sarcoidosis and Other Granulomatous Disorders. New York, NY: Dekker 1994; 73:323–334.
- Padilla M. Cardiac sarcoidosis. In:Baughman R, editor. Lung Biology in Health and Disease (Sarcoidosis), vol 210. New York, NY: Taylor & Francis Group; 2006:515–552.
- Judson MA. A proposed solution to the clinical assessment of sarcoidosis: the sarcoidosis three-dimensional assessment instrument (STAI). Med Hypotheses 2007; 68:1080–1087.
- Judson MA, Baughman RP, Teirstein AS, Terrin ML, Yeager H. Defining organ involvement in sarcoidosis: the ACCESS proposed instrument. ACCESS Research Group. A case control etiologic study of sarcoidosis. Sarcoidosis Vasc Diffuse Lung Dis 1999; 16:75–86.
- Hiraga H, Yuwai K, Hiroe M, et al. Guideline for diagnosis of cardiac sarcoidosis. Study report of diffuse pulmonary diseases. Tokyo, Japan: The Japanese Ministry of Health and Welfare, 1993:23–24 (in Japanese).
- Stein E, Jackler I, Stimmel B, Stein W, Siltzbach LE. Asymptomatic electrocardiographic alterations in sarcoidosis. Am Heart J 1973; 86:474–477.
- Fahy GJ, Marwick T, McCreery CJ, Quigley PJ, Maurer BJ. Doppler echocardiographic detection of left ventricular diastolic dysfunction in patients with pulmonary sarcoidosis. Chest 1996; 109:62–66.
- Butany J, Bahl NE, Morales K, et al. The intricacies of cardiac sarcoidosis: a case report involving the coronary arteries and a review of the literature. Cardiovasc Pathol 2006; 15:222–227.
- Haywood LJ, Sharma OP, Siegel ME, et al. Detection of myocardial sarcoidosis by thallium-201 imaging. J Natl Med Assoc 1982; 74:959–964.
- Tadamura E, Yamamuro M, Kubo S, et al. Effectiveness of delayed enhanced MRI for identification of cardiac sarcoidosis: comparison with radionuclide imaging. AJR Am J Roentgenol 2005; 185:110–115.
- Kinney EL, Caldwell JW. Do thallium myocardial perfusion scan abnormalities predict survival in sarcoid patients without cardiac symptoms? Angiology 1990; 41:573–576.
- Pandya C, Brunken RC, Tchou P, Schoenhagen P, Culver DA. Detecting cardiac involvement in sarcoidosis: a call for prospective studies of newer imaging techniques. Eur Respir J 2007; 29:418–422.
- Ohira H, Tsujino I, Ishimaru S, et al. Myocardial imaging with 18F-fluoro-2-deoxyglucose positron emission tomography and magnetic resonance imaging in sarcoidosis. Eur J Nucl Med Mol Imaging 2008; 35:933–941.
- Yamagishi H, Shirai N, Takagi M, et al. Identification of cardiac sarcoidosis with 13N-NH3/18F-FDG PET. J Nucl Med 2003; 44:1030–1036.
- Takeda N, Yokoyama I, Hiroi Y, et al. Positron emission tomography predicted recovery of complete A-V nodal dysfunction in a patient with cardiac sarcoidosis. Circulation 2002; 105:1144–1145.
- Ishimaru S, Tsujino I, Takei T, et al. Focal uptake on 18F-fluoro-2-deoxyglucose positron emission tomography images indicates cardiac involvement of sarcoidosis. Eur Heart J 2005; 26:1538–1543.
- Okumura W, Iwasaki T, Toyama T, et al. Usefulness of fasting 18F-FDG PET in identification of cardiac sarcoidosis. J Nucl Med 2004; 45:1989–1998.
- Schulz-Menger J, Wassmuth R, Abdel-Aty H, et al. Patterns of myocardial inflammation and scarring in sarcoidosis as assessed by cardiovascular magnetic resonance. Heart 2006; 92:399–400.
- Kiuchi S, Teraoka K, Koizumi K, Takazawa K, Yamashina A. Usefulness of late gadolinium enhancement combined with MRI and 67-Ga scintigraphy in the diagnosis of cardiac sarcoidosis and disease activity evaluation. Int J Cardiovasc Imaging 2007; 23:237–241.
- Matsuki M, Matsuo M. MR findings of myocardial sarcoidosis. Clin Radiol 2000; 55:323–325.
- Inoue S, Shimada T, Murakami Y. Clinical significance of gadolinium-DTPA-enhanced MRI for detection of myocardial lesions in a patient with sarcoidosis. Clin Radiol 1999; 54:70–72.
- Vignaux O, Dhote R, Dudoc D, et al. Detection of myocardial involvement in patients with sarcoidosis applying T2-weighted, contrastenhanced, and cine magnetic resonance imaging: initial results of a prospective study. J Comput Assist Tomogr 2002; 26:762–767.
- Vignaux O. Cardiac sarcoidosis: spectrum of MRI features. AJR Am J Roentgenol 2005; 184:249–254.
- Smedema JP, Snoep G, Van Kroonenburgh MP, et al. Evaluation of the accuracy of gadolinium-enhanced cardiovascular magnetic resonance in the diagnosis of cardiac sarcoidosis. J Am Coll Cardiol 2005; 45:1683–1690.
- Doherty MJ, Kumar SK, Nicholson AA, McGivern DV. Cardiac sarcoidosis: the value of magnetic resonance imagine in diagnosis and assessment of response to treatment. Respir Med 1998; 92:697–699.
- Smedema JP, Truter R, de Klerk PA, Zaaiman L, White L, Doubell AF. Cardiac sarcoidosis evaluated with gadolinium-enhanced magnetic resonance and contrast-enhanced 64-slice computed tomography. Int J Cardiol 2006; 112:261–263.
- Kanao S, Tadamura E, Yamamuro M, et al. Demonstration of cardiac involvement of sarcoidosis by contrast-enhanced multislice computed tomography and delayed-enhanced magnetic resonance imaging. J Comput Assist Tomogr 2005; 29:745–748.
- Vignaux O, Dhote R, Duboc D, et al. Clinical significance of myocardial magnetic resonance abnormalities in patients with sarcoidosis: a 1-year follow-up study. Chest 2002; 122:1895–1901.
- Shimada T, Shimada K, Sakane T, et al. Diagnosis of cardiac sarcoidosis and evaluation of the effects of steroid therapy by gadolinium-DTPA-enhanced magnetic resonance imaging. Am J Med 2001; 110:520–527.
- Yazaki Y, Isobe M, Hiroe M, et al. Prognostic determinants of longterm survival in Japanese patients with cardiac sarcoidosis treated with prednisone. Am J Cardiol 2001; 88:1006–1010.
- Ishikawa T, Kondoh H, Nakagawa S, Koiwaya Y, Tanaka K. Steroid therapy in cardiac sarcoidosis. Increased left ventricular contractility concomitant with electrocardiographic improvement after prednisolone. Chest 1984; 85:445–447.
- Walsh MJ. Systemic sarcoidosis with refractory ventricular tachycardia and heart failure. Br Heart J 1978; 40:931–933.
- Lash R, Coker J, Wong BY. Treatment of heart block due to sarcoid heart disease. J Electrocardiol 1979; 12:325–329.
- Johns CJ, Schonfeld SA, Scott PP, Zachary JB, MacGregor MI. Longitudinal study of chronic sarcoidosis with low-dose maintenance corticosteroid therapy. Outcome and implications. Ann N Y Acad Sci 1986; 465:702–712.
- Demeter SL. Myocardial sarcoidosis unresponsive to steroids. Treatment with cyclophosphamide. Chest 1988; 94:202–203.
- Lower EE, Baughman RP. Prolonged use of methotrexate for sarcoidosis. Arch Intern Med 1995; 155:846–851.
- York EL, Kovithavongs T, Man SF, Rebuck AS, Sproule BJ. Cyclosporine and chronic sarcoidosis. Chest 1990; 98:1026–1029.
- Winters SL, Cohen M, Greenberg S, et al. Sustained ventricular tachycardia associated with sarcoidosis: assessment of the underlying cardiac anatomy and the prospective utility of programmed ventricular stimulation, drug therapy and an implantable antitachycardia device. J Am Coll Cardiol 1991; 18:937–943.
- Bajaj AK, Kopelman HA, Echt DS. Cardiac sarcoidosis with sudden death: treatment with automatic implantable cardioverter defibrillator. Am Heart J 1988; 116:557–560.
- Paz HL, McCormick DJ, Kutalek SP, Patchefsky A. The automated implantable cardiac defibrillator. Prophylaxis in cardiac sarcoidosis. Chest 1994; 106:1603–1607.
- Becker D, Berger E, Chmielewski C. Cardiac sarcoidosis: a report of four cases with ventricular tachycardia. J Cardiovasc Electrophysiol 1990; 1:214–219.
- Zaidi AR, Zaidi A, Vaitkus PT. Outcome of heart transplantation in patients with sarcoid cardiomyopathy. J Heart Lung Transplant 2007; 26:714–717.
- Valantine HA, Tazelaar HD, Macoviak J, et al. Cardiac sarcoidosis: response to steroids and transplantation. J Heart Transplant 1987; 6:244–250.
- Oni AA, Hershberger RE, Norman DJ, et al. Recurrence of sarcoidosis in a cardiac allograft: control with augmented corticosteroids. J Heart Lung Transplant 1992; 11:367–369.
- Burke WM, Keogh A, Maloney PJ, Delprado W, Bryant DH, Spratt P. Transmission of sarcoidosis via cardiac transplantation. Lancet 1990; 336:1579.
- Johns CJ, Schonfeld SA, Scott PP, Zachary JB, MacGregor MI. Longitudinal study of chronic sarcoidosis with low-dose maintenance corticosteroid therapy. Outcome and complications. Ann N Y Acad Sci 1986; 465:702–712.
- Gideon NM, Mannino DM. Sarcoidosis mortality in the United States 1979–1991: an analysis of multiple-cause mortality data. Am J Med 1996; 100:423–427.
- Fleming HA, Bailey SM. The prognosis of sarcoid heart disease in the United Kingdom. Ann N Y Acad Sci 1986; 465:543–550.
- Takada K, Ina Y, Yamamoto M, Satoh T, Morishita M. Prognosis after pacemaker implantation in cardiac sarcoidosis in Japan. Clinical evaluation of corticosteroid therapy. Sarcoidosis 1994; 11:113–117.
A 61-year-old white man presents with progressive fatigue, which began several months ago and has accelerated in severity over the past week. He says he has had no shortness of breath, chest pain, or symptoms of heart failure, but he has noticed a decrease in exertional capacity and now has trouble completing his daily 5-mile walk.
He saw his primary physician, who obtained an electrocardiogram that showed a new left bundle branch block. Transthoracic echocardiography indicated that his left ventricular ejection fraction, which was 60% a year earlier, was now 35%.
He has hypertension, dyslipidemia, type 2 diabetes, and chronic kidney disease. Although he was previously morbidly obese, he has lost more than 100 pounds with diet and exercise over the past 10 years. He also used to smoke; in fact, he has a 30-pack-year history, but he quit in 1987. He has a family history of premature coronary artery disease.
Physical examination. His heart rate is 75 beats per minute, blood pressure 142/85 mm Hg, and blood oxygen saturation 96% while breathing room air. He weighs 169 pounds (76.6 kg) and he is 6 feet tall (182.9 cm), so his body mass index is 22.9 kg/m2.
Electrocardiography reveals sinus rhythm with a left bundle branch block and left axis deviation (Figure 1), which were not present 1 year ago.
Chest roentgenography is normal.
A WORRISOME PICTURE
1. Which of the following is associated with left bundle branch block?
- Myocardial injury
- Hypertension
- Aortic stenosis
- Intrinsic conduction system disease
- All of the above
All of the above are true. For left bundle branch block to be diagnosed, the rhythm must be supraventricular and the QRS duration must be 120 ms or more. There should be a QS or RS complex in V1 and a monophasic R wave in I and V6. Also, the T wave should be deflected opposite the terminal deflection of the QRS complex. This is known as appropriate T-wave discordance with bundle branch block. A concordant T wave is nonspecific but suggests ischemia or myocardial infarction.
Potential causes of a new left bundle branch block include hypertension, acute myocardial infarction, aortic stenosis, and conduction system disease. A new left bundle branch block with a concomitant decrease in ejection fraction, especially in a patient with cardiac risk factors, is very worrisome, raising the possibility of ischemic heart disease.
MORE CARDIAC TESTING
The patient undergoes more cardiac testing.
Transthoracic echocardiography is done again. The left ventricle is normal in size, but the ejection fraction is 35%. In addition, stage 1 diastolic dysfunction (abnormal relaxation) and evidence of mechanical dyssynchrony (disruption in the normal sequence of activation and contraction of segments of the left ventricular wall) are seen. The right ventricle is normal in size and function. There is trivial mitral regurgitation and mild tricuspid regurgitation with normal right-sided pressures.
A gated rubidium-82 dipyridamole stress test yields no evidence of a fixed or reversible perfusion defect.
Left heart catheterization reveals angiographically normal coronary arteries.
Magnetic resonance imaging (MRI) shows a moderately hypertrophied left ventricle with moderately to severely depressed systolic function (left ventricular ejection fraction 27%). The left ventricle appears dyssynchronous. Delayed-enhancement imaging reveals patchy delayed enhancement in the basal septum and the basal inferolateral walls. These findings suggest cardiac sarcoidosis, with a sensitivity of nearly 100% and a specificity of approximately 78%.1
SARCOIDOSIS IS A MULTISYSTEM DISEASE
Sarcoidosis is a multisystem disease characterized by noncaseating granulomas. Almost any organ can be affected, but it most commonly involves the respiratory and lymphatic systems.2 Although infectious, environmental, and genetic factors have been implicated, the cause remains unknown. The prevalence is approximately 20 per 100,000, being higher in black3 and Japanese 4 populations.
CARDIAC SARCOIDOSIS
2. What percentage of patients with sarcoidosis have cardiac involvement?
- 10%–20%
- 20%–30%
- 50%
- 80%
Cardiac involvement is seen in 20% to 30% of patients with sarcoidosis.5–7 However, most cases are subclinical, and symptomatic cardiac involvement is present in only about 5% of patients with systemic sarcoidosis.8 Isolated cardiac sarcoidosis has been described in case reports but is rare.9
The clinical manifestations of cardiac sarcoidosis depend on the location and extent of granulomatous inflammation. In a necropsy study of 113 patients with cardiac sarcoidosis, the left ventricular free wall was the most common location, followed by the interventricular septum.10
3. How does cardiac sarcoidosis most commonly present?
- Conduction abnormalities
- Ventricular tachycardia
- Cardiomyopathy
- Sudden death
- None of the above
Common presentations of cardiac sarcoidosis include conduction system disease and arrhythmias (which can sometimes result in sudden death), and heart failure.
Conduction abnormalities due to granulomas (in the active phase of sarcoidosis) and fibrosis (in the fibrotic phase) in the atrioventricular node or bundle of His are the most common presentation of cardiac sarcoidosis.9 These lesions may result in relatively benign first-degree heart block or may be as potentially devastating as complete heart block.
In almost all patients with conduction abnormalities, the basal interventricular septum is involved.11 Patients who develop complete heart block from sarcoidosis tend to be younger than those with idiopathic heart block. Therefore, complete heart block in a young patient should raise the possibility of this diagnosis. 12
Ventricular tachycardia (sustained or nonsustained) and ventricular premature beats are the second most common presentation. Up to 22% of patients with sarcoidosis have electrocardiographic evidence of ventricular arrythmias. 13 The cause is believed to be myocardial scar tissue resulting from the sarcoid granulomas, leading to electrical reentry.14 Sudden death due to ventricular tachyarrhythmias or conduction blocks accounts for 25% to 65% of deaths from cardiac sarcoidosis.9,15,16
Heart failure may result from sarcoidosis when there is extensive granulomatous disease in the myocardium. Depending on the location of the granulomas, both systolic and diastolic dysfunction can occur. In severe cases, extensive granulomas can cause left ventricular aneurysms.
The diagnosis of cardiac sarcoidosis as the cause of heart failure can be difficult to establish, especially in patients without evidence of sarcoidosis elsewhere. Such patients are often given a diagnosis of idiopathic dilated cardiomyopathy. However, compared with patients with idiopathic dilated cardiomyopathy, those with cardiac sarcoidosis have a greater incidence of advanced atrioventricular block, abnormal wall thickness, focal wall motion abnormalities, and perfusion defects of the anteroseptal and apical regions.17
Progressive heart failure is the second most frequent cause of death (after sudden death) and accounts for 25% to 75% of sarcoid-related cardiac deaths.9,18,19
DIAGNOSING CARDIAC SARCOIDOSIS
4. How is cardiac sarcoidosis diagnosed?
- Electrocardiography
- Echocardiography
- Computed tomography
- Endomyocardial biopsy
- There are no guidelines for diagnosis
Given the variable extent and location of granulomas in sarcoidosis, the diagnosis of cardiac sarcoidosis is often challenging.
To make the diagnosis of sarcoidosis in general, the American Thoracic Society2 says that the clinical picture should be compatible with this diagnosis, noncaseating granulomas should be histologically confirmed, and other diseases capable of producing a similar clinical or histologic picture should be excluded.
A newer diagnostic tool, the Sarcoidosis Three-Dimensional Assessment Instrument,20 incorporates two earlier tools.20,21 It assesses three axes: organ involvement, sarcoidosis severity, and sarcoidosis activity and categorizes the diagnosis of sarcoidosis as “definite,” “probable,” or “possible.”20
In Japan, where sarcoidosis is more common, the Ministry of Health and Welfare22 says that cardiac sarcoidosis can be diagnosed histologically if operative or endomyocardial biopsy specimens contain noncaseating granuloma. In addition, the diagnosis can be suspected in patients who have a histologic diagnosis of extracardiac sarcoidosis if the first item in the list below and one or more of the rest are present:
- Complete right bundle branch block, left axis deviation, atrioventricular block, ventricular tachycardia, premature ventricular contractions (> grade 2 of the Lown classification), or Q or ST-T wave abnormalities
- Abnormal wall motion, regional wall thinning, or dilation of the left ventricle on echocardiography
- Perfusion defects on thallium 201 myocardial scintigraphy or abnormal accumulation of gallium citrate Ga 67 or technetium 99m on myocardial scintigraphy
- Abnormal intracardiac pressure, low cardiac output, or abnormal wall motion or depressed left ventricular ejection fraction on cardiac catheterization
- Nonspecific interstitial fibrosis or cellular infiltration on myocardial biopsy.
The current diagnostic guidelines from the American Thoracic Society2 and the Japanese Ministry of Health and Welfare22 and the Sarcoidosis Three-Dimensional Assessment Instrument,20 however, do not incorporate newer imaging studies as part of their criteria.
A DEFINITIVE DIAGNOSIS
5. Endomyocardial biopsy often provides the definitive diagnosis of cardiac sarcoidosis.
- True
- False
False. Endomyocardial biopsy often fails to reveal noncaseating granulomas, which have a patchy distribution.13 Table 2 summarizes the accuracy of tests for cardiac sarcoidosis.
Electrocardiography is abnormal in up to 50% of patients with sarcoidosis,23 reflecting the conduction disease or arrhythmias commonly seen in cardiac involvement.
Chest radiography classically shows hilar lymphadenopathy and interstitial disease, and may show cardiomegaly, pericardial effusion, or left ventricular aneurysm.
Echocardiography is nonspecific for sarcoid disease, but granulomatous involvement and scar tissue of cardiac tissue may appear hyperechogenic, particularly in the ventricular septum or left ventricular free wall.24
Angiography. Primary sarcoidosis rarely involves the coronary arteries,25 so angiography is most useful in excluding the diagnosis of atherosclerotic coronary artery disease.
Radionuclide imaging with thallium 201 in patients with suspected cardiac sarcoidosis may be useful to suggest myocardial involvement and to exclude cardiac dysfunction secondary to coronary artery disease. Segmental areas with defective thallium 201 uptake correspond to fibrogranulomatous tissue. In resting images, the pattern may be similar to that seen in coronary artery disease. However, during exercise, perfusion defects increase in patients who have ischemia but actually decrease in those with cardiac sarcoidosis.26
Nevertheless, some conclude that thallium scanning is too nonspecific for it to be used as a diagnostic or screening test.27,28 The combined use of thallium 201 and gallium 67 may better detect cardiac sarcoidosis, as gallium is taken up in areas of active inflammation.
Positron-emission tomography (PET) with fluorodeoxyglucose F 18 (FDG), with the patient fasting, appears to be useful in detecting the early inflammation of cardiac sarcoidosis29–34 and monitoring disease activity.30,31 FDG is a glucose analogue that is taken up by granulomatous tissue in the myocardium.34 The uptake in cardiac sarcoidosis is in a focal distribution.30,31,34 The abnormal FDG uptake resolves with steroid treatment.31,32
MRI has promise for diagnosing cardiac sarcoidosis. With gadolinium contrast, MRI has superior image resolution and can detect cardiac involvement early in its course.27,29,35–44
Inflammation of the myocardium due to sarcoid involvement appears as focal zones of increased signal intensity on both T2-weighted and early gadolinium T1-weighted images. Late myocardial enhancement after gadolinium infusion is the most typical finding of cardiac sarcoidosis on MRI, and likely represents fibrogranulomatous tissue.27 Delayed gadolinium enhancement is also seen in myocardial infarction but differs in its distribution.1,35,45 Cardiac sarcoidosis most commonly affects the basal and lateral segments. In one study, the finding of delayed enhancement had a sensitivity of 100% and a specificity of 78%,1,27 though it may not sufficiently differentiate active inflammation from scar.30
Like FDG-PET, MRI has also been shown to be useful for monitoring treatment.33,46 However, PET is more useful for follow-up in patients who receive a pacemaker or implantable cardioverter-defibrillator, in whom MRI is contraindicated. One case report29 described using both delayed-enhancement MRI and FDG-PET to diagnose cardiac sarcoidosis.
TREATMENT
6. How is cardiac sarcoidosis currently treated?
- Implantable cardioverter-defibrillator
- Corticosteroids
- Heart transplantation
- All of the above
- None of the above
Corticosteroids
Corticosteroids are the mainstay of treatment of cardiac sarcoidosis, as they attenuate the characteristic inflammation and fibrosis of sarcoid granulomas. The goal is to prevent compromise of cardiac structure or function.47 Although most of the supporting data are anecdotal, steroids have been shown to improve ventricular contractility,48 arrhythmias,49 and conduction abnormalities.50 MRI and FDG-PET studies have shown cardiac lesions resolving after steroids were started.31,45,46
The optimal dosage remains unknown. Initial doses of 30 to 60 mg daily, gradually tapered over 6 to 12 months to maintenance doses of 5 to 10 mg daily, have been effective.45,51
Relapses are common and require vigilant monitoring.
Alternative agents such as cyclophosphamide (Cytoxan),52 methotrexate (Rheumatrex), 53 and cyclosporine (Sandimmune)54 can be given to patients whose disease does not respond to corticosteroids or who cannot tolerate their side effects.
Implantable cardioverter-defibrillator
Sudden death due to ventricular tachyarrhythmias or conduction block accounts for 30% to 65% of deaths in patients with cardiac sarcoidosis.10 The rates of recurrent ventricular tachycardia and sudden death are high, even with antiarrhythmic drug therapy.55
Although experience with implantable cardiac defibrillators is limited in patients with cardiac sarcoidosis,55–58 some have argued that they be strongly considered to prevent sudden cardiac death in this high-risk group.57,58
Heart transplantation
The largest body of data on transplantation comes from the United Network for Organ Sharing database. In the 65 patients with cardiac sarcoidosis who underwent cardiac transplantation in the 18 years from October 1987 to September 2005, the 1-year post-transplant survival rate was 88%, which was better than in patients with all other diagnoses (85%). The 5-year survival rate was 80%.59,60
Recurrence of sarcoidosis within the cardiac allograft and transmission of sarcoidosis from donor to recipient have both been documented after heart transplantation.61,62
CAUSES OF DEATH
7. What is the most common cause of death in patients with cardiac sarcoidosis?
- Respiratory failure
- Conduction disturbances
- Progressive heart failure
- Ventricular tachyarrhythmias
- None of the above
The prognosis of symptomatic cardiac sarcoidosis is not well defined, owing to the variable extent and severity of the disease. The mortality rate in sarcoidosis without cardiac involvement is about 1% to 5% per year.63,64 Cardiac involvement portends a worse prognosis, with a 55% survival rate at 5 years and 44% at 10 years.17,65 Most patients in the reported series ultimately died of cardiac complications of sarcoidosis, including ventricular tachyarrhythmias, conduction disturbances, and progressive cardiomyopathy.10,17
Since corticosteroids, pacemakers, and implantable cardioverter-defibrillators have begun to be used, the cause of death has shifted from sudden death to progressive heart failure.66
CASE CONTINUED
Electrophysiologic testing revealed inducible monomorphic sustained ventricular tachycardia. The patient subsequently had a biventricular cardioverter-defibrillator implanted. He was started on an angiotensin-converting enzyme inhibitor and a beta-blocker for his heart failure. Further imaging of his chest and abdomen revealed lesions in his thyroid and liver. As of this writing, he is undergoing further workup. Because of active infection with Clostridium difficile, steroid therapy was deferred.
- Smedema JP, Snoep G, van Kroonenburgh MP, et al. Evaluation of the accuracy of gadolinium-enhanced cardiovascular magnetic resonance in the diagnosis of cardiac sarcoidosis. J Am Coll Cardiol 2005; 45:1683–1690.
- Statement on sarcoidosis. Joint statement of the American Thoracic Society (ATS), the European Respiratory Society (ERS) and the World Association of Sarcoidosis and Other Granulomatous Disorders (WASOG) adopted by the ATS Board of Directors and by the ERS Executive Committee, February 1999. Am J Respir Crit Care Med 1999; 160:736–755.
- Rybicki BA, Major M, Popovich J, Maliarik MJ, Iannuzzi MC. Racial differences in sarcoidosis incidence: a 5-year study in a health maintenance organization. Am J Epidemiol 1997; 145:234–241.
- Matsui Y, Iwai K, Tachibana T, et al. Clinicopathological study of fatal myocardial sarcoidosis. Ann NY Acad Sci 1976; 278:455–469.
- Chapelon-Abric C, de Zuttere D, Duhaut P, et al. Cardiac sarcoidosis: a retrospective study of 41 cases. Medicine (Baltimore) 2004; 83:315–334.
- Iwai K, Sekiguti M, Hosoda Y, et al. Racial difference in cardiac sarcoidosis incidence observed at autopsy. Sarcoidosis 1994; 11:26–31.
- Thomsen TK, Eriksson T. Myocardial sarcoidosis in forensic medicine. Am J Forensic Med Pathol 1999; 20:52–56.
- Silverman KJ, Hutchins GM, Buckley BH. Cardiac sarcoid: a clinicopathologic study of 84 unselected patients with systemic sarcoidosis. Circulation 1978; 58:1204–1211.
- Roberts WC, McAllister HA, Ferrans VJ. Sarcoidosis of the heart. A clinicopathologic study of 35 necropsy patients (group 1) and review of 78 previously described necropsy patients (group 11). Am J Med 1977; 63:86–108.
- Bargout R, Kelly R. Sarcoid heart disease: clinical course and treatment. Int J Cardiol 2004; 97:173–182.
- Abeler V. Sarcoidosis of the cardiac conducting system. Am Heart J 1979; 97:701–707.
- Fleming HA, Bailey SM. Sarcoid heart disease. J R Coll Physicians Lond 1981; 15:245–253.
- Sekiguchi M, Numao Y, Imai M, Furuie T, Mikami R. Clinical and histological profile of sarcoidosis of the heart and acute idiopathic myocarditis. Concepts through a study employing endomyocardial biopsy. I. Sarcoidosis. Jpn Circ J 1980; 44:249–263.
- Furushima H, Chinushi M, Sugiura H, Kasai H, Washizuka T, Aizawa Y. Ventricular tachyarrhythmia associated with cardiac sarcoidosis: its mechanisms and outcome. Clin Cardiol 2004; 27:217–222.
- Yazaki Y, Isobe M, Hiroe M, et al. Prognostic determinants of long-term survival in Japanese patients with cardiac sarcoidosis treated with prednisone. Am J Cardiol 2001; 88:1006–1010.
- Reuhl J, Schneider M, Sievert H, Lutz FU, Zieger G. Myocardial sarcoidosis as a rare cause of sudden cardiac death. Forensic Sci Int 1997; 89:145–153.
- Yazaki Y, Isobe M, Hiramitsu S, et al. Comparison of clinical features and prognosis of cardiac sarcoidosis and idiopathic dilated cardiomyopathy. Am J Cardiol 1998; 82:537–540.
- Fleming H. Cardiac sarcoidosis. In:James DG, editor. Sarcoidosis and Other Granulomatous Disorders. New York, NY: Dekker 1994; 73:323–334.
- Padilla M. Cardiac sarcoidosis. In:Baughman R, editor. Lung Biology in Health and Disease (Sarcoidosis), vol 210. New York, NY: Taylor & Francis Group; 2006:515–552.
- Judson MA. A proposed solution to the clinical assessment of sarcoidosis: the sarcoidosis three-dimensional assessment instrument (STAI). Med Hypotheses 2007; 68:1080–1087.
- Judson MA, Baughman RP, Teirstein AS, Terrin ML, Yeager H. Defining organ involvement in sarcoidosis: the ACCESS proposed instrument. ACCESS Research Group. A case control etiologic study of sarcoidosis. Sarcoidosis Vasc Diffuse Lung Dis 1999; 16:75–86.
- Hiraga H, Yuwai K, Hiroe M, et al. Guideline for diagnosis of cardiac sarcoidosis. Study report of diffuse pulmonary diseases. Tokyo, Japan: The Japanese Ministry of Health and Welfare, 1993:23–24 (in Japanese).
- Stein E, Jackler I, Stimmel B, Stein W, Siltzbach LE. Asymptomatic electrocardiographic alterations in sarcoidosis. Am Heart J 1973; 86:474–477.
- Fahy GJ, Marwick T, McCreery CJ, Quigley PJ, Maurer BJ. Doppler echocardiographic detection of left ventricular diastolic dysfunction in patients with pulmonary sarcoidosis. Chest 1996; 109:62–66.
- Butany J, Bahl NE, Morales K, et al. The intricacies of cardiac sarcoidosis: a case report involving the coronary arteries and a review of the literature. Cardiovasc Pathol 2006; 15:222–227.
- Haywood LJ, Sharma OP, Siegel ME, et al. Detection of myocardial sarcoidosis by thallium-201 imaging. J Natl Med Assoc 1982; 74:959–964.
- Tadamura E, Yamamuro M, Kubo S, et al. Effectiveness of delayed enhanced MRI for identification of cardiac sarcoidosis: comparison with radionuclide imaging. AJR Am J Roentgenol 2005; 185:110–115.
- Kinney EL, Caldwell JW. Do thallium myocardial perfusion scan abnormalities predict survival in sarcoid patients without cardiac symptoms? Angiology 1990; 41:573–576.
- Pandya C, Brunken RC, Tchou P, Schoenhagen P, Culver DA. Detecting cardiac involvement in sarcoidosis: a call for prospective studies of newer imaging techniques. Eur Respir J 2007; 29:418–422.
- Ohira H, Tsujino I, Ishimaru S, et al. Myocardial imaging with 18F-fluoro-2-deoxyglucose positron emission tomography and magnetic resonance imaging in sarcoidosis. Eur J Nucl Med Mol Imaging 2008; 35:933–941.
- Yamagishi H, Shirai N, Takagi M, et al. Identification of cardiac sarcoidosis with 13N-NH3/18F-FDG PET. J Nucl Med 2003; 44:1030–1036.
- Takeda N, Yokoyama I, Hiroi Y, et al. Positron emission tomography predicted recovery of complete A-V nodal dysfunction in a patient with cardiac sarcoidosis. Circulation 2002; 105:1144–1145.
- Ishimaru S, Tsujino I, Takei T, et al. Focal uptake on 18F-fluoro-2-deoxyglucose positron emission tomography images indicates cardiac involvement of sarcoidosis. Eur Heart J 2005; 26:1538–1543.
- Okumura W, Iwasaki T, Toyama T, et al. Usefulness of fasting 18F-FDG PET in identification of cardiac sarcoidosis. J Nucl Med 2004; 45:1989–1998.
- Schulz-Menger J, Wassmuth R, Abdel-Aty H, et al. Patterns of myocardial inflammation and scarring in sarcoidosis as assessed by cardiovascular magnetic resonance. Heart 2006; 92:399–400.
- Kiuchi S, Teraoka K, Koizumi K, Takazawa K, Yamashina A. Usefulness of late gadolinium enhancement combined with MRI and 67-Ga scintigraphy in the diagnosis of cardiac sarcoidosis and disease activity evaluation. Int J Cardiovasc Imaging 2007; 23:237–241.
- Matsuki M, Matsuo M. MR findings of myocardial sarcoidosis. Clin Radiol 2000; 55:323–325.
- Inoue S, Shimada T, Murakami Y. Clinical significance of gadolinium-DTPA-enhanced MRI for detection of myocardial lesions in a patient with sarcoidosis. Clin Radiol 1999; 54:70–72.
- Vignaux O, Dhote R, Dudoc D, et al. Detection of myocardial involvement in patients with sarcoidosis applying T2-weighted, contrastenhanced, and cine magnetic resonance imaging: initial results of a prospective study. J Comput Assist Tomogr 2002; 26:762–767.
- Vignaux O. Cardiac sarcoidosis: spectrum of MRI features. AJR Am J Roentgenol 2005; 184:249–254.
- Smedema JP, Snoep G, Van Kroonenburgh MP, et al. Evaluation of the accuracy of gadolinium-enhanced cardiovascular magnetic resonance in the diagnosis of cardiac sarcoidosis. J Am Coll Cardiol 2005; 45:1683–1690.
- Doherty MJ, Kumar SK, Nicholson AA, McGivern DV. Cardiac sarcoidosis: the value of magnetic resonance imagine in diagnosis and assessment of response to treatment. Respir Med 1998; 92:697–699.
- Smedema JP, Truter R, de Klerk PA, Zaaiman L, White L, Doubell AF. Cardiac sarcoidosis evaluated with gadolinium-enhanced magnetic resonance and contrast-enhanced 64-slice computed tomography. Int J Cardiol 2006; 112:261–263.
- Kanao S, Tadamura E, Yamamuro M, et al. Demonstration of cardiac involvement of sarcoidosis by contrast-enhanced multislice computed tomography and delayed-enhanced magnetic resonance imaging. J Comput Assist Tomogr 2005; 29:745–748.
- Vignaux O, Dhote R, Duboc D, et al. Clinical significance of myocardial magnetic resonance abnormalities in patients with sarcoidosis: a 1-year follow-up study. Chest 2002; 122:1895–1901.
- Shimada T, Shimada K, Sakane T, et al. Diagnosis of cardiac sarcoidosis and evaluation of the effects of steroid therapy by gadolinium-DTPA-enhanced magnetic resonance imaging. Am J Med 2001; 110:520–527.
- Yazaki Y, Isobe M, Hiroe M, et al. Prognostic determinants of longterm survival in Japanese patients with cardiac sarcoidosis treated with prednisone. Am J Cardiol 2001; 88:1006–1010.
- Ishikawa T, Kondoh H, Nakagawa S, Koiwaya Y, Tanaka K. Steroid therapy in cardiac sarcoidosis. Increased left ventricular contractility concomitant with electrocardiographic improvement after prednisolone. Chest 1984; 85:445–447.
- Walsh MJ. Systemic sarcoidosis with refractory ventricular tachycardia and heart failure. Br Heart J 1978; 40:931–933.
- Lash R, Coker J, Wong BY. Treatment of heart block due to sarcoid heart disease. J Electrocardiol 1979; 12:325–329.
- Johns CJ, Schonfeld SA, Scott PP, Zachary JB, MacGregor MI. Longitudinal study of chronic sarcoidosis with low-dose maintenance corticosteroid therapy. Outcome and implications. Ann N Y Acad Sci 1986; 465:702–712.
- Demeter SL. Myocardial sarcoidosis unresponsive to steroids. Treatment with cyclophosphamide. Chest 1988; 94:202–203.
- Lower EE, Baughman RP. Prolonged use of methotrexate for sarcoidosis. Arch Intern Med 1995; 155:846–851.
- York EL, Kovithavongs T, Man SF, Rebuck AS, Sproule BJ. Cyclosporine and chronic sarcoidosis. Chest 1990; 98:1026–1029.
- Winters SL, Cohen M, Greenberg S, et al. Sustained ventricular tachycardia associated with sarcoidosis: assessment of the underlying cardiac anatomy and the prospective utility of programmed ventricular stimulation, drug therapy and an implantable antitachycardia device. J Am Coll Cardiol 1991; 18:937–943.
- Bajaj AK, Kopelman HA, Echt DS. Cardiac sarcoidosis with sudden death: treatment with automatic implantable cardioverter defibrillator. Am Heart J 1988; 116:557–560.
- Paz HL, McCormick DJ, Kutalek SP, Patchefsky A. The automated implantable cardiac defibrillator. Prophylaxis in cardiac sarcoidosis. Chest 1994; 106:1603–1607.
- Becker D, Berger E, Chmielewski C. Cardiac sarcoidosis: a report of four cases with ventricular tachycardia. J Cardiovasc Electrophysiol 1990; 1:214–219.
- Zaidi AR, Zaidi A, Vaitkus PT. Outcome of heart transplantation in patients with sarcoid cardiomyopathy. J Heart Lung Transplant 2007; 26:714–717.
- Valantine HA, Tazelaar HD, Macoviak J, et al. Cardiac sarcoidosis: response to steroids and transplantation. J Heart Transplant 1987; 6:244–250.
- Oni AA, Hershberger RE, Norman DJ, et al. Recurrence of sarcoidosis in a cardiac allograft: control with augmented corticosteroids. J Heart Lung Transplant 1992; 11:367–369.
- Burke WM, Keogh A, Maloney PJ, Delprado W, Bryant DH, Spratt P. Transmission of sarcoidosis via cardiac transplantation. Lancet 1990; 336:1579.
- Johns CJ, Schonfeld SA, Scott PP, Zachary JB, MacGregor MI. Longitudinal study of chronic sarcoidosis with low-dose maintenance corticosteroid therapy. Outcome and complications. Ann N Y Acad Sci 1986; 465:702–712.
- Gideon NM, Mannino DM. Sarcoidosis mortality in the United States 1979–1991: an analysis of multiple-cause mortality data. Am J Med 1996; 100:423–427.
- Fleming HA, Bailey SM. The prognosis of sarcoid heart disease in the United Kingdom. Ann N Y Acad Sci 1986; 465:543–550.
- Takada K, Ina Y, Yamamoto M, Satoh T, Morishita M. Prognosis after pacemaker implantation in cardiac sarcoidosis in Japan. Clinical evaluation of corticosteroid therapy. Sarcoidosis 1994; 11:113–117.
Update on 2009 pandemic influenza A (H1N1) virus
A 69-year-old ohio man with leukemia was treated in another state in late June. During the car trip back to Ohio, he developed a sore throat, fever, cough, and nasal congestion. He was admitted to Cleveland Clinic with a presumed diagnosis of neutropenic fever; his absolute neutrophil count was 0.4 × 10⁹/L (reference range 1.8–7.7). His chest radiograph was normal. He was treated with empiric broad-spectrum antimicrobials. On his second day in the hospital, he was tested for influenza by a polymerase chain reaction (PCR) test, which was positive for influenza A. He was moved to a private room and started on oseltamivir (Tamiflu) and rimantadine (Flumadine). The patient’s previous roommate subsequently tested positive for influenza A, as did two health care workers working on the ward. All patients on the floor received prophylactic oseltamivir.
The patient’s condition worsened, and he subsequently went into respiratory distress with diffuse pulmonary infiltrates. He was transferred to the intensive care unit, where he was intubated. Influenza A was isolated from a bronchoscopic specimen. He subsequently recovered after a prolonged course and was discharged on hospital day 50. Testing by the Ohio Department of Health confirmed that this was the 2009 pandemic influenza A (H1N1) virus.
THE CHALLENGES WE FACE
We are now in the midst of an influenza pandemic of the 2009 influenza A (H1N1) virus, with pandemic defined as “worldwide sustained community transmission.” The circulation of seasonal and 2009 pandemic influenza A (H1N1) strains will make this flu season both interesting and challenging.
The approaches to vaccination, prophylaxis, and treatment will be more complex. As of this writing (mid-September 2009), it is clear that we will be giving two influenza vaccines this season: a trivalent vaccine for seasonal influenza, and a monovalent vaccine for pandemic H1N1. It appears the monovalent vaccine may require only one dose to provide protective immunity.1 Fortunately, the vast majority of cases of pandemic H1N1 are relatively mild and uncomplicated. Still, some people are at higher risk of complications, including young patients, pregnant women, and people with immune deficiency or concomitant health conditions that put them at higher risk of flu-associated complications. Thus, clinicians will need to be educated about whom to test, who needs prophylaxis, and who should not be treated.
As our case demonstrates, unsuspected cases of influenza in hospitalized patients or health care workers working with influenza pose the greatest threat for transmission of influenza within the hospital. Adults hospitalized with influenza tend to present late (more than 48 hours after the onset of symptoms) and tend to have prolonged illness.2 Ambulatory adults shed virus for 3 to 6 days; virus shedding is more prolonged for hospitalized patients. Antiviral agents started within 4 days of illness enhance viral clearance and are associated with a shorter stay.3 Therefore, we should have a low threshold for testing for influenza and for isolating all suspected cases.
This is also creating a paradigm shift for health care workers, who are notorious for working through an illness. If you are sick, stay home! This applies whether you have pandemic H1N1 or something else.
EPIDEMIOLOGY OF PANDEMIC 2009 INFLUENZA A (H1N1) VIRUS
The location of cases can now be found on Google Maps; the US Centers for Disease Control and Prevention (CDC) provides weekly influenza reports at www.cdc.gov/flu/weekly/fluactivity.htm.
Pandemic H1N1 appeared in the spring of 2009, and cases continued to mount all summer in the United States (when influenza is normally absent) and around the world. In Mexico in March and April 2009, 2,155 cases of pneumonia, 821 hospitalizations, and 100 deaths were reported.4
In contrast with seasonal influenza, children and younger adults were hit the hardest in Mexico. The age group 5 through 59 years accounted for 87% of the deaths (usually, they account for about 17%) and 71% of the cases of severe pneumonia (usually, they account for 32%). These observations may be explained in part by the possibility that people who were alive during the 1957 pandemic (which was an H1N1 strain) have some immunity to the new virus. However, the case-fatality rate was highest in people age 65 and older.4
As of July 2009, there were more than 43,000 confirmed cases of pandemic H1N1 in the United States, and actual cases probably exceed 1 million, with more than 400 deaths. An underlying risk factor was identified in more than half of the fatal cases.5 Ten percent of the women who died were pregnant.
Pandemic H1N1 has several distinctive epidemiologic features:
- The distribution of cases is similar across multiple geographic areas.
- The distribution of cases by age group is markedly different than that of seasonal influenza, with more cases in school children and fewer cases in older adults.
- Fewer cases have been reported in older adults, but this group has the highest case-fatality rate.
2009 PANDEMIC H1N1 IS A MONGREL
There are three types of influenza viruses, designated A, B, and C. Type A undergoes antigenic shift (rapid changes) and antigenic drift (gradual changes) from year to year, and so it is the type associated with pandemics. In contrast, type B undergoes antigenic drift only, and type C is relatively stable.
Influenza virus is subtyped on the basis of surface glycoproteins: 16 hemagglutinins and nine neuraminidases. The circulating subtypes change every year; the current circulating human subtypes are a seasonal subtype of H1N1 that is different than the pandemic H1N1 subtype, and H3N2.
The 2009 pandemic H1N1 is a new virus never seen before in North America.6 Genetically, it is a mongrel, coming from three recognized sources (pigs, birds, and humans) which were combined in pigs.7 It is similar to subtypes that circulated in the 1920s through the 1940s.
Most influenza in the Western world comes from Asia every fall, and its arrival is probably facilitated by air travel. The spread is usually unidirectional and is unlikely to contribute to long-term viral evolution.8 It appears that 2009 H1N1 virus is the predominant strain circulating in the current influenza season in the Southern Hemisphere. Virologic studies indicate that the H1N1 virus strain has remained antigenically stable since it appeared in April 2009. Thus, it appears likely that the strain selected by the United States for vaccine manufacturing will match the currently circulating seasonal and pandemic H1N1 strains.
VACCINATION IS THE FIRST LINE OF DEFENSE
In addition to the trivalent vaccine against seasonal influenza, a monovalent vaccine for pandemic H1N1 virus is being produced. The CDC has indicated that 45 million doses of pandemic influenza vaccine are expected in October 2009, with an average of 20 million doses each week thereafter. It is anticipated that half of these will be in multidose vials, that 20% will be in prefilled syringes for children over 5 years old and for pregnant women, and that 20% will be in the form of live-attenuated influenza vaccine (nasal spray). The inhaled vaccine should not be given to children under 2 years old, to children under 5 years old who have recurrent wheezing, or to anyone with severe asthma. Neither vaccine should be given to people allergic to hen eggs, from which the vaccine is produced.
An ample supply of the seasonal trivalent vaccine should be available. Once the CDC has more information about specific product availability of the pandemic H1N1 vaccine, that vaccine will be distributed. It can be given concurrently with seasonal influenza vaccine.
Several definitions should be kept in mind when discussing vaccination strategies. Supply is the number of vaccine doses available for distribution. Availability is the ability of a person recommended to be vaccinated to do so in a local venue. Prioritization is the recommendation to vaccination venues to selectively use vaccine for certain population groups first. Targeting is the recommendation that immunization programs encourage and promote vaccination for certain population groups.
The Advisory Committee on Immunization Practices and the CDC recommend both seasonal and H1N1 vaccinations for anyone 6 months of age or older who is at risk of becoming ill or of transmitting the viruses to others. Based on a review of epidemiologic data, the recommendation is for targeting the following five groups for H1N1 vaccination: children and young adults aged 6 months through 24 years; pregnant women; health care workers and emergency medical service workers; people ages 25 through 64 years who have certain health conditions (eg, diabetes, heart disease, lung disease); and people who live with or care for children younger than 6 months of age. This represents approximately 159 million people in the United States.
If the estimates for the vaccine supply are met, and if pandemic H1N1 vaccine requires only a single injection, there should be no need for prioritization of vaccine. If the supply of pandemic H1N1 vaccine is inadequate, then those groups who are targeted would also receive the first doses of the pandemic H1N1 vaccine. It should be used only with caution after consideration of potential benefits and risks in people who have had Guillain-Barré syndrome during the previous 6 weeks, in people with altered immunocompetence, or in people with medical conditions predisposing to influenza complications.
A mass vaccination campaign involving two separate flu vaccines can pose challenges in execution and messaging for public health officials and politicians. In 1976, an aggressive vaccination program turned into a disaster, as there was no pandemic and the vaccine was associated with adverse effects such as Guillain-Barré syndrome. The government and the medical profession need to prepare for a vaccine controversy and to communicate and continue to explain the plan to the public. As pointed out in a recent op-ed piece,9 we would hope that all expectant women in the fall flu season will get the flu vaccines. We also know that, normally, one in seven pregnancies would be expected to miscarry. The challenge for public health officials and physicians will be to explain to these patients that there may be an association rather than a causal relationship.
In health care workers, the average vaccination rate is only 37%. We should be doing much better. Cleveland Clinic previously increased the rate of vaccination among its employees via a program in which all workers must either be vaccinated or formally declare (on an internal Web site) that they decline to be vaccinated.10 This season, even more resources are being directed at decreasing the barriers to flu vaccinations for our health care workers with the support from hospital leadership.
INFECTION CONTROL IN THE HOSPITAL AND IN THE COMMUNITY
Influenza is very contagious and is spread in droplets via sneezing and coughing (within a 3-foot radius), or via unwashed hands—thus the infection-control campaigns urging you to cover your cough and wash your hands.
As noted, for patients being admitted or transferred to the hospital, we need to have a low threshold for testing for influenza and for isolating patients suspected of having influenza. For patients with suspected or proven seasonal influenza, transmission precautions are those recommended by the CDC for droplet precautions (www.cdc.gov/ncidod/dhqp/gl_isolation_droplet.html). A face mask is deemed adequate to protect transmission when coming within 3 feet of an infected person. CDC guidelines for pandemic H1N1 recommends airborne-transmission-based precautions for health care workers who are in close contact with patients with proven or possible H1N1 (www.cdc.gov/ncidod/dhqp/gl_isolation_airborne.html). This recommendation implies the use of fit-tested N95 respirators and negative air pressure rooms (if available).
The recent Institute of Medicine report, Respiratory Protection for Healthcare Workers in the Workplace Against Novel H1N1 Influenza A (www.iom.edu/CMS/3740/71769/72967/72970.aspx) endorses the current CDC guidelines and recommends following these guidelines until we have evidence that other forms of protection or guidelines are equally or more effective.
Personally, I am against this requirement because it creates a terrible administrative burden with no proven benefit. Requiring a respirator means requiring fit-testing, and this will negatively affect our ability to deliver patient care. Recent studies have shown that surgical masks may not be as effective11 but are probably sufficient. Lim et al12 reported that 79 (37%) of 212 workers who responded to a survey experienced headaches while wearing N95 masks. This remains a controversial issue.
Besides getting the flu shot, what can one do to avoid getting influenza or transmitting to others?
- Cover your cough (cough etiquette) and sneeze.
- Practice good hand hygiene.
- Avoid close contact with people who are sick.
- Do not go to school or work if sick.
A recent study of influenza in households suggested that having the person with flu and household contacts wear face masks and practice hand hygiene within the first 36 hours decreased transmission of flu within the household.13
The United States does have a national influenza pandemic plan that outlines specific roles in the event of a pandemic, and I urge you to peruse it at www.hhs.gov/pandemicflu/plan/.
RECOGNIZING AND DIAGNOSING INFLUENZA
The familiar signs and symptoms of influenza—fever, cough, muscle aches, and headache—are nonspecific. Call et al14 analyzed the diagnostic accuracy of symptoms and signs of influenza and found that fever and cough during an epidemic suggest but do not confirm influenza, and that sneezing in those over age 60 argues against influenza. They concluded that signs and symptoms can tell us whether a patient has an influenza-like illness, but do not confirm or exclude the diagnosis of influenza: “Clinicians need to consider whether influenza is circulating in their communities, and then either treat patients with influenza-like illness empirically or obtain a rapid influenza test.”14
The signs and symptoms of pandemic 2009 H1N1 are the same as for seasonal flu, except that about 25% of patients with pandemic flu develop gastrointestinal symptoms. It has not been more virulent than seasonal influenza to date.
Should you order a test for influenza?
Most people with influenza are neither tested nor treated. Before ordering a test for influenza, ask, “Does this patient actually have influenza?” Patients diagnosed with “influenza” may have a range of infectious and noninfectious causes, such as vasculitis, endocarditis, or any other condition that can cause a fever and cough.
If I truly suspect influenza, I would still only order a test if the results would change how I manage the patient—for example, a patient being admitted to the hospital where isolation would be required.
Pandemic H1N1 will be detected only as influenza A in our current PCR screen for human influenza. The test does not differentiate between seasonal strains of influenza A (which is resistant to oseltamivir) and pandemic H1N1 (which is susceptible to oseltamivir). This means if you intend to treat, you will have to address further complexity.
Testing for influenza
The clinician should be familiar with the types of tests available. Each test has advantages and disadvantages15:
Rapid antigen assay is a point-of-care test that can give results in 15 minutes but unfortunately is only 20% to 30% sensitive, so a negative result does not exclude the diagnosis. The positive predictive value is high, meaning a positive test means the patient does have the flu.
Direct fluorescent antibody testing takes about 2.5 hours to complete and requires special training for technicians. It has a sensitivity of 47%, a positive predictive value of 95%, and a negative predictive value of 92%.
PCR testing takes about 6 hours and has a sensitivity of 98%, a positive predictive value of 100%, and a negative predictive value of 98%. This is probably the best test, in view of its all-around performance, but it is not a point-of-care test.
Culture takes 2 to 3 days, has a sensitivity of 89%, a positive predictive value of 100%, and a negative predictive value of 88%.
These tests can determine that the patient has influenza A, but a confirmatory test is always required to confirm pandemic H1N1. This confirmatory testing can be done by the CDC, by state public health laboratories, and by commercial reference laboratories.
ANTIVIRAL TREATMENT
Since influenza test results do not specify whether the patient has seasonal or pandemic influenza, treatment decisions are a sticky wicket. Most patients with pandemic H1N1 do not need to be tested or treated.
Several drugs are approved for treating influenza and shorten the duration of symptoms by about 1 day. The earlier the treatment is started, the better: the time of antiviral initiation affects influenza viral load and the duration of viral shedding.3
The neuraminidase inhibitors oseltamivir and zanamivir (Relenza) block release of virus from the cell. Resistance to oseltamivir is emerging in seasonal influenza A, while most pandemic H1N1 strains are susceptible.
Oseltamivir resistance in pandemic H1N1
A total of 11 cases of oseltamivir-resistant pandemic H1N1 have been confirmed worldwide, including 3 in the United States (2 in immunosuppressed patients in Seattle, WA). Ten of the 11 cases occurred with oseltamivir exposure. All involved a histidine-to-tyrosine substitution at position 275 (H275Y) of the neuraminidase gene. Most were susceptible to zanamivir.
Supplies of oseltamivir and zanamivir are limited, so they should be used only in those who will benefit the most, ie, those at higher risk of influenza complications. These include children under 5 years old, adults age 65 and older, children and adolescents on long-term aspirin therapy, pregnant women, patients who have chronic conditions or who are immunosuppressed, and residents of long-term care facilities.
- Greenberg MA, Lai MH, Hartel GF. Response after one dose of a monovalent influenza A (H1N1) 2009 vaccine—preliminary report. N Engl J Med 2009;361doi:10.1056/NEJMoa0907413 [published online ahead of print].
- Ison M. Influenza in hospitalized adults: gaining insight into a significant problem. J Infect Dis 2009; 200:485–488.
- Lee N, Chan PKS, Hui DSC, et al. Viral loads and duration of viral shedding in adult patients hospitalized with influenza. J Infect Dis 2009; 200:492–500.
- Chowell G, Bertozzi SM, Colchero MA, et al. Severe respiratory disease concurrent with the circulation of H1N1 influenza. N Engl J Med 2009; 361:674–679.
- Vaillant L, La Ruche G, Tarantola A, Barboza P; for the Epidemic Intelligence Team at InVS. Epidemiology of fatal cases associated with pandemic H1N1 influenza 2009. Euro Surveill 2009; 14(33):1–6. Available online at www.eurosurveillance.org/ViewArticle.aspx?ArticleID=19309.
- Zimmer SM, Burke DS. Historical perspective—emergence of influenza A (H1N1) viruses. N Engl J Med 2009; 361:279–285.
- Garten RJ, Davis CT, Russell CA, et al. Antigenic and genetic characteristics of swine-origin 2009 A(H1N1) influenza viruses circulating in humans. Science 2009; 325:197–201.
- Russell CA, Jones TC, Barr IG, et al. The global circulation of seasonal influenza A (H3N2) viruses. Science 2008; 320:340–346.
- Allen A. Prepare for a vaccine controversy. New York Times. 9/1/2009.
- Bertin M, Scarpelli M, Proctor AW, et al. Novel use of the intranet to document health care personnel participation in a mandatory influenza vaccination reporting program. Am J Infect Control 2007; 35:33–37.
- Johnson DF, Druce JD, Birch C, Grayson ML. A quantitative assessment of the efficacy of surgical and N95 masks to filter influenza virus in patients with acute influenza infection. Clin Infect Dis 2009; 49:275–277.
- Lim EC, Seet RC, Lee KH, Wilder-Smith EP, Chuah BY, Ong BK. Headaches and the N95 face-mask amongst healthcare providers. Acta Neurol Scand 2006; 113:199–202.
- Cowling BJ, Chan KH, Fang VJ, et al. Facemasks and hand hygiene to prevent influenza transmission in households: a randomized trial. Ann Intern Med 2009; 151(6 Oct) [published online ahead of print].
- Call SA, Vollenweider MA, Hornung CA, Simel DL, McKinney WP. Does this patient have influenza? JAMA 2005; 293:987–997.
- Ginocchio CC, Zhang F, Manji R, et al. Evaluation of multiple test methods for the detection of the novel 2009 influenza A (H1N1) during the New York City outbreak. J Clin Virol 2009; 45:191–195.
- US Centers for Disease Control and Prevention. Oseltamivir-resistant novel influenza A (H1N1) virus infection in two immunosuppressed patients—Seattle, Washington, 2009. MMWR 2009; 58:893–896.
A 69-year-old ohio man with leukemia was treated in another state in late June. During the car trip back to Ohio, he developed a sore throat, fever, cough, and nasal congestion. He was admitted to Cleveland Clinic with a presumed diagnosis of neutropenic fever; his absolute neutrophil count was 0.4 × 10⁹/L (reference range 1.8–7.7). His chest radiograph was normal. He was treated with empiric broad-spectrum antimicrobials. On his second day in the hospital, he was tested for influenza by a polymerase chain reaction (PCR) test, which was positive for influenza A. He was moved to a private room and started on oseltamivir (Tamiflu) and rimantadine (Flumadine). The patient’s previous roommate subsequently tested positive for influenza A, as did two health care workers working on the ward. All patients on the floor received prophylactic oseltamivir.
The patient’s condition worsened, and he subsequently went into respiratory distress with diffuse pulmonary infiltrates. He was transferred to the intensive care unit, where he was intubated. Influenza A was isolated from a bronchoscopic specimen. He subsequently recovered after a prolonged course and was discharged on hospital day 50. Testing by the Ohio Department of Health confirmed that this was the 2009 pandemic influenza A (H1N1) virus.
THE CHALLENGES WE FACE
We are now in the midst of an influenza pandemic of the 2009 influenza A (H1N1) virus, with pandemic defined as “worldwide sustained community transmission.” The circulation of seasonal and 2009 pandemic influenza A (H1N1) strains will make this flu season both interesting and challenging.
The approaches to vaccination, prophylaxis, and treatment will be more complex. As of this writing (mid-September 2009), it is clear that we will be giving two influenza vaccines this season: a trivalent vaccine for seasonal influenza, and a monovalent vaccine for pandemic H1N1. It appears the monovalent vaccine may require only one dose to provide protective immunity.1 Fortunately, the vast majority of cases of pandemic H1N1 are relatively mild and uncomplicated. Still, some people are at higher risk of complications, including young patients, pregnant women, and people with immune deficiency or concomitant health conditions that put them at higher risk of flu-associated complications. Thus, clinicians will need to be educated about whom to test, who needs prophylaxis, and who should not be treated.
As our case demonstrates, unsuspected cases of influenza in hospitalized patients or health care workers working with influenza pose the greatest threat for transmission of influenza within the hospital. Adults hospitalized with influenza tend to present late (more than 48 hours after the onset of symptoms) and tend to have prolonged illness.2 Ambulatory adults shed virus for 3 to 6 days; virus shedding is more prolonged for hospitalized patients. Antiviral agents started within 4 days of illness enhance viral clearance and are associated with a shorter stay.3 Therefore, we should have a low threshold for testing for influenza and for isolating all suspected cases.
This is also creating a paradigm shift for health care workers, who are notorious for working through an illness. If you are sick, stay home! This applies whether you have pandemic H1N1 or something else.
EPIDEMIOLOGY OF PANDEMIC 2009 INFLUENZA A (H1N1) VIRUS
The location of cases can now be found on Google Maps; the US Centers for Disease Control and Prevention (CDC) provides weekly influenza reports at www.cdc.gov/flu/weekly/fluactivity.htm.
Pandemic H1N1 appeared in the spring of 2009, and cases continued to mount all summer in the United States (when influenza is normally absent) and around the world. In Mexico in March and April 2009, 2,155 cases of pneumonia, 821 hospitalizations, and 100 deaths were reported.4
In contrast with seasonal influenza, children and younger adults were hit the hardest in Mexico. The age group 5 through 59 years accounted for 87% of the deaths (usually, they account for about 17%) and 71% of the cases of severe pneumonia (usually, they account for 32%). These observations may be explained in part by the possibility that people who were alive during the 1957 pandemic (which was an H1N1 strain) have some immunity to the new virus. However, the case-fatality rate was highest in people age 65 and older.4
As of July 2009, there were more than 43,000 confirmed cases of pandemic H1N1 in the United States, and actual cases probably exceed 1 million, with more than 400 deaths. An underlying risk factor was identified in more than half of the fatal cases.5 Ten percent of the women who died were pregnant.
Pandemic H1N1 has several distinctive epidemiologic features:
- The distribution of cases is similar across multiple geographic areas.
- The distribution of cases by age group is markedly different than that of seasonal influenza, with more cases in school children and fewer cases in older adults.
- Fewer cases have been reported in older adults, but this group has the highest case-fatality rate.
2009 PANDEMIC H1N1 IS A MONGREL
There are three types of influenza viruses, designated A, B, and C. Type A undergoes antigenic shift (rapid changes) and antigenic drift (gradual changes) from year to year, and so it is the type associated with pandemics. In contrast, type B undergoes antigenic drift only, and type C is relatively stable.
Influenza virus is subtyped on the basis of surface glycoproteins: 16 hemagglutinins and nine neuraminidases. The circulating subtypes change every year; the current circulating human subtypes are a seasonal subtype of H1N1 that is different than the pandemic H1N1 subtype, and H3N2.
The 2009 pandemic H1N1 is a new virus never seen before in North America.6 Genetically, it is a mongrel, coming from three recognized sources (pigs, birds, and humans) which were combined in pigs.7 It is similar to subtypes that circulated in the 1920s through the 1940s.
Most influenza in the Western world comes from Asia every fall, and its arrival is probably facilitated by air travel. The spread is usually unidirectional and is unlikely to contribute to long-term viral evolution.8 It appears that 2009 H1N1 virus is the predominant strain circulating in the current influenza season in the Southern Hemisphere. Virologic studies indicate that the H1N1 virus strain has remained antigenically stable since it appeared in April 2009. Thus, it appears likely that the strain selected by the United States for vaccine manufacturing will match the currently circulating seasonal and pandemic H1N1 strains.
VACCINATION IS THE FIRST LINE OF DEFENSE
In addition to the trivalent vaccine against seasonal influenza, a monovalent vaccine for pandemic H1N1 virus is being produced. The CDC has indicated that 45 million doses of pandemic influenza vaccine are expected in October 2009, with an average of 20 million doses each week thereafter. It is anticipated that half of these will be in multidose vials, that 20% will be in prefilled syringes for children over 5 years old and for pregnant women, and that 20% will be in the form of live-attenuated influenza vaccine (nasal spray). The inhaled vaccine should not be given to children under 2 years old, to children under 5 years old who have recurrent wheezing, or to anyone with severe asthma. Neither vaccine should be given to people allergic to hen eggs, from which the vaccine is produced.
An ample supply of the seasonal trivalent vaccine should be available. Once the CDC has more information about specific product availability of the pandemic H1N1 vaccine, that vaccine will be distributed. It can be given concurrently with seasonal influenza vaccine.
Several definitions should be kept in mind when discussing vaccination strategies. Supply is the number of vaccine doses available for distribution. Availability is the ability of a person recommended to be vaccinated to do so in a local venue. Prioritization is the recommendation to vaccination venues to selectively use vaccine for certain population groups first. Targeting is the recommendation that immunization programs encourage and promote vaccination for certain population groups.
The Advisory Committee on Immunization Practices and the CDC recommend both seasonal and H1N1 vaccinations for anyone 6 months of age or older who is at risk of becoming ill or of transmitting the viruses to others. Based on a review of epidemiologic data, the recommendation is for targeting the following five groups for H1N1 vaccination: children and young adults aged 6 months through 24 years; pregnant women; health care workers and emergency medical service workers; people ages 25 through 64 years who have certain health conditions (eg, diabetes, heart disease, lung disease); and people who live with or care for children younger than 6 months of age. This represents approximately 159 million people in the United States.
If the estimates for the vaccine supply are met, and if pandemic H1N1 vaccine requires only a single injection, there should be no need for prioritization of vaccine. If the supply of pandemic H1N1 vaccine is inadequate, then those groups who are targeted would also receive the first doses of the pandemic H1N1 vaccine. It should be used only with caution after consideration of potential benefits and risks in people who have had Guillain-Barré syndrome during the previous 6 weeks, in people with altered immunocompetence, or in people with medical conditions predisposing to influenza complications.
A mass vaccination campaign involving two separate flu vaccines can pose challenges in execution and messaging for public health officials and politicians. In 1976, an aggressive vaccination program turned into a disaster, as there was no pandemic and the vaccine was associated with adverse effects such as Guillain-Barré syndrome. The government and the medical profession need to prepare for a vaccine controversy and to communicate and continue to explain the plan to the public. As pointed out in a recent op-ed piece,9 we would hope that all expectant women in the fall flu season will get the flu vaccines. We also know that, normally, one in seven pregnancies would be expected to miscarry. The challenge for public health officials and physicians will be to explain to these patients that there may be an association rather than a causal relationship.
In health care workers, the average vaccination rate is only 37%. We should be doing much better. Cleveland Clinic previously increased the rate of vaccination among its employees via a program in which all workers must either be vaccinated or formally declare (on an internal Web site) that they decline to be vaccinated.10 This season, even more resources are being directed at decreasing the barriers to flu vaccinations for our health care workers with the support from hospital leadership.
INFECTION CONTROL IN THE HOSPITAL AND IN THE COMMUNITY
Influenza is very contagious and is spread in droplets via sneezing and coughing (within a 3-foot radius), or via unwashed hands—thus the infection-control campaigns urging you to cover your cough and wash your hands.
As noted, for patients being admitted or transferred to the hospital, we need to have a low threshold for testing for influenza and for isolating patients suspected of having influenza. For patients with suspected or proven seasonal influenza, transmission precautions are those recommended by the CDC for droplet precautions (www.cdc.gov/ncidod/dhqp/gl_isolation_droplet.html). A face mask is deemed adequate to protect transmission when coming within 3 feet of an infected person. CDC guidelines for pandemic H1N1 recommends airborne-transmission-based precautions for health care workers who are in close contact with patients with proven or possible H1N1 (www.cdc.gov/ncidod/dhqp/gl_isolation_airborne.html). This recommendation implies the use of fit-tested N95 respirators and negative air pressure rooms (if available).
The recent Institute of Medicine report, Respiratory Protection for Healthcare Workers in the Workplace Against Novel H1N1 Influenza A (www.iom.edu/CMS/3740/71769/72967/72970.aspx) endorses the current CDC guidelines and recommends following these guidelines until we have evidence that other forms of protection or guidelines are equally or more effective.
Personally, I am against this requirement because it creates a terrible administrative burden with no proven benefit. Requiring a respirator means requiring fit-testing, and this will negatively affect our ability to deliver patient care. Recent studies have shown that surgical masks may not be as effective11 but are probably sufficient. Lim et al12 reported that 79 (37%) of 212 workers who responded to a survey experienced headaches while wearing N95 masks. This remains a controversial issue.
Besides getting the flu shot, what can one do to avoid getting influenza or transmitting to others?
- Cover your cough (cough etiquette) and sneeze.
- Practice good hand hygiene.
- Avoid close contact with people who are sick.
- Do not go to school or work if sick.
A recent study of influenza in households suggested that having the person with flu and household contacts wear face masks and practice hand hygiene within the first 36 hours decreased transmission of flu within the household.13
The United States does have a national influenza pandemic plan that outlines specific roles in the event of a pandemic, and I urge you to peruse it at www.hhs.gov/pandemicflu/plan/.
RECOGNIZING AND DIAGNOSING INFLUENZA
The familiar signs and symptoms of influenza—fever, cough, muscle aches, and headache—are nonspecific. Call et al14 analyzed the diagnostic accuracy of symptoms and signs of influenza and found that fever and cough during an epidemic suggest but do not confirm influenza, and that sneezing in those over age 60 argues against influenza. They concluded that signs and symptoms can tell us whether a patient has an influenza-like illness, but do not confirm or exclude the diagnosis of influenza: “Clinicians need to consider whether influenza is circulating in their communities, and then either treat patients with influenza-like illness empirically or obtain a rapid influenza test.”14
The signs and symptoms of pandemic 2009 H1N1 are the same as for seasonal flu, except that about 25% of patients with pandemic flu develop gastrointestinal symptoms. It has not been more virulent than seasonal influenza to date.
Should you order a test for influenza?
Most people with influenza are neither tested nor treated. Before ordering a test for influenza, ask, “Does this patient actually have influenza?” Patients diagnosed with “influenza” may have a range of infectious and noninfectious causes, such as vasculitis, endocarditis, or any other condition that can cause a fever and cough.
If I truly suspect influenza, I would still only order a test if the results would change how I manage the patient—for example, a patient being admitted to the hospital where isolation would be required.
Pandemic H1N1 will be detected only as influenza A in our current PCR screen for human influenza. The test does not differentiate between seasonal strains of influenza A (which is resistant to oseltamivir) and pandemic H1N1 (which is susceptible to oseltamivir). This means if you intend to treat, you will have to address further complexity.
Testing for influenza
The clinician should be familiar with the types of tests available. Each test has advantages and disadvantages15:
Rapid antigen assay is a point-of-care test that can give results in 15 minutes but unfortunately is only 20% to 30% sensitive, so a negative result does not exclude the diagnosis. The positive predictive value is high, meaning a positive test means the patient does have the flu.
Direct fluorescent antibody testing takes about 2.5 hours to complete and requires special training for technicians. It has a sensitivity of 47%, a positive predictive value of 95%, and a negative predictive value of 92%.
PCR testing takes about 6 hours and has a sensitivity of 98%, a positive predictive value of 100%, and a negative predictive value of 98%. This is probably the best test, in view of its all-around performance, but it is not a point-of-care test.
Culture takes 2 to 3 days, has a sensitivity of 89%, a positive predictive value of 100%, and a negative predictive value of 88%.
These tests can determine that the patient has influenza A, but a confirmatory test is always required to confirm pandemic H1N1. This confirmatory testing can be done by the CDC, by state public health laboratories, and by commercial reference laboratories.
ANTIVIRAL TREATMENT
Since influenza test results do not specify whether the patient has seasonal or pandemic influenza, treatment decisions are a sticky wicket. Most patients with pandemic H1N1 do not need to be tested or treated.
Several drugs are approved for treating influenza and shorten the duration of symptoms by about 1 day. The earlier the treatment is started, the better: the time of antiviral initiation affects influenza viral load and the duration of viral shedding.3
The neuraminidase inhibitors oseltamivir and zanamivir (Relenza) block release of virus from the cell. Resistance to oseltamivir is emerging in seasonal influenza A, while most pandemic H1N1 strains are susceptible.
Oseltamivir resistance in pandemic H1N1
A total of 11 cases of oseltamivir-resistant pandemic H1N1 have been confirmed worldwide, including 3 in the United States (2 in immunosuppressed patients in Seattle, WA). Ten of the 11 cases occurred with oseltamivir exposure. All involved a histidine-to-tyrosine substitution at position 275 (H275Y) of the neuraminidase gene. Most were susceptible to zanamivir.
Supplies of oseltamivir and zanamivir are limited, so they should be used only in those who will benefit the most, ie, those at higher risk of influenza complications. These include children under 5 years old, adults age 65 and older, children and adolescents on long-term aspirin therapy, pregnant women, patients who have chronic conditions or who are immunosuppressed, and residents of long-term care facilities.
- Greenberg MA, Lai MH, Hartel GF. Response after one dose of a monovalent influenza A (H1N1) 2009 vaccine—preliminary report. N Engl J Med 2009;361doi:10.1056/NEJMoa0907413 [published online ahead of print].
- Ison M. Influenza in hospitalized adults: gaining insight into a significant problem. J Infect Dis 2009; 200:485–488.
- Lee N, Chan PKS, Hui DSC, et al. Viral loads and duration of viral shedding in adult patients hospitalized with influenza. J Infect Dis 2009; 200:492–500.
- Chowell G, Bertozzi SM, Colchero MA, et al. Severe respiratory disease concurrent with the circulation of H1N1 influenza. N Engl J Med 2009; 361:674–679.
- Vaillant L, La Ruche G, Tarantola A, Barboza P; for the Epidemic Intelligence Team at InVS. Epidemiology of fatal cases associated with pandemic H1N1 influenza 2009. Euro Surveill 2009; 14(33):1–6. Available online at www.eurosurveillance.org/ViewArticle.aspx?ArticleID=19309.
- Zimmer SM, Burke DS. Historical perspective—emergence of influenza A (H1N1) viruses. N Engl J Med 2009; 361:279–285.
- Garten RJ, Davis CT, Russell CA, et al. Antigenic and genetic characteristics of swine-origin 2009 A(H1N1) influenza viruses circulating in humans. Science 2009; 325:197–201.
- Russell CA, Jones TC, Barr IG, et al. The global circulation of seasonal influenza A (H3N2) viruses. Science 2008; 320:340–346.
- Allen A. Prepare for a vaccine controversy. New York Times. 9/1/2009.
- Bertin M, Scarpelli M, Proctor AW, et al. Novel use of the intranet to document health care personnel participation in a mandatory influenza vaccination reporting program. Am J Infect Control 2007; 35:33–37.
- Johnson DF, Druce JD, Birch C, Grayson ML. A quantitative assessment of the efficacy of surgical and N95 masks to filter influenza virus in patients with acute influenza infection. Clin Infect Dis 2009; 49:275–277.
- Lim EC, Seet RC, Lee KH, Wilder-Smith EP, Chuah BY, Ong BK. Headaches and the N95 face-mask amongst healthcare providers. Acta Neurol Scand 2006; 113:199–202.
- Cowling BJ, Chan KH, Fang VJ, et al. Facemasks and hand hygiene to prevent influenza transmission in households: a randomized trial. Ann Intern Med 2009; 151(6 Oct) [published online ahead of print].
- Call SA, Vollenweider MA, Hornung CA, Simel DL, McKinney WP. Does this patient have influenza? JAMA 2005; 293:987–997.
- Ginocchio CC, Zhang F, Manji R, et al. Evaluation of multiple test methods for the detection of the novel 2009 influenza A (H1N1) during the New York City outbreak. J Clin Virol 2009; 45:191–195.
- US Centers for Disease Control and Prevention. Oseltamivir-resistant novel influenza A (H1N1) virus infection in two immunosuppressed patients—Seattle, Washington, 2009. MMWR 2009; 58:893–896.
KEY POINTS
- Vaccination this season will require two vaccines: a trivalent vaccine for seasonal influenza and a monovalent vaccine for 2009 pandemic influenza A (H1N1).
- Recent studies indicate that the monovalent vaccine for 2009 pandemic influenza A (H1N1) may require only one injection.
- To date, 2009 pandemic influenza A (H1N1) virus has not been exceptionally virulent and differs from conventional influenza in that it seems to disproportionately affect children and young adults. Pregnant women are at a higher risk of complications.
- Most people with 2009 pandemic influenza A (H1N1) do not need to be tested, treated, or seen by a clinician.
- Antiviral drugs should be reserved only for those at high risk of influenza complications.
VHA Facilities Improve Colonoscope Reprocessing Compliance
Grand Rounds: Woman, 39, With Leg Weakness After Exercise Class
A 39-year-old woman presented to the emergency department (ED) with a chief complaint of muscle aches and pain. She stated that three days earlier, she had begun exercising in a 45-minute “spinning” class (ie, riding a stationary bicycle with a weighted front wheel). The patient had not engaged in any aerobic exercise for at least six months before the spinning class. She mentioned that much older participants in the class were outperforming her, but she did not feel the need to keep up with them.
After dismounting, the woman said, she experienced weakness in her legs and had great difficulty ambulating. She went home, took 400 mg of ibuprofen, and went to bed. She awoke with pain and swelling in both thighs and continued to take ibuprofen, in addition to applying a topical mentholated preparation to her thighs. She took an Epsom salts bath two days later.
On the morning of the third day after the spinning class, she voided black urine and presented to the ED.
The patient had no significant medical history. Surgical history was limited to removal of a ganglion cyst on her wrist. She denied any history of seizure disorder, thyroid disease, hepatitis, heart disease, or hyperlipidemia.
The patient had been taking ibuprofen as needed since the spinning class. She was taking no other medications. She denied any allergies to drugs or food.
The patient admitted to smoking one pack of cigarettes per week and to occasional alcohol consumption but denied use of illicit drugs. She was employed as an executive officer for a large business association.
On physical examination, the patient’s vital signs were blood pressure, 134/73 mm/Hg; pulse, 86 beats/min; and respirations, 16 breaths/min. She was afebrile, alert, and oriented. Her sclera were nonicteric. Her neck was supple with no anterior cervical lymphadenopathy. There was no thyroid enlargement, her lungs were clear to auscultation, and her heart sounds were regular. There was no peripheral edema, and dorsalis pedis pulses were present bilaterally. Her thighs appeared swollen but were not tender to palpation.
The patient’s history, combined with an extremely high level of serum creatine phosphokinase (CPK; ie, 123,800 U/L [reference range, 45 to 260 U/L1]), confirmed a diagnosis of rhabdomyolysis. She was admitted for close observation. The patient’s urinalysis revealed 2 to 5 red blood cells and 6 to 10 white blood cells per high-power field. Moderate occult blood was detected, with no casts or protein noted. A urine myoglobin test was not performed.
The patient underwent IV hydration with dextrose 5% in water and three ampules of sodium bicarbonate after being given a 2.0-L saline bolus. Ibuprofen was discontinued. IV hydration with bicarbonate solution was continued until the patient’s CPK level declined significantly. She underwent daily laboratory testing (see Table 1). Her renal function remained stable, and she was discharged on hospital day 7.
DISCUSSION
Rhabdomyolysis is a clinical condition defined as muscle necrosis resulting from the release of intracellular skeletal muscle components (including myoglobin, CPK, potassium, phosphorus, and aldolase) into the extracellular compartment.1-3 The condition was first described during the bombing of London in World War II, with high incidence of crush injuries, shock, and associated kidney damage.4 The preponderance of such injuries during a 1988 earthquake in Armenia led the International Society of Nephrology to form its Renal Disaster Relief Task Force, which has provided support at numerous other disaster scenes since then.5
Rhabdomyolysis has been identified with a variety of pathologic events: those that cause muscle trauma, those associated with muscle use or overuse, and other etiologies involving genetic, metabolic, infectious, or pharmaceutical factors.1 Many of the reported causes of rhabdomyolysis are listed in Table 2.1,2
For patients with muscle trauma, the etiology of rhabdomyolysis is clear, but for those with other disease states, diagnosis may be more elusive. Patients who present with rhabdomyolysis after excessive exercise, for example, may have underlying metabolic disorders that predispose them to exertional rhabdomyolysis, such as chronic hypokalemia resulting from primary hyperaldosteronism.1 Others may have a muscle enzyme deficiency, as in McArdle’s syndrome or carnitine deficiency.6
Alterations in blood chemistries can also contribute to development of rhabdomyolysis, even when more obvious etiologies for muscle necrosis are evident. Hypokalemia interferes with the vasodilation that normally occurs during exercise to increase muscle blood flow.1,7,8 Continued exercise can lead to muscle necrosis, raising a concern for athletes who take diuretics.1 Hypophosphatemia leads to a state of muscle necrosis; this is of particular concern for alcoholic patients who receive hyperalimentation without repletion of phosphates.9
Diagnosis
Patients with rhabdomyolysis usually present with myalgias, darkened urine (red, brown, or black), and a clinical scenario that corroborates the diagnosis (ie, history of trauma, excessive exercise, use of an offending medication).1 Some patients may have minimal to absent symptoms or symptoms that occur only after exercise.3
A careful history is key. While traumatic causes are obvious, it is important to ask a patient with rhabdomyolysis after exertion about previous history of excessive weakness during or immediately after exercise, excessive cramping, or discoloration of urine after exercise. The family history may point to a genetic abnormality. A thorough understanding of the patient’s use of medications, including OTC agents, is also important. Rhabdomyolysis has been reported in patients who use herbal remedies, including those taken to facilitate weight loss or to improve lipid profiles.10,11
For patients suspected of having rhabdomyolysis, a serum CPK level should be obtained; results exceeding normal values by five times confirm the diagnosis.3 Measurements for potassium, phosphorus, and calcium are also important to determine, as is renal function. A high level of serum aldolase (an enzyme that breaks down glucose in muscle tissue) can also support a diagnosis of rhabdomyolysis.1,12 Urinalysis and urine myoglobin testing are also warranted, although a negative urine myoglobin test result does not rule out rhabdomyolysis in the presence of an elevated CPK level. Myoglobin is cleared rapidly by the kidneys, whereas serum CPK levels change slowly.1
Any patient who presents with acute rhabdomyolysis and low to normal values for potassium or phosphate should be evaluated further for hypokalemia and hypophosphatemia as contributing or etiologic factors. Hypocalcemia may occur in the early course of rhabdomyolysis as calcium salt is deposited in muscle tissue. Patients recovering from rhabdomyolysis may experience rebound hypercalcemia as the damaged muscle releases the deposited calcium.7,13
In most cases of rhabdomyolysis, only laboratory values are needed to make the diagnosis and follow the course of the episode.1 However, when the etiology appears to involve metabolic deficiencies or genetic etiologies, it may become necessary to order additional diagnostic tests. These may include tests for thyroid function, a carnitine level to screen for glycogen storage diseases, and toxin screening (eg, for illicit drugs, such as cocaine).2,6
Treatment and Management
Effective treatment of rhabdomyolysis relies on recognizing the underlying disorder.1 For patients with muscle trauma (eg, crush injury) or muscle overuse, the mainstay of treatment is aggressive fluid resuscitation and prevention of acute injury to the kidneys.13 As for patients with an injury induced by a pharmaceutical agent or a toxin, removal of the offending agent is required, followed by hydration and prevention of renal damage. Supportive care during an infectious illness is also essential.14
Additionally, treatment must address the complications inherent with rhabdomyolysis.1 In addition to CPK, potassium, phosphorus, and myoglobin are also released from skeletal muscle tissue. Hyperkalemia can be fatal, and potassium levels must be monitored closely to avert this condition.7,8,13 During an episode of rhabdomyolysis, normal levels of both potassium and phosphorus should raise the clinician’s suspicion for underlying hypokalemia and hypophosphatemia—conditions that may have contributed to the episode of rhabdomyolysis. Hypocalcemia may also develop.13
Released myoglobin may cause acute kidney injury, as is the case in 33% to 50% of patients with rhabdomyolysis.3 In early studies, it was determined that alkalinizing the urine with IV isotonic bicarbonate might thwart onset of acute kidney injury.1,2,15 Time is critical, and even on the battlefield or at the scene of a recent disaster, most attempts at resuscitation are begun immediately. IV access may be problematic, but administration of oral bicarbonate solutions has also proven effective.15 Close follow-up of the serum urea and creatinine levels and measurement of the urine pH during alkalinization is warranted throughout the course of the episode.
Unfortunately, some patients respond poorly to these conservative measures, and the released myoglobin can cause renal tubular blockage and necrosis, resulting in acute kidney injury.1 Renal replacement therapy may be required.16 However, most episodes of dialysis-dependent acute renal injury do subside with time.
For patients with less elusive causes of rhabdomyolysis, treatment will hinge on a workup of the possible etiologies and follow-up treatment to target the apparent cause. For example, carnitine may be administered to patients with carnitine deficiency, and hypokalemic patients may be given potassium.1,6,7 These patients will also need counseling before they consider engaging in an exercise program.
Patient’s Outcome
The case patient presented with exertional rhabdomyolysis; improper hydration, severe deconditioning, and a relatively low serum potassium level may all have contributed to the muscle necrosis she experienced. She was given IV alkaline solutions and did not develop acute kidney injury. She was discharged from the hospital and at the time of this writing was awaiting outpatient follow-up.
It should be interesting to see whether the case patient experiences any further episodes of severe weakness after engaging in exercise. Her low-normal potassium level (reference range, 3.5 to 5.3 mmol/L17) warrants further follow-up, as does her mildly elevated thyroid-stimulating hormone level (reference range, 0.5 to 4.7 mcIU/mL17).
CONCLUSION
Patients with rhabdomyolysis may present with muscle aches, darkened urine, and/or weakness; an elevated CPK level confirms the diagnosis. Management is mainly conservative, with IV hydration accompanied by alkalinizing the urine and correcting any metabolic abnormalities, such as potassium deficiencies. For the few patients who experience severe acute kidney injury, renal replacement therapy may be necessary.
While most causes of rhabdomyolysis have obvious clinical scenarios, such as a crush injury, a search for muscle enzyme deficiencies, disorders of potassium homeostasis, and thyroid abnormalities is also warranted in patients who present with exertional rhabdomyolysis.
1. Huerta-Alardín AL, Varon J, Marik PE. Bench-to-bedside review: rhabdomyolysis—an overview for clinicians. Crit Care. 2005;9(2):158-169.
2. Warren JD, Blumbergs PC, Thompson PD. Rhabdomyolysis: a review. Muscle Nerve. 2002;25(3):332-347.
3. Lima RSA, da Silva GB Jr, Liborio AB, Daher ED. Acute kidney injury due to rhabdomyolysis. Saudi J Kidney Dis Transpl. 2008;19(5):721-729.
4. Bywaters EG, Beall D. Crush injuries with impairment of renal function [reprinted from BMJ, 1941]. J Am Soc Nephrol. 1998;9(2):322-332.
5. Vanholder R, Van Biesen W, Lameire N, Sever MS; International Society of Nephrology/Renal Disaster Relief Task Force. The role of the International Society of Nephrology/Renal Disaster Relief Task Force in the rescue of renal disaster victims. Contrib Nephrol. 2007;156:325-332.
6. Toledo R, López V, Martín G, et al. Rhabdomyolysis due to enzyme deficiency in muscles. Nefrología. 2009;29(1):77-80.
7. Agrawal S, Agrawal V, Taneja A. Hypokalemia causing rhabdomyolysis resulting in life-threatening hyperkalemia. Pediatr Nephrol. 2006;221(2): 289-291.
8. Knochel JP, Schlein EM. On the mechanism of rhabdomyolysis in potassium depletion. J Clin Invest. 1972:51(7):1750-1758.
9. Knochel JP. Hypophosphatemia and rhabdomyolysis. Am J Med. 1992;92(5):455-457.
10. Mansi IA, Huang J. Rhabdomyolysis in response to weight-loss herbal medicine. Am J Med Sci. 2004; 327(6): 356-357.
11. Heber D, Yip I, Ashley JM, et al. Cholesterol-lowering effects of a proprietary Chinese red-yeast-rice dietary supplement. Am J Clin Nutr. 1999;69(2): 231-236.
12. Hooda AK, Narula AS. Exertional rhabdomyolysis causing acute renal failure. Med J Armed Forces India. 2005;61(4):395-396.
13. Chatzizisis YS, Misirli G, Hatzitolios AI, Giannoglou GD. The syndrome of rhabdomyolysis: complications and treatment. Eur J Intern Med. 2008;19(8): 568-574.
14. Blanco JR, Zabalza M, Salcedo J, et al. Rhabdomyolysis of infectious and noninfectious causes. South Med J. 2002;95(5):542-544.
15. Ron D, Taitelman U, Michaelson M, et al. Prevention of acute renal failure in traumatic rhabdomyolysis. Arch Intern Med. 1984;144(2):277-280.
16. Soni SS, Nagarik AP, Adikey GK, Raman A. Using continuous renal replacement therapy to manage patients of shock and acute renal failure. J Emerg Trauma Shock. 2009;2(1):19-22.
17. Normal laboratory values. In: Beers MH, Berkow R, eds. The Merck Manual of Diagnosis and Therapy. 17th ed. Whitehouse Station, NJ: Merck Research Laboratories; 1999:2526-2546.
A 39-year-old woman presented to the emergency department (ED) with a chief complaint of muscle aches and pain. She stated that three days earlier, she had begun exercising in a 45-minute “spinning” class (ie, riding a stationary bicycle with a weighted front wheel). The patient had not engaged in any aerobic exercise for at least six months before the spinning class. She mentioned that much older participants in the class were outperforming her, but she did not feel the need to keep up with them.
After dismounting, the woman said, she experienced weakness in her legs and had great difficulty ambulating. She went home, took 400 mg of ibuprofen, and went to bed. She awoke with pain and swelling in both thighs and continued to take ibuprofen, in addition to applying a topical mentholated preparation to her thighs. She took an Epsom salts bath two days later.
On the morning of the third day after the spinning class, she voided black urine and presented to the ED.
The patient had no significant medical history. Surgical history was limited to removal of a ganglion cyst on her wrist. She denied any history of seizure disorder, thyroid disease, hepatitis, heart disease, or hyperlipidemia.
The patient had been taking ibuprofen as needed since the spinning class. She was taking no other medications. She denied any allergies to drugs or food.
The patient admitted to smoking one pack of cigarettes per week and to occasional alcohol consumption but denied use of illicit drugs. She was employed as an executive officer for a large business association.
On physical examination, the patient’s vital signs were blood pressure, 134/73 mm/Hg; pulse, 86 beats/min; and respirations, 16 breaths/min. She was afebrile, alert, and oriented. Her sclera were nonicteric. Her neck was supple with no anterior cervical lymphadenopathy. There was no thyroid enlargement, her lungs were clear to auscultation, and her heart sounds were regular. There was no peripheral edema, and dorsalis pedis pulses were present bilaterally. Her thighs appeared swollen but were not tender to palpation.
The patient’s history, combined with an extremely high level of serum creatine phosphokinase (CPK; ie, 123,800 U/L [reference range, 45 to 260 U/L1]), confirmed a diagnosis of rhabdomyolysis. She was admitted for close observation. The patient’s urinalysis revealed 2 to 5 red blood cells and 6 to 10 white blood cells per high-power field. Moderate occult blood was detected, with no casts or protein noted. A urine myoglobin test was not performed.
The patient underwent IV hydration with dextrose 5% in water and three ampules of sodium bicarbonate after being given a 2.0-L saline bolus. Ibuprofen was discontinued. IV hydration with bicarbonate solution was continued until the patient’s CPK level declined significantly. She underwent daily laboratory testing (see Table 1). Her renal function remained stable, and she was discharged on hospital day 7.
DISCUSSION
Rhabdomyolysis is a clinical condition defined as muscle necrosis resulting from the release of intracellular skeletal muscle components (including myoglobin, CPK, potassium, phosphorus, and aldolase) into the extracellular compartment.1-3 The condition was first described during the bombing of London in World War II, with high incidence of crush injuries, shock, and associated kidney damage.4 The preponderance of such injuries during a 1988 earthquake in Armenia led the International Society of Nephrology to form its Renal Disaster Relief Task Force, which has provided support at numerous other disaster scenes since then.5
Rhabdomyolysis has been identified with a variety of pathologic events: those that cause muscle trauma, those associated with muscle use or overuse, and other etiologies involving genetic, metabolic, infectious, or pharmaceutical factors.1 Many of the reported causes of rhabdomyolysis are listed in Table 2.1,2
For patients with muscle trauma, the etiology of rhabdomyolysis is clear, but for those with other disease states, diagnosis may be more elusive. Patients who present with rhabdomyolysis after excessive exercise, for example, may have underlying metabolic disorders that predispose them to exertional rhabdomyolysis, such as chronic hypokalemia resulting from primary hyperaldosteronism.1 Others may have a muscle enzyme deficiency, as in McArdle’s syndrome or carnitine deficiency.6
Alterations in blood chemistries can also contribute to development of rhabdomyolysis, even when more obvious etiologies for muscle necrosis are evident. Hypokalemia interferes with the vasodilation that normally occurs during exercise to increase muscle blood flow.1,7,8 Continued exercise can lead to muscle necrosis, raising a concern for athletes who take diuretics.1 Hypophosphatemia leads to a state of muscle necrosis; this is of particular concern for alcoholic patients who receive hyperalimentation without repletion of phosphates.9
Diagnosis
Patients with rhabdomyolysis usually present with myalgias, darkened urine (red, brown, or black), and a clinical scenario that corroborates the diagnosis (ie, history of trauma, excessive exercise, use of an offending medication).1 Some patients may have minimal to absent symptoms or symptoms that occur only after exercise.3
A careful history is key. While traumatic causes are obvious, it is important to ask a patient with rhabdomyolysis after exertion about previous history of excessive weakness during or immediately after exercise, excessive cramping, or discoloration of urine after exercise. The family history may point to a genetic abnormality. A thorough understanding of the patient’s use of medications, including OTC agents, is also important. Rhabdomyolysis has been reported in patients who use herbal remedies, including those taken to facilitate weight loss or to improve lipid profiles.10,11
For patients suspected of having rhabdomyolysis, a serum CPK level should be obtained; results exceeding normal values by five times confirm the diagnosis.3 Measurements for potassium, phosphorus, and calcium are also important to determine, as is renal function. A high level of serum aldolase (an enzyme that breaks down glucose in muscle tissue) can also support a diagnosis of rhabdomyolysis.1,12 Urinalysis and urine myoglobin testing are also warranted, although a negative urine myoglobin test result does not rule out rhabdomyolysis in the presence of an elevated CPK level. Myoglobin is cleared rapidly by the kidneys, whereas serum CPK levels change slowly.1
Any patient who presents with acute rhabdomyolysis and low to normal values for potassium or phosphate should be evaluated further for hypokalemia and hypophosphatemia as contributing or etiologic factors. Hypocalcemia may occur in the early course of rhabdomyolysis as calcium salt is deposited in muscle tissue. Patients recovering from rhabdomyolysis may experience rebound hypercalcemia as the damaged muscle releases the deposited calcium.7,13
In most cases of rhabdomyolysis, only laboratory values are needed to make the diagnosis and follow the course of the episode.1 However, when the etiology appears to involve metabolic deficiencies or genetic etiologies, it may become necessary to order additional diagnostic tests. These may include tests for thyroid function, a carnitine level to screen for glycogen storage diseases, and toxin screening (eg, for illicit drugs, such as cocaine).2,6
Treatment and Management
Effective treatment of rhabdomyolysis relies on recognizing the underlying disorder.1 For patients with muscle trauma (eg, crush injury) or muscle overuse, the mainstay of treatment is aggressive fluid resuscitation and prevention of acute injury to the kidneys.13 As for patients with an injury induced by a pharmaceutical agent or a toxin, removal of the offending agent is required, followed by hydration and prevention of renal damage. Supportive care during an infectious illness is also essential.14
Additionally, treatment must address the complications inherent with rhabdomyolysis.1 In addition to CPK, potassium, phosphorus, and myoglobin are also released from skeletal muscle tissue. Hyperkalemia can be fatal, and potassium levels must be monitored closely to avert this condition.7,8,13 During an episode of rhabdomyolysis, normal levels of both potassium and phosphorus should raise the clinician’s suspicion for underlying hypokalemia and hypophosphatemia—conditions that may have contributed to the episode of rhabdomyolysis. Hypocalcemia may also develop.13
Released myoglobin may cause acute kidney injury, as is the case in 33% to 50% of patients with rhabdomyolysis.3 In early studies, it was determined that alkalinizing the urine with IV isotonic bicarbonate might thwart onset of acute kidney injury.1,2,15 Time is critical, and even on the battlefield or at the scene of a recent disaster, most attempts at resuscitation are begun immediately. IV access may be problematic, but administration of oral bicarbonate solutions has also proven effective.15 Close follow-up of the serum urea and creatinine levels and measurement of the urine pH during alkalinization is warranted throughout the course of the episode.
Unfortunately, some patients respond poorly to these conservative measures, and the released myoglobin can cause renal tubular blockage and necrosis, resulting in acute kidney injury.1 Renal replacement therapy may be required.16 However, most episodes of dialysis-dependent acute renal injury do subside with time.
For patients with less elusive causes of rhabdomyolysis, treatment will hinge on a workup of the possible etiologies and follow-up treatment to target the apparent cause. For example, carnitine may be administered to patients with carnitine deficiency, and hypokalemic patients may be given potassium.1,6,7 These patients will also need counseling before they consider engaging in an exercise program.
Patient’s Outcome
The case patient presented with exertional rhabdomyolysis; improper hydration, severe deconditioning, and a relatively low serum potassium level may all have contributed to the muscle necrosis she experienced. She was given IV alkaline solutions and did not develop acute kidney injury. She was discharged from the hospital and at the time of this writing was awaiting outpatient follow-up.
It should be interesting to see whether the case patient experiences any further episodes of severe weakness after engaging in exercise. Her low-normal potassium level (reference range, 3.5 to 5.3 mmol/L17) warrants further follow-up, as does her mildly elevated thyroid-stimulating hormone level (reference range, 0.5 to 4.7 mcIU/mL17).
CONCLUSION
Patients with rhabdomyolysis may present with muscle aches, darkened urine, and/or weakness; an elevated CPK level confirms the diagnosis. Management is mainly conservative, with IV hydration accompanied by alkalinizing the urine and correcting any metabolic abnormalities, such as potassium deficiencies. For the few patients who experience severe acute kidney injury, renal replacement therapy may be necessary.
While most causes of rhabdomyolysis have obvious clinical scenarios, such as a crush injury, a search for muscle enzyme deficiencies, disorders of potassium homeostasis, and thyroid abnormalities is also warranted in patients who present with exertional rhabdomyolysis.
1. Huerta-Alardín AL, Varon J, Marik PE. Bench-to-bedside review: rhabdomyolysis—an overview for clinicians. Crit Care. 2005;9(2):158-169.
2. Warren JD, Blumbergs PC, Thompson PD. Rhabdomyolysis: a review. Muscle Nerve. 2002;25(3):332-347.
3. Lima RSA, da Silva GB Jr, Liborio AB, Daher ED. Acute kidney injury due to rhabdomyolysis. Saudi J Kidney Dis Transpl. 2008;19(5):721-729.
4. Bywaters EG, Beall D. Crush injuries with impairment of renal function [reprinted from BMJ, 1941]. J Am Soc Nephrol. 1998;9(2):322-332.
5. Vanholder R, Van Biesen W, Lameire N, Sever MS; International Society of Nephrology/Renal Disaster Relief Task Force. The role of the International Society of Nephrology/Renal Disaster Relief Task Force in the rescue of renal disaster victims. Contrib Nephrol. 2007;156:325-332.
6. Toledo R, López V, Martín G, et al. Rhabdomyolysis due to enzyme deficiency in muscles. Nefrología. 2009;29(1):77-80.
7. Agrawal S, Agrawal V, Taneja A. Hypokalemia causing rhabdomyolysis resulting in life-threatening hyperkalemia. Pediatr Nephrol. 2006;221(2): 289-291.
8. Knochel JP, Schlein EM. On the mechanism of rhabdomyolysis in potassium depletion. J Clin Invest. 1972:51(7):1750-1758.
9. Knochel JP. Hypophosphatemia and rhabdomyolysis. Am J Med. 1992;92(5):455-457.
10. Mansi IA, Huang J. Rhabdomyolysis in response to weight-loss herbal medicine. Am J Med Sci. 2004; 327(6): 356-357.
11. Heber D, Yip I, Ashley JM, et al. Cholesterol-lowering effects of a proprietary Chinese red-yeast-rice dietary supplement. Am J Clin Nutr. 1999;69(2): 231-236.
12. Hooda AK, Narula AS. Exertional rhabdomyolysis causing acute renal failure. Med J Armed Forces India. 2005;61(4):395-396.
13. Chatzizisis YS, Misirli G, Hatzitolios AI, Giannoglou GD. The syndrome of rhabdomyolysis: complications and treatment. Eur J Intern Med. 2008;19(8): 568-574.
14. Blanco JR, Zabalza M, Salcedo J, et al. Rhabdomyolysis of infectious and noninfectious causes. South Med J. 2002;95(5):542-544.
15. Ron D, Taitelman U, Michaelson M, et al. Prevention of acute renal failure in traumatic rhabdomyolysis. Arch Intern Med. 1984;144(2):277-280.
16. Soni SS, Nagarik AP, Adikey GK, Raman A. Using continuous renal replacement therapy to manage patients of shock and acute renal failure. J Emerg Trauma Shock. 2009;2(1):19-22.
17. Normal laboratory values. In: Beers MH, Berkow R, eds. The Merck Manual of Diagnosis and Therapy. 17th ed. Whitehouse Station, NJ: Merck Research Laboratories; 1999:2526-2546.