User login
Palliative-Care Payment
Many hospitalists provide palliative-care services to patients at the request of physicians within their own groups or from other specialists. Varying factors affect how hospitalists report these services—namely, the nature of the request and the type of service provided. Palliative-care programs can be quite costly as they involve several team members and a substantial amount of time delivering these services. Capturing services appropriately and obtaining reimbursement to help continue program initiatives is pertinent.
Nature of the Request
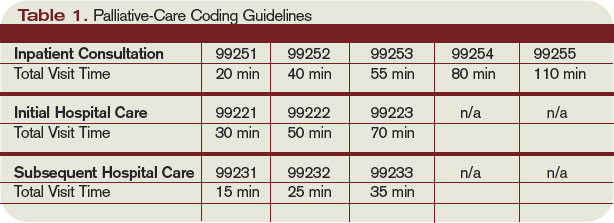
Members of a palliative-care team often are called on to provide management options to assist in reducing pain and suffering associated with both terminal and nonterminal disease, thereby improving a patient’s quality of life. When a palliative-care specialist is asked to provide an opinion or advice, the initial service could qualify as a consultation. However, all requirements must be met in order to report the service as an inpatient consultation (codes 99251-99255).
There must be a written request from a qualified healthcare provider involved in the patient’s care (e.g., a physician, resident, or nurse practitioner). In the inpatient setting, this request can be documented as a physician order or in the assessment of the requesting provider’s progress note. Standing orders for consultation are not permitted. Ideally, the requesting provider should identify the reason for a consult to support the medical necessity of the service.
Additionally, the palliative-care physician renders and documents the service, then reports findings to the requesting physician. The consultant’s required written report does not have to be sent separately to the requesting physician. Because the requesting physician and the consultant share a common medical record in an inpatient setting, the consultant’s inpatient progress note suffices the “written report” requirement.
One concern about billing consultations involves the nature of the request. If the requesting physician documents the need for an opinion or advice from the palliative-care specialist, the service can be reported as a consultation. If, however, the request states consult for “medical management” or “palliative management,” it’s less likely that payors will consider the service a consultation. In the latter situation, it appears as if the requesting physician is not seeking an opinion or advice from the consultant to incorporate into his own plan of care for the patient and would rather the consultant take over that portion of patient care.
Recently revised billing policies prevent the consultant from billing consults under these circumstances. Without a sufficient request for consultation, the palliative-care specialist can only report “subsequent” hospital care services.1 Language that better supports the consultative nature of the request is:
- Consult for an opinion or advice on palliative measures;
- Consult for evaluation of palliative options; and
- Consult palliative care for treatment options.
Proper Documentation
The requesting physician can be in the same or different provider group as the consultant. The consultant must possess expertise in an area beyond that of the requesting provider. Because the specialty designation for most hospitalists is internal medicine, palliative-care claims could be scrutinized more closely. This does not necessarily occur when the requesting provider has a different two-digit specialty designation (e.g., internal medicine and gastroenterology).2 Scrutiny is more likely to occur when the requesting provider has the same internal-medicine designation as the palliative-care consultant, even if they are in different provider groups.
Payor concern escalates when physicians of the same designated specialty submit claims for the same patient on the same date. Having different primary diagnosis codes attached to each visit level does not necessarily help. The payor is likely to deny the second claim received, pending a review of documentation. If this happens, the provider who received the denial should submit a copy of both progress notes for the date in question. Hopefully, the distinction between the services is demonstrated in the documentation.
Service Type
Palliative services might involve obtaining and documenting the standard key components for visit-level selection: history, exam, and medical decision-making.3 However, the palliative-care specialist might spend more time providing counseling or coordination of care for a patient and family. When this occurs, the palliative-care specialist should not forget about the guidelines for reporting time-based services.4 Inpatient services may be reported on the basis of time, as long as a face-to-face service between the provider and the patient occurs. Consider the total time spent face to face with the patient, and the time spent obtaining, discussing, and coordinating patient care, while you are in the patient’s unit or floor.
As a reminder, document the total time, the amount of time spent counseling, and the details of discussion and coordination. The physician may count the time spent counseling the patient’s family regarding the treatment and care, as long as the focus is not emotional support for the family, the meeting takes place in the patient’s unit or floor, and the patient is present, unless there is medically supported reason for which the patient is unable to participate (e.g., cognitive impairment). The palliative-care specialist can then select the visit level based on time.5 (See Table 1, above.) TH
Carol Pohlig is a billing and coding expert with the University of Pennsylvania Medical Center, Philadelphia. She is on the faculty of SHM’s inpatient coding course.
References
1. Centers for Medicare and Medicaid Services. Medicare Claims Processing Manual: Chapter 12, Section 30.6.10. CMS Web site. Available at: www.cms.hhs.gov/manuals/downloads/clm104c12.pdf. Accessed Jan. 30, 2009.
2. Centers for Medicare and Medicaid Services. Medicare Claims Processing Manual: Chapter 26, Section 10.8. CMS Web site. Available at: www.cms.hhs.gov/manuals/downloads/clm104c26.pdf. Accessed Jan. 30, 2009.
3. Centers for Medicare and Medicaid Services. Documentation Guidelines for Evaluation and Management Services. CMS Web site. Available at: www.cms.hhs.gov/MLNEdWebGuide/25_EMDOC.asp. Accessed Jan. 30, 2009.
4. Centers for Medicare and Medicaid Services. Medicare Claims Processing Manual: Chapter 12, Section 30.6.1B. CMS Web site. Available at: www.cms.hhs.gov/manuals/downloads/clm104c12.pdf. Accessed Jan. 30, 2009.
5. Beebe M, Dalton J, Espronceda M, Evans D, Glenn R. Current Procedural Terminology Professional Edition. Chicago: American Medical Association Press; 2008.
Many hospitalists provide palliative-care services to patients at the request of physicians within their own groups or from other specialists. Varying factors affect how hospitalists report these services—namely, the nature of the request and the type of service provided. Palliative-care programs can be quite costly as they involve several team members and a substantial amount of time delivering these services. Capturing services appropriately and obtaining reimbursement to help continue program initiatives is pertinent.
Nature of the Request
Members of a palliative-care team often are called on to provide management options to assist in reducing pain and suffering associated with both terminal and nonterminal disease, thereby improving a patient’s quality of life. When a palliative-care specialist is asked to provide an opinion or advice, the initial service could qualify as a consultation. However, all requirements must be met in order to report the service as an inpatient consultation (codes 99251-99255).
There must be a written request from a qualified healthcare provider involved in the patient’s care (e.g., a physician, resident, or nurse practitioner). In the inpatient setting, this request can be documented as a physician order or in the assessment of the requesting provider’s progress note. Standing orders for consultation are not permitted. Ideally, the requesting provider should identify the reason for a consult to support the medical necessity of the service.
Additionally, the palliative-care physician renders and documents the service, then reports findings to the requesting physician. The consultant’s required written report does not have to be sent separately to the requesting physician. Because the requesting physician and the consultant share a common medical record in an inpatient setting, the consultant’s inpatient progress note suffices the “written report” requirement.
One concern about billing consultations involves the nature of the request. If the requesting physician documents the need for an opinion or advice from the palliative-care specialist, the service can be reported as a consultation. If, however, the request states consult for “medical management” or “palliative management,” it’s less likely that payors will consider the service a consultation. In the latter situation, it appears as if the requesting physician is not seeking an opinion or advice from the consultant to incorporate into his own plan of care for the patient and would rather the consultant take over that portion of patient care.
Recently revised billing policies prevent the consultant from billing consults under these circumstances. Without a sufficient request for consultation, the palliative-care specialist can only report “subsequent” hospital care services.1 Language that better supports the consultative nature of the request is:
- Consult for an opinion or advice on palliative measures;
- Consult for evaluation of palliative options; and
- Consult palliative care for treatment options.
Proper Documentation
The requesting physician can be in the same or different provider group as the consultant. The consultant must possess expertise in an area beyond that of the requesting provider. Because the specialty designation for most hospitalists is internal medicine, palliative-care claims could be scrutinized more closely. This does not necessarily occur when the requesting provider has a different two-digit specialty designation (e.g., internal medicine and gastroenterology).2 Scrutiny is more likely to occur when the requesting provider has the same internal-medicine designation as the palliative-care consultant, even if they are in different provider groups.
Payor concern escalates when physicians of the same designated specialty submit claims for the same patient on the same date. Having different primary diagnosis codes attached to each visit level does not necessarily help. The payor is likely to deny the second claim received, pending a review of documentation. If this happens, the provider who received the denial should submit a copy of both progress notes for the date in question. Hopefully, the distinction between the services is demonstrated in the documentation.
Service Type
Palliative services might involve obtaining and documenting the standard key components for visit-level selection: history, exam, and medical decision-making.3 However, the palliative-care specialist might spend more time providing counseling or coordination of care for a patient and family. When this occurs, the palliative-care specialist should not forget about the guidelines for reporting time-based services.4 Inpatient services may be reported on the basis of time, as long as a face-to-face service between the provider and the patient occurs. Consider the total time spent face to face with the patient, and the time spent obtaining, discussing, and coordinating patient care, while you are in the patient’s unit or floor.
As a reminder, document the total time, the amount of time spent counseling, and the details of discussion and coordination. The physician may count the time spent counseling the patient’s family regarding the treatment and care, as long as the focus is not emotional support for the family, the meeting takes place in the patient’s unit or floor, and the patient is present, unless there is medically supported reason for which the patient is unable to participate (e.g., cognitive impairment). The palliative-care specialist can then select the visit level based on time.5 (See Table 1, above.) TH
Carol Pohlig is a billing and coding expert with the University of Pennsylvania Medical Center, Philadelphia. She is on the faculty of SHM’s inpatient coding course.
References
1. Centers for Medicare and Medicaid Services. Medicare Claims Processing Manual: Chapter 12, Section 30.6.10. CMS Web site. Available at: www.cms.hhs.gov/manuals/downloads/clm104c12.pdf. Accessed Jan. 30, 2009.
2. Centers for Medicare and Medicaid Services. Medicare Claims Processing Manual: Chapter 26, Section 10.8. CMS Web site. Available at: www.cms.hhs.gov/manuals/downloads/clm104c26.pdf. Accessed Jan. 30, 2009.
3. Centers for Medicare and Medicaid Services. Documentation Guidelines for Evaluation and Management Services. CMS Web site. Available at: www.cms.hhs.gov/MLNEdWebGuide/25_EMDOC.asp. Accessed Jan. 30, 2009.
4. Centers for Medicare and Medicaid Services. Medicare Claims Processing Manual: Chapter 12, Section 30.6.1B. CMS Web site. Available at: www.cms.hhs.gov/manuals/downloads/clm104c12.pdf. Accessed Jan. 30, 2009.
5. Beebe M, Dalton J, Espronceda M, Evans D, Glenn R. Current Procedural Terminology Professional Edition. Chicago: American Medical Association Press; 2008.
A Pivotal Year for Policy
Change is in the air. With a new ad-ministration promising to be a change agent, an overhauled Congress, and a seemingly unanimous national interest in tackling healthcare reform, what changes can hospital medicine expect in 2009?
“I think there’s certainly the political will and interest now,” says Eric Siegal, MD, chair of SHM’s Public Policy Committee. “We haven’t had enough political will to ‘go big’ until recently. Now that we have it, the trillion-dollar question is where the money will come from.”
With that in mind, let’s explore three of the hottest healthcare issues:
Comprehensive Healthcare Reform
Providing healthcare coverage to all or most Americans was a centerpiece of President Obama’s campaign and a significant part of a proposal published by Senate Finance Committee Chairman Max Baucus (D-Mont.). Any actual reform will come through legislation, which will have to spell out who is covered and how, and where the money will come from. Any legislation will have to pass both the House and the Senate before Obama can sign it into law.
“The Democrats have certainly said [healthcare reform] is going to happen. Obama has talked about it … but how bipartisan will the effort be?” Dr. Siegal says. “This is too big and important for unilateral action; any durable healthcare reform must have bipartisan support. I do think that everyone can agree that the healthcare system is going to bankrupt itself if we don’t make changes.”
Dr. Siegal is skeptical that a major reform bill of any stripe will be passed anytime soon. “Given the depth of the recession and the projected cost of the stimulus package, my guess is that we will not see significant healthcare reform legislation passed in 2009,” he predicts. “However, I think that 2009 is still going to be an important year in that Congress will lay much of the foundation for new legislation. My guess is that 2010 is the year to look for major healthcare reform. And we want to make sure that the reform that happens is in the best interests of healthcare and of hospitalists.”
Less encompassing aspects of healthcare reform, the “easy stuff,” should have enough votes to pass in 2009, Dr. Siegal says. A good example is the State Children’s Health Insurance Program (SCHIP), which was passed the first week of February and increases the number of children eligible for free medical coverage from 7 million to 11 million. “SCHIP was as close to a slam dunk as possible.”
Major overhauls to the system, such as the healthcare exchange outlined in Sen. Baucus’ proposal or a major reworking of Medicare, may come about further down the road. “Those are going to take a lot of time, energy, and money,” Dr. Siegal says, “and I think that Congress has bigger fish to fry right now.”
Physician Fee Schedule
Last summer, physician fees paid by Medicare were slashed by 10.6% and then restored—with a 1.1% increase—when Congress overrode a presidential veto. SHM members were among the many physicians who fought the fee cut with letters and e-mails to Congress. However, the current fee schedule is short-lived: A 20% fee cut is scheduled for 2010. Will hospitalists and others have to go through the same battle all over again to maintain their Medicare payments?
Bradley Flansbaum, DO, MPH, chief of the hospitalist section at Lenox Hill Hospital in New York City and a member of SHM’s Public Policy Committee, points out “there are some proposals to modify the SGR [sustainable growth rate] formula, so this may not be the hot issue it was in 2008.” The SGR is used to set reimbursement rates for specific services and have been targeted by numerous stakeholders as flawed.
Regardless of the reimbursement formula, the Centers for Medicare and Medicaid Services (CMS) physician fee schedule might become less crucial to hospitalists’ income. “In the context of healthcare reform, you have to wonder if fee-for-service is even going to be relevant,” Dr. Flansbaum explains. “I think that Congress and MedPAC will think things through and admit that we can’t keep Band-Aiding a broken system.”
A major system overhaul might be looming. “This may not happen this year,” he says, “but I think that if Congress needs to avert the pay cut, then they will say they’re doing this one more time, with the caveat that payment will be drastically different” in the near future.
Delivery System Reform
A third hot topic for 2009 is legislation and consideration of changes in the healthcare delivery system, including payment reform, healthcare information technology, and improving care coordination.
“We think that payment reform is central to reshaping the healthcare system,” Dr. Siegal says.
As for moving toward a fee-for-quality system: “Well, there’s politics and there’s policy,” Dr. Flansbaum says. “Politics says we need to reward quality. However, the policy is that the methods of measuring quality haven’t evolved to the point where we can go forward. Everything is in beta-testing right now; we’re not ready to make any sweeping decisions. The delivery system has to be well-thought-out. It’s complicated.”
For example, in 2008, the CMS published a proposed inpatient prospective payment system rule, which included additional categories of hospital-acquired conditions that would no longer carry higher Medicare payments. The list caused industry alarm because some of the conditions—including Clostridium difficile-associated disease (see “Clostridium Difficile Infection: Are We Doing Enough,” p. 12)—were seen as only partially preventable in hospitalized patients or not entirely hospital-acquired.
The lesson learned? Any reform to healthcare delivery must be carefully considered, along with input from the medical community. “Healthcare is 16% of the gross domestic product. You don’t take that and spin it around in one day,” Dr. Flansbaum says. “It’s best to approach reform slowly and really think it through.”
Even so, there is no guarantee that reform legislation will make it through Congress.
“Another aspect to consider is that there are ideological differences between Democrats and Republicans,” Dr. Flansbaum adds. “ … Many Republicans are miles away from [Democrats] ideologically. Further still, with Daschle’s exit, it is unclear how his replacement will approach any overhaul.”
Of course, nobody has a crystal ball. This year may bring forth less drastic changes than hospital medicine is predicting. Then again, considering the economic and political climate, reform could take place faster than seems possible.
Only time will tell. TH
Jane Jerrard is a medical writer based in Chicago.
Appearance Counts
Your physical appearance—the image and demeanor you present in your work environment—plays an important role in your career. If you aspire to a leadership position or are looking for a new job, be sure to examine your outward style as carefully as you craft your curriculum vitae.
“This is a huge, woefully unexplored way that physicians relate to the world,” says Mary Frances Lyons, MD, an executive search consultant with Witt/Kiefer in St. Louis. “Let’s call it body language. It’s the attitude or deportment you show. If you’re not the most corporate person in the world, you can still appear to be open, enthusiastic about your work, and have integrity.”
Kindergarten Revisited
Dr. Lyons frequently coaches physician executives before job interviews. She instructs many of them in the basics: standing up straight, making eye contact, smiling, and having a firm handshake. “This is literally your chance to connect with other people,” she says. “Send a signal that you want to connect, that you’re open, and you’ll bring that out in them as well.”
Her advice may seem simplistic, and she agrees. “You can literally learn this stuff in kindergarten—but many physicians don’t do it,” she says. “Their currency of credibility is how smart they are, and they rely on that. The truth is that no one in medical school ever teaches physicians that a large part of their medical success is how they interact with and relate to others—including patients, their boss, payers, and colleagues.” As a clinician, you can get by with minimal social skills or attention to your demeanor, but Dr. Lyons warns, “If you want to move up the food chain, this is professionally important.”
Typically, hospitalists are insulated from the traditional office dress code (i.e., suits and ties and heels), but doctors are not immune to the basic standards of workplace appearance. “For better or for worse, hospital medicine groups are not corporate,” Dr. Lyons points out. “The question is, how do you become corporate enough to get the job offer or the promotion?”
Look the Part
If you want a higher-level position, whether you’re aiming for a promotion, interviewing for an important committee position, or seeking a new job, consider the impression you make before you open your mouth.
“Your style and attitude is more important than how you dress,” Dr. Lyons says. “However, appearance-wise, you want to look professional and serious … not somber. Be appropriate and nondescript; you don’t want interesting clothes or clothes that make a statement. You want people to think, ‘What a professional person,’ not ‘Wow, I really love those earrings.’ ”
When you have an important interview or meeting, wear a dark business suit. Pantsuits are fine for women, Dr. Lyons says. “You can never, ever go wrong with a suit,” she says. “You don’t want the people interviewing you to be better dressed than you. Your appearance signals how you’ll present yourself to patients.”
Ultimately, a physician’s behavior and professional interactions are significant considerations in the hiring process, says Kenneth Simone, DO, owner of Hospitalist and Practice Solutions in Veazie, Maine, and author of the upcoming book “Hospitalist Recruitment and Retention: Building a Hospital Medicine Program.” “It will affect relationships with all stakeholders in the healthcare system. Furthermore, if the hospitalist’s professional relationship with the nursing staff and other hospital staff disintegrates, it can affect patient care.”
Listen Up
During a job interview, promotional interview, or committee chair interview, the balance between how much you say and when you stop talking can reveal much about your attitude. Hiring managers look for leaders who can listen as well as they direct. “Doctors have no idea how to listen,” Dr. Lyons says. “I sometimes recommend that a client limit himself or herself to three sentences to answer a question.” Dr. Simone agrees. “A job candidate should discuss their professional and personal interests when queried but should refrain from dominating the discussion. It should be an interactive exchange,” he says.
Dr. Lyons recommends preparing for an interview by putting together a three- to five-minute presentation about who you are as a professional. Your interviewers will already have your resume, so avoid recounting what they already know. “If you’re having trouble with these things, put on your interview suit, then videotape yourself giving your presentation,” Dr. Lyons says. “Watch it and ask yourself, ‘Would I hire this person?’ It’s a grim exercise, but it’s effective.”
Consider your demeanor and make changes that allow you to show off your personal strengths and your ability to connect. Simple changes—upgrades, if you will—can lift you above your competition. “If concerns arise with one candidate, the rule of thumb is to avoid taking a chance on hiring a potential problem physician,” Dr. Simone says. “Recruitment is expensive. It has been estimated that making an incorrect [hire] can cost a program up to $100,000, when you consider expenses such as headhunter fees, sign-on bonus, moving expenses, and advertising, in addition to lost revenues for the program while staff participate in the recruitment process and lost productivity when the program is down one provider.”
A good attitude, openness to others, and a professional demeanor can bolster your career path. As Dr. Lyons points out, “If you don’t interview well, other people will make all the major decisions for your career. Physicians have not been taught to interview well. The good news is, it’s not that hard.” TH
Jane Jerrard is a medical writer based in Chicago. She also writes “Public Policy” for The Hospitalist.
C. Difficile Infection: Are We Doing Enough?
The worst of the nationwide Clostri-dium difficile epidemic is yet to come. The current, highly virulent NAP1/027 strain has reached all 50 states and Canada, with a total burden estimated at more than 500,000 annual cases.1
The economic burden associated with managing C. difficile-associated disease (CDAD) in Massachusetts hospitals over a two-year period was estimated at $51.2 million and associated with 55,380 inpatient days.2 A retrospective review (n=3,692) identified a mean cost per stay for a first hospitalization with a primary CDAD diagnosis at $10,212. This was associated with a mean length of stay (LOS) of 6.4 days. For patients with a secondary CDAD diagnosis, the LOS was estimated at 15.7 days, most likely due to time spent in the intensive-care unit (ICU) and not likely related to CDAD management. The CDAD-related increased LOS in these patients was estimated to be an additional 2.95 days, with an additional cost of $13,675.
More recently, CDAD-associated costs were noted to be more than $7,000 per case, according to data from 439 cases evaluated by two statistical methods.3
Bacillus Background
C. difficile is a spore-forming, gram-positive, anaerobic bacillus that has become one of the most significant causes of hospitalization-associated diarrhea in adults.4 The number of infections occurring with the more virulent strain is disquieting. It is associated with a spectrum of illnesses, which include uncomplicated diarrhea presenting as mild, watery stools, life-threatening pseudomembranous colitis, and toxic megacolon, leading to sepsis and death.
CDAD might be an unrecognized and under-reported cause of death in the U.S.5 From 1999 to 2004, CDAD was reported as a cause of death for 24,642 people and an underlying cause of death for an additional 12,264 people.6 The median patient age was 82.
As an aside, CDAD is the older terminology for what is now being referred to as C. difficile infection (CDI).
CDI is predominantly seen as a nosocomial or long-term-care facility concern, although community-acquired infections have been reported.7 Risk factors include previous antimicrobial use, particularly with clindamycin, fluoroquinolones, cephalosporins, ampicillin, or ß-lactams. Other risk factors include use of immunosuppressants or chemotherapeutic agents, advanced age, surgery, exposure to gastric acid suppressants, host immunity, and serious underlying illnesses or comorbidities.8,9 Gastric acid suppressant use outside a healthcare facility might be a significant risk factor for outpatient CDI.
Prevention
Healthcare-facility-based CDI prevention strategies include discontinuing any suspected antibiotic, as this alone has been known to resolve CDI in up to 25% of patients. C. difficile spores are resistant to bactericidal effects of alcohol and most hospital disinfectants. Therefore, additional prevention measures should include:
- Meticulous and proper hand hygiene for healthcare workers, patients, and visitors;
- Utilizing soap and water and avoiding alcohol-based rubs that are not sporicidal;
- Environmental cleaning with sporicidal cleaning agents;
- Placing patients under contact isolation infection control procedures until resolution of the diarrhea; and
- Adopting antibiotic restriction policies to limit excessive antimicrobial use.
Two additional principles include not giving prophylactic antimicrobials for patients at high risk of developing CDI and not treating or attempting to decolonize asymptomatic C. difficile carriers. The Centers for Disease Control recently developed a patient-safety initiative to assist healthcare facilities in dealing with multidrug-resistant organisms (MDRO) and CDAD.10
Management
General management strategies for CDI patients include:
- Discontinuing all unnecessary antimicrobials or utilizing lower-risk agents when able;
- Monitoring volume status and electrolytes and appropriately replete when necessary;
- Avoiding anti-diarrheal agents, such as loperamide, atropine, or diphenoxylate, as these agents do not allow the toxin to be excreted and can worsen symptoms and lead to serious complications;
- Encouraging patient hand hygiene through use of soap and water;
- Possibly avoiding the use of lactose-containing foods;
- Possibly discontinuing proton pump inhibitors and other acid suppressants; and
- Administering specific anti-Clostridial antibiotics, if necessary, based on infection severity.
Severe CDI causes volume depletion, electrolyte imbalances, and hypotension, as well as renal impairment, hemodynamic instability, leukocytosis, toxic megacolon, and death. Severe diarrhea associated with this form of CDI might include 10 or more loose stools per day. A surgical consultation should be obtained for a complete evaluation in the most severe cases, as patients may require colectomy.
Recent reports suggest oral (OP) vancomycin be considered as first-line therapy for severe CDI. Intravenous (IV) vancomycin should not be used, because it does not reach high enough stool levels to treat the infection. Vancomycin should be dosed at 500 mg four times daily for 10 to 14 days (severe CDI) and 125 mg four times daily for 10 to 14 days in cases of mild to moderate CDI; alternatively, the duration of treatment can be extended for several days after the diarrhea resolves. This usually occurs within a few days after commencing treatment.
The treatment of choice for mild to moderate CDI is metronidazole. It is dosed at either 500 mg PO three times daily or 250 mg PO four times daily. Oral metronidazole achieves higher stool concentrations than IV metronidazole, so it is the preferred route for CDI management.
Metronidazole can cause nausea and a metallic taste. It also interacts with warfarin, so the international normalized ratio (INR) must be followed. Concomitant administration of alcohol can lead to a reaction similar to that associated with use of Antabuse. The drug should not be used in pregnant women or children. Metronidazole and vancomycin usually are equally effective for treating mild to moderate CDI, but some resistance has been noted. Vancomycin PO currently is available only as a branded drug with a high cost, but this may soon change.11
Recurrence
Recurrence can occur in approximately 20% of patients within 60 days, and these patients can be treated with the same antibiotics as were previously utilized. Subsequent recurrences can be managed with pulse dosing, or by tapering the dose at the end of therapy. Due to a lack of controlled studies, the use of probiotics, such as Lactobacillus, in the prevention of CDI cannot be routinely recommended.12 However, Lactobacillus-containing products generally are considered safe in immunocompetent individuals.
The Future
Generic oral vancomycin is on the horizon and a number of agents are currently undergoing phase 3 clinical trials for CDI management. These include rifaximin, nitazoxanide, and rifampin in combination with current agents.13-16 For now, prevention is key. Utilize some of the measures noted above to prevent this potentially serious, nosocomial infection. For infected patients, current treatments are effective and new ones will be here soon. TH
Michele B. Kaufman, PharmD, BSc, RPh, is a freelance medical writer based in New York City.
References
1.Walker EP. ICAAC-IDSA: C. difficile epidemic continues to worsen. MedPage Web site. Available at: www.medpagetoday.com/MeetingCoverage/ ICAAC/11518. Accessed Jan. 13, 2009.
2.O’Brien JA, Lahue BJ, Caro JJ, Davidson DM. The emerging infectious challenge of Clostridium difficile-associated disease in Massachusetts hospitals: clinical and economic consequences. Infect Control Hosp Epidemiol. 2007;28:1219-1227.
3.Dubberke ER, Reske RA, Olsen MA, McDonald C, Fraser VJ. Short- and long-term attributable costs of Clostridium difficile-associated disease in nonsurgical patients. Clin Infect Dis. 2008;46:497-504.
4.Jodlowski TZ, Oehler R, Kam LW, Melnychuk I. Emerging therapies in the treatment of Clostridium difficile-associated disease. Ann Pharmacother. 2006;40:2164-2169.
5.Redelings MD, Sorvillo F, Mascola L. Increase in Clostridium difficile-related mortality rates, United States, 1999-2004. Emerg Infect Dis. 2007;13:1417-1419.
6.The national healthcare safety network protocol multi-drug-resistant organism and Clostridium difficile-associated disease module version 4.1. CDC Web site. Available at: www.cdc.gov/ncidod/dhqp/ pdf/nhsn/MDRO_CDADprotocolv41Dec08final.pdf. Accessed Jan. 14, 2009.
7.Severe Clostridium difficile-associated disease in populations previously at low risk—four states, 2005. CDC Web site. Available at www.cdc.gov/mmwr/preview/mmwrhtml/mm5447a1.htm. Accessed Jan. 14, 2009.
8.Lawrence SJ. Contemporary management of Clostridium difficile-associated disease. IDSE Web site. Available at: www.idse.net/download/079idse0907WM.pdf. Accessed Jan. 14, 2009.
9.Dubberke ER, Gerding DN, Classen D, et al. Strategies to prevent Clostridium difficile infections in acute care hospitals. Infect Control Hosp Epidemiol. 2008;29:S81-S92.
10.Multidrug-resistant organisms (MDRO) and Clostridium difficile-associated disease (CDAD) module. CDC Web site. Available at: www.cdc.gov/ncidod/dhqp/nhsn_MDRO_CDAD.html. Accessed Jan. 14, 2009.
11.ViroPharma files FOIA complaint seeking administrative record for vancocin. ViroPharma Inc. Web site. Available at: phx.corporateir.net/phoenix.zhtml?c=92320&p=irol-newsArticle&ID=1237649. Published Dec. 18, 2008. Accessed Jan. 14, 2009.
12.Hickson M, D’Souza AL, Muthu N, et al. Use of probiotic Lactobacillus preparation to prevent diarrhoea associated with antibiotics: randomised double blind placebo controlled trial. BMJ. 2007;6. Available at: www.bmj.com/cgi/reprint/bmj.39231.599815.55v1. Accessed Jan. 14, 2009.
13. A trial to compare xifaxan to vancomycin for the treatment of Clostridium difficile-associated diarrhea (CDAD). National Institutes of Health Web site. Available at: www.clinicaltrials.gov/ct2/show/ NCT00269399?term=rifaximin+and+clostridium&rank=1. Accessed Jan. 10, 2009.
14. Efficacy of metronidazole versus metronidazole and rifampin in CDAD treatment. National Institutes of Health Web site. Available at www.clinicaltrials.gov/ct2/show/NCT00182429?term=rifampin+and+cdad&rank=1. Accessed Jan. 10, 2009.
15. Compassionate use of nitazoxanide for the treatment of Clostridium difficile infection. National Institutes of Health Web site. Available at: www.clinicaltrials.gov/ct2/show/NCT00304356?term=Nitazoxanide+and+clostridium&rank=2. Accessed Jan. 10, 2009.
16. Vancomycin vs. nitazoxanide to treat recurrent C. difficile colitis. National Institutes of Health Web site. Available at: www.clinicaltrials.gov/ct2/show/NCT00304889?term=Nitazoxanide+and+vancomycin&rank=2. Accessed Jan. 10, 2009.
SHM National Conference Expands to Four Days

With the total number of hospitalists in the U.S. nearing 28,000 and hospitalists now working in four out of every five large hospitals, the issues affecting hospitalists continue to expand and become more complex.
That’s the rationale behind expanding SHM’s national conference, “Hospital Medicine 2009,” to a four-day schedule. Previous SHM annual conferences were limited to three days; HM09 runs May 14-17 in Chicago.
“Hospitalists are continually looking for opportunities for professional development, and we’re expecting another record-breaking attendance,” says Todd Von Deak, SHM’s vice president for membership and marketing. “We’re thrilled that we can offer additional courses and still give attendees plenty of time for other sessions and networking with thousands of hospitalists and colleagues. Ultimately, the expansion makes it easier for hospitalists to bring best practices back to their hospitals and patients.”
HM09 will feature keynotes from a pair of leaders in healthcare quality:
- Mark R. Chassin, MD, MPP, MPH, president of The Joint Commission and an expert on improving the safety and quality of healthcare; and
- Robert M. Wachter, MD, professor and chief of the division of hospital medicine at the University of California San Francisco, a former SHM president, and author of the blog “Wachter’s World”.
VTE Awareness Month
Jason Stein, MD, knows he could walk into almost any nursing unit in any hospital in the country, ask a simple question, and get blank stares in return.
“I would ask, ‘Which patients here in the nursing unit don’t have an order for VTE prophylaxis?’ ” says Dr. Stein, associate director for quality improvement and assistant professor of medicine at Emory University School of Medicine in Atlanta. “And they would tell me, ‘What kind of place do you think this is? How can we possibly know that?’ ”
It’s not idle chat. Venous thromboembolism (VTE) is a condition known throughout HM for three things: It runs rampant in hospitals; it can be deadly; and it’s easily preventable.
This month, SHM—along with dozens of other healthcare organizations, including the Agency for Healthcare Research Quality (AHRQ)—is highlighting the dangers of VTE and deep vein thrombosis (DVT), and promoting best practices to prevent them.
“SHM’s leadership of awareness efforts and championing VTE [prevention] has played an important role in keeping this on everybody’s mind,” Dr. Stein says.
VTE: A Hospital-Based Epidemic
Although it is easy to target at-risk populations and prevent it, VTE is widespread and dangerous.
“By published estimates, each year VTE kills more people than HIV, car accidents, and breast cancer combined,” says Gregory A. Maynard, MD, Ms, chief of the division of hospital medicine and clinical professor of medicine at the University of California at San Diego.
The risk of VTE in hospital patients should give hospitalists and their colleagues pause. Here’s why:
- According to the American Heart Association, more than 200,000 cases of VTE are reported each year, and VTE occurs for the first time in approximately 100 out of every 100,000 persons each year;
- Research published last year in The Lancet estimates 52% of hospitalized patients are at risk for VTE;
- 1 in 3 VTE patients experiences a pulmonary embolism;
- 30% of new VTE patients die within three days;
- 20% of new VTE patients die suddenly from pulmonary embolus; and
- DVT is responsible for approximately 8,000 hospital discharges every year. Pulmonary embolism accounts for nearly 100,000.
Risk Factors and Prevention
In a hospital setting, VTE risk factors are especially straightforward to monitor and prevent, but Dr. Maynard sees room for improvement.
“We don’t need to do better things; we need to do things better,” he told colleagues at a recent grand rounds. “Pharmacologic prophylaxis is the preferred way to prevent VTE in the hospital, which can reduce DVT and pulmonary embolism by 50% to 65%.”
Most hospital patients have at least one of these VTE risk factors, which are sorted into three categories:
- Stasis: conditions such as advanced age, immobility, paralysis, or stroke;
- Hypercoaguability: smoking, pregnancy, cancer, or sepsis; and
- Endothelial damage: surgery, prior VTE, central lines, or trauma.
Because the potential VTE risk is so high in hospital patients, the assessment must go hand in hand with prophylaxis, says Dr. Maynard and other hospitalists working with VTE.
Recent research has shown that prescribing medications to prevent VTE before it begins is safe, effective, and cost-effective.
The Hospitalist’s Role

The responsibility for VTE risk assessment and prevention often falls to hospitalists. In its online VTE Resource Room, SHM provides information for hospitalists working to assess and prevent VTE in their patients. It also provides a complete toolkit for hospitalists interested in addressing VTE prevention systematically throughout their hospitals. The toolkit is part of a comprehensive VTE Prevention Collaborative, which provides real-world mentoring and materials to hospitalists as they develop VTE monitoring and prevention programs.
“In 2005, when SHM set up the Quality Improvement resource room, we began with VTE prophylaxis,” Dr. Stein says. “VTE is the No. 1 cause of preventable death in hospitals, and preventing it is a fundamentally simple thing for hospitalists to do. We’re trying to get physicians to order a shot in the abdomen once a day. … If we can’t do that, we’re in trouble. On the flipside, if we can figure that out, we can derive mechanisms that we can apply to more complex problems in care.”
Together with SHM, Drs. Stein and Maynard have pioneered a two-pronged approach known as “measure-vention.” The underlying principal of measure-vention is that monitoring for VTE risk in real time can empower hospital staff to remedy issues in real time. In most hospitals, VTE risk can only be measured retrospectively through quality improvement data, which can take months to collect.
SHM and Dr. Stein have implemented an information technology approach at five of Emory’s hospitals. Each facility assesses patients who don’t have VTE prophylaxis every hour. The data is distributed to nursing stations, where nurses and other providers can apply VTE interventions within minutes. The program has driven Emory’s VTE prophylaxis rates to more than 90%, and Dr. Stein is working to make the program exportable to other hospitals, with the help of funding and assistance from SHM.
“As the leader of the VTE prevention program at Emory hospitals, I hear lots of stories about preventable VTE—not just about patients, but from friends of friends and family members,” he says. “It’s extraordinary.” TH
Brendon Shank is a freelance writer based in Philadelphia.
Jason Stein, MD, knows he could walk into almost any nursing unit in any hospital in the country, ask a simple question, and get blank stares in return.
“I would ask, ‘Which patients here in the nursing unit don’t have an order for VTE prophylaxis?’ ” says Dr. Stein, associate director for quality improvement and assistant professor of medicine at Emory University School of Medicine in Atlanta. “And they would tell me, ‘What kind of place do you think this is? How can we possibly know that?’ ”
It’s not idle chat. Venous thromboembolism (VTE) is a condition known throughout HM for three things: It runs rampant in hospitals; it can be deadly; and it’s easily preventable.
This month, SHM—along with dozens of other healthcare organizations, including the Agency for Healthcare Research Quality (AHRQ)—is highlighting the dangers of VTE and deep vein thrombosis (DVT), and promoting best practices to prevent them.
“SHM’s leadership of awareness efforts and championing VTE [prevention] has played an important role in keeping this on everybody’s mind,” Dr. Stein says.
VTE: A Hospital-Based Epidemic
Although it is easy to target at-risk populations and prevent it, VTE is widespread and dangerous.
“By published estimates, each year VTE kills more people than HIV, car accidents, and breast cancer combined,” says Gregory A. Maynard, MD, Ms, chief of the division of hospital medicine and clinical professor of medicine at the University of California at San Diego.
The risk of VTE in hospital patients should give hospitalists and their colleagues pause. Here’s why:
- According to the American Heart Association, more than 200,000 cases of VTE are reported each year, and VTE occurs for the first time in approximately 100 out of every 100,000 persons each year;
- Research published last year in The Lancet estimates 52% of hospitalized patients are at risk for VTE;
- 1 in 3 VTE patients experiences a pulmonary embolism;
- 30% of new VTE patients die within three days;
- 20% of new VTE patients die suddenly from pulmonary embolus; and
- DVT is responsible for approximately 8,000 hospital discharges every year. Pulmonary embolism accounts for nearly 100,000.
Risk Factors and Prevention
In a hospital setting, VTE risk factors are especially straightforward to monitor and prevent, but Dr. Maynard sees room for improvement.
“We don’t need to do better things; we need to do things better,” he told colleagues at a recent grand rounds. “Pharmacologic prophylaxis is the preferred way to prevent VTE in the hospital, which can reduce DVT and pulmonary embolism by 50% to 65%.”
Most hospital patients have at least one of these VTE risk factors, which are sorted into three categories:
- Stasis: conditions such as advanced age, immobility, paralysis, or stroke;
- Hypercoaguability: smoking, pregnancy, cancer, or sepsis; and
- Endothelial damage: surgery, prior VTE, central lines, or trauma.
Because the potential VTE risk is so high in hospital patients, the assessment must go hand in hand with prophylaxis, says Dr. Maynard and other hospitalists working with VTE.
Recent research has shown that prescribing medications to prevent VTE before it begins is safe, effective, and cost-effective.
The Hospitalist’s Role
The responsibility for VTE risk assessment and prevention often falls to hospitalists. In its online VTE Resource Room, SHM provides information for hospitalists working to assess and prevent VTE in their patients. It also provides a complete toolkit for hospitalists interested in addressing VTE prevention systematically throughout their hospitals. The toolkit is part of a comprehensive VTE Prevention Collaborative, which provides real-world mentoring and materials to hospitalists as they develop VTE monitoring and prevention programs.
“In 2005, when SHM set up the Quality Improvement resource room, we began with VTE prophylaxis,” Dr. Stein says. “VTE is the No. 1 cause of preventable death in hospitals, and preventing it is a fundamentally simple thing for hospitalists to do. We’re trying to get physicians to order a shot in the abdomen once a day. … If we can’t do that, we’re in trouble. On the flipside, if we can figure that out, we can derive mechanisms that we can apply to more complex problems in care.”
Together with SHM, Drs. Stein and Maynard have pioneered a two-pronged approach known as “measure-vention.” The underlying principal of measure-vention is that monitoring for VTE risk in real time can empower hospital staff to remedy issues in real time. In most hospitals, VTE risk can only be measured retrospectively through quality improvement data, which can take months to collect.
SHM and Dr. Stein have implemented an information technology approach at five of Emory’s hospitals. Each facility assesses patients who don’t have VTE prophylaxis every hour. The data is distributed to nursing stations, where nurses and other providers can apply VTE interventions within minutes. The program has driven Emory’s VTE prophylaxis rates to more than 90%, and Dr. Stein is working to make the program exportable to other hospitals, with the help of funding and assistance from SHM.
“As the leader of the VTE prevention program at Emory hospitals, I hear lots of stories about preventable VTE—not just about patients, but from friends of friends and family members,” he says. “It’s extraordinary.” TH
Brendon Shank is a freelance writer based in Philadelphia.
Politics & Publishing Pitfalls

Wouldn’t you know it? The same day the February issue of The Hospitalist was being shipped to the post office, former Sen. Tom Daschle—President Obama’s “chosen one” to spearhead healthcare reform— surprised us all. Embroiled in a tax and ethics scandal, Daschle up and withdrew his nomination for secretary of the Department of Health and Human Services (HHS). Considering our February cover story outlines Obama and Daschle’s plan for comprehensive healthcare reform—and the magazine cover has a nice picture of Obama with Daschle in the background—the timing couldn’t have been … better.
In publishing circles, it’s one of those slow-motion moments. You know, the kind of moment sitcoms rewind and show from three different angles. Do they really think we need to see Cosmo Kramer trip and fall three times? I got it.
It’s not as if we declared Thomas Dewey the next president of the United States. If nothing else, consider the February issue a collector’s item. Once I’m done writing this column, I’m going to FedEx a box of February issues to Daschle’s office. I hope he hangs one on the wall—a reminder of how close he came to history.
The fact of the matter is, I’m guessing Daschle’s departure will do little to slow Obama’s push for healthcare reform. Case in point: The day after Daschle withdrew his nomination, the House of Representatives approved legislation to provide federally funded healthcare to 4 million more Americans by expanding the State Children’s Health Insurance Program, or SCHIP (see “2009: A Pivotal Year for Policy,” p. 14). The president’s first healthcare reform legislation passed Congress by a pair of two-thirds votes and will inject $35 billion into the program over the next five years. More importantly, the fact that the legislation was signed into law on Day 15 of the new administration signals Obama’s commitment to comprehensive healthcare reform.
Most in the HM community fully support the president on the idea that it’s time to change the way healthcare is delivered, revamp the way providers are paid for their services, and eliminate the term “uninsured.” Unfortunately, the president’s tidal wave of support for healthcare reform is being chipped away by a wayward economy and missteps in the confirmation process. A similar message was conveyed during a policy report to SHM’s board of directors in late January in Washington, D.C. Key HM issues, such as bundling and coordination of care, appear to be on the traditional route within the legislative process. Translation: a slower one rife with political obstacles.
At press time, Obama had not put forth a new HHS nominee. Some names thrown into the ring: Jeanne Lambrew, PhD, a deputy health adviser to Obama and Daschle’s former right hand; Rep. Rosa DeLauro (D-Conn.); and Sen. Max Baucus (D-Mont.), chairman of the Senate Finance Committee. And a possibility from the other side of the aisle: Mitt Romney, former Massachusetts governor and presidential candidate. (OK, the Romney mention is a shout-out to the blogosphere. Massachusetts physicians would lay siege to the White House if Romney were nominated.)
Pundits are calling for an individual with many of Daschle’s key attributes: expertise in the healthcare system, knowledge of the inner workings of Washington, and confluence—not to mention influence—with the president in healthcare issues. From the looks of things—and knowing that Daschle’s place in the Obama cabinet was considered a slam dunk—the president will have the unenviable task of replacing the person he thought was most capable of being the “lead architect” to implement “our healthcare plan,” as he said in the Dec. 11 news conference introducing Daschle as his HHS nominee.
Although the task is great and the process delayed, it’s unlikely the healthcare debate is going to slide to the back burner. Although healthcare reform ideology spans the full spectrum—politically, philosophically, and economically—the healthcare debate is alive and kicking in this new administration.
We’ll just have to make sure the next HHS leader is confirmed before The Hospitalist shines the spotlight on them. TH
Jason Carris is editor of The Hospitalist.
Special Recognition
Jeff Dichter, MD, admits he’s not the typical 21st-century hospitalist. He isn’t in his 30s anymore and he isn’t practicing HM full time anymore. He is, however, one of the original 300 SHM members. And after 10 years as a hospitalist, building an HM program of his own, and serving five years on SHM’s Board of Directors, Dr. Dichter is among more than 500 hospitalists in the inaugural Fellow in Hospital Medicine (FHM) class (Download the complete list as a PDF). The designation is for physicians who have devoted their career to HM and whose personal and professional activities embody both the mission and goals of SHM and the medical profession.
“The society and the profession have grown beyond my wildest expectations,” says Dr. Dichter, former SHM president and medical director of cardiovascular intensive care at Regions Hospital in Saint Paul, Minn. “I am thrilled, and continue to be thrilled, at the growth. For me, personally, I am greatly honored.”
Jenn Myers, MD, agrees the honor is especially gratifying. Dr. Myers chose a hospitalist career in 2002 after finishing her residency at Johns Hopkins in Baltimore. Now an assistant professor of clinical medicine and patient safety officer at the Hospital of the University of Pennsylvania, she says the FHM designation is both “important and exciting.”
“I think I have a focused practice in HM that is different from most of my general IM colleagues,” she says. “It’s good to have that practice recognized on a national level. … It’s also good to be part of anything inaugural.”
The first class will be inducted at HM09 next month in Chicago. Selection criteria included a minimum of five years as a practicing hospitalist, no history of professional disciplinary action, and letters of recommendation from SHM peers.
Advertise at Your Own Risk
“The issue for hospitalists really isn’t different from anybody else,” says Erin A. Egan, MD, JD, a hospitalist at the University of Colorado at Denver and chair of SHM’s Ethics Committee. “If you can claim something quantifiable, you better be able to back it up. If you claim something qualitative, essentially you’re offering an opinion, and opinions don’t have to be based in fact.”
Virtua Health in Voorhees, N.J., and Cooper Health System, based in Camden, N.J., have been engaged in a legal battle since February. Virtua’s advertising claims the hospital has the most “Top Docs” in the region. After Cooper launched a legal challenge to the validity of the claim, a state judge ruled that Virtua could continue to say it had the most “Top Docs,” a claim based on a compilation of rankings from four regional magazines. The judge did, however, rule that Virtua had to withdraw wording from advertising that claimed the findings were made by an "independent" source, as Virtua had hired a group to compile the rankings. The judge also told Virtua to remove Web links to sites that explained how the figures were tallied. A federal case is pending.
Dr. Egan notes that few HM advertising tiffs result in similar legal claims unless they involve fraud. She adds that such battles often are costly and fruitless. For this reason, she urges advertisers to ensure their promotions are legally defensible. She offers these tips for any HM group when creating a marketing campaign:
- Use subjective language for subjective claims;
- Make sure you can back up all factual claims; and
- Think about the response you will give if you are challenged.
Snapshots of the Latest Healthcare-Related Posts
You know that feeling of frustration you get when something that should work—computers, airline schedules—just doesn't? Here's something new to add to that list: prostate cancer screenings.
Bob Wachter, MD, professor and chief of the division of hospital medicine at the University of California at San Francisco and author of Wachter’s World, sums up the findings of two recent New England Journal of Medicine studies in a recent post.
“One, a European study, found that PSA screening led to little benefit. The American study found that, after seven years of followup, the unscreened group had a 13% lower mortality rate than the screened group, with not a whiff of benefit.”
Dr. Wachter describes how his own father chose not to act on a PSA that came back in the 8 ng/mL range in the late 1990s. His father recently turned 79 and is healthy. “A heartfelt thanks to my dad’s urologists, who gave him what proved to be sage advice when all of the pressures—social, psychological, and financial—might have steered them toward more aggressive recommendations,” Dr. Wachter writes.
A Smarter Investment?
The Happy Hospitalist ponders what would happen if the $8,760 a year his patient and her husband spent on cigarettes was invested in the stock market. “Let’s say that the price of a pack of cigarettes only rises 5% a year (a conservative estimate). How much money could you save up by not spending $8,760 on cigarettes and instead investing it with a post-inflation return on average of 7%?”
The answer? After 10 years, the total would be $153,716; after 50 years, it would be $5.8 million.
“My, how foolish we are as a nation,” The Happy Hospitalist writes. “Looking for ways to pay for the healthcare of its citizenry, when the answers are staring us in the face.”
Brave New Hospitalist
HM welcomes a rookie to the ranks this week. Spiffer, an internist from California who doesn’t mince words on her blog, explains her new gig as a hospitalist to patients. “This is the doctor that will come and ask you about 700 annoying questions while you lay, uncomfortably, in the overcrowded emergency room. And this person will, ideally, follow you for much, if not all, of your stay in the hospital.
“I love my patients and will miss them,” she says. “But here I go, into a brave new world.”
Welcome, Spiffer.