User login
Hospital Readmissions Reduction Program may be doing more harm than good
A Medicare program aimed at lowering readmissions to hospitals could be having an adverse effect on mortality.

Results from a retrospective cohort study of hospitalizations for heart failure, acute myocardial infarction, and pneumonia among Medicare beneficiaries aged 65 years and older between April 1, 2005 and March 31, 2015 (covering the period before and after the Medicare Hospital Readmissions Reduction Program was announced in April 2010 and implemented in October 2012) found a significant increase in 30-day post discharge mortality among heart failure and pneumonia patients.
“Most concerning, however, is the possibility that the relationship between the HRRP and postdischarge mortality for heart failure and pneumonia is causal, indicating that the HRRP led to changes in quality of care that adversely affected patients,” Rishi Wadhera, MD, Harvard Medical School, Boston, and his colleagues wrote in a report published Dec. 25, 2018, in JAMA.
They looked at 8.3 million hospitalizations for heart failure, acute MI, and pneumonia, among whom 7.9 million were alive at the time of discharge. There were roughly 270,000 deaths within 30 days of discharge for heart failure; 128,000 for acute MI; and 246,000 for pneumonia.
To examine trends, the timing was divided into four periods: two prior to the announcement of the HRRP (April 2005–September 2007 and October 2007–March 2010); a third covering the time when the HRRP was announced (April 2010–September 2012); and the fourth when HRRP was implemented (October 2012–March 2015).
They found that among patients discharged with heart failure, 30-day mortality was rising even before the announcement of the HRRP, by 0.27% from the first period to the second period. That baseline trend continued when the HRRP was announced, by 0.49%, from second period to third. The difference in change between those periods was 0.22%. After implementation, 30-day mortality increased by 0.52%, with a difference in change from the third period of 0.25%. Both changes were statistically significant.
Among pneumonia patients, postdischarge mortality was stable before HRRP, but significantly increased after HRRP announcement, by 0.26%, with a difference in change from the second period to the third period of 0.22%. After implementation, the 30-day postdischarge mortality was 0.44%, with a significant difference in change of 0.40%.
Acute MI was a different story. Postdischarge mortality decreased significantly after the implementation of the HRRP, by 0.22%. The difference in change was –0.26%.
The authors suggested that “some hospitals may have focused more resources and efforts on reducing or avoiding readmissions than on prioritizing survival.” They add that the increases in heart failure morbidity could be related to patients with more severe heart conditions.
They noted that “although hospitals that reduce readmissions also appear to reduce mortality, this hospital-level concordance does not reflect the change in readmissions and mortality at the level of the patient population, which is arguably of greater importance to individual patients and to public health.”
Further research is needed to understand whether the increase in 30-day postdischarge mortality is a result of the HRRP, the authors concluded.
SOURCE: Wadhera R et al. JAMA. 2018 Dec 25. doi: 10.1001/jama.2018.19232.
Evidence in this study shows that while the Hospital Readmissions Reduction Program my be succeeding in reducing hospital admissions, little evidence is available to show that it is having a positive effect on patient outcomes.
The Centers for Medicare & Medicaid Services needs to reexamine the program and find alternative methods that are both effective at reducing hospital readmissions while at the same time protect patients from unintentional harm, including death.
Gregg C. Fonarow, MD , University of California Medical Center, Los Angeles, in an editorial published in JAMA, Dec. 25, 2018. doi:10.1001/jama.2018.19325 .
A Medicare program aimed at lowering readmissions to hospitals could be having an adverse effect on mortality.
Results from a retrospective cohort study of hospitalizations for heart failure, acute myocardial infarction, and pneumonia among Medicare beneficiaries aged 65 years and older between April 1, 2005 and March 31, 2015 (covering the period before and after the Medicare Hospital Readmissions Reduction Program was announced in April 2010 and implemented in October 2012) found a significant increase in 30-day post discharge mortality among heart failure and pneumonia patients.
“Most concerning, however, is the possibility that the relationship between the HRRP and postdischarge mortality for heart failure and pneumonia is causal, indicating that the HRRP led to changes in quality of care that adversely affected patients,” Rishi Wadhera, MD, Harvard Medical School, Boston, and his colleagues wrote in a report published Dec. 25, 2018, in JAMA.
They looked at 8.3 million hospitalizations for heart failure, acute MI, and pneumonia, among whom 7.9 million were alive at the time of discharge. There were roughly 270,000 deaths within 30 days of discharge for heart failure; 128,000 for acute MI; and 246,000 for pneumonia.
To examine trends, the timing was divided into four periods: two prior to the announcement of the HRRP (April 2005–September 2007 and October 2007–March 2010); a third covering the time when the HRRP was announced (April 2010–September 2012); and the fourth when HRRP was implemented (October 2012–March 2015).
They found that among patients discharged with heart failure, 30-day mortality was rising even before the announcement of the HRRP, by 0.27% from the first period to the second period. That baseline trend continued when the HRRP was announced, by 0.49%, from second period to third. The difference in change between those periods was 0.22%. After implementation, 30-day mortality increased by 0.52%, with a difference in change from the third period of 0.25%. Both changes were statistically significant.
Among pneumonia patients, postdischarge mortality was stable before HRRP, but significantly increased after HRRP announcement, by 0.26%, with a difference in change from the second period to the third period of 0.22%. After implementation, the 30-day postdischarge mortality was 0.44%, with a significant difference in change of 0.40%.
Acute MI was a different story. Postdischarge mortality decreased significantly after the implementation of the HRRP, by 0.22%. The difference in change was –0.26%.
The authors suggested that “some hospitals may have focused more resources and efforts on reducing or avoiding readmissions than on prioritizing survival.” They add that the increases in heart failure morbidity could be related to patients with more severe heart conditions.
They noted that “although hospitals that reduce readmissions also appear to reduce mortality, this hospital-level concordance does not reflect the change in readmissions and mortality at the level of the patient population, which is arguably of greater importance to individual patients and to public health.”
Further research is needed to understand whether the increase in 30-day postdischarge mortality is a result of the HRRP, the authors concluded.
SOURCE: Wadhera R et al. JAMA. 2018 Dec 25. doi: 10.1001/jama.2018.19232.
FROM JAMA
Key clinical point:
Major finding: Heart failure patients saw mortality increase 0.52% after HRRP launched.
Study details: A retrospective cohort study across 10 years, including time before and after the implementation of the HRRP.
Disclosures: The Richard A. and Susan F. Smith Center for Outcomes Research in Cardiology funded the study. No relevant conflicts of interest were disclosed.
Source: Wadhera R et al. JAMA 2018 Dec 25. doi: 10.1001/jama.2018.19232.
Synthetic opioids drive spike in U.S. fatal drug overdoses
New federal statistics suggest that the opioid epidemic in the United States is evolving as physicians crack down on the use of prescription painkillers: Fatal drug overdose deaths rose by 12% from 2016 to 2017, boosted by a wave of fatalities linked to illicit synthetic opioids like fentanyl that are now linked to an estimated 60% of opioid-related deaths.

“Overall, the overdose epidemic continues to worsen, and it has grown increasingly complex by coinvolvement of prescription and illicit drugs,” Lawrence Scholl, PhD, MPH, and his associates at the Centers for Disease Control & Prevention wrote in the Morbidity and Mortality Weekly Report.
The new statistics provide more evidence that 2017 marked “a sharp increase in what has characterized as the third wave of the opioid epidemic,” said drug and health policy researcher Stephen Crystal, PhD, of Rutgers University, New Brunswick, N.J., in an interview. He was referring to a wave that experts believe started in 2013 amid a spike in U.S. overdose deaths from fentanyl and other synthetic opioids.
The new report analyzes fatal drug overdose data from 2013 to 2017. According to the findings, the total number of those overdoses rose to 70,237 in 2017, up from 63,632 in 2016. The highest drug overdose death rates in 2017 were in West Virginia, followed by Ohio, Pennsylvania, and the District of Columbia.
Some statistics did not change much from 2016 to 2017: About two-thirds of the drug overdose deaths were linked to opioids in both years, and the death rate of cases linked to prescription drugs and heroin remained steady. (Death rates in the report were age adjusted.)
However, the percentage of fatal overdose cases linked to synthetic opioids grew 45% from 2016 to 2017. Overall, 60% of opioid-related fatal overdoses in 2017 involved synthetic opioids.
The report identifies increases in several areas from 2016 to 2017. Opioid-related drug overdose deaths among black people rose by 25%, and an analysis of data from 34 states and the District of Columbia found the highest increases in death rates in North Carolina (29%), Ohio (19%), and Maine (19%).
In regard to deaths linked to synthetic opioids specifically, the highest death rates in 2017 were in West Virginia (37 per 100,000), Ohio (32 per 100,000), and New Hampshire (30 per 100,000).
“Part of what we’re seeing in these increased numbers are individuals who have pain, can’t get prescribed opioids, and turn to street drugs,” Dr. Crystal said, adding that “abruptly cutting patients off is not good, and leaving patients with a lot of untreated pain is not good. If people are going to be discontinued [from opioids] or have their doses reduced, the taper needs to be done very slowly and carefully.”
Synthetic opioids were not the only drugs that are driving up fatal overdoses, as the death rates of cases linked to cocaine and psychostimulants (such as methamphetamine) jumped by more than a third in 2017.
“The most important thing these numbers are telling me is that it’s becoming more and more attractive to drug dealers to put fentanyl in the heroin, cocaine, and other drugs they sell,” Dr. Crystal said. “When that happens, dependence on street drugs becomes much more deadly. It’s almost impossible to get the dose right. Every time you shoot up, you’re taking a chance that you’ll overdose.”
The report had limitations, including the fact that details about drug use were missing from 12% (2016) and 15% (2017) of death certificates in fatal overdose cases. By state, the percentages of those death certificates that included drug information ranged from as little as 55% to 99%.
There’s some possible positive news: The report points to preliminary data from 2018 suggesting that the number of annual drug overdose deaths may be leveling off – although it says more analysis is needed to confirm the trend.
Dr. Crystal, however, is not celebrating. “I don’t see this as a good news story, really,” he said, adding that there’s “a little too much of people patting themselves on the back” because they’re proud of cutbacks in opioid prescriptions.
“This doesn’t have to do with the huge number of people who got started with opioids years ago” and are now at risk of using street drugs, he said. “We haven’t engaged that population at the rate we need to. And flattening out at 70,000 drug overdoses a year is not a good news story.”
Dr. Crystal reported no relevant disclosures.
SOURCE: Scholl L et al. MMWR. 2019 Jan 4;67(5152):1419-27.
New federal statistics suggest that the opioid epidemic in the United States is evolving as physicians crack down on the use of prescription painkillers: Fatal drug overdose deaths rose by 12% from 2016 to 2017, boosted by a wave of fatalities linked to illicit synthetic opioids like fentanyl that are now linked to an estimated 60% of opioid-related deaths.
“Overall, the overdose epidemic continues to worsen, and it has grown increasingly complex by coinvolvement of prescription and illicit drugs,” Lawrence Scholl, PhD, MPH, and his associates at the Centers for Disease Control & Prevention wrote in the Morbidity and Mortality Weekly Report.
The new statistics provide more evidence that 2017 marked “a sharp increase in what has characterized as the third wave of the opioid epidemic,” said drug and health policy researcher Stephen Crystal, PhD, of Rutgers University, New Brunswick, N.J., in an interview. He was referring to a wave that experts believe started in 2013 amid a spike in U.S. overdose deaths from fentanyl and other synthetic opioids.
The new report analyzes fatal drug overdose data from 2013 to 2017. According to the findings, the total number of those overdoses rose to 70,237 in 2017, up from 63,632 in 2016. The highest drug overdose death rates in 2017 were in West Virginia, followed by Ohio, Pennsylvania, and the District of Columbia.
Some statistics did not change much from 2016 to 2017: About two-thirds of the drug overdose deaths were linked to opioids in both years, and the death rate of cases linked to prescription drugs and heroin remained steady. (Death rates in the report were age adjusted.)
However, the percentage of fatal overdose cases linked to synthetic opioids grew 45% from 2016 to 2017. Overall, 60% of opioid-related fatal overdoses in 2017 involved synthetic opioids.
The report identifies increases in several areas from 2016 to 2017. Opioid-related drug overdose deaths among black people rose by 25%, and an analysis of data from 34 states and the District of Columbia found the highest increases in death rates in North Carolina (29%), Ohio (19%), and Maine (19%).
In regard to deaths linked to synthetic opioids specifically, the highest death rates in 2017 were in West Virginia (37 per 100,000), Ohio (32 per 100,000), and New Hampshire (30 per 100,000).
“Part of what we’re seeing in these increased numbers are individuals who have pain, can’t get prescribed opioids, and turn to street drugs,” Dr. Crystal said, adding that “abruptly cutting patients off is not good, and leaving patients with a lot of untreated pain is not good. If people are going to be discontinued [from opioids] or have their doses reduced, the taper needs to be done very slowly and carefully.”
Synthetic opioids were not the only drugs that are driving up fatal overdoses, as the death rates of cases linked to cocaine and psychostimulants (such as methamphetamine) jumped by more than a third in 2017.
“The most important thing these numbers are telling me is that it’s becoming more and more attractive to drug dealers to put fentanyl in the heroin, cocaine, and other drugs they sell,” Dr. Crystal said. “When that happens, dependence on street drugs becomes much more deadly. It’s almost impossible to get the dose right. Every time you shoot up, you’re taking a chance that you’ll overdose.”
The report had limitations, including the fact that details about drug use were missing from 12% (2016) and 15% (2017) of death certificates in fatal overdose cases. By state, the percentages of those death certificates that included drug information ranged from as little as 55% to 99%.
There’s some possible positive news: The report points to preliminary data from 2018 suggesting that the number of annual drug overdose deaths may be leveling off – although it says more analysis is needed to confirm the trend.
Dr. Crystal, however, is not celebrating. “I don’t see this as a good news story, really,” he said, adding that there’s “a little too much of people patting themselves on the back” because they’re proud of cutbacks in opioid prescriptions.
“This doesn’t have to do with the huge number of people who got started with opioids years ago” and are now at risk of using street drugs, he said. “We haven’t engaged that population at the rate we need to. And flattening out at 70,000 drug overdoses a year is not a good news story.”
Dr. Crystal reported no relevant disclosures.
SOURCE: Scholl L et al. MMWR. 2019 Jan 4;67(5152):1419-27.
FROM MMWR
How can I improve opioid safety at my hospital?
Quality improvement is essential
Case
A 67-year-old opioid-naive male with a history of obstructive sleep apnea and chronic kidney disease became unresponsive 2 days after hip replacement. Physical exam revealed a respiratory rate of 6 breaths/minute and oxygen saturation of 82%. He had received 6 doses of 6-mg IV morphine within the past 7 hours. How can I improve opioid safety at my hospital?

Background
Opioids are the most commonly prescribed class of medication in the hospital and the second–most common class causing adverse drug events (ADEs), the most serious being respiratory depression and death.1
Opioid ADEs and side effects can cause prolonged length of stay and patient suffering. These vary from potentially life-threatening events such as serotonin syndrome and adrenal insufficiency to more manageable problems still requiring intervention such as constipation, urinary retention, cognitive impairment, nausea, and vomiting. Treatment of side effects can lead to complications, including side effects from antiemetics and urinary tract infections from catheters.
A 4-year review found 700 deaths in the United States attributed to patient-controlled analgesia (PCA) use.2 Another study revealed that one out of every 200 patients has postoperative respiratory depression attributable to opioids.3
It is estimated that 2 million patients a year become chronic opioid users. Inpatient opioid prescribing contributes to this problem;4 for instance, 5.9% of patients after minor surgery and 6.5% after major surgery become chronic opioid users if discharged with an opioid.5 Calcaterra et al. found 25% of opioid-naive medical patients received an opioid at discharge from a medical service.6 Those patients had an odds ratio of 4.90 for becoming a chronic opioid user that year.6
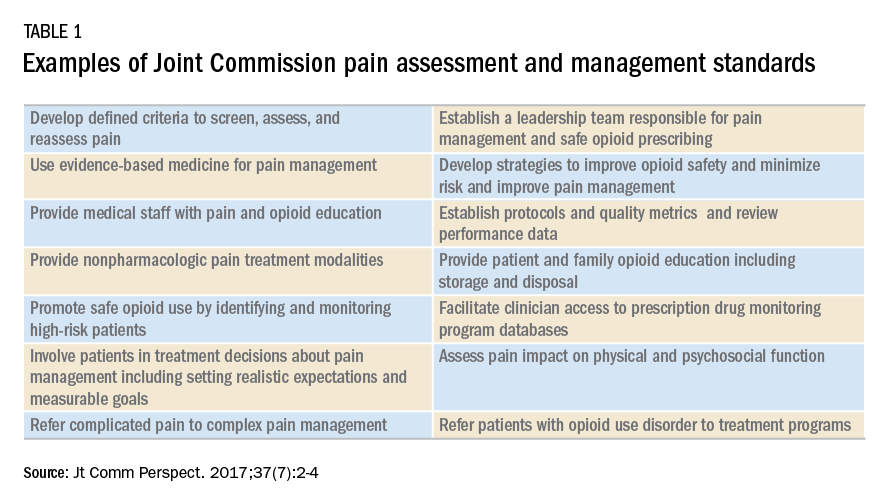
Most hospitals have incomplete or outdated policies and procedures for safe opioid prescribing and administration.7 The Joint Commission on Accreditation of Healthcare Organizations has specific pain standards for pain assessment, pain management, and safe opioid prescribing for hospitals. Additions and revisions were developed to go into effect Jan. 1, 2018. (Table 1)8
Quality improvement
Quality improvement (QI) is an effective way to improve opioid safety. The Society of Hospital Medicine has developed a QI guide, “Reducing adverse drug events related to opioids” or “RADEO,” to increase safety and decrease serious ADEs attributable to opioids.7
The steps in the RADEO program are as follows:
1. Assemble your team
It is critical to identify and include stakeholders from multiple disciplines on your project team. This team will be essential to develop a practical project, identify barriers, create solutions, and gain buy-in from medical staff and administrative leadership.
Front-line staff will have invaluable insight and need to be team members. The majority of interventions are performed by nurses; therefore, nursing leadership and input is essential. Representatives from pharmacy, information technology, and the quality department will be extremely valuable team members to guide you through the correct approach to a successful QI project.
A project champion can keep a high profile for the project and build and lead the team.
Identify an “executive sponsor” such as your CEO, CMO, or CNO. This leader will focus the team on issues critical to your organization, such as accreditation from governmental agencies, and help you obtain dedicated time and resources. Aligning with hospital goals will make your project a priority.
Coordinate with existing opioid initiative teams in the hospital to integrate efforts. This will keep the work of different departments aligned and allow you to learn from pitfalls and barriers the other groups experienced.
Patients/families contribute a unique and valuable perspective. Consider including a member of your hospital’s patient and family advisory council on your team.
2. Perform a needs assessment
Determine the current state of your hospital including: opioid prescribers; opioids prescribed; areas with increased ADEs or naloxone use; formulary restrictions, policies, or guidelines for monitoring, prescribing, and administering opioids; order sets; safety alerts; provider education; or patient education.
Your risk management or quality department may be able to a share root cause analysis of ADEs related to opioids. Joint Commission and CMS recommendations as well as other regulatory requirements may shape your QI interventions.8
Most importantly, review all of the concerns and priorities of your diverse team, which will identify areas of most pressing need and provide insight regarding needs you have not considered.
3. Develop SMART aims
Frame your QI project into a series of well-defined, clear SMART aims.9
Specific: Who will carry out the intervention? Who is your target population? What will be improved? In what way will it be improved?
Measurable: What will be measured? How it will be measured? Does it measure the outcome that needs to be improved?
Attainable/achievable: Ensure you have the resources and time to achieve the aim.
Relevant: Ensure each aim moves your team toward the project vision.
Timely: The aim should be achieved within a realistic time frame, long enough to meet goals but not so long that interest is lost.
An example of a poor aim is “Clinicians will improve knowledge of opioids.”
An example of a SMART aim is “75% of inpatient opioid prescribers including MDs, NPs, and PAs will complete and pass the opioid safety training module by July 1, 2018.”
4. Choose metrics
Outcome metrics measure if the intervention has improved patient safety, for example, measuring a decrease in opioid related ADEs. Structure metrics are the physical and organizational properties of the health care delivery setting, for example, the presence of EMR opioid safety. Processes are communication and practice patterns, for example, adherence to policy by examining nursing documentation of pain assessments.
5. Development and implementation 7,10
Use PDSA for development and implementation of the QI intervention.
Plan: Determine the intervention group such as a specific unit, number of units, and if there will be a control group. Determine who will collect the data, if baseline data will be collected, and who will analyze the data. Your information technology department will be essential to determine if the data can be collected via the EMR and how. Input from your multidisciplinary team is critical to anticipate unintended consequences, such as limiting opioid prescribing at discharge inadvertently increasing emergency department visits for pain control.
Do: Start as a small pilot study to make it as easy as possible to implement the project and begin data collection. A small-scale intervention will be more manageable and allow rapid responses to unanticipated problems.
Study: Analyze the data early to determine if the intervention is improving opioid safety and if alterations are needed. At this stage both process metrics (are processes being followed?) and outcome metrics (is the process leading to a desired outcome?) are important.
Act: Based on data analysis, refine the intervention as necessary. You may have to repeat cycles of PDSA to develop the final intervention. Then implement the final intervention to the entire hospital.

The Joint Commission recommendations for opioid QI
The Joint Commission recommends7 the following to reduce opioid-related respiratory depression:
- Effective processes which include processes such as tracking and analyzing ADEs related to opioids.
- Safe technology which includes using technology such as the EMR to monitor opioid prescribing of greater than 90 morphine milligram equivalents.
- Effective tools which include valid and reliable tools to improve opioid safety, such as the Pasero Opioid Induced Sedation Scale (POSS).
- Opioid education and training which includes provider and patient education such as patient discharge education.
Education
Develop educational interventions to ensure medical and hospital staff are aware of new processes, with an emphasis on “why.”7 If possible, use web-based programs that provide CME. Improve education interventions by using multiple live, interactive, and multimedia exposures.
Principles for successful interventions
- Keep it simple for the end user. This makes it more likely that the intervention is performed. Minimize complex tasks such as calculations and if possible design automated processes.
- Build your process into current work flow. If possible simplify or streamline work flow. A project that competes with staff’s other tasks and competing priorities is doomed to fail. It is critical to have input from those performing the intervention to develop a user-friendly and less disruptive intervention.
- Design reliability into the process. Make your intervention the default action. Build prompts into the work flow. Standardize the intervention into the work flow. And, consider having the intervention at scheduled intervals.7
Opioid safety QI interventions
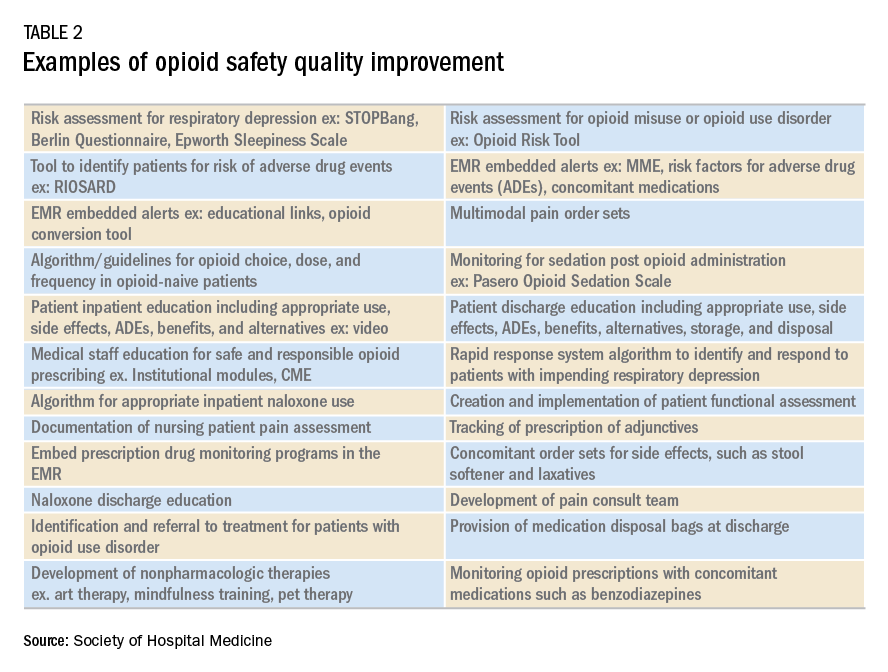
Interventions for improving opioid safety and reducing opioid -elated ADEs may be generalized into areas including risk screening and assessment, pain treatment, opioid administration, pain assessment, post opioid administration monitoring, and patient and provider education (Table 2).7
Back to the case
The patient received naloxone. His respiratory rate and oxygen saturation returned to normal. His dose of morphine was reduced and his interval increased. A multimodal approach was implemented including low-dose scheduled acetaminophen. There were no further ADEs while maintaining good pain control.
A multidisciplinary opioid task force was created and performed a hospital-wide review of opioid ADEs. Opportunities for improvement were identified and new procedures implemented. The Pasero opioid sedation scale (POSS) was added to the nursing work flow to monitor patients who received an opioid for sedation. An algorithm was developed for opioid-naive patients including guidance for opioid selection, dosing, and frequency. Multiple pain control modalities were added to pain control order sets. Annual training was developed for opioid prescribers, pharmacists, and nurses regarding safe and responsible use of opioids.
And, lastly, in-hospital and discharge patient education was developed for patients and families to be well-informed of opioid risk and benefit including how to identify and respond to ADEs.
Bottom line
Quality improvement is an effective method to improve patient safety and reduce serious adverse events related to opioids in the hospital setting.
Dr. Holmes-Maybank, is codirector, Fundamentals of Patient Care Year 1 and Internship 101, and chair, Clinical Competency Examination Committee, division of hospital medicine, Medical University of South Carolina. Dr. Frederickson is medical director, Hospital Medicine and Palliative Care at CHI Health, Omaha, Neb., and assistant professor at Creighton University School of Medicine, Omaha.
References
1. Davies EC et al. Adverse drug reactions in hospital inpatients: a prospective analysis of 3695 patient-episodes. PLoS One. 2009;4(2):e4439. doi: 10.1371/journal.pone.0004439. Epub 2009 Feb 11.
2. Association for the Advancement of Medical Instrumentation. Infusing patients safely: Priority issues from the AAMI/FDA Infusion Device Summit. 2010;1-39.
3. Dahan Aet al. Incidence, reversal, and prevention of opioid-induced respiratory depression. Anesthesiology. 2010;112:226-238. doi: 10.1097/ALN.0b013e3181c38c25.
4. Estimate about opioid users.
5. Brummett CM et al. New persistent opioid use after minor and major surgical procedures in U.S. adults. JAMA Surg. 2017;152(6):e170504. doi: 10.1001/jamasurg.2017.0504.
6. Calcaterra SL et al. Opioid prescribing at hospital discharge contributes to chronic opioid use. J Gen Intern Med. 2016;31(5):478-85. doi: 10.1007/s11606-015-3539-4.
7. Frederickson TW et al. Reducing adverse drug events related to opioids implementation guide. Philadelphia: Society of Hospital Medicine, 2015.
8. Joint Commission enhances pain assessment and management requirements for accredited hospitals. The Joint Commission Perspectives. 2017;37(7):2-4.
9. Minnesota Department of Health. SMART objectives.
10. Agency for Healthcare Research and Quality. Health Literacy Universal Precautions Toolkit, 2nd Edition.
Plan-Do-Study-Act (PDSA) Directions and Examples.
Recommended reading
Dowell D et al. CDC guideline for prescribing opioids for chronic pain – United States, 2016. Recommendations and Reports. 2016 Mar 18;65(1):1-49.
Frederickson TW et al. Using the 2018 guidelines from the Joint Commission to kickstart your hospital’s program to reduce opioid-induced ventilatory impairment. Anesthesia Patient Safety Foundation Newsletter. 2018;33(1):1-32.
Herzig SJ et al. Safe opioid prescribing for acute noncancer pain in hospitalized adults: a systematic review of existing guidelines. J Hosp Med. 2018 Apr;13(4):256-62. doi: 10.12788/jhm.2979.
Herzig SJ et al. Improving the safety of opioid use for acute noncancer pain in hospitalized adults: a consensus statement from the society of hospital medicine. J Hosp Med. 2018 Apr;13(4):263-71. doi: 10.12788/jhm.2980.
Joint Commission enhances pain assessment and management requirements for accredited hospitals. The Joint Commission Perspectives. 2017;37(7):2-4.
Key points
- Quality improvement is required by the Joint Commission and is an effective method to improve opioid safety in the hospital setting.
- It is critical to the success of a QI project to develop a multidisciplinary team.
- Input from frontline users of the intervention is essential to produce an effective intervention.
- Executive sponsorship and aligning the goals of your QI project with those of your institution will prioritize your project and increase resource availability.
Quiz
1. Based on a needs assessment at your hospital you assemble a multidisciplinary team to improve education for patients discharged on opioids. You recognize the importance of multidisciplinary input to develop a successful intervention for discharge education. Essential team members include all EXCEPT the following:
a. Executive sponsor
b. Patient representative
c. Nursing
d. Medical student representative ---- CORRECT
Explanation: The assembly of a multidisciplinary team is critical to the success of a QI intervention. An executive sponsor may assist you in aligning your goals with that of the hospital and provide resources for its development and implementation. Patient input would help determine how to best deliver the education. Lastly, the individuals carrying out the intervention are essential to develop an intervention that will easy for the end user and increase the likelihood of being used, in this case nursing.
2. You performed a review of naloxone use at your hospital and find that it is greater than similar hospitals. Prior to starting the QI project, you review SHM’s “Reducing adverse events related to opioids implementation guide” and learn that keys to success for QI implementation include:
a. A team of primarily hospitalists
b. Implementing the intervention hospital wide
c. Information technology input for data collection ---- CORRECT
d. No team – it is more effective to work alone
Explanation: Successful implementation of a QI project involves a multidisciplinary team. It is critical to involve information technology early in the development of the project to determine how and if the data can be collected from the EMR. It is best to pilot the intervention on one or two units to make alterations as needed rapidly and perfect the final intervention prior to rolling it out to the entire hospital.
3. You have assembled a multidisciplinary team to respond to the newly revised JCAHO pain standards. An example of a requirement from the new and revised JCAHO standards for pain assessment and management includes:
a. Programs for physician wellness
b. No opioids for chronic pain
c. No more than 5 days of opioids for acute pain
d. Nonpharmacologic pain management options ---- CORRECT
Explanation: JCAHO released new and revised requirements for pain assessment and management including offering nonpharmacologic pain management options. (See Table 1)
4. Your multidisciplinary QI team decides to develop a project to reduce respiratory depression in patients receiving opioids by monitoring for sedation with the Pasero Opioid Induced Sedation Scale. Principles for successful QI interventions include:
a. Complex tasks
b. Make the intervention a default action ---- CORRECT
c. Avoid EMR prompts
d. Competing with other hospital priorities
Explanation: Principles for successful QI interventions include keeping tasks simple, ensuring the intervention does not compete with other priorities, making the intervention the default action, installing prompts in the EMR, and standardizing the intervention into the work flow.
Quality improvement is essential
Quality improvement is essential
Case
A 67-year-old opioid-naive male with a history of obstructive sleep apnea and chronic kidney disease became unresponsive 2 days after hip replacement. Physical exam revealed a respiratory rate of 6 breaths/minute and oxygen saturation of 82%. He had received 6 doses of 6-mg IV morphine within the past 7 hours. How can I improve opioid safety at my hospital?
Background
Opioids are the most commonly prescribed class of medication in the hospital and the second–most common class causing adverse drug events (ADEs), the most serious being respiratory depression and death.1
Opioid ADEs and side effects can cause prolonged length of stay and patient suffering. These vary from potentially life-threatening events such as serotonin syndrome and adrenal insufficiency to more manageable problems still requiring intervention such as constipation, urinary retention, cognitive impairment, nausea, and vomiting. Treatment of side effects can lead to complications, including side effects from antiemetics and urinary tract infections from catheters.
A 4-year review found 700 deaths in the United States attributed to patient-controlled analgesia (PCA) use.2 Another study revealed that one out of every 200 patients has postoperative respiratory depression attributable to opioids.3
It is estimated that 2 million patients a year become chronic opioid users. Inpatient opioid prescribing contributes to this problem;4 for instance, 5.9% of patients after minor surgery and 6.5% after major surgery become chronic opioid users if discharged with an opioid.5 Calcaterra et al. found 25% of opioid-naive medical patients received an opioid at discharge from a medical service.6 Those patients had an odds ratio of 4.90 for becoming a chronic opioid user that year.6
Most hospitals have incomplete or outdated policies and procedures for safe opioid prescribing and administration.7 The Joint Commission on Accreditation of Healthcare Organizations has specific pain standards for pain assessment, pain management, and safe opioid prescribing for hospitals. Additions and revisions were developed to go into effect Jan. 1, 2018. (Table 1)8
Quality improvement
Quality improvement (QI) is an effective way to improve opioid safety. The Society of Hospital Medicine has developed a QI guide, “Reducing adverse drug events related to opioids” or “RADEO,” to increase safety and decrease serious ADEs attributable to opioids.7
The steps in the RADEO program are as follows:
1. Assemble your team
It is critical to identify and include stakeholders from multiple disciplines on your project team. This team will be essential to develop a practical project, identify barriers, create solutions, and gain buy-in from medical staff and administrative leadership.
Front-line staff will have invaluable insight and need to be team members. The majority of interventions are performed by nurses; therefore, nursing leadership and input is essential. Representatives from pharmacy, information technology, and the quality department will be extremely valuable team members to guide you through the correct approach to a successful QI project.
A project champion can keep a high profile for the project and build and lead the team.
Identify an “executive sponsor” such as your CEO, CMO, or CNO. This leader will focus the team on issues critical to your organization, such as accreditation from governmental agencies, and help you obtain dedicated time and resources. Aligning with hospital goals will make your project a priority.
Coordinate with existing opioid initiative teams in the hospital to integrate efforts. This will keep the work of different departments aligned and allow you to learn from pitfalls and barriers the other groups experienced.
Patients/families contribute a unique and valuable perspective. Consider including a member of your hospital’s patient and family advisory council on your team.
2. Perform a needs assessment
Determine the current state of your hospital including: opioid prescribers; opioids prescribed; areas with increased ADEs or naloxone use; formulary restrictions, policies, or guidelines for monitoring, prescribing, and administering opioids; order sets; safety alerts; provider education; or patient education.
Your risk management or quality department may be able to a share root cause analysis of ADEs related to opioids. Joint Commission and CMS recommendations as well as other regulatory requirements may shape your QI interventions.8
Most importantly, review all of the concerns and priorities of your diverse team, which will identify areas of most pressing need and provide insight regarding needs you have not considered.
3. Develop SMART aims
Frame your QI project into a series of well-defined, clear SMART aims.9
Specific: Who will carry out the intervention? Who is your target population? What will be improved? In what way will it be improved?
Measurable: What will be measured? How it will be measured? Does it measure the outcome that needs to be improved?
Attainable/achievable: Ensure you have the resources and time to achieve the aim.
Relevant: Ensure each aim moves your team toward the project vision.
Timely: The aim should be achieved within a realistic time frame, long enough to meet goals but not so long that interest is lost.
An example of a poor aim is “Clinicians will improve knowledge of opioids.”
An example of a SMART aim is “75% of inpatient opioid prescribers including MDs, NPs, and PAs will complete and pass the opioid safety training module by July 1, 2018.”
4. Choose metrics
Outcome metrics measure if the intervention has improved patient safety, for example, measuring a decrease in opioid related ADEs. Structure metrics are the physical and organizational properties of the health care delivery setting, for example, the presence of EMR opioid safety. Processes are communication and practice patterns, for example, adherence to policy by examining nursing documentation of pain assessments.
5. Development and implementation 7,10
Use PDSA for development and implementation of the QI intervention.
Plan: Determine the intervention group such as a specific unit, number of units, and if there will be a control group. Determine who will collect the data, if baseline data will be collected, and who will analyze the data. Your information technology department will be essential to determine if the data can be collected via the EMR and how. Input from your multidisciplinary team is critical to anticipate unintended consequences, such as limiting opioid prescribing at discharge inadvertently increasing emergency department visits for pain control.
Do: Start as a small pilot study to make it as easy as possible to implement the project and begin data collection. A small-scale intervention will be more manageable and allow rapid responses to unanticipated problems.
Study: Analyze the data early to determine if the intervention is improving opioid safety and if alterations are needed. At this stage both process metrics (are processes being followed?) and outcome metrics (is the process leading to a desired outcome?) are important.
Act: Based on data analysis, refine the intervention as necessary. You may have to repeat cycles of PDSA to develop the final intervention. Then implement the final intervention to the entire hospital.
The Joint Commission recommendations for opioid QI
The Joint Commission recommends7 the following to reduce opioid-related respiratory depression:
- Effective processes which include processes such as tracking and analyzing ADEs related to opioids.
- Safe technology which includes using technology such as the EMR to monitor opioid prescribing of greater than 90 morphine milligram equivalents.
- Effective tools which include valid and reliable tools to improve opioid safety, such as the Pasero Opioid Induced Sedation Scale (POSS).
- Opioid education and training which includes provider and patient education such as patient discharge education.
Education
Develop educational interventions to ensure medical and hospital staff are aware of new processes, with an emphasis on “why.”7 If possible, use web-based programs that provide CME. Improve education interventions by using multiple live, interactive, and multimedia exposures.
Principles for successful interventions
- Keep it simple for the end user. This makes it more likely that the intervention is performed. Minimize complex tasks such as calculations and if possible design automated processes.
- Build your process into current work flow. If possible simplify or streamline work flow. A project that competes with staff’s other tasks and competing priorities is doomed to fail. It is critical to have input from those performing the intervention to develop a user-friendly and less disruptive intervention.
- Design reliability into the process. Make your intervention the default action. Build prompts into the work flow. Standardize the intervention into the work flow. And, consider having the intervention at scheduled intervals.7
Opioid safety QI interventions
Interventions for improving opioid safety and reducing opioid -elated ADEs may be generalized into areas including risk screening and assessment, pain treatment, opioid administration, pain assessment, post opioid administration monitoring, and patient and provider education (Table 2).7
Back to the case
The patient received naloxone. His respiratory rate and oxygen saturation returned to normal. His dose of morphine was reduced and his interval increased. A multimodal approach was implemented including low-dose scheduled acetaminophen. There were no further ADEs while maintaining good pain control.
A multidisciplinary opioid task force was created and performed a hospital-wide review of opioid ADEs. Opportunities for improvement were identified and new procedures implemented. The Pasero opioid sedation scale (POSS) was added to the nursing work flow to monitor patients who received an opioid for sedation. An algorithm was developed for opioid-naive patients including guidance for opioid selection, dosing, and frequency. Multiple pain control modalities were added to pain control order sets. Annual training was developed for opioid prescribers, pharmacists, and nurses regarding safe and responsible use of opioids.
And, lastly, in-hospital and discharge patient education was developed for patients and families to be well-informed of opioid risk and benefit including how to identify and respond to ADEs.
Bottom line
Quality improvement is an effective method to improve patient safety and reduce serious adverse events related to opioids in the hospital setting.
Dr. Holmes-Maybank, is codirector, Fundamentals of Patient Care Year 1 and Internship 101, and chair, Clinical Competency Examination Committee, division of hospital medicine, Medical University of South Carolina. Dr. Frederickson is medical director, Hospital Medicine and Palliative Care at CHI Health, Omaha, Neb., and assistant professor at Creighton University School of Medicine, Omaha.
References
1. Davies EC et al. Adverse drug reactions in hospital inpatients: a prospective analysis of 3695 patient-episodes. PLoS One. 2009;4(2):e4439. doi: 10.1371/journal.pone.0004439. Epub 2009 Feb 11.
2. Association for the Advancement of Medical Instrumentation. Infusing patients safely: Priority issues from the AAMI/FDA Infusion Device Summit. 2010;1-39.
3. Dahan Aet al. Incidence, reversal, and prevention of opioid-induced respiratory depression. Anesthesiology. 2010;112:226-238. doi: 10.1097/ALN.0b013e3181c38c25.
4. Estimate about opioid users.
5. Brummett CM et al. New persistent opioid use after minor and major surgical procedures in U.S. adults. JAMA Surg. 2017;152(6):e170504. doi: 10.1001/jamasurg.2017.0504.
6. Calcaterra SL et al. Opioid prescribing at hospital discharge contributes to chronic opioid use. J Gen Intern Med. 2016;31(5):478-85. doi: 10.1007/s11606-015-3539-4.
7. Frederickson TW et al. Reducing adverse drug events related to opioids implementation guide. Philadelphia: Society of Hospital Medicine, 2015.
8. Joint Commission enhances pain assessment and management requirements for accredited hospitals. The Joint Commission Perspectives. 2017;37(7):2-4.
9. Minnesota Department of Health. SMART objectives.
10. Agency for Healthcare Research and Quality. Health Literacy Universal Precautions Toolkit, 2nd Edition.
Plan-Do-Study-Act (PDSA) Directions and Examples.
Recommended reading
Dowell D et al. CDC guideline for prescribing opioids for chronic pain – United States, 2016. Recommendations and Reports. 2016 Mar 18;65(1):1-49.
Frederickson TW et al. Using the 2018 guidelines from the Joint Commission to kickstart your hospital’s program to reduce opioid-induced ventilatory impairment. Anesthesia Patient Safety Foundation Newsletter. 2018;33(1):1-32.
Herzig SJ et al. Safe opioid prescribing for acute noncancer pain in hospitalized adults: a systematic review of existing guidelines. J Hosp Med. 2018 Apr;13(4):256-62. doi: 10.12788/jhm.2979.
Herzig SJ et al. Improving the safety of opioid use for acute noncancer pain in hospitalized adults: a consensus statement from the society of hospital medicine. J Hosp Med. 2018 Apr;13(4):263-71. doi: 10.12788/jhm.2980.
Joint Commission enhances pain assessment and management requirements for accredited hospitals. The Joint Commission Perspectives. 2017;37(7):2-4.
Key points
- Quality improvement is required by the Joint Commission and is an effective method to improve opioid safety in the hospital setting.
- It is critical to the success of a QI project to develop a multidisciplinary team.
- Input from frontline users of the intervention is essential to produce an effective intervention.
- Executive sponsorship and aligning the goals of your QI project with those of your institution will prioritize your project and increase resource availability.
Quiz
1. Based on a needs assessment at your hospital you assemble a multidisciplinary team to improve education for patients discharged on opioids. You recognize the importance of multidisciplinary input to develop a successful intervention for discharge education. Essential team members include all EXCEPT the following:
a. Executive sponsor
b. Patient representative
c. Nursing
d. Medical student representative ---- CORRECT
Explanation: The assembly of a multidisciplinary team is critical to the success of a QI intervention. An executive sponsor may assist you in aligning your goals with that of the hospital and provide resources for its development and implementation. Patient input would help determine how to best deliver the education. Lastly, the individuals carrying out the intervention are essential to develop an intervention that will easy for the end user and increase the likelihood of being used, in this case nursing.
2. You performed a review of naloxone use at your hospital and find that it is greater than similar hospitals. Prior to starting the QI project, you review SHM’s “Reducing adverse events related to opioids implementation guide” and learn that keys to success for QI implementation include:
a. A team of primarily hospitalists
b. Implementing the intervention hospital wide
c. Information technology input for data collection ---- CORRECT
d. No team – it is more effective to work alone
Explanation: Successful implementation of a QI project involves a multidisciplinary team. It is critical to involve information technology early in the development of the project to determine how and if the data can be collected from the EMR. It is best to pilot the intervention on one or two units to make alterations as needed rapidly and perfect the final intervention prior to rolling it out to the entire hospital.
3. You have assembled a multidisciplinary team to respond to the newly revised JCAHO pain standards. An example of a requirement from the new and revised JCAHO standards for pain assessment and management includes:
a. Programs for physician wellness
b. No opioids for chronic pain
c. No more than 5 days of opioids for acute pain
d. Nonpharmacologic pain management options ---- CORRECT
Explanation: JCAHO released new and revised requirements for pain assessment and management including offering nonpharmacologic pain management options. (See Table 1)
4. Your multidisciplinary QI team decides to develop a project to reduce respiratory depression in patients receiving opioids by monitoring for sedation with the Pasero Opioid Induced Sedation Scale. Principles for successful QI interventions include:
a. Complex tasks
b. Make the intervention a default action ---- CORRECT
c. Avoid EMR prompts
d. Competing with other hospital priorities
Explanation: Principles for successful QI interventions include keeping tasks simple, ensuring the intervention does not compete with other priorities, making the intervention the default action, installing prompts in the EMR, and standardizing the intervention into the work flow.
Topical antibiotic decolonizes S. aureus in NICU infants
Application of the topical antibiotic mupirocin to multiple body sites was reported to be safe and efficacious in eradicating Staphylococcus aureus (SA) colonization on infants in the neonatal intensive care unit (NICU), according to researchers at the University of Maryland, Baltimore.

Karen L. Kotloff, MD, and her colleagues conducted a phase 2 multicenter, open-label, randomized trial to assess the safety and efficacy of intranasal plus topical mupirocin in eradicating SA colonization in critically ill infants between April 2014 and May 2016.
“Staph aureus is a leading cause of sepsis in young children admitted to the NICU. Sepsis, which is systemic infection, can be fatal in infants. Thus, preventing these infections is very important in managing risk for babies in the NICU who are fragile and struggling with multiple medical problems,” said Dr. Kotloff in a university interview.
The researchers examined infants in the NICU at eight study centers who were less than 24 months old who underwent serial screening for nasal SA. Infants colonized with SA and were randomly assigned to receive 5 days of mupirocin versus no mupirocin to the intranasal, periumbilical, and perianal areas. Treatment effects were assessed on day 8 (primary decolonization) and day 22 (persistent decolonization) for all three body areas (Pediatrics. 2019 Jan 1. doi: 10.1542/peds.2018-1565).
Primary decolonization occurred in 62/66 (93.9%) of treated infants and 3/64 (4.7%) of the control infants (P less than .001). Persistent decolonization was seen in 21/46 (45.7%) of treated infants compared with 1/48 (2.1%) of the controls (P less than .001).
“This multicenter trial supervised by Dr. Kotloff provides strong support for a safe strategy to minimize Staphylococcus aureus infections in some of the most at-risk patients in any hospital, premature babies,” E. Albert Reece, MD, dean of the University of Maryland School of Medicine, said in a university press release commenting on the study.
Application of the topical antibiotic mupirocin to multiple body sites was reported to be safe and efficacious in eradicating Staphylococcus aureus (SA) colonization on infants in the neonatal intensive care unit (NICU), according to researchers at the University of Maryland, Baltimore.
Karen L. Kotloff, MD, and her colleagues conducted a phase 2 multicenter, open-label, randomized trial to assess the safety and efficacy of intranasal plus topical mupirocin in eradicating SA colonization in critically ill infants between April 2014 and May 2016.
“Staph aureus is a leading cause of sepsis in young children admitted to the NICU. Sepsis, which is systemic infection, can be fatal in infants. Thus, preventing these infections is very important in managing risk for babies in the NICU who are fragile and struggling with multiple medical problems,” said Dr. Kotloff in a university interview.
The researchers examined infants in the NICU at eight study centers who were less than 24 months old who underwent serial screening for nasal SA. Infants colonized with SA and were randomly assigned to receive 5 days of mupirocin versus no mupirocin to the intranasal, periumbilical, and perianal areas. Treatment effects were assessed on day 8 (primary decolonization) and day 22 (persistent decolonization) for all three body areas (Pediatrics. 2019 Jan 1. doi: 10.1542/peds.2018-1565).
Primary decolonization occurred in 62/66 (93.9%) of treated infants and 3/64 (4.7%) of the control infants (P less than .001). Persistent decolonization was seen in 21/46 (45.7%) of treated infants compared with 1/48 (2.1%) of the controls (P less than .001).
“This multicenter trial supervised by Dr. Kotloff provides strong support for a safe strategy to minimize Staphylococcus aureus infections in some of the most at-risk patients in any hospital, premature babies,” E. Albert Reece, MD, dean of the University of Maryland School of Medicine, said in a university press release commenting on the study.
FROM PEDIATRICS
Meal programs for dual eligibles
Do food delivery programs reduce the use of costly health services and decrease medical spending in a population of patients dually eligible for Medicare and Medicaid?

Researchers in Massachusetts wanted to determine whether home meal delivery of either medically tailored food or nontailored food reduces the use of selected health care services and medical spending in a sample of adult “dual eligibles.”
“Compared with matched nonparticipants, participants had fewer emergency department visits in both the medically tailored meal program and the nontailored food program,” the investigators found. “Participants in the medically tailored meal program also had fewer inpatient admissions and lower medical spending. Participation in the nontailored food program was not associated with fewer inpatient admissions but was associated with lower medical spending.”
Reference
Berkowitz SA et al. Meal delivery programs reduce the use of costly health care in dually eligible Medicare and Medicaid beneficiaries. Health Aff (Millwood). 2018 Apr;37(4):535-42.
Do food delivery programs reduce the use of costly health services and decrease medical spending in a population of patients dually eligible for Medicare and Medicaid?
Researchers in Massachusetts wanted to determine whether home meal delivery of either medically tailored food or nontailored food reduces the use of selected health care services and medical spending in a sample of adult “dual eligibles.”
“Compared with matched nonparticipants, participants had fewer emergency department visits in both the medically tailored meal program and the nontailored food program,” the investigators found. “Participants in the medically tailored meal program also had fewer inpatient admissions and lower medical spending. Participation in the nontailored food program was not associated with fewer inpatient admissions but was associated with lower medical spending.”
Reference
Berkowitz SA et al. Meal delivery programs reduce the use of costly health care in dually eligible Medicare and Medicaid beneficiaries. Health Aff (Millwood). 2018 Apr;37(4):535-42.
How to assess an Antimicrobial Stewardship Program
A study compares the merits of DOT and DOTA
The currently recommended method for hospital antimicrobial stewardship programs (ASPs) to measure antibiotic use is Days of Therapy/1,000 patient-days, but there are a few disadvantages of using the DOT, said Maryrose Laguio-Vila, MD, coauthor of a recent study on stewardship.

“For accurate measurement, it requires information technology (IT) support to assist an ASP in generating reports of antibiotic prescriptions and administrations to patients, often from an electronic medical record (EMR). In hospitals where there is no EMR, DOT is probably not easily done and would have to be manually extracted (a herculean task),” she said. “Second, DOT tends to be an aggregate measurement of antibiotics used at an institution or hospital location; if an ASP does a specific intervention targeting a group of antibiotics or infectious indication, changes in the hospital-wide DOT or drug-class DOT may not accurately reflect the exact impact of an ASP’s intervention.”
The paper offers an alternative/supplemental method for ASPs to quantify their impact on antibiotic use without using an EMR or needing IT support: Days of Therapy Avoided. “DOTA can be tracked prospectively (or retrospectively) with each intervention an ASP makes, and calculates an exact amount of antibiotic use avoided,” Dr. Laguio-Vila said. “If the ASP also tracks the types of antibiotic recommendations made according to infectious indication, comparison of DOTA between indications – such as pneumonia versus UTI [urinary tract infection] – can lead to ideas of which type of indication needs clinical guidelines development, or order set revision, or which type of infection the ASP should target to reduce high-risk antibiotics.”
Also, she added, because most ASPs have several types of interventions at once (such as education on pneumonia guidelines, as well as penicillin-allergy assessment), aggregate assessments of institutional antibiotic use like the DOT cannot quantify how much impact a specific intervention has accomplished. DOTA may offer a fairer assessment of the direct changes in antibiotic use resulting from specific ASP activities, because tracking DOTA is extracted from each specific patient intervention.
“Now that the Joint Commission has a requirement that all hospitals seeking JC accreditation have some form of an ASP in place and measure antibiotic use in some way at their institution, there may be numerous hospitals facing the same challenges with calculating a DOT. DOTA would meet these requirements, but in a ‘low tech’ way,” Dr. Laguio-Vila said. “For hospitalists with interests in being the antibiotic steward or champion for their institution, DOTA is an option for measuring antibiotic use.”
Reference
Datta S et al. Days of therapy avoided: A novel method for measuring the impact of an antimicrobial stewardship program to stop antibiotics. J Hosp Med. 2018 Feb 8. doi: 10.12788/jhm.2927.
A study compares the merits of DOT and DOTA
A study compares the merits of DOT and DOTA
The currently recommended method for hospital antimicrobial stewardship programs (ASPs) to measure antibiotic use is Days of Therapy/1,000 patient-days, but there are a few disadvantages of using the DOT, said Maryrose Laguio-Vila, MD, coauthor of a recent study on stewardship.
“For accurate measurement, it requires information technology (IT) support to assist an ASP in generating reports of antibiotic prescriptions and administrations to patients, often from an electronic medical record (EMR). In hospitals where there is no EMR, DOT is probably not easily done and would have to be manually extracted (a herculean task),” she said. “Second, DOT tends to be an aggregate measurement of antibiotics used at an institution or hospital location; if an ASP does a specific intervention targeting a group of antibiotics or infectious indication, changes in the hospital-wide DOT or drug-class DOT may not accurately reflect the exact impact of an ASP’s intervention.”
The paper offers an alternative/supplemental method for ASPs to quantify their impact on antibiotic use without using an EMR or needing IT support: Days of Therapy Avoided. “DOTA can be tracked prospectively (or retrospectively) with each intervention an ASP makes, and calculates an exact amount of antibiotic use avoided,” Dr. Laguio-Vila said. “If the ASP also tracks the types of antibiotic recommendations made according to infectious indication, comparison of DOTA between indications – such as pneumonia versus UTI [urinary tract infection] – can lead to ideas of which type of indication needs clinical guidelines development, or order set revision, or which type of infection the ASP should target to reduce high-risk antibiotics.”
Also, she added, because most ASPs have several types of interventions at once (such as education on pneumonia guidelines, as well as penicillin-allergy assessment), aggregate assessments of institutional antibiotic use like the DOT cannot quantify how much impact a specific intervention has accomplished. DOTA may offer a fairer assessment of the direct changes in antibiotic use resulting from specific ASP activities, because tracking DOTA is extracted from each specific patient intervention.
“Now that the Joint Commission has a requirement that all hospitals seeking JC accreditation have some form of an ASP in place and measure antibiotic use in some way at their institution, there may be numerous hospitals facing the same challenges with calculating a DOT. DOTA would meet these requirements, but in a ‘low tech’ way,” Dr. Laguio-Vila said. “For hospitalists with interests in being the antibiotic steward or champion for their institution, DOTA is an option for measuring antibiotic use.”
Reference
Datta S et al. Days of therapy avoided: A novel method for measuring the impact of an antimicrobial stewardship program to stop antibiotics. J Hosp Med. 2018 Feb 8. doi: 10.12788/jhm.2927.
CDC: Flu activity ‘high’ in nine states
according to the Centers for Disease Control and Prevention.
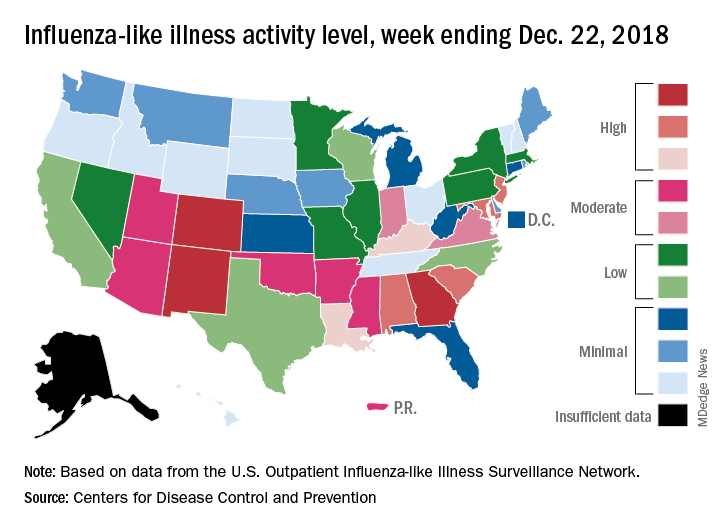
Patients with ILI made up an estimated 3.3% of outpatient visits for the week, which is up from 2.7% the previous week and well above the baseline rate of 2.2%, which the 2018-2019 flu season has now exceeded for the past 3 weeks, the CDC reported Dec. 28. ILI is defined “as fever (temperature of 100°F [37.8°C] or greater) and cough and/or sore throat.”
Three states – Colorado, Georgia, and New Mexico – are now at the highest level of flu activity on the CDC’s 1-10 scale, and nine states are in the “high” range (8-10), compared with two states in high range (both at level 10) for the week ending Dec. 15. Another seven states and Puerto Rico are now in the “moderate” range of 6-7, data from the CDC’s Outpatient ILI Surveillance Network show.
Four flu-related deaths in children were reported during the week ending Dec. 22, two of which occurred in previous weeks, which brings the total to 11 for the 2018-2019 season, the CDC reported.
according to the Centers for Disease Control and Prevention.
Patients with ILI made up an estimated 3.3% of outpatient visits for the week, which is up from 2.7% the previous week and well above the baseline rate of 2.2%, which the 2018-2019 flu season has now exceeded for the past 3 weeks, the CDC reported Dec. 28. ILI is defined “as fever (temperature of 100°F [37.8°C] or greater) and cough and/or sore throat.”
Three states – Colorado, Georgia, and New Mexico – are now at the highest level of flu activity on the CDC’s 1-10 scale, and nine states are in the “high” range (8-10), compared with two states in high range (both at level 10) for the week ending Dec. 15. Another seven states and Puerto Rico are now in the “moderate” range of 6-7, data from the CDC’s Outpatient ILI Surveillance Network show.
Four flu-related deaths in children were reported during the week ending Dec. 22, two of which occurred in previous weeks, which brings the total to 11 for the 2018-2019 season, the CDC reported.
No change in postoperative pain with restrictive opioid protocol
Opioid prescriptions after gynecologic surgery can be significantly reduced without impacting postoperative pain scores or complication rates, according to a paper published in JAMA Network Open.
A tertiary care comprehensive care center implemented an ultrarestrictive opioid prescription protocol (UROPP) then evaluated the outcomes in a case-control study involving 605 women undergoing gynecologic surgery, compared with 626 controls treated before implementation of the new protocol.
The ultrarestrictive protocol was prompted by frequent inquiries from patients who had used very little of their prescribed opioids after surgery and wanted to know what to do with the unused pills.
The new protocol involved a short preoperative counseling session about postoperative pain management. Following that, ambulatory surgery, minimally invasive surgery, or laparotomy patients were prescribed a 7-day supply of nonopioid pain relief. Laparotomy patients were also prescribed a 3-day supply of an oral opioid.
Any patients who required more than five opioid doses in the 24 hours before discharge were also prescribed a 3-day supply of opioid pain medication as needed, and all patients had the option of requesting an additional 3-day opioid refill.
Researchers saw no significant differences between the two groups in mean postoperative pain scores 2 weeks after surgery, and a similar number of patients in each group requested an opioid refill. There was also no significant difference in the number of postoperative complications between groups.
Implementation of the ultrarestrictive protocol was associated with significant declines in the mean number of opioid pills prescribed dropped from 31.7 to 3.5 in all surgical cases, from 43.6 to 12.1 in the laparotomy group, from 38.4 to 1.3 in the minimally invasive surgery group, and from 13.9 to 0.2 in patients who underwent ambulatory surgery.
“These data suggest that the implementation of a UROPP in a large surgical service is feasible and safe and was associated with a significantly decreased number of opioids dispensed during the perioperative period, particularly among opioid-naive patients,” wrote Jaron Mark, MD, of the department of gynecologic oncology at Roswell Park Comprehensive Cancer Center, Buffalo, N.Y., and his coauthors. “The opioid-sparing effect was also marked and statistically significant in the laparotomy group, where most patients remained physically active and recovered well with no negative sequelae or elevated pain score after surgery.”
The researchers also noted that patients who were discharged home with an opioid prescription were more likely to call and request a refill within 30 days, compared with patients who did not receive opioids at discharge.
The study was supported by the Roswell Park Comprehensive Cancer Center, the National Cancer Institute and the Roswell Park Alliance Foundation. Two authors reported receiving fees and nonfinancial support from the private sector unrelated to the study.
SOURCE: Mark J et al. JAMA Netw Open. 2018 Dec 7. doi: 10.1001/jamanetworkopen.2018.5452.
The ultrarestrictive postoperative opioid prescribing protocol described in this study is a promising strategy for reducing opioid prescribing without increasing pain and limiting the potential for diversion and misuse of opioids. An important element of this protocol is the preoperative counseling, because setting patient expectations is likely to be an important factor in improving postoperative outcomes.
It is also worth noting that this study focused on patients undergoing major and minor gynecologic surgery, so more research is needed to explore these outcomes particularly among patients undergoing procedures that may be associated with a higher risk of persistent postoperative pain and/or opioid use. It is also a management strategy explored in patients at low risk of chronic postoperative opioid use, but a similar pathway should be developed and explored in more high-risk patients.
Dr. Jennifer M. Hah is from the department of anesthesiology, perioperative, and pain management at Stanford University (Calif.). These comments are taken from an accompanying editorial (JAMA Network Open. 2018 Dec 7. doi: 10.1001/jamanetworkopen.2018.5432). No conflicts of interest were reported.
Opioid prescriptions after gynecologic surgery can be significantly reduced without impacting postoperative pain scores or complication rates, according to a paper published in JAMA Network Open.
A tertiary care comprehensive care center implemented an ultrarestrictive opioid prescription protocol (UROPP) then evaluated the outcomes in a case-control study involving 605 women undergoing gynecologic surgery, compared with 626 controls treated before implementation of the new protocol.
The ultrarestrictive protocol was prompted by frequent inquiries from patients who had used very little of their prescribed opioids after surgery and wanted to know what to do with the unused pills.
The new protocol involved a short preoperative counseling session about postoperative pain management. Following that, ambulatory surgery, minimally invasive surgery, or laparotomy patients were prescribed a 7-day supply of nonopioid pain relief. Laparotomy patients were also prescribed a 3-day supply of an oral opioid.
Any patients who required more than five opioid doses in the 24 hours before discharge were also prescribed a 3-day supply of opioid pain medication as needed, and all patients had the option of requesting an additional 3-day opioid refill.
Researchers saw no significant differences between the two groups in mean postoperative pain scores 2 weeks after surgery, and a similar number of patients in each group requested an opioid refill. There was also no significant difference in the number of postoperative complications between groups.
Implementation of the ultrarestrictive protocol was associated with significant declines in the mean number of opioid pills prescribed dropped from 31.7 to 3.5 in all surgical cases, from 43.6 to 12.1 in the laparotomy group, from 38.4 to 1.3 in the minimally invasive surgery group, and from 13.9 to 0.2 in patients who underwent ambulatory surgery.
“These data suggest that the implementation of a UROPP in a large surgical service is feasible and safe and was associated with a significantly decreased number of opioids dispensed during the perioperative period, particularly among opioid-naive patients,” wrote Jaron Mark, MD, of the department of gynecologic oncology at Roswell Park Comprehensive Cancer Center, Buffalo, N.Y., and his coauthors. “The opioid-sparing effect was also marked and statistically significant in the laparotomy group, where most patients remained physically active and recovered well with no negative sequelae or elevated pain score after surgery.”
The researchers also noted that patients who were discharged home with an opioid prescription were more likely to call and request a refill within 30 days, compared with patients who did not receive opioids at discharge.
The study was supported by the Roswell Park Comprehensive Cancer Center, the National Cancer Institute and the Roswell Park Alliance Foundation. Two authors reported receiving fees and nonfinancial support from the private sector unrelated to the study.
SOURCE: Mark J et al. JAMA Netw Open. 2018 Dec 7. doi: 10.1001/jamanetworkopen.2018.5452.
Key clinical point: A ultrarestrictive postoperative opioid protocol is not associated with higher postoperative pain scores.
Major finding: The protocol achieves significant reductions in opioid use.
Study details: A case-control study in 1,231 women undergoing gynecologic surgery.
Disclosures: The study was supported by the Roswell Park Comprehensive Cancer Center, the National Cancer Institute, and the Roswell Park Alliance Foundation. Two authors reported receiving fees and nonfinancial support from the private sector unrelated to the study.
Source: Mark J et al. JAMA Netw Open. 2018 Dec 7. doi: 10.1001/jamanetworkopen.2018.5452.
EHR stress linked to burnout
Physicians who experience stress related to the use of health information technology are twice as likely to experience burnout.

Rebekah Gardner, MD, of Brown University in Providence, R.I., and her colleagues surveyed all 4,197 Rhode Island physicians in 2017 to learn how the use of electronic health records affected their practices and their job satisfaction.
Just over a quarter (25.0%) of 1,792 respondents reported burnout. Among electronic health record users (91% of respondents), 70% reported health IT-related stress (J Am Med Inform Assoc. doi: 10.1093/jamia/ocy145).
“After adjustment, physicians reporting poor/marginal time for documentation had 2.8 times the odds of burnout (95% confidence interval, 2.0-4.1; P less than .0001) compared to those reporting sufficient time,” according to the researchers.
The team looked at three stress-related variables: whether the EHR adds to the frustration of one’s day; whether physicians felt they had sufficient time for documentation; and the amount of time spent on the EHR at home. Variables were measured on a four- or five-point scale depending on the question related to the specific stress variable.
Almost two-thirds (64.2%) of respondents “agreed” or “strongly agreed” that EHRs add to the frustration of their day.
“It was the most commonly cited HIT-related stress measure in almost every specialty, with the highest prevalence among emergency physicians (77.6%),” the investigators wrote.
More than a third of physicians (37.7%) reported “moderately high” or “excessive” time spent on EHRs at home; this metric was the most commonly cited stress measure among pediatricians (63.6%).
Nearly half (46.4%) of physicians reported “poor” or “marginal” sufficiency of time for documentation.
“Presence of any 1 of the HIT-related stress measures was associated with approximately twice the odds of burnout among physician respondents,” Dr. Gardner and her colleagues noted, adding that “measuring and addressing HIT-related stress is an important step in reducing workforce burden and improving the care of our patients.”
To alleviate burnout, the authors recommended increased use of scribes, use of medical assistants to help create a more team-based documentation function, improved EHR training, providing more time during the day for documentation, and streamlining documentation expectations, with certain culture shifts needed in some cases (i.e., banning work-related email and clinical tasks for vacationing physicians).
SOURCE: Gardner R et al. J Am Med Inform Assoc. doi: 10.1093/jamia/ocy145.
Physicians who experience stress related to the use of health information technology are twice as likely to experience burnout.
Rebekah Gardner, MD, of Brown University in Providence, R.I., and her colleagues surveyed all 4,197 Rhode Island physicians in 2017 to learn how the use of electronic health records affected their practices and their job satisfaction.
Just over a quarter (25.0%) of 1,792 respondents reported burnout. Among electronic health record users (91% of respondents), 70% reported health IT-related stress (J Am Med Inform Assoc. doi: 10.1093/jamia/ocy145).
“After adjustment, physicians reporting poor/marginal time for documentation had 2.8 times the odds of burnout (95% confidence interval, 2.0-4.1; P less than .0001) compared to those reporting sufficient time,” according to the researchers.
The team looked at three stress-related variables: whether the EHR adds to the frustration of one’s day; whether physicians felt they had sufficient time for documentation; and the amount of time spent on the EHR at home. Variables were measured on a four- or five-point scale depending on the question related to the specific stress variable.
Almost two-thirds (64.2%) of respondents “agreed” or “strongly agreed” that EHRs add to the frustration of their day.
“It was the most commonly cited HIT-related stress measure in almost every specialty, with the highest prevalence among emergency physicians (77.6%),” the investigators wrote.
More than a third of physicians (37.7%) reported “moderately high” or “excessive” time spent on EHRs at home; this metric was the most commonly cited stress measure among pediatricians (63.6%).
Nearly half (46.4%) of physicians reported “poor” or “marginal” sufficiency of time for documentation.
“Presence of any 1 of the HIT-related stress measures was associated with approximately twice the odds of burnout among physician respondents,” Dr. Gardner and her colleagues noted, adding that “measuring and addressing HIT-related stress is an important step in reducing workforce burden and improving the care of our patients.”
To alleviate burnout, the authors recommended increased use of scribes, use of medical assistants to help create a more team-based documentation function, improved EHR training, providing more time during the day for documentation, and streamlining documentation expectations, with certain culture shifts needed in some cases (i.e., banning work-related email and clinical tasks for vacationing physicians).
SOURCE: Gardner R et al. J Am Med Inform Assoc. doi: 10.1093/jamia/ocy145.
FROM JAMIA
Key clinical point: EHR-related stress is a measurable predictor of physician burnout.
Major finding: Seventy percent of EHR users who responded to a survey reported stress related to the use of health information technology.
Study details: Survey of all 4,197 physicians in Rhode Island; 1,792 (43%) responded.
Disclosures: The Rhode Island Department of Health funded the study. The authors reported no conflicts of interest.
Source: Gardner R et al. J Am Med Inform Assoc. doi: 10.1093/jamia/ocy145.
2018-2019 flu season starts in earnest
National flu activity moved solidly into above-average territory during the week ending Dec. 15, as Colorado and Georgia took the lead with the highest activity levels in the country, according to the Centers for Disease Control and Prevention.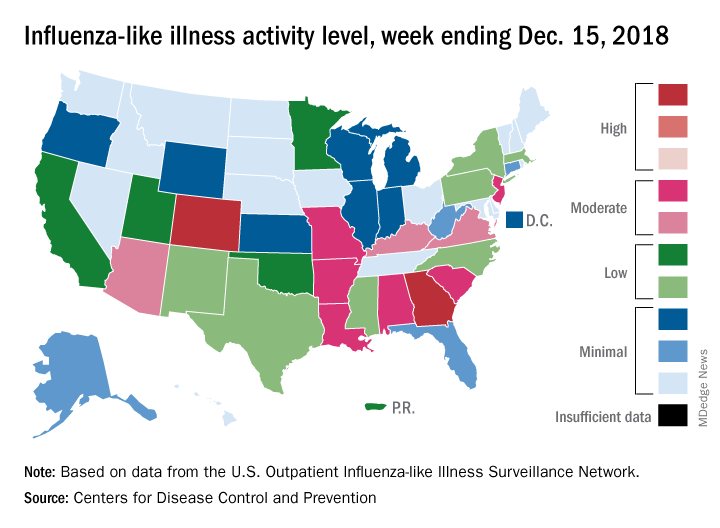
The proportion of outpatient visits for influenza-like illness (ILI) was 2.7% for the week, which was up from 2.3% the previous week and above the national baseline of 2.2%, the CDC reported. ILI is defined “as fever (temperature of 100°F [37.8°C] or greater) and cough and/or sore throat.”
Colorado and Georgia both reported ILI activity of 10 on the CDC’s 1-10 scale, making them the only states in the “high” range (8-10). Nine states and New York City had activity levels in the “moderate” range (6-7), Puerto Rico and 11 states were in the “low” range (4-5), and 28 states and the District of Columbia were in the “minimal” range (1-3), the CDC said.
During the comparable period of last year’s high-severity flu season, which ultimately resulted in 900,000 flu-related hospitalizations and 80,000 deaths (185 pediatric), nine states were already at level 10. For the 2018-2019 season so far, there have been seven ILI-related pediatric deaths, CDC data show.