User login
Short-course therapy for recurrent genital herpes and herpes labialis
- Consider giving patients an oral antiviral (OAV) medication to self-administer when HSV prodromal symptoms occur.
- Patient-initiated, short-course, high-dose OAV treatment of recurrent HSV outbreaks may be as effective as the traditional, longer-course regimens.
Hit early, hit hard. That expression arose during the evolution of treatment for human immunodeficiency virus (HIV).1 While this approach has not lived up to expectations for HIV treatment, it may have found its place in the treatment of recurrent herpes simplex virus (HSV) infections.
Our review focuses on episodic treatment of acute recurrent HSV outbreaks for immunocompetent persons. We do not discuss suppressive therapy, which may be indicated for frequent or severe recurrences (6 or more per year) in immunocompetent persons, for immunocompromised patients, or as an adjunctive measure to reduce genital herpes transmission.2
As we will describe in detail, the efficacy of the new short-course therapy is, at minimum, comparable to that seen with the older, longer-course trials of topical and oral antiviral therapy. In one head-to-head comparison, Leone et al compared a short-course regimen (3 days) of valacyclovir with 5 days of treatment; they found no difference in results.3 If the efficacy of short-course treatment is the same as that of longer courses, the increased convenience and expected improvement in patient adherence with these new regimens argue strongly in their favor. (See Scope of the problem.)
The strategy: Take advantage of a brief therapeutic window
The innate and acquired immune responses of chronically infected, immunocompetent persons rapidly limit cutaneous viral replication, thereby truncating the duration of recurrent HSV outbreaks.13,14 In both recurrent herpes labialis and genital herpes, HSV viral titers peak in the first 24 hours following lesion onset (FIGURE 1A).13-15
Herpes labialis lesion size and pain are also greatest in the first 24 hours.13,16 Most herpes labialis lesions progress from the vesicle stage to the ulcer/soft crust stage within 48 hours, with a hard crust forming by day 2 or 3 (FIGURE 1B).17
With genital lesions, crust formation depends on whether the skin area is dry (3–4 days) or moist (8–9 days).14
The likely events are a burst of virus replication in the first 24 hours of outbreak that lyses basal keratinocytes in a discreet area of epidermis innervated by the infected neuron(s), followed by a vigorous immune response that curtails the infection and creates, in part, the clinical disease (erythema, swelling, vesiculation, and ulceration). The subsequent elements of the illness, which are the majority of the lesion course, are related to wound healing
Recognizing the window. Given the brief period of viral replication and the rapid evolution of lesions, the therapeutic window for treating HSV outbreaks with antiviral drugs is both early and short, making it problematic to effectively treat HSV recurrences. Patients often have mature lesions by the time they consult a physician, rendering subsequent anti-viral treatment less effective.18 However, before lesions appear, many patients experience prodromal symptoms such as pain, burning, or itching.13,18 These symptoms can be a prompt to start treatment early, thereby taking advantage of the transient therapeutic window.
If a patient is able to self-administer therapy when prodromal symptoms occur, there may be a greater benefit to treatment. Giving patients drugs for self-administration is therefore an important strategy in managing HSV recurrences.
Traditionally, patient-initiated episodic therapy for recurrent genital herpes and herpes labialis has involved multiple daily doses of topical or oral antiviral agents for 4 to 5 days.19-26 Studies of the pathogenesis of HSV recurrences, however, indicate—as said earlier—that the period of virus replication is early and brief, such that a shorter duration of treatment might be more appropriate and equally effective. Other recent clinical studies have indicated that patient-initiated, short-course, high-dose OAV treatment of recurrent HSV infections may be as effective as the traditional therapies.3,27-30 In the section that follows, we examine and compare the results of these trials. (See The agents and how they work.)
FIGURE 1A
Lesion HSV-1 titer peaks within 24 hours of onset of herpes labialis lesions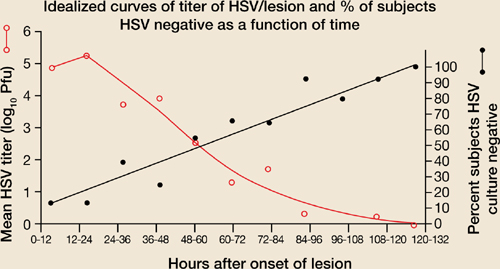
Source: Krueger et al, J Clin Epidemiol Derm 1978.15 Reproduced with permission from GG Krueger.
FIGURE 1B
Hard crust formation occurs by 48 to 72 hours of onset of herpes labialis lesions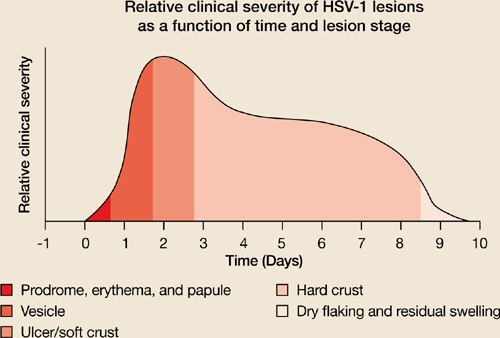
Source: Spruance, Sem Dermatol 1992.17 With permission from Elsevier.
Clinical trials: Short-course, high-dose, patient-initiated episodic OAV therapy for recurrent genital herpes
Three-day vs 5-day valacyclovir therapy. The efficacy of 3-day treatment with oral valacyclovir was compared with that of 5-day treatment in immunocompetent adults with a history of ≥4 episodes of recurrent genital herpes and confirmed HSV infection.3 Eight hundred participants were randomized to receive 500 mg twice daily valacyclovir for 3 days (and placebo for the remaining 2 days) or 500 mg twice daily for 5 days, and were required to self-administer therapy no later than 24 hours after the onset of symptoms.
Herpes simplex virus (HSV) type 1 (HSV-1) or type 2 (HSV-2) results in periodic, recurrent outbreaks of skin lesions after first infection. Herpes labialis (fever blisters or cold sores) is usually caused by HSV-1, while genital herpes is usually caused by HSV-2.4 HSV-2 lesions of the lips have been reported, and the incidence of genital herpes caused by HSV-1 is on the rise in the developed world, likely because of increased oral-genital sexual behavior.5,6 Patients with HSV-1 genital herpes typically have fewer recurrences than those with HSV-2 genital infection.7
The prevalence of HSV-1 and HSV-2 infection varies according to age, geography, gender, and population subgroup, such as people who exhibit high-risk sexual behavior.8 approximately 45% of americans are infected with HSV-1 by adolescence,8 and approximately 22% of all american adults are infected with HSV-2.9 The global prevalence of HSV is even greater: as many as 60% to 90% of older adults worldwide are seropositive for HSV-1, and as many as 30% are seropositive for HSV-2. HSV-2 seropositivity is more prevalent among women than men.8 overall, the burden of recurrent genital herpes outbreaks can have a profound, negative impact on patient quality of life.10,11 The psychological impact of recurrent herpes labialis has not been thoroughly investigated, but an undefined burden is thought to exist, particularly in young patients with frequent or severe recurrences.12
The primary endpoint was time to lesion healing (defined as the number of days from initiation of therapy to lesion reepithelialization). Secondary endpoints were pain duration, episode duration (defined as time from initiation of therapy to resolution of all symptoms) and percentage of patients with aborted lesions.
The 3-day valacyclovir treatment exhibited similar time to lesion healing, length of episode, and percentage of patients with aborted lesions as the 5-day treatment (TABLE 1), suggesting equal efficacy. Duration of pain was also similar (data not shown). Adverse events were similar for both treatment groups, with the most common being headache (10%), nausea (4%), and diarrhea (4%, 5-day treatment vs 2%, 3-day treatment).
Placebo-controlled trial of 2-day acyclovir therapy. Wald and coworkers examined the effect of a shorter treatment regimen of acyclovir (2 days) on recurrent genital herpes.28 Eighty-four immunocompetent HSV-2–infected patients with a history of ≥3 recurrences in the previous 12 months were randomized to receive either 2 days of 800 mg 3 times daily acyclovir or matching placebo. Patients were asked to take their medication no later than 12 hours after the first sign or symptom of an episode.
Efficacy endpoints were time to lesion healing, episode duration, and percentage of patients with aborted lesions. Short-course acyclovir therapy was shown to decrease time to healing (P=.001) and episode duration (P<.001) by 2 days compared with placebo (TABLE 1). Short-course acyclovir therapy also increased the percentage of patients with aborted lesions compared with placebo (27% vs 11%; P=.029 (TABLE 1). Adverse events were not recorded in this analysis.
Placebo-controlled trial of single-day famciclovir therapy. Aoki and colleagues29 performed a randomized, double-blind, patient-initiated, placebo-controlled trial to assess the efficacy and safety of patient-initiated, single-day famciclovir 1000 mg twice daily in immunocompetent adults with recurrent genital herpes. The 329 patients in the study were instructed to self-initiate therapy within 6 hours of the onset of prodromal symptoms or genital herpes lesions, and were asked to return to the clinic no later than 24 hours after initiation of therapy. Patients were followed until their lesions healed or for up to 14 days.
The primary endpoint was time to lesion healing of nonaborted lesions. Secondary endpoints were time to healing of all lesions (aborted and nonaborted), time to resolution of pain and other symptoms, and the percentage of patients who did not progress to a full outbreak.
Single-day treatment with famciclovir shortened the time to healing of nonaborted genital herpes lesions by approximately 2 days (P<.001), and the time to healing of all lesions by 1.5 days (P<.001) compared with placebo, and increased the percentage of patients who did not progress to a full outbreak (23% vs 13%;P=.003) (TABLE 1). Famciclovir also reduced the time to resolution of all symptoms by approximately 2 days (P<.001) (data not shown).
Adverse events were mild to moderate; the most common in the famciclovir and placebo groups, respectively, were headache (13.5% vs 5.4%), nausea (2.5% vs 3.6%), and diarrhea (4.9% vs 1.2%).
TABLE 1
Short-course, patient-initiated OAV therapy is effective for treating episodic genital herpes
| DRUG | TREATMENT DURATION | TREATMENT DOSE | CONTROL | MEDIAN TIME (DAYS) TO LESION HEALING (TREATMENT VS CONTROL) | MEDIAN EP ISODE DURATION (DAYS) (TREATMENT VS CONTROL) | PATIENTS WITH ABORTED EPISODES (%) (TREATMENT VS CONTROL) |
|---|---|---|---|---|---|---|
| Valacyclovir3 | 3 days | 500 mg 2×daily | valacyclovir 500 mg 2×/day for 5 days | 4.4 vs 4.7 (P=NS) | 4.3 vs 4.4 (P=NS) | 25 vs 27 (P=NS) |
| Acyclovir28 | 2 days | 800 mg 3×daily | Placebo | 4.0 vs 6.0 (P=.001) | 4.0 vs 6.0 (P=.001) | 27 vs 11 (P=.029) |
| Famciclovir29 | 1 day | 1000 mg 2×daily | Placebo | 4.3 vs 6.1 (P<.001) | 3.5 vs 5.0 (P<.001) | 23 vs 13 (P=.003) |
| Lesion healing time measures the duration of a subset of severe or classical herpetic outbreaks, characterized by the formation of vesicles, ulcers, or crusts (also papules in some studies28,29). The endpoint is lesion reepithelialization/loss of crust. Episodes where there were only prodromal symptoms, erythema, and/or papule formation (or only symptoms and/or erythema in some studies28,29) were considered “aborted” or prevented lesions. The occurrence of these favorable episode outcomes is described as a percentage of all episodes. Episode duration, sometimes called healing time of all lesions or time to return to normal skin, is the time to resolution of all episodes, regardless of lesion severity. The definition of normal skin varies among the different studies. | ||||||
| NS=not significant. | ||||||
Short-course, high-dose, patient-initiated episodic OAV therapy for recurrent herpes labialis
Placebo-controlled trial of single-day and 2-day valacyclovir therapy. Spruance and coworkers studied the efficacy of single-day and 2-day valacyclovir treatments in comparison with placebo for an episode of herpes labialis.27 Two identical studies were performed on individuals who were at least 12 years old, had a clinical history of recurrent cold sores, and had experienced ≥3 episodes in the preceding year. Participants in both studies (study 1, N=1524; study 2, N=1627) were required to self-administer 2 g valacyclovir twice daily for 1 day (valacyclovir 1 day), 2 g valacyclovir twice daily for 1 day followed by 1 g twice daily for 1 day (valacyclovir 2 days), or matching placebo at the earliest onset of prodromal symptoms and before the appearance of lesions. Patients were asked to return to the clinic within 24 hours of initiation of therapy.
The primary endpoint in study 1 was clinician-observed duration of all herpes labialis lesions and the secondary endpoint was the percentage of subjects who had herpes labialis lesions that did not progress beyond the papule stage. In study 2, the endpoints were reversed: the primary endpoint was the percentage of patients with lesions that did not progress and the secondary endpoint was the duration of lesions. Other efficacy endpoints were time to healing of vesicular (classical) lesions and duration of pain and discomfort.
Both studies demonstrated that single-day valacyclovir treatment significantly decreased lesion healing time and the duration of herpes labialis episodes by 0.5 to 1.0 days compared with placebo (TABLE 2). A statistically significant decrease in the duration of pain and other symptoms was also seen with single-day valacyclovir compared with placebo (data not shown). In both studies, a higher percentage of patients in the valacyclovir group did not progress to full outbreak compared with placebo, but these differences were not statistically significant. The results with 2 days of valacyclovir treatment were similar. Adverse events were similar between the treatment groups and the placebo group.
Placebo-controlled trial of single-dose and single-day famciclovir therapy. Spruance and coworkers assessed patient-initiated famciclovir 1500 mg (single-dose) and 750 mg twice daily (single-day) in immunocompetent adults with recurrent cold sores.30 Subjects (N=1376) were at least 18 years of age and had experienced ≥3 episodes of cold sores over the previous 12 months. Subjects were instructed to administer 1500 mg (single-dose), 750 mg twice daily (single-day), or matching placebo within 1 hour of the onset of prodromal symptoms and before the onset of lesions, and were asked to return to the clinic within 24 hours of initiating medication.
Topical antiviral drug formulations were the first treatments approved for recurrent HSV-1 and HSV-2 outbreaks, but these were only marginally efficacious.19-21,31 orally-administered antiviral agents appear to be more effective, possibly because of better delivery of the drug to the site of infection. Three oral antiviral agents (OAVs) are currently approved for the treatment of recurrent genital herpes: acyclovir, an acyclic nucleoside analog; valacyclovir, the prodrug of acyclovir; and famciclovir, the prodrug of penciclovir, another acyclic nucleoside analog. one OAV (valacyclovir) is currently approved for the treatment of herpes labialis in immunocompetent patients.27 The prodrugs of acyclovir and penciclovir, valacyclovir and famciclovir, respectively, were synthesized to provide high oral bioavailability and thus permit less frequent administration and potentially greater efficacy compared to the parent compounds.
Following oral administration, valacyclovir and famciclovir undergo first-pass metabolism to acyclovir and penciclovir, respectively.4,32 acyclovir and penciclovir are selectively phosphorylated by the viral thymidine kinase of infected cells and then converted to the active triphosphate by cellular enzymes. The triphosphate forms (which have different half-lives depending upon the compound)33 inhibit viral DNA polymerase and interfere with DNA chain extension,34 thereby halting viral DNA synthesis. The drugs cannot prevent the death of a cell once it is infected, but they can reduce, in a dose-dependent manner, the quantity of virions produced by an infected cell. The mechanism of action of HSV-selective antiviral drugs suggests that the most logical strategy for episodic treatment is to maximally inhibit HSV replication using high doses.18,35
The primary endpoint was time to healing of primary vesicular lesions. Secondary endpoints included time to healing of all vesicular lesions (primary and secondary [secondary lesions are defined as lesions that developed in addition to and on 1 or more days after primary lesions and that were located at least 1 cm from primary lesions]), time to return to normal skin for all lesions (defined as loss of crust, swelling, and dry flaking), duration of lesion tenderness and pain, and proportion of patients with aborted lesions.
There was a statistically significant decrease in time to healing of primary vesicular lesions by approximately 2 days with both single-dose and single-day famciclovir compared with placebo, with no significant difference between the 2 famciclovir regimens in time to healing of primary vesicular lesions (TABLE 2). There was also a statistically significant decrease in the time to healing of all lesions (primary and secondary) by approximately 2 days with both famciclovir treatments compared with placebo, with no significant differences seen in healing between the famciclovir arms (data not shown).
However, only single-dose famciclovir had a statistically significant decrease in the duration of lesion tenderness and pain and the time to return to normal skin compared with placebo (data not shown). No difference was noted between the famciclovir arms in the percentage of patients with aborted lesions compared with placebo. Adverse events in both famciclovir groups were similar to those in the placebo group.
TABLE 2
Short-course, patient-initiated OAV therapy is effective against recurrent herpes labialis
| DRUG | TREATMENT DURATION | TREATMENT DOSE | COMPARATOR REGIMEN | CONTROL | MEDIAN TIME (DAYS) TO LESION HEALING (TREATMENT VS COMPARATOR VS CONTROL)* | MEDIAN EP ISODE DURATION (DAYS) (TREATMENT VS COMPARATOR VS CONTROL)* | PATIENTS WITH ABORTED LESIONS (%)(TREATMENT VS COMPARATOR VS CONTROL)† |
|---|---|---|---|---|---|---|---|
| Valacyclovir27 | 1 day | 2000 mg 2×daily | valacyclovir 2000 mg 2×daily×1 day 1000 mg 2×daily for a 2nd day | Placebo | study 1 4.3 vs 4.3 vs 5.1 study 2 4.8 vs 4.6 vs 5.4 | study 1 4.0 vs 4.5 vs 5.0 study 2 2 5.0 vs 5.0 vs 5.5 | study 1 44 vs 46 vs 38 study 2 43 vs 43 vs 35 |
| Famciclovir30 1 dose | 1 Does | 1500 mg | famciclovir 750 mg 2x daily for 1 day | Placebo | 4.4 vs 4.0 vs 6.2 | 4.5 vs 5.7 vs 7.0 | 33 vs 29 vs 34 |
| Lesion healing time measures the duration of a subset of severe or classical herpetic outbreaks, characterized by the formation of vesicles, ulcers, or crusts (also papules in some studies28,29). The endpoint is lesion reepithelialization/loss of crust. Episodes where there were only prodromal symptoms, erythema, and/or papule formation (or only symptoms and/or erythema in some studies28,29) were considered “aborted” or prevented lesions. The occurrence of these favorable episode outcomes is described as a percentage of all episodes. Episode duration, sometimes called healing time of all lesions or time to return to normal skin, is the time to resolution of all episodes, regardless of lesion severity. The definition of normal skin varies among the different studies. | |||||||
| *All of the healing time and episode duration values for the active treatment arms in both studies differed statistically significantly from placebo, except for famciclovir 750 mg twice daily for 1 day. | |||||||
| †None of the frequencies of aborted lesions in the active treatment arms in either study differed statistically significantly from placebo. | |||||||
CORRESPONDENCE
Spotswood Spruance MD Professor of Medicine, Division of Infectious Diseases, University of Utah School of Medicine, Room 4B319, 30 North 1900 East, Salt Lake City, UT 84132-2405. E-mail:[email protected]
1. Ho D. Time to hit HIV, early and hard. N Engl J Med 1995;333:450-451.
2. Corey L, Wald A, Patel R, et al. Once-daily valacyclovir to reduce the risk of transmission of genital herpes. N Engl J Med 2004;350:11-20.
3. Leone PA, Trottier S, Miller JM. Valacyclovir for episodic treatment of genital herpes: a shorter 3-day treatment course compared with 5-day treatment. Clin Infect Dis 2002;34:958-962.
4. Whitley RJ, Kimberlin DW, Roizman B. Herpes simplex viruses. Clin Infect Dis 1998;26:541-555.
5. Wald A, Ericsson M, Krantz E, Selkes S, Corey L. Oral shedding of herpes simplex virus type 2. Sex Transm Infect 2004;80:272-276.
6. Mertz GJ, Rosenthal Sl, Stanberry LR. Editorial response: Is herpes simplex virus type 1 (HSV-1) now more common than HSV-2 in first episodes of genital herpes? Sex Transm Dis 2003;30:801-802.
7. Lafferty WE, Coombs RW, Benedetti J, Critchlow C, Corey L. Recurrences after oral and genital herpes simplex virus infection. N Engl J Med 1987;316:1444-1449.
8. Smith JS, Robinson RJ. Age-specific prevalence of infection with herpes simplex virus types 2 and 1: a global review. J Infect Dis 2002;186(suppl 1):S3-S28.
9. Fleming DT, McQuillan GM, Johnson RE, et al. Herpes simplex virus type 2 in the united States, 1976 to 1994. N Engl J Med 1997;337:1105-1111.
10. Bierman SM. A retrospective study of 375 patients with genital herpes simplex infections seen between 1973 and 1980. Cutis 1983;31:548-565.
11. Drob S, Loemer M, Lifshutz H. Genital herpes: the psychological consequences. Br J Med Psychol 1985;58:307-315.
12. Spruance SL, Kriesel JD. Treatment of herpes simplex labialis. Herpes 2002;9:64-69.
13. Spruance SL, overall JC, Jr, Kern ER, Krueger GG, Pliam V, Miller W. The natural history of recurrent herpes simplex labialis. N Engl J Med 1977;297:69-75.
14. Brown ZA, Kern ER, Spruance SL, Overall JC, Jr. Clinical and virologic course of herpes simplex genitalis. West J Med 1979;130:414-421.
15. Krueger GG, Spruance SL, Overall JC, Jr. Herpes simplex labialis: a review of pathogenesis and therapy. J Clin Epidemiol Derm 1978;1:19-37.
16. Spruance SL, Wenerstrom G. Pathogenesis of herpes simplex labialis: IV. Maturation of lesions during within 8 hours after onset and implications for antiviral treatment. Oral Surg Oral Med Oral Path 1984;58:667-671.
17. Spruance SL. The natural history of recurrent oral-facial herpes simplex virus infection. Sem Dermatol 1992;11:200-206.
18. Spruance SL. Herpes simplex labialis. In: Clinical Management of Herpes Viruses. Sacks SL, Straus SE, Whitley RJ, Griffiths PD, eds. amsterdam, Netherlands: IOS Press; 1995.
19. Spruance SL, Nett R, Marbury T, Wolff R, Johnson J, Spaulding T. Acyclovir cream for treatment of herpes simplex labialis: results of two randomized, double-blind, vehicle-controlled, multicenter clinical trials. Antimicrob Agents Chemother 2002;46:2238-2243.
20. Spruance SL, Rea TL, Thoming C, Tucker R, Saltzman R, Boon R. Penciclovir cream for the treatment of herpes simplex labialis. JAMA 1997;277:1374-1379.
21. Raborn GW, Martel AY, lassonde M, et al. Worldwide Topical Penciclovir Collaborative Study Group. Effective treatment of herpes simplex labialis with penciclovir cream: combined results of two trials. J Am Dent Assoc 2002;133:303-309.
22. Reichman RC, Badger GJ, Mertz GJ, et al. Treatment of recurrent genital herpes simplex infections with oral acyclovir: a controlled trial. JAMA 1984;251:2103-2107.
23. Sacks SL, Aoki FY, Diaz-Mitoma F, Sellors J, Shafran SD. Canadian Famciclovir Study Group. Patient-initiated, twice-daily oral famciclovir for early recurrent genital herpes: a randomized, double-blind multicenter trial. JAMA 1996;276:44-49.
24. Tyring SK, Douglas JM, Jr, Corey L, Spruance SL, Esmann J. The valaciclovir International Study Group. A randomized, placebo-controlled comparison of oral valcyclovir and acyclovir in immunocompetent patients with recurrent genital herpes infections. Arch Dermatol 1998;134:185-191.
25. Spruance S, Stewart JCB, Rowe NH, McKeough MB, Wenerstrom G, Freeman DJ. Treatment of herpes simplex labialis with oral acyclovir. J Infect Dis 1990;161:185-190.
26. Spruance SL, Tyring SK, DeGregorio B, Miller C, Beutner K; valaciclovir HSV Study Group. A large-scale, placebo-controlled, dose-ranging trial of peroral valaciclovir for episodic treatment of recurrent herpes genitalis. Arch Intern Med 1996;156:1729-1735.
27. Spruance SL, Jones TM, Blatter MM, et al. High-dose, short-duration, early valacyclovir therapy for episodic treatment of cold sores: results of two randomized, placebo-controlled, multicenter studies. Antimicrob Agents Chemother 2003;47:1072-1080.
28. Wald A, Carrell D, Remington M, Kexel E, Zeh J, Corey L. Two-day regimen of acyclovir for treatment of recurrent genital herpes simplex virus type 2 infection. Clin Infect Dis 2002;34:944-948.
29. Aoki FY, Tyring S, Dias-Mitoma F, Gross G, Gao J, Hamed K. Single-day patient initiated famciclovir therapy for recurrent genital herpes: a randomized double-blind, placebo-controlled trial. Clin Infect Dis 2006;42:8-13.
30. Spruance S, Bodsworth N, Resnick H, et al. Single-dose, patient-initiated famciclovir: a randomized, double-blind, placebo-controlled trial for episodic treatment of herpes labialis. J Am Acad Dermatol 2006;55:47-53.
31. Reichman RC, Badger GJ, Guinan ME, et al. Topically administered acyclovir in the treatment of recurrent herpes simplex genitalis: a controlled trial. J Infect Dis 1983;147:336-340.
32. Gill KS, Wood MJ. The clinical pharmacokinetics of famciclovir. Clin Pharmacokinet 1996;31:1-8.
33. Earnshaw DL, Bacon TH, Darlison SJ, Edmonds K, Perkins RM, Vere Hodge RA. Mode of antiviral action of penciclovir in MRC-5 cells infected with herpes simplex virus type 1 (HSV-1), HSV-2, and varicella-zoster virus. Antimicrob Agents Chemother 1992;36:2747-2757.
34. Vere Hodge RA, Perkins RM. Mode of action of 9-(4-hydroxy-3-hydroxymethylbut-1-yl)guanine (Brl 39123) against herpes simplex virus in MrC-5 cells. Antimicrob Agents Chemother 1989;33:223-229.
35. Spruance SL, Freeman DJ. Topical treatment of cutaneous herpes simplex virus infections. Antivir Res 1990;14:305-321.
- Consider giving patients an oral antiviral (OAV) medication to self-administer when HSV prodromal symptoms occur.
- Patient-initiated, short-course, high-dose OAV treatment of recurrent HSV outbreaks may be as effective as the traditional, longer-course regimens.
Hit early, hit hard. That expression arose during the evolution of treatment for human immunodeficiency virus (HIV).1 While this approach has not lived up to expectations for HIV treatment, it may have found its place in the treatment of recurrent herpes simplex virus (HSV) infections.
Our review focuses on episodic treatment of acute recurrent HSV outbreaks for immunocompetent persons. We do not discuss suppressive therapy, which may be indicated for frequent or severe recurrences (6 or more per year) in immunocompetent persons, for immunocompromised patients, or as an adjunctive measure to reduce genital herpes transmission.2
As we will describe in detail, the efficacy of the new short-course therapy is, at minimum, comparable to that seen with the older, longer-course trials of topical and oral antiviral therapy. In one head-to-head comparison, Leone et al compared a short-course regimen (3 days) of valacyclovir with 5 days of treatment; they found no difference in results.3 If the efficacy of short-course treatment is the same as that of longer courses, the increased convenience and expected improvement in patient adherence with these new regimens argue strongly in their favor. (See Scope of the problem.)
The strategy: Take advantage of a brief therapeutic window
The innate and acquired immune responses of chronically infected, immunocompetent persons rapidly limit cutaneous viral replication, thereby truncating the duration of recurrent HSV outbreaks.13,14 In both recurrent herpes labialis and genital herpes, HSV viral titers peak in the first 24 hours following lesion onset (FIGURE 1A).13-15
Herpes labialis lesion size and pain are also greatest in the first 24 hours.13,16 Most herpes labialis lesions progress from the vesicle stage to the ulcer/soft crust stage within 48 hours, with a hard crust forming by day 2 or 3 (FIGURE 1B).17
With genital lesions, crust formation depends on whether the skin area is dry (3–4 days) or moist (8–9 days).14
The likely events are a burst of virus replication in the first 24 hours of outbreak that lyses basal keratinocytes in a discreet area of epidermis innervated by the infected neuron(s), followed by a vigorous immune response that curtails the infection and creates, in part, the clinical disease (erythema, swelling, vesiculation, and ulceration). The subsequent elements of the illness, which are the majority of the lesion course, are related to wound healing
Recognizing the window. Given the brief period of viral replication and the rapid evolution of lesions, the therapeutic window for treating HSV outbreaks with antiviral drugs is both early and short, making it problematic to effectively treat HSV recurrences. Patients often have mature lesions by the time they consult a physician, rendering subsequent anti-viral treatment less effective.18 However, before lesions appear, many patients experience prodromal symptoms such as pain, burning, or itching.13,18 These symptoms can be a prompt to start treatment early, thereby taking advantage of the transient therapeutic window.
If a patient is able to self-administer therapy when prodromal symptoms occur, there may be a greater benefit to treatment. Giving patients drugs for self-administration is therefore an important strategy in managing HSV recurrences.
Traditionally, patient-initiated episodic therapy for recurrent genital herpes and herpes labialis has involved multiple daily doses of topical or oral antiviral agents for 4 to 5 days.19-26 Studies of the pathogenesis of HSV recurrences, however, indicate—as said earlier—that the period of virus replication is early and brief, such that a shorter duration of treatment might be more appropriate and equally effective. Other recent clinical studies have indicated that patient-initiated, short-course, high-dose OAV treatment of recurrent HSV infections may be as effective as the traditional therapies.3,27-30 In the section that follows, we examine and compare the results of these trials. (See The agents and how they work.)
FIGURE 1A
Lesion HSV-1 titer peaks within 24 hours of onset of herpes labialis lesions
Source: Krueger et al, J Clin Epidemiol Derm 1978.15 Reproduced with permission from GG Krueger.
FIGURE 1B
Hard crust formation occurs by 48 to 72 hours of onset of herpes labialis lesions
Source: Spruance, Sem Dermatol 1992.17 With permission from Elsevier.
Clinical trials: Short-course, high-dose, patient-initiated episodic OAV therapy for recurrent genital herpes
Three-day vs 5-day valacyclovir therapy. The efficacy of 3-day treatment with oral valacyclovir was compared with that of 5-day treatment in immunocompetent adults with a history of ≥4 episodes of recurrent genital herpes and confirmed HSV infection.3 Eight hundred participants were randomized to receive 500 mg twice daily valacyclovir for 3 days (and placebo for the remaining 2 days) or 500 mg twice daily for 5 days, and were required to self-administer therapy no later than 24 hours after the onset of symptoms.
Herpes simplex virus (HSV) type 1 (HSV-1) or type 2 (HSV-2) results in periodic, recurrent outbreaks of skin lesions after first infection. Herpes labialis (fever blisters or cold sores) is usually caused by HSV-1, while genital herpes is usually caused by HSV-2.4 HSV-2 lesions of the lips have been reported, and the incidence of genital herpes caused by HSV-1 is on the rise in the developed world, likely because of increased oral-genital sexual behavior.5,6 Patients with HSV-1 genital herpes typically have fewer recurrences than those with HSV-2 genital infection.7
The prevalence of HSV-1 and HSV-2 infection varies according to age, geography, gender, and population subgroup, such as people who exhibit high-risk sexual behavior.8 approximately 45% of americans are infected with HSV-1 by adolescence,8 and approximately 22% of all american adults are infected with HSV-2.9 The global prevalence of HSV is even greater: as many as 60% to 90% of older adults worldwide are seropositive for HSV-1, and as many as 30% are seropositive for HSV-2. HSV-2 seropositivity is more prevalent among women than men.8 overall, the burden of recurrent genital herpes outbreaks can have a profound, negative impact on patient quality of life.10,11 The psychological impact of recurrent herpes labialis has not been thoroughly investigated, but an undefined burden is thought to exist, particularly in young patients with frequent or severe recurrences.12
The primary endpoint was time to lesion healing (defined as the number of days from initiation of therapy to lesion reepithelialization). Secondary endpoints were pain duration, episode duration (defined as time from initiation of therapy to resolution of all symptoms) and percentage of patients with aborted lesions.
The 3-day valacyclovir treatment exhibited similar time to lesion healing, length of episode, and percentage of patients with aborted lesions as the 5-day treatment (TABLE 1), suggesting equal efficacy. Duration of pain was also similar (data not shown). Adverse events were similar for both treatment groups, with the most common being headache (10%), nausea (4%), and diarrhea (4%, 5-day treatment vs 2%, 3-day treatment).
Placebo-controlled trial of 2-day acyclovir therapy. Wald and coworkers examined the effect of a shorter treatment regimen of acyclovir (2 days) on recurrent genital herpes.28 Eighty-four immunocompetent HSV-2–infected patients with a history of ≥3 recurrences in the previous 12 months were randomized to receive either 2 days of 800 mg 3 times daily acyclovir or matching placebo. Patients were asked to take their medication no later than 12 hours after the first sign or symptom of an episode.
Efficacy endpoints were time to lesion healing, episode duration, and percentage of patients with aborted lesions. Short-course acyclovir therapy was shown to decrease time to healing (P=.001) and episode duration (P<.001) by 2 days compared with placebo (TABLE 1). Short-course acyclovir therapy also increased the percentage of patients with aborted lesions compared with placebo (27% vs 11%; P=.029 (TABLE 1). Adverse events were not recorded in this analysis.
Placebo-controlled trial of single-day famciclovir therapy. Aoki and colleagues29 performed a randomized, double-blind, patient-initiated, placebo-controlled trial to assess the efficacy and safety of patient-initiated, single-day famciclovir 1000 mg twice daily in immunocompetent adults with recurrent genital herpes. The 329 patients in the study were instructed to self-initiate therapy within 6 hours of the onset of prodromal symptoms or genital herpes lesions, and were asked to return to the clinic no later than 24 hours after initiation of therapy. Patients were followed until their lesions healed or for up to 14 days.
The primary endpoint was time to lesion healing of nonaborted lesions. Secondary endpoints were time to healing of all lesions (aborted and nonaborted), time to resolution of pain and other symptoms, and the percentage of patients who did not progress to a full outbreak.
Single-day treatment with famciclovir shortened the time to healing of nonaborted genital herpes lesions by approximately 2 days (P<.001), and the time to healing of all lesions by 1.5 days (P<.001) compared with placebo, and increased the percentage of patients who did not progress to a full outbreak (23% vs 13%;P=.003) (TABLE 1). Famciclovir also reduced the time to resolution of all symptoms by approximately 2 days (P<.001) (data not shown).
Adverse events were mild to moderate; the most common in the famciclovir and placebo groups, respectively, were headache (13.5% vs 5.4%), nausea (2.5% vs 3.6%), and diarrhea (4.9% vs 1.2%).
TABLE 1
Short-course, patient-initiated OAV therapy is effective for treating episodic genital herpes
| DRUG | TREATMENT DURATION | TREATMENT DOSE | CONTROL | MEDIAN TIME (DAYS) TO LESION HEALING (TREATMENT VS CONTROL) | MEDIAN EP ISODE DURATION (DAYS) (TREATMENT VS CONTROL) | PATIENTS WITH ABORTED EPISODES (%) (TREATMENT VS CONTROL) |
|---|---|---|---|---|---|---|
| Valacyclovir3 | 3 days | 500 mg 2×daily | valacyclovir 500 mg 2×/day for 5 days | 4.4 vs 4.7 (P=NS) | 4.3 vs 4.4 (P=NS) | 25 vs 27 (P=NS) |
| Acyclovir28 | 2 days | 800 mg 3×daily | Placebo | 4.0 vs 6.0 (P=.001) | 4.0 vs 6.0 (P=.001) | 27 vs 11 (P=.029) |
| Famciclovir29 | 1 day | 1000 mg 2×daily | Placebo | 4.3 vs 6.1 (P<.001) | 3.5 vs 5.0 (P<.001) | 23 vs 13 (P=.003) |
| Lesion healing time measures the duration of a subset of severe or classical herpetic outbreaks, characterized by the formation of vesicles, ulcers, or crusts (also papules in some studies28,29). The endpoint is lesion reepithelialization/loss of crust. Episodes where there were only prodromal symptoms, erythema, and/or papule formation (or only symptoms and/or erythema in some studies28,29) were considered “aborted” or prevented lesions. The occurrence of these favorable episode outcomes is described as a percentage of all episodes. Episode duration, sometimes called healing time of all lesions or time to return to normal skin, is the time to resolution of all episodes, regardless of lesion severity. The definition of normal skin varies among the different studies. | ||||||
| NS=not significant. | ||||||
Short-course, high-dose, patient-initiated episodic OAV therapy for recurrent herpes labialis
Placebo-controlled trial of single-day and 2-day valacyclovir therapy. Spruance and coworkers studied the efficacy of single-day and 2-day valacyclovir treatments in comparison with placebo for an episode of herpes labialis.27 Two identical studies were performed on individuals who were at least 12 years old, had a clinical history of recurrent cold sores, and had experienced ≥3 episodes in the preceding year. Participants in both studies (study 1, N=1524; study 2, N=1627) were required to self-administer 2 g valacyclovir twice daily for 1 day (valacyclovir 1 day), 2 g valacyclovir twice daily for 1 day followed by 1 g twice daily for 1 day (valacyclovir 2 days), or matching placebo at the earliest onset of prodromal symptoms and before the appearance of lesions. Patients were asked to return to the clinic within 24 hours of initiation of therapy.
The primary endpoint in study 1 was clinician-observed duration of all herpes labialis lesions and the secondary endpoint was the percentage of subjects who had herpes labialis lesions that did not progress beyond the papule stage. In study 2, the endpoints were reversed: the primary endpoint was the percentage of patients with lesions that did not progress and the secondary endpoint was the duration of lesions. Other efficacy endpoints were time to healing of vesicular (classical) lesions and duration of pain and discomfort.
Both studies demonstrated that single-day valacyclovir treatment significantly decreased lesion healing time and the duration of herpes labialis episodes by 0.5 to 1.0 days compared with placebo (TABLE 2). A statistically significant decrease in the duration of pain and other symptoms was also seen with single-day valacyclovir compared with placebo (data not shown). In both studies, a higher percentage of patients in the valacyclovir group did not progress to full outbreak compared with placebo, but these differences were not statistically significant. The results with 2 days of valacyclovir treatment were similar. Adverse events were similar between the treatment groups and the placebo group.
Placebo-controlled trial of single-dose and single-day famciclovir therapy. Spruance and coworkers assessed patient-initiated famciclovir 1500 mg (single-dose) and 750 mg twice daily (single-day) in immunocompetent adults with recurrent cold sores.30 Subjects (N=1376) were at least 18 years of age and had experienced ≥3 episodes of cold sores over the previous 12 months. Subjects were instructed to administer 1500 mg (single-dose), 750 mg twice daily (single-day), or matching placebo within 1 hour of the onset of prodromal symptoms and before the onset of lesions, and were asked to return to the clinic within 24 hours of initiating medication.
Topical antiviral drug formulations were the first treatments approved for recurrent HSV-1 and HSV-2 outbreaks, but these were only marginally efficacious.19-21,31 orally-administered antiviral agents appear to be more effective, possibly because of better delivery of the drug to the site of infection. Three oral antiviral agents (OAVs) are currently approved for the treatment of recurrent genital herpes: acyclovir, an acyclic nucleoside analog; valacyclovir, the prodrug of acyclovir; and famciclovir, the prodrug of penciclovir, another acyclic nucleoside analog. one OAV (valacyclovir) is currently approved for the treatment of herpes labialis in immunocompetent patients.27 The prodrugs of acyclovir and penciclovir, valacyclovir and famciclovir, respectively, were synthesized to provide high oral bioavailability and thus permit less frequent administration and potentially greater efficacy compared to the parent compounds.
Following oral administration, valacyclovir and famciclovir undergo first-pass metabolism to acyclovir and penciclovir, respectively.4,32 acyclovir and penciclovir are selectively phosphorylated by the viral thymidine kinase of infected cells and then converted to the active triphosphate by cellular enzymes. The triphosphate forms (which have different half-lives depending upon the compound)33 inhibit viral DNA polymerase and interfere with DNA chain extension,34 thereby halting viral DNA synthesis. The drugs cannot prevent the death of a cell once it is infected, but they can reduce, in a dose-dependent manner, the quantity of virions produced by an infected cell. The mechanism of action of HSV-selective antiviral drugs suggests that the most logical strategy for episodic treatment is to maximally inhibit HSV replication using high doses.18,35
The primary endpoint was time to healing of primary vesicular lesions. Secondary endpoints included time to healing of all vesicular lesions (primary and secondary [secondary lesions are defined as lesions that developed in addition to and on 1 or more days after primary lesions and that were located at least 1 cm from primary lesions]), time to return to normal skin for all lesions (defined as loss of crust, swelling, and dry flaking), duration of lesion tenderness and pain, and proportion of patients with aborted lesions.
There was a statistically significant decrease in time to healing of primary vesicular lesions by approximately 2 days with both single-dose and single-day famciclovir compared with placebo, with no significant difference between the 2 famciclovir regimens in time to healing of primary vesicular lesions (TABLE 2). There was also a statistically significant decrease in the time to healing of all lesions (primary and secondary) by approximately 2 days with both famciclovir treatments compared with placebo, with no significant differences seen in healing between the famciclovir arms (data not shown).
However, only single-dose famciclovir had a statistically significant decrease in the duration of lesion tenderness and pain and the time to return to normal skin compared with placebo (data not shown). No difference was noted between the famciclovir arms in the percentage of patients with aborted lesions compared with placebo. Adverse events in both famciclovir groups were similar to those in the placebo group.
TABLE 2
Short-course, patient-initiated OAV therapy is effective against recurrent herpes labialis
| DRUG | TREATMENT DURATION | TREATMENT DOSE | COMPARATOR REGIMEN | CONTROL | MEDIAN TIME (DAYS) TO LESION HEALING (TREATMENT VS COMPARATOR VS CONTROL)* | MEDIAN EP ISODE DURATION (DAYS) (TREATMENT VS COMPARATOR VS CONTROL)* | PATIENTS WITH ABORTED LESIONS (%)(TREATMENT VS COMPARATOR VS CONTROL)† |
|---|---|---|---|---|---|---|---|
| Valacyclovir27 | 1 day | 2000 mg 2×daily | valacyclovir 2000 mg 2×daily×1 day 1000 mg 2×daily for a 2nd day | Placebo | study 1 4.3 vs 4.3 vs 5.1 study 2 4.8 vs 4.6 vs 5.4 | study 1 4.0 vs 4.5 vs 5.0 study 2 2 5.0 vs 5.0 vs 5.5 | study 1 44 vs 46 vs 38 study 2 43 vs 43 vs 35 |
| Famciclovir30 1 dose | 1 Does | 1500 mg | famciclovir 750 mg 2x daily for 1 day | Placebo | 4.4 vs 4.0 vs 6.2 | 4.5 vs 5.7 vs 7.0 | 33 vs 29 vs 34 |
| Lesion healing time measures the duration of a subset of severe or classical herpetic outbreaks, characterized by the formation of vesicles, ulcers, or crusts (also papules in some studies28,29). The endpoint is lesion reepithelialization/loss of crust. Episodes where there were only prodromal symptoms, erythema, and/or papule formation (or only symptoms and/or erythema in some studies28,29) were considered “aborted” or prevented lesions. The occurrence of these favorable episode outcomes is described as a percentage of all episodes. Episode duration, sometimes called healing time of all lesions or time to return to normal skin, is the time to resolution of all episodes, regardless of lesion severity. The definition of normal skin varies among the different studies. | |||||||
| *All of the healing time and episode duration values for the active treatment arms in both studies differed statistically significantly from placebo, except for famciclovir 750 mg twice daily for 1 day. | |||||||
| †None of the frequencies of aborted lesions in the active treatment arms in either study differed statistically significantly from placebo. | |||||||
CORRESPONDENCE
Spotswood Spruance MD Professor of Medicine, Division of Infectious Diseases, University of Utah School of Medicine, Room 4B319, 30 North 1900 East, Salt Lake City, UT 84132-2405. E-mail:[email protected]
1. Ho D. Time to hit HIV, early and hard. N Engl J Med 1995;333:450-451.
2. Corey L, Wald A, Patel R, et al. Once-daily valacyclovir to reduce the risk of transmission of genital herpes. N Engl J Med 2004;350:11-20.
3. Leone PA, Trottier S, Miller JM. Valacyclovir for episodic treatment of genital herpes: a shorter 3-day treatment course compared with 5-day treatment. Clin Infect Dis 2002;34:958-962.
4. Whitley RJ, Kimberlin DW, Roizman B. Herpes simplex viruses. Clin Infect Dis 1998;26:541-555.
5. Wald A, Ericsson M, Krantz E, Selkes S, Corey L. Oral shedding of herpes simplex virus type 2. Sex Transm Infect 2004;80:272-276.
6. Mertz GJ, Rosenthal Sl, Stanberry LR. Editorial response: Is herpes simplex virus type 1 (HSV-1) now more common than HSV-2 in first episodes of genital herpes? Sex Transm Dis 2003;30:801-802.
7. Lafferty WE, Coombs RW, Benedetti J, Critchlow C, Corey L. Recurrences after oral and genital herpes simplex virus infection. N Engl J Med 1987;316:1444-1449.
8. Smith JS, Robinson RJ. Age-specific prevalence of infection with herpes simplex virus types 2 and 1: a global review. J Infect Dis 2002;186(suppl 1):S3-S28.
9. Fleming DT, McQuillan GM, Johnson RE, et al. Herpes simplex virus type 2 in the united States, 1976 to 1994. N Engl J Med 1997;337:1105-1111.
10. Bierman SM. A retrospective study of 375 patients with genital herpes simplex infections seen between 1973 and 1980. Cutis 1983;31:548-565.
11. Drob S, Loemer M, Lifshutz H. Genital herpes: the psychological consequences. Br J Med Psychol 1985;58:307-315.
12. Spruance SL, Kriesel JD. Treatment of herpes simplex labialis. Herpes 2002;9:64-69.
13. Spruance SL, overall JC, Jr, Kern ER, Krueger GG, Pliam V, Miller W. The natural history of recurrent herpes simplex labialis. N Engl J Med 1977;297:69-75.
14. Brown ZA, Kern ER, Spruance SL, Overall JC, Jr. Clinical and virologic course of herpes simplex genitalis. West J Med 1979;130:414-421.
15. Krueger GG, Spruance SL, Overall JC, Jr. Herpes simplex labialis: a review of pathogenesis and therapy. J Clin Epidemiol Derm 1978;1:19-37.
16. Spruance SL, Wenerstrom G. Pathogenesis of herpes simplex labialis: IV. Maturation of lesions during within 8 hours after onset and implications for antiviral treatment. Oral Surg Oral Med Oral Path 1984;58:667-671.
17. Spruance SL. The natural history of recurrent oral-facial herpes simplex virus infection. Sem Dermatol 1992;11:200-206.
18. Spruance SL. Herpes simplex labialis. In: Clinical Management of Herpes Viruses. Sacks SL, Straus SE, Whitley RJ, Griffiths PD, eds. amsterdam, Netherlands: IOS Press; 1995.
19. Spruance SL, Nett R, Marbury T, Wolff R, Johnson J, Spaulding T. Acyclovir cream for treatment of herpes simplex labialis: results of two randomized, double-blind, vehicle-controlled, multicenter clinical trials. Antimicrob Agents Chemother 2002;46:2238-2243.
20. Spruance SL, Rea TL, Thoming C, Tucker R, Saltzman R, Boon R. Penciclovir cream for the treatment of herpes simplex labialis. JAMA 1997;277:1374-1379.
21. Raborn GW, Martel AY, lassonde M, et al. Worldwide Topical Penciclovir Collaborative Study Group. Effective treatment of herpes simplex labialis with penciclovir cream: combined results of two trials. J Am Dent Assoc 2002;133:303-309.
22. Reichman RC, Badger GJ, Mertz GJ, et al. Treatment of recurrent genital herpes simplex infections with oral acyclovir: a controlled trial. JAMA 1984;251:2103-2107.
23. Sacks SL, Aoki FY, Diaz-Mitoma F, Sellors J, Shafran SD. Canadian Famciclovir Study Group. Patient-initiated, twice-daily oral famciclovir for early recurrent genital herpes: a randomized, double-blind multicenter trial. JAMA 1996;276:44-49.
24. Tyring SK, Douglas JM, Jr, Corey L, Spruance SL, Esmann J. The valaciclovir International Study Group. A randomized, placebo-controlled comparison of oral valcyclovir and acyclovir in immunocompetent patients with recurrent genital herpes infections. Arch Dermatol 1998;134:185-191.
25. Spruance S, Stewart JCB, Rowe NH, McKeough MB, Wenerstrom G, Freeman DJ. Treatment of herpes simplex labialis with oral acyclovir. J Infect Dis 1990;161:185-190.
26. Spruance SL, Tyring SK, DeGregorio B, Miller C, Beutner K; valaciclovir HSV Study Group. A large-scale, placebo-controlled, dose-ranging trial of peroral valaciclovir for episodic treatment of recurrent herpes genitalis. Arch Intern Med 1996;156:1729-1735.
27. Spruance SL, Jones TM, Blatter MM, et al. High-dose, short-duration, early valacyclovir therapy for episodic treatment of cold sores: results of two randomized, placebo-controlled, multicenter studies. Antimicrob Agents Chemother 2003;47:1072-1080.
28. Wald A, Carrell D, Remington M, Kexel E, Zeh J, Corey L. Two-day regimen of acyclovir for treatment of recurrent genital herpes simplex virus type 2 infection. Clin Infect Dis 2002;34:944-948.
29. Aoki FY, Tyring S, Dias-Mitoma F, Gross G, Gao J, Hamed K. Single-day patient initiated famciclovir therapy for recurrent genital herpes: a randomized double-blind, placebo-controlled trial. Clin Infect Dis 2006;42:8-13.
30. Spruance S, Bodsworth N, Resnick H, et al. Single-dose, patient-initiated famciclovir: a randomized, double-blind, placebo-controlled trial for episodic treatment of herpes labialis. J Am Acad Dermatol 2006;55:47-53.
31. Reichman RC, Badger GJ, Guinan ME, et al. Topically administered acyclovir in the treatment of recurrent herpes simplex genitalis: a controlled trial. J Infect Dis 1983;147:336-340.
32. Gill KS, Wood MJ. The clinical pharmacokinetics of famciclovir. Clin Pharmacokinet 1996;31:1-8.
33. Earnshaw DL, Bacon TH, Darlison SJ, Edmonds K, Perkins RM, Vere Hodge RA. Mode of antiviral action of penciclovir in MRC-5 cells infected with herpes simplex virus type 1 (HSV-1), HSV-2, and varicella-zoster virus. Antimicrob Agents Chemother 1992;36:2747-2757.
34. Vere Hodge RA, Perkins RM. Mode of action of 9-(4-hydroxy-3-hydroxymethylbut-1-yl)guanine (Brl 39123) against herpes simplex virus in MrC-5 cells. Antimicrob Agents Chemother 1989;33:223-229.
35. Spruance SL, Freeman DJ. Topical treatment of cutaneous herpes simplex virus infections. Antivir Res 1990;14:305-321.
How well do family physicians manage skin lesions?
Family physicians can feel comfortable that most patients whom they treat with skin disorders improve (B).
The bite of a brown recluse spider is dangerous, leading to necrosis and possibly death, right? That supposition is widely held and backed by studies.1,2 In fact, conventional wisdom says if a person is bitten by a brown recluse spider, serious complications are the norm and the best course of action is aggressive treatment in a hospital.
The studies supporting this view, however, were conducted in tertiary care settings, which do not always represent primary care settings.3,4 When Cacy and Mold5 examined the characteristics of brown recluse spider bites in outpatient settings, they found that 43% of patients healed within 2 weeks and only 1 in 149 patients required hospitalization.
Is it likely other skin disorders seen in primary care also have clinical courses more favorable than when seen in tertiary care centers? This was one of our hypotheses, and we structured our study to determine the percentage of the skin lesions that improved after evaluation and management by family physicians.
How do FPs compare with dermatologists?
Dermatology literature boasts about the superiority of the dermatologist in diagnostic ability, cost savings, and cancer prevention when compared with primary care physicians.6-10 Studies have evaluated the skill level of primary care physicians compared with dermatologists in identifying skin disorders when tested with color transparencies, computer images, and slides—however, rarely with actual patients.7,9-16 Some studies have suggested a higher rate of referral for skin problems than for other non-dermatologic conditions.14,17,18
Often the outcome of interest in these studies is disease-oriented, judging a physician’s diagnostic ability, rather than examining a patient-oriented outcome, such as resolution of lesion or patient satisfaction.
Thus, the secondary aims of our study were to observe how family physicians diagnose and treat the lesions, and to gauge their concordance with dermatologists’ assessments and plans. We hypothesized that, in an office setting, family physicians would provide effective and efficient treatment for most patients who present with new skin lesions, and that there is high diagnostic concordance between the 2 specialties.
We first share our study findings, and then provide details of our Methodology and Results.
Family physicians excel at dermatologic care
Our study demonstrates that most skin conditions diagnosed and managed by family physicians improve. At day 7, 84% of patients who were contacted reported their skin lesions were “better” or “much better.” Moreover, patients said they were highly satisfied with their care. Referrals to subspecialists were infrequent.
These findings counter those from previous studies questioning primary care physicians’ care of dermatologic conditions. We believe it is likely that patients in previous studies reflected different populations than are typically seen by family physicians.18-20 Another difference may be that family physicians used other resources to assist with their diagnosis and treatment decisions. As we hypothesized, family physicians had good correlation with dermatologists in both diagnosis and treatment, and skin lesions improved.
Important study limitations
We relied on patient reports of improvement. While-self impression of degree of improvement is a patient-centered outcome, there may be instances in which inappropriate or insufficient treatment may produce temporary symptomatic relief and mask true improvement.
Although the patients’ primary care physicians were not involved in the follow-up process, it is possible they felt some social pressure to report higher levels of improvement or satisfaction.
Though we attempted to enroll all eligible patients, some patients seen for skin conditions may not have been captured. As we met our planned enrollment rates, we believe we captured most of the eligible encounters.
Some studies have questioned primary care physicians’ abilities to properly diagnose skin cancers.21,22 Our study was not designed or powered to detect skin cancers or the number, if any, of missed diagnoses of skin cancer.
Cues for teachers of family medicine
Most diagnoses fell within a limited set of diagnostic categories that probably reflect a distribution of skin disorders more typical within family medicine than in dermatology clinics. This range of disease defines a set of diagnostic skills, information resources, and treatment plans required to make these diagnoses and manage these conditions in family practice settings. This information should help physicians involved in training family physicians to concentrate on these common categories of diagnoses. Most important, our study conducted with actual patients found that family physicians manage skin lesions effectively and efficiently, with high patient satisfaction.
Methods
Study design and participants
We conducted a multisite, 3-state (Maryland, Virginia, and Washington, DC) prospective cohort study under the auspices of the Capital Area Practice Based Research Network (CAPRICORN). Between May 24 and August 13, 2004, all patients with new skin lesions who were seen by participating physicians were expected to enter into the study. Institutional Review Board approval was obtained from Georgetown University prior to the study. Written informed consent was obtained from all physicians and patients.
Inclusion/exclusion criteria
A lesion was considered new if patients presented to a family physician with one or more skin lesion that had not been previously treated or examined by another physician.
Patients were ineligible if they: 1) had a lesion with unknown duration; 2) had no telephone for follow-up; 3) did not speak English or Spanish; or, 4) had a lesion resulting from trauma.
Interventions
The initial intervention consisted of 2 parts: 1) after examining a patient, family physicians completed a 10-question survey, recording diagnosis, treatment plan, and resources used in treatment; 2) research assistants completed a 14-question survey, consisting of general patient and lesion information. Follow-up patient surveys were completed by telephone on days 7, 28, and 84.
Two university-based dermatologists helped develop the photography protocol. They specifically requested 3 digital photos of lesions under incandescent light, specific information for diagnosis, and direction for how photographs should be taken. The photographs were taken using Olympus C-5000 5MP Digital Camera w/3x Optical Zoom and were developed with HP photo glossy paper. The dermatologists separately reviewed the photographs blinded to the family physician’s diagnosis and treatment. The dermatologists commented on diagnosis and treatment plan for the first 99 patients enrolled in the study.
Outcomes
The primary outcome was dichotomous: whether skin lesions improved or not at day 7. Secondary outcomes were measures of improvement at days 28 and 84. We also examined patients’ satisfaction on a scale of 1 to 5 (“How satisfied were you with your skin care provided by your family physician?” 1=very satisfied, 5=very unsatisfied).
The categorization of acute skin lesions was developed by a modified delphi process in order to classify the lesions into groups. The principal investigator initially categorized all diagnoses and treatments. Next, 3 other members of the study (AK, BP, and DM) individually reviewed and guided categorizations. The 2 dermatologists gave the final input. This resulted in 41 categories for diagnosis and 9 for treatment.
Statistical analysis
Descriptive statistics provided baseline characteristics for the group. Frequencies were computed on patient, visit, and lesion characteristics, including patient improvement at days 7, 28, and 84. We also computed patient satisfaction with the care provided by their physician at 7, 28, and 84 days. Agreement rates between the family physicians and the 2 dermatologists were obtained for the subset of cases where both dermatologists agreed on the diagnosis. Similarly, the agreement rates were computed for recommended treatment using only those cases where the 2 dermatologists agreed on treatment. All descriptive statistics were computed with SPSS (SPSS, Inc, Chicago, Ill).
RESULTS
A total of 244 patients with 267 skin lesions were recruited by 53 family physicians during the study period. The 7-day follow-up patient survey was completed for 234 lesions (88%), the 28-day survey was completed for 220 lesions (82%), and the 84-day survey was completed for 203 lesions (76%). Study participants ranged in age from 3 months to 86 years; adults were predominantly college-educated, non-Hispanic, and white (TABLE 1). The majority of study participants (73%) reported that their skin lesion was the primary reason for their appointment.
Characteristics of the clinical encounters are presented in TABLE 2. While most skin lesions were present for 30 days or less (62%), over one quarter had been present for more than 90 days. The family physicians made 40 general dermatologic diagnoses. Only 3 lesions (1%) were considered malignant (data not shown). Family physicians reported relatively high confidence with their diagnoses (mean confidence score of 8.4, with range 1 to 10, 1=not at all certain, 10=very certain).
Other characteristics of the clinical encounters not shown in TABLE 2 are the family physicians’ judgment on resolution of the lesions and diagnostic steps used in treating the lesions. In most cases, family physicians believed the lesion would resolve within 12 weeks (203 lesions received a score of ≥7, 0=no improvement expected, 10=complete resolution expected). There was a bimodal distribution with 144 lesions receiving a 10, while 36 received a grade of 0. To make their diagnosis, most family physicians examined other parts of the skin (70%), consulted a colleague (14%), or consulted an electronic resource (6%). Laboratory tests, skin scrapings, diagnostic cultures, Woods lamp exams, or skin biopsies were performed in a total of 10% of encounters.
TABLE 3 reports the primary outcome, patient-reported resolution of skin lesions. These data were restricted only to lesions that were expected to improve (defined as a clinician assigned resolution score ≥7).
Overall, patients were very satisfied with the dermatologic care provided by their family physician. On a 5-point satisfaction scale, 55% of patients reported 1, the highest satisfaction level and 34% reported 2, the next highest level at day 7. At days 28 and 84, 93% of the patients reported the 2 highest levels of satisfaction. These data exclude patients lost to follow-up. Including all participants in the denominator, the rates of either the 2 highest levels of satisfaction at day 7 was 78%, at day 28 was 76%, and at day 84 was 70%.
The overall agreements in diagnosis and treatment, respectively, between the family physicians and the dermatologists were 72% and 80%. We examined only the aspects where both of the dermatologists agreed. Interestingly, for the more common diagnoses, the agreement rates were above 80%; however, for less common diagnoses, the rates were 62%. This trend was not observed in the treatment agreements, primarily due to dermatologists recommending steroids much more often than family physicians prescribed steroids. See Table 4 and Table 5.
TABLE 1
Characteristics of study sample
| CHARACTERISTIC | N (%)* |
|---|---|
| Age of participants (years) | |
| 0–17 | 42 (17) |
| 18–35 | 80 (33) |
| 36–64 | 107 (44) |
| ≥65 | 15 (6) |
| Gender | |
| Male | 112 (46) |
| Female | 131 (54) |
| Race/ethnicity | |
| Hispanic† | 27 (11) |
| Non-Hispanic | |
| White | 186 (77) |
| African american | 13 (5) |
| Asian | 13 (5) |
| American Indian/Inuit | 2 (1) |
| Highest education level (older than 18 years) | |
| High school or less | 26 (13) |
| Some college/college grad | 111 (56) |
| Graduate school | 63 (31) |
| Employment status (older than 18 years) | |
| Employed | 163 (82) |
| Unemployed | 35 (18) |
| Insurance status | |
| Insured | 228 (94) |
| Uninsured | 15 (6) |
| Skin lesion primary reason for visit | |
| Yes | 189 (73) |
| No | 70 (27) |
| * Totals may no always equal 244 due to missing data. | |
| † Hispanics may be of any race. | |
TABLE 2
Skin lesions seen in study sites
| DURATION OF LESION PRIOR TO VISIT (N=258) | N (%) |
| 30 days or less | 161 (62%) |
| 31–60 days | 15 (6%) |
| 61–90 days | 9 (4%) |
| 91 days or longer | 73 (28%) |
| TEN MOST COMMONLY DIAGNOSED SKIN LESIONS (N=257) | N (%) |
| Eczema | 73 (28%) |
| Dermatophyte infection | 28 (11%) |
| Benign nevus | 26 (10%) |
| Bacterial infection | 14 (6%) |
| Seborreic keratosis | 11 (4%) |
| Bites | 11 (4%) |
| Herpes | 10 (4%) |
| Warts | 10 (4%) |
| Viral exanthem | 8 (3%) |
| Actinic keratosis | 7 (3%) |
| FREQUENCY OF REPORTED TREATMENT ELEMENTS | N (%) |
| Prescription | 158 (59%) |
| Recommended over-the-counter medication | 63 (24%) |
| Reassurance with no other treatment | 43 (16%) |
| Recommended prevention | 29 (11%) |
| Removed lesion | 28 (11%) |
| No treatment but arranged follow-up | 15 (6%) |
| Degree of certainty with diagnosis* | Mean: 8.4 (SD: 1.7) |
| Referred to another provider (n=263) | 23 (9%) |
| Unless otherwise noted, the sample size is 267 lesions. | |
| * 1=Not at all certain, 10=Very certain. | |
TABLE 3
Patients reported high satisfaction
| NUMBER OF PATIENTS REPORTING OUTCOME (%) FOR PATIENTS WITH LESIONS EXPECTED TO IMPROVE BY FAMILY PHYSICIAN (RESOLUTION SCORE ≥ 7)* | |
|---|---|
| Day 7 (n=234) | (n=181) |
| Much better or better | 152 (84%) |
| The same | 24 (13%) |
| Much worse or worse | 5 (3%) |
| Day 28 (n=220) | (n=169) |
| Much better or better | 150 (89%) |
| The same | 15 (9%) |
| Much worse or worse | 1 (2%) |
| Day 84 (n=203) | (n=157) |
| Much better or better | 147 (94%) |
| The same | 6 (4%) |
| Much worse or worse | 1 (2%) |
| * Totals not identical with Table 2 due to loss to follow-up. | |
Acknowledgments
The views expressed are those of the authors. No official endorsement by the Agency for Healthcare Research and Quality is intended or should be inferred. We would like to thank the following medical students who played an integral role in recruitment, Aaron Baker, Richard Sisson and Giovina Lara Bomba. We would like to thank Haewon Park for editorial assistance. We would like to that the following practices for participation, Potomac Physician Associates of Kensington, La Clinica del Pueblo, Community of Hope, Fort Lincoln, Fairfax Family Practice of Vienna, Fair Oaks, and Prince William.
CORRESPONDENCE
Dan Merenstein, MD, 215 Kober Cogan Hall, 3750 Reservoir Road, NW, Washington, DC 20007. E-mail: [email protected]
1. Dovey SM, Green LA, Phillips RL, Fryer GE. The ecology of medical care for children in the United States: a new application of an old model reveals inequities that can be corrected. Am Fam Physician 2003;68:2310.-
2. Green LA, Fryer GE, Jr, Yawn BP, Lanier D, Dovey SM. The ecology of medical care revisited. N Engl J Med 2001;344:2021-2025.
3. Townsend. Sabiston Textbook of Surgery. Elsevier, 2004:604–605.
4. Noble. Textbook of Primary Care Medicine. 3rd ed. St Louis, Mo: Mosby, 2001:808.
5. Cacy J, Mold JW. The clinical characteristics of brown recluse spider bites treated by family physicians: an OKPRN Study. Oklahoma Physicians research Network. J Fam Pract 1999;48:536-542.
6. Cassileth BR, Clark WH, Jr, Lusk EJ, Frederick BE, Thompson CJ, Walsh WP. How well do physicians recognize melanoma and other problem lesions? J Am Acad Dermatol 1986;14:555-560.
7. Ramsey DL, Fox AB. The ability of the primary care physicians to recognize the common dermatoses. Arch Dermatol 1981;117:620-622.
8. Federman DG, Kirsner RS. The primary care physician and the treatment of patients with skin disorders. Dermatol Clin 2000;18:215-221, viii.
9. Wagner RF, Jr, Wagner D, Tomich JM, Wagner KD, Grande DJ. Diagnoses of skin disease: dermatologists vs. nondermatologists. J Dermatol Surg Oncol 1985;11:476-479.
10. Federman DG, Concato J, Kirsner RS. Comparison of dermatologic diagnoses by primary care practitioners and dermatologists. A review of the literature. Arch Fam Med 1999;8:170-172.
11. Solomon BA, Collins R, Silverberg NB, Glass AT. Quality of care: issue or oversight in health care reform? J Am Acad Dermatol 1996;34:601-607.
12. Norman GR, Rosenthal D, Brooks LR, Allen SW, Muzzin LJ. The development of expertise in dermatology. Arch Dermatol 1989;125:1063-1068.
13. Kirsner RS, Federman DG. Lack of correlation between internists’ ability in dermatology and their patterns of treating patients with skin disease. Arch Dermatol 1996;132:1043-1046.
14. Clark RA, Rietschel RL. The cost of initiating appropriate therapy for skin diseases: a comparison of dermatologists and family physicians. J Am Acad Dermatol 1983;9:787-796.
15. Gerbert B, Maurer T, Berger T, et al. Primary care physicians as gatekeepers in managed care. Primary care physicians’ and dermatologists’ skills at secondary prevention of skin cancer. Arch Dermatol 1996;132:1030-1038.
16. Dolan NC, Martin GJ, Robinson JK, Rademaker AW. Skin cancer control practices among physicians in a university general medicine practice. J Gen Intern Med 1995;10:515-519.
17. Lowell BA, Froelich CW, Federman DG, Kirsner RS. Dermatology in primary care: Prevalence and patient disposition. J Am Acad Dermatol 2001;45:250-255.
18. Feldman SR, Fleischer AB, Jr, Chen JG. The gatekeeper model is inefficient for the delivery of dermatologic services. J Am Acad Dermatol 1999;40:426-432.
19. Fleischer AB, Jr, Herbert CR, Feldman SR, O’Brien F. Diagnosis of skin disease by nondermatologists. Am J Manag Care 2000;6:1149-1156.
20. McCarthy GM, Lamb GC, Russell TJ, Young MJ. Primary care-based dermatology practice: internists need more training. J Gen Intern Med 1991;6:52-56.
21. Halpern AC, Hanson LJ. Awareness of, knowledge of and attitudes to nonmelanoma skin cancer (NMSC) and actinic keratosis (AK) among physicians. Int J Dermatol 2004;43:638-642.
22. Roetzheim RG, Pal N, van Durme DJ, et al. Increasing supplies of dermatologists and family physicians are associated with earlier stage of melanoma detection. J Am Acad Dermatol 2000;43:211-218.
Family physicians can feel comfortable that most patients whom they treat with skin disorders improve (B).
The bite of a brown recluse spider is dangerous, leading to necrosis and possibly death, right? That supposition is widely held and backed by studies.1,2 In fact, conventional wisdom says if a person is bitten by a brown recluse spider, serious complications are the norm and the best course of action is aggressive treatment in a hospital.
The studies supporting this view, however, were conducted in tertiary care settings, which do not always represent primary care settings.3,4 When Cacy and Mold5 examined the characteristics of brown recluse spider bites in outpatient settings, they found that 43% of patients healed within 2 weeks and only 1 in 149 patients required hospitalization.
Is it likely other skin disorders seen in primary care also have clinical courses more favorable than when seen in tertiary care centers? This was one of our hypotheses, and we structured our study to determine the percentage of the skin lesions that improved after evaluation and management by family physicians.
How do FPs compare with dermatologists?
Dermatology literature boasts about the superiority of the dermatologist in diagnostic ability, cost savings, and cancer prevention when compared with primary care physicians.6-10 Studies have evaluated the skill level of primary care physicians compared with dermatologists in identifying skin disorders when tested with color transparencies, computer images, and slides—however, rarely with actual patients.7,9-16 Some studies have suggested a higher rate of referral for skin problems than for other non-dermatologic conditions.14,17,18
Often the outcome of interest in these studies is disease-oriented, judging a physician’s diagnostic ability, rather than examining a patient-oriented outcome, such as resolution of lesion or patient satisfaction.
Thus, the secondary aims of our study were to observe how family physicians diagnose and treat the lesions, and to gauge their concordance with dermatologists’ assessments and plans. We hypothesized that, in an office setting, family physicians would provide effective and efficient treatment for most patients who present with new skin lesions, and that there is high diagnostic concordance between the 2 specialties.
We first share our study findings, and then provide details of our Methodology and Results.
Family physicians excel at dermatologic care
Our study demonstrates that most skin conditions diagnosed and managed by family physicians improve. At day 7, 84% of patients who were contacted reported their skin lesions were “better” or “much better.” Moreover, patients said they were highly satisfied with their care. Referrals to subspecialists were infrequent.
These findings counter those from previous studies questioning primary care physicians’ care of dermatologic conditions. We believe it is likely that patients in previous studies reflected different populations than are typically seen by family physicians.18-20 Another difference may be that family physicians used other resources to assist with their diagnosis and treatment decisions. As we hypothesized, family physicians had good correlation with dermatologists in both diagnosis and treatment, and skin lesions improved.
Important study limitations
We relied on patient reports of improvement. While-self impression of degree of improvement is a patient-centered outcome, there may be instances in which inappropriate or insufficient treatment may produce temporary symptomatic relief and mask true improvement.
Although the patients’ primary care physicians were not involved in the follow-up process, it is possible they felt some social pressure to report higher levels of improvement or satisfaction.
Though we attempted to enroll all eligible patients, some patients seen for skin conditions may not have been captured. As we met our planned enrollment rates, we believe we captured most of the eligible encounters.
Some studies have questioned primary care physicians’ abilities to properly diagnose skin cancers.21,22 Our study was not designed or powered to detect skin cancers or the number, if any, of missed diagnoses of skin cancer.
Cues for teachers of family medicine
Most diagnoses fell within a limited set of diagnostic categories that probably reflect a distribution of skin disorders more typical within family medicine than in dermatology clinics. This range of disease defines a set of diagnostic skills, information resources, and treatment plans required to make these diagnoses and manage these conditions in family practice settings. This information should help physicians involved in training family physicians to concentrate on these common categories of diagnoses. Most important, our study conducted with actual patients found that family physicians manage skin lesions effectively and efficiently, with high patient satisfaction.
Methods
Study design and participants
We conducted a multisite, 3-state (Maryland, Virginia, and Washington, DC) prospective cohort study under the auspices of the Capital Area Practice Based Research Network (CAPRICORN). Between May 24 and August 13, 2004, all patients with new skin lesions who were seen by participating physicians were expected to enter into the study. Institutional Review Board approval was obtained from Georgetown University prior to the study. Written informed consent was obtained from all physicians and patients.
Inclusion/exclusion criteria
A lesion was considered new if patients presented to a family physician with one or more skin lesion that had not been previously treated or examined by another physician.
Patients were ineligible if they: 1) had a lesion with unknown duration; 2) had no telephone for follow-up; 3) did not speak English or Spanish; or, 4) had a lesion resulting from trauma.
Interventions
The initial intervention consisted of 2 parts: 1) after examining a patient, family physicians completed a 10-question survey, recording diagnosis, treatment plan, and resources used in treatment; 2) research assistants completed a 14-question survey, consisting of general patient and lesion information. Follow-up patient surveys were completed by telephone on days 7, 28, and 84.
Two university-based dermatologists helped develop the photography protocol. They specifically requested 3 digital photos of lesions under incandescent light, specific information for diagnosis, and direction for how photographs should be taken. The photographs were taken using Olympus C-5000 5MP Digital Camera w/3x Optical Zoom and were developed with HP photo glossy paper. The dermatologists separately reviewed the photographs blinded to the family physician’s diagnosis and treatment. The dermatologists commented on diagnosis and treatment plan for the first 99 patients enrolled in the study.
Outcomes
The primary outcome was dichotomous: whether skin lesions improved or not at day 7. Secondary outcomes were measures of improvement at days 28 and 84. We also examined patients’ satisfaction on a scale of 1 to 5 (“How satisfied were you with your skin care provided by your family physician?” 1=very satisfied, 5=very unsatisfied).
The categorization of acute skin lesions was developed by a modified delphi process in order to classify the lesions into groups. The principal investigator initially categorized all diagnoses and treatments. Next, 3 other members of the study (AK, BP, and DM) individually reviewed and guided categorizations. The 2 dermatologists gave the final input. This resulted in 41 categories for diagnosis and 9 for treatment.
Statistical analysis
Descriptive statistics provided baseline characteristics for the group. Frequencies were computed on patient, visit, and lesion characteristics, including patient improvement at days 7, 28, and 84. We also computed patient satisfaction with the care provided by their physician at 7, 28, and 84 days. Agreement rates between the family physicians and the 2 dermatologists were obtained for the subset of cases where both dermatologists agreed on the diagnosis. Similarly, the agreement rates were computed for recommended treatment using only those cases where the 2 dermatologists agreed on treatment. All descriptive statistics were computed with SPSS (SPSS, Inc, Chicago, Ill).
RESULTS
A total of 244 patients with 267 skin lesions were recruited by 53 family physicians during the study period. The 7-day follow-up patient survey was completed for 234 lesions (88%), the 28-day survey was completed for 220 lesions (82%), and the 84-day survey was completed for 203 lesions (76%). Study participants ranged in age from 3 months to 86 years; adults were predominantly college-educated, non-Hispanic, and white (TABLE 1). The majority of study participants (73%) reported that their skin lesion was the primary reason for their appointment.
Characteristics of the clinical encounters are presented in TABLE 2. While most skin lesions were present for 30 days or less (62%), over one quarter had been present for more than 90 days. The family physicians made 40 general dermatologic diagnoses. Only 3 lesions (1%) were considered malignant (data not shown). Family physicians reported relatively high confidence with their diagnoses (mean confidence score of 8.4, with range 1 to 10, 1=not at all certain, 10=very certain).
Other characteristics of the clinical encounters not shown in TABLE 2 are the family physicians’ judgment on resolution of the lesions and diagnostic steps used in treating the lesions. In most cases, family physicians believed the lesion would resolve within 12 weeks (203 lesions received a score of ≥7, 0=no improvement expected, 10=complete resolution expected). There was a bimodal distribution with 144 lesions receiving a 10, while 36 received a grade of 0. To make their diagnosis, most family physicians examined other parts of the skin (70%), consulted a colleague (14%), or consulted an electronic resource (6%). Laboratory tests, skin scrapings, diagnostic cultures, Woods lamp exams, or skin biopsies were performed in a total of 10% of encounters.
TABLE 3 reports the primary outcome, patient-reported resolution of skin lesions. These data were restricted only to lesions that were expected to improve (defined as a clinician assigned resolution score ≥7).
Overall, patients were very satisfied with the dermatologic care provided by their family physician. On a 5-point satisfaction scale, 55% of patients reported 1, the highest satisfaction level and 34% reported 2, the next highest level at day 7. At days 28 and 84, 93% of the patients reported the 2 highest levels of satisfaction. These data exclude patients lost to follow-up. Including all participants in the denominator, the rates of either the 2 highest levels of satisfaction at day 7 was 78%, at day 28 was 76%, and at day 84 was 70%.
The overall agreements in diagnosis and treatment, respectively, between the family physicians and the dermatologists were 72% and 80%. We examined only the aspects where both of the dermatologists agreed. Interestingly, for the more common diagnoses, the agreement rates were above 80%; however, for less common diagnoses, the rates were 62%. This trend was not observed in the treatment agreements, primarily due to dermatologists recommending steroids much more often than family physicians prescribed steroids. See Table 4 and Table 5.
TABLE 1
Characteristics of study sample
| CHARACTERISTIC | N (%)* |
|---|---|
| Age of participants (years) | |
| 0–17 | 42 (17) |
| 18–35 | 80 (33) |
| 36–64 | 107 (44) |
| ≥65 | 15 (6) |
| Gender | |
| Male | 112 (46) |
| Female | 131 (54) |
| Race/ethnicity | |
| Hispanic† | 27 (11) |
| Non-Hispanic | |
| White | 186 (77) |
| African american | 13 (5) |
| Asian | 13 (5) |
| American Indian/Inuit | 2 (1) |
| Highest education level (older than 18 years) | |
| High school or less | 26 (13) |
| Some college/college grad | 111 (56) |
| Graduate school | 63 (31) |
| Employment status (older than 18 years) | |
| Employed | 163 (82) |
| Unemployed | 35 (18) |
| Insurance status | |
| Insured | 228 (94) |
| Uninsured | 15 (6) |
| Skin lesion primary reason for visit | |
| Yes | 189 (73) |
| No | 70 (27) |
| * Totals may no always equal 244 due to missing data. | |
| † Hispanics may be of any race. | |
TABLE 2
Skin lesions seen in study sites
| DURATION OF LESION PRIOR TO VISIT (N=258) | N (%) |
| 30 days or less | 161 (62%) |
| 31–60 days | 15 (6%) |
| 61–90 days | 9 (4%) |
| 91 days or longer | 73 (28%) |
| TEN MOST COMMONLY DIAGNOSED SKIN LESIONS (N=257) | N (%) |
| Eczema | 73 (28%) |
| Dermatophyte infection | 28 (11%) |
| Benign nevus | 26 (10%) |
| Bacterial infection | 14 (6%) |
| Seborreic keratosis | 11 (4%) |
| Bites | 11 (4%) |
| Herpes | 10 (4%) |
| Warts | 10 (4%) |
| Viral exanthem | 8 (3%) |
| Actinic keratosis | 7 (3%) |
| FREQUENCY OF REPORTED TREATMENT ELEMENTS | N (%) |
| Prescription | 158 (59%) |
| Recommended over-the-counter medication | 63 (24%) |
| Reassurance with no other treatment | 43 (16%) |
| Recommended prevention | 29 (11%) |
| Removed lesion | 28 (11%) |
| No treatment but arranged follow-up | 15 (6%) |
| Degree of certainty with diagnosis* | Mean: 8.4 (SD: 1.7) |
| Referred to another provider (n=263) | 23 (9%) |
| Unless otherwise noted, the sample size is 267 lesions. | |
| * 1=Not at all certain, 10=Very certain. | |
TABLE 3
Patients reported high satisfaction
| NUMBER OF PATIENTS REPORTING OUTCOME (%) FOR PATIENTS WITH LESIONS EXPECTED TO IMPROVE BY FAMILY PHYSICIAN (RESOLUTION SCORE ≥ 7)* | |
|---|---|
| Day 7 (n=234) | (n=181) |
| Much better or better | 152 (84%) |
| The same | 24 (13%) |
| Much worse or worse | 5 (3%) |
| Day 28 (n=220) | (n=169) |
| Much better or better | 150 (89%) |
| The same | 15 (9%) |
| Much worse or worse | 1 (2%) |
| Day 84 (n=203) | (n=157) |
| Much better or better | 147 (94%) |
| The same | 6 (4%) |
| Much worse or worse | 1 (2%) |
| * Totals not identical with Table 2 due to loss to follow-up. | |
Acknowledgments
The views expressed are those of the authors. No official endorsement by the Agency for Healthcare Research and Quality is intended or should be inferred. We would like to thank the following medical students who played an integral role in recruitment, Aaron Baker, Richard Sisson and Giovina Lara Bomba. We would like to thank Haewon Park for editorial assistance. We would like to that the following practices for participation, Potomac Physician Associates of Kensington, La Clinica del Pueblo, Community of Hope, Fort Lincoln, Fairfax Family Practice of Vienna, Fair Oaks, and Prince William.
CORRESPONDENCE
Dan Merenstein, MD, 215 Kober Cogan Hall, 3750 Reservoir Road, NW, Washington, DC 20007. E-mail: [email protected]
1. Dovey SM, Green LA, Phillips RL, Fryer GE. The ecology of medical care for children in the United States: a new application of an old model reveals inequities that can be corrected. Am Fam Physician 2003;68:2310.-
2. Green LA, Fryer GE, Jr, Yawn BP, Lanier D, Dovey SM. The ecology of medical care revisited. N Engl J Med 2001;344:2021-2025.
3. Townsend. Sabiston Textbook of Surgery. Elsevier, 2004:604–605.
4. Noble. Textbook of Primary Care Medicine. 3rd ed. St Louis, Mo: Mosby, 2001:808.
5. Cacy J, Mold JW. The clinical characteristics of brown recluse spider bites treated by family physicians: an OKPRN Study. Oklahoma Physicians research Network. J Fam Pract 1999;48:536-542.
6. Cassileth BR, Clark WH, Jr, Lusk EJ, Frederick BE, Thompson CJ, Walsh WP. How well do physicians recognize melanoma and other problem lesions? J Am Acad Dermatol 1986;14:555-560.
7. Ramsey DL, Fox AB. The ability of the primary care physicians to recognize the common dermatoses. Arch Dermatol 1981;117:620-622.
8. Federman DG, Kirsner RS. The primary care physician and the treatment of patients with skin disorders. Dermatol Clin 2000;18:215-221, viii.
9. Wagner RF, Jr, Wagner D, Tomich JM, Wagner KD, Grande DJ. Diagnoses of skin disease: dermatologists vs. nondermatologists. J Dermatol Surg Oncol 1985;11:476-479.
10. Federman DG, Concato J, Kirsner RS. Comparison of dermatologic diagnoses by primary care practitioners and dermatologists. A review of the literature. Arch Fam Med 1999;8:170-172.
11. Solomon BA, Collins R, Silverberg NB, Glass AT. Quality of care: issue or oversight in health care reform? J Am Acad Dermatol 1996;34:601-607.
12. Norman GR, Rosenthal D, Brooks LR, Allen SW, Muzzin LJ. The development of expertise in dermatology. Arch Dermatol 1989;125:1063-1068.
13. Kirsner RS, Federman DG. Lack of correlation between internists’ ability in dermatology and their patterns of treating patients with skin disease. Arch Dermatol 1996;132:1043-1046.
14. Clark RA, Rietschel RL. The cost of initiating appropriate therapy for skin diseases: a comparison of dermatologists and family physicians. J Am Acad Dermatol 1983;9:787-796.
15. Gerbert B, Maurer T, Berger T, et al. Primary care physicians as gatekeepers in managed care. Primary care physicians’ and dermatologists’ skills at secondary prevention of skin cancer. Arch Dermatol 1996;132:1030-1038.
16. Dolan NC, Martin GJ, Robinson JK, Rademaker AW. Skin cancer control practices among physicians in a university general medicine practice. J Gen Intern Med 1995;10:515-519.
17. Lowell BA, Froelich CW, Federman DG, Kirsner RS. Dermatology in primary care: Prevalence and patient disposition. J Am Acad Dermatol 2001;45:250-255.
18. Feldman SR, Fleischer AB, Jr, Chen JG. The gatekeeper model is inefficient for the delivery of dermatologic services. J Am Acad Dermatol 1999;40:426-432.
19. Fleischer AB, Jr, Herbert CR, Feldman SR, O’Brien F. Diagnosis of skin disease by nondermatologists. Am J Manag Care 2000;6:1149-1156.
20. McCarthy GM, Lamb GC, Russell TJ, Young MJ. Primary care-based dermatology practice: internists need more training. J Gen Intern Med 1991;6:52-56.
21. Halpern AC, Hanson LJ. Awareness of, knowledge of and attitudes to nonmelanoma skin cancer (NMSC) and actinic keratosis (AK) among physicians. Int J Dermatol 2004;43:638-642.
22. Roetzheim RG, Pal N, van Durme DJ, et al. Increasing supplies of dermatologists and family physicians are associated with earlier stage of melanoma detection. J Am Acad Dermatol 2000;43:211-218.
Cutaneous melanoma: Detecting it earlier, weighing management options
- Arrange a biopsy of any pigmented lesion that changes significantly on serial examinations.
- Full-thickness excisional biopsy is preferred; for large lesions, incisional or punch biopsy at the deepest point of the tumor may be an option.
- For thin lesions, a surgical margin encompassing 1 cm normal skin is recommended.
- Specimens submitted in formalin for permanent sections are preferred to frozen sections.
A 51-year-old man of northern European descent who works outdoors for the city asks you to look at a “mole” on his face. The lesion does not have the classic appearance of a melanoma that you have seen before, and it is still fairly small. Should you advise a wait-and-see approach or perform a biopsy?
Opt for early detection
Given the patient’s likely genetic predisposition to skin cancer and his regular, lengthy exposure to sunlight (see Risk factors), you would be wise to follow your cutaneous examination with a biopsy.
The ABCDs of visual assessment. The classic clinical presentation of melanoma is well known. The most publicized means for identifying potentially atypical pigmented skin lesions is the “ABCD” mnemonic (asymmetry, border irregularity, color variegation, and lesion diameter >6 mm) (FIGURES 1 AND 2).7,8 The ABCDs are primarily an educational tool for patients. This mnemonic was expanded to include E, representing evolution of a pigmented lesion.9 Any pigmented lesion observed to change significantly on serial examinations warrants biopsy to exclude melanoma.
Caveat: not all melanomas are pigmented. Amelanotic melanomas are a diagnostic challenge and may be lethal if left unattended.
Routine screening. Large-scale skin cancer screening has been performed and found to be a statistically ineffective means of detection. Moreover, the US Preventive Services Task Force found insufficient evidence to recommend for or against routine counseling by primary care physicians to prevent skin cancer.10
A large-scale educational and screening campaign was performed in Italy from 1991 to 1996. During this period, 90,000 educational leaflets were distributed to a target population of approximately 243,000. A total of 2050 individuals requested a skin examination, resulting in detection of 13 melanomas.11 However, 92.3% of the melanomas were thin (<1.52 mm deep). Despite the lack of statistical significance for such screenings, many organizations do perform them and find melanomas, which can be life saving for those few individuals.
Anatomic areas to focus on. While melanoma can affect any anatomic region, it is especially common on sun-exposed areas, including the head, neck, and upper extremities. Acral lentiginous melanoma is found on palmar, plantar, and subungual regions. Include the scalp, ocular mucosa, and oral cavity in your examination.
Four primary groups have been traditionally proposed based on a combination of clinical and pathologic features: superficial spreading melanoma, nodular melanoma, lentigo maligna melanoma and acral lentiginous melanoma. Furthermore, additional histopathologic variants including desmoplastic, neurotropic, amelanotic, signet-ring cell, small cell and balloon cell melanoma have been described.
FIGURE 1
Melanoma in situ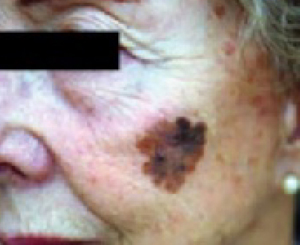
Classic presentations of melanoma in situ on the left cheek. Sun-exposed areas are most often affected.
FIGURE 2
Melanoma in situ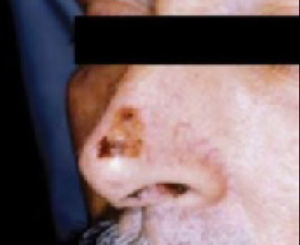
Classic presentations of melanoma in situ on the tip of the nose. Sun-exposed areas are most often affected.
Which biopsy technique to choose?
A properly performed biopsy is mandatory to accurately diagnose and microstage the tumor. No other test reliably surpasses routine histologic examination.
When possible, arrange for a full-thickness excisional biopsy with a narrow (2-mm) rim of normal skin, especially for large lesions in which sampling error may be a factor.
Tissue samples are submitted for histologic examination in formalin for permanent sections. Frozen sections are not recommended for the initial diagnosis of melanoma due to artifactual changes from the freezing process.
When lesions are too large for primary excision, or if an optimal cosmetic result is important to the patient, an incisional or punch biopsy may be taken from the area believed to be the deepest portion of the tumor.
For the largest lesions, multiple punch or incisional biopsies may help to reduce the risk of sampling error. Diagnostic and management problems arise when the initial biopsy does not sample the complete skin thickness or when large lesions are not sampled adequately.
Classification of melanoma
The traditional melanoma classification scheme includes several subtypes (see Detailed melanoma classifications). Though these terms have limited clinical utility, we include them for the sake of completeness and because the terminology may arise in consultation with colleagues.
Most important for the prognosis is a determination of the tumor’s depth of invasiveness.
In situ or invasive?
Melanoma in situ lesions are confined to the epidermis and may extend along hair appendages. It often occurs on sun-exposed areas (FIGURES 1 AND 2). Histologically, melanoma in situ is an asymmetric and poorly circumscribed proliferation of melanocytes usually larger than 6 mm in diameter (FIGURE 3).
Melanocytes form irregular nests that are not equidistant and have areas of confluence (FIGURE 3). Single melanocytes predominate over nests in some areas and may entirely replace the basal layer.
Additional histologic features include single melanocytes above the dermal-epidermal junction (Pagetoid spread) and uneven distribution of pigment. In many cases the dermis has inflammatory infiltrates, melanophages, and evidence of solar-damage. Particularly in anatomical areas rich in hair follicles, the neoplastic cells may spread into the epithelium of the hair follicles without extending to the dermis.
Melanoma in situ may be quite large in diameter (horizontal growth phase) without becoming invasive; however, always be concerned about invasion.
Invasive melanoma shares the same histologic features but invades the dermis or subcutaneous fat (vertical growth phase). Aside from the conventional criteria used for the histologic diagnosis of melanoma, acral melanomas may show an increased number of dendritic melanocytes loaded with melanin (FIGURE 4). Desmoplastic melanoma is most commonly found on the head and neck; however, it varies in clinical presentation (FIGURE 5). It is often associated with other types of melanoma, is common in older persons, and has a slight male predilection.
FIGURE 3
Melanocytes
Melanoma in situ stained with routine hematoxylin/eosin on permanent sections. Note confluent nesting of atypical melanocytes at the dermal-epidermal junction (arrow). There are several foci of Pagetoid spread as melanocytes are seen migrating upward toward the surface.
FIGURE 4
Acral melanoma
Acral melanoma lesion on the hand.
FIGURE 5
Dermoplastic melanoma
Desmoplastic melanoma lesion, commonly found on the head and neck.
Microstaging: The key to good management
The categories “superficial spreading” and “nodular” are based on the seminal work of Wallace Clark, who described putative growth phases of cutaneous melanoma.12 Clark hypothesized that melanoma initially grows horizontally and only later begins an invasive vertical growth phase.
The horizontal growth phase is common in sun-exposed sites and often occurs over a long period of time. The vertical growth phase is a much more aggressive growth pattern that, if left unchecked, can be lethal. This is often seen in nodular melanoma (FIGURE 6).
Measurement of vertical growth (“microstaging”) is the most important prognostic indicator for localized cutaneous melanoma.13
Clark described 5 levels (“Clarks’ levels,” I–V) of invasion (FIGURE 7).
Independently of Clark, Breslow described tumor thickness as an important prognostic factor.14,15 Breslow thickness is measured from the granular layer of the epidermis to the deepest area of invasion (FIGURE 7). Most reports indicate that, overall, Breslow tumor thickness more closely correlates with clinical outcome.16
Special circumstances that affect microstaging. Although Clark and Breslow measurements are both conceptually simple, a number of factors, including hair follicle involvement and ulceration, must be considered when measuring melanoma depth. It is often useful to have a Breslow thickness and a Clark’s level for primary cutaneous melanomas (both methods are used for staging thin primary lesions).
The location of the primary lesion affects interpretation of measurement results. For example, a Breslow thickness of 0.5 mm confers a different meaning on the eyelid (very thin skin, Clark’s level proportionately deeper than tumor thickness might indicate) than the back (thick skin, proportionately more superficial Clark’s level than tumor thickness would indicate).
Measurement of vertical involvement is used to stage the tumor with the TNM classification. This was recently updated as outlined by Balch et al13 in 2001 (TABLE 1).
FIGURE 6
Nodular melanoma
Nodular melanoma often exhibits aggressive vertical growth.
FIGURE 7
Classifying melanoma: Both Clark’s level and Breslow measurement are often used for staging
Clark’s levels are derived from level of tumor invasion compared with layers of the skin. Tumors are divided into 5 levels. Level I: Tumor cells confined to the epidermis (in situ). Level II: Tumor invades the papillary dermis, past basement membrane. level III: Tumor fills papillary dermis, extends to the between the papillary and reticular dermis. Level IV: Tumor invades reticular dermis. Level V: Tumor invasion of subcutaneous tissue. Breslow’s thickness is a measurement of lesion depth in millimeters. Tumors are classified into 4 categories based on the depth vertically from the top of the granular layer (or base of superficial ulceration) to the deepest point of tumor involvement.
TABLE 1
Using the TNM staging system to determine prognosis for melanoma
| T CLASSIFICATION | BRESLOW THICKNESS (MM) | ULCERATION | |||||
| T1 | ≤1.0 | a: no ulceration and Clark’s level II/III | |||||
| b: ulceration or Clark’s level IV/V | |||||||
| T2 | 1.01–2.0 | a: no ulceration | |||||
| b: with ulceration | |||||||
| T3 | 2.01–4.0 | a: no ulceration | |||||
| b: with ulceration | |||||||
| T4 | >4.0 | a: no ulceration | |||||
| b: with ulceration | |||||||
| N CLASSIFICATION | METAST ATIC NODES | NODAL METASTATIC MASS | |||||
| N1 | 1 node | a: micrometastasis* | |||||
| b: macrometastasis† | |||||||
| N2 | 2–3 nodes | a: micrometastasis* | |||||
| b: macrometastasis† | |||||||
| N3 | ≥4 metastatic nodes, or matted nodes, or in transit metastases/satellites with metastatic node(s) | ||||||
| M CLASSIFICATION | METASTASES (SITE) | SERUM LDH‡ | |||||
| M1a | Distal skin, subcutaneous/nodal | Normal | |||||
| M1b | Lung | Normal | |||||
| M1c | All other visceral | Normal | |||||
| Any visceral | Elevated | ||||||
| *Micrometastases diagnosed after sentinel or elective lymphadenectomy. | |||||||
| ‡Macrometastases defined as clinically detectable nodal metastases confirmed by therapeutic lymphadenectomy or when nodal metastasis exhibits gross extracapsular extension. | |||||||
| ‡LDH, lactate dehydrogenase. | |||||||
| Once the TNM classification has been determined, the combined findings, as shown below, can help you determine a patient’s relative prognosis. | |||||||
| Clinical Staging | Pathologic Staging | 5-year survival (%) | |||||
| 0 | Tis | N0 | M0 | Tis | N0 | M0 | 96–100 |
| IA | T1a | N0 | M0 | T1a | N0 | M0 | 95 |
| IB | T1b | N0 | M0 | T1b | N0 | M0 | 90 |
| T2a | N0 | M0 | T2a | N0 | M0 | ||
| IIA | T2b | N0 | M0 | T2b | N0 | M0 | 78 |
| T3a | N0 | M0 | T3a | N0 | M0 | ||
| IIB | T3b | N0 | M0 | T3b | N0 | M0 | 65 |
| T4a | N0 | M0 | T4a | N0 | M0 | ||
| IIC | T4b | N0 | M0 | T4b | N0 | M0 | 45 |
| III | Any T | Any N | M0 | ||||
| IIIA | T1-4a | N1a | M0 | 66 | |||
| T1-4a | N2a | M0 | |||||
| IIIB | T1-4b | N1a | M0 | 52 | |||
| T1-4b | N2a | M0 | |||||
| T1-4a | N1b | M0 | |||||
| T1-4a | N2b | M0 | |||||
| T1-4a | N2c | M0 | |||||
| T1-4b | N2c | M0 | |||||
| IIIC | T1-4b | N1b | M0 | 26 | |||
| T1-4b | N2b | M0 | |||||
| Any T | N3 | M0 | |||||
| IV | Any T | Any N | Any M | Any T | Any N | Any M | 7.5–11 |
Preferred management and contingencies
Primary treatment for cutaneous melanoma is wide local excision of the primary site.
How wide should excision margins be? The appropriate margin of normal skin (measured from the biopsy scar or lateral border of residual melanoma) varies with Breslow tumor thickness.17 With thin and intermediate thickness, a surgical margin encompassing 1 cm of normal skin is the consensus.17 For thicker lesions, many authorities recommend a 2-cm margin. A 1-cm margin may be inadequate due to the risk of local recurrence; however, whether a 2 cm or 3 cm margin is optimal remains unclear.18,19TABLE 2 reviews treatment guidelines for surgical excision of primary cutaneous melanoma.20-24
Biopsied tissue submitted as permanent sections. The planned primary excision site should be oriented and submitted to pathology in formalin for permanent section examination. Frozen sections are generally not recommended; when the pathologist assesses surgical margin status, scattered melanocytes in adjacent sun-damaged skin may lead to uncertainty. Moreover, artifacts from the freezing process make interpretation difficult.
2 qualifiers for the above advice: immunostains have increased the utility of frozen sections, and frozen sections were not used in the clinical trials from which current treatment options were derived. These considerations apply particularly to the use of frozen section analysis in Mohs micrographic surgery (see below).
The wide local excision specimen can be examined by multiple surgical pathology orientation methods. In many cases, if the primary lesion was completely excised by the initial biopsy, the pathologist will examine the area of the biopsy scar for residual melanoma and select portions of the lateral margins for examination. Alternatively, the entire lesion, all of the margins, or even the entire specimen may be submitted for examination depending on the clinical circumstances and concerns of the pathologist and surgeon, such as incomplete removal at the time of initial biopsy or close deep or lateral margins. Communication between surgeon and pathologist must be clear and unambiguous.
Examining multiple sections from the tissue block and adding immunohistochemical stains greatly increase sensitivity for metastatic melanoma.37-40 Cochran et al41 originally demonstrated the importance of immunohistochemistry in the pathology examination of lymph nodes. From 2227 lymph nodes removed from 100 patients, they found that 16 additional lymph nodes in 14 patients contained metastatic melanoma when examined with S-100 immunohistostains. Using additional antibodies more recently (see below), these authors reported that up to 12% of metastatic melanoma deposits can be missed by experienced pathologists without the aid of immunohistochemistry.42
Though no antibody is both highly sensitive and specific for malignant melanoma (versus normal melanocytes), the antibodies most commonly used in immunohistochemistry include S-100 (a neuroectodermal tissue maker expressed in nerves, melanocytes, histiocytes and dendritic cells in lymph nodes), HMB 45 (recognizes an oligosaccharide side chain present in immature melanosomes), Melan-A (recognizes the MART-1 protein), and tyrosinase (recognizing the enzyme tyrosinase required for melanin synthesis). S-100, although very sensitive, is not a melanocyte-specific antibody. The remaining antibodies, though melanocyte specific, are non-reactive in 5% to 15% of cutaneous malignant melanoma.42
Using polymerase chain reaction (PCR) and reverse transcriptase polymerase chain reaction (RTPCR) for MRNA for melanocyte-associated proteins further increases sensitivity, detecting positive nodal cells when routine hematoxylin/eosin and immunohistochemical methods do not. The clinical utility of molecular methods for diagnosis and patient management has not been established; these techniques are the subject of ongoing clinical trials.43
In retrospect, it is clear that the standard techniques used to examine lymph nodes taken from regional lymph node dissections underestimate the presence of micrometastatic disease. one could argue, in fact, that the sole advantage of lymphatic mapping and sentinel lymph node biopsy has been to allow the pathologist to perform a focused, extensive examination on 1-3 lymph nodes – an examination that would be impractical (and prohibitively expensive) on a standard regional lymph node dissection specimen. Interestingly, the idea that additional sections from lymph nodes will increase the detection rate of metastatic tumor is not new and was well-known to the surgeons and pathologists involved in the pioneering work on sentinel lymph node biopsy.41
Mohs micrographic surgery increasingly used for melanoma.25-31 This procedure may be performed with frozen or permanent sections, using concomitant immunohistochemical staining with either method of embedding. This has been especially useful in cosmetically sensitive areas such as the face, ear, nose, genitalia, and extremities.30 Mohs micrographic surgery with permanent sections also makes possible the most definitive surgical margin analysis.
TABLE 2
Recommended incision margins
| BRESLOW THICKNESS | EXCISION MARGINS (CM) |
|---|---|
| In situ | 0.5 |
| <1 mm | 1 |
| 1–4 mm | 1–2 |
| >4 mm | 2–3 |
Sentinel lymph node biopsy
Lymphatic mapping and sentinel lymph node biopsy have significantly changed the initial approach to the patient with melanoma and have reinvigorated debate over the importance and management of regional lymph nodes in cutaneous malignant melanoma. The anatomic basis of, and techniques for, lymphatic mapping and sentinel lymph node biopsy are well-described elsewhere and are not reviewed here.32
Risk factors for melanoma include a personal or family history of melanoma and the presence of multiple nevi. Nevi are considered risk factors if an individual has many or if the nevi are unusual in appearance or size. Other risk factors include fair complexion, excessive sun exposure, history of severe sunburns, use of tanning booths, immunosuppression and occupational exposure to certain chemicals.1
Ultraviolet light exposure remains the most well-described risk factor for the development of cutaneous melanoma; however, the pathogenesis remains largely unknown.3,4 This is especially true in patients with increased ultraviolet sensitivity secondary to fair skin type and a tendency to burn. The use of sunscreen is recommended for prevention of all types of skin cancer; however, its use may promote increased ultraviolet exposure from a false sense of protection.5,6 Additionally, proper application (i.e. frequent reapplication) is seldom performed.
Histolopathologic data from regional lymph nodes is the most important prognostic factor for cutaneous melanoma,13 and sentinel lymph node biopsy is proven as a staging procedure—as reflected in the revised AJCC TNM Staging System published in 2001 (TABLES 1 AND 2).13 This staging system differs from the previous one in several ways:
- Thickness and ulceration are the primary predictors of survival with localized melanoma (stages I and II)
- Number of metastatic lymph nodes involved and tumor burden are most important predictors of survival in stage III melanoma
- Anatomic site of metastasis (distant) and presence/absence of elevated lactate dehydrogenase (LDH) are primary predictors of survival with stage IV melanoma
- Ulceration should prompt an overall upstaging for melanoma stages I–III
- Satellite metastases around a primary melanoma and in-transit metastases together indicate a stage III melanoma
- Staging decisions are based on sentinel node biopsy/lymphatic mapping.13
Multiple studies have reviewed the changes between the new and old TNM staging systems for melanoma.13
When to biopsy. Clinical experience supports reserving lymphatic mapping and sentinel lymph node mapping for patients with primary lesions 1 mm or thicker. Some authorities have recommended sentinel lymph node biopsy for lesions <1 mm thick if they are ulcerated or if a discrepancy exists between the Breslow tumor thickness and Clark’s level. For such lesions, biopsy has been recommended for Clark’s level >III.33
Though sentinel lymph node biopsy can be performed successfully after wide local excision, doing it before excision will prevent disruption of lymphatics for node mapping.34 The sentinel lymph node should be submitted to pathology for permanent section analysis. Frozen section analysis is not recommended for melanoma due to its lower sensitivity.35
Though not widely adopted, some surgeons use intraoperative touch prep cytology as part of an initial intraoperative evaluation.36 If the surgeon is prepared to proceed with regional node dissection and a “black” grossly involved node is encountered, intraoperative frozen section may be used to confirm metastastic melanoma. Neither touch preps nor frozen sections are likely to demonstrate the small, isolated metastatic tumor cells commonly identified in small, grossly normal lymph nodes.
What to expect from the pathologist. If blue dye is used for localization, the pathologist should document the presence of that color in the lymph nodes submitted. Outside of a clinical trial, fresh lymph node tissue is not usually preserved for polymerase chain reaction (PCR) or other molecular methods for detecting tumor cells.
Although examination techniques vary in some details among institutions, general principles are well accepted and include submission of the entire lymph node, step or serial sections, and, when initial sections do not reveal metastatic tumor, use of immunohistochemistry for melanocyte-associated antigens (see Immunohistochemical techniques and antibody testing).
Fine points regarding interpretation of sentinel lymph nodes. First, the rationale behind biopsy of sentinel lymph nodes is that the lymphatic system is a potential means of metastasis. However, it is not the only means of spread. Hematogenous and tissue spread are potential mechanisms as well.
Second, the lymphatic system acts as a drain but not a dam for lymphatic flow. Thus a negative lymph node biopsy does not guarantee that a metastasis has not already occurred.
Third, the increased sensitivity of identification of positive sentinel lymph nodes with more specific tests (ie, immunohistochemistry, PCR, rtPCR) calls a negative result into question. A sentinel lymph node that is “negative” with immunohistochemistry may in fact be positive with gene amplification techniques (PCR, rtPCR).
Fourth, surgeons performing sentinel node biopsies vary in thoroughness when identifying which node or nodes contain the dye. Lymphoscintigraphy is more accurate than using dyes; however, many surgeons use both.44 Thus, while sentinel node biopsy has demonstrated a role in staging, its use and the interpretation of results must be performed with these variables in mind.
Regional lymph node dissection: Does it benefit patients?
Patients found to have metastatic melanoma in a sentinel lymph node are advised to undergo regional lymph node dissection. Unfortunately, few data address survival with this therapy. The role of sentinel lymph node biopsy and elective lymph node dissection in the management of cutaneous malignant melanoma generates debate, much of which focuses on alternate interpretations of the data from the era of elective lymph node dissection for intermediate-thickness melanoma.
The debate over elective lymph node dissection has been summarized by others in detail.47
Proponents of an aggressive strategy correctly point out that data from trials are simply not comparable to what is seen in the current era of sentinel lymph node biopsy.
Opponents of an aggressive strategy, who are numerous and vocal,48-50 correctly observe that no survival benefit has been demonstrated for any treatment strategy based on regional lymph node dissection. However, to be balanced, such long-term outcome data are simply not yet available. Certainly questions will continue to arise regarding the theoretical validity and cost-effectiveness of sentinel lymph node biopsy.48,49,51
How good is adjuvant therapy?
Adjuvant therapy for cutaneous melanoma can include regional external beam radiation, systemic cytotoxic chemotherapy, or immunotherapy. Radiation has a limited role, being used postoperatively to treat regional lymph node dissection beds at high risk of recurrence and to treat locally recurrent and in-transit disease.52
Systemic cytotoxin (often dacarbazine) has not been effective as adjuvant therapy.53 When combined chemo- and immunotherapy is used for metastatic disease, it is with the hope of discovering an effective combination that might also be used in the adjuvant setting.54 However, it has been the initial success with immunotherapy that frames the debate regarding adjuvant systemic therapy for cutaneous malignant melanoma.
High-dose interferon alpha 2b. For thick or node-positive cutaneous malignant melanoma, a statistically significant increase in overall survival with high-dose interferon alpha 2b was demonstrated in a landmark Eastern Cooperative Oncology Group trial.55 Though the results have been confirmed in other trials, the clinical benefit is still debated. The expense and toxicity of the trial, as well as the absence of benefit in a second ECOG trial of high-dose systemic therapy, have contributed to the uncertainty.56
In an effort to reduce toxicity, low-dose systemic interferon alpha 2b has been tested in numerous trials and found to be of no benefit.56 High-dose alpha 2b interferon therapy continues to be a focus of active clinical investigation by national and international cooperative groups. In addition to high-dose systemic interferon, a large number of immunotherapeutic approaches for the systemic treatment of melanoma have been devised and are under active investigation, including non-specific immune adjuvants such as Bacile Calmette-Guerin, levaminsole, vaccines prepared from autologous melanoma cells and vaccines designed against chemically defined antigens (gangliocides).57 Because of the controversies surrounding adjuvant systemic therapy, patients are best served by participating in an ongoing clinical trial if the expense and toxicity of high dose systemic interferon alpha 2b are deemed to be unacceptable.
Acknowledgments
We thank Brian C. Brockway, M.S. (Department of Medical Media, Veterans affairs Medical Center, Augusta, Georgia) for illustrations.
CORRESPONDENCE
Joshua E. Lane, MD, 308 Hospital Drive, Suite 200, Macon, GA 31217. E-mail: [email protected]
1. American Cancer Society Cancer Facts and Figures 2006. Atlanta: american Cancer Society; 2006.
2. Anonymous. Melanoma: Clinical Practice Guidelines in Oncology. JNCCN 2004;2:46-60.
3. Elwood JM. Melanoma and sun exposure. Semin Oncol 1996;23:650-666.
4. Elwood JM, Jopson J. Melanoma and sun exposure: an overview of published studies. Int J Cancer 1997;73:198-203.
5. Whiteman DC, Green AC. Melanoma and sun exposure: where are we now? Int J Dermatol 1999;38:481-489.
6. Katsambas A, Nicolaidou E. Cutaneous malignant melanoma and sun exposure. Recent developments in epidemiology. Arch Dermatol 1996;132:444-450.
7. Polk HC. Surgical progress and understanding in the treatment of the melanoma epidemic. Am J Surg 1999;178:443-448.
8. Baade PD, Balanda KP, Stanton WR, et al. Community perceptions about the important signs of early melanoma. J Am Acad Dermatol 1997;36:199-202.
9. Abbasi NR, Shaw, Rigel DS, et al. Early diagnosis of cutaneous melanoma: revisiting the ABCD criteria. JAMA 2004;292:2771-2776.
10. Counseling to prevent skin cancer: recommendations and rationale of the U.S. Preventive Services Task Force. MMWR Recomm Rep 2003;52:13-17.
11. Rossi CR, Vecchiato A, Bezze G, et al. Early detection of melanoma: an educational campaign in Padova, Italy. Melanoma Res 2000;10:181-187.
12. Clark WH, From L, Bernardino EA, et al. Histogenesis and biologic behavior of primary human malignant melanomas of the skin. Cancer Res 1969;29:705-726.
13. Balch CM, Buzaid AC, Soong SJ, et al. Final version of the American Joint Committee on Cancer staging system for cutaneous melanoma. J Clin Oncol 2001;19:3635-3648.
14. Breslow A. Tumor thickness, level of invasion and node dissection in Stage 1 cutaneous melanoma. Ann Surg 1976;182:572-575.
15. Breslow A. Thickness, cross sectional areas and depth of invasion in the prognosis of cutaneous melanoma. Ann Surg 1970;172:902-908.
16. Barnhill RL, Fine JA, Roush GC, et al. Predicting five-year outcome for patients with cutaneous melanoma in a population-based study. Cancer 1996;78:427-432.
17. Lens MD, Dawes M, Goodacre T, et al. Excision margins in the treatment of primary cutaneous melanoma: a systematic review of randomized controlled trials comparing marrow vs wide excision. Arch Surg 2002;137:1101-1105.
18. Brown SE, Chapman PB. Defining adequate surgery for primary melanoma. N Engl J Med 2004;350:823-825.
19. Thomas JM, Newton-Bishop J, A’Hern R, et al. Excision margins in high-risk melanoma. N Engl J Med 2004;350:757-766.
20. Veronesi U, Cascinelli N. Narrow excision (1-cm margin). A safe procedure for thin cutaneous melanoma. Arch Surg 1991;126:438-441.
21. Bono A, Bartoli C, Clemente C, et al. Ambulatory narrow excision for thin melanoma (< or=2 mm): results of a prospective study. Eur J Cancer 1997;33:1330-1332.
22. Cascinelli N. Margin of resection in the management of primary melanoma. Semin Surg Oncol 1998;14:272-275.
23. Balch CM, Soong SJ, Smith T, et al. Long-term results of a prospective surgical trial comparing 2 cm vs. 4 cm excision margins for 740 patients with 1-4 mm melanomas. Ann Surg Oncol 2001;8:101-108.
24. Johnson TM, Sondak VK. A centimeter here, a centimeter there: does it matter? J Am Acad Dermatol 1995;33:532-534.
25. Zitelli JA, Brown C, Hanusa BH. Mohs micrographic surgery for the treatment of primary cutaneous melanoma. J Am Acad Dermatol 1997;37:236-245.
26. Zalla MJ, Lim KK, Dicaudo DJ, et al. Mohs micrographic excision of melanoma using immunostains. Dermatol Surg 2000;26:771-884.
27. Kelley LC, Starkus L. Immunohistochemical staining of lentigo maligna during Mohs micrographic surgery using MART-1. J Am Acad Dermatol 2002;46:78-84.
28. Nagi C, O’Grady TC, Izadpanah A. Mohs micrographically controlled surgery and the treatment of malignant melanoma. Semin Oncol 2002;29:336-340.
29. Carucci JA. Mohs’ micrographic surgery for the treatment of melanoma. Dermatol Clin 2002;20:701-708.
30. Bienert TN, Trotter MJ, Arlette JP. Treatment of cutaneous melanoma of the face by Mohs micrographic surgery. J Cutan Med Surg 2003;7:25-30.
31. Cook J. Surgical margins for resection of primary cutaneous melanoma. Clin Dermatol 2004;22:228-233.
32. Jakub JW, Pendas S, Reintgen DS. Current status of sentinel lymph node mapping and biopsy: facts and controversies. Oncologist 2003;8:59-68.
33. Jacobs IA, Chang CK, DasGupta TK, et al. Role of sentinel lymph node biopsy in patients with thin (<1mm) primary cutaneous melanoma. Ann Surg Oncol 2003;10:558-561.
34. Evans HL, Krag DN, Teates D, et al. Lymphoscintigraphy and sentinel node bipsy accurately stage melanoma in patients presenting after wide local excision. Ann Surg Oncol 2003;10:416-425.
35. Tanis PJ, Boom RP, Koops HS, et al. Frozen section investigation of the sentinel node in malignant melanoma and breast cancer. Ann Surg Oncol 2002;8:222-226.
36. Greeger AJ, Shiver SA, Shen P, et al. Intraoperative evaluation of sentinel lymph nodes for metastatic melanoma by imprint cytology. Cancer 2002;94:3016-3022.
37. Gietema HA, Vuylesteke RJ, de Jonge IA, et al. Sentinel node investigation in melanoma: detailed analysis of the yield from step sectioning and immunohistochemistry. J Clin Pathol 2004;57:618-620.
38. Torrenga H, Rahusen FD, Meijer S, et al. Sentinel node investigation in breast cancer: detailed analysis of the yield from step sectioning and immunohistochemistry. J Clin Pathol 2001;54:550-552.
39. Abrahamsen HN, Hamilton-Dutoit SJ, Larsen J, et al. Sentinel lymph nodes in malignant melanoma: extended histopathologic evaluation improves diagnostic precision. Cancer 2004;100:1683-1691.
40. Ross GL, Shoaib T, Scott J, et al. The impact of immunohistochemistry on sentinel node biopsy for primary cutaneous malignant melanoma. Br J Plast Surg 2003;56:153-155.
41. Cochran AJ, Wen DR, Morton DL. Occult tumor cells in the lymph nodes of patients with pathological stage I malignant melanoma. An immunohistological study. Am J Surg Pathol 1988;12:612-618.
42. Robers A, Cochran AJ. Pathologic analysis of sentinel lymph ndoes in melanoma patients: current and future trends. J Surg Oncol 2004;85:152-161.
43. Reintgen D, Pendas S, Jakub J, et al. National trials involving lymphatic mapping for melanoma: the multicenter selective lymphadenectomy trial, the sunbelt melanoma trial, and the Florida melanoma trial. Sem Oncol 2004;31:363-373.
44. Caprio MG, Carbone G, Bracigliano A, et al. Sentinel lymph node detection by Lymphoscintigraphy in malignant melanoma. Tumori 2002;88:543-545.
45. Maffioli L, Sturm E, Roselli M, et al. State of the art sentinel node biopsy in Oncology. Tumori 2000;86:263-272.
46. Bartolomei M, Testori A, Chinol M, et al. Sentinel node localization in cutaneous melanoma: lymphoscintigraphy with colloids and antibody fragments versus blue dye mapping. Eur J Nucl Med 1998;25:1489-1494.
47. Balch CM. The role of elective lymph node dissection in melanoma: rationale, results, and controversies. J Clin Oncol 1988;6:163-172.
48. Medalie NS, Ackerman AB. Sentinel lymph node biopsy has no benefit for patients with primary cutaneous melanoma metastatic to a lymph node: An assertion based on comprehensive, critical analysis: Part I. Am J Dermatopathol 2003;25:399-417.
49. Medalie NS, Ackerman AB. Sentinel lymph node biopsy has no benefit for patients with primary cutaneous melanoma metastatic to a lymph node: an assertion based on comprehensive, critical analysis: Part II. Am J Dermatopathol 2003;25:473-484.
50. Eedy DJ. Introducing controversies in dermatology: sentinel lymph node biopsy for cutaneous melanoma—a useful technique or a waste of time? Br J Dermatol 2004;151:267-268.
51. Agnese DM, Abdessalam SF, Burak WE, et al. Cost-effectiveness of sentinel lymph node biopsy in thin melanomas. Surgery 2003;134:542-547.
52. Ang KK, Gera FB, Byers RM, et al. Radiotherapy for melanoma. In: Cutaneous Melanoma, Balch CM, Houghton AN, Sober AJ, Soong S, eds. St. Louis, Mo: Quality Medical Publishing; 1998:389–404.
53. Argawala SS, Neuberg D, Park Y, et al. Mature results of a phase III randomized trial of bacillus calmetteguerin (BCG) versus observation and BCG versus dacarbazine bersus BCG in the adjuvant therapy of American joint committee on cancer State I-III melanoma (E1673). Cancer 2004;100:692-698.
54. Groenewegen G, Bloem A, De Gast GC. Phase I/II study of sequential chemoimmunotherapy (SCIT) for metastatic melanoma: outpatient treatment with dacarbazine, granulocyte-macrophage colony-stimulating factor, low-dose interleukin-2, and interferon-alpha. Cancer Immunol Immunother 2002;51:630-636.
55. Kirkwood JM, Strawderman MH, Ernstoff MS, et al. Interferon alfa-2b adjuvant therapy of high-risk resected cutaneous melanoma: the Eastern Cooperative Oncology Group Trial EST 1684. J Clin Oncol 1996;14:7-17.
56. Moschos SJ, Kirkwood JM, Konstantinopolis PA. Present status and future prospects for adjuvant therapy of melanoma: time to build upon the foundation of high-dose interferon alfa-2b. J Clin Oncol 2004;22:11-14.
57. Lotze MT, Dalla RM, Kirkwood JM, et al. Cutaneous Melanoma. In: Cancer: Principles and Practice of Oncology, Devita VT, Hellma S, Rosenberg SA, eds. Philadelphia, Pa: lippincott Williams & Wilkins; 2001:2021–2056.
- Arrange a biopsy of any pigmented lesion that changes significantly on serial examinations.
- Full-thickness excisional biopsy is preferred; for large lesions, incisional or punch biopsy at the deepest point of the tumor may be an option.
- For thin lesions, a surgical margin encompassing 1 cm normal skin is recommended.
- Specimens submitted in formalin for permanent sections are preferred to frozen sections.
A 51-year-old man of northern European descent who works outdoors for the city asks you to look at a “mole” on his face. The lesion does not have the classic appearance of a melanoma that you have seen before, and it is still fairly small. Should you advise a wait-and-see approach or perform a biopsy?
Opt for early detection
Given the patient’s likely genetic predisposition to skin cancer and his regular, lengthy exposure to sunlight (see Risk factors), you would be wise to follow your cutaneous examination with a biopsy.
The ABCDs of visual assessment. The classic clinical presentation of melanoma is well known. The most publicized means for identifying potentially atypical pigmented skin lesions is the “ABCD” mnemonic (asymmetry, border irregularity, color variegation, and lesion diameter >6 mm) (FIGURES 1 AND 2).7,8 The ABCDs are primarily an educational tool for patients. This mnemonic was expanded to include E, representing evolution of a pigmented lesion.9 Any pigmented lesion observed to change significantly on serial examinations warrants biopsy to exclude melanoma.
Caveat: not all melanomas are pigmented. Amelanotic melanomas are a diagnostic challenge and may be lethal if left unattended.
Routine screening. Large-scale skin cancer screening has been performed and found to be a statistically ineffective means of detection. Moreover, the US Preventive Services Task Force found insufficient evidence to recommend for or against routine counseling by primary care physicians to prevent skin cancer.10
A large-scale educational and screening campaign was performed in Italy from 1991 to 1996. During this period, 90,000 educational leaflets were distributed to a target population of approximately 243,000. A total of 2050 individuals requested a skin examination, resulting in detection of 13 melanomas.11 However, 92.3% of the melanomas were thin (<1.52 mm deep). Despite the lack of statistical significance for such screenings, many organizations do perform them and find melanomas, which can be life saving for those few individuals.
Anatomic areas to focus on. While melanoma can affect any anatomic region, it is especially common on sun-exposed areas, including the head, neck, and upper extremities. Acral lentiginous melanoma is found on palmar, plantar, and subungual regions. Include the scalp, ocular mucosa, and oral cavity in your examination.
Four primary groups have been traditionally proposed based on a combination of clinical and pathologic features: superficial spreading melanoma, nodular melanoma, lentigo maligna melanoma and acral lentiginous melanoma. Furthermore, additional histopathologic variants including desmoplastic, neurotropic, amelanotic, signet-ring cell, small cell and balloon cell melanoma have been described.
FIGURE 1
Melanoma in situ
Classic presentations of melanoma in situ on the left cheek. Sun-exposed areas are most often affected.
FIGURE 2
Melanoma in situ
Classic presentations of melanoma in situ on the tip of the nose. Sun-exposed areas are most often affected.
Which biopsy technique to choose?
A properly performed biopsy is mandatory to accurately diagnose and microstage the tumor. No other test reliably surpasses routine histologic examination.
When possible, arrange for a full-thickness excisional biopsy with a narrow (2-mm) rim of normal skin, especially for large lesions in which sampling error may be a factor.
Tissue samples are submitted for histologic examination in formalin for permanent sections. Frozen sections are not recommended for the initial diagnosis of melanoma due to artifactual changes from the freezing process.
When lesions are too large for primary excision, or if an optimal cosmetic result is important to the patient, an incisional or punch biopsy may be taken from the area believed to be the deepest portion of the tumor.
For the largest lesions, multiple punch or incisional biopsies may help to reduce the risk of sampling error. Diagnostic and management problems arise when the initial biopsy does not sample the complete skin thickness or when large lesions are not sampled adequately.
Classification of melanoma
The traditional melanoma classification scheme includes several subtypes (see Detailed melanoma classifications). Though these terms have limited clinical utility, we include them for the sake of completeness and because the terminology may arise in consultation with colleagues.
Most important for the prognosis is a determination of the tumor’s depth of invasiveness.
In situ or invasive?
Melanoma in situ lesions are confined to the epidermis and may extend along hair appendages. It often occurs on sun-exposed areas (FIGURES 1 AND 2). Histologically, melanoma in situ is an asymmetric and poorly circumscribed proliferation of melanocytes usually larger than 6 mm in diameter (FIGURE 3).
Melanocytes form irregular nests that are not equidistant and have areas of confluence (FIGURE 3). Single melanocytes predominate over nests in some areas and may entirely replace the basal layer.
Additional histologic features include single melanocytes above the dermal-epidermal junction (Pagetoid spread) and uneven distribution of pigment. In many cases the dermis has inflammatory infiltrates, melanophages, and evidence of solar-damage. Particularly in anatomical areas rich in hair follicles, the neoplastic cells may spread into the epithelium of the hair follicles without extending to the dermis.
Melanoma in situ may be quite large in diameter (horizontal growth phase) without becoming invasive; however, always be concerned about invasion.
Invasive melanoma shares the same histologic features but invades the dermis or subcutaneous fat (vertical growth phase). Aside from the conventional criteria used for the histologic diagnosis of melanoma, acral melanomas may show an increased number of dendritic melanocytes loaded with melanin (FIGURE 4). Desmoplastic melanoma is most commonly found on the head and neck; however, it varies in clinical presentation (FIGURE 5). It is often associated with other types of melanoma, is common in older persons, and has a slight male predilection.
FIGURE 3
Melanocytes
Melanoma in situ stained with routine hematoxylin/eosin on permanent sections. Note confluent nesting of atypical melanocytes at the dermal-epidermal junction (arrow). There are several foci of Pagetoid spread as melanocytes are seen migrating upward toward the surface.
FIGURE 4
Acral melanoma
Acral melanoma lesion on the hand.
FIGURE 5
Dermoplastic melanoma
Desmoplastic melanoma lesion, commonly found on the head and neck.
Microstaging: The key to good management
The categories “superficial spreading” and “nodular” are based on the seminal work of Wallace Clark, who described putative growth phases of cutaneous melanoma.12 Clark hypothesized that melanoma initially grows horizontally and only later begins an invasive vertical growth phase.
The horizontal growth phase is common in sun-exposed sites and often occurs over a long period of time. The vertical growth phase is a much more aggressive growth pattern that, if left unchecked, can be lethal. This is often seen in nodular melanoma (FIGURE 6).
Measurement of vertical growth (“microstaging”) is the most important prognostic indicator for localized cutaneous melanoma.13
Clark described 5 levels (“Clarks’ levels,” I–V) of invasion (FIGURE 7).
Independently of Clark, Breslow described tumor thickness as an important prognostic factor.14,15 Breslow thickness is measured from the granular layer of the epidermis to the deepest area of invasion (FIGURE 7). Most reports indicate that, overall, Breslow tumor thickness more closely correlates with clinical outcome.16
Special circumstances that affect microstaging. Although Clark and Breslow measurements are both conceptually simple, a number of factors, including hair follicle involvement and ulceration, must be considered when measuring melanoma depth. It is often useful to have a Breslow thickness and a Clark’s level for primary cutaneous melanomas (both methods are used for staging thin primary lesions).
The location of the primary lesion affects interpretation of measurement results. For example, a Breslow thickness of 0.5 mm confers a different meaning on the eyelid (very thin skin, Clark’s level proportionately deeper than tumor thickness might indicate) than the back (thick skin, proportionately more superficial Clark’s level than tumor thickness would indicate).
Measurement of vertical involvement is used to stage the tumor with the TNM classification. This was recently updated as outlined by Balch et al13 in 2001 (TABLE 1).
FIGURE 6
Nodular melanoma
Nodular melanoma often exhibits aggressive vertical growth.
FIGURE 7
Classifying melanoma: Both Clark’s level and Breslow measurement are often used for staging
Clark’s levels are derived from level of tumor invasion compared with layers of the skin. Tumors are divided into 5 levels. Level I: Tumor cells confined to the epidermis (in situ). Level II: Tumor invades the papillary dermis, past basement membrane. level III: Tumor fills papillary dermis, extends to the between the papillary and reticular dermis. Level IV: Tumor invades reticular dermis. Level V: Tumor invasion of subcutaneous tissue. Breslow’s thickness is a measurement of lesion depth in millimeters. Tumors are classified into 4 categories based on the depth vertically from the top of the granular layer (or base of superficial ulceration) to the deepest point of tumor involvement.
TABLE 1
Using the TNM staging system to determine prognosis for melanoma
| T CLASSIFICATION | BRESLOW THICKNESS (MM) | ULCERATION | |||||
| T1 | ≤1.0 | a: no ulceration and Clark’s level II/III | |||||
| b: ulceration or Clark’s level IV/V | |||||||
| T2 | 1.01–2.0 | a: no ulceration | |||||
| b: with ulceration | |||||||
| T3 | 2.01–4.0 | a: no ulceration | |||||
| b: with ulceration | |||||||
| T4 | >4.0 | a: no ulceration | |||||
| b: with ulceration | |||||||
| N CLASSIFICATION | METAST ATIC NODES | NODAL METASTATIC MASS | |||||
| N1 | 1 node | a: micrometastasis* | |||||
| b: macrometastasis† | |||||||
| N2 | 2–3 nodes | a: micrometastasis* | |||||
| b: macrometastasis† | |||||||
| N3 | ≥4 metastatic nodes, or matted nodes, or in transit metastases/satellites with metastatic node(s) | ||||||
| M CLASSIFICATION | METASTASES (SITE) | SERUM LDH‡ | |||||
| M1a | Distal skin, subcutaneous/nodal | Normal | |||||
| M1b | Lung | Normal | |||||
| M1c | All other visceral | Normal | |||||
| Any visceral | Elevated | ||||||
| *Micrometastases diagnosed after sentinel or elective lymphadenectomy. | |||||||
| ‡Macrometastases defined as clinically detectable nodal metastases confirmed by therapeutic lymphadenectomy or when nodal metastasis exhibits gross extracapsular extension. | |||||||
| ‡LDH, lactate dehydrogenase. | |||||||
| Once the TNM classification has been determined, the combined findings, as shown below, can help you determine a patient’s relative prognosis. | |||||||
| Clinical Staging | Pathologic Staging | 5-year survival (%) | |||||
| 0 | Tis | N0 | M0 | Tis | N0 | M0 | 96–100 |
| IA | T1a | N0 | M0 | T1a | N0 | M0 | 95 |
| IB | T1b | N0 | M0 | T1b | N0 | M0 | 90 |
| T2a | N0 | M0 | T2a | N0 | M0 | ||
| IIA | T2b | N0 | M0 | T2b | N0 | M0 | 78 |
| T3a | N0 | M0 | T3a | N0 | M0 | ||
| IIB | T3b | N0 | M0 | T3b | N0 | M0 | 65 |
| T4a | N0 | M0 | T4a | N0 | M0 | ||
| IIC | T4b | N0 | M0 | T4b | N0 | M0 | 45 |
| III | Any T | Any N | M0 | ||||
| IIIA | T1-4a | N1a | M0 | 66 | |||
| T1-4a | N2a | M0 | |||||
| IIIB | T1-4b | N1a | M0 | 52 | |||
| T1-4b | N2a | M0 | |||||
| T1-4a | N1b | M0 | |||||
| T1-4a | N2b | M0 | |||||
| T1-4a | N2c | M0 | |||||
| T1-4b | N2c | M0 | |||||
| IIIC | T1-4b | N1b | M0 | 26 | |||
| T1-4b | N2b | M0 | |||||
| Any T | N3 | M0 | |||||
| IV | Any T | Any N | Any M | Any T | Any N | Any M | 7.5–11 |
Preferred management and contingencies
Primary treatment for cutaneous melanoma is wide local excision of the primary site.
How wide should excision margins be? The appropriate margin of normal skin (measured from the biopsy scar or lateral border of residual melanoma) varies with Breslow tumor thickness.17 With thin and intermediate thickness, a surgical margin encompassing 1 cm of normal skin is the consensus.17 For thicker lesions, many authorities recommend a 2-cm margin. A 1-cm margin may be inadequate due to the risk of local recurrence; however, whether a 2 cm or 3 cm margin is optimal remains unclear.18,19TABLE 2 reviews treatment guidelines for surgical excision of primary cutaneous melanoma.20-24
Biopsied tissue submitted as permanent sections. The planned primary excision site should be oriented and submitted to pathology in formalin for permanent section examination. Frozen sections are generally not recommended; when the pathologist assesses surgical margin status, scattered melanocytes in adjacent sun-damaged skin may lead to uncertainty. Moreover, artifacts from the freezing process make interpretation difficult.
2 qualifiers for the above advice: immunostains have increased the utility of frozen sections, and frozen sections were not used in the clinical trials from which current treatment options were derived. These considerations apply particularly to the use of frozen section analysis in Mohs micrographic surgery (see below).
The wide local excision specimen can be examined by multiple surgical pathology orientation methods. In many cases, if the primary lesion was completely excised by the initial biopsy, the pathologist will examine the area of the biopsy scar for residual melanoma and select portions of the lateral margins for examination. Alternatively, the entire lesion, all of the margins, or even the entire specimen may be submitted for examination depending on the clinical circumstances and concerns of the pathologist and surgeon, such as incomplete removal at the time of initial biopsy or close deep or lateral margins. Communication between surgeon and pathologist must be clear and unambiguous.
Examining multiple sections from the tissue block and adding immunohistochemical stains greatly increase sensitivity for metastatic melanoma.37-40 Cochran et al41 originally demonstrated the importance of immunohistochemistry in the pathology examination of lymph nodes. From 2227 lymph nodes removed from 100 patients, they found that 16 additional lymph nodes in 14 patients contained metastatic melanoma when examined with S-100 immunohistostains. Using additional antibodies more recently (see below), these authors reported that up to 12% of metastatic melanoma deposits can be missed by experienced pathologists without the aid of immunohistochemistry.42
Though no antibody is both highly sensitive and specific for malignant melanoma (versus normal melanocytes), the antibodies most commonly used in immunohistochemistry include S-100 (a neuroectodermal tissue maker expressed in nerves, melanocytes, histiocytes and dendritic cells in lymph nodes), HMB 45 (recognizes an oligosaccharide side chain present in immature melanosomes), Melan-A (recognizes the MART-1 protein), and tyrosinase (recognizing the enzyme tyrosinase required for melanin synthesis). S-100, although very sensitive, is not a melanocyte-specific antibody. The remaining antibodies, though melanocyte specific, are non-reactive in 5% to 15% of cutaneous malignant melanoma.42
Using polymerase chain reaction (PCR) and reverse transcriptase polymerase chain reaction (RTPCR) for MRNA for melanocyte-associated proteins further increases sensitivity, detecting positive nodal cells when routine hematoxylin/eosin and immunohistochemical methods do not. The clinical utility of molecular methods for diagnosis and patient management has not been established; these techniques are the subject of ongoing clinical trials.43
In retrospect, it is clear that the standard techniques used to examine lymph nodes taken from regional lymph node dissections underestimate the presence of micrometastatic disease. one could argue, in fact, that the sole advantage of lymphatic mapping and sentinel lymph node biopsy has been to allow the pathologist to perform a focused, extensive examination on 1-3 lymph nodes – an examination that would be impractical (and prohibitively expensive) on a standard regional lymph node dissection specimen. Interestingly, the idea that additional sections from lymph nodes will increase the detection rate of metastatic tumor is not new and was well-known to the surgeons and pathologists involved in the pioneering work on sentinel lymph node biopsy.41
Mohs micrographic surgery increasingly used for melanoma.25-31 This procedure may be performed with frozen or permanent sections, using concomitant immunohistochemical staining with either method of embedding. This has been especially useful in cosmetically sensitive areas such as the face, ear, nose, genitalia, and extremities.30 Mohs micrographic surgery with permanent sections also makes possible the most definitive surgical margin analysis.
TABLE 2
Recommended incision margins
| BRESLOW THICKNESS | EXCISION MARGINS (CM) |
|---|---|
| In situ | 0.5 |
| <1 mm | 1 |
| 1–4 mm | 1–2 |
| >4 mm | 2–3 |
Sentinel lymph node biopsy
Lymphatic mapping and sentinel lymph node biopsy have significantly changed the initial approach to the patient with melanoma and have reinvigorated debate over the importance and management of regional lymph nodes in cutaneous malignant melanoma. The anatomic basis of, and techniques for, lymphatic mapping and sentinel lymph node biopsy are well-described elsewhere and are not reviewed here.32
Risk factors for melanoma include a personal or family history of melanoma and the presence of multiple nevi. Nevi are considered risk factors if an individual has many or if the nevi are unusual in appearance or size. Other risk factors include fair complexion, excessive sun exposure, history of severe sunburns, use of tanning booths, immunosuppression and occupational exposure to certain chemicals.1
Ultraviolet light exposure remains the most well-described risk factor for the development of cutaneous melanoma; however, the pathogenesis remains largely unknown.3,4 This is especially true in patients with increased ultraviolet sensitivity secondary to fair skin type and a tendency to burn. The use of sunscreen is recommended for prevention of all types of skin cancer; however, its use may promote increased ultraviolet exposure from a false sense of protection.5,6 Additionally, proper application (i.e. frequent reapplication) is seldom performed.
Histolopathologic data from regional lymph nodes is the most important prognostic factor for cutaneous melanoma,13 and sentinel lymph node biopsy is proven as a staging procedure—as reflected in the revised AJCC TNM Staging System published in 2001 (TABLES 1 AND 2).13 This staging system differs from the previous one in several ways:
- Thickness and ulceration are the primary predictors of survival with localized melanoma (stages I and II)
- Number of metastatic lymph nodes involved and tumor burden are most important predictors of survival in stage III melanoma
- Anatomic site of metastasis (distant) and presence/absence of elevated lactate dehydrogenase (LDH) are primary predictors of survival with stage IV melanoma
- Ulceration should prompt an overall upstaging for melanoma stages I–III
- Satellite metastases around a primary melanoma and in-transit metastases together indicate a stage III melanoma
- Staging decisions are based on sentinel node biopsy/lymphatic mapping.13
Multiple studies have reviewed the changes between the new and old TNM staging systems for melanoma.13
When to biopsy. Clinical experience supports reserving lymphatic mapping and sentinel lymph node mapping for patients with primary lesions 1 mm or thicker. Some authorities have recommended sentinel lymph node biopsy for lesions <1 mm thick if they are ulcerated or if a discrepancy exists between the Breslow tumor thickness and Clark’s level. For such lesions, biopsy has been recommended for Clark’s level >III.33
Though sentinel lymph node biopsy can be performed successfully after wide local excision, doing it before excision will prevent disruption of lymphatics for node mapping.34 The sentinel lymph node should be submitted to pathology for permanent section analysis. Frozen section analysis is not recommended for melanoma due to its lower sensitivity.35
Though not widely adopted, some surgeons use intraoperative touch prep cytology as part of an initial intraoperative evaluation.36 If the surgeon is prepared to proceed with regional node dissection and a “black” grossly involved node is encountered, intraoperative frozen section may be used to confirm metastastic melanoma. Neither touch preps nor frozen sections are likely to demonstrate the small, isolated metastatic tumor cells commonly identified in small, grossly normal lymph nodes.
What to expect from the pathologist. If blue dye is used for localization, the pathologist should document the presence of that color in the lymph nodes submitted. Outside of a clinical trial, fresh lymph node tissue is not usually preserved for polymerase chain reaction (PCR) or other molecular methods for detecting tumor cells.
Although examination techniques vary in some details among institutions, general principles are well accepted and include submission of the entire lymph node, step or serial sections, and, when initial sections do not reveal metastatic tumor, use of immunohistochemistry for melanocyte-associated antigens (see Immunohistochemical techniques and antibody testing).
Fine points regarding interpretation of sentinel lymph nodes. First, the rationale behind biopsy of sentinel lymph nodes is that the lymphatic system is a potential means of metastasis. However, it is not the only means of spread. Hematogenous and tissue spread are potential mechanisms as well.
Second, the lymphatic system acts as a drain but not a dam for lymphatic flow. Thus a negative lymph node biopsy does not guarantee that a metastasis has not already occurred.
Third, the increased sensitivity of identification of positive sentinel lymph nodes with more specific tests (ie, immunohistochemistry, PCR, rtPCR) calls a negative result into question. A sentinel lymph node that is “negative” with immunohistochemistry may in fact be positive with gene amplification techniques (PCR, rtPCR).
Fourth, surgeons performing sentinel node biopsies vary in thoroughness when identifying which node or nodes contain the dye. Lymphoscintigraphy is more accurate than using dyes; however, many surgeons use both.44 Thus, while sentinel node biopsy has demonstrated a role in staging, its use and the interpretation of results must be performed with these variables in mind.
Regional lymph node dissection: Does it benefit patients?
Patients found to have metastatic melanoma in a sentinel lymph node are advised to undergo regional lymph node dissection. Unfortunately, few data address survival with this therapy. The role of sentinel lymph node biopsy and elective lymph node dissection in the management of cutaneous malignant melanoma generates debate, much of which focuses on alternate interpretations of the data from the era of elective lymph node dissection for intermediate-thickness melanoma.
The debate over elective lymph node dissection has been summarized by others in detail.47
Proponents of an aggressive strategy correctly point out that data from trials are simply not comparable to what is seen in the current era of sentinel lymph node biopsy.
Opponents of an aggressive strategy, who are numerous and vocal,48-50 correctly observe that no survival benefit has been demonstrated for any treatment strategy based on regional lymph node dissection. However, to be balanced, such long-term outcome data are simply not yet available. Certainly questions will continue to arise regarding the theoretical validity and cost-effectiveness of sentinel lymph node biopsy.48,49,51
How good is adjuvant therapy?
Adjuvant therapy for cutaneous melanoma can include regional external beam radiation, systemic cytotoxic chemotherapy, or immunotherapy. Radiation has a limited role, being used postoperatively to treat regional lymph node dissection beds at high risk of recurrence and to treat locally recurrent and in-transit disease.52
Systemic cytotoxin (often dacarbazine) has not been effective as adjuvant therapy.53 When combined chemo- and immunotherapy is used for metastatic disease, it is with the hope of discovering an effective combination that might also be used in the adjuvant setting.54 However, it has been the initial success with immunotherapy that frames the debate regarding adjuvant systemic therapy for cutaneous malignant melanoma.
High-dose interferon alpha 2b. For thick or node-positive cutaneous malignant melanoma, a statistically significant increase in overall survival with high-dose interferon alpha 2b was demonstrated in a landmark Eastern Cooperative Oncology Group trial.55 Though the results have been confirmed in other trials, the clinical benefit is still debated. The expense and toxicity of the trial, as well as the absence of benefit in a second ECOG trial of high-dose systemic therapy, have contributed to the uncertainty.56
In an effort to reduce toxicity, low-dose systemic interferon alpha 2b has been tested in numerous trials and found to be of no benefit.56 High-dose alpha 2b interferon therapy continues to be a focus of active clinical investigation by national and international cooperative groups. In addition to high-dose systemic interferon, a large number of immunotherapeutic approaches for the systemic treatment of melanoma have been devised and are under active investigation, including non-specific immune adjuvants such as Bacile Calmette-Guerin, levaminsole, vaccines prepared from autologous melanoma cells and vaccines designed against chemically defined antigens (gangliocides).57 Because of the controversies surrounding adjuvant systemic therapy, patients are best served by participating in an ongoing clinical trial if the expense and toxicity of high dose systemic interferon alpha 2b are deemed to be unacceptable.
Acknowledgments
We thank Brian C. Brockway, M.S. (Department of Medical Media, Veterans affairs Medical Center, Augusta, Georgia) for illustrations.
CORRESPONDENCE
Joshua E. Lane, MD, 308 Hospital Drive, Suite 200, Macon, GA 31217. E-mail: [email protected]
1. American Cancer Society Cancer Facts and Figures 2006. Atlanta: american Cancer Society; 2006.
2. Anonymous. Melanoma: Clinical Practice Guidelines in Oncology. JNCCN 2004;2:46-60.
3. Elwood JM. Melanoma and sun exposure. Semin Oncol 1996;23:650-666.
4. Elwood JM, Jopson J. Melanoma and sun exposure: an overview of published studies. Int J Cancer 1997;73:198-203.
5. Whiteman DC, Green AC. Melanoma and sun exposure: where are we now? Int J Dermatol 1999;38:481-489.
6. Katsambas A, Nicolaidou E. Cutaneous malignant melanoma and sun exposure. Recent developments in epidemiology. Arch Dermatol 1996;132:444-450.
7. Polk HC. Surgical progress and understanding in the treatment of the melanoma epidemic. Am J Surg 1999;178:443-448.
8. Baade PD, Balanda KP, Stanton WR, et al. Community perceptions about the important signs of early melanoma. J Am Acad Dermatol 1997;36:199-202.
9. Abbasi NR, Shaw, Rigel DS, et al. Early diagnosis of cutaneous melanoma: revisiting the ABCD criteria. JAMA 2004;292:2771-2776.
10. Counseling to prevent skin cancer: recommendations and rationale of the U.S. Preventive Services Task Force. MMWR Recomm Rep 2003;52:13-17.
11. Rossi CR, Vecchiato A, Bezze G, et al. Early detection of melanoma: an educational campaign in Padova, Italy. Melanoma Res 2000;10:181-187.
12. Clark WH, From L, Bernardino EA, et al. Histogenesis and biologic behavior of primary human malignant melanomas of the skin. Cancer Res 1969;29:705-726.
13. Balch CM, Buzaid AC, Soong SJ, et al. Final version of the American Joint Committee on Cancer staging system for cutaneous melanoma. J Clin Oncol 2001;19:3635-3648.
14. Breslow A. Tumor thickness, level of invasion and node dissection in Stage 1 cutaneous melanoma. Ann Surg 1976;182:572-575.
15. Breslow A. Thickness, cross sectional areas and depth of invasion in the prognosis of cutaneous melanoma. Ann Surg 1970;172:902-908.
16. Barnhill RL, Fine JA, Roush GC, et al. Predicting five-year outcome for patients with cutaneous melanoma in a population-based study. Cancer 1996;78:427-432.
17. Lens MD, Dawes M, Goodacre T, et al. Excision margins in the treatment of primary cutaneous melanoma: a systematic review of randomized controlled trials comparing marrow vs wide excision. Arch Surg 2002;137:1101-1105.
18. Brown SE, Chapman PB. Defining adequate surgery for primary melanoma. N Engl J Med 2004;350:823-825.
19. Thomas JM, Newton-Bishop J, A’Hern R, et al. Excision margins in high-risk melanoma. N Engl J Med 2004;350:757-766.
20. Veronesi U, Cascinelli N. Narrow excision (1-cm margin). A safe procedure for thin cutaneous melanoma. Arch Surg 1991;126:438-441.
21. Bono A, Bartoli C, Clemente C, et al. Ambulatory narrow excision for thin melanoma (< or=2 mm): results of a prospective study. Eur J Cancer 1997;33:1330-1332.
22. Cascinelli N. Margin of resection in the management of primary melanoma. Semin Surg Oncol 1998;14:272-275.
23. Balch CM, Soong SJ, Smith T, et al. Long-term results of a prospective surgical trial comparing 2 cm vs. 4 cm excision margins for 740 patients with 1-4 mm melanomas. Ann Surg Oncol 2001;8:101-108.
24. Johnson TM, Sondak VK. A centimeter here, a centimeter there: does it matter? J Am Acad Dermatol 1995;33:532-534.
25. Zitelli JA, Brown C, Hanusa BH. Mohs micrographic surgery for the treatment of primary cutaneous melanoma. J Am Acad Dermatol 1997;37:236-245.
26. Zalla MJ, Lim KK, Dicaudo DJ, et al. Mohs micrographic excision of melanoma using immunostains. Dermatol Surg 2000;26:771-884.
27. Kelley LC, Starkus L. Immunohistochemical staining of lentigo maligna during Mohs micrographic surgery using MART-1. J Am Acad Dermatol 2002;46:78-84.
28. Nagi C, O’Grady TC, Izadpanah A. Mohs micrographically controlled surgery and the treatment of malignant melanoma. Semin Oncol 2002;29:336-340.
29. Carucci JA. Mohs’ micrographic surgery for the treatment of melanoma. Dermatol Clin 2002;20:701-708.
30. Bienert TN, Trotter MJ, Arlette JP. Treatment of cutaneous melanoma of the face by Mohs micrographic surgery. J Cutan Med Surg 2003;7:25-30.
31. Cook J. Surgical margins for resection of primary cutaneous melanoma. Clin Dermatol 2004;22:228-233.
32. Jakub JW, Pendas S, Reintgen DS. Current status of sentinel lymph node mapping and biopsy: facts and controversies. Oncologist 2003;8:59-68.
33. Jacobs IA, Chang CK, DasGupta TK, et al. Role of sentinel lymph node biopsy in patients with thin (<1mm) primary cutaneous melanoma. Ann Surg Oncol 2003;10:558-561.
34. Evans HL, Krag DN, Teates D, et al. Lymphoscintigraphy and sentinel node bipsy accurately stage melanoma in patients presenting after wide local excision. Ann Surg Oncol 2003;10:416-425.
35. Tanis PJ, Boom RP, Koops HS, et al. Frozen section investigation of the sentinel node in malignant melanoma and breast cancer. Ann Surg Oncol 2002;8:222-226.
36. Greeger AJ, Shiver SA, Shen P, et al. Intraoperative evaluation of sentinel lymph nodes for metastatic melanoma by imprint cytology. Cancer 2002;94:3016-3022.
37. Gietema HA, Vuylesteke RJ, de Jonge IA, et al. Sentinel node investigation in melanoma: detailed analysis of the yield from step sectioning and immunohistochemistry. J Clin Pathol 2004;57:618-620.
38. Torrenga H, Rahusen FD, Meijer S, et al. Sentinel node investigation in breast cancer: detailed analysis of the yield from step sectioning and immunohistochemistry. J Clin Pathol 2001;54:550-552.
39. Abrahamsen HN, Hamilton-Dutoit SJ, Larsen J, et al. Sentinel lymph nodes in malignant melanoma: extended histopathologic evaluation improves diagnostic precision. Cancer 2004;100:1683-1691.
40. Ross GL, Shoaib T, Scott J, et al. The impact of immunohistochemistry on sentinel node biopsy for primary cutaneous malignant melanoma. Br J Plast Surg 2003;56:153-155.
41. Cochran AJ, Wen DR, Morton DL. Occult tumor cells in the lymph nodes of patients with pathological stage I malignant melanoma. An immunohistological study. Am J Surg Pathol 1988;12:612-618.
42. Robers A, Cochran AJ. Pathologic analysis of sentinel lymph ndoes in melanoma patients: current and future trends. J Surg Oncol 2004;85:152-161.
43. Reintgen D, Pendas S, Jakub J, et al. National trials involving lymphatic mapping for melanoma: the multicenter selective lymphadenectomy trial, the sunbelt melanoma trial, and the Florida melanoma trial. Sem Oncol 2004;31:363-373.
44. Caprio MG, Carbone G, Bracigliano A, et al. Sentinel lymph node detection by Lymphoscintigraphy in malignant melanoma. Tumori 2002;88:543-545.
45. Maffioli L, Sturm E, Roselli M, et al. State of the art sentinel node biopsy in Oncology. Tumori 2000;86:263-272.
46. Bartolomei M, Testori A, Chinol M, et al. Sentinel node localization in cutaneous melanoma: lymphoscintigraphy with colloids and antibody fragments versus blue dye mapping. Eur J Nucl Med 1998;25:1489-1494.
47. Balch CM. The role of elective lymph node dissection in melanoma: rationale, results, and controversies. J Clin Oncol 1988;6:163-172.
48. Medalie NS, Ackerman AB. Sentinel lymph node biopsy has no benefit for patients with primary cutaneous melanoma metastatic to a lymph node: An assertion based on comprehensive, critical analysis: Part I. Am J Dermatopathol 2003;25:399-417.
49. Medalie NS, Ackerman AB. Sentinel lymph node biopsy has no benefit for patients with primary cutaneous melanoma metastatic to a lymph node: an assertion based on comprehensive, critical analysis: Part II. Am J Dermatopathol 2003;25:473-484.
50. Eedy DJ. Introducing controversies in dermatology: sentinel lymph node biopsy for cutaneous melanoma—a useful technique or a waste of time? Br J Dermatol 2004;151:267-268.
51. Agnese DM, Abdessalam SF, Burak WE, et al. Cost-effectiveness of sentinel lymph node biopsy in thin melanomas. Surgery 2003;134:542-547.
52. Ang KK, Gera FB, Byers RM, et al. Radiotherapy for melanoma. In: Cutaneous Melanoma, Balch CM, Houghton AN, Sober AJ, Soong S, eds. St. Louis, Mo: Quality Medical Publishing; 1998:389–404.
53. Argawala SS, Neuberg D, Park Y, et al. Mature results of a phase III randomized trial of bacillus calmetteguerin (BCG) versus observation and BCG versus dacarbazine bersus BCG in the adjuvant therapy of American joint committee on cancer State I-III melanoma (E1673). Cancer 2004;100:692-698.
54. Groenewegen G, Bloem A, De Gast GC. Phase I/II study of sequential chemoimmunotherapy (SCIT) for metastatic melanoma: outpatient treatment with dacarbazine, granulocyte-macrophage colony-stimulating factor, low-dose interleukin-2, and interferon-alpha. Cancer Immunol Immunother 2002;51:630-636.
55. Kirkwood JM, Strawderman MH, Ernstoff MS, et al. Interferon alfa-2b adjuvant therapy of high-risk resected cutaneous melanoma: the Eastern Cooperative Oncology Group Trial EST 1684. J Clin Oncol 1996;14:7-17.
56. Moschos SJ, Kirkwood JM, Konstantinopolis PA. Present status and future prospects for adjuvant therapy of melanoma: time to build upon the foundation of high-dose interferon alfa-2b. J Clin Oncol 2004;22:11-14.
57. Lotze MT, Dalla RM, Kirkwood JM, et al. Cutaneous Melanoma. In: Cancer: Principles and Practice of Oncology, Devita VT, Hellma S, Rosenberg SA, eds. Philadelphia, Pa: lippincott Williams & Wilkins; 2001:2021–2056.
Is any one analgesic superior for episodic tension-type headache?
- Though all non-narcotic analgesics have equivalent efficacy against tension-type headache, ibuprofen’s generally favorable side-effect profile makes it a reasonable first choice.
Whereas quantitative and qualitative analyses of 41 randomized controlled trials (RCTs) strongly suggests that all types of NSAIDs are more effective than placebo (>50% pain relief) against an acute episode of tension-type headache (TTH), the evidence also shows that no single nonsteroidal anti-inflammatory drug (NSAID) is more effective than another in this setting.
How, then, to choose an NSAID? Many of the 41 articles we reviewed reported on the side effects of NSAIDs. No clear differences were reported in the number of side effects between the NSAIDs and placebo. However, differences were found among the types of NSAIDs. Our results agree with those found by Henry et al,1 who concluded from their meta-analysis that ibuprofen, compared with other NSAIDs, had the lowest relative risk of serious gastrointestinal complications. Given the lack of important differences in efficacy among NSAIDs for relieving an acute episode of TTH, using the most effective dose of a drug that is well tolerated by a patient is a reasonable basis for selection. Ibuprofen, therefore, generally may be advocated.
When acetaminophen is preferred. Our results suggest NSAIDs might be more effective than acetaminophen for TTH. However, because NSAIDs are allergenic for some people, and they must not be used in association with anticoagulants,2 acetaminophen might be an alternative in these situations. When giving acetaminophen, the dose of the medication might be important due to a possible dose-response relationship.
Why this review was needed
Tension-type headache, also known as tension headache or muscle contraction headache, is the most commonly experienced type of headache (see Episodic tension-type headache). Population-based studies suggest prevalence rates of 35% to 40% in adults.3-5
Persons experiencing an acute episode of TTH most often self-treat with mild, non-narcotic analgesics for initial pain relief. Studies have suggested that acetaminophen and NSAIDs like aspirin, ibuprofen, naproxen, and ketoprofen are effective in reducing headache symptoms. But a variety of drugs, dosages, and combinations have been described. No systematic review has, until now, described the efficacy and tolerability of analgesics for the treatment of acute episodes of TTH. Good quality-controlled trials and a systematic review form the basis for evidence-based treatment guidelines, which provide a basis for the individual patient.
Episodic TTH has been defined in the classification of the International Headache Society (IHS) as headache frequency of greater than 10 lifetime episodes, but fewer than 15 episodes per month; an average episode duration of 30 minutes to 7 days; and with at least 2 quality of pain features (ie, mild or moderate pain intensity, bilateral, pressing or tightening [nonpulsating] feeling, and no exacerbation by exercise).7 In addition, the headache does not have the IHS-defining features of migraine (ie, nausea, vomiting, or photophobia and phonophobia). The definition of chronic TTH is identical to those for episodic TTH, except that the episode frequency is 15 or more episodes per month for at least 6 months, and 1 associated symptom of nausea, photophobia, or phonophobia is permitted.
We aimed to describe and assess the data from RCTs concerning the efficacy and tolerability of analgesics for the treatment of acute episodes of TTH in adult patients. Details of our Methods and Results follow.
Methods
Search strategy
Medline and EMBASE were searched from inception to January 2005 using the terms tension-type headache, tension headache, stress headache, or muscle contraction headache together with the search strategy for identifying RCTs described by Robinson and Dickerson.6 The Cochrane Controlled Trials Register was searched using the words tension headache or tension-type headache or muscle contraction headache. Additional strategies for identifying trials included searching the reference lists of review articles and included studies.
Study selection
Only RCTs including analgesic medicine used in the treatment or management of TTH conducted among adult patients (aged 18 years or older), with reasonable criteria designed to distinguish TTH from migraine, were selected for our review. The use of a specific set of diagnostic criteria (eg, IHS 1988 and Ad Hoc 1962)7,8 was not required, but TTH diagnoses had to be based on at least some of the distinctive features of TTH—eg, bilateral in location, no nausea or vomiting, mild or moderate intensity, or no exacerbation by exercise.
Main outcome measures were pain relief or recovery over 2 to 6 hours.
Two authors (LD, AV) independently screened titles and abstracts of identified studies for eligibility. All potentially relevant studies were retrieved as full papers and then again independently reviewed by 2 authors (LD, AV). Disagreements were resolved through consensus where possible, or by arbitration with a third author (MB). Crossover designs often presented data from treatment groups, as if the trial was a parallel group trial. The results from these studies were excluded from data-analysis if no results from both arms were presented or a binary correlation coefficient was available.9
Methodological quality and data extraction
Two authors (LD with MB, BK, or AV) independently rated the methodological quality of the included trials using the Delphi list.10 The Delphi list is a generic criteria list developed by international consensus and consists of the following 9 items: 1) randomization; 2) adequate allocation concealment; 3) groups similar at baseline; 4) specification of eligibility criteria; 5) blinding of outcome assessor; 6) blinding of care provider; 7) blinding of patient; 8) presentation of point estimates and measures of variability; 9) intention-to-treat-analysis. One extra item was added: 10) withdrawal or dropout rate unlikely to cause bias. All selected methodological criteria were scored as yes (=1), no (=0) or don’t know (=0). A quality score of a trial was computed by counting the number of positive scores, with equal weights applied on all items. In case of a disagreement between the 2 authors, consensus was used to resolve disagreement. When consensus could not be reached, a third author made the final decision (MB or AV).
Extraction of data from the original reports was performed by 1 author (LD) and checked by a second (AV). Disagreements were resolved by consensus. Extracted information included (if available) demographic data, detailed description of the intervention and control (ie, dose given, study duration, rescue medication), data on pain relief or recovery, and information on adverse effects measured during a treatment period of 2 to 6 hours. When a trial protocol permitted the use of rescue medication prior to the outcome time (2 to 6 hours), then the latest outcome assessment not confounded by the use of rescue medication was extracted
Data analysis
A quantitative analysis was limited to clinically homogenous studies for which the study populations, interventions and outcomes were considered to be similar. For each study, the number of patients who were recovered (often defined as more than 50% pain relief) was used to calculate relative risk (RR) with 95% confidence interval (CI). RRs and 95% CI were presented using the random effects model. Data are presented as treatment success, indicating that an RR >1 represents a better outcome for the first mentioned medication group.
In parallel studies, when more than 1 comparison from the same study (ie, aspirin 650 mg vs placebo and ibuprofen 400 mg vs placebo) was used for the statistical pooling of NSAIDs vs placebo, the results from the placebo group were evenly spread out over the 2 comparisons and the number of patients in the placebo group was divided by 2 in order to prevent double counting (personal communication RJPM Scholten, Dutch Cochrane Centre).
Because only a subset of available trials provides sufficient data for inclusion in the quantitative analysis, also a qualitative analysis was performed. We summarized findings by strength of evidence, nature of intervention and control treatments. The evidence was judged to be strong when multiple high-quality trials produced generally consistent findings.11 Results were considered consistent if over 75% of the studies reported similar results on the same outcome measure. It was judged to be moderate when multiple low-quality trials or one high-quality and 1 or more low-quality trials produced generally consistent findings. Evidence was considered to be limited when only 1 low-quality RCT existed and conflicting when the findings of existing trials were inconsistent. We arbitrarily regarded trials with methodological quality scores of 6 or more as of high quality.11
Relation between funding source of the RCTs and conclusions
We extracted the sources of funding of the RCTs from the text, statements of sources of support, authors’ affiliations, and acknowledgements. Funding sources were classified as nonprofit organizations, not reported, both nonprofit and for-profit organizations, or for-profit organizations.12 For-profit organizations were defined as companies that might acquire financial gain or loss depending on the outcome of the trial.12 Funding included provision of grants, study material (drug, placebo), or manpower (authorship, statistical analysis, or other assistance).12 We used the effect sizes between medication(s) and placebo to evaluate whether funding source affected outcome.
Results
Search results
A total of 1878 publications were identified by our search strategy. Finally, 41 RCTs met our inclusion criteria and 4 papers concerned double publications (FIGURE 1),13-16 leaving a total of 41 trials which were included in this review. Thirteen of these RCTs used a crossover design.15,7-27
FIGURE 1
How the 41 trials made our cut for the review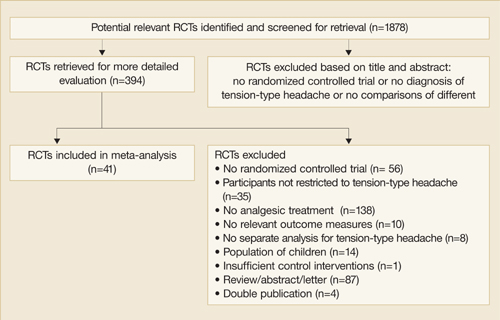
Description of studies
Full details of the included studies are presented in TABLE W1. The number of participants included in each trial ranged from 12 to 900 (mean=252.7 patients), with a total of 10,363 patients included. The mean percentage of participants who dropped out from the trials was 15.2% (range=0%–61.9%). Age of participants (for studies reporting this information) ranged from 18 to 87 years. Overall, the percentage of women was generally higher than men (mean=69.3%; range=36%–97%). Fifteen trials used the criteria of the International Headache Society to classify TTH,14,17,19-21,24,28-36 12 trials used the Ad Hoc Committee’s criteria,13,23,26,37,45 while the remaining studies did not use a formal classification.
Twenty-five studies compared 1 or more types of NSAIDs with placebo,13-17,22-24,26-36,38,41-43,45-47 17 studies compared 1 or more doses of acetaminophen with placebo,17-21,25,30-34,41,44-46,48,49 7 studies compared different types of NSAIDs,15,26,28,29,35-37 9 studies compared 1 or more types of NSAIDs with acetaminophen,17,30-34,41,45,46 and 13 studies compared other analgesics with placebo.15,18,25,27,39,40,44,49,50-53
The quality score (with positive items in parenthesis) is presented in the “Notes” section of TABLE W1. The interobserver reliability of the methodological quality assessment was high (κ=0.85). There was disagreement between the 2 authors in 7.5% of the criteria, but after consensus no disagreement persisted. The median quality score was 5 (range 1–9). Using a cutoff point of 6 out of 10 criteria, 15 studies (36.6%) were considered to be of high quality.15,17,19,21,22,24,25,28-30,32-34,36
Only 1 study reported a concealed randomization method.34 Other methodological flaws, which often scored “negative” or “unclear,” were blinding of the care provider (unclear 88%) and an intention-to-treat analysis (unclear 30% and negative 60%).
Effectiveness of analgesics
TABLE 1 gives the quantitative analysis for high-quality studies, low-quality studies, and for all studies for the different comparisons of NSAIDs, acetaminophen, and placebo.
TABLE 1
Quantitative analysis for the different studies for the comparisons of NSAIDs, acetaminophen and placebo
| HIGH-QUALITY TRIALS | LOW-QUALITY TRIALS | ALL TRIALS | |||||
|---|---|---|---|---|---|---|---|
| N/n | RR (95% CI) | N/n | RR (95% CI) | N/n | RR (95% CI) | ||
| 1. NSAIDs vs placebo | 7/13 | 1.5 (1.3–1.8)* | 8/15 | 2.0 (1.4–2.7)* | 15/28 | 1.6 (1.4–2.0)* | |
| 2. Acetaminophen vs placebo | 5/6 | 1.4 (1.04–1.8)* | 3/3 | 1.6 (0.9–2.7) | 8/9 | 1.4 (1.1–1.8)* | |
| 500 mg vs placebo | 1/1 | 1.1 (0.8–1.5) | 1/1 | 1.1 (0.8–1.5) | |||
| 1000 mg vs placebo | 4/5 | 1.4 (0.97–2.0) | 3/3 | 1.6 (0.9–2.7) | 7/8 | 1.5 (1.1–2.0)8 | |
| 4. NSAIDs vs acetaminophen | 5/7 | 1.1 (0.96–1.4) | 2/2 | 2.2 (1.4–3.4)* | 7/9 | 1.3 (1.04–1.5)* | |
| 3. NSAIDs vs NSAIDs | |||||||
| Ibuprofen 400/800 mg vs aspirin 650 mg37 | 1/2 | 1.2 (0.6–2.2) | |||||
| Ketoprofen 12.5/25/50 mg vs ibuprofen 200 mg29,36 | 1/2 | 1.1 (0.8–1.5) | 1/2 | 1.5 (0.8–2.7) | 2/4 | 1.2 (0.9–1.6) | |
| Ketoprofen 12.5/25 mg vs naproxen 275 mg29 | 1/2 | 0.96 (0.7–1.3) | |||||
| Naproxen 275 mg vs ibuprofen 200 mg29 | 1/1 | 0.9 (0.7–1.2) | |||||
| Metamizol 500/1000 mg vs aspirin 1000 mg30 | 1/2 | 1.2 (0.9–1.7) | |||||
| Diclofenac 12.5/25 mg vs ibuprofen 400 mg55 | 1/2 | 1.1 (0.8–1.5) | |||||
| N/n=number of trials/total number of comparisons; RR: relative risk; CI: confidence interval. *P<.05. | |||||||
1. NSAIDs vs placebo
Twenty-five studies compared one or more types of NSAIDs with placebo, of which 10 are of high quality.15,17,22,24,29,30,32-34,36,45
Quantitative analysis. Sufficient data were available in 15 studies,13,14,29-38,41,45,47 of which 6 were of high quality.29,30,32-34,36,45 Because some trials included 3 or more treatment groups, data were available for 28 comparisons. We found a significant effect in favor of NSAIDs compared with placebo on short-term pain relief (see TABLE 1 and FIGURE W1).
Qualitative analysis. The 10 high-quality studies reported 30 comparisons, of which in 26 (86.6%) NSAIDs were significantly more effective compared with placebo for short-term pain relief (strong evidence).
Adverse events. Twenty studies reported during a 2 to 6 hours treatment period data on adverse events. For the NSAID group (n=2061) frequently mentioned side effects were nausea (4.6%), photophobia (3.1%), vomiting (2.7%), phonophobia (1.7%), aching limbs (1.2%), dizziness (1.1%), and drowsiness (1.0%). For the placebo group (n=1323), these were nausea (7.0%), photophobia (4.8%), vomiting (3.9%), phonophobia (3.4%), aching limbs (2.0%), drowsiness (1.7%), and dizziness (1.0%). The pooled RR for the number of patients reporting side effects for 14 studies with sufficient data was 0.96 (95% CI, 0.7–1.3), indicating no significant difference.
2. Acetaminophen vs placebo
Seventeen studies compared 1 or more doses of acetaminophen with placebo; 9 were high-quality studies.17,19,21,25,30-34,45
Quantitative analysis. The pooled analysis of 5 high-quality trials30,32-34,45 and 3 low-quality trials31,41,44 showed that acetaminophen was significantly more effective compared with placebo for patients on short-term pain relief (TABLE 1 and FIGURE W2). This result was due to the studies comparing acetaminophen with placebo. The only high-quality trial34 with acetaminophen 500 mg failed to show a difference in short-term pain relief compared with placebo (TABLE 1).
Qualitative analysis. The 9 high-quality studies reported 16 comparisons, of which 10 (62.5%) mentioned that acetaminophen showed significantly more pain relief than placebo (conflicting evidence). In 2 high-quality studies,17,34 we found no significant differences between acetaminophen 500 mg and placebo (strong evidence), but in the 9 high-quality studies, in 10 out of 14 comparisons (71.4%) acetaminophen 1000 mg showed significantly more pain relief compared with placebo (conflicting evidence).
Adverse events. Twelve studies reported data on adverse events. For the acetaminophen group (n=3715), frequently mentioned side effects were stomach discomfort (3.9%), dizziness (1.6%), nervousness (0.7%), nausea (0.4%), and drowsiness (0.3%). For the placebo group (n=3700), these were stomach discomfort (3.7%), nervousness (0.7%), nausea (0.6%), dizziness (0.5%), and drowsiness (0.3%). The pooled RR for the number of patients reporting side effects was 1.3 (95% CI, 0.9–1.7), indicating no significant difference.
3. NSAIDs vs acetaminophen
Nine studies compared 1 or more types of NSAIDs with acetaminophen, of which 6 are of high-quality.17,30-34,45
Quantitative analysis. The pooled analysis of 5 high-quality studies30-34,45 and 2 low-quality studies31,41 showed a significant difference in short-term pain relief in favor of NSAIDs (TABLE 1).
Qualitative analysis. Six high-quality studies showed that in 9 out of 13 comparisons (69%) NSAIDs were not significantly more effective than acetaminophen for short-term pain relief in patients with acute episodes of TTH (conflicting evidence).
Adverse events. Seven studies reported data on adverse events. The pooled RR for number of patients reporting side effects was 1.3 (95% CI, 0.97–1.6), indicating no significant difference.
4. Comparison between different NSAIDs
Seven studies compared different types of NSAIDs,15,26,28,29,35-37 of which 4 provided data.
Quantitative and qualitative analysis. The analysis the between different types of NSAIDs no differences in short-term pain relief can be found; RR vary between 0.9 and 1.5 (TABLE 1).
Adverse events. The adverse effects were reported involving the central nervous system (ie, dizziness, drowsiness, vertigo), gastrointestinal system (ie, nausea, vomiting, gastrointestinal upset or discomfort), and the body as a whole (ie, light-headed, fatigue, cramps, asthenia, chills).
Naproxen and zomepirac gave more adverse events involving the central nervous system than aspirin, ibuprofen, and ketoprofen. Naproxen and zomepirac were also more often associated with gastrointestinal side effects than ibuprofen and ketoprofen.
Furthermore, aspirin was more associated with gastrointestinal complaints than ibuprofen. Side effects such as fatigue and cramps (body as whole) occurred significantly more often with ketoprofen compared with aspirin and ibuprofen, naproxen compared with ketoprofen, and zomepirac compared with aspirin.
5. Other analgesics vs placebo
Qualitative analysis. There is insufficient evidence to either support or refute the effectiveness of all other analgesics compared with placebo, due to the fact that most analgesics were a unique combination of analgesics with caffeine or peppermint oil. Also, the low methodological quality of nearly all these studies and the low number of studies per comparison made drawing conclusions difficult.
Optalidon and Tonopan were compared with placebo in 3 substudies of 1 high-quality study, and we found significant more pain relief using these analgesics than placebo.15 No adverse events were stated in these studies.
The combination of acetaminophen and caffeine was compared with placebo in 2 studies of high quality25,49 showed that the combination of acetaminophen with caffeine is more effective than placebo (moderate evidence).
The combination of acetaminophen, aspirin, and caffeine was compared with placebo in 4 substudies of the same high-quality study.25 Data from these studies suggest that this combination is significantly more effective than placebo. All groups reported low numbers of side effects as stomach discomfort, nervousness, and dizziness.
Relation between funding source and effect estimates
The pooled effect estimates in placebo-controlled trials stratified by funding are shown in TABLE 2. No major differences in effect sizes were found between the different funding sources.
TABLE 2
Relation between funding source and effect estimate, intervention vs placebo only
| NUMBER OF COMPARISONS (TRIALS) | NUMBER OF COMPARISONS IN HIGH QUALITY STUDIES (TRIALS) | EFFECT ESTIMATE ALLSTUDIES: RR (95% CI) | EFFECT ESTIMATE HIGH QUALITY STUDIES: RR (95% CI) | |
|---|---|---|---|---|
| Non-profit organizations | 0 | 0 | — | — |
| Not reported | 4 (2) | 0 | 1.4 (0.8–2.6) | — |
| Non-profit and for-profit organizations | 26 (11) | 11 (4) | 1.7 (1.4–2.1) | 1.4 (1.1–1.7) |
| For-profit organizations | 14 (7) | 8 (3) | 1.4 (1.2–1.6) | 1.2 (1.06–1.4) |
| All studies | 44 (20) | 19 (7) | 1.5 (1.3–1.8) | 1.4 (1.1–1.7) |
| *P=.006 using χ2 test | ||||
Methodological quality of included studies
This review shows that many RCTs on the efficacy of analgesics in TTH have methodological shortcomings. Using a cut-off point of 6 out of 10 criteria, only 35% of the included studies were found to be of high quality. Most authors failed to explicitly specify the method of treatment allocation and blinding procedure. In many studies authors stated that the trial had a double-blind procedure, however, when the blinding procedure was not explicitly reported (ie, identical looking tablets) we did not score 1 or more blinding items positive. These flaws can be prevented in future trials.
We are unaware of any prior systematic reviews or meta-analyses that have assessed the efficacy and tolerability of analgesics in the treatment of acute episodes of tension-type headache in adults. We conducted the review according to the high Cochrane standard, resulting in a review of high validity. Our review succeeded in identifying a large number of only randomized trials. Also the methodological quality did not explain the possible association between funding and effect estimates.
Although systematic reviews offer the least biased method of summarizing research literature, our review should be considered with the following limitations in mind. First, we decided not to contact the authors for additional information, because most trials were published before 1995. Second, some of the medications have only been evaluated in 1 or 2 studies, which may limit the generalizability of the findings. We do not think these factors have influences our conclusions.
CORRESPONDENCE
Arianne P. Verhagen, PhD, Department of General Practice, Erasmus Medical Centre, PO Box 1738, 3000 DR Rotterdam, The Netherlands. E-mail: [email protected]
1. Henry D, Lim LLY, Garcia Rodriguez LA, et al. Variability in risk of gastrointestinal complications with individual nonsteroidal anti-inflammatory drugs: results of a collaborative meta-analysis. BMJ 1996;312:1563-1566.
2. D’Amico D, Grazzi L, Leone M, Moschiano F, Bussone G. A review of the treatment of primary headaches. Part II: Tension-type headache. Ital J Neurol Sci 1998;19:2-9.
3. Schwartz BS, Stewart WF, Simon D, Lipton RB. Epidemiology of tension-type headache. JAMA 1998;279:381-383.
4. Rasmussen BK. Epidemiology of headache. Cephalalgia 1995;15:45-68.
5. Pryse-Philips W, Findlay H, Tugwell P, Edmeads J, Murray TJ, Nelson RF. Canadian population survey on the clinical, epidemiologic and societal impact of migraine and tension-type headache. Can J Neurol Sci 1992;19:333-339.
6. Robinson KA, Dickerson K. Development of a highly sensitive search strategy for the retrieval of reports of controlled trials using PubMed. Int J Epidemiol 2002;31:150-153.
7. Headache Classification Committee of the International Headache Society. Classification and diagnostic criteria for headache disorders, cranial neuralgias and facial pain. Cephalalgia 1988;8(Suppl 7):1-96;Headache Classification Committee of the International Headache Society. The International Classification of headache disorders.Cephalalgia 2004; 24(Suppl 1): 1-152.
8. Ad Hoc Committee on the Classification of Headache of the National Institute of Neurological Diseases and Blindness. Classification of headache. JAMA 1962;179:717-718.
9. Elbourne DR, Altman DG, Higgins JP, Curtin F, Worthington HV, Vail A. Meta-analyses involving crossover trials: methodological issues. Int J Epidemiol 2002;31:140-149.
10. Verhagen AP, de Vet HCW, de Bie RA, et al. The art of quality assessment of RCTs included in systematic reviews. J Clin Epidemiol 2001;54:651-654.
11. Van Tulder MW, Furlan A, Bombarbier C, Bouter L. Editorial Board of the Cochrane Collabaration Back Review Group. Updated method guidelines for systematic reviews in the Cochrane Collaboration Back review Group. Spine 2003;28:1290-1299.
12. Als-Nielsen B, Chen W, Gluud C, Kjaergard LL. Association of funding and conclusions in randomized drug trials. A reflection of treatment effect or adverse events? JAMA 2003;290:921-928.
13. Diamond S. Zomepirac in the symptomatic treatment of muscle contraction headache. J Clin Pharmacol 1980;20:298-302;Diamond S, Medina JL. A double-blind study of zomepirac sodium and placebo in the treatment of muscle contraction headache. Headache 1981; 21:45-48.
14. Diamond S, Balm TK, Freitag FG. Ibuprofen plus caffeine in the treatment of tension-type headache. Clin Pharmacol Ther 2000;68:312-319;Diamond S, Freitag FG. The use of ibuprofen plus caffeine to treat tension-type headache. Curr Pain Headache Rep 2001; 5:472-478.
15. von Graffenried B, Hill RC, Nüesch E. Headache as a model for assessing mild analgesic drugs. J Clin Pharmacol 1980;20:131-144;von Graffenried B, Nüesch B. Non-migrainous headache for the evaluation of oral analgesics. Br J Clin Pharmacol 1980; 10(suppl2):225S-231S.
16. Friedman AP, Boyles WF, Elkind AH, et al. Fiorinal with codeine in the treatment of tension headache-the contribution of components to the combination drug. Clin Ther 1988;10:303-315;Hwang DS, Mietlowski MJ, Friedman AP. Fiorinal with Codeine in the management of tension headache: impact of placebo response. Clin Ther 1987; 9:201-222.
17. Dahlöf CG, Jacobs LD. Ketoprofen, paracetamol and placebo in the treatment of episodic tension-type headache. Cephalalgia 1996;16:117-123.
18. Gilbert MM, De Sola Pool N, Schecter C. Analgesic/calmative effects of acetaminophen and phenyltoloxamine in treatment of simple nervous tension accompanied by headache. Curr Ther Res Clin Exp 1976;20:53-58.
19. Göbel H, Fresenius J, Heinze A, Dworschak M, Soyka D. Effectiveness of peppermint oil and paracetamol in the treatment of tension headache [German]. Nervenarzt 1996;67:672-681.
20. Göbel H, Heinze A, Lurch A, Dworschak M. Essential oils in the therapy of tension headache [German]. Z Allg Med 1998;74:223-228.
21. Göbel H, Heinze A, Dworschak M, Heinze-Kuhn Stolze H. Analgesic efficacy and tolerability of locally applied oleum menthae piperitae preparation LI 170 in patients with migraine or tension-type headache [German]. Z Allg Med 2001;77:287-295.
22. Guidotti M, Zanasi S, Garagiola U. Pirprofen in the treatment of migraine and episodic headache attacks: a placebo-controlled crossover clinical trial. J Int Med Res 1989;17:48-54.
23. Langemark M, Olesen J. Effervescent ASA versus solid ASA in the treatment of tension headache. A double-blind, placebo controlled study. Headache 1987;27:90-95.
24. Laveneziana D, Speranza R, Raulli P, Paredi G. Comparative efficacy of ibuprofen arginine and beta-cyclodextrin piroxicam as treatment for tension-type headache. Clin Drug Invest 1996;11(Suppl 1):22-26.
25. Migliardi JR, Armellino JJ, Friedman M, Gillings DB, Beaver WT. Caffeine as an analgesic adjuvant in tension headache. Clin Pharmacol Ther 1994;56:576-586.
26. Ryan RE, Sr. Motrin- A new agent for the symptomatic treatment of muscle contraction headache. Headache 1977;16:280-283.
27. Wood A, von Graffenried B. Fluproquazone: Analgesic activity in outpatients with non-migrainous headache. Arzneim-Forsch/Drug Res 1981;31:914-917.
28. Lange R, Lentz R. Comparison ketoprofen, ibuprofen and naproxen sodium in the treatment of tension-type headache. Drugs Exp Clin Res 1995;21:89-96.
29. Martinez-Martin P, Raffaelli E, Jr, Titus F, et al. Efficacy and safety of metamizol vs. acetylsalicylic acid in patients with moderate episodic tension-type headache: a randomized, double-blind, placebo- and active-controlled, multicentre study. Cephalalgia 2001;21:604-610.
30. Mehlisch DR, Weaver M, Fladung B. Ketoprofen, acetaminophen, and placebo in the treatment of tension headache. Headache 1998;38:579-589.
31. Packman B, Packman E, Doyle G, et al. Solubilized ibuprofen: evaluation of onset, relief, and safety of a novel formulation in the treatment of episodic tension-type headache. Headache 2000;40:561-567.
32. Prior MJ, Cooper KM, May LG, Bowen DL. Efficacy and safety of acetaminophen and naproxen in the treatment of tension-type headache. A randomized, double-blind, placebo-controlled trial. Cephalalgia 2002;22:740-748.
33. Steiner TJ, Lange R. Ketoprofen (25 mg) in the symptomatic treatment of episodic tension-type headache: double-blind placebo-controlled comparison with acetaminophen (1000 mg). Cephalalgia 1998;18:38-43.
34. Steiner T, Lange R, Voelker M. Aspirin in episodic tension-type headache: placebo-controlled dose-ranging comparison with paracetamol. Cephalalgia 2003;23:59-66.
35. van Gerven JM, Schoemaker RC, Jacobs LD, et al. Self-medication of a single headache episode with ketoprofen, ibuprofen or placebo, home-monitored with an electronic patient diary. Br J Clin Pharmacol 1996;42:475-481.
36. Kubitzek F, Ziegler G, Gold MS, Liu JMH, Ionescu E. Low-dose diclofenac potassium in the treatment of episodic tension-type headache. European J Pain 2003;7:155-162.
37. Diamond S. Ibuprofen versus aspirin and placebo in the treatment of muscle contraction headache. Headache 1983;23:206-210.
38. DiSerio FJ, Friedman AP, Parno J, Singer JM. Proquazone for tension headache-a multicenter trial. Headache 1985;25:127-133.
39. Friedman AP. Assessment of Fiorinal with Codeine in the treatment of tension headache. Clin Ther 1986;8:703-721.
40. Friedman AP, DiSerio FJ. Symptomatic treatment of chronically recurring tension headache: a placebo-controlled, multicenter investigation of Fioricet and acetaminophen with codeine. Clin Ther 1987;10:69-81.
41. Miller DS, Talbot CA, Simpson W, Korey A. A comparison of naproxen sodium, acetaminophen and placebo in the treatment of muscle contraction headache. Headache 1987;27:392-396.
42. Sargent JD, Peters K, Goldstein J, Madison DS, Solbach P. Naproxen sodium for muscle contraction headache treatment. Headache 1988;28:180-182.
43. Schachtel BP, Thoden WR. Onset of action of ibuprofen in the treatment of muscle-contraction headache. Headache 1988;28:471-474.
44. Schachtel BP, Thoden WR, Konerman JP, Brown A, Chaing DS. Headache pain model for assessing and comparing the efficacy of over-the-counter analgesic agents. Clin Pharmacol Ther 1991;50:322-329.
45. Schachtel BP, Furey SA, Thoden WR. Nonprescription ibuprofen and acetaminophen in the treatment of tension-type headache. J Clin Pharmacol 1996;36:1120-1125.
46. Peters BH, Fraim CJ, Masel BE. Comparison of 650 mg aspirin and 1,000 mg acetaminophen with each other, and with placebo in moderately severe headache. Am J Med 1983;74:36-42.
47. Ryan RE, Sr, Ryan RE, Jr. Symptomatic treatment of tension headache. Ear Nose Throat J 1979;58:423-426.
48. Schattner P, Randerson D. Tiger Balm as a treatment of tension headache. A clinical trial in general practice. Aust Fam Physician 1996;25:216, 218,220passim
49. Ward N, Whitney C, Avery D, Dunner D. The analgesic effects of caffeine in headache. Pain 1991;44:151-155.
50. Borges J, Zavaleta C. Study of a new analgesic compound in the treatment of tension headache. J Int Med Res 1976;4:74-78.
51. Thorpe P. Controlled and uncontrolled studies on “Fiorinal-PA” for symptomatic relief in tension headache. Med J Aust 1970;2:180-181.
52. Kagan G, Masheter HC. A controlled study of short-term treatment of tension headache. Curr Med Res Opin 1978;5:709-713.
53. Scheepers F. Syndol in the treatment of tension headache. Med Proc 1971;359-368.
- Though all non-narcotic analgesics have equivalent efficacy against tension-type headache, ibuprofen’s generally favorable side-effect profile makes it a reasonable first choice.
Whereas quantitative and qualitative analyses of 41 randomized controlled trials (RCTs) strongly suggests that all types of NSAIDs are more effective than placebo (>50% pain relief) against an acute episode of tension-type headache (TTH), the evidence also shows that no single nonsteroidal anti-inflammatory drug (NSAID) is more effective than another in this setting.
How, then, to choose an NSAID? Many of the 41 articles we reviewed reported on the side effects of NSAIDs. No clear differences were reported in the number of side effects between the NSAIDs and placebo. However, differences were found among the types of NSAIDs. Our results agree with those found by Henry et al,1 who concluded from their meta-analysis that ibuprofen, compared with other NSAIDs, had the lowest relative risk of serious gastrointestinal complications. Given the lack of important differences in efficacy among NSAIDs for relieving an acute episode of TTH, using the most effective dose of a drug that is well tolerated by a patient is a reasonable basis for selection. Ibuprofen, therefore, generally may be advocated.
When acetaminophen is preferred. Our results suggest NSAIDs might be more effective than acetaminophen for TTH. However, because NSAIDs are allergenic for some people, and they must not be used in association with anticoagulants,2 acetaminophen might be an alternative in these situations. When giving acetaminophen, the dose of the medication might be important due to a possible dose-response relationship.
Why this review was needed
Tension-type headache, also known as tension headache or muscle contraction headache, is the most commonly experienced type of headache (see Episodic tension-type headache). Population-based studies suggest prevalence rates of 35% to 40% in adults.3-5
Persons experiencing an acute episode of TTH most often self-treat with mild, non-narcotic analgesics for initial pain relief. Studies have suggested that acetaminophen and NSAIDs like aspirin, ibuprofen, naproxen, and ketoprofen are effective in reducing headache symptoms. But a variety of drugs, dosages, and combinations have been described. No systematic review has, until now, described the efficacy and tolerability of analgesics for the treatment of acute episodes of TTH. Good quality-controlled trials and a systematic review form the basis for evidence-based treatment guidelines, which provide a basis for the individual patient.
Episodic TTH has been defined in the classification of the International Headache Society (IHS) as headache frequency of greater than 10 lifetime episodes, but fewer than 15 episodes per month; an average episode duration of 30 minutes to 7 days; and with at least 2 quality of pain features (ie, mild or moderate pain intensity, bilateral, pressing or tightening [nonpulsating] feeling, and no exacerbation by exercise).7 In addition, the headache does not have the IHS-defining features of migraine (ie, nausea, vomiting, or photophobia and phonophobia). The definition of chronic TTH is identical to those for episodic TTH, except that the episode frequency is 15 or more episodes per month for at least 6 months, and 1 associated symptom of nausea, photophobia, or phonophobia is permitted.
We aimed to describe and assess the data from RCTs concerning the efficacy and tolerability of analgesics for the treatment of acute episodes of TTH in adult patients. Details of our Methods and Results follow.
Methods
Search strategy
Medline and EMBASE were searched from inception to January 2005 using the terms tension-type headache, tension headache, stress headache, or muscle contraction headache together with the search strategy for identifying RCTs described by Robinson and Dickerson.6 The Cochrane Controlled Trials Register was searched using the words tension headache or tension-type headache or muscle contraction headache. Additional strategies for identifying trials included searching the reference lists of review articles and included studies.
Study selection
Only RCTs including analgesic medicine used in the treatment or management of TTH conducted among adult patients (aged 18 years or older), with reasonable criteria designed to distinguish TTH from migraine, were selected for our review. The use of a specific set of diagnostic criteria (eg, IHS 1988 and Ad Hoc 1962)7,8 was not required, but TTH diagnoses had to be based on at least some of the distinctive features of TTH—eg, bilateral in location, no nausea or vomiting, mild or moderate intensity, or no exacerbation by exercise.
Main outcome measures were pain relief or recovery over 2 to 6 hours.
Two authors (LD, AV) independently screened titles and abstracts of identified studies for eligibility. All potentially relevant studies were retrieved as full papers and then again independently reviewed by 2 authors (LD, AV). Disagreements were resolved through consensus where possible, or by arbitration with a third author (MB). Crossover designs often presented data from treatment groups, as if the trial was a parallel group trial. The results from these studies were excluded from data-analysis if no results from both arms were presented or a binary correlation coefficient was available.9
Methodological quality and data extraction
Two authors (LD with MB, BK, or AV) independently rated the methodological quality of the included trials using the Delphi list.10 The Delphi list is a generic criteria list developed by international consensus and consists of the following 9 items: 1) randomization; 2) adequate allocation concealment; 3) groups similar at baseline; 4) specification of eligibility criteria; 5) blinding of outcome assessor; 6) blinding of care provider; 7) blinding of patient; 8) presentation of point estimates and measures of variability; 9) intention-to-treat-analysis. One extra item was added: 10) withdrawal or dropout rate unlikely to cause bias. All selected methodological criteria were scored as yes (=1), no (=0) or don’t know (=0). A quality score of a trial was computed by counting the number of positive scores, with equal weights applied on all items. In case of a disagreement between the 2 authors, consensus was used to resolve disagreement. When consensus could not be reached, a third author made the final decision (MB or AV).
Extraction of data from the original reports was performed by 1 author (LD) and checked by a second (AV). Disagreements were resolved by consensus. Extracted information included (if available) demographic data, detailed description of the intervention and control (ie, dose given, study duration, rescue medication), data on pain relief or recovery, and information on adverse effects measured during a treatment period of 2 to 6 hours. When a trial protocol permitted the use of rescue medication prior to the outcome time (2 to 6 hours), then the latest outcome assessment not confounded by the use of rescue medication was extracted
Data analysis
A quantitative analysis was limited to clinically homogenous studies for which the study populations, interventions and outcomes were considered to be similar. For each study, the number of patients who were recovered (often defined as more than 50% pain relief) was used to calculate relative risk (RR) with 95% confidence interval (CI). RRs and 95% CI were presented using the random effects model. Data are presented as treatment success, indicating that an RR >1 represents a better outcome for the first mentioned medication group.
In parallel studies, when more than 1 comparison from the same study (ie, aspirin 650 mg vs placebo and ibuprofen 400 mg vs placebo) was used for the statistical pooling of NSAIDs vs placebo, the results from the placebo group were evenly spread out over the 2 comparisons and the number of patients in the placebo group was divided by 2 in order to prevent double counting (personal communication RJPM Scholten, Dutch Cochrane Centre).
Because only a subset of available trials provides sufficient data for inclusion in the quantitative analysis, also a qualitative analysis was performed. We summarized findings by strength of evidence, nature of intervention and control treatments. The evidence was judged to be strong when multiple high-quality trials produced generally consistent findings.11 Results were considered consistent if over 75% of the studies reported similar results on the same outcome measure. It was judged to be moderate when multiple low-quality trials or one high-quality and 1 or more low-quality trials produced generally consistent findings. Evidence was considered to be limited when only 1 low-quality RCT existed and conflicting when the findings of existing trials were inconsistent. We arbitrarily regarded trials with methodological quality scores of 6 or more as of high quality.11
Relation between funding source of the RCTs and conclusions
We extracted the sources of funding of the RCTs from the text, statements of sources of support, authors’ affiliations, and acknowledgements. Funding sources were classified as nonprofit organizations, not reported, both nonprofit and for-profit organizations, or for-profit organizations.12 For-profit organizations were defined as companies that might acquire financial gain or loss depending on the outcome of the trial.12 Funding included provision of grants, study material (drug, placebo), or manpower (authorship, statistical analysis, or other assistance).12 We used the effect sizes between medication(s) and placebo to evaluate whether funding source affected outcome.
Results
Search results
A total of 1878 publications were identified by our search strategy. Finally, 41 RCTs met our inclusion criteria and 4 papers concerned double publications (FIGURE 1),13-16 leaving a total of 41 trials which were included in this review. Thirteen of these RCTs used a crossover design.15,7-27
FIGURE 1
How the 41 trials made our cut for the review
Description of studies
Full details of the included studies are presented in TABLE W1. The number of participants included in each trial ranged from 12 to 900 (mean=252.7 patients), with a total of 10,363 patients included. The mean percentage of participants who dropped out from the trials was 15.2% (range=0%–61.9%). Age of participants (for studies reporting this information) ranged from 18 to 87 years. Overall, the percentage of women was generally higher than men (mean=69.3%; range=36%–97%). Fifteen trials used the criteria of the International Headache Society to classify TTH,14,17,19-21,24,28-36 12 trials used the Ad Hoc Committee’s criteria,13,23,26,37,45 while the remaining studies did not use a formal classification.
Twenty-five studies compared 1 or more types of NSAIDs with placebo,13-17,22-24,26-36,38,41-43,45-47 17 studies compared 1 or more doses of acetaminophen with placebo,17-21,25,30-34,41,44-46,48,49 7 studies compared different types of NSAIDs,15,26,28,29,35-37 9 studies compared 1 or more types of NSAIDs with acetaminophen,17,30-34,41,45,46 and 13 studies compared other analgesics with placebo.15,18,25,27,39,40,44,49,50-53
The quality score (with positive items in parenthesis) is presented in the “Notes” section of TABLE W1. The interobserver reliability of the methodological quality assessment was high (κ=0.85). There was disagreement between the 2 authors in 7.5% of the criteria, but after consensus no disagreement persisted. The median quality score was 5 (range 1–9). Using a cutoff point of 6 out of 10 criteria, 15 studies (36.6%) were considered to be of high quality.15,17,19,21,22,24,25,28-30,32-34,36
Only 1 study reported a concealed randomization method.34 Other methodological flaws, which often scored “negative” or “unclear,” were blinding of the care provider (unclear 88%) and an intention-to-treat analysis (unclear 30% and negative 60%).
Effectiveness of analgesics
TABLE 1 gives the quantitative analysis for high-quality studies, low-quality studies, and for all studies for the different comparisons of NSAIDs, acetaminophen, and placebo.
TABLE 1
Quantitative analysis for the different studies for the comparisons of NSAIDs, acetaminophen and placebo
| HIGH-QUALITY TRIALS | LOW-QUALITY TRIALS | ALL TRIALS | |||||
|---|---|---|---|---|---|---|---|
| N/n | RR (95% CI) | N/n | RR (95% CI) | N/n | RR (95% CI) | ||
| 1. NSAIDs vs placebo | 7/13 | 1.5 (1.3–1.8)* | 8/15 | 2.0 (1.4–2.7)* | 15/28 | 1.6 (1.4–2.0)* | |
| 2. Acetaminophen vs placebo | 5/6 | 1.4 (1.04–1.8)* | 3/3 | 1.6 (0.9–2.7) | 8/9 | 1.4 (1.1–1.8)* | |
| 500 mg vs placebo | 1/1 | 1.1 (0.8–1.5) | 1/1 | 1.1 (0.8–1.5) | |||
| 1000 mg vs placebo | 4/5 | 1.4 (0.97–2.0) | 3/3 | 1.6 (0.9–2.7) | 7/8 | 1.5 (1.1–2.0)8 | |
| 4. NSAIDs vs acetaminophen | 5/7 | 1.1 (0.96–1.4) | 2/2 | 2.2 (1.4–3.4)* | 7/9 | 1.3 (1.04–1.5)* | |
| 3. NSAIDs vs NSAIDs | |||||||
| Ibuprofen 400/800 mg vs aspirin 650 mg37 | 1/2 | 1.2 (0.6–2.2) | |||||
| Ketoprofen 12.5/25/50 mg vs ibuprofen 200 mg29,36 | 1/2 | 1.1 (0.8–1.5) | 1/2 | 1.5 (0.8–2.7) | 2/4 | 1.2 (0.9–1.6) | |
| Ketoprofen 12.5/25 mg vs naproxen 275 mg29 | 1/2 | 0.96 (0.7–1.3) | |||||
| Naproxen 275 mg vs ibuprofen 200 mg29 | 1/1 | 0.9 (0.7–1.2) | |||||
| Metamizol 500/1000 mg vs aspirin 1000 mg30 | 1/2 | 1.2 (0.9–1.7) | |||||
| Diclofenac 12.5/25 mg vs ibuprofen 400 mg55 | 1/2 | 1.1 (0.8–1.5) | |||||
| N/n=number of trials/total number of comparisons; RR: relative risk; CI: confidence interval. *P<.05. | |||||||
1. NSAIDs vs placebo
Twenty-five studies compared one or more types of NSAIDs with placebo, of which 10 are of high quality.15,17,22,24,29,30,32-34,36,45
Quantitative analysis. Sufficient data were available in 15 studies,13,14,29-38,41,45,47 of which 6 were of high quality.29,30,32-34,36,45 Because some trials included 3 or more treatment groups, data were available for 28 comparisons. We found a significant effect in favor of NSAIDs compared with placebo on short-term pain relief (see TABLE 1 and FIGURE W1).
Qualitative analysis. The 10 high-quality studies reported 30 comparisons, of which in 26 (86.6%) NSAIDs were significantly more effective compared with placebo for short-term pain relief (strong evidence).
Adverse events. Twenty studies reported during a 2 to 6 hours treatment period data on adverse events. For the NSAID group (n=2061) frequently mentioned side effects were nausea (4.6%), photophobia (3.1%), vomiting (2.7%), phonophobia (1.7%), aching limbs (1.2%), dizziness (1.1%), and drowsiness (1.0%). For the placebo group (n=1323), these were nausea (7.0%), photophobia (4.8%), vomiting (3.9%), phonophobia (3.4%), aching limbs (2.0%), drowsiness (1.7%), and dizziness (1.0%). The pooled RR for the number of patients reporting side effects for 14 studies with sufficient data was 0.96 (95% CI, 0.7–1.3), indicating no significant difference.
2. Acetaminophen vs placebo
Seventeen studies compared 1 or more doses of acetaminophen with placebo; 9 were high-quality studies.17,19,21,25,30-34,45
Quantitative analysis. The pooled analysis of 5 high-quality trials30,32-34,45 and 3 low-quality trials31,41,44 showed that acetaminophen was significantly more effective compared with placebo for patients on short-term pain relief (TABLE 1 and FIGURE W2). This result was due to the studies comparing acetaminophen with placebo. The only high-quality trial34 with acetaminophen 500 mg failed to show a difference in short-term pain relief compared with placebo (TABLE 1).
Qualitative analysis. The 9 high-quality studies reported 16 comparisons, of which 10 (62.5%) mentioned that acetaminophen showed significantly more pain relief than placebo (conflicting evidence). In 2 high-quality studies,17,34 we found no significant differences between acetaminophen 500 mg and placebo (strong evidence), but in the 9 high-quality studies, in 10 out of 14 comparisons (71.4%) acetaminophen 1000 mg showed significantly more pain relief compared with placebo (conflicting evidence).
Adverse events. Twelve studies reported data on adverse events. For the acetaminophen group (n=3715), frequently mentioned side effects were stomach discomfort (3.9%), dizziness (1.6%), nervousness (0.7%), nausea (0.4%), and drowsiness (0.3%). For the placebo group (n=3700), these were stomach discomfort (3.7%), nervousness (0.7%), nausea (0.6%), dizziness (0.5%), and drowsiness (0.3%). The pooled RR for the number of patients reporting side effects was 1.3 (95% CI, 0.9–1.7), indicating no significant difference.
3. NSAIDs vs acetaminophen
Nine studies compared 1 or more types of NSAIDs with acetaminophen, of which 6 are of high-quality.17,30-34,45
Quantitative analysis. The pooled analysis of 5 high-quality studies30-34,45 and 2 low-quality studies31,41 showed a significant difference in short-term pain relief in favor of NSAIDs (TABLE 1).
Qualitative analysis. Six high-quality studies showed that in 9 out of 13 comparisons (69%) NSAIDs were not significantly more effective than acetaminophen for short-term pain relief in patients with acute episodes of TTH (conflicting evidence).
Adverse events. Seven studies reported data on adverse events. The pooled RR for number of patients reporting side effects was 1.3 (95% CI, 0.97–1.6), indicating no significant difference.
4. Comparison between different NSAIDs
Seven studies compared different types of NSAIDs,15,26,28,29,35-37 of which 4 provided data.
Quantitative and qualitative analysis. The analysis the between different types of NSAIDs no differences in short-term pain relief can be found; RR vary between 0.9 and 1.5 (TABLE 1).
Adverse events. The adverse effects were reported involving the central nervous system (ie, dizziness, drowsiness, vertigo), gastrointestinal system (ie, nausea, vomiting, gastrointestinal upset or discomfort), and the body as a whole (ie, light-headed, fatigue, cramps, asthenia, chills).
Naproxen and zomepirac gave more adverse events involving the central nervous system than aspirin, ibuprofen, and ketoprofen. Naproxen and zomepirac were also more often associated with gastrointestinal side effects than ibuprofen and ketoprofen.
Furthermore, aspirin was more associated with gastrointestinal complaints than ibuprofen. Side effects such as fatigue and cramps (body as whole) occurred significantly more often with ketoprofen compared with aspirin and ibuprofen, naproxen compared with ketoprofen, and zomepirac compared with aspirin.
5. Other analgesics vs placebo
Qualitative analysis. There is insufficient evidence to either support or refute the effectiveness of all other analgesics compared with placebo, due to the fact that most analgesics were a unique combination of analgesics with caffeine or peppermint oil. Also, the low methodological quality of nearly all these studies and the low number of studies per comparison made drawing conclusions difficult.
Optalidon and Tonopan were compared with placebo in 3 substudies of 1 high-quality study, and we found significant more pain relief using these analgesics than placebo.15 No adverse events were stated in these studies.
The combination of acetaminophen and caffeine was compared with placebo in 2 studies of high quality25,49 showed that the combination of acetaminophen with caffeine is more effective than placebo (moderate evidence).
The combination of acetaminophen, aspirin, and caffeine was compared with placebo in 4 substudies of the same high-quality study.25 Data from these studies suggest that this combination is significantly more effective than placebo. All groups reported low numbers of side effects as stomach discomfort, nervousness, and dizziness.
Relation between funding source and effect estimates
The pooled effect estimates in placebo-controlled trials stratified by funding are shown in TABLE 2. No major differences in effect sizes were found between the different funding sources.
TABLE 2
Relation between funding source and effect estimate, intervention vs placebo only
| NUMBER OF COMPARISONS (TRIALS) | NUMBER OF COMPARISONS IN HIGH QUALITY STUDIES (TRIALS) | EFFECT ESTIMATE ALLSTUDIES: RR (95% CI) | EFFECT ESTIMATE HIGH QUALITY STUDIES: RR (95% CI) | |
|---|---|---|---|---|
| Non-profit organizations | 0 | 0 | — | — |
| Not reported | 4 (2) | 0 | 1.4 (0.8–2.6) | — |
| Non-profit and for-profit organizations | 26 (11) | 11 (4) | 1.7 (1.4–2.1) | 1.4 (1.1–1.7) |
| For-profit organizations | 14 (7) | 8 (3) | 1.4 (1.2–1.6) | 1.2 (1.06–1.4) |
| All studies | 44 (20) | 19 (7) | 1.5 (1.3–1.8) | 1.4 (1.1–1.7) |
| *P=.006 using χ2 test | ||||
Methodological quality of included studies
This review shows that many RCTs on the efficacy of analgesics in TTH have methodological shortcomings. Using a cut-off point of 6 out of 10 criteria, only 35% of the included studies were found to be of high quality. Most authors failed to explicitly specify the method of treatment allocation and blinding procedure. In many studies authors stated that the trial had a double-blind procedure, however, when the blinding procedure was not explicitly reported (ie, identical looking tablets) we did not score 1 or more blinding items positive. These flaws can be prevented in future trials.
We are unaware of any prior systematic reviews or meta-analyses that have assessed the efficacy and tolerability of analgesics in the treatment of acute episodes of tension-type headache in adults. We conducted the review according to the high Cochrane standard, resulting in a review of high validity. Our review succeeded in identifying a large number of only randomized trials. Also the methodological quality did not explain the possible association between funding and effect estimates.
Although systematic reviews offer the least biased method of summarizing research literature, our review should be considered with the following limitations in mind. First, we decided not to contact the authors for additional information, because most trials were published before 1995. Second, some of the medications have only been evaluated in 1 or 2 studies, which may limit the generalizability of the findings. We do not think these factors have influences our conclusions.
CORRESPONDENCE
Arianne P. Verhagen, PhD, Department of General Practice, Erasmus Medical Centre, PO Box 1738, 3000 DR Rotterdam, The Netherlands. E-mail: [email protected]
1. Henry D, Lim LLY, Garcia Rodriguez LA, et al. Variability in risk of gastrointestinal complications with individual nonsteroidal anti-inflammatory drugs: results of a collaborative meta-analysis. BMJ 1996;312:1563-1566.
2. D’Amico D, Grazzi L, Leone M, Moschiano F, Bussone G. A review of the treatment of primary headaches. Part II: Tension-type headache. Ital J Neurol Sci 1998;19:2-9.
3. Schwartz BS, Stewart WF, Simon D, Lipton RB. Epidemiology of tension-type headache. JAMA 1998;279:381-383.
4. Rasmussen BK. Epidemiology of headache. Cephalalgia 1995;15:45-68.
5. Pryse-Philips W, Findlay H, Tugwell P, Edmeads J, Murray TJ, Nelson RF. Canadian population survey on the clinical, epidemiologic and societal impact of migraine and tension-type headache. Can J Neurol Sci 1992;19:333-339.
6. Robinson KA, Dickerson K. Development of a highly sensitive search strategy for the retrieval of reports of controlled trials using PubMed. Int J Epidemiol 2002;31:150-153.
7. Headache Classification Committee of the International Headache Society. Classification and diagnostic criteria for headache disorders, cranial neuralgias and facial pain. Cephalalgia 1988;8(Suppl 7):1-96;Headache Classification Committee of the International Headache Society. The International Classification of headache disorders.Cephalalgia 2004; 24(Suppl 1): 1-152.
8. Ad Hoc Committee on the Classification of Headache of the National Institute of Neurological Diseases and Blindness. Classification of headache. JAMA 1962;179:717-718.
9. Elbourne DR, Altman DG, Higgins JP, Curtin F, Worthington HV, Vail A. Meta-analyses involving crossover trials: methodological issues. Int J Epidemiol 2002;31:140-149.
10. Verhagen AP, de Vet HCW, de Bie RA, et al. The art of quality assessment of RCTs included in systematic reviews. J Clin Epidemiol 2001;54:651-654.
11. Van Tulder MW, Furlan A, Bombarbier C, Bouter L. Editorial Board of the Cochrane Collabaration Back Review Group. Updated method guidelines for systematic reviews in the Cochrane Collaboration Back review Group. Spine 2003;28:1290-1299.
12. Als-Nielsen B, Chen W, Gluud C, Kjaergard LL. Association of funding and conclusions in randomized drug trials. A reflection of treatment effect or adverse events? JAMA 2003;290:921-928.
13. Diamond S. Zomepirac in the symptomatic treatment of muscle contraction headache. J Clin Pharmacol 1980;20:298-302;Diamond S, Medina JL. A double-blind study of zomepirac sodium and placebo in the treatment of muscle contraction headache. Headache 1981; 21:45-48.
14. Diamond S, Balm TK, Freitag FG. Ibuprofen plus caffeine in the treatment of tension-type headache. Clin Pharmacol Ther 2000;68:312-319;Diamond S, Freitag FG. The use of ibuprofen plus caffeine to treat tension-type headache. Curr Pain Headache Rep 2001; 5:472-478.
15. von Graffenried B, Hill RC, Nüesch E. Headache as a model for assessing mild analgesic drugs. J Clin Pharmacol 1980;20:131-144;von Graffenried B, Nüesch B. Non-migrainous headache for the evaluation of oral analgesics. Br J Clin Pharmacol 1980; 10(suppl2):225S-231S.
16. Friedman AP, Boyles WF, Elkind AH, et al. Fiorinal with codeine in the treatment of tension headache-the contribution of components to the combination drug. Clin Ther 1988;10:303-315;Hwang DS, Mietlowski MJ, Friedman AP. Fiorinal with Codeine in the management of tension headache: impact of placebo response. Clin Ther 1987; 9:201-222.
17. Dahlöf CG, Jacobs LD. Ketoprofen, paracetamol and placebo in the treatment of episodic tension-type headache. Cephalalgia 1996;16:117-123.
18. Gilbert MM, De Sola Pool N, Schecter C. Analgesic/calmative effects of acetaminophen and phenyltoloxamine in treatment of simple nervous tension accompanied by headache. Curr Ther Res Clin Exp 1976;20:53-58.
19. Göbel H, Fresenius J, Heinze A, Dworschak M, Soyka D. Effectiveness of peppermint oil and paracetamol in the treatment of tension headache [German]. Nervenarzt 1996;67:672-681.
20. Göbel H, Heinze A, Lurch A, Dworschak M. Essential oils in the therapy of tension headache [German]. Z Allg Med 1998;74:223-228.
21. Göbel H, Heinze A, Dworschak M, Heinze-Kuhn Stolze H. Analgesic efficacy and tolerability of locally applied oleum menthae piperitae preparation LI 170 in patients with migraine or tension-type headache [German]. Z Allg Med 2001;77:287-295.
22. Guidotti M, Zanasi S, Garagiola U. Pirprofen in the treatment of migraine and episodic headache attacks: a placebo-controlled crossover clinical trial. J Int Med Res 1989;17:48-54.
23. Langemark M, Olesen J. Effervescent ASA versus solid ASA in the treatment of tension headache. A double-blind, placebo controlled study. Headache 1987;27:90-95.
24. Laveneziana D, Speranza R, Raulli P, Paredi G. Comparative efficacy of ibuprofen arginine and beta-cyclodextrin piroxicam as treatment for tension-type headache. Clin Drug Invest 1996;11(Suppl 1):22-26.
25. Migliardi JR, Armellino JJ, Friedman M, Gillings DB, Beaver WT. Caffeine as an analgesic adjuvant in tension headache. Clin Pharmacol Ther 1994;56:576-586.
26. Ryan RE, Sr. Motrin- A new agent for the symptomatic treatment of muscle contraction headache. Headache 1977;16:280-283.
27. Wood A, von Graffenried B. Fluproquazone: Analgesic activity in outpatients with non-migrainous headache. Arzneim-Forsch/Drug Res 1981;31:914-917.
28. Lange R, Lentz R. Comparison ketoprofen, ibuprofen and naproxen sodium in the treatment of tension-type headache. Drugs Exp Clin Res 1995;21:89-96.
29. Martinez-Martin P, Raffaelli E, Jr, Titus F, et al. Efficacy and safety of metamizol vs. acetylsalicylic acid in patients with moderate episodic tension-type headache: a randomized, double-blind, placebo- and active-controlled, multicentre study. Cephalalgia 2001;21:604-610.
30. Mehlisch DR, Weaver M, Fladung B. Ketoprofen, acetaminophen, and placebo in the treatment of tension headache. Headache 1998;38:579-589.
31. Packman B, Packman E, Doyle G, et al. Solubilized ibuprofen: evaluation of onset, relief, and safety of a novel formulation in the treatment of episodic tension-type headache. Headache 2000;40:561-567.
32. Prior MJ, Cooper KM, May LG, Bowen DL. Efficacy and safety of acetaminophen and naproxen in the treatment of tension-type headache. A randomized, double-blind, placebo-controlled trial. Cephalalgia 2002;22:740-748.
33. Steiner TJ, Lange R. Ketoprofen (25 mg) in the symptomatic treatment of episodic tension-type headache: double-blind placebo-controlled comparison with acetaminophen (1000 mg). Cephalalgia 1998;18:38-43.
34. Steiner T, Lange R, Voelker M. Aspirin in episodic tension-type headache: placebo-controlled dose-ranging comparison with paracetamol. Cephalalgia 2003;23:59-66.
35. van Gerven JM, Schoemaker RC, Jacobs LD, et al. Self-medication of a single headache episode with ketoprofen, ibuprofen or placebo, home-monitored with an electronic patient diary. Br J Clin Pharmacol 1996;42:475-481.
36. Kubitzek F, Ziegler G, Gold MS, Liu JMH, Ionescu E. Low-dose diclofenac potassium in the treatment of episodic tension-type headache. European J Pain 2003;7:155-162.
37. Diamond S. Ibuprofen versus aspirin and placebo in the treatment of muscle contraction headache. Headache 1983;23:206-210.
38. DiSerio FJ, Friedman AP, Parno J, Singer JM. Proquazone for tension headache-a multicenter trial. Headache 1985;25:127-133.
39. Friedman AP. Assessment of Fiorinal with Codeine in the treatment of tension headache. Clin Ther 1986;8:703-721.
40. Friedman AP, DiSerio FJ. Symptomatic treatment of chronically recurring tension headache: a placebo-controlled, multicenter investigation of Fioricet and acetaminophen with codeine. Clin Ther 1987;10:69-81.
41. Miller DS, Talbot CA, Simpson W, Korey A. A comparison of naproxen sodium, acetaminophen and placebo in the treatment of muscle contraction headache. Headache 1987;27:392-396.
42. Sargent JD, Peters K, Goldstein J, Madison DS, Solbach P. Naproxen sodium for muscle contraction headache treatment. Headache 1988;28:180-182.
43. Schachtel BP, Thoden WR. Onset of action of ibuprofen in the treatment of muscle-contraction headache. Headache 1988;28:471-474.
44. Schachtel BP, Thoden WR, Konerman JP, Brown A, Chaing DS. Headache pain model for assessing and comparing the efficacy of over-the-counter analgesic agents. Clin Pharmacol Ther 1991;50:322-329.
45. Schachtel BP, Furey SA, Thoden WR. Nonprescription ibuprofen and acetaminophen in the treatment of tension-type headache. J Clin Pharmacol 1996;36:1120-1125.
46. Peters BH, Fraim CJ, Masel BE. Comparison of 650 mg aspirin and 1,000 mg acetaminophen with each other, and with placebo in moderately severe headache. Am J Med 1983;74:36-42.
47. Ryan RE, Sr, Ryan RE, Jr. Symptomatic treatment of tension headache. Ear Nose Throat J 1979;58:423-426.
48. Schattner P, Randerson D. Tiger Balm as a treatment of tension headache. A clinical trial in general practice. Aust Fam Physician 1996;25:216, 218,220passim
49. Ward N, Whitney C, Avery D, Dunner D. The analgesic effects of caffeine in headache. Pain 1991;44:151-155.
50. Borges J, Zavaleta C. Study of a new analgesic compound in the treatment of tension headache. J Int Med Res 1976;4:74-78.
51. Thorpe P. Controlled and uncontrolled studies on “Fiorinal-PA” for symptomatic relief in tension headache. Med J Aust 1970;2:180-181.
52. Kagan G, Masheter HC. A controlled study of short-term treatment of tension headache. Curr Med Res Opin 1978;5:709-713.
53. Scheepers F. Syndol in the treatment of tension headache. Med Proc 1971;359-368.
Do family physicians fail to provide triptans for patients with migraine?
- While continuing to improve recognition of migraine in your patient population, pay particular attention to the adherence rate among those for whom you have prescribed a triptan.
- Ask patients who discontinue triptan therapy why they made that decision. Besides adverse effects from the agent, reasons may include medication cost, influence of comorbidities, or triptan interaction with medications you may not have known about.
Despite more than 5 million consultations annually, relatively little is known about the treatment of migraine in primary care. Much of the literature is projected from population surveys or reports concerning patients referred for specialist care or those entering treatment studies.
Our study is the largest reported to gather data directly from patients treated for migraine in family practice. The participating practices represent a spectrum of communities and practice types. As minimal differences exist in practice patterns between family physicians who participate in research networks and all family physicians1, these findings may more accurately reflect the current status in family practice than other studies.
We believe that this study indicates family physicians offer triptans to most patients consulting specifically for migraine and that adherence issues contribute significantly to the perceived low rates of use of these medications in primary care. In recent years, considerable effort has gone into increasing the diagnosis of migraine and promoting the more extensive use of triptans in primary care patients (see article on page 1038 in this issue). Family physicians must certainly continue to improve the recognition of migraine; but attention to patient concerns about triptans and efforts to enhance adherence and appropriate use of these medications is obviously essential. We must continue efforts to better understand why some 30% or more of migraine patients in primary care practice discontinue a therapy that has been found to be highly effective and well accepted by patients in clinical studies.
Migraine-specific prescribing in primary care is better than commonly reported
Between 1990 and 1998, the number of physician office visits for migraine doubled to more than 5 million per year.2 Of the more than 28 million US adults with migraine, approximately 70% of women and 50% of men are now believed to have consulted a physician at least once,3 and two thirds of these patients have made 5 or more physician visits for migraine.4 More than 72% of migraine-related physician visits are to primary care physicians, the most to family physicians.1
Nevertheless, the headache literature routinely describes migraine as “undertreated” in primary care.5-7 In particular, primary care physicians are perceived to under-prescribe triptans,7-11 the most effective migraine-specific medications available, widely regarded as “the gold standard” for acute migraine therapy of all but mild attacks.12-16 Population surveys estimate that only some 13% to 20% of migraine sufferers have been prescribed triptans.4,5,9,17 A 1995 study of migraine patients enrolled in a health maintenance organization reported that 11.4% used subcutaneous sumatriptan; however, oral triptans were not included in the study.18 Ten years later, another study of health plan enrollees estimated that only 11% of those meeting strict criteria for migraine were prescribed triptans or ergots.7
These low percentages do not correlate with our experience of primary care practice nor with data indicating substantial sales of triptans in the US.19 As we have not identified any studies that directly address prescribing by primary care physicians for migraine, we conducted a survey of patients who consulted family physicians for migraine during 2002.
Some of the differences between our findings and those based on prescription data could be attributed to the use of samples (reported to be particularly common in migraine treatment during this period), or difficulties in patient recall of medications.
Diagnosis of migraine not always coded. A more significant source of difference between our findings and those of population-based surveys is in the diagnosis of migraine. Most surveys use patient-reported symptoms for diagnosis, and hence the population of migraine sufferers includes those who have not had a physician visit coded for migraine. Our interest is in the primary care consultation specifically for migraine.
If a physician concludes a patient has migraine, this diagnosis is highly likely to be correct,20 and our findings indicate that a migraine-specific medication is commonly offered. We strongly support ongoing efforts to improve the recognition of migraine by all physicians and emphasize that our results are based only on patients identified by migraine-coded primary care visits.
Why do patients discontinue triptans?
The finding that about one third of patients discontinued triptan use may be surprising in view of the widely reported efficacy16 and tolerability24 of these medications, but this is almost identical to the results of a study of 663 patients of a US headache clinic.25 Significant rates of triptan discontinuation have been reported by other studies.
A study based on British general practice pharmacy records reported 55% of patients not renewing a triptan prescription during 1 year of follow-up,26 and an older study of patients attending a Dutch neurology clinic found that 25% of sumatriptan users discontinued this drug over a 2-year period.27 One US primary care treatment study found that on enrollment, 62% of 143 migraine patients had previously used triptans or ergotamines but had discontinued therapy.28
As in our study, the principal stated reason for discontinuation in the Dutch study27 was lack of efficacy. Conversely, in the US primary care study only 13% of patients gave lack of efficacy as the principal reason for discontinuation but 20% cited cost and 55% cited nonprescribing by physicians.28
As shown in the TABLE, the most striking differences between patients who discontinued triptans and those who continued were in patient satisfaction with treatment and current use of narcotic medication for migraine, but the higher grades of MIDAS scores (FIGURE) were also significantly more common in the patients who discontinued.
This study was not designed to assess if these factors caused or resulted from triptan discontinuation, but the association of triptan “failure” with 3 other significant negative factors could indicate subgroups of patients with especially high morbidity from migraine or risk of poor response to migraine-specific treatment. Future studies are needed to better characterize patients who discontinue, especially to examine the roles of comorbidities, total medication use, and the role of subspecialty referral.
TABLE
Differences between patients who discontinued triptans and those who continued
| DISCONTINUERS | CONTINUERS | P VALUE | |
|---|---|---|---|
| Disability (MIDAS score) | |||
| Grade I or II | 34 | 98 | .034 |
| Grade III or IV | 86 | 145 | |
| Medication coverage* | |||
| All or some | 106 | 216 | .904 |
| None | 14 | 28 | |
| Patient satisfaction | |||
| Satisfied | 71 | 201 | <.001 |
| Dissatisfied | 49 | 44 | |
| Gender | |||
| Female | 103 | 216 | .39 |
| Male | 18 | 27 | |
| Current narcotic use | |||
| Use | 57 | 54 | <.001 |
| No use | 64 | 191 | |
| * Payment by health insurance for migraine medications | |||
| Sample size calculated for alpha=0.05 and power=1–beta=0.80. | |||
Limitations of this study
This study has several weaknesses, mainly the low response rate and potential biases in patient selection and participation. A headache survey mailed to 200 randomly selected patients in a single British general practice reported a response rate of 61%29and the American Migraine II Survey reported response rates of 59% to 69% of households.4 Considerations of patient confidentiality, cost, and burdening busy practices limited our ability to use many of the strategies recommended to increase response rate.30 The highest response rates were from those smaller practices where the office staff expressed most interest in the study.
Although ICD coding has shortcomings as a technique of identifying a study population, it is reported to be very accurate for specific conditions such as migraine and for patients with insurance.31,32 We did not include questions to verify that patients met International Headache Society (IHS) criteria for migraine33 because of concerns about the length of the survey and because a positive diagnosis of migraine by a family physician is reported to be likely accurate 98% of the time.20 Examining how the accuracy of diagnosis and the various subtypes of migraine impact treatment would be interesting additions to a future study.
For this study, we used 10 community practices—5 rural and 5 urban, and all associated with the Kansas Practice Research Network—to conduct an observational, cross-sectional study of adult patients who consulted family physicians because of migraine during 2002. The 5 rural practices served communities ranging from 835 to 6313 in population and were selected to represent the different geographic regions of the state. Similarly, the 5 urban practices represented different demographic areas within the city of Wichita (population 344,284).
Patients were identified by use of migraine-specific ICD-9 codes (all subgroups of ICD 9-346) for the consultation. The only exclusion was of patients aged less than 18 years. The 15-item written survey (FIGURE W1) gathered demographic data and incorporated the standardized Migraine Disability Assessment Score (MIDAS) questionnaire (FIGURE),21,22 as well as questions about migraine experience, medications, and satisfaction with treatment.
The MIDAS questionnaire is a simple 5-item written instrument (FIGURE) developed from more complex measures of headache and morbidity specifically to assess impact on daily activities. Its validity, reliability, and ease of use have been confirmed in population studies and busy clinical settings.21-23 The survey asked patients to name all medications (prescription, nonprescription, or other, including herbal remedies) usually used for migraine. In addition, a specific question addressed current or previous use of the triptans available at the time of the study—ie, naratriptan (Amerge), sumatriptan (Imitrex—injection, oral, or nasal spray), rizatriptan (Maxalt), zolmitriptan (Zomig), almotriptan (Axert), and frovatriptan (Frova). This question used both generic and trade names for the medication. Patients who reported previous but not current use of any triptan were asked to describe their reasons for discontinuation in their own words.
Patients received the survey by mail, along with a cover letter from their personal physicians inviting them to participate in the study and instructions to return the anonymous survey directly to the primary investigator. Patients were assured that neither their personal physicians nor the researchers could identify participants and that their ongoing medical care would not be altered in any way by their participation in the survey or by the information provided. The study was approved by the University of Kansas School of Medicine Institutional Review Board.
Data were entered into a Microsoft Access 2000 file and 2 data entry personnel performed data editing to verify each entry. Data were analyzed using Microsoft Excel. Analysis was completed using the statistical program SPSS for Windows V.11.0 (SPSS Inc, Chicago, Ill). The principal modes of data analysis included chi-square, Kruskal-Wallis, independent samples t-tests, and analysis of variance (ANOVA). A probability value of less than 0.05 was considered statistically significant.
Results
The 10 participating practices identified 992 patients aged 18 or older who consulted at least once during 2002 primarily for a migraine-related diagnosis. After 3 mailings, 447 surveys suitable for analysis were returned (a response rate of 45%). For individual practices, the number of patients surveyed ranged from 9 to 540, and the response rates were from27.5% to 72%. Responders did not differ from nonresponders in age or gender distribution.
The respondents were predominantly female (83%) with a mean age of 44 years (range, 18–82). Two thirds of the respondents had experienced migraine for more than 10 years, and most reported that migraine significantly impacted their lives. Sixty percent of patients scored 10 or more on the MIDAS scale, indicating moderate-severe migraine-related disability.
Most respondents (85.5%) had private insurance. Only 14% reported having no assistance with payment for migraine medications, and 58% reported that “all” or “most” of their migraine medications were paid by insurance plans. Seventy-three percent of respondents were “satisfied” or “very satisfied” with medical treatment for migraine and only 5% “very dissatisfied.”
Participants reported using a wide range of prescription and nonprescription medications. Overall, 366 (82%) patients reported experience with triptans. Of these patients, 206 (56%) had used more than 1 triptan. Current triptan use was reported by 245 (55%) of all respondents. Among the 121 patients who reported discontinuation of triptans, the most common reason provided was lack of efficacy (57%), followed by adverse effects (24%).
Statistically significant differences were found between patients who continued triptan therapy and those who discontinued in migraine disability (MIDAS scores), satisfaction with migraine treatment, and reported use of narcotic medication for migraine (TABLE). Patients who discontinued triptan therapy did not differ significantly from those who continued in age, gender, number of years with migraine, insurance type, use of prophylactic migraine medication or reported use of analgesics, combination medications, ergots, “other,” or “no” medications to treat migraine attacks.
Although surveys were returned directly to the researchers without identifying information and patients were assured that information would not be shared with participating physicians, the study design could have inhibited negative comments about medical care. Conversely, patients who were angry, upset, or disappointed about migraine care could have been motivated to complete the survey.34 Migraine patients who consult physicians are reported to have more severe migraine, more comorbidities, decreased quality of life, and to consult significantly more frequently for multiple medical conditions than other patients.35,36
FIGURE
The MIDAS questionnaire is valid, reliable, and easy to use
Acknowledgments
The authors acknowledge substantial assistance from Nolem Llong, Terry Ast, Nicole Rogers, and Mary Hursey in the conduct of the study and preparation of this manuscript and the assistance of the physicians of the Kansas Practice Research Network. The study was funded in part by the AAFP Practice Based Research Network Research Stimulation Grant.
CORRESPONDENCE
Anne Walling MB, ChB, FFPHM, University of Kansas School of Medicine–Wichita, Department of Family and Community Medicine, 1010 North Kansas, Wichita, KS 67214. E-mail: [email protected]
1. Nutting PA, Baier M, Werner JJ, Cutter G, Reed FM, Orzano AJ. Practice patterns of family physicians in practice-based research networks: a report from ASPN. J Am Board Fam Pract 1999;12:278-284.
2. Gibbs TS, Fleischer AB, Feldman SR, Sam MC, O’Donovan CA. Health care utilization in patients with migraine: demographics and patterns of care in the ambulatory setting. Headache 2003;43:330-335.
3. Lipton RB, Stewart WF, Diamond S, Diamond ML, Reed M. Prevalence and burden of migraine in the United States: data from the American migraine study II. Headache 2001;41:646-657.
4. Lipton RB, Scher AI, Kolodner K, Liberman J, Steiner TJ, Stewart WF. Migraine in the United States: Epidemiology and patterns of health care use. Neurology 2002;58:885-894.
5. Lipton RB, Diamond S, Reed M, Diamond M, Stewart WF. Migraine diagnosis and treatment: results from the American Migraine Study II. Headache 2001;41:638-645.
6. Maizels M. Model interventions to improve headache outcomes in health care systems. In Reducing the Burden of Headache, Olesen J, Steiner TJ, Lipton RB (eds). New York: Oxford University Press; 2003:290-301.
7. Bigal ME, Kolodner KB, Lafata JE, Leotta C, Lipton RB. Patterns of medical diagnosis and treatment of migraine and probable migraine in a health plan. Cephalalgia 2006;26:43-49.
8. Cady R, Dodrick DW. Diagnosis and treatment of migraine. Mayo Clin Proc 2002;77:255-261.
9. Lipton RB, Scher AI, Steiner TJ, et al. Patterns of health care utilization for migraine in England and in the United States Neurology 2003;60:441-448.
10. Loder EW, Lipton RB. Conclusion: how primary care physicians can help their patients with migraine. Am J Med 2005;118:45S-46S.
11. Loder EW, Sheftell F. The quality of headache treatment in the United States: review and analysis of recent data. Headache 2005;45:939-946.
12. Snow V, Weiss K, Wall EM, Mottur-Pilson C. Pharmacologic management of acute attacks of migraine and prevention of migraine headache. Ann Intern Med 2002;137:840-849.
13. Lipton RB, Cutrer FM, Goadsby PJ, et al. How treatment priorities influence triptan p in clinical practice: perspectives of migraine sufferers, neurologists, and primary care physicians. Curr Med Res Opin 2005;21:413-424.
14. Gallagher RM, Cutrer FM. Migraine: diagnosis, management, and new treatment options. Am J Man Care 2002;8:S58-S73.
15. Silberstein SD. Practice parameter: evidence-based guidelines for migraine headache (an evidence-based review). Report of the Quality Standards Subcommittee of the American Academy of Neurology. Neurology 2000;55:754-763.
16. Ferrari MD, Roon KI, Lipton RB, Goadsby PJ. Oral triptans (setotonin 5-HT1B/1D agonists) in acute migraine treatment: a meta-analysis of 53 trials. Lancet 2001;358:1668-1675.
17. Lohman JJHM, van der Kuy-de Ree MM. Patterns of specific antimigraine drug use—a study based on the records of 18 community pharmacies. Cephalalgia 2004;25:214-218.
18. Von Korff M, Black LK, Saunders K, Galer BS. Headache medication-use among primary care headache patients in a health maintenance organization. Cephalalgia 1999;19:575-580.
19. Available at: www.pozen.com/product/migraine.asppjbpubs.com/script_reports/migraine.htm.
20. Tepper SJ, Dahlof CG, Dowson A, et al. Prevalence and diagnosis of migraine in patients consulting their physician with a complaint of a headache: data from the Landmark Study. Headache 2004;44:856-864.
21. Stewart WF, Lipton RB, Kolodner K, Liberman J, Sawyer J. Reliability of the migraine disability assessment score in a population-based sample of headache sufferers. Cephalalgia 1000;19:107-114.
22. Stewart WF, Lipton RB, Kolodner KB, Sawyer J, Lee C, Liberman JN. Validity of the Migraine Disability Assessment Score in (MIDAS) n comparison to a diary-based measure in a population sample of migraine sufferers. Pain 2000;88:41-52.
23. Andrasik F, Lipchik GL, McCroy DC, Wittrock DA. Outcome measurement in behavioral headache research: headache parameters and psychosocial outcomes. Headache 2005;45:429-437.
24. Welch KMS, Mathew NT, Rosamond W, et al. Tolerability of sumatriptan: clinical trials and post-marketing experience. Cephalalgia 2000;20:687-695.
25. Robbins L. Triptans versus analgesics. Headache 2002;42:903-907.
26. Savini N, Martin A, Browning D. Switching patients with migraine from sumatriptan to other triptans increases primary care costs. Int J Clin Prac 2004;58:758-763.
27. Visser WH, de Vriend RHM, Jaspers NMWH, Ferrari MD. Sumatriptan in clinical practice: a 2-year review of 453 migraine patients. Neurology 1996;47:46-51.
28. Powers C, Szeto S, Pangtay D, Bort T, Cervi M, Cady R. Evaluation of migraineurs’ p for naratriptan over conventional first-line agents. Arch Fam Med 2000;9:753-757.
29. Boardman HF. Headaches in primary care: a pilot study. Cephalalgia 2000;20:364.-
30. Edwards P, Roberts I, Clarke M, et al. Increasing response rates to postal questionnaires: systematic review. BMJ 2002;324:1183-1193.
31. Chao J, Gillanders WG, Flocke SA, et al. Billing for physician services: a comparison of actual billing with CPT codes assigned by direct observation. J Fam Pract 1998;47:28-32.
32. Stange KC, Zyzanski SJ, Smith TF, et al. How valid are medical records and patient questionnaires for physician profiling and health services research? A comparison of direct observation of patients visits. Med Care 1998;36:851-857.
33. Headache Classification Subcommittee of the International Headache Society The international classification of headache disorders 2nd ed. Cephalalgia 2004;24:S1-S150.
34. Scott A, Smith RD. Keeping the customer satisfied: issues in the interpretation and use of patient satisfaction surveys. Int J Qual Health Care 1994;6:353-359.
35. Linet MS, Celentano DC, Stewart WF. Headache characteristics associated with physician consultation: a population-based survey. Am J Prevent Med 1991;7:40-46.
36. Lafata JE, Moon C, Leotta C, Kolodner K, Poisson L, Lipton RB. The medical care utilization and costs associated with migraine headache. J Gen Intern Med 2004;19:1005-1012.
- While continuing to improve recognition of migraine in your patient population, pay particular attention to the adherence rate among those for whom you have prescribed a triptan.
- Ask patients who discontinue triptan therapy why they made that decision. Besides adverse effects from the agent, reasons may include medication cost, influence of comorbidities, or triptan interaction with medications you may not have known about.
Despite more than 5 million consultations annually, relatively little is known about the treatment of migraine in primary care. Much of the literature is projected from population surveys or reports concerning patients referred for specialist care or those entering treatment studies.
Our study is the largest reported to gather data directly from patients treated for migraine in family practice. The participating practices represent a spectrum of communities and practice types. As minimal differences exist in practice patterns between family physicians who participate in research networks and all family physicians1, these findings may more accurately reflect the current status in family practice than other studies.
We believe that this study indicates family physicians offer triptans to most patients consulting specifically for migraine and that adherence issues contribute significantly to the perceived low rates of use of these medications in primary care. In recent years, considerable effort has gone into increasing the diagnosis of migraine and promoting the more extensive use of triptans in primary care patients (see article on page 1038 in this issue). Family physicians must certainly continue to improve the recognition of migraine; but attention to patient concerns about triptans and efforts to enhance adherence and appropriate use of these medications is obviously essential. We must continue efforts to better understand why some 30% or more of migraine patients in primary care practice discontinue a therapy that has been found to be highly effective and well accepted by patients in clinical studies.
Migraine-specific prescribing in primary care is better than commonly reported
Between 1990 and 1998, the number of physician office visits for migraine doubled to more than 5 million per year.2 Of the more than 28 million US adults with migraine, approximately 70% of women and 50% of men are now believed to have consulted a physician at least once,3 and two thirds of these patients have made 5 or more physician visits for migraine.4 More than 72% of migraine-related physician visits are to primary care physicians, the most to family physicians.1
Nevertheless, the headache literature routinely describes migraine as “undertreated” in primary care.5-7 In particular, primary care physicians are perceived to under-prescribe triptans,7-11 the most effective migraine-specific medications available, widely regarded as “the gold standard” for acute migraine therapy of all but mild attacks.12-16 Population surveys estimate that only some 13% to 20% of migraine sufferers have been prescribed triptans.4,5,9,17 A 1995 study of migraine patients enrolled in a health maintenance organization reported that 11.4% used subcutaneous sumatriptan; however, oral triptans were not included in the study.18 Ten years later, another study of health plan enrollees estimated that only 11% of those meeting strict criteria for migraine were prescribed triptans or ergots.7
These low percentages do not correlate with our experience of primary care practice nor with data indicating substantial sales of triptans in the US.19 As we have not identified any studies that directly address prescribing by primary care physicians for migraine, we conducted a survey of patients who consulted family physicians for migraine during 2002.
Some of the differences between our findings and those based on prescription data could be attributed to the use of samples (reported to be particularly common in migraine treatment during this period), or difficulties in patient recall of medications.
Diagnosis of migraine not always coded. A more significant source of difference between our findings and those of population-based surveys is in the diagnosis of migraine. Most surveys use patient-reported symptoms for diagnosis, and hence the population of migraine sufferers includes those who have not had a physician visit coded for migraine. Our interest is in the primary care consultation specifically for migraine.
If a physician concludes a patient has migraine, this diagnosis is highly likely to be correct,20 and our findings indicate that a migraine-specific medication is commonly offered. We strongly support ongoing efforts to improve the recognition of migraine by all physicians and emphasize that our results are based only on patients identified by migraine-coded primary care visits.
Why do patients discontinue triptans?
The finding that about one third of patients discontinued triptan use may be surprising in view of the widely reported efficacy16 and tolerability24 of these medications, but this is almost identical to the results of a study of 663 patients of a US headache clinic.25 Significant rates of triptan discontinuation have been reported by other studies.
A study based on British general practice pharmacy records reported 55% of patients not renewing a triptan prescription during 1 year of follow-up,26 and an older study of patients attending a Dutch neurology clinic found that 25% of sumatriptan users discontinued this drug over a 2-year period.27 One US primary care treatment study found that on enrollment, 62% of 143 migraine patients had previously used triptans or ergotamines but had discontinued therapy.28
As in our study, the principal stated reason for discontinuation in the Dutch study27 was lack of efficacy. Conversely, in the US primary care study only 13% of patients gave lack of efficacy as the principal reason for discontinuation but 20% cited cost and 55% cited nonprescribing by physicians.28
As shown in the TABLE, the most striking differences between patients who discontinued triptans and those who continued were in patient satisfaction with treatment and current use of narcotic medication for migraine, but the higher grades of MIDAS scores (FIGURE) were also significantly more common in the patients who discontinued.
This study was not designed to assess if these factors caused or resulted from triptan discontinuation, but the association of triptan “failure” with 3 other significant negative factors could indicate subgroups of patients with especially high morbidity from migraine or risk of poor response to migraine-specific treatment. Future studies are needed to better characterize patients who discontinue, especially to examine the roles of comorbidities, total medication use, and the role of subspecialty referral.
TABLE
Differences between patients who discontinued triptans and those who continued
| DISCONTINUERS | CONTINUERS | P VALUE | |
|---|---|---|---|
| Disability (MIDAS score) | |||
| Grade I or II | 34 | 98 | .034 |
| Grade III or IV | 86 | 145 | |
| Medication coverage* | |||
| All or some | 106 | 216 | .904 |
| None | 14 | 28 | |
| Patient satisfaction | |||
| Satisfied | 71 | 201 | <.001 |
| Dissatisfied | 49 | 44 | |
| Gender | |||
| Female | 103 | 216 | .39 |
| Male | 18 | 27 | |
| Current narcotic use | |||
| Use | 57 | 54 | <.001 |
| No use | 64 | 191 | |
| * Payment by health insurance for migraine medications | |||
| Sample size calculated for alpha=0.05 and power=1–beta=0.80. | |||
Limitations of this study
This study has several weaknesses, mainly the low response rate and potential biases in patient selection and participation. A headache survey mailed to 200 randomly selected patients in a single British general practice reported a response rate of 61%29and the American Migraine II Survey reported response rates of 59% to 69% of households.4 Considerations of patient confidentiality, cost, and burdening busy practices limited our ability to use many of the strategies recommended to increase response rate.30 The highest response rates were from those smaller practices where the office staff expressed most interest in the study.
Although ICD coding has shortcomings as a technique of identifying a study population, it is reported to be very accurate for specific conditions such as migraine and for patients with insurance.31,32 We did not include questions to verify that patients met International Headache Society (IHS) criteria for migraine33 because of concerns about the length of the survey and because a positive diagnosis of migraine by a family physician is reported to be likely accurate 98% of the time.20 Examining how the accuracy of diagnosis and the various subtypes of migraine impact treatment would be interesting additions to a future study.
For this study, we used 10 community practices—5 rural and 5 urban, and all associated with the Kansas Practice Research Network—to conduct an observational, cross-sectional study of adult patients who consulted family physicians because of migraine during 2002. The 5 rural practices served communities ranging from 835 to 6313 in population and were selected to represent the different geographic regions of the state. Similarly, the 5 urban practices represented different demographic areas within the city of Wichita (population 344,284).
Patients were identified by use of migraine-specific ICD-9 codes (all subgroups of ICD 9-346) for the consultation. The only exclusion was of patients aged less than 18 years. The 15-item written survey (FIGURE W1) gathered demographic data and incorporated the standardized Migraine Disability Assessment Score (MIDAS) questionnaire (FIGURE),21,22 as well as questions about migraine experience, medications, and satisfaction with treatment.
The MIDAS questionnaire is a simple 5-item written instrument (FIGURE) developed from more complex measures of headache and morbidity specifically to assess impact on daily activities. Its validity, reliability, and ease of use have been confirmed in population studies and busy clinical settings.21-23 The survey asked patients to name all medications (prescription, nonprescription, or other, including herbal remedies) usually used for migraine. In addition, a specific question addressed current or previous use of the triptans available at the time of the study—ie, naratriptan (Amerge), sumatriptan (Imitrex—injection, oral, or nasal spray), rizatriptan (Maxalt), zolmitriptan (Zomig), almotriptan (Axert), and frovatriptan (Frova). This question used both generic and trade names for the medication. Patients who reported previous but not current use of any triptan were asked to describe their reasons for discontinuation in their own words.
Patients received the survey by mail, along with a cover letter from their personal physicians inviting them to participate in the study and instructions to return the anonymous survey directly to the primary investigator. Patients were assured that neither their personal physicians nor the researchers could identify participants and that their ongoing medical care would not be altered in any way by their participation in the survey or by the information provided. The study was approved by the University of Kansas School of Medicine Institutional Review Board.
Data were entered into a Microsoft Access 2000 file and 2 data entry personnel performed data editing to verify each entry. Data were analyzed using Microsoft Excel. Analysis was completed using the statistical program SPSS for Windows V.11.0 (SPSS Inc, Chicago, Ill). The principal modes of data analysis included chi-square, Kruskal-Wallis, independent samples t-tests, and analysis of variance (ANOVA). A probability value of less than 0.05 was considered statistically significant.
Results
The 10 participating practices identified 992 patients aged 18 or older who consulted at least once during 2002 primarily for a migraine-related diagnosis. After 3 mailings, 447 surveys suitable for analysis were returned (a response rate of 45%). For individual practices, the number of patients surveyed ranged from 9 to 540, and the response rates were from27.5% to 72%. Responders did not differ from nonresponders in age or gender distribution.
The respondents were predominantly female (83%) with a mean age of 44 years (range, 18–82). Two thirds of the respondents had experienced migraine for more than 10 years, and most reported that migraine significantly impacted their lives. Sixty percent of patients scored 10 or more on the MIDAS scale, indicating moderate-severe migraine-related disability.
Most respondents (85.5%) had private insurance. Only 14% reported having no assistance with payment for migraine medications, and 58% reported that “all” or “most” of their migraine medications were paid by insurance plans. Seventy-three percent of respondents were “satisfied” or “very satisfied” with medical treatment for migraine and only 5% “very dissatisfied.”
Participants reported using a wide range of prescription and nonprescription medications. Overall, 366 (82%) patients reported experience with triptans. Of these patients, 206 (56%) had used more than 1 triptan. Current triptan use was reported by 245 (55%) of all respondents. Among the 121 patients who reported discontinuation of triptans, the most common reason provided was lack of efficacy (57%), followed by adverse effects (24%).
Statistically significant differences were found between patients who continued triptan therapy and those who discontinued in migraine disability (MIDAS scores), satisfaction with migraine treatment, and reported use of narcotic medication for migraine (TABLE). Patients who discontinued triptan therapy did not differ significantly from those who continued in age, gender, number of years with migraine, insurance type, use of prophylactic migraine medication or reported use of analgesics, combination medications, ergots, “other,” or “no” medications to treat migraine attacks.
Although surveys were returned directly to the researchers without identifying information and patients were assured that information would not be shared with participating physicians, the study design could have inhibited negative comments about medical care. Conversely, patients who were angry, upset, or disappointed about migraine care could have been motivated to complete the survey.34 Migraine patients who consult physicians are reported to have more severe migraine, more comorbidities, decreased quality of life, and to consult significantly more frequently for multiple medical conditions than other patients.35,36
FIGURE
The MIDAS questionnaire is valid, reliable, and easy to use
Acknowledgments
The authors acknowledge substantial assistance from Nolem Llong, Terry Ast, Nicole Rogers, and Mary Hursey in the conduct of the study and preparation of this manuscript and the assistance of the physicians of the Kansas Practice Research Network. The study was funded in part by the AAFP Practice Based Research Network Research Stimulation Grant.
CORRESPONDENCE
Anne Walling MB, ChB, FFPHM, University of Kansas School of Medicine–Wichita, Department of Family and Community Medicine, 1010 North Kansas, Wichita, KS 67214. E-mail: [email protected]
1. Nutting PA, Baier M, Werner JJ, Cutter G, Reed FM, Orzano AJ. Practice patterns of family physicians in practice-based research networks: a report from ASPN. J Am Board Fam Pract 1999;12:278-284.
2. Gibbs TS, Fleischer AB, Feldman SR, Sam MC, O’Donovan CA. Health care utilization in patients with migraine: demographics and patterns of care in the ambulatory setting. Headache 2003;43:330-335.
3. Lipton RB, Stewart WF, Diamond S, Diamond ML, Reed M. Prevalence and burden of migraine in the United States: data from the American migraine study II. Headache 2001;41:646-657.
4. Lipton RB, Scher AI, Kolodner K, Liberman J, Steiner TJ, Stewart WF. Migraine in the United States: Epidemiology and patterns of health care use. Neurology 2002;58:885-894.
5. Lipton RB, Diamond S, Reed M, Diamond M, Stewart WF. Migraine diagnosis and treatment: results from the American Migraine Study II. Headache 2001;41:638-645.
6. Maizels M. Model interventions to improve headache outcomes in health care systems. In Reducing the Burden of Headache, Olesen J, Steiner TJ, Lipton RB (eds). New York: Oxford University Press; 2003:290-301.
7. Bigal ME, Kolodner KB, Lafata JE, Leotta C, Lipton RB. Patterns of medical diagnosis and treatment of migraine and probable migraine in a health plan. Cephalalgia 2006;26:43-49.
8. Cady R, Dodrick DW. Diagnosis and treatment of migraine. Mayo Clin Proc 2002;77:255-261.
9. Lipton RB, Scher AI, Steiner TJ, et al. Patterns of health care utilization for migraine in England and in the United States Neurology 2003;60:441-448.
10. Loder EW, Lipton RB. Conclusion: how primary care physicians can help their patients with migraine. Am J Med 2005;118:45S-46S.
11. Loder EW, Sheftell F. The quality of headache treatment in the United States: review and analysis of recent data. Headache 2005;45:939-946.
12. Snow V, Weiss K, Wall EM, Mottur-Pilson C. Pharmacologic management of acute attacks of migraine and prevention of migraine headache. Ann Intern Med 2002;137:840-849.
13. Lipton RB, Cutrer FM, Goadsby PJ, et al. How treatment priorities influence triptan p in clinical practice: perspectives of migraine sufferers, neurologists, and primary care physicians. Curr Med Res Opin 2005;21:413-424.
14. Gallagher RM, Cutrer FM. Migraine: diagnosis, management, and new treatment options. Am J Man Care 2002;8:S58-S73.
15. Silberstein SD. Practice parameter: evidence-based guidelines for migraine headache (an evidence-based review). Report of the Quality Standards Subcommittee of the American Academy of Neurology. Neurology 2000;55:754-763.
16. Ferrari MD, Roon KI, Lipton RB, Goadsby PJ. Oral triptans (setotonin 5-HT1B/1D agonists) in acute migraine treatment: a meta-analysis of 53 trials. Lancet 2001;358:1668-1675.
17. Lohman JJHM, van der Kuy-de Ree MM. Patterns of specific antimigraine drug use—a study based on the records of 18 community pharmacies. Cephalalgia 2004;25:214-218.
18. Von Korff M, Black LK, Saunders K, Galer BS. Headache medication-use among primary care headache patients in a health maintenance organization. Cephalalgia 1999;19:575-580.
19. Available at: www.pozen.com/product/migraine.asppjbpubs.com/script_reports/migraine.htm.
20. Tepper SJ, Dahlof CG, Dowson A, et al. Prevalence and diagnosis of migraine in patients consulting their physician with a complaint of a headache: data from the Landmark Study. Headache 2004;44:856-864.
21. Stewart WF, Lipton RB, Kolodner K, Liberman J, Sawyer J. Reliability of the migraine disability assessment score in a population-based sample of headache sufferers. Cephalalgia 1000;19:107-114.
22. Stewart WF, Lipton RB, Kolodner KB, Sawyer J, Lee C, Liberman JN. Validity of the Migraine Disability Assessment Score in (MIDAS) n comparison to a diary-based measure in a population sample of migraine sufferers. Pain 2000;88:41-52.
23. Andrasik F, Lipchik GL, McCroy DC, Wittrock DA. Outcome measurement in behavioral headache research: headache parameters and psychosocial outcomes. Headache 2005;45:429-437.
24. Welch KMS, Mathew NT, Rosamond W, et al. Tolerability of sumatriptan: clinical trials and post-marketing experience. Cephalalgia 2000;20:687-695.
25. Robbins L. Triptans versus analgesics. Headache 2002;42:903-907.
26. Savini N, Martin A, Browning D. Switching patients with migraine from sumatriptan to other triptans increases primary care costs. Int J Clin Prac 2004;58:758-763.
27. Visser WH, de Vriend RHM, Jaspers NMWH, Ferrari MD. Sumatriptan in clinical practice: a 2-year review of 453 migraine patients. Neurology 1996;47:46-51.
28. Powers C, Szeto S, Pangtay D, Bort T, Cervi M, Cady R. Evaluation of migraineurs’ p for naratriptan over conventional first-line agents. Arch Fam Med 2000;9:753-757.
29. Boardman HF. Headaches in primary care: a pilot study. Cephalalgia 2000;20:364.-
30. Edwards P, Roberts I, Clarke M, et al. Increasing response rates to postal questionnaires: systematic review. BMJ 2002;324:1183-1193.
31. Chao J, Gillanders WG, Flocke SA, et al. Billing for physician services: a comparison of actual billing with CPT codes assigned by direct observation. J Fam Pract 1998;47:28-32.
32. Stange KC, Zyzanski SJ, Smith TF, et al. How valid are medical records and patient questionnaires for physician profiling and health services research? A comparison of direct observation of patients visits. Med Care 1998;36:851-857.
33. Headache Classification Subcommittee of the International Headache Society The international classification of headache disorders 2nd ed. Cephalalgia 2004;24:S1-S150.
34. Scott A, Smith RD. Keeping the customer satisfied: issues in the interpretation and use of patient satisfaction surveys. Int J Qual Health Care 1994;6:353-359.
35. Linet MS, Celentano DC, Stewart WF. Headache characteristics associated with physician consultation: a population-based survey. Am J Prevent Med 1991;7:40-46.
36. Lafata JE, Moon C, Leotta C, Kolodner K, Poisson L, Lipton RB. The medical care utilization and costs associated with migraine headache. J Gen Intern Med 2004;19:1005-1012.
Migraine: A better way to recognize and treat it
- Consider using the Headache Assessment Quiz, which 76% of providers in this study said enabled patients to adequately convey headache severity/symptoms, compared with just 20% of providers at baseline who thought patients communicated clearly.
- Use the quiz also to better understand the impact of migraine on a patient’s life, and to help determine which patients need migraine-specific therapy.
Up to 25% of patients in a typical primary care practice could be afflicted with migraine, and many of them simply do not report their headaches. Their silence does not necessarily imply adequate control with self-medication. Other concerns may command their attention, or inadequate communication may mask the issue. Whatever the reason, too few of them receive migraine-specific medications and proper instruction on avoiding headache triggers that could relieve the well-known burden of this disorder. Our study verifies the success of a program for screening—including a Headache Assessment Quiz—and treating migraine that also eases the burden of management for you.
For more original research on the treatment of migraines, see “Do family physicians fail to provide triptans for patients with migraine?”
We begin with a summary of our findings, and then give a detailed account of our study methods and results.
How many patients are slipping through the cracks?
Nearly half of all persons with migraine in the United States have not received a diagnosis for their disorder.1 Many of them suffer substantial functional impairment in daily activities and, thus, a diminished quality of life.
What’s to blame for this underdiagnosis? Perhaps a person’s failure to consult a physician for headache, poor patient-physician communication, comorbid conditions that obscure the presence or significance of headache, or a lack of time and resources devoted to detecting and managing migraine in the health care setting.2-5 In 2 recent studies conducted mainly in primary care settings, the frequency of unrecognized migraine among patients consulting for headache ranged from 48% to 60%.6,7
Even when migraine is recognized, quality of care is often suboptimal. In 1999, only 4 of 10 US migraineurs used prescription medication for migraine.6 In a recently published study that used 2002–2003 retrospective data from more than 30 managed care organizations, 50% of patients with a migraine diagnosis who had prescription drug coverage filled a prescription for a medication commonly used to treat migraine.8
We need a reliable system for migraine detection and management.
Migraine Care Program proves its worth
The Migraine Care Program (at www.migrainecareprogram.com) is a disease-management program employing educational materials and clinical assessment tools to help health care providers and patients improve awareness and recognition of migraine and the quality of care received by migraine sufferers. Components of the program:
- Informational modules on migraine epidemiology, pathophysiology, diagnosis, triggers, impact, and treatment
- Headache diary for patients
- Action plan for patients to complete with their health care providers
- Information for patients on effectively communicating with their health care providers about headache
- 10-question Headache Assessment Quiz and its supplement, which screen for the presence of migraine (FIGURE 1)
- 6-item Headache Impact Test (HIT-6) (FIGURE 2), a reliable, valid measure of the impact of headache on patients’ lives.9
This article reports the results of a prospective, two-phase study undertaken to assess (Phase 1) the utility of the Headache Assessment Quiz in facilitating recognition of migraine; and (Phase 2) the usefulness of the Migraine Care Program from the perspectives of both primary care providers and their patients. The study is unique in being one of a few to assess the effectiveness of a disease management program in improving patient outcomes or influencing physician’s behavior.
FIGURE 1
Headache Assessment Quiz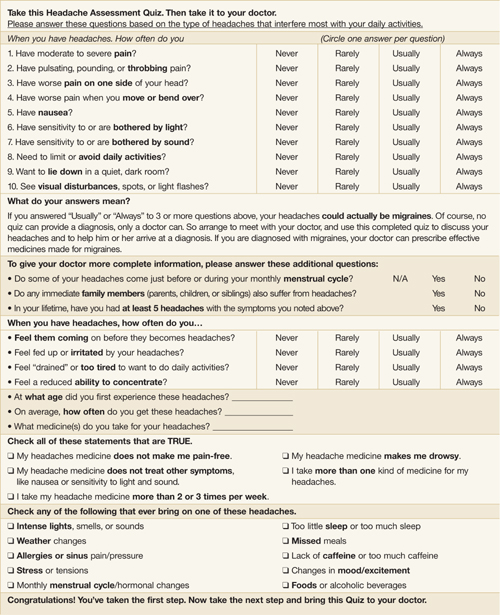
FIGURE 2
Headache Impact Test: HIT-6 (version 1.0)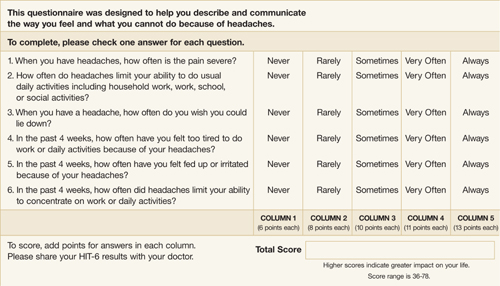
How we measured success
In our study, primary care providers using the Migraine Care Program’s Headache Assessment Quiz as a screening tool diagnosed migraine in 25% of 4443 patients. That 1 in 4 patients consulting these primary care clinics for any reason had migraine is consistent with the estimated prevalence of migraine in the general population.1 More than half (52%) of those given a clinical diagnosis of migraine in this study had not previously received the diagnosis, which is also consistent with previous figures on unrecognized migraine.1,6,7 This pattern of results suggests that provider education and use of the Headache Assessment Quiz facilitated recognition of migraine in this sample.
Providers said the Headache Assessment Quiz improved management decisions. Three of 4 (74%) patients who tested positive for migraine on the Headache Assessment Quiz were subsequently given a clinical diagnosis of migraine after further evaluation by the primary care provider. Providers’ ratings of the Headache Assessment Quiz indicate the tool proved useful in multiple aspects of migraine care: understanding headache severity and impact, facilitating treatment decisions, and identifying patients requiring treatment. By the end of the study, providers found headache patients less difficult to assess and manage than before.
Clear benefits to patients. For 42% of patients with migraine, providers adjusted the pre-study medication regimens—most often by adding a migraine-specific triptan. On post-study surveys, significantly more patients said they were satisfied or very satisfied with the effectiveness of medication and with the overall quality of migraine care compared with the beginning of the study. The impact of headache on patients’ lives as determined from HIT-6 scores was less at the end of the study compared with the beginning.
A subgroup analysis among Phase 2 patients confirmed the value of the program. Phase 2 patients reporting no pre-study diagnosis of migraine were significantly less satisfied with care and medication at baseline than patients reporting a pre-study migraine diagnosis—even though patients reporting no pre-study diagnosis had less severe migraine at baseline. Patients with previously unrecognized migraine responded well to care in our study. Though satisfaction increased and headache impact decreased from baseline to the end of Phase 2 for both sets of patients, improvement was greater for those without a prior diagnosis.
Migraine affects 18% of women and 7% of men in the United States.1 A large body of research conducted over the past decade contradicts the historical conception of migraine as a trivial illness and has established it as a disabling condition warranting aggressive management.10-13 Concurrently, understanding of the pathophysiology of migraine has evolved; and new, migraine-specific treatments that can relieve pain and restore patients’ functional ability have been introduced.14,15 Despite these advances, several barriers to optimizing migraine care remain. Perhaps the most significant obstacle to effective migraine care, failure to recognize and diagnose migraine occurs alarmingly often.2,6,7,16,17 In a 1999 US population-based survey, less than half (48%) of those meeting International Headache Society (IHS) diagnostic criteria for migraine reported having received a physician diagnosis of migraine.1 Frequency of physician diagnosis of migraine in 1999 did not increase appreciably from diagnosis rates in 1989 although consultations for headache tripled over the 10-year period. Underrecognition and suboptimal management of migraine may be particularly problematic in the primary care setting, where the majority of migraine sufferers consult.
The suboptimal nature of migraine care is also reflected in patients’ assessments of medical care. In a recent study of patients with primary headache diagnoses in three geographically diverse primary care institutions in the United States, 1 of 4 patients with severe headaches reported dissatisfaction with their headache care; and 3 of 4 reported moderate or severe problems with headache management.18
Limitations of the study. First, patients were enrolled only if they agreed to complete the Headache Assessment Quiz. Thus, regarding characteristics relevant to study assessments, selection bias may have occurred if patients who agreed to take the quiz differed systematically from those who did not.
Second, attrition during Phase 2—though relatively low for a naturalistic study that, unlike a clinical trial, did not use incentives such as provision of study medication—might have biased the results of patient assessments at the end of the study. Attrition could have inflated the patient-satisfaction and other end-of-study ratings of medication and migraine care if dissatisfied patients were more likely to withdraw prematurely from the study than were satisfied patients.
Third, the study lacked a control group because of the difficulty in blinding investigators in a naturalistic study.
Strengths of the study. Among several disease management programs for migraine, the Migraine Care Program is unique in being one of the few whose effects on migraine care have been assessed. In this study, application of the Migraine Care Program was evaluated in the “real-world” clinical setting and as used by providers (physicians, nurse practitioners, physician assistants) typically responsible for headache care in primary care centers across the US. These characteristics enhance the probability that the results reflect those achievable in actual clinical practice. The comprehensive nature of the study assessments, which involved both primary care providers and patients, supports the benefits of the program.
Methods
This prospective, observational study had 2 phases. During Phase 1, primary care providers were introduced to the Migraine Care Program, and they administered the Headache Assessment Quiz to consulting patients who agreed to complete it. During Phase 2, a subset of patients who screened positive for migraine on the Headache Assessment Quiz in Phase 1 and whose migraine diagnosis was confirmed by their primary care provider received 12 weeks of additional treatment for migraine under the care of that primary care provider.
Participants
Study participants included both primary care providers and their patients. Eligible health care providers included physicians, nurse practitioners, and physician assistants responsible for performing headache assessments in US primary care practices that did not routinely use a questionnaire to screen headache patients prior to the study.
Eligible patients for Phase 1 were the first 100 consecutive 18- to 65-year-old patients in each practice who agreed to complete the Headache Assessment Quiz. Patients were eligible for Phase 1 regardless of whether they were consulting for headache. Patients from Phase 1 were eligible for Phase 2 if they screened positive for migraine on the Headache Assessment Quiz, had a confirmed clinical diagnosis of migraine meeting IHS criteria 1.1 or 1.2,19 and were willing to remain under the care of the study investigator and to treat headaches with therapy recommended by that investigator for 12 weeks.
Procedures
Phase 1
Primary care providers completed an Accreditation Council for Continuing Medical Education-accredited educational program consisting of a 38-minute DVD on migraine diagnosis and screening. After they completed the educational program, health care providers administered the Headache Assessment Quiz and HIT-6 to a target of 100 consecutively consulting patients regardless of patients’ reason for consulting. For patients who screened positive for migraine on the Headache Assessment Quiz, primary care providers recorded whether or not in their clinical judgment they confirmed a diagnosis of migraine by IHS criteria19 and whether or not patients reported, in response to a question, that they had received a migraine diagnosis from a health care professional before the study.
Phase 2
Primary care providers were asked to recruit up to 10 Phase-1 patients with a confirmed clinical diagnosis of migraine for Phase 2 of the study. At least half of the patients recruited in each practice were to have received their first clinical diagnosis of migraine during the study. All patients provided written, informed consent to participate in Phase 2.
At the beginning of Phase 2, eligible patients received Migraine Care Program educational materials including a migraine diary and a pamphlet about the causes, triggers, symptoms of migraine, and migraine types. They received migraine care for the ensuing 12 weeks under the supervision of the investigator. Investigators could prescribe any pharmacological or nonpharmacological migraine treatment to patients at their discretion.
Measures
In questionnaires administered at the beginning of the study before they initiated the Migraine Care Program (baseline) and again at the end of Phase 2, primary care providers rated the difficulty of assessing and treating patients with headache (0 = not at all difficult; 10 = extremely difficult), the importance of understanding the impact of headaches on a patient’s life when making treatment decisions (on a 7-point Likert scale ranging from very important to very unimportant), and their satisfaction (on a 7-point Likert scale ranging from very satisfied to very dissatisfied) with how well patients describe their headache severity and how well patients describe the physical, emotional, and financial impact of headaches.
For the questions on patient communication about headaches, providers were instructed to respond with respect to their general experience with patients for the baseline questionnaire and with respect to their experience with patients in Phase 2 of the study for the end-of-study questionnaire. The end-of-study questionnaire also contained items on which primary care providers rated satisfaction with the use of the Headache Assessment Quiz to facilitate (a) understanding of the impact of headaches on patients’ lives; (b) treatment decisions; and (c) identification of headache patients requiring better treatment and indicated whether or not they would recommend the Headache Assessment Quiz for use in clinical practice.
In questionnaires administered at the beginning of Phase 2 and again at the end of the study, patients who participated in Phase 2 rated their satisfaction (on a 7-point Likert scale ranging from very satisfied to very dissatisfied) with the medication used to treat migraine headaches and with the quality of medical care received for migraine. In addition, patients rated the bothersomeness of side effects of medication used to treat migraine headaches (on a 5-point categorical scale ranging from not at all to extremely). At the beginning of Phase 2, patients listed the medications they had used during the 3 months before the study to treat headaches. HIT-6, which was first administered at study entry, was also administered at the end of Phase 2.
Responses to the primary care provider and patient questionnaires were summarized with descriptive statistics. The Wilcoxon Signed Ranks Test was used to compare differences between baseline and the end of the study in the distribution of percentages of respondents to each question on satisfaction, bothersomeness, and importance; in median primary care provider ratings of difficulty of assessing and treating headache patients; and in distribution of HIT-6 scores (<50 = little to no impact of headache; 50–55 = some impact; 56–59 = substantial impact; ≥60 = severe impact).
In a subgroup analysis, baseline characteristics and end-of-study assessments were summarized separately for Phase 2 patients who reported a pre-study diagnosis of migraine and those who reported no pre-study diagnosis of migraine. Differences between subgroups were compared with chi-square tests as appropriate.
Results
Phase 1 participants
Forty-nine primary care providers (physicians, nurse practitioners, and physician assistants) participated in the Migraine Care Program (TABLE 1). Providers’ mean age was 44 years (SD=8.28). The majority (86%) were in group practice. The number of patients recruited to complete the Headache Assessment Quiz during Phase 1 of the study was 4443.
TABLE 1
Characteristics of study participants
| PRIMARY CARE PROVIDERS | |
| N | 49 |
| Type of provider, % | |
| Physician | 84 |
| Nurse practitioner | 100 |
| Physician assistant | 6 |
| Mean age, years (SD) | 44 (8.3) |
| Female, % | 33 |
| Practice type, % | |
| Group | 86 |
| Private | 14 |
| PATIENTS: PHASE 2 | |
| N | 470 |
| Mean age, years (SD) | 41 (11.9) |
| Female, % | 77 |
| Race, % | |
| White | 85 |
| Black | 6 |
| Hispanic | 6 |
| Other | 2† |
| Medications used for headache during the 3 months before the study,* % | |
| Over-the-counter medications | 70 |
| Triptans | 19 |
| Prescription NSAIDs | 14 |
| Combination analgesic | 9 |
| Narcotics | 5 |
| *Patients could list more than one medication. | |
| †Does not add to 100% because patients could have taken multiple medications. | |
Migraine diagnosis during Phase 1
Of the 4443 patients who completed the Headache Assessment Quiz in Phase 1, 1527 (34%) screened positive for migraine. Of these 1527 patients who screened positive for migraine, 1126 (74% of the 1527 patients screening positive for migraine) had their diagnosis confirmed during further evaluation by their primary care provider (FIGURE 3). More than half (52%) of the 1126 patients with a confirmed migraine diagnosis reported that they had not received a health care professional’s diagnosis of migraine prior to the study.
The proportion of patients with migraine as confirmed by a clinical migraine diagnosis was 25% (1126/4443) in the sample as a whole, which included all patients who had consulted these primary care practices for any reason and who had agreed to complete the Headache Assessment Quiz.
FIGURE 3
Prevalence of migraine among patients who consulted primary care providers for any reason and who agreed to complete the Headache Assessment Quiz
PCP’s perceptions of headache management before and after participation in the program
Primary care providers’ participation in the Migraine Care Program was associated with an increase in awareness of headache impact. At the end of Phase 2 compared with the beginning of the study, significantly more providers rated understanding headache impact as being important or very important in treatment decisions (87% vs 74%; P<.05) (TABLE 2).
Primary care providers’ participation in the Migraine Care Program was also associated with a perceived reduction in the challenges of providing headache care. At the end of Phase 2 compared with the beginning of the study, primary care providers reported assessing and treating headache to be significantly less difficult (median score = 6 at baseline and 3 at the end of the study; P<.001) (TABLE 2).
This improvement was accompanied by the perception of better patient communication about headaches: the proportions of primary care providers indicating that they were satisfied or very satisfied with patients’ descriptions of headache severity/symptoms and headache impact were significantly higher for patients they treated in Phase 2 than for headache patients they had treated prior to the study (76% vs 20% for severity/symptoms; 67% vs 27% for headache impact; P<.001 for both comparisons) (FIGURE 4).
The majority of providers indicated that they were satisfied or very satisfied with the use of the Headache Assessment Quiz as a tool for each of the dimensions assessed: understanding headache severity (88%), understanding headache impact (78%), making treatment decisions (71%), and identifying patients requiring treatment (86%) (FIGURE 4). Nearly all providers (96%) indicated that they would recommend the Headache Assessment Quiz for use in clinical practice (TABLE 2).
TABLE 2
Primary care providers’ perceptions of headache management at baseline and at the end of the study after participating in the Migraine Care Program
| BASELINE | END OF STUDY | |
| Knowledge of headache impact is important/very important in making decisions about treatment, % | 74 | 87* |
| Difficulty in headache assessment, median score† (range) | 6 (2–8) | 3‡ (1–7) |
| Would recommend the Headache Assessment Quiz for use in clinical practice, % | NA | 96 |
| *P<.05 vs baseline. | ||
| †Difficulty was scored on an 11-point scale ranging from 0 (not at all difficult) to 10 (extremely difficult). | ||
| ‡P<.001 vs baseline. | ||
FIGURE 4
Percentages of primary care providers who were satisfied/very satisfied with patient communication and the use of the Headache Assessment Quiz
Patients’ perceptions of headache care by PCPs participating in the Migraine Care Program
Phase 2 sample. The number of patients who participated in Phase 2 was 470 (TABLE 1). Mean age of patients in the Phase 2 sample was 41 years (SD=11.9). The majority of patients were white (85%) and were women (77%).
Medications
Among the 470 patients with a confirmed diagnosis of migraine who participated in Phase 2, the most common medications used to treat headaches during the 3 months prior to the study were over-the-counter medications (70% of patients) (TABLE 1). Fewer than one in five patients (19%) reported treating their pre-study headaches with migraine-specific triptan therapy.
At the beginning of Phase 2, primary care providers changed the headache medication regimen of 197 of these patients (42%). Of the 205 total changes to medication regimens, 72% involved adding a triptan; 10% involved adding other medications; 11% involved discontinuation of a medication; and 7% involved dose adjustment.
The changes to medication regimens were associated with significant improvement in satisfaction with medication in the subset of patients who finished Phase 2 and completed the end-of-study questionnaire (n=258). More patients indicated that they were satisfied or very satisfied with the effectiveness of headache medications used during the study than with headache medications used before the study (42% versus 26%; P<.005) (FIGURE 5). In addition, with respect to overall satisfaction with medication, more patients reported themselves to be satisfied or very satisfied with the medications used during the study than with those used before the study (41% vs 29%; P<.005) (FIGURE 5). Bothersomeness of side effects of migraine medication did not differ during the study versus before the study. Most patients (63%) reported themselves to be not at all bothered by medication side effects both during the study and before the study.
FIGURE 5
Percentage of patients who were satisfied/very satisfied with medication and migraine care
Quality of care
The proportion of patients indicating that they were satisfied or very satisfied with the overall quality of migraine care was significantly higher for care received during the study than care received before the study (48% vs 32%; P<.001) (FIGURE 5).
Impact of headache
Patients’ HIT-6 scores reflected significantly less impact of headache at the end of Phase 2 compared with the beginning of the study. The percentage of patients whose headaches impacted their lives substantially or very severely was 75.3% at enrollment compared with 68.8% at the end of the study (P<.05).
Patients with pre-study migraine diagnosis vs those without
Of the 470 patients in the Phase 2 sample, 230 reported a pre-study diagnosis of migraine and 240 report no pre-study diagnosis of migraine. Patients who reported a pre-study migraine diagnosis compared with those who did not appeared to have more severe migraine at baseline as reflected by a higher frequency of severe pain, a longer duration of typical migraine attacks, and higher frequency of HIT-6 scores reflecting substantial or very severe impact of headaches (TABLE 3).
Patients with no prior diagnosis were significantly less satisfied with care and medication at baseline than patients with a prior diagnosis. While satisfaction increased and headache impact decreased from baseline to the end of Phase 2 both in patients who reported a prior diagnosis and those who did not, improvement was greater in those without a prior diagnosis (TABLE 3).
Acknowledgments
Some of the data described in this manuscript were presented at the 47th Annual Meeting of the American Headache Society, Philadelphia, Pennsylvania, United States. The study described in this manuscript was funded by GlaxoSmithKline. The authors acknowledge Jane Saiers, PhD, for assistance with writing the manuscript. Dr. Saiers’ work on the manuscript was funded by GlaxoSmithKline.
CORRESPONDENCE
Stephen Landy, MD, Wesley Headache Clinic, 8974 Bridge Forest Drive, Memphis, TN 38138. E-mail: [email protected]
1. Lipton RB, Stewart WF, Diamond S, et al. Prevalence and burden of migraine in the United States: data from the American Migraine Study II. Headache 2001;41:646-657.
2. De Diego EV, Lanteri-Minet M. Recognition and management of migraine in primary care: influence of functional impact measured by the Headache Impact Test (HIT). Cephalalgia 2005;25:184-190.
3. Hu XH, Markson LE, Lipton RB, et al. Burden of migraine in the United States: Disability and economic costs. Arch Intern Med 1999;159:813-815.
4. Blau JN, MacGregor EA. Migraine consultations: A triangle of viewpoints. Headache 1995;35:104-106.
5. MacGregor EA. The doctor and the migraine patient: Improving compliance. Neurology 1997;48(suppl 3):S16-S20.
6. Lipton RB, Diamond S, Reed M, Diamond ML, Stewart WF. Migraine diagnosis and treatment: results from the American Migraine Study II. Headache 2001;41:638-645.
7. Tepper SJ, Dahlöf CG, Dowson A, et al. Prevalence and diagnosis of migraine in patients consulting their physician with a complaint of headache: data from the Landmark Study. Headache 2004;44:856-864.
8. Tepper SJ, Martin V, Burch SP, et al. Acute headache treatments in patients with health care coverage: What prescriptions are doctors writing? Headache Pain 2006;17:11-17.
9. Kosinski M, Bayliss MS, Bjorner JB, et al. Six-item short-form survey for measuring headache impact: the HIT-6. Qual Life Res 2003;2:963-974.
10. Matchar DB, Young WB, Rosenberg JH, et al. Multispecialty consensus on diagnosis and treatment of headache: pharmacological management of acute attacks. Neurology 2000;54.:Available at www.aan.com/public/practiceguidelines/03.pdf. Accessed 16 February 2002.
11. Mannix LK. Epidemiology and impact of primary headache disorders. Med Clin North Am 2001;85:887-895.
12. Dowson AJ. Assessing the impact of migraine. Curr Med Res Opin 2001;17:298-309.
13. Stang P, Cady R, Batenhorst A, et al. Workplace productivity: A review of the impact of migraine and its treatment. Pharmacoeconomics 2001;19:231-244.
14. Hargreaves RJ, Shepheard SL. Pathophysiology of migraine-new insights. Can J Neurol Sci 1999;26:S12-S19.
15. Freitag FG. Acute treatment of migraine and the role of trip-tans. Curr Neurol Neurosci Rep 2001;1:125-132.
16. Kaniecki RG. Diagnostic challenges in headache: Migraine as the wolf disguised in sheep’s clothing. Neurology 2002;8(suppl 6):S1-S2.
17. Cady R, Dodick DW. Diagnosis and treatment of migraine. Mayo Clin Proc 2002;77:255-261.
18. Harpole LH, Samsa GP, Matchar DB, et al. Burden of illness and satisfaction with care among patients with headache seen in a primary care setting. Headache 2005;5:1048-1055.
19. Headache Classification Committee of the International Headache Society. The international classification of headache disorders, 2nd ed. Cephalalgia 2004;(suppl 1):9-160.
- Consider using the Headache Assessment Quiz, which 76% of providers in this study said enabled patients to adequately convey headache severity/symptoms, compared with just 20% of providers at baseline who thought patients communicated clearly.
- Use the quiz also to better understand the impact of migraine on a patient’s life, and to help determine which patients need migraine-specific therapy.
Up to 25% of patients in a typical primary care practice could be afflicted with migraine, and many of them simply do not report their headaches. Their silence does not necessarily imply adequate control with self-medication. Other concerns may command their attention, or inadequate communication may mask the issue. Whatever the reason, too few of them receive migraine-specific medications and proper instruction on avoiding headache triggers that could relieve the well-known burden of this disorder. Our study verifies the success of a program for screening—including a Headache Assessment Quiz—and treating migraine that also eases the burden of management for you.
For more original research on the treatment of migraines, see “Do family physicians fail to provide triptans for patients with migraine?”
We begin with a summary of our findings, and then give a detailed account of our study methods and results.
How many patients are slipping through the cracks?
Nearly half of all persons with migraine in the United States have not received a diagnosis for their disorder.1 Many of them suffer substantial functional impairment in daily activities and, thus, a diminished quality of life.
What’s to blame for this underdiagnosis? Perhaps a person’s failure to consult a physician for headache, poor patient-physician communication, comorbid conditions that obscure the presence or significance of headache, or a lack of time and resources devoted to detecting and managing migraine in the health care setting.2-5 In 2 recent studies conducted mainly in primary care settings, the frequency of unrecognized migraine among patients consulting for headache ranged from 48% to 60%.6,7
Even when migraine is recognized, quality of care is often suboptimal. In 1999, only 4 of 10 US migraineurs used prescription medication for migraine.6 In a recently published study that used 2002–2003 retrospective data from more than 30 managed care organizations, 50% of patients with a migraine diagnosis who had prescription drug coverage filled a prescription for a medication commonly used to treat migraine.8
We need a reliable system for migraine detection and management.
Migraine Care Program proves its worth
The Migraine Care Program (at www.migrainecareprogram.com) is a disease-management program employing educational materials and clinical assessment tools to help health care providers and patients improve awareness and recognition of migraine and the quality of care received by migraine sufferers. Components of the program:
- Informational modules on migraine epidemiology, pathophysiology, diagnosis, triggers, impact, and treatment
- Headache diary for patients
- Action plan for patients to complete with their health care providers
- Information for patients on effectively communicating with their health care providers about headache
- 10-question Headache Assessment Quiz and its supplement, which screen for the presence of migraine (FIGURE 1)
- 6-item Headache Impact Test (HIT-6) (FIGURE 2), a reliable, valid measure of the impact of headache on patients’ lives.9
This article reports the results of a prospective, two-phase study undertaken to assess (Phase 1) the utility of the Headache Assessment Quiz in facilitating recognition of migraine; and (Phase 2) the usefulness of the Migraine Care Program from the perspectives of both primary care providers and their patients. The study is unique in being one of a few to assess the effectiveness of a disease management program in improving patient outcomes or influencing physician’s behavior.
FIGURE 1
Headache Assessment Quiz
FIGURE 2
Headache Impact Test: HIT-6 (version 1.0)
How we measured success
In our study, primary care providers using the Migraine Care Program’s Headache Assessment Quiz as a screening tool diagnosed migraine in 25% of 4443 patients. That 1 in 4 patients consulting these primary care clinics for any reason had migraine is consistent with the estimated prevalence of migraine in the general population.1 More than half (52%) of those given a clinical diagnosis of migraine in this study had not previously received the diagnosis, which is also consistent with previous figures on unrecognized migraine.1,6,7 This pattern of results suggests that provider education and use of the Headache Assessment Quiz facilitated recognition of migraine in this sample.
Providers said the Headache Assessment Quiz improved management decisions. Three of 4 (74%) patients who tested positive for migraine on the Headache Assessment Quiz were subsequently given a clinical diagnosis of migraine after further evaluation by the primary care provider. Providers’ ratings of the Headache Assessment Quiz indicate the tool proved useful in multiple aspects of migraine care: understanding headache severity and impact, facilitating treatment decisions, and identifying patients requiring treatment. By the end of the study, providers found headache patients less difficult to assess and manage than before.
Clear benefits to patients. For 42% of patients with migraine, providers adjusted the pre-study medication regimens—most often by adding a migraine-specific triptan. On post-study surveys, significantly more patients said they were satisfied or very satisfied with the effectiveness of medication and with the overall quality of migraine care compared with the beginning of the study. The impact of headache on patients’ lives as determined from HIT-6 scores was less at the end of the study compared with the beginning.
A subgroup analysis among Phase 2 patients confirmed the value of the program. Phase 2 patients reporting no pre-study diagnosis of migraine were significantly less satisfied with care and medication at baseline than patients reporting a pre-study migraine diagnosis—even though patients reporting no pre-study diagnosis had less severe migraine at baseline. Patients with previously unrecognized migraine responded well to care in our study. Though satisfaction increased and headache impact decreased from baseline to the end of Phase 2 for both sets of patients, improvement was greater for those without a prior diagnosis.
Migraine affects 18% of women and 7% of men in the United States.1 A large body of research conducted over the past decade contradicts the historical conception of migraine as a trivial illness and has established it as a disabling condition warranting aggressive management.10-13 Concurrently, understanding of the pathophysiology of migraine has evolved; and new, migraine-specific treatments that can relieve pain and restore patients’ functional ability have been introduced.14,15 Despite these advances, several barriers to optimizing migraine care remain. Perhaps the most significant obstacle to effective migraine care, failure to recognize and diagnose migraine occurs alarmingly often.2,6,7,16,17 In a 1999 US population-based survey, less than half (48%) of those meeting International Headache Society (IHS) diagnostic criteria for migraine reported having received a physician diagnosis of migraine.1 Frequency of physician diagnosis of migraine in 1999 did not increase appreciably from diagnosis rates in 1989 although consultations for headache tripled over the 10-year period. Underrecognition and suboptimal management of migraine may be particularly problematic in the primary care setting, where the majority of migraine sufferers consult.
The suboptimal nature of migraine care is also reflected in patients’ assessments of medical care. In a recent study of patients with primary headache diagnoses in three geographically diverse primary care institutions in the United States, 1 of 4 patients with severe headaches reported dissatisfaction with their headache care; and 3 of 4 reported moderate or severe problems with headache management.18
Limitations of the study. First, patients were enrolled only if they agreed to complete the Headache Assessment Quiz. Thus, regarding characteristics relevant to study assessments, selection bias may have occurred if patients who agreed to take the quiz differed systematically from those who did not.
Second, attrition during Phase 2—though relatively low for a naturalistic study that, unlike a clinical trial, did not use incentives such as provision of study medication—might have biased the results of patient assessments at the end of the study. Attrition could have inflated the patient-satisfaction and other end-of-study ratings of medication and migraine care if dissatisfied patients were more likely to withdraw prematurely from the study than were satisfied patients.
Third, the study lacked a control group because of the difficulty in blinding investigators in a naturalistic study.
Strengths of the study. Among several disease management programs for migraine, the Migraine Care Program is unique in being one of the few whose effects on migraine care have been assessed. In this study, application of the Migraine Care Program was evaluated in the “real-world” clinical setting and as used by providers (physicians, nurse practitioners, physician assistants) typically responsible for headache care in primary care centers across the US. These characteristics enhance the probability that the results reflect those achievable in actual clinical practice. The comprehensive nature of the study assessments, which involved both primary care providers and patients, supports the benefits of the program.
Methods
This prospective, observational study had 2 phases. During Phase 1, primary care providers were introduced to the Migraine Care Program, and they administered the Headache Assessment Quiz to consulting patients who agreed to complete it. During Phase 2, a subset of patients who screened positive for migraine on the Headache Assessment Quiz in Phase 1 and whose migraine diagnosis was confirmed by their primary care provider received 12 weeks of additional treatment for migraine under the care of that primary care provider.
Participants
Study participants included both primary care providers and their patients. Eligible health care providers included physicians, nurse practitioners, and physician assistants responsible for performing headache assessments in US primary care practices that did not routinely use a questionnaire to screen headache patients prior to the study.
Eligible patients for Phase 1 were the first 100 consecutive 18- to 65-year-old patients in each practice who agreed to complete the Headache Assessment Quiz. Patients were eligible for Phase 1 regardless of whether they were consulting for headache. Patients from Phase 1 were eligible for Phase 2 if they screened positive for migraine on the Headache Assessment Quiz, had a confirmed clinical diagnosis of migraine meeting IHS criteria 1.1 or 1.2,19 and were willing to remain under the care of the study investigator and to treat headaches with therapy recommended by that investigator for 12 weeks.
Procedures
Phase 1
Primary care providers completed an Accreditation Council for Continuing Medical Education-accredited educational program consisting of a 38-minute DVD on migraine diagnosis and screening. After they completed the educational program, health care providers administered the Headache Assessment Quiz and HIT-6 to a target of 100 consecutively consulting patients regardless of patients’ reason for consulting. For patients who screened positive for migraine on the Headache Assessment Quiz, primary care providers recorded whether or not in their clinical judgment they confirmed a diagnosis of migraine by IHS criteria19 and whether or not patients reported, in response to a question, that they had received a migraine diagnosis from a health care professional before the study.
Phase 2
Primary care providers were asked to recruit up to 10 Phase-1 patients with a confirmed clinical diagnosis of migraine for Phase 2 of the study. At least half of the patients recruited in each practice were to have received their first clinical diagnosis of migraine during the study. All patients provided written, informed consent to participate in Phase 2.
At the beginning of Phase 2, eligible patients received Migraine Care Program educational materials including a migraine diary and a pamphlet about the causes, triggers, symptoms of migraine, and migraine types. They received migraine care for the ensuing 12 weeks under the supervision of the investigator. Investigators could prescribe any pharmacological or nonpharmacological migraine treatment to patients at their discretion.
Measures
In questionnaires administered at the beginning of the study before they initiated the Migraine Care Program (baseline) and again at the end of Phase 2, primary care providers rated the difficulty of assessing and treating patients with headache (0 = not at all difficult; 10 = extremely difficult), the importance of understanding the impact of headaches on a patient’s life when making treatment decisions (on a 7-point Likert scale ranging from very important to very unimportant), and their satisfaction (on a 7-point Likert scale ranging from very satisfied to very dissatisfied) with how well patients describe their headache severity and how well patients describe the physical, emotional, and financial impact of headaches.
For the questions on patient communication about headaches, providers were instructed to respond with respect to their general experience with patients for the baseline questionnaire and with respect to their experience with patients in Phase 2 of the study for the end-of-study questionnaire. The end-of-study questionnaire also contained items on which primary care providers rated satisfaction with the use of the Headache Assessment Quiz to facilitate (a) understanding of the impact of headaches on patients’ lives; (b) treatment decisions; and (c) identification of headache patients requiring better treatment and indicated whether or not they would recommend the Headache Assessment Quiz for use in clinical practice.
In questionnaires administered at the beginning of Phase 2 and again at the end of the study, patients who participated in Phase 2 rated their satisfaction (on a 7-point Likert scale ranging from very satisfied to very dissatisfied) with the medication used to treat migraine headaches and with the quality of medical care received for migraine. In addition, patients rated the bothersomeness of side effects of medication used to treat migraine headaches (on a 5-point categorical scale ranging from not at all to extremely). At the beginning of Phase 2, patients listed the medications they had used during the 3 months before the study to treat headaches. HIT-6, which was first administered at study entry, was also administered at the end of Phase 2.
Responses to the primary care provider and patient questionnaires were summarized with descriptive statistics. The Wilcoxon Signed Ranks Test was used to compare differences between baseline and the end of the study in the distribution of percentages of respondents to each question on satisfaction, bothersomeness, and importance; in median primary care provider ratings of difficulty of assessing and treating headache patients; and in distribution of HIT-6 scores (<50 = little to no impact of headache; 50–55 = some impact; 56–59 = substantial impact; ≥60 = severe impact).
In a subgroup analysis, baseline characteristics and end-of-study assessments were summarized separately for Phase 2 patients who reported a pre-study diagnosis of migraine and those who reported no pre-study diagnosis of migraine. Differences between subgroups were compared with chi-square tests as appropriate.
Results
Phase 1 participants
Forty-nine primary care providers (physicians, nurse practitioners, and physician assistants) participated in the Migraine Care Program (TABLE 1). Providers’ mean age was 44 years (SD=8.28). The majority (86%) were in group practice. The number of patients recruited to complete the Headache Assessment Quiz during Phase 1 of the study was 4443.
TABLE 1
Characteristics of study participants
| PRIMARY CARE PROVIDERS | |
| N | 49 |
| Type of provider, % | |
| Physician | 84 |
| Nurse practitioner | 100 |
| Physician assistant | 6 |
| Mean age, years (SD) | 44 (8.3) |
| Female, % | 33 |
| Practice type, % | |
| Group | 86 |
| Private | 14 |
| PATIENTS: PHASE 2 | |
| N | 470 |
| Mean age, years (SD) | 41 (11.9) |
| Female, % | 77 |
| Race, % | |
| White | 85 |
| Black | 6 |
| Hispanic | 6 |
| Other | 2† |
| Medications used for headache during the 3 months before the study,* % | |
| Over-the-counter medications | 70 |
| Triptans | 19 |
| Prescription NSAIDs | 14 |
| Combination analgesic | 9 |
| Narcotics | 5 |
| *Patients could list more than one medication. | |
| †Does not add to 100% because patients could have taken multiple medications. | |
Migraine diagnosis during Phase 1
Of the 4443 patients who completed the Headache Assessment Quiz in Phase 1, 1527 (34%) screened positive for migraine. Of these 1527 patients who screened positive for migraine, 1126 (74% of the 1527 patients screening positive for migraine) had their diagnosis confirmed during further evaluation by their primary care provider (FIGURE 3). More than half (52%) of the 1126 patients with a confirmed migraine diagnosis reported that they had not received a health care professional’s diagnosis of migraine prior to the study.
The proportion of patients with migraine as confirmed by a clinical migraine diagnosis was 25% (1126/4443) in the sample as a whole, which included all patients who had consulted these primary care practices for any reason and who had agreed to complete the Headache Assessment Quiz.
FIGURE 3
Prevalence of migraine among patients who consulted primary care providers for any reason and who agreed to complete the Headache Assessment Quiz
PCP’s perceptions of headache management before and after participation in the program
Primary care providers’ participation in the Migraine Care Program was associated with an increase in awareness of headache impact. At the end of Phase 2 compared with the beginning of the study, significantly more providers rated understanding headache impact as being important or very important in treatment decisions (87% vs 74%; P<.05) (TABLE 2).
Primary care providers’ participation in the Migraine Care Program was also associated with a perceived reduction in the challenges of providing headache care. At the end of Phase 2 compared with the beginning of the study, primary care providers reported assessing and treating headache to be significantly less difficult (median score = 6 at baseline and 3 at the end of the study; P<.001) (TABLE 2).
This improvement was accompanied by the perception of better patient communication about headaches: the proportions of primary care providers indicating that they were satisfied or very satisfied with patients’ descriptions of headache severity/symptoms and headache impact were significantly higher for patients they treated in Phase 2 than for headache patients they had treated prior to the study (76% vs 20% for severity/symptoms; 67% vs 27% for headache impact; P<.001 for both comparisons) (FIGURE 4).
The majority of providers indicated that they were satisfied or very satisfied with the use of the Headache Assessment Quiz as a tool for each of the dimensions assessed: understanding headache severity (88%), understanding headache impact (78%), making treatment decisions (71%), and identifying patients requiring treatment (86%) (FIGURE 4). Nearly all providers (96%) indicated that they would recommend the Headache Assessment Quiz for use in clinical practice (TABLE 2).
TABLE 2
Primary care providers’ perceptions of headache management at baseline and at the end of the study after participating in the Migraine Care Program
| BASELINE | END OF STUDY | |
| Knowledge of headache impact is important/very important in making decisions about treatment, % | 74 | 87* |
| Difficulty in headache assessment, median score† (range) | 6 (2–8) | 3‡ (1–7) |
| Would recommend the Headache Assessment Quiz for use in clinical practice, % | NA | 96 |
| *P<.05 vs baseline. | ||
| †Difficulty was scored on an 11-point scale ranging from 0 (not at all difficult) to 10 (extremely difficult). | ||
| ‡P<.001 vs baseline. | ||
FIGURE 4
Percentages of primary care providers who were satisfied/very satisfied with patient communication and the use of the Headache Assessment Quiz
Patients’ perceptions of headache care by PCPs participating in the Migraine Care Program
Phase 2 sample. The number of patients who participated in Phase 2 was 470 (TABLE 1). Mean age of patients in the Phase 2 sample was 41 years (SD=11.9). The majority of patients were white (85%) and were women (77%).
Medications
Among the 470 patients with a confirmed diagnosis of migraine who participated in Phase 2, the most common medications used to treat headaches during the 3 months prior to the study were over-the-counter medications (70% of patients) (TABLE 1). Fewer than one in five patients (19%) reported treating their pre-study headaches with migraine-specific triptan therapy.
At the beginning of Phase 2, primary care providers changed the headache medication regimen of 197 of these patients (42%). Of the 205 total changes to medication regimens, 72% involved adding a triptan; 10% involved adding other medications; 11% involved discontinuation of a medication; and 7% involved dose adjustment.
The changes to medication regimens were associated with significant improvement in satisfaction with medication in the subset of patients who finished Phase 2 and completed the end-of-study questionnaire (n=258). More patients indicated that they were satisfied or very satisfied with the effectiveness of headache medications used during the study than with headache medications used before the study (42% versus 26%; P<.005) (FIGURE 5). In addition, with respect to overall satisfaction with medication, more patients reported themselves to be satisfied or very satisfied with the medications used during the study than with those used before the study (41% vs 29%; P<.005) (FIGURE 5). Bothersomeness of side effects of migraine medication did not differ during the study versus before the study. Most patients (63%) reported themselves to be not at all bothered by medication side effects both during the study and before the study.
FIGURE 5
Percentage of patients who were satisfied/very satisfied with medication and migraine care
Quality of care
The proportion of patients indicating that they were satisfied or very satisfied with the overall quality of migraine care was significantly higher for care received during the study than care received before the study (48% vs 32%; P<.001) (FIGURE 5).
Impact of headache
Patients’ HIT-6 scores reflected significantly less impact of headache at the end of Phase 2 compared with the beginning of the study. The percentage of patients whose headaches impacted their lives substantially or very severely was 75.3% at enrollment compared with 68.8% at the end of the study (P<.05).
Patients with pre-study migraine diagnosis vs those without
Of the 470 patients in the Phase 2 sample, 230 reported a pre-study diagnosis of migraine and 240 report no pre-study diagnosis of migraine. Patients who reported a pre-study migraine diagnosis compared with those who did not appeared to have more severe migraine at baseline as reflected by a higher frequency of severe pain, a longer duration of typical migraine attacks, and higher frequency of HIT-6 scores reflecting substantial or very severe impact of headaches (TABLE 3).
Patients with no prior diagnosis were significantly less satisfied with care and medication at baseline than patients with a prior diagnosis. While satisfaction increased and headache impact decreased from baseline to the end of Phase 2 both in patients who reported a prior diagnosis and those who did not, improvement was greater in those without a prior diagnosis (TABLE 3).
Acknowledgments
Some of the data described in this manuscript were presented at the 47th Annual Meeting of the American Headache Society, Philadelphia, Pennsylvania, United States. The study described in this manuscript was funded by GlaxoSmithKline. The authors acknowledge Jane Saiers, PhD, for assistance with writing the manuscript. Dr. Saiers’ work on the manuscript was funded by GlaxoSmithKline.
CORRESPONDENCE
Stephen Landy, MD, Wesley Headache Clinic, 8974 Bridge Forest Drive, Memphis, TN 38138. E-mail: [email protected]
1. Lipton RB, Stewart WF, Diamond S, et al. Prevalence and burden of migraine in the United States: data from the American Migraine Study II. Headache 2001;41:646-657.
2. De Diego EV, Lanteri-Minet M. Recognition and management of migraine in primary care: influence of functional impact measured by the Headache Impact Test (HIT). Cephalalgia 2005;25:184-190.
3. Hu XH, Markson LE, Lipton RB, et al. Burden of migraine in the United States: Disability and economic costs. Arch Intern Med 1999;159:813-815.
4. Blau JN, MacGregor EA. Migraine consultations: A triangle of viewpoints. Headache 1995;35:104-106.
5. MacGregor EA. The doctor and the migraine patient: Improving compliance. Neurology 1997;48(suppl 3):S16-S20.
6. Lipton RB, Diamond S, Reed M, Diamond ML, Stewart WF. Migraine diagnosis and treatment: results from the American Migraine Study II. Headache 2001;41:638-645.
7. Tepper SJ, Dahlöf CG, Dowson A, et al. Prevalence and diagnosis of migraine in patients consulting their physician with a complaint of headache: data from the Landmark Study. Headache 2004;44:856-864.
8. Tepper SJ, Martin V, Burch SP, et al. Acute headache treatments in patients with health care coverage: What prescriptions are doctors writing? Headache Pain 2006;17:11-17.
9. Kosinski M, Bayliss MS, Bjorner JB, et al. Six-item short-form survey for measuring headache impact: the HIT-6. Qual Life Res 2003;2:963-974.
10. Matchar DB, Young WB, Rosenberg JH, et al. Multispecialty consensus on diagnosis and treatment of headache: pharmacological management of acute attacks. Neurology 2000;54.:Available at www.aan.com/public/practiceguidelines/03.pdf. Accessed 16 February 2002.
11. Mannix LK. Epidemiology and impact of primary headache disorders. Med Clin North Am 2001;85:887-895.
12. Dowson AJ. Assessing the impact of migraine. Curr Med Res Opin 2001;17:298-309.
13. Stang P, Cady R, Batenhorst A, et al. Workplace productivity: A review of the impact of migraine and its treatment. Pharmacoeconomics 2001;19:231-244.
14. Hargreaves RJ, Shepheard SL. Pathophysiology of migraine-new insights. Can J Neurol Sci 1999;26:S12-S19.
15. Freitag FG. Acute treatment of migraine and the role of trip-tans. Curr Neurol Neurosci Rep 2001;1:125-132.
16. Kaniecki RG. Diagnostic challenges in headache: Migraine as the wolf disguised in sheep’s clothing. Neurology 2002;8(suppl 6):S1-S2.
17. Cady R, Dodick DW. Diagnosis and treatment of migraine. Mayo Clin Proc 2002;77:255-261.
18. Harpole LH, Samsa GP, Matchar DB, et al. Burden of illness and satisfaction with care among patients with headache seen in a primary care setting. Headache 2005;5:1048-1055.
19. Headache Classification Committee of the International Headache Society. The international classification of headache disorders, 2nd ed. Cephalalgia 2004;(suppl 1):9-160.
Parkinson’s disease: How practical are new recommendations?
This feature reviews guidelines when they are developed with high-quality evidence and are relevant to primary care physicians. Now and then, however, it is instructive to critique recommendations that fall short of this mark. Four Parkinson’s disease practice parameters recently published by the American Academy of Neurology purport to be explicit, evidence-based, and of high quality; however, we feel these guidelines should be used with caution.
These recommendations for care of the Parkinson’s patient were published in Neurology as 4 separate reviews.1-4 The topics covered include diagnosis and prognosis, treatment of motor fluctuations and dyskinesia, neuroprotective strategies, and evaluation and treatment of depression, psychosis, and dementia. There are 201 references. These recommendations were developed by the Quality Standards Subcommittee of the American Academy of Neurology. These guidelines can be accessed on the Web at: www.aan.com/professionals/practice/guideline/index.cfm.
Limitations of these recommendations
In these reviews, terminology regarding effectiveness is not consistently used. Instead of stating that a treatment “is effective,” the authors report that it “should be considered” or “should be offered.”
DIAGNOSIS
- Early falls, poor response to levodopa, symmetry of motor symptoms, and lack of tremor are “probably useful” to suggest other Parkinson-like syndromes, but are not typical for Parkinson’s disease
- Levodopa or apomorphine challenge and olfactory testing are “probably useful” in diagnosing Parkinson’s disease
- Older age at onset, associated comorbidities, rigidity and bradykinesia at onset, and decreased dopamine responsiveness are associated with poorer prognosis
TREATMENT
- Entacapone and rasagiline “should be offered” to reduce off time (periods where medications wear off and Parkinson’s disease symptoms return) (A). Pergolide, pramipexole, ropinirole, and tolcapone “should be considered” (B). Apomorphine, cabergoline, and selegiline “may be considered” (C). Current evidence does not support the use of one medication over another in reducing off time (B). Sustained release carbidopa/levodopa and bromocriptine “may be disregarded” to reduce off time (C)
- Amantadine “may be considered” to reduce dyskinesias (C)
- Deep brain stimulation of the subthalamic nucleus “may be considered” for improving motor function and dyskinesias and reducing off time and medication usage (C)
NEUROPROTECTION
- Levodopa “does not appear” to accelerate disease progression
- No treatment is neuroprotective
- No evidence supports vitamin and food additives for improving motor function
- Exercise “may be helpful” for improving motor function
- Speech therapy “may be helpful” for improving speech volume
- Screening and treatment of depression, psychosis, and dementia
- Depression rating scales “should be considered” to screen for depression (B)
- Dementia screening “should be considered” (B)
- Amitriptyline “may be considered” to treat depression without dementia (C)
- Clozapine “should be considered” (C), quetiapine “may be considered” (C), and olanzapine “should not be considered” (B) for psychosis
- Donepezil or rivastigmine “should be considered” for dementia (B)
There is not consistency between the manuscripts. Abstracts in 2 of the publications2,4 link level of evidence to the summary of recommendations in the abstracts. The other 2 do not.
In all 4 documents the abstracts are written in randomized controlled trial format, which make them difficult to quickly review. They are in question and answer format. There are long blocks of text without figures or tables to aid in learning and retaining the recommendations.
No cost-effectiveness analysis is performed in the reviews. They recommend that deep brain stimulation of the subthalamic nucleus “may be considered” to improve Parkinson’s disease symptoms and reduce medication use. But at what cost?
Because of their perspective from a specialty, these guidelines lack relevance for the family physician. For example, olfactory testing, which they recommend, is impractical for primary care physicians. However, no recommendations discuss dose titration with commonly prescribed medications. There are 3 pages reviewing surgical therapy.
CORRESPONDENCE
Keith B. Holten, MD, 825 Locust Street, Wilmington, OH 45177. E-mail: [email protected]
1. Suchowersky O, Reich S, Perlmutter J, Zesiewicz T, Gronseth G, Weiner WJ. Quality Standards Subcommittee of the American Academy of Neurology. Practice Parameter: diagnosis and prognosis of new onset Parkinson disease (an evidence-based review): report of the Quality Standards Subcommittee of the American Academy of Neurology. Neurology 2006;66:968-975.
2. Pahwa R, Factor SA, Lyons KE, et al. Quality Standards Subcommittee of the American Academy of Neurology. Practice Parameter: treatment of Parkinson disease with motor fluctuations and dyskinesia (an evidence-based review): report of the Quality Standards Subcommittee of the American Academy of Neurology. Neurology 2006;66:983-995
3. Suchowersky O, Gronseth G, Perlmutter J, Reich S, Zesiewicz T, Weiner WJ. Quality Standards Subcommittee of the American Academy of Neurology. Practice Parameter: neuroprotective strategies and alternative therapies for Parkinson disease (an evidence-based review): report of the Quality Standards Subcommittee of the American Academy of Neurology. Neurology 2006;66:976-982.
4. Miyasaki JM, Shannon K, Voon V, et al. Quality Standards Subcommittee of the American Academy of Neurology. Practice Parameter: evaluation and treatment of depression, psychosis, and dementia in Parkinson disease (an evidence-based review): report of the Quality Standards Subcommittee of the American Academy of Neurology. Neurology 2006;66:996-1002.
This feature reviews guidelines when they are developed with high-quality evidence and are relevant to primary care physicians. Now and then, however, it is instructive to critique recommendations that fall short of this mark. Four Parkinson’s disease practice parameters recently published by the American Academy of Neurology purport to be explicit, evidence-based, and of high quality; however, we feel these guidelines should be used with caution.
These recommendations for care of the Parkinson’s patient were published in Neurology as 4 separate reviews.1-4 The topics covered include diagnosis and prognosis, treatment of motor fluctuations and dyskinesia, neuroprotective strategies, and evaluation and treatment of depression, psychosis, and dementia. There are 201 references. These recommendations were developed by the Quality Standards Subcommittee of the American Academy of Neurology. These guidelines can be accessed on the Web at: www.aan.com/professionals/practice/guideline/index.cfm.
Limitations of these recommendations
In these reviews, terminology regarding effectiveness is not consistently used. Instead of stating that a treatment “is effective,” the authors report that it “should be considered” or “should be offered.”
DIAGNOSIS
- Early falls, poor response to levodopa, symmetry of motor symptoms, and lack of tremor are “probably useful” to suggest other Parkinson-like syndromes, but are not typical for Parkinson’s disease
- Levodopa or apomorphine challenge and olfactory testing are “probably useful” in diagnosing Parkinson’s disease
- Older age at onset, associated comorbidities, rigidity and bradykinesia at onset, and decreased dopamine responsiveness are associated with poorer prognosis
TREATMENT
- Entacapone and rasagiline “should be offered” to reduce off time (periods where medications wear off and Parkinson’s disease symptoms return) (A). Pergolide, pramipexole, ropinirole, and tolcapone “should be considered” (B). Apomorphine, cabergoline, and selegiline “may be considered” (C). Current evidence does not support the use of one medication over another in reducing off time (B). Sustained release carbidopa/levodopa and bromocriptine “may be disregarded” to reduce off time (C)
- Amantadine “may be considered” to reduce dyskinesias (C)
- Deep brain stimulation of the subthalamic nucleus “may be considered” for improving motor function and dyskinesias and reducing off time and medication usage (C)
NEUROPROTECTION
- Levodopa “does not appear” to accelerate disease progression
- No treatment is neuroprotective
- No evidence supports vitamin and food additives for improving motor function
- Exercise “may be helpful” for improving motor function
- Speech therapy “may be helpful” for improving speech volume
- Screening and treatment of depression, psychosis, and dementia
- Depression rating scales “should be considered” to screen for depression (B)
- Dementia screening “should be considered” (B)
- Amitriptyline “may be considered” to treat depression without dementia (C)
- Clozapine “should be considered” (C), quetiapine “may be considered” (C), and olanzapine “should not be considered” (B) for psychosis
- Donepezil or rivastigmine “should be considered” for dementia (B)
There is not consistency between the manuscripts. Abstracts in 2 of the publications2,4 link level of evidence to the summary of recommendations in the abstracts. The other 2 do not.
In all 4 documents the abstracts are written in randomized controlled trial format, which make them difficult to quickly review. They are in question and answer format. There are long blocks of text without figures or tables to aid in learning and retaining the recommendations.
No cost-effectiveness analysis is performed in the reviews. They recommend that deep brain stimulation of the subthalamic nucleus “may be considered” to improve Parkinson’s disease symptoms and reduce medication use. But at what cost?
Because of their perspective from a specialty, these guidelines lack relevance for the family physician. For example, olfactory testing, which they recommend, is impractical for primary care physicians. However, no recommendations discuss dose titration with commonly prescribed medications. There are 3 pages reviewing surgical therapy.
CORRESPONDENCE
Keith B. Holten, MD, 825 Locust Street, Wilmington, OH 45177. E-mail: [email protected]
1. Suchowersky O, Reich S, Perlmutter J, Zesiewicz T, Gronseth G, Weiner WJ. Quality Standards Subcommittee of the American Academy of Neurology. Practice Parameter: diagnosis and prognosis of new onset Parkinson disease (an evidence-based review): report of the Quality Standards Subcommittee of the American Academy of Neurology. Neurology 2006;66:968-975.
2. Pahwa R, Factor SA, Lyons KE, et al. Quality Standards Subcommittee of the American Academy of Neurology. Practice Parameter: treatment of Parkinson disease with motor fluctuations and dyskinesia (an evidence-based review): report of the Quality Standards Subcommittee of the American Academy of Neurology. Neurology 2006;66:983-995
3. Suchowersky O, Gronseth G, Perlmutter J, Reich S, Zesiewicz T, Weiner WJ. Quality Standards Subcommittee of the American Academy of Neurology. Practice Parameter: neuroprotective strategies and alternative therapies for Parkinson disease (an evidence-based review): report of the Quality Standards Subcommittee of the American Academy of Neurology. Neurology 2006;66:976-982.
4. Miyasaki JM, Shannon K, Voon V, et al. Quality Standards Subcommittee of the American Academy of Neurology. Practice Parameter: evaluation and treatment of depression, psychosis, and dementia in Parkinson disease (an evidence-based review): report of the Quality Standards Subcommittee of the American Academy of Neurology. Neurology 2006;66:996-1002.
Detecting overweight children in primary care: Do national data reflect the typical urban practice?
- Primary care physicians can easily identify overweight in children aged >2 years using body-mass index.
- There is no consensus on the appropriate way of identifying overweight before age 2 years. However, the primary care physician should be alert if the body-mass index of a child <2 years of age is significantly higher then those published (as a guideline) in this paper.
- Overweight is occurring early. Thus it is essential that primary care physicians focus on identifying overweight as early as preschool age.
- Primary care physicians have to pay particular attention to identifying overweight in non-Hispanic black children aged 2 to 11 years, who may have a higher prevalence of being at risk for overweight compared with 1999–2002 national data.
- Children seen for a sick-child visit may be at higher risk for overweight; thus, we recommend that height and weight measurements be obtained during these visits.
The rate of “at risk for overweight” and “overweight” in young children, starting in preschool years, is alarming.1
Primary care physicians are in the best position to identify children who are at risk for overweight or are overweight, even in preschool years. A major effort has to be put forward in achieving a consensus regarding assessment of body adiposity and overweight in the child aged younger than 2 years.
We believed it was important to collect data directly from primary care practices in western New York and reduce selection bias created by referrals to an endocrinology clinic. The aims of our study were to obtain data regarding the feasibility of detecting “risk for over-weight” and “overweight” in infants and young children seen for well-child visits based on pediatricians’ standard practice, to compare these estimates with the national data,5,6 and to compare the data obtained during well-child visits with data obtained in preschool children seen for a sick-child visit.
Results: Overweight in 3 age groups
Data from 1190 well-child visits (79.2% non-Hispanic white, 12.9 non-Hispanic black, 3.0% Hispanic, 1.3% other) and 292 sick-child visits (100% non-Hispanic white, aged 3.8 ± 1.1 years) were analyzed. TABLE 1 illustrates the subjects’ demographic data.
Subjects aged <2 years. TABLE 2 illustrates that mean body-mass index (BMI) values in subjects younger than 2 years are similar to the values reported in the National Health and Nutrition Examination Survey (NHANES) 2001 to 2002 data.
Subjects aged 2 to 5 years. The prevalence of overweight or at risk for over-weight in non-Hispanic white children aged 2 to 5 years is comparable with that reported in the 1999 to 2002 NHANES dataset (TABLE 3). In non-Hispanic black children in this group, the prevalence of at risk for overweight is similar to the NHANES sample, but the prevalence of overweight is higher (13.5 vs 8.8%).
Within the non-Hispanic white 2- to 5-year-old group, the prevalence of “at risk for overweight” is 36% in the western New York children seen for sick visits compared with 25.5% in the children seen for well visits.
Subjects aged 6 to 11 years. Like the 2-to 5-year-olds, the prevalence of over-weight or at risk for overweight in non-Hispanic white children aged 6 to 11 years is comparable with that reported in the 1999 to 2002 NHANES data. However, a sharp increase is present in the 6- to 11-year-old non-Hispanic black group with regard to “at risk for overweight” (56.0%) and overweight (42.0%) compared with NHANES data (TABLE 3).
In the 6- to 11-year-olds the prevalence of “overweight” or at “risk for overweight” in non-Hispanic black subjects is 3 (42.0 vs 13.9%) and almost 2 times (56.0% vs 29.4%) higher, respectively, than those observed in non-Hispanic white children.
TABLE 1
Demographic data (well child visits only)
| NON-HISPANIC WHITE | NON-HISPANIC BLACK | |||||
|---|---|---|---|---|---|---|
| Cohort | Age (yrs) mean ± SD | N | Sex (M/F) | Age (yrs) mean + SD | N | Sex (M/F) |
| <2 years | 1.1 ± 0.4 | 200 | 107/93 | 1.1 ± 0.5 | 97 | 61/36 |
| 2–5 years | 3.7 ± 1.1 | 451 | 233/218 | 3.7 ± 1.0 | 89 | 46/43 |
| 6–11 years | 8.8 ± 1.8 | 238 | 112/126 | 9.2 ± 1.8 | 50 | 29/21 |
TABLE 2
BMI data for patients aged <2 years (well-child visits only)
| AGE GROUP | NHANES (N) | WNY (N) | |
|---|---|---|---|
| Non-Hispanic white | 6–12 months | 17.9 ± 1.4 (88) | 18.3 ± 1.8 (75) |
| 13–18 months | 16.7 ± 1.2 (41) | 17.5 ± 1.7 (78) | |
| 19–24 months | 16.3 ± 1.3 (44) | 17.0 ± 1.3 (47) | |
| Non-Hispanic black | 6–12 months | 17.9 ± 1.8 (55) | 17.7 ± 1.8 (38) |
| 13–18 months | 17.1 ± 1.4 (35) | 18.0 ± 1.8 (33) | |
| 19–24 months | 16.6 ± 1.4 (35) | 17.5 ± 2.3 (26) |
TABLE 3
Percentage of children aged 2 to 5 years and 6 to 11 years at risk for overweight or overweight
| AGE GROUP | WESTERN NEWYORK, 2003–2005 | NHANES, 1999–2002 | |
|---|---|---|---|
| Non-Hispanic white >95th | 2–5 years | 10.0 | 8.6 |
| Non-Hispanic white >95th | 6–11 years | 13.9 | 13.5 |
| Non-Hispanic white >85th | 2–5 years | 25.5 | 20.8 |
| Non-Hispanic white >85th | 6–11 years | 29.4 | 28.6 |
| Non-Hispanic black >95th | 2–5 years | 13.5 | 8.8 |
| Non-Hispanic black >95th | 6–11 years | 42.0 | 19.8 |
| Non-Hispanic black >85th | 2–5 years | 28.1 | 23.2 |
| Non-Hispanic black >85th | 6–11 years | 56.0 | 33.7 |
Discussion
Significance of the data for those aged <2 years
The earlier children begin increasing in adiposity, the greater the risk for being obese as adolescents and adults,7,8 with 40% of infants whose weight was above the 95th percentile reported to be over-weight as adults.9 Our BMI data in the subjects younger than 2 years were similar to those reported in the 2001 to 2002 NHANES sample.
However, there is no agreement on the best way of assessing overweight in infants aged <2 years,10 and BMI may not represent a valid measure of adiposity in these children.11 Traditionally, weight-length ratio or ponderal index have been used to define overweight in infants aged <2 years. Despite the potential limit of using BMI in infants, the use of BMI from birth on may be helpful in tracking the infant’s growth and looking at trends and risk factors associated with the years preceding the adiposity rebound.7,10
The data presented herein are significant because they reflect the anthropometrical parameters primary care physicians obtain and should use routinely to calculate and plot BMI.2,12
Moreover, the primary care practices sampled could have been located anywhere in the US and the data generated are similar to the national data, despite having been collected without any standardization or additional personnel training. Thus they illustrate that primary care physicians can easily identify overweight in young children without implementing any change in their current practice, as long as they do not use the paper-and-pencil methods, shown to systematically overestimate length.13
Significance of the data for those aged 2 to 5 years
In 2- to 5-year-old non-Hispanic white children seen for well-child visits in a typical primary care setting in western New York, the prevalence of “overweight” is similar to the national prevalence, with a trend towards a higher prevalence of “at risk for overweight” compared with the national data (western New York 25.5% vs 20.8% NHANES).5 These data provide alerting evidence that 25% to 30% of preschool children are at risk for over-weight at a routine well-child visit.
Significance of the data for those aged 6 to 11 years
Caution must be used in interpreting our finding of a higher prevalence of over-weight (42.0 vs 19.8%) in the 6- to 11-year-old non-Hispanic black population, given the smaller size of this sample. However, this may reflect the fact that prevalence of overweight may be worsening in minorities, and may be higher in specific areas of the US and in populations with lower socioeconomic status.
In fact Gauthier et al14 showed that 38% of males and 16% of females (aged 4 to 17 years) were obese in a predominantly rural community of Michigan with low socioeconomic status. A higher prevalence of obesity was also found by these authors in a large database from Practice Partner Research Network practices located in 24 states.15
Comorbidities and the sick child
There are several known obesity comorbidities,16 but it is unclear if the over-weight status is actually posing the affected child at higher risk for developing illnesses treated routinely by the primary care physicians, such as viral syndrome, otitis media, and others.17-20 Our preliminary data in a sample of 2- to 5-year-old non-Hispanic white children seen for a sick visit suggest that the prevalence of at risk for overweight may be higher in children seen for a sick-child compared with well-child visit.
Since many children are only brought to medical attention when they are in need of urgent care, by omitting height and weight measurements at the time of a sick-child visit, physicians may miss the only opportunity of detecting the child who is at risk for overweight, and thus in need of preventative measures.
This cross-sectional study was conducted in 2 urban practices and 3 suburban practices located in Erie County, the largest and most populated area in western New York. These practices were chosen on the basis of their large size and demographics, reflective of the population and racial distribution in western New York. We included in the study children ages 6 months to 11 years seen for well-child visits and 2- to 5-year-old non-Hispanic white children seen for sick-child visits. The data (age, gender, race, weight, height/length), provided without any identifier, were collected by the pediatricians in patients seen sequentially during randomly selected days during the periods October 2003 to February 2004 and January 2006 without implementing any changes in their practice.
We excluded subjects with syndromes or chronic disorders or length or height above or below or 2.5 standard deviations (SD) from the mean for age and gender.
In children aged more than 2 years, “overweight” or “at risk for overweight” were defined as BMI >85th percentile or >95th percentile for age and gender, respectively, and compared with the National Health and Nutrition Examination Survey (NHANES) 1999 to 2002. In the 6- to 24-month group, we are presenting BMI data (weight/recumbent length squared) and comparing them with age-matched BMI data in NHANES 2001 to 2002.
We followed National Center for Health Statistics guidelines in estimating mean estimates software that incorporated the appropriate statistical weight for data collected at the Mobile Examination Center, taking into account the stratified multi-stage random sample design of NHANES 1999 to 2002. The study was approved by the Human Institutional Review Board of the Women and Children’s Hospital of Buffalo.
Acknowledgments
The author would like to thank the pediatric practices who collaborated in this study and are particularly grateful to Drs Cozza, Lana, Laws, McNally, Vaughan and Vetrano. The Authors are indebted to Mrs Sherry Ortiz for her assistance in the manuscript preparation. This work was presented in part at the 2004 Pediatric Academic Society Annual Meeting.
CORRESPONDENCE
Teresa Quattrin, MD, Chief, Division of Endocrinology/Diabetes, Women and Children’s Hospital of Buffalo, 219 Bryant Street, Buffalo, NY 14222. E-mail: [email protected]
1. Deckelbaum RJ, Williams CL. Childhood obesity: the health issue. Obes Res 2001;9 Suppl 4:239S-243S.
2. Baird J, Fisher D, Lucas P, Kleijnen J, Roberts H, Law C. Being big or growing fast: systematic review of size and growth in infancy and later obesity. BMJ 2005;331:929.-
3. Ogden CL, Troiano RP, Briefel RR, Kuczmarski RJ, Flegal KM, Johnson CL. Prevalence of overweight among pre-school children in the United States, 1971 through 1994. Pediatrics 1997;99:E1.-
4. Quattrin T, Liu E, Shaw N, Shine B, Chiang E. Obese children who are referred to the pediatric endocrinologist: characteristics and outcome. Pediatrics 2005;115:348-351.
5. Hedley AA, Ogden CL, Johnson CL, Carroll MD, Curtin LR, Flegal KM. Prevalence of overweight and obesity among US children adolescents and adults 1999-2002 JAMA 2004;291:2847-2850.
6. Ogden CL, Flegal KM, Carroll MD, Johnson CL. Prevalence and trends in overweight among US children and adolescents, 1999-2000. JAMA 2002;288:1728-1732.
7. Rolland-Cachera MF, Deheeger M, Bellisle F, Sempe M, Guilloud-Bataille M, Patois E. Adiposity rebound in children: a simple indicator for predicting obesity. Am J Clin Nutr 1984;39:129-135.
8. Whitaker RC, Pepe MS, Wright JA, Seidel KD, Dietz WH. Early adiposity rebound and the risk of adult obesity. Pediatrics 1998;101:E5.-
9. Charney E, Goodman HC, McBride M, Lyon B, Pratt R. Childhood antecedents of adult obesity. Do chubby infants become obese adults? N Engl J Med 1976;295:6-9.
10. Dietz WH. “Adiposity rebound”: reality or epiphenomenon? Lancet 2000;356:2027-2028.
11. Dietz WH, Robinson TN. Use of the body mass index (BMI) as a measure of overweight in children and adoles-cents. J Pediatr 1998;132:191-193.
12. Krebs NF, Jacobson MS. Prevention of pediatric over-weight and obesity. Pediatrics 2003;112:424-430.
13. Rifas-Shiman SL, Rich-Edwards JW, Scanlon KS, Kleinman KP, Gillman MW. Misdiagnosis of overweight and underweight children younger than 2 years of age due to length measurement bias. Medscape Gen Med 2005;7:56.-
14. Gauthier BM, Hickner JM, Noel MM. High prevalence of overweight children in Michigan primary care practices. An UPRNet study. Upper Peninsula Research Network. J Fam Pract 2000;49:73-76.
15. Gauthier BM, Hickner JM, Ornstein S. High prevalence of overweight children and adolescents in the Practice Partner Research Network. Arch Pediatr Adolesc Med 2000;154:625-628.
16. Weiss R, Caprio S. The metabolic consequences of childhood obesity. Best Pract Res Clin Endocrinol Metab 2005;19:405-419.
17. To T, Vydykhan TN, Dell S, Tassoudji M, Harris JK. Is obesity associated with asthma in young children? J Pediatr 2004;144:162-168.
18. Steinberger J, Moran A, Hong CP, Jacobs DR, Jr, Sinaiko AR. Adiposity in childhood predicts obesity and insulin resistance in young adulthood. J Pediatr 2001;138:469-473.
19. Epstein LH, Kuller LH, Wing RR, Valoski A, McCurley J. The effect of weight control on lipid changes in obese children. Am J Dis Child 1989;143:454-457.
20. Li S, Chen W, Srinivasan S, et al. Childhood cardiovascular risk factors and carotid vascular changes in adult-hood: The Bogalusa Heart Study. JAMA 2003;290:2271-2276.
- Primary care physicians can easily identify overweight in children aged >2 years using body-mass index.
- There is no consensus on the appropriate way of identifying overweight before age 2 years. However, the primary care physician should be alert if the body-mass index of a child <2 years of age is significantly higher then those published (as a guideline) in this paper.
- Overweight is occurring early. Thus it is essential that primary care physicians focus on identifying overweight as early as preschool age.
- Primary care physicians have to pay particular attention to identifying overweight in non-Hispanic black children aged 2 to 11 years, who may have a higher prevalence of being at risk for overweight compared with 1999–2002 national data.
- Children seen for a sick-child visit may be at higher risk for overweight; thus, we recommend that height and weight measurements be obtained during these visits.
The rate of “at risk for overweight” and “overweight” in young children, starting in preschool years, is alarming.1
Primary care physicians are in the best position to identify children who are at risk for overweight or are overweight, even in preschool years. A major effort has to be put forward in achieving a consensus regarding assessment of body adiposity and overweight in the child aged younger than 2 years.
We believed it was important to collect data directly from primary care practices in western New York and reduce selection bias created by referrals to an endocrinology clinic. The aims of our study were to obtain data regarding the feasibility of detecting “risk for over-weight” and “overweight” in infants and young children seen for well-child visits based on pediatricians’ standard practice, to compare these estimates with the national data,5,6 and to compare the data obtained during well-child visits with data obtained in preschool children seen for a sick-child visit.
Results: Overweight in 3 age groups
Data from 1190 well-child visits (79.2% non-Hispanic white, 12.9 non-Hispanic black, 3.0% Hispanic, 1.3% other) and 292 sick-child visits (100% non-Hispanic white, aged 3.8 ± 1.1 years) were analyzed. TABLE 1 illustrates the subjects’ demographic data.
Subjects aged <2 years. TABLE 2 illustrates that mean body-mass index (BMI) values in subjects younger than 2 years are similar to the values reported in the National Health and Nutrition Examination Survey (NHANES) 2001 to 2002 data.
Subjects aged 2 to 5 years. The prevalence of overweight or at risk for over-weight in non-Hispanic white children aged 2 to 5 years is comparable with that reported in the 1999 to 2002 NHANES dataset (TABLE 3). In non-Hispanic black children in this group, the prevalence of at risk for overweight is similar to the NHANES sample, but the prevalence of overweight is higher (13.5 vs 8.8%).
Within the non-Hispanic white 2- to 5-year-old group, the prevalence of “at risk for overweight” is 36% in the western New York children seen for sick visits compared with 25.5% in the children seen for well visits.
Subjects aged 6 to 11 years. Like the 2-to 5-year-olds, the prevalence of over-weight or at risk for overweight in non-Hispanic white children aged 6 to 11 years is comparable with that reported in the 1999 to 2002 NHANES data. However, a sharp increase is present in the 6- to 11-year-old non-Hispanic black group with regard to “at risk for overweight” (56.0%) and overweight (42.0%) compared with NHANES data (TABLE 3).
In the 6- to 11-year-olds the prevalence of “overweight” or at “risk for overweight” in non-Hispanic black subjects is 3 (42.0 vs 13.9%) and almost 2 times (56.0% vs 29.4%) higher, respectively, than those observed in non-Hispanic white children.
TABLE 1
Demographic data (well child visits only)
| NON-HISPANIC WHITE | NON-HISPANIC BLACK | |||||
|---|---|---|---|---|---|---|
| Cohort | Age (yrs) mean ± SD | N | Sex (M/F) | Age (yrs) mean + SD | N | Sex (M/F) |
| <2 years | 1.1 ± 0.4 | 200 | 107/93 | 1.1 ± 0.5 | 97 | 61/36 |
| 2–5 years | 3.7 ± 1.1 | 451 | 233/218 | 3.7 ± 1.0 | 89 | 46/43 |
| 6–11 years | 8.8 ± 1.8 | 238 | 112/126 | 9.2 ± 1.8 | 50 | 29/21 |
TABLE 2
BMI data for patients aged <2 years (well-child visits only)
| AGE GROUP | NHANES (N) | WNY (N) | |
|---|---|---|---|
| Non-Hispanic white | 6–12 months | 17.9 ± 1.4 (88) | 18.3 ± 1.8 (75) |
| 13–18 months | 16.7 ± 1.2 (41) | 17.5 ± 1.7 (78) | |
| 19–24 months | 16.3 ± 1.3 (44) | 17.0 ± 1.3 (47) | |
| Non-Hispanic black | 6–12 months | 17.9 ± 1.8 (55) | 17.7 ± 1.8 (38) |
| 13–18 months | 17.1 ± 1.4 (35) | 18.0 ± 1.8 (33) | |
| 19–24 months | 16.6 ± 1.4 (35) | 17.5 ± 2.3 (26) |
TABLE 3
Percentage of children aged 2 to 5 years and 6 to 11 years at risk for overweight or overweight
| AGE GROUP | WESTERN NEWYORK, 2003–2005 | NHANES, 1999–2002 | |
|---|---|---|---|
| Non-Hispanic white >95th | 2–5 years | 10.0 | 8.6 |
| Non-Hispanic white >95th | 6–11 years | 13.9 | 13.5 |
| Non-Hispanic white >85th | 2–5 years | 25.5 | 20.8 |
| Non-Hispanic white >85th | 6–11 years | 29.4 | 28.6 |
| Non-Hispanic black >95th | 2–5 years | 13.5 | 8.8 |
| Non-Hispanic black >95th | 6–11 years | 42.0 | 19.8 |
| Non-Hispanic black >85th | 2–5 years | 28.1 | 23.2 |
| Non-Hispanic black >85th | 6–11 years | 56.0 | 33.7 |
Discussion
Significance of the data for those aged <2 years
The earlier children begin increasing in adiposity, the greater the risk for being obese as adolescents and adults,7,8 with 40% of infants whose weight was above the 95th percentile reported to be over-weight as adults.9 Our BMI data in the subjects younger than 2 years were similar to those reported in the 2001 to 2002 NHANES sample.
However, there is no agreement on the best way of assessing overweight in infants aged <2 years,10 and BMI may not represent a valid measure of adiposity in these children.11 Traditionally, weight-length ratio or ponderal index have been used to define overweight in infants aged <2 years. Despite the potential limit of using BMI in infants, the use of BMI from birth on may be helpful in tracking the infant’s growth and looking at trends and risk factors associated with the years preceding the adiposity rebound.7,10
The data presented herein are significant because they reflect the anthropometrical parameters primary care physicians obtain and should use routinely to calculate and plot BMI.2,12
Moreover, the primary care practices sampled could have been located anywhere in the US and the data generated are similar to the national data, despite having been collected without any standardization or additional personnel training. Thus they illustrate that primary care physicians can easily identify overweight in young children without implementing any change in their current practice, as long as they do not use the paper-and-pencil methods, shown to systematically overestimate length.13
Significance of the data for those aged 2 to 5 years
In 2- to 5-year-old non-Hispanic white children seen for well-child visits in a typical primary care setting in western New York, the prevalence of “overweight” is similar to the national prevalence, with a trend towards a higher prevalence of “at risk for overweight” compared with the national data (western New York 25.5% vs 20.8% NHANES).5 These data provide alerting evidence that 25% to 30% of preschool children are at risk for over-weight at a routine well-child visit.
Significance of the data for those aged 6 to 11 years
Caution must be used in interpreting our finding of a higher prevalence of over-weight (42.0 vs 19.8%) in the 6- to 11-year-old non-Hispanic black population, given the smaller size of this sample. However, this may reflect the fact that prevalence of overweight may be worsening in minorities, and may be higher in specific areas of the US and in populations with lower socioeconomic status.
In fact Gauthier et al14 showed that 38% of males and 16% of females (aged 4 to 17 years) were obese in a predominantly rural community of Michigan with low socioeconomic status. A higher prevalence of obesity was also found by these authors in a large database from Practice Partner Research Network practices located in 24 states.15
Comorbidities and the sick child
There are several known obesity comorbidities,16 but it is unclear if the over-weight status is actually posing the affected child at higher risk for developing illnesses treated routinely by the primary care physicians, such as viral syndrome, otitis media, and others.17-20 Our preliminary data in a sample of 2- to 5-year-old non-Hispanic white children seen for a sick visit suggest that the prevalence of at risk for overweight may be higher in children seen for a sick-child compared with well-child visit.
Since many children are only brought to medical attention when they are in need of urgent care, by omitting height and weight measurements at the time of a sick-child visit, physicians may miss the only opportunity of detecting the child who is at risk for overweight, and thus in need of preventative measures.
This cross-sectional study was conducted in 2 urban practices and 3 suburban practices located in Erie County, the largest and most populated area in western New York. These practices were chosen on the basis of their large size and demographics, reflective of the population and racial distribution in western New York. We included in the study children ages 6 months to 11 years seen for well-child visits and 2- to 5-year-old non-Hispanic white children seen for sick-child visits. The data (age, gender, race, weight, height/length), provided without any identifier, were collected by the pediatricians in patients seen sequentially during randomly selected days during the periods October 2003 to February 2004 and January 2006 without implementing any changes in their practice.
We excluded subjects with syndromes or chronic disorders or length or height above or below or 2.5 standard deviations (SD) from the mean for age and gender.
In children aged more than 2 years, “overweight” or “at risk for overweight” were defined as BMI >85th percentile or >95th percentile for age and gender, respectively, and compared with the National Health and Nutrition Examination Survey (NHANES) 1999 to 2002. In the 6- to 24-month group, we are presenting BMI data (weight/recumbent length squared) and comparing them with age-matched BMI data in NHANES 2001 to 2002.
We followed National Center for Health Statistics guidelines in estimating mean estimates software that incorporated the appropriate statistical weight for data collected at the Mobile Examination Center, taking into account the stratified multi-stage random sample design of NHANES 1999 to 2002. The study was approved by the Human Institutional Review Board of the Women and Children’s Hospital of Buffalo.
Acknowledgments
The author would like to thank the pediatric practices who collaborated in this study and are particularly grateful to Drs Cozza, Lana, Laws, McNally, Vaughan and Vetrano. The Authors are indebted to Mrs Sherry Ortiz for her assistance in the manuscript preparation. This work was presented in part at the 2004 Pediatric Academic Society Annual Meeting.
CORRESPONDENCE
Teresa Quattrin, MD, Chief, Division of Endocrinology/Diabetes, Women and Children’s Hospital of Buffalo, 219 Bryant Street, Buffalo, NY 14222. E-mail: [email protected]
1. Deckelbaum RJ, Williams CL. Childhood obesity: the health issue. Obes Res 2001;9 Suppl 4:239S-243S.
2. Baird J, Fisher D, Lucas P, Kleijnen J, Roberts H, Law C. Being big or growing fast: systematic review of size and growth in infancy and later obesity. BMJ 2005;331:929.-
3. Ogden CL, Troiano RP, Briefel RR, Kuczmarski RJ, Flegal KM, Johnson CL. Prevalence of overweight among pre-school children in the United States, 1971 through 1994. Pediatrics 1997;99:E1.-
4. Quattrin T, Liu E, Shaw N, Shine B, Chiang E. Obese children who are referred to the pediatric endocrinologist: characteristics and outcome. Pediatrics 2005;115:348-351.
5. Hedley AA, Ogden CL, Johnson CL, Carroll MD, Curtin LR, Flegal KM. Prevalence of overweight and obesity among US children adolescents and adults 1999-2002 JAMA 2004;291:2847-2850.
6. Ogden CL, Flegal KM, Carroll MD, Johnson CL. Prevalence and trends in overweight among US children and adolescents, 1999-2000. JAMA 2002;288:1728-1732.
7. Rolland-Cachera MF, Deheeger M, Bellisle F, Sempe M, Guilloud-Bataille M, Patois E. Adiposity rebound in children: a simple indicator for predicting obesity. Am J Clin Nutr 1984;39:129-135.
8. Whitaker RC, Pepe MS, Wright JA, Seidel KD, Dietz WH. Early adiposity rebound and the risk of adult obesity. Pediatrics 1998;101:E5.-
9. Charney E, Goodman HC, McBride M, Lyon B, Pratt R. Childhood antecedents of adult obesity. Do chubby infants become obese adults? N Engl J Med 1976;295:6-9.
10. Dietz WH. “Adiposity rebound”: reality or epiphenomenon? Lancet 2000;356:2027-2028.
11. Dietz WH, Robinson TN. Use of the body mass index (BMI) as a measure of overweight in children and adoles-cents. J Pediatr 1998;132:191-193.
12. Krebs NF, Jacobson MS. Prevention of pediatric over-weight and obesity. Pediatrics 2003;112:424-430.
13. Rifas-Shiman SL, Rich-Edwards JW, Scanlon KS, Kleinman KP, Gillman MW. Misdiagnosis of overweight and underweight children younger than 2 years of age due to length measurement bias. Medscape Gen Med 2005;7:56.-
14. Gauthier BM, Hickner JM, Noel MM. High prevalence of overweight children in Michigan primary care practices. An UPRNet study. Upper Peninsula Research Network. J Fam Pract 2000;49:73-76.
15. Gauthier BM, Hickner JM, Ornstein S. High prevalence of overweight children and adolescents in the Practice Partner Research Network. Arch Pediatr Adolesc Med 2000;154:625-628.
16. Weiss R, Caprio S. The metabolic consequences of childhood obesity. Best Pract Res Clin Endocrinol Metab 2005;19:405-419.
17. To T, Vydykhan TN, Dell S, Tassoudji M, Harris JK. Is obesity associated with asthma in young children? J Pediatr 2004;144:162-168.
18. Steinberger J, Moran A, Hong CP, Jacobs DR, Jr, Sinaiko AR. Adiposity in childhood predicts obesity and insulin resistance in young adulthood. J Pediatr 2001;138:469-473.
19. Epstein LH, Kuller LH, Wing RR, Valoski A, McCurley J. The effect of weight control on lipid changes in obese children. Am J Dis Child 1989;143:454-457.
20. Li S, Chen W, Srinivasan S, et al. Childhood cardiovascular risk factors and carotid vascular changes in adult-hood: The Bogalusa Heart Study. JAMA 2003;290:2271-2276.
Overweight youth: Changing behaviors that are barriers to health
- To motivate change, help parents to realize that overweight in their child is a health risk and not merely an aesthetic concern (C).
- Keep in mind that children can be motivated by different goals, such as increased athleticism, appearance, or social acceptance (C).
- Several short bursts of physical activity are usually more feasible than longer bouts, and may be more reinforcing for children and adolescents (C).
- Changing specific eating and activity behaviors is more realistic than setting a weight management goal (C).
My child doesn’t have a weight problem. We’re a family of big eaters, that’s all.” If you’ve heard this explanation or ones like it after raising a concern about a child’s weight, chances are you will encounter barriers to recognizing obesity and to changing the behavior that encourages it.
Even when parents and a significantly overweight child or adolescent acknowledge the problem, they may not achieve goals for good nutrition or activity. Treating childhood obesity requires identifying and removing the barriers to change.
In this paper, we identify 3 domains of weight management barriers—family, personal, and sociocultural—and offer possible solutions for dismantling the barriers.
Barriers to weight loss
Family: When parents make poor choices
Ideally parents would model a healthy lifestyle, provide a supportive home atmosphere, and reduce family stressors to facilitate weight reduction. However, parental behavior—even when well intentioned—often interferes with what’s best for the child.
For more original research on weight problems in children, see “Detecting overweight children in primary care: Do national data reflect the typical urban practice?”
If parents make inadequate nutritional choices and have a sedentary lifestyle, their children will mimic them. In fact, parent self-report of activity accounted for some of the variance in overweight youth’s physical activity.1
Parents’ food choices and purchasing behaviors may affect how their children purchase both healthy and unhealthy foods.2 Regular family mealtimes with nutritious foods will help adolescents learn to make more positive dietary choices and adopt healthy behaviors.3
In addition, the weight of mothers and fathers influences the weight of their children,4-6 and parent obesity is associated with less physical activity among children.7,8
Parental disciplinary strategies also affect children’s behavior. Authoritarian parents tend to engage in a battle of wills with children, creating standoffs—eg, when children are forced to sit at the table for hours to try fruits and vegetables or other new items.9
Authoritarian parenting was associated with the highest risk of overweight among young children.10 However, parental control of food intake and structured planning of healthy behaviors is not always negative.11,12
Parents often do not see their children as overweight even when they are. Parents may actually view heavy children as being healthy and a sign of successful parenting.4,13 They may use terms such as “thick” or “solid” rather than “overweight.” Some parents acknowledge weight problems only if their child is the object of teasing or exhibits physical limitations.14
Deflected responsibility. Furthermore, parents often attribute weight difficulties to an inherited propensity, citing multiple overweight family members while disregarding the influence of the home environment on weight status.15
Personal barriers: A need for empowerment
In a behaviorally oriented weight-control program for youth, significant predictors of weight loss were the child’s beliefs regarding personal control over weight, perceived difficulty of losing weight, attribution of obesity to their medical problems or family problems, and perceived willingness of family members to diet.16
Sometimes motivation is lacking. The importance of motivation in getting obese children to exercise is well established.7,17 Inaction may be due to a lack of information or to insufficient maturity to see that change is needed to protect health.
Psychosocial problems are more prevalent among overweight youth than among their peers at normal weight.18 In the past 10 years, published research on the psychiatric aspects of pediatric obesity shows increased rates of depression, anxiety, and low self-esteem,19 which can be significant barriers to change.20 Emotional difficulties can increase distress that contributes to binging and overeating,19 limit physical activity, and impair motivation to change by increasing helplessness and hopelessness.20,21
Comorbid physical conditions can affect activity goals (juvenile arthritis, hemophilia, asthma, etc) or dietary goals (diabetes, food allergies, etc).
Limited knowledge about nutrition and exercise can hinder behavioral change. Weight management goals, for instance, are often too broad or vague to be of help to children and their families. They need specific details. Much of the public misunderstands important nutritional concepts—portion size, balanced meal, metabolism, healthy eating, and low fat. For example, children believed a food product labeled “diet” was healthy.
Physical activity concepts are also often misunderstood by patients; for example, “screen time,” moderate intensity, cardiovascular fitness, and low impact. Using nutrition and activity terminology with patients does not guarantee good communication or goal achievement. Information and awareness, as well as myths and misinformation, were found to be barriers to weight improvement.22
Sociocultural barriers: A “fast food” culture and ever-present bias
Multiple studies have cited increased consumption of high energy/low cost foods including carbohydrates,23,24 fats, and sugars23,25 as a cause of child obesity. Many foods thought to be central to a healthy diet are perceived by some caregivers as too costly.9 The good taste, convenient preparation, and lower cost of foods with refined grains and added sugars and fats increase their popularity.26,27
Some neighborhood environments limit access to fruits and vegetables,28 resulting in increased rates of obesity. Restaurants, including the “fast food” kind, often serve large portions of unhealthy foods and thereby promote the ingestion of portions that are, literally, out of proportion to reason.29 Nutrient-dense lean meats, fish, and fruits and vegetables cost more per serving and do not satiate appetites as readily.
Unsafe neighborhoods cause significant anxiety in inner city parents and children30 and may discourage physical activity, thus increasing risk of overweight.31 In a study involving 20 large US cities, mothers’ perceptions of neighborhood safety related to their children’s television viewing time,32 and television viewing time has been shown to have a negative relationship to increased body mass index (BMI) in youth.33-35
Obese children may avoid physical activities that involve peers. Peers exert increasing influence on children and adolescents and ostracize those who are different. Bell et al showed that young children were less willing to engage an obese peer in physical activities,36 and overweight and obese children are more likely to be the victims of bullying as well as more likely to be the perpetrators of bullying than are normal weight peers.37
Although rates of childhood obesity among the general population are alarmingly high, they are higher still in ethnic minority and low-income communities.38 Low-income and minority children watch more television than white, non-poor children do. Neighborhoods where low-income and minority children live typically have more fast food restaurants and fewer vendors of healthful foods than do wealthier or predominantly white neighborhoods. Obstacles cited by Kumanyika38 are unsafe streets, dilapidated parks, and lack of facilities. In Hispanic youth, barriers in the school system include lack of facilities, equipment, and trained staff for physical education.39 Hispanic children are more sedentary than are white children40 and resultantly overweight.41
Enlist other caregivers to strengthen a treatment plan
We promote a multidisciplinary approach—the short- and long-term benefits of which are supported by data59—to treating overweight youth: parental involvement, nutrition education, physical activity education, and behavior modification.42 Coordination among the healthcare professionals is important to avoid giving mixed messages to patients and to learn what each discipline uniquely discovers about barriers and ways to surmount them. Combining perspectives and information should lead to a stronger treatment plan (FIGURE) and greater treatment success. Online resources like the USDA’s MyPyramid.gov, are available to clinicians who do not have access to multidisciplinary clinic facilities.
Parents’ attitudes influence the child
Assess the family’s level of concern and willingness to participate in a treatment plan.44-46 Parents’ involvement is critical, especially given that parental concern about weight is a predictor of change in total fat mass over time, at least in Caucasian children.14 Only when parents see a child’s weight as a health problem are they likely to be motivated toward changing.43
Research suggests that the parents’ attitude toward physical activity affects a child’s attitude toward physical activity.19,47 In fact, parent changes in BMI have been found to predict child changes in BMI for overweight youth.48
Clinicians need to inform and engage family members in the assessment and behavioral change processes, uncover erroneous belief systems, identify family dynamics that may affect treatment, and assess parenting skills. For instance, feeding children every time they say they are hungry might not be in their best interest, especially if the food is used to satiate or modify emotions and behaviors. Parents need to understand how their roles in addressing nutrition and physical activity change as their children move through different developmental periods,49 suggesting a flexible parenting style that evolves as the child ages.
One method to determine the parental choices and behavior is to ask parents to keep a record of what the child eats and in what portion size. How much and what kind of exercise does the child receive? Over time, patterns emerge that allow a clinician to formulate a treatment plan based on eating and physical activity modification.
FIGURE
Key steps in managing overweight in children and youths
Identify the personal goals that motivate a child
Overweight youth motivated to change are more likely to exercise7,17 and make healthier nutritional choices.50 A child in the preparation/action stage of change is highly motivated to make changes.43 Often multiple discussions are needed before a patient is ready to make changes. Keep in mind when having these discussions that patients can be motivated by different goals (increased athleticism, appearance, social acceptance).
For patients with comorbid medical disorders, modify nutrition and activity recommendations accordingly. Patients with emotional or behavioral disorders may need to see a psychologist or psychiatrist who can evaluate for and treat the issues.46 Psychologist-led group therapy sessions for the youth and/or their parents can also be helpful in providing support and positive peer modeling.51 If significant family stress or negative family dynamics are present, a referral for family therapy could be helpful.
Educate patients and caregivers about nutritional foods
Some patients and their families need assistance in learning how to buy healthful foods on a limited income. For others, learning how to budget and distribute food throughout the month is important.
Omar et al9 reported that male caregivers were most interested in learning about nutritional food choices, and that female caregivers were most interested in time-cutting measures for feeding their children. Caregivers, in general, relied on other family members for most nutrition information, some of which was inaccurate. This disparity among caregivers opens avenues for educating families, and in some cases must include the extended family. Furthermore, misunderstandings of the meanings of common terms can be avoided with a review or educational handouts.52
Finally, your advocacy for better laws, school policies, and social services can positively affect the cost of food, access to healthy foods, and neighborhood safety.
Provide physical activity choices
Provide a list of no-cost or low-cost options for exercise.52 With the child’s or teen’s input, list all the physical activities they enjoy7 and review other activities that they might like to try. Contact community centers and local parks and recreation services for a list of child-appropriate low-cost or no-cost physical activities available and add them to the list. Emphasizing activities that the child/teen finds enjoyable will enhance willingness to participate and consistency.
Sometimes, several short bursts of physical activity are more logistically possible than a longer bout, and may be more reinforcing for children and adolescents.53 Sothern et al54 recommend physical exercise that is both structured and progressive. Walking 15 minutes a day, 3 times a week, and gradually increasing the time and intensity is both structured and progressive.
Introduce behavior modification
Prioritize changes or goals. Changing specific eating and activity behaviors is more realistic than setting a weight management goal,44 because behaviors are easily identifiable, and changing them will likely yield health benefits before weight loss occurs.55 Overweight children need reminding that even if they maintain their weight, they will often grow in height, improving their BMI.
Once you have emphasized the importance of behavioral changes, set specific changes as goals. For example, “decrease intake of drinks containing sugar such as juice, sweet tea, or soft drinks to 1 or less per week” or “move from 0 minutes of physical activity to 15 minutes per day.” Move toward initial goals slowly so they can be achieved, and build positive momentum toward further changes. Assess nutrition and activity goals regularly and refine and revise goals as needed.
Carefully tracking progress toward treatment goals will also help you assess where additional barriers might be and motivate and energize patients who are making changes. When goals are not met, ask patients “why” in a nonjudgmental manner; this approach might disclose other unforeseen barriers and lead to a problem-solving discussion that can overcome them.
Traditional behavioral modification techniques apply to nutrition and physical activity changes. Rewarding progress can increase compliance and motivation to maintain changes and set new goals. Stimulus control techniques can also be helpful (eating at the table, not in front of the TV). Another technique that can work is making sedentary activities such as time spent in front of a television or computer contingent upon completion of physical activity.56,57 This technique, called the Premack Principle58 involves using a favorite, high-frequency activity as a reward for a behavior you would like to increase, such as physical activity. The patient is only allowed to engage in this favorite, high frequency activity as a reward for achieving a daily goal.
Conclusion: On transcending barriers to change
Multiple barriers to controlling childhood overweight are possible. Addressing weight status and related nutritional and activity behaviors is difficult if potential barriers are not recognized and addressed at the outset. Careful tracking of progress toward treatment goals is also important to find additional barriers and motivate patients. When goals are not met, asking the patients why in a nonjudgmental manner might disclose other unforeseen barriers and lead to a problem-solving discussion.
Data support the short- and long-term benefits of a multidisciplinary approach to treating overweight youth.59 Parents can help children change their eating and activity behaviors by modeling healthful behaviors, providing a home environment that makes it easy to make healthful choices, focusing less on weight and more on overall health, and providing a supportive environment for their children to enhance communication.60
Transcending the barriers to change involves lifestyle interventions. A multidisciplinary treatment approach is recommended, one that addresses family-centered treatment, nutrition and physical activity education, and behavior modification.61 Coordination between healthcare professionals is important to avoid giving mixed messages to patients. Combining perspectives and information should lead to a stronger treatment plan and greater treatment success.
CORRESPONDENCE
Wendy Ward-Begnoche, PhD, Assistant Professor, Department of Pediatrics, College of Medicine, University of Arkansas for Medical Sciences, 800 Marshall St. $ 512-21, Little Rock, AR 72202. E-mail: [email protected]
1. Epstein LH, Paluch RA, Coleman KJ, Vito D, Anderson K. Determinants of physical activity in obese children assessed by accelerometer and self-report. Med Sci Sports Exerc 1996;28:1157-1164.
2. Epstein LH, Dearing KK, Handley EA, Roemmich JN, Paluch RA. Relationship of mother and child food purchases as a function of price: a pilot study. Appetite 2006;47:115-118.
3. Cason KL. Family mealtimes: more than just eating together. J Am Diet Assoc 2006;106:532-533.
4. Baughcum AE, Chamberlin LA, Deeks CM, Powers SW, Whitaker RC. Maternal perceptions of overweight preschool children. Pediatrics 2000;106:1380-1386.
5. Golan M, Weizman A, Fainaru M. Impact of treatment for childhood obesity on parental risk factors for cardiovascular disease. Prev Med 1999;29:519-526.
6. Strauss RS, Knight J. Influence of the home environment on the development of obesity in children. Pediatrics 1999;103(6):e85-92.
7. Sallis J, Prochaska JJ, Taylor WC. A review of correlates of physical activity of children and adolescents. Med Sci Sports Exerc 2000;32:963-975.
8. Treuth MS, Butte NF, Adolph AL, Puyau MR. A longitudinal study of fitness and activity in girls predisposed to obesity. Med Sci Sports Exerc 2004;36:198-204.
9. Omar MA, Coleman G, Hoerr S. Healthy eating for rural low-income toddlers: caregivers’ perceptions. J Community Health Nurs 2001;18:93-106.
10. Rhee KE, Lumeng JC, Appugliese DP, Kaciroti N, Bradley RH. Parenting styles and overweight status in first grade. Pediatrics 2006;117:2047-2054.
11. Chen JL, Kennedy C. Family functioning parenting style and Chinese children’s weight status. J Fam Nursing 2004;10:262-279.
12. Ogden J, Reynolds R, Smith A. Expanding the concept of parental control: a role for overt and covert control in children’s snacking behaviour? Appetite 2006;7(1):100-106.
13. Adams AK, Quinn RA, Prince RJ. Low recognition of childhood overweight and disease risk among Native-American caregivers. Obes Res 2005;13:146-152.
14. Jain A, Sherman SN, Chamberlin LA, Carter Y, Powers SW, Whitaker RC. Why don’t low-income mothers worry about their preschoolers being overweight? Pediatrics 2001;107:1138-1146.
15. Faulkner MS. Low income mothers of overweight children had personal and environmental challenges in preventing and managing obesity. Evidence-Based Nursing 2002;5:27.-
16. Uzark KC, Becker MH, Dielman TE, Rocchini AP. Psychosocial predictors of compliance with a weight control intervention for obese children and adolescents. J Compliance Health Care 1987;2:167-178.
17. McWhorter JW, Wallmann HW, Alpert PT. The obese child: motivation as a tool for exercise. J Pediatr Healthcare 2003;17:11-17.
18. Young-Hyman D, Schlundt DG, Herman-Wenderoth L, Bozylinski K. Obesity appearance and psychosocial adaptation on young African American children. J Pediatr Psychol 2003;28:463-472.
19. Zametkin AJ, Zoon CK, Klein HW, Munson S. Psychiatric aspects of child and adolescent obesity: a review of the past 10 years. J Am Acad Child Adolesc Psychiatry 2004;43:134-150.
20. Strauss RS. Childhood obesity and self-esteem. Pediatrics 2000;105:e15-19.
21. Pesa JA, Syre TR, Jones E. Psychosocial differences associated with body weight among female adolescents: the importance of body image. J Adolesc Health 2000;26:330-337.
22. Hesketh K, Waters E, Green J, Salmon L, Williams J. Healthy eating activity and obesity prevention: a qualitative study of parent and child perceptions in Australia. Health Promotion Intl 2005;20:19-26.
23. Nicklas TA, Yang S-J, Baranowski T, Zakeri I, Berenson G. Eating patterns and obesity in children: the Bogalusa heart study. Am J Prev Med 2003;25:9-16.
24. Nielsen BM, Bjørnsbo K, Tetens I, Heitmann BL. Dietary glycaemic index and glycaemic load in Danish children in relation to body fatness. Br J Nutr 2005;94:992-997.
25. Troiano RP, Briefel RR, Carroll MD, Bailostosky K. Energy and fat intakes of children and adolescents in the United States: data from the National Health and Nutrition Examination Surveys. Am J Clin Nutr 2000;72(Suppl):1343S-1353S.
26. Drewnowski A, Darmon N. The economics of obesity: dietary energy density and energy cost. Am J Clin Nutr 2005;82:265S-273S.
27. Drewnowski A, Specter SE. Poverty and obesity: the role of energy density and energy costs. Am J Clin Nutr 2004;79:6-16.
28. Sallis JF, Glanz K. The role of built environments in physical activity eating and obesity in childhood. Future Child 2006;16:89-108.
29. Young LR, Nestle M. Expanding portion sizes in the US marketplace: implications for nutrition counseling. J Am Diet Assoc 2003;103:231-234.
30. Weir LA, Etelson D, Brand DA. Parents’ perceptions of neighborhood safety and children’s physical activity. Prev Med 2006;43:212-217.
31. Lumeng J. What can we do to prevent childhood obesity? Zero to Three 2005;25:13-19.
32. Burdette HL, Whitaker RC. A national study of neighborhood safety outdoor play television viewing and obesity in preschool children. Pediatrics 2005;116:657-662.
33. Andersen RE, Crespo CJ, Bartlett SJ, Cheskin LJ, Pratt M. Relationship of physical activity and television watching with body weight and level of fatness among children. JAMA 1998;279:938-942.
34. Proctor MH, Moore LL, Gao D, et al. Television viewing and change in body fat from preschool to early adolescence: the Framingham Children’s Study. Int J Obes 2003;27:827-833.
35. Salmon J, Campbell KJ, Crawford DA. Television viewing habits associated with obesity risk factors: a survey of Melbourne schoolchildren. Med J Aust 2006;184:64-67.
36. Bell SK, Morgan SB. Children’s attitudes and behavioral intentions toward a peer presented as obese: does a medical explanation for the obesity make a difference? J Pediatr Psychol 2000;25:137-145.
37. Janssen I, Craig WM, Boyce WF, Pickett W. Associations between overweight and obesity with bullying behaviors in school-aged children. Pediatrics 2004;113:1187-1194.
38. Kumanyika S, Grier S. Targeting interventions for ethnic minority and low-income populations. Future Child 2006;16:187-207.
39. Thompson JL, Davis SM, Gittelsohn J, et al. Patterns of physical activity among American Indian children: An assessment of barriers and support. J Comm Health 2001;26:407-421.
40. Mirza NM, Kadow K, Palmer M, Solano H, Rosche C, Yanovski JA. Prevalence of overweight among inner city Hispanic-American children and adolescents. Obes Res 2004;12:1298-1310.
41. Ritchie LD, Ivey SL, Woodward-Lopez G, Crawford PB. Alarming trends in pediatric overweight in the United States. Soz Praventivmed 2003;48:168-177.
42. Jefferson A. Breaking down barriers—examining health promoting behaviour in the family. Kellogg’s Family Health Study 2005. Nutr Bull 2006;31:60-64.
43. Rhee KE, DeLago CW, Arscott-Mills T, Mehta SD, Davis RK. Factors associated with parental readiness to make changes for overweight children. Pediatrics 2005;116:e94-101.
44. Dietz WH. Childhood obesity: susceptibility cause and management. J Pediatr 1983;103:676-686.
45. Epstein LH, Valoski A, Wing RR, McCurley J. Ten-year outcomes of behavioral family-based treatment for childhood obesity. Health Psychol 1994;13:373-383.
46. Vila F, Zipper E, Dabbas M, et al. Mental disorders in obese children and adolescents. Psychosom Med 2004;66:387-394.
47. Levine MD, Ringham RM, Kalarchian MA, Wisniewski L, Marcus MD. Is family-based behavioral weight control appropriate for severe pediatric obesity? Int J Eat Disord 2001;30:318-328.
48. Wrotniak BH, Epstein LH, Paluch RA, Roemmich JN. Parent weight change as a predictor of child weight change in family-based behavioral obesity treatment. Arch Pediatr Adolesc Med 2004;158:342-347.
49. Lindsay AC, Sussner KM, Kim J, Gortmaker SL. The role of parents in preventing childhood obesity. Future Child 2006;16:169-186.
50. Carruth BR, Skinner JD. The role of dietary calcium and other nutrients in moderating body fat in preschool children. Int J Obes 2001;25:559-566.
51. Eissa MAH, Gunner KB. Evaluation and management of obesity in children and adolescents. J Pediatr Health Care 2003;18:35-38.
52. Ward-Begnoche W, Gance-Cleveland B. Promoting behavioral change in overweight youth. J Pediatr Health Care 2005;19:318-328.
53. Epstein LH, Paluch RA, Kalakanis LE, Goldfield GS, Cerny FJ, Roemmich JN. How much activity do youth get? A quantitative review of heart-rate measured activity. Pediatrics 2001;108:e44.-
54. Sothern MS, Hunter S, Suskind RM, Brown R, Udall JN, Blecker U. Motivating the obese child to move: the role of structured exercise in pediatric weight management. South Med J 1999;92:577-584.
55. Franz MJ, Bantle JP, Beebe CA, Brunzell JD, Chiasson J-L, Garg A, et al. Evidence-based nutrition principles and recommendations for the treatment and prevention of diabetes and related complications. Diabetes Care 2002;25:148-198.
56. Faith M, Berman N, Heo M, et al. Effects of contingent television on physical activity and television viewing in obese children. Pediatrics 2001;107:1043-1048.
57. Goldfield GS, Kalakanis LE, Ernst MM, Epstein LH. Open-loop feedback to increase physical activity on obese children. Int J Obes 2000;24:888-892.
58. Premack D. Reversibility of the reinforcement relation. Science 1962;136:255-257.
59. Nemet D, Barkan S, Epstein Y, Friedland O, Kowen G, Eliakim A. Short- and long-term beneficial effects of a combined dietary-behavioral-physical activity intervention for the treatment of childhood obesity. Pediatrics 2005;115:e443-449.
60. Neumark-Sztainer D. Preventing the broad spectrum of weight-related problems: working with parents to help teens achieve a healthy weight and a positive body image. J Nutr Educ Behav 2005;37(Suppl 2):S135-S139.
61. Flodmark C-E, Lissau I, Moreno LA, Pietrobelli A, Widhalm K. New insights into the field of children and adolescents’ obesity: the European perspective. Int J Obes 2004;28:1189-1196.
- To motivate change, help parents to realize that overweight in their child is a health risk and not merely an aesthetic concern (C).
- Keep in mind that children can be motivated by different goals, such as increased athleticism, appearance, or social acceptance (C).
- Several short bursts of physical activity are usually more feasible than longer bouts, and may be more reinforcing for children and adolescents (C).
- Changing specific eating and activity behaviors is more realistic than setting a weight management goal (C).
My child doesn’t have a weight problem. We’re a family of big eaters, that’s all.” If you’ve heard this explanation or ones like it after raising a concern about a child’s weight, chances are you will encounter barriers to recognizing obesity and to changing the behavior that encourages it.
Even when parents and a significantly overweight child or adolescent acknowledge the problem, they may not achieve goals for good nutrition or activity. Treating childhood obesity requires identifying and removing the barriers to change.
In this paper, we identify 3 domains of weight management barriers—family, personal, and sociocultural—and offer possible solutions for dismantling the barriers.
Barriers to weight loss
Family: When parents make poor choices
Ideally parents would model a healthy lifestyle, provide a supportive home atmosphere, and reduce family stressors to facilitate weight reduction. However, parental behavior—even when well intentioned—often interferes with what’s best for the child.
For more original research on weight problems in children, see “Detecting overweight children in primary care: Do national data reflect the typical urban practice?”
If parents make inadequate nutritional choices and have a sedentary lifestyle, their children will mimic them. In fact, parent self-report of activity accounted for some of the variance in overweight youth’s physical activity.1
Parents’ food choices and purchasing behaviors may affect how their children purchase both healthy and unhealthy foods.2 Regular family mealtimes with nutritious foods will help adolescents learn to make more positive dietary choices and adopt healthy behaviors.3
In addition, the weight of mothers and fathers influences the weight of their children,4-6 and parent obesity is associated with less physical activity among children.7,8
Parental disciplinary strategies also affect children’s behavior. Authoritarian parents tend to engage in a battle of wills with children, creating standoffs—eg, when children are forced to sit at the table for hours to try fruits and vegetables or other new items.9
Authoritarian parenting was associated with the highest risk of overweight among young children.10 However, parental control of food intake and structured planning of healthy behaviors is not always negative.11,12
Parents often do not see their children as overweight even when they are. Parents may actually view heavy children as being healthy and a sign of successful parenting.4,13 They may use terms such as “thick” or “solid” rather than “overweight.” Some parents acknowledge weight problems only if their child is the object of teasing or exhibits physical limitations.14
Deflected responsibility. Furthermore, parents often attribute weight difficulties to an inherited propensity, citing multiple overweight family members while disregarding the influence of the home environment on weight status.15
Personal barriers: A need for empowerment
In a behaviorally oriented weight-control program for youth, significant predictors of weight loss were the child’s beliefs regarding personal control over weight, perceived difficulty of losing weight, attribution of obesity to their medical problems or family problems, and perceived willingness of family members to diet.16
Sometimes motivation is lacking. The importance of motivation in getting obese children to exercise is well established.7,17 Inaction may be due to a lack of information or to insufficient maturity to see that change is needed to protect health.
Psychosocial problems are more prevalent among overweight youth than among their peers at normal weight.18 In the past 10 years, published research on the psychiatric aspects of pediatric obesity shows increased rates of depression, anxiety, and low self-esteem,19 which can be significant barriers to change.20 Emotional difficulties can increase distress that contributes to binging and overeating,19 limit physical activity, and impair motivation to change by increasing helplessness and hopelessness.20,21
Comorbid physical conditions can affect activity goals (juvenile arthritis, hemophilia, asthma, etc) or dietary goals (diabetes, food allergies, etc).
Limited knowledge about nutrition and exercise can hinder behavioral change. Weight management goals, for instance, are often too broad or vague to be of help to children and their families. They need specific details. Much of the public misunderstands important nutritional concepts—portion size, balanced meal, metabolism, healthy eating, and low fat. For example, children believed a food product labeled “diet” was healthy.
Physical activity concepts are also often misunderstood by patients; for example, “screen time,” moderate intensity, cardiovascular fitness, and low impact. Using nutrition and activity terminology with patients does not guarantee good communication or goal achievement. Information and awareness, as well as myths and misinformation, were found to be barriers to weight improvement.22
Sociocultural barriers: A “fast food” culture and ever-present bias
Multiple studies have cited increased consumption of high energy/low cost foods including carbohydrates,23,24 fats, and sugars23,25 as a cause of child obesity. Many foods thought to be central to a healthy diet are perceived by some caregivers as too costly.9 The good taste, convenient preparation, and lower cost of foods with refined grains and added sugars and fats increase their popularity.26,27
Some neighborhood environments limit access to fruits and vegetables,28 resulting in increased rates of obesity. Restaurants, including the “fast food” kind, often serve large portions of unhealthy foods and thereby promote the ingestion of portions that are, literally, out of proportion to reason.29 Nutrient-dense lean meats, fish, and fruits and vegetables cost more per serving and do not satiate appetites as readily.
Unsafe neighborhoods cause significant anxiety in inner city parents and children30 and may discourage physical activity, thus increasing risk of overweight.31 In a study involving 20 large US cities, mothers’ perceptions of neighborhood safety related to their children’s television viewing time,32 and television viewing time has been shown to have a negative relationship to increased body mass index (BMI) in youth.33-35
Obese children may avoid physical activities that involve peers. Peers exert increasing influence on children and adolescents and ostracize those who are different. Bell et al showed that young children were less willing to engage an obese peer in physical activities,36 and overweight and obese children are more likely to be the victims of bullying as well as more likely to be the perpetrators of bullying than are normal weight peers.37
Although rates of childhood obesity among the general population are alarmingly high, they are higher still in ethnic minority and low-income communities.38 Low-income and minority children watch more television than white, non-poor children do. Neighborhoods where low-income and minority children live typically have more fast food restaurants and fewer vendors of healthful foods than do wealthier or predominantly white neighborhoods. Obstacles cited by Kumanyika38 are unsafe streets, dilapidated parks, and lack of facilities. In Hispanic youth, barriers in the school system include lack of facilities, equipment, and trained staff for physical education.39 Hispanic children are more sedentary than are white children40 and resultantly overweight.41
Enlist other caregivers to strengthen a treatment plan
We promote a multidisciplinary approach—the short- and long-term benefits of which are supported by data59—to treating overweight youth: parental involvement, nutrition education, physical activity education, and behavior modification.42 Coordination among the healthcare professionals is important to avoid giving mixed messages to patients and to learn what each discipline uniquely discovers about barriers and ways to surmount them. Combining perspectives and information should lead to a stronger treatment plan (FIGURE) and greater treatment success. Online resources like the USDA’s MyPyramid.gov, are available to clinicians who do not have access to multidisciplinary clinic facilities.
Parents’ attitudes influence the child
Assess the family’s level of concern and willingness to participate in a treatment plan.44-46 Parents’ involvement is critical, especially given that parental concern about weight is a predictor of change in total fat mass over time, at least in Caucasian children.14 Only when parents see a child’s weight as a health problem are they likely to be motivated toward changing.43
Research suggests that the parents’ attitude toward physical activity affects a child’s attitude toward physical activity.19,47 In fact, parent changes in BMI have been found to predict child changes in BMI for overweight youth.48
Clinicians need to inform and engage family members in the assessment and behavioral change processes, uncover erroneous belief systems, identify family dynamics that may affect treatment, and assess parenting skills. For instance, feeding children every time they say they are hungry might not be in their best interest, especially if the food is used to satiate or modify emotions and behaviors. Parents need to understand how their roles in addressing nutrition and physical activity change as their children move through different developmental periods,49 suggesting a flexible parenting style that evolves as the child ages.
One method to determine the parental choices and behavior is to ask parents to keep a record of what the child eats and in what portion size. How much and what kind of exercise does the child receive? Over time, patterns emerge that allow a clinician to formulate a treatment plan based on eating and physical activity modification.
FIGURE
Key steps in managing overweight in children and youths
Identify the personal goals that motivate a child
Overweight youth motivated to change are more likely to exercise7,17 and make healthier nutritional choices.50 A child in the preparation/action stage of change is highly motivated to make changes.43 Often multiple discussions are needed before a patient is ready to make changes. Keep in mind when having these discussions that patients can be motivated by different goals (increased athleticism, appearance, social acceptance).
For patients with comorbid medical disorders, modify nutrition and activity recommendations accordingly. Patients with emotional or behavioral disorders may need to see a psychologist or psychiatrist who can evaluate for and treat the issues.46 Psychologist-led group therapy sessions for the youth and/or their parents can also be helpful in providing support and positive peer modeling.51 If significant family stress or negative family dynamics are present, a referral for family therapy could be helpful.
Educate patients and caregivers about nutritional foods
Some patients and their families need assistance in learning how to buy healthful foods on a limited income. For others, learning how to budget and distribute food throughout the month is important.
Omar et al9 reported that male caregivers were most interested in learning about nutritional food choices, and that female caregivers were most interested in time-cutting measures for feeding their children. Caregivers, in general, relied on other family members for most nutrition information, some of which was inaccurate. This disparity among caregivers opens avenues for educating families, and in some cases must include the extended family. Furthermore, misunderstandings of the meanings of common terms can be avoided with a review or educational handouts.52
Finally, your advocacy for better laws, school policies, and social services can positively affect the cost of food, access to healthy foods, and neighborhood safety.
Provide physical activity choices
Provide a list of no-cost or low-cost options for exercise.52 With the child’s or teen’s input, list all the physical activities they enjoy7 and review other activities that they might like to try. Contact community centers and local parks and recreation services for a list of child-appropriate low-cost or no-cost physical activities available and add them to the list. Emphasizing activities that the child/teen finds enjoyable will enhance willingness to participate and consistency.
Sometimes, several short bursts of physical activity are more logistically possible than a longer bout, and may be more reinforcing for children and adolescents.53 Sothern et al54 recommend physical exercise that is both structured and progressive. Walking 15 minutes a day, 3 times a week, and gradually increasing the time and intensity is both structured and progressive.
Introduce behavior modification
Prioritize changes or goals. Changing specific eating and activity behaviors is more realistic than setting a weight management goal,44 because behaviors are easily identifiable, and changing them will likely yield health benefits before weight loss occurs.55 Overweight children need reminding that even if they maintain their weight, they will often grow in height, improving their BMI.
Once you have emphasized the importance of behavioral changes, set specific changes as goals. For example, “decrease intake of drinks containing sugar such as juice, sweet tea, or soft drinks to 1 or less per week” or “move from 0 minutes of physical activity to 15 minutes per day.” Move toward initial goals slowly so they can be achieved, and build positive momentum toward further changes. Assess nutrition and activity goals regularly and refine and revise goals as needed.
Carefully tracking progress toward treatment goals will also help you assess where additional barriers might be and motivate and energize patients who are making changes. When goals are not met, ask patients “why” in a nonjudgmental manner; this approach might disclose other unforeseen barriers and lead to a problem-solving discussion that can overcome them.
Traditional behavioral modification techniques apply to nutrition and physical activity changes. Rewarding progress can increase compliance and motivation to maintain changes and set new goals. Stimulus control techniques can also be helpful (eating at the table, not in front of the TV). Another technique that can work is making sedentary activities such as time spent in front of a television or computer contingent upon completion of physical activity.56,57 This technique, called the Premack Principle58 involves using a favorite, high-frequency activity as a reward for a behavior you would like to increase, such as physical activity. The patient is only allowed to engage in this favorite, high frequency activity as a reward for achieving a daily goal.
Conclusion: On transcending barriers to change
Multiple barriers to controlling childhood overweight are possible. Addressing weight status and related nutritional and activity behaviors is difficult if potential barriers are not recognized and addressed at the outset. Careful tracking of progress toward treatment goals is also important to find additional barriers and motivate patients. When goals are not met, asking the patients why in a nonjudgmental manner might disclose other unforeseen barriers and lead to a problem-solving discussion.
Data support the short- and long-term benefits of a multidisciplinary approach to treating overweight youth.59 Parents can help children change their eating and activity behaviors by modeling healthful behaviors, providing a home environment that makes it easy to make healthful choices, focusing less on weight and more on overall health, and providing a supportive environment for their children to enhance communication.60
Transcending the barriers to change involves lifestyle interventions. A multidisciplinary treatment approach is recommended, one that addresses family-centered treatment, nutrition and physical activity education, and behavior modification.61 Coordination between healthcare professionals is important to avoid giving mixed messages to patients. Combining perspectives and information should lead to a stronger treatment plan and greater treatment success.
CORRESPONDENCE
Wendy Ward-Begnoche, PhD, Assistant Professor, Department of Pediatrics, College of Medicine, University of Arkansas for Medical Sciences, 800 Marshall St. $ 512-21, Little Rock, AR 72202. E-mail: [email protected]
1. Epstein LH, Paluch RA, Coleman KJ, Vito D, Anderson K. Determinants of physical activity in obese children assessed by accelerometer and self-report. Med Sci Sports Exerc 1996;28:1157-1164.
2. Epstein LH, Dearing KK, Handley EA, Roemmich JN, Paluch RA. Relationship of mother and child food purchases as a function of price: a pilot study. Appetite 2006;47:115-118.
3. Cason KL. Family mealtimes: more than just eating together. J Am Diet Assoc 2006;106:532-533.
4. Baughcum AE, Chamberlin LA, Deeks CM, Powers SW, Whitaker RC. Maternal perceptions of overweight preschool children. Pediatrics 2000;106:1380-1386.
5. Golan M, Weizman A, Fainaru M. Impact of treatment for childhood obesity on parental risk factors for cardiovascular disease. Prev Med 1999;29:519-526.
6. Strauss RS, Knight J. Influence of the home environment on the development of obesity in children. Pediatrics 1999;103(6):e85-92.
7. Sallis J, Prochaska JJ, Taylor WC. A review of correlates of physical activity of children and adolescents. Med Sci Sports Exerc 2000;32:963-975.
8. Treuth MS, Butte NF, Adolph AL, Puyau MR. A longitudinal study of fitness and activity in girls predisposed to obesity. Med Sci Sports Exerc 2004;36:198-204.
9. Omar MA, Coleman G, Hoerr S. Healthy eating for rural low-income toddlers: caregivers’ perceptions. J Community Health Nurs 2001;18:93-106.
10. Rhee KE, Lumeng JC, Appugliese DP, Kaciroti N, Bradley RH. Parenting styles and overweight status in first grade. Pediatrics 2006;117:2047-2054.
11. Chen JL, Kennedy C. Family functioning parenting style and Chinese children’s weight status. J Fam Nursing 2004;10:262-279.
12. Ogden J, Reynolds R, Smith A. Expanding the concept of parental control: a role for overt and covert control in children’s snacking behaviour? Appetite 2006;7(1):100-106.
13. Adams AK, Quinn RA, Prince RJ. Low recognition of childhood overweight and disease risk among Native-American caregivers. Obes Res 2005;13:146-152.
14. Jain A, Sherman SN, Chamberlin LA, Carter Y, Powers SW, Whitaker RC. Why don’t low-income mothers worry about their preschoolers being overweight? Pediatrics 2001;107:1138-1146.
15. Faulkner MS. Low income mothers of overweight children had personal and environmental challenges in preventing and managing obesity. Evidence-Based Nursing 2002;5:27.-
16. Uzark KC, Becker MH, Dielman TE, Rocchini AP. Psychosocial predictors of compliance with a weight control intervention for obese children and adolescents. J Compliance Health Care 1987;2:167-178.
17. McWhorter JW, Wallmann HW, Alpert PT. The obese child: motivation as a tool for exercise. J Pediatr Healthcare 2003;17:11-17.
18. Young-Hyman D, Schlundt DG, Herman-Wenderoth L, Bozylinski K. Obesity appearance and psychosocial adaptation on young African American children. J Pediatr Psychol 2003;28:463-472.
19. Zametkin AJ, Zoon CK, Klein HW, Munson S. Psychiatric aspects of child and adolescent obesity: a review of the past 10 years. J Am Acad Child Adolesc Psychiatry 2004;43:134-150.
20. Strauss RS. Childhood obesity and self-esteem. Pediatrics 2000;105:e15-19.
21. Pesa JA, Syre TR, Jones E. Psychosocial differences associated with body weight among female adolescents: the importance of body image. J Adolesc Health 2000;26:330-337.
22. Hesketh K, Waters E, Green J, Salmon L, Williams J. Healthy eating activity and obesity prevention: a qualitative study of parent and child perceptions in Australia. Health Promotion Intl 2005;20:19-26.
23. Nicklas TA, Yang S-J, Baranowski T, Zakeri I, Berenson G. Eating patterns and obesity in children: the Bogalusa heart study. Am J Prev Med 2003;25:9-16.
24. Nielsen BM, Bjørnsbo K, Tetens I, Heitmann BL. Dietary glycaemic index and glycaemic load in Danish children in relation to body fatness. Br J Nutr 2005;94:992-997.
25. Troiano RP, Briefel RR, Carroll MD, Bailostosky K. Energy and fat intakes of children and adolescents in the United States: data from the National Health and Nutrition Examination Surveys. Am J Clin Nutr 2000;72(Suppl):1343S-1353S.
26. Drewnowski A, Darmon N. The economics of obesity: dietary energy density and energy cost. Am J Clin Nutr 2005;82:265S-273S.
27. Drewnowski A, Specter SE. Poverty and obesity: the role of energy density and energy costs. Am J Clin Nutr 2004;79:6-16.
28. Sallis JF, Glanz K. The role of built environments in physical activity eating and obesity in childhood. Future Child 2006;16:89-108.
29. Young LR, Nestle M. Expanding portion sizes in the US marketplace: implications for nutrition counseling. J Am Diet Assoc 2003;103:231-234.
30. Weir LA, Etelson D, Brand DA. Parents’ perceptions of neighborhood safety and children’s physical activity. Prev Med 2006;43:212-217.
31. Lumeng J. What can we do to prevent childhood obesity? Zero to Three 2005;25:13-19.
32. Burdette HL, Whitaker RC. A national study of neighborhood safety outdoor play television viewing and obesity in preschool children. Pediatrics 2005;116:657-662.
33. Andersen RE, Crespo CJ, Bartlett SJ, Cheskin LJ, Pratt M. Relationship of physical activity and television watching with body weight and level of fatness among children. JAMA 1998;279:938-942.
34. Proctor MH, Moore LL, Gao D, et al. Television viewing and change in body fat from preschool to early adolescence: the Framingham Children’s Study. Int J Obes 2003;27:827-833.
35. Salmon J, Campbell KJ, Crawford DA. Television viewing habits associated with obesity risk factors: a survey of Melbourne schoolchildren. Med J Aust 2006;184:64-67.
36. Bell SK, Morgan SB. Children’s attitudes and behavioral intentions toward a peer presented as obese: does a medical explanation for the obesity make a difference? J Pediatr Psychol 2000;25:137-145.
37. Janssen I, Craig WM, Boyce WF, Pickett W. Associations between overweight and obesity with bullying behaviors in school-aged children. Pediatrics 2004;113:1187-1194.
38. Kumanyika S, Grier S. Targeting interventions for ethnic minority and low-income populations. Future Child 2006;16:187-207.
39. Thompson JL, Davis SM, Gittelsohn J, et al. Patterns of physical activity among American Indian children: An assessment of barriers and support. J Comm Health 2001;26:407-421.
40. Mirza NM, Kadow K, Palmer M, Solano H, Rosche C, Yanovski JA. Prevalence of overweight among inner city Hispanic-American children and adolescents. Obes Res 2004;12:1298-1310.
41. Ritchie LD, Ivey SL, Woodward-Lopez G, Crawford PB. Alarming trends in pediatric overweight in the United States. Soz Praventivmed 2003;48:168-177.
42. Jefferson A. Breaking down barriers—examining health promoting behaviour in the family. Kellogg’s Family Health Study 2005. Nutr Bull 2006;31:60-64.
43. Rhee KE, DeLago CW, Arscott-Mills T, Mehta SD, Davis RK. Factors associated with parental readiness to make changes for overweight children. Pediatrics 2005;116:e94-101.
44. Dietz WH. Childhood obesity: susceptibility cause and management. J Pediatr 1983;103:676-686.
45. Epstein LH, Valoski A, Wing RR, McCurley J. Ten-year outcomes of behavioral family-based treatment for childhood obesity. Health Psychol 1994;13:373-383.
46. Vila F, Zipper E, Dabbas M, et al. Mental disorders in obese children and adolescents. Psychosom Med 2004;66:387-394.
47. Levine MD, Ringham RM, Kalarchian MA, Wisniewski L, Marcus MD. Is family-based behavioral weight control appropriate for severe pediatric obesity? Int J Eat Disord 2001;30:318-328.
48. Wrotniak BH, Epstein LH, Paluch RA, Roemmich JN. Parent weight change as a predictor of child weight change in family-based behavioral obesity treatment. Arch Pediatr Adolesc Med 2004;158:342-347.
49. Lindsay AC, Sussner KM, Kim J, Gortmaker SL. The role of parents in preventing childhood obesity. Future Child 2006;16:169-186.
50. Carruth BR, Skinner JD. The role of dietary calcium and other nutrients in moderating body fat in preschool children. Int J Obes 2001;25:559-566.
51. Eissa MAH, Gunner KB. Evaluation and management of obesity in children and adolescents. J Pediatr Health Care 2003;18:35-38.
52. Ward-Begnoche W, Gance-Cleveland B. Promoting behavioral change in overweight youth. J Pediatr Health Care 2005;19:318-328.
53. Epstein LH, Paluch RA, Kalakanis LE, Goldfield GS, Cerny FJ, Roemmich JN. How much activity do youth get? A quantitative review of heart-rate measured activity. Pediatrics 2001;108:e44.-
54. Sothern MS, Hunter S, Suskind RM, Brown R, Udall JN, Blecker U. Motivating the obese child to move: the role of structured exercise in pediatric weight management. South Med J 1999;92:577-584.
55. Franz MJ, Bantle JP, Beebe CA, Brunzell JD, Chiasson J-L, Garg A, et al. Evidence-based nutrition principles and recommendations for the treatment and prevention of diabetes and related complications. Diabetes Care 2002;25:148-198.
56. Faith M, Berman N, Heo M, et al. Effects of contingent television on physical activity and television viewing in obese children. Pediatrics 2001;107:1043-1048.
57. Goldfield GS, Kalakanis LE, Ernst MM, Epstein LH. Open-loop feedback to increase physical activity on obese children. Int J Obes 2000;24:888-892.
58. Premack D. Reversibility of the reinforcement relation. Science 1962;136:255-257.
59. Nemet D, Barkan S, Epstein Y, Friedland O, Kowen G, Eliakim A. Short- and long-term beneficial effects of a combined dietary-behavioral-physical activity intervention for the treatment of childhood obesity. Pediatrics 2005;115:e443-449.
60. Neumark-Sztainer D. Preventing the broad spectrum of weight-related problems: working with parents to help teens achieve a healthy weight and a positive body image. J Nutr Educ Behav 2005;37(Suppl 2):S135-S139.
61. Flodmark C-E, Lissau I, Moreno LA, Pietrobelli A, Widhalm K. New insights into the field of children and adolescents’ obesity: the European perspective. Int J Obes 2004;28:1189-1196.
Which tympanometer is optimal for an outpatient primary care setting?
- Four tympanometers are suitable for outpatient primary care, and each has positive and negative attributes. The Earscan was rated easiest to use and provided the most consistent data.
In a primary care setting where patient volume, time constraints, and provider turnover are on the increase, you need dependable biomedical equipment that produces quality data and is easy to use, ergonomic, and affordable. This is certainly true of the tympanometer, which is used to measure mobility and impedance of the tympanic membrane and ossicles, provide an objective measurement of the middle ear, augment visual and pneumatic otoscopy, and confirm and document otitis media with effusion (OME) and acute otitis media (AOM).1-3 Our study aimed to determine which tympanometer is optimal in the outpatient primary care setting.
Based on objective and subjective analysis, the Earscan appears to be an excellent choice for outpatient primary care, though users also liked the MT 10 and GSI 37.
Four units made initial cut
Of 16 tympanometers we found through a review of market literature, an Internet search, and audiology recommendations, 4 met the minimum requirements (TABLE 1)—Earscan (www.microaud.com), GSI 37 (www.viasyshealthcare.com), MicroTymp 2 (www.welchallyn.com) and MT 10 (www.interacoustics-us.com).
TABLE 1
Tympanometers had to meet these minimum requirements to be considered
| 1. COMPLIANCE |
| Pressure measurement: +200 to –300 daPa |
| Sound frequency: 226 Hz ±3% |
| Sound amplitude: 85 dB SPL ±3dB |
| 2. PRESSURE PUMP |
| Accuracy: ±15% or 10 daPa (or better) |
| Positive to negative pressure sweep |
| 3. DATA DISPLAY |
| Screen size: 2.5 cm × 2.5 cm |
| Horizontal axis (pressure): +200 to –300 daPa |
| Vertical axis (volume): 1.0 to 2.5 cm3 displayed |
| 4. PRICE |
| <$3000 list price per unit |
| 5. SIZE AND ERGONOMICS |
| Main box or docking station: dimensions < 30 cm × 23 cm × 10 cm; weight <2.7 kg |
| Handheld component: dimensions < 10 cm × 25 cm × 13 cm; weight <500 g |
What we looked for in our in-depth evaluation
We evaluated the tympanometers with formal objective testing, clinical use, subjective user rating, and feature comparison.
We assessed reproducibility with a volume calibration tool (in vitro), and with intra- and inter-device testing (in vivo) on volunteers. The tympanometers were also compared side by side in a clinical setting on adults and children with and without ear disease.
Eight evaluators with various clinical and technical backgrounds were our subjective raters. They used a Likert scale survey to rate the following tympanometer attributes: appearance, size, safety, durability, capabilities, ergonomics of physical design, ease of use (overall operations, specific control features), screen information layout, LCD screen/monitor, printing, maintenance, software interface, data quality and reliability, and accessories. Participants independently reviewed the tympanometers and were blinded to others’ evaluations.
We prioritized categories as high, medium, or low importance. Finally, important features of each unit were identified and verified.
Our rankings
Earscan comes out on top
Formal testing, clinical use, and feature comparison suggest the Earscan is the tympanometer best suited for primary care (see “How the units compared”).
The Earscan delivered high-quality data with excellent results in reproducibility testing for volume, pressure, and compliance. It proved reliable in the clinical setting with positive comments from participants.
Ergonomics. The Earscan was rated the easiest to use and the simplest to obtain a probe tip-ear seal. The Earscan has a small cylindrical probe affixed to a pressure/sound tube that attaches to the control unit. Anecdotally, these kinds of box-and-tube tympanometers provide the best seal and true readings. The probe is small, lightweight, and well suited for the clinician’s hand and patient’s ear so the tip-ear seal is easily viewed during the procedure. The tips are malleable, beveled, and tapered to provide an excellent fit in the ear canal.
The control unit is a reasonable size with finger-sized buttons and a viewable screen. It is simple to turn the unit on, press the Impedance button and perform the exam. The unit displays understandable feedback as to status.
Construction. The air pump, tone inducer, tubing, probe, and compliance pressure sensor are sturdy and yield consistent results. The unit is rugged and portable making it popular for occupational health.
Features. The Earscan is affordable and comes with additional functionality of audiometry and acoustic reflex testing. It has RS232 serial port capability to facilitate printer and limited computer integration.
Drawbacks. The unit is powered by a 120-volt adapter, making it less convenient than a handheld tympanometer. It may not be reasonable to carry the Earscan from one exam room to another. The Earscan has an older appearance with sealed buttons that are encased and provide little tactile feedback.
When other units may be preferable
If a handheld tympanometer with a docking station is necessary, then the MT10 or GSI 37 would be an appropriate choice.
MT10. This unit received the highest overall user ratings, slightly higher than the Earscan. The MT10 has a larger monitor and better control features than the GSI 37. It also has the capability for computer integration. However, the MT 10 gave less consistent readings for same-ear measurements when compared with the Earscan and GSI 37.
GSI 37. This unit provided more consistent pressure and compliance readings than the MT 10, and had no glare on its screen. It also has a longer track record in the field than does the newer MT10. It has an excellent operation manual.
In vitro testing for volume using a fixed object (calibration tube) demonstrated excellent reproducibility. There was little to no variation for 10 consecutive measurements for each tympanometer. In vivo reproducibility testing was performed taking 3 consecutive readings on each of 5 different ears using the tympanometers. For Compliance and Pressure readings the Earscan showed the most consistency while the MT 10 showed the least (TABLE 2).
Compliance data is graphed from 1 left ear to portray the range of values obtained from 4 tympanometers (FIGURE 1). While all tympanometers gave normal compliance readings, some units were less consistent than others. The MT10 showed the widest range of readings (least consistency). For this patient’s right ear (not shown), 3 tympanometers identified an overly compliant ear drum, while the MT10 gave normal and close to normal values. The MicroTymp 2 did not provide a compliance reading for the right ear.
Middle ear pressure data is graphed from the same left ear to portray the range of values obtained from 4 tympanometers (FIGURE 2). Overall, the units gave values that were within the clinically acceptable range of normal. However, there was a wide range of readings from the MT10 and MicroTymp 2. Assuming the participants’ middle ear pressure was truly close to zero, the outlier values reported by the MT10 and MicroTymp 2 might have clinical significance.
More than 100 tympanograms were obtained on children and adults; observations were noted. The Earscan, GSI 37 and MT 10 were easier to use and to obtain a good seal. The MicroTymp 2 proved more difficult to obtain a seal with and at times presented a falsely positive flat tympanogram. Earscan and MT10 gave similar readings on several occasions. On several occasions, the MicroTymp 2 and GSI 37 values significantly disagreed with each other. At times the MicroTymp 2 provided a graphical tympanogram but did not provide the numerical data. It was also easy to inadvertently combine previous data from one ear with new data from contralateral ear when using the MicroTymp 2.
Earscan tympanograms and corresponding video otoscope images are shown in FIGURE 3. The right tympanogram (bottom) is consistent with the video otoscope findings of otitis media. Observe the low compliance, elevated middle ear pressure, and low physical volume. The normal left tympanogram and otoscopy are concordant.
User ratings are shown in TABLE 3. Overall, participants ranked the MT10 highest (56.3) with the Earscan second (54.9), GSI 37 third (50.4), and MicroTymp 2 fourth (46.0). The MT10 rated highest in Ergonomics, Ease of Use of Control Features, Screen, Accessories, Appearance, Size and Information Layout. The Earscan rated highest in Overall Ease of Use and Perceived Durability. The MT10 and Earscan were tied for Capabilities and Interfacing. The MT10, GSI 37 and Earscan were tied for Perceived Data Quality. The GSI 37 was rated highest in Perceived Maintenance. Seven out of 8 reviewers (2 ties with the MT10) selected the Earscan as easiest to use. Eight out of eight (2 ties with MT10) selected the Earscan as the most simple to obtain a good seal.
The features representing the main differences between the 4 tympanometers are listed on pages 951 and 952. Features are identified as positive or negative and ranked according to how they impacted the final selection from most influential to least.
FIGURE 1
Compliance data obtained from 4 tympanometers
While all 4 gave normal readings, the MT10 showed the least consistency.
FIGURE 2
Middle ear pressure data obtained from 4 tympanometers
All 4 units gave values within normal range; there was a wide range from the MT10 and MicroTymp2.
FIGURE 3
Earscan tympanograms agree with corresponding video otoscope images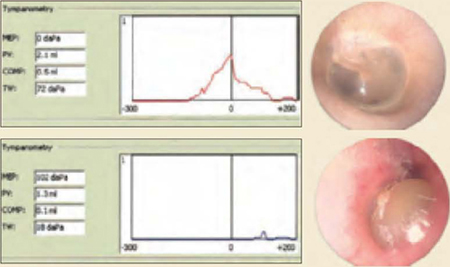
Top: Earscan demonstrating a normal left tympanogram and corresponding video otoscope image.
Bottom: Earscan demonstrating an abnormal right tympanogram with elevated middle ear pressure, reduced compliance and reduced physical volume. The video otoscope image is consistent with otitis media.
TABLE 2
For compliance and pressure readings, the Earscan showed the most consistency while the MT10 showed the least
| EAR A | EAR B | EAR C | EAR D | EAR E | |
|---|---|---|---|---|---|
| Range of readings (variance) for compliance in mL | |||||
| Earscan | 0.2 | 0.1 | 0.2 | 0.1 | 0.4 |
| MT 10 | 0.8 | 0.65 | 0.64 | 0.12 | 0.62 |
| Range of readings (variance) for pressure in daPa | |||||
| Earscan | 0 | 6 | 0 | 0 | 6 |
| MT10 | 30 | 53 | 31 | 16 | 82 |
TABLE 3
User ratings of 4 tympanometers (Likert scale 1 to 5)
| CATEGORY | EARSCAN | GSI 37 | MICROTYMP 2 | MT10 |
|---|---|---|---|---|
| Categories deemed highest importance | ||||
| Ease of use: overall | 4.1 | 3.8 | 3.0 | 3.8 |
| Data quality | 4.4 | 4.4 | 4.0 | 4.4 |
| Ergonomics | 4.5 | 4.6 | 4.4 | 4.0 |
| Durability | 4.9 | 4.3 | 4.4 | 4.6 |
| Maintenance | 4.7 | 4.8 | 3.7 | 4.4 |
| Categories deemed medium importance | ||||
| Ease of use: controls | 3.8 | 3.7 | 4.2 | 4.5 |
| Screen | 4.3 | 4.5 | 3.1 | 4.7 |
| Accessories | 4.2 | 3.9 | 3.8 | 4.3 |
| Categories deemed lowest importance | ||||
| Appearance | 4.0 | 3.8 | 3.7 | 4.1 |
| Size | 4.1 | 3.8 | 4.2 | 4.4 |
| Capabilities | 4.0 | 2.0 | 1.0 | 4.0 |
| Info layout | 4.2 | 4.2 | 4.1 | 4.7 |
| Interface | 3.7 | 2.6 | 2.4 | 3.7 |
| Total | 54.9 | 50.4 | 46.0 | 56.3 |
CORRESPONDENCE
Chris Patricoski, MD, Alaska Federal Health Care Access Network, 4000 Ambassador Drive, Anchorage, AK 99508. E-mail: [email protected]
1. American Academy of Family Physicians; American Academy of Otolaryngology-Head and Neck Surgery; American Academy of Pediatrics Subcommittee on Otitis Media with Effusion. Pediatrics 2004;113:1412-1429.
2. American Academy of Family Physicians; American Academy of Otolaryngology-Head and Neck Surgery; American Academy of Pediatrics Subcommittee on Acute Otitis Media Pediatrics 2004;113:1451-1465.
3. Onusko E. Tympanometry. Am Fam Physician 2004;7:1713-1720.
- Four tympanometers are suitable for outpatient primary care, and each has positive and negative attributes. The Earscan was rated easiest to use and provided the most consistent data.
In a primary care setting where patient volume, time constraints, and provider turnover are on the increase, you need dependable biomedical equipment that produces quality data and is easy to use, ergonomic, and affordable. This is certainly true of the tympanometer, which is used to measure mobility and impedance of the tympanic membrane and ossicles, provide an objective measurement of the middle ear, augment visual and pneumatic otoscopy, and confirm and document otitis media with effusion (OME) and acute otitis media (AOM).1-3 Our study aimed to determine which tympanometer is optimal in the outpatient primary care setting.
Based on objective and subjective analysis, the Earscan appears to be an excellent choice for outpatient primary care, though users also liked the MT 10 and GSI 37.
Four units made initial cut
Of 16 tympanometers we found through a review of market literature, an Internet search, and audiology recommendations, 4 met the minimum requirements (TABLE 1)—Earscan (www.microaud.com), GSI 37 (www.viasyshealthcare.com), MicroTymp 2 (www.welchallyn.com) and MT 10 (www.interacoustics-us.com).
TABLE 1
Tympanometers had to meet these minimum requirements to be considered
| 1. COMPLIANCE |
| Pressure measurement: +200 to –300 daPa |
| Sound frequency: 226 Hz ±3% |
| Sound amplitude: 85 dB SPL ±3dB |
| 2. PRESSURE PUMP |
| Accuracy: ±15% or 10 daPa (or better) |
| Positive to negative pressure sweep |
| 3. DATA DISPLAY |
| Screen size: 2.5 cm × 2.5 cm |
| Horizontal axis (pressure): +200 to –300 daPa |
| Vertical axis (volume): 1.0 to 2.5 cm3 displayed |
| 4. PRICE |
| <$3000 list price per unit |
| 5. SIZE AND ERGONOMICS |
| Main box or docking station: dimensions < 30 cm × 23 cm × 10 cm; weight <2.7 kg |
| Handheld component: dimensions < 10 cm × 25 cm × 13 cm; weight <500 g |
What we looked for in our in-depth evaluation
We evaluated the tympanometers with formal objective testing, clinical use, subjective user rating, and feature comparison.
We assessed reproducibility with a volume calibration tool (in vitro), and with intra- and inter-device testing (in vivo) on volunteers. The tympanometers were also compared side by side in a clinical setting on adults and children with and without ear disease.
Eight evaluators with various clinical and technical backgrounds were our subjective raters. They used a Likert scale survey to rate the following tympanometer attributes: appearance, size, safety, durability, capabilities, ergonomics of physical design, ease of use (overall operations, specific control features), screen information layout, LCD screen/monitor, printing, maintenance, software interface, data quality and reliability, and accessories. Participants independently reviewed the tympanometers and were blinded to others’ evaluations.
We prioritized categories as high, medium, or low importance. Finally, important features of each unit were identified and verified.
Our rankings
Earscan comes out on top
Formal testing, clinical use, and feature comparison suggest the Earscan is the tympanometer best suited for primary care (see “How the units compared”).
The Earscan delivered high-quality data with excellent results in reproducibility testing for volume, pressure, and compliance. It proved reliable in the clinical setting with positive comments from participants.
Ergonomics. The Earscan was rated the easiest to use and the simplest to obtain a probe tip-ear seal. The Earscan has a small cylindrical probe affixed to a pressure/sound tube that attaches to the control unit. Anecdotally, these kinds of box-and-tube tympanometers provide the best seal and true readings. The probe is small, lightweight, and well suited for the clinician’s hand and patient’s ear so the tip-ear seal is easily viewed during the procedure. The tips are malleable, beveled, and tapered to provide an excellent fit in the ear canal.
The control unit is a reasonable size with finger-sized buttons and a viewable screen. It is simple to turn the unit on, press the Impedance button and perform the exam. The unit displays understandable feedback as to status.
Construction. The air pump, tone inducer, tubing, probe, and compliance pressure sensor are sturdy and yield consistent results. The unit is rugged and portable making it popular for occupational health.
Features. The Earscan is affordable and comes with additional functionality of audiometry and acoustic reflex testing. It has RS232 serial port capability to facilitate printer and limited computer integration.
Drawbacks. The unit is powered by a 120-volt adapter, making it less convenient than a handheld tympanometer. It may not be reasonable to carry the Earscan from one exam room to another. The Earscan has an older appearance with sealed buttons that are encased and provide little tactile feedback.
When other units may be preferable
If a handheld tympanometer with a docking station is necessary, then the MT10 or GSI 37 would be an appropriate choice.
MT10. This unit received the highest overall user ratings, slightly higher than the Earscan. The MT10 has a larger monitor and better control features than the GSI 37. It also has the capability for computer integration. However, the MT 10 gave less consistent readings for same-ear measurements when compared with the Earscan and GSI 37.
GSI 37. This unit provided more consistent pressure and compliance readings than the MT 10, and had no glare on its screen. It also has a longer track record in the field than does the newer MT10. It has an excellent operation manual.
In vitro testing for volume using a fixed object (calibration tube) demonstrated excellent reproducibility. There was little to no variation for 10 consecutive measurements for each tympanometer. In vivo reproducibility testing was performed taking 3 consecutive readings on each of 5 different ears using the tympanometers. For Compliance and Pressure readings the Earscan showed the most consistency while the MT 10 showed the least (TABLE 2).
Compliance data is graphed from 1 left ear to portray the range of values obtained from 4 tympanometers (FIGURE 1). While all tympanometers gave normal compliance readings, some units were less consistent than others. The MT10 showed the widest range of readings (least consistency). For this patient’s right ear (not shown), 3 tympanometers identified an overly compliant ear drum, while the MT10 gave normal and close to normal values. The MicroTymp 2 did not provide a compliance reading for the right ear.
Middle ear pressure data is graphed from the same left ear to portray the range of values obtained from 4 tympanometers (FIGURE 2). Overall, the units gave values that were within the clinically acceptable range of normal. However, there was a wide range of readings from the MT10 and MicroTymp 2. Assuming the participants’ middle ear pressure was truly close to zero, the outlier values reported by the MT10 and MicroTymp 2 might have clinical significance.
More than 100 tympanograms were obtained on children and adults; observations were noted. The Earscan, GSI 37 and MT 10 were easier to use and to obtain a good seal. The MicroTymp 2 proved more difficult to obtain a seal with and at times presented a falsely positive flat tympanogram. Earscan and MT10 gave similar readings on several occasions. On several occasions, the MicroTymp 2 and GSI 37 values significantly disagreed with each other. At times the MicroTymp 2 provided a graphical tympanogram but did not provide the numerical data. It was also easy to inadvertently combine previous data from one ear with new data from contralateral ear when using the MicroTymp 2.
Earscan tympanograms and corresponding video otoscope images are shown in FIGURE 3. The right tympanogram (bottom) is consistent with the video otoscope findings of otitis media. Observe the low compliance, elevated middle ear pressure, and low physical volume. The normal left tympanogram and otoscopy are concordant.
User ratings are shown in TABLE 3. Overall, participants ranked the MT10 highest (56.3) with the Earscan second (54.9), GSI 37 third (50.4), and MicroTymp 2 fourth (46.0). The MT10 rated highest in Ergonomics, Ease of Use of Control Features, Screen, Accessories, Appearance, Size and Information Layout. The Earscan rated highest in Overall Ease of Use and Perceived Durability. The MT10 and Earscan were tied for Capabilities and Interfacing. The MT10, GSI 37 and Earscan were tied for Perceived Data Quality. The GSI 37 was rated highest in Perceived Maintenance. Seven out of 8 reviewers (2 ties with the MT10) selected the Earscan as easiest to use. Eight out of eight (2 ties with MT10) selected the Earscan as the most simple to obtain a good seal.
The features representing the main differences between the 4 tympanometers are listed on pages 951 and 952. Features are identified as positive or negative and ranked according to how they impacted the final selection from most influential to least.
FIGURE 1
Compliance data obtained from 4 tympanometers
While all 4 gave normal readings, the MT10 showed the least consistency.
FIGURE 2
Middle ear pressure data obtained from 4 tympanometers
All 4 units gave values within normal range; there was a wide range from the MT10 and MicroTymp2.
FIGURE 3
Earscan tympanograms agree with corresponding video otoscope images
Top: Earscan demonstrating a normal left tympanogram and corresponding video otoscope image.
Bottom: Earscan demonstrating an abnormal right tympanogram with elevated middle ear pressure, reduced compliance and reduced physical volume. The video otoscope image is consistent with otitis media.
TABLE 2
For compliance and pressure readings, the Earscan showed the most consistency while the MT10 showed the least
| EAR A | EAR B | EAR C | EAR D | EAR E | |
|---|---|---|---|---|---|
| Range of readings (variance) for compliance in mL | |||||
| Earscan | 0.2 | 0.1 | 0.2 | 0.1 | 0.4 |
| MT 10 | 0.8 | 0.65 | 0.64 | 0.12 | 0.62 |
| Range of readings (variance) for pressure in daPa | |||||
| Earscan | 0 | 6 | 0 | 0 | 6 |
| MT10 | 30 | 53 | 31 | 16 | 82 |
TABLE 3
User ratings of 4 tympanometers (Likert scale 1 to 5)
| CATEGORY | EARSCAN | GSI 37 | MICROTYMP 2 | MT10 |
|---|---|---|---|---|
| Categories deemed highest importance | ||||
| Ease of use: overall | 4.1 | 3.8 | 3.0 | 3.8 |
| Data quality | 4.4 | 4.4 | 4.0 | 4.4 |
| Ergonomics | 4.5 | 4.6 | 4.4 | 4.0 |
| Durability | 4.9 | 4.3 | 4.4 | 4.6 |
| Maintenance | 4.7 | 4.8 | 3.7 | 4.4 |
| Categories deemed medium importance | ||||
| Ease of use: controls | 3.8 | 3.7 | 4.2 | 4.5 |
| Screen | 4.3 | 4.5 | 3.1 | 4.7 |
| Accessories | 4.2 | 3.9 | 3.8 | 4.3 |
| Categories deemed lowest importance | ||||
| Appearance | 4.0 | 3.8 | 3.7 | 4.1 |
| Size | 4.1 | 3.8 | 4.2 | 4.4 |
| Capabilities | 4.0 | 2.0 | 1.0 | 4.0 |
| Info layout | 4.2 | 4.2 | 4.1 | 4.7 |
| Interface | 3.7 | 2.6 | 2.4 | 3.7 |
| Total | 54.9 | 50.4 | 46.0 | 56.3 |
CORRESPONDENCE
Chris Patricoski, MD, Alaska Federal Health Care Access Network, 4000 Ambassador Drive, Anchorage, AK 99508. E-mail: [email protected]
1. American Academy of Family Physicians; American Academy of Otolaryngology-Head and Neck Surgery; American Academy of Pediatrics Subcommittee on Otitis Media with Effusion. Pediatrics 2004;113:1412-1429.
2. American Academy of Family Physicians; American Academy of Otolaryngology-Head and Neck Surgery; American Academy of Pediatrics Subcommittee on Acute Otitis Media Pediatrics 2004;113:1451-1465.
3. Onusko E. Tympanometry. Am Fam Physician 2004;7:1713-1720.