User login
Oral contraceptives and breakthrough bleeding: What patients need to know
- Lack of adherence is a common cause of breakthrough bleeding. Focus counseling on ensuring that patients understand and can follow pill-taking instructions before switching pills or method (A).
- If breakthrough bleeding extends beyond 4 cycles and a woman wish to continue using oral contraceptives, consider switching to a pill with a higher ethinyl estradiol (EE):progestin ratio, either by increasing the EE dose or decreasing the relative progestin dose (C).
- Breakthrough bleeding may be due to progestin type; switching from an estrane to a gonane may reduce it (C).
- Women who have breakthrough bleeding after having well-controlled menstrual cycles on oral contraceptives should be assessed for for causes not related to their birth control pills, such as pregnancy, cervicitis, smoking, or interactions with medications (A).
In 1982, more than 20% of women surveyed in a nationally representative sample had discontinued oral contraceptives (OCs) on their own or at the recommendation of their physician due to bleeding or spotting.1 Sadly, the percentage today has not decreased much.
Understandable concern, embarrassment, and annoyance lead these women to abandon OCs.1,2 What they often don’t know, though, is that breakthrough bleeding generally is greatest in the first 3 to 4 months after starting OCs,3 and it steadily declines and stabilizes by the end of the fourth cycle.4 Timely counsel could enable many of these women to cope with the bleeding and stick with an effective contraceptive method. Additional incentives are noncontraceptive benefits of OCs: improved menstrual regularity and decreased menstrual blood loss, dysmenorrhea, and risk of ovarian and endometrial cancer.
Women who discontinue OCs on their own switch to less effective methods of birth control or use no method.1,2 Consequences may be unexpected pregnancies and increased abortion rates.5 With patients who are using OCs, it would be appropriate to ask periodically whether they are satisfied with OC use.
In this review we discuss the mechanisms and management of breakthrough bleeding in women taking OCs, and provide tips for counseling that may help decrease the risk of discontinuation due to menstrual abnormalities in the initial months of use.
Breakthrough bleeding in this review refers to either unplanned spotting or bleeding, regardless of requirement for protection—unless defined otherwise by a specific study under discussion.
4 factors contribute to breakthrough bleeding
Breakthrough bleeding may be due to any the following factors: 1) physiologic effects of OCs on the endometrium, 2) OC-related parameters, including dose, formulation, and regimen, 3) patient behavior, including compliance, using concomitant medications, and smoking, and 4) benign or malignant pathology.
OCs and the endometrium: Estrogen-progestin balance significant
Progestin and estrogen in combination OCs have profound effects on the endometrium, which, though not contributing to contraception, do lead to a predictable pattern of bleeding or such problems as breakthrough bleeding or lack of withdrawal bleed.
Normally, estrogen causes the endometrium to proliferate. Progesterone stabilizes the growing uterine lining. Since the introduction of OCs in 1960, the trend in formulation has been to use the least amount of hormone necessary to inhibit ovulation. Given that the progestin is primarily responsible for the contraceptive efficacy of OCs, the risk of pregnancy is not altered with decreases in the estrogen component. However, significantly lowering the estrogen in OCs may account for breakthrough bleeding. Unplanned bleeding, though, is not dependent solely on the estrogen component as variations in the progestin can contribute to breakthrough bleeding.7
Most OC users in the US take low-dose formulations, so designated because the estrogen component is <50 μg. This level of estrogen in combination with a progestin provides excellent contraceptive efficacy, but may be insufficient to sustain endometrial integrity in some women.8 Studies that have compared OCs containing 20 μg ethinyl estradiol (EE) with those containing 30 μg or 35 μg EE have not been very useful for judging breakthrough bleeding rates because the products often also vary in the phasing and type of progestin. Some studies show more breakthrough bleeding with 20 μg EE pills,9-11 but others show equal or improved cycle control with the lower EE dose.
For the purpose of performing studies, unplanned bleeding is classified by the World Health Organization into 2 categories: 1) breakthrough bleeding, which requires sanitary protection, and 2) spotting, which does not require sanitary protection.6 Despite this formal classification, trials have varied in their terminology and method of recording menstrual irregularities, making comparisons between studies difficult. In addition, there is wide variation among women in tolerance to bleeding abnormalities, perceptions of heavy vs light bleeding, as well as the need for protection.3
Nevertheless, menstrual abnormalities are consistently cited as a common reason for discontinuing OCs. A prospective US study of 1657 women performed in the 1990s reported that 37% of OC users had stopped taking OCs by 6 months after starting a new prescription because of side effects.2 Irregular bleeding was the most common cause; cited by 12% of women, followed by nausea, weight gain, and mood changes, which ranged from 5% to 7%.
Estrogen-progestin balance is more important than absolute level of estrogen. Endrikat et al12 conducted a study to compare two 20 μg EE pills containing different progestins, and to compare 2 levonorgestrel-based formulations with differing EE amounts. An OC of 20 μg EE/100 μg levonorgestrel was compared with a preparation of 20 μg EE/500 mg norethisterone. A 30 μg EE/150 mg levonorgestrel pill was used as a standard reference preparation.
Overall, the 30 μg EE preparation showed a lower cumulative incidence of breakthrough bleeding compared with the 20 μg EE/100 μg levonorgestrel and 20 μg EE/500 μg norethisterone pills over 13 cycles (1.0% vs 4.1% vs 11.7%, respectively). However, the 20 μg EE/500 μg norethisterone pills consistently had higher breakthrough bleeding rates than the 20 μg EE/100 μg levonorgestrel pill. This suggests that, although the higher EE component in the 30 μg pill was important when comparing 2 formulations with the same progestin, the difference in progestins of the two 20 μg EE pills was most likely responsible for the differing rates of breakthrough bleeding.
This study highlights the ability to achieve greater cycle control by titrating the EE component of an OC in a balanced ratio with the same progestin, but suggests that the absolute quantity of EE in a given pill may be less important than maintaining a balance between the 2 hormones or less important than the impact of different progestins on breakthrough bleeding rates.
The delicate balance between estrogen and progesterone supplementation required for contraception may also lead to progestin-induced decidualization and endometrial atrophy, which can result in asynchronous, erratic bleeding.7,13 This has been primarily studied in long-acting progestin-only contraceptives such as implants. Alterations in angiogenic factors14 may play a role. Hysteroscopic studies have shown abnormalities in superficial endometrial blood vessels in terms of size, proliferation, and fragility in women using Norplant.13,15,16 Abnormalities in endothelial cells and extracellular matrix proteins,17 tissue factor,18 and endometrial lymphoid cells19 may contribute to breakthrough bleeding in progestin-dominant environments.
Available OC formulations, doses, and regimens
More than 30 formulations of combination OCs are available in the US, with different doses and types of estrogen and progestin ( TABLE 1 ).20 Approved OCs have been studied in clinical trials to assess contraceptive efficacy and cycle control; however, comparisons between studies regarding bleeding phenomena are impaired by inconsistent terminology.3
While some studies describe breakthrough bleeding and spotting according to their recognized definitions, others simply refer to intermenstrual bleeding or use spotting to refer to any unexpected bleeding. In addition, cycle control studies of OC users frequently do not account for the effects of missed pills, use of concomitant medications, or smoking. The percentage of women who experience breakthrough bleeding in a given cycle varies widely even in different trials of the same formulation.
Pay attention to progestin level. Conventional wisdom holds that OCs with the lowest doses of EE (≤20 μg) are associated with more breakthrough bleeding.11 However, even moderately low doses of either EE or progestin can increase the incidence of breakthrough bleeding. For example, when 3 pills with the same estrogen and progestin (50 μg EE/100 μg norethin-drone; 35 μg EE/100 μg norethindrone; and 35 μg EE/50 μg norethindrone) were compared in 192 women over 8 cycles, the pill containing the lowest amount of norethindrone (35 μg EE/50 μg norethisterone) caused the highest rates of breakthrough bleeding (decreasing to approximately 50% by cycle 8 as compared with 35% in the 35 μg EE/100 μg norethindrone pill and 25% in the 50 μg EE/100 μg norethindrone pill).21
In addition, the number of intermenstrual bleeding days plateaued more slowly as the amount of both hormones in the OC formulations decreased. This underscores the importance of the relative proportions of estrogen and progestin contained in combination OCs and its impact on breakthrough bleeding.
Similarly, a large comprehensive study in 1991 women compared 7 different formulations of combination OCs containing different dose combinations of EE and norgestimate—20/250, 50/250, 35/125, 20/60, 50/60, 30/90, 25/125.25 Total inter-menstrual bleeding was more frequent at lower doses of either estrogen or progestin. However, as long as a similar estrogenprogestin ratio was maintained, bleeding rates were considered acceptable (approximately 10% of days per cycle with bleeding). The authors also noted that in the low-dose range of OCs, small changes in the absolute amount of either EE or norgestimate might result in noticeable changes in bleeding.
Type of progestin may affect breakthrough bleeding. All combination OCs contain either EE or mestranol. However, a variety of progestins have come into use. The 2 most common contraceptive progestins are derived from 19-nortestosterone, and are classified as gonanes or estranes ( TABLE 2 ).22
Estranes include norethindrone and its derivatives, norethindrone acetate and ethinyodiol diacetate. Gonanes include levonorgestrel, norgestrel, desogestrel, gestodene, and norgestimate.
Each progestin differs in half-life, estrogenic, progestogenic, and androgenic properties, and these variations may explain differing rates of breakthrough bleeding among formulations.4 As shown by Endrikat et al,12 pills with the same quantity of EE but different progestins can have marked differences in breakthrough bleeding rates.
Although gonanes have greater progestational activity, no trial has determined which progestin has the best bleeding profile. A recent Cochrane review comparing different progestins did find that, compared with pills containing levonorgestrel, those containing gestodene may be associated with less intermenstrual bleeding.23
Regardless of the progestin used or the quantity of EE, breakthrough bleeding generally decreases with each successive cycle. One study that compared 2 combination OCs composed of EE/norgestimate and EE/norgestrel demonstrated bleeding rates of 11.3% and 10.6% during the first 6 cycles, that decreased to 5.1% and 6.3% in Cycles 13 to 24, respectively.24 Additionally, all women using OCs can experience some cycles without a withdrawal bleed—a menstrual abnormality that may be concerning to those who desire a menstrual period as confirmation that they are not pregnant.
Comparing regimens. OC regimens are available as biphasic, triphasic, extended-cycle, and continuous use. Women using extended-cycle contraceptives may experience more breakthrough bleeding than those using a standard 28-day pill. However, in a 3-month cycle, there are only 7 days of planned bleeding. This is in contrast to 28-day cycles during 3 months in which there are 21 days of planned bleeding.
Though women on extended-cycle regimens may initially experience more breakthrough bleeding than women using 28-day regimens, the total number of planned and unplanned bleeding days may still decrease. Women using a 3-month cycle OC (30 μg EE/150 μg levonorgestrel) experienced more unscheduled bleeding than women using a standard 28-day cycle OC of the same formulation and dose.26 The number of bleeding days decreased with each cycle. Another study examined continuous OC use (20 μg EE/100 μg levonorgestrel) over a period of 1 year, and reported a decreasing number of bleeding days over time.27 In the case of continuous use, all bleeding is unscheduled, and any bleeding is considered breakthrough bleeding.
Multiphasic OC regimens were developed with the intention of decreasing breakthrough bleeding by mimicking the rising and falling pattern of estrogen and progesterone in the normal menstrual cycle.28 After the introduction of the biphasic pill, an increase in breakthrough bleeding was noted, which led to the development of the triphasic pill.29 Though the multiphasic hypothesis is physiologically plausible, recent reviews of the literature have found the evidence for its efficacy too limited and methodologically flawed to draw any definitive conclusions about a decrease in breakthrough bleeding.30,31
TABLE 1
Available OCs by formulation and regimen
| TRADE NAME | GENERIC NAME(S) | TROGEN (DOSE) | PROGESTIN (DOSE) |
|---|---|---|---|
| MONOPHASIC | |||
| Alesse, Levlite | Aviane, Lessina | Ethinyl estradiol (20 μg) | Levonorgestrel (0.1 mg) |
| Mircette | Kariva | Ethinyl estradiol (20 μg×21 days +10 μg×5 days during placebo week) | Desogestrel (0.15 mg) |
| Loestrin FE | Microgestin FE 1/20, June FE 1/20 | Ethinyl estradiol (20 μg) | Norethindrone acetate (1 mg) |
| Yaz | Ethinyl estradiol (20 μg) | Drospirenone (3 mg) | |
| Levlen, Nordette | Levora, Portia | Ethinyl estradiol (30 μg) | Levonorgestrel (0.15 mg) |
| Lo/Ovral | Low-ogestrel, Cryselle | Ethinyl estradiol (30 μg) | Norgestrel (0.3 mg) |
| Desogen, Ortho-cept | Apri | Ethinyl estradiol (30 μg) | Desogestrel (0.15 mg) |
| Loestrin 211/5/30 | Microgestin, Junel Fe | Ethinyl estradiol (30 μg) | Norethindrone acetate (1.5 mg) |
| Yasmin | Ethinyl estradiol (30 μg) | Drospirenone (3 mg) | |
| Ovcon 35 | Ethinyl estradiol (35 μg) | Norethindrone (0.4 mg) | |
| Ortho-Cyclen | Mononesessa, Sprintec | Ethinyl estradiol (35 μg) | Norgestimate (0.25 mg) |
| Brevicon, Modicon | Nortrel, Necon 0.5/35 | Ethinyl estradiol (35 μg) | Norethindrone (0.5 mg) |
| Demulen 1/35 | Zovia 1/35 | Ethinyl estradiol (35 μg) | Ethynodiol diacetate (1 mg) |
| Ortho-Novum 1/35, Norinyl 1+35 | Necon 1/35, Nortrel | Ethinyl estradiol (35 μg) | Norethindrone (1 mg) |
| Ortho-Novum 1/50 | Necon 1/50 | Ethinyl estradiol (50 μg) | Norethindrone (1 mg) |
| Ovral | Ogestrel | Ethinyl estradiol (50 μg) | Norgestrel (0.5 mg) |
| Ovcon 50 | Ethinyl estradiol (50 μg) | Norethindrone (1 mg) | |
| Demulen 1/50 | Zovia 1/50 | Ethinyl estradiol (50 μg) | Ethynodiol diacetate (1 mg) |
| Norinyl 1/50 | Mestranol (50 μg) | Norethindrone (1 mg) | |
| BIPHASIC | |||
| Ortho-Novum 10/11, Jenest | Necon 10/11, Nelova 10/11 | Ethinyl estradiol (35 μg) | Norethindrone (0.5 mg×10 days, 1 mg×11 days) |
| TRIPHASIC | |||
| Ortho Tri-Cyclen Lo | Ethinyl estradiol (25 μg) | Norgestimate (0.18 mg×7 days, 0.215 mg×7 days, 0.25 mg×7 days) | |
| Cyclessa | Velivet | Ethinyl estradiol (25 μg) | Desogestrel (0.1 mg×7 days, 0.125×7 days, 0.15 mg×7 days) |
| T riphasil, Tri-Levlen | Trivora, Enpresse | Ethinyl estradiol (30 μg×6 days, 40 μg×5 days, 30 μg×10 days) | Levonorgestrel (0.05 mg×6 days, 0.075 mg×5 days, 0.125 mg×10 days) |
| Tri-Norinyl | Ethinyl estradiol (35 μg) | Norethindrone (0.5 mg×7 days, 1 mg×9 days, 0.5 mg×5 days) | |
| Ortho Tri-Cyclen | Tri-Sprintec, Trinessa * | Ethinyl estradiol (35 μg) | Norgestimate (0.18 mg×7 days, 0.215 mg×7 days, 0.25 mg×7 days) |
| Ortho-Novum 7/7/7 | Nortrel 7/7/7, Necon 7/7/7 | Ethinyl estradiol (35 μg) | Norethindrone (0.5 mg×7 days, 0.75 mg×7 days, 1 mg×7 days) |
| Estrostep FE | Ethinyl estradiol (20 μg×5 days, 30 μg×7 days, 35 μg×9 days) | Norethindrone acetate (1 mg) | |
| EXTENDED CYCLE | |||
| Seasonale | Ethinyl estradiol (30 μg×84 days followed by 7 placebo pills) | Levonorgestrel (0.15 mg) | |
| Seasonique | Ethinyl estradiol (30 μg×84 days followed by 10 μg×7 days) | Levonorgestrel (0.15 mg) | |
* Corrections were made to this chart following its publication in print.
TABLE 2
Progestins used in oral contraceptive formulations
| ESTRANES | GONANES | SPIROLACTONES |
|---|---|---|
| Norethindrone | Norgestrel | Drospirenone |
| Norethindrone acetate | Levonorgestrel | |
| Ethynodiol diacetate | Norgestimate | |
| Gestodene | ||
| Desogestrel |
Patient behavior contributing to breakthrough bleeding
Skipping a pill is a common cause of breakthrough bleeding.5 Compliance with any OC regimen is crucial to achieving a regular and predictable bleeding pattern. Of 6676 women surveyed retrospectively, 19% reported missing 1 or more pills per cycle, and 10% reported missing 2 or more pills per cycle.32 Prospective studies have found even higher rates of inconsistent use.
When an electronic device was used to monitor pill ingestion, up to 81% of women were found to miss at least 1 pill per cycle and up to 51% missed 3 or more pills per cycle.33
Other side effects also adversely affect adherence. For example, women experiencing nausea may skip pills, which leads to breakthrough bleeding and, ultimately, discontinuation.34 Patients need to understand the impact of skipping pills. Women who report irregular bleeding are 1.6 to 1.7 times more likely as those not reporting this side effect to miss 2 or more pills per cycle.5 Even 1 missed pill can increase the risk of bleeding irregularities.35
Failure to take the pill at the same time every day, as well as poor comprehension of pill-taking instructions, are other strong predictors of inconsistent use and breakthrough bleeding.32
Taking some prescription and over-the-counter medications, as well as herbal supplements, may interfere with the activity of OCs to alter bleeding patterns and contraceptive efficacy.36 Medications that induce the cytochrome P-450 system (CYP450) in the liver increase the metabolism of OCs. Anticonvulsants, the antituberculosis agent rifampin, and antifungals such as griseofulvin, can increase the clearance of steroid hormones and thus lead to breakthrough bleeding. The herbal supplement St. John’s Wort, commonly used for mild to moderate depression, is associated with CYP450 induction. It has been shown to increase the incidence of breakthrough bleeding and probably ovulation in women taking OCs.37
Smoking is associated with such anti-estrogenic effects as early menopause, osteoporosis, and menstrual abnormalities.38 These effects may be related to the induction of hepatic estrogen and progesterone metabolism by cigarette smoking.39,40
Before receiving OCs, women are made aware of the relationship between smoking, OCs, and an increased risk of myocardial infarction, stroke, and venous thromboembolism.41 They should also understand that the anti-estrogenic effect of smoking may lower estrogen levels and lead to breakthrough bleeding, even in women who are reliable pill-takers.42,43
Smoking appears to have a dose-response relationship with breakthrough bleeding. Increasing levels of smoking have been associated with an increased risk of spotting or bleeding in each cycle.44 The difference in cycle control between smokers and nonsmokers appears to be more pronounced with each cycle. Smokers demonstrate a 30% elevation in the risk of bleeding irregularities compared with nonsmokers in the first cycle of use, which rises to an 86% increased risk by the sixth cycle.
Reports conflict regarding the relationship between smoking and contraceptive efficacy, suggesting that confounding factors like compliance may be more important than the antihormonal effect of cigarettes.45 Nevertheless, women who smoke should be informed of this potential complicating factor to OC use and as yet another reason to encourage smoking cessation.
Pathologic causes of breakthrough bleeding
When a woman experiences difficult cycle control after the first 3 to 4 months of OC use, consider the possibility of benign and malignant growths, including endometrial polyps, submucous myomas, and cervical or endometrial cancer.46 Additionally, contraceptive failure must always be a consideration and that what appears to be breakthrough bleeding may actually represent bleeding in early pregnancy.
Cervicitis is an important but largely unrecognized source of unplanned bleeding in women using OCs. Causative organisms include chlamydia, gonorrhea, and trichomonas.22 Intermenstrual bleeding in women previously well controlled on OCs is particularly suggestive of asymptomatic chlamydia cervicitis.
Krettek et al37 found that 29.2% of women who had been taking OCs for more than 3 months and presented with intermenstrual spotting had a positive test for Chlamydia trachomatis. By comparison, chlamydia cervicitis was found in 10.7% of matched controls taking OCs without spotting who were screened for symptoms of vaginitis or high-risk sexual behavior, and in just 6.1% of women undergoing routine screening before the initiation of contraception.
3 aspects of managing breakthrough bleeding
Managing breakthrough bleeding involves effective pretreatment and ongoing counseling, reassurance, and timely and appropriate diagnostic testing (TABLE 3). In some instances, pill-switching or other forms of medical management may be helpful, but these options are largely unproven.
TABLE 3
What to review with patients who are starting a combination OC
|
Counseling reduces anxiety and improves satisfaction, adherence
In a recent survey, 649 Canadian women who were picking up prescriptions for OCs were asked to complete a questionnaire at the pharmacy while they waited.48 Over one third (34.5%) reported they had not received counseling from their health-care provider about breakthrough bleeding. Furthermore, only 28.3% of women who were counseled, and 26.1% of women who were not counseled, gave the optimal response to breakthrough bleeding as defined in this study (“continue taking pill and not call my doctor”).
Lack of counseling can lead to poor method satisfaction and significant cost expenditures due to visits and phone calls by women experiencing unexpected bothersome side-effects.5 Compared with women who reported the highest satisfaction with the care they received from their provider, those reporting the lowest scores were 1.6 to 2.2 times as likely to be dissatisfied with the pill.
Inform women that breakthrough bleeding is common in the first 3 to 4 cycles of OC use, that bleeding irregularities tend to decline with each successive cycle, and that they should not discontinue pill use without discussing their concerns with you. Remind women to keep sanitary protection with them during the first few months. The impact of poor counseling was underscored in a study of women enrolled in clinical trials of OCs, contraceptive vaginal rings, and Depo-Provera. Women taking OCs were the least likely to have been warned of menstrual irregularities and thus tended to stop using that method more often than those using a ring or Depo-Provera.49 Of women who discontinue OCs, 47% use a less effective method and 19% use no method at all.1
Give specific instructions for specific regimens. Given the array of OC regimens available, make sure women know how to take them properly. This will help ensure contraceptive efficacy and cycle control. Women who do not understand pill-package instructions are up to 2.8 times more likely to miss pills, which increases the risk of breakthrough bleeding and impacts contraceptive efficacy.5 Among women who were counseled about the consequences of missed pills, 76% reported knowing what to do in response (“use another form of birth control that month”). Of women who received no such counseling, only 48% gave the appropriate response (P<.001).48 To improve adherence, advise women to establish a routine for pill-taking: taking the pill at the same time each day or linking pill ingestion with another daily activity, such as tooth brushing. Women without an established routine were 3.6 times more likely to miss 2 or more pills per cycle than women with a routine.5
Reassurance regarding contraceptive efficacy
Reassure users who take their pills routinely that breakthrough bleeding and contraceptive efficacy are not linked.50 Breakthrough bleeding is not a sign that OCs are not working.4 On the other hand, approximately 1 million unintended pregnancies in the United States each year are associated with misuse or discontinuation of OCs.51
When to consider diagnostic testing
For OC users who continue to experience breakthrough bleeding beyond 3 to 4 cycles, other potential causes must be ruled out using appropriate diagnostic tests. A pregnancy test, appropriate testing for cervical infection, a pregnancy test, pelvic ultrasound, Pap smear, or endometrial biopsy may be warranted depending on clinical circumstances.
Fall-back options
If breakthrough bleeding continues beyond 3 months, and other reasons including poor adherence and pathologic processes are excluded, you could consider providing estrogen or switching to a different pill, though no clinical trials support definitive recommendations.
Aside from changing from a multiphasic to a monophasic formulation, altering the progestin component is often a first step in trying to control breakthrough bleeding.46 An OC with a gonane rather than an estrane progestin may be beneficial as this class of progestins may provide more consistent hormonal effects on the endometrium.
Choosing an OC with a higher quantity of EE may also help, particularly for women using 20 μg pills. When possible, the same progestin should be used.
You may want to start a trial of conjugated estrogen, 1.25 mg, or estradiol, 2 mg, administered for 7 days when bleeding occurs. This can be repeated if necessary; however, if breakthrough bleeding continues despite this treatment, consideration of a different pill or method should be undertaken.
CORRESPONDENCE
Patricia A. Lohr, MD, University of Pittsburgh, Magee-Womens Hospital, 300 Halket Street, Pittsburgh, PA 15213-3180. E-mail: [email protected]
1. Pratt WF, Bachrach CA. What do women use when they stop using the pill? Fam Plann Perspect 1987;19:257-266.
2. Rosenberg MJ, Waugh MS. Oral contraceptive discontinuation: A prospective evaluation of frequency and reasons. Am J Obstet Gynecol 1998;179:577-582.
3. Thorneycroft IH. Cycle control with oral contraceptives: A review of the literature. Am J Obstet Gynecol 1999;180:S280-S287.
4. Speroff L, Darney PD. A Clinical Guide for Contraception. 3rd ed. Philadelphia, Pa: Lippincott Williams & Wilkins; 2001.
5. Rosenberg MJ, Waugh MS, Burnhill MS. Compliance, counseling, and satisfaction with oral contraceptives: A prospective evaluation. Fam Plann Perspect 1998;30:89-92,104.
6. Belsey EM, Machin D, d’Arcangues C. The analysis of vaginal bleeding patterns induced by fertility regulating methods. World Health Organization Special Programme of Research, Development and Research Training in Human Reproduction. Contraception 1986;34:253-260.
7. ESHRE Capri Workshop Group. Ovarian and endometrial function during hormonal contraception. Hum Reprod 2001;16:1527-1535.
8. Kaunitz AM. Oral contraceptive estrogen dose considerations. Contraception 1998;58(Suppl):15S-21S.
9. Preston SN. A report of a collaborative dose-response clinical study using decreasing doses of combination oral contraceptives. Contraception 1972;6:17-35.
10. Akerlund M, Rode A, Westergaard J. Comparative profiles of reliability, cycle control and side effects of two oral contraceptive formulations containing 150 mcg desogestrel and either 30 mcg or 20 mcg ethinyl oestradiol. Br J Obstet Gynaecol 1993;100:832-838.
11. Gallo MF, Nanda K, Grimes DA, Schulz KF. Twenty micrograms vs >20 microg estrogen oral contraceptives for contraception: a systematic review of randomized controlled trials. Contraception 2005;71:162-169.
12. Endrikat J, Hite R, Bannemerschult R, Gerlinger C, Schmidt W. Multicenter, comparative study of cycle control, efficacy and tolerability of two low-dose oral contraceptives containing 20 microg ethinylestradiol/100 microg levonorgestrel and 20 microg ethinylestradiol/50 microg noresthisterone. Contraception 2001;64:3-10.
13. Hickey M, Fraser I, Dwarte D, Graham S. Endometrial vasculature in Norplant users: preliminary results from a hysteroscopic study. Hum Reprod 1996;11(Suppl 2):35-44.
14. Smith SK. Steroids and endometrial breakthrough bleeding: future directions for research. Hum Reprod 2000;15(Suppl 3):197-202.
15. Song JY, Markham R, Russell P, Wong T, Young L, Fraser IS. The effect of high-dose medium- and long-term progestogen exposure on endometrial vessels. Hum Reprod 1995;10:797-800.
16. Hickey M, Dwarte D, Fraser IS. Superficial endometrial vascular fragility in Norplant users and in women with ovulatory dysfunctional uterine bleeding. Hum Reprod 2000;15:1509-1514.
17. Rodriguez-Manzaneque JC, Graubert M, Iruela-Arispe ML. Endothelial cell dysfunction following prolonged activation of progesterone receptor. Hum Reprod 2000;15(Suppl 3):39-47.
18. Lockwood CJ, Runic R, Wan L, Krikun G, Demopolous R, Schatz F. The role of tissue factor in regulating endometrial haemostsis: Implications for progestin-only contraception. Hum Reprod 2000;15(Suppl 3):144-151.
19. Clark DA, Wang S, Rogers P, Vince G, Affandi B. Endometrial lymphoid cells in abnormal uterine bleeding due to levonorgestrel (Norplant). Hum Reprod 1996;11:1438-1444.
20. Hatcher RA, Trussell J, Stewart FH. Contraceptive Technology. 18th ed. New York: Ardent Media; 2004.
21. Saleh WA, Burkman RT, Zacur HA, Kimball AW, Kwieterovich P, Bell W. A randomized trial of three oral contraceptives: comparison of bleeding patterns by contraceptive types and steroid levels. Am J Obstet Gynecol 1993;168:1740-1747.
22. Stenchever MA, Ling FW. Comprehensive Gynecology. 4th ed. St Louis, Mo: Mosby; 2001.
23. Maitra N, Kulier R, Bloemenkamp KW, Helmerhorst FM, Gulmezoglu AM. Progestogens in combined oral contraceptives for contraception. Cochrane Database Syst Rev 2004;(3):CD004861.-
24. Corson SL. Efficacy and clinical profile of a new oral contraceptive containing norgestimate. US clinical trials. Acta Obstet Gynecol Scand Suppl 1990;152:25-31.
25. Lawson JS, Yuliano SE, Pasquale SA, Osterman JJ. Optimum dosing of an oral contraceptive. A report from the study of seven combinations of norgestimate and ethinyl estradiol. Am J Obstet Gynecol 1979;134:315-320.
26. Anderson FD, Hait H. A multicenter, randomized study of an extended cycle oral contraceptive. Contraception 2003;68:89-96.
27. Miller L, Hughes JP. Continuous combined oral contraceptive pills to eliminate withdrawal bleeding: a randomized trial. Obstet Gynecol 2003;101:653-661.
28. Upton GV. The phasic approach to oral contraception: the triphasic concept and its clinical application. Int J Fertil Steril 1983;28:121-140.
29. Mishell DR, Jr. Oral contraception: past, present, and future perspectives. Int J Fertil Steril 1991;37(Suppl):s7-s18.
30. Van Vliet H, Grimes D, Helmerhorst F, Schulz K. Biphasic versus triphasic oral contraceptives for contraception. Cochrane Database Syst Rev 2006;3:CD003283.-
31. Van Vliet H, Grimes D, Helmerhorst F, Schulz K. Biphasic versus monophasic oral contraceptives for contraception. Cochrane Database Syst Rev 2006;3:CD002032.-
32. Rosenberg MJ, Waugh MS, Meehan TE. Use and misuse of oral contraceptives: Risk indicators for poor pill taking and discontinuation. Contraception 1995;51:283-288.
33. Potter L, Oakley D, de Leon-Wong E, Canamar R. Measuring compliance among oral contraceptive users. Fam Plann Perspect 1996;28:154-158.
34. Stubblefield PG. Menstrual impact of contraception. Am J Obstet Gynecol 1994;170:1513-1522.
35. Talwar PP, Dingfelder JR, Ravenholt RT. Increased risk of breakthrough bleeding when one oral-contraceptive tablet is missed. N Engl J Med 1977;296:1236-1237.
36. Wallach M, Grimes DA. Modern Oral Contraception: Updates from the Contraceptive Report. Totowa, NJ: Emron; 2000.
37. Murphy PA, Kern SE, Stanczyk FZ, Westhoff CL. Interaction of St. John’s Wort with oral contraceptives: effects on the pharmacokinectics of norethindrone and ethinyl estradiol, ovarian activity and breakthrough bleeding. Contraception 2005;71:402-408.
38. Baron JA, Greenberg ER. Cigarette smoking and estrogen related disease in women. In: Smoking and Reproductive Health, ed. Rosenberg MJ. Boston: PSG; 1987:149-160.
39. Jusko WJ. Influence of cigarette smoking on drug metabolism in man. Drug Met Rev 1979;9:221-236.
40. Basu J, Mikhail MS, Palan PR, Thysen B, Bloch E, Romney SL. Endogenous estradiol and progesterone concentrations in smokers on oral contraceptives. Gynecol Obstet Invest 1992;33:224-227.
41. Faculty of Family Planning and Reproductive Health Care, Clinical Effectiveness Unit. FFPRHC Guidance (October 2003): First prescription of combined oral contraception. J Fam Plann Reprod Health Care 2003;29:209-222.
42. Sparrow MJ. Pregnancies in reliable pill takers. NZ Med J 1989;102:575-577.
43. Kanarkowski R, Tornatore KM, D’Ambrosio R, Gardner MJ, Jusko WJ. Pharmacokinetics of single and multiple doses of ethinyl estradiol and levonorgestrel in relation to smoking. Clin Pharmacol Ther 1988;43:23-31.
44. Rosenberg MJ, Waugh MS, Stevens CM. Smoking and cycle control among oral contraceptive users. Am J Obstet Gynecol 1996;174:628-632.
45. Vessey MP, Villard-Makintosh L, Jacobs HS. Anti-estrogenic effect of cigarette smoking. N Engl J Med 1987;317:769-770.
46. Darney PD. OC practice guidelines: minimizing side effects. Int J Fertil Womens Med 1997;42(suppl 1):158-169.
47. Krettek JE, Arkin SI, Chaisilwattana P, Monif GR. Chlamydia trachomatis in patients who used oral contraceptives and had intermenstrual spotting. Obstet Gynecol 1993;81:728-731.
48. Gaudet LM, Kives S, Hahn PM, Reid RL. What women believe about oral contraceptives and the effect of counseling. Contraception 2004;69:31-36.
49. Belsey EM. The association between vaginal bleeding patterns and reasons for discontinuation of contraceptive use. Contraception 1988;38:207-225.
50. Jung-Hoffman C, Kuhl H. Intra- and interindividual variations in contraceptive steroid levels during 12 treatment cycles: no relation to irregular bleedings. Contraception 1990;(42):423-438.
51. Rosenberg MJ, Waugh MS, Long S. Unintended pregnancies and use, misuse and discontinuation of oral contraceptives. J Reprod Med 1995;40:355-360.
- Lack of adherence is a common cause of breakthrough bleeding. Focus counseling on ensuring that patients understand and can follow pill-taking instructions before switching pills or method (A).
- If breakthrough bleeding extends beyond 4 cycles and a woman wish to continue using oral contraceptives, consider switching to a pill with a higher ethinyl estradiol (EE):progestin ratio, either by increasing the EE dose or decreasing the relative progestin dose (C).
- Breakthrough bleeding may be due to progestin type; switching from an estrane to a gonane may reduce it (C).
- Women who have breakthrough bleeding after having well-controlled menstrual cycles on oral contraceptives should be assessed for for causes not related to their birth control pills, such as pregnancy, cervicitis, smoking, or interactions with medications (A).
In 1982, more than 20% of women surveyed in a nationally representative sample had discontinued oral contraceptives (OCs) on their own or at the recommendation of their physician due to bleeding or spotting.1 Sadly, the percentage today has not decreased much.
Understandable concern, embarrassment, and annoyance lead these women to abandon OCs.1,2 What they often don’t know, though, is that breakthrough bleeding generally is greatest in the first 3 to 4 months after starting OCs,3 and it steadily declines and stabilizes by the end of the fourth cycle.4 Timely counsel could enable many of these women to cope with the bleeding and stick with an effective contraceptive method. Additional incentives are noncontraceptive benefits of OCs: improved menstrual regularity and decreased menstrual blood loss, dysmenorrhea, and risk of ovarian and endometrial cancer.
Women who discontinue OCs on their own switch to less effective methods of birth control or use no method.1,2 Consequences may be unexpected pregnancies and increased abortion rates.5 With patients who are using OCs, it would be appropriate to ask periodically whether they are satisfied with OC use.
In this review we discuss the mechanisms and management of breakthrough bleeding in women taking OCs, and provide tips for counseling that may help decrease the risk of discontinuation due to menstrual abnormalities in the initial months of use.
Breakthrough bleeding in this review refers to either unplanned spotting or bleeding, regardless of requirement for protection—unless defined otherwise by a specific study under discussion.
4 factors contribute to breakthrough bleeding
Breakthrough bleeding may be due to any the following factors: 1) physiologic effects of OCs on the endometrium, 2) OC-related parameters, including dose, formulation, and regimen, 3) patient behavior, including compliance, using concomitant medications, and smoking, and 4) benign or malignant pathology.
OCs and the endometrium: Estrogen-progestin balance significant
Progestin and estrogen in combination OCs have profound effects on the endometrium, which, though not contributing to contraception, do lead to a predictable pattern of bleeding or such problems as breakthrough bleeding or lack of withdrawal bleed.
Normally, estrogen causes the endometrium to proliferate. Progesterone stabilizes the growing uterine lining. Since the introduction of OCs in 1960, the trend in formulation has been to use the least amount of hormone necessary to inhibit ovulation. Given that the progestin is primarily responsible for the contraceptive efficacy of OCs, the risk of pregnancy is not altered with decreases in the estrogen component. However, significantly lowering the estrogen in OCs may account for breakthrough bleeding. Unplanned bleeding, though, is not dependent solely on the estrogen component as variations in the progestin can contribute to breakthrough bleeding.7
Most OC users in the US take low-dose formulations, so designated because the estrogen component is <50 μg. This level of estrogen in combination with a progestin provides excellent contraceptive efficacy, but may be insufficient to sustain endometrial integrity in some women.8 Studies that have compared OCs containing 20 μg ethinyl estradiol (EE) with those containing 30 μg or 35 μg EE have not been very useful for judging breakthrough bleeding rates because the products often also vary in the phasing and type of progestin. Some studies show more breakthrough bleeding with 20 μg EE pills,9-11 but others show equal or improved cycle control with the lower EE dose.
For the purpose of performing studies, unplanned bleeding is classified by the World Health Organization into 2 categories: 1) breakthrough bleeding, which requires sanitary protection, and 2) spotting, which does not require sanitary protection.6 Despite this formal classification, trials have varied in their terminology and method of recording menstrual irregularities, making comparisons between studies difficult. In addition, there is wide variation among women in tolerance to bleeding abnormalities, perceptions of heavy vs light bleeding, as well as the need for protection.3
Nevertheless, menstrual abnormalities are consistently cited as a common reason for discontinuing OCs. A prospective US study of 1657 women performed in the 1990s reported that 37% of OC users had stopped taking OCs by 6 months after starting a new prescription because of side effects.2 Irregular bleeding was the most common cause; cited by 12% of women, followed by nausea, weight gain, and mood changes, which ranged from 5% to 7%.
Estrogen-progestin balance is more important than absolute level of estrogen. Endrikat et al12 conducted a study to compare two 20 μg EE pills containing different progestins, and to compare 2 levonorgestrel-based formulations with differing EE amounts. An OC of 20 μg EE/100 μg levonorgestrel was compared with a preparation of 20 μg EE/500 mg norethisterone. A 30 μg EE/150 mg levonorgestrel pill was used as a standard reference preparation.
Overall, the 30 μg EE preparation showed a lower cumulative incidence of breakthrough bleeding compared with the 20 μg EE/100 μg levonorgestrel and 20 μg EE/500 μg norethisterone pills over 13 cycles (1.0% vs 4.1% vs 11.7%, respectively). However, the 20 μg EE/500 μg norethisterone pills consistently had higher breakthrough bleeding rates than the 20 μg EE/100 μg levonorgestrel pill. This suggests that, although the higher EE component in the 30 μg pill was important when comparing 2 formulations with the same progestin, the difference in progestins of the two 20 μg EE pills was most likely responsible for the differing rates of breakthrough bleeding.
This study highlights the ability to achieve greater cycle control by titrating the EE component of an OC in a balanced ratio with the same progestin, but suggests that the absolute quantity of EE in a given pill may be less important than maintaining a balance between the 2 hormones or less important than the impact of different progestins on breakthrough bleeding rates.
The delicate balance between estrogen and progesterone supplementation required for contraception may also lead to progestin-induced decidualization and endometrial atrophy, which can result in asynchronous, erratic bleeding.7,13 This has been primarily studied in long-acting progestin-only contraceptives such as implants. Alterations in angiogenic factors14 may play a role. Hysteroscopic studies have shown abnormalities in superficial endometrial blood vessels in terms of size, proliferation, and fragility in women using Norplant.13,15,16 Abnormalities in endothelial cells and extracellular matrix proteins,17 tissue factor,18 and endometrial lymphoid cells19 may contribute to breakthrough bleeding in progestin-dominant environments.
Available OC formulations, doses, and regimens
More than 30 formulations of combination OCs are available in the US, with different doses and types of estrogen and progestin ( TABLE 1 ).20 Approved OCs have been studied in clinical trials to assess contraceptive efficacy and cycle control; however, comparisons between studies regarding bleeding phenomena are impaired by inconsistent terminology.3
While some studies describe breakthrough bleeding and spotting according to their recognized definitions, others simply refer to intermenstrual bleeding or use spotting to refer to any unexpected bleeding. In addition, cycle control studies of OC users frequently do not account for the effects of missed pills, use of concomitant medications, or smoking. The percentage of women who experience breakthrough bleeding in a given cycle varies widely even in different trials of the same formulation.
Pay attention to progestin level. Conventional wisdom holds that OCs with the lowest doses of EE (≤20 μg) are associated with more breakthrough bleeding.11 However, even moderately low doses of either EE or progestin can increase the incidence of breakthrough bleeding. For example, when 3 pills with the same estrogen and progestin (50 μg EE/100 μg norethin-drone; 35 μg EE/100 μg norethindrone; and 35 μg EE/50 μg norethindrone) were compared in 192 women over 8 cycles, the pill containing the lowest amount of norethindrone (35 μg EE/50 μg norethisterone) caused the highest rates of breakthrough bleeding (decreasing to approximately 50% by cycle 8 as compared with 35% in the 35 μg EE/100 μg norethindrone pill and 25% in the 50 μg EE/100 μg norethindrone pill).21
In addition, the number of intermenstrual bleeding days plateaued more slowly as the amount of both hormones in the OC formulations decreased. This underscores the importance of the relative proportions of estrogen and progestin contained in combination OCs and its impact on breakthrough bleeding.
Similarly, a large comprehensive study in 1991 women compared 7 different formulations of combination OCs containing different dose combinations of EE and norgestimate—20/250, 50/250, 35/125, 20/60, 50/60, 30/90, 25/125.25 Total inter-menstrual bleeding was more frequent at lower doses of either estrogen or progestin. However, as long as a similar estrogenprogestin ratio was maintained, bleeding rates were considered acceptable (approximately 10% of days per cycle with bleeding). The authors also noted that in the low-dose range of OCs, small changes in the absolute amount of either EE or norgestimate might result in noticeable changes in bleeding.
Type of progestin may affect breakthrough bleeding. All combination OCs contain either EE or mestranol. However, a variety of progestins have come into use. The 2 most common contraceptive progestins are derived from 19-nortestosterone, and are classified as gonanes or estranes ( TABLE 2 ).22
Estranes include norethindrone and its derivatives, norethindrone acetate and ethinyodiol diacetate. Gonanes include levonorgestrel, norgestrel, desogestrel, gestodene, and norgestimate.
Each progestin differs in half-life, estrogenic, progestogenic, and androgenic properties, and these variations may explain differing rates of breakthrough bleeding among formulations.4 As shown by Endrikat et al,12 pills with the same quantity of EE but different progestins can have marked differences in breakthrough bleeding rates.
Although gonanes have greater progestational activity, no trial has determined which progestin has the best bleeding profile. A recent Cochrane review comparing different progestins did find that, compared with pills containing levonorgestrel, those containing gestodene may be associated with less intermenstrual bleeding.23
Regardless of the progestin used or the quantity of EE, breakthrough bleeding generally decreases with each successive cycle. One study that compared 2 combination OCs composed of EE/norgestimate and EE/norgestrel demonstrated bleeding rates of 11.3% and 10.6% during the first 6 cycles, that decreased to 5.1% and 6.3% in Cycles 13 to 24, respectively.24 Additionally, all women using OCs can experience some cycles without a withdrawal bleed—a menstrual abnormality that may be concerning to those who desire a menstrual period as confirmation that they are not pregnant.
Comparing regimens. OC regimens are available as biphasic, triphasic, extended-cycle, and continuous use. Women using extended-cycle contraceptives may experience more breakthrough bleeding than those using a standard 28-day pill. However, in a 3-month cycle, there are only 7 days of planned bleeding. This is in contrast to 28-day cycles during 3 months in which there are 21 days of planned bleeding.
Though women on extended-cycle regimens may initially experience more breakthrough bleeding than women using 28-day regimens, the total number of planned and unplanned bleeding days may still decrease. Women using a 3-month cycle OC (30 μg EE/150 μg levonorgestrel) experienced more unscheduled bleeding than women using a standard 28-day cycle OC of the same formulation and dose.26 The number of bleeding days decreased with each cycle. Another study examined continuous OC use (20 μg EE/100 μg levonorgestrel) over a period of 1 year, and reported a decreasing number of bleeding days over time.27 In the case of continuous use, all bleeding is unscheduled, and any bleeding is considered breakthrough bleeding.
Multiphasic OC regimens were developed with the intention of decreasing breakthrough bleeding by mimicking the rising and falling pattern of estrogen and progesterone in the normal menstrual cycle.28 After the introduction of the biphasic pill, an increase in breakthrough bleeding was noted, which led to the development of the triphasic pill.29 Though the multiphasic hypothesis is physiologically plausible, recent reviews of the literature have found the evidence for its efficacy too limited and methodologically flawed to draw any definitive conclusions about a decrease in breakthrough bleeding.30,31
TABLE 1
Available OCs by formulation and regimen
| TRADE NAME | GENERIC NAME(S) | TROGEN (DOSE) | PROGESTIN (DOSE) |
|---|---|---|---|
| MONOPHASIC | |||
| Alesse, Levlite | Aviane, Lessina | Ethinyl estradiol (20 μg) | Levonorgestrel (0.1 mg) |
| Mircette | Kariva | Ethinyl estradiol (20 μg×21 days +10 μg×5 days during placebo week) | Desogestrel (0.15 mg) |
| Loestrin FE | Microgestin FE 1/20, June FE 1/20 | Ethinyl estradiol (20 μg) | Norethindrone acetate (1 mg) |
| Yaz | Ethinyl estradiol (20 μg) | Drospirenone (3 mg) | |
| Levlen, Nordette | Levora, Portia | Ethinyl estradiol (30 μg) | Levonorgestrel (0.15 mg) |
| Lo/Ovral | Low-ogestrel, Cryselle | Ethinyl estradiol (30 μg) | Norgestrel (0.3 mg) |
| Desogen, Ortho-cept | Apri | Ethinyl estradiol (30 μg) | Desogestrel (0.15 mg) |
| Loestrin 211/5/30 | Microgestin, Junel Fe | Ethinyl estradiol (30 μg) | Norethindrone acetate (1.5 mg) |
| Yasmin | Ethinyl estradiol (30 μg) | Drospirenone (3 mg) | |
| Ovcon 35 | Ethinyl estradiol (35 μg) | Norethindrone (0.4 mg) | |
| Ortho-Cyclen | Mononesessa, Sprintec | Ethinyl estradiol (35 μg) | Norgestimate (0.25 mg) |
| Brevicon, Modicon | Nortrel, Necon 0.5/35 | Ethinyl estradiol (35 μg) | Norethindrone (0.5 mg) |
| Demulen 1/35 | Zovia 1/35 | Ethinyl estradiol (35 μg) | Ethynodiol diacetate (1 mg) |
| Ortho-Novum 1/35, Norinyl 1+35 | Necon 1/35, Nortrel | Ethinyl estradiol (35 μg) | Norethindrone (1 mg) |
| Ortho-Novum 1/50 | Necon 1/50 | Ethinyl estradiol (50 μg) | Norethindrone (1 mg) |
| Ovral | Ogestrel | Ethinyl estradiol (50 μg) | Norgestrel (0.5 mg) |
| Ovcon 50 | Ethinyl estradiol (50 μg) | Norethindrone (1 mg) | |
| Demulen 1/50 | Zovia 1/50 | Ethinyl estradiol (50 μg) | Ethynodiol diacetate (1 mg) |
| Norinyl 1/50 | Mestranol (50 μg) | Norethindrone (1 mg) | |
| BIPHASIC | |||
| Ortho-Novum 10/11, Jenest | Necon 10/11, Nelova 10/11 | Ethinyl estradiol (35 μg) | Norethindrone (0.5 mg×10 days, 1 mg×11 days) |
| TRIPHASIC | |||
| Ortho Tri-Cyclen Lo | Ethinyl estradiol (25 μg) | Norgestimate (0.18 mg×7 days, 0.215 mg×7 days, 0.25 mg×7 days) | |
| Cyclessa | Velivet | Ethinyl estradiol (25 μg) | Desogestrel (0.1 mg×7 days, 0.125×7 days, 0.15 mg×7 days) |
| T riphasil, Tri-Levlen | Trivora, Enpresse | Ethinyl estradiol (30 μg×6 days, 40 μg×5 days, 30 μg×10 days) | Levonorgestrel (0.05 mg×6 days, 0.075 mg×5 days, 0.125 mg×10 days) |
| Tri-Norinyl | Ethinyl estradiol (35 μg) | Norethindrone (0.5 mg×7 days, 1 mg×9 days, 0.5 mg×5 days) | |
| Ortho Tri-Cyclen | Tri-Sprintec, Trinessa * | Ethinyl estradiol (35 μg) | Norgestimate (0.18 mg×7 days, 0.215 mg×7 days, 0.25 mg×7 days) |
| Ortho-Novum 7/7/7 | Nortrel 7/7/7, Necon 7/7/7 | Ethinyl estradiol (35 μg) | Norethindrone (0.5 mg×7 days, 0.75 mg×7 days, 1 mg×7 days) |
| Estrostep FE | Ethinyl estradiol (20 μg×5 days, 30 μg×7 days, 35 μg×9 days) | Norethindrone acetate (1 mg) | |
| EXTENDED CYCLE | |||
| Seasonale | Ethinyl estradiol (30 μg×84 days followed by 7 placebo pills) | Levonorgestrel (0.15 mg) | |
| Seasonique | Ethinyl estradiol (30 μg×84 days followed by 10 μg×7 days) | Levonorgestrel (0.15 mg) | |
* Corrections were made to this chart following its publication in print.
TABLE 2
Progestins used in oral contraceptive formulations
| ESTRANES | GONANES | SPIROLACTONES |
|---|---|---|
| Norethindrone | Norgestrel | Drospirenone |
| Norethindrone acetate | Levonorgestrel | |
| Ethynodiol diacetate | Norgestimate | |
| Gestodene | ||
| Desogestrel |
Patient behavior contributing to breakthrough bleeding
Skipping a pill is a common cause of breakthrough bleeding.5 Compliance with any OC regimen is crucial to achieving a regular and predictable bleeding pattern. Of 6676 women surveyed retrospectively, 19% reported missing 1 or more pills per cycle, and 10% reported missing 2 or more pills per cycle.32 Prospective studies have found even higher rates of inconsistent use.
When an electronic device was used to monitor pill ingestion, up to 81% of women were found to miss at least 1 pill per cycle and up to 51% missed 3 or more pills per cycle.33
Other side effects also adversely affect adherence. For example, women experiencing nausea may skip pills, which leads to breakthrough bleeding and, ultimately, discontinuation.34 Patients need to understand the impact of skipping pills. Women who report irregular bleeding are 1.6 to 1.7 times more likely as those not reporting this side effect to miss 2 or more pills per cycle.5 Even 1 missed pill can increase the risk of bleeding irregularities.35
Failure to take the pill at the same time every day, as well as poor comprehension of pill-taking instructions, are other strong predictors of inconsistent use and breakthrough bleeding.32
Taking some prescription and over-the-counter medications, as well as herbal supplements, may interfere with the activity of OCs to alter bleeding patterns and contraceptive efficacy.36 Medications that induce the cytochrome P-450 system (CYP450) in the liver increase the metabolism of OCs. Anticonvulsants, the antituberculosis agent rifampin, and antifungals such as griseofulvin, can increase the clearance of steroid hormones and thus lead to breakthrough bleeding. The herbal supplement St. John’s Wort, commonly used for mild to moderate depression, is associated with CYP450 induction. It has been shown to increase the incidence of breakthrough bleeding and probably ovulation in women taking OCs.37
Smoking is associated with such anti-estrogenic effects as early menopause, osteoporosis, and menstrual abnormalities.38 These effects may be related to the induction of hepatic estrogen and progesterone metabolism by cigarette smoking.39,40
Before receiving OCs, women are made aware of the relationship between smoking, OCs, and an increased risk of myocardial infarction, stroke, and venous thromboembolism.41 They should also understand that the anti-estrogenic effect of smoking may lower estrogen levels and lead to breakthrough bleeding, even in women who are reliable pill-takers.42,43
Smoking appears to have a dose-response relationship with breakthrough bleeding. Increasing levels of smoking have been associated with an increased risk of spotting or bleeding in each cycle.44 The difference in cycle control between smokers and nonsmokers appears to be more pronounced with each cycle. Smokers demonstrate a 30% elevation in the risk of bleeding irregularities compared with nonsmokers in the first cycle of use, which rises to an 86% increased risk by the sixth cycle.
Reports conflict regarding the relationship between smoking and contraceptive efficacy, suggesting that confounding factors like compliance may be more important than the antihormonal effect of cigarettes.45 Nevertheless, women who smoke should be informed of this potential complicating factor to OC use and as yet another reason to encourage smoking cessation.
Pathologic causes of breakthrough bleeding
When a woman experiences difficult cycle control after the first 3 to 4 months of OC use, consider the possibility of benign and malignant growths, including endometrial polyps, submucous myomas, and cervical or endometrial cancer.46 Additionally, contraceptive failure must always be a consideration and that what appears to be breakthrough bleeding may actually represent bleeding in early pregnancy.
Cervicitis is an important but largely unrecognized source of unplanned bleeding in women using OCs. Causative organisms include chlamydia, gonorrhea, and trichomonas.22 Intermenstrual bleeding in women previously well controlled on OCs is particularly suggestive of asymptomatic chlamydia cervicitis.
Krettek et al37 found that 29.2% of women who had been taking OCs for more than 3 months and presented with intermenstrual spotting had a positive test for Chlamydia trachomatis. By comparison, chlamydia cervicitis was found in 10.7% of matched controls taking OCs without spotting who were screened for symptoms of vaginitis or high-risk sexual behavior, and in just 6.1% of women undergoing routine screening before the initiation of contraception.
3 aspects of managing breakthrough bleeding
Managing breakthrough bleeding involves effective pretreatment and ongoing counseling, reassurance, and timely and appropriate diagnostic testing (TABLE 3). In some instances, pill-switching or other forms of medical management may be helpful, but these options are largely unproven.
TABLE 3
What to review with patients who are starting a combination OC
|
Counseling reduces anxiety and improves satisfaction, adherence
In a recent survey, 649 Canadian women who were picking up prescriptions for OCs were asked to complete a questionnaire at the pharmacy while they waited.48 Over one third (34.5%) reported they had not received counseling from their health-care provider about breakthrough bleeding. Furthermore, only 28.3% of women who were counseled, and 26.1% of women who were not counseled, gave the optimal response to breakthrough bleeding as defined in this study (“continue taking pill and not call my doctor”).
Lack of counseling can lead to poor method satisfaction and significant cost expenditures due to visits and phone calls by women experiencing unexpected bothersome side-effects.5 Compared with women who reported the highest satisfaction with the care they received from their provider, those reporting the lowest scores were 1.6 to 2.2 times as likely to be dissatisfied with the pill.
Inform women that breakthrough bleeding is common in the first 3 to 4 cycles of OC use, that bleeding irregularities tend to decline with each successive cycle, and that they should not discontinue pill use without discussing their concerns with you. Remind women to keep sanitary protection with them during the first few months. The impact of poor counseling was underscored in a study of women enrolled in clinical trials of OCs, contraceptive vaginal rings, and Depo-Provera. Women taking OCs were the least likely to have been warned of menstrual irregularities and thus tended to stop using that method more often than those using a ring or Depo-Provera.49 Of women who discontinue OCs, 47% use a less effective method and 19% use no method at all.1
Give specific instructions for specific regimens. Given the array of OC regimens available, make sure women know how to take them properly. This will help ensure contraceptive efficacy and cycle control. Women who do not understand pill-package instructions are up to 2.8 times more likely to miss pills, which increases the risk of breakthrough bleeding and impacts contraceptive efficacy.5 Among women who were counseled about the consequences of missed pills, 76% reported knowing what to do in response (“use another form of birth control that month”). Of women who received no such counseling, only 48% gave the appropriate response (P<.001).48 To improve adherence, advise women to establish a routine for pill-taking: taking the pill at the same time each day or linking pill ingestion with another daily activity, such as tooth brushing. Women without an established routine were 3.6 times more likely to miss 2 or more pills per cycle than women with a routine.5
Reassurance regarding contraceptive efficacy
Reassure users who take their pills routinely that breakthrough bleeding and contraceptive efficacy are not linked.50 Breakthrough bleeding is not a sign that OCs are not working.4 On the other hand, approximately 1 million unintended pregnancies in the United States each year are associated with misuse or discontinuation of OCs.51
When to consider diagnostic testing
For OC users who continue to experience breakthrough bleeding beyond 3 to 4 cycles, other potential causes must be ruled out using appropriate diagnostic tests. A pregnancy test, appropriate testing for cervical infection, a pregnancy test, pelvic ultrasound, Pap smear, or endometrial biopsy may be warranted depending on clinical circumstances.
Fall-back options
If breakthrough bleeding continues beyond 3 months, and other reasons including poor adherence and pathologic processes are excluded, you could consider providing estrogen or switching to a different pill, though no clinical trials support definitive recommendations.
Aside from changing from a multiphasic to a monophasic formulation, altering the progestin component is often a first step in trying to control breakthrough bleeding.46 An OC with a gonane rather than an estrane progestin may be beneficial as this class of progestins may provide more consistent hormonal effects on the endometrium.
Choosing an OC with a higher quantity of EE may also help, particularly for women using 20 μg pills. When possible, the same progestin should be used.
You may want to start a trial of conjugated estrogen, 1.25 mg, or estradiol, 2 mg, administered for 7 days when bleeding occurs. This can be repeated if necessary; however, if breakthrough bleeding continues despite this treatment, consideration of a different pill or method should be undertaken.
CORRESPONDENCE
Patricia A. Lohr, MD, University of Pittsburgh, Magee-Womens Hospital, 300 Halket Street, Pittsburgh, PA 15213-3180. E-mail: [email protected]
1. Pratt WF, Bachrach CA. What do women use when they stop using the pill? Fam Plann Perspect 1987;19:257-266.
2. Rosenberg MJ, Waugh MS. Oral contraceptive discontinuation: A prospective evaluation of frequency and reasons. Am J Obstet Gynecol 1998;179:577-582.
3. Thorneycroft IH. Cycle control with oral contraceptives: A review of the literature. Am J Obstet Gynecol 1999;180:S280-S287.
4. Speroff L, Darney PD. A Clinical Guide for Contraception. 3rd ed. Philadelphia, Pa: Lippincott Williams & Wilkins; 2001.
5. Rosenberg MJ, Waugh MS, Burnhill MS. Compliance, counseling, and satisfaction with oral contraceptives: A prospective evaluation. Fam Plann Perspect 1998;30:89-92,104.
6. Belsey EM, Machin D, d’Arcangues C. The analysis of vaginal bleeding patterns induced by fertility regulating methods. World Health Organization Special Programme of Research, Development and Research Training in Human Reproduction. Contraception 1986;34:253-260.
7. ESHRE Capri Workshop Group. Ovarian and endometrial function during hormonal contraception. Hum Reprod 2001;16:1527-1535.
8. Kaunitz AM. Oral contraceptive estrogen dose considerations. Contraception 1998;58(Suppl):15S-21S.
9. Preston SN. A report of a collaborative dose-response clinical study using decreasing doses of combination oral contraceptives. Contraception 1972;6:17-35.
10. Akerlund M, Rode A, Westergaard J. Comparative profiles of reliability, cycle control and side effects of two oral contraceptive formulations containing 150 mcg desogestrel and either 30 mcg or 20 mcg ethinyl oestradiol. Br J Obstet Gynaecol 1993;100:832-838.
11. Gallo MF, Nanda K, Grimes DA, Schulz KF. Twenty micrograms vs >20 microg estrogen oral contraceptives for contraception: a systematic review of randomized controlled trials. Contraception 2005;71:162-169.
12. Endrikat J, Hite R, Bannemerschult R, Gerlinger C, Schmidt W. Multicenter, comparative study of cycle control, efficacy and tolerability of two low-dose oral contraceptives containing 20 microg ethinylestradiol/100 microg levonorgestrel and 20 microg ethinylestradiol/50 microg noresthisterone. Contraception 2001;64:3-10.
13. Hickey M, Fraser I, Dwarte D, Graham S. Endometrial vasculature in Norplant users: preliminary results from a hysteroscopic study. Hum Reprod 1996;11(Suppl 2):35-44.
14. Smith SK. Steroids and endometrial breakthrough bleeding: future directions for research. Hum Reprod 2000;15(Suppl 3):197-202.
15. Song JY, Markham R, Russell P, Wong T, Young L, Fraser IS. The effect of high-dose medium- and long-term progestogen exposure on endometrial vessels. Hum Reprod 1995;10:797-800.
16. Hickey M, Dwarte D, Fraser IS. Superficial endometrial vascular fragility in Norplant users and in women with ovulatory dysfunctional uterine bleeding. Hum Reprod 2000;15:1509-1514.
17. Rodriguez-Manzaneque JC, Graubert M, Iruela-Arispe ML. Endothelial cell dysfunction following prolonged activation of progesterone receptor. Hum Reprod 2000;15(Suppl 3):39-47.
18. Lockwood CJ, Runic R, Wan L, Krikun G, Demopolous R, Schatz F. The role of tissue factor in regulating endometrial haemostsis: Implications for progestin-only contraception. Hum Reprod 2000;15(Suppl 3):144-151.
19. Clark DA, Wang S, Rogers P, Vince G, Affandi B. Endometrial lymphoid cells in abnormal uterine bleeding due to levonorgestrel (Norplant). Hum Reprod 1996;11:1438-1444.
20. Hatcher RA, Trussell J, Stewart FH. Contraceptive Technology. 18th ed. New York: Ardent Media; 2004.
21. Saleh WA, Burkman RT, Zacur HA, Kimball AW, Kwieterovich P, Bell W. A randomized trial of three oral contraceptives: comparison of bleeding patterns by contraceptive types and steroid levels. Am J Obstet Gynecol 1993;168:1740-1747.
22. Stenchever MA, Ling FW. Comprehensive Gynecology. 4th ed. St Louis, Mo: Mosby; 2001.
23. Maitra N, Kulier R, Bloemenkamp KW, Helmerhorst FM, Gulmezoglu AM. Progestogens in combined oral contraceptives for contraception. Cochrane Database Syst Rev 2004;(3):CD004861.-
24. Corson SL. Efficacy and clinical profile of a new oral contraceptive containing norgestimate. US clinical trials. Acta Obstet Gynecol Scand Suppl 1990;152:25-31.
25. Lawson JS, Yuliano SE, Pasquale SA, Osterman JJ. Optimum dosing of an oral contraceptive. A report from the study of seven combinations of norgestimate and ethinyl estradiol. Am J Obstet Gynecol 1979;134:315-320.
26. Anderson FD, Hait H. A multicenter, randomized study of an extended cycle oral contraceptive. Contraception 2003;68:89-96.
27. Miller L, Hughes JP. Continuous combined oral contraceptive pills to eliminate withdrawal bleeding: a randomized trial. Obstet Gynecol 2003;101:653-661.
28. Upton GV. The phasic approach to oral contraception: the triphasic concept and its clinical application. Int J Fertil Steril 1983;28:121-140.
29. Mishell DR, Jr. Oral contraception: past, present, and future perspectives. Int J Fertil Steril 1991;37(Suppl):s7-s18.
30. Van Vliet H, Grimes D, Helmerhorst F, Schulz K. Biphasic versus triphasic oral contraceptives for contraception. Cochrane Database Syst Rev 2006;3:CD003283.-
31. Van Vliet H, Grimes D, Helmerhorst F, Schulz K. Biphasic versus monophasic oral contraceptives for contraception. Cochrane Database Syst Rev 2006;3:CD002032.-
32. Rosenberg MJ, Waugh MS, Meehan TE. Use and misuse of oral contraceptives: Risk indicators for poor pill taking and discontinuation. Contraception 1995;51:283-288.
33. Potter L, Oakley D, de Leon-Wong E, Canamar R. Measuring compliance among oral contraceptive users. Fam Plann Perspect 1996;28:154-158.
34. Stubblefield PG. Menstrual impact of contraception. Am J Obstet Gynecol 1994;170:1513-1522.
35. Talwar PP, Dingfelder JR, Ravenholt RT. Increased risk of breakthrough bleeding when one oral-contraceptive tablet is missed. N Engl J Med 1977;296:1236-1237.
36. Wallach M, Grimes DA. Modern Oral Contraception: Updates from the Contraceptive Report. Totowa, NJ: Emron; 2000.
37. Murphy PA, Kern SE, Stanczyk FZ, Westhoff CL. Interaction of St. John’s Wort with oral contraceptives: effects on the pharmacokinectics of norethindrone and ethinyl estradiol, ovarian activity and breakthrough bleeding. Contraception 2005;71:402-408.
38. Baron JA, Greenberg ER. Cigarette smoking and estrogen related disease in women. In: Smoking and Reproductive Health, ed. Rosenberg MJ. Boston: PSG; 1987:149-160.
39. Jusko WJ. Influence of cigarette smoking on drug metabolism in man. Drug Met Rev 1979;9:221-236.
40. Basu J, Mikhail MS, Palan PR, Thysen B, Bloch E, Romney SL. Endogenous estradiol and progesterone concentrations in smokers on oral contraceptives. Gynecol Obstet Invest 1992;33:224-227.
41. Faculty of Family Planning and Reproductive Health Care, Clinical Effectiveness Unit. FFPRHC Guidance (October 2003): First prescription of combined oral contraception. J Fam Plann Reprod Health Care 2003;29:209-222.
42. Sparrow MJ. Pregnancies in reliable pill takers. NZ Med J 1989;102:575-577.
43. Kanarkowski R, Tornatore KM, D’Ambrosio R, Gardner MJ, Jusko WJ. Pharmacokinetics of single and multiple doses of ethinyl estradiol and levonorgestrel in relation to smoking. Clin Pharmacol Ther 1988;43:23-31.
44. Rosenberg MJ, Waugh MS, Stevens CM. Smoking and cycle control among oral contraceptive users. Am J Obstet Gynecol 1996;174:628-632.
45. Vessey MP, Villard-Makintosh L, Jacobs HS. Anti-estrogenic effect of cigarette smoking. N Engl J Med 1987;317:769-770.
46. Darney PD. OC practice guidelines: minimizing side effects. Int J Fertil Womens Med 1997;42(suppl 1):158-169.
47. Krettek JE, Arkin SI, Chaisilwattana P, Monif GR. Chlamydia trachomatis in patients who used oral contraceptives and had intermenstrual spotting. Obstet Gynecol 1993;81:728-731.
48. Gaudet LM, Kives S, Hahn PM, Reid RL. What women believe about oral contraceptives and the effect of counseling. Contraception 2004;69:31-36.
49. Belsey EM. The association between vaginal bleeding patterns and reasons for discontinuation of contraceptive use. Contraception 1988;38:207-225.
50. Jung-Hoffman C, Kuhl H. Intra- and interindividual variations in contraceptive steroid levels during 12 treatment cycles: no relation to irregular bleedings. Contraception 1990;(42):423-438.
51. Rosenberg MJ, Waugh MS, Long S. Unintended pregnancies and use, misuse and discontinuation of oral contraceptives. J Reprod Med 1995;40:355-360.
An easy approach to evaluating peripheral neuropathy
- Pain described by patients as electric shocks, burning, freezing, tightness, or throbbing suggests toxic, metabolic, or ischemic causes of neuropathy (C).
- When motor and sensory symptoms appear together, rank them in order of symptom predominance. Motor symptom supremacy may indicate an immune-related disorder (C).
- When measuring sensory thresholds, keep in mind that they normally increase with the patient’s age and height. Vibration sensation in the toes of elderly persons is often said to be decreased, when in fact it is only an age-related change (C).
Polyneuropathy has an estimated prevalence of about 2% in the general population.1,2 Despite being common, polyneuropathy remains a diagnostic challenge for most clinicians for many reasons, including the large number of potential causes and the fact that a specific cause often cannot be identified even after appropriate testing. These factors can contribute to uncertainty about the direction and level of aggressiveness of the evaluation. The result is often a “one size fits all” strategy—from an unnecessarily expensive “shotgun” approach to a “defeatist” attitude that too quickly deems a neuropathy as idiopathic.
A number of experts have developed algorithms for the evaluation of neuropathy.1,3-8 We have incorporated and modified many of these suggestions to develop a simple, user-friendly approach; one that characterizes the neuropathy using “what?”, “where?”, “when?” and “what setting?” parameters (FIGURE).
The focus of this article is on the polyneuropathy that presents with widespread sensory or sensorimotor symptoms and signs. We will not discuss the evaluation of other peripheral neuropathic processes—eg, mononeuropathies, plexopathies, or motor neuronopathies such as amyotrophic lateral sclerosis. We emphasize the fundamental step of determining whether the polyneuropathy is a distal, symmetrical, sensory or sensorimotor polyneuropathy, in which case metabolic/toxic, inherited and idiopathic causes are more probable. In contrast, alternative presentations suggest immune-mediated and infectious causes.
What: Sensory, motor, or autonomic?
The first step is to assign the patient’s complaints and your examination findings to specific nerve fiber types of the peripheral nervous system: sensory, motor, or autonomic.5
FIGURE
Characterizing your patient’s neuropathy
Sensory findings help narrow your search
Once you have ruled out a nonneuropathic process (eg, arthritis) as the cause of sensory symptoms and signs, turn your attention to distinguishing between peripheral or central nervous system dysfunction. When the pathology resides in the central nervous system (eg, multiple sclerosis) accompanying symptoms and signs usually assist in localization. If a patient acknowledges clinical features suggesting past or present involvement of cerebellar, urinary, or visual (eg, optic neuritis) systems, for example, magnetic resonance imaging rather than electrodiagnostic testing may be warranted.
In a patient with peripheral nervous system dysfunction, sensory abnormalities help exclude neuromuscular diseases not associated with sensory dysfunction, such as myopathies, neuromuscular transmission disorders, or disease of the motor neuron.
Positive neuropathic sensory symptoms suggest acquired polyneuropathies. Patients may describe “prickling,” “tingling,” “swelling,” “asleep-like numbness,” or a sensation of “bunched-up socks.” Patients with acquired polyneuropathies usually complain of positive neuropathic sensory symptoms (PNSS), whereas patients with inherited polyneuropathies only rarely do (FIGURE).
Pain suggests toxic, metabolic, or ischemic causes. Patients may describe “electric shocks,” “burning,” “freezing,” “tightness,” or “throbbing.” They may complain of discomfort or pain to sensory stimuli that under normal circumstances would not be painful (allodynia)—eg, discomfort evoked by a bed sheet resting on the feet. They may also describe exaggerated pain to stimuli that would normally evoke low levels of discomfort or pain (hyperalgesia).
A painful neuropathy narrows the differential diagnosis to diseases that affect smaller nerve fibers, which generally convey pain and temperature input. Causes may be toxic, metabolic, ischemic, or idiopathic. For example, a pure “small-fiber” polyneuropathy commonly occurs in patients aged >60 years and typically causes painful feet. It is often idiopathic, but diabetes or impaired glucose tolerance and alcohol toxicity should be explored.9 Patients with painful neuropathy usually also exhibit reduced or absent sensation of pinprick and temperature in the distribution of their sensory complaints.
Negative neuropathic sensory symptoms. In addition to positive neuropathic symptoms, patients may complain of “negative” symptoms such as loss of sensation and imbalance. Examination usually reveals abnormalities of proprioception and sensation to vibration with reduced or absent deep tendon reflexes and ataxia. These features can occur in acquired or inherited causes of neuropathy.
Important sensory tests. Test sensation on the toes and fingertips, and more proximally (eg, ankle and shin) if any abnormality is found at these distal sites. Test vibration with a 128 Hz tuning fork, pinprick with disposable safety pin, and light touch with a cotton swab.
You may test temperature sensation by warming or cooling the handle or prong of the tuning fork and applying it to the patient’s skin.
Joint position testing is performed by asking the patient to avert his eyes, then moving the distal phalanx of a finger or toe up or down by small increments and asking the patient to tell you the direction of movement. Assess a patient’s casual and tandem gait for unsteadiness or ataxia.
Motor symptoms: Weigh them against sensory findings
Most patients with neuropathy have some degree of weakness, but it is usually overshadowed by sensory complaints. Distal lower extremity weakness may manifest as “foot drop,” which, if it affects ankle dorsiflexion, may cause a “slapping” or noisy step due to the forefoot hitting the ground with abnormal force.
Distal upper extremity weakness may cause trouble with fine motor skills of the hands.
Proximal weakness may present as difficulty in rising from a chair or lifting objects above the shoulders.
There may be muscle atrophy or fasciculations.
Motor symptoms are seldom the sole complaint. When motor and sensory symptoms are combined, it is helpful to rank them in order of symptom predominance—ie, motor greater than sensory, or vice versa. For instance, many immune-mediated disorders, such as Guillain-Barré syndrome and chronic inflammatory demyelinating polyradiculoneuropathy (CIDP), produce chiefly motor abnormalities and fewer sensory symptoms. Sensory complaints predominate in many other polyneuropathies, especially the “length-dependent” polyneuropathies (ie, those affecting the longer nerves initially) caused by metabolic or toxic disorders.
Autonomic symptom evaluation
The number of processes that affect both autonomic and somatic nerves are relatively few (TABLE 1).5,7,10 It is particularly important to assess symptoms suggesting involvement of the autonomic nervous system.
Autonomic symptoms include lightheadedness, syncope, diarrhea, constipation, postprandial bloating, early satiety, urinary complaints, erectile dysfunction, abnormal or absent sweating, and dry mouth and eyes. Many of these complaints are common in the general population, so their relevance should be based on severity and temporal evolution, as well as comorbidities and medication use.
When complaints do not clearly implicate pathology in the autonomic nervous system, autonomic testing may be helpful, targeted for the domain that may be impaired. For example, bedside orthostatics or tilt-table testing are used for pre-syncopal symptoms, but gastric emptying testing can assist the evaluation of complaints of early satiety or postprandial bloating.
TABLE 1
Relatively common acquired polyneuropathies with autonomic nervous system involvement
| Diabetes mellitus |
| Amyloidosis |
| Guillain-Barré syndrome |
| Paraneoplastic neuropathy (usually small cell lung cancer) |
| Sjögren’s syndrome–associated neuropathy |
Where: The distribution of nerve involvement
“Where” refers to distribution of nerve involvement 1) globally throughout the body and 2) locally along the nerve(s). During the history taking and examination, determine the nature of general distribution (eg, symmetric or asymmetric) and where along the length of the nerve(s) (proximal and/or distal) the dysfunction exists.
Polyneuropathy most commonly presents in a “length-dependent” distribution, with clinical features appearing initially most distally and symmetrically (ie, in the feet). Asymmetry and involvement of the proximal parts of a nerve are “red flags” for an uncommon cause that may require referral to a neurologist (FIGURE).
Comparative vs absolute measurements. At bedside, 2 approaches are used to assess the distribution of nerve involvement: comparative and absolute. The comparative approach searches for a relative difference in sensory thresholds or weakness between sites. It can assess side-to-side or one nerve (or root or region) territory to another. It is useful for establishing sensory or motor impairment in a radicular, plexus, or single nerve distribution.
Testing for an absolute reduction in sensation (eg, decreased vibration in the toes) can be more challenging because it requires experience in judging what is normal and abnormal according to expectations for a particular site and modality. Take into account that sensory thresholds are normally increased with the patient’s age and height.11 For example, we commonly encounter elderly patients whose vibration sensation in the toes is said to be decreased, when in fact the reduced sensory threshold is only an age-related change.
Most assessments of sensory thresholds use the absolute approach because most generalized polyneuropathies are “length-dependent.”
Perform motor testing for appendicular (upper and lower extremities) and axial (neck and trunk) muscles, assessing particularly for weakness, atrophy, and fasciculations.
The typical polyneuropathy caused by metabolic, toxic, inherited, or unknown causes is distal and symmetric.12 Neuropathies caused by other mechanisms, such as immune-mediated or infectious, are rarely length-dependent. Examples include motor neuronopathies (eg, amyotrophic lateral sclerosis), sensory neuronopathies (eg, paraneoplastic), polyradiculoneuropathies (Guillain-Barré syndrome, CIDP), and mononeuritis multiplex (caused by vasculitis).
When: The time course of signs and symptoms
Knowing whether the onset of neuropathy was definite and abrupt or was gradual is the most helpful temporal clue to possible underlying causes. The time course (ie, tempo) following onset is also important.
An acute/subacute onset with a definite date often suggests an immune-mediated or an infectious process (FIGURE). With respect to immune-mediated neuropathies, consider primarily autoimmune conditions (eg, Guillain-Barré syndrome, vasculitic neuropathy) and also paraneoplastic autoimmune syndromes (eg, subacute sensory neuropathy). In the latter case, a cancer presents to the immune system an epitope that is similarly found in the nervous system, prompting an autoimmune attack of the nervous system. Both autoimmune and infectious processes almost always have a rapid start on a definite date.
With an insidious onset, the patient won’t recollect a definite date on which the neuropathy began. The underlying mechanism usually is an inherited, metabolic, or toxic process—or idiopathic, if a cause cannot be identified.
The disease course sheds additional light on the causative mechanism. Onset and subsequent progression often correlate in a predictable manner, owing in part to the underlying mechanism. For example, an acute onset neuropathy often is followed by rapid disease progression, especially when caused by an autoimmune process (Guillain-Barré and vasculitic neuropathy). On the other hand, a neuropathy of insidious onset usually follows a slow or even static course. But there are exceptions that may make the diagnosis challenging and illustrate the need for clinical follow-up.
What setting
The patient’s medical history, medications, social and family history, and a review of systems can uncover known risk factors for neuropathic processes.
Common causes of acquired polyneuropathies are diabetes mellitus, chronic renal disease, and alcohol dependence. If a patient with distal, symmetric sensory complaints also has any of these conditions, a causal relationship should be considered. Another example is the patient with a history of bariatric surgery, which could lead to neuropathy as a result of malnutrition, particularly vitamin B1 and B12 deficiencies.13
The clinical setting may indicate a need for further evaluation by a neurologist. For example, a family history of inherited neuropathy in a patient with high arches and curled “hammer” toes would strongly suggest Charcot-Marie-Tooth (CMT) disease, also known as hereditary motor and sensory neuropathy. A patient with a monoclonal gammopathy may have a paraproteinemic neuropathy that warrants further evaluation by a neuromuscular specialist. Although more rare, a paraneoplastic cause would warrant consideration in a smoker, especially if the neuropathy was subacute. In many cases, neuropathic symptoms are the first clue of a new medical condition (eg, impaired glucose tolerance).
Electrodiagnostic testing: What it can and can’t tell you
Most polyneuropathies warrant additional electrodiagnostic evaluation in an electromyography (EMG) laboratory. Electro-diagnostic testing comprises 2 procedures: nerve conduction studies and needle electrode examination.
Preparing your patient. When ordering this study, be sure to discuss it thoroughly with the patient. The entire study typically takes an hour or longer. And it can be painful, though in our experience nearly every patient tolerates the procedure. Most important for the patient to understand is that information gleaned from electrodiagnostic testing may be essential to the diagnosis, as explained below.
Many benefits of the study. First, electrodiagnostic testing can confirm a peripheral neuropathic basis for a patient’s complaints.
Second, electrodiagnostic testing helps characterize a neuropathy as primarily demyelinating, primarily axonal, or mixed demyelinating and axonal. An example of this benefit is that a primary demyelinating characterization greatly narrows the list of possible causes (eg, Guillain-Barré syndrome, chronic inflammatory demyelinating polyradiculoneuropathy, Charcot-Marie-Tooth disease type 1).
Third, electrodiagnostic testing assists in characterizing the neuropathic process as sensory, motor or sensorimotor.
Fourth, electrodiagnostic testing helps localize the neuropathic process (the “where”).
Fifth, electrodiagnostic testing can gauge the severity of the neuropathic process.
Limitations of the study. When the study returns normal results, keep in mind it has limited sensitivity. For example, nerve conduction studies are only able to assess the function of larger myelinated nerve fibers; a neuropathic process solely in small fibers will not be evident with this test. Likewise, the needle electrode examination is unable to assess small nerve fiber status. We include this caveat in our electrodiagnostic testing reports of patients who have symptoms suggestive of pure small fiber polyneuropathy.
When might blood studies be useful?
Laboratory testing of blood is often of great value, but only after a particular polyneuropathy has been characterized and placed into one or more potential etiologic subgroups.
For example, laboratory testing for a distal, symmetric sensory polyneuropathy (TABLE 2) should be much different than testing for another presentation (eg, mononeuritis multiplex). TABLE 3 details some of the laboratory tests we recommend for the more common polyneuropathies that don’t typically present in a distal, symmetric sensory fashion or that are accompanied by other distinctive features. In our experience, clinicians too frequently order unnecessary and expensive tests for disorders only rarely associated with neuropathy; the rare causes of neuropathy are intentionally not the subject of this review.
TABLE 2
Common blood tests for the evaluation of a distal, symmetrical neuropathy1,3,5,6,8
| TEST | POTENTIAL CONFIRMATORY VALUE OF TESTS |
|---|---|
| Fasting glucose or 2-hour oral glucose tolerance test | Diabetes mellitus and possibly impaired glucose tolerance (“pre-diabetes”) cause neuropathy |
| Serum protein electrophoresis | Paraproteinemias, including monoclonal gammopathy of undetermined significance, Waldenstrom’s macroglobulinemia, and osteosclerotic myeloma, are often associated with a demyelinating neuropathy. Amyloidosis and mixed cryoglobulinemiacan also cause an axonal neuropathy |
| Chemistry profile | Uremic neuropathy |
| Hepatitis C titer | Hepatitis C is associated with neuropathy, particularly when associated with mixed cryoglobulinemia. This neuropathy usually presents asymmetrically and often as mononeuritis multiplex but sometimes as a distal, symmetrical neuropathy |
| Serum B12 level | Vitamin B12 deficiency may cause neuropathy, often in association with symptoms and signs of myelopathy |
TABLE 3
Other diagnostic tests for acquired neuropathies in specific clinical situations2,4,5,7
| SUSPECTED PATHOLOGIC PROCESSES AND PERTINENT TESTS | POTENTIAL CONFIRMATORY VALUE OF TESTS |
|---|---|
| Metabolic/toxic | |
| Complete blood count | Elevated MCV may suggest alcoholism, vitamin B12 deficiency |
| Thiamine level | Thiamine deficiency (eg, alcoholics or following bariatric surgery) |
| Urine heavy metals | Heavy metal intoxication (rare; usually systemic symptoms too) |
| Thyroid function tests | Hypothyroid neuropathy (rare) |
| Inflammatory | |
| Complete blood count | If systemic vasculitic neuropathy suspected (eg, patient presents with painful “mononeuritis multiplex”) systemic vasculitic neuropathy |
| Markers of vasculitis or systemic inflammation (ESR, ANCA, RF, ANA, ENA, cryoglobulins, etc) | Cryoglobulinemic neuropathy is associated with hepatitis C |
| Cerebrospinal fluid (CSF) | CSF protein elevation in Guillain-Barré syndrome and chronic inflammatory demyelinating polyneuropathy |
| Neoplastic/paraneoplastic | |
| Paraneoplastic serology (technique and scope of testing varies between different labs) | Neuropathy associated with cancer, especially subacute and severe neuropathic processes in smokers (eg, subacute sensory neuronopathy associated with small cell lung cancer) |
| Chest X-ray and other imaging for cancer | Small cell lung cancer or other malignancy |
| Cerebrospinal cytology | Carcinomatous or lymphomatous polyradiculopathy. |
| Infectious | |
| Cerebrospinal fluid | CSF pleocytosis common in infectious polyradiculoneuropathies (Lyme, sarcoid, HIV) |
| Lyme titers (serum, cerebrospinal fluid) | Lyme neuroborreliosis |
| HIV testing | HIV-associated neuropathy |
| Hepatitis C (serum cryoglobulin testing) | Hepatitis C—mixed cryoglobulinemia |
Common causes of distal, symmetric polyneuropathies
Distal, symmetric polyneuropathies are usually due to metabolic/toxic, inherited, or idiopathic causes (FIGURE, TABLE 2). As such, it is often unnecessary to obtain diagnostic tests searching for active infectious, autoimmune or paraneoplastic etiologies.3 In electrodiagnostic terms, these neuropathies are almost always primarily axonal rather than demyelinating, usually involving both large and small nerve fibers.
Diabetes is the most common cause of neuropathy in developed Western countries, occurring in more than 50% of patients who require insulin.14 Diabetic neuropathy typically presents as a distal, symmetric neuropathy syndrome, though diabetic lumbosacral radiculoplexus neuropathy (diabetic amyotrophy) and other presentations may be seen less commonly.
Recent evidence suggests that neuropathy—particularly a sensory and often painful, distal, symmetric “small-fiber” neuropathy—sometimes occurs in patients with impaired fasting glucose (IFG) or impaired glucose tolerance (IGT).15-19 The 2-hour oral glucose tolerance test has been deemed more sensitive for the early diabetic state of IGT/IFG associated with neuropathy.19 It remains to be seen whether this early diabetic state neuropathy will turn out to represent a large percentage of cases of what were previously thought of as idiopathic small-fiber neuropathy.
Alcoholism is another common cause of a distal, symmetric neuropathy that is predominantly sensory with a painful, burning sensation.20-22 Alcohol abuse and dependence occurs in 10% to 20% of the primary care population.23,24 The prevalence of neuropathy in alcoholics is uncertain, though 1 study of hospitalized patients admitting to daily alcohol intake of over 100 g for men or 80 g for women (10 oz of beer, 1 oz liquor and 3–4 oz wine each have 10 g of alcohol) for 2 years or more (mean of 238±120 g for a period of 22.7±10.2 years) demonstrated that one third of patients had electrophysiologic evidence of peripheral neuropathy and one fourth of autonomic neuropathy.20 Most subjects in this cohort did not show any clinical or laboratory evidence of malnutrition.
Frequently alcoholic neuropathy coexists with thiamine-deficient neuropathy,22 warranting assessment of thiamine status in all alcoholics with neuropathy. Pain is a prominent complaint in alcoholic neuropathy but a less common complaint in thiamine-deficient neuropathy.22 Cobalamin (vitamin B12)-deficient neuropathy is more likely to occur suddenly and to involve the hands or hands and feet simultaneously, and is less likely to be painful.25 Myelopathy is frequent in cobalamin deficiency, sometimes serving as a clue to diagnosis. It may be difficult to determine whether sensory symptoms are caused by myelopathy or neuropathy. Electro-diagnostic testing, somatosensory evoked potentials, and radiological investigation may be helpful.
Uremic neuropathy may occur in patients with chronic renal failure on dialysis.26,27 Today it is less common by virtue of the widespread implementation of dialysis and renal transplantation. Generally reserve this diagnosis for patients with end-stage renal failure with a creatinine clearance of less than 10 mL/min. Other systemic disorders associated with renal failure must be considered; these include diabetes mellitus, amyloidosis, and vasculitis. Also consider drug-induced neuropathy in this population.
Pharmaceutical agents, industrial and environmental agents, and substances of abuse may cause neuropathy, most commonly in the form of a length-dependent axonal neuropathy. Offending chemotherapeutic agents include colchicine, pyridoxine, and amiodarone. However, toxic polyneuropathies probably represent a rather small proportion of cases.
The list of potentially offending substances is long and includes many medications and agents that the general population is commonly exposed to in low doses. Consider the inherent risk of neuropathy of the particular agent in question. To establish a causal link, verify exposure, determine that symptoms are temporally related to the toxin, and rule out other causes of neuropathy. Furthermore, some clinical improvement or at least stabilization should occur following removal of the offending agent, though this may take months to years.28
Medication-induced neuropathy is more common than industrial and environmental neuropathies. The neuropathy of heavy metal intoxication is rare, and is usually accompanied by a combination of gastrointestinal, hematologic, and central nervous system problems.
HIV neuropathy is predominantly sensory and length-dependent. It occurs in about one third of infected patients. This is an exception to the tenet that infectious neuropathies typically present in a non– length-dependent pattern. However, in almost all circumstances, the diagnosis of HIV is well established and so it usually doesn’t present a diagnostic challenge. It is not our routine practice to check for HIV in those presenting with a new-onset distal, symmetric neuropathy, though we will in the proper clinical setting. Whether HIV neuropathy should be included in the differential diagnosis depends on the incidence of HIV in your patient population and the patient’s specifics.6 Rarely, Guillain-Barré syndrome and CIDP can be the presentation of a recent HIV infection.
For inherited neuropathies, there are an overwhelming number of commercially available panels for DNA testing.3,29-31 A detailed discussion of inherited neuropathies is beyond the scope of this review, and many excellent reviews have been written on the subject. We will, however, make a few general comments.
First, Charcot-Marie-Tooth (CMT) disease is the most common inherited neuromuscular disorder, and it is encountered in primary care.
Second, foot deformities (eg, high arches, curled toes) commonly accompany an inherited polyneuropathy and are valuable clues.
Third, the inheritence pattern should be sought through a detailed family history and examination of other family members (including query and examination for foot deformities). Inherited neuropathies can be autosomal dominant, autosomal recessive, or X-linked, based largely on what gene harbors the mutation. Furthermore, spontaneous “de novo” mutations are not uncommon, being responsible for probably 25% of cases of CMT type 1.
Fourth, inherited neuropathies should be characterized just like acquired neuropathies, with particular attention paid to whether the neuropathy is demyelinating (eg, CMT type 1) or axonal (CMT type 2).
With respect to DNA testing of blood, focused genetic testing is almost always possible once you further characterize the inherited neuropathy and also take into account prevalence estimates of the various inherited neuropathies (eg, CMT type 1A caused by a duplication of the PMP-22 gene is responsible for the majority of cases on CMT), obviating the need for expensive, comprehensive genetic testing.
Other presentations
The evaluation of neuropathies that are not distal and symmetric can be complex and in many cases may warrant referral to a neurologist for further evaluation. With such presentations, diagnostic considerations include chest imaging and antineuronal (paraneoplastic) antibody serology for smokers with subacute neuropathies, cerebrospinal fluid analysis for an acquired demyelinating neuropathy, infectious neuropathy or a polyradiculopathy (eg, Lyme disease),3,7 and sensory nerve biopsy (eg, sural nerve) when vasculitis, amyloidosis, or sarcoidosis is suspected.
CORRESPONDENCE
Ted M. Burns, MD, University of Virginia Health System Department of Neurology, Box 800394, Charlottesville, VA 22908. E-mail: [email protected]
1. Hughes RAC. Peripheral neuropathy. BMJ 2002;324:466-469.
2. England JD, Asbury AK. Peripheral neuropathy. Lancet 2004;363:2151-2161.
3. Pourmand R. Evaluating patients with suspected peripheral neuropathy: Do the right thing, not everything. Muscle Nerve 2002;26:288-290.
4. Dyck PJ, Dyck PJB, Grant IA, Fealey RD. Ten steps in characterizing and diagnosing patients with peripheral neuropathy. Neurology 1996;47:10-17.
5. Barohn RJ. Approach to peripheral neuropathy and neuronopathy. Seminars Neurol 1998;18:7-18.
6. Rosenberg NR, Portegies P, de Visser M, Vermeulen M. Diagnostic investigation of patients with chronic polyneuropathy: evaluation of a clinical guideline. J Neurol Neurosurg Psych 2001;71:205-209.
7. Bromberg MB, Smith AG. Toward an efficient method to evaluate peripheral neuropathies. J Clin Neuromusc Dis 2002;3:172-182.
8. Hughes RAC, Umapathi T, Gray IA, et al. A controlled investigation of the cause of chronic idiopathic axonal polyneuropathy. Brain 2004;127:1723-1730.
9. Lacomis D. Small-fiber neuropathy. Muscle Nerve 2002;26:173-188.
10. Low PA, Vernino S, Suarez G. Autonomic dysfunction in peripheral nerve disease. Muscle Nerve 2003;27:646-661.
11. Burns TM, Taly A, O’Brien PC, Dyck PJ. Clinical versus quantitative vibration assessment: improving clinical performance. J Periph Nerv System 2002;7:112-117.
12. England JD, Gronseth GS, Franklin G, et al. Distal symmetric polyneuropathy: A definition for clinical research: Report of the American Academy of Neurology, the American Association of Electrodiagnostic Medicine, and the American Academy of Physical Medicine and Rehabilitation. Neurology 2005;64:199-207.
13. Thaisetthawatkul P, Collazo-Clavell ML, Sarr MG, Norell JE, Dyck PJ. A controlled study of peripheral neuropathy after bariatric surgery. Neurology 2004;63:1462-1470.
14. Pirart J. Diabetes mellitus and its degenerative complications: a prospective study of 4,400 patients observed between 1947 and 1973. Diabetes Care 1978;1:168-188.
15. Singleton JR, Smith AG, Russell JW, Feldman EL. Microvascular complications of impaired glucose tolerance. Diabetes 2003;52:2867-2873.
16. Sumner CJ, Sheth S, Griffin JW, Cornblath DR, Polydefkis M. The spectrum of neuropathy in diabetes and impaired glucose tolerance. Neurology 2003;60:108-111.
17. Novella SP, Inzucchi SE, Goldstein JM. The frequency of undiagnosed diabetes and impaired glucose tolerance in patients with idiopathic sensory neuropathy. Muscle Nerve 2001;24:1229-1231.
18. Singleton JR, Smith AG, Bromberg MB. Painful sensory polyneuropathy associated with impaired glucose tolerance. Muscle Nerve 2001;24:1225-1228.
19. Polydefkis M, Griffin JW, McArthur J. New insights into diabetic polyneuropathy. JAMA 2003;290:1371-1376.
20. Monforte R, Estruch R, Valls-Sole J, Nicolas J, Villalta J, Urbano-Marquez A. Autonomic and peripheral neuropathies in patients with chronic alcoholism. A dose-related toxic effect of alcohol. Arch Neurol 1995;52:45-51.
21. Koike H, Mori K, Misu K, et al. Painful alcoholic polyneuropathy with predominant small-fiber loss and normal thiamine status. Neurol 2001;56:1727-1732.
22. Koike H, LiJima M, Sugiura M, et al. Alcoholic neuropathy is clinicopathologically distinct from thiamine-deficiency neuropathy. Ann Neurol 2003;54:19-29.
23. Coulehan JL, Zettler-Segal M, Block M, McClelland M, Schulberg HC. Recognition of alcoholism and substance abuse in primary care patients. Arch Intern Med 1987;147:349-352.
24. Brienza RS, Stein MD. Alcohol use disorders in primary care. Do gender-specific differences exist? J Gen Intern Med 2002;17:387-397.
25. Saperstein DS, Wolfe GI, Gronseth GS, et al. Challenges in the identification of cobalamin-deficiency polyneuropathy. Arch Neurol 2003;60:1296-1301.
26. Laaksonen S, Metsärinne K, Voipio-Pulkki LM, Falck B. Neurophysiologic parameters and symptoms in chronic renal failure. Muscle Nerve 2002;25:884-890.
27. Said G, Boudier L, Selva J, Zingraff J, Drueke T. Different patterns of uremic polyneuropathy: clinicopathologic study. Neurology 1983;33:567-574.
28. Hill AB. The environment and disease: association or causation? Proc Roy Soc Med 1965;58:295-300.
29. Donaghy M. Genes for peripheral neuropathy and their relevance to clinical practice. J Neurol Neurosurg Psychiatry 2004;75:1371-1372.
30. Lewis RA, Sumner AJ, Shy ME. Electrophysiological features of inherited demyelinating neuropathies: a reappraisal in the era of molecular diagnosis. Muscle Nerve 2000;23:1472-1487.
31. Pareyson D. Charcot-Marie-Tooth disease and related neuropathies: molecular basis and distinction and diagnosis. Muscle Nerve 1999;22:1498-1509.
32. Scherer SS. Finding the causes of inherited neuropathies. Arch Neurol 2006;63:812-816.
- Pain described by patients as electric shocks, burning, freezing, tightness, or throbbing suggests toxic, metabolic, or ischemic causes of neuropathy (C).
- When motor and sensory symptoms appear together, rank them in order of symptom predominance. Motor symptom supremacy may indicate an immune-related disorder (C).
- When measuring sensory thresholds, keep in mind that they normally increase with the patient’s age and height. Vibration sensation in the toes of elderly persons is often said to be decreased, when in fact it is only an age-related change (C).
Polyneuropathy has an estimated prevalence of about 2% in the general population.1,2 Despite being common, polyneuropathy remains a diagnostic challenge for most clinicians for many reasons, including the large number of potential causes and the fact that a specific cause often cannot be identified even after appropriate testing. These factors can contribute to uncertainty about the direction and level of aggressiveness of the evaluation. The result is often a “one size fits all” strategy—from an unnecessarily expensive “shotgun” approach to a “defeatist” attitude that too quickly deems a neuropathy as idiopathic.
A number of experts have developed algorithms for the evaluation of neuropathy.1,3-8 We have incorporated and modified many of these suggestions to develop a simple, user-friendly approach; one that characterizes the neuropathy using “what?”, “where?”, “when?” and “what setting?” parameters (FIGURE).
The focus of this article is on the polyneuropathy that presents with widespread sensory or sensorimotor symptoms and signs. We will not discuss the evaluation of other peripheral neuropathic processes—eg, mononeuropathies, plexopathies, or motor neuronopathies such as amyotrophic lateral sclerosis. We emphasize the fundamental step of determining whether the polyneuropathy is a distal, symmetrical, sensory or sensorimotor polyneuropathy, in which case metabolic/toxic, inherited and idiopathic causes are more probable. In contrast, alternative presentations suggest immune-mediated and infectious causes.
What: Sensory, motor, or autonomic?
The first step is to assign the patient’s complaints and your examination findings to specific nerve fiber types of the peripheral nervous system: sensory, motor, or autonomic.5
FIGURE
Characterizing your patient’s neuropathy
Sensory findings help narrow your search
Once you have ruled out a nonneuropathic process (eg, arthritis) as the cause of sensory symptoms and signs, turn your attention to distinguishing between peripheral or central nervous system dysfunction. When the pathology resides in the central nervous system (eg, multiple sclerosis) accompanying symptoms and signs usually assist in localization. If a patient acknowledges clinical features suggesting past or present involvement of cerebellar, urinary, or visual (eg, optic neuritis) systems, for example, magnetic resonance imaging rather than electrodiagnostic testing may be warranted.
In a patient with peripheral nervous system dysfunction, sensory abnormalities help exclude neuromuscular diseases not associated with sensory dysfunction, such as myopathies, neuromuscular transmission disorders, or disease of the motor neuron.
Positive neuropathic sensory symptoms suggest acquired polyneuropathies. Patients may describe “prickling,” “tingling,” “swelling,” “asleep-like numbness,” or a sensation of “bunched-up socks.” Patients with acquired polyneuropathies usually complain of positive neuropathic sensory symptoms (PNSS), whereas patients with inherited polyneuropathies only rarely do (FIGURE).
Pain suggests toxic, metabolic, or ischemic causes. Patients may describe “electric shocks,” “burning,” “freezing,” “tightness,” or “throbbing.” They may complain of discomfort or pain to sensory stimuli that under normal circumstances would not be painful (allodynia)—eg, discomfort evoked by a bed sheet resting on the feet. They may also describe exaggerated pain to stimuli that would normally evoke low levels of discomfort or pain (hyperalgesia).
A painful neuropathy narrows the differential diagnosis to diseases that affect smaller nerve fibers, which generally convey pain and temperature input. Causes may be toxic, metabolic, ischemic, or idiopathic. For example, a pure “small-fiber” polyneuropathy commonly occurs in patients aged >60 years and typically causes painful feet. It is often idiopathic, but diabetes or impaired glucose tolerance and alcohol toxicity should be explored.9 Patients with painful neuropathy usually also exhibit reduced or absent sensation of pinprick and temperature in the distribution of their sensory complaints.
Negative neuropathic sensory symptoms. In addition to positive neuropathic symptoms, patients may complain of “negative” symptoms such as loss of sensation and imbalance. Examination usually reveals abnormalities of proprioception and sensation to vibration with reduced or absent deep tendon reflexes and ataxia. These features can occur in acquired or inherited causes of neuropathy.
Important sensory tests. Test sensation on the toes and fingertips, and more proximally (eg, ankle and shin) if any abnormality is found at these distal sites. Test vibration with a 128 Hz tuning fork, pinprick with disposable safety pin, and light touch with a cotton swab.
You may test temperature sensation by warming or cooling the handle or prong of the tuning fork and applying it to the patient’s skin.
Joint position testing is performed by asking the patient to avert his eyes, then moving the distal phalanx of a finger or toe up or down by small increments and asking the patient to tell you the direction of movement. Assess a patient’s casual and tandem gait for unsteadiness or ataxia.
Motor symptoms: Weigh them against sensory findings
Most patients with neuropathy have some degree of weakness, but it is usually overshadowed by sensory complaints. Distal lower extremity weakness may manifest as “foot drop,” which, if it affects ankle dorsiflexion, may cause a “slapping” or noisy step due to the forefoot hitting the ground with abnormal force.
Distal upper extremity weakness may cause trouble with fine motor skills of the hands.
Proximal weakness may present as difficulty in rising from a chair or lifting objects above the shoulders.
There may be muscle atrophy or fasciculations.
Motor symptoms are seldom the sole complaint. When motor and sensory symptoms are combined, it is helpful to rank them in order of symptom predominance—ie, motor greater than sensory, or vice versa. For instance, many immune-mediated disorders, such as Guillain-Barré syndrome and chronic inflammatory demyelinating polyradiculoneuropathy (CIDP), produce chiefly motor abnormalities and fewer sensory symptoms. Sensory complaints predominate in many other polyneuropathies, especially the “length-dependent” polyneuropathies (ie, those affecting the longer nerves initially) caused by metabolic or toxic disorders.
Autonomic symptom evaluation
The number of processes that affect both autonomic and somatic nerves are relatively few (TABLE 1).5,7,10 It is particularly important to assess symptoms suggesting involvement of the autonomic nervous system.
Autonomic symptoms include lightheadedness, syncope, diarrhea, constipation, postprandial bloating, early satiety, urinary complaints, erectile dysfunction, abnormal or absent sweating, and dry mouth and eyes. Many of these complaints are common in the general population, so their relevance should be based on severity and temporal evolution, as well as comorbidities and medication use.
When complaints do not clearly implicate pathology in the autonomic nervous system, autonomic testing may be helpful, targeted for the domain that may be impaired. For example, bedside orthostatics or tilt-table testing are used for pre-syncopal symptoms, but gastric emptying testing can assist the evaluation of complaints of early satiety or postprandial bloating.
TABLE 1
Relatively common acquired polyneuropathies with autonomic nervous system involvement
| Diabetes mellitus |
| Amyloidosis |
| Guillain-Barré syndrome |
| Paraneoplastic neuropathy (usually small cell lung cancer) |
| Sjögren’s syndrome–associated neuropathy |
Where: The distribution of nerve involvement
“Where” refers to distribution of nerve involvement 1) globally throughout the body and 2) locally along the nerve(s). During the history taking and examination, determine the nature of general distribution (eg, symmetric or asymmetric) and where along the length of the nerve(s) (proximal and/or distal) the dysfunction exists.
Polyneuropathy most commonly presents in a “length-dependent” distribution, with clinical features appearing initially most distally and symmetrically (ie, in the feet). Asymmetry and involvement of the proximal parts of a nerve are “red flags” for an uncommon cause that may require referral to a neurologist (FIGURE).
Comparative vs absolute measurements. At bedside, 2 approaches are used to assess the distribution of nerve involvement: comparative and absolute. The comparative approach searches for a relative difference in sensory thresholds or weakness between sites. It can assess side-to-side or one nerve (or root or region) territory to another. It is useful for establishing sensory or motor impairment in a radicular, plexus, or single nerve distribution.
Testing for an absolute reduction in sensation (eg, decreased vibration in the toes) can be more challenging because it requires experience in judging what is normal and abnormal according to expectations for a particular site and modality. Take into account that sensory thresholds are normally increased with the patient’s age and height.11 For example, we commonly encounter elderly patients whose vibration sensation in the toes is said to be decreased, when in fact the reduced sensory threshold is only an age-related change.
Most assessments of sensory thresholds use the absolute approach because most generalized polyneuropathies are “length-dependent.”
Perform motor testing for appendicular (upper and lower extremities) and axial (neck and trunk) muscles, assessing particularly for weakness, atrophy, and fasciculations.
The typical polyneuropathy caused by metabolic, toxic, inherited, or unknown causes is distal and symmetric.12 Neuropathies caused by other mechanisms, such as immune-mediated or infectious, are rarely length-dependent. Examples include motor neuronopathies (eg, amyotrophic lateral sclerosis), sensory neuronopathies (eg, paraneoplastic), polyradiculoneuropathies (Guillain-Barré syndrome, CIDP), and mononeuritis multiplex (caused by vasculitis).
When: The time course of signs and symptoms
Knowing whether the onset of neuropathy was definite and abrupt or was gradual is the most helpful temporal clue to possible underlying causes. The time course (ie, tempo) following onset is also important.
An acute/subacute onset with a definite date often suggests an immune-mediated or an infectious process (FIGURE). With respect to immune-mediated neuropathies, consider primarily autoimmune conditions (eg, Guillain-Barré syndrome, vasculitic neuropathy) and also paraneoplastic autoimmune syndromes (eg, subacute sensory neuropathy). In the latter case, a cancer presents to the immune system an epitope that is similarly found in the nervous system, prompting an autoimmune attack of the nervous system. Both autoimmune and infectious processes almost always have a rapid start on a definite date.
With an insidious onset, the patient won’t recollect a definite date on which the neuropathy began. The underlying mechanism usually is an inherited, metabolic, or toxic process—or idiopathic, if a cause cannot be identified.
The disease course sheds additional light on the causative mechanism. Onset and subsequent progression often correlate in a predictable manner, owing in part to the underlying mechanism. For example, an acute onset neuropathy often is followed by rapid disease progression, especially when caused by an autoimmune process (Guillain-Barré and vasculitic neuropathy). On the other hand, a neuropathy of insidious onset usually follows a slow or even static course. But there are exceptions that may make the diagnosis challenging and illustrate the need for clinical follow-up.
What setting
The patient’s medical history, medications, social and family history, and a review of systems can uncover known risk factors for neuropathic processes.
Common causes of acquired polyneuropathies are diabetes mellitus, chronic renal disease, and alcohol dependence. If a patient with distal, symmetric sensory complaints also has any of these conditions, a causal relationship should be considered. Another example is the patient with a history of bariatric surgery, which could lead to neuropathy as a result of malnutrition, particularly vitamin B1 and B12 deficiencies.13
The clinical setting may indicate a need for further evaluation by a neurologist. For example, a family history of inherited neuropathy in a patient with high arches and curled “hammer” toes would strongly suggest Charcot-Marie-Tooth (CMT) disease, also known as hereditary motor and sensory neuropathy. A patient with a monoclonal gammopathy may have a paraproteinemic neuropathy that warrants further evaluation by a neuromuscular specialist. Although more rare, a paraneoplastic cause would warrant consideration in a smoker, especially if the neuropathy was subacute. In many cases, neuropathic symptoms are the first clue of a new medical condition (eg, impaired glucose tolerance).
Electrodiagnostic testing: What it can and can’t tell you
Most polyneuropathies warrant additional electrodiagnostic evaluation in an electromyography (EMG) laboratory. Electro-diagnostic testing comprises 2 procedures: nerve conduction studies and needle electrode examination.
Preparing your patient. When ordering this study, be sure to discuss it thoroughly with the patient. The entire study typically takes an hour or longer. And it can be painful, though in our experience nearly every patient tolerates the procedure. Most important for the patient to understand is that information gleaned from electrodiagnostic testing may be essential to the diagnosis, as explained below.
Many benefits of the study. First, electrodiagnostic testing can confirm a peripheral neuropathic basis for a patient’s complaints.
Second, electrodiagnostic testing helps characterize a neuropathy as primarily demyelinating, primarily axonal, or mixed demyelinating and axonal. An example of this benefit is that a primary demyelinating characterization greatly narrows the list of possible causes (eg, Guillain-Barré syndrome, chronic inflammatory demyelinating polyradiculoneuropathy, Charcot-Marie-Tooth disease type 1).
Third, electrodiagnostic testing assists in characterizing the neuropathic process as sensory, motor or sensorimotor.
Fourth, electrodiagnostic testing helps localize the neuropathic process (the “where”).
Fifth, electrodiagnostic testing can gauge the severity of the neuropathic process.
Limitations of the study. When the study returns normal results, keep in mind it has limited sensitivity. For example, nerve conduction studies are only able to assess the function of larger myelinated nerve fibers; a neuropathic process solely in small fibers will not be evident with this test. Likewise, the needle electrode examination is unable to assess small nerve fiber status. We include this caveat in our electrodiagnostic testing reports of patients who have symptoms suggestive of pure small fiber polyneuropathy.
When might blood studies be useful?
Laboratory testing of blood is often of great value, but only after a particular polyneuropathy has been characterized and placed into one or more potential etiologic subgroups.
For example, laboratory testing for a distal, symmetric sensory polyneuropathy (TABLE 2) should be much different than testing for another presentation (eg, mononeuritis multiplex). TABLE 3 details some of the laboratory tests we recommend for the more common polyneuropathies that don’t typically present in a distal, symmetric sensory fashion or that are accompanied by other distinctive features. In our experience, clinicians too frequently order unnecessary and expensive tests for disorders only rarely associated with neuropathy; the rare causes of neuropathy are intentionally not the subject of this review.
TABLE 2
Common blood tests for the evaluation of a distal, symmetrical neuropathy1,3,5,6,8
| TEST | POTENTIAL CONFIRMATORY VALUE OF TESTS |
|---|---|
| Fasting glucose or 2-hour oral glucose tolerance test | Diabetes mellitus and possibly impaired glucose tolerance (“pre-diabetes”) cause neuropathy |
| Serum protein electrophoresis | Paraproteinemias, including monoclonal gammopathy of undetermined significance, Waldenstrom’s macroglobulinemia, and osteosclerotic myeloma, are often associated with a demyelinating neuropathy. Amyloidosis and mixed cryoglobulinemiacan also cause an axonal neuropathy |
| Chemistry profile | Uremic neuropathy |
| Hepatitis C titer | Hepatitis C is associated with neuropathy, particularly when associated with mixed cryoglobulinemia. This neuropathy usually presents asymmetrically and often as mononeuritis multiplex but sometimes as a distal, symmetrical neuropathy |
| Serum B12 level | Vitamin B12 deficiency may cause neuropathy, often in association with symptoms and signs of myelopathy |
TABLE 3
Other diagnostic tests for acquired neuropathies in specific clinical situations2,4,5,7
| SUSPECTED PATHOLOGIC PROCESSES AND PERTINENT TESTS | POTENTIAL CONFIRMATORY VALUE OF TESTS |
|---|---|
| Metabolic/toxic | |
| Complete blood count | Elevated MCV may suggest alcoholism, vitamin B12 deficiency |
| Thiamine level | Thiamine deficiency (eg, alcoholics or following bariatric surgery) |
| Urine heavy metals | Heavy metal intoxication (rare; usually systemic symptoms too) |
| Thyroid function tests | Hypothyroid neuropathy (rare) |
| Inflammatory | |
| Complete blood count | If systemic vasculitic neuropathy suspected (eg, patient presents with painful “mononeuritis multiplex”) systemic vasculitic neuropathy |
| Markers of vasculitis or systemic inflammation (ESR, ANCA, RF, ANA, ENA, cryoglobulins, etc) | Cryoglobulinemic neuropathy is associated with hepatitis C |
| Cerebrospinal fluid (CSF) | CSF protein elevation in Guillain-Barré syndrome and chronic inflammatory demyelinating polyneuropathy |
| Neoplastic/paraneoplastic | |
| Paraneoplastic serology (technique and scope of testing varies between different labs) | Neuropathy associated with cancer, especially subacute and severe neuropathic processes in smokers (eg, subacute sensory neuronopathy associated with small cell lung cancer) |
| Chest X-ray and other imaging for cancer | Small cell lung cancer or other malignancy |
| Cerebrospinal cytology | Carcinomatous or lymphomatous polyradiculopathy. |
| Infectious | |
| Cerebrospinal fluid | CSF pleocytosis common in infectious polyradiculoneuropathies (Lyme, sarcoid, HIV) |
| Lyme titers (serum, cerebrospinal fluid) | Lyme neuroborreliosis |
| HIV testing | HIV-associated neuropathy |
| Hepatitis C (serum cryoglobulin testing) | Hepatitis C—mixed cryoglobulinemia |
Common causes of distal, symmetric polyneuropathies
Distal, symmetric polyneuropathies are usually due to metabolic/toxic, inherited, or idiopathic causes (FIGURE, TABLE 2). As such, it is often unnecessary to obtain diagnostic tests searching for active infectious, autoimmune or paraneoplastic etiologies.3 In electrodiagnostic terms, these neuropathies are almost always primarily axonal rather than demyelinating, usually involving both large and small nerve fibers.
Diabetes is the most common cause of neuropathy in developed Western countries, occurring in more than 50% of patients who require insulin.14 Diabetic neuropathy typically presents as a distal, symmetric neuropathy syndrome, though diabetic lumbosacral radiculoplexus neuropathy (diabetic amyotrophy) and other presentations may be seen less commonly.
Recent evidence suggests that neuropathy—particularly a sensory and often painful, distal, symmetric “small-fiber” neuropathy—sometimes occurs in patients with impaired fasting glucose (IFG) or impaired glucose tolerance (IGT).15-19 The 2-hour oral glucose tolerance test has been deemed more sensitive for the early diabetic state of IGT/IFG associated with neuropathy.19 It remains to be seen whether this early diabetic state neuropathy will turn out to represent a large percentage of cases of what were previously thought of as idiopathic small-fiber neuropathy.
Alcoholism is another common cause of a distal, symmetric neuropathy that is predominantly sensory with a painful, burning sensation.20-22 Alcohol abuse and dependence occurs in 10% to 20% of the primary care population.23,24 The prevalence of neuropathy in alcoholics is uncertain, though 1 study of hospitalized patients admitting to daily alcohol intake of over 100 g for men or 80 g for women (10 oz of beer, 1 oz liquor and 3–4 oz wine each have 10 g of alcohol) for 2 years or more (mean of 238±120 g for a period of 22.7±10.2 years) demonstrated that one third of patients had electrophysiologic evidence of peripheral neuropathy and one fourth of autonomic neuropathy.20 Most subjects in this cohort did not show any clinical or laboratory evidence of malnutrition.
Frequently alcoholic neuropathy coexists with thiamine-deficient neuropathy,22 warranting assessment of thiamine status in all alcoholics with neuropathy. Pain is a prominent complaint in alcoholic neuropathy but a less common complaint in thiamine-deficient neuropathy.22 Cobalamin (vitamin B12)-deficient neuropathy is more likely to occur suddenly and to involve the hands or hands and feet simultaneously, and is less likely to be painful.25 Myelopathy is frequent in cobalamin deficiency, sometimes serving as a clue to diagnosis. It may be difficult to determine whether sensory symptoms are caused by myelopathy or neuropathy. Electro-diagnostic testing, somatosensory evoked potentials, and radiological investigation may be helpful.
Uremic neuropathy may occur in patients with chronic renal failure on dialysis.26,27 Today it is less common by virtue of the widespread implementation of dialysis and renal transplantation. Generally reserve this diagnosis for patients with end-stage renal failure with a creatinine clearance of less than 10 mL/min. Other systemic disorders associated with renal failure must be considered; these include diabetes mellitus, amyloidosis, and vasculitis. Also consider drug-induced neuropathy in this population.
Pharmaceutical agents, industrial and environmental agents, and substances of abuse may cause neuropathy, most commonly in the form of a length-dependent axonal neuropathy. Offending chemotherapeutic agents include colchicine, pyridoxine, and amiodarone. However, toxic polyneuropathies probably represent a rather small proportion of cases.
The list of potentially offending substances is long and includes many medications and agents that the general population is commonly exposed to in low doses. Consider the inherent risk of neuropathy of the particular agent in question. To establish a causal link, verify exposure, determine that symptoms are temporally related to the toxin, and rule out other causes of neuropathy. Furthermore, some clinical improvement or at least stabilization should occur following removal of the offending agent, though this may take months to years.28
Medication-induced neuropathy is more common than industrial and environmental neuropathies. The neuropathy of heavy metal intoxication is rare, and is usually accompanied by a combination of gastrointestinal, hematologic, and central nervous system problems.
HIV neuropathy is predominantly sensory and length-dependent. It occurs in about one third of infected patients. This is an exception to the tenet that infectious neuropathies typically present in a non– length-dependent pattern. However, in almost all circumstances, the diagnosis of HIV is well established and so it usually doesn’t present a diagnostic challenge. It is not our routine practice to check for HIV in those presenting with a new-onset distal, symmetric neuropathy, though we will in the proper clinical setting. Whether HIV neuropathy should be included in the differential diagnosis depends on the incidence of HIV in your patient population and the patient’s specifics.6 Rarely, Guillain-Barré syndrome and CIDP can be the presentation of a recent HIV infection.
For inherited neuropathies, there are an overwhelming number of commercially available panels for DNA testing.3,29-31 A detailed discussion of inherited neuropathies is beyond the scope of this review, and many excellent reviews have been written on the subject. We will, however, make a few general comments.
First, Charcot-Marie-Tooth (CMT) disease is the most common inherited neuromuscular disorder, and it is encountered in primary care.
Second, foot deformities (eg, high arches, curled toes) commonly accompany an inherited polyneuropathy and are valuable clues.
Third, the inheritence pattern should be sought through a detailed family history and examination of other family members (including query and examination for foot deformities). Inherited neuropathies can be autosomal dominant, autosomal recessive, or X-linked, based largely on what gene harbors the mutation. Furthermore, spontaneous “de novo” mutations are not uncommon, being responsible for probably 25% of cases of CMT type 1.
Fourth, inherited neuropathies should be characterized just like acquired neuropathies, with particular attention paid to whether the neuropathy is demyelinating (eg, CMT type 1) or axonal (CMT type 2).
With respect to DNA testing of blood, focused genetic testing is almost always possible once you further characterize the inherited neuropathy and also take into account prevalence estimates of the various inherited neuropathies (eg, CMT type 1A caused by a duplication of the PMP-22 gene is responsible for the majority of cases on CMT), obviating the need for expensive, comprehensive genetic testing.
Other presentations
The evaluation of neuropathies that are not distal and symmetric can be complex and in many cases may warrant referral to a neurologist for further evaluation. With such presentations, diagnostic considerations include chest imaging and antineuronal (paraneoplastic) antibody serology for smokers with subacute neuropathies, cerebrospinal fluid analysis for an acquired demyelinating neuropathy, infectious neuropathy or a polyradiculopathy (eg, Lyme disease),3,7 and sensory nerve biopsy (eg, sural nerve) when vasculitis, amyloidosis, or sarcoidosis is suspected.
CORRESPONDENCE
Ted M. Burns, MD, University of Virginia Health System Department of Neurology, Box 800394, Charlottesville, VA 22908. E-mail: [email protected]
1. Hughes RAC. Peripheral neuropathy. BMJ 2002;324:466-469.
2. England JD, Asbury AK. Peripheral neuropathy. Lancet 2004;363:2151-2161.
3. Pourmand R. Evaluating patients with suspected peripheral neuropathy: Do the right thing, not everything. Muscle Nerve 2002;26:288-290.
4. Dyck PJ, Dyck PJB, Grant IA, Fealey RD. Ten steps in characterizing and diagnosing patients with peripheral neuropathy. Neurology 1996;47:10-17.
5. Barohn RJ. Approach to peripheral neuropathy and neuronopathy. Seminars Neurol 1998;18:7-18.
6. Rosenberg NR, Portegies P, de Visser M, Vermeulen M. Diagnostic investigation of patients with chronic polyneuropathy: evaluation of a clinical guideline. J Neurol Neurosurg Psych 2001;71:205-209.
7. Bromberg MB, Smith AG. Toward an efficient method to evaluate peripheral neuropathies. J Clin Neuromusc Dis 2002;3:172-182.
8. Hughes RAC, Umapathi T, Gray IA, et al. A controlled investigation of the cause of chronic idiopathic axonal polyneuropathy. Brain 2004;127:1723-1730.
9. Lacomis D. Small-fiber neuropathy. Muscle Nerve 2002;26:173-188.
10. Low PA, Vernino S, Suarez G. Autonomic dysfunction in peripheral nerve disease. Muscle Nerve 2003;27:646-661.
11. Burns TM, Taly A, O’Brien PC, Dyck PJ. Clinical versus quantitative vibration assessment: improving clinical performance. J Periph Nerv System 2002;7:112-117.
12. England JD, Gronseth GS, Franklin G, et al. Distal symmetric polyneuropathy: A definition for clinical research: Report of the American Academy of Neurology, the American Association of Electrodiagnostic Medicine, and the American Academy of Physical Medicine and Rehabilitation. Neurology 2005;64:199-207.
13. Thaisetthawatkul P, Collazo-Clavell ML, Sarr MG, Norell JE, Dyck PJ. A controlled study of peripheral neuropathy after bariatric surgery. Neurology 2004;63:1462-1470.
14. Pirart J. Diabetes mellitus and its degenerative complications: a prospective study of 4,400 patients observed between 1947 and 1973. Diabetes Care 1978;1:168-188.
15. Singleton JR, Smith AG, Russell JW, Feldman EL. Microvascular complications of impaired glucose tolerance. Diabetes 2003;52:2867-2873.
16. Sumner CJ, Sheth S, Griffin JW, Cornblath DR, Polydefkis M. The spectrum of neuropathy in diabetes and impaired glucose tolerance. Neurology 2003;60:108-111.
17. Novella SP, Inzucchi SE, Goldstein JM. The frequency of undiagnosed diabetes and impaired glucose tolerance in patients with idiopathic sensory neuropathy. Muscle Nerve 2001;24:1229-1231.
18. Singleton JR, Smith AG, Bromberg MB. Painful sensory polyneuropathy associated with impaired glucose tolerance. Muscle Nerve 2001;24:1225-1228.
19. Polydefkis M, Griffin JW, McArthur J. New insights into diabetic polyneuropathy. JAMA 2003;290:1371-1376.
20. Monforte R, Estruch R, Valls-Sole J, Nicolas J, Villalta J, Urbano-Marquez A. Autonomic and peripheral neuropathies in patients with chronic alcoholism. A dose-related toxic effect of alcohol. Arch Neurol 1995;52:45-51.
21. Koike H, Mori K, Misu K, et al. Painful alcoholic polyneuropathy with predominant small-fiber loss and normal thiamine status. Neurol 2001;56:1727-1732.
22. Koike H, LiJima M, Sugiura M, et al. Alcoholic neuropathy is clinicopathologically distinct from thiamine-deficiency neuropathy. Ann Neurol 2003;54:19-29.
23. Coulehan JL, Zettler-Segal M, Block M, McClelland M, Schulberg HC. Recognition of alcoholism and substance abuse in primary care patients. Arch Intern Med 1987;147:349-352.
24. Brienza RS, Stein MD. Alcohol use disorders in primary care. Do gender-specific differences exist? J Gen Intern Med 2002;17:387-397.
25. Saperstein DS, Wolfe GI, Gronseth GS, et al. Challenges in the identification of cobalamin-deficiency polyneuropathy. Arch Neurol 2003;60:1296-1301.
26. Laaksonen S, Metsärinne K, Voipio-Pulkki LM, Falck B. Neurophysiologic parameters and symptoms in chronic renal failure. Muscle Nerve 2002;25:884-890.
27. Said G, Boudier L, Selva J, Zingraff J, Drueke T. Different patterns of uremic polyneuropathy: clinicopathologic study. Neurology 1983;33:567-574.
28. Hill AB. The environment and disease: association or causation? Proc Roy Soc Med 1965;58:295-300.
29. Donaghy M. Genes for peripheral neuropathy and their relevance to clinical practice. J Neurol Neurosurg Psychiatry 2004;75:1371-1372.
30. Lewis RA, Sumner AJ, Shy ME. Electrophysiological features of inherited demyelinating neuropathies: a reappraisal in the era of molecular diagnosis. Muscle Nerve 2000;23:1472-1487.
31. Pareyson D. Charcot-Marie-Tooth disease and related neuropathies: molecular basis and distinction and diagnosis. Muscle Nerve 1999;22:1498-1509.
32. Scherer SS. Finding the causes of inherited neuropathies. Arch Neurol 2006;63:812-816.
Psyllium: Keeping this boon for patients from becoming a bane for providers
• Don’t pour psyllium powder into medicine cups: spoon it or combine it with a liquid (C).
• Use respiratory protection, such as a chemical hood or HEPA filter mask (C).
A 39-year-old female nurse with a history of moderate to severe asthma was preparing medications for patients at an extended care facility. While pouring a bulk psyllium product from a large container into a medicine cup, a clumped mass of the powder fell from the container, striking the counter, and raising a cloud of psyllium dust. On inhaling this dust, the nurse became dyspneic. She did not respond to a beta-agonist and suffered respiratory arrest within 5 minutes. Emergency Medical Services and staff at the receiving hospital were unable to resuscitate her. Time of death was 1 hour and 25 minutes after exposure to psyllium dust. Autopsy showed severe bronchospasm with mucus plugging, but no signs of foreign material in the airways. Anaphylaxis secondary to inhaled psyllium was the final diagnosis.
Risk is significant and underestimated
Thousands of health care workers, particularly nurses, are at risk for hypersensitivity responses to psyllium, including rhinitis, conjunctivitis, cough, wheeze, asthma exacerbation, nausea, and anaphylaxis.1-7 Exposure in the workplace usually results from inhalation of dust during the preparation of the product for patient use.
One review found that up to 73% of residents in extended care facilities receive psyllium products.8 Hospitalized and home care patients also receive psyllium. Nurses especially are constantly exposed, and many are sensitized.
Despite the significant number of persons at risk, awareness and precaution are inadequate. Personal communication reveals that no health care providers—nurses, physicians, medical directors—were aware of the degree of risk. There was no routine use of protective devices or precautions when working with psyllium products in the facilities reviewed.
Quality and safety of psyllium products vary
Psyllium is a well-known powdered fiber supplement derived from the seed husk of Plantago ovata.9,10 The supplement contains varying ratios of endosperm, seed embryo, and psyllium (a translucent hydrophilic colloid material).
The endosperm and seed embryo proteins are allergenic; the colloid is not.11 Concentrations of each component vary according to the means of processing and the country of origin.9-11
Independent review indicates that the concentration of non-psyllium allergenic components is inversely proportional to the cost of the commercial product. The product dispensed for the patient in our case was particularly heterogenous.
Those at particular risk
Multiple instances of anaphylaxis have been linked to psyllium since the initial description in 1941.12 Ingestion of cereals containing psyllium is the most common cause of psyllium-related anaphylaxis.10 In a number of cases of anaphylaxis secondary to ingestion, the initial sensitization was related to psyllium dust inhalation.1 Twenty cases of anaphylaxis to a psyllium-rich cereal were reviewed shortly after its introduction. Fourteen of those affected were nurses. It was concluded that these nurses were sensitized from job-related inhalation exposure.13
IgE sensitization to psyllium has been shown in as many as 12% of health care personnel. History of asthma or atopy in a health care worker, as in the patient presented, seems to make IgE sensitization to psyllium more likely and raises the risk for fatal anaphylaxis.2
One review of workers with documented IgE sensitivity to psyllium showed that 42% complained of symptoms of conjunctivitis, rhinitis, or exacerbation of asthma.3 In another study, 29% of subjects were shown to have significant bronchial hyper-responsiveness to psyllium dust.2
One 1987 investigation of health care workers in an extended care facility concluded that the response to inhaled psyllium in these employees could range from mild to disabling.5 In a similar study, a nurse who had experienced only mild symptoms previously required intubation for severe bronchospasm after only 1 minute of exposure to psyllium dust.3 As happened with the patient in our case, she was symptomatic (moderate to severe asthma) and exposed, which led to fatal anaphylaxis.
Urge precautions to limit risk
Package inserts for the most popular—but not all—brands of psyllium describe precautions for dispensing psyllium, particularly for those with asthma.
1. Don’t pour the powder. Pouring the bulk form of the powder into medicine or beverage cups disperses significant amounts of dust. Yet this seems to be the most common manner of dispensing this medication. The standard set by the Occupational Safety and Health Administration (OSHA) limits the time-weighted average concentration for nuisance dust to 15 mg/m3. Dust concentration exhibited when psyllium powder is poured ranges from 4 to 28.5 mg/m3, with a mean concentration of 12.96 mg/m3. Given the frequency of inappropriate preparation, it is probable that OSHA recommended safe levels are frequently exceeded.3
Spoon the powder … To limit the amount of aerosolized dust, the powder should only be spooned into cups. While this recommendation is in the package insert, most health care workers are unaware of the guideline.
… or pour solvent over powder. Even better, our experiments showed there was less dust produced if the solvent (water or orange juice) was poured slowly over the powder than if the powder was put into solvent.
… or immerse powder in liquid. Alternatively, a device such as a scoop with a lid could be used that would submerge the powder into solution and then release it, creating virtually no dust.
2. Ventilate properly … Respiratory protection must be offered to the preparer and anyone else in the area. One maneuver to prevent exposure to psyllium dust would be to prepare the product in a chemical hood to ventilate dust away from the preparer.
… or use a mask. A simple mask, as is used to prevent the spread of communicable diseases, would offer some protection, though incomplete. The Material Safety Data Sheets for psyllium recommends that personnel wear powered purifying respirators with HEPA (high-efficiency particulate air) filters and Tyvek face seals while cleaning up a psyllium spill. In our query, however, these items were not readily available.
3. Substitute other preparations? A third alternative to prevent psyllium dust exposure would be to use other forms of psyllium, such as granules, capsules, or wafers. The drawback to this alternative, clearly, is greater cost. As already mentioned, the cost of a psyllium product is inversely proportional to the number of antigenic components.
4. Assess risk beforehand. A final means of preventing serious hypersensitivity reactions is to screen staff for their degree of risk: pre-employment screening as well during subsequent review of systems by a physician. Stratify risk based on such factors as history of allergies, atopy or asthma, and frequency of respiratory symptoms, particularly as may be related to work.
5. Consider cross-reactivity. For example, there is evidence that reactivity to psyllium may be seen in those with dust and grass allergies.15
Social history should focus on employment and exposure both at work and at home (eg, those who care for elderly relatives in the home). Smoking status is also important, as cigarette smoke increases the risk of bronchial hyper-responsiveness. Appropriate precautions and warnings could then be offered based on perceived risk.
CORRESPONDENCE
E-mail: [email protected]
1. Khalil B, Bardana EJ, Jr, Yunginger JW. Psyllium-associated anaphylaxis and death: a case report and review of the literature. Ann Allergy Asthma Immunol 2003;91:579-584.
2. Malo J, Cartier A, L’Archeveque, et al. Prevalence of occupational asthma and immunologic sensitization to psyllium among health personnel in chronic care hospitals. Am Rev Respir Dis 1990;142:1359-1366.
3. Cartier A, Malo J, Dolovich J. Occupational asthma in nurses handling psyllium. Clinical Allergy 1987;17:1-6.
4. Gauss WF, Alarie JP, Karol MH. Workplace allergenicity of a psyllium-containing bulk laxative. Allergy 1985;40:73-76.
5. Nelson WL. Allergic events among health care workers exposed to psyllium laxatives in the workplace. J Occ Med 1987;29:497-500.
6. Pozner LJ, Mandarano C, Zitt MJ, Frieri M, Weiss NS. Recurrent bronchospasm in a nurse. Ann Allergy 1986;56:14-1544-47.
7. Scott D. Psyllium-induced asthma: occupational exposure in a nurse. Asthma 1987;82:160-161.
8. Primrose WR, Capewell AE, Simpson GK, Smith RG. Prescribing patterns observed in registered nursing homes and long-stay geriatric wards. Age Ageing 1987;16:25-28.
9. Hanson CV, Oelke EA, Putnam DH, Oplinger ES. Psyllium. In: Alternative Field Crops Manual. Available at: www.hort.purdue.edu/newcrop/afcm/psyllium.html. Accessed on July 31, 2006.
10. Sirabonian A. Psyllium. Available at: www.botgard.ucla.edu/html/botanytextbooks/economicbotany/Plantago/. Accessed on July 31, 2006.
11. Arlian LG, Vyszenski-Moher DL, Lawrence AT, Schrotnel KR, Ritz HL. Antigenic and allergenic analysis of psyllium seed components. J Allergy Clin Immunol 1992;89:866-876.
12. Ascher MS. Psyllium seed sensitivity. J Allergy 1941;607:609.-
13. James JM, Cooke SK, Barnett A, Sampson HA. Anaphylactic reactions to a psyllium-containing cereal. J Allergy Clin Immunol 1991;88:402-408.
14. Material Safety Data Sheet: Psyllium Hydrophyllic mucilloid.
15. The Medical Advisor: The Complete Guide to Alternative & Conventional Treatments. Alexandria, Va: Time-Life; 1997:997.
• Don’t pour psyllium powder into medicine cups: spoon it or combine it with a liquid (C).
• Use respiratory protection, such as a chemical hood or HEPA filter mask (C).
A 39-year-old female nurse with a history of moderate to severe asthma was preparing medications for patients at an extended care facility. While pouring a bulk psyllium product from a large container into a medicine cup, a clumped mass of the powder fell from the container, striking the counter, and raising a cloud of psyllium dust. On inhaling this dust, the nurse became dyspneic. She did not respond to a beta-agonist and suffered respiratory arrest within 5 minutes. Emergency Medical Services and staff at the receiving hospital were unable to resuscitate her. Time of death was 1 hour and 25 minutes after exposure to psyllium dust. Autopsy showed severe bronchospasm with mucus plugging, but no signs of foreign material in the airways. Anaphylaxis secondary to inhaled psyllium was the final diagnosis.
Risk is significant and underestimated
Thousands of health care workers, particularly nurses, are at risk for hypersensitivity responses to psyllium, including rhinitis, conjunctivitis, cough, wheeze, asthma exacerbation, nausea, and anaphylaxis.1-7 Exposure in the workplace usually results from inhalation of dust during the preparation of the product for patient use.
One review found that up to 73% of residents in extended care facilities receive psyllium products.8 Hospitalized and home care patients also receive psyllium. Nurses especially are constantly exposed, and many are sensitized.
Despite the significant number of persons at risk, awareness and precaution are inadequate. Personal communication reveals that no health care providers—nurses, physicians, medical directors—were aware of the degree of risk. There was no routine use of protective devices or precautions when working with psyllium products in the facilities reviewed.
Quality and safety of psyllium products vary
Psyllium is a well-known powdered fiber supplement derived from the seed husk of Plantago ovata.9,10 The supplement contains varying ratios of endosperm, seed embryo, and psyllium (a translucent hydrophilic colloid material).
The endosperm and seed embryo proteins are allergenic; the colloid is not.11 Concentrations of each component vary according to the means of processing and the country of origin.9-11
Independent review indicates that the concentration of non-psyllium allergenic components is inversely proportional to the cost of the commercial product. The product dispensed for the patient in our case was particularly heterogenous.
Those at particular risk
Multiple instances of anaphylaxis have been linked to psyllium since the initial description in 1941.12 Ingestion of cereals containing psyllium is the most common cause of psyllium-related anaphylaxis.10 In a number of cases of anaphylaxis secondary to ingestion, the initial sensitization was related to psyllium dust inhalation.1 Twenty cases of anaphylaxis to a psyllium-rich cereal were reviewed shortly after its introduction. Fourteen of those affected were nurses. It was concluded that these nurses were sensitized from job-related inhalation exposure.13
IgE sensitization to psyllium has been shown in as many as 12% of health care personnel. History of asthma or atopy in a health care worker, as in the patient presented, seems to make IgE sensitization to psyllium more likely and raises the risk for fatal anaphylaxis.2
One review of workers with documented IgE sensitivity to psyllium showed that 42% complained of symptoms of conjunctivitis, rhinitis, or exacerbation of asthma.3 In another study, 29% of subjects were shown to have significant bronchial hyper-responsiveness to psyllium dust.2
One 1987 investigation of health care workers in an extended care facility concluded that the response to inhaled psyllium in these employees could range from mild to disabling.5 In a similar study, a nurse who had experienced only mild symptoms previously required intubation for severe bronchospasm after only 1 minute of exposure to psyllium dust.3 As happened with the patient in our case, she was symptomatic (moderate to severe asthma) and exposed, which led to fatal anaphylaxis.
Urge precautions to limit risk
Package inserts for the most popular—but not all—brands of psyllium describe precautions for dispensing psyllium, particularly for those with asthma.
1. Don’t pour the powder. Pouring the bulk form of the powder into medicine or beverage cups disperses significant amounts of dust. Yet this seems to be the most common manner of dispensing this medication. The standard set by the Occupational Safety and Health Administration (OSHA) limits the time-weighted average concentration for nuisance dust to 15 mg/m3. Dust concentration exhibited when psyllium powder is poured ranges from 4 to 28.5 mg/m3, with a mean concentration of 12.96 mg/m3. Given the frequency of inappropriate preparation, it is probable that OSHA recommended safe levels are frequently exceeded.3
Spoon the powder … To limit the amount of aerosolized dust, the powder should only be spooned into cups. While this recommendation is in the package insert, most health care workers are unaware of the guideline.
… or pour solvent over powder. Even better, our experiments showed there was less dust produced if the solvent (water or orange juice) was poured slowly over the powder than if the powder was put into solvent.
… or immerse powder in liquid. Alternatively, a device such as a scoop with a lid could be used that would submerge the powder into solution and then release it, creating virtually no dust.
2. Ventilate properly … Respiratory protection must be offered to the preparer and anyone else in the area. One maneuver to prevent exposure to psyllium dust would be to prepare the product in a chemical hood to ventilate dust away from the preparer.
… or use a mask. A simple mask, as is used to prevent the spread of communicable diseases, would offer some protection, though incomplete. The Material Safety Data Sheets for psyllium recommends that personnel wear powered purifying respirators with HEPA (high-efficiency particulate air) filters and Tyvek face seals while cleaning up a psyllium spill. In our query, however, these items were not readily available.
3. Substitute other preparations? A third alternative to prevent psyllium dust exposure would be to use other forms of psyllium, such as granules, capsules, or wafers. The drawback to this alternative, clearly, is greater cost. As already mentioned, the cost of a psyllium product is inversely proportional to the number of antigenic components.
4. Assess risk beforehand. A final means of preventing serious hypersensitivity reactions is to screen staff for their degree of risk: pre-employment screening as well during subsequent review of systems by a physician. Stratify risk based on such factors as history of allergies, atopy or asthma, and frequency of respiratory symptoms, particularly as may be related to work.
5. Consider cross-reactivity. For example, there is evidence that reactivity to psyllium may be seen in those with dust and grass allergies.15
Social history should focus on employment and exposure both at work and at home (eg, those who care for elderly relatives in the home). Smoking status is also important, as cigarette smoke increases the risk of bronchial hyper-responsiveness. Appropriate precautions and warnings could then be offered based on perceived risk.
CORRESPONDENCE
E-mail: [email protected]
1. Khalil B, Bardana EJ, Jr, Yunginger JW. Psyllium-associated anaphylaxis and death: a case report and review of the literature. Ann Allergy Asthma Immunol 2003;91:579-584.
2. Malo J, Cartier A, L’Archeveque, et al. Prevalence of occupational asthma and immunologic sensitization to psyllium among health personnel in chronic care hospitals. Am Rev Respir Dis 1990;142:1359-1366.
3. Cartier A, Malo J, Dolovich J. Occupational asthma in nurses handling psyllium. Clinical Allergy 1987;17:1-6.
4. Gauss WF, Alarie JP, Karol MH. Workplace allergenicity of a psyllium-containing bulk laxative. Allergy 1985;40:73-76.
5. Nelson WL. Allergic events among health care workers exposed to psyllium laxatives in the workplace. J Occ Med 1987;29:497-500.
6. Pozner LJ, Mandarano C, Zitt MJ, Frieri M, Weiss NS. Recurrent bronchospasm in a nurse. Ann Allergy 1986;56:14-1544-47.
7. Scott D. Psyllium-induced asthma: occupational exposure in a nurse. Asthma 1987;82:160-161.
8. Primrose WR, Capewell AE, Simpson GK, Smith RG. Prescribing patterns observed in registered nursing homes and long-stay geriatric wards. Age Ageing 1987;16:25-28.
9. Hanson CV, Oelke EA, Putnam DH, Oplinger ES. Psyllium. In: Alternative Field Crops Manual. Available at: www.hort.purdue.edu/newcrop/afcm/psyllium.html. Accessed on July 31, 2006.
10. Sirabonian A. Psyllium. Available at: www.botgard.ucla.edu/html/botanytextbooks/economicbotany/Plantago/. Accessed on July 31, 2006.
11. Arlian LG, Vyszenski-Moher DL, Lawrence AT, Schrotnel KR, Ritz HL. Antigenic and allergenic analysis of psyllium seed components. J Allergy Clin Immunol 1992;89:866-876.
12. Ascher MS. Psyllium seed sensitivity. J Allergy 1941;607:609.-
13. James JM, Cooke SK, Barnett A, Sampson HA. Anaphylactic reactions to a psyllium-containing cereal. J Allergy Clin Immunol 1991;88:402-408.
14. Material Safety Data Sheet: Psyllium Hydrophyllic mucilloid.
15. The Medical Advisor: The Complete Guide to Alternative & Conventional Treatments. Alexandria, Va: Time-Life; 1997:997.
The Journal of Family Practice ©2006 Dowden Health Media
Are your patients with risk of CVD getting the viscous soluble fiber they need?
- A diet that includes 5 to 10 g/d of viscous soluble fiber reduces cardiovascular disease (CVD) events and death independent of baseline risk (A).
- Consuming foods rich in viscous soluble fiber reduces low-density lipoprotein cholesterol (LDL-C) blood levels 10% to 15% with expected reduction in CVD events by 10% to 15% (A).
- Routinely counsel adults at risk of CVD to promote a healthy diet: assess dietary fiber consumption; recommend specific foods rich in viscous soluble fiber; monitor LDL-C levels and encourage increased dietary fiber intake at follow-up visits; motivate patients to comply with recommendations (A).
The Adult Treatment Panel III and the Dietary Guidelines for Americans recommend that adults eat a healthy diet as defined in TABLE 1—including more than 20 to 30 g of dietary fiber per day, 5 to 10 g of which should be viscous soluble fiber.1,2,3 The benefits of such a diet are supported by growing epidemiologic data:
- Risk of CVD drops by 20% to 30%
- Morbidity and mortality from cardiovascular diseases fall by more than 10%
- Foods rich in viscous soluble fiber, at a dose of 5 to 10 g/d, can reduce LDL-C levels by 10% to 15%, improve insulin sensitivity, and decrease blood pressure
- Pooled analysis of 10 prospective cohort studies showed that, for adults at low risk of heart attack (estimated with Framingham scores), every additional 10 g of fiber consumed daily may prevent 1 coronary death in 74 adults (95% confidence interval [CI], 51–154), and 1 in 19 adults at high risk (95% CI, 13–38).4
Despite these hopeful findings, the average American adult eats less than half the recommended amount of fiber: 10 to 15 g/d; just 2.4 g of viscous soluble fiber.2,5Healthy People 2010 has set a national objective to reduce coronary heart disease (CHD) mortality from 208 deaths to 166 deaths per 100,000 people.6 The US Preventive Services Task Force (USPSTF) recommends that primary care clinicians intensively counsel adults with elevated risk of CVD to improve daily intake of essential components of a healthy diet, including dietary fiber.7
In this article, we review practical approaches you can use in motivating patients to eat more fiber, types of dietary fiber and their sources, and the evidence for fiber’s impact on CVD risk factors and prevention of CVD events.
TABLE 1
Recommended ATP-III dietary change reduces risk of CVD by 20% to 30%
| DIETARY COMPONENT | RECOMMENDED DAILY LEVELS* | EXPECTED LDL-C REDUCTION4 |
|---|---|---|
| Total fat | 25%-35% | 8%-10% |
| Saturated fat | <7% | |
| Polyunsaturated fat | ≤10% | |
| Monounsaturated fat | ≤20% | |
| Dietary cholesterol | <200 mg | 3%-5% |
| Carbohydrates | 50%–60% | |
| Dietary fiber | 20–30 g | |
| Viscous soluble fiber | 5–10 g | 3%–5% |
| Protein | 15% | |
| Plant stanols/sterols | 2 g | 6%–15% |
| Cumulative estimate | 20%–30% | |
| * % of total calorie intake | ||
Making sure patients get the right dietary fiber
Dietary fiber (nondigestible non-starch polysaccharides) is classified as insoluble or viscous soluble, based on its solubility in water and other fluids in the digestive tract.8
Insoluble fibers, present in most fruits, vegetables, and whole grain products, constitute over 80% of the total fiber in the typical US diet. Insoluble fibers shorten bowel transit time and produce a laxative effect but have no significant impact on blood lipids.9
Viscous soluble fiber is present in smaller quantities in foods, but is responsible for the fiber-related physiological effects such as decreased blood cholesterol.5 The US Food and Drug Administration (FDA) has also approved health claims for 2 such fibers—beta-glucan from whole oat sources and psyllium—to be used as supplements in reducing CVD risk.10,11
Viscous soluble fiber absorbs and holds water in the gastrointestinal tract, forming a thick gel. Viscous soluble bulk reduces reabsorption of bile acids from the ileum. Consequently, the liver shifts sterol metabolism from cholesterol production to replacement of bile acids lost in the stool. Fecal excretion of total bile acids increases in conjunction with serum cholesterol reduction when diets high in viscous soluble fiber are eaten.12-14
Moreover, when viscous soluble fiber is fermented by colonic microflora, it produces short-chain fatty acids that directly inhibit intestinal fat absorption, and cholesterol transport and synthesis.15 Viscous soluble fiber may delay the absorption of simple sugars from the gut, thus decreasing postprandial glucose level and the demand for insulin secretion, and increasing insulin sensitivity.16
Viscous soluble fibers reduce CVD risk factors: The evidence
The goal of the cholesterol-lowering diet is to prevent CVD events by reducing LDLC, blood pressure, and glucose intolerance. Evidence from observational studies and randomized controlled trials confirms that foods rich in viscous soluble fiber lower blood lipids and arterial blood pressure and enhance insulin sensitivity.
Soluble fiber reduces LDL-C and may allow lower drug doses. In randomized controlled trials, 2 viscous soluble fiber sources at different doses resulted in a modest but clinically significant reduction in LDLC.17,18 In addition, the reduction was seen in healthy men and women and in those with hypercholesterolemia (TABLE 2).19-24 A 1% decrease in LDL-C reduces the risk of CVD events by 1%.1
For those on lipid-lowering drug therapy, supplementation with viscous fiber may help achieve the recommended reduction in LDL-C with lower doses of drugs.25 Moreyra et al25 treated hypercholesterolemic adults with 20 mg of simvastatin plus placebo, 10 mg of simvastatin plus placebo, or 10 mg of simvastatin plus 15 g of psyllium. A significant LDL-C reduction (36%) was observed in the group receiving 10 mg of simvastatin plus psyllium and 20 mg of simvastatin. The authors concluded that psyllium supplementation augmented the lipid-lowering effects of the statin.
Blood pressure decreases, as does the need for medications. In a prospective study of 51,529 male health professionals followed for 5 years, Ascherio et al26 found an inverse association between incidence of hypertension and fruit fiber intake in young men, independent of age and other risk factors. Moderate but significant reductions in 24-hour monitored systolic blood pressure—by 5.9 mm Hg after psyllium27 and by 5 mm Hg after oat administration28—were reported in randomized controlled trials. A 5 mm Hg reduction of systolic blood pressure in the population would result in a 9% reduction in fatal CHD and a 7% decrease in all-cause mortality.29
Eighty-eight patients with a history of essential moderate hypertension treated with medications were randomized to consume 5.4 g/d of beta-glucan in oats or placebo for 12 weeks. Oat consumption reduced the need for blood pressure medications in 73% of participants in the treatment group, compared with 42% in the control group.30
The Seventh Report of the Joint National Committee on Prevention, Detection, Evaluation, and Treatment of High Blood Pressure recommends a dietary plan rich in fiber (24 g/1600 kcal/d) from fruits and vegetables among other life style modifications to treat hypertension.29
Insulin sensitivity improves and HbA1c drops. Foods rich in viscous soluble fiber lower glycemic index compared with reference food in healthy people and in patients with type II diabetes.31,32 In a randomized trial, barley meal enriched with 1.5 to 15 g of viscous soluble fiber reduced postprandial glucose concentration by 19% to 28% compared with wheat bread, and by 15% to 30% compared with glucose solution.31 Consumption of barley meal containing 3.5 g of soluble viscous fiber improved insulin sensitivity as assessed by the standard oral glucose tolerance test; it significantly reduced fasting insulin by 11.5% and postprandial increase in plasma glucose levels by 8.3%, and increased glucose disappearance by 7.5%.33
In patients with diabetes, postprandial glucose was significantly less by 10.6% after a meal of barley bread compared with control wheat bread.32 Intake of barley bread with 5.2 g of viscous soluble fiber for 12 weeks resulted in 20% reduced postprandial glucose response and in decreased doses of oral hypoglycemic medications.34
In a meta-analysis of 12 clinical trials, diets moderate in carbohydrate intake with increased consumption of foods rich in fiber provided the best control of fasting blood glucose and a significant decrease in glycosylated hemoglobin (HbA1c) in patients with diabetes.35
TABLE 2
Viscous soluble fiber reduces LDL-cholesterol (results of RCTs)
| STUDY POPULATION | VISCOUS SOLUBLE FIBER SOURCE | DOSE (G/D) | LDL-C REDUCTION (%) MEAN (95% CI) | ESTIMATED CVD EVENT REDUCTION (%) MEAN (95% CI) |
|---|---|---|---|---|
| Hypercholesterolemic men and women (656)19 | Psyllium | 10 | 7 (5-9) | 7 (5-9) |
| Hypercholesterolemic men (404)20 | Psyllium | 3–12 | 9 (7-10) | 9 (7-10) |
| Hypercholesterolemic men and women (150)21 | Oat* | 1.2–6 | 16 (14-25) | 16 (14-25) |
| Healthy men and women (236)22 | Oat* | 2.2 | 8 (2-13) | 8 (2-13) |
| Healthy men and women (208)23 | Oat* | 2.4–3.3 | 5 | 5 (3-7) |
| Healthy men and women (245)24 | Oat* | 2.4 | 9 | 9 (5-12) |
| *The dose of beta-glucan in oats. | ||||
CVD events decline with soluble-fiber diets, and diverse fiber sources yield equivalent effects
TABLE 3 summarizes findings from prospective observational studies of adults followed for more than 5 years to evaluate the incidence of CVD in groups consuming different kinds of dietary fiber. These studies show that risk reduction is consistent in different populations and with different sources of dietary fiber,4,36-38 regardless of patient age, gender, treatment status, smoking, and other risk factors for CVD.
In a pooled analysis of 10 large cohort studies, an additional intake of 10 g/d of fruit fiber reduced the risk of CHD death by 30%.4
The Women’s Health Study followed health professionals for 6 years and reported that an increase of 4.9 g/d of viscous soluble fiber was associated with a 44% reduction in myocardial infarction incidents.38
Among participants in the National Health and Nutrition Examination Survey (NHANES) I Follow-up Study, each 5 g/d increase in viscous soluble fiber intake diminished the risk of CVD by 6% and coronary heart disease by 8%.37
Estimated risk reduction is adjusted for all known risk factors of CVD; therefore it is independent of Framingham baseline CHD risk.
For another perspective on the evidence for fiber preventing CVD events, consider the number needed to treat (NNT) with increased fiber intake to prevent the particular CVD-related patient outcome for each study (TABLE 3). Based on the findings of Pereira and colleagues’ pooled cohort study,4 among persons at less than 5% risk for CHD according to the Framingham baseline,1 67 subjects (95% CI, 44–182) need to increase their fruit fiber intake by 10 g/d to prevent 1 CHD death. For persons at baseline CHD risk greater than 20%, the NNT is reduced to 17 (95% CI, 11–45). In the Women’s Health Study, an additional 4.9 g/d of viscous soluble fiber intake among 45 women (95% CI, 31–167) was estimated to prevent 1 CHD event.36
TABLE 3
Increased daily fiber consumption, regardless of source, reduces risk for cardiovascular disease
| STUDY SAMPLE (N) | INCREMENTAL INCREASE IN FIBER DOSE (G/D) | OUTCOME | RR | 95% CI | NNT BASELINE RISK 5% (LOW)* | 95% CI | NNT BASELINE RISK 20% (HIGH)* | 95% CI |
|---|---|---|---|---|---|---|---|---|
| Pereira4 91,058 men 245,186 women | 10 g total fiber | CHD event | 14 | 4–22 | 143 | 91–500 | 36 | 23–125 |
| CHD death | 27 | 13–39 | 74 | 51–154 | 19 | 13–38 | ||
| 10 g fruit fiber | CHD event | 16 | 1–30 | 125 | 67–2000 | 31 | 17–500 | |
| CHD death | 30 | 11–45 | 67 | 44–182 | 17 | 11–45 | ||
| 10 g cereal fiber | CHD death | 25 | 9–37 | 80 | 54–222 | 20 | 14–56 | |
| Women's Health Study (39,876)36 | 13.8 g total fiber | CVD event | 35 | 16–49 | 57 | 41–125 | 14 | 10–31 |
| MI | 54 | 28–70 | 37 | 29–71 | 9 | 7–18 | ||
| 4.9 g viscous soluble fiber | CVD event | 26 | 4–43 | 77 | 47–500 | 19 | 12–125 | |
| MI | 44 | 12–64 | 45 | 31–167 | 11 | 8–42 | ||
| US Males (43,757)37 | 16.5 g total fiber | MI (nonfatal) | 35 | 12–51 | 57 | 39–167 | 14 | 10–42 |
| CHD death | 55 | 28–72 | 36 | 28–71 | 9 | 7–18 | ||
| 10 g cereal fiber | MI event | 27 | 6–43 | 74 | 47–333 | 19 | 12–83 | |
| NHANES I Follow up (9776)38 | 10 g total fiber | CHD event | 8 | 2–14 | 250 | 143–1000 | 63 | 36–250 |
| CVD event | 7 | 3–11 | 286 | 182–667 | 71 | 45–167 | ||
| 5 g viscous soluble fiber | CHD event | 8 | 3–13 | 250 | 154–667 | 63 | 38–167 | |
| CHD death | 9 | 1–17 | 222 | 118–2000 | 56 | 29–500 | ||
| CVD event | 6 | 1–10 | 333 | 200–2000 | 83 | 50–500 | ||
| RR, relative risk reduction, defined as (relative risk-1) ×100%; NNT, number needed to treat to prevent 1event; CI, confidence interval; CVD, cardiovascular disease; CHD, coronary heart disease; MI, myocardial infarction | ||||||||
| NNT=1/p*(1-RR) –p is the typical event risk without treatment (Systematic Reviews in Health Care: Meta-Analysis in Context, Egger M, Smith GD, Altman DG (eds). London: BMJ, 2001:333 | ||||||||
| *Baseline risk is obtained from the Framingham risk calculator, a probability less than 5% to have heart attack during next 10 years is defined as a low risk, a probability more than 20% is defined as a high risk | ||||||||
What should patients eat to increase viscous soluble fiber?
The 2005 Dietary Guidelines for Americans recommend a daily intake of 14 g of total dietary fiber for every 1000 kcal consumed.2 This would include 2.5 to 6.5 cups of fruits and vegetables and at least three 1-ounce servings of whole-grain foods daily.39-42 Common foods and their dietary total and soluble fiber content per serving are listed in FIGURE 1, which is a modified nutrition prescription from the American Academy of Family Physicians (familydoctor.org/298.xml) incorporating the recommendations for viscous soluble fiber intake from guidelines discussed in this paper.1-3,6
Four servings per day of the FDA-recommended whole oats (0.75 g per serving of viscous soluble fiber) and psyllium (1.78 g per serving) are required to reduce CVD risk.10,11
An estimated 23% of Americans eat 2 to 3 servings a day of whole grains and 4 to 5 servings a day of fruits and vegetables (all sources of viscous soluble fiber). Healthy People 2010 has called for this proportion to increase to 50% to 75%.6
FIGURE 1
Common foods high in fiber for a nutrition prescription*
Ways to approach dietary counseling
The USPSTF found good evidence that, for adult patients at increased risk for diet-related chronic disease, medium- to high-intensity counseling improves the average daily intake of core components of a healthy diet (including saturated fat, fiber, fruit, and vegetables).7 It recommends that clinicians routinely provide intensive behavioral counseling to promote a healthy diet in adult patients with hyperlipidemia and other known risk factors for cardiovascular diseases. It found no evidence sufficient to recommend for or against routine counseling of unselected patients in primary care.
Both USPSTF7 and Adult Treatment Panel III1 offer frameworks to engage patients in therapeutic lifestyle changes.
USPSTF recommends the “5-A” framework to behavioral counseling7:
Assess dietary practices and related risk factors
Advise to change dietary practices
Agree on individual diet change goals
Assist to change dietary practices
Arrange regular follow-up and support for refer to more intensive behavioral nutritional counseling (eg, medical nutrition therapy) if needed.
Physicians may use face-to-face and interactive health communications, staff-performed education, and nutritional prescriptions (FIGURE 1) to influence patients’ food choices that increase dietary fiber consumption and achieve the doses recommended for adults at risk of CVD.7,43
Low-intensity interventions involve 5 minutes of professional counseling supplemented by patient self-help materials, telephone counseling, or other interactive health communications via Internet.44,45
Medium-intensity interventions involve face-to-face dietary counseling (2 to 3 group or individual sessions) delivered by a dietitian or a specially trained primary care physician.
High-intensity interventions yield the largest effect. These involve multiple sessions lasting 30 minutes or longer7 and use office-level supports and algorithms to estimate the baseline risk of CVD, individual calorie and nutrients intake, and energy expenditure.45
The Adult Treatment Panel III outlines a model for initiating and monitoring dietary therapy for adults with risk of CVD (FIGURE 2). You may start by assessing the risk of CVD with Framingham scores and current dietary patterns, then counsel patients directly or engage dietitians to help patients institute therapeutic lifestyle changes. After 6 weeks of the therapeutic diet, repeat the lipoprotein examination to determine recommendations to continue or intensify the lifestyle changes. After another 6 weeks, you may consider adding drug therapy and further reinforcing dietary recommendations.
Regardless of the approach you use to assess a patient’s diet, a comprehensive individualized nutritional prescription will effectively increase daily intake of dietary fiber, with success similar to that achieved in a major randomized clinical trial.46
FIGURE 2
ATP III guidance on initiating dietary changes: Determine your patient’s 10-year risk for CVD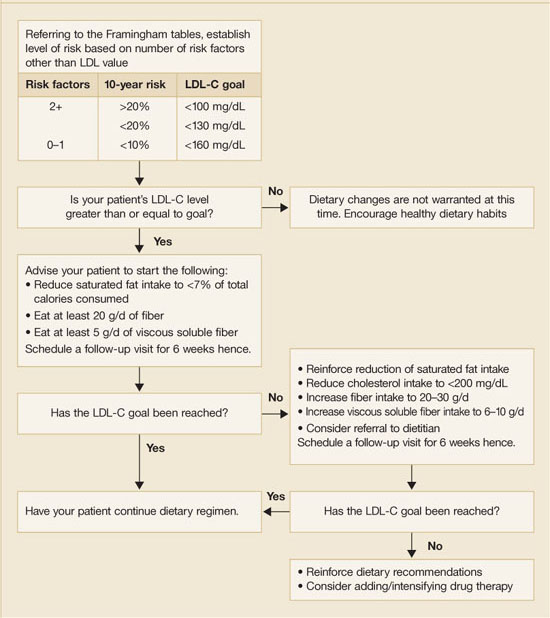
Acknowledgments
The authors thank Heather Haley, MS for editing the manuscript, and Elizabeth Greene, for her help in its preparation. Dr. Shamliyan thanks Professor E. B. Arushanian, MD, PhD, Department of Pharmacology, Stavropol Medical Academy, Russia for motivating her enthusiasm for scientific research.
CORRESPONDENCE
Joseph M. Keenan, MD, Department of Family Medicine and Community Health, University of Minnesota Medical School, MMC 381, 420 Delaware Street SE, Minneapolis, MN 55455. E-mail: [email protected]
1. Grundy SM (ed). Report of the National Cholesterol Education Program (NCEP) on Detection, Evaluation, and Treatment of High Blood Cholesterol in Adults (Adult Treatment Panel III) Third and Final Report. Collingdale, Pa: DIANE Publishing Company; 2002.
2. Krauss RM, Eckel RH, Howard B, et al. AHA Dietary Guidelines: revision 2000: A statement for healthcare professionals from the Nutrition Committee of the American Heart Association. Circulation 2000;102:2284-2299.
3. US Department of Health and Human Services and Department of Agriculture. Dietary Guidelines Advisory Committee. Dietary Guidelines for Americans, 2005. 6th ed. Washington, DC: US Government Printing Office; 2005. Available at www.mypyramid.gov/.
4. Pereira MA, O’Reilly E, Augustsson K, et al. Dietary fiber and risk of coronary heart disease: a pooled analysis of cohort studies. Arch Intern Med 2004;164:370-376.
5. Institute of Medicine (US). Standing Committee on the Scientific Evaluation of Dietary Reference Intakes. Dietary Reference Intakes for Energy, Carbohydrate, Fiber, Fat, Fatty Acids, Cholesterol, Protein, and Amino Acids (Macronutrients). Washington, DC: National Academy Press; 2003.
6. US Department of Health and Human Services. Healthy People 2010: Understanding and Improving Health. Volume 1, 2nd ed. Washington, DC: US Government Printing Office; 2000.
7. Snow V (ed) Clinical Practice: American College of Physicians Guidelines and U.S. Preventive Services Task Force Recommendations. Philadelphia, Pa: American College of Physicians; 2005.
8. The definition of dietary fiber. Cereal Foods World 2001;46:112-127.
9. Marlett JA, McBurney MI, Slavin JL. American Dietetic Association. Position of the American Dietetic Association: health implications of dietary fiber. J Am Diet Assoc 2002;102:993-1000.
10. US Food and Drug Administration, Department of Health and Human Services. Food labeling: health claims; soluble dietary fiber from certain foods and coronary heart disease. Interim final rule. Fed Regist 2002;67:61773-61783.
11. US Food and Drug Administration, Department of Health and Human Services. Food labeling: health claims; soluble dietary fiber from certain foods and coronary heart disease. Final rule. Fed Regist 2003;68:44207-44209.
12. Andersson M, Ellegard L, Andersson H. Oat bran stimulates bile acid synthesis within 8 h as measured by 7alpha-hydroxy-4-cholesten-3-one. Am J Clin Nutr 2002;76:1111-1116.
13. Jenkins DJA, Wolever TMS, Vidgen E, et al. Effect of psyllium in hypercholesterolemia at two monounsaturated fatty acid intakes. Am J Clin Nutr 1997;65:1524-1533.
14. Marlett JA, Hosig KB, Vollendorf NW, et al. Mechanism of serum cholesterol reduction by oat bran. Hepatology 1994;20:1450-1457.
15. Marcil V, Delvin E, Seidman E, et al. Modulation of lipid synthesis, apolipoprotein biogenesis, and lipoprotein assembly by butyrate. Am J Physiol Gastrointest Liver Physiol 2002;283:G340-346.
16. Wolever TM, Mehling C. High-carbohydrate-low-glycaemic index dietary advice improves glucose disposition index in subjects with impaired glucose tolerance. Br J Nutr 2002;87:477-487.
17. Ripsin CM, Keenan JM, Jacobs DR, Jr, et al. Oat products and lipid lowering. A meta-analysis. JAMA 1992;267:3317-3325.
18. Brown L, Rosner B, Willett WW, et al. Cholesterol-lowering effects of dietary fiber: a meta-analysis. Am J Clin Nutr 1999;69:30-42.
19. Olson BH, Anderson SM, Becker MP, et al. Psyllium-enriched cereals lower blood total cholesterol and LDL cholesterol, but not HDL cholesterol, in hypercholesterolemic adults: results of a meta-analysis. J Nutr 1997;127:1973-1980.
20. Anderson JW, Allgood LD, Lawrence A, et al. Cholesterol-lowering effects of psyllium intake adjunctive to diet therapy in men and women with hypercholesterolemia: meta-analysis of 8 controlled trials. Am J Clin Nutr 2000;71:472-479.
21. Davidson MH, Dugan LD, Burns JH, et al. The hypocholesterolemic effects of beta-glucan in oatmeal and oat bran. A dose controlled study. JAMA 1991;265:1833-1839.
22. Van Horn L, Emidy LA, Liu KA, et al. Serum lipid response to a fat-modified, oatmeal-enhanced diet. Prev Med 1988;17:377-386.
23. Van Horn LV, Liu K, Parker D, et al. Serum lipid response to oat product intake with a fat-modified diet. J Am Diet Assoc 1986;86:759-764.
24. Van Horn L, Liu K, Gerber J, et al. Oats and soy in lipid-lowering diets for women with hypercholesterolemia: is there synergy? J Am Diet Assoc 2001;101:1319-1325.
25. Moreyra AE, Wilson AC, Koraym A. Effect of combining psyllium fiber with simvastatin in lowering cholesterol. Arch Intern Med 2005;165:1161-1166.
26. Ascherio A, Rimm EB, Giovannucci EL, et al. A prospective study of nutritional factors and hypertension among US men. Circulation 1992;86:1475-1484.
27. Burke V, Hodgson JM, Beilin LJ, et al. Dietary protein and viscous soluble fiber reduce ambulatory blood pressure in treated hypertensives. Hypertension 2001;38:821-826.
28. Saltzman E, Das SK, Lichtenstein AH, et al. An oat-containing hypocaloric diet reduces systolic blood pressure and improves lipid profile beyond effects of weight loss in men and women. J Nutr 2001;131:1465-1470.
29. Chobanian AV, Bakris GL, Black HR, et al. Joint National Committee on Prevention, Detection, Evaluation, and Treatment of High Blood Pressure. National Heart, Lung, and Blood Institute; National High Blood Pressure Education Program Coordinating Committee. Seventh report of the Joint National Committee on Prevention, Detection, Evaluation, and Treatment of High Blood Pressure. Hypertension 2003;42:1206-1252.
30. Pins JJ, Geleva D, Keenan JM, et al. Do whole-grain oat cereals reduce the need for antihypertensive medications and improve blood pressure control? J Fam Pract 2002;51:353-359.
31. Cavallero A, Empilli S, Brighenti F, et al. High (1 -> 3,1 -> 4)-β-glucan barley fractions in bread making and their effects on human glycemic response. J Cereal Science 2002;36:59-66.
32. Urooj A, Vinutha SR, Puttaraj S, et al. Effect of barley incorporation in bread on its quality and glycemic responses in diabetics. Int J Food Sci Nutr 1998;49:265-270.
33. Thorburn A, Muir J, Proietto J. Carbohydrate fermentation decreases hepatic glucose output in healthy subjects. Metabolism 1993;42:780-785.
34. Pick ME, Hawrysh ZJ, Gee MI, et al. Barley bread products improve glycemic control of type 2 subjects. Int J Food Sci Nutr 1998;49:71-78.
35. Anderson JA, Randles KM, Kendall CW, et al. Carbohydrate and fiber recommendations for individuals with diabetes: A quantitative assessment and meta-analysis of the evidence. J Am Coll Nutr 2004;23:5-17.
36. Liu S, Buring JE, Sesso HD, et al. A prospective study of dietary fiber intake and risk of cardiovascular diseases among women. J Am Coll Cardiol 2002;39:49-56.
37. Rimm EB, Ascherio A, Giovannucci E, et al. Vegetable, fruit, and cereal fiber intake and risk of coronary heart disease among men. JAMA 1996;275:447-451.
38. Bazzano LA, He J, Ogden LG, et al. Dietary fiber intake and reduced risk of coronary heart disease in US men and women: the National Health and Nutrition Examination Survey I Epidemiologic Follow-up Study. Arch Intern Med 2003;163:1897-1904.
39. Li BW, Andrews KW, Pehrsson PR. Individual sugars, soluble, and insoluble dietary fiber contents of 70 high consumption foods. J Food Composition Analysis 2002;15:715-723.
40. Marlett JA. Content and composition of dietary fiber in 117 frequently consumed foods. J Am Diet Assoc 1992;92:175-186.
41. Anderson JW, Bridges SR. Dietary fiber content of selected foods. Am J Clin Nutr 1988;47:440-447.
42. National Cholesterol Education Program, National Heart, Lung, and Blood Institute, National Institutes of Health. Food sources of soluble fiber. Available at: www.nhlbi.nih.gov/chd/Tipsheets/solfiber.htm. Accessed on April 28, 2006.
43. Truswell AS, Hiddink GJ, Blom J. Nutrition guidance by family doctors in a changing world: problems, opportunities, and future possibilities. Am J Clin Nutr 2003;77(Suppl):1089S-1092S.
44. van Woerkum CM. The Internet and primary care physicians: coping with different expectations Am J Clin Nutr 2003;77(Suppl):1016S-1018S.
45. US Department of Agriculture, Center for Nutrition Policy and Promotion. Steps to a Healthier You. Alexandria, VA: 2005. Available at: www.mypyramid.gov/. Accessed on April 28, 2006.
46. McCarron DA, Oparil S, Chait A, et al. Nutritional management of cardiovascular risk factors. A randomized clinical trial. Arch Intern Med 1997;157:169-177.
- A diet that includes 5 to 10 g/d of viscous soluble fiber reduces cardiovascular disease (CVD) events and death independent of baseline risk (A).
- Consuming foods rich in viscous soluble fiber reduces low-density lipoprotein cholesterol (LDL-C) blood levels 10% to 15% with expected reduction in CVD events by 10% to 15% (A).
- Routinely counsel adults at risk of CVD to promote a healthy diet: assess dietary fiber consumption; recommend specific foods rich in viscous soluble fiber; monitor LDL-C levels and encourage increased dietary fiber intake at follow-up visits; motivate patients to comply with recommendations (A).
The Adult Treatment Panel III and the Dietary Guidelines for Americans recommend that adults eat a healthy diet as defined in TABLE 1—including more than 20 to 30 g of dietary fiber per day, 5 to 10 g of which should be viscous soluble fiber.1,2,3 The benefits of such a diet are supported by growing epidemiologic data:
- Risk of CVD drops by 20% to 30%
- Morbidity and mortality from cardiovascular diseases fall by more than 10%
- Foods rich in viscous soluble fiber, at a dose of 5 to 10 g/d, can reduce LDL-C levels by 10% to 15%, improve insulin sensitivity, and decrease blood pressure
- Pooled analysis of 10 prospective cohort studies showed that, for adults at low risk of heart attack (estimated with Framingham scores), every additional 10 g of fiber consumed daily may prevent 1 coronary death in 74 adults (95% confidence interval [CI], 51–154), and 1 in 19 adults at high risk (95% CI, 13–38).4
Despite these hopeful findings, the average American adult eats less than half the recommended amount of fiber: 10 to 15 g/d; just 2.4 g of viscous soluble fiber.2,5Healthy People 2010 has set a national objective to reduce coronary heart disease (CHD) mortality from 208 deaths to 166 deaths per 100,000 people.6 The US Preventive Services Task Force (USPSTF) recommends that primary care clinicians intensively counsel adults with elevated risk of CVD to improve daily intake of essential components of a healthy diet, including dietary fiber.7
In this article, we review practical approaches you can use in motivating patients to eat more fiber, types of dietary fiber and their sources, and the evidence for fiber’s impact on CVD risk factors and prevention of CVD events.
TABLE 1
Recommended ATP-III dietary change reduces risk of CVD by 20% to 30%
| DIETARY COMPONENT | RECOMMENDED DAILY LEVELS* | EXPECTED LDL-C REDUCTION4 |
|---|---|---|
| Total fat | 25%-35% | 8%-10% |
| Saturated fat | <7% | |
| Polyunsaturated fat | ≤10% | |
| Monounsaturated fat | ≤20% | |
| Dietary cholesterol | <200 mg | 3%-5% |
| Carbohydrates | 50%–60% | |
| Dietary fiber | 20–30 g | |
| Viscous soluble fiber | 5–10 g | 3%–5% |
| Protein | 15% | |
| Plant stanols/sterols | 2 g | 6%–15% |
| Cumulative estimate | 20%–30% | |
| * % of total calorie intake | ||
Making sure patients get the right dietary fiber
Dietary fiber (nondigestible non-starch polysaccharides) is classified as insoluble or viscous soluble, based on its solubility in water and other fluids in the digestive tract.8
Insoluble fibers, present in most fruits, vegetables, and whole grain products, constitute over 80% of the total fiber in the typical US diet. Insoluble fibers shorten bowel transit time and produce a laxative effect but have no significant impact on blood lipids.9
Viscous soluble fiber is present in smaller quantities in foods, but is responsible for the fiber-related physiological effects such as decreased blood cholesterol.5 The US Food and Drug Administration (FDA) has also approved health claims for 2 such fibers—beta-glucan from whole oat sources and psyllium—to be used as supplements in reducing CVD risk.10,11
Viscous soluble fiber absorbs and holds water in the gastrointestinal tract, forming a thick gel. Viscous soluble bulk reduces reabsorption of bile acids from the ileum. Consequently, the liver shifts sterol metabolism from cholesterol production to replacement of bile acids lost in the stool. Fecal excretion of total bile acids increases in conjunction with serum cholesterol reduction when diets high in viscous soluble fiber are eaten.12-14
Moreover, when viscous soluble fiber is fermented by colonic microflora, it produces short-chain fatty acids that directly inhibit intestinal fat absorption, and cholesterol transport and synthesis.15 Viscous soluble fiber may delay the absorption of simple sugars from the gut, thus decreasing postprandial glucose level and the demand for insulin secretion, and increasing insulin sensitivity.16
Viscous soluble fibers reduce CVD risk factors: The evidence
The goal of the cholesterol-lowering diet is to prevent CVD events by reducing LDLC, blood pressure, and glucose intolerance. Evidence from observational studies and randomized controlled trials confirms that foods rich in viscous soluble fiber lower blood lipids and arterial blood pressure and enhance insulin sensitivity.
Soluble fiber reduces LDL-C and may allow lower drug doses. In randomized controlled trials, 2 viscous soluble fiber sources at different doses resulted in a modest but clinically significant reduction in LDLC.17,18 In addition, the reduction was seen in healthy men and women and in those with hypercholesterolemia (TABLE 2).19-24 A 1% decrease in LDL-C reduces the risk of CVD events by 1%.1
For those on lipid-lowering drug therapy, supplementation with viscous fiber may help achieve the recommended reduction in LDL-C with lower doses of drugs.25 Moreyra et al25 treated hypercholesterolemic adults with 20 mg of simvastatin plus placebo, 10 mg of simvastatin plus placebo, or 10 mg of simvastatin plus 15 g of psyllium. A significant LDL-C reduction (36%) was observed in the group receiving 10 mg of simvastatin plus psyllium and 20 mg of simvastatin. The authors concluded that psyllium supplementation augmented the lipid-lowering effects of the statin.
Blood pressure decreases, as does the need for medications. In a prospective study of 51,529 male health professionals followed for 5 years, Ascherio et al26 found an inverse association between incidence of hypertension and fruit fiber intake in young men, independent of age and other risk factors. Moderate but significant reductions in 24-hour monitored systolic blood pressure—by 5.9 mm Hg after psyllium27 and by 5 mm Hg after oat administration28—were reported in randomized controlled trials. A 5 mm Hg reduction of systolic blood pressure in the population would result in a 9% reduction in fatal CHD and a 7% decrease in all-cause mortality.29
Eighty-eight patients with a history of essential moderate hypertension treated with medications were randomized to consume 5.4 g/d of beta-glucan in oats or placebo for 12 weeks. Oat consumption reduced the need for blood pressure medications in 73% of participants in the treatment group, compared with 42% in the control group.30
The Seventh Report of the Joint National Committee on Prevention, Detection, Evaluation, and Treatment of High Blood Pressure recommends a dietary plan rich in fiber (24 g/1600 kcal/d) from fruits and vegetables among other life style modifications to treat hypertension.29
Insulin sensitivity improves and HbA1c drops. Foods rich in viscous soluble fiber lower glycemic index compared with reference food in healthy people and in patients with type II diabetes.31,32 In a randomized trial, barley meal enriched with 1.5 to 15 g of viscous soluble fiber reduced postprandial glucose concentration by 19% to 28% compared with wheat bread, and by 15% to 30% compared with glucose solution.31 Consumption of barley meal containing 3.5 g of soluble viscous fiber improved insulin sensitivity as assessed by the standard oral glucose tolerance test; it significantly reduced fasting insulin by 11.5% and postprandial increase in plasma glucose levels by 8.3%, and increased glucose disappearance by 7.5%.33
In patients with diabetes, postprandial glucose was significantly less by 10.6% after a meal of barley bread compared with control wheat bread.32 Intake of barley bread with 5.2 g of viscous soluble fiber for 12 weeks resulted in 20% reduced postprandial glucose response and in decreased doses of oral hypoglycemic medications.34
In a meta-analysis of 12 clinical trials, diets moderate in carbohydrate intake with increased consumption of foods rich in fiber provided the best control of fasting blood glucose and a significant decrease in glycosylated hemoglobin (HbA1c) in patients with diabetes.35
TABLE 2
Viscous soluble fiber reduces LDL-cholesterol (results of RCTs)
| STUDY POPULATION | VISCOUS SOLUBLE FIBER SOURCE | DOSE (G/D) | LDL-C REDUCTION (%) MEAN (95% CI) | ESTIMATED CVD EVENT REDUCTION (%) MEAN (95% CI) |
|---|---|---|---|---|
| Hypercholesterolemic men and women (656)19 | Psyllium | 10 | 7 (5-9) | 7 (5-9) |
| Hypercholesterolemic men (404)20 | Psyllium | 3–12 | 9 (7-10) | 9 (7-10) |
| Hypercholesterolemic men and women (150)21 | Oat* | 1.2–6 | 16 (14-25) | 16 (14-25) |
| Healthy men and women (236)22 | Oat* | 2.2 | 8 (2-13) | 8 (2-13) |
| Healthy men and women (208)23 | Oat* | 2.4–3.3 | 5 | 5 (3-7) |
| Healthy men and women (245)24 | Oat* | 2.4 | 9 | 9 (5-12) |
| *The dose of beta-glucan in oats. | ||||
CVD events decline with soluble-fiber diets, and diverse fiber sources yield equivalent effects
TABLE 3 summarizes findings from prospective observational studies of adults followed for more than 5 years to evaluate the incidence of CVD in groups consuming different kinds of dietary fiber. These studies show that risk reduction is consistent in different populations and with different sources of dietary fiber,4,36-38 regardless of patient age, gender, treatment status, smoking, and other risk factors for CVD.
In a pooled analysis of 10 large cohort studies, an additional intake of 10 g/d of fruit fiber reduced the risk of CHD death by 30%.4
The Women’s Health Study followed health professionals for 6 years and reported that an increase of 4.9 g/d of viscous soluble fiber was associated with a 44% reduction in myocardial infarction incidents.38
Among participants in the National Health and Nutrition Examination Survey (NHANES) I Follow-up Study, each 5 g/d increase in viscous soluble fiber intake diminished the risk of CVD by 6% and coronary heart disease by 8%.37
Estimated risk reduction is adjusted for all known risk factors of CVD; therefore it is independent of Framingham baseline CHD risk.
For another perspective on the evidence for fiber preventing CVD events, consider the number needed to treat (NNT) with increased fiber intake to prevent the particular CVD-related patient outcome for each study (TABLE 3). Based on the findings of Pereira and colleagues’ pooled cohort study,4 among persons at less than 5% risk for CHD according to the Framingham baseline,1 67 subjects (95% CI, 44–182) need to increase their fruit fiber intake by 10 g/d to prevent 1 CHD death. For persons at baseline CHD risk greater than 20%, the NNT is reduced to 17 (95% CI, 11–45). In the Women’s Health Study, an additional 4.9 g/d of viscous soluble fiber intake among 45 women (95% CI, 31–167) was estimated to prevent 1 CHD event.36
TABLE 3
Increased daily fiber consumption, regardless of source, reduces risk for cardiovascular disease
| STUDY SAMPLE (N) | INCREMENTAL INCREASE IN FIBER DOSE (G/D) | OUTCOME | RR | 95% CI | NNT BASELINE RISK 5% (LOW)* | 95% CI | NNT BASELINE RISK 20% (HIGH)* | 95% CI |
|---|---|---|---|---|---|---|---|---|
| Pereira4 91,058 men 245,186 women | 10 g total fiber | CHD event | 14 | 4–22 | 143 | 91–500 | 36 | 23–125 |
| CHD death | 27 | 13–39 | 74 | 51–154 | 19 | 13–38 | ||
| 10 g fruit fiber | CHD event | 16 | 1–30 | 125 | 67–2000 | 31 | 17–500 | |
| CHD death | 30 | 11–45 | 67 | 44–182 | 17 | 11–45 | ||
| 10 g cereal fiber | CHD death | 25 | 9–37 | 80 | 54–222 | 20 | 14–56 | |
| Women's Health Study (39,876)36 | 13.8 g total fiber | CVD event | 35 | 16–49 | 57 | 41–125 | 14 | 10–31 |
| MI | 54 | 28–70 | 37 | 29–71 | 9 | 7–18 | ||
| 4.9 g viscous soluble fiber | CVD event | 26 | 4–43 | 77 | 47–500 | 19 | 12–125 | |
| MI | 44 | 12–64 | 45 | 31–167 | 11 | 8–42 | ||
| US Males (43,757)37 | 16.5 g total fiber | MI (nonfatal) | 35 | 12–51 | 57 | 39–167 | 14 | 10–42 |
| CHD death | 55 | 28–72 | 36 | 28–71 | 9 | 7–18 | ||
| 10 g cereal fiber | MI event | 27 | 6–43 | 74 | 47–333 | 19 | 12–83 | |
| NHANES I Follow up (9776)38 | 10 g total fiber | CHD event | 8 | 2–14 | 250 | 143–1000 | 63 | 36–250 |
| CVD event | 7 | 3–11 | 286 | 182–667 | 71 | 45–167 | ||
| 5 g viscous soluble fiber | CHD event | 8 | 3–13 | 250 | 154–667 | 63 | 38–167 | |
| CHD death | 9 | 1–17 | 222 | 118–2000 | 56 | 29–500 | ||
| CVD event | 6 | 1–10 | 333 | 200–2000 | 83 | 50–500 | ||
| RR, relative risk reduction, defined as (relative risk-1) ×100%; NNT, number needed to treat to prevent 1event; CI, confidence interval; CVD, cardiovascular disease; CHD, coronary heart disease; MI, myocardial infarction | ||||||||
| NNT=1/p*(1-RR) –p is the typical event risk without treatment (Systematic Reviews in Health Care: Meta-Analysis in Context, Egger M, Smith GD, Altman DG (eds). London: BMJ, 2001:333 | ||||||||
| *Baseline risk is obtained from the Framingham risk calculator, a probability less than 5% to have heart attack during next 10 years is defined as a low risk, a probability more than 20% is defined as a high risk | ||||||||
What should patients eat to increase viscous soluble fiber?
The 2005 Dietary Guidelines for Americans recommend a daily intake of 14 g of total dietary fiber for every 1000 kcal consumed.2 This would include 2.5 to 6.5 cups of fruits and vegetables and at least three 1-ounce servings of whole-grain foods daily.39-42 Common foods and their dietary total and soluble fiber content per serving are listed in FIGURE 1, which is a modified nutrition prescription from the American Academy of Family Physicians (familydoctor.org/298.xml) incorporating the recommendations for viscous soluble fiber intake from guidelines discussed in this paper.1-3,6
Four servings per day of the FDA-recommended whole oats (0.75 g per serving of viscous soluble fiber) and psyllium (1.78 g per serving) are required to reduce CVD risk.10,11
An estimated 23% of Americans eat 2 to 3 servings a day of whole grains and 4 to 5 servings a day of fruits and vegetables (all sources of viscous soluble fiber). Healthy People 2010 has called for this proportion to increase to 50% to 75%.6
FIGURE 1
Common foods high in fiber for a nutrition prescription*
Ways to approach dietary counseling
The USPSTF found good evidence that, for adult patients at increased risk for diet-related chronic disease, medium- to high-intensity counseling improves the average daily intake of core components of a healthy diet (including saturated fat, fiber, fruit, and vegetables).7 It recommends that clinicians routinely provide intensive behavioral counseling to promote a healthy diet in adult patients with hyperlipidemia and other known risk factors for cardiovascular diseases. It found no evidence sufficient to recommend for or against routine counseling of unselected patients in primary care.
Both USPSTF7 and Adult Treatment Panel III1 offer frameworks to engage patients in therapeutic lifestyle changes.
USPSTF recommends the “5-A” framework to behavioral counseling7:
Assess dietary practices and related risk factors
Advise to change dietary practices
Agree on individual diet change goals
Assist to change dietary practices
Arrange regular follow-up and support for refer to more intensive behavioral nutritional counseling (eg, medical nutrition therapy) if needed.
Physicians may use face-to-face and interactive health communications, staff-performed education, and nutritional prescriptions (FIGURE 1) to influence patients’ food choices that increase dietary fiber consumption and achieve the doses recommended for adults at risk of CVD.7,43
Low-intensity interventions involve 5 minutes of professional counseling supplemented by patient self-help materials, telephone counseling, or other interactive health communications via Internet.44,45
Medium-intensity interventions involve face-to-face dietary counseling (2 to 3 group or individual sessions) delivered by a dietitian or a specially trained primary care physician.
High-intensity interventions yield the largest effect. These involve multiple sessions lasting 30 minutes or longer7 and use office-level supports and algorithms to estimate the baseline risk of CVD, individual calorie and nutrients intake, and energy expenditure.45
The Adult Treatment Panel III outlines a model for initiating and monitoring dietary therapy for adults with risk of CVD (FIGURE 2). You may start by assessing the risk of CVD with Framingham scores and current dietary patterns, then counsel patients directly or engage dietitians to help patients institute therapeutic lifestyle changes. After 6 weeks of the therapeutic diet, repeat the lipoprotein examination to determine recommendations to continue or intensify the lifestyle changes. After another 6 weeks, you may consider adding drug therapy and further reinforcing dietary recommendations.
Regardless of the approach you use to assess a patient’s diet, a comprehensive individualized nutritional prescription will effectively increase daily intake of dietary fiber, with success similar to that achieved in a major randomized clinical trial.46
FIGURE 2
ATP III guidance on initiating dietary changes: Determine your patient’s 10-year risk for CVD
Acknowledgments
The authors thank Heather Haley, MS for editing the manuscript, and Elizabeth Greene, for her help in its preparation. Dr. Shamliyan thanks Professor E. B. Arushanian, MD, PhD, Department of Pharmacology, Stavropol Medical Academy, Russia for motivating her enthusiasm for scientific research.
CORRESPONDENCE
Joseph M. Keenan, MD, Department of Family Medicine and Community Health, University of Minnesota Medical School, MMC 381, 420 Delaware Street SE, Minneapolis, MN 55455. E-mail: [email protected]
1. Grundy SM (ed). Report of the National Cholesterol Education Program (NCEP) on Detection, Evaluation, and Treatment of High Blood Cholesterol in Adults (Adult Treatment Panel III) Third and Final Report. Collingdale, Pa: DIANE Publishing Company; 2002.
2. Krauss RM, Eckel RH, Howard B, et al. AHA Dietary Guidelines: revision 2000: A statement for healthcare professionals from the Nutrition Committee of the American Heart Association. Circulation 2000;102:2284-2299.
3. US Department of Health and Human Services and Department of Agriculture. Dietary Guidelines Advisory Committee. Dietary Guidelines for Americans, 2005. 6th ed. Washington, DC: US Government Printing Office; 2005. Available at www.mypyramid.gov/.
4. Pereira MA, O’Reilly E, Augustsson K, et al. Dietary fiber and risk of coronary heart disease: a pooled analysis of cohort studies. Arch Intern Med 2004;164:370-376.
5. Institute of Medicine (US). Standing Committee on the Scientific Evaluation of Dietary Reference Intakes. Dietary Reference Intakes for Energy, Carbohydrate, Fiber, Fat, Fatty Acids, Cholesterol, Protein, and Amino Acids (Macronutrients). Washington, DC: National Academy Press; 2003.
6. US Department of Health and Human Services. Healthy People 2010: Understanding and Improving Health. Volume 1, 2nd ed. Washington, DC: US Government Printing Office; 2000.
7. Snow V (ed) Clinical Practice: American College of Physicians Guidelines and U.S. Preventive Services Task Force Recommendations. Philadelphia, Pa: American College of Physicians; 2005.
8. The definition of dietary fiber. Cereal Foods World 2001;46:112-127.
9. Marlett JA, McBurney MI, Slavin JL. American Dietetic Association. Position of the American Dietetic Association: health implications of dietary fiber. J Am Diet Assoc 2002;102:993-1000.
10. US Food and Drug Administration, Department of Health and Human Services. Food labeling: health claims; soluble dietary fiber from certain foods and coronary heart disease. Interim final rule. Fed Regist 2002;67:61773-61783.
11. US Food and Drug Administration, Department of Health and Human Services. Food labeling: health claims; soluble dietary fiber from certain foods and coronary heart disease. Final rule. Fed Regist 2003;68:44207-44209.
12. Andersson M, Ellegard L, Andersson H. Oat bran stimulates bile acid synthesis within 8 h as measured by 7alpha-hydroxy-4-cholesten-3-one. Am J Clin Nutr 2002;76:1111-1116.
13. Jenkins DJA, Wolever TMS, Vidgen E, et al. Effect of psyllium in hypercholesterolemia at two monounsaturated fatty acid intakes. Am J Clin Nutr 1997;65:1524-1533.
14. Marlett JA, Hosig KB, Vollendorf NW, et al. Mechanism of serum cholesterol reduction by oat bran. Hepatology 1994;20:1450-1457.
15. Marcil V, Delvin E, Seidman E, et al. Modulation of lipid synthesis, apolipoprotein biogenesis, and lipoprotein assembly by butyrate. Am J Physiol Gastrointest Liver Physiol 2002;283:G340-346.
16. Wolever TM, Mehling C. High-carbohydrate-low-glycaemic index dietary advice improves glucose disposition index in subjects with impaired glucose tolerance. Br J Nutr 2002;87:477-487.
17. Ripsin CM, Keenan JM, Jacobs DR, Jr, et al. Oat products and lipid lowering. A meta-analysis. JAMA 1992;267:3317-3325.
18. Brown L, Rosner B, Willett WW, et al. Cholesterol-lowering effects of dietary fiber: a meta-analysis. Am J Clin Nutr 1999;69:30-42.
19. Olson BH, Anderson SM, Becker MP, et al. Psyllium-enriched cereals lower blood total cholesterol and LDL cholesterol, but not HDL cholesterol, in hypercholesterolemic adults: results of a meta-analysis. J Nutr 1997;127:1973-1980.
20. Anderson JW, Allgood LD, Lawrence A, et al. Cholesterol-lowering effects of psyllium intake adjunctive to diet therapy in men and women with hypercholesterolemia: meta-analysis of 8 controlled trials. Am J Clin Nutr 2000;71:472-479.
21. Davidson MH, Dugan LD, Burns JH, et al. The hypocholesterolemic effects of beta-glucan in oatmeal and oat bran. A dose controlled study. JAMA 1991;265:1833-1839.
22. Van Horn L, Emidy LA, Liu KA, et al. Serum lipid response to a fat-modified, oatmeal-enhanced diet. Prev Med 1988;17:377-386.
23. Van Horn LV, Liu K, Parker D, et al. Serum lipid response to oat product intake with a fat-modified diet. J Am Diet Assoc 1986;86:759-764.
24. Van Horn L, Liu K, Gerber J, et al. Oats and soy in lipid-lowering diets for women with hypercholesterolemia: is there synergy? J Am Diet Assoc 2001;101:1319-1325.
25. Moreyra AE, Wilson AC, Koraym A. Effect of combining psyllium fiber with simvastatin in lowering cholesterol. Arch Intern Med 2005;165:1161-1166.
26. Ascherio A, Rimm EB, Giovannucci EL, et al. A prospective study of nutritional factors and hypertension among US men. Circulation 1992;86:1475-1484.
27. Burke V, Hodgson JM, Beilin LJ, et al. Dietary protein and viscous soluble fiber reduce ambulatory blood pressure in treated hypertensives. Hypertension 2001;38:821-826.
28. Saltzman E, Das SK, Lichtenstein AH, et al. An oat-containing hypocaloric diet reduces systolic blood pressure and improves lipid profile beyond effects of weight loss in men and women. J Nutr 2001;131:1465-1470.
29. Chobanian AV, Bakris GL, Black HR, et al. Joint National Committee on Prevention, Detection, Evaluation, and Treatment of High Blood Pressure. National Heart, Lung, and Blood Institute; National High Blood Pressure Education Program Coordinating Committee. Seventh report of the Joint National Committee on Prevention, Detection, Evaluation, and Treatment of High Blood Pressure. Hypertension 2003;42:1206-1252.
30. Pins JJ, Geleva D, Keenan JM, et al. Do whole-grain oat cereals reduce the need for antihypertensive medications and improve blood pressure control? J Fam Pract 2002;51:353-359.
31. Cavallero A, Empilli S, Brighenti F, et al. High (1 -> 3,1 -> 4)-β-glucan barley fractions in bread making and their effects on human glycemic response. J Cereal Science 2002;36:59-66.
32. Urooj A, Vinutha SR, Puttaraj S, et al. Effect of barley incorporation in bread on its quality and glycemic responses in diabetics. Int J Food Sci Nutr 1998;49:265-270.
33. Thorburn A, Muir J, Proietto J. Carbohydrate fermentation decreases hepatic glucose output in healthy subjects. Metabolism 1993;42:780-785.
34. Pick ME, Hawrysh ZJ, Gee MI, et al. Barley bread products improve glycemic control of type 2 subjects. Int J Food Sci Nutr 1998;49:71-78.
35. Anderson JA, Randles KM, Kendall CW, et al. Carbohydrate and fiber recommendations for individuals with diabetes: A quantitative assessment and meta-analysis of the evidence. J Am Coll Nutr 2004;23:5-17.
36. Liu S, Buring JE, Sesso HD, et al. A prospective study of dietary fiber intake and risk of cardiovascular diseases among women. J Am Coll Cardiol 2002;39:49-56.
37. Rimm EB, Ascherio A, Giovannucci E, et al. Vegetable, fruit, and cereal fiber intake and risk of coronary heart disease among men. JAMA 1996;275:447-451.
38. Bazzano LA, He J, Ogden LG, et al. Dietary fiber intake and reduced risk of coronary heart disease in US men and women: the National Health and Nutrition Examination Survey I Epidemiologic Follow-up Study. Arch Intern Med 2003;163:1897-1904.
39. Li BW, Andrews KW, Pehrsson PR. Individual sugars, soluble, and insoluble dietary fiber contents of 70 high consumption foods. J Food Composition Analysis 2002;15:715-723.
40. Marlett JA. Content and composition of dietary fiber in 117 frequently consumed foods. J Am Diet Assoc 1992;92:175-186.
41. Anderson JW, Bridges SR. Dietary fiber content of selected foods. Am J Clin Nutr 1988;47:440-447.
42. National Cholesterol Education Program, National Heart, Lung, and Blood Institute, National Institutes of Health. Food sources of soluble fiber. Available at: www.nhlbi.nih.gov/chd/Tipsheets/solfiber.htm. Accessed on April 28, 2006.
43. Truswell AS, Hiddink GJ, Blom J. Nutrition guidance by family doctors in a changing world: problems, opportunities, and future possibilities. Am J Clin Nutr 2003;77(Suppl):1089S-1092S.
44. van Woerkum CM. The Internet and primary care physicians: coping with different expectations Am J Clin Nutr 2003;77(Suppl):1016S-1018S.
45. US Department of Agriculture, Center for Nutrition Policy and Promotion. Steps to a Healthier You. Alexandria, VA: 2005. Available at: www.mypyramid.gov/. Accessed on April 28, 2006.
46. McCarron DA, Oparil S, Chait A, et al. Nutritional management of cardiovascular risk factors. A randomized clinical trial. Arch Intern Med 1997;157:169-177.
Knee osteoarthritis: Should your patient opt for hyaluronic acid injection?
- Hyaluronic acid (HA) injection may provide short-term relief of pain and improved functionality for patients with osteoarthritis of the knee, but benefits do not last beyond 6 months.
- Examine the HA option from a cost-benefit perspective on a case-by-case basis. Based on our meta-analysis, there is no sufficient reason to recommend or not recommend HA injection for treatment of osteoarthritis of the knee.
- You may want to help select patients weigh the possible benefit of HA therapy against its cost.
Though hyaluronic acid may reduce symptoms related to osteoarthritis of the knee, the relatively small and transient response in the population studied in our analysis does not provide sufficient reason to recommend or not recommend this therapy.
Those who might want to opt for hyaluronic acid injections
With the relatively low risk of complications, some patients may still opt to try hyaluronic acid injections as opposed to other osteoarthritis management strategies. Potential candidates include those whose only other option is surgery, in the hope that HA injection might postpone having to make that decision. Also, those whose pain or stiffness have not been relieved with other therapies might want to consider HA.
Two instruments for assessing osteoarthritis
There are many claims to the efficacy of hyaluronic acid injections for decreasing the pain associated with osteoarthritis of the knee. This meta-analysis was an attempt to collapse the data for hyaluronic acid treatment, using a reduction in score on the Western Ontario McMaster Universities Index (WOMAC) or the Lequesne index as its outcome measurement.
The WOMAC is a disease-specific, self-administered instrument for patients with osteoarthritis of the knee or hip. It has 3 separate dimensions (with 24 individual scenarios), measuring pain (5 scenarios), stiffness (2 scenarios), and physical function (17 scenarios). It may be administered using a 100 mm/10 cm visual analog scale (VAS) (where 0=none, 100 or 10=extreme) or a Likert scale (0 to 4, where 0=none, 4=extreme). These results are then scored on a 0 to 20 scale for pain, a 0 to 8 scale for stiffness, and a 0 to 68 scale for physical function. Lower scores for both scales indicate a lesser degree of pain, stiffness, or physical dysfunction. In a double-blind, randomized controlled trial, WOMAC was found to be a valid and reliable tool for determining self-reported status for osteoarthritis of the knee or hip.12
Osteoarthritis is a degenerative, debilitating disease that affects approximately 20.7 million adults in the United States.1 It is the degeneration of the articular cartilage at synovial joints. There seems to be a genetic predisposition to developing osteoarthritis, although most people tend to experience some pain in their joints as they age, usually starting in their 30s or 40s.2 Some elite athletes have even been reported as having arthritic changes in their 20s.3 Unfortunately, many factors may contribute to the pathological state of each person affected, making each case unique. It can be the result of general wear and tear at the joint, structural malalignments, or injury.4 With the surge in the elderly population, a more effective management strategy for osteoarthritis will improve quality of life and reduce health costs for many.
Hyaluronic acid, a normal component of synovial joints, the linear repeating polysaccharide that forms the central axis of proteoglycan aggregates, which are necessary for functional integrity of the articular cartilage.5 It is involved in joint lubrication and nutrition. Native hyaluronic acid increases the viscosity of the extracellular matrix, thereby increasing the load-dispersion properties of the articular cartilage. Arthritic articular cartilage tends to have a decreased concentration of naturally occurring hyaluronic acid.
Unfortunately, injection of hyaluronic acid does not appear to restore the properties that native hyaluronic acid provides to the articular cartilage. A treatment series of intra-articular injections of hyaluronic acid has been reported to decrease the pain associated with osteoarthritis and provide patient relief.6 It has also been reported that residual benefits may last for months after the last injection.7-9 One of the first reported trials of hyaluronic acid injections for treatment of osteoarthritis came in 1974.10 Subsequently, in 1982, a report was published on the therapeutic effect as a result of hyaluronic acid injection into the knee.11 By 1991, some of the first randomized, controlled trials of hyaluronic acid were reported.
Several different chemical compositions of hyaluronic acid are used for the treatment. Though similar, dosage depends on the specific chemical properties of each. A usual dosage is 3 to 5 injections, with the patient receiving 1 injection per week.
The Lequesne index is a 10-question interview-style survey given to patients with osteoarthritis of the knee. It has 5 questions pertaining to pain or discomfort, 1 question dealing with maximum distance walked, and 4 questions about activities of daily living. The total questionnaire is scored on a 0 to 24 scale, with lower scores meaning less functional impairment. A study by Faucher et al13 found the Lequesne index to be a reliable questionnaire.
Methods
Selection of studies
Two researchers (JM and AT) performed a computerized literature search of PubMed (1950–2004), CINAHL (1982–2004), and Medline (1966–2004) to identify citations concerning the efficacy of hyaluronic acid injection for management of osteoarthritis of the knee. Four separate searches were conducted. The first used the terms knee, osteoarthritis, WOMAC, and hyaluronic acid. The second used the same terms as the first, replacing WOMAC with Lequesne. The third and fourth searched WOMAC and validity and Lequesne and validity, respectively. All 4 searches were limited to human randomized clinical trials, in English-language journal reports. A hand search of the reference lists of all retrieved studies was performed to ensure that no eligible studies were excluded.
Studies were selected independently by the same 2 researchers. The search was performed independently to ensure an exhaustive review of the literature. All studies were considered eligible until disqualified based on exclusion criteria.
Studies were eligible for inclusion if they addressed hyaluronic acid injection for osteoarthritis at the knee and used the WOMAC or Lequesne indexes as outcomes measurements. It was also necessary that they provided means and standard deviations in order to perform statistical analysis. We attempted to contact authors who did not provide necessary statistics for meta-analysis; however, we received no responses.
Assessment of methodological quality and data abstraction
The methodological quality of each study was assessed independently by the reviewers using the Physiological Evidence Database (PEDro) rating scale.14 It was determined that studies must include a control group that used placebo saline injections, provide means and standard deviations at baseline for the WOMAC or Lequesne, and also means and standard deviations after the intervention for both the treatment and control groups.
All abstracted data were converted into a percentage of the total possible score for each outcome measurement using a method described by a statistical consultant and an algorithm developed by one investigator (JM) using MATLAB 7.0 (MathWorks, Inc, Natick, Mass). This allowed for comparison between results of the WOMAC and Lequesne studies. This also allowed for comparison to the results of the Wang et al15 meta-analysis.
Statistical analysis
Homogeneity of the included studies, as determined by inclusion and exclusion criteria, allowed for meta-analysis. One meta-analysis was performed on the 3 studies that used the WOMAC scale,16-18 2 on the 4 studies that used the Lequesne index.7-9,19 Most studies that used the Lequesne index reported outcomes for a variety of follow-up points (4, 5, 8, 20, 24, 26, 49, 52 weeks); however, there was not a consistent reporting timeline among these studies. We grouped the follow-up reports into “up to 6 months post-treatment” and “6 months or greater post-treatment.” The first Lequesne analysis evaluated the difference between treatment and placebo groups at with data points less than 6 months post-treatment. The second Lequesne analysis examined the difference between groups at 6 months and greater post-treatment. In the study by Karlsson,7 2 different but similar types of hyaluronic acid were used. These groups were separated and analyzed as independent studies; 95% confidence intervals were calculated for all analyses. Effect sizes were also calculated to determine the between-group effect of the treatment and placebo.
Results
Selection of studies
The literature search resulted in 35 potentially eligible studies, of which 7 were selected after application of the inclusion criteria.7-9,16-19 Three of the selected studies used the WOMAC as an outcome assessment tool,16-18 4 used the Lequesne index.7-9,19 The remaining 28 studies were excluded. TABLE W1 details the rejection of studies.
Methodological quality and study characteristics
Each investigator then independently scored the methodological quality for the remaining studies by using the PEDro scale.14 There was total agreement for all studies in regards to the PEDro score. No study received a score under 5. The average PEDro rating among the studies was 8.2 out of 10.
Homogeneity
All groups across all included studies were similar at baseline. All patients had mild to severe osteoarthritis of the knee. Mean ages of the groups were similar (treatment groups=67.1 years, placebo=66.7 years). Not all patients received treatment as per manufacturer’s recommendations ( TABLES 1 AND 2 ). A saline placebo was used for control groups in all studies. The volume of saline placebo for each study was equal to volume of hyaluronic acid injection plus saline vehicle used for that study. All studies used either the WOMAC scale or the Lequesne Functional Index as an outcome measurement tool. All studies included a follow-up outcome measurement; however, the range of follow-up time periods was wide (4 to 52 weeks).
Meta-analysis
The analysis for the outcome measurements on the WOMAC scale revealed no significant difference between groups in regards to pain or disability (95% confidence interval [CI] for pain, –0.6043 to 5.4755; for disability, –0.8282 to 4.8619). The outcome measurement for stiffness demonstrated a significant difference between treatment and control (95% CI for stiffness, 2.1780 to 8.7955).
The analysis for the outcome measurement on the Lequesne index revealed a significant difference between groups for measurements taken up to 6 months post-treatment (95% CI, 1.2315 to 2.6268). However, these differences were not seen in the 6+ month outcomes analysis (95% CI, –.8489 to .04787]. Confidence intervals are presented in FIGURE 1 . Mean differences for each outcome at baseline and post-treatment between the active treatment and placebo are presented in TABLE 3 .
TABLE 1
Hyaluronic acid: Manufacturer’s recommendations
| HA BRAND | ARTZAL | SYNVISC | HYALGAN | DUROLANE | SUPLASYN | NRD101 |
|---|---|---|---|---|---|---|
| Number of injections (given 1 week apart) | 5 | 3 | 5 | 1 | 3 | N/A |
| Concomitant local anesthetic injection recommended | Yes | No* | Yes | NR | N/A | N/A |
| Aspiration recommended prior to injection | Yes | Yes | Yes | Yes | No | N/A |
| Dosage per injection (mg) | 25.0 | 32.0 | 40.0 | 60.0 | 20.0 | 25.0 |
| Molecular weight (kDa) | 620–1170 | 6000 | 500–730 | N/A | N/A | 1900 |
| Cross-linked | No | Yes | No | Yes | No | N/A |
| HA, hyaluronic acid; NR, not reported; N/A, not available. | ||||||
| * Purported to alter the efficacy of Synvisc. | ||||||
TABLE 2
Details of included studies
| STUDY | KARLSSON ET AL7 | DOUGADOS ET AL8 | HUSKISSON9 | DAY ET AL16 | ALTMAN ET AL17 | PETRELLA ET AL18 | PHAM ET AL19 | |
|---|---|---|---|---|---|---|---|---|
| Brand | Artzal | Synvisc | Hyalgan | Hyalgan | Artzal | Durolane | Suplasyn | NRD101 |
| Number of injections | ||||||||
| given 1 wk apart | 3 | 3 | 4 | 5 | 5 | 1 | 3 | 3* |
| Mfr’s recommendations | 5 | 3 | 5 | 5 | 5 | 1 | 3 | NA |
| Concomitant local anaesthetic injection | NR | NR | NR | NR | Yes | NR | NR | Yes |
| Aspiration prior to injection | NR | NR | Yes | NR | Yes | NR | NR | Yes |
| Dosage per injection (mg) + vehicle† | 25/2.5 mL saline | 32/2.5 mL saline | 20/2.0 mL saline | 20/2.0 mL saline | 25/2.5 mL saline | 60/3.0 mL saline | 20/2.0 mL saline | 25/2.5 mL saline |
| Cross-linked | No | Yes | No | No | No | Yes | NR | NR |
| NR=not reported | ||||||||
| * Given as 3 courses every 3 months of 3 weekly injections | ||||||||
| † Volume of saline placebo for each study equal to volume of hyaluronic acid injection plus saline vehicle used for that study | ||||||||
FIGURE 1
Hyaluronic acid vs control: 95% confidence intervals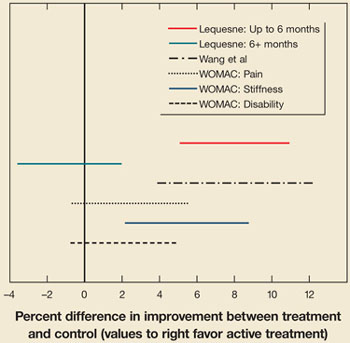
Confidence intervals that cross the 0-value represent a nonsignificant difference between active treatment and control. Also included is a result from the Wang et al meta-analysis15 for comparison.
TABLE 3
Mean improvements: treatment vs. control
| BASELINE | POST-TREATMENT | |||
|---|---|---|---|---|
| HA | PLACEBO | HA | PLACEBO | |
| LEQUESNE | 12.7 (3.0) | 12.44 (2.7) | 8.7 (4.4) | 8.91 (4.4) |
| % Lequesne* | 53.0 (12.8) | 51.83 (11.2) | 36.3 (18.5) | 37.1 (18.1) |
| WOMAC | ||||
| Pain* | 40.5 (17.0) | 43.9 (19.0) | 26.8 (18.3) | 30.9 (21.6) |
| Stiffness* | 47.0 (17.6) | 50.9 (21.1) | 33.0 (21.4) | 42.8 (24.0) |
| Disability* | 42.5 (18.6) | 46.8 (22.2) | 27.9 (19.0) | 33.3 (21.8) |
| The mean (standard deviation) change among included studies in outcomes scores between baseline and post-treatment at the final collection point for hyaluronic acid and placebo. An increase in outcome score represents improvement. | ||||
| * Normalized to a maximal score of 100 possible points | ||||
FIGURE 2
Comparing effect sizes of hyaluronic acid therapy and saline placebo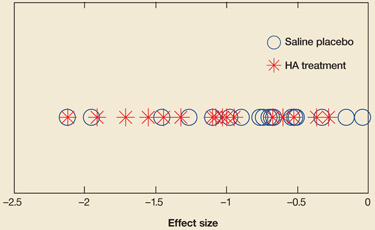
Across studies, effect sizes were similar for hyaluronic acid therapy and placebo.
Discussion: Benefits are limited
Based on this meta-analysis, we cannot conclude that hyaluronic acid performs better than saline placebo for a reduction of pain or disability on the WOMAC. Some indication may be warranted for reduction in stiffness. It is notable that hyaluronic acid injection and saline placebo groups both experienced an improvement in pain, stiffness, and disability scores on the WOMAC.
We also cannot conclude that hyaluronic acid enhances functionality as evaluated on the Lequesne Index past 6 months post-treatment. In 2 studies,7,19 patients with placebo actually showed reduced disability compared with patients in the hyaluronic acid group. While a short-term improvement in functionality was observed in other studies, this effect was not seen in follow-up reports greater than 6 months.
Comparisons with other meta-analyses
A recently published meta-analysis by Modawal et al20 also pooled data to compare hyaluronic acid treatment to saline placebo. That meta-analysis was similar to ours in that it had relatively small sample size (n=11) and examined self-reported patient outcomes as the item of interest. The difference between this meta-analysis and ours is that the length of the evaluation periods for the other analysis was fairly short; the longest follow-up was 26 weeks. Our study examined the pooled effects of hyaluronic acid carried out to at least 24 weeks and up to 52 weeks. Their results for the short-term outcomes demonstrated significant decrease in pain in the active treatment group; however, these results diminished considerably when controlled for study quality.
Our meta-analysis was not consistent with a previous meta-analysis of hyaluronic acid treatment with regard to pain relief and reduction of disability. This study15 revealed that hyaluronic acid has a therapeutic effect on osteoarthritis of the knee, specifically decreasing pain and disability. The analysis included 20 studies, but differed from ours in that it failed to control for between-group heterogeneity and used an original formula to derive mean differences in efficacy scores between hyaluronic acid and placebo. Each study in our meta-analysis used an identical method for reporting outcome scores. Our study also synthesized the original data values as reported in each original study.
In addition, our results have to be interpreted with attention to a large effect of saline injection, which were much greater than the expected effect of placebo. Calculated effect sizes demonstrated similar effects for both treatment and placebo groups, with no clustering that was different between groups ( FIGURE 2 ). Treatment and placebo groups showed equal response when evaluated for greatest effect.
Refocusing research
The effects of hyaluronic acid injection appear to be transient and offer only slight improvement for older patients with mild to advanced osteoarthritis. Attention should be given to other groups, including younger patients and patients with mild degenerative changes. These studies should attempt to better stratify patient groups to identify those who are most likely to benefit from intervention. In addition, there must be better reporting of treatment protocols and results will allow clinicians to make rational decisions regarding treatments.
Cost and side effects
Consider the degree of benefit and costs when making treatment decisions. The average treatment cost was approximately $900 in 2003.21 Obviously one issue is whether a patient’s insurance provider will pay for the treatment.
Side effects are uncommon, and complications with hyaluronic acid injections have been relatively mild.
A few cases of hyaluronic acid allergy have been reported,22 including sweating, paleness, feelings of pressure in the chest and stomach, skin turning blue, or a decrease in blood pressure.22
Acknowledgments
The authors would like to thank Esra Akdeniz from the Statistical Consulting Center at the Pennsylvania State University for assistance with the methods for performing statistical meta-analysis.
CORRESPONDENCE
Jennifer M. Medina, 146 Recreation Building, University Park, PA 16802. E-mail: [email protected]
1. Lawrence RC, Helmick CG, Arnett FC, et al. Estimates of the prevalence of arthritis and selected musculoskeletal disorders in the United States. Arthritis Rheum 1998;41:778-799.
2. Sharma L, Kapoor D, Issa S. Epidemiology of osteoarthritis: an update. Curr Opin Rheumatol 2006;18:147-156.
3. Neyret P, Donell ST, Dejour H. Results of partial meniscectomy related to the state of the anterior cruciate ligament. Review at 20 to 35 years. J Bone Joint Surg Br 1993;75:36-40.
4. Moskowitz RW, Kelly MA, Lewallen DG. Understanding osteoarthritis of the knee-causes and effects. Am J Orthop 2004;33:5-9.
5. Walsh DA, Sledge CB, Blanke DR. Biology of the normal joint. In: Kelley WN, Ruddy W, Harris ED Jr, Sledge CB, eds. Textbook of Rheumatology. Vol 1. 5th ed. Philadelphia, PA: W.B. Saunders Company;1997:1-26.
6. Leardini G, Mattara L, Franceschini M, Perbellini A. Intra-articular treatment of knee osteoarthritis. A comparative study between hyaluronic acid and –methyl prednisolone acetate. Clin Exp Rheumatol 1991;9:375-381.
7. Karlsson J, Sjogren LS, Lohmander LS. Comparison of two hyaluronan drugs and placebo in patients with knee osteoarthritis. A controlled, randomized, double-blind, parallel-design multicentre study. Rheumatology. 2002;41:1240-1248.
8. Dougados M, Nguyen M, Listrat V, Amor B. High molecular weight sodium hyaluronate (hyalectin) in osteoarthritis of the knee: a 1 year placebo-controlled trial. Osteoarthritis Cartilage 1993;1:97-103.
9. Huskisson EC, Donnelly S. Hyaluronic acid in the treatment of osteoarthritis of the knee. Rheumatology 1999;38:602-607.
10. Peyron JG, Balazs EA. Preliminary clinical assessment of Na-hyaluronate injection into human arthritic joints. PatholBiol (Paris) 1974;22:731-736.
11. Namiki O, Toyoshima H, Morisaki N. Therapeutic effect of intra-articular injection of high molecular weight hyaluronic acid on osteoarthritis of the knee. Int J Clin Pharmacol Ther Toxicol 1982;20:501-507.
12. Bellamy N, Buchanan W, Goldsmith CH, Campbell J, Stitt LW. Validation study of WOMAC: a health status instrument for measuring clinically important patient relevant outcomes to antirheumatic drug therapy in patients with osteoarthritis of the hip or knee. J Rheumatol 1999;15:1833-1840.
13. Faucher M, Poiraudeau S, Lefevre-Colau MM, Rannou F, Fermanian F, Revel M. Algo-functional assessment of knee osteoarthritis: comparison of the test-retest reliability and construct validity of the WOMAC and Lequesne indexes. Osteoarth Cartil 2002;10:602-610.
14. PEDro Scale. Physiotherapy Evidence Database Web site. Available at: www.pedro.fhs.usyd.edu.au/scale_item.html. Accessed on February 10, 2005.
15. Wang C, Lin J, Chang C, Lin Y, Hou S. Therapeutic effects of hyaluronic acid on osteoarthritis of the knee. J Bone Joint Surg 2004;86A:538-545.
16. Day R, Brooks P, Conaghan PG, Petersen M. A double blind, randomized, multicenter, parallel group study of the effectiveness and tolerance of intra-articular hyaluronan in osteoarthritis of the knee. J Rheumatol 2004;31:775-782.
17. Altman RD, Akermark C, Beaulieu AD, Schnitzer T. Efficacy and safety of a single intra-articular injection of non-animal stabilized hyaluronic acid (NASHA) in patients with osteoarthritis of the knee. Osteoarthritis Cartilage 2004;12:642-649.
18. Petrella RJ, DiSilvestro MD, Hildebrand C. Effects of hyaluronate sodium on pain and physical functioning on osteoarthritis of the knee. Arch Intern Med 2002;162:292-298.
19. Pham T, Le Henanff A, Ravaud P, Dieppe P, Paolozzi L, Dougados M. Evaluation of the symptomatic and structural efficacy of a new hyaluronic acid compound, NRD101, in comparison with diacerein and placebo in a 1 year randomized controlled study in symptomatic knee osteoarthritis. Ann Rhem Dis 2004;63:1611-1617.
20. Modawal A, Ferrer M, Choi HK, Castle JA. Hyaluronic acid injections relieve knee pain. J Fam Pract 2005;54:758-677.
21. Kahan A, Lleu P, Salin L. Prospective randomized study comparing the medicoeconomic benefits of Hylan GF-20 vs. conventional treatment in knee osteoarthritis. Joint Bone Spine 2003;70:276-281.
22. Brandt KD, Block JA, Michalski JP, Moreland LW, Caldwell JR, Lavin PT. Efficacy and safety of intra-articular sodium hyaluronate in knee osteoarthritis. Clin Orthop 2001;385:130-143.
- Hyaluronic acid (HA) injection may provide short-term relief of pain and improved functionality for patients with osteoarthritis of the knee, but benefits do not last beyond 6 months.
- Examine the HA option from a cost-benefit perspective on a case-by-case basis. Based on our meta-analysis, there is no sufficient reason to recommend or not recommend HA injection for treatment of osteoarthritis of the knee.
- You may want to help select patients weigh the possible benefit of HA therapy against its cost.
Though hyaluronic acid may reduce symptoms related to osteoarthritis of the knee, the relatively small and transient response in the population studied in our analysis does not provide sufficient reason to recommend or not recommend this therapy.
Those who might want to opt for hyaluronic acid injections
With the relatively low risk of complications, some patients may still opt to try hyaluronic acid injections as opposed to other osteoarthritis management strategies. Potential candidates include those whose only other option is surgery, in the hope that HA injection might postpone having to make that decision. Also, those whose pain or stiffness have not been relieved with other therapies might want to consider HA.
Two instruments for assessing osteoarthritis
There are many claims to the efficacy of hyaluronic acid injections for decreasing the pain associated with osteoarthritis of the knee. This meta-analysis was an attempt to collapse the data for hyaluronic acid treatment, using a reduction in score on the Western Ontario McMaster Universities Index (WOMAC) or the Lequesne index as its outcome measurement.
The WOMAC is a disease-specific, self-administered instrument for patients with osteoarthritis of the knee or hip. It has 3 separate dimensions (with 24 individual scenarios), measuring pain (5 scenarios), stiffness (2 scenarios), and physical function (17 scenarios). It may be administered using a 100 mm/10 cm visual analog scale (VAS) (where 0=none, 100 or 10=extreme) or a Likert scale (0 to 4, where 0=none, 4=extreme). These results are then scored on a 0 to 20 scale for pain, a 0 to 8 scale for stiffness, and a 0 to 68 scale for physical function. Lower scores for both scales indicate a lesser degree of pain, stiffness, or physical dysfunction. In a double-blind, randomized controlled trial, WOMAC was found to be a valid and reliable tool for determining self-reported status for osteoarthritis of the knee or hip.12
Osteoarthritis is a degenerative, debilitating disease that affects approximately 20.7 million adults in the United States.1 It is the degeneration of the articular cartilage at synovial joints. There seems to be a genetic predisposition to developing osteoarthritis, although most people tend to experience some pain in their joints as they age, usually starting in their 30s or 40s.2 Some elite athletes have even been reported as having arthritic changes in their 20s.3 Unfortunately, many factors may contribute to the pathological state of each person affected, making each case unique. It can be the result of general wear and tear at the joint, structural malalignments, or injury.4 With the surge in the elderly population, a more effective management strategy for osteoarthritis will improve quality of life and reduce health costs for many.
Hyaluronic acid, a normal component of synovial joints, the linear repeating polysaccharide that forms the central axis of proteoglycan aggregates, which are necessary for functional integrity of the articular cartilage.5 It is involved in joint lubrication and nutrition. Native hyaluronic acid increases the viscosity of the extracellular matrix, thereby increasing the load-dispersion properties of the articular cartilage. Arthritic articular cartilage tends to have a decreased concentration of naturally occurring hyaluronic acid.
Unfortunately, injection of hyaluronic acid does not appear to restore the properties that native hyaluronic acid provides to the articular cartilage. A treatment series of intra-articular injections of hyaluronic acid has been reported to decrease the pain associated with osteoarthritis and provide patient relief.6 It has also been reported that residual benefits may last for months after the last injection.7-9 One of the first reported trials of hyaluronic acid injections for treatment of osteoarthritis came in 1974.10 Subsequently, in 1982, a report was published on the therapeutic effect as a result of hyaluronic acid injection into the knee.11 By 1991, some of the first randomized, controlled trials of hyaluronic acid were reported.
Several different chemical compositions of hyaluronic acid are used for the treatment. Though similar, dosage depends on the specific chemical properties of each. A usual dosage is 3 to 5 injections, with the patient receiving 1 injection per week.
The Lequesne index is a 10-question interview-style survey given to patients with osteoarthritis of the knee. It has 5 questions pertaining to pain or discomfort, 1 question dealing with maximum distance walked, and 4 questions about activities of daily living. The total questionnaire is scored on a 0 to 24 scale, with lower scores meaning less functional impairment. A study by Faucher et al13 found the Lequesne index to be a reliable questionnaire.
Methods
Selection of studies
Two researchers (JM and AT) performed a computerized literature search of PubMed (1950–2004), CINAHL (1982–2004), and Medline (1966–2004) to identify citations concerning the efficacy of hyaluronic acid injection for management of osteoarthritis of the knee. Four separate searches were conducted. The first used the terms knee, osteoarthritis, WOMAC, and hyaluronic acid. The second used the same terms as the first, replacing WOMAC with Lequesne. The third and fourth searched WOMAC and validity and Lequesne and validity, respectively. All 4 searches were limited to human randomized clinical trials, in English-language journal reports. A hand search of the reference lists of all retrieved studies was performed to ensure that no eligible studies were excluded.
Studies were selected independently by the same 2 researchers. The search was performed independently to ensure an exhaustive review of the literature. All studies were considered eligible until disqualified based on exclusion criteria.
Studies were eligible for inclusion if they addressed hyaluronic acid injection for osteoarthritis at the knee and used the WOMAC or Lequesne indexes as outcomes measurements. It was also necessary that they provided means and standard deviations in order to perform statistical analysis. We attempted to contact authors who did not provide necessary statistics for meta-analysis; however, we received no responses.
Assessment of methodological quality and data abstraction
The methodological quality of each study was assessed independently by the reviewers using the Physiological Evidence Database (PEDro) rating scale.14 It was determined that studies must include a control group that used placebo saline injections, provide means and standard deviations at baseline for the WOMAC or Lequesne, and also means and standard deviations after the intervention for both the treatment and control groups.
All abstracted data were converted into a percentage of the total possible score for each outcome measurement using a method described by a statistical consultant and an algorithm developed by one investigator (JM) using MATLAB 7.0 (MathWorks, Inc, Natick, Mass). This allowed for comparison between results of the WOMAC and Lequesne studies. This also allowed for comparison to the results of the Wang et al15 meta-analysis.
Statistical analysis
Homogeneity of the included studies, as determined by inclusion and exclusion criteria, allowed for meta-analysis. One meta-analysis was performed on the 3 studies that used the WOMAC scale,16-18 2 on the 4 studies that used the Lequesne index.7-9,19 Most studies that used the Lequesne index reported outcomes for a variety of follow-up points (4, 5, 8, 20, 24, 26, 49, 52 weeks); however, there was not a consistent reporting timeline among these studies. We grouped the follow-up reports into “up to 6 months post-treatment” and “6 months or greater post-treatment.” The first Lequesne analysis evaluated the difference between treatment and placebo groups at with data points less than 6 months post-treatment. The second Lequesne analysis examined the difference between groups at 6 months and greater post-treatment. In the study by Karlsson,7 2 different but similar types of hyaluronic acid were used. These groups were separated and analyzed as independent studies; 95% confidence intervals were calculated for all analyses. Effect sizes were also calculated to determine the between-group effect of the treatment and placebo.
Results
Selection of studies
The literature search resulted in 35 potentially eligible studies, of which 7 were selected after application of the inclusion criteria.7-9,16-19 Three of the selected studies used the WOMAC as an outcome assessment tool,16-18 4 used the Lequesne index.7-9,19 The remaining 28 studies were excluded. TABLE W1 details the rejection of studies.
Methodological quality and study characteristics
Each investigator then independently scored the methodological quality for the remaining studies by using the PEDro scale.14 There was total agreement for all studies in regards to the PEDro score. No study received a score under 5. The average PEDro rating among the studies was 8.2 out of 10.
Homogeneity
All groups across all included studies were similar at baseline. All patients had mild to severe osteoarthritis of the knee. Mean ages of the groups were similar (treatment groups=67.1 years, placebo=66.7 years). Not all patients received treatment as per manufacturer’s recommendations ( TABLES 1 AND 2 ). A saline placebo was used for control groups in all studies. The volume of saline placebo for each study was equal to volume of hyaluronic acid injection plus saline vehicle used for that study. All studies used either the WOMAC scale or the Lequesne Functional Index as an outcome measurement tool. All studies included a follow-up outcome measurement; however, the range of follow-up time periods was wide (4 to 52 weeks).
Meta-analysis
The analysis for the outcome measurements on the WOMAC scale revealed no significant difference between groups in regards to pain or disability (95% confidence interval [CI] for pain, –0.6043 to 5.4755; for disability, –0.8282 to 4.8619). The outcome measurement for stiffness demonstrated a significant difference between treatment and control (95% CI for stiffness, 2.1780 to 8.7955).
The analysis for the outcome measurement on the Lequesne index revealed a significant difference between groups for measurements taken up to 6 months post-treatment (95% CI, 1.2315 to 2.6268). However, these differences were not seen in the 6+ month outcomes analysis (95% CI, –.8489 to .04787]. Confidence intervals are presented in FIGURE 1 . Mean differences for each outcome at baseline and post-treatment between the active treatment and placebo are presented in TABLE 3 .
TABLE 1
Hyaluronic acid: Manufacturer’s recommendations
| HA BRAND | ARTZAL | SYNVISC | HYALGAN | DUROLANE | SUPLASYN | NRD101 |
|---|---|---|---|---|---|---|
| Number of injections (given 1 week apart) | 5 | 3 | 5 | 1 | 3 | N/A |
| Concomitant local anesthetic injection recommended | Yes | No* | Yes | NR | N/A | N/A |
| Aspiration recommended prior to injection | Yes | Yes | Yes | Yes | No | N/A |
| Dosage per injection (mg) | 25.0 | 32.0 | 40.0 | 60.0 | 20.0 | 25.0 |
| Molecular weight (kDa) | 620–1170 | 6000 | 500–730 | N/A | N/A | 1900 |
| Cross-linked | No | Yes | No | Yes | No | N/A |
| HA, hyaluronic acid; NR, not reported; N/A, not available. | ||||||
| * Purported to alter the efficacy of Synvisc. | ||||||
TABLE 2
Details of included studies
| STUDY | KARLSSON ET AL7 | DOUGADOS ET AL8 | HUSKISSON9 | DAY ET AL16 | ALTMAN ET AL17 | PETRELLA ET AL18 | PHAM ET AL19 | |
|---|---|---|---|---|---|---|---|---|
| Brand | Artzal | Synvisc | Hyalgan | Hyalgan | Artzal | Durolane | Suplasyn | NRD101 |
| Number of injections | ||||||||
| given 1 wk apart | 3 | 3 | 4 | 5 | 5 | 1 | 3 | 3* |
| Mfr’s recommendations | 5 | 3 | 5 | 5 | 5 | 1 | 3 | NA |
| Concomitant local anaesthetic injection | NR | NR | NR | NR | Yes | NR | NR | Yes |
| Aspiration prior to injection | NR | NR | Yes | NR | Yes | NR | NR | Yes |
| Dosage per injection (mg) + vehicle† | 25/2.5 mL saline | 32/2.5 mL saline | 20/2.0 mL saline | 20/2.0 mL saline | 25/2.5 mL saline | 60/3.0 mL saline | 20/2.0 mL saline | 25/2.5 mL saline |
| Cross-linked | No | Yes | No | No | No | Yes | NR | NR |
| NR=not reported | ||||||||
| * Given as 3 courses every 3 months of 3 weekly injections | ||||||||
| † Volume of saline placebo for each study equal to volume of hyaluronic acid injection plus saline vehicle used for that study | ||||||||
FIGURE 1
Hyaluronic acid vs control: 95% confidence intervals
Confidence intervals that cross the 0-value represent a nonsignificant difference between active treatment and control. Also included is a result from the Wang et al meta-analysis15 for comparison.
TABLE 3
Mean improvements: treatment vs. control
| BASELINE | POST-TREATMENT | |||
|---|---|---|---|---|
| HA | PLACEBO | HA | PLACEBO | |
| LEQUESNE | 12.7 (3.0) | 12.44 (2.7) | 8.7 (4.4) | 8.91 (4.4) |
| % Lequesne* | 53.0 (12.8) | 51.83 (11.2) | 36.3 (18.5) | 37.1 (18.1) |
| WOMAC | ||||
| Pain* | 40.5 (17.0) | 43.9 (19.0) | 26.8 (18.3) | 30.9 (21.6) |
| Stiffness* | 47.0 (17.6) | 50.9 (21.1) | 33.0 (21.4) | 42.8 (24.0) |
| Disability* | 42.5 (18.6) | 46.8 (22.2) | 27.9 (19.0) | 33.3 (21.8) |
| The mean (standard deviation) change among included studies in outcomes scores between baseline and post-treatment at the final collection point for hyaluronic acid and placebo. An increase in outcome score represents improvement. | ||||
| * Normalized to a maximal score of 100 possible points | ||||
FIGURE 2
Comparing effect sizes of hyaluronic acid therapy and saline placebo
Across studies, effect sizes were similar for hyaluronic acid therapy and placebo.
Discussion: Benefits are limited
Based on this meta-analysis, we cannot conclude that hyaluronic acid performs better than saline placebo for a reduction of pain or disability on the WOMAC. Some indication may be warranted for reduction in stiffness. It is notable that hyaluronic acid injection and saline placebo groups both experienced an improvement in pain, stiffness, and disability scores on the WOMAC.
We also cannot conclude that hyaluronic acid enhances functionality as evaluated on the Lequesne Index past 6 months post-treatment. In 2 studies,7,19 patients with placebo actually showed reduced disability compared with patients in the hyaluronic acid group. While a short-term improvement in functionality was observed in other studies, this effect was not seen in follow-up reports greater than 6 months.
Comparisons with other meta-analyses
A recently published meta-analysis by Modawal et al20 also pooled data to compare hyaluronic acid treatment to saline placebo. That meta-analysis was similar to ours in that it had relatively small sample size (n=11) and examined self-reported patient outcomes as the item of interest. The difference between this meta-analysis and ours is that the length of the evaluation periods for the other analysis was fairly short; the longest follow-up was 26 weeks. Our study examined the pooled effects of hyaluronic acid carried out to at least 24 weeks and up to 52 weeks. Their results for the short-term outcomes demonstrated significant decrease in pain in the active treatment group; however, these results diminished considerably when controlled for study quality.
Our meta-analysis was not consistent with a previous meta-analysis of hyaluronic acid treatment with regard to pain relief and reduction of disability. This study15 revealed that hyaluronic acid has a therapeutic effect on osteoarthritis of the knee, specifically decreasing pain and disability. The analysis included 20 studies, but differed from ours in that it failed to control for between-group heterogeneity and used an original formula to derive mean differences in efficacy scores between hyaluronic acid and placebo. Each study in our meta-analysis used an identical method for reporting outcome scores. Our study also synthesized the original data values as reported in each original study.
In addition, our results have to be interpreted with attention to a large effect of saline injection, which were much greater than the expected effect of placebo. Calculated effect sizes demonstrated similar effects for both treatment and placebo groups, with no clustering that was different between groups ( FIGURE 2 ). Treatment and placebo groups showed equal response when evaluated for greatest effect.
Refocusing research
The effects of hyaluronic acid injection appear to be transient and offer only slight improvement for older patients with mild to advanced osteoarthritis. Attention should be given to other groups, including younger patients and patients with mild degenerative changes. These studies should attempt to better stratify patient groups to identify those who are most likely to benefit from intervention. In addition, there must be better reporting of treatment protocols and results will allow clinicians to make rational decisions regarding treatments.
Cost and side effects
Consider the degree of benefit and costs when making treatment decisions. The average treatment cost was approximately $900 in 2003.21 Obviously one issue is whether a patient’s insurance provider will pay for the treatment.
Side effects are uncommon, and complications with hyaluronic acid injections have been relatively mild.
A few cases of hyaluronic acid allergy have been reported,22 including sweating, paleness, feelings of pressure in the chest and stomach, skin turning blue, or a decrease in blood pressure.22
Acknowledgments
The authors would like to thank Esra Akdeniz from the Statistical Consulting Center at the Pennsylvania State University for assistance with the methods for performing statistical meta-analysis.
CORRESPONDENCE
Jennifer M. Medina, 146 Recreation Building, University Park, PA 16802. E-mail: [email protected]
1. Lawrence RC, Helmick CG, Arnett FC, et al. Estimates of the prevalence of arthritis and selected musculoskeletal disorders in the United States. Arthritis Rheum 1998;41:778-799.
2. Sharma L, Kapoor D, Issa S. Epidemiology of osteoarthritis: an update. Curr Opin Rheumatol 2006;18:147-156.
3. Neyret P, Donell ST, Dejour H. Results of partial meniscectomy related to the state of the anterior cruciate ligament. Review at 20 to 35 years. J Bone Joint Surg Br 1993;75:36-40.
4. Moskowitz RW, Kelly MA, Lewallen DG. Understanding osteoarthritis of the knee-causes and effects. Am J Orthop 2004;33:5-9.
5. Walsh DA, Sledge CB, Blanke DR. Biology of the normal joint. In: Kelley WN, Ruddy W, Harris ED Jr, Sledge CB, eds. Textbook of Rheumatology. Vol 1. 5th ed. Philadelphia, PA: W.B. Saunders Company;1997:1-26.
6. Leardini G, Mattara L, Franceschini M, Perbellini A. Intra-articular treatment of knee osteoarthritis. A comparative study between hyaluronic acid and –methyl prednisolone acetate. Clin Exp Rheumatol 1991;9:375-381.
7. Karlsson J, Sjogren LS, Lohmander LS. Comparison of two hyaluronan drugs and placebo in patients with knee osteoarthritis. A controlled, randomized, double-blind, parallel-design multicentre study. Rheumatology. 2002;41:1240-1248.
8. Dougados M, Nguyen M, Listrat V, Amor B. High molecular weight sodium hyaluronate (hyalectin) in osteoarthritis of the knee: a 1 year placebo-controlled trial. Osteoarthritis Cartilage 1993;1:97-103.
9. Huskisson EC, Donnelly S. Hyaluronic acid in the treatment of osteoarthritis of the knee. Rheumatology 1999;38:602-607.
10. Peyron JG, Balazs EA. Preliminary clinical assessment of Na-hyaluronate injection into human arthritic joints. PatholBiol (Paris) 1974;22:731-736.
11. Namiki O, Toyoshima H, Morisaki N. Therapeutic effect of intra-articular injection of high molecular weight hyaluronic acid on osteoarthritis of the knee. Int J Clin Pharmacol Ther Toxicol 1982;20:501-507.
12. Bellamy N, Buchanan W, Goldsmith CH, Campbell J, Stitt LW. Validation study of WOMAC: a health status instrument for measuring clinically important patient relevant outcomes to antirheumatic drug therapy in patients with osteoarthritis of the hip or knee. J Rheumatol 1999;15:1833-1840.
13. Faucher M, Poiraudeau S, Lefevre-Colau MM, Rannou F, Fermanian F, Revel M. Algo-functional assessment of knee osteoarthritis: comparison of the test-retest reliability and construct validity of the WOMAC and Lequesne indexes. Osteoarth Cartil 2002;10:602-610.
14. PEDro Scale. Physiotherapy Evidence Database Web site. Available at: www.pedro.fhs.usyd.edu.au/scale_item.html. Accessed on February 10, 2005.
15. Wang C, Lin J, Chang C, Lin Y, Hou S. Therapeutic effects of hyaluronic acid on osteoarthritis of the knee. J Bone Joint Surg 2004;86A:538-545.
16. Day R, Brooks P, Conaghan PG, Petersen M. A double blind, randomized, multicenter, parallel group study of the effectiveness and tolerance of intra-articular hyaluronan in osteoarthritis of the knee. J Rheumatol 2004;31:775-782.
17. Altman RD, Akermark C, Beaulieu AD, Schnitzer T. Efficacy and safety of a single intra-articular injection of non-animal stabilized hyaluronic acid (NASHA) in patients with osteoarthritis of the knee. Osteoarthritis Cartilage 2004;12:642-649.
18. Petrella RJ, DiSilvestro MD, Hildebrand C. Effects of hyaluronate sodium on pain and physical functioning on osteoarthritis of the knee. Arch Intern Med 2002;162:292-298.
19. Pham T, Le Henanff A, Ravaud P, Dieppe P, Paolozzi L, Dougados M. Evaluation of the symptomatic and structural efficacy of a new hyaluronic acid compound, NRD101, in comparison with diacerein and placebo in a 1 year randomized controlled study in symptomatic knee osteoarthritis. Ann Rhem Dis 2004;63:1611-1617.
20. Modawal A, Ferrer M, Choi HK, Castle JA. Hyaluronic acid injections relieve knee pain. J Fam Pract 2005;54:758-677.
21. Kahan A, Lleu P, Salin L. Prospective randomized study comparing the medicoeconomic benefits of Hylan GF-20 vs. conventional treatment in knee osteoarthritis. Joint Bone Spine 2003;70:276-281.
22. Brandt KD, Block JA, Michalski JP, Moreland LW, Caldwell JR, Lavin PT. Efficacy and safety of intra-articular sodium hyaluronate in knee osteoarthritis. Clin Orthop 2001;385:130-143.
“Hot tub” lung: Is it on your list of respiratory ailments?
A 49-year-old white male came to our Family Medicine Center with a complaint of lethargy, night sweats, fever, dyspnea on exertion, myalgias, and an 8-pound weight loss over a 4-week period. He was employed as a recreational director, and his normally athletic lifestyle had been limited by his symptomatic illness.
He had recently traveled to Mexico and Barbados and reported no known animal or insect bites. He had no history of lung disease or occupational exposure. He stopped smoking 5 years earlier (20-pack-year history) and did not use drugs. He had no infectious contacts or significant risk factors.
During the interview, he mentioned recently using an indoor hot tub ventilated with hose aeration. In fact, he used the hot tub almost daily for the 2 months leading up to this office visit. He developed symptoms after approximately 4 weeks of hot tub use.
What diagnostic studies showed
Baseline measurements were all within normal limits for a complete blood count, comprehensive metabolic panel, and thyroid-stimulating hormone. The sedimentation rate was elevated (76), as was C-reactive protein (62.3); an ANA with titer 1:80 showed homogenous pattern.
The chest x-ray was normal; however, a chest computed tomography (CT) scan performed 2 weeks after the initial film due to symptom exacerbation showed diffuse bilateral ground-glass opacification within the lung parenchyma (FIGURE 1). Pulmonary function testing revealed a mild to moderate restrictive defect with a decrease in the diffusion capacity.
Transbronchial microscopic studies revealed noncaseating granulomatous inflammation (FIGURES 2 AND 3). Results were negative for acid-fast bacilli smears and for bacterial and fungal cultures from blood and bronchial washings.
FIGURE 1
CT scan of chest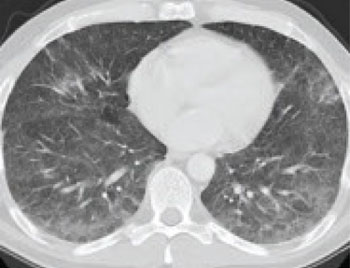
Chest computed tomography scan showed groundglass opacification in lung parenchyma.
FIGURE 2
Microscopic evaluation of lung
Microscopic evaluation from bronchoscopy revealed noncaseating granulomatous inflammation consistent with hypersensitivity pneumonitis.
FIGURE 3
Lung granuloma
Image of an isolated lung granuloma from the microscopic evaluation in Figure 2.
Follow-up
This immunocompetent patient was diagnosed with interstitial hypersensitivity pneumonitis. A definitive organism was never isolated.
Hot tub pathogens
Hot tub lung is thought to be a hypersensitivity response to an aerosolized organism such as Mycobacterium avian complex (MAC), which is a common contaminant of standing water.1-4 (A point of controversy is whether persons with pulmonary disease secondary to nontuberculous mycobacterial disease are experiencing a hypersensitivity reaction to the organisms, or simply symptoms secondary to true pulmonary infection.5) Cladosporium spp and Bacillus cereus also can cause a hypersensitivity reaction.
More than one pathologic process?
For previously healthy patients who experience an abrupt onset of fever, chills, malaise, cough, chest tightness, and dyspnea, the differential diagnosis may be broad. However, a history of hot tub exposure makes a diagnosis of hypersensitivity pneumonitis likely. Infiltrates on CT scan,6 clinical improvement with avoidance of the allergen (with or without steroids), and absence of predisposing factors such as chronic lung disease are also consistent with hypersensitivity pneumonitis.
However, the noncaseating granulomatous inflammation found in our patient is suggestive of infection, and both MAC and Pseudomonas aeruginosa have been associated with poor hot tub maintenance.7 Some authors suggest that hot tub lung is a spectrum of disease with components of both hypersensitivity pneumonitis and infection.8-11
Treatment
The main focus of treatment is avoiding the allergen (the hot tub). Patients with persistent symptoms may benefit from a short course of oral corticosteroids. Antimycobacterial medications may be needed, depending on the symptoms and response to avoidance therapy.12 Antibacterials and antifungals are rarely needed.
After 4 weeks of steroid therapy and avoiding the hot tub, our patient was able to return to aerobic activity without symptoms. One year later, he had no long-term adverse effects.
Hot tub maintenance as disease prevention
Infections are more likely to occur if a hot tub is improperly maintained. Outbreaks of P aeruginosa dermatitis13 and otitis externa13 associated with hot tub use have been reported, as have the nonvenereal spread of herpes simplex virus from spa facilities.14 Severe necrotizing pneumonia due to community-acquired P aeruginosa was associated with a poorly maintained hot tub.8 Hot tub exposure during early pregnancy has been associated with an increased risk of neural tube defects.15
Hot tubs should be maintained according to manufacturer’s recommendations, which include both frequent water changes and adequate use of disinfectants. Proper usage also entails changing filters on schedule and showering before using a hot tub.
Water temperatures above 84°F may make chlorine evaporate and lose much of its disinfectant properties. Bromine is often substituted for chlorine because of its lower vapor pressure, but bromine is more reactive and may exacerbate the formation of antigens that may lead to a hypersensitivity reaction.
The steam and bubbles generated by the hot tub efficiently aerosolize the organism and facilitate easy inhalation. When hot tubs are outdoors, the mist simply disperses. But in an indoor setting, the aerosol is more likely to be contained and subsequently inhaled. Placement of a hot tub in an enclosed or poorly ventilated environment should be discouraged.
Get cultures of hot tub water. We did not obtain cultures of the hot tub water in this case, but some authors have reported positive results from water cultures that correspond to results of lung cultures.8 Most patients will improve with antigen avoidance, which is more suggestive of a hypersensitivity reaction than an infection—particularly when symptoms resolve without antibiotics or antifungals. However, after review of the literature, we recommend obtaining a culture of the water in suspicious hot tubs, as it may uncover an infectious source.8
Our recommendation. As hot tubs become more popular in the United States, illnesses associated with improperly maintained units are likely to increase. Skin lesions,13 external otitis,13 genital herpes,14 and Legionnaire’s disease16-20 have all been associated with hot tub use. In routine reviews of patients with respiratory problems, consider hypersensitivity pneumonitis in your differential diagnosis and include questions about hot tub use.
CORRESPONDENCE
Kevin N. Waninger, MD, MS, FAAFP, FACEP, FACSM, Department of Family Medicine, Family Medicine Residency Program, St. Luke’s Hospital, Bethlehem, PA 18017-4206. E-mail: [email protected]
1. Rickman OB, Ryu JH, Fidler ME, Kalra S. Hypersensitivity pneumonitis associated with Mycobacterium avium complex and hot tub use. Mayo Clin Proc 2002;77:1233-1237.
2. Khoor A, Leslie KO, Tazelaar HD, Helmers RA, Colby TV. Diffuse pulmonary disease caused by nontuberculous mycobacteria in immunocompetent people (hot tub lung). Am J Clin Pathol 2001;115:755-762.
3. Cappelluti E, Fraire AE, Schaefer OP. A case of hot tub lung due to Mycobacterium avium complex in an immunocompetent host. Arch Intern Med 2003;163:845-848.
4. Mery A, Horan RF. Hot tub-related Mycobacterium avium intracellulare pneumonitis. Allergy Asthma Proc 2002;23:271-273.
5. Murphy RLH, Mark EJ. Case 6-1996: A 40-year-old man with cough, increasing dyspnea, and bilateral nodular lung opacities. N Engl J Med 1996;334:521-526.
6. Pham RV, Vydareny KH, Gal AA. High-resolution computed tomography appearance of pulmonary Mycobacterium avium complex infection after exposure to hot tub: case of hot-tub lung. J Thorac Imaging 2003;18:48-52.
7. Crnich CJ, Gordon B, Andes D. Hot tub-associated nectrotizing pneumonia due to Pseudomonas aeruginosa. Clin Infect Dis 2003;36:e55-57.
8. Embil J, Kay JM, Yakras MA, et al. Pulmonary illness associated with exposure to Mycobacterium-avium complex in hot tub water: hypersensitivity pneumonitis or infection. Chest 1997;111:242-245.
9. Mangione EJ, Huitt G, Lenaway D, et al. Nontuberculous mycobacterial disease following hot tub exposure. Emerg Infect Dis 2001;7:1039-1042.
10. Systrom DM, Wittram C. Case 9-2005: A 67-year-old man with acute respiratory failure. N Engl J Med 2005;352(12):1238-1246.
11. Rose CS, Martyny J, Huitt G, Iseman M. Hot tub associated granulomatous lung disease from mycobacterial bioaerosols. Am J Respir Crit Care Med 2000;161:A730.-
12. Lynch DA, Rose CS, Way D, King TE. Hypersensitivity pneumonitis: sensitivity of high resolution CT in a population based study. AJR Am J Roentgenol 1992;159:469-472.
13. CDC. Pseudomonas dermatitis/folliculitis associated with pools and hot tubs-Colorado and Maine, 1999-2000. MMWR Morb Mortal Wkly Rep 2000;49:1087-1090.
14. Nerurkar LS, West F, Madden DL, Sever JL. Survival of herpes simplex virus in water specimens collected from hot tubs in spa facilities and on plastic surfaces. JAMA 1983;250:3081-3083.
15. Milunsky A, Ulcickas M, Rothman KJ, et al. Maternal heat exposure and neural tube defects. JAMA 1992;268:882-885.
16. Tolentino A, Ahkee S, Ramirez J. Hot tub legionellosis. J Ky Med Assoc 1996;94:393-394.
17. Thomas DL, Mundy LM, Tucker PC. Hot tub legionellosis. Legionnaires’ disease and Pontiac fever after a point-source exposure to Legionella pneumophila. Arch Intern Med 1993;153:2597-2599.
18. Rocha G, Verissimo A, Bowker R, Bornstein N, Da Costa MS. Relationship between Legionella spp. and antibody titers at a therapeutic thermal spa in Portugal. Epidemiol Infect 1995;115:79-88.
19. Jernigan DB, Hofmann J, Cetron MS, et al. Outbreak of legionnaires’ disease among cruise ship passengers exposed to a contaminated whirlpool spa. Lancet 1996;347:494-499.
20. CDC. Legionnaires’ disease associated with a Whirlpool spa display. MMWR Morb Mortal Wkly Rep 1997;46(4).
A 49-year-old white male came to our Family Medicine Center with a complaint of lethargy, night sweats, fever, dyspnea on exertion, myalgias, and an 8-pound weight loss over a 4-week period. He was employed as a recreational director, and his normally athletic lifestyle had been limited by his symptomatic illness.
He had recently traveled to Mexico and Barbados and reported no known animal or insect bites. He had no history of lung disease or occupational exposure. He stopped smoking 5 years earlier (20-pack-year history) and did not use drugs. He had no infectious contacts or significant risk factors.
During the interview, he mentioned recently using an indoor hot tub ventilated with hose aeration. In fact, he used the hot tub almost daily for the 2 months leading up to this office visit. He developed symptoms after approximately 4 weeks of hot tub use.
What diagnostic studies showed
Baseline measurements were all within normal limits for a complete blood count, comprehensive metabolic panel, and thyroid-stimulating hormone. The sedimentation rate was elevated (76), as was C-reactive protein (62.3); an ANA with titer 1:80 showed homogenous pattern.
The chest x-ray was normal; however, a chest computed tomography (CT) scan performed 2 weeks after the initial film due to symptom exacerbation showed diffuse bilateral ground-glass opacification within the lung parenchyma (FIGURE 1). Pulmonary function testing revealed a mild to moderate restrictive defect with a decrease in the diffusion capacity.
Transbronchial microscopic studies revealed noncaseating granulomatous inflammation (FIGURES 2 AND 3). Results were negative for acid-fast bacilli smears and for bacterial and fungal cultures from blood and bronchial washings.
FIGURE 1
CT scan of chest
Chest computed tomography scan showed groundglass opacification in lung parenchyma.
FIGURE 2
Microscopic evaluation of lung
Microscopic evaluation from bronchoscopy revealed noncaseating granulomatous inflammation consistent with hypersensitivity pneumonitis.
FIGURE 3
Lung granuloma
Image of an isolated lung granuloma from the microscopic evaluation in Figure 2.
Follow-up
This immunocompetent patient was diagnosed with interstitial hypersensitivity pneumonitis. A definitive organism was never isolated.
Hot tub pathogens
Hot tub lung is thought to be a hypersensitivity response to an aerosolized organism such as Mycobacterium avian complex (MAC), which is a common contaminant of standing water.1-4 (A point of controversy is whether persons with pulmonary disease secondary to nontuberculous mycobacterial disease are experiencing a hypersensitivity reaction to the organisms, or simply symptoms secondary to true pulmonary infection.5) Cladosporium spp and Bacillus cereus also can cause a hypersensitivity reaction.
More than one pathologic process?
For previously healthy patients who experience an abrupt onset of fever, chills, malaise, cough, chest tightness, and dyspnea, the differential diagnosis may be broad. However, a history of hot tub exposure makes a diagnosis of hypersensitivity pneumonitis likely. Infiltrates on CT scan,6 clinical improvement with avoidance of the allergen (with or without steroids), and absence of predisposing factors such as chronic lung disease are also consistent with hypersensitivity pneumonitis.
However, the noncaseating granulomatous inflammation found in our patient is suggestive of infection, and both MAC and Pseudomonas aeruginosa have been associated with poor hot tub maintenance.7 Some authors suggest that hot tub lung is a spectrum of disease with components of both hypersensitivity pneumonitis and infection.8-11
Treatment
The main focus of treatment is avoiding the allergen (the hot tub). Patients with persistent symptoms may benefit from a short course of oral corticosteroids. Antimycobacterial medications may be needed, depending on the symptoms and response to avoidance therapy.12 Antibacterials and antifungals are rarely needed.
After 4 weeks of steroid therapy and avoiding the hot tub, our patient was able to return to aerobic activity without symptoms. One year later, he had no long-term adverse effects.
Hot tub maintenance as disease prevention
Infections are more likely to occur if a hot tub is improperly maintained. Outbreaks of P aeruginosa dermatitis13 and otitis externa13 associated with hot tub use have been reported, as have the nonvenereal spread of herpes simplex virus from spa facilities.14 Severe necrotizing pneumonia due to community-acquired P aeruginosa was associated with a poorly maintained hot tub.8 Hot tub exposure during early pregnancy has been associated with an increased risk of neural tube defects.15
Hot tubs should be maintained according to manufacturer’s recommendations, which include both frequent water changes and adequate use of disinfectants. Proper usage also entails changing filters on schedule and showering before using a hot tub.
Water temperatures above 84°F may make chlorine evaporate and lose much of its disinfectant properties. Bromine is often substituted for chlorine because of its lower vapor pressure, but bromine is more reactive and may exacerbate the formation of antigens that may lead to a hypersensitivity reaction.
The steam and bubbles generated by the hot tub efficiently aerosolize the organism and facilitate easy inhalation. When hot tubs are outdoors, the mist simply disperses. But in an indoor setting, the aerosol is more likely to be contained and subsequently inhaled. Placement of a hot tub in an enclosed or poorly ventilated environment should be discouraged.
Get cultures of hot tub water. We did not obtain cultures of the hot tub water in this case, but some authors have reported positive results from water cultures that correspond to results of lung cultures.8 Most patients will improve with antigen avoidance, which is more suggestive of a hypersensitivity reaction than an infection—particularly when symptoms resolve without antibiotics or antifungals. However, after review of the literature, we recommend obtaining a culture of the water in suspicious hot tubs, as it may uncover an infectious source.8
Our recommendation. As hot tubs become more popular in the United States, illnesses associated with improperly maintained units are likely to increase. Skin lesions,13 external otitis,13 genital herpes,14 and Legionnaire’s disease16-20 have all been associated with hot tub use. In routine reviews of patients with respiratory problems, consider hypersensitivity pneumonitis in your differential diagnosis and include questions about hot tub use.
CORRESPONDENCE
Kevin N. Waninger, MD, MS, FAAFP, FACEP, FACSM, Department of Family Medicine, Family Medicine Residency Program, St. Luke’s Hospital, Bethlehem, PA 18017-4206. E-mail: [email protected]
1. Rickman OB, Ryu JH, Fidler ME, Kalra S. Hypersensitivity pneumonitis associated with Mycobacterium avium complex and hot tub use. Mayo Clin Proc 2002;77:1233-1237.
2. Khoor A, Leslie KO, Tazelaar HD, Helmers RA, Colby TV. Diffuse pulmonary disease caused by nontuberculous mycobacteria in immunocompetent people (hot tub lung). Am J Clin Pathol 2001;115:755-762.
3. Cappelluti E, Fraire AE, Schaefer OP. A case of hot tub lung due to Mycobacterium avium complex in an immunocompetent host. Arch Intern Med 2003;163:845-848.
4. Mery A, Horan RF. Hot tub-related Mycobacterium avium intracellulare pneumonitis. Allergy Asthma Proc 2002;23:271-273.
5. Murphy RLH, Mark EJ. Case 6-1996: A 40-year-old man with cough, increasing dyspnea, and bilateral nodular lung opacities. N Engl J Med 1996;334:521-526.
6. Pham RV, Vydareny KH, Gal AA. High-resolution computed tomography appearance of pulmonary Mycobacterium avium complex infection after exposure to hot tub: case of hot-tub lung. J Thorac Imaging 2003;18:48-52.
7. Crnich CJ, Gordon B, Andes D. Hot tub-associated nectrotizing pneumonia due to Pseudomonas aeruginosa. Clin Infect Dis 2003;36:e55-57.
8. Embil J, Kay JM, Yakras MA, et al. Pulmonary illness associated with exposure to Mycobacterium-avium complex in hot tub water: hypersensitivity pneumonitis or infection. Chest 1997;111:242-245.
9. Mangione EJ, Huitt G, Lenaway D, et al. Nontuberculous mycobacterial disease following hot tub exposure. Emerg Infect Dis 2001;7:1039-1042.
10. Systrom DM, Wittram C. Case 9-2005: A 67-year-old man with acute respiratory failure. N Engl J Med 2005;352(12):1238-1246.
11. Rose CS, Martyny J, Huitt G, Iseman M. Hot tub associated granulomatous lung disease from mycobacterial bioaerosols. Am J Respir Crit Care Med 2000;161:A730.-
12. Lynch DA, Rose CS, Way D, King TE. Hypersensitivity pneumonitis: sensitivity of high resolution CT in a population based study. AJR Am J Roentgenol 1992;159:469-472.
13. CDC. Pseudomonas dermatitis/folliculitis associated with pools and hot tubs-Colorado and Maine, 1999-2000. MMWR Morb Mortal Wkly Rep 2000;49:1087-1090.
14. Nerurkar LS, West F, Madden DL, Sever JL. Survival of herpes simplex virus in water specimens collected from hot tubs in spa facilities and on plastic surfaces. JAMA 1983;250:3081-3083.
15. Milunsky A, Ulcickas M, Rothman KJ, et al. Maternal heat exposure and neural tube defects. JAMA 1992;268:882-885.
16. Tolentino A, Ahkee S, Ramirez J. Hot tub legionellosis. J Ky Med Assoc 1996;94:393-394.
17. Thomas DL, Mundy LM, Tucker PC. Hot tub legionellosis. Legionnaires’ disease and Pontiac fever after a point-source exposure to Legionella pneumophila. Arch Intern Med 1993;153:2597-2599.
18. Rocha G, Verissimo A, Bowker R, Bornstein N, Da Costa MS. Relationship between Legionella spp. and antibody titers at a therapeutic thermal spa in Portugal. Epidemiol Infect 1995;115:79-88.
19. Jernigan DB, Hofmann J, Cetron MS, et al. Outbreak of legionnaires’ disease among cruise ship passengers exposed to a contaminated whirlpool spa. Lancet 1996;347:494-499.
20. CDC. Legionnaires’ disease associated with a Whirlpool spa display. MMWR Morb Mortal Wkly Rep 1997;46(4).
Dealing with school refusal behavior: A primer for family physicians
- You can help assess forms of a child’s school refusal behavior as well as reinforcers that maintain the problem (B).
- All youths with school refusal behavior should be assessed for severe anxiety and depression (C).
- You can treat medical conditions associated with school refusal behavior, provide pharmacotherapy for severe anxiety and depression, and work with school-based personnel and a clinical child psychologist to gradually reintroduce a child to school and address comorbid educational, psychological, and familial problems (A).
Nathan is a 13-year-old boy referred by his parents to a family physician for recent school refusal behavior. Nathan has had difficulty adjusting to middle school and has already been marked absent one-third of school days this academic year. These absences have come in the form of tardiness, skipped classes, and full-day absences. Nathan complains of headaches and stomachaches and says he feels upset and nervous while in school. His parents, however, complain that Nathan seems fine on weekends and holidays and seems to be embellishing symptoms to miss school. Nathan’s parents are concerned that their son may have some physical or mental condition that is preventing his school attendance and that might be remediated with medication.
Child-motivated refusal to attend school or to remain in classes for an entire day is not that uncommon. The problem affects 5% to 28% of youths at some time during their lives and is often referred first by parents to the attention of a family physician.1-2
The behavior may be viewed along a spectrum of absenteeism ( FIGURE), and a child may exhibit all forms of absenteeism at one time or another. In Nathan’s case, for example, he could be anxious during school on Monday, arrive late to school on Tuesday, skip afternoon classes on Wednesday, and fail to attend school completely on Thursday and Friday.
In this article you will learn characteristics of school refusal behavior to watch for and assess, and treatment strategies for youths aged 5 to 17 years. You will also find advice and techniques to offer parents.
FIGURE
A child may exhibit each behavior on this spectrum at different times
Characteristics of youths with school refusal behavior
School refusal behavior is a term than encompasses all subsets of problematic absenteeism, such as truancy, school phobia, and separation anxiety.3 Children and adolescents of all ages, and boys and girls alike, can exhibit school refusal behavior. The most common age of onset, however, is 10 to 13 years. In addition, youths who are entering a school building for the first time, especially elementary and middle school (as was the case for Nathan), are at particular risk for school refusal behavior. Little information is available regarding ethnic differences, although school dropout rates for Hispanics are often considerably elevated compared with other ethnic groups.4-5
School refusal behavior covers a range of symptoms, diagnoses, somatic complaints, and medical conditions (TABLES 1-3).6-12 Longitudinal studies indicate that, if left unaddressed, school refusal behavior can lead to serious short-term problems such as distress, academic decline, alienation from peers, family conflict, and financial and legal consequences. Common long-term problems include school dropout, delinquent behaviors, economic deprivation, social isolation, marital problems, and difficulty maintaining employment. Approximately 52% of adolescents with school refusal behavior meet criteria for an anxiety, depressive, conduct-personality, or other psychiatric disorder later in life.13-16
TABLE 1
Common symptoms that could signal school refusal behavior
| INTERNALIZING/COVERT SYMPTOM | EXTERNALIZING/OVERT SYMPTOM |
|---|---|
| Depression | Aggression |
| Fatigue/tiredness | Clinging to an adult |
| Fear and panic | Excessive reassurance-seeking behavior |
| General and social anxiety | Noncompliance and defiance |
| Self-consciousness | Refusal to move in the morning |
| Somatization | Running away from school or home |
| Worry | Temper tantrums and crying |
TABLE 2
Primary psychiatric disorders among youths with school refusal behavior
| DIAGNOSIS | PERCENTAGE |
|---|---|
| No diagnosis | 32.9 |
| Separation anxiety disorder | 22.4 |
| Generalized anxiety disorder | 10.5 |
| Oppositional defiant disorder | 8.4 |
| Major depression | 4.9 |
| Specific phobia | 4.2 |
| Social anxiety disorder | 3.5 |
| Conduct disorder | 2.8 |
| Attention deficit/hyperactivity disorder | 1.4 |
| Panic disorder | 1.4 |
| Enuresis | 0.7 |
| Posttraumatic stress disorder | 0.7 |
| Source: Adapted from Kearney and Albano (2004). | |
TABLE 3
Rule out these somatic complaints and medical conditions commonly associated with school refusal behavior
| SOMATIC COMPLAINT | MEDICAL CONDITION |
|---|---|
| Diarrhea/irritable bowel | Allergic rhinitis |
| Fatigue | Asthma and respiratory illness |
| Headache and stomachache | Chronic pain and illness (notably cancer, Crohn’s disease, dyspepsia, hemophilia, chronic fatigue syndrome) |
| Nausea and vomiting | Diabetes |
| Palpitations and perspiration | Dysmenorrhea |
| Recurrent abdominal pain or other pain | Head louse infestation |
| Shaking or trembling | Influenza |
| Sleep problems | Orodental disease |
Getting to the bottom of school refusal behavior
If a child has somatic complaints, you can expect to find that the child is (1) suffering from a true physical malady, (2) embellishing low-grade physical symptoms from stress or attention-seeking behavior, or (3) reporting physical problems that have no medical basis. A full medical examination is always recommended to rule out organic problems or to properly treat true medical conditions.
If no medical condition is found, explore the reasons a particular child refuses school. A common model of conceptualizing school refusal behavior involves reinforcers1-2:
- To avoid school-based stimuli that provoke a sense of negative affectivity, or combined anxiety and depression; examples of key stimuli include teachers, peers, bus, cafeteria, classroom, and transitions between classes
- To escape aversive social or evaluative situations such as conversing or otherwise interacting with others or performing before others as in class presentations
- To pursue attention from significant others, such as wanting to stay home or go to work with parents
- To pursue tangible reinforcers outside of school, such as sleeping late, watching television, playing with friends, or engaging in delinquent behavior or substance use.
The first 2 functions are maintained by negative reinforcement, or a desire to leave anxiety-provoking stimuli. The latter 2 functions are maintained by positive reinforcement, or a desire to pursue rewards outside of school. Youths may also refuse school for a combination of these reasons.17 In Nathan’s case, he was initially anxious about school in general (function 1) but, after his parents allowed him to stay home for a few days, was refusing school as well to enjoy fun activities (eg, video games) at home (function 4).
One method for quickly assessing the role of these 4 functions is the School Refusal Assessment Scale–Revised.18,19 This scale poses 24 questions, the answers to which measure the relative strength of each of the 4 functions. Versions are available for children and parents, who complete their respective scales separately (TABLES 4-5). Item means are calculated across the measures to help determine the primary reason for a child’s school refusal.
In addition to using the School Refusal Assessment Scale–Revised, you may ask interview questions regarding the form and function of school refusal behavior (TABLE 6). Take care to assess attendance history and patterns, comorbid conditions, instances of legitimate absenteeism, family disruption, and a child’s social and academic status. Specific questions about function can help narrow the reason for school refusal.
Assess specific school-related stimuli that provoke absenteeism (eg, social and evaluative situations), whether a child could attend school with a parent (evidence of attention-seeking), and what tangible rewards a child receives for absenteeism throughout the school day. Information about the form and function of school refusal behavior may also be evident during in-office observations of the family. Data from the School Refusal Assessment Scale-Revised, interviews, and observations can then be used to recommend particular treatment options.
TABLE 4
Child version of the School Refusal Assessment Scale–Revised
|
| NOTE: (1)=avoidance of school-related stimuli that provoke a sense of negative affectivity, (2)=escape aversive social and/or evaluative situations, (3) pursuit of attention from significant others, (4) pursuit of tangible reinforcers outside of school. |
| NOTE: Items are scored on a 0-6 scale where 0=never, 1=seldom, 2=sometimes, 3=half the time, 4=usually, 5=almost always, and 6=always. |
TABLE 5
Parent version of the School Refusal Assessment Scale–Revised
|
| NOTE: (1)=avoidance of school-related stimuli that provoke a sense of negative affectivity, (2)=escape aversive social and/or evaluative situations, (3) pursuit of attention from significant others, (4) pursuit of tangible reinforcers outside of school. |
| NOTE: Items are scored on a 0-6 scale where 0=never, 1=seldom, 2=sometimes, 3=half the time, 4=usually, 5=almost always, and 6=always. |
TABLE 6
Sample questions and targets of assessment regarding the forms of school refusal behavior
| QUESTIONS RELATED TO THE FORM OF SCHOOL REFUSAL BEHAVIOR |
| What are the child’s specific forms of absenteeism, and how do these forms change daily? |
| Is a child’s school refusal behavior relatively acute or chronic in nature (in related fashion, how did the child’s school refusal behavior develop over time)? |
| What comorbid conditions occur with a child’s school refusal behavior (see TABLE 3), including substance abuse? |
| What is the child’s degree of anxiety or misbehavior upon entering school, and what specific misbehaviors are present in the morning before school (see TABLES 2 AND 4)? |
| What specific school-related stimuli are provoking the child’s concern about going to school? |
| Is the child’s refusal to attend school legitimate or understandable in some way (eg, school-based threat, bullying, inadequate school climate)? |
| What family disruption or conflict has occurred as a result of a child’s school refusal behavior? |
| What is the child’s academic and social status (this should include a review of academic records, formal evaluation reports, attendance records, and individualized education plans or 504 plans as applicable)? |
| QUESTIONS RELATED TO THE FUNCTION OF SCHOOL REFUSAL BEHAVIOR |
| Have recent or traumatic home or school events occurred to influence a child’s school refusal behavior? |
| Are symptoms of school refusal behavior evident on weekends and holidays? |
| Are there any non-school situations where anxiety or attention-seeking behavior occurs? |
| What specific social and/or evaluative situations at school are avoided? |
| Is the child willing to attend school if a parent accompanied him or her? |
| What specific tangible rewards does the child pursue outside of school that causes him or her to miss school? |
| Is the child willing to attend school if incentives were provided for attendance? |
Treating youths with school refusal behavior
Should you choose to address more than a diagnosed physical condition contributing to school refusal behavior, various resources are available to you. Medications have proven useful in alleviating severe cases of anxiety and depression. And cognitive management techniques can be applied to the child, the parents, and the family together.
Treatment success will be better assured, too, if you work closely with school personnel and a clinical child psychologist to gather and share information, coordinate a plan for returning a child to school, and address familial and comorbid psychological problems that impact attendance.
When to consider anxiolytics or antidepressants
Pharmacotherapy research for school refusal behavior is in its infancy. However, some investigators have found that tricyclic antidepressant such as imipramine may be useful in some cases20-21—generally for children with better attendance records and fewer symptoms of social avoidance and separation anxiety.22
With respect to substantial child anxiety and depression without school refusal behavior, researchers have focused on selective serotonin reuptake inhibitors. In particular, fluoxetine, fluvoxamine, sertraline, and paroxetine have been useful for youths with symptoms of general and social anxiety and depression,23,24 However, youths often do not respond to these medications as well as adults because of the fluid and amorphous nature of anxious and depressive symptomatology in children and adolescents.
Useful psychological techniques
Sophisticated Level 1 clinical controlled studies on treatment of diverse youths with school refusal behavior have appeared in recent literature.25-28 Options for this population may be generally arranged according to function or the set of reinforcers primarily maintaining absenteeism:
- Child-based techniques to manage anxiety in a school setting
- Parent-based techniques to manage contingencies for school attendance and nonattendance
- Family-based techniques to manage incentives and disincentives for school attendance and nonattendance.
Child-based anxiety management techniques include relaxation training, breathing retraining, cognitive therapy (generally for youths aged 9–17 years), and exposure-based practices to gradually reintroduce a child to school. These techniques have been strongly supported by randomized controlled trials specific to school refusal behavior (see above) and are useful for treating general anxiety and depression in these youths as well.
Parent-based contingency management techniques include establishing morning and evening routines, modifying parental commands toward brevity and clarity, providing attention-based consequences for school nonattendance (eg, early bedtime, limited time with a parent at night), reducing excessive child questioning or reassurance-seeking behavior, and engaging in forced school attendance under strict conditions. Parent-based techniques have received strong support in the literature in general, but have been applied specifically to youths with school refusal behavior less frequently than child-based techniques.
Family-based techniques include developing written contracts to increase incentives for school attendance and decrease incentives for nonattendance, escorting a child to school and classes, and teaching youths to refuse offers from peers to miss school.29 As with parent-based techniques, family-based techniques have received strong support in the literature in general, but have been applied specifically to youths with school refusal behavior less frequently than child-based techniques.
Gradual reintroduction to school
A preferred approach to resolve school refusal behavior usually involves gradual reintegration to school and classes. This may include initial attendance at lunchtime, 1 or 2 favorite classes, or in an alternative classroom setting such as a guidance counselor’s office or school library. Gradual reintegration into a regular classroom setting may then proceed.
If possible, a child should remain in the school setting during the day and not be sent home unless intense medical symptoms are present.30 A recommended list regarding the latter includes frequent vomiting, bleeding, temperature greater than 100°F, severe diarrhea, lice, acute flu-like symptoms, or an extreme medical condition such as intense pain.
The outcome for Nathan
Using a structured diagnostic interview and other behavioral assessment measures, Nathan’s psychologist concluded that the teenager met criteria for generalized anxiety disorder. He worried excessively about his social and academic performance at school and displayed several somatic complaints related to anxiety. His treatment thus involved a two-pronged approach.
Nathan’s physician placed him on a regimen of sertraline, 50 mg/d, which has been found to significantly reduce symptoms of generalized anxiety disorder in youths aged 5 to 17 years. In addition, Nathan’s psychologist implemented child-based anxiety management techniques as well as family therapy to increase incentives for school attendance and limit fun activities during a school day spent at home. The physician and psychologist collaborated with school personnel as well to gradually reintroduce Nathan to a full-time academic schedule.
Final comments
School refusal behavior sometimes is severe and intransigent, and requires a multidisciplinary approach. Cooperation and communication among parents, physicians, mental health professionals, and school officials is often crucial for resolving any particular case of school refusal behavior. The references at the end of this article provide more detailed information and note advances in the field.
CORRESPONDENCE
Christopher A. Kearney, PhD, Department of Psychology, University of Nevada, Las Vegas, 4505 Maryland Parkway, Las Vegas, NV 89154-5030. E-mail: [email protected]
1. Kearney CA, Silverman WK. The evolution and reconciliation of taxonomic strategies for school refusal behavior. Clin Psychol: Sci Prac 1996;3:339-354.
2. Kearney CA. School refusal behavior in youth: A functional approach to assessment and treatment. Washington, DC: American Psychological Association; 2001.
3. Hansen C, Sanders SL, Massaro S, Last CG. Predictors of severity of absenteeism in children with anxiety-based school refusal. J Clin Child Psychol 1998;27:246-254.
4. Franklin CG, Soto I. Keeping Hispanic youths in school. Children & Schools 2002;24:139-143.
5. Egger HL, Costello EJ, Angold A. School refusal and psychiatric disorders: A community study. J Am Acad Child Adolesc Psychiatry 2003;42:797-807.
6. McShane G, Walter G, Rey JM. Characteristics of adolescents with school refusal. Aust New Zeal J Psychiatry 2001;35:822-826.
7. Kearney CA, Albano AM. The functional profiles of school refusal behavior: Diagnostic aspects. Behav Modif 2004;28:147-161.
8. Bernstein GA, Massie ED, Thuras PD, Perwien AR, Borchardt CM, Crosby RD. Somatic symptoms in anxious-depressed school refusers. J Amer Acad Child Adolesc Psychiatry 1997;36:661-668.
9. Gilliland FD, Berhane K, Islam T, et al. Environmental tobacco smoke and absenteeism related to respiratory illness in schoolchildren. Am J Epidemiology 2003;157:861-869.
10. Glaab LA, Brown R, Daneman D. School attendance in children with type I diabetes. Diabetic Med 2005;22:421-426.
11. Levy RL, Whitehead WE, Walker LS, et al. Increased somatic complaints and health-care utilization in children: Effects of parent IBS status and parent response to gastrointestinal symptoms. Am J Gastroenterology 2004;99:2442-2451.
12. Buitelaar JK, van Andel H, Duyx, JHM, van Strien DC. Depressive and anxiety disorders in adolescence: A follow-up study of adolescents with school refusal. Acta Paedopsychiatrica 1994;56:249-253.
13. Flakierska-Praquin N, Lindstrom M, Gillberg C. School phobia with separation anxiety disorder: A comparative 20- to 29-year follow-up study of 35 school refusers. Comp Psychiatry 1997;38:17-22.
14. Hibbett A, Fogelman K. Future lives of truants: Family formation and health-related behaviour. Brit J Educ Psychology 1990;60:171-179.
15. Hibbett A, Fogelman K, Manor O. Occupational outcomes of truancy. Brit J Educ Psychology 1990;60:23-36.
16. Kearney CA. Bridging the gap among professionals who address youth with school absenteeism: Overview and suggestions for consensus. Prof Psychol Res Prac 2003;34:57-65.
17. King NJ, Heyne D, Tonge B, Gullone E, Ollendick TH. School refusal: Categorical diagnoses, functional analysis and treatment planning. Clin Psychol Psychother 2001;8:352-360.
18. Kearney CA. Identifying the function of school refusal behavior: A revision of the School Refusal Assessment Scale. J Psychopathol Behav Assess 2002;24:235-245.
19. Kearney CA. Confirmatory factor analysis of the School Refusal Assessment Scale-Revised: Child and parent versions. J Psychopathol Behav Assess 2006; in press.
20. Bernstein GA, Borchardt CM, Perwein AR, et al. Imipramine plus cognitive-behavioral therapy in the treatment of school refusal. J Amer Acad Chil Adol Psychiatry 2000;39:276-283.
21. Kearney CA, Silverman WK. A critical review of pharmacotherapy for youth with anxiety disorders: Things are not as they seem. J Anx Dis 1998;12:83-102.
22. Layne AE, Bernstein GA, Egan EA, Kushner MG. Predictors of treatment response in anxious-depressed adolescents with school refusal. J Amer Acad Chil Adol Psychiatry 2003;42:319-326.
23. Compton SN, Grant PJ, Chrisman AK, Gammon PJ, Brown VL, March JS. Sertraline in children and adolescents with social anxiety disorder: An open trial. J Amer Acad Chil Adol Psychiatry 2001;40:564-571.
24. Whittington CJ, Kendall T, Fonagy T, Cottrell D, Cotgrove A, Boddington E. Selective serotonin reuptake inhibitors in childhood depression: Systematic review of published versus unpublished data. Lancet 2004;363:1341-1345.
25. Kearney CA, Silverman WK. Functionally-based prescriptive and nonprescriptive treatment for children and adolescents with school refusal behavior. Behav Ther 1999;30:673-695.
26. King NJ, Tonge BJ, Heyne D, et al. Cognitive-behavioral treatment of school-refusing children: A controlled evaluation. J Amer Acad Chil Adol Psychiatry 1998;37:395-403.
27. Last CG, Hansen C, Franco N. Cognitive-behavioral treatment of school phobia. J Amer Acad Chil Adol Psychiatry 1998;37:404-411.
28. Ebell MH, Siwek J, Weiss BD, et al. Strength of recommendation taxonomy (SORT): A patient-centered approach to grading evidence in the medical literature J Fam Pract 2004;53:111-120.
29. Kearney CA, Albano AM. When children refuse school: A cognitive-behavioral therapy approach/Therapist’s guide. San Antonio, Tex: Psychological Corporation, 2000.
30. Kearney CA, Bates M. Addressing school refusal behavior: Suggestions for frontline professionals. Children & Schools 2005;27:207-216.
31. Seidel L, Walkup JT. Selective serotonin reuptake inhibitor use in the treatment of the pediatric non-obsessive-compulsive disorder anxiety diagnoses. J Child Adol Psychopharm 2006;16:171-179.
- You can help assess forms of a child’s school refusal behavior as well as reinforcers that maintain the problem (B).
- All youths with school refusal behavior should be assessed for severe anxiety and depression (C).
- You can treat medical conditions associated with school refusal behavior, provide pharmacotherapy for severe anxiety and depression, and work with school-based personnel and a clinical child psychologist to gradually reintroduce a child to school and address comorbid educational, psychological, and familial problems (A).
Nathan is a 13-year-old boy referred by his parents to a family physician for recent school refusal behavior. Nathan has had difficulty adjusting to middle school and has already been marked absent one-third of school days this academic year. These absences have come in the form of tardiness, skipped classes, and full-day absences. Nathan complains of headaches and stomachaches and says he feels upset and nervous while in school. His parents, however, complain that Nathan seems fine on weekends and holidays and seems to be embellishing symptoms to miss school. Nathan’s parents are concerned that their son may have some physical or mental condition that is preventing his school attendance and that might be remediated with medication.
Child-motivated refusal to attend school or to remain in classes for an entire day is not that uncommon. The problem affects 5% to 28% of youths at some time during their lives and is often referred first by parents to the attention of a family physician.1-2
The behavior may be viewed along a spectrum of absenteeism ( FIGURE), and a child may exhibit all forms of absenteeism at one time or another. In Nathan’s case, for example, he could be anxious during school on Monday, arrive late to school on Tuesday, skip afternoon classes on Wednesday, and fail to attend school completely on Thursday and Friday.
In this article you will learn characteristics of school refusal behavior to watch for and assess, and treatment strategies for youths aged 5 to 17 years. You will also find advice and techniques to offer parents.
FIGURE
A child may exhibit each behavior on this spectrum at different times
Characteristics of youths with school refusal behavior
School refusal behavior is a term than encompasses all subsets of problematic absenteeism, such as truancy, school phobia, and separation anxiety.3 Children and adolescents of all ages, and boys and girls alike, can exhibit school refusal behavior. The most common age of onset, however, is 10 to 13 years. In addition, youths who are entering a school building for the first time, especially elementary and middle school (as was the case for Nathan), are at particular risk for school refusal behavior. Little information is available regarding ethnic differences, although school dropout rates for Hispanics are often considerably elevated compared with other ethnic groups.4-5
School refusal behavior covers a range of symptoms, diagnoses, somatic complaints, and medical conditions (TABLES 1-3).6-12 Longitudinal studies indicate that, if left unaddressed, school refusal behavior can lead to serious short-term problems such as distress, academic decline, alienation from peers, family conflict, and financial and legal consequences. Common long-term problems include school dropout, delinquent behaviors, economic deprivation, social isolation, marital problems, and difficulty maintaining employment. Approximately 52% of adolescents with school refusal behavior meet criteria for an anxiety, depressive, conduct-personality, or other psychiatric disorder later in life.13-16
TABLE 1
Common symptoms that could signal school refusal behavior
| INTERNALIZING/COVERT SYMPTOM | EXTERNALIZING/OVERT SYMPTOM |
|---|---|
| Depression | Aggression |
| Fatigue/tiredness | Clinging to an adult |
| Fear and panic | Excessive reassurance-seeking behavior |
| General and social anxiety | Noncompliance and defiance |
| Self-consciousness | Refusal to move in the morning |
| Somatization | Running away from school or home |
| Worry | Temper tantrums and crying |
TABLE 2
Primary psychiatric disorders among youths with school refusal behavior
| DIAGNOSIS | PERCENTAGE |
|---|---|
| No diagnosis | 32.9 |
| Separation anxiety disorder | 22.4 |
| Generalized anxiety disorder | 10.5 |
| Oppositional defiant disorder | 8.4 |
| Major depression | 4.9 |
| Specific phobia | 4.2 |
| Social anxiety disorder | 3.5 |
| Conduct disorder | 2.8 |
| Attention deficit/hyperactivity disorder | 1.4 |
| Panic disorder | 1.4 |
| Enuresis | 0.7 |
| Posttraumatic stress disorder | 0.7 |
| Source: Adapted from Kearney and Albano (2004). | |
TABLE 3
Rule out these somatic complaints and medical conditions commonly associated with school refusal behavior
| SOMATIC COMPLAINT | MEDICAL CONDITION |
|---|---|
| Diarrhea/irritable bowel | Allergic rhinitis |
| Fatigue | Asthma and respiratory illness |
| Headache and stomachache | Chronic pain and illness (notably cancer, Crohn’s disease, dyspepsia, hemophilia, chronic fatigue syndrome) |
| Nausea and vomiting | Diabetes |
| Palpitations and perspiration | Dysmenorrhea |
| Recurrent abdominal pain or other pain | Head louse infestation |
| Shaking or trembling | Influenza |
| Sleep problems | Orodental disease |
Getting to the bottom of school refusal behavior
If a child has somatic complaints, you can expect to find that the child is (1) suffering from a true physical malady, (2) embellishing low-grade physical symptoms from stress or attention-seeking behavior, or (3) reporting physical problems that have no medical basis. A full medical examination is always recommended to rule out organic problems or to properly treat true medical conditions.
If no medical condition is found, explore the reasons a particular child refuses school. A common model of conceptualizing school refusal behavior involves reinforcers1-2:
- To avoid school-based stimuli that provoke a sense of negative affectivity, or combined anxiety and depression; examples of key stimuli include teachers, peers, bus, cafeteria, classroom, and transitions between classes
- To escape aversive social or evaluative situations such as conversing or otherwise interacting with others or performing before others as in class presentations
- To pursue attention from significant others, such as wanting to stay home or go to work with parents
- To pursue tangible reinforcers outside of school, such as sleeping late, watching television, playing with friends, or engaging in delinquent behavior or substance use.
The first 2 functions are maintained by negative reinforcement, or a desire to leave anxiety-provoking stimuli. The latter 2 functions are maintained by positive reinforcement, or a desire to pursue rewards outside of school. Youths may also refuse school for a combination of these reasons.17 In Nathan’s case, he was initially anxious about school in general (function 1) but, after his parents allowed him to stay home for a few days, was refusing school as well to enjoy fun activities (eg, video games) at home (function 4).
One method for quickly assessing the role of these 4 functions is the School Refusal Assessment Scale–Revised.18,19 This scale poses 24 questions, the answers to which measure the relative strength of each of the 4 functions. Versions are available for children and parents, who complete their respective scales separately (TABLES 4-5). Item means are calculated across the measures to help determine the primary reason for a child’s school refusal.
In addition to using the School Refusal Assessment Scale–Revised, you may ask interview questions regarding the form and function of school refusal behavior (TABLE 6). Take care to assess attendance history and patterns, comorbid conditions, instances of legitimate absenteeism, family disruption, and a child’s social and academic status. Specific questions about function can help narrow the reason for school refusal.
Assess specific school-related stimuli that provoke absenteeism (eg, social and evaluative situations), whether a child could attend school with a parent (evidence of attention-seeking), and what tangible rewards a child receives for absenteeism throughout the school day. Information about the form and function of school refusal behavior may also be evident during in-office observations of the family. Data from the School Refusal Assessment Scale-Revised, interviews, and observations can then be used to recommend particular treatment options.
TABLE 4
Child version of the School Refusal Assessment Scale–Revised
|
| NOTE: (1)=avoidance of school-related stimuli that provoke a sense of negative affectivity, (2)=escape aversive social and/or evaluative situations, (3) pursuit of attention from significant others, (4) pursuit of tangible reinforcers outside of school. |
| NOTE: Items are scored on a 0-6 scale where 0=never, 1=seldom, 2=sometimes, 3=half the time, 4=usually, 5=almost always, and 6=always. |
TABLE 5
Parent version of the School Refusal Assessment Scale–Revised
|
| NOTE: (1)=avoidance of school-related stimuli that provoke a sense of negative affectivity, (2)=escape aversive social and/or evaluative situations, (3) pursuit of attention from significant others, (4) pursuit of tangible reinforcers outside of school. |
| NOTE: Items are scored on a 0-6 scale where 0=never, 1=seldom, 2=sometimes, 3=half the time, 4=usually, 5=almost always, and 6=always. |
TABLE 6
Sample questions and targets of assessment regarding the forms of school refusal behavior
| QUESTIONS RELATED TO THE FORM OF SCHOOL REFUSAL BEHAVIOR |
| What are the child’s specific forms of absenteeism, and how do these forms change daily? |
| Is a child’s school refusal behavior relatively acute or chronic in nature (in related fashion, how did the child’s school refusal behavior develop over time)? |
| What comorbid conditions occur with a child’s school refusal behavior (see TABLE 3), including substance abuse? |
| What is the child’s degree of anxiety or misbehavior upon entering school, and what specific misbehaviors are present in the morning before school (see TABLES 2 AND 4)? |
| What specific school-related stimuli are provoking the child’s concern about going to school? |
| Is the child’s refusal to attend school legitimate or understandable in some way (eg, school-based threat, bullying, inadequate school climate)? |
| What family disruption or conflict has occurred as a result of a child’s school refusal behavior? |
| What is the child’s academic and social status (this should include a review of academic records, formal evaluation reports, attendance records, and individualized education plans or 504 plans as applicable)? |
| QUESTIONS RELATED TO THE FUNCTION OF SCHOOL REFUSAL BEHAVIOR |
| Have recent or traumatic home or school events occurred to influence a child’s school refusal behavior? |
| Are symptoms of school refusal behavior evident on weekends and holidays? |
| Are there any non-school situations where anxiety or attention-seeking behavior occurs? |
| What specific social and/or evaluative situations at school are avoided? |
| Is the child willing to attend school if a parent accompanied him or her? |
| What specific tangible rewards does the child pursue outside of school that causes him or her to miss school? |
| Is the child willing to attend school if incentives were provided for attendance? |
Treating youths with school refusal behavior
Should you choose to address more than a diagnosed physical condition contributing to school refusal behavior, various resources are available to you. Medications have proven useful in alleviating severe cases of anxiety and depression. And cognitive management techniques can be applied to the child, the parents, and the family together.
Treatment success will be better assured, too, if you work closely with school personnel and a clinical child psychologist to gather and share information, coordinate a plan for returning a child to school, and address familial and comorbid psychological problems that impact attendance.
When to consider anxiolytics or antidepressants
Pharmacotherapy research for school refusal behavior is in its infancy. However, some investigators have found that tricyclic antidepressant such as imipramine may be useful in some cases20-21—generally for children with better attendance records and fewer symptoms of social avoidance and separation anxiety.22
With respect to substantial child anxiety and depression without school refusal behavior, researchers have focused on selective serotonin reuptake inhibitors. In particular, fluoxetine, fluvoxamine, sertraline, and paroxetine have been useful for youths with symptoms of general and social anxiety and depression,23,24 However, youths often do not respond to these medications as well as adults because of the fluid and amorphous nature of anxious and depressive symptomatology in children and adolescents.
Useful psychological techniques
Sophisticated Level 1 clinical controlled studies on treatment of diverse youths with school refusal behavior have appeared in recent literature.25-28 Options for this population may be generally arranged according to function or the set of reinforcers primarily maintaining absenteeism:
- Child-based techniques to manage anxiety in a school setting
- Parent-based techniques to manage contingencies for school attendance and nonattendance
- Family-based techniques to manage incentives and disincentives for school attendance and nonattendance.
Child-based anxiety management techniques include relaxation training, breathing retraining, cognitive therapy (generally for youths aged 9–17 years), and exposure-based practices to gradually reintroduce a child to school. These techniques have been strongly supported by randomized controlled trials specific to school refusal behavior (see above) and are useful for treating general anxiety and depression in these youths as well.
Parent-based contingency management techniques include establishing morning and evening routines, modifying parental commands toward brevity and clarity, providing attention-based consequences for school nonattendance (eg, early bedtime, limited time with a parent at night), reducing excessive child questioning or reassurance-seeking behavior, and engaging in forced school attendance under strict conditions. Parent-based techniques have received strong support in the literature in general, but have been applied specifically to youths with school refusal behavior less frequently than child-based techniques.
Family-based techniques include developing written contracts to increase incentives for school attendance and decrease incentives for nonattendance, escorting a child to school and classes, and teaching youths to refuse offers from peers to miss school.29 As with parent-based techniques, family-based techniques have received strong support in the literature in general, but have been applied specifically to youths with school refusal behavior less frequently than child-based techniques.
Gradual reintroduction to school
A preferred approach to resolve school refusal behavior usually involves gradual reintegration to school and classes. This may include initial attendance at lunchtime, 1 or 2 favorite classes, or in an alternative classroom setting such as a guidance counselor’s office or school library. Gradual reintegration into a regular classroom setting may then proceed.
If possible, a child should remain in the school setting during the day and not be sent home unless intense medical symptoms are present.30 A recommended list regarding the latter includes frequent vomiting, bleeding, temperature greater than 100°F, severe diarrhea, lice, acute flu-like symptoms, or an extreme medical condition such as intense pain.
The outcome for Nathan
Using a structured diagnostic interview and other behavioral assessment measures, Nathan’s psychologist concluded that the teenager met criteria for generalized anxiety disorder. He worried excessively about his social and academic performance at school and displayed several somatic complaints related to anxiety. His treatment thus involved a two-pronged approach.
Nathan’s physician placed him on a regimen of sertraline, 50 mg/d, which has been found to significantly reduce symptoms of generalized anxiety disorder in youths aged 5 to 17 years. In addition, Nathan’s psychologist implemented child-based anxiety management techniques as well as family therapy to increase incentives for school attendance and limit fun activities during a school day spent at home. The physician and psychologist collaborated with school personnel as well to gradually reintroduce Nathan to a full-time academic schedule.
Final comments
School refusal behavior sometimes is severe and intransigent, and requires a multidisciplinary approach. Cooperation and communication among parents, physicians, mental health professionals, and school officials is often crucial for resolving any particular case of school refusal behavior. The references at the end of this article provide more detailed information and note advances in the field.
CORRESPONDENCE
Christopher A. Kearney, PhD, Department of Psychology, University of Nevada, Las Vegas, 4505 Maryland Parkway, Las Vegas, NV 89154-5030. E-mail: [email protected]
1. Kearney CA, Silverman WK. The evolution and reconciliation of taxonomic strategies for school refusal behavior. Clin Psychol: Sci Prac 1996;3:339-354.
2. Kearney CA. School refusal behavior in youth: A functional approach to assessment and treatment. Washington, DC: American Psychological Association; 2001.
3. Hansen C, Sanders SL, Massaro S, Last CG. Predictors of severity of absenteeism in children with anxiety-based school refusal. J Clin Child Psychol 1998;27:246-254.
4. Franklin CG, Soto I. Keeping Hispanic youths in school. Children & Schools 2002;24:139-143.
5. Egger HL, Costello EJ, Angold A. School refusal and psychiatric disorders: A community study. J Am Acad Child Adolesc Psychiatry 2003;42:797-807.
6. McShane G, Walter G, Rey JM. Characteristics of adolescents with school refusal. Aust New Zeal J Psychiatry 2001;35:822-826.
7. Kearney CA, Albano AM. The functional profiles of school refusal behavior: Diagnostic aspects. Behav Modif 2004;28:147-161.
8. Bernstein GA, Massie ED, Thuras PD, Perwien AR, Borchardt CM, Crosby RD. Somatic symptoms in anxious-depressed school refusers. J Amer Acad Child Adolesc Psychiatry 1997;36:661-668.
9. Gilliland FD, Berhane K, Islam T, et al. Environmental tobacco smoke and absenteeism related to respiratory illness in schoolchildren. Am J Epidemiology 2003;157:861-869.
10. Glaab LA, Brown R, Daneman D. School attendance in children with type I diabetes. Diabetic Med 2005;22:421-426.
11. Levy RL, Whitehead WE, Walker LS, et al. Increased somatic complaints and health-care utilization in children: Effects of parent IBS status and parent response to gastrointestinal symptoms. Am J Gastroenterology 2004;99:2442-2451.
12. Buitelaar JK, van Andel H, Duyx, JHM, van Strien DC. Depressive and anxiety disorders in adolescence: A follow-up study of adolescents with school refusal. Acta Paedopsychiatrica 1994;56:249-253.
13. Flakierska-Praquin N, Lindstrom M, Gillberg C. School phobia with separation anxiety disorder: A comparative 20- to 29-year follow-up study of 35 school refusers. Comp Psychiatry 1997;38:17-22.
14. Hibbett A, Fogelman K. Future lives of truants: Family formation and health-related behaviour. Brit J Educ Psychology 1990;60:171-179.
15. Hibbett A, Fogelman K, Manor O. Occupational outcomes of truancy. Brit J Educ Psychology 1990;60:23-36.
16. Kearney CA. Bridging the gap among professionals who address youth with school absenteeism: Overview and suggestions for consensus. Prof Psychol Res Prac 2003;34:57-65.
17. King NJ, Heyne D, Tonge B, Gullone E, Ollendick TH. School refusal: Categorical diagnoses, functional analysis and treatment planning. Clin Psychol Psychother 2001;8:352-360.
18. Kearney CA. Identifying the function of school refusal behavior: A revision of the School Refusal Assessment Scale. J Psychopathol Behav Assess 2002;24:235-245.
19. Kearney CA. Confirmatory factor analysis of the School Refusal Assessment Scale-Revised: Child and parent versions. J Psychopathol Behav Assess 2006; in press.
20. Bernstein GA, Borchardt CM, Perwein AR, et al. Imipramine plus cognitive-behavioral therapy in the treatment of school refusal. J Amer Acad Chil Adol Psychiatry 2000;39:276-283.
21. Kearney CA, Silverman WK. A critical review of pharmacotherapy for youth with anxiety disorders: Things are not as they seem. J Anx Dis 1998;12:83-102.
22. Layne AE, Bernstein GA, Egan EA, Kushner MG. Predictors of treatment response in anxious-depressed adolescents with school refusal. J Amer Acad Chil Adol Psychiatry 2003;42:319-326.
23. Compton SN, Grant PJ, Chrisman AK, Gammon PJ, Brown VL, March JS. Sertraline in children and adolescents with social anxiety disorder: An open trial. J Amer Acad Chil Adol Psychiatry 2001;40:564-571.
24. Whittington CJ, Kendall T, Fonagy T, Cottrell D, Cotgrove A, Boddington E. Selective serotonin reuptake inhibitors in childhood depression: Systematic review of published versus unpublished data. Lancet 2004;363:1341-1345.
25. Kearney CA, Silverman WK. Functionally-based prescriptive and nonprescriptive treatment for children and adolescents with school refusal behavior. Behav Ther 1999;30:673-695.
26. King NJ, Tonge BJ, Heyne D, et al. Cognitive-behavioral treatment of school-refusing children: A controlled evaluation. J Amer Acad Chil Adol Psychiatry 1998;37:395-403.
27. Last CG, Hansen C, Franco N. Cognitive-behavioral treatment of school phobia. J Amer Acad Chil Adol Psychiatry 1998;37:404-411.
28. Ebell MH, Siwek J, Weiss BD, et al. Strength of recommendation taxonomy (SORT): A patient-centered approach to grading evidence in the medical literature J Fam Pract 2004;53:111-120.
29. Kearney CA, Albano AM. When children refuse school: A cognitive-behavioral therapy approach/Therapist’s guide. San Antonio, Tex: Psychological Corporation, 2000.
30. Kearney CA, Bates M. Addressing school refusal behavior: Suggestions for frontline professionals. Children & Schools 2005;27:207-216.
31. Seidel L, Walkup JT. Selective serotonin reuptake inhibitor use in the treatment of the pediatric non-obsessive-compulsive disorder anxiety diagnoses. J Child Adol Psychopharm 2006;16:171-179.
Chronic constipation: Let symptom type and severity direct treatment
- Increased fiber intake through diet (C) or fiber supplements (B) is an appropriate initial therapy for chronic constipation.
- Osmotic and stimulant laxatives may be administered to patients who do not respond to more conservative measures if the limitations of these agents are explained (B).
- Tegaserod, a selective 5-hydroxytryptamine type 4 (5-HT4) receptor partial agonist, is more effective than placebo at relieving symptoms of chronic idiopathic constipation in patients younger than 65 years of age (A).
- Patients with suspected defecation disorders and those with treatment-refractory symptoms should be referred to a gastroenterologist for further evaluation (C).
By the time a patient sees you with a complaint of constipation, chances are she has tried a remedy or 2 and is now looking for something new. However, the abandoned remedies may yet prove useful, depending on the nature of her complaint and on her understanding of how the remedy was supposed to have worked. In this article, we discuss the benefits and limitations of several treatment options in managing a patient’s distinct condition, as assessed in part 1 (page 580).
Symptom-focused treatment
As per the ACG Task Force guidelines, initial treatment of chronic constipation (in the absence of alarm features and secondary causes) is empiric.1 The patient’s symptoms—specifically those most bother-some—should direct your decisions. A plan so guided will also help you manage the patient’s expectations.
Address patients’ prior disappointments
Most patients will have self-treated before coming to see you, and some even will have tried prescribed regimens. Initial treatment of constipation has traditionally involved lifestyle changes (eg, diet, fluid, exercise modification), increased fiber intake, and laxatives. However, evidence supporting use of these modalities in this setting is sparse, and patient surveys often show dissatisfaction with these approaches. For instance, a web-based survey showed that 96% of patients with chronic constipation have tried some form of traditional medication (eg, bulking agents, stool softeners, laxatives).2 Overall, 47% were not satisfied with their current treatment, primarily because of inadequate symptom relief and unwanted side effects.
Furthermore, patient compliance with some therapies is poor because of side effects such as flatulence, distension, and bloating. Two recently published systematic reviews evaluating treatment options for patients with chronic constipation came to similar conclusions.1,3
Below we discuss the ACG Chronic Constipation Task Force conclusions and recommendations.1 Explicit communication with patients about what they can expect will help ensure treatment success.
Prescribe fiber, increase water intake
Just a few clinical trials have evaluated the effects of lifestyle changes on constipation symptoms, and they have generally been poorly designed or involved small numbers of patients (TABLE).4-7
Educating patients about proper nutrition and designating a time for daily defecation are common initial approaches, but efficacy of these strategies in this patient population has not been established (SOR: C).4,5
Exercise has dubious value. Exercise is often recommended as a way to treat constipation because of its purported effect on reducing gastrointestinal (GI) transit time (SOR: C).6 However, uncontrolled studies have found that aerobic exercise does not necessarily decrease transit time and may actually prolong it.6
Increasing water alone generally unhelpful… Few data support the benefits of increased fluid consumption, except for dehydrated patients. In one study, increased intake (to 1 L/d) of water or isotonic fluid had no effect on the stool weight of healthy volunteers.4
…but fiber plus water works. However, in a study involving patients with chronic constipation, a high-fiber diet and 2 L/d of water increased frequency of bowel movements and reduced use of laxatives compared with the same diet and ad libitum fluid intake (P<.001). By binding water, fiber increases stool weight, softens stool, decreases colonic transit time, and increases GI motility.4,5,8,9
You can recommend that patients gradually increase fiber intake over several weeks to a total of 20 g/d to 25 g/d)18 through fiber-rich foods (vegetables [eg, carrots, broccoli, string beans], fruits [eg, peaches, apples, oranges], whole-grain breads, pasta, cereal, etc) (SOR: C) or bulk supplements (eg, psyllium, methylcellulose, and polycarbophil) (SOR: B). In conjunction with other lifestyle modifications, this is a reasonable management decision.11 Because failure to balance the ratio between fiber and fluid can worsen constipation, and even cause intestinal obstruction, tell patients who increase their fiber consumption to also increase their fluid intake (30 mL/kg body weight daily).5,12
Caveats. Few data support the benefits of this approach. Epidemiologic studies show a low prevalence of constipation in countries in which fiber-rich diets are the norm,8 but extrapolating data from healthy populations to constipated patients may not be justified.13 In fact, few data from controlled trials support the use of fiber therapy in patients with constipation. In the uncontrolled Nurses’ Health Study, subjects in the highest quintile of dietary fiber intake (median intake, 20 g/d) were less likely to have constipation than those in the lowest quintile (median intake, 7 g/d).14 This general dearth of evidence led the ACG Chronic Constipation Task Force to conclude that psyllium increases stool frequency in patients with chronic constipation (ACG grade: B) but that there are insufficient data to make a recommendation about the efficacy of calcium polycarbophil, methylcellulose, and bran in this patient population (ACG grade: B).1
Important points for patients. Counsel patients for whom you recommend fiber intake that it may take several weeks for them to experience relief,5,8 and that long-term fiber use may cause abdominal distension, bloating, and flatulence.4,5,8,15 Few serious adverse effects (eg, delayed gastric emptying, anorexia, and iron and calcium malabsorption) are associated with bulking agents; however, fecal impaction may occur in patients with severe colonic inertia.16
Hypersensitivity reactions have been reported in patients who ingest psyllium and in healthcare workers exposed to it.16
Osmotic laxatives may help
When increased fiber intake fails to alleviate symptoms of constipation, patients are often prescribed an osmotic laxative (eg, magnesium hydroxide, magnesium citrate, sodium phosphate, or polyethylene glycol [PEG]) (SOR: B), which promotes water secretion in the intestines.4,8,15 However, several days may pass before the laxatives take effect, and they are indicated only for short-term use in patients with occasional constipation.1
Common adverse effects include abdominal cramping, bloating, and flatulence.4,10,17 More serious adverse effects include hypermagnesemia, hyperphosphatemia, hypercalcemia, hyponatremia, hypokalemia, hypovolemia, and diarrhea1,16 ; the incidences of these events were not reported.
The ACG Task Force gave PEG and lactulose grade A recommendations, based on the quality of evidence supporting their effectiveness at improving stool frequency and stool consistency in patients with chronic constipation.1 PEG was the only laxative shown in clinical trials to improve bowel movement frequency, stool consistency, and colonic transit time. However, this conclusion was based on analysis of all formulations—PMF-100, PEG 3350, PEG/electrolyte solutions, and high-molecular-weight PEG (PEG 4000); PEG 3350 (Miralax), the only PEG formulation approved by the FDA for use in patients with constipation, is indicated specifically for patients with occasional constipation. The Task Force determined that data were insufficient to make a recommendation for milk of magnesia (ACG grade: B).1
Stimulant laxatives, if all else fails
Stimulants (eg, bisacodyl, cascara, senna, ricinoleic acid) cause rhythmic muscle contractions in the intestines and increase intestinal motility and secretions.4,5,9,15,17 Controlled study data for stimulant laxatives are sparse (SOR: B).18 They work within hours,12,15,17,19 but use them judiciously.9
A common adverse effect is abdominal pain; more serious adverse effects include electrolyte imbalances, allergic reactions, and hepatotoxicity.1,16,20 However, these effects appear to be no more severe or frequent than effects of other constipation treatments. Long-term use can also cause benign pigmentation changes in the colon (Pseudomelanosis coli) and can lead to reduced colonic motility (colonic inertia).12,16
Given safety concerns with long-term use, reserve stimulant laxatives for patients who are refractory to or who cannot tolerate other agents.5,17 You should use them only as needed and for a brief time12 (the general guideline for most over-the-counter products is 1 week or less). The ACG Task Force concluded that data are insufficient to make recommendations for stimulant laxatives (ACG grade: B).1
Fiber or laxatives better?
A meta-analysis of randomized clinical trials found that fiber and laxatives increased bowel movement frequency by an overall weighted mean of 1.4 (95% confidence interval, 1.1–1.8) bowel movements per week.21 However, evidence was insufficient to establish whether fiber was superior to laxatives or whether one laxative class was superior to another.
Another meta-analysis found that, in studies lasting 4 weeks or less, fiber supplements and laxatives improved stool frequency (mean increase, 1.9 stool/week) and stool weight (mean increase, 476 g) but that these benefits were not clearly distinguishable from those of placebo (stool frequency, 1 stool; stool weight, 434 g).18
Large, well-designed, comparative trials of treatments for chronic constipation in adults are needed.22 Current literature contains few thoroughly reported studies of fiber and laxative use.18 Additionally, standardized measures to assess the adverse effects and outcomes (effects on quality of life) of specific agents have rarely been incorporated.18,22 Given the problematic safety/tolerability profiles of some laxatives, it is unknown whether they improve quality of life of patients with constipation.18
TABLE
Treatments for chronic constipation
| TREATMENT | EFFICACY | SOR | OUTCOMES MEASURED | COMMENTS |
|---|---|---|---|---|
| Lifestyle changes (Increased fluids, designated time for defecation, patient education)4,5,7 | High-fiber diet+2 L/d of water significantly increased bowel movement frequency and decreased laxative use (P<.001) compared with high-fiber diet alone (NNT=NA) | C | Stool weight BM frequency Laxative use | Not evaluated in controlled studies in which numbers of responders were reported |
| Exercise 4,6 | Crossover study of low-intensity physical activity minimally improved symptoms in 5 of 8 patients (NNT=1.6) | C | BM frequency, consistency Straining | Uncontrolled studies show inconsistent effects on stool weight and transit time |
| Increased dietary fiber 4,14 | In uncontrolled Nurses’ Health Study, women with high fiber intake were less likely than those with low intake to report constipation (NNT=NA) | C | BM frequency | Not evaluated in well-designed, controlled studies |
| Bulk fiber laxatives (Psyllium, methylcellulose, polycarbophil, ispaghula, bran, among others)13,18,36-38 | Improve overall bowel function at 4 weeks (NNT=7.5) | B | Bowel function at 4 weeks | Few controlled studies; efficacy results often reported only as mean scores, not as number (or %) of responders Adverse effects included abdominal pain, bloating, and flatulence |
| Osmotic laxatives (Magnesium hydroxide, magnesium citrate, sodium phosphate, polyethylene glycol, among others)4,8,15,30,39-42 | Compared with placebo, greater overall effectiveness, more effective in increasing bowel movement frequency, improving subjective well-being, and promoting complete remission of constipation (NNT=1.3–2.4) | B | Overall effectiveness BM frequency Subjective well-being related to defecation Complete remission of constipation | Few controlled studies; small populations in many studies; efficacy results often reported only as mean scores, not as number (or %) of responders |
| Adverse effects included nausea, abdominal pain or discomfort, bloating, distension, and flatulence | ||||
| Stimulant laxatives (Bisacodyl, cascara, senna, ricinoleic acid, ocusates, among others)4,15,22 | Improve bowel movement frequency (NNT=4–14.3) | B | Bowel movement frequency | Few controlled studies |
| Adverse effects include abdominal cramping, fluid and electrolyte depletion, diarrhea, allergic reactions | ||||
| 5-HT4 receptor agonists (Tegaserod)25-27 | More effective than placebo at relieving symptoms of chronic constipation (NNT=5.5–11.1) | A | Responder rate for CSBMs during first 4 weeks of treatment | Brief episodes of diarrhea, usually mild to moderate, may occur near the start of treatment; Safe for long-term use |
| NA, not applicable; NNT, number needed to treat; SOR, strength of recommendation; CSBM, complete spontaneous bowel movement. | ||||
Novel therapies
Tegaserod
Tegaserod (Zelnorm) is FDA-approved for treatment of women with IBS whose primary bowel symptom is constipation, and for treatment of chronic idiopathic constipation in women and men aged <65.23 The ACG Task Force determined that tegaserod increases the frequency of complete spontaneous bowel movements (CSBM), decreases straining, and improves stool consistency in patients with chronic constipation (ACG grade: A).1 Tegaserod binds with high affinity at human 5-HT4 receptors and augments peristalsis, increases colonic motility along the entire GI tract, and promotes intestinal secretions.23,24 (For more information on tegaserod’s mode of activity, see www.jfponline.com.)
Adverse effects. The most noteworthy adverse effect of tegaserod was diarrhea, occurring as brief episodes that were generally mild (not requiring antidiarrheal drugs), transient (occurring early after initiation of treatment and resolving after a couple of days), and self-limiting.25,26 Results of a single-blind, uncontrolled extension study in which 842 patients were administered tegaserod 2 mg or 6 mg for up to 13 months (total exposure was up to 16 months) were similar to those of shorter term studies, indicating that long-term treatment is safe and well-tolerated.27
Important advice for patients. Although tegaserod is generally well tolerated, counsel patients regarding its potential risk. Ischemic colitis, a vascular disorder that results from reduced blood flow in the colon, appears as a precaution in the current package insert.23 No cases of this condition were reported during clinical trials. Although reports of transient ischemic colitis were reported during postmarketing surveillance, they were not associated with long-term consequences, and they occurred at the expected rate in the general population and lower than the rate observed in IBS patients.23,28 To date, no vascular mechanism has been found that links colonic ischemia with tegaserod use.29 Nevertheless, patients for whom tegaserod is prescribed should be counseled to promptly report any symptoms consistent with this condition, including worsening abdominal pain, rectal bleeding, or bloody diarrhea.23
Lubiprostone
Lubiprostone (Amitiza) is a chloride channel activator that increases secretion of intestinal fluid. This agent significantly increases stool frequency, improves stool form, and decreases straining,30-32 and was recently FDA-approved for the treatment of patients with chronic idiopathic constipation.33 To date, data from lubiprostone clinical trials have not been published in full. As more data become available, it will be interesting to evaluate where this agent fits into the growing treatment armamentarium for chronic constipation.
Drugs in the pipeline
Several additional pharmacologic classes with unique modes of action are under investigation for the treatment of chronic constipation, including opioid antagonists and neurotrophic factors.34
When to use which agent
In the absence of specific guidelines dictating an order of treatment options for patients with chronic constipation, base your decision on such factors as the degree to which symptoms affect a patient’s daily life, results achieved with agents in the past, patient preference, and your clinical judgment and experience ( FIGURE ). Lifestyle modifications and traditional (primarily over-the-counter) therapies are typically the initial approaches for patients with milder symptoms. Patients experiencing moderate to severe constipation-associated symptoms, those who have experienced adverse effects, and those who have not achieved satisfactory relief of constipation should be evaluated for other treatment options, including prescription laxatives, tegaserod, and lubiprostone.
Because of the heterogeneity of this disorder, successful management is patient specific. Positive outcomes may include increased stool frequency, less straining, sense of complete evacuation, resolution of abdominal bloating, and passage of soft, formed stool. Optimally, these positive symptom outcomes will translate into better overall quality of life and the ability to return to normal work and personal activities. Importantly, education and continual open dialogue with the patient are crucial to managing expectations, both for the physician and for the patient.
FIGURE
Chronic primary constipation: Let symptom type and severity direct treatment choices 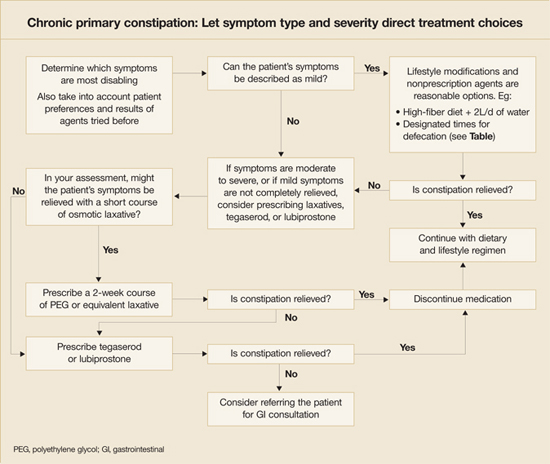
When referral is indicated
Though most patients with chronic constipation can be treated successfully in the primary care setting,35 a few may require referral to a gastroenterologist. Reasons may include the following:
- Suspicion of defecatory disorders (eg, pelvic floor dyssynergia)
- Lack of sufficient response to empiric treatment
- Worsening symptoms despite treatment
- Development of GI-associated alarm features requiring diagnostic procedures that may not be feasible to conduct in the primary care clinic setting (eg, balloon distension, anorectal manometry, defecography, colonic transit, barium enema, and colonoscopy).8
Ongoing communication with the consulting gastroenterologist is critical to maintaining optimal patient care. Use a referral form to clearly explain whether the patient is being referred for a procedure (eg, specific diagnostic test) or for a consultation (eg, temporary release of the patient to the gastroenterologist to further evaluate potential causes of symptoms); this will increase the likelihood that every-one’s expectations are satisfactorily met.
Acknowledgments
The author acknowledges the editorial assistance of Meera Nathan, PhD, Maribeth Bogush, PhD, and Sophia Shumyatsky, PharmD in the preparation of this manuscript.
CORRESPONDENCE
Scott D. Bleser, DO, FAAFP, Bellbrook Medical Center, Inc, 4336 State Route 725, Bellbrook, OH 45305-2742. E-mail: [email protected]
1. Brandt LJ, Schoenfeld P, Prather CM, Quigley EMM, Schiller LR, Talley NJ. Evidenced-based position statement on the management of chronic constipation in North America. Am J Gastroenterol 2005;100(suppl):S1-S21.
2. Schiller LR, Dennis E, Toth G. An internet-based survey of the prevalence and symptom spectrum of chronic constipation [abstract]. Am J Gastroenterol 2004;99:S234.-
3. Ramkumar D, Rao SSC. Efficacy and safety of traditional medical therapies for chronic constipation: systematic review. Am J Gastroenterol 2005;100:936-971.
4. Pampati V, Fogel R. Treatment options for primary constipation. Curr Treat Options Gastroenterol 2004;7:225-233.
5. Wald A. Constipation. Med Clin North Am 2000;84:1231-1246.
6. Meshkinpour H, Selod S, Movahedi H, et al. Effects of regular exercise in management of chronic idiopathic constipation. Dig Dis Sci 1998;43:2379-2383.
7. Anti M, Pignataro G, Armuzzi A, et al. Water supplementation enhances the effect of high-fiber diet on stool frequency and laxative consumption in adult patients with functional constipation. Hepatogastroenterology 1998;45:727-732.
8. Locke GR, III, Pemberton JH, Phillips SF. AGA technical review on constipation. Gastroenterol 2000;119:1766-1778.
9. Borum ML. Constipation: evaluation and management. Primary Care 2001;28:577-590.
10. Talley NJ. Management of chronic constipation. Rev Gastroenterol Disord 2004;4:18-24.
11. Locke GR, III, Pemberton JH, Phillips SF. AGA Medical Position Statement: guidelines on constipation. Gastroenterol 2000;119:1761-1766.
12. Doughty DB. When fiber is not enough: current thinking on constipation management. Ostomy Wound Manage 2002;48:30-41.
13. Cheskin LJ, Kamal N, Crowell MD, Schuster MM, Whitehead WE. Mechanisms of constipation in older persons and effects of fiber compared with placebo. J Am Geriatr Soc 1995;43:666-669.
14. Dukas L, Willett WC, Giovannucci EL. Association between physical activity, fiber intake, and other lifestyle variables and constipation in a study of women. Am J Gastroenterol 2003;98:1790-1796.
15. Lembo A, Camilleri M. Chronic constipation. N Engl J Med 2003;349:1360-1368.
16. Xing JH, Soffer EE. Adverse effects of laxatives. Dis Colon Rectum 2001;44:1201-1209.
17. Schiller LR. Review article: the therapy of constipation. Aliment Pharmacol Ther 2001;15:749-763.
18. Jones MP, Talley NJ, Nuyts G, Dubois D. Lack of objective evidence of efficacy of laxatives in chronic constipation. Dig Dis Sci 2002;47:2222-2230.
19. DiPalma JA. Current treatment options for chronic constipation. Rev Gastroenterol Disord 2004;(suppl 2):S34-S42.
20. Gattuso JM, Kamm MA. Adverse effects of drugs used in the management of constipation and diarrhoea. Drug Saf 1994;10:47-65.
21. Tramonte SM, Brand MB, Mulrow CD, Amato MG, O’Keefe ME, Ramirez G. The treatment of chronic constipation in adults. A systematic review. J Gen Intern Med 1997;12:15-24.
22. Petticrew M, Rodgers M, Booth A. Effectiveness of laxatives in adults. Qual Health Care 2001;10:268-273.
23. Zelnorm (tegaserod maleate) tablets [prescribing information]. East Hanover, NJ: Novartis; August 2004.
24. Appel-Dingemanse S. Clinical pharmacokinetics of tegaserod, a serotonin 5-HT4 receptor partial agonist with promotile activity. Clin Pharmacokinet 2002;41:1021-1042.
25. Johanson JF, Wald A, Tougas G, et al. Effect of tegaserod in chronic constipation: a randomized, double-blind, controlled trial. Clin Gastroenterol Hepatol 2004;2:796-805.
26. Kamm MA, Muller-Lissner S, Talley NJ, et al. Tegaserod for the treatment of chronic constipation: a randomized, double-blind, placebo-controlled multinational study. Am J Gastroenterol 2005;100:362-372.
27. Mueller-Lissner S, Kamm M, Haeck P, et al. Long-term safety and tolerability of tegaserod in chronic constipation (CC) [abstract]. Gastroenterol 2004;126(Suppl 2).-
28. Schoenfeld P. Review article: the safety profile of tegaserod. Aliment Pharmacol Ther 2004;20(suppl 7):25-30.
29. Joelsson BE, Shetzline MA, Cunningham S. Ischemic colitis associated with use of tegaserod [reply]. N Engl J Med 2004;351:1363-1364.
30. Johanson JF, Gargano MA, Holland PC, Patchen ML, Ueno R. Phase III, randomized withdrawal study of RU-0211, a novel chloride channel activator for the treatment of constipation [abstract]. Gastroenterol 2004;126(suppl 2):A100.-
31. Johanson JF, Gargano MA, Holland PC, Patchen ML, Ueno R. Phase III efficacy and safety of RU-0211, a novel chloride channel activator, for the treatment of constipation [abstract]. Gastroenterol 2003;124:A104.-
32. Johanson JF, Gargano MA, Patchen ML, Ueno R. Efficacy and safety of a novel compound, RU-0211, for the treatment of constipation [abstract]. Gastroenterol 2002;122:A-315.
33. Amitiza (lubiprostone) soft gelatin capsules [prescribing information]. Bethesda, Md: Sucampo Pharmaceuticals; 2006.
34. Schiller LR. New and emerging treatment options for chronic constipation. Rev Gastroenterol Dis 2004;4:S43-S51.
35. Sonnenberg A, Koch TR. Physician visits in the United States for constipation: 1958 to 1986. Dig Dis Sci 1989;34:606-611.
36. Dettmar PW, Sykes J. A multi-centre, general practice comparison of ispaghula husk with lactulose and other laxatives in the treatment of simple constipation. Curr Med Res Opin. 1998;14:227-233.
37. Badiali D, Corazziari E, Habib FI, et al. Effect of wheat bran in treatment of chronic nonorganic constipation: a double-blind controlled trial. Dig Dis Sci 1995;40:349-356.
38. McRorie JW, Daggy BP, Morel JG, Diersing PS, Miner PB, Robinson M. Psyllium is superior to docusate sodium for treatment of chronic constipation. Aliment Pharmacol Ther 1998;12:491-497.
39. Klauser AG, Muhldorfer BE, Voderholzer WA, Wenzel G, Muller-Lissner SA. Polyethylene glycol 4000 for slow transit constipation. Z Gastroenterol 1995;33:5-8.
40. Cleveland MV, Flavin DP, Ruben RA, Epstein RM, Clark GE. New polyethylene glycol laxative for treatment of constipation in adults: a randomized, double-blind, placebo-controlled study. South Med J 2001;94:478-481.
41. Corazziari E, Badiali D, Bazzocchi G, et al. Long-term efficacy, safety, and tolerability of low daily doses of isosmotic polyethylene glycol electrolyte balanced solution (PMF-100) in the treatment of functional chronic constipation. Gut 2000;46:522-526.
42. Corazziari E, Badiali D, Habib FI, et al. Small volume isosmotic polyethylene glycol electrolyte balanced solution (PMF-100) in treatment of chronic nonorganic constipation. Dig Dis Sci 1996;41:1636-1642.
- Increased fiber intake through diet (C) or fiber supplements (B) is an appropriate initial therapy for chronic constipation.
- Osmotic and stimulant laxatives may be administered to patients who do not respond to more conservative measures if the limitations of these agents are explained (B).
- Tegaserod, a selective 5-hydroxytryptamine type 4 (5-HT4) receptor partial agonist, is more effective than placebo at relieving symptoms of chronic idiopathic constipation in patients younger than 65 years of age (A).
- Patients with suspected defecation disorders and those with treatment-refractory symptoms should be referred to a gastroenterologist for further evaluation (C).
By the time a patient sees you with a complaint of constipation, chances are she has tried a remedy or 2 and is now looking for something new. However, the abandoned remedies may yet prove useful, depending on the nature of her complaint and on her understanding of how the remedy was supposed to have worked. In this article, we discuss the benefits and limitations of several treatment options in managing a patient’s distinct condition, as assessed in part 1 (page 580).
Symptom-focused treatment
As per the ACG Task Force guidelines, initial treatment of chronic constipation (in the absence of alarm features and secondary causes) is empiric.1 The patient’s symptoms—specifically those most bother-some—should direct your decisions. A plan so guided will also help you manage the patient’s expectations.
Address patients’ prior disappointments
Most patients will have self-treated before coming to see you, and some even will have tried prescribed regimens. Initial treatment of constipation has traditionally involved lifestyle changes (eg, diet, fluid, exercise modification), increased fiber intake, and laxatives. However, evidence supporting use of these modalities in this setting is sparse, and patient surveys often show dissatisfaction with these approaches. For instance, a web-based survey showed that 96% of patients with chronic constipation have tried some form of traditional medication (eg, bulking agents, stool softeners, laxatives).2 Overall, 47% were not satisfied with their current treatment, primarily because of inadequate symptom relief and unwanted side effects.
Furthermore, patient compliance with some therapies is poor because of side effects such as flatulence, distension, and bloating. Two recently published systematic reviews evaluating treatment options for patients with chronic constipation came to similar conclusions.1,3
Below we discuss the ACG Chronic Constipation Task Force conclusions and recommendations.1 Explicit communication with patients about what they can expect will help ensure treatment success.
Prescribe fiber, increase water intake
Just a few clinical trials have evaluated the effects of lifestyle changes on constipation symptoms, and they have generally been poorly designed or involved small numbers of patients (TABLE).4-7
Educating patients about proper nutrition and designating a time for daily defecation are common initial approaches, but efficacy of these strategies in this patient population has not been established (SOR: C).4,5
Exercise has dubious value. Exercise is often recommended as a way to treat constipation because of its purported effect on reducing gastrointestinal (GI) transit time (SOR: C).6 However, uncontrolled studies have found that aerobic exercise does not necessarily decrease transit time and may actually prolong it.6
Increasing water alone generally unhelpful… Few data support the benefits of increased fluid consumption, except for dehydrated patients. In one study, increased intake (to 1 L/d) of water or isotonic fluid had no effect on the stool weight of healthy volunteers.4
…but fiber plus water works. However, in a study involving patients with chronic constipation, a high-fiber diet and 2 L/d of water increased frequency of bowel movements and reduced use of laxatives compared with the same diet and ad libitum fluid intake (P<.001). By binding water, fiber increases stool weight, softens stool, decreases colonic transit time, and increases GI motility.4,5,8,9
You can recommend that patients gradually increase fiber intake over several weeks to a total of 20 g/d to 25 g/d)18 through fiber-rich foods (vegetables [eg, carrots, broccoli, string beans], fruits [eg, peaches, apples, oranges], whole-grain breads, pasta, cereal, etc) (SOR: C) or bulk supplements (eg, psyllium, methylcellulose, and polycarbophil) (SOR: B). In conjunction with other lifestyle modifications, this is a reasonable management decision.11 Because failure to balance the ratio between fiber and fluid can worsen constipation, and even cause intestinal obstruction, tell patients who increase their fiber consumption to also increase their fluid intake (30 mL/kg body weight daily).5,12
Caveats. Few data support the benefits of this approach. Epidemiologic studies show a low prevalence of constipation in countries in which fiber-rich diets are the norm,8 but extrapolating data from healthy populations to constipated patients may not be justified.13 In fact, few data from controlled trials support the use of fiber therapy in patients with constipation. In the uncontrolled Nurses’ Health Study, subjects in the highest quintile of dietary fiber intake (median intake, 20 g/d) were less likely to have constipation than those in the lowest quintile (median intake, 7 g/d).14 This general dearth of evidence led the ACG Chronic Constipation Task Force to conclude that psyllium increases stool frequency in patients with chronic constipation (ACG grade: B) but that there are insufficient data to make a recommendation about the efficacy of calcium polycarbophil, methylcellulose, and bran in this patient population (ACG grade: B).1
Important points for patients. Counsel patients for whom you recommend fiber intake that it may take several weeks for them to experience relief,5,8 and that long-term fiber use may cause abdominal distension, bloating, and flatulence.4,5,8,15 Few serious adverse effects (eg, delayed gastric emptying, anorexia, and iron and calcium malabsorption) are associated with bulking agents; however, fecal impaction may occur in patients with severe colonic inertia.16
Hypersensitivity reactions have been reported in patients who ingest psyllium and in healthcare workers exposed to it.16
Osmotic laxatives may help
When increased fiber intake fails to alleviate symptoms of constipation, patients are often prescribed an osmotic laxative (eg, magnesium hydroxide, magnesium citrate, sodium phosphate, or polyethylene glycol [PEG]) (SOR: B), which promotes water secretion in the intestines.4,8,15 However, several days may pass before the laxatives take effect, and they are indicated only for short-term use in patients with occasional constipation.1
Common adverse effects include abdominal cramping, bloating, and flatulence.4,10,17 More serious adverse effects include hypermagnesemia, hyperphosphatemia, hypercalcemia, hyponatremia, hypokalemia, hypovolemia, and diarrhea1,16 ; the incidences of these events were not reported.
The ACG Task Force gave PEG and lactulose grade A recommendations, based on the quality of evidence supporting their effectiveness at improving stool frequency and stool consistency in patients with chronic constipation.1 PEG was the only laxative shown in clinical trials to improve bowel movement frequency, stool consistency, and colonic transit time. However, this conclusion was based on analysis of all formulations—PMF-100, PEG 3350, PEG/electrolyte solutions, and high-molecular-weight PEG (PEG 4000); PEG 3350 (Miralax), the only PEG formulation approved by the FDA for use in patients with constipation, is indicated specifically for patients with occasional constipation. The Task Force determined that data were insufficient to make a recommendation for milk of magnesia (ACG grade: B).1
Stimulant laxatives, if all else fails
Stimulants (eg, bisacodyl, cascara, senna, ricinoleic acid) cause rhythmic muscle contractions in the intestines and increase intestinal motility and secretions.4,5,9,15,17 Controlled study data for stimulant laxatives are sparse (SOR: B).18 They work within hours,12,15,17,19 but use them judiciously.9
A common adverse effect is abdominal pain; more serious adverse effects include electrolyte imbalances, allergic reactions, and hepatotoxicity.1,16,20 However, these effects appear to be no more severe or frequent than effects of other constipation treatments. Long-term use can also cause benign pigmentation changes in the colon (Pseudomelanosis coli) and can lead to reduced colonic motility (colonic inertia).12,16
Given safety concerns with long-term use, reserve stimulant laxatives for patients who are refractory to or who cannot tolerate other agents.5,17 You should use them only as needed and for a brief time12 (the general guideline for most over-the-counter products is 1 week or less). The ACG Task Force concluded that data are insufficient to make recommendations for stimulant laxatives (ACG grade: B).1
Fiber or laxatives better?
A meta-analysis of randomized clinical trials found that fiber and laxatives increased bowel movement frequency by an overall weighted mean of 1.4 (95% confidence interval, 1.1–1.8) bowel movements per week.21 However, evidence was insufficient to establish whether fiber was superior to laxatives or whether one laxative class was superior to another.
Another meta-analysis found that, in studies lasting 4 weeks or less, fiber supplements and laxatives improved stool frequency (mean increase, 1.9 stool/week) and stool weight (mean increase, 476 g) but that these benefits were not clearly distinguishable from those of placebo (stool frequency, 1 stool; stool weight, 434 g).18
Large, well-designed, comparative trials of treatments for chronic constipation in adults are needed.22 Current literature contains few thoroughly reported studies of fiber and laxative use.18 Additionally, standardized measures to assess the adverse effects and outcomes (effects on quality of life) of specific agents have rarely been incorporated.18,22 Given the problematic safety/tolerability profiles of some laxatives, it is unknown whether they improve quality of life of patients with constipation.18
TABLE
Treatments for chronic constipation
| TREATMENT | EFFICACY | SOR | OUTCOMES MEASURED | COMMENTS |
|---|---|---|---|---|
| Lifestyle changes (Increased fluids, designated time for defecation, patient education)4,5,7 | High-fiber diet+2 L/d of water significantly increased bowel movement frequency and decreased laxative use (P<.001) compared with high-fiber diet alone (NNT=NA) | C | Stool weight BM frequency Laxative use | Not evaluated in controlled studies in which numbers of responders were reported |
| Exercise 4,6 | Crossover study of low-intensity physical activity minimally improved symptoms in 5 of 8 patients (NNT=1.6) | C | BM frequency, consistency Straining | Uncontrolled studies show inconsistent effects on stool weight and transit time |
| Increased dietary fiber 4,14 | In uncontrolled Nurses’ Health Study, women with high fiber intake were less likely than those with low intake to report constipation (NNT=NA) | C | BM frequency | Not evaluated in well-designed, controlled studies |
| Bulk fiber laxatives (Psyllium, methylcellulose, polycarbophil, ispaghula, bran, among others)13,18,36-38 | Improve overall bowel function at 4 weeks (NNT=7.5) | B | Bowel function at 4 weeks | Few controlled studies; efficacy results often reported only as mean scores, not as number (or %) of responders Adverse effects included abdominal pain, bloating, and flatulence |
| Osmotic laxatives (Magnesium hydroxide, magnesium citrate, sodium phosphate, polyethylene glycol, among others)4,8,15,30,39-42 | Compared with placebo, greater overall effectiveness, more effective in increasing bowel movement frequency, improving subjective well-being, and promoting complete remission of constipation (NNT=1.3–2.4) | B | Overall effectiveness BM frequency Subjective well-being related to defecation Complete remission of constipation | Few controlled studies; small populations in many studies; efficacy results often reported only as mean scores, not as number (or %) of responders |
| Adverse effects included nausea, abdominal pain or discomfort, bloating, distension, and flatulence | ||||
| Stimulant laxatives (Bisacodyl, cascara, senna, ricinoleic acid, ocusates, among others)4,15,22 | Improve bowel movement frequency (NNT=4–14.3) | B | Bowel movement frequency | Few controlled studies |
| Adverse effects include abdominal cramping, fluid and electrolyte depletion, diarrhea, allergic reactions | ||||
| 5-HT4 receptor agonists (Tegaserod)25-27 | More effective than placebo at relieving symptoms of chronic constipation (NNT=5.5–11.1) | A | Responder rate for CSBMs during first 4 weeks of treatment | Brief episodes of diarrhea, usually mild to moderate, may occur near the start of treatment; Safe for long-term use |
| NA, not applicable; NNT, number needed to treat; SOR, strength of recommendation; CSBM, complete spontaneous bowel movement. | ||||
Novel therapies
Tegaserod
Tegaserod (Zelnorm) is FDA-approved for treatment of women with IBS whose primary bowel symptom is constipation, and for treatment of chronic idiopathic constipation in women and men aged <65.23 The ACG Task Force determined that tegaserod increases the frequency of complete spontaneous bowel movements (CSBM), decreases straining, and improves stool consistency in patients with chronic constipation (ACG grade: A).1 Tegaserod binds with high affinity at human 5-HT4 receptors and augments peristalsis, increases colonic motility along the entire GI tract, and promotes intestinal secretions.23,24 (For more information on tegaserod’s mode of activity, see www.jfponline.com.)
Adverse effects. The most noteworthy adverse effect of tegaserod was diarrhea, occurring as brief episodes that were generally mild (not requiring antidiarrheal drugs), transient (occurring early after initiation of treatment and resolving after a couple of days), and self-limiting.25,26 Results of a single-blind, uncontrolled extension study in which 842 patients were administered tegaserod 2 mg or 6 mg for up to 13 months (total exposure was up to 16 months) were similar to those of shorter term studies, indicating that long-term treatment is safe and well-tolerated.27
Important advice for patients. Although tegaserod is generally well tolerated, counsel patients regarding its potential risk. Ischemic colitis, a vascular disorder that results from reduced blood flow in the colon, appears as a precaution in the current package insert.23 No cases of this condition were reported during clinical trials. Although reports of transient ischemic colitis were reported during postmarketing surveillance, they were not associated with long-term consequences, and they occurred at the expected rate in the general population and lower than the rate observed in IBS patients.23,28 To date, no vascular mechanism has been found that links colonic ischemia with tegaserod use.29 Nevertheless, patients for whom tegaserod is prescribed should be counseled to promptly report any symptoms consistent with this condition, including worsening abdominal pain, rectal bleeding, or bloody diarrhea.23
Lubiprostone
Lubiprostone (Amitiza) is a chloride channel activator that increases secretion of intestinal fluid. This agent significantly increases stool frequency, improves stool form, and decreases straining,30-32 and was recently FDA-approved for the treatment of patients with chronic idiopathic constipation.33 To date, data from lubiprostone clinical trials have not been published in full. As more data become available, it will be interesting to evaluate where this agent fits into the growing treatment armamentarium for chronic constipation.
Drugs in the pipeline
Several additional pharmacologic classes with unique modes of action are under investigation for the treatment of chronic constipation, including opioid antagonists and neurotrophic factors.34
When to use which agent
In the absence of specific guidelines dictating an order of treatment options for patients with chronic constipation, base your decision on such factors as the degree to which symptoms affect a patient’s daily life, results achieved with agents in the past, patient preference, and your clinical judgment and experience ( FIGURE ). Lifestyle modifications and traditional (primarily over-the-counter) therapies are typically the initial approaches for patients with milder symptoms. Patients experiencing moderate to severe constipation-associated symptoms, those who have experienced adverse effects, and those who have not achieved satisfactory relief of constipation should be evaluated for other treatment options, including prescription laxatives, tegaserod, and lubiprostone.
Because of the heterogeneity of this disorder, successful management is patient specific. Positive outcomes may include increased stool frequency, less straining, sense of complete evacuation, resolution of abdominal bloating, and passage of soft, formed stool. Optimally, these positive symptom outcomes will translate into better overall quality of life and the ability to return to normal work and personal activities. Importantly, education and continual open dialogue with the patient are crucial to managing expectations, both for the physician and for the patient.
FIGURE
Chronic primary constipation: Let symptom type and severity direct treatment choices
When referral is indicated
Though most patients with chronic constipation can be treated successfully in the primary care setting,35 a few may require referral to a gastroenterologist. Reasons may include the following:
- Suspicion of defecatory disorders (eg, pelvic floor dyssynergia)
- Lack of sufficient response to empiric treatment
- Worsening symptoms despite treatment
- Development of GI-associated alarm features requiring diagnostic procedures that may not be feasible to conduct in the primary care clinic setting (eg, balloon distension, anorectal manometry, defecography, colonic transit, barium enema, and colonoscopy).8
Ongoing communication with the consulting gastroenterologist is critical to maintaining optimal patient care. Use a referral form to clearly explain whether the patient is being referred for a procedure (eg, specific diagnostic test) or for a consultation (eg, temporary release of the patient to the gastroenterologist to further evaluate potential causes of symptoms); this will increase the likelihood that every-one’s expectations are satisfactorily met.
Acknowledgments
The author acknowledges the editorial assistance of Meera Nathan, PhD, Maribeth Bogush, PhD, and Sophia Shumyatsky, PharmD in the preparation of this manuscript.
CORRESPONDENCE
Scott D. Bleser, DO, FAAFP, Bellbrook Medical Center, Inc, 4336 State Route 725, Bellbrook, OH 45305-2742. E-mail: [email protected]
1. Brandt LJ, Schoenfeld P, Prather CM, Quigley EMM, Schiller LR, Talley NJ. Evidenced-based position statement on the management of chronic constipation in North America. Am J Gastroenterol 2005;100(suppl):S1-S21.
2. Schiller LR, Dennis E, Toth G. An internet-based survey of the prevalence and symptom spectrum of chronic constipation [abstract]. Am J Gastroenterol 2004;99:S234.-
3. Ramkumar D, Rao SSC. Efficacy and safety of traditional medical therapies for chronic constipation: systematic review. Am J Gastroenterol 2005;100:936-971.
4. Pampati V, Fogel R. Treatment options for primary constipation. Curr Treat Options Gastroenterol 2004;7:225-233.
5. Wald A. Constipation. Med Clin North Am 2000;84:1231-1246.
6. Meshkinpour H, Selod S, Movahedi H, et al. Effects of regular exercise in management of chronic idiopathic constipation. Dig Dis Sci 1998;43:2379-2383.
7. Anti M, Pignataro G, Armuzzi A, et al. Water supplementation enhances the effect of high-fiber diet on stool frequency and laxative consumption in adult patients with functional constipation. Hepatogastroenterology 1998;45:727-732.
8. Locke GR, III, Pemberton JH, Phillips SF. AGA technical review on constipation. Gastroenterol 2000;119:1766-1778.
9. Borum ML. Constipation: evaluation and management. Primary Care 2001;28:577-590.
10. Talley NJ. Management of chronic constipation. Rev Gastroenterol Disord 2004;4:18-24.
11. Locke GR, III, Pemberton JH, Phillips SF. AGA Medical Position Statement: guidelines on constipation. Gastroenterol 2000;119:1761-1766.
12. Doughty DB. When fiber is not enough: current thinking on constipation management. Ostomy Wound Manage 2002;48:30-41.
13. Cheskin LJ, Kamal N, Crowell MD, Schuster MM, Whitehead WE. Mechanisms of constipation in older persons and effects of fiber compared with placebo. J Am Geriatr Soc 1995;43:666-669.
14. Dukas L, Willett WC, Giovannucci EL. Association between physical activity, fiber intake, and other lifestyle variables and constipation in a study of women. Am J Gastroenterol 2003;98:1790-1796.
15. Lembo A, Camilleri M. Chronic constipation. N Engl J Med 2003;349:1360-1368.
16. Xing JH, Soffer EE. Adverse effects of laxatives. Dis Colon Rectum 2001;44:1201-1209.
17. Schiller LR. Review article: the therapy of constipation. Aliment Pharmacol Ther 2001;15:749-763.
18. Jones MP, Talley NJ, Nuyts G, Dubois D. Lack of objective evidence of efficacy of laxatives in chronic constipation. Dig Dis Sci 2002;47:2222-2230.
19. DiPalma JA. Current treatment options for chronic constipation. Rev Gastroenterol Disord 2004;(suppl 2):S34-S42.
20. Gattuso JM, Kamm MA. Adverse effects of drugs used in the management of constipation and diarrhoea. Drug Saf 1994;10:47-65.
21. Tramonte SM, Brand MB, Mulrow CD, Amato MG, O’Keefe ME, Ramirez G. The treatment of chronic constipation in adults. A systematic review. J Gen Intern Med 1997;12:15-24.
22. Petticrew M, Rodgers M, Booth A. Effectiveness of laxatives in adults. Qual Health Care 2001;10:268-273.
23. Zelnorm (tegaserod maleate) tablets [prescribing information]. East Hanover, NJ: Novartis; August 2004.
24. Appel-Dingemanse S. Clinical pharmacokinetics of tegaserod, a serotonin 5-HT4 receptor partial agonist with promotile activity. Clin Pharmacokinet 2002;41:1021-1042.
25. Johanson JF, Wald A, Tougas G, et al. Effect of tegaserod in chronic constipation: a randomized, double-blind, controlled trial. Clin Gastroenterol Hepatol 2004;2:796-805.
26. Kamm MA, Muller-Lissner S, Talley NJ, et al. Tegaserod for the treatment of chronic constipation: a randomized, double-blind, placebo-controlled multinational study. Am J Gastroenterol 2005;100:362-372.
27. Mueller-Lissner S, Kamm M, Haeck P, et al. Long-term safety and tolerability of tegaserod in chronic constipation (CC) [abstract]. Gastroenterol 2004;126(Suppl 2).-
28. Schoenfeld P. Review article: the safety profile of tegaserod. Aliment Pharmacol Ther 2004;20(suppl 7):25-30.
29. Joelsson BE, Shetzline MA, Cunningham S. Ischemic colitis associated with use of tegaserod [reply]. N Engl J Med 2004;351:1363-1364.
30. Johanson JF, Gargano MA, Holland PC, Patchen ML, Ueno R. Phase III, randomized withdrawal study of RU-0211, a novel chloride channel activator for the treatment of constipation [abstract]. Gastroenterol 2004;126(suppl 2):A100.-
31. Johanson JF, Gargano MA, Holland PC, Patchen ML, Ueno R. Phase III efficacy and safety of RU-0211, a novel chloride channel activator, for the treatment of constipation [abstract]. Gastroenterol 2003;124:A104.-
32. Johanson JF, Gargano MA, Patchen ML, Ueno R. Efficacy and safety of a novel compound, RU-0211, for the treatment of constipation [abstract]. Gastroenterol 2002;122:A-315.
33. Amitiza (lubiprostone) soft gelatin capsules [prescribing information]. Bethesda, Md: Sucampo Pharmaceuticals; 2006.
34. Schiller LR. New and emerging treatment options for chronic constipation. Rev Gastroenterol Dis 2004;4:S43-S51.
35. Sonnenberg A, Koch TR. Physician visits in the United States for constipation: 1958 to 1986. Dig Dis Sci 1989;34:606-611.
36. Dettmar PW, Sykes J. A multi-centre, general practice comparison of ispaghula husk with lactulose and other laxatives in the treatment of simple constipation. Curr Med Res Opin. 1998;14:227-233.
37. Badiali D, Corazziari E, Habib FI, et al. Effect of wheat bran in treatment of chronic nonorganic constipation: a double-blind controlled trial. Dig Dis Sci 1995;40:349-356.
38. McRorie JW, Daggy BP, Morel JG, Diersing PS, Miner PB, Robinson M. Psyllium is superior to docusate sodium for treatment of chronic constipation. Aliment Pharmacol Ther 1998;12:491-497.
39. Klauser AG, Muhldorfer BE, Voderholzer WA, Wenzel G, Muller-Lissner SA. Polyethylene glycol 4000 for slow transit constipation. Z Gastroenterol 1995;33:5-8.
40. Cleveland MV, Flavin DP, Ruben RA, Epstein RM, Clark GE. New polyethylene glycol laxative for treatment of constipation in adults: a randomized, double-blind, placebo-controlled study. South Med J 2001;94:478-481.
41. Corazziari E, Badiali D, Bazzocchi G, et al. Long-term efficacy, safety, and tolerability of low daily doses of isosmotic polyethylene glycol electrolyte balanced solution (PMF-100) in the treatment of functional chronic constipation. Gut 2000;46:522-526.
42. Corazziari E, Badiali D, Habib FI, et al. Small volume isosmotic polyethylene glycol electrolyte balanced solution (PMF-100) in treatment of chronic nonorganic constipation. Dig Dis Sci 1996;41:1636-1642.
The Journal of Family Practice ©2006 Dowden Health Media
Does every allusion to possible suicide require the same response?
- Assess patients with major depression or substance abuse for suicide ideation, as they are at elevated risk for self-harm (B).
- Severity of suicide ideation is associated with suicide risk. Its assessment, therefore, should proceed sequentially from passive to active suicide ideation, to a specific detailed plan, including intention to harm oneself, reasons for living, and impulse control (B).
- Primary care patients at mild to moderate risk for suicide can be effectively treated in primary care settings (B); however, patients at high risk should be referred to mental health specialists given their need for intensive treatments and frequent monitoring (C).
"I think I’d be better off—and my family would be—if I were dead.” This surprising announcement was just made in your office by a lady who is 74 years old and suffers with chronic pain. Are her words an exaggerated expression of frustration and anger, or do they convey a real intention to harm herself? How would you explore her thoughts and feelings? What kind of follow-up is needed?
Risk of suicide must not be thought of as being merely present or absent. The significance of risk, if present, varies along a continuum. Specific elements in a patient’s history can help determine the level of risk, as can the information you glean from a structured interview process that we review in this article.
You are uniquely positioned to assess suicide risk
As a primary care physician, you are often in a better position to assess suicide risk than is a mental health specialist. Any patient with major depression or a substance abuse problem can be at risk for suicide. Accurately identifying suicide ideation can be complex with primary care patients who have severe medical illness, somatic symptoms of depression, pain, disability, and social and environmental adversity.
How prevalent is suicidal ideation in primary care? While most primary care patients do not experience suicide ideation, the rate of such ideation in this population is high compared with general community samples. In a review of 10 studies, any level of suicide ideation among midlife and elderly primary care patients ranged from 1% to 10% depending on the assessment method used,5 with rates up to 54% obtained for patients with depressive disorders.6
Suicidal patients often come to your attention first. Eleven studies15 of completed suicides found that, on average, 23% of victims aged 35 and younger and 58% of victims aged 55 and older visited a general physician in the month preceding suicide. These rates substantially exceed those seen in specialty mental health services. Since older adults and women of all ages see physicians more often than others do, they may particularly benefit from primary care assessment and intervention efforts.15
No data exist on rates of physician contact for suicide victims among ethnic minorities, but their rate may be lower given that minorities use health services at lower levels.16,17
Chart reviews revealed that 60% of patient visits by those who committed suicide included psychiatric components, such as depression or worry.18-20 However, suicidal patients explicitly informed their physician of suicide ideation or plans in only 19% to 54% of visits.18,21,22
Distinct levels of risk. According to the Diagnostic and Statistical Manual for Mental Health, 4th edition (DSM-IV),1 suicide ideation ranges from thoughts that life is not worth living or that one would be better off dead (passive suicide ideation), to thoughts about harming oneself (active suicide ideation), to specific plans for committing suicide. These distinctions are important. Pronounced suicide ideation not only increases the risk for self-harm among patients with major depression,2,3 it may also affect time to treatment response.4
As level of suicide risk increases, so does the need for your attention, to determine at regular intervals whether the level of risk has changed. Even a seemingly flip remark, as portrayed at the start of this article, may signal a desperate state of mind. At minimum, further psychiatric evaluation is warranted, as patients with suicide ideation often have a psychiatric disorder, such as major depression. Patients reporting a suicide plan or intention require immediate emergency room evaluation.
To ask or not to ask?
An older study23 found limited evidence for reliable screening of suicide ideation in general practice. A recent study24 found that physicians can be trained to accurately identify suicide ideation among their depressed patients.
Can asking about suicide provoke a suicide attempt? Some clinicians think so, but we know of no studies investigating this concern.
A patient’s answer predicts outcomes. Another question is whether suicide ideation needs to be assessed over and above diagnosing psychiatric disorders such as major depression or alcohol abuse. A detailed analysis of the severity of suicide ideation is needed since it is the strongest predictor of successful suicide by patients with major depression.3 Furthermore, severe suicide ideation may affect time to treatment response4 and thus can influence decisions about duration of treatment.
Impact on mortality unknown. A important question regarding the impact of assessing suicide ideation is whether it reduces mortality. The US Preventive Services Task Force12 identified no study directly examining this concern.
Will your assessment of risk improve a patient’s outcome?
Evidence regarding the efficacy of antidepressant medications and psychotherapy in reducing risk for suicide is limited due to the methodologic and ethical difficulties associated with studying suicide. In a systematic review of intervention studies, Gaynes et al12 reported inconsistent findings of whether treating at-risk individuals reduces the number of suicide attempts or completions.
Interventions do, however, reduce suicide ideation, depression severity, and hopelessness, and do improve functioning.12,25,26 In the only study specifically targeting elderly depressed primary care patients, management of depression combined with antidepressant medication or psychotherapy reduced suicide ideation significantly more frequently than usual care.27
SSRIs and suicide. A continuing controversy is the relationship between selective serotonin reuptake inhibitors (SSRIs) and suicide attempts; a relationship possibly due to these drugs’ potential for agitation and akathasia. A review of randomized controlled trials documented a more than twofold increase in nonfatal suicide attempts among patients receiving SSRIs in comparison with placebo.28 A similar risk level was detected when comparing SSRIs and tricyclic antidepressants.28
Suicide attempts seem to increase during the first 1 to 9 days after treatment is started.29 This suggests that SSRIs do not immediately resolve depression or suicide ideation and may possibly increase risk in the first weeks of treatment. Closely monitor patients who are started on SSRIs, for symptom severity and suicide ideation (SOR: C).
Patient contracts. Suicide prevention contracts are often used to ensure that patients inform a family member or a healthcare professional if they no longer feel able to resist their suicidal thoughts. However, studies of suicide victims and attempters have found that many such patients had such a contract in place before the suicidal act.30,31 Thus, the American Psychiatric Association’s Practice Guideline for the Assessment and Treatment of Patients with Suicidal Behaviors3 cautions that suicide prevention contracts should not substitute for ongoing assessment of suicide ideation.
Targeting your assessment and management
Given the above knowledge base, physicians have been urged to help prevent suicide through targeted assessment and management.32,33 The Canadian Task Force on Preventive Health34 and the US Preventive Services Task Force12 recommend assessing suicide risk for primary care patients experiencing major depression or substance abuse (SOR: B).
Assessment may also be appropriate for those with panic disorder or a past suicidal attempt, and for those facing life-threatening illnesses, other stressful situations, or transitional life changes (SOR: C).
In this next section, we offer a structured assessment that identifies successive levels of suicide risk and advise corresponding action steps (FIGURE 1).35 The related visual tool (FIGURE 2), developed to improve depression detection by home care nurses,36 is pertinent for primary care clinicians as well.
FIGURE 1
Sequential questions to determine level of suicide risk
FIGURE 2
Suicide risk as a spectrum: Assessment and intervention strategies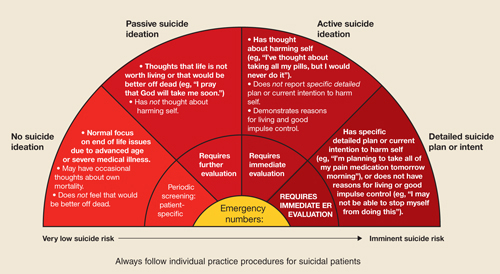
Assessing suicide risk as a spectrum
Patient stigma, negative family and societal attitudes, and clinician discomfort can make depression and other emotional symptoms hard to talk about and impede appropriate screening.37 This makes identifying suicide ideation all the more difficult. When should you screen, and how should you ask clinical questions?
Screening instruments can help. Posing questions about suicide can be especially difficult during an initial visit. Therefore, you may administer a structured screening instrument such as the Patient Health Questionnaire (PHQ-9),38 the Beck Depression Inventory–Primary Care version (BDI-PC),39 or the Scale for Suicide Ideation (SSI).40 Alternatively, you may use the brief clinical interview format proposed here (see also Hamilton41 and Frierson et al42).
Spontaneous lines of questioning. When a patient’s particular circumstance leads to a discussion of pain, the impact of disability, social history, or difficulties coping, it would seem only natural for you to proceed to an assessment of emotional symptoms. You may begin with questions about mood and other depressive symptoms, and then specifically inquire about suicide ideation.
Older adults and patients whose ethnic and cultural backgrounds are different than yours may be particularly challenging. Recognize a particular group’s attitudes about suicide and revealing suicide ideation, and adapt assessment strategies accordingly. With older patients, for example, end-of-life discussions may serve as a way to elicit thoughts about death and dying.43
Using normalizing statements. Such statements can counteract the stigma experienced by patients with suicidal thoughts. For example, you may say “It is common for people who have medical problems or who experience pain to have problems adjusting. Some people have emotional reactions like feeling depressed or hopeless, or even in some cases feeling like life is not worth living.” Inquiring about suicidal thoughts generally won’t increase a patient’s distress, nor will it precipitate a suicide attempt. When performed by a concerned and sensitive clinician, this assessment usually makes the patient feel more understood and cared for.5
Background: Mrs. Lee is a 74 year old, married, Caucasian woman with the following medical conditions: 1. severe osteoporosis, 2. fracture of vertebrae, with lower back pain, and 3. history of breast cancer, on Tamoxifen prophylactically. She reports depressed mood associated with her back pain.
Clinician: “In the past couple of weeks, were things ever so bad that you had thoughts that life is not worth living or that you’d be better off dead?”
Mrs. Lee #1: “Oh, no. I don’t feel that way.”
Patient denies passive suicide ideation.
Stop questioning here.
Mrs. Lee #2: “Yes, sometimes I do think that I’d be better off dead. It would be much easier for my family. I’m such a burden.”
Patient endorses passive suicide ideation.
Continue questioning.
Clinician: “Have you had any thoughts about hurting yourself or suicide in the past couple of weeks?”
Mrs. Lee #2: “No. I would never hurt myself. But I sometimes wish I could just go to sleep and not wake up.”
Patient denies active suicide ideation.
Stop questioning here.
Mrs. Lee #3: “The thought has crossed my mind.”
Patient endorses active suicide ideation.
Continue with all remaining questions.
Clinician: “What have you been thinking of doing?”
Mrs. Lee #3: “I’ve thought of taking all my pills.”
Clinician: “How often do you have these thoughts? How long do they stay on your mind?”
Mrs. Lee #3: “Every day or so, especially when the pain gets bad.”
Clinician: “Besides dealing with the lower back pain, is there anything else going on in your life right now?”
Mrs. Lee #3: “Not really. I just can’t seem to get any relief from my pain.”
Clinician: “Do you have a plan to take all your pills?”
Mrs. Lee #3: “No.”
Mrs. Lee #4: “No. I haven’t worked up the courage yet.”
Clinician: “Do you intend to harm yourself?”
Mrs. Lee #3: “No. I would never do that.”
Mrs. Lee #4: “I might. I’m not sure.”
Clinician: “Is anything preventing you from harming yourself?”
Mrs. Lee #3: “I guess my faith. Plus, I’d never do that to my family. It would be devastating to them.”
Mrs. Lee #4: “Not really. I don’t really have anything to live for.”
Clinician: “Do you feel you can resist these thoughts?”
Mrs. Lee #3: “Yes. I told you I would never do that.”
Patient reports active suicide ideation, but denies plan and intention.
Mrs. Lee #4: “I’m not sure. I don’t know if I’ll be able to stop myself from taking the pills.” Patient reports active suicide ideation, and has uncertain intention, no reasons for living, and poor impulse control.
* From the educational videotape by Brown EL, Bruce ML, Raue PJ, et al. (2004): Depression Recognition and Assessment in Older Homecare Patients.
How the process works. As shown in FIGURE 1, the clinician asks a series of questions to determine the patient’s level of suicide risk. We suggest you ask about the prior 2 weeks, the same time frame covered in structured assessments like the PHQ-9.38 Use follow-up probe questions, as necessary, to formulate a clinical judgment.
Patients endorsing question 1 are considered at minimum to experience passive suicide ideation. In this instance, you should ask question 2, which deals with active suicide ideation. If a patient endorses question 2, pose questions 2a through 2g to identify a specific detailed suicide plan and to gauge a patient’s suicide intention, reasons for living, and impulse control. The CASE illustrates this process by presenting the same patient’s alternative responses to a clinician’s questions.
FIGURE 2 places the patient’s responses on a spectrum of risk and assists in conveying assessment findings to mental health professionals. The horizontal axis shows the continuum of suicide risk from very low (left) to imminent (right), and the correspondingly increased attention required by health care professionals. (Printable copies of these figures are available from the authors at www.geriu.org/suiciderisk)
The following descriptions assist in determining level of suicide risk and the associated intervention.
No suicide ideation
Presentation. Many primary care patients face end-of-life issues due to advanced age or severe illnesses. Indeed, older adults and the terminally ill are at the stage wherein occasional thoughts regarding death or mortality are normal and not pathological.44 Suicide ideation is considered present only when patients state that life is not worth living, or that they would be better off dead. Few primary care patients report such suicide ideation.5
Recommendation. Psychiatric evaluation in the absence of other psychiatric symptoms is unnecessary.
Follow-up. Reassess minimal risk patients following deterioration in their medical, functional, or social-environmental situations, or when starting them on an antidepressant.45
Passive suicide ideation
Presentation. Patients with passive suicide ideation have frequent thoughts that life is not worth living, or that they would be better off dead—for example, praying nightly that God will take them soon. Patients at this risk level deny thoughts about harming themselves. However, as many as 10% of medical patients report such passive suicide ideation,5 which is a moderate risk factor for suicide.
Recommendation. Patients endorsing passive suicide ideation require further psychiatric evaluation to determine the presence of a depressive or other psychiatric disorder. You may choose to conduct this evaluation personally and, if appropriate, pursue treatment by prescribing recommended antidepressant medications.46 Psychosocial interventions may seek to increase social contact, encourage hope, enhance ability to cope with stress and negative life events, and address meaning-of-life issues. Alternatively, you may refer such patients to psychiatrists, psychologists, social workers, or psychiatric nurses.
Follow-up. Schedule frequent visits with these patients, and assess their level of suicide risk at each office visit, particularly when the dosage of an antidepressant has been changed.45
Active suicide ideation
Presentation. Patients with active suicide ideation have thoughts about harming themselves, with differing levels of severity whose boundaries can be imprecise. At the severity level’s milder end, patients report active thoughts of self-harm but do not specify a particular method (“I feel like hurting myself, but I wouldn’t know how”).
Other patients may have specified a particular method for harming themselves, but lack a detailed plan or intention for doing so (“I’ve thought about taking all my pills, but I would never do that”). Ascertaining level of detail (for example, by asking “Which pills have you been thinking about? Have you thought about a particular time and place to take them? Have you made any preparations?”) will clarify a patient’s investment in harming him or herself. Insufficient detail or specificity suggests lack of an organized plan or intent.
Patients with active suicide ideation but no detailed plan must articulate convincing reasons for living such as having a purpose in life, not wanting to cause family or friends pain, or deeming suicide morally wrong or contrary to religious beliefs so as not to be classified at the highest risk level. They must also demonstrate good impulse control, or the ability to resist acting on these thoughts. Factors such as current alcohol or substance abuse, or a history of suicide attempts may indicate poor impulse control. While only about 1% of primary care patients endorse any level of active suicide ideation,5 those who do are at increased risk even when reporting reasons for living and demonstrating good impulse control.
Recommendation. Patients endorsing active suicide ideation even when lacking a specific plan or intention require immediate, same-day evaluation by a mental health specialist given the clinical complexities in precisely defining level of active suicide ideation. With the patient’s permission, a family member should be notified about his/her active suicide ideation. Medical ethics dictate that a family member be so informed without patient permission only when he or she is at a higher risk for suicide (see below). Primary care clinicians may directly treat patients with active suicide ideation,46 or refer them to specialty mental health practitioners.
Follow-up. Schedule visits with patients who have active suicide ideation more frequently than visits for those with passive ideation. Assess their level of suicide risk at each office visit.
Specific detailed suicide plan or intent
Presentation. Patients who report active suicide ideation with a specific detailed plan, intention to harm themselves, no convincing reasons for living, or a lack of impulse control are classified at the highest risk level. The term “suicide plan” means a patient reports an adequately detailed plan, as opposed to a more vaguely considered method. Given the association between suicide and firearms, especially in rural areas,47 also be sure to assess home or workplace firearms whenever active suicide ideation is present.3 An example of this highest risk level is a patient who states, “I’m planning to take all of my pain medication tomorrow morning,” or one who says, “I’ve been thinking about taking all of my pain medication, and I may not be able to stop myself from doing this.” Very few primary care patients endorse a specific plan or intention to harm themselves,5 but those who do so constitute a clinical emergency.
Recommendation. Patients endorsing a specific plan or intention to harm themselves require immediate psychiatric evaluation for safety, and should be transported to an emergency department. A family member should be notified of the patient’s suicide plan or intention.
Follow-up. Following emergency room evaluation and possible inpatient hospitalization, these patients should be referred to a mental health specialist for ongoing treatment and monitoring.
CORRESPONDENCE
Patrick J. Raue, PhD, Weill Medical College of Cornell University, 21 Bloomingdale Road, White Plains, NY 10605. E-mail: [email protected]
1. American Psychiatric Association. Diagnostic and Statistic Manual of Mental Health Disorders 4th ed., text revision. Washington, DC, American Psychiatric Association; 2000.
2. Coryell W, Young EA. Clinical predictors of suicide in primary major depressive disorder. J Clin Psychiatry 2005;66:412-417.
3. Practice guideline for the assessment and treatment of patients with suicidal behaviors. Am J Psychiatry 2003;160(11 Suppl):1-60.
4. Szanto K, Mulsant BH, Houck P, Dew MA, Reynolds CF. Occurrence and course of suicidality during short-term treatment of late-life depression. Arch Gen Psychiatry 2003;60:610-617.
5. Schulberg HC, Bruce ML, Lee PW, Williams JW, Dietrich AJ. Preventing suicide in primary care practice: the primary care physician’s role. Gen Hosp Psychiatry 2004;26:337-345.
6. Wells KB, Schoenbaum M, Unutzer J, Lagomasino IT, Rubenstein LV. Quality of care for primary care patients with depression in managed care. Arch Fam Med 1999;8:529-536.
7. Minino AM, Arias E, Kochanek KD, Murphy SL, Smith BL. Deaths: final data for 2000. National Vital Statistics Reports. 50 Hyattsville, Md: National Center for Health Statistics;2002.
8. Conwell Y, Duberstein PR, Caine ED. Risk factors for suicide in later life. Biol Psychiatry 2002;52:193-204.
9. Pearson JL, Conwell Y. Suicide in late life: challenges and opportunities for research. Int Psychogeriatr 1995;7:131-136.
10. Gliatto MF, Rai AK. Evaluation and treatment of patients with suicidal ideation. Am Fam Physician 1999;59:1500-1506.
11. Moscicki EK. Identification of suicide risk factors using epidemiologic studies. Psychiatr Clin North Am 1997;20:499-517.
12. Gaynes BN, West SL, Ford CA, Frame P, Klein J, Lohr KN. Screening for suicide risk in adults: a summary of the evidence for the U.S. Preventive Services Task Force. Ann Intern Med 2004;140:822-835.
13. Conner KR, Conwell Y, Duberstein PR. The validity of proxy-based data in suicide research: a study of patients 50 years of age and older who attempted suicide. II. Life events, social support, and suicidal behavior. Acta Psychiatr Scand 2001;104:452-457.
14. Flint EP, Hays JC, Krishnan KRR, Meador KG, Blazer DG. Suicidal behaviors in depressed men with a family history of suicide: effects of psychosocial factors and age. Aging Mental Health 1998;2:286-299.
15. Luoma JB, Martin CE, Pearson JL. Contact with mental health and primary care providers before suicide: a review of the evidence. Am J Psychiatry 2002;159:909-916.
16. Freiman MP. The demand for healthcare among racial/ethnic subpopulations. Health Serv Res 1998;33:867-890.
17. Wagner TH, Guendelman S. Healthcare utilization among Hispanics: findings from the 1994 Minority Health Survey. Am J Manag Care 2000;6:355-364.
18. Stenager EN, Jensen K. Attempted suicide and contact with the primary health authorities. Acta Psychiatr Scand 1994;90:109-113.
19. Appleby L, Amos T, Doyle U, Tomenson B, Woodman M. General practitioners and young suicides: a preventive role for primary care. Br J Psychiatry 1996;168:330-333.
20. Lin EH, Von Korff M, Wagner EH. Identifying suicide potential in primary care. J Gen Intern Med 1989;4:1-6.
21. Coombs DW, Miller HL, Alarcon R, Herlihy C, Lee JM, Morrison DP. Presuicide attempt communications between parasuicides and consulted caregivers. Suicide Life Threat Behav 1992;22:289-302.
22. Isometsa ET, Heikkinen ME, Marttunen MJ, Henriksson MM, Aro HM, Lonnqvist JK. The last appointment before suicide: is suicide intent communicated? Am J Psychiatry 1995;152:919-922.
23. Olfson M, Weissman MM, Leon AC, Sheehan DV, Farber L. Suicidal ideation in primary care. J Gen Intern Med 1996;11:447-453.
24. Nutting PA, Dickinson LM, Rubenstein LV, Keeley RD, Smith JL, Elliott CE. Improving detection of suicide ideation among depressed patients in primary care. Ann Fam Med 2005;3:529-536.
25. Mann JJ, Apter A, Bertolote J, et al. Suicide prevention strategies: a systematic review. JAMA 2005;294:2064-2074.
26. Schulberg HC, Lee PW, Bruce ML, et al. Suicidal ideation and risk levels among primary care patients with uncomplicated depression. Ann Fam Med 2006;3:523-528.
27. Bruce ML, Ten Have TR, Reynolds CF, 3rd, et al. Reducing suicidal ideation and depressive symptoms in depressed older primary care patients: a randomized controlled trial. JAMA 2004;291:1081-1091.
28. Fergusson D, Doucette S, Glass KC, et al. Association between suicide attempts and selective serotonin reuptake inhibitors: systematic review of randomised controlled trials. BMJ 2005;330:396.-
29. Jick H, Kaye JA, Jick SS. Antidepressants and the risk of suicidal behaviors. JAMA 2004;292:338-343.
30. Hall RC, Platt DE, Hall RC. Suicide risk assessment: a review of risk factors for suicide in 100 patients who made severe suicide attempts: evaluation of suicide risk in a time of managed care. Psychosomatics 1999;40:18-27.
31. Busch KA, Fawcett J, Jacobs DG. Clinical correlates of inpatient suicide. J Clin Psychiatry 2003;64:14-19.
32. Public Health Service. The surgeon general’s call to action to prevent suicide. Rockville, Md: US Department of Health and Human Services;1999.
33. Goldsmith S, Pellman T, Kleinman A, Bunney W, eds. Reducing Suicide: A National Imperative. Washington, DC: National Academies Press;2002.
34. McNamee JE, Offord DR. Prevention of suicide. In: Canadian Task Force on the Periodic Health Examination, Canadian guide to clinical preventive health care. Canada, Ottawa: CCG;1994:456-467.
35. Bruce ML, McAvay GJ, Raue PJ, et al. Major depression in elderly home health care patients. Am J Psychiatry 2002;159:1367-1374.
36. Brown EL, Bruce ML, Raue PJ, et al. (Writers). Bruce ML, Brown EL (Producers) (2004). Depression Recognition and Assessment in Older Homecare Patients [Videotape].
37. US Department of Health and Human Services. Mental Health: A Report of the Surgeon General. Rockville, Md: US Department of Health and Human Services, Substance Abuse and Mental Health Services Administration, Center for Mental Health Services, National Institutes of Health, National Institute of Mental Health, 1999.
38. Kroenke K, Spitzer RL, Williams JB. The PHQ-9: Validity of a brief depression severity measure. J Gen Intern Med 2001;16:606-613.
39. Beck AT, Guth D, Steer RA, Ball R. Screening for major depression disorders in medical inpatients with the Beck Depression Inventory for primary care. Behav Res Therapy 1997;35:785-791.
40. Beck AT, Kovacs M, Weissman M. Scale for suicide ideation. J Consult Clin Psychol 1979;47:343.-
41. Hamilton GN. Suicide prevention in primary care: careful questioning, prompt treatment can save lives. Postgrad Med 2000;108:81-84,87.
42. Frierson RL, Melikian M, Wadman PC. Principles of suicide risk assessment: how to interview depressed patients and tailor treatment. Postgrad Med 2002;112:65-66,69-71.
43. Bartels SJ, Coakley E, Oxman TE, et al. Suicidal and death ideation in older primary care patients with depression, anxiety, and at-risk alcohol use. Am J Geriatr Psychiatry 2002;10:417-427.
44. Kalish RA. The social context of death and dying. In: Binstock RH, Shanas E(eds.), Handbook of Aging & the Social Sciences. (2nd ed). New York: Van Nostrand Reinhold;1985:149-170.
45. US Food and Drug Administration Public Health Advisory. Worsening depression and suicidality in patients being treated with antidepressant medications. March 22, 2004. Available at: www.fda.gov/bbs/topics/ANSWERS/2004/ANS01283.html. Accessed on June 14, 2006.
46. Schulberg HC, Katon W, Simon GE, Rush AJ. Treating major depression in primary care practice: an update of the Agency for Health Care Policy and Research Practice Guidelines. Arch Gen Psychiatry 1998;55:1121-1127.
47. Dresang LT. Gun deaths in rural and urban settings: recommendations for prevention. J Am Board Fam Pract 2001;14:107-115.
48. Schulberg HC, Bryce C, Chism K, et al. Managing late-life depression in primary care practice: a case study of the Health Specialist’s role. Int J Geriatr Psychiatry 2001;16:577-584.
49. Unutzer J, Katon W, Callahan CM, et al. Collaborative care management of late-life depression in the primary care setting: a randomized controlled trial. JAMA 2002;288:2836-2845.
- Assess patients with major depression or substance abuse for suicide ideation, as they are at elevated risk for self-harm (B).
- Severity of suicide ideation is associated with suicide risk. Its assessment, therefore, should proceed sequentially from passive to active suicide ideation, to a specific detailed plan, including intention to harm oneself, reasons for living, and impulse control (B).
- Primary care patients at mild to moderate risk for suicide can be effectively treated in primary care settings (B); however, patients at high risk should be referred to mental health specialists given their need for intensive treatments and frequent monitoring (C).
"I think I’d be better off—and my family would be—if I were dead.” This surprising announcement was just made in your office by a lady who is 74 years old and suffers with chronic pain. Are her words an exaggerated expression of frustration and anger, or do they convey a real intention to harm herself? How would you explore her thoughts and feelings? What kind of follow-up is needed?
Risk of suicide must not be thought of as being merely present or absent. The significance of risk, if present, varies along a continuum. Specific elements in a patient’s history can help determine the level of risk, as can the information you glean from a structured interview process that we review in this article.
You are uniquely positioned to assess suicide risk
As a primary care physician, you are often in a better position to assess suicide risk than is a mental health specialist. Any patient with major depression or a substance abuse problem can be at risk for suicide. Accurately identifying suicide ideation can be complex with primary care patients who have severe medical illness, somatic symptoms of depression, pain, disability, and social and environmental adversity.
How prevalent is suicidal ideation in primary care? While most primary care patients do not experience suicide ideation, the rate of such ideation in this population is high compared with general community samples. In a review of 10 studies, any level of suicide ideation among midlife and elderly primary care patients ranged from 1% to 10% depending on the assessment method used,5 with rates up to 54% obtained for patients with depressive disorders.6
Suicidal patients often come to your attention first. Eleven studies15 of completed suicides found that, on average, 23% of victims aged 35 and younger and 58% of victims aged 55 and older visited a general physician in the month preceding suicide. These rates substantially exceed those seen in specialty mental health services. Since older adults and women of all ages see physicians more often than others do, they may particularly benefit from primary care assessment and intervention efforts.15
No data exist on rates of physician contact for suicide victims among ethnic minorities, but their rate may be lower given that minorities use health services at lower levels.16,17
Chart reviews revealed that 60% of patient visits by those who committed suicide included psychiatric components, such as depression or worry.18-20 However, suicidal patients explicitly informed their physician of suicide ideation or plans in only 19% to 54% of visits.18,21,22
Distinct levels of risk. According to the Diagnostic and Statistical Manual for Mental Health, 4th edition (DSM-IV),1 suicide ideation ranges from thoughts that life is not worth living or that one would be better off dead (passive suicide ideation), to thoughts about harming oneself (active suicide ideation), to specific plans for committing suicide. These distinctions are important. Pronounced suicide ideation not only increases the risk for self-harm among patients with major depression,2,3 it may also affect time to treatment response.4
As level of suicide risk increases, so does the need for your attention, to determine at regular intervals whether the level of risk has changed. Even a seemingly flip remark, as portrayed at the start of this article, may signal a desperate state of mind. At minimum, further psychiatric evaluation is warranted, as patients with suicide ideation often have a psychiatric disorder, such as major depression. Patients reporting a suicide plan or intention require immediate emergency room evaluation.
To ask or not to ask?
An older study23 found limited evidence for reliable screening of suicide ideation in general practice. A recent study24 found that physicians can be trained to accurately identify suicide ideation among their depressed patients.
Can asking about suicide provoke a suicide attempt? Some clinicians think so, but we know of no studies investigating this concern.
A patient’s answer predicts outcomes. Another question is whether suicide ideation needs to be assessed over and above diagnosing psychiatric disorders such as major depression or alcohol abuse. A detailed analysis of the severity of suicide ideation is needed since it is the strongest predictor of successful suicide by patients with major depression.3 Furthermore, severe suicide ideation may affect time to treatment response4 and thus can influence decisions about duration of treatment.
Impact on mortality unknown. A important question regarding the impact of assessing suicide ideation is whether it reduces mortality. The US Preventive Services Task Force12 identified no study directly examining this concern.
Will your assessment of risk improve a patient’s outcome?
Evidence regarding the efficacy of antidepressant medications and psychotherapy in reducing risk for suicide is limited due to the methodologic and ethical difficulties associated with studying suicide. In a systematic review of intervention studies, Gaynes et al12 reported inconsistent findings of whether treating at-risk individuals reduces the number of suicide attempts or completions.
Interventions do, however, reduce suicide ideation, depression severity, and hopelessness, and do improve functioning.12,25,26 In the only study specifically targeting elderly depressed primary care patients, management of depression combined with antidepressant medication or psychotherapy reduced suicide ideation significantly more frequently than usual care.27
SSRIs and suicide. A continuing controversy is the relationship between selective serotonin reuptake inhibitors (SSRIs) and suicide attempts; a relationship possibly due to these drugs’ potential for agitation and akathasia. A review of randomized controlled trials documented a more than twofold increase in nonfatal suicide attempts among patients receiving SSRIs in comparison with placebo.28 A similar risk level was detected when comparing SSRIs and tricyclic antidepressants.28
Suicide attempts seem to increase during the first 1 to 9 days after treatment is started.29 This suggests that SSRIs do not immediately resolve depression or suicide ideation and may possibly increase risk in the first weeks of treatment. Closely monitor patients who are started on SSRIs, for symptom severity and suicide ideation (SOR: C).
Patient contracts. Suicide prevention contracts are often used to ensure that patients inform a family member or a healthcare professional if they no longer feel able to resist their suicidal thoughts. However, studies of suicide victims and attempters have found that many such patients had such a contract in place before the suicidal act.30,31 Thus, the American Psychiatric Association’s Practice Guideline for the Assessment and Treatment of Patients with Suicidal Behaviors3 cautions that suicide prevention contracts should not substitute for ongoing assessment of suicide ideation.
Targeting your assessment and management
Given the above knowledge base, physicians have been urged to help prevent suicide through targeted assessment and management.32,33 The Canadian Task Force on Preventive Health34 and the US Preventive Services Task Force12 recommend assessing suicide risk for primary care patients experiencing major depression or substance abuse (SOR: B).
Assessment may also be appropriate for those with panic disorder or a past suicidal attempt, and for those facing life-threatening illnesses, other stressful situations, or transitional life changes (SOR: C).
In this next section, we offer a structured assessment that identifies successive levels of suicide risk and advise corresponding action steps (FIGURE 1).35 The related visual tool (FIGURE 2), developed to improve depression detection by home care nurses,36 is pertinent for primary care clinicians as well.
FIGURE 1
Sequential questions to determine level of suicide risk
FIGURE 2
Suicide risk as a spectrum: Assessment and intervention strategies
Assessing suicide risk as a spectrum
Patient stigma, negative family and societal attitudes, and clinician discomfort can make depression and other emotional symptoms hard to talk about and impede appropriate screening.37 This makes identifying suicide ideation all the more difficult. When should you screen, and how should you ask clinical questions?
Screening instruments can help. Posing questions about suicide can be especially difficult during an initial visit. Therefore, you may administer a structured screening instrument such as the Patient Health Questionnaire (PHQ-9),38 the Beck Depression Inventory–Primary Care version (BDI-PC),39 or the Scale for Suicide Ideation (SSI).40 Alternatively, you may use the brief clinical interview format proposed here (see also Hamilton41 and Frierson et al42).
Spontaneous lines of questioning. When a patient’s particular circumstance leads to a discussion of pain, the impact of disability, social history, or difficulties coping, it would seem only natural for you to proceed to an assessment of emotional symptoms. You may begin with questions about mood and other depressive symptoms, and then specifically inquire about suicide ideation.
Older adults and patients whose ethnic and cultural backgrounds are different than yours may be particularly challenging. Recognize a particular group’s attitudes about suicide and revealing suicide ideation, and adapt assessment strategies accordingly. With older patients, for example, end-of-life discussions may serve as a way to elicit thoughts about death and dying.43
Using normalizing statements. Such statements can counteract the stigma experienced by patients with suicidal thoughts. For example, you may say “It is common for people who have medical problems or who experience pain to have problems adjusting. Some people have emotional reactions like feeling depressed or hopeless, or even in some cases feeling like life is not worth living.” Inquiring about suicidal thoughts generally won’t increase a patient’s distress, nor will it precipitate a suicide attempt. When performed by a concerned and sensitive clinician, this assessment usually makes the patient feel more understood and cared for.5
Background: Mrs. Lee is a 74 year old, married, Caucasian woman with the following medical conditions: 1. severe osteoporosis, 2. fracture of vertebrae, with lower back pain, and 3. history of breast cancer, on Tamoxifen prophylactically. She reports depressed mood associated with her back pain.
Clinician: “In the past couple of weeks, were things ever so bad that you had thoughts that life is not worth living or that you’d be better off dead?”
Mrs. Lee #1: “Oh, no. I don’t feel that way.”
Patient denies passive suicide ideation.
Stop questioning here.
Mrs. Lee #2: “Yes, sometimes I do think that I’d be better off dead. It would be much easier for my family. I’m such a burden.”
Patient endorses passive suicide ideation.
Continue questioning.
Clinician: “Have you had any thoughts about hurting yourself or suicide in the past couple of weeks?”
Mrs. Lee #2: “No. I would never hurt myself. But I sometimes wish I could just go to sleep and not wake up.”
Patient denies active suicide ideation.
Stop questioning here.
Mrs. Lee #3: “The thought has crossed my mind.”
Patient endorses active suicide ideation.
Continue with all remaining questions.
Clinician: “What have you been thinking of doing?”
Mrs. Lee #3: “I’ve thought of taking all my pills.”
Clinician: “How often do you have these thoughts? How long do they stay on your mind?”
Mrs. Lee #3: “Every day or so, especially when the pain gets bad.”
Clinician: “Besides dealing with the lower back pain, is there anything else going on in your life right now?”
Mrs. Lee #3: “Not really. I just can’t seem to get any relief from my pain.”
Clinician: “Do you have a plan to take all your pills?”
Mrs. Lee #3: “No.”
Mrs. Lee #4: “No. I haven’t worked up the courage yet.”
Clinician: “Do you intend to harm yourself?”
Mrs. Lee #3: “No. I would never do that.”
Mrs. Lee #4: “I might. I’m not sure.”
Clinician: “Is anything preventing you from harming yourself?”
Mrs. Lee #3: “I guess my faith. Plus, I’d never do that to my family. It would be devastating to them.”
Mrs. Lee #4: “Not really. I don’t really have anything to live for.”
Clinician: “Do you feel you can resist these thoughts?”
Mrs. Lee #3: “Yes. I told you I would never do that.”
Patient reports active suicide ideation, but denies plan and intention.
Mrs. Lee #4: “I’m not sure. I don’t know if I’ll be able to stop myself from taking the pills.” Patient reports active suicide ideation, and has uncertain intention, no reasons for living, and poor impulse control.
* From the educational videotape by Brown EL, Bruce ML, Raue PJ, et al. (2004): Depression Recognition and Assessment in Older Homecare Patients.
How the process works. As shown in FIGURE 1, the clinician asks a series of questions to determine the patient’s level of suicide risk. We suggest you ask about the prior 2 weeks, the same time frame covered in structured assessments like the PHQ-9.38 Use follow-up probe questions, as necessary, to formulate a clinical judgment.
Patients endorsing question 1 are considered at minimum to experience passive suicide ideation. In this instance, you should ask question 2, which deals with active suicide ideation. If a patient endorses question 2, pose questions 2a through 2g to identify a specific detailed suicide plan and to gauge a patient’s suicide intention, reasons for living, and impulse control. The CASE illustrates this process by presenting the same patient’s alternative responses to a clinician’s questions.
FIGURE 2 places the patient’s responses on a spectrum of risk and assists in conveying assessment findings to mental health professionals. The horizontal axis shows the continuum of suicide risk from very low (left) to imminent (right), and the correspondingly increased attention required by health care professionals. (Printable copies of these figures are available from the authors at www.geriu.org/suiciderisk)
The following descriptions assist in determining level of suicide risk and the associated intervention.
No suicide ideation
Presentation. Many primary care patients face end-of-life issues due to advanced age or severe illnesses. Indeed, older adults and the terminally ill are at the stage wherein occasional thoughts regarding death or mortality are normal and not pathological.44 Suicide ideation is considered present only when patients state that life is not worth living, or that they would be better off dead. Few primary care patients report such suicide ideation.5
Recommendation. Psychiatric evaluation in the absence of other psychiatric symptoms is unnecessary.
Follow-up. Reassess minimal risk patients following deterioration in their medical, functional, or social-environmental situations, or when starting them on an antidepressant.45
Passive suicide ideation
Presentation. Patients with passive suicide ideation have frequent thoughts that life is not worth living, or that they would be better off dead—for example, praying nightly that God will take them soon. Patients at this risk level deny thoughts about harming themselves. However, as many as 10% of medical patients report such passive suicide ideation,5 which is a moderate risk factor for suicide.
Recommendation. Patients endorsing passive suicide ideation require further psychiatric evaluation to determine the presence of a depressive or other psychiatric disorder. You may choose to conduct this evaluation personally and, if appropriate, pursue treatment by prescribing recommended antidepressant medications.46 Psychosocial interventions may seek to increase social contact, encourage hope, enhance ability to cope with stress and negative life events, and address meaning-of-life issues. Alternatively, you may refer such patients to psychiatrists, psychologists, social workers, or psychiatric nurses.
Follow-up. Schedule frequent visits with these patients, and assess their level of suicide risk at each office visit, particularly when the dosage of an antidepressant has been changed.45
Active suicide ideation
Presentation. Patients with active suicide ideation have thoughts about harming themselves, with differing levels of severity whose boundaries can be imprecise. At the severity level’s milder end, patients report active thoughts of self-harm but do not specify a particular method (“I feel like hurting myself, but I wouldn’t know how”).
Other patients may have specified a particular method for harming themselves, but lack a detailed plan or intention for doing so (“I’ve thought about taking all my pills, but I would never do that”). Ascertaining level of detail (for example, by asking “Which pills have you been thinking about? Have you thought about a particular time and place to take them? Have you made any preparations?”) will clarify a patient’s investment in harming him or herself. Insufficient detail or specificity suggests lack of an organized plan or intent.
Patients with active suicide ideation but no detailed plan must articulate convincing reasons for living such as having a purpose in life, not wanting to cause family or friends pain, or deeming suicide morally wrong or contrary to religious beliefs so as not to be classified at the highest risk level. They must also demonstrate good impulse control, or the ability to resist acting on these thoughts. Factors such as current alcohol or substance abuse, or a history of suicide attempts may indicate poor impulse control. While only about 1% of primary care patients endorse any level of active suicide ideation,5 those who do are at increased risk even when reporting reasons for living and demonstrating good impulse control.
Recommendation. Patients endorsing active suicide ideation even when lacking a specific plan or intention require immediate, same-day evaluation by a mental health specialist given the clinical complexities in precisely defining level of active suicide ideation. With the patient’s permission, a family member should be notified about his/her active suicide ideation. Medical ethics dictate that a family member be so informed without patient permission only when he or she is at a higher risk for suicide (see below). Primary care clinicians may directly treat patients with active suicide ideation,46 or refer them to specialty mental health practitioners.
Follow-up. Schedule visits with patients who have active suicide ideation more frequently than visits for those with passive ideation. Assess their level of suicide risk at each office visit.
Specific detailed suicide plan or intent
Presentation. Patients who report active suicide ideation with a specific detailed plan, intention to harm themselves, no convincing reasons for living, or a lack of impulse control are classified at the highest risk level. The term “suicide plan” means a patient reports an adequately detailed plan, as opposed to a more vaguely considered method. Given the association between suicide and firearms, especially in rural areas,47 also be sure to assess home or workplace firearms whenever active suicide ideation is present.3 An example of this highest risk level is a patient who states, “I’m planning to take all of my pain medication tomorrow morning,” or one who says, “I’ve been thinking about taking all of my pain medication, and I may not be able to stop myself from doing this.” Very few primary care patients endorse a specific plan or intention to harm themselves,5 but those who do so constitute a clinical emergency.
Recommendation. Patients endorsing a specific plan or intention to harm themselves require immediate psychiatric evaluation for safety, and should be transported to an emergency department. A family member should be notified of the patient’s suicide plan or intention.
Follow-up. Following emergency room evaluation and possible inpatient hospitalization, these patients should be referred to a mental health specialist for ongoing treatment and monitoring.
CORRESPONDENCE
Patrick J. Raue, PhD, Weill Medical College of Cornell University, 21 Bloomingdale Road, White Plains, NY 10605. E-mail: [email protected]
1. American Psychiatric Association. Diagnostic and Statistic Manual of Mental Health Disorders 4th ed., text revision. Washington, DC, American Psychiatric Association; 2000.
2. Coryell W, Young EA. Clinical predictors of suicide in primary major depressive disorder. J Clin Psychiatry 2005;66:412-417.
3. Practice guideline for the assessment and treatment of patients with suicidal behaviors. Am J Psychiatry 2003;160(11 Suppl):1-60.
4. Szanto K, Mulsant BH, Houck P, Dew MA, Reynolds CF. Occurrence and course of suicidality during short-term treatment of late-life depression. Arch Gen Psychiatry 2003;60:610-617.
5. Schulberg HC, Bruce ML, Lee PW, Williams JW, Dietrich AJ. Preventing suicide in primary care practice: the primary care physician’s role. Gen Hosp Psychiatry 2004;26:337-345.
6. Wells KB, Schoenbaum M, Unutzer J, Lagomasino IT, Rubenstein LV. Quality of care for primary care patients with depression in managed care. Arch Fam Med 1999;8:529-536.
7. Minino AM, Arias E, Kochanek KD, Murphy SL, Smith BL. Deaths: final data for 2000. National Vital Statistics Reports. 50 Hyattsville, Md: National Center for Health Statistics;2002.
8. Conwell Y, Duberstein PR, Caine ED. Risk factors for suicide in later life. Biol Psychiatry 2002;52:193-204.
9. Pearson JL, Conwell Y. Suicide in late life: challenges and opportunities for research. Int Psychogeriatr 1995;7:131-136.
10. Gliatto MF, Rai AK. Evaluation and treatment of patients with suicidal ideation. Am Fam Physician 1999;59:1500-1506.
11. Moscicki EK. Identification of suicide risk factors using epidemiologic studies. Psychiatr Clin North Am 1997;20:499-517.
12. Gaynes BN, West SL, Ford CA, Frame P, Klein J, Lohr KN. Screening for suicide risk in adults: a summary of the evidence for the U.S. Preventive Services Task Force. Ann Intern Med 2004;140:822-835.
13. Conner KR, Conwell Y, Duberstein PR. The validity of proxy-based data in suicide research: a study of patients 50 years of age and older who attempted suicide. II. Life events, social support, and suicidal behavior. Acta Psychiatr Scand 2001;104:452-457.
14. Flint EP, Hays JC, Krishnan KRR, Meador KG, Blazer DG. Suicidal behaviors in depressed men with a family history of suicide: effects of psychosocial factors and age. Aging Mental Health 1998;2:286-299.
15. Luoma JB, Martin CE, Pearson JL. Contact with mental health and primary care providers before suicide: a review of the evidence. Am J Psychiatry 2002;159:909-916.
16. Freiman MP. The demand for healthcare among racial/ethnic subpopulations. Health Serv Res 1998;33:867-890.
17. Wagner TH, Guendelman S. Healthcare utilization among Hispanics: findings from the 1994 Minority Health Survey. Am J Manag Care 2000;6:355-364.
18. Stenager EN, Jensen K. Attempted suicide and contact with the primary health authorities. Acta Psychiatr Scand 1994;90:109-113.
19. Appleby L, Amos T, Doyle U, Tomenson B, Woodman M. General practitioners and young suicides: a preventive role for primary care. Br J Psychiatry 1996;168:330-333.
20. Lin EH, Von Korff M, Wagner EH. Identifying suicide potential in primary care. J Gen Intern Med 1989;4:1-6.
21. Coombs DW, Miller HL, Alarcon R, Herlihy C, Lee JM, Morrison DP. Presuicide attempt communications between parasuicides and consulted caregivers. Suicide Life Threat Behav 1992;22:289-302.
22. Isometsa ET, Heikkinen ME, Marttunen MJ, Henriksson MM, Aro HM, Lonnqvist JK. The last appointment before suicide: is suicide intent communicated? Am J Psychiatry 1995;152:919-922.
23. Olfson M, Weissman MM, Leon AC, Sheehan DV, Farber L. Suicidal ideation in primary care. J Gen Intern Med 1996;11:447-453.
24. Nutting PA, Dickinson LM, Rubenstein LV, Keeley RD, Smith JL, Elliott CE. Improving detection of suicide ideation among depressed patients in primary care. Ann Fam Med 2005;3:529-536.
25. Mann JJ, Apter A, Bertolote J, et al. Suicide prevention strategies: a systematic review. JAMA 2005;294:2064-2074.
26. Schulberg HC, Lee PW, Bruce ML, et al. Suicidal ideation and risk levels among primary care patients with uncomplicated depression. Ann Fam Med 2006;3:523-528.
27. Bruce ML, Ten Have TR, Reynolds CF, 3rd, et al. Reducing suicidal ideation and depressive symptoms in depressed older primary care patients: a randomized controlled trial. JAMA 2004;291:1081-1091.
28. Fergusson D, Doucette S, Glass KC, et al. Association between suicide attempts and selective serotonin reuptake inhibitors: systematic review of randomised controlled trials. BMJ 2005;330:396.-
29. Jick H, Kaye JA, Jick SS. Antidepressants and the risk of suicidal behaviors. JAMA 2004;292:338-343.
30. Hall RC, Platt DE, Hall RC. Suicide risk assessment: a review of risk factors for suicide in 100 patients who made severe suicide attempts: evaluation of suicide risk in a time of managed care. Psychosomatics 1999;40:18-27.
31. Busch KA, Fawcett J, Jacobs DG. Clinical correlates of inpatient suicide. J Clin Psychiatry 2003;64:14-19.
32. Public Health Service. The surgeon general’s call to action to prevent suicide. Rockville, Md: US Department of Health and Human Services;1999.
33. Goldsmith S, Pellman T, Kleinman A, Bunney W, eds. Reducing Suicide: A National Imperative. Washington, DC: National Academies Press;2002.
34. McNamee JE, Offord DR. Prevention of suicide. In: Canadian Task Force on the Periodic Health Examination, Canadian guide to clinical preventive health care. Canada, Ottawa: CCG;1994:456-467.
35. Bruce ML, McAvay GJ, Raue PJ, et al. Major depression in elderly home health care patients. Am J Psychiatry 2002;159:1367-1374.
36. Brown EL, Bruce ML, Raue PJ, et al. (Writers). Bruce ML, Brown EL (Producers) (2004). Depression Recognition and Assessment in Older Homecare Patients [Videotape].
37. US Department of Health and Human Services. Mental Health: A Report of the Surgeon General. Rockville, Md: US Department of Health and Human Services, Substance Abuse and Mental Health Services Administration, Center for Mental Health Services, National Institutes of Health, National Institute of Mental Health, 1999.
38. Kroenke K, Spitzer RL, Williams JB. The PHQ-9: Validity of a brief depression severity measure. J Gen Intern Med 2001;16:606-613.
39. Beck AT, Guth D, Steer RA, Ball R. Screening for major depression disorders in medical inpatients with the Beck Depression Inventory for primary care. Behav Res Therapy 1997;35:785-791.
40. Beck AT, Kovacs M, Weissman M. Scale for suicide ideation. J Consult Clin Psychol 1979;47:343.-
41. Hamilton GN. Suicide prevention in primary care: careful questioning, prompt treatment can save lives. Postgrad Med 2000;108:81-84,87.
42. Frierson RL, Melikian M, Wadman PC. Principles of suicide risk assessment: how to interview depressed patients and tailor treatment. Postgrad Med 2002;112:65-66,69-71.
43. Bartels SJ, Coakley E, Oxman TE, et al. Suicidal and death ideation in older primary care patients with depression, anxiety, and at-risk alcohol use. Am J Geriatr Psychiatry 2002;10:417-427.
44. Kalish RA. The social context of death and dying. In: Binstock RH, Shanas E(eds.), Handbook of Aging & the Social Sciences. (2nd ed). New York: Van Nostrand Reinhold;1985:149-170.
45. US Food and Drug Administration Public Health Advisory. Worsening depression and suicidality in patients being treated with antidepressant medications. March 22, 2004. Available at: www.fda.gov/bbs/topics/ANSWERS/2004/ANS01283.html. Accessed on June 14, 2006.
46. Schulberg HC, Katon W, Simon GE, Rush AJ. Treating major depression in primary care practice: an update of the Agency for Health Care Policy and Research Practice Guidelines. Arch Gen Psychiatry 1998;55:1121-1127.
47. Dresang LT. Gun deaths in rural and urban settings: recommendations for prevention. J Am Board Fam Pract 2001;14:107-115.
48. Schulberg HC, Bryce C, Chism K, et al. Managing late-life depression in primary care practice: a case study of the Health Specialist’s role. Int J Geriatr Psychiatry 2001;16:577-584.
49. Unutzer J, Katon W, Callahan CM, et al. Collaborative care management of late-life depression in the primary care setting: a randomized controlled trial. JAMA 2002;288:2836-2845.
Practical symptom-based evaluation of chronic constipation
- A symptom-based approach is the best means for diagnosing chronic constipation. Extensive diagnostic testing is seldom necessary unless alarm features are present (C).
- Encourage routine colon cancer screening tests for all patients aged 50 years or older (C).
When a patient tells you she is constipated, what does she really mean? You would think that a report so common about a complaint so universal would be immediately clear. But, in fact, there is no standard, widely accepted definition.
Researchers define constipation by diagnostic criteria (eg, Rome II).1
Recommendation grades based on the American College of Gastroenterology (ACG) Chronic Constipation Task Force are presented on our web site (TABLE W1),4 as are the strength of recommendations taxonomy (SORT) grades for evidence (TABLE W2).5
Methods
References were selected by searching Medline and InfoRetriever using the terms constipation or chronic constipation and socioeconomics, prevalence, impact, treatment(s), patient unmet needs, patient needs, and definition. Articles from 1994 to November 2005 were included. Searches were restricted to manuscripts written in English and to those examining constipation in adults (aged 18 and older).
The focus of this article is on the North American population. A note-worthy limitation is that, although references for prevalence and socioeconomic impact are recent, most statistics in these references are from data more than 10 years old.
Using a symptom-based evaluation
The first step in this evaluation (FIGURE) is to ask the patient to clearly describe her symptoms.
FIGURE
Symptom-based approach to evaluating constipation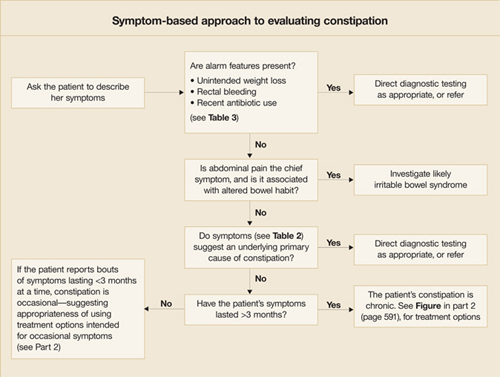
Helpful aids in assessing symptoms
The Rome II criteria (TABLE 1), developed by a panel of experts, are one frame of reference in which to assess a patient’s symptoms.1
Recently, to capture a more clinically relevant definition, the American College of Gastroenterology’s Chronic Constipation Task Force described constipation as a symptom-based disorder characterized by unsatisfactory defecation—infrequent stool or difficult stool passage, including straining, incomplete evacuation, hard/lumpy stool, increased time to passing stool, use of manual maneuvers, or sense of difficulty passing stool (TABLE 1).4
TABLE 1
Definitions of chronic constipation
| ROME II DIAGNOSTIC CRITERIA FOR FUNCTIONAL CONSTIPATION |
Constipation is defined by the presence of 2 or more of the following symptoms for at least 12 weeks, which need not be consecutive, in the preceding 12 months:
|
| AMERICAN COLLEGE OF GASTROENTEROLOGY CHRONIC CONSTIPATION TASK FORCE |
| Constipation is a symptom-based disorder manifesting as unsatisfactory defecation and characterized by infrequent stool, difficult passage of stool (including straining, a sense of difficulty passing stool, prolonged time to bowel movement, or need for manual maneuvers to pass stool), or both. Chronic constipation is defined as the presence of these symptoms for at least 3 months. |
| Sources: For Rome II: Thompson et al, Gut 19991; for ACG: Brandt et al, Am J Gastroenterol 2005.4 |
Specifics to look for in history and physical
Get a thorough account of the patient’s medical and surgical history, the family’s history, and medications currently used for other conditions (TABLE 2).
Ask about medications or maneuvers the patient has tried as constipation remedies, and consider potential reasons for ineffectiveness of medications. For instance, patients often do not take enough of an agent or do not give it enough time to work.
In the physical examination, be sure to include a digital rectal exam (looking for presence of skin tags, hemorrhoids, masses, etc).
Are alarm features present? Symptoms that are red flags suggestive of organic disease include rectal bleeding, symptom onset in patients older than 50 years, family history of colorectal cancer or inflammatory bowel disease, and key laboratory abnormalities (eg, anemia, leukocytosis), among others (TABLE 3).4 Such symptoms of course necessitate directed evaluation of the potential underlying cause.
Clues to primary or secondary constipation. Findings from the physical examination and patient history may also help distinguish between constipation that is primary (no known cause) and that which is secondary to a physiologic disorder (eg, hemorrhoids, strictures, anal fissure), medication (eg, antidepressants, anti-spasmodics), or lifestyle habits (eg, inactivity, inadequate fiber and fluid intake) (TABLE 2).6-11
When abdominal pain is the chief symptom. If the patient reports abdominal pain, explore the possibility of irritable bowel syndrome with constipation (IBS-C). Symptom overlap between IBS-C and chronic constipation is common and includes hard, lumpy stools, straining, and feelings of incomplete evacuation. Abdominal pain is the main distinguishing feature.1
In the case of IBS, abdominal pain is the primary symptom and, by definition, is associated with a change in stool frequency or form. With chronic constipation, however, abdominal pain is not necessarily the primary symptom and is not always related to changes in bowel habits.1
What symptom duration tells you. Symptom duration can aid in determining whether constipation is occasional or chronic, which may influence the treatment course you recommend. In the absence of clear-cut guidelines differentiating these subcategories, the distinction is often arbitrary: constipation is considered acute/occasional if it lasts less than 3 months and chronic if it lasts 3 months or more.4
TABLE 2
Causes of secondary constipation6-11
| MAIN CAUSES | SUGGESTIVE SIGNS AND SYMPTOMS |
|---|---|
| Medical conditions | |
GI tract conditions
| Abdominal pain, nausea, cramping, vomiting, weight loss, melena, rectal bleeding, rectal pain, fever, blood in stool |
Endocrine disorders
| Reduced body hair, skin dryness, fixed edema, weight gain, urinary frequency, and urgency |
Neurologic disorders
| Focal deficits, delayed relaxation phase of the deep tendon reflex, absence of a rectoanal inhibitory reflex, cogwheel rigidity |
Systemic condition
| Numbness, pain, or color changes in fingers, toes, cheeks, nose, and ears; stiffness or pain in joints; digestive problems; sores over joints; puffy hands and feet, particularly in the morning |
Psychological disorders
| Signs of depression (eg, flat affect, poor eye contact), history of abuse |
Postsurgical complications
| Surgical scars |
Female reproduction–related issues
| Pelvic floor dyssynergia, stress incontinence |
| Medications | |
| Aluminum-containing antacids, antispasmodics, antidepressants, diuretics, anticonvulsants, pain medications (especially narcotics), and calcium-channel blockers | Prescription and over-the-counter medication use |
| Lifestyle habits | |
| Inadequate dietary fiber consumption, insufficient fluid intake, inactivity, ignoring urge to defecate | Evidence of poor dietary habits and low level of physical activity |
TABLE 3
Select alarm features suggesting dire underlying causes4,7
HISTORY
|
PHYSICAL EXAMINATION
|
LABORATORY RESULTS
|
When are diagnostic tests warranted?
The choice of diagnostic tests and the timing of those tests is a judgment call in each case, ultimately based on your experience and clinical assessment. There are no universally accepted standards, but recently published evidence-based recommendations by the ACG Task Force on Chronic Constipation serve as a useful guide.
Per these recommendations, for patients with chronic constipation who do not exhibit alarm features, evidence is insufficient to recommend routine diagnostic testing (eg, colonoscopy, flexible sigmoidoscopy, barium enema, serum calcium, thyroid function tests) (ACG grade: C). In the presence of alarm features, however, relevant diagnostic tests are indicated (ACG grade: C).
Routine colon cancer screening tests for all patients aged 50 years or older is recommended (ACG grade: C).
In summary, per these guidelines, the routine initial approach to patients with chronic constipation but without alarm features is empiric treatment without diagnostic testing.4
Acknowledgments
The author acknowledges the editorial assistance of Meera Nathan, PhD, Maribeth Bogush, PhD, and Sophia Shumyatsky, PharmD in the preparation of this manuscript.
CORRESPONDENCE
Scott D. Bleser, DO, FAAFP, Bellbrook Medical Center, Inc, 4336 State Route 725, Bellbrook, OH 45305-2742. E-mail: [email protected]
1. Thompson WG, Longstreth GF, Drossman DA, Heaton KW, Irvine EJ, Muller-Lissner SA. Functional bowel disorders and functional abdominal pain. Gut 1999;45(suppl II):II43-II47.
2. Herz MJ, Kahan E, Zalevski S, Aframian R, Kuznitz D, Reichman S. Constipation: a different entity for patients and doctors. Fam Pract 1996;13:156-159.
3. Pare P, Ferrazzi S, Thompson WG, Irvine EJ, Rance L. An epidemiological survey of constipation in Canada: definitions, rates, demographics, and predictors of health care seeking. Am J Gastroenterol 2001;96:3130-3137.
4. Brandt LJ, Schoenfeld P, Prather CM, Quigley EMM, Schiller LR, Talley NJ. Evidenced-based position statement on the management of chronic constipation in North America. Am J Gastroenterol 2005;100(suppl):S1-S21.
5. Ebell MH, Siwek J, Weiss BD, et al. Strength of recommendation taxonomy (SORT): a patient-centered approach to grading evidence in the medical literature. J Fam Pract 2004;53:111-120.
6. Higgins PD, Johanson JF. Epidemiology of constipation in North America: a systematic review. Am J Gastroenterol 2004;99:750-759.
7. Lembo A, Camilleri M. Chronic constipation. N Engl J Med 2003;349:1360-1368.
8. Arce DA, Ermocilla CA, Costa H. Evaluation of constipation. Am Fam Physician 2002;65:2283-2290.
9. Passmore AP. Economic aspects of pharmacotherapy for chronic constipation. Pharmacoeconomics 1995;7:14-24.
10. Jacobs TQ, Pamies RJ. Adult constipation: a review and clinical guide. J Natl Med Assoc 2001;93:22-30.
11. Petticrew M, Rodgers M, Booth A. Effectiveness of laxatives in adults. Qual Health Care 2001;10:268-273.
- A symptom-based approach is the best means for diagnosing chronic constipation. Extensive diagnostic testing is seldom necessary unless alarm features are present (C).
- Encourage routine colon cancer screening tests for all patients aged 50 years or older (C).
When a patient tells you she is constipated, what does she really mean? You would think that a report so common about a complaint so universal would be immediately clear. But, in fact, there is no standard, widely accepted definition.
Researchers define constipation by diagnostic criteria (eg, Rome II).1
Recommendation grades based on the American College of Gastroenterology (ACG) Chronic Constipation Task Force are presented on our web site (TABLE W1),4 as are the strength of recommendations taxonomy (SORT) grades for evidence (TABLE W2).5
Methods
References were selected by searching Medline and InfoRetriever using the terms constipation or chronic constipation and socioeconomics, prevalence, impact, treatment(s), patient unmet needs, patient needs, and definition. Articles from 1994 to November 2005 were included. Searches were restricted to manuscripts written in English and to those examining constipation in adults (aged 18 and older).
The focus of this article is on the North American population. A note-worthy limitation is that, although references for prevalence and socioeconomic impact are recent, most statistics in these references are from data more than 10 years old.
Using a symptom-based evaluation
The first step in this evaluation (FIGURE) is to ask the patient to clearly describe her symptoms.
FIGURE
Symptom-based approach to evaluating constipation
Helpful aids in assessing symptoms
The Rome II criteria (TABLE 1), developed by a panel of experts, are one frame of reference in which to assess a patient’s symptoms.1
Recently, to capture a more clinically relevant definition, the American College of Gastroenterology’s Chronic Constipation Task Force described constipation as a symptom-based disorder characterized by unsatisfactory defecation—infrequent stool or difficult stool passage, including straining, incomplete evacuation, hard/lumpy stool, increased time to passing stool, use of manual maneuvers, or sense of difficulty passing stool (TABLE 1).4
TABLE 1
Definitions of chronic constipation
| ROME II DIAGNOSTIC CRITERIA FOR FUNCTIONAL CONSTIPATION |
Constipation is defined by the presence of 2 or more of the following symptoms for at least 12 weeks, which need not be consecutive, in the preceding 12 months:
|
| AMERICAN COLLEGE OF GASTROENTEROLOGY CHRONIC CONSTIPATION TASK FORCE |
| Constipation is a symptom-based disorder manifesting as unsatisfactory defecation and characterized by infrequent stool, difficult passage of stool (including straining, a sense of difficulty passing stool, prolonged time to bowel movement, or need for manual maneuvers to pass stool), or both. Chronic constipation is defined as the presence of these symptoms for at least 3 months. |
| Sources: For Rome II: Thompson et al, Gut 19991; for ACG: Brandt et al, Am J Gastroenterol 2005.4 |
Specifics to look for in history and physical
Get a thorough account of the patient’s medical and surgical history, the family’s history, and medications currently used for other conditions (TABLE 2).
Ask about medications or maneuvers the patient has tried as constipation remedies, and consider potential reasons for ineffectiveness of medications. For instance, patients often do not take enough of an agent or do not give it enough time to work.
In the physical examination, be sure to include a digital rectal exam (looking for presence of skin tags, hemorrhoids, masses, etc).
Are alarm features present? Symptoms that are red flags suggestive of organic disease include rectal bleeding, symptom onset in patients older than 50 years, family history of colorectal cancer or inflammatory bowel disease, and key laboratory abnormalities (eg, anemia, leukocytosis), among others (TABLE 3).4 Such symptoms of course necessitate directed evaluation of the potential underlying cause.
Clues to primary or secondary constipation. Findings from the physical examination and patient history may also help distinguish between constipation that is primary (no known cause) and that which is secondary to a physiologic disorder (eg, hemorrhoids, strictures, anal fissure), medication (eg, antidepressants, anti-spasmodics), or lifestyle habits (eg, inactivity, inadequate fiber and fluid intake) (TABLE 2).6-11
When abdominal pain is the chief symptom. If the patient reports abdominal pain, explore the possibility of irritable bowel syndrome with constipation (IBS-C). Symptom overlap between IBS-C and chronic constipation is common and includes hard, lumpy stools, straining, and feelings of incomplete evacuation. Abdominal pain is the main distinguishing feature.1
In the case of IBS, abdominal pain is the primary symptom and, by definition, is associated with a change in stool frequency or form. With chronic constipation, however, abdominal pain is not necessarily the primary symptom and is not always related to changes in bowel habits.1
What symptom duration tells you. Symptom duration can aid in determining whether constipation is occasional or chronic, which may influence the treatment course you recommend. In the absence of clear-cut guidelines differentiating these subcategories, the distinction is often arbitrary: constipation is considered acute/occasional if it lasts less than 3 months and chronic if it lasts 3 months or more.4
TABLE 2
Causes of secondary constipation6-11
| MAIN CAUSES | SUGGESTIVE SIGNS AND SYMPTOMS |
|---|---|
| Medical conditions | |
GI tract conditions
| Abdominal pain, nausea, cramping, vomiting, weight loss, melena, rectal bleeding, rectal pain, fever, blood in stool |
Endocrine disorders
| Reduced body hair, skin dryness, fixed edema, weight gain, urinary frequency, and urgency |
Neurologic disorders
| Focal deficits, delayed relaxation phase of the deep tendon reflex, absence of a rectoanal inhibitory reflex, cogwheel rigidity |
Systemic condition
| Numbness, pain, or color changes in fingers, toes, cheeks, nose, and ears; stiffness or pain in joints; digestive problems; sores over joints; puffy hands and feet, particularly in the morning |
Psychological disorders
| Signs of depression (eg, flat affect, poor eye contact), history of abuse |
Postsurgical complications
| Surgical scars |
Female reproduction–related issues
| Pelvic floor dyssynergia, stress incontinence |
| Medications | |
| Aluminum-containing antacids, antispasmodics, antidepressants, diuretics, anticonvulsants, pain medications (especially narcotics), and calcium-channel blockers | Prescription and over-the-counter medication use |
| Lifestyle habits | |
| Inadequate dietary fiber consumption, insufficient fluid intake, inactivity, ignoring urge to defecate | Evidence of poor dietary habits and low level of physical activity |
TABLE 3
Select alarm features suggesting dire underlying causes4,7
HISTORY
|
PHYSICAL EXAMINATION
|
LABORATORY RESULTS
|
When are diagnostic tests warranted?
The choice of diagnostic tests and the timing of those tests is a judgment call in each case, ultimately based on your experience and clinical assessment. There are no universally accepted standards, but recently published evidence-based recommendations by the ACG Task Force on Chronic Constipation serve as a useful guide.
Per these recommendations, for patients with chronic constipation who do not exhibit alarm features, evidence is insufficient to recommend routine diagnostic testing (eg, colonoscopy, flexible sigmoidoscopy, barium enema, serum calcium, thyroid function tests) (ACG grade: C). In the presence of alarm features, however, relevant diagnostic tests are indicated (ACG grade: C).
Routine colon cancer screening tests for all patients aged 50 years or older is recommended (ACG grade: C).
In summary, per these guidelines, the routine initial approach to patients with chronic constipation but without alarm features is empiric treatment without diagnostic testing.4
Acknowledgments
The author acknowledges the editorial assistance of Meera Nathan, PhD, Maribeth Bogush, PhD, and Sophia Shumyatsky, PharmD in the preparation of this manuscript.
CORRESPONDENCE
Scott D. Bleser, DO, FAAFP, Bellbrook Medical Center, Inc, 4336 State Route 725, Bellbrook, OH 45305-2742. E-mail: [email protected]
1. Thompson WG, Longstreth GF, Drossman DA, Heaton KW, Irvine EJ, Muller-Lissner SA. Functional bowel disorders and functional abdominal pain. Gut 1999;45(suppl II):II43-II47.
2. Herz MJ, Kahan E, Zalevski S, Aframian R, Kuznitz D, Reichman S. Constipation: a different entity for patients and doctors. Fam Pract 1996;13:156-159.
3. Pare P, Ferrazzi S, Thompson WG, Irvine EJ, Rance L. An epidemiological survey of constipation in Canada: definitions, rates, demographics, and predictors of health care seeking. Am J Gastroenterol 2001;96:3130-3137.
4. Brandt LJ, Schoenfeld P, Prather CM, Quigley EMM, Schiller LR, Talley NJ. Evidenced-based position statement on the management of chronic constipation in North America. Am J Gastroenterol 2005;100(suppl):S1-S21.
5. Ebell MH, Siwek J, Weiss BD, et al. Strength of recommendation taxonomy (SORT): a patient-centered approach to grading evidence in the medical literature. J Fam Pract 2004;53:111-120.
6. Higgins PD, Johanson JF. Epidemiology of constipation in North America: a systematic review. Am J Gastroenterol 2004;99:750-759.
7. Lembo A, Camilleri M. Chronic constipation. N Engl J Med 2003;349:1360-1368.
8. Arce DA, Ermocilla CA, Costa H. Evaluation of constipation. Am Fam Physician 2002;65:2283-2290.
9. Passmore AP. Economic aspects of pharmacotherapy for chronic constipation. Pharmacoeconomics 1995;7:14-24.
10. Jacobs TQ, Pamies RJ. Adult constipation: a review and clinical guide. J Natl Med Assoc 2001;93:22-30.
11. Petticrew M, Rodgers M, Booth A. Effectiveness of laxatives in adults. Qual Health Care 2001;10:268-273.