User login
Ectopic pregnancy: Expectant management an immediate surgery?
- Expectant management may be offered to asymptomatic patients with small adnexal masses (≤3 cm) lower beta-human chorionic gonadotropin (β-hCG) levels (<1000 mIU/mL), evidence of spontaneous resolution (eg, falling β-hCG levels) who are willing to accept the risk of tubal (A).
- Systemic methotrexate administration resolves ectopic pregnancy in 87% to 95% of cases, maintains tubal patency in 75% to 81%, and results in subsequent successful pregnancy in about 58% to 61% of patients. Hemodynamically stable patients with adnexal mass≤3.5 cm, β-hCG levels <5000 mIU/mL, no adnexal yolk sac and normal hematologic, liver, and kidney functions are ideal candidates for methotrexate therapy (A).
Management strategies for patients with ectopic pregnancy have evolved rapidly, with ambulatory medical therapy becoming an option for more patients.1 In part 1, published in the May 2006 JFP, using a practical decision protocol, we discuss the physical findings that most reliably suggest ectopic pregnancy, describe sensible use of laboratory and imaging studies, and explain what to do when results are equivocal.
Management choices
Once the diagnosis of ectopic pregnancy has been made, options include surgical, medical, or expectant management (FIGURE). The goal of treatment is to minimize disease-and treatment-related morbidity while maximizing reproductive potential.
Administer Rhogam to all Rh-negative women.
Clinical prediction tools have been developed to aid management decision making. Fernandez et al developed a score based on gestational age, β-hCG level, progesterone level, abdominal pain, hemoperitoneum volume, and hematosalpinx diameter.2 A score <12 predicts a >80% success with expectant or nonsurgical management (TABLE 1). Similarly, to predict response to a single-dose of methotrexate, Elito et al3 developed a score based on β-hCG level, ultrasound findings, have size of the mass (cm), and color Doppler image aspects (TABLE 1). In a small study of for 40 patients, those with scores >5 had a the 97% success rate.3
FIGURE
Deciding which management option is best for your patient with ectopic pregnancy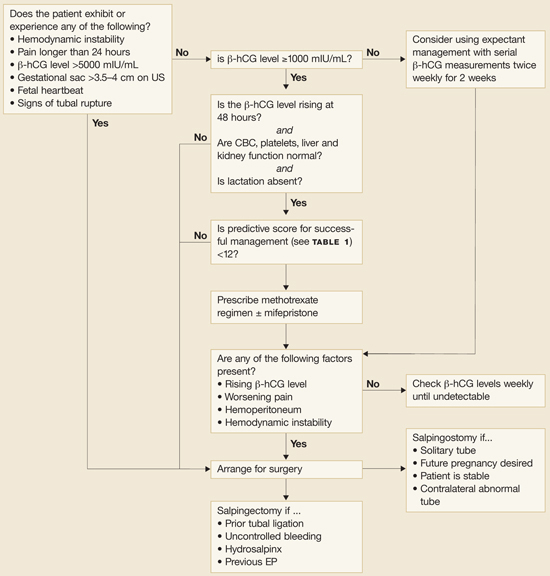
TABLE 1
Predictive score for successful treatment of ectopic pregnancy
| Predictive score for expectant management and several nonsurgical treatments (Fernandez 1991) | |||
| CRITERION | 1 POINT | 2 POINT | 3 POINT |
| β-hCG (mIU/mL) | <1000 | 1000–5000 | >5000 |
| Progesterone (ng/mL) | <5 | 5–10 | >10 |
| Abdominal pain | Absent | Induced | Spontaneous |
| Hematosalpinx (cm) | <1 | 1–3 | >3 |
| Hemoperitoneum (mL) | 0 | 1–100 | >100 |
| Score <12: 80% success with various nonsurgical treatments, including expectant management. | |||
| Predictive score for single dose methotrexate (50 mg/m2 IM) (Elito 1999) | |||
| PARAMETERS | 0 POINTS | 1 POINTS | 2 POINTS |
| β-hCG (mIU/mL) | >5000 | 1500–5000 | <1500 |
| Aspects of the image | Live embryo | Tubal ring | Hematosalpinx |
| Size of the mass | >3.0–3.5 | 2.6–3.0 | <2.5 |
| Color Doppler | High risk | Medium risk | Low risk |
| Score≥5: 97% success with single-dose methotrexate. | |||
| Sources: Fernandez et al 1991,2 Elito et al 1999.3 | |||
Surgical management
Surgery is preferred for ruptured ectopic pregnancy. Surgery is also indicated for patients with evidence of hemodynamic instability, anemia, pain for longer than 24 hours, β-hCG levels greater than 5000 mIU/mL, or with a gestational sac that measures more than 3.5 to 4 cm on ultrasound.1,4,5
Laparoscopic techniques minimize the trauma and morbidity of salpingectomy or salpingostomy. Compared with older procedures, they lessen blood loss, decrease the need for analgesia, and allow a shorter hospital stay and an earlier return to work.6
Salpingostomy removes the ectopic pregnancy while preserving the Fallopian tube. Weekly quantitative β-hCG testing is required to rule out persistent ectopic pregnancy, which occurs in 5% to 8% of patients following salpingostomy.7 The likelihood of persistent ectopic pregnancy following salpingostomy increases with an ectopic pregnancy <2 cm in diameter, salpingostomy performed <6 weeks from the last menstrual period, a β-hCG level >3000 mIU/mL, or progesterone level over 35 nmol/L combined with a daily change in β-hCG over 100 mIU/mL.8,9
Expectant management possible when β-hCG levels <1000 mIU/mL
Expectant management may be offered to asymptomatic women with small adnexal masses, lower β-hCG levels, and evidence of spontaneous resolution (eg, falling β-hCG levels) who are willing to accept the risk of tubal rupture.10 Rising β-hCG levels, pain, hemodynamic instability, or hemoperitoneum on ultrasound dictate switching to active management.11
Eighty percent of women with initial β-hCG levels <1000 mIU/mL experience spontaneous resolution (TABLE 2).1,4,5,11-17 In one study, women with initial β-hCG levels <1000 mIU/mL, adnexal masses <4 cm, no fetal heartbeat, and <100 mL of fluid in the pouch of Douglas were managed by serial ultrasound and β-hCG levels obtained twice-weekly for 2 weeks; the result was an 88% chance of spontaneous resolution.18 Women (n=9) with initial β-hCG levels ≤1000 mIU/mL with subsequent rising titers experienced no spontaneous resolution.
TABLE 2
Treatment options for ectopic pregnancy
| MODALITY | DESCRIPTION | EP RESOLUTION (%) | TUBAL PATENCY (%) | FUTURE IUP (%) | EP (%) | ADVERSE EVENTS | ||
| Salpingectomy Open or laparoscopic | Excision of ectopic pregnancy and tube | 100 | NA | 42–82* | 6–13 | Hemorrhage Infection Adhesions | ||
| Laparoscopic | Excision of ectopic pregnancy with repair of tube | 93 | 76 | 57 | 13 | Incomplete removal (persistent EP) Analgesic needed Lost work time | ||
| Expectant management | Twice-weekly β-hCG, ultrasound obtained for 2 weeks | 67–68 | 76–77 | 68–86 | 7–13 | Persistent EP 25% need medical or surgical management | ||
| β-hCG <1000 | 88 | |||||||
| β-hCG ≥1000 | 48 | |||||||
| Methotrexate Multidose | 1 mg/kg IV or IM with 0.1 mg/kg folic acid on alternating days. Stop when >15% drop in β-hCG observed or 4 doses administered | 93–95 | 75 | 58 | 7 | Mucositis (stomatitis, gastritis, diarrhea) Dermatitis Bone marrow suppression Hepatic dysfunction Pleuritis | ||
| Single dose | Injection of 50 mg/m2. β-hCG levels days 4 and 7. Repeat dose if no drop. | 87–90 | 81 | 61 | 8 | Reversible alopecia Photosensitivity Pulmonary fibrosis | ||
| Oral | 50 mg daily for 5 days or 60 mg/m2 (one time in 2 divided doses) | 86 | ||||||
| Direct injection | Ultrasound or laparoscopic guidance of 12.5–25 mg | 76 | 80 | 57 | 6 | |||
| EP, ectopic pregnancy; IUP, intrauterine pregnancy; NA, not applicable; IM, intramuscular; IV, intravenous. | ||||||||
| *82% if contralateral tube normal. | ||||||||
Medical management an option for about 25% of patients
Methotrexate depletes tetrahydrofolate cofactors required for DNA and RNA synthesis and cell replication, and thereby inhibits the rapidly growing trophoblasts in patients with ectopic pregnancy.
Methotrexate may be used for primary treatment of ectopic pregnancy, for persistent ectopic pregnancy following tubal sparing surgery, as prophylaxis to reduce persistent ectopic pregnancy following salpingostomy, and in cornual and cervical pregnancies.11,13,19
Who qualifies. Patients eligible for methotrexate administration are those without hemodynamic instability or evidence of tubal rupture (clinical or ultrasound), desiring future fertility, having a gestational sac <3.5 cm, a β-hCG level less than 5000 mIU/mL, no fetal cardiac motion on ultrasound, and the ability and willingness to comply with post-treatment monitoring.10,14
Systemic methotrexate successfully resolves ectopic pregnancy in 90% of patients. Subsequent tubal patency rates approximate 80% and pregnancy rates 60% with recurrent ectopic pregnancy rates 8%.10,13,15,16 The cost of treatment for systemic methotrexate was $5721 per patient compared with $4066 for salpingostomy.20 Hematologic, liver, and renal functions should be assessed before treatment.
Following methotrexate administration, some patients experience a transient increase in abdominal pain, vaginal bleeding, and rising β-hCG. Exclude a ruptured ectopic pregnancy in patients with worsening pain. Pelvic examinations, sexual intercourse, and TVUS should be avoided or minimized during treatment.10
Two regimens are used for the systemic administration of methotrexate (TABLE 2).
The single-dose regimen uses an intramuscular (IM) injection dose of 50 mg/m2 of methotrexate without leucovorin. It has an overall success rate of 87%. β-hCG levels are measured on days 4 and 7, and the medication is repeated if no drop is noticed.13 β-hCG levels are then repeated weekly until undetectable (usually 4 weeks). Serum progesterone levels drop significantly faster than β-hCG following methotrexate administration, and levels <1.5 ng/mL predict ectopic pregnancy resolution more accurately than β-hCG levels.21 Repeat dosing is needed in up to 14% of women.
In the multidose regimen, IM injections of 1 mg/kg of methotrexate are given followed by leucovorin (0.1 mg/kg) after 24 hours. β-hCG levels are checked every other day until there is a 15% or more drop on 2 consecutive days, or 4 doses of methotrexate are administered.1 β-hCG levels are then repeated weekly until undetectable. About half of the women receiving the multidose regimen require 4 or more doses (6.8% require >4 doses). On the other hand, 10% of women treated with this regimen require only 1 dose. Multidose methotrexate has also been used as first-line therapy in cervical, interstitial, ovarian, and abdominal gestation, but with substantially lower success.19
Single-dose vs multidose regimens. Although there are no direct comparison trials, a meta-analysis combining the results of 26 studies with 1067 women treated with a single-dose regimen and 267 women treated with a multidose regimen found that the multidose regimen was slightly more effective.16 The success rate for women with multidose treatment was 92.7% (95% confidence interval [CI], 89–96) vs a single-dose treatment success rate of 88.1% (95% CI, 86–90).
Women treated with single-dose regimens had fewer side effects (31.3% vs 41.2%). However, in both regimens, women who experienced adverse side effects were less likely to have failed treatment (single dose, odds ratio [OR]=0.27; multidose, OR=0.72). Another systematic review including 19 studies with 393 women treated with single-dose methotrexate and 338 women treated with multidose methotrexate had similar outcome findings; the multidose regimen was slightly more effective (93% vs 87%).13
A recent retrospective study comparing the multidose and single-dose regimens in 643 patients with ectopic pregnancy (single dose, n=555; multidose, n=97) from a single database also showed slightly better success with the multidose regimen (95% vs 90%, P=.18).22 Therefore, the multidose regimen may be preferred but a randomized controlled trial comparing the 2 regimens is needed.
In clinically stable women, the serum β-hCG level at presentation is probably the most important single factor determining failure of single-dose methotrexate; patients with low β-hCG levels (1000–2000 mIU/mL) have a high (~98%) response rate.23
Add mifepristone? Mifepristone 600 mg orally added to methotrexate increases successful resolution of unruptured ectopic pregnancy, decreases resolution time, and reduces the need for a second injection or laparotomy, without worsening side effects.24 A recent randomized controlled trial, however, showed that this combination had little advantage over methotrexate alone, and concluded that adding mifepristone be limited to patients with serum progesterone ≥10 ng/mL.25
Direct injection. When fetal cardiac activity is present, injection of 20% potassium chloride (KCl) 0.5 mL into the gestational sac under ultrasound guidance results in asystole and a slow resolution of ectopic pregnancy. Because KCl does not affect the trophoblast, trophoblastic tissue may continue to proliferate leading to tubal rupture.26 Hyperosmolar glucose 1 to 3 mL injected laparoscopically or under ultrasound guidance into the gestational sac maintains tubal patency, has few side effects, but its initial high success rates in resolving ectopic pregnancy (94% to 100%) has not been duplicated.11,13 Another option is prostaglandin F-2 alpha, which when injected into the Fallopian tube causes contractions and vasoconstriction, resulting in a resolution of ectopic pregnancy in 92% of patients.13 However, serious side effects have been reported, including severe abdominal discomfort, vomiting, and pulmonary edema.
CORRESPONDENCE
K. Ramakrishnan, MD, Department of Family and Preventive Medicine, University of Oklahoma Health Sciences Center, 900 NE 10th Street, Oklahoma City, OK 73104. E-mail: [email protected]
1. Carr RJ, Evans P. Ectopic pregnancy. Prim Care 2000;27:169-183.
2. Fernandez H, Lelaidier C, Thouvenez V, et al. The use of a pretherapeutic, predictive score to determine inclusion criteria for the non-surgical management of ectopic pregnancy. Hum Reprod 1991;6:995-998.
3. Elito J, Jr, Reichmann AP, Uchiyama MN, Camano L. Predictive score for the systemic treatment of unruptured ectopic pregnancy with a single dose of methotrexate. Int J Gynecol Obstet 1999;67:75-79.
4. Pisarska MD, Carson SA, Buster JE. Ectopic pregnancy. Lancet 1998;351:1115-1120.
5. Farquhar CM. Ectopic pregnancy. Lancet 2005;366:583-591.
6. Kelly AJ, Sowter MC, Trinder J. The management of tubal pregnancy. Royal College of Obstetricians and Gynecologists (RCOG). Guideline No. 21, May 2004. Available at: www.rcog.org.uk/resources/Public/pdf/management_tubal_pregnancy21.pdf.
7. Rulin MC. Is salpingostomy the surgical treatment of choice for unruptured tubal pregnancy? Obstet Gynecol 1995;86:1010-1013.
8. Seifer DB. Persistent ectopic pregnancy: an argument for heightened vigilance and patient compliance. Fertil Steril 1997;68:402-404.
9. Hagstrom HG, Hahlin M, Bennegard-Edèn B, Sjoblom P, Thorburn J, Lindblom B. Prediction of persistent ectopic pregnancy after laparoscopic salpingostomy. Obstet Gynecol 1994;84:798-802.
10. ACOG practice bulletin. Medical management of tubal pregnancy. Number 3, December 1998. Clinical management guidelines for obstetrician-gynecologists. American College of Obstetricians and Gynecologists. Int J Gynaecol Obstet 1999;65:97-103.
11. Mittal S. Non-surgical management of ectopic pregnancy. Obs Gyn Com 1999;1:23-28.
12. Cohen MA, Sauer MV. Expectant management of ectopic pregnancy. Clin Obstet Gynecol 1999;42:48-54.
13. Buster JE, Pisarska MD. Medical management of ectopic pregnancy. Clin Obstet Gynecol 1999;42:23-30.
14. Murray H, Baakdah H, Bardell T, Tulandi T. Diagnosis and treatment of ectopic pregnancy. CMAJ 2005;173:905-912.
15. Pansky M. Methotrexate (MXT) treatment for ectopic pregnancy-systemic vs local injection. Scientific presentation at The First World Congress on Controversies in Obstetrics, Gynecology & Infertility. Prague, Czech Republic, 1999. Available at: www.obgyn.net/firstcontroversies/prague1999pansky.doc. Accessed December 4, 2005.
16. Barnhart KT, Gosman G, Ashby R, Sammel M. The medical management of ectopic pregnancy: a meta-analysis comparing “single dose” and “multidose” regimens. Obstet Gynecol 2003;101:778-784.
17. Lipscomb GH, Meyer NL, Flynn DE, Peterson M, Ling F. Oral methotrexate for treatment of ectopic pregnancy. Am J Obstet Gynecol 2002;186:1192-1195.
18. Trio D, Strobelt N, Picciolo C, Lapinski RH, Ghidini A. Prognostic factors for successful expectant management of ectopic pregnancy. Fertil Steril 1995;63:469-472.
19. Barnhart K, Esposito M, Coutifaris C. An update on the medical treatment of ectopic pregnancy. Obstet Gynecol Clin North Am 2000;27:653-667, viii.
20. Mol BW, Hajenius PJ, Engelsbel S, et al. Treatment of tubal pregnancy in the Netherlands: an economic comparison of systemic methotrexate administration and laparoscopic salpingostomy. Am J Obstet Gynecol 1999;181:945-951.
21. Saraj AJ, Wilcox JG, Najmabadi, Stein SM, Johnson MB, Paulson RJ. Resolution of hormonal markers of ectopic gestation: a randomized trial comparing single-dose intramuscular methotrexate with salpingostomy. Obstet Gynecol 1998;92:989-994.
22. Lipscomb GH, Givens VM, Meyer NL, Bran D. Comparison of multidose and single-dose methotrexate protocols for the treatment of ectopic pregnancy. Am J Obstet Gynecol 2005;192:1844-1847.
23. Sowter MC, Farquhar CM. Ectopic pregnancy: an update. Curr Opin Obstet Gynecol 2004;16:289-293.
24. Gazvani MR, Baruah DN, Alfirevic Z, Emery SJ. Mifepristone in combination with methotrexate for the medical treatment of tubal pregnancy: a randomized, controlled trial. Hum Reprod 1998;13:1987-1990.
25. Rozenberg P, Chevret S, Camus E, et al. Medical treatment of ectopic pregnancies: a randomized clinical trial comparing methotrexate-mifepristone and methotrexate-placebo. Hum Reprod 2003;18:1802-1808.
26. Pansky M, Golan A, Bukovsky I, Caspi E. Nonsurgical management of tubal pregnancy. Necessity in view of the changing clinical appearance. Am J Obstet Gynecol 1991;164:888-895.
- Expectant management may be offered to asymptomatic patients with small adnexal masses (≤3 cm) lower beta-human chorionic gonadotropin (β-hCG) levels (<1000 mIU/mL), evidence of spontaneous resolution (eg, falling β-hCG levels) who are willing to accept the risk of tubal (A).
- Systemic methotrexate administration resolves ectopic pregnancy in 87% to 95% of cases, maintains tubal patency in 75% to 81%, and results in subsequent successful pregnancy in about 58% to 61% of patients. Hemodynamically stable patients with adnexal mass≤3.5 cm, β-hCG levels <5000 mIU/mL, no adnexal yolk sac and normal hematologic, liver, and kidney functions are ideal candidates for methotrexate therapy (A).
Management strategies for patients with ectopic pregnancy have evolved rapidly, with ambulatory medical therapy becoming an option for more patients.1 In part 1, published in the May 2006 JFP, using a practical decision protocol, we discuss the physical findings that most reliably suggest ectopic pregnancy, describe sensible use of laboratory and imaging studies, and explain what to do when results are equivocal.
Management choices
Once the diagnosis of ectopic pregnancy has been made, options include surgical, medical, or expectant management (FIGURE). The goal of treatment is to minimize disease-and treatment-related morbidity while maximizing reproductive potential.
Administer Rhogam to all Rh-negative women.
Clinical prediction tools have been developed to aid management decision making. Fernandez et al developed a score based on gestational age, β-hCG level, progesterone level, abdominal pain, hemoperitoneum volume, and hematosalpinx diameter.2 A score <12 predicts a >80% success with expectant or nonsurgical management (TABLE 1). Similarly, to predict response to a single-dose of methotrexate, Elito et al3 developed a score based on β-hCG level, ultrasound findings, have size of the mass (cm), and color Doppler image aspects (TABLE 1). In a small study of for 40 patients, those with scores >5 had a the 97% success rate.3
FIGURE
Deciding which management option is best for your patient with ectopic pregnancy
TABLE 1
Predictive score for successful treatment of ectopic pregnancy
| Predictive score for expectant management and several nonsurgical treatments (Fernandez 1991) | |||
| CRITERION | 1 POINT | 2 POINT | 3 POINT |
| β-hCG (mIU/mL) | <1000 | 1000–5000 | >5000 |
| Progesterone (ng/mL) | <5 | 5–10 | >10 |
| Abdominal pain | Absent | Induced | Spontaneous |
| Hematosalpinx (cm) | <1 | 1–3 | >3 |
| Hemoperitoneum (mL) | 0 | 1–100 | >100 |
| Score <12: 80% success with various nonsurgical treatments, including expectant management. | |||
| Predictive score for single dose methotrexate (50 mg/m2 IM) (Elito 1999) | |||
| PARAMETERS | 0 POINTS | 1 POINTS | 2 POINTS |
| β-hCG (mIU/mL) | >5000 | 1500–5000 | <1500 |
| Aspects of the image | Live embryo | Tubal ring | Hematosalpinx |
| Size of the mass | >3.0–3.5 | 2.6–3.0 | <2.5 |
| Color Doppler | High risk | Medium risk | Low risk |
| Score≥5: 97% success with single-dose methotrexate. | |||
| Sources: Fernandez et al 1991,2 Elito et al 1999.3 | |||
Surgical management
Surgery is preferred for ruptured ectopic pregnancy. Surgery is also indicated for patients with evidence of hemodynamic instability, anemia, pain for longer than 24 hours, β-hCG levels greater than 5000 mIU/mL, or with a gestational sac that measures more than 3.5 to 4 cm on ultrasound.1,4,5
Laparoscopic techniques minimize the trauma and morbidity of salpingectomy or salpingostomy. Compared with older procedures, they lessen blood loss, decrease the need for analgesia, and allow a shorter hospital stay and an earlier return to work.6
Salpingostomy removes the ectopic pregnancy while preserving the Fallopian tube. Weekly quantitative β-hCG testing is required to rule out persistent ectopic pregnancy, which occurs in 5% to 8% of patients following salpingostomy.7 The likelihood of persistent ectopic pregnancy following salpingostomy increases with an ectopic pregnancy <2 cm in diameter, salpingostomy performed <6 weeks from the last menstrual period, a β-hCG level >3000 mIU/mL, or progesterone level over 35 nmol/L combined with a daily change in β-hCG over 100 mIU/mL.8,9
Expectant management possible when β-hCG levels <1000 mIU/mL
Expectant management may be offered to asymptomatic women with small adnexal masses, lower β-hCG levels, and evidence of spontaneous resolution (eg, falling β-hCG levels) who are willing to accept the risk of tubal rupture.10 Rising β-hCG levels, pain, hemodynamic instability, or hemoperitoneum on ultrasound dictate switching to active management.11
Eighty percent of women with initial β-hCG levels <1000 mIU/mL experience spontaneous resolution (TABLE 2).1,4,5,11-17 In one study, women with initial β-hCG levels <1000 mIU/mL, adnexal masses <4 cm, no fetal heartbeat, and <100 mL of fluid in the pouch of Douglas were managed by serial ultrasound and β-hCG levels obtained twice-weekly for 2 weeks; the result was an 88% chance of spontaneous resolution.18 Women (n=9) with initial β-hCG levels ≤1000 mIU/mL with subsequent rising titers experienced no spontaneous resolution.
TABLE 2
Treatment options for ectopic pregnancy
| MODALITY | DESCRIPTION | EP RESOLUTION (%) | TUBAL PATENCY (%) | FUTURE IUP (%) | EP (%) | ADVERSE EVENTS | ||
| Salpingectomy Open or laparoscopic | Excision of ectopic pregnancy and tube | 100 | NA | 42–82* | 6–13 | Hemorrhage Infection Adhesions | ||
| Laparoscopic | Excision of ectopic pregnancy with repair of tube | 93 | 76 | 57 | 13 | Incomplete removal (persistent EP) Analgesic needed Lost work time | ||
| Expectant management | Twice-weekly β-hCG, ultrasound obtained for 2 weeks | 67–68 | 76–77 | 68–86 | 7–13 | Persistent EP 25% need medical or surgical management | ||
| β-hCG <1000 | 88 | |||||||
| β-hCG ≥1000 | 48 | |||||||
| Methotrexate Multidose | 1 mg/kg IV or IM with 0.1 mg/kg folic acid on alternating days. Stop when >15% drop in β-hCG observed or 4 doses administered | 93–95 | 75 | 58 | 7 | Mucositis (stomatitis, gastritis, diarrhea) Dermatitis Bone marrow suppression Hepatic dysfunction Pleuritis | ||
| Single dose | Injection of 50 mg/m2. β-hCG levels days 4 and 7. Repeat dose if no drop. | 87–90 | 81 | 61 | 8 | Reversible alopecia Photosensitivity Pulmonary fibrosis | ||
| Oral | 50 mg daily for 5 days or 60 mg/m2 (one time in 2 divided doses) | 86 | ||||||
| Direct injection | Ultrasound or laparoscopic guidance of 12.5–25 mg | 76 | 80 | 57 | 6 | |||
| EP, ectopic pregnancy; IUP, intrauterine pregnancy; NA, not applicable; IM, intramuscular; IV, intravenous. | ||||||||
| *82% if contralateral tube normal. | ||||||||
Medical management an option for about 25% of patients
Methotrexate depletes tetrahydrofolate cofactors required for DNA and RNA synthesis and cell replication, and thereby inhibits the rapidly growing trophoblasts in patients with ectopic pregnancy.
Methotrexate may be used for primary treatment of ectopic pregnancy, for persistent ectopic pregnancy following tubal sparing surgery, as prophylaxis to reduce persistent ectopic pregnancy following salpingostomy, and in cornual and cervical pregnancies.11,13,19
Who qualifies. Patients eligible for methotrexate administration are those without hemodynamic instability or evidence of tubal rupture (clinical or ultrasound), desiring future fertility, having a gestational sac <3.5 cm, a β-hCG level less than 5000 mIU/mL, no fetal cardiac motion on ultrasound, and the ability and willingness to comply with post-treatment monitoring.10,14
Systemic methotrexate successfully resolves ectopic pregnancy in 90% of patients. Subsequent tubal patency rates approximate 80% and pregnancy rates 60% with recurrent ectopic pregnancy rates 8%.10,13,15,16 The cost of treatment for systemic methotrexate was $5721 per patient compared with $4066 for salpingostomy.20 Hematologic, liver, and renal functions should be assessed before treatment.
Following methotrexate administration, some patients experience a transient increase in abdominal pain, vaginal bleeding, and rising β-hCG. Exclude a ruptured ectopic pregnancy in patients with worsening pain. Pelvic examinations, sexual intercourse, and TVUS should be avoided or minimized during treatment.10
Two regimens are used for the systemic administration of methotrexate (TABLE 2).
The single-dose regimen uses an intramuscular (IM) injection dose of 50 mg/m2 of methotrexate without leucovorin. It has an overall success rate of 87%. β-hCG levels are measured on days 4 and 7, and the medication is repeated if no drop is noticed.13 β-hCG levels are then repeated weekly until undetectable (usually 4 weeks). Serum progesterone levels drop significantly faster than β-hCG following methotrexate administration, and levels <1.5 ng/mL predict ectopic pregnancy resolution more accurately than β-hCG levels.21 Repeat dosing is needed in up to 14% of women.
In the multidose regimen, IM injections of 1 mg/kg of methotrexate are given followed by leucovorin (0.1 mg/kg) after 24 hours. β-hCG levels are checked every other day until there is a 15% or more drop on 2 consecutive days, or 4 doses of methotrexate are administered.1 β-hCG levels are then repeated weekly until undetectable. About half of the women receiving the multidose regimen require 4 or more doses (6.8% require >4 doses). On the other hand, 10% of women treated with this regimen require only 1 dose. Multidose methotrexate has also been used as first-line therapy in cervical, interstitial, ovarian, and abdominal gestation, but with substantially lower success.19
Single-dose vs multidose regimens. Although there are no direct comparison trials, a meta-analysis combining the results of 26 studies with 1067 women treated with a single-dose regimen and 267 women treated with a multidose regimen found that the multidose regimen was slightly more effective.16 The success rate for women with multidose treatment was 92.7% (95% confidence interval [CI], 89–96) vs a single-dose treatment success rate of 88.1% (95% CI, 86–90).
Women treated with single-dose regimens had fewer side effects (31.3% vs 41.2%). However, in both regimens, women who experienced adverse side effects were less likely to have failed treatment (single dose, odds ratio [OR]=0.27; multidose, OR=0.72). Another systematic review including 19 studies with 393 women treated with single-dose methotrexate and 338 women treated with multidose methotrexate had similar outcome findings; the multidose regimen was slightly more effective (93% vs 87%).13
A recent retrospective study comparing the multidose and single-dose regimens in 643 patients with ectopic pregnancy (single dose, n=555; multidose, n=97) from a single database also showed slightly better success with the multidose regimen (95% vs 90%, P=.18).22 Therefore, the multidose regimen may be preferred but a randomized controlled trial comparing the 2 regimens is needed.
In clinically stable women, the serum β-hCG level at presentation is probably the most important single factor determining failure of single-dose methotrexate; patients with low β-hCG levels (1000–2000 mIU/mL) have a high (~98%) response rate.23
Add mifepristone? Mifepristone 600 mg orally added to methotrexate increases successful resolution of unruptured ectopic pregnancy, decreases resolution time, and reduces the need for a second injection or laparotomy, without worsening side effects.24 A recent randomized controlled trial, however, showed that this combination had little advantage over methotrexate alone, and concluded that adding mifepristone be limited to patients with serum progesterone ≥10 ng/mL.25
Direct injection. When fetal cardiac activity is present, injection of 20% potassium chloride (KCl) 0.5 mL into the gestational sac under ultrasound guidance results in asystole and a slow resolution of ectopic pregnancy. Because KCl does not affect the trophoblast, trophoblastic tissue may continue to proliferate leading to tubal rupture.26 Hyperosmolar glucose 1 to 3 mL injected laparoscopically or under ultrasound guidance into the gestational sac maintains tubal patency, has few side effects, but its initial high success rates in resolving ectopic pregnancy (94% to 100%) has not been duplicated.11,13 Another option is prostaglandin F-2 alpha, which when injected into the Fallopian tube causes contractions and vasoconstriction, resulting in a resolution of ectopic pregnancy in 92% of patients.13 However, serious side effects have been reported, including severe abdominal discomfort, vomiting, and pulmonary edema.
CORRESPONDENCE
K. Ramakrishnan, MD, Department of Family and Preventive Medicine, University of Oklahoma Health Sciences Center, 900 NE 10th Street, Oklahoma City, OK 73104. E-mail: [email protected]
1. Carr RJ, Evans P. Ectopic pregnancy. Prim Care 2000;27:169-183.
2. Fernandez H, Lelaidier C, Thouvenez V, et al. The use of a pretherapeutic, predictive score to determine inclusion criteria for the non-surgical management of ectopic pregnancy. Hum Reprod 1991;6:995-998.
3. Elito J, Jr, Reichmann AP, Uchiyama MN, Camano L. Predictive score for the systemic treatment of unruptured ectopic pregnancy with a single dose of methotrexate. Int J Gynecol Obstet 1999;67:75-79.
4. Pisarska MD, Carson SA, Buster JE. Ectopic pregnancy. Lancet 1998;351:1115-1120.
5. Farquhar CM. Ectopic pregnancy. Lancet 2005;366:583-591.
6. Kelly AJ, Sowter MC, Trinder J. The management of tubal pregnancy. Royal College of Obstetricians and Gynecologists (RCOG). Guideline No. 21, May 2004. Available at: www.rcog.org.uk/resources/Public/pdf/management_tubal_pregnancy21.pdf.
7. Rulin MC. Is salpingostomy the surgical treatment of choice for unruptured tubal pregnancy? Obstet Gynecol 1995;86:1010-1013.
8. Seifer DB. Persistent ectopic pregnancy: an argument for heightened vigilance and patient compliance. Fertil Steril 1997;68:402-404.
9. Hagstrom HG, Hahlin M, Bennegard-Edèn B, Sjoblom P, Thorburn J, Lindblom B. Prediction of persistent ectopic pregnancy after laparoscopic salpingostomy. Obstet Gynecol 1994;84:798-802.
10. ACOG practice bulletin. Medical management of tubal pregnancy. Number 3, December 1998. Clinical management guidelines for obstetrician-gynecologists. American College of Obstetricians and Gynecologists. Int J Gynaecol Obstet 1999;65:97-103.
11. Mittal S. Non-surgical management of ectopic pregnancy. Obs Gyn Com 1999;1:23-28.
12. Cohen MA, Sauer MV. Expectant management of ectopic pregnancy. Clin Obstet Gynecol 1999;42:48-54.
13. Buster JE, Pisarska MD. Medical management of ectopic pregnancy. Clin Obstet Gynecol 1999;42:23-30.
14. Murray H, Baakdah H, Bardell T, Tulandi T. Diagnosis and treatment of ectopic pregnancy. CMAJ 2005;173:905-912.
15. Pansky M. Methotrexate (MXT) treatment for ectopic pregnancy-systemic vs local injection. Scientific presentation at The First World Congress on Controversies in Obstetrics, Gynecology & Infertility. Prague, Czech Republic, 1999. Available at: www.obgyn.net/firstcontroversies/prague1999pansky.doc. Accessed December 4, 2005.
16. Barnhart KT, Gosman G, Ashby R, Sammel M. The medical management of ectopic pregnancy: a meta-analysis comparing “single dose” and “multidose” regimens. Obstet Gynecol 2003;101:778-784.
17. Lipscomb GH, Meyer NL, Flynn DE, Peterson M, Ling F. Oral methotrexate for treatment of ectopic pregnancy. Am J Obstet Gynecol 2002;186:1192-1195.
18. Trio D, Strobelt N, Picciolo C, Lapinski RH, Ghidini A. Prognostic factors for successful expectant management of ectopic pregnancy. Fertil Steril 1995;63:469-472.
19. Barnhart K, Esposito M, Coutifaris C. An update on the medical treatment of ectopic pregnancy. Obstet Gynecol Clin North Am 2000;27:653-667, viii.
20. Mol BW, Hajenius PJ, Engelsbel S, et al. Treatment of tubal pregnancy in the Netherlands: an economic comparison of systemic methotrexate administration and laparoscopic salpingostomy. Am J Obstet Gynecol 1999;181:945-951.
21. Saraj AJ, Wilcox JG, Najmabadi, Stein SM, Johnson MB, Paulson RJ. Resolution of hormonal markers of ectopic gestation: a randomized trial comparing single-dose intramuscular methotrexate with salpingostomy. Obstet Gynecol 1998;92:989-994.
22. Lipscomb GH, Givens VM, Meyer NL, Bran D. Comparison of multidose and single-dose methotrexate protocols for the treatment of ectopic pregnancy. Am J Obstet Gynecol 2005;192:1844-1847.
23. Sowter MC, Farquhar CM. Ectopic pregnancy: an update. Curr Opin Obstet Gynecol 2004;16:289-293.
24. Gazvani MR, Baruah DN, Alfirevic Z, Emery SJ. Mifepristone in combination with methotrexate for the medical treatment of tubal pregnancy: a randomized, controlled trial. Hum Reprod 1998;13:1987-1990.
25. Rozenberg P, Chevret S, Camus E, et al. Medical treatment of ectopic pregnancies: a randomized clinical trial comparing methotrexate-mifepristone and methotrexate-placebo. Hum Reprod 2003;18:1802-1808.
26. Pansky M, Golan A, Bukovsky I, Caspi E. Nonsurgical management of tubal pregnancy. Necessity in view of the changing clinical appearance. Am J Obstet Gynecol 1991;164:888-895.
How should we manage GERD?
GRADE A RECOMMENDATIONS
- PPIs are superior to H2RAs for the resolution of GERD symptoms at 4 weeks and the healing of esophagitis at 8 weeks.
- There is no difference in relief of symptoms at 8 weeks between omeprazole, lansoprazole, pantoprazole, and rabeprazole.
GRADE B RECOMMENDATIONS
- Laparoscopic fundoplication is as effective as open fundoplication for relieving heartburn and regurgitation, improving quality of life, and decreasing the use of antisecretory medications.
- Medical treatment was as effective as fundoplication for relief of GERD symptoms and decreasing esophageal acid exposure, at least for up to 2 years of follow-up.
- Laparoscopic techniques yielded better patient satisfaction compared with endoscopic treatments.
GRADE C RECOMMENDATION
- Patients with psychiatric disorders, when treated surgically, have less symptom improvement and worse satisfaction outcomes.
- Are proton pump inhibitors (PPIs) more effective than histamine type 2 receptor antagonists (H2RAs) for the treatment of gastroesophageal reflux disorder (GERD)?
- Do all PPIs relieve heartburn symptoms equally?
- What is the role of fundoplication in the management of severe GERD?
The answers to these clinical questions can be found in a clinical effectiveness review that compares the medical, surgical, and endoscopic treatments for GERD. It was prepared for the Agency for Healthcare Research and Quality (AHRQ) by Tufts–New England Medical Center’s Evidence-Based Practice Center. AHRQ began funding these clinical effectiveness reviews in 2005 to provide valid evidence about the comparative effectiveness of medical interventions to treat common health problems. Their objective is to provide resources to assist consumers and healthcare providers to make informed choices among treatment alternatives. The evidence category for this effectiveness review was management. The patient population was limited to adults. The evidence rating is updated to comply with the SORT taxonomy.1
Guideline relevance and limitations
GERD is defined as weekly heartburn or acid regurgitation. It is one of the most common medical problems encountered by primary care physicians. In the year 2000, direct costs for treating GERD was estimated at $10 billion for patients with chronic GERD. Goals of therapy are to improve heartburn symptoms and quality of life, heal esophagitis, maintain healing, and prevent complications (Barrett’s esophagus, esophageal stricture formation, or esophageal adenocarcinoma).
The review considered comparison of medical treatments to surgery, comparison of surgery with endoscopic procedures, comparison of medical treatments with endoscopic procedures, comparison of medical treatments (between classes and within class), comparison of surgical techniques (open and laparoscopic), comparison of endoscopic treatment with sham, patient characteristics associated with outcomes of medical, surgical, and endoscopic treatments, and adverse events associated with medical, surgical, and endoscopic treatments.
Medical treatments considered were intermittent, periodic, or continuous use of prescription or over-the-counter medications, H2RAs, and PPIs. Surgical therapy included fundoplication. The review is weakened by inconsistent reference points in the scale of defining severity.
Guideline development and evidence review
The guideline was formulated by Tufts–New England Medical Center’s Evidence-Based Practice Center. Evidence was selected by searching Medline, EmBase, and Cochrane databases. A critical appraisal was performed and recommendations were graded. The review was released in December 2005.
Source for this guideline
Ip S, Bonis P, Tatsioni A, et al. Comparative effectiveness of management strategies for gastroesophageal reflux disease. Evidence Report/Technology Assessment No. 1. (Prepared by Tufts–New England Medical Center Evidence-Based Practice Center under Contract No. 290-02-0022.) Rockville, Md: Agency for Healthcare Research and Quality. December 2005. Available at: effectivehealthcare.ahrq.gov/synthesize/report/final.cfm?Document=2&Topic=30. Accessed on April 18, 2006.
Other guidelines on GERD
Guideline for the management of dyspepsia
This 2005 guideline considers indications for EGD and 2 treatment options for functional dyspepsia: testing and eradication of Helicobacter pylori infection or empiric trial of acid suppression with a PPI for 4 to 8 weeks.
Source. Talley NJ, Vakil N, and the Practice Parameters Committee of the American College of Gastroenterology. Guidelines for the management of dyspepsia. Am J Gastroenterology 2005; 100:2324–2337 Available at: www.acg.gi.org/physicians/guidelines/dyspepsia.pdf. Accessed on April 18, 2006.
Updated guidelines for the diagnosis and treatment of gastroesophageal reflux disease
This recent guideline reviews diagnosis (endoscopy, ambulatory reflux monitoring, and esophageal manometry) and treatment of GERD (including lifestyle changes and pro-motility agents). The literature review is less rigorous than the AHRQ clinical effectiveness review.
Source. DeVault KR, Castell DO. Updated guidelines for the diagnosis and treatment of gastroesophageal reflux disease. Am J Gastroenterol 2005; 100:190–200. Available at: www.acg.gi.org/physicians/guidelines/GERDTreatment.pdf. Accessed on April 18, 2006.
CORRESPONDENCE
Keith B. Holten, MD, 825 Locust Street, Wilmington, OH 45177. E-mail: [email protected]
REFERENCE
1. Ebell M, Siwek J, Weiss BD, et al. Strength of recommendation taxonomy (SORT): A patient-centered approach to grading evidence in the medical literature. J Fam Pract 2004;53:111-120.
GRADE A RECOMMENDATIONS
- PPIs are superior to H2RAs for the resolution of GERD symptoms at 4 weeks and the healing of esophagitis at 8 weeks.
- There is no difference in relief of symptoms at 8 weeks between omeprazole, lansoprazole, pantoprazole, and rabeprazole.
GRADE B RECOMMENDATIONS
- Laparoscopic fundoplication is as effective as open fundoplication for relieving heartburn and regurgitation, improving quality of life, and decreasing the use of antisecretory medications.
- Medical treatment was as effective as fundoplication for relief of GERD symptoms and decreasing esophageal acid exposure, at least for up to 2 years of follow-up.
- Laparoscopic techniques yielded better patient satisfaction compared with endoscopic treatments.
GRADE C RECOMMENDATION
- Patients with psychiatric disorders, when treated surgically, have less symptom improvement and worse satisfaction outcomes.
- Are proton pump inhibitors (PPIs) more effective than histamine type 2 receptor antagonists (H2RAs) for the treatment of gastroesophageal reflux disorder (GERD)?
- Do all PPIs relieve heartburn symptoms equally?
- What is the role of fundoplication in the management of severe GERD?
The answers to these clinical questions can be found in a clinical effectiveness review that compares the medical, surgical, and endoscopic treatments for GERD. It was prepared for the Agency for Healthcare Research and Quality (AHRQ) by Tufts–New England Medical Center’s Evidence-Based Practice Center. AHRQ began funding these clinical effectiveness reviews in 2005 to provide valid evidence about the comparative effectiveness of medical interventions to treat common health problems. Their objective is to provide resources to assist consumers and healthcare providers to make informed choices among treatment alternatives. The evidence category for this effectiveness review was management. The patient population was limited to adults. The evidence rating is updated to comply with the SORT taxonomy.1
Guideline relevance and limitations
GERD is defined as weekly heartburn or acid regurgitation. It is one of the most common medical problems encountered by primary care physicians. In the year 2000, direct costs for treating GERD was estimated at $10 billion for patients with chronic GERD. Goals of therapy are to improve heartburn symptoms and quality of life, heal esophagitis, maintain healing, and prevent complications (Barrett’s esophagus, esophageal stricture formation, or esophageal adenocarcinoma).
The review considered comparison of medical treatments to surgery, comparison of surgery with endoscopic procedures, comparison of medical treatments with endoscopic procedures, comparison of medical treatments (between classes and within class), comparison of surgical techniques (open and laparoscopic), comparison of endoscopic treatment with sham, patient characteristics associated with outcomes of medical, surgical, and endoscopic treatments, and adverse events associated with medical, surgical, and endoscopic treatments.
Medical treatments considered were intermittent, periodic, or continuous use of prescription or over-the-counter medications, H2RAs, and PPIs. Surgical therapy included fundoplication. The review is weakened by inconsistent reference points in the scale of defining severity.
Guideline development and evidence review
The guideline was formulated by Tufts–New England Medical Center’s Evidence-Based Practice Center. Evidence was selected by searching Medline, EmBase, and Cochrane databases. A critical appraisal was performed and recommendations were graded. The review was released in December 2005.
Source for this guideline
Ip S, Bonis P, Tatsioni A, et al. Comparative effectiveness of management strategies for gastroesophageal reflux disease. Evidence Report/Technology Assessment No. 1. (Prepared by Tufts–New England Medical Center Evidence-Based Practice Center under Contract No. 290-02-0022.) Rockville, Md: Agency for Healthcare Research and Quality. December 2005. Available at: effectivehealthcare.ahrq.gov/synthesize/report/final.cfm?Document=2&Topic=30. Accessed on April 18, 2006.
Other guidelines on GERD
Guideline for the management of dyspepsia
This 2005 guideline considers indications for EGD and 2 treatment options for functional dyspepsia: testing and eradication of Helicobacter pylori infection or empiric trial of acid suppression with a PPI for 4 to 8 weeks.
Source. Talley NJ, Vakil N, and the Practice Parameters Committee of the American College of Gastroenterology. Guidelines for the management of dyspepsia. Am J Gastroenterology 2005; 100:2324–2337 Available at: www.acg.gi.org/physicians/guidelines/dyspepsia.pdf. Accessed on April 18, 2006.
Updated guidelines for the diagnosis and treatment of gastroesophageal reflux disease
This recent guideline reviews diagnosis (endoscopy, ambulatory reflux monitoring, and esophageal manometry) and treatment of GERD (including lifestyle changes and pro-motility agents). The literature review is less rigorous than the AHRQ clinical effectiveness review.
Source. DeVault KR, Castell DO. Updated guidelines for the diagnosis and treatment of gastroesophageal reflux disease. Am J Gastroenterol 2005; 100:190–200. Available at: www.acg.gi.org/physicians/guidelines/GERDTreatment.pdf. Accessed on April 18, 2006.
CORRESPONDENCE
Keith B. Holten, MD, 825 Locust Street, Wilmington, OH 45177. E-mail: [email protected]
REFERENCE
1. Ebell M, Siwek J, Weiss BD, et al. Strength of recommendation taxonomy (SORT): A patient-centered approach to grading evidence in the medical literature. J Fam Pract 2004;53:111-120.
REFERENCE
1. Ebell M, Siwek J, Weiss BD, et al. Strength of recommendation taxonomy (SORT): A patient-centered approach to grading evidence in the medical literature. J Fam Pract 2004;53:111-120.
Screening for developmental delay: Reliable, easy-to-use tools
- Do not rely on clinical judgment only or developmental milestone review for the timely identification of developmental delays (B).
- Screen children for developmental delays regularly with cost- and time-effective screens such as the Ages and Stages Questionnaire and PEDS (Parents’ Evaluation of Developmental Status) (C).
- Refer children with suspected delays promptly for comprehensive developmental assessment (C).
- Children with documented delays should receive prompt referral for appropriate early intervention (C).
One child out of 6 in your practice probably has a developmental disability.1 However, identifying disability will be erratic if you rely solely on clinical judgment and informal milestone reviews.
There is reason for concern: the evidence for early intervention, though limited, shows that it confers long-term benefits for these children. Judicious use of practical, reliable standardized screens that I discuss in this article will increase your likelihood of identifying children who need help.
Needed: A screening net with tighter mesh
Disorders such as cerebral palsy and profound mental retardation are clearly recognizable and have well-known consequences. Disabilities such as language impairment, mild mental retardation, and learning disabilities (see Range of disabilities) are more subtle but also associated with poorer health status, higher rates of school failure, in-grade retention, and special education placement.1,2
Developmental problems commonly escape detection in the first 5 years of life despite frequent well-child visits. Physicians generally acknowledge that screening for developmental disabilities is important,3 but few use standardized screening instruments.4,5 Most physicians rely instead on clinical judgment and milestone review.
Scope of the problem
A study that examined how doctors in the US screen for delays found that only 15% to 20% screened more than 10% of all of their patients with a formalized developmental instrument.5 Again, this points to reliance on clinical judgment to determine who should be screened. A National Survey of pediatricians and family physicians6 found that 53% reported using no standardized instrument in their assessment of children for developmental delays. The most recent National Survey of Early Childhood Health (NSECH)12 found that only 35% to 45% of parents recall their child’s development ever being assessed by their doctor.
Speech and language impairment are common among children (approximate prevalence 6%),7 as are learning disabilities (8%)8 and attention deficit disorder (7%).8 Less common conditions include mental retardation (1%–2%),9 cerebral palsy (0.2%),9 autism and autism spectrum disorders (0.5%).10 According to the US Department of Education, 13.2% of school-age children are in special education, most of them diagnosed with learning disabilities or mental retardation.11
The fallout. Most children who would qualify for early intervention under federal law are not identified before school entry. Palfrey et al13 examined the records of 1726 children in special education classes at 5 sites and found that just 28.7% of developmental and behavioral problems were identified before entry into school (age 5). Just 15% to 25% of learning and speech disorders emotional disorders and attention deficit disorders were identified before school entry.13
A study in the UK14 found that despite of a system geared to detect subtle developmental disorders, their child health surveillance failed to detect 38% of children with moderate learning disabilities and 94% of children with mild or moderate learning disabilities. Another study15 on this matter shows a disappointing detection rate, failing to identify 55% to 65% of children with developmental problems before entry into school.
Studies have proven clinical judgment insensitive even in the detection of mental retardation. Two studies from the 1960s showed that US pediatricians accurately identified only 43% of children with an intelligence quotient (IQ) of <80.
Does early intervention work?
Much of the literature on early intervention in childhood focuses on children with risk factors such as prematurity and low birth weight or low socioeconomic status. In controlled studies, children at psychosocial disadvantage who received high-quality intervention exhibited long-term improvement in IQ, higher academic achievement, and decreased criminal behavior, and were, as adults, more likely to be employed and to earn higher incomes than those who did not participate in early intervention (SOR: A).16,17
Other studies have similarly shown benefits from early intervention for children with such biological risk factors as low birth weight and prematurity (SOR: A).18 Early intervention for conditions such as learning disabilities or speech and language delays is generally thought to improve outcomes (SOR: C).2
Rationale for screening
Early identification mandated by law
The Individuals with Disabilities Education Act (IDEA) Amendments of 199719 mandate the “early identification of, and intervention for developmental disabilities through the development of community-based systems.” This law requires physicians to refer children with suspected developmental delays to appropriate early intervention services in a timely manner. All states receive federal funding to provide appropriate intervention through infant and child-find programs for children with developmental delays.
In a study released in February 2006, the United States Preventive Services Task Force20 concluded that the evidence is insufficient to recommend for or against routine use of brief, formal screening instruments in primary care to detect speech and language delay in children up to 5 years of age. The Canadian Guide to Clinical Preventive Health Care21 recommended against screening with the Denver Developmental Screening Test and stated evidence was insufficient to support either the inclusion or exclusion of other screening tools. No studies have randomized children to screening versus no screening with contemporary screening tools.
Developmental screening is reliable
Screening tests can identify children with developmental delay with reasonable accuracy, and, as noted, such children may benefit from early intervention.
Developmental screening instruments fall into 1 of 2 categories: those that require the direct elicitation of developmental skills from children in conjunction with parental report, and those that rely solely on parental report.
Researchers in developmental screening regard a sensitivity of 70% to 80% as acceptable.22 Though this sensitivity is relatively low compared with other common screens used in medicine, it is in part unavoidable given the brevity of screens and the dynamic nature of child development. No screening tests have been shown to maintain sensitivity much greater than this without an unacceptable trade-off in specificity.
The specificity for a good developmental screen should also be in the range of 70% to 80%, ideally closer to 80%.22 Though this relatively low specificity will result in false-positive results, research has questioned whether this is problematic. Glascoe, in a study23 involving a geographically representative sample of 512 children, found that though false positives on validated screening instruments did not reflect disabilities, these children nevertheless scored substantially lower than peers in intelligence, language, and academic achievement—the 3 best predictors for school success. Thus, many children who do not qualify for special educational services on subsequent testing may still have substantial risk factors for academic failure and may benefit from other services such as Head Start, Title 1 services, private speech-language therapy, and quality day care.
Suitable tests convenient for a busy office practice
The following 2 screening instruments rely on parental input. Research has shown that parental questioning is a valid means of screening for developmental delays, and that standardized instruments have a sensitivity and specificity similar to that of screens that require direct elicitation of a child’s skills, such as the Brigance and the BDSI (discussed later).24
PEDS
PEDS (Parents’ Evaluation of Developmental Status) consists of 2 open-ended questions and 8 yes/no questions. It is written at a fifth-grade reading level and takes approximately 5 minutes to administer if an interview is needed—and even less time if parents can complete it independently. It need not be administered by a professional, and can be completed by a parent while waiting to see the doctor or even at home before a well-child visit.
PEDS was published in 1997 as a developmental screen entirely dependent on one kind of parental report—their concerns. The instrument was standardized and validated with 771 children representative of the 1996 US Census.25 Twenty-five percent of the children used in standardization lived in poverty, 30% had unmarried parents. This questionnaire has a sensitivity of 74% to 79% and a specificity of 70% to 80% across ages 0 to 8 years in the detection of developmental delays and behavioral problems. It maintains its psychometric properties across various levels of parental education, socioeconomic status, and child-rearing experience.26 The sensitivity and specificity for all ages combined was 75% and 74%, respectively.
Validity was determined through comparison with a battery of tests including the Woodcock-Johnson Psychoeducational Battery: Tests of Achievement, Stanford-Binet Intelligence Scale, and the Bayley Scales of Infant Development–II.
Scoring stratifies risk as low, medium, and high. Children at high risk require referral for more comprehensive assessment; validity studies found approximately 70% to possess disabilities or substantial delays on further evaluation. Children at intermediate risk require further screening, as approximately 30% were found to have disabilities or substantial delays on in validation studies.25
The Ages and Stages Questionnaires
The Age and Stages Questionnaire (ASQ) system (formerly known as the Infant Monitoring Questionnaires) was developed by Bricker, Squires, and colleagues at the University of Oregon.27 It is a low-cost and easily administered screening instrument relying on parental report.28 Items are written at a fourth- to sixth-grade reading level; illustrations and examples are often provided. This self-administered assessment can be completed in 10 to 20 minutes and scored in 1 to 5 minutes.
The writers of the ASQ drew on several standardized developmental tests for item statements as well as literature that outlined early developmental milestones. They selected skills that could be observed or elicited easily by parents at home in the course of daily activities.
The system has 19 questionnaires designed to be administered at ages 4 months through 5 years, corresponding to common well-child visits. Five developmental areas are covered in each questionnaire—communication, gross motor, fine motor, problem solving, and personal-social. Five items query skills in each area. An overall section has 5 questions that cover general parental concerns.
Normative data were gathered from 2008 children drawn from an ethnically and socioeconomically heterogeneous population, with 81% of children judged “at-risk.”28 The items were picked to represent the developmental quotient (DQ) of 75 to 100. Validity data were gathered from the analysis of 247 children, a subset of the population used in gathering normative data.
The ASQ has a specificity ranging from 81% (16 months) to 92% (36 months), and 86% overall. There was trend toward higher specificity when screening older children. Sensitivity was lower, averaging 72%.29 Age-appropriate tests of individual cognition were used as the gold standard, including the Bayley Scales of Infant Development, Stanford-Binet Intelligence Test (4th ed), and the McCarthy Scales of Children’s Abilities.
The instrument maintains its validity when screening high-risk children: when specifically used to evaluate infants born prematurely, the ASQ had 90% sensitivity, 77% specificity.30 In this study formal assessment was performed with the Griffith Mental development Scales, Bayley Development Intelligence Scale.
Reliable tests requiring direct elicitation and observation of children
Brigance screens
The Brigance screens are not well known to physicians but are commonly used in Head Start and educational settings.31 They include 9 separate forms, each covering a 12-month age range. The Brigance requires about 15 minutes to administer and score. The screens address speech-language, motor skills, readiness, and general knowledge at younger ages, and also reading and math at older ages.
The Brigance screens were standardized using 1156 children; validity data were gathered through examining 408 children. Both groups were drawn from populations of diverse geographical and socioeconomic status, producing demographics similar to the US Census for the year 2000.
Validity data estimated the sensitivity and specificity for detecting children with delays at 82% and 75%, with a range of 72% to 100% across different years. Validity was determined through comparison with a battery of age-appropriate developmental assessment tools such as the Bayley Scales of Infant Development–II (BSID-II), Slossen Intelligence Test, and the Woodcock-Johnson Psycho-Educational Battery—Revised: Test of Achievement–II.32 A study examining the extension of the Brigance screens to children ages 0 to 2 years found the screen to maintain its sensitivity (76% to 77%) and specificity (85% to 86%).33 An additional feature of the Brigance is its ability to detect gifted and academically talented children with a sensitivity and specificity of 69% and 79%, respectively.32
The Brigance II was published in early 2006; it has a sensitivity of 70% and specificity of 82% for the detection of developmental and academic problems.34
Battelle Developmental Inventory Screening Test
The Battelle Developmental Inventory Screening Test (BDIST) can be used to screen children from age 12 to 96 months, using a combination of direct assessment, observation, and parental interview. Normative data were gathered from a geographically and socioeconomically diverse sample of 800 children.35
Studies have shown the test to possess a sensitivity of 75% and specificity of 73%.36 Validity data were gathered from 105 subjects, most of whose parents’ incomes were below poverty guidelines. A battery of tests was used as a gold standard including the Bayley Scales of Infant Development–II, Kaufman Assessment Battery for Children or the Stanford-Binet Intelligence Scale. The BDIST requires 4 to 6 hours to learn and 10 to 30 minutes to administer, and may be impractical for routine screening in primary care. The receptive language subtest may be administered in lieu of the full screen and takes just a few minutes to administer; however, that diminishes specificity to 66% while maintaining sensitivity at 80%.36
Bayley Infant Neurodevelopmental Screener
The Bayley Infant Neurodevelopmental Screener (BINS) is a recently developed test designed for screening high-risk infants aged 3 to 24 months. The test was standardized on a nonclinical sample of 600 children representative of the US Census data for 1988.37 It uses 10 to 13 directly elicited items per 3- to 6-month range to assess neurodevelopmental skills and developmental accomplishments. Data published in the technical manual found the BINS to have a sensitivity and specificity of 75% and 86%, respectively, across all ages.37
A subsequent study found the BINS to possess a sensitivity of 70% and a specificity of 71% when a population of infants born prematurely was screened at 12 and 24 months.38
Both studies used the Bayley Scales of Infant Development–II as the gold standard. The BINS requires only about 10 minutes to administer, but requires experience in standardized assessment and familiarity with infant development.39 A recent study found the BINS insensitive in the detection of developmental delays as compared with the Bayley Scales of Infant Development–II in environmentally at-risk children at ages of 6 months and 12 months.40
Tests of questionable value
Denver–II
The Denver Developmental Screening Test (DDST) was introduced in 1967. Research has consistently found it lacking in sensitivity. In response to this criticism, a revised version, the Denver II, was released in 1992.41
The Denver II is the most commonly used developmental screening tool.6 It combines direct observation and parental report. The tool consists of 125 items, organized into 4 developmental domains: gross motor, fine motor/adaptive, language, and personal/social. Items are displayed in bars that indicate the ages in which 25%, 75%, and 90% of children in the standardization study mastered a given task. A Denver test kit consists of scoring pads, materials used in eliciting skills, and a technical manual that details the appropriate administration and scoring of the test. Thirty-one percent of items can be addressed by parental report; the remainder requires observation of elicited skills.42
Though the Denver II used more than 2000 children to establish normative data, all of them were from Colorado, undermining our ability to generalize this data to a more heterogeneous population. Furthermore, both versions of the test were published without data on the test’s validity, sensitivity, and specificity. The authors have instead relied on the significance of a child falling outside of the normal range as evidence of delay. This approach has been criticized.
Two studies have examined the validity of the Denver–II. In 1992, Glascoe et al43 studied a demographically representative sample of 102 children and found that though the Denver II had a high sensitivity (83%), it had an unacceptably low specificity (43%). Attempts to improve specificity through categorizing questionable/untestable scores as normal raised specificity to 80%, but at the expense of sensitivity, dropping it to 56%.43 Assuming a 16% prevalence of developmental disorders, the low specificity of the Denver–II would produce suspect scores in nearly 3 out of 5 children tested, but true problems could only be expected to be found in 1 of 4 children with suspect scores.
A follow-up study of 89 children by Glascoe and Byrne44 found the Denver–II to possess excellent sensitivity (83%) but similarly disappointing specificity (26%), producing a positive predictive value of 28% in the study population (20% prevalence of disabilities).
In both studies, a battery of tests similar to those used to determine eligibility for special services were used as the gold standard. Properly performed, administration of the Denver–II requires approximately 20 minutes.42 Shortened versions or informal scoring of the Denver–II can only further degrade the questionable validity of this measure.
Child Development Inventories
The Child Development Inventory or CDI, formerly known as the Minnesota Child Development Inventory, was created to provide a systematic, standardized method for parents to report on their children’s strengths, problems, and present development. The original 300-item instrument has been broken down into instruments that apply to 3 age intervals.
The CDI measures a child’s development in 8 areas: social, self-help, gross motor, fine motor, expressive language, language comprehension, letters, and numbers. It consists of a 300-item booklet and answer sheet for the parent to complete and a profile sheet for recording the results. It was standardized on a sample of 568 children from South St. Paul Minnesota, a predominantly Caucasian, working-class community near a large metropolitan area.44
Parents complete the questionnaire by circling Yes/No responses to the statements. Children are considered “borderline” if their CDI scores are 25% below chronological age (1.5 standard deviations [SD] below the mean) and “delayed” if their scores are >30% below chronological age (2.0 SD). The CDI has been researched in presumed normal populations and in high-risk populations such as children born prematurely.
In a high-risk population of infants and children, it was found to have a sensitivity of 80% and specificity of 96% for detecting developmental delay (ie, CDI scores >2.0 SD below the mean) when compared with to the Bayley Scales of Infant Development–II, using 2 SD below the mean as the cutoff.45 It seems to have particular utility for screening at-risk children even when applied to a population of low socioeconomic status and low education level.46 In addition to validity, good predictive value has been established for future cognitive, reading, academic, intellectual, and adaptive functioning.
The CDI takes 35 to 50 minutes to complete, requires a seventh- to eight-grade reading level, and may thus be impractical for screening large groups of low-risk children. Additionally, the CDI’s generalizability to diverse populations is not established, as the normative data was gathered from a population that was 95% Caucasian. The length and depth of the CDI has called some to question whether it is an instrument for developmental assessment rather than developmental screening.
The Child Development Inventories (plural) are shortened versions of the CDI (singular), tailored for ages 0 to 18 months and 18 months to 5 years.47 The Infant Development Inventory (IDI) requires a parent to describe their child’s development, using a chart of milestones, in social, gross motor, fine motor, and language skills areas.
The Child Development Review (CDR) is designed to screen for developmental problems in children ages 18 months to 5 years. The IDI and CDR are brief and easy to administer and score. Both rely on the formalized gathering of a parent’s concerns and the parent’s assessment of the child’s progress in achieving milestones in several streams of development. Unfortunately, evidence in the technical manual or medical literature is insufficient to establish the validity of this instrument, and thus it is difficult to recommend the child development inventories when other parent-report instruments exist with well established validity.
Economics of developmental screening
It is useful to look at the economics of developmental screens from 2 perspectives—that of the physician and that of society. A 1998 review of the literature by the RAND group48 concluded that 2 studies—the Elmira Prenatal/Early Infancy Project (EPEIP) and the Perry Preschool Project—followed children for sufficient time to allow for the assessment of the economic implications of intervention in children at risk for developmental delays.
Societal perspective
Both studies found that interventions led to considerable savings, with the biggest savings from decreased criminality in adulthood. The RAND group48 estimated a government savings of $18,611 per child who underwent early intervention in the Elmira Prenatal/Early Infancy Project, and a savings of $13,289 per child for individuals receiving intervention in the Perry Preschool Project (figures in 1996 dollars.)
It is difficult to know whether these same savings would be seen in developmental intervention applied on a larger scale. Additionally, it is difficult to know how generalizable research from intervention with high-risk children is to intervention stemming from screening in a doctor’s office.
The physician perspective
Developmental screening is associated with additional costs. Dobrez et al49 estimated the physician’s expense in administering a number of developmental screens, accounting for the administration costs and costs associated with time required to discuss abnormal results. This analysis found screens based on parental report such as the ASQ, CDI, and PEDS considerably less expensive, with a per-visit expense of approximately $12 for negative screen results and approximately $16 for positive results. Tests requiring the direct elicitation of skills from children such as the Denver–II and BINS had an estimated cost of $55.12 and $22.22 for normal screens, respectively, and $59.57 and $26.67 for abnormal screens.49 Medicaid reimbursement varies by state; information can be obtained though the Center for Medicaid/Medicare website. Private payers may or may not reimburse physicians for developmental screening.
CORRESPONDENCE
Sutton Hamilton, MD, Underwood-Memorial Family Medicine Residency, 35 Oak Street, Woodbury, NJ 08033. E-mail: [email protected]
1. Walker D, Greenwood C, Hart B, Carta J. Prediction of school outcomes based on early language production and socioeconomic factors. Child Dev 1994;64:606-621.
2. Barnett SW. Long-term effects of early childhood programs on cognitive and school outcomes. Future Child 1995;5:25-50.
3. Dobos AK, Dworkin P, Berstein B. Pediatricians’ approaches to developmental problems: has the gap been narrowed? J Dev Behav Pediatr 1994;15:34-38.
4. Glascoe FP, VanDervoort RL. The developmental screening and referral practices of physicians in Tennessee. J Tenn Med Assoc 1985;141-147.
5. Smith RD. The use of developmental screening tests by primary care pediatricians? J Pediatr 1978;93:524-527.
6. Sices L, Feudtner C, McLaughlin J, Drotar D, Williams M. How do primary care physicians identify young children with developmental delays? A National Survey. Pediatrics 2003;24:409-427.
7. Law J, Boyle J, Harris F, Harkness A, Nye C. Screening for speech and language disorder: a systematic review of the literature. Health Technol Assessment 1998;2:1-198.
8. National Health Interview Surveys, 1997–1998: Summary Health Statistics for U S. Children. National Center of Health Statistics. Vital Health Stat 10 (203). Available at: www.cdc.gov/nchs/.
9. Yeargin-Allsopp M, Murphy CC, Oakley GP, Sikes RK. A multiple-source method for studying the prevalence of developmental disabilities in children: the Metropolitan Atlanta Developmental Disabilities Study. Pediatrics 1992;89:624-630.
10. Wing L, Potter D. The epidemiology of autistic spectrum disorders: is the prevalence rising? Ment Retard Dev Disabil Res Rev 2002;8:151-161.
11. Condition of Education 1997. Supplemental Table 46-2: Participation in special education programs as a percentage of total public school enrollment, by selected types of disability, sex and race/ethnicity of student: school years ending in 1986, 1988, 1990, and 1992. Available at: www.nces.ed.gov/pubs/ce/c9746d02.html.
12. Halfron N, Inkelas M, et al. Summary Statistics from the National Survey of Early Childhood Health, 2000. National Center for Health Statistics. Vital Health Stat 2000;15:1-52.Available at www.cdc.gov/nchs/data/slaits/summary_sech00.pdf.
13. Palfrey JS, Singer JD, Walker DK, Butler JA. Early identification of children’s special needs: A study in five metropolitan communities. J Pediatr 1987;111:651-659.
14. Corrigan N, Stewart M, Scott M, Fee F. Predictive value of preschool surveillance in detecting learning disabilities. Arch Dis Child 1996;72:517-521.
15. Dearlove J, Kearney D. How good is general practice developmental screening? BMJ 1990;300:1177-1180.
16. Reynolds AJ, Temple JA, Robertson DL, Mann EA. Long-term Effects of an Early Childhood Intervention on Educational Achievement and Juvenile Arrest. JAMA 2001;285:2339-2346.
17. Schweinhart LJ, Barnes HV, Weikart DP. Significant Benefits: The High/Scope Perry Preschool Study Through Age 27. Ypsilanti, Mich: High/Scope Press; 1993.
18. Blair C, Ramey CT, Hardin J. Early intervention for low birth-weight, premature infants: participation and intellectual development. Am J Mental Retardation 1995;99:542-554.
19. Individuals With Disabilities Education Act Amendments of 1997 (Pub L No 105-117).
20. US Preventive Service Task Force. Screening for speech and language delay in preschool children. February 2006. Available at: www.ahrq.gov/clinic/uspstf/uspschdv.htm.
21. Canadian Guide to Clinical Preventive Health Care. Section 2 Pediatric Preventive Care. Available at: www.hc-sc.gc.ca/hppb/healthcare/pubs/clinical_preventive/index.html.
22. Glascoe FP. Standards for screening test construction. Available at: www.dbpeds.org.
23. Glascoe FP. Are over-referrals on developmental screening tests really a problem? Arch Pediatr Adolesc Med 2001;155:54-59.
24. Glascoe FP, Dworkin PH. The role of parents in the detection of developmental and behavioral problems. Pediatrics 1995;95:829-836.
25. Glascoe FP, Byrne KE. The accuracy of three developmental screening tests. J Early Interv 1993;17:368-378.
26. Glascoe FP. Parents’ Evaluation of Developmental Status. Nashville, Tenn: Ellsworth and Vandermeer Press; 1997.
27. Bricker D, Squires J. Ages and Stages Questionnaire: A Parent-Completed Child Monitoring System. Baltimore, Md: Paul H. Brookes Publishing Co.; 1999.
28. Bricker D, Squires J. Low cost system using parents to monitor the development of at-risk infants. J Earl Interven 1989;13:50-60.
29. Squires J, Bricker D, Potter L. Revision of a parent-completed developmental screening tool: ages and stages questionnaires. J Ped Psychol 1997;22:313-328.
30. Skellern CY, Rogers Y, O’Callaghan MJ. A parent-completed developmental questionnaire: follow-up of ex-premature Infants. J Ped Child Heal 2001;37:125-129.
31. Costenbader V, Rohrer AM, Difonzo N. Kindergarten screening: a survey of current practice. Psychol Sch 2000;37:323-332.
32. Glascoe FP. Technical Report for the Brigance Screens. 3rd ed. North Billerica, Mass: Curriculum Associate, Inc; 2002.
33. Glascoe FP. The Brigance Infant-Toddler Screen (BITS): standardization and validation. J Dev Behav Peds 2001;22:351.-
34. Brigance A. Brigance Screens-II. North Billerica, Mass: Curriculum Associates, 2006.
35. Oehler-Stinnett JO. Batelle Developmental Inventory Screening Test. In: Mental Measurement Yearbook [on-line database]. New York: Ovid Technologies. Available at www.ovid.com.
36. Glascoe FP, Byrne KE. The usefulness of the Battelle Developmental Inventory Screening Test. Clin Pediatr 1993;32:273-280.
37. Aylward GP. The Bayley Infant Neurodevelopmental Screener. San Antonio, Tex: Psychological Corporation; 1995.
38. Marcias MM, Saylor CF, Greer KM, Charles JM, Bell N, Katikaneni LD. Infant screening: The usefulness of the Bayley Infant Neurodevelopmental Screener and the Clinical Adaptive Test/Clinical Linguistic Auditory Milestone Scale. Dev Beh Peds 1998;19:155-161.
39. Barnett FW. Batelle Developmental inventory. In: Mental Measurement Yearbook [on-line database]. New York: Ovid Technologies. Available at www.ovid.com.
40. Hess CR, Papas MA, Black MM. Use of the Bayley Infant Neurodevelopmental Screener with an environmental risk group. J Ped Psychol 2004;29:321-330.
41. Frankenburg WK, Dodds J, Archer P, Shapiro H, Bresnick B. Denver II: A Major Revision of Restandardization of Denver Developmental Screening Test. Pediatrics 1992;89:91-97.
42. Hughs S. Denver Developmental Screening Test. In: Mental Measurement Yearbook [on-line database]. New York: Ovid Technologies. Available at www.ovid.com.
43. Glascoe FP, Byrne KE, Ashford LG, Johnson KL, Chang B, Strickland B. The accuracy of the Denver-II in developmental screening. Pediatrics 1992;89:1221-1225.
44. Ireton H. Manual for the Child Development Inventory. Minneapolis, Minn: Behavior Science Systems; 1992.
45. Doig KB, Macias MM, Saylor CF, Craver JR, Ingram PE. The Child Development Inventory: A developmental outcome measure for follow-up of the high risk infant. J Ped 1999;135:358-362.
46. Montgomery ML, Saylor C, Bell N, Macias MM, Charles JM, Katikaneni LD. Use of the Child Development Inventory to screen high-risk populations. Clin Pediatr 1999;38:535-539.
47. Ireton H, Vader H. Child Development Review—Instructions Manual. Minneapolis, Minn: Behavior Science Systems, Inc; 2004.
48. Karoly LA. Investing in our Children. Washington, DC: RAND; 1998.
49. Dobrez D, Sasso AO, Holl J, Shalowitz M, Leon S, Budetti P. Estimating the cost of developmental and behavioral screening of preschool children in general pediatric practice. Pediatrics 2001;108:913-922.
- Do not rely on clinical judgment only or developmental milestone review for the timely identification of developmental delays (B).
- Screen children for developmental delays regularly with cost- and time-effective screens such as the Ages and Stages Questionnaire and PEDS (Parents’ Evaluation of Developmental Status) (C).
- Refer children with suspected delays promptly for comprehensive developmental assessment (C).
- Children with documented delays should receive prompt referral for appropriate early intervention (C).
One child out of 6 in your practice probably has a developmental disability.1 However, identifying disability will be erratic if you rely solely on clinical judgment and informal milestone reviews.
There is reason for concern: the evidence for early intervention, though limited, shows that it confers long-term benefits for these children. Judicious use of practical, reliable standardized screens that I discuss in this article will increase your likelihood of identifying children who need help.
Needed: A screening net with tighter mesh
Disorders such as cerebral palsy and profound mental retardation are clearly recognizable and have well-known consequences. Disabilities such as language impairment, mild mental retardation, and learning disabilities (see Range of disabilities) are more subtle but also associated with poorer health status, higher rates of school failure, in-grade retention, and special education placement.1,2
Developmental problems commonly escape detection in the first 5 years of life despite frequent well-child visits. Physicians generally acknowledge that screening for developmental disabilities is important,3 but few use standardized screening instruments.4,5 Most physicians rely instead on clinical judgment and milestone review.
Scope of the problem
A study that examined how doctors in the US screen for delays found that only 15% to 20% screened more than 10% of all of their patients with a formalized developmental instrument.5 Again, this points to reliance on clinical judgment to determine who should be screened. A National Survey of pediatricians and family physicians6 found that 53% reported using no standardized instrument in their assessment of children for developmental delays. The most recent National Survey of Early Childhood Health (NSECH)12 found that only 35% to 45% of parents recall their child’s development ever being assessed by their doctor.
Speech and language impairment are common among children (approximate prevalence 6%),7 as are learning disabilities (8%)8 and attention deficit disorder (7%).8 Less common conditions include mental retardation (1%–2%),9 cerebral palsy (0.2%),9 autism and autism spectrum disorders (0.5%).10 According to the US Department of Education, 13.2% of school-age children are in special education, most of them diagnosed with learning disabilities or mental retardation.11
The fallout. Most children who would qualify for early intervention under federal law are not identified before school entry. Palfrey et al13 examined the records of 1726 children in special education classes at 5 sites and found that just 28.7% of developmental and behavioral problems were identified before entry into school (age 5). Just 15% to 25% of learning and speech disorders emotional disorders and attention deficit disorders were identified before school entry.13
A study in the UK14 found that despite of a system geared to detect subtle developmental disorders, their child health surveillance failed to detect 38% of children with moderate learning disabilities and 94% of children with mild or moderate learning disabilities. Another study15 on this matter shows a disappointing detection rate, failing to identify 55% to 65% of children with developmental problems before entry into school.
Studies have proven clinical judgment insensitive even in the detection of mental retardation. Two studies from the 1960s showed that US pediatricians accurately identified only 43% of children with an intelligence quotient (IQ) of <80.
Does early intervention work?
Much of the literature on early intervention in childhood focuses on children with risk factors such as prematurity and low birth weight or low socioeconomic status. In controlled studies, children at psychosocial disadvantage who received high-quality intervention exhibited long-term improvement in IQ, higher academic achievement, and decreased criminal behavior, and were, as adults, more likely to be employed and to earn higher incomes than those who did not participate in early intervention (SOR: A).16,17
Other studies have similarly shown benefits from early intervention for children with such biological risk factors as low birth weight and prematurity (SOR: A).18 Early intervention for conditions such as learning disabilities or speech and language delays is generally thought to improve outcomes (SOR: C).2
Rationale for screening
Early identification mandated by law
The Individuals with Disabilities Education Act (IDEA) Amendments of 199719 mandate the “early identification of, and intervention for developmental disabilities through the development of community-based systems.” This law requires physicians to refer children with suspected developmental delays to appropriate early intervention services in a timely manner. All states receive federal funding to provide appropriate intervention through infant and child-find programs for children with developmental delays.
In a study released in February 2006, the United States Preventive Services Task Force20 concluded that the evidence is insufficient to recommend for or against routine use of brief, formal screening instruments in primary care to detect speech and language delay in children up to 5 years of age. The Canadian Guide to Clinical Preventive Health Care21 recommended against screening with the Denver Developmental Screening Test and stated evidence was insufficient to support either the inclusion or exclusion of other screening tools. No studies have randomized children to screening versus no screening with contemporary screening tools.
Developmental screening is reliable
Screening tests can identify children with developmental delay with reasonable accuracy, and, as noted, such children may benefit from early intervention.
Developmental screening instruments fall into 1 of 2 categories: those that require the direct elicitation of developmental skills from children in conjunction with parental report, and those that rely solely on parental report.
Researchers in developmental screening regard a sensitivity of 70% to 80% as acceptable.22 Though this sensitivity is relatively low compared with other common screens used in medicine, it is in part unavoidable given the brevity of screens and the dynamic nature of child development. No screening tests have been shown to maintain sensitivity much greater than this without an unacceptable trade-off in specificity.
The specificity for a good developmental screen should also be in the range of 70% to 80%, ideally closer to 80%.22 Though this relatively low specificity will result in false-positive results, research has questioned whether this is problematic. Glascoe, in a study23 involving a geographically representative sample of 512 children, found that though false positives on validated screening instruments did not reflect disabilities, these children nevertheless scored substantially lower than peers in intelligence, language, and academic achievement—the 3 best predictors for school success. Thus, many children who do not qualify for special educational services on subsequent testing may still have substantial risk factors for academic failure and may benefit from other services such as Head Start, Title 1 services, private speech-language therapy, and quality day care.
Suitable tests convenient for a busy office practice
The following 2 screening instruments rely on parental input. Research has shown that parental questioning is a valid means of screening for developmental delays, and that standardized instruments have a sensitivity and specificity similar to that of screens that require direct elicitation of a child’s skills, such as the Brigance and the BDSI (discussed later).24
PEDS
PEDS (Parents’ Evaluation of Developmental Status) consists of 2 open-ended questions and 8 yes/no questions. It is written at a fifth-grade reading level and takes approximately 5 minutes to administer if an interview is needed—and even less time if parents can complete it independently. It need not be administered by a professional, and can be completed by a parent while waiting to see the doctor or even at home before a well-child visit.
PEDS was published in 1997 as a developmental screen entirely dependent on one kind of parental report—their concerns. The instrument was standardized and validated with 771 children representative of the 1996 US Census.25 Twenty-five percent of the children used in standardization lived in poverty, 30% had unmarried parents. This questionnaire has a sensitivity of 74% to 79% and a specificity of 70% to 80% across ages 0 to 8 years in the detection of developmental delays and behavioral problems. It maintains its psychometric properties across various levels of parental education, socioeconomic status, and child-rearing experience.26 The sensitivity and specificity for all ages combined was 75% and 74%, respectively.
Validity was determined through comparison with a battery of tests including the Woodcock-Johnson Psychoeducational Battery: Tests of Achievement, Stanford-Binet Intelligence Scale, and the Bayley Scales of Infant Development–II.
Scoring stratifies risk as low, medium, and high. Children at high risk require referral for more comprehensive assessment; validity studies found approximately 70% to possess disabilities or substantial delays on further evaluation. Children at intermediate risk require further screening, as approximately 30% were found to have disabilities or substantial delays on in validation studies.25
The Ages and Stages Questionnaires
The Age and Stages Questionnaire (ASQ) system (formerly known as the Infant Monitoring Questionnaires) was developed by Bricker, Squires, and colleagues at the University of Oregon.27 It is a low-cost and easily administered screening instrument relying on parental report.28 Items are written at a fourth- to sixth-grade reading level; illustrations and examples are often provided. This self-administered assessment can be completed in 10 to 20 minutes and scored in 1 to 5 minutes.
The writers of the ASQ drew on several standardized developmental tests for item statements as well as literature that outlined early developmental milestones. They selected skills that could be observed or elicited easily by parents at home in the course of daily activities.
The system has 19 questionnaires designed to be administered at ages 4 months through 5 years, corresponding to common well-child visits. Five developmental areas are covered in each questionnaire—communication, gross motor, fine motor, problem solving, and personal-social. Five items query skills in each area. An overall section has 5 questions that cover general parental concerns.
Normative data were gathered from 2008 children drawn from an ethnically and socioeconomically heterogeneous population, with 81% of children judged “at-risk.”28 The items were picked to represent the developmental quotient (DQ) of 75 to 100. Validity data were gathered from the analysis of 247 children, a subset of the population used in gathering normative data.
The ASQ has a specificity ranging from 81% (16 months) to 92% (36 months), and 86% overall. There was trend toward higher specificity when screening older children. Sensitivity was lower, averaging 72%.29 Age-appropriate tests of individual cognition were used as the gold standard, including the Bayley Scales of Infant Development, Stanford-Binet Intelligence Test (4th ed), and the McCarthy Scales of Children’s Abilities.
The instrument maintains its validity when screening high-risk children: when specifically used to evaluate infants born prematurely, the ASQ had 90% sensitivity, 77% specificity.30 In this study formal assessment was performed with the Griffith Mental development Scales, Bayley Development Intelligence Scale.
Reliable tests requiring direct elicitation and observation of children
Brigance screens
The Brigance screens are not well known to physicians but are commonly used in Head Start and educational settings.31 They include 9 separate forms, each covering a 12-month age range. The Brigance requires about 15 minutes to administer and score. The screens address speech-language, motor skills, readiness, and general knowledge at younger ages, and also reading and math at older ages.
The Brigance screens were standardized using 1156 children; validity data were gathered through examining 408 children. Both groups were drawn from populations of diverse geographical and socioeconomic status, producing demographics similar to the US Census for the year 2000.
Validity data estimated the sensitivity and specificity for detecting children with delays at 82% and 75%, with a range of 72% to 100% across different years. Validity was determined through comparison with a battery of age-appropriate developmental assessment tools such as the Bayley Scales of Infant Development–II (BSID-II), Slossen Intelligence Test, and the Woodcock-Johnson Psycho-Educational Battery—Revised: Test of Achievement–II.32 A study examining the extension of the Brigance screens to children ages 0 to 2 years found the screen to maintain its sensitivity (76% to 77%) and specificity (85% to 86%).33 An additional feature of the Brigance is its ability to detect gifted and academically talented children with a sensitivity and specificity of 69% and 79%, respectively.32
The Brigance II was published in early 2006; it has a sensitivity of 70% and specificity of 82% for the detection of developmental and academic problems.34
Battelle Developmental Inventory Screening Test
The Battelle Developmental Inventory Screening Test (BDIST) can be used to screen children from age 12 to 96 months, using a combination of direct assessment, observation, and parental interview. Normative data were gathered from a geographically and socioeconomically diverse sample of 800 children.35
Studies have shown the test to possess a sensitivity of 75% and specificity of 73%.36 Validity data were gathered from 105 subjects, most of whose parents’ incomes were below poverty guidelines. A battery of tests was used as a gold standard including the Bayley Scales of Infant Development–II, Kaufman Assessment Battery for Children or the Stanford-Binet Intelligence Scale. The BDIST requires 4 to 6 hours to learn and 10 to 30 minutes to administer, and may be impractical for routine screening in primary care. The receptive language subtest may be administered in lieu of the full screen and takes just a few minutes to administer; however, that diminishes specificity to 66% while maintaining sensitivity at 80%.36
Bayley Infant Neurodevelopmental Screener
The Bayley Infant Neurodevelopmental Screener (BINS) is a recently developed test designed for screening high-risk infants aged 3 to 24 months. The test was standardized on a nonclinical sample of 600 children representative of the US Census data for 1988.37 It uses 10 to 13 directly elicited items per 3- to 6-month range to assess neurodevelopmental skills and developmental accomplishments. Data published in the technical manual found the BINS to have a sensitivity and specificity of 75% and 86%, respectively, across all ages.37
A subsequent study found the BINS to possess a sensitivity of 70% and a specificity of 71% when a population of infants born prematurely was screened at 12 and 24 months.38
Both studies used the Bayley Scales of Infant Development–II as the gold standard. The BINS requires only about 10 minutes to administer, but requires experience in standardized assessment and familiarity with infant development.39 A recent study found the BINS insensitive in the detection of developmental delays as compared with the Bayley Scales of Infant Development–II in environmentally at-risk children at ages of 6 months and 12 months.40
Tests of questionable value
Denver–II
The Denver Developmental Screening Test (DDST) was introduced in 1967. Research has consistently found it lacking in sensitivity. In response to this criticism, a revised version, the Denver II, was released in 1992.41
The Denver II is the most commonly used developmental screening tool.6 It combines direct observation and parental report. The tool consists of 125 items, organized into 4 developmental domains: gross motor, fine motor/adaptive, language, and personal/social. Items are displayed in bars that indicate the ages in which 25%, 75%, and 90% of children in the standardization study mastered a given task. A Denver test kit consists of scoring pads, materials used in eliciting skills, and a technical manual that details the appropriate administration and scoring of the test. Thirty-one percent of items can be addressed by parental report; the remainder requires observation of elicited skills.42
Though the Denver II used more than 2000 children to establish normative data, all of them were from Colorado, undermining our ability to generalize this data to a more heterogeneous population. Furthermore, both versions of the test were published without data on the test’s validity, sensitivity, and specificity. The authors have instead relied on the significance of a child falling outside of the normal range as evidence of delay. This approach has been criticized.
Two studies have examined the validity of the Denver–II. In 1992, Glascoe et al43 studied a demographically representative sample of 102 children and found that though the Denver II had a high sensitivity (83%), it had an unacceptably low specificity (43%). Attempts to improve specificity through categorizing questionable/untestable scores as normal raised specificity to 80%, but at the expense of sensitivity, dropping it to 56%.43 Assuming a 16% prevalence of developmental disorders, the low specificity of the Denver–II would produce suspect scores in nearly 3 out of 5 children tested, but true problems could only be expected to be found in 1 of 4 children with suspect scores.
A follow-up study of 89 children by Glascoe and Byrne44 found the Denver–II to possess excellent sensitivity (83%) but similarly disappointing specificity (26%), producing a positive predictive value of 28% in the study population (20% prevalence of disabilities).
In both studies, a battery of tests similar to those used to determine eligibility for special services were used as the gold standard. Properly performed, administration of the Denver–II requires approximately 20 minutes.42 Shortened versions or informal scoring of the Denver–II can only further degrade the questionable validity of this measure.
Child Development Inventories
The Child Development Inventory or CDI, formerly known as the Minnesota Child Development Inventory, was created to provide a systematic, standardized method for parents to report on their children’s strengths, problems, and present development. The original 300-item instrument has been broken down into instruments that apply to 3 age intervals.
The CDI measures a child’s development in 8 areas: social, self-help, gross motor, fine motor, expressive language, language comprehension, letters, and numbers. It consists of a 300-item booklet and answer sheet for the parent to complete and a profile sheet for recording the results. It was standardized on a sample of 568 children from South St. Paul Minnesota, a predominantly Caucasian, working-class community near a large metropolitan area.44
Parents complete the questionnaire by circling Yes/No responses to the statements. Children are considered “borderline” if their CDI scores are 25% below chronological age (1.5 standard deviations [SD] below the mean) and “delayed” if their scores are >30% below chronological age (2.0 SD). The CDI has been researched in presumed normal populations and in high-risk populations such as children born prematurely.
In a high-risk population of infants and children, it was found to have a sensitivity of 80% and specificity of 96% for detecting developmental delay (ie, CDI scores >2.0 SD below the mean) when compared with to the Bayley Scales of Infant Development–II, using 2 SD below the mean as the cutoff.45 It seems to have particular utility for screening at-risk children even when applied to a population of low socioeconomic status and low education level.46 In addition to validity, good predictive value has been established for future cognitive, reading, academic, intellectual, and adaptive functioning.
The CDI takes 35 to 50 minutes to complete, requires a seventh- to eight-grade reading level, and may thus be impractical for screening large groups of low-risk children. Additionally, the CDI’s generalizability to diverse populations is not established, as the normative data was gathered from a population that was 95% Caucasian. The length and depth of the CDI has called some to question whether it is an instrument for developmental assessment rather than developmental screening.
The Child Development Inventories (plural) are shortened versions of the CDI (singular), tailored for ages 0 to 18 months and 18 months to 5 years.47 The Infant Development Inventory (IDI) requires a parent to describe their child’s development, using a chart of milestones, in social, gross motor, fine motor, and language skills areas.
The Child Development Review (CDR) is designed to screen for developmental problems in children ages 18 months to 5 years. The IDI and CDR are brief and easy to administer and score. Both rely on the formalized gathering of a parent’s concerns and the parent’s assessment of the child’s progress in achieving milestones in several streams of development. Unfortunately, evidence in the technical manual or medical literature is insufficient to establish the validity of this instrument, and thus it is difficult to recommend the child development inventories when other parent-report instruments exist with well established validity.
Economics of developmental screening
It is useful to look at the economics of developmental screens from 2 perspectives—that of the physician and that of society. A 1998 review of the literature by the RAND group48 concluded that 2 studies—the Elmira Prenatal/Early Infancy Project (EPEIP) and the Perry Preschool Project—followed children for sufficient time to allow for the assessment of the economic implications of intervention in children at risk for developmental delays.
Societal perspective
Both studies found that interventions led to considerable savings, with the biggest savings from decreased criminality in adulthood. The RAND group48 estimated a government savings of $18,611 per child who underwent early intervention in the Elmira Prenatal/Early Infancy Project, and a savings of $13,289 per child for individuals receiving intervention in the Perry Preschool Project (figures in 1996 dollars.)
It is difficult to know whether these same savings would be seen in developmental intervention applied on a larger scale. Additionally, it is difficult to know how generalizable research from intervention with high-risk children is to intervention stemming from screening in a doctor’s office.
The physician perspective
Developmental screening is associated with additional costs. Dobrez et al49 estimated the physician’s expense in administering a number of developmental screens, accounting for the administration costs and costs associated with time required to discuss abnormal results. This analysis found screens based on parental report such as the ASQ, CDI, and PEDS considerably less expensive, with a per-visit expense of approximately $12 for negative screen results and approximately $16 for positive results. Tests requiring the direct elicitation of skills from children such as the Denver–II and BINS had an estimated cost of $55.12 and $22.22 for normal screens, respectively, and $59.57 and $26.67 for abnormal screens.49 Medicaid reimbursement varies by state; information can be obtained though the Center for Medicaid/Medicare website. Private payers may or may not reimburse physicians for developmental screening.
CORRESPONDENCE
Sutton Hamilton, MD, Underwood-Memorial Family Medicine Residency, 35 Oak Street, Woodbury, NJ 08033. E-mail: [email protected]
1. Walker D, Greenwood C, Hart B, Carta J. Prediction of school outcomes based on early language production and socioeconomic factors. Child Dev 1994;64:606-621.
2. Barnett SW. Long-term effects of early childhood programs on cognitive and school outcomes. Future Child 1995;5:25-50.
3. Dobos AK, Dworkin P, Berstein B. Pediatricians’ approaches to developmental problems: has the gap been narrowed? J Dev Behav Pediatr 1994;15:34-38.
4. Glascoe FP, VanDervoort RL. The developmental screening and referral practices of physicians in Tennessee. J Tenn Med Assoc 1985;141-147.
5. Smith RD. The use of developmental screening tests by primary care pediatricians? J Pediatr 1978;93:524-527.
6. Sices L, Feudtner C, McLaughlin J, Drotar D, Williams M. How do primary care physicians identify young children with developmental delays? A National Survey. Pediatrics 2003;24:409-427.
7. Law J, Boyle J, Harris F, Harkness A, Nye C. Screening for speech and language disorder: a systematic review of the literature. Health Technol Assessment 1998;2:1-198.
8. National Health Interview Surveys, 1997–1998: Summary Health Statistics for U S. Children. National Center of Health Statistics. Vital Health Stat 10 (203). Available at: www.cdc.gov/nchs/.
9. Yeargin-Allsopp M, Murphy CC, Oakley GP, Sikes RK. A multiple-source method for studying the prevalence of developmental disabilities in children: the Metropolitan Atlanta Developmental Disabilities Study. Pediatrics 1992;89:624-630.
10. Wing L, Potter D. The epidemiology of autistic spectrum disorders: is the prevalence rising? Ment Retard Dev Disabil Res Rev 2002;8:151-161.
11. Condition of Education 1997. Supplemental Table 46-2: Participation in special education programs as a percentage of total public school enrollment, by selected types of disability, sex and race/ethnicity of student: school years ending in 1986, 1988, 1990, and 1992. Available at: www.nces.ed.gov/pubs/ce/c9746d02.html.
12. Halfron N, Inkelas M, et al. Summary Statistics from the National Survey of Early Childhood Health, 2000. National Center for Health Statistics. Vital Health Stat 2000;15:1-52.Available at www.cdc.gov/nchs/data/slaits/summary_sech00.pdf.
13. Palfrey JS, Singer JD, Walker DK, Butler JA. Early identification of children’s special needs: A study in five metropolitan communities. J Pediatr 1987;111:651-659.
14. Corrigan N, Stewart M, Scott M, Fee F. Predictive value of preschool surveillance in detecting learning disabilities. Arch Dis Child 1996;72:517-521.
15. Dearlove J, Kearney D. How good is general practice developmental screening? BMJ 1990;300:1177-1180.
16. Reynolds AJ, Temple JA, Robertson DL, Mann EA. Long-term Effects of an Early Childhood Intervention on Educational Achievement and Juvenile Arrest. JAMA 2001;285:2339-2346.
17. Schweinhart LJ, Barnes HV, Weikart DP. Significant Benefits: The High/Scope Perry Preschool Study Through Age 27. Ypsilanti, Mich: High/Scope Press; 1993.
18. Blair C, Ramey CT, Hardin J. Early intervention for low birth-weight, premature infants: participation and intellectual development. Am J Mental Retardation 1995;99:542-554.
19. Individuals With Disabilities Education Act Amendments of 1997 (Pub L No 105-117).
20. US Preventive Service Task Force. Screening for speech and language delay in preschool children. February 2006. Available at: www.ahrq.gov/clinic/uspstf/uspschdv.htm.
21. Canadian Guide to Clinical Preventive Health Care. Section 2 Pediatric Preventive Care. Available at: www.hc-sc.gc.ca/hppb/healthcare/pubs/clinical_preventive/index.html.
22. Glascoe FP. Standards for screening test construction. Available at: www.dbpeds.org.
23. Glascoe FP. Are over-referrals on developmental screening tests really a problem? Arch Pediatr Adolesc Med 2001;155:54-59.
24. Glascoe FP, Dworkin PH. The role of parents in the detection of developmental and behavioral problems. Pediatrics 1995;95:829-836.
25. Glascoe FP, Byrne KE. The accuracy of three developmental screening tests. J Early Interv 1993;17:368-378.
26. Glascoe FP. Parents’ Evaluation of Developmental Status. Nashville, Tenn: Ellsworth and Vandermeer Press; 1997.
27. Bricker D, Squires J. Ages and Stages Questionnaire: A Parent-Completed Child Monitoring System. Baltimore, Md: Paul H. Brookes Publishing Co.; 1999.
28. Bricker D, Squires J. Low cost system using parents to monitor the development of at-risk infants. J Earl Interven 1989;13:50-60.
29. Squires J, Bricker D, Potter L. Revision of a parent-completed developmental screening tool: ages and stages questionnaires. J Ped Psychol 1997;22:313-328.
30. Skellern CY, Rogers Y, O’Callaghan MJ. A parent-completed developmental questionnaire: follow-up of ex-premature Infants. J Ped Child Heal 2001;37:125-129.
31. Costenbader V, Rohrer AM, Difonzo N. Kindergarten screening: a survey of current practice. Psychol Sch 2000;37:323-332.
32. Glascoe FP. Technical Report for the Brigance Screens. 3rd ed. North Billerica, Mass: Curriculum Associate, Inc; 2002.
33. Glascoe FP. The Brigance Infant-Toddler Screen (BITS): standardization and validation. J Dev Behav Peds 2001;22:351.-
34. Brigance A. Brigance Screens-II. North Billerica, Mass: Curriculum Associates, 2006.
35. Oehler-Stinnett JO. Batelle Developmental Inventory Screening Test. In: Mental Measurement Yearbook [on-line database]. New York: Ovid Technologies. Available at www.ovid.com.
36. Glascoe FP, Byrne KE. The usefulness of the Battelle Developmental Inventory Screening Test. Clin Pediatr 1993;32:273-280.
37. Aylward GP. The Bayley Infant Neurodevelopmental Screener. San Antonio, Tex: Psychological Corporation; 1995.
38. Marcias MM, Saylor CF, Greer KM, Charles JM, Bell N, Katikaneni LD. Infant screening: The usefulness of the Bayley Infant Neurodevelopmental Screener and the Clinical Adaptive Test/Clinical Linguistic Auditory Milestone Scale. Dev Beh Peds 1998;19:155-161.
39. Barnett FW. Batelle Developmental inventory. In: Mental Measurement Yearbook [on-line database]. New York: Ovid Technologies. Available at www.ovid.com.
40. Hess CR, Papas MA, Black MM. Use of the Bayley Infant Neurodevelopmental Screener with an environmental risk group. J Ped Psychol 2004;29:321-330.
41. Frankenburg WK, Dodds J, Archer P, Shapiro H, Bresnick B. Denver II: A Major Revision of Restandardization of Denver Developmental Screening Test. Pediatrics 1992;89:91-97.
42. Hughs S. Denver Developmental Screening Test. In: Mental Measurement Yearbook [on-line database]. New York: Ovid Technologies. Available at www.ovid.com.
43. Glascoe FP, Byrne KE, Ashford LG, Johnson KL, Chang B, Strickland B. The accuracy of the Denver-II in developmental screening. Pediatrics 1992;89:1221-1225.
44. Ireton H. Manual for the Child Development Inventory. Minneapolis, Minn: Behavior Science Systems; 1992.
45. Doig KB, Macias MM, Saylor CF, Craver JR, Ingram PE. The Child Development Inventory: A developmental outcome measure for follow-up of the high risk infant. J Ped 1999;135:358-362.
46. Montgomery ML, Saylor C, Bell N, Macias MM, Charles JM, Katikaneni LD. Use of the Child Development Inventory to screen high-risk populations. Clin Pediatr 1999;38:535-539.
47. Ireton H, Vader H. Child Development Review—Instructions Manual. Minneapolis, Minn: Behavior Science Systems, Inc; 2004.
48. Karoly LA. Investing in our Children. Washington, DC: RAND; 1998.
49. Dobrez D, Sasso AO, Holl J, Shalowitz M, Leon S, Budetti P. Estimating the cost of developmental and behavioral screening of preschool children in general pediatric practice. Pediatrics 2001;108:913-922.
A practical 3-step model for managing treatment refusal
- The process for evaluating treatment refusal should be consistent regardless of setting, problem (ie, medical or psychiatric), type of patient, or practitioner.
- Assess decisional capacity, psychiatric dangerousness, and medical risk in all cases of treatment refusal while addressing potential causes of treatment refusal.
- Based on these assessments, choose between: a) respecting the treatment refusal, b) obtaining a surrogate, or c) mandating hospitalization and possibly treatment.
An 80-year-old woman with diabetes who has been your patient for many years is in failing health and may need dialysis for deteriorating kidney function. She refuses even to consider further evaluation.
A 37-year-old man has, according to his family, become increasingly depressed and makes comments suggesting suicidal ideation. They are afraid for his safety. He says he’s just going through a rough period and doesn’t need help.
Would you be prepared to handle instances of treatment refusal such as these? Treatment refusal can be challenging, creating conflicts among patients, families, and health care providers, and raising important ethical considerations. A patient’s autonomy may be undermined if her wishes are overridden. Inappropriately confining, restraining, or treating patients may cause harm. Failing to obtain a surrogate when indicated may result in a missed opportunity to benefit a patient. Refusal of treatment, when unaddressed or mishandled, may lead to patient dissatisfaction, substandard care, increased litigation, or disparities in care.
Clearer guidelines are needed to help clinicians evaluate and manage patients who refuse treatment. Building on previous work in treatment refusal, informed consent, and competency theory, we propose an approach to treatment refusal that provides 3 unique contributions:
- First, our model integrates medical and psychiatric treatment refusal practices—usually found in separate literature bases—into one model.
- Second, it emphasizes that evaluations of both decisional capacity and dangerousness (both defined later) are crucial to determining the appropriate response to treatment refusal.
- Third, it provides concrete guidance for how to decide between 3 actions: 1) respect the treatment refusal, 2) obtain a surrogate, or 3) mandate hospitalization and possibly treatment.
How to assess and manage treatment refusal
Step 1: Evaluate both decisional capacity and dangerousness
Grisso and Appelbaum have described an empirically tested model of how to evaluate decisional capacity.1Decisional capacity refers to the ability to make a choice about treatment, and it is determined by the presence and extent of functional abilities, which are hierarchical, from the simplest to the most complex:
- Making a choice (“I’d like to have the cardiac catheterization”)
- Understanding relevant details, such as diagnosis, prognosis, the benefits and burdens of different treatment alternatives, and what will happen without treatment
- Appreciating that the relevant details apply to oneself and will mean something for one’s own future
- Rationally describing why a choice was made (such as explaining why one would prefer a particular set of risks, benefits, or burdens from one treatment alternative over another).
Many factors may interfere with these abilities and they should be assessed,1 but additional discussion is beyond the scope of this article.
Not all patients with mental illness have impaired decisional capacity. On the contrary, there is significant variability in the decisional capacity of people with serious mental illness.2 One instrument to evaluate decisional capacity for treatment decisions has been studied, but time constraints may limit its widespread application in clinical practice.3
Dangerousness in the clinical setting is generally defined as the intent to harm oneself or others, creating imminent risk. For the purposes of our model, this will be called “psychiatric dangerousness.” Other sources describe the assessment of psychiatric dangerousness in more detail,4 but the assessment typically includes a thorough psychosocial history, an evaluation for mental illness, a determination of risk factors for suicide, and often corroborating history from family or friends. “Medical dangerousness” is defined as the risk of morbidity or mortality that accompanies medical intervention or non-intervention.
In cases of treatment refusal, explicitly assess both decisional capacity and dangerousness. There are 3 benefits in doing so. First, it helps avoid the tendency to assess dangerousness only in the psychiatric context and decisional capacity in the general medical context. Second, it provides a useful way to approach treatment refusal when the cause of symptoms or complaints is ambiguous. Third, it helps when a patient exhibits both medical and psychiatric symptoms of illness.
Step 2: Determine the need for involuntary hospitalization and treatment
The ideal threshold for involuntary confinement is the point at which those who will harm themselves or others are confined and protected, while those who will not harm themselves or others are not. Determining the ideal threshold for involuntary treatment is difficult. Besides the challenges in predicting dangerousness,5 this determination involves a balance between potentially competing goals: respecting individual liberties, enhancing quality of life, and protecting patients and others from harm.
In general, there is greater justification for involuntary hospitalization with increasing “psychiatric dangerousness.” States vary on what requirements must be met for involuntary psychiatric hospitalization. Many jurisdictions have additional requirements to force psychiatric treatment; in some jurisdictions, forcing psychiatric treatment is not permitted.
Step 3: Determine the need for a surrogate decision-maker
The strength of the case for surrogate decision-making increases as decisional capacity decreases. A surrogate decision-maker is the person authorized to make decisions for a person who is not fully autonomous because of impaired decisional capacity. The ethical justification for obtaining a surrogate is to respect the patient’s prior ability to be informed and make a choice. Some patients share decision-making with other family or friends and this should be respected.
In our view, a surrogate should be obtained for a patient with impaired decisional capacity even when significant “psychiatric dangerousness” is present and involuntary hospitalization or treatment is pursued. The principle of equal respect for persons supports the view that since incompetent patients with medical problems are afforded a surrogate, so should incompetent patients with psychiatric problems.
Some might argue that the judge ordering the mandatory hospitalization or treatment is the surrogate. However, others who know the patient better and are more familiar with their values are more likely to provide authentic substituted judgment. At the same time, safety concerns for the patient (in the case of suicidal intent) or others (in the case of homicidal intent) require that surrogate decision-making be restricted. Surprisingly, no law or regulation in the US, to our knowledge, mandates appointing a surrogate for a patient who is involuntarily hospitalized or treated.
Managing treatment refusal in practice
Evaluating decisional capacity and dangerousness leads to 3 possible decisions: 1) respect the treatment refusal, 2) obtain a surrogate, or 3) mandate hospitalization and possibly treatment. FIGURES 1 AND 2 depict such decisions for psychiatric and medical dangerousness, respectively. The important question during evaluation is not, “Is there decisional capacity or dangerousness?” but is rather, “How much decisional capacity or dangerousness is present?” Even if different evaluators agree which decision-making abilities are present or how much psychiatric dangerousness exists, a value judgment must be made to decide the threshold at which a surrogate is obtained or the court is petitioned for involuntary hospitalization or treatment.
Similarities in the assessments of medical and psychiatric dangerousness.
When a patient exhibits adequate decisional capacity and insufficient dangerousness of either type, treatment refusal is respected. When decisional capacity is judged to be impaired, a surrogate should be obtained regardless of the type of dangerousness that is present.
FIGURE 1
Decisional capacity and psychiatric dangerousness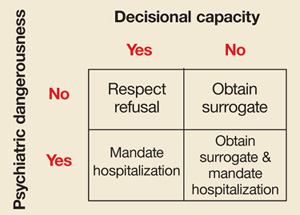
In assessing a patient’s decisional capacity and level of psychiatric dangerousness, we depart from traditional practice (lower right-hand box) and recommend obtaining a surrogate decision-maker when the patient has inadequate decisional capacity.
FIGURE 2
Decisional capacity and medical dangerousness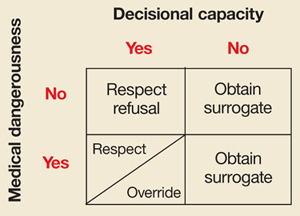
In assessing a patient’s decisional capacity and level of medical dangerousness, our model considers the clinical context in judging whether to override or respect a patient’s decision (lower left-hand box).
Decisional capacity
Differences in the assessments. Two boxes in the figures deserve comment. First, the bottom right box of FIGURE 1 recommends a departure from current practice. As described earlier, we recommend obtaining a surrogate for patients who have impaired decisional capacity and are involuntarily hospitalized for psychiatric dangerousness. Second, in the bottom left box of FIGURE 2, treatment refusal by a patient who has decisional capacity and “medical dangerousness” may be respected or overridden depending on contextual factors. The long history of respect for liberty, and the requirement not to invade another’s body without consent generally supports respecting treatment refusal.
When decisions may be overridden in a patient with adequate decisional capacity and medical dangerousness. During a public health emergency, such as a tuberculosis or SARS outbreak, ensuring the public’s safety may outweigh respect for individual liberties. When someone with tuberculosis refuses treatment and has adequate decisional capacity, legal precedent and ethical justification exist to defend involuntary confinement or treatment in certain circumstances.6
When the threshold for adequate decisional capacity changes based on the level of medical dangerousness. With increasing medical dangerousness, a given level of decisional capacity may be regarded as inadequate, and treatment refusal may be appropriately questioned and consideration given to naming a surrogate.7,8 Alternatively, when there is little “medical dangerousness,” less decisional capacity may be required for a treatment refusal to be respected. This approach is controversial because it involves a modifiable notion of decisional capacity.9
In addition, this approach is not appropriate in all contexts. For example, in patients who are imminently dying with irreversible terminal illness, “medical dangerousness” may be very high, but the threshold for adequate decisional capacity should not necessarily be very high.
Dealing with uncertainty
Sometimes the degree of “medical dangerousness” is difficult to quantify, in part because the diagnosis may be uncertain; or even when the diagnosis is known, prognostication may be difficult.10
In instances of uncertainty, considering the possibility that there may be a serious underlying condition is important both medically (in case immediate intervention can prevent a negative outcome) and ethically (to benefit the patient and preserve autonomy by preventing morbidity that may be impairing). Thus, shifting the standard for decisional capacity to require a higher level of understanding and appreciation may be justified.
In such cases, even though a patient has some level of decisional capacity, a surrogate may be needed. One approach might be to attempt shared decision-making between the patient and surrogate, although ultimate decision-making should be left to the surrogate.
Careful documentation is important
As with other medical issues, in cases of treatment refusal, thoroughly document the process, whether or not treatment refusal is ultimately honored. Note findings from the evaluation including decisional capacity and medical and psychiatric dangerousness, thinking associated with the assessment, and specific management plans.
Record any decision for involuntary hospitalization or treatment because of psychiatric dangerousness or the need for a surrogate decision-maker because of impaired decisional capacity. Finally, describe your reasons for a course of action in the special situations noted above.
Benefits of this model
This approach to treatment refusal is consistent and involves clear standards and processes for evaluation, regardless of setting, problem, type of patient, or practitioner. It facilitates respect for persons, equal treatment independent of diagnosis, and appropriate involvement of surrogate decision-makers and the courts.
Acknowledgments
Earlier versions of this work have been presented at the following meetings:
Bekelman D, Carrese J (2003). Treatment refusal and decisional competence assessment. Concurrent Session, Clinical Ethics Consultation: First International Summit, Cleveland, Ohio.
Bekelman D (2002). Treatment refusal: Conceptual models and clinical approaches. Workshop, 49th annual meeting of the Academy of Psychosomatic Medicine, Tucson, Arizona.
CORRESPONDENCE
David Bekelman, MD, MPH, Division of General Internal Medicine, University of Colorado at Denver and Health Sciences Center, 4200 East 9th Avenue, B180, Denver, CO 80262. E-mail: [email protected]
1. Grisso T, Appelbaum PS. Assessing Competence to Consent to Treatment: A Guide for Physicians and Other Health Professionals. New York: Oxford University Press, 1998.
2. Grisso T, Appelbaum PS. The MacArthur Treatment Competence Study. III: Abilities of patients to consent to psychiatric and medical treatments. Law Hum Behav 1995;19:149-174.
3. Grisso T, Appelbaum PS, Hill-Fotouhi C. The MacCAT-T: a clinical tool to assess patients’ capacities to make treatment decisions. Psychiatr Serv 1997; 48:1415–1419. The tool itself can be found online at: www.prpress.com/books/mact-setfr.html.
4. Packman WL, Marlitt RE, Bongar B, O’Connor PT. A comprehensive and concise assessment of suicide risk. Behav Sci Law 2004;22:667.-
5. Monahan J, Steadman HJ. Violence and Mental Disorder: Developments in Risk Assessment. Chicago: University of Chicago Press,1994.
6. Gostin LO. Public Health Law: Power, Duty, Restraint. Berkeley: University of California Press, 2000.
7. Buchanan AE, Brock DW. Deciding for Others: The Ethics of Surrogate Decision Making. Cambridge, England: Cambridge University Press,1989.
8. Roth LH, Meisel A, Lidz CW. Tests of competency to consent to treatment. Am J Psych 1977;134:279-284.
9. Beauchamp TL, Childress CF. Principles of Biomedical Ethics. 5th ed. Oxford: Oxford University Press, 2001.
10. Christakis NA. Death Foretold: Prophecy and Prognosis in Medical Care. Chicago: University of Chicago Press,1999.
- The process for evaluating treatment refusal should be consistent regardless of setting, problem (ie, medical or psychiatric), type of patient, or practitioner.
- Assess decisional capacity, psychiatric dangerousness, and medical risk in all cases of treatment refusal while addressing potential causes of treatment refusal.
- Based on these assessments, choose between: a) respecting the treatment refusal, b) obtaining a surrogate, or c) mandating hospitalization and possibly treatment.
An 80-year-old woman with diabetes who has been your patient for many years is in failing health and may need dialysis for deteriorating kidney function. She refuses even to consider further evaluation.
A 37-year-old man has, according to his family, become increasingly depressed and makes comments suggesting suicidal ideation. They are afraid for his safety. He says he’s just going through a rough period and doesn’t need help.
Would you be prepared to handle instances of treatment refusal such as these? Treatment refusal can be challenging, creating conflicts among patients, families, and health care providers, and raising important ethical considerations. A patient’s autonomy may be undermined if her wishes are overridden. Inappropriately confining, restraining, or treating patients may cause harm. Failing to obtain a surrogate when indicated may result in a missed opportunity to benefit a patient. Refusal of treatment, when unaddressed or mishandled, may lead to patient dissatisfaction, substandard care, increased litigation, or disparities in care.
Clearer guidelines are needed to help clinicians evaluate and manage patients who refuse treatment. Building on previous work in treatment refusal, informed consent, and competency theory, we propose an approach to treatment refusal that provides 3 unique contributions:
- First, our model integrates medical and psychiatric treatment refusal practices—usually found in separate literature bases—into one model.
- Second, it emphasizes that evaluations of both decisional capacity and dangerousness (both defined later) are crucial to determining the appropriate response to treatment refusal.
- Third, it provides concrete guidance for how to decide between 3 actions: 1) respect the treatment refusal, 2) obtain a surrogate, or 3) mandate hospitalization and possibly treatment.
How to assess and manage treatment refusal
Step 1: Evaluate both decisional capacity and dangerousness
Grisso and Appelbaum have described an empirically tested model of how to evaluate decisional capacity.1Decisional capacity refers to the ability to make a choice about treatment, and it is determined by the presence and extent of functional abilities, which are hierarchical, from the simplest to the most complex:
- Making a choice (“I’d like to have the cardiac catheterization”)
- Understanding relevant details, such as diagnosis, prognosis, the benefits and burdens of different treatment alternatives, and what will happen without treatment
- Appreciating that the relevant details apply to oneself and will mean something for one’s own future
- Rationally describing why a choice was made (such as explaining why one would prefer a particular set of risks, benefits, or burdens from one treatment alternative over another).
Many factors may interfere with these abilities and they should be assessed,1 but additional discussion is beyond the scope of this article.
Not all patients with mental illness have impaired decisional capacity. On the contrary, there is significant variability in the decisional capacity of people with serious mental illness.2 One instrument to evaluate decisional capacity for treatment decisions has been studied, but time constraints may limit its widespread application in clinical practice.3
Dangerousness in the clinical setting is generally defined as the intent to harm oneself or others, creating imminent risk. For the purposes of our model, this will be called “psychiatric dangerousness.” Other sources describe the assessment of psychiatric dangerousness in more detail,4 but the assessment typically includes a thorough psychosocial history, an evaluation for mental illness, a determination of risk factors for suicide, and often corroborating history from family or friends. “Medical dangerousness” is defined as the risk of morbidity or mortality that accompanies medical intervention or non-intervention.
In cases of treatment refusal, explicitly assess both decisional capacity and dangerousness. There are 3 benefits in doing so. First, it helps avoid the tendency to assess dangerousness only in the psychiatric context and decisional capacity in the general medical context. Second, it provides a useful way to approach treatment refusal when the cause of symptoms or complaints is ambiguous. Third, it helps when a patient exhibits both medical and psychiatric symptoms of illness.
Step 2: Determine the need for involuntary hospitalization and treatment
The ideal threshold for involuntary confinement is the point at which those who will harm themselves or others are confined and protected, while those who will not harm themselves or others are not. Determining the ideal threshold for involuntary treatment is difficult. Besides the challenges in predicting dangerousness,5 this determination involves a balance between potentially competing goals: respecting individual liberties, enhancing quality of life, and protecting patients and others from harm.
In general, there is greater justification for involuntary hospitalization with increasing “psychiatric dangerousness.” States vary on what requirements must be met for involuntary psychiatric hospitalization. Many jurisdictions have additional requirements to force psychiatric treatment; in some jurisdictions, forcing psychiatric treatment is not permitted.
Step 3: Determine the need for a surrogate decision-maker
The strength of the case for surrogate decision-making increases as decisional capacity decreases. A surrogate decision-maker is the person authorized to make decisions for a person who is not fully autonomous because of impaired decisional capacity. The ethical justification for obtaining a surrogate is to respect the patient’s prior ability to be informed and make a choice. Some patients share decision-making with other family or friends and this should be respected.
In our view, a surrogate should be obtained for a patient with impaired decisional capacity even when significant “psychiatric dangerousness” is present and involuntary hospitalization or treatment is pursued. The principle of equal respect for persons supports the view that since incompetent patients with medical problems are afforded a surrogate, so should incompetent patients with psychiatric problems.
Some might argue that the judge ordering the mandatory hospitalization or treatment is the surrogate. However, others who know the patient better and are more familiar with their values are more likely to provide authentic substituted judgment. At the same time, safety concerns for the patient (in the case of suicidal intent) or others (in the case of homicidal intent) require that surrogate decision-making be restricted. Surprisingly, no law or regulation in the US, to our knowledge, mandates appointing a surrogate for a patient who is involuntarily hospitalized or treated.
Managing treatment refusal in practice
Evaluating decisional capacity and dangerousness leads to 3 possible decisions: 1) respect the treatment refusal, 2) obtain a surrogate, or 3) mandate hospitalization and possibly treatment. FIGURES 1 AND 2 depict such decisions for psychiatric and medical dangerousness, respectively. The important question during evaluation is not, “Is there decisional capacity or dangerousness?” but is rather, “How much decisional capacity or dangerousness is present?” Even if different evaluators agree which decision-making abilities are present or how much psychiatric dangerousness exists, a value judgment must be made to decide the threshold at which a surrogate is obtained or the court is petitioned for involuntary hospitalization or treatment.
Similarities in the assessments of medical and psychiatric dangerousness.
When a patient exhibits adequate decisional capacity and insufficient dangerousness of either type, treatment refusal is respected. When decisional capacity is judged to be impaired, a surrogate should be obtained regardless of the type of dangerousness that is present.
FIGURE 1
Decisional capacity and psychiatric dangerousness
In assessing a patient’s decisional capacity and level of psychiatric dangerousness, we depart from traditional practice (lower right-hand box) and recommend obtaining a surrogate decision-maker when the patient has inadequate decisional capacity.
FIGURE 2
Decisional capacity and medical dangerousness
In assessing a patient’s decisional capacity and level of medical dangerousness, our model considers the clinical context in judging whether to override or respect a patient’s decision (lower left-hand box).
Decisional capacity
Differences in the assessments. Two boxes in the figures deserve comment. First, the bottom right box of FIGURE 1 recommends a departure from current practice. As described earlier, we recommend obtaining a surrogate for patients who have impaired decisional capacity and are involuntarily hospitalized for psychiatric dangerousness. Second, in the bottom left box of FIGURE 2, treatment refusal by a patient who has decisional capacity and “medical dangerousness” may be respected or overridden depending on contextual factors. The long history of respect for liberty, and the requirement not to invade another’s body without consent generally supports respecting treatment refusal.
When decisions may be overridden in a patient with adequate decisional capacity and medical dangerousness. During a public health emergency, such as a tuberculosis or SARS outbreak, ensuring the public’s safety may outweigh respect for individual liberties. When someone with tuberculosis refuses treatment and has adequate decisional capacity, legal precedent and ethical justification exist to defend involuntary confinement or treatment in certain circumstances.6
When the threshold for adequate decisional capacity changes based on the level of medical dangerousness. With increasing medical dangerousness, a given level of decisional capacity may be regarded as inadequate, and treatment refusal may be appropriately questioned and consideration given to naming a surrogate.7,8 Alternatively, when there is little “medical dangerousness,” less decisional capacity may be required for a treatment refusal to be respected. This approach is controversial because it involves a modifiable notion of decisional capacity.9
In addition, this approach is not appropriate in all contexts. For example, in patients who are imminently dying with irreversible terminal illness, “medical dangerousness” may be very high, but the threshold for adequate decisional capacity should not necessarily be very high.
Dealing with uncertainty
Sometimes the degree of “medical dangerousness” is difficult to quantify, in part because the diagnosis may be uncertain; or even when the diagnosis is known, prognostication may be difficult.10
In instances of uncertainty, considering the possibility that there may be a serious underlying condition is important both medically (in case immediate intervention can prevent a negative outcome) and ethically (to benefit the patient and preserve autonomy by preventing morbidity that may be impairing). Thus, shifting the standard for decisional capacity to require a higher level of understanding and appreciation may be justified.
In such cases, even though a patient has some level of decisional capacity, a surrogate may be needed. One approach might be to attempt shared decision-making between the patient and surrogate, although ultimate decision-making should be left to the surrogate.
Careful documentation is important
As with other medical issues, in cases of treatment refusal, thoroughly document the process, whether or not treatment refusal is ultimately honored. Note findings from the evaluation including decisional capacity and medical and psychiatric dangerousness, thinking associated with the assessment, and specific management plans.
Record any decision for involuntary hospitalization or treatment because of psychiatric dangerousness or the need for a surrogate decision-maker because of impaired decisional capacity. Finally, describe your reasons for a course of action in the special situations noted above.
Benefits of this model
This approach to treatment refusal is consistent and involves clear standards and processes for evaluation, regardless of setting, problem, type of patient, or practitioner. It facilitates respect for persons, equal treatment independent of diagnosis, and appropriate involvement of surrogate decision-makers and the courts.
Acknowledgments
Earlier versions of this work have been presented at the following meetings:
Bekelman D, Carrese J (2003). Treatment refusal and decisional competence assessment. Concurrent Session, Clinical Ethics Consultation: First International Summit, Cleveland, Ohio.
Bekelman D (2002). Treatment refusal: Conceptual models and clinical approaches. Workshop, 49th annual meeting of the Academy of Psychosomatic Medicine, Tucson, Arizona.
CORRESPONDENCE
David Bekelman, MD, MPH, Division of General Internal Medicine, University of Colorado at Denver and Health Sciences Center, 4200 East 9th Avenue, B180, Denver, CO 80262. E-mail: [email protected]
1. Grisso T, Appelbaum PS. Assessing Competence to Consent to Treatment: A Guide for Physicians and Other Health Professionals. New York: Oxford University Press, 1998.
2. Grisso T, Appelbaum PS. The MacArthur Treatment Competence Study. III: Abilities of patients to consent to psychiatric and medical treatments. Law Hum Behav 1995;19:149-174.
3. Grisso T, Appelbaum PS, Hill-Fotouhi C. The MacCAT-T: a clinical tool to assess patients’ capacities to make treatment decisions. Psychiatr Serv 1997; 48:1415–1419. The tool itself can be found online at: www.prpress.com/books/mact-setfr.html.
4. Packman WL, Marlitt RE, Bongar B, O’Connor PT. A comprehensive and concise assessment of suicide risk. Behav Sci Law 2004;22:667.-
5. Monahan J, Steadman HJ. Violence and Mental Disorder: Developments in Risk Assessment. Chicago: University of Chicago Press,1994.
6. Gostin LO. Public Health Law: Power, Duty, Restraint. Berkeley: University of California Press, 2000.
7. Buchanan AE, Brock DW. Deciding for Others: The Ethics of Surrogate Decision Making. Cambridge, England: Cambridge University Press,1989.
8. Roth LH, Meisel A, Lidz CW. Tests of competency to consent to treatment. Am J Psych 1977;134:279-284.
9. Beauchamp TL, Childress CF. Principles of Biomedical Ethics. 5th ed. Oxford: Oxford University Press, 2001.
10. Christakis NA. Death Foretold: Prophecy and Prognosis in Medical Care. Chicago: University of Chicago Press,1999.
Ectopic pregnancy: Forget the “classic presentation” if you want to catch it sooner
- Less than half of the patients with ectopic pregnancy present with the classic triad of a history of amenorrhea, abdominal pain, and irregular vaginal bleeding (C).
- Definite cervical motion tenderness and peritoneal signs are the most sensitive and specific examination findings for ectopic pregnancy—91% and 95%, respectively (A).
- Beta-human chorionic gonadotropin (β-hCG) levels can be used in combination with ultrasound findings to improve the accuracy of the diagnosis of ectopic pregnancy (A).
- Women with initial nondiagnostic transvaginal ultrasound should be followed with serial β-hCGs (B).
Despite advanced detection methods, ectopic pregnancy may be missed in 40% to 50% of patients on an initial visit.1 Most women with ectopic pregnancy have no risk factors (TABLE 1),2-5 and the classic triad of a history of amenorrhea, abdominal pain, and irregular vaginal bleeding is absent in more than half of cases.
Early diagnosis not only decreases maternal mortality and morbidity; it also helps preserve future reproductive capacity—only one third of women with ectopic pregnancy have subsequent live births.2
Management strategies for patients with ectopic pregnancy have evolved rapidly, with ambulatory medical therapy becoming an option for more patients.6 Using a practical decision protocol, we discuss the physical findings that most reliably suggest ectopic pregnancy, describe sensible use of laboratory and imaging studies, and explain what to do when results are equivocal. In part 2 of this article (coming in the June 2006 Journal of Family Practice), we provide a decision protocol for management of ectopic pregnancy.
TABLE 1
Risk factors for ectopic pregnancy
| DEGREE OF RISK | FACTOR | ODDS RATIO (95% CONFIDENCE INTERVALS) | ||
|---|---|---|---|---|
| ANKUM ET AL3 | MOL ET AL4 | BOUYER ET AL5 | ||
| High | Previous tubal surgery | 21 (9.3–47) | 4.0 (2.6–6.1) | |
| Tubal ligation | 9.3 (4.9–18) | |||
| Previous ectopic pregnancy | 8.3 (6.0–11.5) | |||
| In utero DES exposure | 5.6 (2.4–13) | |||
| Current IUD use | 4.2–45* | |||
| Tubal pathology/abnormality | 3.5–25* | |||
| Moderate | Infertility | 2.5–21* | 2.7 (1.8–4.2) | |
| History of PID | 2.5 (2.1–3.0) | 3.4 (2.4–5.0) | ||
| Previous chlamydial or gonococcal infection | 2.8–3.7* | |||
| Current smoking | 2.3 (2.0–2.8) | 3.9 (2.6–5.9) | ||
| Spontaneous abortions ≥3 | 3.0 (1.3–6.9) | |||
| Induced abortions (medical±surgical) | 2.8 (1.1–7.2) | |||
| Lifetime sexual partners >1 | 2.1 (1.4–4.8) | |||
| Low | Age first intercourse <18 years | 1.6 (1.1–2.5) | ||
| Previous pelvic/abdominal surgery | 0.93–3.8* | |||
| Vaginal douching | 1.1–3.1* | |||
| DES, diethylstilbestrol; PID, pelvic inflammatory disease; IUD, intrauterine device | ||||
| * Range; summary odds ratio not calculated owing to significant heterogeneity between studies. | ||||
Evaluation
Clinical features of ectopic pregnancy highly variable
No single clinical feature accurately indicates ectopic pregnancy. Less than half of women with ectopic pregnancy exhibit the classic triad of a history of amenorrhea, abdominal pain, and irregular vaginal bleeding.1 And, unfortunately, these features are seen commonly in patients with both viable (50%) and nonviable (25%) intrauterine pregnancies, as well as in threatened abortion, cervical irritation, infection, and trauma.7
Set a low threshold for suspicion. For any woman of childbearing age with abdominal pain and vaginal bleeding, consider pregnancy and take steps to rule out ectopic pregnancy. Abdominal pain and vaginal bleeding are highly sensitive for ectopic pregnancy but are not specific for the disorder (TABLE 2).8-17 Pain located in the hypogastrium or iliac fossa may be mild to severe. Vaginal bleeding, present in 50% to 80% of patients with ectopic pregnancy, can be mistaken for a normal menstrual period.2,6 Pregnancy-associated symptoms of nausea and vomiting, breast tenderness, and fatigue may be present.
Lower abdominal and adnexal tenderness can be elicited in most women with ectopic pregnancy. Cervical motion tenderness, peritoneal signs, and adnexal masses are most specific for ectopic pregnancy, but are not sensitive.8 An adnexal mass is palpable in less than 10% of cases; when it is detected, one third of patients will have a contralateral ectopic pregnancy on ultrasonography.18 Symptoms of hemodynamic compromise (orthostasis, hypotension, shock) are becoming uncommon with earlier diagnosis of ectopic pregnancy, facilitated by improved detection methods.
TABLE 2
Significance of features associated with ectopic pregnancy
| FEATURES | SN (%) | SP (%) | LR+ | LR– |
|---|---|---|---|---|
| Clinical features8 | ||||
| Any risk factors | 23 | 83 | 1.4 | 0.9 |
| Estimated gestational age <70 days | 95 | 27 | 1.3 | 0.2 |
| Vaginal bleeding | 69 | 26 | 0.9 | 1.2 |
| Abdominal pain | 97 | 15 | 1.1 | 0.2 |
| Abdominal tenderness | 85 | 50 | 1.7 | 0.3 |
| Peritoneal signs | 23 | 95 | 4.6 | 0.8 |
| Cervical motion tenderness | 33 | 91 | 3.7 | 0.7 |
| Adnexal tenderness | 69 | 62 | 1.8 | 0.5 |
| Adnexal mass | 5 | 96 | 1.3 | 1.0 |
| Transvaginal ultrasound | ||||
| No intrauterine gestational sac9 | 100 | 89 | 9.1 | <0.1 |
| Adnexal mass10 | ||||
| Separate from ovary | 93 | 99 | 93 | 0.1 |
| Cardiac activity | 20 | 100 | ∞ | 0.8 |
| Yolk sac or embryo | 37 | 100 | ∞ | 0.6 |
| Tubal ring/yolk sac or embryo | 65 | 99 | 65 | 0.4 |
| Fluid in pouch of Douglas11 | ||||
| Any | 63 | 69 | 2.0 | 0.5 |
| Echogenic | 56 | 96 | 14.0 | 0.5 |
| Color-flow Doppler12 | 95 | 98 | 47.5 | 0.1 |
| β-hCG combined with transvaginal ultrasound | ||||
| Empty uterus | ||||
| ≥1000 mIU/mL10,13,14 | 43–96 | 86–100 | 3.0–∞ | 0.04–0.66 |
| ≥1500 mIU/mL13,15 | 40–99 | 84–96 | 6.3–9.9 | 0.01–0.63 |
| ≥2000 mIU/mL13,16 | 38–48 | 80–98 | 2.3–25.3 | 0.63–0.68 |
| Adnexal mass* | ||||
| ≥1000 mIU/mL13 | 73 | 85 | 4.7 | 0.32 |
| ≥1500 mIU/mL13,15 | 46–64 | 92–96 | 5.9–16.5 | 0.38–0.58 |
| ≥2000 mIU/mL13 | 55 | 96 | 14.2 | 0.47 |
| β-hCG rise in 48 hours (empty uterus)† | ||||
| >66%17 | — | — | 1.1 | — |
| <66%17 | — | — | 7.4 | — |
| >50%13 | — | — | 2.8 | — |
| <50%13 | — | — | 3.3 | — |
| β-hCG fall in 48 hours (empty uterus)† | ||||
| >50%13,17 | — | — | 0.8–1.4 | — |
| <50%13,17 | — | — | 0–0.1 | — |
| * Mass or fluid in cul de sac for β-hCG ≥1500 mIU/mL and ≥2000 mIU/mL. | ||||
| † Strata-specific likelihood ratios reported, sensitivity and specificity not applicable. | ||||
| Sn, sensitivity; Sp, specificity; LR, likelihood ratio; β-hCG, beta-human chorionic gonadotropin. | ||||
Laboratory tests
In an early normal pregnancy, the beta-human chorionic gonadotropin (β-hCG) level doubles every 1.8 to 3 days, rising to 1000 mIU/mL IRP (International Reference Preparation, measured by radioimmunoassay) by 5 weeks, to 2500 mIU/mL by 6 weeks, and to 13,000 mIU/mL (±3000) by 7 weeks. A single quantitative β-hCG level is not always helpful, as it can range from less than 100 mIU/mL to greater than 50,000 mIU/mL with both ruptured and unruptured ectopic pregnancies.19
Rethinking the rate of rise in β-hCG. The oft-quoted maxim that ectopic pregnancy or impending miscarriage is associated with a rise in β-hCG of less than 66% in 48 hours arose from a 1981 study that included only 20 women and that was based on an 85% confidence interval (CI).20 A recent study of 287 women suggests that the minimal expected rise in 2 days for a viable intrauterine pregnancy (based on a 99% CI) should be at least 53%.21
Combining β-hCG levels and ultrasound findings to improve diagnosis. Because the exact gestational age is often unknown in women presenting with features of ectopic pregnancy, the β-hCG level is used to determine whether a gestational sac can be identified on ultrasound. With a β-hCG level of 6500 mIU/mL, a gestational sac should be visible on abdominal ultrasound in the uterus of a woman with an intrauterine pregnancy; the sac should be absent in ectopic pregnancy. This β-hCG level is designated the discriminatory zone.22
With a high-resolution transvaginal ultrasound (TVUS), the gestational sac of a normal single intrauterine pregnancy should be visible at a β-hCG level above 1000–1500 mIU/mL, depending on equipment and technical expertise.2,7 In multiple gestations the discriminatory zone is observed to be above 2300 mIU/mL.2 Various ultrasonography findings have been combined with β-hCG levels to more accurately diagnose ectopic pregnancy (TABLE 2 and FIGURE).
Serial β-hCG measurements. If TVUS findings are indeterminate, serial measurements of β-hCG levels at 48-hour intervals may be useful in managing suspected ectopic pregnancy. Dart et al17 found that a rise in β-hCG level of 66% or more was usually associated with a viable intrauterine pregnancy, though 22% of women in that study had an ectopic pregnancy. Mol et al13 found similar results using a cutoff of a β-hCG level rise of 50% or more; 35% had an ectopic pregnancy. Increases in the β-hCG level less than these cutoffs almost always indicated an abnormal pregnancy, and about half of these women had an ectopic pregnancy.13,17 Also a fall in the β-hCG level by less than 50% was almost always associated with an abnormal pregnancy, but only 19% of these women had an ectopic pregnancy. 13,17 Alternatively, decreases in β-hCG level of greater than 50% reduced the chance that patients had an ectopic pregnancy to less than 3%.13,17
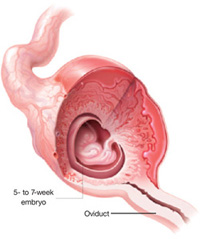
Ectopic pregnancy is defined as the implantation of the fertilized egg that occurs outside the uterine cavity. It is practically synonymous with tubal pregnancy, as 97% occur in the Fallopian tube.6,23 Ectopic pregnancy occurs in 2% of all pregnancies in the United States, affecting more than 100,000 patients each year. It is a leading cause of pregnancy-related death in the first trimester,2 with a yearly monetary impact of greater than 1 billion dollars. The incidence has increased almost six-fold since 1970 due to delayed child-bearing, rising prevalence of sexually transmitted diseases, and sterilization procedures.6
FIGURE
Diagnostic protocol with high sensitivity and specificity for ectopic pregnancy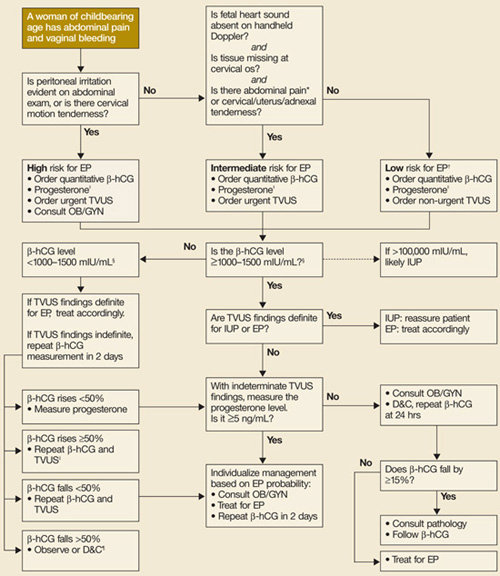
* Other than midline suprapubic cramping.
† Risk may be higher in presence of these factors: previous EP, tubal surgery, tubal disease detected by hysterosalpingogram or laproscopy, diethylstilbestrol exposure, sterilization, intrauterine device.
‡ Progesterone is useful only when TVUS is indeterminate.
§ β-hCG level for criterion should be based on local values at which IUP visible on TVUS.
|| TVUS should be repeated when β-hCG has risen above the discrimination zone.
¶ Only 2/170 patients in this category had EP; therefore, D&C is safe but may not be cost-effective.11
β-hCG, beta-human chorionic gonadotropin; EP, ectopic pregnancy; TVUS, transvaginal ultrasound; OB/GYN, obstetrician/gynecologist;
IUP, intrauterine pregnancy; D&C, dilation and curettage.
Serum progesterone levels may have limited usefulness. Serum progesterone measurements are not considered accurate enough to diagnose ectopic pregnancy.24 However, progesterone levels may be helpful if they are either very high or very low. Levels less than 22 ng/mL have a sensitivity of 100% for ectopic pregnancy.25 Only 5 of 1615 patients (0.3%) in 13 studies with progesterone levels below 5 ng/mL had a viable intrauterine pregnancy.24 By establishing the low likelihood of a viable intrauterine pregnancy, serum progesterone measurements may also be useful when β-hCG levels have reached 1000–1500 mIU/mL and the TVUS is equivocal.25
When D&C may help. Dilation and curettage (D&C) is an option for patients with an indeterminate ultrasound result and progesterone levels less than 5 ng/mL, as it can rule out an ectopic pregnancy with only a small chance of interrupting a viable intrauterine pregnancy. The presence of chorionic villi rules out an ectopic pregnancy. In the absence of villi, if β-hCG levels subsequently plateau or increase, it is presumptive of ectopic pregnancy. Chorionic villous sampling by pipelle curette has both insufficient sensitivity and predictive value in diagnosing ectopic pregnancy, and should not be considered a substitute for D&C.26
Other tests that have limited use. Patients with ectopic pregnancy may have elevated serum markers of smooth muscle destruction such as creatinine phosphokinase (CPK), myoglobin, and smooth muscle heavy-chain myosin (SMHC). However, these tests are of limited value in diagnosing ectopic pregnancy.27 SMHC may be of use in evaluating pregnancies less than 5 weeks’ gestation when the TVUS is not diagnostic. Serum vascular endothelial growth factor is another marker elevated in women with ectopic pregnancy; levels greater than 200 pg/mL distinguish ectopic pregnancy from intrauterine pregnancy (sensitivity=60%, specificity=90%).28
Imaging
In normal pregnancies, a gestational sac is seen on TVUS between 4 and 5 weeks’ gestation;29 the yolk sac is visible at around 6 weeks; and an embryo can be detected between 6 and 7 weeks. A gestational sac greater than 10 mm in diameter without a yolk sac, or greater than 25 mm without an embryo, indicates an abnormal regnancy.9,29 Presence of an intrauterine pregnancy on ultrasound effectively rules out ectopic pregnancy because heterotopic pregnancy is rare (1 in 2600–30,000 pregnancies).30 Hormonal changes associated with pregnancy result in a uterine endometrial fluid collection (pseudo-sac) in 8% of ectopic pregnancies.31
Specific diagnostic finding for ectopic pregnancy. A gestational sac visible on ultrasound with a yolk sac or fetal pole outside the endometrial cavity (TABLE 2) is diagnostic of ectopic pregnancy. The initial ultrasound is indeterminate in 15% to 20% of women with clinical features suggesting ectopic pregnancy.14,15 Dart et al32 developed a subclassification system of indeterminate ultrasound including 5 categories that stratify the risk of ectopic pregnancy (TABLE 3).
Endometrial stripe thickness of dubious value. For patients with an empty uterus on TVUS and a β-hCG level below the discriminatory zone, endometrial stripe thickness may identify an abnormal pregnancy. In a retrospective study of 117 patients with β-hCG levels less than 1500 mIU/mL, stripe thickness <6 mm had a sensitivity of 100% in identifying ectopic pregnancy or miscarriage; at >13 mm, it had a specificity of 100%.33
Two recent studies, however, have called into question the value of stripe thickness in identifying ectopic pregnancy. One suggested it was of little value with β-hCG levels <1500 mIU/mL,34 and the other concluded its predictive value for ectopic pregnancy and the likelihood of obtaining chorionic villi on D&C is confined to β-hCG values at or below 1000 mIU/mL.35
Color-enhanced sonography. The addition of endovaginal color-flow imaging to sonography enables exclusion of ectopic pregnancy by establishing findings consistent with a nonviable intrauterine pregnancy: an intrauterine gestational sac, nonvisualization of an adnexal mass, and absent placental blood flow (sensitivity=95%, specificity=98%).12 Color-flow Doppler imaging shows enhanced blood flow to the affected tube. A cutoff value of 8% change in tubal blood flow has been used to diagnose ectopic pregnancy (sensitivity=85%, specificity=96%).36 In cases where the gestational sac is questionable or absent, color-flow Doppler may expedite diagnosis and possibly identify candidates for expectant or medical management.
When an MRI might help. Magnetic resonance imaging (MRI), in a small study of 37 patients, allowed recognition of tubal wall enhancements and fresh tubal hematoma, and was diagnostic in 21 patients.37 An MRI may be useful when precise and early diagnosis of ectopic pregnancy is imperative, such as pre-existing damage to the contralateral tube where preservation of tubal patency is paramount and when prior TVUS is inconclusive.37
TABLE 3
Detecting ectopic pregnancy with ultrasound and β-hCG levels
| SUBCLASS | β-hCG <1000 mIU/mL, % (95% CI) | β-hCG >1000 mIU/mL, % (95% CI) |
|---|---|---|
| Empty uterus | 17.9 (12.7–24.2) | 6.0 (2.2–12.8) |
| Nonspecific intrauterine fluid* | 12.2 (4.6–25.0) | 1.2 (0.1–5.9) |
| Echogenic intrauterine material | 10.5 (1.8–30.6) | 2.7 (0.5–8.4) |
| Abnormal intrauterine sac† | 0.0 (0.0–39.3) | 0.0 (0.0–3.1) |
| Normal intrauterine sac | 0.0 (0.0–34.8) | 0.0 (0.0–8.4) |
| * Anechoic intrauterine fluid collection >10 mm diameter with no echogenic border. | ||
| † Anechoic intrauterine fluid collection >10 mm diameter with no yolk sac or fetal pole or grossly irregular border. | ||
| Source: Dart et al 2002.32 | ||
A practical evaluation algorithm
Prediction models based on clinical presentation, which classify patients into high-, intermediate-, and low-risk groups, are useful for estimating the risk of ectopic pregnancy in first-trimester patients (FIGURE). Diagnostic pathways incorporating physical findings, quantitative β-hCG levels, and ultrasound results have been developed to manage possible ectopic pregnancy.38,39 A protocol created by Barnhart using β-hCG and TVUS was accurate and safe when applied to women presenting in emergency settings (sensitivity=100%, specificity=99.9%).30 If β-hCG levels were greater than 1500 mIU/mL, ultrasound was performed. Clinically stable patients with β-hCG levels below 1500 mIU/mL were followed with serial β-hCG levels.
A decision model comparing 6 possible diagnostic strategies that combined clinical examination, TVUS, β-hCG, serum progesterone, and D&C showed that TVUS followed by serial serum β-hCGs in those with initial nondiagnostic ultrasound scans was the most accurate and efficient model.40 By using this strategy, all ectopic pregnancies would be detected, fewer than 1 in 100 normal pregnancies would be interrupted, and diagnostic lag would average only 1.46 days.
CORRESPONDENCE
K. Ramakrishnan, MD, Department of Family and Preventive Medicine, University of Oklahoma Health Sciences Center, 900 NE 10th Street, Oklahoma City, OK 73104. E-mail: [email protected]
1. Stovall TG, Kellerman AL, Ling FW, Buster JE. Emergency department diagnosis of ectopic pregnancy. Ann Emerg Med 1990;19:1098-1103.
2. Fylstra DL. Tubal pregnancy: a review of current diagnosis and treatment. Obstet Gynecol Surv 1998;53:320-328.
3. Ankum WM, Mol BW, Van der Veen F, Bossuyt PM. Risk factors for ectopic pregnancy: a meta-analysis. Fertil Steril 1996;65:1093-1099.
4. Mol BW, Ankum WM, Bossuyt PM, Van der Veen F. Contraception and the risk of ectopic pregnancy: a meta-analysis. Contraception 1995;52:337-341.
5. Bouyer J, Coste J, Shojaei T, et al. Risk factors for ectopic pregnancy: a comprehensive analysis based on a large case-control, population-based study in France. Am J Epidemiology 2003;157:185-194.
6. Carr RJ, Evans P. Ectopic pregnancy. Prim Care 2000;27:169-183.
7. Barnhart K, Esposito M, Coutifaris C. An update on the medical treatment of ectopic pregnancy. Obstet Gynecol Clin North Am 2000;27:653-667, viii.
8. Buckley RG, King KJ, Disney JD, Ambroz PK, Gorman JD, Klausen JH. Derivation of a clinical prediction model for the emergency department diagnosis of ectopic pregnancy. Acad Emerg Med 1998;5:951-960.
9. Cacciatore B, Tiitinen A, Stenman U, Ylostalo P. Normal early pregnancy: serum hCG levels and vaginal ultrasonography findings. Br J Obstet Gynecol 1990;97:899-903.
10. Brown DL, Doubilet PM. Transvaginal sonography for diagnosing ectopic pregnancy: positivity criteria and performance characteristics. J Ultrasound Med 1994;13:259-266.
11. Nyberg DA, Hughes MP, Mack LA, Wang KY. Extrauterine findings of ectopic pregnancy at transvaginal US: importance of echogenic fluid. Radiology 1991;178:823-826.
12. Pellerito JS, Taylor KJ, Quedens-Case C, et al. Ectopic pregnancy: evaluation with endovaginal color flow imaging. Radiology 1992;183:407-411.
13. Mol BW, Hajenius PJ, Engelsbel S, et al. Serum human chorionic gonadotropin measurement in the diagnosis of ectopic pregnancy when transvaginal sonography is inconclusive. Fertil Steril 1998;70:972-981.
14. Kaplan BC, Dart RG, Moskos M, et al. Ectopic pregnancy: prospective study with improved diagnostic accuracy. Ann Emerg Med 1996;28:10-17.
15. Braffman BH, Coleman BG, Ramchandani P, et al. Emergency department screening for ectopic pregnancy: a prospective US study. Radiology 1994;190:797-802.
16. Mateer JR, Aiman EJ, Brown MH, Olson DW. Ultrasonographic examination by emergency physicians of patients at risk for ectopic pregnancy. Acad Emerg Med 1995;2:867-873.
17. Dart RG, Mitterando J, Dart LM. Rate of change of serial beta-human chorionic gonadotropin values as a predictor of ectopic pregnancy in patients with indeterminate transvaginal ultrasound findings. Ann Emerg Med 1999;34:703-710.
18. Dart RG, Kaplan B, Varaklis K. Predictive value of history and physical examination in patients with suspected ectopic pregnancy. Ann Emerg Med 1999;33:283-290.
19. Carson SA, Buster JE. Ectopic pregnancy. N Engl J Med 1993;329:1174-1181.
20. Kadar N, Caldwell BV, Romero R. A method of screening for ectopic pregnancy and its indications. Obstet Gynecol 1981;58:162-166.
21. Barnhart KT, Sammel MD, Rinaudo PF, Zhou L, Hummel AC, Guo W. Symptomatic patients with an early viable intrauterine pregnancy: hCG curves redefined. Obstet Gynecol 2004;104:50-55.
22. Kadar N, DeVore G, Romero R. Discriminatory hCG zone: its use in the sonographic evaluation for ectopic pregnancy. Obstet Gynecol 1981;58:156-161.
23. Brennan DF. Ectopic pregnancy—Part I: Clinical and laboratory diagnosis. Acad Emerg Med 1995;2:1081-1089.
24. Mol BWJ, Lijmer JL, Ankum WM, Van der Veen F, Bossuyt PM. The accuracy of single serum progesterone measurement in the diagnosis of ectopic pregnancy: a meta-analysis. Hum Reprod 1998;13:3220-3227.
25. Buckley RG, King KJ, Disney JD, Riffenburgh RH, Gorman JD, Klausen JH. Serum progesterone testing to predict ectopic pregnancy in symptomatic first-trimester patients. Ann Emerg Med 2000;36:95-100.
26. Barnhart KT, Gracia CR, Reindl B, Wheeler JE. Usefulness of pipelle endometrial biopsy in the diagnosis of women at risk for ectopic pregnancy. Am J Obstet Gynecol 2003;188:906-909.
27. Birkhahn RH, Gaeta TJ, Paraschiv D, et al. Serum levels of myoglobin, creatine phosphokinase, and smooth muscle heavy-chain myosin in patients with ectopic pregnancy. Ann Emerg Med 2001;38:628-632.
28. Daniel Y, Geva E, Lerner-Geva L, et al. Levels of vascular endothelial growth factor are elevated in ectopic pregnancy: is this a novel marker? Fertil Steril 1999;72:1013-1017.
29. Bree RL, Edwards M, Bohm-Velez M, Beyler S, Roberts J, Mendelson EB. Transvaginal sonography in the evaluation of normal early pregnancy: correlation with hCG level. AJR Am J Roentgenol 1989;153:75-79.
30. Barnhart K, Mennuti MT, Benjamin I, Jacobson S, Goodman D, Coutifaris C. Prompt diagnosis of ectopic pregnancy in an emergency department setting. Obstet Gynecol 1994;84:1010-1015.
31. Hill LM, Kislak S, Martin JG. Transvaginal sonographic detection of the pseudogestational sac associated with ectopic pregnancy. Obstet Gynecol 1990;75:986-988.
32. Dart R, Burke G, Dart L. Subclassification of indeterminate pelvic ultrasonography: prospective evaluation of the risk of ectopic pregnancy. Ann Emerg Med 2002;39:382-388.
33. Spandorfer SD, Barnhart KT. Endometrial stripe thickness as a predictor of ectopic pregnancy. Fertil Steril 1996;66:474-477.
34. Mol BW, Hajenius PJ, Engelsbel S, et al. Are gestational age and endometrial thickness alternatives for serum human chorionic gonadotropin as criteria for the diagnosis of ectopic pregnancy? Fertil Steril 1999;72:643-645.
35. Dart RG, Dart L, Mitchell P, Berty C. The predictive value of endometrial stripe thickness in patients with suspected ectopic pregnancy who have an empty uterus at ultrasonography. Acad Emerg Med 1999;6:602-608.
36. Kirchler H, Seebacher S, Alge AA, Muller-Holzner E, Fessler S, Kolle D. Early diagnosis of tubal pregnancy: changes in tubal blood flow evaluated by endovaginal color Doppler sonography. Obstet Gynecol 1993;82(4 Pt 1):561-565.
37. Kataoka ML, Togashi K, Kobayashi H, Inoue T, Fujii S, Konishi J. Evaluation of ectopic pregnancy by magnetic resonance imaging. Hum Reprod 1999;14:2644-2650.
38. Cacciatore B, Stenman U, Ylosato P. Diagnosis of ectopic pregnancy by vaginal ultrasonography in combination with a discriminatory serum hCG level of 1000 IU/l (IRP). Br J Obstet Gynecol 1990;97:904-908.
39. Mol BWJ, Van der Veen F, Bossuyt PM. Implementation of probabilistic decision rules improves the predictive values of algorithms in the diagnostic management of ectopic pregnancy. Hum Reprod 1999;14:2855-2862.
40. Gracia CR, Barnhart KT. Diagnosing ectopic pregnancy: decision analysis comparing six strategies. Obstet Gynecol 2001;97:464-470.
- Less than half of the patients with ectopic pregnancy present with the classic triad of a history of amenorrhea, abdominal pain, and irregular vaginal bleeding (C).
- Definite cervical motion tenderness and peritoneal signs are the most sensitive and specific examination findings for ectopic pregnancy—91% and 95%, respectively (A).
- Beta-human chorionic gonadotropin (β-hCG) levels can be used in combination with ultrasound findings to improve the accuracy of the diagnosis of ectopic pregnancy (A).
- Women with initial nondiagnostic transvaginal ultrasound should be followed with serial β-hCGs (B).
Despite advanced detection methods, ectopic pregnancy may be missed in 40% to 50% of patients on an initial visit.1 Most women with ectopic pregnancy have no risk factors (TABLE 1),2-5 and the classic triad of a history of amenorrhea, abdominal pain, and irregular vaginal bleeding is absent in more than half of cases.
Early diagnosis not only decreases maternal mortality and morbidity; it also helps preserve future reproductive capacity—only one third of women with ectopic pregnancy have subsequent live births.2
Management strategies for patients with ectopic pregnancy have evolved rapidly, with ambulatory medical therapy becoming an option for more patients.6 Using a practical decision protocol, we discuss the physical findings that most reliably suggest ectopic pregnancy, describe sensible use of laboratory and imaging studies, and explain what to do when results are equivocal. In part 2 of this article (coming in the June 2006 Journal of Family Practice), we provide a decision protocol for management of ectopic pregnancy.
TABLE 1
Risk factors for ectopic pregnancy
| DEGREE OF RISK | FACTOR | ODDS RATIO (95% CONFIDENCE INTERVALS) | ||
|---|---|---|---|---|
| ANKUM ET AL3 | MOL ET AL4 | BOUYER ET AL5 | ||
| High | Previous tubal surgery | 21 (9.3–47) | 4.0 (2.6–6.1) | |
| Tubal ligation | 9.3 (4.9–18) | |||
| Previous ectopic pregnancy | 8.3 (6.0–11.5) | |||
| In utero DES exposure | 5.6 (2.4–13) | |||
| Current IUD use | 4.2–45* | |||
| Tubal pathology/abnormality | 3.5–25* | |||
| Moderate | Infertility | 2.5–21* | 2.7 (1.8–4.2) | |
| History of PID | 2.5 (2.1–3.0) | 3.4 (2.4–5.0) | ||
| Previous chlamydial or gonococcal infection | 2.8–3.7* | |||
| Current smoking | 2.3 (2.0–2.8) | 3.9 (2.6–5.9) | ||
| Spontaneous abortions ≥3 | 3.0 (1.3–6.9) | |||
| Induced abortions (medical±surgical) | 2.8 (1.1–7.2) | |||
| Lifetime sexual partners >1 | 2.1 (1.4–4.8) | |||
| Low | Age first intercourse <18 years | 1.6 (1.1–2.5) | ||
| Previous pelvic/abdominal surgery | 0.93–3.8* | |||
| Vaginal douching | 1.1–3.1* | |||
| DES, diethylstilbestrol; PID, pelvic inflammatory disease; IUD, intrauterine device | ||||
| * Range; summary odds ratio not calculated owing to significant heterogeneity between studies. | ||||
Evaluation
Clinical features of ectopic pregnancy highly variable
No single clinical feature accurately indicates ectopic pregnancy. Less than half of women with ectopic pregnancy exhibit the classic triad of a history of amenorrhea, abdominal pain, and irregular vaginal bleeding.1 And, unfortunately, these features are seen commonly in patients with both viable (50%) and nonviable (25%) intrauterine pregnancies, as well as in threatened abortion, cervical irritation, infection, and trauma.7
Set a low threshold for suspicion. For any woman of childbearing age with abdominal pain and vaginal bleeding, consider pregnancy and take steps to rule out ectopic pregnancy. Abdominal pain and vaginal bleeding are highly sensitive for ectopic pregnancy but are not specific for the disorder (TABLE 2).8-17 Pain located in the hypogastrium or iliac fossa may be mild to severe. Vaginal bleeding, present in 50% to 80% of patients with ectopic pregnancy, can be mistaken for a normal menstrual period.2,6 Pregnancy-associated symptoms of nausea and vomiting, breast tenderness, and fatigue may be present.
Lower abdominal and adnexal tenderness can be elicited in most women with ectopic pregnancy. Cervical motion tenderness, peritoneal signs, and adnexal masses are most specific for ectopic pregnancy, but are not sensitive.8 An adnexal mass is palpable in less than 10% of cases; when it is detected, one third of patients will have a contralateral ectopic pregnancy on ultrasonography.18 Symptoms of hemodynamic compromise (orthostasis, hypotension, shock) are becoming uncommon with earlier diagnosis of ectopic pregnancy, facilitated by improved detection methods.
TABLE 2
Significance of features associated with ectopic pregnancy
| FEATURES | SN (%) | SP (%) | LR+ | LR– |
|---|---|---|---|---|
| Clinical features8 | ||||
| Any risk factors | 23 | 83 | 1.4 | 0.9 |
| Estimated gestational age <70 days | 95 | 27 | 1.3 | 0.2 |
| Vaginal bleeding | 69 | 26 | 0.9 | 1.2 |
| Abdominal pain | 97 | 15 | 1.1 | 0.2 |
| Abdominal tenderness | 85 | 50 | 1.7 | 0.3 |
| Peritoneal signs | 23 | 95 | 4.6 | 0.8 |
| Cervical motion tenderness | 33 | 91 | 3.7 | 0.7 |
| Adnexal tenderness | 69 | 62 | 1.8 | 0.5 |
| Adnexal mass | 5 | 96 | 1.3 | 1.0 |
| Transvaginal ultrasound | ||||
| No intrauterine gestational sac9 | 100 | 89 | 9.1 | <0.1 |
| Adnexal mass10 | ||||
| Separate from ovary | 93 | 99 | 93 | 0.1 |
| Cardiac activity | 20 | 100 | ∞ | 0.8 |
| Yolk sac or embryo | 37 | 100 | ∞ | 0.6 |
| Tubal ring/yolk sac or embryo | 65 | 99 | 65 | 0.4 |
| Fluid in pouch of Douglas11 | ||||
| Any | 63 | 69 | 2.0 | 0.5 |
| Echogenic | 56 | 96 | 14.0 | 0.5 |
| Color-flow Doppler12 | 95 | 98 | 47.5 | 0.1 |
| β-hCG combined with transvaginal ultrasound | ||||
| Empty uterus | ||||
| ≥1000 mIU/mL10,13,14 | 43–96 | 86–100 | 3.0–∞ | 0.04–0.66 |
| ≥1500 mIU/mL13,15 | 40–99 | 84–96 | 6.3–9.9 | 0.01–0.63 |
| ≥2000 mIU/mL13,16 | 38–48 | 80–98 | 2.3–25.3 | 0.63–0.68 |
| Adnexal mass* | ||||
| ≥1000 mIU/mL13 | 73 | 85 | 4.7 | 0.32 |
| ≥1500 mIU/mL13,15 | 46–64 | 92–96 | 5.9–16.5 | 0.38–0.58 |
| ≥2000 mIU/mL13 | 55 | 96 | 14.2 | 0.47 |
| β-hCG rise in 48 hours (empty uterus)† | ||||
| >66%17 | — | — | 1.1 | — |
| <66%17 | — | — | 7.4 | — |
| >50%13 | — | — | 2.8 | — |
| <50%13 | — | — | 3.3 | — |
| β-hCG fall in 48 hours (empty uterus)† | ||||
| >50%13,17 | — | — | 0.8–1.4 | — |
| <50%13,17 | — | — | 0–0.1 | — |
| * Mass or fluid in cul de sac for β-hCG ≥1500 mIU/mL and ≥2000 mIU/mL. | ||||
| † Strata-specific likelihood ratios reported, sensitivity and specificity not applicable. | ||||
| Sn, sensitivity; Sp, specificity; LR, likelihood ratio; β-hCG, beta-human chorionic gonadotropin. | ||||
Laboratory tests
In an early normal pregnancy, the beta-human chorionic gonadotropin (β-hCG) level doubles every 1.8 to 3 days, rising to 1000 mIU/mL IRP (International Reference Preparation, measured by radioimmunoassay) by 5 weeks, to 2500 mIU/mL by 6 weeks, and to 13,000 mIU/mL (±3000) by 7 weeks. A single quantitative β-hCG level is not always helpful, as it can range from less than 100 mIU/mL to greater than 50,000 mIU/mL with both ruptured and unruptured ectopic pregnancies.19
Rethinking the rate of rise in β-hCG. The oft-quoted maxim that ectopic pregnancy or impending miscarriage is associated with a rise in β-hCG of less than 66% in 48 hours arose from a 1981 study that included only 20 women and that was based on an 85% confidence interval (CI).20 A recent study of 287 women suggests that the minimal expected rise in 2 days for a viable intrauterine pregnancy (based on a 99% CI) should be at least 53%.21
Combining β-hCG levels and ultrasound findings to improve diagnosis. Because the exact gestational age is often unknown in women presenting with features of ectopic pregnancy, the β-hCG level is used to determine whether a gestational sac can be identified on ultrasound. With a β-hCG level of 6500 mIU/mL, a gestational sac should be visible on abdominal ultrasound in the uterus of a woman with an intrauterine pregnancy; the sac should be absent in ectopic pregnancy. This β-hCG level is designated the discriminatory zone.22
With a high-resolution transvaginal ultrasound (TVUS), the gestational sac of a normal single intrauterine pregnancy should be visible at a β-hCG level above 1000–1500 mIU/mL, depending on equipment and technical expertise.2,7 In multiple gestations the discriminatory zone is observed to be above 2300 mIU/mL.2 Various ultrasonography findings have been combined with β-hCG levels to more accurately diagnose ectopic pregnancy (TABLE 2 and FIGURE).
Serial β-hCG measurements. If TVUS findings are indeterminate, serial measurements of β-hCG levels at 48-hour intervals may be useful in managing suspected ectopic pregnancy. Dart et al17 found that a rise in β-hCG level of 66% or more was usually associated with a viable intrauterine pregnancy, though 22% of women in that study had an ectopic pregnancy. Mol et al13 found similar results using a cutoff of a β-hCG level rise of 50% or more; 35% had an ectopic pregnancy. Increases in the β-hCG level less than these cutoffs almost always indicated an abnormal pregnancy, and about half of these women had an ectopic pregnancy.13,17 Also a fall in the β-hCG level by less than 50% was almost always associated with an abnormal pregnancy, but only 19% of these women had an ectopic pregnancy. 13,17 Alternatively, decreases in β-hCG level of greater than 50% reduced the chance that patients had an ectopic pregnancy to less than 3%.13,17
Ectopic pregnancy is defined as the implantation of the fertilized egg that occurs outside the uterine cavity. It is practically synonymous with tubal pregnancy, as 97% occur in the Fallopian tube.6,23 Ectopic pregnancy occurs in 2% of all pregnancies in the United States, affecting more than 100,000 patients each year. It is a leading cause of pregnancy-related death in the first trimester,2 with a yearly monetary impact of greater than 1 billion dollars. The incidence has increased almost six-fold since 1970 due to delayed child-bearing, rising prevalence of sexually transmitted diseases, and sterilization procedures.6
FIGURE
Diagnostic protocol with high sensitivity and specificity for ectopic pregnancy
* Other than midline suprapubic cramping.
† Risk may be higher in presence of these factors: previous EP, tubal surgery, tubal disease detected by hysterosalpingogram or laproscopy, diethylstilbestrol exposure, sterilization, intrauterine device.
‡ Progesterone is useful only when TVUS is indeterminate.
§ β-hCG level for criterion should be based on local values at which IUP visible on TVUS.
|| TVUS should be repeated when β-hCG has risen above the discrimination zone.
¶ Only 2/170 patients in this category had EP; therefore, D&C is safe but may not be cost-effective.11
β-hCG, beta-human chorionic gonadotropin; EP, ectopic pregnancy; TVUS, transvaginal ultrasound; OB/GYN, obstetrician/gynecologist;
IUP, intrauterine pregnancy; D&C, dilation and curettage.
Serum progesterone levels may have limited usefulness. Serum progesterone measurements are not considered accurate enough to diagnose ectopic pregnancy.24 However, progesterone levels may be helpful if they are either very high or very low. Levels less than 22 ng/mL have a sensitivity of 100% for ectopic pregnancy.25 Only 5 of 1615 patients (0.3%) in 13 studies with progesterone levels below 5 ng/mL had a viable intrauterine pregnancy.24 By establishing the low likelihood of a viable intrauterine pregnancy, serum progesterone measurements may also be useful when β-hCG levels have reached 1000–1500 mIU/mL and the TVUS is equivocal.25
When D&C may help. Dilation and curettage (D&C) is an option for patients with an indeterminate ultrasound result and progesterone levels less than 5 ng/mL, as it can rule out an ectopic pregnancy with only a small chance of interrupting a viable intrauterine pregnancy. The presence of chorionic villi rules out an ectopic pregnancy. In the absence of villi, if β-hCG levels subsequently plateau or increase, it is presumptive of ectopic pregnancy. Chorionic villous sampling by pipelle curette has both insufficient sensitivity and predictive value in diagnosing ectopic pregnancy, and should not be considered a substitute for D&C.26
Other tests that have limited use. Patients with ectopic pregnancy may have elevated serum markers of smooth muscle destruction such as creatinine phosphokinase (CPK), myoglobin, and smooth muscle heavy-chain myosin (SMHC). However, these tests are of limited value in diagnosing ectopic pregnancy.27 SMHC may be of use in evaluating pregnancies less than 5 weeks’ gestation when the TVUS is not diagnostic. Serum vascular endothelial growth factor is another marker elevated in women with ectopic pregnancy; levels greater than 200 pg/mL distinguish ectopic pregnancy from intrauterine pregnancy (sensitivity=60%, specificity=90%).28
Imaging
In normal pregnancies, a gestational sac is seen on TVUS between 4 and 5 weeks’ gestation;29 the yolk sac is visible at around 6 weeks; and an embryo can be detected between 6 and 7 weeks. A gestational sac greater than 10 mm in diameter without a yolk sac, or greater than 25 mm without an embryo, indicates an abnormal regnancy.9,29 Presence of an intrauterine pregnancy on ultrasound effectively rules out ectopic pregnancy because heterotopic pregnancy is rare (1 in 2600–30,000 pregnancies).30 Hormonal changes associated with pregnancy result in a uterine endometrial fluid collection (pseudo-sac) in 8% of ectopic pregnancies.31
Specific diagnostic finding for ectopic pregnancy. A gestational sac visible on ultrasound with a yolk sac or fetal pole outside the endometrial cavity (TABLE 2) is diagnostic of ectopic pregnancy. The initial ultrasound is indeterminate in 15% to 20% of women with clinical features suggesting ectopic pregnancy.14,15 Dart et al32 developed a subclassification system of indeterminate ultrasound including 5 categories that stratify the risk of ectopic pregnancy (TABLE 3).
Endometrial stripe thickness of dubious value. For patients with an empty uterus on TVUS and a β-hCG level below the discriminatory zone, endometrial stripe thickness may identify an abnormal pregnancy. In a retrospective study of 117 patients with β-hCG levels less than 1500 mIU/mL, stripe thickness <6 mm had a sensitivity of 100% in identifying ectopic pregnancy or miscarriage; at >13 mm, it had a specificity of 100%.33
Two recent studies, however, have called into question the value of stripe thickness in identifying ectopic pregnancy. One suggested it was of little value with β-hCG levels <1500 mIU/mL,34 and the other concluded its predictive value for ectopic pregnancy and the likelihood of obtaining chorionic villi on D&C is confined to β-hCG values at or below 1000 mIU/mL.35
Color-enhanced sonography. The addition of endovaginal color-flow imaging to sonography enables exclusion of ectopic pregnancy by establishing findings consistent with a nonviable intrauterine pregnancy: an intrauterine gestational sac, nonvisualization of an adnexal mass, and absent placental blood flow (sensitivity=95%, specificity=98%).12 Color-flow Doppler imaging shows enhanced blood flow to the affected tube. A cutoff value of 8% change in tubal blood flow has been used to diagnose ectopic pregnancy (sensitivity=85%, specificity=96%).36 In cases where the gestational sac is questionable or absent, color-flow Doppler may expedite diagnosis and possibly identify candidates for expectant or medical management.
When an MRI might help. Magnetic resonance imaging (MRI), in a small study of 37 patients, allowed recognition of tubal wall enhancements and fresh tubal hematoma, and was diagnostic in 21 patients.37 An MRI may be useful when precise and early diagnosis of ectopic pregnancy is imperative, such as pre-existing damage to the contralateral tube where preservation of tubal patency is paramount and when prior TVUS is inconclusive.37
TABLE 3
Detecting ectopic pregnancy with ultrasound and β-hCG levels
| SUBCLASS | β-hCG <1000 mIU/mL, % (95% CI) | β-hCG >1000 mIU/mL, % (95% CI) |
|---|---|---|
| Empty uterus | 17.9 (12.7–24.2) | 6.0 (2.2–12.8) |
| Nonspecific intrauterine fluid* | 12.2 (4.6–25.0) | 1.2 (0.1–5.9) |
| Echogenic intrauterine material | 10.5 (1.8–30.6) | 2.7 (0.5–8.4) |
| Abnormal intrauterine sac† | 0.0 (0.0–39.3) | 0.0 (0.0–3.1) |
| Normal intrauterine sac | 0.0 (0.0–34.8) | 0.0 (0.0–8.4) |
| * Anechoic intrauterine fluid collection >10 mm diameter with no echogenic border. | ||
| † Anechoic intrauterine fluid collection >10 mm diameter with no yolk sac or fetal pole or grossly irregular border. | ||
| Source: Dart et al 2002.32 | ||
A practical evaluation algorithm
Prediction models based on clinical presentation, which classify patients into high-, intermediate-, and low-risk groups, are useful for estimating the risk of ectopic pregnancy in first-trimester patients (FIGURE). Diagnostic pathways incorporating physical findings, quantitative β-hCG levels, and ultrasound results have been developed to manage possible ectopic pregnancy.38,39 A protocol created by Barnhart using β-hCG and TVUS was accurate and safe when applied to women presenting in emergency settings (sensitivity=100%, specificity=99.9%).30 If β-hCG levels were greater than 1500 mIU/mL, ultrasound was performed. Clinically stable patients with β-hCG levels below 1500 mIU/mL were followed with serial β-hCG levels.
A decision model comparing 6 possible diagnostic strategies that combined clinical examination, TVUS, β-hCG, serum progesterone, and D&C showed that TVUS followed by serial serum β-hCGs in those with initial nondiagnostic ultrasound scans was the most accurate and efficient model.40 By using this strategy, all ectopic pregnancies would be detected, fewer than 1 in 100 normal pregnancies would be interrupted, and diagnostic lag would average only 1.46 days.
CORRESPONDENCE
K. Ramakrishnan, MD, Department of Family and Preventive Medicine, University of Oklahoma Health Sciences Center, 900 NE 10th Street, Oklahoma City, OK 73104. E-mail: [email protected]
1. Stovall TG, Kellerman AL, Ling FW, Buster JE. Emergency department diagnosis of ectopic pregnancy. Ann Emerg Med 1990;19:1098-1103.
2. Fylstra DL. Tubal pregnancy: a review of current diagnosis and treatment. Obstet Gynecol Surv 1998;53:320-328.
3. Ankum WM, Mol BW, Van der Veen F, Bossuyt PM. Risk factors for ectopic pregnancy: a meta-analysis. Fertil Steril 1996;65:1093-1099.
4. Mol BW, Ankum WM, Bossuyt PM, Van der Veen F. Contraception and the risk of ectopic pregnancy: a meta-analysis. Contraception 1995;52:337-341.
5. Bouyer J, Coste J, Shojaei T, et al. Risk factors for ectopic pregnancy: a comprehensive analysis based on a large case-control, population-based study in France. Am J Epidemiology 2003;157:185-194.
6. Carr RJ, Evans P. Ectopic pregnancy. Prim Care 2000;27:169-183.
7. Barnhart K, Esposito M, Coutifaris C. An update on the medical treatment of ectopic pregnancy. Obstet Gynecol Clin North Am 2000;27:653-667, viii.
8. Buckley RG, King KJ, Disney JD, Ambroz PK, Gorman JD, Klausen JH. Derivation of a clinical prediction model for the emergency department diagnosis of ectopic pregnancy. Acad Emerg Med 1998;5:951-960.
9. Cacciatore B, Tiitinen A, Stenman U, Ylostalo P. Normal early pregnancy: serum hCG levels and vaginal ultrasonography findings. Br J Obstet Gynecol 1990;97:899-903.
10. Brown DL, Doubilet PM. Transvaginal sonography for diagnosing ectopic pregnancy: positivity criteria and performance characteristics. J Ultrasound Med 1994;13:259-266.
11. Nyberg DA, Hughes MP, Mack LA, Wang KY. Extrauterine findings of ectopic pregnancy at transvaginal US: importance of echogenic fluid. Radiology 1991;178:823-826.
12. Pellerito JS, Taylor KJ, Quedens-Case C, et al. Ectopic pregnancy: evaluation with endovaginal color flow imaging. Radiology 1992;183:407-411.
13. Mol BW, Hajenius PJ, Engelsbel S, et al. Serum human chorionic gonadotropin measurement in the diagnosis of ectopic pregnancy when transvaginal sonography is inconclusive. Fertil Steril 1998;70:972-981.
14. Kaplan BC, Dart RG, Moskos M, et al. Ectopic pregnancy: prospective study with improved diagnostic accuracy. Ann Emerg Med 1996;28:10-17.
15. Braffman BH, Coleman BG, Ramchandani P, et al. Emergency department screening for ectopic pregnancy: a prospective US study. Radiology 1994;190:797-802.
16. Mateer JR, Aiman EJ, Brown MH, Olson DW. Ultrasonographic examination by emergency physicians of patients at risk for ectopic pregnancy. Acad Emerg Med 1995;2:867-873.
17. Dart RG, Mitterando J, Dart LM. Rate of change of serial beta-human chorionic gonadotropin values as a predictor of ectopic pregnancy in patients with indeterminate transvaginal ultrasound findings. Ann Emerg Med 1999;34:703-710.
18. Dart RG, Kaplan B, Varaklis K. Predictive value of history and physical examination in patients with suspected ectopic pregnancy. Ann Emerg Med 1999;33:283-290.
19. Carson SA, Buster JE. Ectopic pregnancy. N Engl J Med 1993;329:1174-1181.
20. Kadar N, Caldwell BV, Romero R. A method of screening for ectopic pregnancy and its indications. Obstet Gynecol 1981;58:162-166.
21. Barnhart KT, Sammel MD, Rinaudo PF, Zhou L, Hummel AC, Guo W. Symptomatic patients with an early viable intrauterine pregnancy: hCG curves redefined. Obstet Gynecol 2004;104:50-55.
22. Kadar N, DeVore G, Romero R. Discriminatory hCG zone: its use in the sonographic evaluation for ectopic pregnancy. Obstet Gynecol 1981;58:156-161.
23. Brennan DF. Ectopic pregnancy—Part I: Clinical and laboratory diagnosis. Acad Emerg Med 1995;2:1081-1089.
24. Mol BWJ, Lijmer JL, Ankum WM, Van der Veen F, Bossuyt PM. The accuracy of single serum progesterone measurement in the diagnosis of ectopic pregnancy: a meta-analysis. Hum Reprod 1998;13:3220-3227.
25. Buckley RG, King KJ, Disney JD, Riffenburgh RH, Gorman JD, Klausen JH. Serum progesterone testing to predict ectopic pregnancy in symptomatic first-trimester patients. Ann Emerg Med 2000;36:95-100.
26. Barnhart KT, Gracia CR, Reindl B, Wheeler JE. Usefulness of pipelle endometrial biopsy in the diagnosis of women at risk for ectopic pregnancy. Am J Obstet Gynecol 2003;188:906-909.
27. Birkhahn RH, Gaeta TJ, Paraschiv D, et al. Serum levels of myoglobin, creatine phosphokinase, and smooth muscle heavy-chain myosin in patients with ectopic pregnancy. Ann Emerg Med 2001;38:628-632.
28. Daniel Y, Geva E, Lerner-Geva L, et al. Levels of vascular endothelial growth factor are elevated in ectopic pregnancy: is this a novel marker? Fertil Steril 1999;72:1013-1017.
29. Bree RL, Edwards M, Bohm-Velez M, Beyler S, Roberts J, Mendelson EB. Transvaginal sonography in the evaluation of normal early pregnancy: correlation with hCG level. AJR Am J Roentgenol 1989;153:75-79.
30. Barnhart K, Mennuti MT, Benjamin I, Jacobson S, Goodman D, Coutifaris C. Prompt diagnosis of ectopic pregnancy in an emergency department setting. Obstet Gynecol 1994;84:1010-1015.
31. Hill LM, Kislak S, Martin JG. Transvaginal sonographic detection of the pseudogestational sac associated with ectopic pregnancy. Obstet Gynecol 1990;75:986-988.
32. Dart R, Burke G, Dart L. Subclassification of indeterminate pelvic ultrasonography: prospective evaluation of the risk of ectopic pregnancy. Ann Emerg Med 2002;39:382-388.
33. Spandorfer SD, Barnhart KT. Endometrial stripe thickness as a predictor of ectopic pregnancy. Fertil Steril 1996;66:474-477.
34. Mol BW, Hajenius PJ, Engelsbel S, et al. Are gestational age and endometrial thickness alternatives for serum human chorionic gonadotropin as criteria for the diagnosis of ectopic pregnancy? Fertil Steril 1999;72:643-645.
35. Dart RG, Dart L, Mitchell P, Berty C. The predictive value of endometrial stripe thickness in patients with suspected ectopic pregnancy who have an empty uterus at ultrasonography. Acad Emerg Med 1999;6:602-608.
36. Kirchler H, Seebacher S, Alge AA, Muller-Holzner E, Fessler S, Kolle D. Early diagnosis of tubal pregnancy: changes in tubal blood flow evaluated by endovaginal color Doppler sonography. Obstet Gynecol 1993;82(4 Pt 1):561-565.
37. Kataoka ML, Togashi K, Kobayashi H, Inoue T, Fujii S, Konishi J. Evaluation of ectopic pregnancy by magnetic resonance imaging. Hum Reprod 1999;14:2644-2650.
38. Cacciatore B, Stenman U, Ylosato P. Diagnosis of ectopic pregnancy by vaginal ultrasonography in combination with a discriminatory serum hCG level of 1000 IU/l (IRP). Br J Obstet Gynecol 1990;97:904-908.
39. Mol BWJ, Van der Veen F, Bossuyt PM. Implementation of probabilistic decision rules improves the predictive values of algorithms in the diagnostic management of ectopic pregnancy. Hum Reprod 1999;14:2855-2862.
40. Gracia CR, Barnhart KT. Diagnosing ectopic pregnancy: decision analysis comparing six strategies. Obstet Gynecol 2001;97:464-470.
Obsessive-compulsive disorder: Strategies for using CBT and pharmacotherapy
- Cognitive-behavioral therapy with exposure and response-prevention is effective for the treatment of obsessive-compulsive disorder (OCD) in both children and adults (A).
- Numerous medications are effective options for the treatment of OCD in adults, including serotonergic agents (clomipramine, citalopram, fluoxetine, sertraline, paroxetine, fluvoxamine) (A). Only clomipramine, fluoxetine, fluvoxamine, and sertraline have been approved by the Food and Drug Administration for use in youths (A).
Note: this article is a continuation of “Obsessive-compulsive disorder: Tools for recognizing its many expressions,” in the March 2006 issue of JFP.
Evidence supports 2 forms of treatment for adults and children with obsessive-compulsive disorder (OCD): cognitive-behavioral therapy (CBT) with exposure and response prevention (E/RP), and psychopharmacologic treatment with serotonin reuptake inhibitors (SRIs).
OCD Expert Consensus Guidelines strongly recommend exposure-based CBT, alone or with pharmacotherapy, as the first-line treatment.1 However, approximately 25% of persons with OCD wish not to participate in CBT for varying reasons (eg, limited insight, difficulty engaging in exposures), thus making medication alone the initial choice of treatment. In many cases, thankfully, patients whose symptoms decrease with medication become willing to participate in CBT.
Cognitive-behavioral therapy the preferred route
A large database supports the efficacy of CBT with E/RP in treating OCD. Methodologically rigorous controlled trials of CBT in adults and children have reported success rates reaching 85% (SOR: A).2,3 One qualifier of success: though most patients respond positively to CBT, symptoms often remain and true cure or complete remission is often not possible.
CBT is unlike other psychotherapies. Unfortunately, the number of qualified mental health professionals trained in CBT for OCD is limited,4 as is general knowledge about this approach. The Obsessive-Compulsive Foundation estimates that 5 million Americans with OCD lack access to behavioral therapy.5 Many of the patients we see in our clinic have participated in psychodynamic or traditional “talk therapies” that are supported by little evidence. Such approaches have a strength of recommendation (SOR) of C. As a result, many afflicted individuals receive only partial treatment that consists of either non-CBT psychotherapy or medication.
Preparing the way for your patient
Before referring a patient for CBT, ask about the practitioner’s level of training (PhD or PsyD are preferable), theoretical approach (cognitive behavioral vs others, such as psychodynamic or humanistic), and experience in working with OCD patients. Perhaps the most important question to ask a clinician is, “Will you expose the patient to situations that provoke rituals while having him/her refrain from engaging in them?”
What your patients can expect. CBT is a form of psychological treatment explicitly based on learning and cognitive principles. Twelve to 16 sessions are typical, though the function of each individual will determine the duration of treatment.2 Treatment may be stopped if significant symptom reduction has lasted for at least 4 consecutive weeks. Thereafter, periodic booster sessions are helpful to maintain gains and prevent relapse.1
The 3 central aspects of CBT therapy for OCD:
- Exposure—placing the patient in situations that elicit anxiety related to their obsessions
- Response prevention—deterring the ritualistic or compulsive behaviors that may serve to reduce or avoid anxiety
- Cognitive therapy—training the patient to identify and reframe anxiety-provoking cognitions.
Exposure—very simply, having the patient face their fear—reduces anxiety responses.
Response prevention involves encouraging the patient to refrain from engaging in repetitive, time-consuming compulsions. This component is based on the notion that rituals serve to reduce anxiety and are thus reinforcing. Naturally, E/RP is quite anxiety-provoking for patients. As a result, it may be useful to inform them that feared situations will be approached in a hierarchical manner, starting with easier items before moving to more difficult ones. Successful completion of E/RP tasks teaches patients that the feared consequences of not ritualizing are not going to occur.
Cognitive therapy takes into account that patients with OCD have characteristic thoughts believed to contribute to the development and maintenance of their condition. Specifically, common themes within this population include distorted appraisals of risk (eg, “The chance of burning the house down with an extinguished cigarette is 25%”), an inflated sense of responsibility for harm (eg, “If I do not touch this rock, my mother will get cancer”), and pathologic levels of self-doubt (eg, “I know the odds of contracting HIV from using a public toilet are slim, but I can’t be sure I will not”). OCD in adults has also been related to the concept of thought–action fusion, in which negative thoughts and actions are seen as synonymous.6 Such maladaptive cognitive processes often motivate compulsive behavior and make patients with OCD less able to cope with negative thoughts.7 The cognitive component of CBT addresses these issues and teaches patients ways to mend their thinking.
Enlist the family. Finally, family involvement is often central to the success of CBT. Family members may accommodate the patient’s symptoms by facilitating avoidance, assisting with ritualistic behaviors, or inadvertently facilitating the development of the disorder by participating in rituals (eg, providing reassurance, allowing compulsive avoidance of feared stimuli, and tolerating delays associated with ritual completion). Given this, CBT often includes the patient’s spouse, parents, and significant others.
Pharmacotherapy
Malfunction in the serotonin neurotransmitter system is thought to be the physiologic basis of OCD.8,9 More specifically, OCD patients are believed to have a lower level of serotonin in neural synapses than healthy persons. Given this, seretonergic agents, such as clomipramine (Anafranil), citalopram (Celexa), fluoxetine (Prozac), sertraline (Zoloft), paroxetine (Paxil), and fluvoxamine (Luvox) have been used extensively to treat OCD in both adults and youths (SOR: A). The Food and Drug Administration (FDA) has approved only clomipramine, fluoxetine, fluvoxamine, and sertraline for use in youth. Each receives an SOR of A.
Clomipramine: once first choice, now a backup
Until recently, clomipramine—a tricyclic antidepressant—was the most widely prescribed medication for OCD, given its record of providing the greatest and most reliable symptom reduction.10 The efficacy of clomipramine, which has strong seretonergic properties, has not been replicated with other tricyclic antidepressants (eg, desipramine [Norpramin, Pertofrane]) that more directly target other neurotransmitter systems (serotonin, norepinephrine, and dopamine).11 However, clomipramine, like other tricyclic antidepressants, can cause tachycardia, prolongation of QT interval, and other unpleasant side effects (eg, orthostatic hypotension, constipation, and dry mouth are common). As a result, its use is indicated in cases where the patient does not respond to alternative medications.
SSRIs now favored
Given clomipramine’s side effects, selective serotonin reuptake inhibitors (SSRIs), a class of SRIs, have emerged as the first-line medication.12 For patients who need medication, first consider prescribing an SSRI first.
SSRIs, however, are not without side effects. During the initial phase of treatment, nausea, exacerbations of anxiety, jitteriness, and insomnia are experienced by approximately 35% of patients and may persist over the duration of treatment. These side effects may be limited by slow-dose titration. With fluoxetine, for example, start at 20 mg and gradually increase the dose over several weeks to the usual target dose of 40 to 60 mg.
Some patients require even lower initial doses and more prolonged titration. Extended SSRI treatment has been linked to sexual dysfunction, headache, asthenia, and sweating in 25% to 35% of patients.13
Multiple large-scale controlled trials have demonstrated the efficacy and tolerability of SSRIs for adults and youths.13,14 About 40% to 55% of patients generally report significant symptom reduction after 12 weeks. However, typical symptom reduction in clinical practice averages only 20% to 50%, and many patients experience residual symptoms after treatment has stopped.
Course of pharmacotherapy
SSRIs should be gradually titrated. The TABLE displays dosing of commonly used SSRIs in adults with OCD. A 12-week trial of an adequate dosage is the standard of care before considering alternative therapies.9 Initial response to medications may take 6 to 8 weeks, although the maximal response may take up to 20 weeks. Continue medications for 1 year after achieving a therapeutic response and slowly taper thereafter. Evidence suggests that ongoing CBT may be one method to prevent relapse when discontinuing medication.15 Most patients do not fully remit on medication treatment alone, and as many as 60% do not have a substantial reduction of symptoms.16
TABLE
SRI dosing guidelines recommended by the Expert Consensus Panel (1997)
| SRI | INITIAL DOSE/INCREMENT FOR INCREASES* | USUAL TARGET DOSE* | MAXIMUM DOSE* | SOR |
|---|---|---|---|---|
| Clomipramine | 10–25 mg/d | 100–250 mg/d | 250 mg/d | A |
| Fluoxetine | 20 mg/d | 40–60 mg/d | 80 mg/d | A |
| Fluvoxamine | 50 mg/d | 200 mg/d | 300 mg/d | A |
| Paroxetine | 10–20 mg/d | 50 mg/d | 60 mg/d | A |
| Sertraline | 50 mg/d | 150 mg/d | 225 mg/d | A |
For cost-effectiveness, CBT still comes out on top
It is suggested that patients continue medication consistently for 2 years before deciding to stop.9 Medication would therefore be expected to cost more over the long-term than CBT, given the time-limited nature and durability of the latter.3 To date, several trials have examined the relative efficacy of pharmacotherapy alone versus its combination with CBT. In general, results suggest that CBT alone or in combination with pharmacotherapy (an SRI) is the treatment of choice.1,17
CBT plus medication often the better way to go
Given that many patients do not respond adequately to medication alone, augmentation strategies are often necessary. As CBT is considered the most effective approach, this therapy should always be used, particularly when a patient has proven refractory with pharmacological approaches. In cases that are unresponsive to multiple SSRIs and CBT, consider such second-line pharmacological treatments as serotonergic or dopaminergic agents, or adding a second first-line agent.13
Dopaminergic augmentation with drugs such as risperidone (Risperdal) or haloperidol (Haldol), and olanzapine (Zyprexa) have been fairly extensively studied. This approach, which consists of adding a medication that affects the dopaminergic system to the ongoing SSRI, has been well-supported.18 However, it is unclear as to how long to continue treatment as many patients relapse upon discontinuation and the antipsychotics are linked to undesirable side effects such as sedation, weight gain, or (particularly with higher doses of risperidone) extrapyramidal effects.
Strategies for adding a second serotonergic medication include switching to a new agent or adding another. Indeed, many patients with an inadequate response to one SSRI may have a favorable response to another.10
Prognosis
Left untreated, the course of obsessive-compulsive disorder is chronic and unremitting, with symptoms generally fluctuating over time due to stress-induced exacerbations of symptoms.19 Children with this disorder remain at higher risk for other psychiatric problems into adulthood,20,21 and adults frequently display additional symptoms as well. Comorbidity with Major Depressive Disorder is particularly common in both children and adults, as are ADHD and other anxiety, mood, and tic disorders.22-24 Symptoms also disrupt family, social, academic, and occupational functioning.25-27
Accurate diagnosis of OCD and the identification of a qualified treatment provider remain the 2 major obstacles to treatment of OCD. In one study, the average delay between onset of symptoms and provision of appropriate treatment was 17 years.27 However, once appropriate treatment begins, prognosis for patients with OCD is positive. One meta-analysis demonstrated significant long-term improvement (range, 1–15 years) in pediatric patients receiving any treatment (ie, pharmacological, psychological, or combined) for OCD.28 Other studies have demonstrated that medication generally accounts for significant symptom reduction compared with baseline levels,14,15 and 57% to 64% of pediatric patients exhibit no symptoms or subclinical levels of symptoms at follow-up.29,30 Studies of adults have also demonstrated significant symptom reduction,12 with about 50% of patients responding to medication.31 In addition, numerous studies have demonstrated that CBT is as effective or more effective than pharmacotherapy alone for both children and adults.12,15,31
As noted previously, upwards of 85% of patients improve significantly with CBT.3,31 Thus, CBT alone or combined with medication has the best prognosis for children and adults.
CORRESPONDENCE
Eric A. Storch, PhD, Department of Psychiatry, University of Florida, Box 100234, Gainesville, FL 32610. E-mail: [email protected]
1. Foa EB, Liebowitz MR, Kozak MJ, et al. Randomized, placebo-controlled trial of exposure and ritual prevention, clomipramine, and their combination in the treatment of obsessive-compulsive disorder. Am J Psychiatry 2005;162:151-161.
2. Franklin ME, Foa EB. Cognitive behavioral treatments for obsessive compulsive disorder. In Nathan PE, Gorman JM, eds: A Guide to Treatments that Work. New York: Oxford University Press; 2002:367–386.
3. Barrett P, Healy-Farrell L, March JS. Cognitive-behavioral family treatment of childhood obsessive-compulsive disorder: A controlled trial. J Am Acad Child Adolesc Psychiatry 2004;43:46-62.
4. Simonds LM, Elliott SA. OCD patients and non-patient groups reporting obsessions and compulsions: phenomenology, help-seeking, and access to treatment. Brit J Med Psychol 2001;74:431-449.
5. BTI benefits. Obsessive-Compulsive Foundation website. Available at: www.ocfoundation.org/ocf1130d.htm. Accessed on February 2, 2006.
6. Rachman S. Obsessions, responsibility and guilt. Behav Res Therapy 1993;31:149-154.
7. Piacentini J, Langley AK. Cognitive-behavioral therapy for children who have obsessive-compulsive disorder. J Clin Psychol 2004;60:1181-1194.
8. Insel TR, Mueller EA, Alterman I, Linnoila M, Murphy DL. Obsessive-compulsive disorder and serotonin: Is there a connection? Biol Psychiatry 1985;20:1174-1188.
9. Goodman WK. Obsessive-compulsive disorder: Diagnosis and treatment. J Clin Psychiatry 1999;60(suppl 18):27-32.
10. Leonard HL. New developments in the treatment of obsessive-compulsive disorder. J Clin Psychiatry 1997;58(suppl 14):39-47.
11. Leonard HL, Swedo SE, Rapoport JL. Treatment of childhood obsessive-compulsive disorder with clomipramine and desipramine: A double-blind crossover comparison. Arch Gen Psychiatry 1989;46:1088-1092.
12. Abramowitz JS. Effectiveness of psychological and pharmacological treatments for obsessive-compulsive disorder: A quantitative review. J Consult Clin Psychol 1997;65:44-52.
13. Nutt DJ. Overview of Diagnosis and drug treatments of anxiety disorders. CNS Spectrums 2005;10:49-56.
14. Geller DA, Biederman J, Stewart SE, et al. Which SSRI? A meta-analysis of pharmacotherapy trials in pediatric obsessive-compulsive disorder. Am J Psychiatry 2003;160:1919-1928.
15. Tolin DF, Maltby N, Diefenbach GJ, et al. Cognitive-behavioral therapy for medication nonresponders with obsessive-compulsive disorder: A wait-list controlled open trial. J Clin Psychiatry 2004;65:922-931.
16. McDougal CJ. Update on pharmacological management of OCD: Agents and augmentation. J Clin Psychiatry 1997;57(suppl 12):11-17.
17. POTS: Cognitive-behavioral therapy, sertraline, and their combination for children and adolescents with obsessive-compulsive disorder. JAMA 2004;292:1969-1976.
18. Maina G, Albert U, Ziero J, Bogetto F. Antipsychotic augmentation for treatment-resistant obsessive-compulsive disorder: What if antipsychotic is discontinued? Internation Clin Psychopharmacol 2003;18:23-28.
19. Practice parameters for the assessment and treatment of children and adolescents with obsessive-compulsive disorder. J Am Acad Child Adolesc Psychiatry 1998;37:27S-45S.
20. Bolton D, Luckie M, Steinberg D. Long-term course of obsessive-compulsive disorder treated in adolescence. J Am Acad Child Adolesc Psychiatry 1995;34:1441-1450.
21. Hanna GL. Demographic and clinical features of obsessive-compulsive disorder in children and adolescents. J Am Acad Child Adolesc Psychiatry 1995;34:19-28.
22. Horwath E, Weissman M. The epidemiology and cross-national presentation of obsessive-compulsive disorder in childhood. J Am Acad Child Adolesc Psychiatry 2000;19:134-144.
23. March JS, Leonard HL. Obsessive-compulsive disorder in children and adolescents: A review of the past 10 years. J Am Acad Child Adolesc Psychiatry 1996;35:1265-1273.
24. Peterson BS, Pine DS, Cohen P, Brooks JS. Prospective, longitudinal study of tic, obsessive-compulsive, and attention-deficit/hyperactivity disorders in an epidemiological sample. J Am Acad Child Adolesc Psychiatry 2001;40:685-695.
25. Koran L, Thienemann M, Davenport R. Quality of life for patients with obsessive-compulsive disorder. Am J Psychiatry 1996;153:783-788.
26. Calvacoressi L, Lewis B, Harris M, et al. Family accommodation in obsessive-compulsive disorder. Am J Psychiatry 1995;152:441-443.
27. Hollander E, Kwon JH, Stein DJ, Broatch J, Rowland CT, Himelein CA. Obsessive-compulsive and spectrum disorders: Overview and quality of life issues. J Clin Psychiatry 1996;19:134-144.
28. Stewart SE, Geller DA, Jenike M, et al. Long-term outcome of pediatric obsessive-compulsive disorder: A meta-analysis and qualitative review of the literature. Acta Psychiatrica Scandinavica 2004;110:4-13.
29. Leonard HL, Swedo SE, Lenane MC. A two to seven year follow-up study of 54 obsessive compulsive children and adolescents. Arch Gen Psychiatry 1993;50:429-439.
30. Wewetzer C, Jans T, Muller B, et al. Long-term outcome and prognosis of obsessive-compulsive disorder with onset in childhood or adolescence. Europ Child Adolesc Psychiatry 2001;10:37-46.
31. Foa EB, Franklin ME, Moser J. Context in the clinic: How well do cognitive-behavioral therapies and medications work in combination? Biolog Psychiatry 2002;52:987-997.
- Cognitive-behavioral therapy with exposure and response-prevention is effective for the treatment of obsessive-compulsive disorder (OCD) in both children and adults (A).
- Numerous medications are effective options for the treatment of OCD in adults, including serotonergic agents (clomipramine, citalopram, fluoxetine, sertraline, paroxetine, fluvoxamine) (A). Only clomipramine, fluoxetine, fluvoxamine, and sertraline have been approved by the Food and Drug Administration for use in youths (A).
Note: this article is a continuation of “Obsessive-compulsive disorder: Tools for recognizing its many expressions,” in the March 2006 issue of JFP.
Evidence supports 2 forms of treatment for adults and children with obsessive-compulsive disorder (OCD): cognitive-behavioral therapy (CBT) with exposure and response prevention (E/RP), and psychopharmacologic treatment with serotonin reuptake inhibitors (SRIs).
OCD Expert Consensus Guidelines strongly recommend exposure-based CBT, alone or with pharmacotherapy, as the first-line treatment.1 However, approximately 25% of persons with OCD wish not to participate in CBT for varying reasons (eg, limited insight, difficulty engaging in exposures), thus making medication alone the initial choice of treatment. In many cases, thankfully, patients whose symptoms decrease with medication become willing to participate in CBT.
Cognitive-behavioral therapy the preferred route
A large database supports the efficacy of CBT with E/RP in treating OCD. Methodologically rigorous controlled trials of CBT in adults and children have reported success rates reaching 85% (SOR: A).2,3 One qualifier of success: though most patients respond positively to CBT, symptoms often remain and true cure or complete remission is often not possible.
CBT is unlike other psychotherapies. Unfortunately, the number of qualified mental health professionals trained in CBT for OCD is limited,4 as is general knowledge about this approach. The Obsessive-Compulsive Foundation estimates that 5 million Americans with OCD lack access to behavioral therapy.5 Many of the patients we see in our clinic have participated in psychodynamic or traditional “talk therapies” that are supported by little evidence. Such approaches have a strength of recommendation (SOR) of C. As a result, many afflicted individuals receive only partial treatment that consists of either non-CBT psychotherapy or medication.
Preparing the way for your patient
Before referring a patient for CBT, ask about the practitioner’s level of training (PhD or PsyD are preferable), theoretical approach (cognitive behavioral vs others, such as psychodynamic or humanistic), and experience in working with OCD patients. Perhaps the most important question to ask a clinician is, “Will you expose the patient to situations that provoke rituals while having him/her refrain from engaging in them?”
What your patients can expect. CBT is a form of psychological treatment explicitly based on learning and cognitive principles. Twelve to 16 sessions are typical, though the function of each individual will determine the duration of treatment.2 Treatment may be stopped if significant symptom reduction has lasted for at least 4 consecutive weeks. Thereafter, periodic booster sessions are helpful to maintain gains and prevent relapse.1
The 3 central aspects of CBT therapy for OCD:
- Exposure—placing the patient in situations that elicit anxiety related to their obsessions
- Response prevention—deterring the ritualistic or compulsive behaviors that may serve to reduce or avoid anxiety
- Cognitive therapy—training the patient to identify and reframe anxiety-provoking cognitions.
Exposure—very simply, having the patient face their fear—reduces anxiety responses.
Response prevention involves encouraging the patient to refrain from engaging in repetitive, time-consuming compulsions. This component is based on the notion that rituals serve to reduce anxiety and are thus reinforcing. Naturally, E/RP is quite anxiety-provoking for patients. As a result, it may be useful to inform them that feared situations will be approached in a hierarchical manner, starting with easier items before moving to more difficult ones. Successful completion of E/RP tasks teaches patients that the feared consequences of not ritualizing are not going to occur.
Cognitive therapy takes into account that patients with OCD have characteristic thoughts believed to contribute to the development and maintenance of their condition. Specifically, common themes within this population include distorted appraisals of risk (eg, “The chance of burning the house down with an extinguished cigarette is 25%”), an inflated sense of responsibility for harm (eg, “If I do not touch this rock, my mother will get cancer”), and pathologic levels of self-doubt (eg, “I know the odds of contracting HIV from using a public toilet are slim, but I can’t be sure I will not”). OCD in adults has also been related to the concept of thought–action fusion, in which negative thoughts and actions are seen as synonymous.6 Such maladaptive cognitive processes often motivate compulsive behavior and make patients with OCD less able to cope with negative thoughts.7 The cognitive component of CBT addresses these issues and teaches patients ways to mend their thinking.
Enlist the family. Finally, family involvement is often central to the success of CBT. Family members may accommodate the patient’s symptoms by facilitating avoidance, assisting with ritualistic behaviors, or inadvertently facilitating the development of the disorder by participating in rituals (eg, providing reassurance, allowing compulsive avoidance of feared stimuli, and tolerating delays associated with ritual completion). Given this, CBT often includes the patient’s spouse, parents, and significant others.
Pharmacotherapy
Malfunction in the serotonin neurotransmitter system is thought to be the physiologic basis of OCD.8,9 More specifically, OCD patients are believed to have a lower level of serotonin in neural synapses than healthy persons. Given this, seretonergic agents, such as clomipramine (Anafranil), citalopram (Celexa), fluoxetine (Prozac), sertraline (Zoloft), paroxetine (Paxil), and fluvoxamine (Luvox) have been used extensively to treat OCD in both adults and youths (SOR: A). The Food and Drug Administration (FDA) has approved only clomipramine, fluoxetine, fluvoxamine, and sertraline for use in youth. Each receives an SOR of A.
Clomipramine: once first choice, now a backup
Until recently, clomipramine—a tricyclic antidepressant—was the most widely prescribed medication for OCD, given its record of providing the greatest and most reliable symptom reduction.10 The efficacy of clomipramine, which has strong seretonergic properties, has not been replicated with other tricyclic antidepressants (eg, desipramine [Norpramin, Pertofrane]) that more directly target other neurotransmitter systems (serotonin, norepinephrine, and dopamine).11 However, clomipramine, like other tricyclic antidepressants, can cause tachycardia, prolongation of QT interval, and other unpleasant side effects (eg, orthostatic hypotension, constipation, and dry mouth are common). As a result, its use is indicated in cases where the patient does not respond to alternative medications.
SSRIs now favored
Given clomipramine’s side effects, selective serotonin reuptake inhibitors (SSRIs), a class of SRIs, have emerged as the first-line medication.12 For patients who need medication, first consider prescribing an SSRI first.
SSRIs, however, are not without side effects. During the initial phase of treatment, nausea, exacerbations of anxiety, jitteriness, and insomnia are experienced by approximately 35% of patients and may persist over the duration of treatment. These side effects may be limited by slow-dose titration. With fluoxetine, for example, start at 20 mg and gradually increase the dose over several weeks to the usual target dose of 40 to 60 mg.
Some patients require even lower initial doses and more prolonged titration. Extended SSRI treatment has been linked to sexual dysfunction, headache, asthenia, and sweating in 25% to 35% of patients.13
Multiple large-scale controlled trials have demonstrated the efficacy and tolerability of SSRIs for adults and youths.13,14 About 40% to 55% of patients generally report significant symptom reduction after 12 weeks. However, typical symptom reduction in clinical practice averages only 20% to 50%, and many patients experience residual symptoms after treatment has stopped.
Course of pharmacotherapy
SSRIs should be gradually titrated. The TABLE displays dosing of commonly used SSRIs in adults with OCD. A 12-week trial of an adequate dosage is the standard of care before considering alternative therapies.9 Initial response to medications may take 6 to 8 weeks, although the maximal response may take up to 20 weeks. Continue medications for 1 year after achieving a therapeutic response and slowly taper thereafter. Evidence suggests that ongoing CBT may be one method to prevent relapse when discontinuing medication.15 Most patients do not fully remit on medication treatment alone, and as many as 60% do not have a substantial reduction of symptoms.16
TABLE
SRI dosing guidelines recommended by the Expert Consensus Panel (1997)
| SRI | INITIAL DOSE/INCREMENT FOR INCREASES* | USUAL TARGET DOSE* | MAXIMUM DOSE* | SOR |
|---|---|---|---|---|
| Clomipramine | 10–25 mg/d | 100–250 mg/d | 250 mg/d | A |
| Fluoxetine | 20 mg/d | 40–60 mg/d | 80 mg/d | A |
| Fluvoxamine | 50 mg/d | 200 mg/d | 300 mg/d | A |
| Paroxetine | 10–20 mg/d | 50 mg/d | 60 mg/d | A |
| Sertraline | 50 mg/d | 150 mg/d | 225 mg/d | A |
For cost-effectiveness, CBT still comes out on top
It is suggested that patients continue medication consistently for 2 years before deciding to stop.9 Medication would therefore be expected to cost more over the long-term than CBT, given the time-limited nature and durability of the latter.3 To date, several trials have examined the relative efficacy of pharmacotherapy alone versus its combination with CBT. In general, results suggest that CBT alone or in combination with pharmacotherapy (an SRI) is the treatment of choice.1,17
CBT plus medication often the better way to go
Given that many patients do not respond adequately to medication alone, augmentation strategies are often necessary. As CBT is considered the most effective approach, this therapy should always be used, particularly when a patient has proven refractory with pharmacological approaches. In cases that are unresponsive to multiple SSRIs and CBT, consider such second-line pharmacological treatments as serotonergic or dopaminergic agents, or adding a second first-line agent.13
Dopaminergic augmentation with drugs such as risperidone (Risperdal) or haloperidol (Haldol), and olanzapine (Zyprexa) have been fairly extensively studied. This approach, which consists of adding a medication that affects the dopaminergic system to the ongoing SSRI, has been well-supported.18 However, it is unclear as to how long to continue treatment as many patients relapse upon discontinuation and the antipsychotics are linked to undesirable side effects such as sedation, weight gain, or (particularly with higher doses of risperidone) extrapyramidal effects.
Strategies for adding a second serotonergic medication include switching to a new agent or adding another. Indeed, many patients with an inadequate response to one SSRI may have a favorable response to another.10
Prognosis
Left untreated, the course of obsessive-compulsive disorder is chronic and unremitting, with symptoms generally fluctuating over time due to stress-induced exacerbations of symptoms.19 Children with this disorder remain at higher risk for other psychiatric problems into adulthood,20,21 and adults frequently display additional symptoms as well. Comorbidity with Major Depressive Disorder is particularly common in both children and adults, as are ADHD and other anxiety, mood, and tic disorders.22-24 Symptoms also disrupt family, social, academic, and occupational functioning.25-27
Accurate diagnosis of OCD and the identification of a qualified treatment provider remain the 2 major obstacles to treatment of OCD. In one study, the average delay between onset of symptoms and provision of appropriate treatment was 17 years.27 However, once appropriate treatment begins, prognosis for patients with OCD is positive. One meta-analysis demonstrated significant long-term improvement (range, 1–15 years) in pediatric patients receiving any treatment (ie, pharmacological, psychological, or combined) for OCD.28 Other studies have demonstrated that medication generally accounts for significant symptom reduction compared with baseline levels,14,15 and 57% to 64% of pediatric patients exhibit no symptoms or subclinical levels of symptoms at follow-up.29,30 Studies of adults have also demonstrated significant symptom reduction,12 with about 50% of patients responding to medication.31 In addition, numerous studies have demonstrated that CBT is as effective or more effective than pharmacotherapy alone for both children and adults.12,15,31
As noted previously, upwards of 85% of patients improve significantly with CBT.3,31 Thus, CBT alone or combined with medication has the best prognosis for children and adults.
CORRESPONDENCE
Eric A. Storch, PhD, Department of Psychiatry, University of Florida, Box 100234, Gainesville, FL 32610. E-mail: [email protected]
1. Foa EB, Liebowitz MR, Kozak MJ, et al. Randomized, placebo-controlled trial of exposure and ritual prevention, clomipramine, and their combination in the treatment of obsessive-compulsive disorder. Am J Psychiatry 2005;162:151-161.
2. Franklin ME, Foa EB. Cognitive behavioral treatments for obsessive compulsive disorder. In Nathan PE, Gorman JM, eds: A Guide to Treatments that Work. New York: Oxford University Press; 2002:367–386.
3. Barrett P, Healy-Farrell L, March JS. Cognitive-behavioral family treatment of childhood obsessive-compulsive disorder: A controlled trial. J Am Acad Child Adolesc Psychiatry 2004;43:46-62.
4. Simonds LM, Elliott SA. OCD patients and non-patient groups reporting obsessions and compulsions: phenomenology, help-seeking, and access to treatment. Brit J Med Psychol 2001;74:431-449.
5. BTI benefits. Obsessive-Compulsive Foundation website. Available at: www.ocfoundation.org/ocf1130d.htm. Accessed on February 2, 2006.
6. Rachman S. Obsessions, responsibility and guilt. Behav Res Therapy 1993;31:149-154.
7. Piacentini J, Langley AK. Cognitive-behavioral therapy for children who have obsessive-compulsive disorder. J Clin Psychol 2004;60:1181-1194.
8. Insel TR, Mueller EA, Alterman I, Linnoila M, Murphy DL. Obsessive-compulsive disorder and serotonin: Is there a connection? Biol Psychiatry 1985;20:1174-1188.
9. Goodman WK. Obsessive-compulsive disorder: Diagnosis and treatment. J Clin Psychiatry 1999;60(suppl 18):27-32.
10. Leonard HL. New developments in the treatment of obsessive-compulsive disorder. J Clin Psychiatry 1997;58(suppl 14):39-47.
11. Leonard HL, Swedo SE, Rapoport JL. Treatment of childhood obsessive-compulsive disorder with clomipramine and desipramine: A double-blind crossover comparison. Arch Gen Psychiatry 1989;46:1088-1092.
12. Abramowitz JS. Effectiveness of psychological and pharmacological treatments for obsessive-compulsive disorder: A quantitative review. J Consult Clin Psychol 1997;65:44-52.
13. Nutt DJ. Overview of Diagnosis and drug treatments of anxiety disorders. CNS Spectrums 2005;10:49-56.
14. Geller DA, Biederman J, Stewart SE, et al. Which SSRI? A meta-analysis of pharmacotherapy trials in pediatric obsessive-compulsive disorder. Am J Psychiatry 2003;160:1919-1928.
15. Tolin DF, Maltby N, Diefenbach GJ, et al. Cognitive-behavioral therapy for medication nonresponders with obsessive-compulsive disorder: A wait-list controlled open trial. J Clin Psychiatry 2004;65:922-931.
16. McDougal CJ. Update on pharmacological management of OCD: Agents and augmentation. J Clin Psychiatry 1997;57(suppl 12):11-17.
17. POTS: Cognitive-behavioral therapy, sertraline, and their combination for children and adolescents with obsessive-compulsive disorder. JAMA 2004;292:1969-1976.
18. Maina G, Albert U, Ziero J, Bogetto F. Antipsychotic augmentation for treatment-resistant obsessive-compulsive disorder: What if antipsychotic is discontinued? Internation Clin Psychopharmacol 2003;18:23-28.
19. Practice parameters for the assessment and treatment of children and adolescents with obsessive-compulsive disorder. J Am Acad Child Adolesc Psychiatry 1998;37:27S-45S.
20. Bolton D, Luckie M, Steinberg D. Long-term course of obsessive-compulsive disorder treated in adolescence. J Am Acad Child Adolesc Psychiatry 1995;34:1441-1450.
21. Hanna GL. Demographic and clinical features of obsessive-compulsive disorder in children and adolescents. J Am Acad Child Adolesc Psychiatry 1995;34:19-28.
22. Horwath E, Weissman M. The epidemiology and cross-national presentation of obsessive-compulsive disorder in childhood. J Am Acad Child Adolesc Psychiatry 2000;19:134-144.
23. March JS, Leonard HL. Obsessive-compulsive disorder in children and adolescents: A review of the past 10 years. J Am Acad Child Adolesc Psychiatry 1996;35:1265-1273.
24. Peterson BS, Pine DS, Cohen P, Brooks JS. Prospective, longitudinal study of tic, obsessive-compulsive, and attention-deficit/hyperactivity disorders in an epidemiological sample. J Am Acad Child Adolesc Psychiatry 2001;40:685-695.
25. Koran L, Thienemann M, Davenport R. Quality of life for patients with obsessive-compulsive disorder. Am J Psychiatry 1996;153:783-788.
26. Calvacoressi L, Lewis B, Harris M, et al. Family accommodation in obsessive-compulsive disorder. Am J Psychiatry 1995;152:441-443.
27. Hollander E, Kwon JH, Stein DJ, Broatch J, Rowland CT, Himelein CA. Obsessive-compulsive and spectrum disorders: Overview and quality of life issues. J Clin Psychiatry 1996;19:134-144.
28. Stewart SE, Geller DA, Jenike M, et al. Long-term outcome of pediatric obsessive-compulsive disorder: A meta-analysis and qualitative review of the literature. Acta Psychiatrica Scandinavica 2004;110:4-13.
29. Leonard HL, Swedo SE, Lenane MC. A two to seven year follow-up study of 54 obsessive compulsive children and adolescents. Arch Gen Psychiatry 1993;50:429-439.
30. Wewetzer C, Jans T, Muller B, et al. Long-term outcome and prognosis of obsessive-compulsive disorder with onset in childhood or adolescence. Europ Child Adolesc Psychiatry 2001;10:37-46.
31. Foa EB, Franklin ME, Moser J. Context in the clinic: How well do cognitive-behavioral therapies and medications work in combination? Biolog Psychiatry 2002;52:987-997.
Five ways you can reduce inappropriate prescribing in the elderly: A systematic review
- Obtain pharmacist recommendations to reduce inappropriate prescribing and adverse drug events (B).
- In the inpatient setting, use computerized alerts to reduce serious medication errors and help prevent adverse drug events (B).
- Review a patient’s medications to reduce polypharmacy and inappropriate prescribing (A).
- Educate patients to improve compliance with medications, reduce polypharmacy, reduce inappropriate prescribing, and decrease adverse events (A).
- Consider using the Beers criteria for avoiding inappropriate drugs in the elderly.
A round one third of elderly persons hospitalized end up there because of adverse drug events. Among the ambulatory elderly, 35% experience such events in a single year. The hopeful outlook is that, depending on the setting, between 25% and 95% of these events can be prevented by reducing inappropriate prescribing.
In this article we discuss 5 recommendations for reducing inappropriate medications, and offer steps to implement these recommendations.
Factors that lead to inappropriate prescribing
Inappropriate prescribing to elderly patients is increasing. It is not uncommon for older patients to receive 1 or more medications from their primary care physician and additional medications from specialty physicians, with each physician unaware of medications prescribed by the others.1 As the number of providers following the patient increases, so does the number of medications.2
One result is that the elderly use a disproportionate number of medications. They make up 13% of the US population but receive 34% of all prescriptions and consume 40% of all nonprescription medications.3,4 A recent national study of non-institutionalized US adults revealed that 90% of persons 65 years or older used at least 1 medication per week. More than 40% used 5 or more medications per week, and 12% used 10 or more per week.5 This situation may become more complicated as by the year 2030, the elderly are expected to make up 20% of the US population.6
Inappropriate prescribing, including polypharmacy, is a major contributing factor to adverse drug events in older patients (see Scope of the problem). A recent nested case-controlled study in a large multi-specialty group revealed an association between number of medications, doses of medications, and adverse drug events.13 The problem of polypharmacy as it relates to adverse drug events is so extensive that it was designated as the principal medication safety issue in the Healthy People 2000 report.14
In the year 2000, medication-related problems were responsible for 106,000 deaths at a cost of $85 billion to our healthcare system.7,8
It has been estimated that 30% of hospital admissions in elderly patients are due to drug-related problems.9 In addition, approximately two thirds of nursing facility residents will experience an adverse drug event over a 4-year period of time, with 1 in 7 of these residents requiring hospitalization.10,11
Ambulatory patients are also affected. A cohort study revealed that approximately 35% of ambulatory elderly experienced an adverse drug event over a 1-year period, 63% of whom required the attention of a physician.9 Another large cohort study, involving 30,347 Medicare enrollees cared for by a multispecialty group practice, demonstrated that adverse drug events are not only common among the elderly, but over 25% of the adverse events during a 12-month period were preventable.12 Other studies have estimated that up to 95% of adverse drug events are preventable.3 These figures are particularly troubling when considering our older patient population because 51% of all deaths caused by adverse reactions to medications occur in patients over 60 years of age.4
Adverse drug events may occur for several reasons including noncompliance, drug-drug interactions, and physician error.
Methods
In this systematic review, English language studies from January 1990 to January 2006 were searched on Medline and the Cochrane Database of Systematic Reviews. Among the specific keywords and phrases we used: adverse drug events in the elderly; inappropriate medications in the elderly; polypharmacy in the elderly; reduction of polypharmacy in the elderly; drug-drug interactions in the elderly; prevention of adverse drug events; and reduction of inappropriate prescribing in the elderly. The search was limited to studies of patients over 65 years of age.
Fifty-nine articles were identified using the above search strategy. In selecting articles on which to base the recommendations in this paper, we gave first priority to randomized controlled trials. When randomized controlled trials did not exist, we used cohort studies or meta-analyses. We excluded review articles and articles that did not specifically address the issue of reducing inappropriate prescribing for elderly patients.
Results
TABLE W1 describes the results of the systematic review. Of the initial 59 articles, we excluded 26 review articles and 13 that did not address inappropriate prescribing. The remaining 19 articles were classified into 5 categories based on the methods studied for reducing inappropriate prescribing. The methods recommended in each of the 5 categories were supported by varying levels of evidence.
Four methods were supported by controlled trials, thus providing a higher level of evidence to support: 1) incorporating pharmacist recommendations, 2) use of computerized alerts, 3) review of patient’s medication list and 4) patient education (TABLE W2). The fifth method, avoiding inappropriate medications, was based on consensus guidelines and expert opinions.
Method 1: Incorporate pharmacist recommendations
Having a pharmacist participate in the care of elderly patients can reduce polypharmacy and adverse drug events.
A randomized controlled trial of 208 patients at a Veterans’ Administration (VA) medical clinic, aged 65 years of age or older and taking 5 or more medications, demonstrated that involving a clinical pharmacist in the patient’s care reduces inappropriate prescribing and adverse drug effects without adversely affecting health-related quality of life.15
In this VA study, patients were randomized to an intervention group and a control group. In the intervention group, a clinical pharmacist met with patients during all scheduled office visits to evaluate and make recommendations about their drug regimens. Before each visit, the clinical pharmacist reviewed the patient’s medical record and current medications, and assessed each medication using the “Medication Appropriateness Index” as a guideline.18,19 Written drug therapy recommendations were then sent to the physician.
Key outcome measures in this study were the rate of prescribing inappropriateness, medication compliance and knowledge, number of medications, adverse drug events, health-related quality of life, patient satisfaction, and physician receptivity to the intervention.
The results show that inappropriate prescribing and the number of drugs prescribed decreased by 24% in the intervention group but only by 6 % in the control group. In addition, fewer intervention-group patients than control patients experienced adverse drug events (30% vs. 40%; P=.19). Physicians were receptive to the clinical pharmacist’s interventions and enacted changes recommended by the clinical pharmacist more frequently than they enacted changes independently for control patients (55.1% vs. 19.8%; P=.001).15
Engaging the pharmacist. Encourage your patients to fill prescriptions by all physicians at the same pharmacy, thereby enabling the maintenance of a single current list of medications. Have your office staff alert the pharmacist whenever a medication is discontinued.
When a patient refills medications, the pharmacist routinely reviews the database for potential adverse drug events. The pharmacist should then alert the physician of potential inappropriate medications or adverse drug events.
Method 2: Use computerized alerts
Computerized alerts provide warnings to physicians using computerized order entry systems. The system contains information on patients’ current medications and drug intolerances and allergies. An “alert” is generated by the system when there is a potential drug allergy, drug intolerance or drug interaction as defined by the National Drug Data File of First Databank Inc. The use of computerized alerts for reducing polypharmacy and inappropriate prescribing has been examined in both outpatient and inpatient settings.
Outpatient. A recent study examined the rate at which physicians overrode computerized alerts among 3481 consecutive alerts generated at 5 adult primary care practices that used a common computerized physician order entry system for prescription writing.20 Of the 3481 consecutive alerts, physicians overrode 91.2% of the alerts but 8.8% resulted in a change in prescribing.
Although few physicians changed their prescriptions in response to an alert, there were few adverse drug events despite the large number of alerts that were overridden. This may have indicated an alert threshold that was set too low.21
Inpatient. A randomized comparison study conducted at a large tertiary hospital demonstrated that physician computer order entry decreased the rate of serious medication errors by more than half.16 This study was divided into 2 phases. Phase I involved 2491 admissions and was designed as “baseline.” Phase II involved 4220 admissions that occurred after the intervention was implemented. The intervention itself was implementation of a computerized order entry system that required the ordering physician to complete a menu of information including drug name, medication dose, route, and frequency. Computerization ensured legibility of all orders. The main outcome measured was serious medication errors.
In comparison of the 2 phases, serious medication errors decreased 55%, from 10.7 events per 1000 patient-days in Phase I to 4.86 events per thousand in Phase II (P=.1). Preventable adverse drug events declined 17%, while most significantly potential adverse drug events declined 84%.16
Another study, this one a randomized controlled study of electronic alerts to remind physicians of prescribed measures to prevent venous thromboembolism in hospitalized patients, also found benefit to an alert system. But the results showed that 3 conditions are needed for the success of the clinical alerts. First, there must be acceptance by the physicians. Secondly, the electronic alerts should deliver simple messages that prevent physicians from routinely bypassing them. Thirdly, the physician should have access to all pertinent information to make an adequate decision.21
Method 3: Review of medications
Reviewing a patient’s medications regularly can reduce polypharmacy and inappropriate prescribing. This has been shown in at least 4 studies.
Physicians often unaware of what patients are, or are not, taking. One prospective observational study of medication review showed a high rate of discrepancy between medications the physician thought a patient was taking and those the patient actually was taking. This study involved patients 65 years of age or older who were taking 4 or more medications. There were 50 physicians-patient pairs blinded at the initial visit. After the initial visit, physicians were given the patient’s chart, with a request to complete a questionnaire on all prescription and nonprescription medications with dosages and frequencies of administration. All patient records contained a flow sheet for review of medications including current, discontinued, and over-the-counter medications.
Home visits were conducted 10 days after initial visits to gather detailed information from patients regarding their understanding of medication regimens. Data obtained showed that 74% of patients were taking at least 1 medication the physician was unaware of, or were not taking a medication the physician thought they were taking. Moreover, in 12% of cases, there were discrepancies in understanding about dose or frequency of medication regimens.22
“Brown bag” assessment useful. In the second study, a program promoting medication reviews between primary care physicians and their elderly patients significantly changed prescribing by physicians. In this prospective study, elderly patients taking 5 or more medications were sent a letter encouraging them to meet with their primary care physician for a medication review. Interventions included notifying the physician that their patients were at high risk for inappropriate prescribing, providing the physician with a “medication management” report that listed all prescriptions, doses, and pills dispensed per prescription, and clinical practice guidelines for effectively preventing and managing inappropriate prescribing. These guidelines emphasized the “brown bag” medication review of both nonprescription and prescription medications (ie, having the patient bring all their medication to the office in a brown bag).
With this intervention, 20% of patients reported discontinuation of a medication, 29% reported a change in medication, and 17% reported a medication that the physician did not know the patient was taking. Forty-five percent of physicians made at least 1 change in a patient’s medication regimen.23
Include all preparations patients use. A third study showed that the medication review should focus not just on prescription drugs but also on nonprescription agents such as vitamins, laxatives, minerals, analgesics, and herbal and natural remedies. This prospective cross-sectional study at 3 university affiliated geriatric clinics involved a room-to-room search of patients’ homes to identify all substances a patient might be taking. The medications identified in the home were compared with the medication list in the clinic and with medications found in the “brown bag evaluation” and by interview. The physician’s understanding of medications a patient was taking matched the patient’s actual use of medications only 52% of the time; much of the mismatch was attributable to nonprescription medications.24
Finally, in a fourth study, a randomized controlled trial, 133 community dwelling adults taking 5 or more medications were assessed at baseline by physician exam, symptom review, and objective tests of physical and cognitive functioning. Sixty-three subjects were randomized to the intervention group and 77 to the control group.
The primary intervention was a review and modification of a patient’s medication regimen by a multidisciplinary team consisting of a consultant pharmacist, physician, and nurse. This intervention was not available to the control group. Medication usage in both groups was re-evaluated at 6 weeks using a brown-bag review.
The control group decreased their medication use by an average of 0.04 medications per month, while the intervention subjects decreased their medications by an average of 1.5 drugs (although the team has actually recommended discontinuation of an average of 4.5 drugs per patient). The difference between recommended discontinuation and actual discontinuation was attributed to patients’ resistance to changing medications.
Intervention subjects saved an average of $26.92 per month in wholesale costs while control subjects saved an average of $6.75 per month. No differences in functioning were observed between groups.17
Method 4: Patient education
The most beneficial intervention may be enhancing communication between providers and patients, and educating patients about medication regimens, potential side effects, and adverse drug events.
Encourage reporting of symptoms. A recent prospective cohort study showed that 63% of preventable events were attributed to the physician’s failure to respond to medication-related symptoms; 37% were due to the patient’s failure to inform the physician of the symptoms.25
Intensive counseling reaps big benefits. In a second study, the South Dakota Medication Reduction Project, educational presentations by pharmacists and one-on-one sessions between pharmacists and patients resulted in patients taking fewer medications and reducing dosages in medical regimens. This longitudinal study involved over 1000 older adults in rural and urban southeastern South Dakota communities over 6 months.
A pharmacist specializing in geriatrics gave a 30-minute presentation at various sites on medication-associated problems and “do’s” and “don’ts” of medication use. This was followed by a 15-minute question-and-answer session.
A one-on-one 20-minute consultation between the pharmacist and patients followed the group presentation. The pharmacist recorded demographic data, medical history, medication names, doses, directions, and intended purposes, and obtained feedback about compliance and side effects. The pharmacist also provided oral counseling and written information about medications.
If a potentially serious drug-related problem was identified, a letter was sent to the patient’s primary care physician, identifying key inappropriate prescribing concerns and offering alternative interventions for the physician’s consideration.
Three months after the educational intervention, a telephone survey was performed. Survey results indicated that older adults participating in the one-on-one reviews were taking fewer medications, were more likely to take their medications, had dosage reductions, and increased their use of nonpharmacologic alternatives.26
But even modest intervention pays off. In another randomized study, a simple education intervention significantly reduced inappropriate prescribing for elderly patients. Participants in the intervention group taking more than 10 medications were sent a single letter recommending that medications be reduced. Similar participants in the control group did not receive letters.
The outcome measured was number of medications. In the notification group, an average reduction of approximately 3 medications occurred over a 4-month period. More complex intervention did not reduce inappropriate prescribing any further.2
Value of visual reminders. Another study showed that a simple visual intervention significantly reduced inappropriate prescribing. In this controlled trial, physicians were shown a medication grid that displayed all of their patient’s medications and times of administration for 1 week. In the intervention group, medications decreased by 2.47 per patient. In the control group, medications increased by 1.65 per patient and doses increased by 3.83 per patient.27
Try a team approach? Yet another randomized study showed that compared with usual care, education through an outpatient geriatric evaluation and management program reduced the number of serious adverse drug events and inappropriate prescribing for frail elderly patients. Patient management guideline interventions consisted of regular assessments and medication recommendations by pharmacists. There was also a core team comprised of a geriatrician, social worker, and a nurse who participated in evaluation and management protocols such as medication reviews. The program reduced the risk of serious adverse drug events by 35%, compared with usual care of the geriatric patient.28
Method 5: Avoid inappropriate medications
The Beers criteria aid in identifying medications to be avoided in older persons. They were developed in 1991, then updated in 1997 and again in 2003. In short, these criteria designate as “inappropriate” any medication that has shown the potential for adverse effects in the elderly.7,29,30
In the 2003 update, a US consensus panel of experts used a modified Delphi method to review medications potentially ineffective or unsafe in the elderly.7,29,30 The TABLE shows selected examples of commonly used medications considered inappropriate.7,29-32
Limited research supports use of the Beers criteria. The 1996 Medical Expenditure Panel Survey controlled for a number of confounding factors and found strong evidence of a sizable and consistent negative effect of using medications identified as inappropriate by the Beers criteria.32
TABLE
Potentially inappropriate medications in the elderly
| MEDICATION | POTENTIAL ADVERSE EFFECT |
|---|---|
| Meperidine (Demerol) | Confusion |
| Propoxyphene (Darvon) | CNS effects |
| Diphenhydramine (Benadryl) | Sedation |
| Long-term use of NSAIDs | GI bleeding |
| Amitriptyline (Elavil) | Sedation/anticholinergic effects |
| Methyldopa (Aldomet) | Bradycardia |
| Diazepam (Valium) | Sedation |
| Cimetidine (Tagamet) | Confusion |
| Nitrofurantoin (Macrodantin) | Potential renal insufficiency |
| Clonidine (Catapres) | Hypotension/CNS effects |
| Disopyramide (Norpace) | Heart failure |
| Ketorolac (Toradol) | GI bleeding |
| Short-acting nifedipine (Procardia) | Hypotension |
| Doxazosin (Cardura) | Hypotension |
Discussion
The key findings of this study are that little evidence-based literature is available to guide recommendations for reducing inappropriate prescribing in elderly patients. Only a handful of randomized controlled trials have been conducted on the topic, and none of those trials involved persons older than age 85.
However, 4 methods for reducing inappropriate prescribing in the elderly are supported by some evidence: 1) incorporating pharmacist recommendations; 2) using computerized alerts in the inpatient setting; 3) reviewing medications; and 4) educating patients. No research evidence supports use of the Beers Criteria, which are based solely on consensus guidelines and expert opinions.
Limited evidence suggests that inappropriate prescribing and polypharmacy can be reduced by up to 24% using pharmacists’ recommendations based on review of patients’ charts and medications lists. This method of intervention may also reduce adverse drug events by 25% without adversely affecting health related quality of life.
Though research has shown that physicians welcome pharmacists’ recommendations, further study is needed to look at ways in which physicians and pharmacists may work together effectively to decrease inappropriate prescribing in the elderly. In addition, since the studies reviewed were conducted before the implementation of Medicare Part D and its change in pharmacy scope of practice, further study is needed to help define this new role of the pharmacist.
The studies reviewed also show that serious medication errors can be decreased by 55% and adverse drug events by 84% when physicians use computerized alerts in the inpatient setting. Considering the significance of hospital safety and quality care issues, this method provides an avenue for hospitals to decrease inappropriate prescribing in elderly hospitalized patients. However, for computerized alerts to work in the inpatient setting, the physician should have access to all pertinent patient information to make an adequate decision. Further study is also needed to determine why physicians routinely bypass or override computerized alerts.
In addition, inappropriate prescribing and polypharmacy can be reduced when a multidisciplinary team consisting of a consulting pharmacist, physician, and nurse reviews a patient’s medications through a “brown bag” review including nonprescription substances such as vitamins and herbal products. This method of intervention will not only decrease the number of medications used by older patients but also medication costs. Further study is needed to see if similar results are achieved in Geriatric Assessment Clinics and also by using the patient’s primary care physician versus a comprehensive team approach for medication review.
Reducing inappropriate prescribing in the elderly can also be achieved through a simple patient educational intervention such as a single letter recommending medications be reduced. Patient education through an outpatient evaluation and management program consisting of regular assessments and medication review protocols can reduce serious adverse drug events by 35%.
The Beers Criteria have been widely used for well over 10 years and have been adopted by the Centers for Medicare and Medicaid Services for nursing home regulation. They are, however, based on a US Consensus Panel of experts using a modified Delphi Method rather than on any research evidence. The Beers Criteria may be helpful solely as a guide in assisting the practitioner to determine whether or not a certain medication may be considered inappropriate for use in the older patient. However, further evidence-based research is needed to determine which medications are considered inappropriate for use in the older adult.
Limitations
This systematic review has several limitations. First, there are few randomized controlled trials that address inappropriate prescribing in patients 65 years of age and older, thus, limiting the strength of evidence. Secondly, the majority of studies reviewed involved healthy elderly and not ill elderly; thus, recommendations for reducing inappropriate prescribing in the elderly may not apply to ill elderly. Finally, the systematic review involved studies prior to Medicare Part D and thus do not take into account the provision of management programs under Medicare Part D. With the changing scope of pharmacy practice that Medicare Part D brings, further study will be needed to define the role of the pharmacist in prevention of medication errors.
CORRESPONDENCE
Robert M. Garcia, MD, St. Joseph’s Hospital and Medical Center, Family Medicine Residency Program, 2927 N. 7th Ave, Phoenix, AZ 85013. E-mail: [email protected]
1. Austin RP. Are you taking more meds than you need? Diabetes Forecast, June 2004.
2. Meyer TJ, Van Kooten D, Marsh S, Prochazka AV. Reduction of polypharmacy by feedback to clinician. J Gen Intern Med 1991;6:133-136.
3. Nixon RG. Geriatrics and their meds: problems and perils. EMS 2003;(Feb):35-42.
4. Stratton MA, Salinas RC. Medication management in the elderly. J Oklahoma State Medical Assoc Vol. 9, No. 3, March, 2003.
5. Kaufman DW, Kelly JP, Rosenberg L, Anderson TE, Mitchell AA. Recent patterns of medication use in the ambulatory adult population of the United States: The Stone Survey. JAMA 2002;287:337-344.
6. Population Projections of the United States by Age, Sex, Race and Hispanic Origin: 1995 to 2050. Bureau of the Census, Population Division, 1996.
7. Fick DM, Cooper JW, Wade WE, Waller JL, Maclean R, Beers MH. Updating the Beers Criteria for potentially inappropriate medication use in older adults. Results of a US Consensus Panel of Experts. Arch Intern Med 2003;163:2716-2724.
8. Perry DP. When medicine hurts instead of helps. Consultant Pharmacist 1999;14:1326-1330.
9. Hanlon JT, Schmader KE, Koronkowski MJ, et al. Adverse drug events in high risk older outpatients. J Am Geriatrics Soc 1997;45:945-948.
10. Cooper JW. Probable adverse drug reactions in a rural geriatric nursing home population: a 4-year study. J Am Geriatrics Soc 1996;44:194-197.
11. Cooper JW. Adverse drug reaction-related hospitalizations of nursing facility patients: a four-year study. South Med J 1999;92:485-490.
12. Gurwitz JH, Field TS, Harrold LR, et al. Incidence and preventability of adverse drug events among older persons in the ambulatory setting. JAMA 2003;289:1107-1116.
13. Field TS, Gurwitz JH, Harrold LR, et al. Risk factors for adverse drug events among older adults in the ambulatory setting. J Am Geriatrics Soc 2004;52:1532-1554.
14. US Department of Health and Human Services. Healthy People 2000: National Health Promotion and Disease Prevention Objectives Publication no 91-50212. Washington, DC: US Government Printing Office, 1991;67.
15. Hanlon JT, Weinberger M, et al. A randomized, controlled trial of a clinical pharmacist intervention to improve inappropriate prescribing in elderly patients with polypharmacy. Am J Med 1996;100:428-437.
16. Bates DW, Leape LL, Cullen DJ, et al. Effect of computerized physician order entry and team intervention on prevention of serious medication errors. JAMA 1998;280:1311-1316.
17. Williams ME, Pulliam CC, Hunter R, et al. The shorttTerm effect of interdisciplinary medication review on function and cost in ambulatory elderly people. J Am Geriatrics Soc 2004;52:93-98.
18. Hanlon JT, Schmader KE, Samsa GP, et al. A method for assessing drug therapy appropriateness. J Clin Epidemiol 1992;45:1045-1051.
19. Samsa G, Hanlon JT, Schmader KE, et al. A summated score for the Medication Appropriateness Index: development and assessment of clinimetric properties including content validity. J Clin Epidemiol 1994;47:891-896.
20. Weingart SN, Toth M, Sands DZ, Aronson MD, David RB, Phillips RS. Physician’s decisions to override computerized drug alerts in primary care. Arch Intern Med 2003;163:2625-2631.
21. Kucher N, Koo S, Quiroz R, et al. Electronic alerts to prevent venous thromboembolism among hospitalized patients. N Engl J Med 2005;352:969-977.
22. Bikowski RM, Rispin CM, Lorraine VL. Physician-patient congruence regarding medication regimens. J Am Geriatrics Soc 2001;49:1353-1357.
23. Fillit HM, Futterman R, et al. Polypharmacy management in Medicare managed care: Changes in prescribing by primary care physicians resulting from a program promoting medication reviews. Am J Managed Care 1999;5:587-594.
24. Yang JC, Tomlinson G, Naglie G. Medication lists for elderly patients. J Gen Intern Med 2001;16:112-115.
25. Gandhi TK, Weingart SN, Borus J, et al. Adverse drug events in ambulatory care. N Engl J Med 2003;348:1556-1564.
26. Schrader SL, Dressing B, Blue R, Jensen G, Miller D, Zawada ET. The Medication Reduction Project: Combating polypharmacy in South Dakota elders through community-based interventions. S Dak J Med 1996;49:441-448.
27. Muir AJ, Sanders LL, Wilkinson WE, Schmader K. Reducing medication regimen complexity: a controlled trial. J Gen Intern Med 2001;16:77-82.
28. Schmader KE, et al. Effects of geriatric evaluation and management on adverse drug reactions and suboptimal prescribing in the frail elderly. Am J Med 2004;116:394-401.
29. Beers MH, Ouslander JG, Rollingher I, et al. Explicit criteria for determining inappropriate medication use in nursing homes residents. Arch Intern Med 1991;151:1825-1832.
30. Beers MH. Explicit criteria for determining potentially inappropriate medication use by the elderly. An update. Arch Intern Med 1997;157:1531-1536.
31. Bressler R, Bahl JJ. Geriatric pharmacology: understanding and avoiding adverse drug reactions. Arizona Geriatrics Society 2004;9(3):3-8.
32. Fu AZ, Liu GG, Christensen DB. Inappropriate medication use and health outcomes in the elderly. J Am Geriatr Soc 2004;52:1934-1939.
- Obtain pharmacist recommendations to reduce inappropriate prescribing and adverse drug events (B).
- In the inpatient setting, use computerized alerts to reduce serious medication errors and help prevent adverse drug events (B).
- Review a patient’s medications to reduce polypharmacy and inappropriate prescribing (A).
- Educate patients to improve compliance with medications, reduce polypharmacy, reduce inappropriate prescribing, and decrease adverse events (A).
- Consider using the Beers criteria for avoiding inappropriate drugs in the elderly.
A round one third of elderly persons hospitalized end up there because of adverse drug events. Among the ambulatory elderly, 35% experience such events in a single year. The hopeful outlook is that, depending on the setting, between 25% and 95% of these events can be prevented by reducing inappropriate prescribing.
In this article we discuss 5 recommendations for reducing inappropriate medications, and offer steps to implement these recommendations.
Factors that lead to inappropriate prescribing
Inappropriate prescribing to elderly patients is increasing. It is not uncommon for older patients to receive 1 or more medications from their primary care physician and additional medications from specialty physicians, with each physician unaware of medications prescribed by the others.1 As the number of providers following the patient increases, so does the number of medications.2
One result is that the elderly use a disproportionate number of medications. They make up 13% of the US population but receive 34% of all prescriptions and consume 40% of all nonprescription medications.3,4 A recent national study of non-institutionalized US adults revealed that 90% of persons 65 years or older used at least 1 medication per week. More than 40% used 5 or more medications per week, and 12% used 10 or more per week.5 This situation may become more complicated as by the year 2030, the elderly are expected to make up 20% of the US population.6
Inappropriate prescribing, including polypharmacy, is a major contributing factor to adverse drug events in older patients (see Scope of the problem). A recent nested case-controlled study in a large multi-specialty group revealed an association between number of medications, doses of medications, and adverse drug events.13 The problem of polypharmacy as it relates to adverse drug events is so extensive that it was designated as the principal medication safety issue in the Healthy People 2000 report.14
In the year 2000, medication-related problems were responsible for 106,000 deaths at a cost of $85 billion to our healthcare system.7,8
It has been estimated that 30% of hospital admissions in elderly patients are due to drug-related problems.9 In addition, approximately two thirds of nursing facility residents will experience an adverse drug event over a 4-year period of time, with 1 in 7 of these residents requiring hospitalization.10,11
Ambulatory patients are also affected. A cohort study revealed that approximately 35% of ambulatory elderly experienced an adverse drug event over a 1-year period, 63% of whom required the attention of a physician.9 Another large cohort study, involving 30,347 Medicare enrollees cared for by a multispecialty group practice, demonstrated that adverse drug events are not only common among the elderly, but over 25% of the adverse events during a 12-month period were preventable.12 Other studies have estimated that up to 95% of adverse drug events are preventable.3 These figures are particularly troubling when considering our older patient population because 51% of all deaths caused by adverse reactions to medications occur in patients over 60 years of age.4
Adverse drug events may occur for several reasons including noncompliance, drug-drug interactions, and physician error.
Methods
In this systematic review, English language studies from January 1990 to January 2006 were searched on Medline and the Cochrane Database of Systematic Reviews. Among the specific keywords and phrases we used: adverse drug events in the elderly; inappropriate medications in the elderly; polypharmacy in the elderly; reduction of polypharmacy in the elderly; drug-drug interactions in the elderly; prevention of adverse drug events; and reduction of inappropriate prescribing in the elderly. The search was limited to studies of patients over 65 years of age.
Fifty-nine articles were identified using the above search strategy. In selecting articles on which to base the recommendations in this paper, we gave first priority to randomized controlled trials. When randomized controlled trials did not exist, we used cohort studies or meta-analyses. We excluded review articles and articles that did not specifically address the issue of reducing inappropriate prescribing for elderly patients.
Results
TABLE W1 describes the results of the systematic review. Of the initial 59 articles, we excluded 26 review articles and 13 that did not address inappropriate prescribing. The remaining 19 articles were classified into 5 categories based on the methods studied for reducing inappropriate prescribing. The methods recommended in each of the 5 categories were supported by varying levels of evidence.
Four methods were supported by controlled trials, thus providing a higher level of evidence to support: 1) incorporating pharmacist recommendations, 2) use of computerized alerts, 3) review of patient’s medication list and 4) patient education (TABLE W2). The fifth method, avoiding inappropriate medications, was based on consensus guidelines and expert opinions.
Method 1: Incorporate pharmacist recommendations
Having a pharmacist participate in the care of elderly patients can reduce polypharmacy and adverse drug events.
A randomized controlled trial of 208 patients at a Veterans’ Administration (VA) medical clinic, aged 65 years of age or older and taking 5 or more medications, demonstrated that involving a clinical pharmacist in the patient’s care reduces inappropriate prescribing and adverse drug effects without adversely affecting health-related quality of life.15
In this VA study, patients were randomized to an intervention group and a control group. In the intervention group, a clinical pharmacist met with patients during all scheduled office visits to evaluate and make recommendations about their drug regimens. Before each visit, the clinical pharmacist reviewed the patient’s medical record and current medications, and assessed each medication using the “Medication Appropriateness Index” as a guideline.18,19 Written drug therapy recommendations were then sent to the physician.
Key outcome measures in this study were the rate of prescribing inappropriateness, medication compliance and knowledge, number of medications, adverse drug events, health-related quality of life, patient satisfaction, and physician receptivity to the intervention.
The results show that inappropriate prescribing and the number of drugs prescribed decreased by 24% in the intervention group but only by 6 % in the control group. In addition, fewer intervention-group patients than control patients experienced adverse drug events (30% vs. 40%; P=.19). Physicians were receptive to the clinical pharmacist’s interventions and enacted changes recommended by the clinical pharmacist more frequently than they enacted changes independently for control patients (55.1% vs. 19.8%; P=.001).15
Engaging the pharmacist. Encourage your patients to fill prescriptions by all physicians at the same pharmacy, thereby enabling the maintenance of a single current list of medications. Have your office staff alert the pharmacist whenever a medication is discontinued.
When a patient refills medications, the pharmacist routinely reviews the database for potential adverse drug events. The pharmacist should then alert the physician of potential inappropriate medications or adverse drug events.
Method 2: Use computerized alerts
Computerized alerts provide warnings to physicians using computerized order entry systems. The system contains information on patients’ current medications and drug intolerances and allergies. An “alert” is generated by the system when there is a potential drug allergy, drug intolerance or drug interaction as defined by the National Drug Data File of First Databank Inc. The use of computerized alerts for reducing polypharmacy and inappropriate prescribing has been examined in both outpatient and inpatient settings.
Outpatient. A recent study examined the rate at which physicians overrode computerized alerts among 3481 consecutive alerts generated at 5 adult primary care practices that used a common computerized physician order entry system for prescription writing.20 Of the 3481 consecutive alerts, physicians overrode 91.2% of the alerts but 8.8% resulted in a change in prescribing.
Although few physicians changed their prescriptions in response to an alert, there were few adverse drug events despite the large number of alerts that were overridden. This may have indicated an alert threshold that was set too low.21
Inpatient. A randomized comparison study conducted at a large tertiary hospital demonstrated that physician computer order entry decreased the rate of serious medication errors by more than half.16 This study was divided into 2 phases. Phase I involved 2491 admissions and was designed as “baseline.” Phase II involved 4220 admissions that occurred after the intervention was implemented. The intervention itself was implementation of a computerized order entry system that required the ordering physician to complete a menu of information including drug name, medication dose, route, and frequency. Computerization ensured legibility of all orders. The main outcome measured was serious medication errors.
In comparison of the 2 phases, serious medication errors decreased 55%, from 10.7 events per 1000 patient-days in Phase I to 4.86 events per thousand in Phase II (P=.1). Preventable adverse drug events declined 17%, while most significantly potential adverse drug events declined 84%.16
Another study, this one a randomized controlled study of electronic alerts to remind physicians of prescribed measures to prevent venous thromboembolism in hospitalized patients, also found benefit to an alert system. But the results showed that 3 conditions are needed for the success of the clinical alerts. First, there must be acceptance by the physicians. Secondly, the electronic alerts should deliver simple messages that prevent physicians from routinely bypassing them. Thirdly, the physician should have access to all pertinent information to make an adequate decision.21
Method 3: Review of medications
Reviewing a patient’s medications regularly can reduce polypharmacy and inappropriate prescribing. This has been shown in at least 4 studies.
Physicians often unaware of what patients are, or are not, taking. One prospective observational study of medication review showed a high rate of discrepancy between medications the physician thought a patient was taking and those the patient actually was taking. This study involved patients 65 years of age or older who were taking 4 or more medications. There were 50 physicians-patient pairs blinded at the initial visit. After the initial visit, physicians were given the patient’s chart, with a request to complete a questionnaire on all prescription and nonprescription medications with dosages and frequencies of administration. All patient records contained a flow sheet for review of medications including current, discontinued, and over-the-counter medications.
Home visits were conducted 10 days after initial visits to gather detailed information from patients regarding their understanding of medication regimens. Data obtained showed that 74% of patients were taking at least 1 medication the physician was unaware of, or were not taking a medication the physician thought they were taking. Moreover, in 12% of cases, there were discrepancies in understanding about dose or frequency of medication regimens.22
“Brown bag” assessment useful. In the second study, a program promoting medication reviews between primary care physicians and their elderly patients significantly changed prescribing by physicians. In this prospective study, elderly patients taking 5 or more medications were sent a letter encouraging them to meet with their primary care physician for a medication review. Interventions included notifying the physician that their patients were at high risk for inappropriate prescribing, providing the physician with a “medication management” report that listed all prescriptions, doses, and pills dispensed per prescription, and clinical practice guidelines for effectively preventing and managing inappropriate prescribing. These guidelines emphasized the “brown bag” medication review of both nonprescription and prescription medications (ie, having the patient bring all their medication to the office in a brown bag).
With this intervention, 20% of patients reported discontinuation of a medication, 29% reported a change in medication, and 17% reported a medication that the physician did not know the patient was taking. Forty-five percent of physicians made at least 1 change in a patient’s medication regimen.23
Include all preparations patients use. A third study showed that the medication review should focus not just on prescription drugs but also on nonprescription agents such as vitamins, laxatives, minerals, analgesics, and herbal and natural remedies. This prospective cross-sectional study at 3 university affiliated geriatric clinics involved a room-to-room search of patients’ homes to identify all substances a patient might be taking. The medications identified in the home were compared with the medication list in the clinic and with medications found in the “brown bag evaluation” and by interview. The physician’s understanding of medications a patient was taking matched the patient’s actual use of medications only 52% of the time; much of the mismatch was attributable to nonprescription medications.24
Finally, in a fourth study, a randomized controlled trial, 133 community dwelling adults taking 5 or more medications were assessed at baseline by physician exam, symptom review, and objective tests of physical and cognitive functioning. Sixty-three subjects were randomized to the intervention group and 77 to the control group.
The primary intervention was a review and modification of a patient’s medication regimen by a multidisciplinary team consisting of a consultant pharmacist, physician, and nurse. This intervention was not available to the control group. Medication usage in both groups was re-evaluated at 6 weeks using a brown-bag review.
The control group decreased their medication use by an average of 0.04 medications per month, while the intervention subjects decreased their medications by an average of 1.5 drugs (although the team has actually recommended discontinuation of an average of 4.5 drugs per patient). The difference between recommended discontinuation and actual discontinuation was attributed to patients’ resistance to changing medications.
Intervention subjects saved an average of $26.92 per month in wholesale costs while control subjects saved an average of $6.75 per month. No differences in functioning were observed between groups.17
Method 4: Patient education
The most beneficial intervention may be enhancing communication between providers and patients, and educating patients about medication regimens, potential side effects, and adverse drug events.
Encourage reporting of symptoms. A recent prospective cohort study showed that 63% of preventable events were attributed to the physician’s failure to respond to medication-related symptoms; 37% were due to the patient’s failure to inform the physician of the symptoms.25
Intensive counseling reaps big benefits. In a second study, the South Dakota Medication Reduction Project, educational presentations by pharmacists and one-on-one sessions between pharmacists and patients resulted in patients taking fewer medications and reducing dosages in medical regimens. This longitudinal study involved over 1000 older adults in rural and urban southeastern South Dakota communities over 6 months.
A pharmacist specializing in geriatrics gave a 30-minute presentation at various sites on medication-associated problems and “do’s” and “don’ts” of medication use. This was followed by a 15-minute question-and-answer session.
A one-on-one 20-minute consultation between the pharmacist and patients followed the group presentation. The pharmacist recorded demographic data, medical history, medication names, doses, directions, and intended purposes, and obtained feedback about compliance and side effects. The pharmacist also provided oral counseling and written information about medications.
If a potentially serious drug-related problem was identified, a letter was sent to the patient’s primary care physician, identifying key inappropriate prescribing concerns and offering alternative interventions for the physician’s consideration.
Three months after the educational intervention, a telephone survey was performed. Survey results indicated that older adults participating in the one-on-one reviews were taking fewer medications, were more likely to take their medications, had dosage reductions, and increased their use of nonpharmacologic alternatives.26
But even modest intervention pays off. In another randomized study, a simple education intervention significantly reduced inappropriate prescribing for elderly patients. Participants in the intervention group taking more than 10 medications were sent a single letter recommending that medications be reduced. Similar participants in the control group did not receive letters.
The outcome measured was number of medications. In the notification group, an average reduction of approximately 3 medications occurred over a 4-month period. More complex intervention did not reduce inappropriate prescribing any further.2
Value of visual reminders. Another study showed that a simple visual intervention significantly reduced inappropriate prescribing. In this controlled trial, physicians were shown a medication grid that displayed all of their patient’s medications and times of administration for 1 week. In the intervention group, medications decreased by 2.47 per patient. In the control group, medications increased by 1.65 per patient and doses increased by 3.83 per patient.27
Try a team approach? Yet another randomized study showed that compared with usual care, education through an outpatient geriatric evaluation and management program reduced the number of serious adverse drug events and inappropriate prescribing for frail elderly patients. Patient management guideline interventions consisted of regular assessments and medication recommendations by pharmacists. There was also a core team comprised of a geriatrician, social worker, and a nurse who participated in evaluation and management protocols such as medication reviews. The program reduced the risk of serious adverse drug events by 35%, compared with usual care of the geriatric patient.28
Method 5: Avoid inappropriate medications
The Beers criteria aid in identifying medications to be avoided in older persons. They were developed in 1991, then updated in 1997 and again in 2003. In short, these criteria designate as “inappropriate” any medication that has shown the potential for adverse effects in the elderly.7,29,30
In the 2003 update, a US consensus panel of experts used a modified Delphi method to review medications potentially ineffective or unsafe in the elderly.7,29,30 The TABLE shows selected examples of commonly used medications considered inappropriate.7,29-32
Limited research supports use of the Beers criteria. The 1996 Medical Expenditure Panel Survey controlled for a number of confounding factors and found strong evidence of a sizable and consistent negative effect of using medications identified as inappropriate by the Beers criteria.32
TABLE
Potentially inappropriate medications in the elderly
| MEDICATION | POTENTIAL ADVERSE EFFECT |
|---|---|
| Meperidine (Demerol) | Confusion |
| Propoxyphene (Darvon) | CNS effects |
| Diphenhydramine (Benadryl) | Sedation |
| Long-term use of NSAIDs | GI bleeding |
| Amitriptyline (Elavil) | Sedation/anticholinergic effects |
| Methyldopa (Aldomet) | Bradycardia |
| Diazepam (Valium) | Sedation |
| Cimetidine (Tagamet) | Confusion |
| Nitrofurantoin (Macrodantin) | Potential renal insufficiency |
| Clonidine (Catapres) | Hypotension/CNS effects |
| Disopyramide (Norpace) | Heart failure |
| Ketorolac (Toradol) | GI bleeding |
| Short-acting nifedipine (Procardia) | Hypotension |
| Doxazosin (Cardura) | Hypotension |
Discussion
The key findings of this study are that little evidence-based literature is available to guide recommendations for reducing inappropriate prescribing in elderly patients. Only a handful of randomized controlled trials have been conducted on the topic, and none of those trials involved persons older than age 85.
However, 4 methods for reducing inappropriate prescribing in the elderly are supported by some evidence: 1) incorporating pharmacist recommendations; 2) using computerized alerts in the inpatient setting; 3) reviewing medications; and 4) educating patients. No research evidence supports use of the Beers Criteria, which are based solely on consensus guidelines and expert opinions.
Limited evidence suggests that inappropriate prescribing and polypharmacy can be reduced by up to 24% using pharmacists’ recommendations based on review of patients’ charts and medications lists. This method of intervention may also reduce adverse drug events by 25% without adversely affecting health related quality of life.
Though research has shown that physicians welcome pharmacists’ recommendations, further study is needed to look at ways in which physicians and pharmacists may work together effectively to decrease inappropriate prescribing in the elderly. In addition, since the studies reviewed were conducted before the implementation of Medicare Part D and its change in pharmacy scope of practice, further study is needed to help define this new role of the pharmacist.
The studies reviewed also show that serious medication errors can be decreased by 55% and adverse drug events by 84% when physicians use computerized alerts in the inpatient setting. Considering the significance of hospital safety and quality care issues, this method provides an avenue for hospitals to decrease inappropriate prescribing in elderly hospitalized patients. However, for computerized alerts to work in the inpatient setting, the physician should have access to all pertinent patient information to make an adequate decision. Further study is also needed to determine why physicians routinely bypass or override computerized alerts.
In addition, inappropriate prescribing and polypharmacy can be reduced when a multidisciplinary team consisting of a consulting pharmacist, physician, and nurse reviews a patient’s medications through a “brown bag” review including nonprescription substances such as vitamins and herbal products. This method of intervention will not only decrease the number of medications used by older patients but also medication costs. Further study is needed to see if similar results are achieved in Geriatric Assessment Clinics and also by using the patient’s primary care physician versus a comprehensive team approach for medication review.
Reducing inappropriate prescribing in the elderly can also be achieved through a simple patient educational intervention such as a single letter recommending medications be reduced. Patient education through an outpatient evaluation and management program consisting of regular assessments and medication review protocols can reduce serious adverse drug events by 35%.
The Beers Criteria have been widely used for well over 10 years and have been adopted by the Centers for Medicare and Medicaid Services for nursing home regulation. They are, however, based on a US Consensus Panel of experts using a modified Delphi Method rather than on any research evidence. The Beers Criteria may be helpful solely as a guide in assisting the practitioner to determine whether or not a certain medication may be considered inappropriate for use in the older patient. However, further evidence-based research is needed to determine which medications are considered inappropriate for use in the older adult.
Limitations
This systematic review has several limitations. First, there are few randomized controlled trials that address inappropriate prescribing in patients 65 years of age and older, thus, limiting the strength of evidence. Secondly, the majority of studies reviewed involved healthy elderly and not ill elderly; thus, recommendations for reducing inappropriate prescribing in the elderly may not apply to ill elderly. Finally, the systematic review involved studies prior to Medicare Part D and thus do not take into account the provision of management programs under Medicare Part D. With the changing scope of pharmacy practice that Medicare Part D brings, further study will be needed to define the role of the pharmacist in prevention of medication errors.
CORRESPONDENCE
Robert M. Garcia, MD, St. Joseph’s Hospital and Medical Center, Family Medicine Residency Program, 2927 N. 7th Ave, Phoenix, AZ 85013. E-mail: [email protected]
1. Austin RP. Are you taking more meds than you need? Diabetes Forecast, June 2004.
2. Meyer TJ, Van Kooten D, Marsh S, Prochazka AV. Reduction of polypharmacy by feedback to clinician. J Gen Intern Med 1991;6:133-136.
3. Nixon RG. Geriatrics and their meds: problems and perils. EMS 2003;(Feb):35-42.
4. Stratton MA, Salinas RC. Medication management in the elderly. J Oklahoma State Medical Assoc Vol. 9, No. 3, March, 2003.
5. Kaufman DW, Kelly JP, Rosenberg L, Anderson TE, Mitchell AA. Recent patterns of medication use in the ambulatory adult population of the United States: The Stone Survey. JAMA 2002;287:337-344.
6. Population Projections of the United States by Age, Sex, Race and Hispanic Origin: 1995 to 2050. Bureau of the Census, Population Division, 1996.
7. Fick DM, Cooper JW, Wade WE, Waller JL, Maclean R, Beers MH. Updating the Beers Criteria for potentially inappropriate medication use in older adults. Results of a US Consensus Panel of Experts. Arch Intern Med 2003;163:2716-2724.
8. Perry DP. When medicine hurts instead of helps. Consultant Pharmacist 1999;14:1326-1330.
9. Hanlon JT, Schmader KE, Koronkowski MJ, et al. Adverse drug events in high risk older outpatients. J Am Geriatrics Soc 1997;45:945-948.
10. Cooper JW. Probable adverse drug reactions in a rural geriatric nursing home population: a 4-year study. J Am Geriatrics Soc 1996;44:194-197.
11. Cooper JW. Adverse drug reaction-related hospitalizations of nursing facility patients: a four-year study. South Med J 1999;92:485-490.
12. Gurwitz JH, Field TS, Harrold LR, et al. Incidence and preventability of adverse drug events among older persons in the ambulatory setting. JAMA 2003;289:1107-1116.
13. Field TS, Gurwitz JH, Harrold LR, et al. Risk factors for adverse drug events among older adults in the ambulatory setting. J Am Geriatrics Soc 2004;52:1532-1554.
14. US Department of Health and Human Services. Healthy People 2000: National Health Promotion and Disease Prevention Objectives Publication no 91-50212. Washington, DC: US Government Printing Office, 1991;67.
15. Hanlon JT, Weinberger M, et al. A randomized, controlled trial of a clinical pharmacist intervention to improve inappropriate prescribing in elderly patients with polypharmacy. Am J Med 1996;100:428-437.
16. Bates DW, Leape LL, Cullen DJ, et al. Effect of computerized physician order entry and team intervention on prevention of serious medication errors. JAMA 1998;280:1311-1316.
17. Williams ME, Pulliam CC, Hunter R, et al. The shorttTerm effect of interdisciplinary medication review on function and cost in ambulatory elderly people. J Am Geriatrics Soc 2004;52:93-98.
18. Hanlon JT, Schmader KE, Samsa GP, et al. A method for assessing drug therapy appropriateness. J Clin Epidemiol 1992;45:1045-1051.
19. Samsa G, Hanlon JT, Schmader KE, et al. A summated score for the Medication Appropriateness Index: development and assessment of clinimetric properties including content validity. J Clin Epidemiol 1994;47:891-896.
20. Weingart SN, Toth M, Sands DZ, Aronson MD, David RB, Phillips RS. Physician’s decisions to override computerized drug alerts in primary care. Arch Intern Med 2003;163:2625-2631.
21. Kucher N, Koo S, Quiroz R, et al. Electronic alerts to prevent venous thromboembolism among hospitalized patients. N Engl J Med 2005;352:969-977.
22. Bikowski RM, Rispin CM, Lorraine VL. Physician-patient congruence regarding medication regimens. J Am Geriatrics Soc 2001;49:1353-1357.
23. Fillit HM, Futterman R, et al. Polypharmacy management in Medicare managed care: Changes in prescribing by primary care physicians resulting from a program promoting medication reviews. Am J Managed Care 1999;5:587-594.
24. Yang JC, Tomlinson G, Naglie G. Medication lists for elderly patients. J Gen Intern Med 2001;16:112-115.
25. Gandhi TK, Weingart SN, Borus J, et al. Adverse drug events in ambulatory care. N Engl J Med 2003;348:1556-1564.
26. Schrader SL, Dressing B, Blue R, Jensen G, Miller D, Zawada ET. The Medication Reduction Project: Combating polypharmacy in South Dakota elders through community-based interventions. S Dak J Med 1996;49:441-448.
27. Muir AJ, Sanders LL, Wilkinson WE, Schmader K. Reducing medication regimen complexity: a controlled trial. J Gen Intern Med 2001;16:77-82.
28. Schmader KE, et al. Effects of geriatric evaluation and management on adverse drug reactions and suboptimal prescribing in the frail elderly. Am J Med 2004;116:394-401.
29. Beers MH, Ouslander JG, Rollingher I, et al. Explicit criteria for determining inappropriate medication use in nursing homes residents. Arch Intern Med 1991;151:1825-1832.
30. Beers MH. Explicit criteria for determining potentially inappropriate medication use by the elderly. An update. Arch Intern Med 1997;157:1531-1536.
31. Bressler R, Bahl JJ. Geriatric pharmacology: understanding and avoiding adverse drug reactions. Arizona Geriatrics Society 2004;9(3):3-8.
32. Fu AZ, Liu GG, Christensen DB. Inappropriate medication use and health outcomes in the elderly. J Am Geriatr Soc 2004;52:1934-1939.
Hypertension: Which drugs to choose for patients with cardiovascular disease
- Decreasing blood pressure by 5 mm Hg will decrease mortality due to stroke by 14%, attenuate cardiac mortality by 9%, and reduce all-cause mortality by 7% (A).
- Patients with heart failure should receive angiotensin-converting enzyme inhibitors if they are clinically tolerated (A). Beta-blockers are also recommended (A). Although aldosterone antagonists are appropriate for use in patients with heart failure (A), we recommend they are taken under the care of a cardiologist to minimize complications and to insure that a complete heart failure plan is in place (C).
- For coronary artery disease, it is now considered standard of care to add a beta-blocker to all patients post–MI that do not have severe heart block or are in cardiogenic shock (A).
- Perindopril plus indapamide should be used in all patients with a history of stroke or transient ischemic attack regardless of blood pressure (B).
Hypertension precedes more than 75% of heart failure cases and 50% of heart attacks. In 67% of first-time strokes, blood pressure exceeds 140/90 mm Hg.1 For those in heart failure or at risk of recurrent myocardial infarction (MI) or stroke, the need to reduce unrecognized or under-treated hypertension is urgent. Thankfully it is possible to select an agent that can lower blood pressure—the most important immediate goal—and confer benefit to the associated cardiovascular disorder.
Given the number of agents used for both hypertension and other cardiovascular conditions, we sought in this study to evaluate which drug classes would best achieve blood pressure treatment goals and reduce morbidity and mortality for patients with cardiac disease. In this article, you will find practical recommendations for drug selection and appropriate regimens.
Even small blood pressure reductions yield big benefits for comorbidities
Using the population of the National Health and Nutrition Examination Survey I Epidemiologic Follow Up Study, Ogden and colleagues2 found that the benefit of treating high blood pressure over a decade depended on lowering systolic blood pressure and on treating other relevant cardiovascular comorbidities. Specifically, the number needed to treat (NNT) and prevent a death was directly related to the risk stratification of patients and their initial blood pressure (TABLE W1) (LOE: 1).
In another provocative trial, the Swedish Trial in Old Patients with Hypertension-2 Study (STOP Hypertension-2)3 evaluated the use of beta-blockers, diuretics, angiotensin-converting enzyme (ACE) inhibitors, or calcium channel blockers. Results of this trial showed that an overall reduction in cardiovascular events related to the ability of a drug class to lower blood pressure (LOE: 1).3
In addition, a meta-analysis of 29 randomized trials (n=162,341) in the Blood Pressure Lowering Treatment Trialists’ Collaboration Trial (BPLTTC)4 showed that all antihypertensive drug classes significantly reduce blood pressure. This meta-analysis confirmed an overall reduction in cardiovascular events, with perceived risk reduction directly proportional to blood pressure reduction (LOE: 1). This advantage was consistent irrespective of drug class (beta-blocker, diuretic, ACE inhibitor, calcium-channel blocker, or angiotensin receptor blocker [ARB]), although different drug classes were recognized to have unique benefits specific to individual patient populations.
Should the BP target level be lowered? Recent evidence suggests that the currently accepted range for normal blood pressure may be too high.5,6
Lewington and colleagues performed a meta-analysis of 61 prospective studies with more than 1 million participants. Using a “time-dependent” correction for regression dilution, they sorted deaths in each decade of age according to estimated blood pressures at the start of the decade (LOE: 1).5 They found that with each decade of life there was a proportional decline in the risk of cardiovascular deaths when blood pressures were controlled incrementally to levels of 115 mm Hg systolic blood pressure and 75 mm Hg diastolic blood pressure (LOE: 1).5 At blood pressures below 115/75 mm Hg, no difference was observed.
In addition, Vasan and collaborators,6 using the Framingham Heart Study database (n=6859 participants), reported an increase in cardiovascular events with higher baseline levels of blood pressure. When compared with optimal blood pressure levels, those with high-normal blood pressure (130–139/85–89 mm Hg) had a risk-factor-adjusted hazard ratio for cardiovascular disease of 2.5 for women and 1.6 for men (LOE: 1).6
The “take-home” message. A small reduction in blood pressure yields a very significant risk reduction. Decreasing blood pressure by 5 mm Hg will decrease mortality due to stroke by 14%, cardiac mortality by 9%, and all cause mortality by 7% (LOE: 1).7 These data suggest that aggressive intervention to affect small changes might affect large differences in morbidity and mortality.
Antihypertensive drugs in heart failure
Angiotensin-converting enzyme inhibitors
Give all patients with heart failure an ACE inhibitor, if clinically tolerated (SOR: A). Although blood pressure control is very important to treat the physiology and neurohormonal basis of heart failure, the primary reason to use ACE inhibitors (as well as other medications) is to provide a disease modifying intervention and treat blood pressure when it is elevated. Different disease conditions require different doses to achieve the desired goal. With heart failure, the dose of an ACE inhibitor is given twice daily at typically 2 to 3 times the dose of that used for hypertension.
The evidence. In 1991, the Studies of Left Ventricular Dysfunction (SOLVD) trial8 demonstrated a 26% risk reduction for death or hospitalization due to heart failure (95% confidence interval [CI], 18–34) for those treated with the ACE inhibitor enalapril (Vasotec) (LOE: 1). The following year, the Survival and Ventricular Enlargement (SAVE)9 trial demonstrated a risk reduction of 19% for patients with a reduced ejection fraction after myocardial infarction (MI) when the ACE inhibitor captopril (Capoten) was used (LOE: 1).
The calculated NNT with an ACE inhibitor to save 1 life over 1 year is 43.10 (See TABLE W2 for a summary of clinical trials and levels of evidence.) The TABLE in this article summarizes treatment recommendations based on these studies.8-23
TABLE
Drugs of choice for hypertension and various comorbidities
| TREATMENT RECOMMENDATIONS BASED ON STUDIES/GUIDELINES | SOR |
|---|---|
| Congestive Heart Failure | |
| ACE inhibitor should be used in patients with heart failure unless a contraindication exists8,9,11,12 | A |
| Beta-blockers should be used in patients with heart failure unless a contraindication exists11-15 | A |
| ARB should be used in heart failure if patient is intolerant to ACE inhibitor12 | A |
| Aldosterone antagonists should be used in patients with severe heart failure unless a contraindication exists16,17 | A |
| Aldosterone antagonists should be prescribed in consultation with a cardiologist | C |
| Coronary Artery Disease | |
| Beta-blockers should be used in patients post-MI unless a contraindication exists11,13,18,19 | A |
| CCB should be used in patients with stable coronary artery disease unless a contraindication exists11,20 | A |
| ACE inhibitors should be used in patients with stable coronary artery disease and no left ventricular dysfunction unless a contraindication exists11,21,22 | A |
| Stroke | |
| ACE inhibitor and indapamide should be used in patients with a TIA or stroke unless a contraindication exists11,23 | B |
| ACE, angiotensin-converting enzyme; ARB, angiotensin receptor blocker; CCB, calcium channel blocker; MI, myocardial infarction; SOR, strength of recommendation; TIA, transient ischemic attack | |
Beta-blockers
Give a beta-blocker, if tolerated, to patients in heart failure (SOR: A). Dosing has been determined by clinical trial data. In general, in order to significantly impact morbidity and mortality in congestive heart failure, the patient needs to reach a dose of 150 mg of metoprolol XL a day or 6.25 mg to 12.5 mg of carvedilol given twice daily. Ideal doses are greater than 200 mg/d of metoprolol XL or 25 mg twice daily of carvedilol.
The evidence. The Cardiac Insufficiency Bisoprolol Study (CIBIS),24 published in 1994, was a randomized, placebo-controlled, double-blind trial designed to test the efficacy of beta-blockade in the treatment of heart failure (LOE: 1). Although no difference in mortality was demonstrated between intervention and control groups, the intervention group showed improved functional status.
The Carvedilol Post Infarct Survival Control in Left Ventricular Dysfunction (CAPRICORN)13 trial (LOE: 1) evaluated patients with left ventricular dysfunction or heart failure after an MI, while the Carvedilol Prospective Randomized Cumulative Survey (COPERNICUS)14 group (LOE: 1) enrolled only patients with severe heart failure (ejection fraction <25%, NYHA class III and IV). These studies demonstrated an overall decrease in cardiovascular morbidity and mortality, as well as all-cause mortality for patients with heart failure receiving the nonspecific beta-blocker carvedilol (Coreg) (receptor blockade at β1, β2, α1). CAPRICORN produced an overall risk reduction in mortality of 2% to 3% at 1 year, resulting in the same NNT (43) over 1 year as ACE inhibitors.13 This is the only beta-blocker tested after infarction to demonstrate a mortality difference for patients with heart failure or decreased left ventricular dysfunction (ejection fraction <40%).
Hypertension specialists debate about how to approach the hypertensive patient. The Seventh Report of the Joint National Committee on Prevention, Detection, Evaluation, and Management of High Blood Pressure (JNC-7) guidelines11 call for defined goals in lowering blood pressure and a stepwise selection of drugs based on comorbidities.
Some leading hypertension experts say this is too formulaic. Dr Michael Alderman, Professor in the Department of Medicine and Epidemiology and Population Health at the Albert Einstein School of Medicine, argues “we have to get over the limitation of the straightjacket of numbers to define our actions.”25 He further asserts that “our willingness to drive blood pressure down has to be modulated by the risk the patient has and the price one has to pay to lower it. A 30% reduction in risk does not mean much if your risk is low, but if your risk is high it means a lot.”25 As such, Dr Alderman argues we should base treatment decisions on “total risk” and not the level of blood pressure. Other leaders in the field such as Mathew Weir, MD, director of the Division of Nephrology, University of Maryland, and Richard Devreaux, MD, Professor of Medicine, Division of Cardiology, Cornell University Medical Center, agree with this more individualized approach.25
But understanding the basic formula is what helps us innovate. In general, we agree that individualizing patient care is the ideal, and that some patients may not tolerate “recommended” treatment. However, it is not possible for physicians to individualize care (a highly complex undertaking) when they still lack understanding at the basic level of care. With the poor treatment of hypertension in the US, we believe that guidelines such as JNC-7 are essential to improving blood pressure control.
Hyman and Pavlik26 demonstrated that physician factors, especially lack of awareness of hypertension treatment recommendations, correlate with poor hypertension treatment. In their 2001 study that included 1200 primary care physicians, 41% of physicians were not familiar with or had not heard of the recommendations. This finding was not trivial. The importance of familiarity with JNC-7 guidelines was demonstrated when statistical analysis revealed that a working knowledge of these guidelines significantly increased adherence with published recommendations (including blood pressure control). As such, it would appear that not following the guidelines has less to do with disagreements over treatment options and more to do with understanding the value of the guidelines to basic management.
The Metoprolol CR/XL Randomized Intervention Trial in Congestive Heart Failure (MERIT-HF)15 concluded that the addition of extended-release metoprolol (Lopressor, a β1-adrenergic receptor blocker) for patients with heart failure demonstrated a survival benefit when compared with patients not receiving a beta-blocker (LOE: 1). One of the essential elements of this trial was the ability to achieve a dose of 200 mg of metoprolol a day. Frequently in clinical practice low-dose or even homeopathic doses are used with few data to support such use.
The Carvedilol or Metoprolol European Trial (COMET)27 of patients with heart failure suggested that nonselective neurohumoral (β and α) blockade may increase the benefit in comparison with selective β1-blockade (LOE: 1). There has been significant debate regarding the dose and the formulation of the drugs in COMET, but we advocate using doses and drug formulations that were specifically in the large prospective randomized trials (CIBIS II, the carvedilol trials, and MERIT-HF).
Angiotensin receptor blockers
Prescribe an ARB only when a patient cannot tolerate an ACE inhibitor secondary to cough or hyperkalemia.12 As these are generally used after or as an adjunct to ACE inhibitors, the usual dose is similar to that for blood pressure dosed twice daily. If patients do not tolerate ACE inhibitors, theses doses may also be higher than those used for blood pressure response alone.
The evidence. The Losartan Heart Failure Survival Study (ELITE II)28 demonstrated the benefit of the ARB losartan (Cozaar) in the treatment of heart failure, but not superiority over previously used ACE inhibitors (LOE: 1). In addition, there was no difference in renal insufficiency with one drug class compared with another. Researchers concluded that ARBs should be used only for patients intolerant to ACE inhibitors.
The Valsartan Heart Failure Trial Investigators Study (Val-HeFT)29 randomized 5010 patients to receive valsartan (Diovan) or placebo combined with standard therapy (ACE inhibitors and beta-blockers) (LOE: 1). The ARB group demonstrated a 13.2% greater reduction than placebo in the combined endpoint of morbidity and mortality (as defined by incidence of cardiac arrest and resuscitation, hospitalization for heat failure, or administration of intravenous inotropes or vasodilators for a minimum of 4 hours). However, a post-study review29 of patients who received the ARB, ACE inhibitor, and beta-blocker combination showed increased mortality.
In 2004, the Candesartan in Heart failure Assessment of Reduction in Mortality and morbidity trial (CHARM)30 found that when the ARB candesartan (Atacand) was added to standard therapy (ACE inhibitor, beta-blockers, aldosterone antagonist) there was a 33% reduction in all-cause mortality, similar to that found with beta-blockers and ACE inhibitors) (LOE: 1). In addition, the CHARM group found no increased risk when candesartan was combined with other treatments; it concluded that ARBs could be added to regimens for all patients with heart failure unless a contraindication exists.
The American College of Cardiology/American Heart Association guidelines prefer ACE inhibitors over ARBs, and recommend ARBs be used when an ACE inhibitor is not tolerated or if there are other contraindications. A low level of evidence (2b) suggests that an ARB may be added to conventional medical therapy with an increased risk of renal insufficiency and hyperkalemia (SOR: A).12
Potassium-sparing diuretics
Aldosterone antagonists are appropriate for patients with heart failure (SOR: A), though we recommend working in conjunction with a cardiologist to minimize complications and to insure that a complete heart failure plan is in place (SOR: C). Spirinolactone (Aldactone, Aldactazide) is used for physiologic purposes (as a neurohormonal regulator) and is not used for blood pressure control. Most heart failure specialists begin with a dose of 12.5 mg/d and advance to doses utilized in the clinical trials (25–50 mg/d).
The evidence. Potassium-sparing diuretics lower mortality among heart failure patients. Spironolactone works in part by reducing aldosterone levels and increasing serum potassium.
In the Randomized Aldactone Evaluation Study (RALES),16 patients with severe heart failure (ejection fraction <35%) on standard medical therapy were randomized to receive spironolactone or placebo (LOE: 1). The spironolactone group exhibited a 30% reduction in mortality compared with conventional medical therapy, and the study was ended early at 24 months.
In the Eplerenone Post Acute Myocardial Infarction Heart Failure Efficacy and Survival Study (EPHESUS),17 an overall reduction in death of 8%, a decrease of sudden cardiac death by >20% (relative risk reduction), as well as an overall reduction of hospitalization for heart failure of 15% occurred in the eplerenone (Inspra) group (LOE: 1) (NNT to save 1 life in 1 year=50).
It is worth noting that the doses used in these studies were devised to alter neurohumoral regulation, and are not to be used as significant diuretics. To date, no comparative study between spironolactone and eplerenone has been undertaken.
Coronary artery disease
Beta-blockers
Prescribe a beta-blocker for every post-MI patient without severe heart block or cardiogenic shock (SOR: A).
The evidence. The Beta-Blocker Heart Attack Trial (BHAT),18 sponsored by the National Heart, Lung, and Blood Institute, was designed to evaluate the benefits of the beta-blocker propranolol (Inderal) after MI (completed more than 24 years ago, before modern medical therapy) (LOE: 1). Total mortality during the average 24-month follow-up period was 7.2% in the propranolol group and 9.8% in the placebo group. The incidence of nonfatal reinfarction was decreased by 15.6% in the treatment group.
A similar trial completed in the early 1980s was The Norwegian Multi-Center Study.19 This trial, which assessed the efficacy of timolol (Blocadren, Timolide) after MI, demonstrated a 44.6% reduction in sudden cardiac death (LOE: 1). The study group reached the same conclusion as the BHAT researchers, and recommended that beta-blockers be used following an MI to reduce reinfarction and death.
Angiotensin-converting enzyme inhibitors
Use ACE inhibitors only for stable post-MI patients without decreased left ventricular function.
The evidence. The Prevention of Events with Angiotensin Converting Enzyme Inhibition (PEACE) trial31 evaluated the benefit of using an ACE inhibitor for patients with stable coronary artery disease and slightly reduced ejection fraction (>40%) (LOE: 1). There was no statistical difference in the primary endpoint (cardiac-induced death, MI, or need for revascularization) between the treatment group (21.9%) and the placebo group (22.5%).
Contrary to the findings of the PEACE trial, many other studies have shown that ACE inhibitors are beneficial for patients with coronary artery disease. In the Trandolapril Cardiac Evaluation (TRACE) study,32 patients stabilized after acute MI were randomized to receive the ACE inhibitor trandolapril (Mavik) or placebo on days 3 to 7 following infarction (LOE: 1). In the treatment group, risk of death from all causes declined 17.6%, risk of death from cardiovascular causes fell 21%, and progression to severe heart failure decreased 27%. These post-MI benefits are also supported by results of the Survival of Myocardial Infarction Long-Term Evaluation (SMILE) study (LOE: 1).33
The Heart Outcomes Prevention Evaluation Investigators (HOPE)21 (LOE: 1), and the European Trial on Reduction of Cardiac Events with Perindopril in Patients with Coronary Artery disease (EUROPA)22 (LOE: 1), demonstrated the benefits of ACE inhibitors in reducing cardiovascular events for patients with or at risk for coronary artery disease, but with normal left ventricular function. The HOPE study showed a significant reduction of events with the ACE inhibitor ramipril (Altace) (NNT=1000 patients over 4 years, resulting in a decrease of 150 events for 75 patients), whereas EUROPA demonstrated the results for the ACE inhibitor perindopril (Aceon) (NNT=50 patients over 4 years to prevent 1 major cardiovascular event).
Calcium channel blockers
Use calcium channel blockers only for stable post-MI patients without decreased left ventricular function or heart failure.
The evidence. The Comparison of Amlodipine vs Enalapril to Limit Occurrences of Thrombosis (CAMELOT)20 study compared treatment using a calcium channel blocker (amlodipine) and an ACE inhibitor (enalapril) with placebo for normotensive patients with coronary artery disease (LOE: 1). Amlodipine reduced hospitalization for angina by 42.2%, nonfatal MI by 26%, and stroke or transient ischemic attack by 50.4% (NNT=16). The study group concluded that the use of the ACE inhibitor enalapril showed “directionally similar, but smaller and nonsignificant, treatment effects.”20 There was no reduction in overall mortality.
Stroke
Prescribe the combination of perindopril and indapamide for all patients with a history of stroke or transient ischemic attack, regardless of blood pressure (SOR: B).
The evidence. The Perindopril Protection Against Recurrent Stroke Study (PROGRESS)23 was designed to evaluate the benefits of the ACE inhibitor perindopril (with the addition of indapamide at the physician’s discretion) for patients with or without hypertension who have had a transient ischemic attack or stroke (LOE: 1). Perindopril plus indapamide reduced risk of stroke by 43%, but treatment with a single agent showed risk reduction.
To see which drug classes are most often recommended in the treatment of hypertension based on underlying cardiovascular disease, we performed an initial Medline search using the key words hypertension and cardiovascular disease. This was supplemented with a search of the archives of the journals Circulation, Hypertension, Stroke, and the authors’ personal references.
All studies were evaluated using the Strength of Recommendation Taxonomy.34 Strength of recommendation (SOR) evaluates a study based on patient (not disease) oriented outcomes, and level of evidence (LOE) is based on key outcomes as well as the methodology of the study.
CORRESPONDENCE
Randy Wexler, MD, MPH, FAAFP, Assistant Professor of Clinical Family Medicine, The Ohio State University College of Medicine and Public Health, B0902B Cramblett Hall, 456 West 10th Ave, Columbus, Ohio 43201. E-mail: [email protected]
1. American Heart Association. Heart Disease and Stroke Statistics–2004 Update. Dallas, Tex: American Heart Association, 2003.
2. Ogden LG, He J, Lydick E, Whelton P. Long-term absolute benefit of lowering blood pressure in hypertensive patients according to JNC VI risk stratification. Hypertension 2000;35:539-543.
3. Hansson L, Lindholm L, Ekbom T, et al. Randomised trial of old and new antihypertensive drugs in elderly patients: cardiovascular mortality and morbidity the Swedish Trial in Old Patients with Hypertension-2 study. Lancet 1999;354:1751-1756.
4. Turnbull F. Blood Pressure Lowering Treatment Trialists’ Collaboration. Effects of different blood-pressure-lowering regimens on major cardiovascular events: results of prospectively-designed overviews of randomized trials. Lancet 2003;362:1527-1535.
5. Lewington S, Clarke R, Qizilbash N, Peto R, Collins R. Age-specific relevance of usual blood pressure to vascular mortality: a meta analysis of individual data for one million adults in 61 prospective studies. Lancet 2002;360:1903-1913.
6. Vasan RS, Larson MG, Leip EP, et al. Impact of high-normal blood pressure on the risk of cardiovascular disease. N Engl J Med 2001;345:1291-1297.
7. Whelton P, He J, Appel L, et al. National High Blood Pressure Education Program Coordinating Committee. Primary prevention of hypertension: Clinical and public health advisory from the National High Blood Pressure Education Program. JAMA 2002;288:1882-1888.
8. The SOLVD Investigators. Effect of enalapril on survival in patients with reduced left ventricular ejection fractions and congestive heart failure. N Engl J Med 1991;325:293-302.
9. Pfeffer MA, Braunwald E, Moye LA, et al. The SAVE Investigators. Effect of captopril on mortality and morbidity in patients with left ventricular dysfunction after myocardial infarction. Results of the survival and ventricular enlargement trial. N Engl J Med 1992;327:669-677.
10. Flather MD, Yusuf S, Kobler L, et al. ACE-Inhibitor Myocardial Infarction Collaboration Group. Long-term ACE inhibitor therapy in patients with heart failure or left ventricular dysfunction: A systematic overview of data from individual patients. Lancet 2000;355:1575-1581.
11. Chobanian A, Bakris G, Black H, et al. Seventh Report of The Joint National Committee on Prevention, Detection, Evaluation, and Management of High Blood Pressure (JNC-7). Hypertension 2003;42:1206-1252.
12. Hunt S, Abraham WT, Chin M, et al. ACC/AHA 2005 Guideline Update for the Diagnosis and Management of Chronic Heart failure in the Adult. A report of the American College of Cardiology/American Heart Association task force on practice guidelines. Writing to update the 2001 guidelines for the evaluation and management of heart failure, 2005, available at www.acc.org, accessed 10-19-05.
13. Dargie HJ. Effect of carvedilol on outcome after myocardial infarction in patients with left-ventricular dysfunction: the CAPRICORN randomized trial. Lancet 2001;357:1385-1390.
14. Packer M, Coats A, Fowler MB, et al. Carvedilol Prospective Randomized Cumulative Survival Study Group. Effect of carvedilol on survival in severe chronic heart failure. N Engl J Med 2001;344:1651-1658.
15. Effect of metoprolol CR/XL in chronic heart failure: Metoprolol CR/XL Randomized Intervention Trial in Congestive Heart Failure (MERIT-HF). Lancet 1999;353:2001-2007.
16. Pitt B, Zannad F, Remme WJ, et al. The effect of spironolactone on morbidity and mortality in patents with severe heart failure. Randomized Aldactone Evaluation Study (RALES) Investigators. N Engl J Med 1999;341:709-717.
17. Pitt B, Remme WJ, Zannad F, et al. Eplerenone Post-Acute Myocardial Infarction Heart Failure Efficacy and Survival (EPHESUS) Study Investigators. Eplerenone, a selective aldosterone blocker, in patients with left ventricular dysfunction after myocardial infarction. N Engl J Med 2003;14:1309-1321.
18. Beta-Blocker Heart Attack (BHAT) Research Group. A randomized trial of propranalol in patients with acute myocardial infarction, I: mortality results. JAMA 1982;247:1707-1714.
19. Timolol-induced reduction in mortality and reinfarction in patients surviving acute myocardial infarction. N Engl J Med 1981;304:801-807.
20. Nissen SE, Tuzcu EM, Libby P, et al. Effect of antihypertensive agents on cardiovascular events in patients with coronary disease and normal blood pressure. The CAMELOT Study: a randomized controlled trial. JAMA 2004;292:2217-2226.
21. The Heart Outcomes Prevention Evaluation (HOPE) Study Investigators. Effects of an angiotensin-converting enzyme inhibitor, ramipril, on cardiovascular events in high risk patients. N Engl J Med 2000;342:145-153.
22. The EURopean trial On reduction of cardiac events with Perindopril in stable coronary Artery disease Investigators. Efficacy of perindopril in reduction of cardiovascular events among patients with stable coronary artery disease; randomized, double-blind, placebo-controlled, multicentre trial (the EUROPA study). Lancet 2003;362:782-788.
23. PROGRESS Collaborative Group. Randomised trial of a perindopril based blood-pressure-lowering regimen among 6105 individuals with previous stroke or transient ischemic attack. Lancet 2001;358:1033-1041.
24. CIBIS Investigators and Committees. A randomized trial of beta blockade in heart failure. The Cardiac Insufficiency Bisoprolol Study (CIBIS). Circulation 1994;90:1765-1773.
25. Brassuer L. Experts challenge present hypertension guidelines. Intern Med 2005;6:1-and 8.-
26. Hyman DJ, Pavlik VN. Self-reported hypertension treatment practices among primary care physicians: Blood pressure thresholds, drug choices, and the role of guidelines and evidence based medicine. Arch Intern Med 2000;160:2281-2286.
27. Poole-Wilson P, Swedberg K, Cleland J, et al. Comparison of carvedilol and metoprolol on clinical outcomes in patients with chronic heart failure in the Carvedilol Or Metoprolol European Trial (COMET): randomized controlled trial. Lancet 2003;362:7-13.
28. Pitt B, Poole-Wilson PA, Segal R, et al. Effect of losartan compared with captopril on mortality in patients with symptomatic heart failure: randomized trial. The Losartan Heart Failure Survival Study ELITE II. Lancet 2000;355:1582-1587.
29. Cohn JN, Tognoni G. Valsartan Heart Failure Trail (VAL-HEFT) Investigators. A randomized trial of the angiotensin receptor blocker valsartan in chronic heart failure. N Engl J Med 2001;345:1667-1675.
30. Young JB, Dunlap ME, Pfeffer MA, et al. Mortality and morbidity reduction with candesartan in patients with chronic heart failure and left ventricular systolic dysfunction: results of the CHARM low-left ventricular ejection fraction trials. Circulation 2004;110:2618-2626.
31. The PEACE Trial Investigators. Angiotensin-converting enzyme inhibition in stable coronary artery disease. N Engl J Med 2004;351:2058-2068.
32. Kober L, Torp-Pedersen, Carlsen JE, et al. for the TRACE study group. A clinical trial of the angiotensin-converting enzyme inhibitor trandolapril in patients with left ventricular dysfunction after myocardial dysfunction. N Engl J Med 1995;333:1670-1676.
33. Ambrosioni E, Borghi C, Magnani B. For the SMILE Study Group. The effect of the angiotensin-converting enzyme inhibitor zofenopril on mortality and morbidity after myocardial infarction. N Engl J Med 1995;332:80-85.
34. Ebell MH, Siwek J, Weiss BD, et al. Strength of Recommendation Taxonomy (SORT): a patient-centered approach to grading evidence in the medical literature. J Fam Pract 2004;53:111-120.
- Decreasing blood pressure by 5 mm Hg will decrease mortality due to stroke by 14%, attenuate cardiac mortality by 9%, and reduce all-cause mortality by 7% (A).
- Patients with heart failure should receive angiotensin-converting enzyme inhibitors if they are clinically tolerated (A). Beta-blockers are also recommended (A). Although aldosterone antagonists are appropriate for use in patients with heart failure (A), we recommend they are taken under the care of a cardiologist to minimize complications and to insure that a complete heart failure plan is in place (C).
- For coronary artery disease, it is now considered standard of care to add a beta-blocker to all patients post–MI that do not have severe heart block or are in cardiogenic shock (A).
- Perindopril plus indapamide should be used in all patients with a history of stroke or transient ischemic attack regardless of blood pressure (B).
Hypertension precedes more than 75% of heart failure cases and 50% of heart attacks. In 67% of first-time strokes, blood pressure exceeds 140/90 mm Hg.1 For those in heart failure or at risk of recurrent myocardial infarction (MI) or stroke, the need to reduce unrecognized or under-treated hypertension is urgent. Thankfully it is possible to select an agent that can lower blood pressure—the most important immediate goal—and confer benefit to the associated cardiovascular disorder.
Given the number of agents used for both hypertension and other cardiovascular conditions, we sought in this study to evaluate which drug classes would best achieve blood pressure treatment goals and reduce morbidity and mortality for patients with cardiac disease. In this article, you will find practical recommendations for drug selection and appropriate regimens.
Even small blood pressure reductions yield big benefits for comorbidities
Using the population of the National Health and Nutrition Examination Survey I Epidemiologic Follow Up Study, Ogden and colleagues2 found that the benefit of treating high blood pressure over a decade depended on lowering systolic blood pressure and on treating other relevant cardiovascular comorbidities. Specifically, the number needed to treat (NNT) and prevent a death was directly related to the risk stratification of patients and their initial blood pressure (TABLE W1) (LOE: 1).
In another provocative trial, the Swedish Trial in Old Patients with Hypertension-2 Study (STOP Hypertension-2)3 evaluated the use of beta-blockers, diuretics, angiotensin-converting enzyme (ACE) inhibitors, or calcium channel blockers. Results of this trial showed that an overall reduction in cardiovascular events related to the ability of a drug class to lower blood pressure (LOE: 1).3
In addition, a meta-analysis of 29 randomized trials (n=162,341) in the Blood Pressure Lowering Treatment Trialists’ Collaboration Trial (BPLTTC)4 showed that all antihypertensive drug classes significantly reduce blood pressure. This meta-analysis confirmed an overall reduction in cardiovascular events, with perceived risk reduction directly proportional to blood pressure reduction (LOE: 1). This advantage was consistent irrespective of drug class (beta-blocker, diuretic, ACE inhibitor, calcium-channel blocker, or angiotensin receptor blocker [ARB]), although different drug classes were recognized to have unique benefits specific to individual patient populations.
Should the BP target level be lowered? Recent evidence suggests that the currently accepted range for normal blood pressure may be too high.5,6
Lewington and colleagues performed a meta-analysis of 61 prospective studies with more than 1 million participants. Using a “time-dependent” correction for regression dilution, they sorted deaths in each decade of age according to estimated blood pressures at the start of the decade (LOE: 1).5 They found that with each decade of life there was a proportional decline in the risk of cardiovascular deaths when blood pressures were controlled incrementally to levels of 115 mm Hg systolic blood pressure and 75 mm Hg diastolic blood pressure (LOE: 1).5 At blood pressures below 115/75 mm Hg, no difference was observed.
In addition, Vasan and collaborators,6 using the Framingham Heart Study database (n=6859 participants), reported an increase in cardiovascular events with higher baseline levels of blood pressure. When compared with optimal blood pressure levels, those with high-normal blood pressure (130–139/85–89 mm Hg) had a risk-factor-adjusted hazard ratio for cardiovascular disease of 2.5 for women and 1.6 for men (LOE: 1).6
The “take-home” message. A small reduction in blood pressure yields a very significant risk reduction. Decreasing blood pressure by 5 mm Hg will decrease mortality due to stroke by 14%, cardiac mortality by 9%, and all cause mortality by 7% (LOE: 1).7 These data suggest that aggressive intervention to affect small changes might affect large differences in morbidity and mortality.
Antihypertensive drugs in heart failure
Angiotensin-converting enzyme inhibitors
Give all patients with heart failure an ACE inhibitor, if clinically tolerated (SOR: A). Although blood pressure control is very important to treat the physiology and neurohormonal basis of heart failure, the primary reason to use ACE inhibitors (as well as other medications) is to provide a disease modifying intervention and treat blood pressure when it is elevated. Different disease conditions require different doses to achieve the desired goal. With heart failure, the dose of an ACE inhibitor is given twice daily at typically 2 to 3 times the dose of that used for hypertension.
The evidence. In 1991, the Studies of Left Ventricular Dysfunction (SOLVD) trial8 demonstrated a 26% risk reduction for death or hospitalization due to heart failure (95% confidence interval [CI], 18–34) for those treated with the ACE inhibitor enalapril (Vasotec) (LOE: 1). The following year, the Survival and Ventricular Enlargement (SAVE)9 trial demonstrated a risk reduction of 19% for patients with a reduced ejection fraction after myocardial infarction (MI) when the ACE inhibitor captopril (Capoten) was used (LOE: 1).
The calculated NNT with an ACE inhibitor to save 1 life over 1 year is 43.10 (See TABLE W2 for a summary of clinical trials and levels of evidence.) The TABLE in this article summarizes treatment recommendations based on these studies.8-23
TABLE
Drugs of choice for hypertension and various comorbidities
| TREATMENT RECOMMENDATIONS BASED ON STUDIES/GUIDELINES | SOR |
|---|---|
| Congestive Heart Failure | |
| ACE inhibitor should be used in patients with heart failure unless a contraindication exists8,9,11,12 | A |
| Beta-blockers should be used in patients with heart failure unless a contraindication exists11-15 | A |
| ARB should be used in heart failure if patient is intolerant to ACE inhibitor12 | A |
| Aldosterone antagonists should be used in patients with severe heart failure unless a contraindication exists16,17 | A |
| Aldosterone antagonists should be prescribed in consultation with a cardiologist | C |
| Coronary Artery Disease | |
| Beta-blockers should be used in patients post-MI unless a contraindication exists11,13,18,19 | A |
| CCB should be used in patients with stable coronary artery disease unless a contraindication exists11,20 | A |
| ACE inhibitors should be used in patients with stable coronary artery disease and no left ventricular dysfunction unless a contraindication exists11,21,22 | A |
| Stroke | |
| ACE inhibitor and indapamide should be used in patients with a TIA or stroke unless a contraindication exists11,23 | B |
| ACE, angiotensin-converting enzyme; ARB, angiotensin receptor blocker; CCB, calcium channel blocker; MI, myocardial infarction; SOR, strength of recommendation; TIA, transient ischemic attack | |
Beta-blockers
Give a beta-blocker, if tolerated, to patients in heart failure (SOR: A). Dosing has been determined by clinical trial data. In general, in order to significantly impact morbidity and mortality in congestive heart failure, the patient needs to reach a dose of 150 mg of metoprolol XL a day or 6.25 mg to 12.5 mg of carvedilol given twice daily. Ideal doses are greater than 200 mg/d of metoprolol XL or 25 mg twice daily of carvedilol.
The evidence. The Cardiac Insufficiency Bisoprolol Study (CIBIS),24 published in 1994, was a randomized, placebo-controlled, double-blind trial designed to test the efficacy of beta-blockade in the treatment of heart failure (LOE: 1). Although no difference in mortality was demonstrated between intervention and control groups, the intervention group showed improved functional status.
The Carvedilol Post Infarct Survival Control in Left Ventricular Dysfunction (CAPRICORN)13 trial (LOE: 1) evaluated patients with left ventricular dysfunction or heart failure after an MI, while the Carvedilol Prospective Randomized Cumulative Survey (COPERNICUS)14 group (LOE: 1) enrolled only patients with severe heart failure (ejection fraction <25%, NYHA class III and IV). These studies demonstrated an overall decrease in cardiovascular morbidity and mortality, as well as all-cause mortality for patients with heart failure receiving the nonspecific beta-blocker carvedilol (Coreg) (receptor blockade at β1, β2, α1). CAPRICORN produced an overall risk reduction in mortality of 2% to 3% at 1 year, resulting in the same NNT (43) over 1 year as ACE inhibitors.13 This is the only beta-blocker tested after infarction to demonstrate a mortality difference for patients with heart failure or decreased left ventricular dysfunction (ejection fraction <40%).
Hypertension specialists debate about how to approach the hypertensive patient. The Seventh Report of the Joint National Committee on Prevention, Detection, Evaluation, and Management of High Blood Pressure (JNC-7) guidelines11 call for defined goals in lowering blood pressure and a stepwise selection of drugs based on comorbidities.
Some leading hypertension experts say this is too formulaic. Dr Michael Alderman, Professor in the Department of Medicine and Epidemiology and Population Health at the Albert Einstein School of Medicine, argues “we have to get over the limitation of the straightjacket of numbers to define our actions.”25 He further asserts that “our willingness to drive blood pressure down has to be modulated by the risk the patient has and the price one has to pay to lower it. A 30% reduction in risk does not mean much if your risk is low, but if your risk is high it means a lot.”25 As such, Dr Alderman argues we should base treatment decisions on “total risk” and not the level of blood pressure. Other leaders in the field such as Mathew Weir, MD, director of the Division of Nephrology, University of Maryland, and Richard Devreaux, MD, Professor of Medicine, Division of Cardiology, Cornell University Medical Center, agree with this more individualized approach.25
But understanding the basic formula is what helps us innovate. In general, we agree that individualizing patient care is the ideal, and that some patients may not tolerate “recommended” treatment. However, it is not possible for physicians to individualize care (a highly complex undertaking) when they still lack understanding at the basic level of care. With the poor treatment of hypertension in the US, we believe that guidelines such as JNC-7 are essential to improving blood pressure control.
Hyman and Pavlik26 demonstrated that physician factors, especially lack of awareness of hypertension treatment recommendations, correlate with poor hypertension treatment. In their 2001 study that included 1200 primary care physicians, 41% of physicians were not familiar with or had not heard of the recommendations. This finding was not trivial. The importance of familiarity with JNC-7 guidelines was demonstrated when statistical analysis revealed that a working knowledge of these guidelines significantly increased adherence with published recommendations (including blood pressure control). As such, it would appear that not following the guidelines has less to do with disagreements over treatment options and more to do with understanding the value of the guidelines to basic management.
The Metoprolol CR/XL Randomized Intervention Trial in Congestive Heart Failure (MERIT-HF)15 concluded that the addition of extended-release metoprolol (Lopressor, a β1-adrenergic receptor blocker) for patients with heart failure demonstrated a survival benefit when compared with patients not receiving a beta-blocker (LOE: 1). One of the essential elements of this trial was the ability to achieve a dose of 200 mg of metoprolol a day. Frequently in clinical practice low-dose or even homeopathic doses are used with few data to support such use.
The Carvedilol or Metoprolol European Trial (COMET)27 of patients with heart failure suggested that nonselective neurohumoral (β and α) blockade may increase the benefit in comparison with selective β1-blockade (LOE: 1). There has been significant debate regarding the dose and the formulation of the drugs in COMET, but we advocate using doses and drug formulations that were specifically in the large prospective randomized trials (CIBIS II, the carvedilol trials, and MERIT-HF).
Angiotensin receptor blockers
Prescribe an ARB only when a patient cannot tolerate an ACE inhibitor secondary to cough or hyperkalemia.12 As these are generally used after or as an adjunct to ACE inhibitors, the usual dose is similar to that for blood pressure dosed twice daily. If patients do not tolerate ACE inhibitors, theses doses may also be higher than those used for blood pressure response alone.
The evidence. The Losartan Heart Failure Survival Study (ELITE II)28 demonstrated the benefit of the ARB losartan (Cozaar) in the treatment of heart failure, but not superiority over previously used ACE inhibitors (LOE: 1). In addition, there was no difference in renal insufficiency with one drug class compared with another. Researchers concluded that ARBs should be used only for patients intolerant to ACE inhibitors.
The Valsartan Heart Failure Trial Investigators Study (Val-HeFT)29 randomized 5010 patients to receive valsartan (Diovan) or placebo combined with standard therapy (ACE inhibitors and beta-blockers) (LOE: 1). The ARB group demonstrated a 13.2% greater reduction than placebo in the combined endpoint of morbidity and mortality (as defined by incidence of cardiac arrest and resuscitation, hospitalization for heat failure, or administration of intravenous inotropes or vasodilators for a minimum of 4 hours). However, a post-study review29 of patients who received the ARB, ACE inhibitor, and beta-blocker combination showed increased mortality.
In 2004, the Candesartan in Heart failure Assessment of Reduction in Mortality and morbidity trial (CHARM)30 found that when the ARB candesartan (Atacand) was added to standard therapy (ACE inhibitor, beta-blockers, aldosterone antagonist) there was a 33% reduction in all-cause mortality, similar to that found with beta-blockers and ACE inhibitors) (LOE: 1). In addition, the CHARM group found no increased risk when candesartan was combined with other treatments; it concluded that ARBs could be added to regimens for all patients with heart failure unless a contraindication exists.
The American College of Cardiology/American Heart Association guidelines prefer ACE inhibitors over ARBs, and recommend ARBs be used when an ACE inhibitor is not tolerated or if there are other contraindications. A low level of evidence (2b) suggests that an ARB may be added to conventional medical therapy with an increased risk of renal insufficiency and hyperkalemia (SOR: A).12
Potassium-sparing diuretics
Aldosterone antagonists are appropriate for patients with heart failure (SOR: A), though we recommend working in conjunction with a cardiologist to minimize complications and to insure that a complete heart failure plan is in place (SOR: C). Spirinolactone (Aldactone, Aldactazide) is used for physiologic purposes (as a neurohormonal regulator) and is not used for blood pressure control. Most heart failure specialists begin with a dose of 12.5 mg/d and advance to doses utilized in the clinical trials (25–50 mg/d).
The evidence. Potassium-sparing diuretics lower mortality among heart failure patients. Spironolactone works in part by reducing aldosterone levels and increasing serum potassium.
In the Randomized Aldactone Evaluation Study (RALES),16 patients with severe heart failure (ejection fraction <35%) on standard medical therapy were randomized to receive spironolactone or placebo (LOE: 1). The spironolactone group exhibited a 30% reduction in mortality compared with conventional medical therapy, and the study was ended early at 24 months.
In the Eplerenone Post Acute Myocardial Infarction Heart Failure Efficacy and Survival Study (EPHESUS),17 an overall reduction in death of 8%, a decrease of sudden cardiac death by >20% (relative risk reduction), as well as an overall reduction of hospitalization for heart failure of 15% occurred in the eplerenone (Inspra) group (LOE: 1) (NNT to save 1 life in 1 year=50).
It is worth noting that the doses used in these studies were devised to alter neurohumoral regulation, and are not to be used as significant diuretics. To date, no comparative study between spironolactone and eplerenone has been undertaken.
Coronary artery disease
Beta-blockers
Prescribe a beta-blocker for every post-MI patient without severe heart block or cardiogenic shock (SOR: A).
The evidence. The Beta-Blocker Heart Attack Trial (BHAT),18 sponsored by the National Heart, Lung, and Blood Institute, was designed to evaluate the benefits of the beta-blocker propranolol (Inderal) after MI (completed more than 24 years ago, before modern medical therapy) (LOE: 1). Total mortality during the average 24-month follow-up period was 7.2% in the propranolol group and 9.8% in the placebo group. The incidence of nonfatal reinfarction was decreased by 15.6% in the treatment group.
A similar trial completed in the early 1980s was The Norwegian Multi-Center Study.19 This trial, which assessed the efficacy of timolol (Blocadren, Timolide) after MI, demonstrated a 44.6% reduction in sudden cardiac death (LOE: 1). The study group reached the same conclusion as the BHAT researchers, and recommended that beta-blockers be used following an MI to reduce reinfarction and death.
Angiotensin-converting enzyme inhibitors
Use ACE inhibitors only for stable post-MI patients without decreased left ventricular function.
The evidence. The Prevention of Events with Angiotensin Converting Enzyme Inhibition (PEACE) trial31 evaluated the benefit of using an ACE inhibitor for patients with stable coronary artery disease and slightly reduced ejection fraction (>40%) (LOE: 1). There was no statistical difference in the primary endpoint (cardiac-induced death, MI, or need for revascularization) between the treatment group (21.9%) and the placebo group (22.5%).
Contrary to the findings of the PEACE trial, many other studies have shown that ACE inhibitors are beneficial for patients with coronary artery disease. In the Trandolapril Cardiac Evaluation (TRACE) study,32 patients stabilized after acute MI were randomized to receive the ACE inhibitor trandolapril (Mavik) or placebo on days 3 to 7 following infarction (LOE: 1). In the treatment group, risk of death from all causes declined 17.6%, risk of death from cardiovascular causes fell 21%, and progression to severe heart failure decreased 27%. These post-MI benefits are also supported by results of the Survival of Myocardial Infarction Long-Term Evaluation (SMILE) study (LOE: 1).33
The Heart Outcomes Prevention Evaluation Investigators (HOPE)21 (LOE: 1), and the European Trial on Reduction of Cardiac Events with Perindopril in Patients with Coronary Artery disease (EUROPA)22 (LOE: 1), demonstrated the benefits of ACE inhibitors in reducing cardiovascular events for patients with or at risk for coronary artery disease, but with normal left ventricular function. The HOPE study showed a significant reduction of events with the ACE inhibitor ramipril (Altace) (NNT=1000 patients over 4 years, resulting in a decrease of 150 events for 75 patients), whereas EUROPA demonstrated the results for the ACE inhibitor perindopril (Aceon) (NNT=50 patients over 4 years to prevent 1 major cardiovascular event).
Calcium channel blockers
Use calcium channel blockers only for stable post-MI patients without decreased left ventricular function or heart failure.
The evidence. The Comparison of Amlodipine vs Enalapril to Limit Occurrences of Thrombosis (CAMELOT)20 study compared treatment using a calcium channel blocker (amlodipine) and an ACE inhibitor (enalapril) with placebo for normotensive patients with coronary artery disease (LOE: 1). Amlodipine reduced hospitalization for angina by 42.2%, nonfatal MI by 26%, and stroke or transient ischemic attack by 50.4% (NNT=16). The study group concluded that the use of the ACE inhibitor enalapril showed “directionally similar, but smaller and nonsignificant, treatment effects.”20 There was no reduction in overall mortality.
Stroke
Prescribe the combination of perindopril and indapamide for all patients with a history of stroke or transient ischemic attack, regardless of blood pressure (SOR: B).
The evidence. The Perindopril Protection Against Recurrent Stroke Study (PROGRESS)23 was designed to evaluate the benefits of the ACE inhibitor perindopril (with the addition of indapamide at the physician’s discretion) for patients with or without hypertension who have had a transient ischemic attack or stroke (LOE: 1). Perindopril plus indapamide reduced risk of stroke by 43%, but treatment with a single agent showed risk reduction.
To see which drug classes are most often recommended in the treatment of hypertension based on underlying cardiovascular disease, we performed an initial Medline search using the key words hypertension and cardiovascular disease. This was supplemented with a search of the archives of the journals Circulation, Hypertension, Stroke, and the authors’ personal references.
All studies were evaluated using the Strength of Recommendation Taxonomy.34 Strength of recommendation (SOR) evaluates a study based on patient (not disease) oriented outcomes, and level of evidence (LOE) is based on key outcomes as well as the methodology of the study.
CORRESPONDENCE
Randy Wexler, MD, MPH, FAAFP, Assistant Professor of Clinical Family Medicine, The Ohio State University College of Medicine and Public Health, B0902B Cramblett Hall, 456 West 10th Ave, Columbus, Ohio 43201. E-mail: [email protected]
1. American Heart Association. Heart Disease and Stroke Statistics–2004 Update. Dallas, Tex: American Heart Association, 2003.
2. Ogden LG, He J, Lydick E, Whelton P. Long-term absolute benefit of lowering blood pressure in hypertensive patients according to JNC VI risk stratification. Hypertension 2000;35:539-543.
3. Hansson L, Lindholm L, Ekbom T, et al. Randomised trial of old and new antihypertensive drugs in elderly patients: cardiovascular mortality and morbidity the Swedish Trial in Old Patients with Hypertension-2 study. Lancet 1999;354:1751-1756.
4. Turnbull F. Blood Pressure Lowering Treatment Trialists’ Collaboration. Effects of different blood-pressure-lowering regimens on major cardiovascular events: results of prospectively-designed overviews of randomized trials. Lancet 2003;362:1527-1535.
5. Lewington S, Clarke R, Qizilbash N, Peto R, Collins R. Age-specific relevance of usual blood pressure to vascular mortality: a meta analysis of individual data for one million adults in 61 prospective studies. Lancet 2002;360:1903-1913.
6. Vasan RS, Larson MG, Leip EP, et al. Impact of high-normal blood pressure on the risk of cardiovascular disease. N Engl J Med 2001;345:1291-1297.
7. Whelton P, He J, Appel L, et al. National High Blood Pressure Education Program Coordinating Committee. Primary prevention of hypertension: Clinical and public health advisory from the National High Blood Pressure Education Program. JAMA 2002;288:1882-1888.
8. The SOLVD Investigators. Effect of enalapril on survival in patients with reduced left ventricular ejection fractions and congestive heart failure. N Engl J Med 1991;325:293-302.
9. Pfeffer MA, Braunwald E, Moye LA, et al. The SAVE Investigators. Effect of captopril on mortality and morbidity in patients with left ventricular dysfunction after myocardial infarction. Results of the survival and ventricular enlargement trial. N Engl J Med 1992;327:669-677.
10. Flather MD, Yusuf S, Kobler L, et al. ACE-Inhibitor Myocardial Infarction Collaboration Group. Long-term ACE inhibitor therapy in patients with heart failure or left ventricular dysfunction: A systematic overview of data from individual patients. Lancet 2000;355:1575-1581.
11. Chobanian A, Bakris G, Black H, et al. Seventh Report of The Joint National Committee on Prevention, Detection, Evaluation, and Management of High Blood Pressure (JNC-7). Hypertension 2003;42:1206-1252.
12. Hunt S, Abraham WT, Chin M, et al. ACC/AHA 2005 Guideline Update for the Diagnosis and Management of Chronic Heart failure in the Adult. A report of the American College of Cardiology/American Heart Association task force on practice guidelines. Writing to update the 2001 guidelines for the evaluation and management of heart failure, 2005, available at www.acc.org, accessed 10-19-05.
13. Dargie HJ. Effect of carvedilol on outcome after myocardial infarction in patients with left-ventricular dysfunction: the CAPRICORN randomized trial. Lancet 2001;357:1385-1390.
14. Packer M, Coats A, Fowler MB, et al. Carvedilol Prospective Randomized Cumulative Survival Study Group. Effect of carvedilol on survival in severe chronic heart failure. N Engl J Med 2001;344:1651-1658.
15. Effect of metoprolol CR/XL in chronic heart failure: Metoprolol CR/XL Randomized Intervention Trial in Congestive Heart Failure (MERIT-HF). Lancet 1999;353:2001-2007.
16. Pitt B, Zannad F, Remme WJ, et al. The effect of spironolactone on morbidity and mortality in patents with severe heart failure. Randomized Aldactone Evaluation Study (RALES) Investigators. N Engl J Med 1999;341:709-717.
17. Pitt B, Remme WJ, Zannad F, et al. Eplerenone Post-Acute Myocardial Infarction Heart Failure Efficacy and Survival (EPHESUS) Study Investigators. Eplerenone, a selective aldosterone blocker, in patients with left ventricular dysfunction after myocardial infarction. N Engl J Med 2003;14:1309-1321.
18. Beta-Blocker Heart Attack (BHAT) Research Group. A randomized trial of propranalol in patients with acute myocardial infarction, I: mortality results. JAMA 1982;247:1707-1714.
19. Timolol-induced reduction in mortality and reinfarction in patients surviving acute myocardial infarction. N Engl J Med 1981;304:801-807.
20. Nissen SE, Tuzcu EM, Libby P, et al. Effect of antihypertensive agents on cardiovascular events in patients with coronary disease and normal blood pressure. The CAMELOT Study: a randomized controlled trial. JAMA 2004;292:2217-2226.
21. The Heart Outcomes Prevention Evaluation (HOPE) Study Investigators. Effects of an angiotensin-converting enzyme inhibitor, ramipril, on cardiovascular events in high risk patients. N Engl J Med 2000;342:145-153.
22. The EURopean trial On reduction of cardiac events with Perindopril in stable coronary Artery disease Investigators. Efficacy of perindopril in reduction of cardiovascular events among patients with stable coronary artery disease; randomized, double-blind, placebo-controlled, multicentre trial (the EUROPA study). Lancet 2003;362:782-788.
23. PROGRESS Collaborative Group. Randomised trial of a perindopril based blood-pressure-lowering regimen among 6105 individuals with previous stroke or transient ischemic attack. Lancet 2001;358:1033-1041.
24. CIBIS Investigators and Committees. A randomized trial of beta blockade in heart failure. The Cardiac Insufficiency Bisoprolol Study (CIBIS). Circulation 1994;90:1765-1773.
25. Brassuer L. Experts challenge present hypertension guidelines. Intern Med 2005;6:1-and 8.-
26. Hyman DJ, Pavlik VN. Self-reported hypertension treatment practices among primary care physicians: Blood pressure thresholds, drug choices, and the role of guidelines and evidence based medicine. Arch Intern Med 2000;160:2281-2286.
27. Poole-Wilson P, Swedberg K, Cleland J, et al. Comparison of carvedilol and metoprolol on clinical outcomes in patients with chronic heart failure in the Carvedilol Or Metoprolol European Trial (COMET): randomized controlled trial. Lancet 2003;362:7-13.
28. Pitt B, Poole-Wilson PA, Segal R, et al. Effect of losartan compared with captopril on mortality in patients with symptomatic heart failure: randomized trial. The Losartan Heart Failure Survival Study ELITE II. Lancet 2000;355:1582-1587.
29. Cohn JN, Tognoni G. Valsartan Heart Failure Trail (VAL-HEFT) Investigators. A randomized trial of the angiotensin receptor blocker valsartan in chronic heart failure. N Engl J Med 2001;345:1667-1675.
30. Young JB, Dunlap ME, Pfeffer MA, et al. Mortality and morbidity reduction with candesartan in patients with chronic heart failure and left ventricular systolic dysfunction: results of the CHARM low-left ventricular ejection fraction trials. Circulation 2004;110:2618-2626.
31. The PEACE Trial Investigators. Angiotensin-converting enzyme inhibition in stable coronary artery disease. N Engl J Med 2004;351:2058-2068.
32. Kober L, Torp-Pedersen, Carlsen JE, et al. for the TRACE study group. A clinical trial of the angiotensin-converting enzyme inhibitor trandolapril in patients with left ventricular dysfunction after myocardial dysfunction. N Engl J Med 1995;333:1670-1676.
33. Ambrosioni E, Borghi C, Magnani B. For the SMILE Study Group. The effect of the angiotensin-converting enzyme inhibitor zofenopril on mortality and morbidity after myocardial infarction. N Engl J Med 1995;332:80-85.
34. Ebell MH, Siwek J, Weiss BD, et al. Strength of Recommendation Taxonomy (SORT): a patient-centered approach to grading evidence in the medical literature. J Fam Pract 2004;53:111-120.
Obsessive-compulsive disorder: Tools for recognizing its many expressions
- For a person with symptoms suggestive of obsessive-compulsive disorder (OCD), inquire about a family history of OCD or other anxiety disorders, either of which increases the likelihood of a diagnosis of OCD.
- Keep in mind that, with children, symptoms suggestive of OCD may simply indicate developmentally appropriate rituals.
- Become familiar with the alternative methods of assessment to facilitate evaluation in your particular office setting.
- Consider OCD when a patient exhibits or complains of intrusive thoughts, anxiety-based avoidance of places or objects, excessive reassurance-seeking, or repetitive behaviors/rituals (B).
Has a parent in your practice reported odd behavior in their child (eg, new fears or rituals) following a streptococcal viral illness? Does your dialogue with an adult patient reveal undue anxiety about hygiene or personal safety? These examples are just 2 of many that signal a person may be suffering from obsessive-compulsive disorder (OCD)—a relentless, debilitating disorder if unrecognized and left untreated.
In this article, we explain the relative advantages of evaluative tools available (which can also help distinguish OCD in children from developmentally appropriate rituals).
In part 2 of this article (to be published in the April 2006 Journal of Family Practice), we discuss how to find professionals appropriately trained in cognitive-behavioral therapy (CBT), and recommend strategies for employing pharmacotherapy.
The tragedy of unrecognized OCD
OCD is an anxiety disorder characterized by recurrent or persistent thoughts, impulses, or images experienced as intrusive or distressing (obsessions), and repetitive behaviors or mental acts (compulsions) often performed in response to an obsession.
Estimates in the early 1980s suggested that OCD affected less than 1% of adults and children, but lifetime prevalence of OCD is now known to be between 2% to 4% in the US.1,2
OCD begins in childhood for as many as 80% of cases,3 and it follows a chronic, unremitting course.4 Impairments in vocational, academic, and social and family functioning are often substantial.5,6 And patients are often unable to work, attend school, or socialize.
Diagnosis: telltale clues, reliable evaluation tools
Consider a diagnosis of OCD when a patient exhibits or complains of intrusive thoughts (eg, specific phrases, worries, images, or numbers), anxiety-based avoidance of certain places (eg, public restrooms) or objects (eg, doorknobs), excessive reassurance-seeking, or repetitive behaviors/rituals (eg, checking, cleaning, hoarding).
Common intrusive thoughts (obsessions) and repetitive behaviors (compulsions) are listed in TABLES 1 AND 2, respectively. According to the Diagnostic and Statistical Manual of Mental Disorders (DSM-IV),7 OCD should be diagnosed only if these symptoms cause significant distress or impairment to the individual; however, subclinical presentations of OCD are also relatively common. DSM-IV diagnostic criteria for OCD are outlined in TABLE 3.
TABLE 1
Common obsessions in OCD
| CATEGORIES | OBSESSIVE CONCERNS |
|---|---|
| Contamination | Dirt; germs; animals/insects; illnesses; bodily waste; contaminants; household cleaners; “sticky” substances; spreading contamination, germs, illnesses, etc |
| Aggression | Harming self or others (even accidentally); causing harm to self or others due to thoughts or behaviors; acting upon aggressive impulses; blurting out inappropriate words/phrases; stealing or breaking things; causing something terrible to happen; frightening/violent images |
| Sexual | Forbidden/perverse sexual thoughts, images; disturbing sexual impulses, desires; homosexuality; molestation; sexual acts toward others |
| Hoarding/saving | Losing things; throwing away objects that might be important |
| Magical thinking | Lucky/unlucky numbers, colors, names, etc |
| Health/body | Contracting illness (especially if fatal or rare); appearance; physical abnormalities (real or imagined) |
| Mortality/religion | Dying and not going to Heaven; offending God; being sinful; morality/perfection; right/wrong |
| Miscellaneous | Knowing/remembering certain things; saying things exactly right; not saying certain words/phrases; intrusive images sounds, words, music, numbers, etc |
| Adapted from the Yale-Brown Obsessive-Compulsive Scale14-15 and the Children’s Yale-Brown Obsessive-Compulsive Scale.16 | |
TABLE 2
Common compulsions in OCD
| CATEGORIES | COMPULSIVE RITUALS |
|---|---|
| Washing & cleaning | Excessive/ritualized handwashing, showering, bathing, toothbrushing, grooming, toileting; cleaning clothing/personal items; avoiding “contaminated” objects/places |
| Checking | Checking locks, alarms, school supplies, homework, toys, books, etc; checking associated with washing, dressing, undressing, somatic concerns; checking that did/will not harm self or others; checking that nothing terrible did/will happen; checking for mistakes |
| Repeating | Rewriting; rereading; recopying; retying (eg, shoelaces); erasing; going in/out door or taking items in/out of schoolbag; getting up/down from seat; repeating words/phrases |
| Counting | Counting objects; mental counting (especially up to a “magic” number); counting steps, chewing, hair-brushing, etc |
| Ordering/arranging | Lining up objects in a certain way; arranging things in specific patterns; making objects/piles/groups “even”; making things symmetrical; “balancing” actions (eg, doing thing on the right and on the left) |
| Hoarding & saving | Keeping unimportant/unnecessary items and/or trash; storing items of no particular value; having difficulty throwing things away; sorting through trash to ensure that nothing important has been thrown away |
| Superstitions | Touching/tapping routines to prevent bad things from happening; avoiding stepping on cracks, lines, etc; avoiding “unlucky” objects/places |
| Reassurance-seeking | Asking a parent to repeatedly answer the same questions; asking parents to describe what they are doing/planning to do; forcing family members to do things in a certain way or at a certain time; forcing family members to avoid certain things/activities |
| Miscellaneous | Mental rituals; needing to tell/ask/confess; ritualized eating behaviors; excessive list-making; needing to touch/tap/rub; needing to do things until it feels “just right” hair-pulling; measures to prevent something bad from happening |
| Adapted from the Yale-Brown Obsessive-Compulsive Scale14-15 and the Children’s Yale-Brown Obsessive-Compulsive Scale.16 | |
Unique aspects of childhood OCD
The incidence and presentation of symptoms in pediatric-onset OCD may differ somewhat from those of adult-onset OCD. For example, strongly consider a diagnosis of OCD if a child or adolescent displays behavioral changes (eg, develops new fears or rituals) after exposure to the streptococcal virus. OCD falls under the category of Pediatric Autoimmune Neurological Disorders Associated with Streptococcus (PANDAS),8 and rapid symptom-onset may reflect this phenomenon.
Symptoms may cause no distress… Though many pediatric patients report multiple symptoms,9 some will not recognize that their symptoms are bizarre or excessive.10 In fact, a subset of pediatric patients may appear undistressed by their symptoms or report that they enjoy engaging in OCD behaviors.11
… or may be incapacitating. However, other children find OCD symptoms overwhelming and may even enlist the help of others (eg, family members) to complete their rituals. Parents of these children frequently report that their child experiences “meltdowns” when the OCD symptoms are not accommodated. Pediatric patients frequently report feeling “stuck” because OCD symptoms interfere with their ability to complete day-to-day tasks (eg, bathing, homework, eating, chores, etc). If you suspect this level of incapacitation, obtain information from parents regarding the impact of symptoms on both child and family functioning.
How to approach the evaluation
Given that symptoms of OCD overlap significantly with other psychiatric and neurologic disorders (eg, general anxiety, psychosis, and mood, pervasive-developmental, and tic disorders), a thorough assessment is crucial to the differential diagnosis of OCD.
Particularly with children, you need to distinguish possible symptoms of OCD from developmentally appropriate rituals (eg, bedtime routines) and fears.12
Inquire about a family history of OCD or other anxiety disorders, either of which increases the likelihood of a diagnosis of OCD.13
Several methods of assessment have been developed that may facilitate your attempt to identify OCD. These include diagnostic interviews, clinician-administered inventories, self-report measures, and (for pediatric patients) parent-report and teacher-report measures.
Diagnostic interviews effective but time consuming. In general, diagnostic interviews are reliable and valid measures that facilitate diagnostic decisions by using questions developed specifically to assess DSM-IV symptoms.7 Good examples include the Anxiety Disorders Interview Schedule for DSM-IV: Child & Parent Versions (ADIS),14 the Schedule for Affective Disorders and Schizophrenia for School-Age Children—Present & Lifetime version (K-SADS-PL),15 and the Structured Clinical Interview Diagnostic for DSM-IV (SCID).16
Each method is highly structured and clinician administered. Such interview techniques assess for anxiety disorders and also include sections to help uncover other psychiatric disorders (ie, disruptive behavior disorders, psychotic disorders, and mood disorders).
However, these interviews are fairly time-consuming and require training to administer. As a result, they are typically administered by a psychologist or other mental health professional.
Clinician-administered measures are reliable and efficient. These inventories allow trained clinicians to rate a patient’s level of impairment and distress compared with other patients they have seen. The most commonly-used “gold standard” measures are the Yale-Brown Obsessive Compulsive Scale (Y-BOCS)17,18 for adults, and the Children’s Yale-Brown Obsessive Com-pulsive Scale (CY-BOCS)19 for youth. The Y-BOCS and the CY-BOCS are semi-structured inventories of OCD symptom presence and severity over the previous week. Both measures have repeatedly demonstrated good reliability and validity,17-22 and they can be completed in approximately 15 minutes.
Self-report and parent-report questionnaires may be most helpful. You may find self- or parent-report questionnaires most useful in your practice, because they can be completed quickly and without your assistance. The measures are particularly useful as screening devices, and thus can also be used to identify patients who may benefit from referral to a psychologist or psychiatrist for a more comprehensive evaluation. An additional strength of these questionnaires is that they can easily be readministered to assess posttreatment change.
For the assessment of adult OCD, we use the Florida Obsessive Compulsive Inventory (FOCI)23 and Obsessive Compulsive Inventory—Revised (OCI-R).24 The FOCI, which is reprinted in APPENDIX A, is a brief measure that screens for common OCD symptoms and assesses the severity of OCD impairment in patients with OCD. The OCI-R is a theoretically-driven instrument that assesses the extent to which individuals are “distressed or bothered” by common OCD symptoms.
For assessment of pediatric OCD, several self-report and parent-report measures have been developed,25 and many are useful for diagnostic decisions.
First, the Children’s Obsessional Compulsive Inventory (ChOCI)26 assesses for obsessive symptoms and compulsive symptoms, and the degree of impairment experienced as a result of symptoms.
Second, the Children’s Yale-Brown Obsessive-Compulsive Scale—Child Report and Parent Report27 consist of 2 subscales assessing the distress and impairment caused by Obsessions and Compulsions. Items are related to 1) time devoted to obsessions/compulsions, 2) functional impairment, 3) level of distress, 4) attempts to resist obsessions/compulsions, and 5) success in resisting obsessions/compulsions. The parent-report version of this questionnaire is included in APPENDIX B.
Third, the Child Obsessive Compulsive Impact Scale (COIS)28 assesses the extent to which symptoms cause impairment in specific areas of child psychosocial functioning (eg, school activities, social activities, and home/family activities).
Fourth, the Florida Obsessive-Compulsive Student Inventory29 is a teacherrated measure that can be used to assess symptom presence and severity in the school setting.
Part 2 of this article discusses treatment strategies for OCD. Look for it in next month’s JFP.
CORRESPONDENCE
Eric A. Storch, PhD, Department of Psychiatry, University of Florida, Box 100234, Gainesville, FL 32610. E-mail: [email protected]
1. Douglass H, Moffit TE, Dar R, McGee E, Silva P. Obsessive-compulsive disorder in a birth cohort of 18-year-olds: Prevalence and predicators. J Am Acad Child Adolesc Psychiatry 1995;34:1424-1431.
2. Karno M, Golding JM, Sorenson SB, Burnam MA. The epidemiology of obsessive-compulsive disorder in five US communities. Arch Gen Psychiatry 1988;45:1094-1099.
3. Pauls DL, Alsobrook JP, Phil M, Goodman WK, Rasmussen SA, Leckman JF. A family study of obsessive-compulsive disorder. Am J Psychiatry 1995;152:76-84.
4. Mataix-Cols D, Rauch SL, Baer L, et al. Symptom stability in adult obsessive-compulsive disorder: Data from a naturalistic two-year follow-up study. Am J Psychiatry 2002;159:263-268.
5. Koran L, Thienemann M, Davenport R. Quality of life for patients with obsessive-compulsive disorder. Am J Psychiatry 1996;153:783-788.
6. Piacentini J, Bergman RL, Keller M, McCracken J. Functional impairment in children and adolescents with obsessive-compulsive disorder. J Child Adolesc Psychopharmacol 2003;13S-1:S61-S69.
7. American Psychiatric Association. Diagnostic and Statistical Manual of Mental Disorders. 4th ed. Washington, DC: American Psychiatric Association; 1994.
8. Murphy TK, Sajid M, Soto O, et al. Detecting pediatric autoimmune neuropsychiatric disorders associated with streptococcus in children with obsessive-compulsive disorder and tics. Biolog Psychiatry 2004;55:61-68.
9. Flament MF, Whitaker A, Rapoport JL. Obsessive compulsive disorder in adolescence: An epidemiological study. J Am Acad Child Adolesc Psychiatry 1988;27:764-771.
10. Practice Parameters for the assessment and treatment of children and adolescents with obsessive-compulsive disorder. J Am Acad Child Adolesc Psychiatry 1998;37:27S-45S.
11. Geffken GR, Storch EA, Lewin A, Adkins J, Merlo LJ, Murphy TK. Development of the Pediatric OCD Disturbance Scale: Assessing ego-syntonic OCD. Paper presented at the Anxiety Disorders Association of America Annual Meeting 2005; Seattle, Wash.
12. March JS, Mulle K. OCD in Children and Adolescents: A Cognitive-Behavioral Treatment Manual. New York: Guilford Press; 1998.
13. Black DW, Gaffney GR, Schlosser S, Gabel J. Children of parents with obsessive-compulsive disorder—a 2-year follow-up study. Acta Psychiatrica Scandinavica 2003;107:305-313.
14. Silverman WK, Albano AM. The Anxiety Disorders Interview Schedule for DSM-IV: Child and Parent Versions. San Antonio, Tex: Psychological Corporation; 1996.
15. Kaufman J, Birmaher B, Brent D, Rao U. Schedule for Affective Disorders and Schizophrenia for School-Age Children-Present and Lifetime version (K-SADS-PL): Initial reliability and validity data. J Am Acad Child Adolesc Psychiatry 1997;36:980-988.
16. First MB, Gibbon M, Spitzer RL, Williams JBW. User’s guide for the structured clinical Interview for DSM-IV for Axis I Disorders: Research Version (SCID-I, version 2.0, final version). 1996.
17. Goodman WK, Price LH, Rasmussen SA, Mazure C. The Yale-Brown Obsessive Compulsive Scale: II Validity. Arch Gen Psychiatry 1989;46:1012-1016.
18. Goodman WK, Price LH, Rasmussen SA, Mazure C. The Yale-Brown Obsessive Compulsive Scale: II Validity. Arch Gen Psychiatry 1989;46:1006-1011.
19. Scahill L, Riddle MA, McSwiggin-Hardin M, Ort SI. Children’s Yale-Brown Obsessive Compulsive Scale: Reliability and validity. J Am Acad Child Adolesc Psychiatry 1997;36:844-852.
20. Arrindell WA, de Vlaming IH, Eisenhardt BM, van Berkum DE, Kwee MGT. Cross-cultural validity of the Yale-Brown Obsessive Compulsive Scale. J Beh Therapy Exper Psychiatry 2002;33:159-176.
21. McKay D, Danyko S, Neziroglu F, Yaryura-Tobias JA. Factor structure of the Yale-Brown Obsessive-Compulsive Scale: A two dimensional measure. Beh Res Therapy 1995;33:865-869.
22. McKay D, Piacentini J, Greisberg S, et al. The Children’s Yale-Brown Obsessive-Compulsive Scale: item structure in an outpatient setting. Psych Assess 2003;15:578-581.
23. Storch EA, Bagner DM, Merlo LJ, et al. Florida Obsessive-Compulsive Inventory: Development, Reliability, and Validity, 2005.
24. Foa EB, Huppert JD, Leiberg S, et al. The Obsessive-Compulsive Inventory: Development and validation of a short version. Psych Assess 2002;14:485-496.
25. Merlo LJ, Storch EA, Murphy TK, Goodman WK, Geffken GR. Assessment of pediatric Obsessive-Compulsive Disorder: A critical review of current methodology. Child Psychiatry Human Develop, in press.
26. Shafran R, Frampton I, Heyman I, Reynolds M, Teachman B, Rachman S. The preliminary development of a new self-report measure for OCD in young people. J Adolesc 2003;26:137-142.
27. Storch EA, Geffken GR, Murphy TK, Goodman WK. Child- and parent-report versions of the Children’s Yale-Brown Obsessive-Compulsive Scale, 2004.
28. Piacentini J, Jaffer M. Measuring functional impairment in youngsters with OCD: Manual for the Child OCD Impact Scale (COIS). Los Angeles, Calif: UCLA Department of Psychiatry; 1999.
29. Merlo LJ, Storch EA. Development and preliminary validation of the Florida Obsessive-Compulsive Student Inventory. Unpublished manuscript, 2005.
- For a person with symptoms suggestive of obsessive-compulsive disorder (OCD), inquire about a family history of OCD or other anxiety disorders, either of which increases the likelihood of a diagnosis of OCD.
- Keep in mind that, with children, symptoms suggestive of OCD may simply indicate developmentally appropriate rituals.
- Become familiar with the alternative methods of assessment to facilitate evaluation in your particular office setting.
- Consider OCD when a patient exhibits or complains of intrusive thoughts, anxiety-based avoidance of places or objects, excessive reassurance-seeking, or repetitive behaviors/rituals (B).
Has a parent in your practice reported odd behavior in their child (eg, new fears or rituals) following a streptococcal viral illness? Does your dialogue with an adult patient reveal undue anxiety about hygiene or personal safety? These examples are just 2 of many that signal a person may be suffering from obsessive-compulsive disorder (OCD)—a relentless, debilitating disorder if unrecognized and left untreated.
In this article, we explain the relative advantages of evaluative tools available (which can also help distinguish OCD in children from developmentally appropriate rituals).
In part 2 of this article (to be published in the April 2006 Journal of Family Practice), we discuss how to find professionals appropriately trained in cognitive-behavioral therapy (CBT), and recommend strategies for employing pharmacotherapy.
The tragedy of unrecognized OCD
OCD is an anxiety disorder characterized by recurrent or persistent thoughts, impulses, or images experienced as intrusive or distressing (obsessions), and repetitive behaviors or mental acts (compulsions) often performed in response to an obsession.
Estimates in the early 1980s suggested that OCD affected less than 1% of adults and children, but lifetime prevalence of OCD is now known to be between 2% to 4% in the US.1,2
OCD begins in childhood for as many as 80% of cases,3 and it follows a chronic, unremitting course.4 Impairments in vocational, academic, and social and family functioning are often substantial.5,6 And patients are often unable to work, attend school, or socialize.
Diagnosis: telltale clues, reliable evaluation tools
Consider a diagnosis of OCD when a patient exhibits or complains of intrusive thoughts (eg, specific phrases, worries, images, or numbers), anxiety-based avoidance of certain places (eg, public restrooms) or objects (eg, doorknobs), excessive reassurance-seeking, or repetitive behaviors/rituals (eg, checking, cleaning, hoarding).
Common intrusive thoughts (obsessions) and repetitive behaviors (compulsions) are listed in TABLES 1 AND 2, respectively. According to the Diagnostic and Statistical Manual of Mental Disorders (DSM-IV),7 OCD should be diagnosed only if these symptoms cause significant distress or impairment to the individual; however, subclinical presentations of OCD are also relatively common. DSM-IV diagnostic criteria for OCD are outlined in TABLE 3.
TABLE 1
Common obsessions in OCD
| CATEGORIES | OBSESSIVE CONCERNS |
|---|---|
| Contamination | Dirt; germs; animals/insects; illnesses; bodily waste; contaminants; household cleaners; “sticky” substances; spreading contamination, germs, illnesses, etc |
| Aggression | Harming self or others (even accidentally); causing harm to self or others due to thoughts or behaviors; acting upon aggressive impulses; blurting out inappropriate words/phrases; stealing or breaking things; causing something terrible to happen; frightening/violent images |
| Sexual | Forbidden/perverse sexual thoughts, images; disturbing sexual impulses, desires; homosexuality; molestation; sexual acts toward others |
| Hoarding/saving | Losing things; throwing away objects that might be important |
| Magical thinking | Lucky/unlucky numbers, colors, names, etc |
| Health/body | Contracting illness (especially if fatal or rare); appearance; physical abnormalities (real or imagined) |
| Mortality/religion | Dying and not going to Heaven; offending God; being sinful; morality/perfection; right/wrong |
| Miscellaneous | Knowing/remembering certain things; saying things exactly right; not saying certain words/phrases; intrusive images sounds, words, music, numbers, etc |
| Adapted from the Yale-Brown Obsessive-Compulsive Scale14-15 and the Children’s Yale-Brown Obsessive-Compulsive Scale.16 | |
TABLE 2
Common compulsions in OCD
| CATEGORIES | COMPULSIVE RITUALS |
|---|---|
| Washing & cleaning | Excessive/ritualized handwashing, showering, bathing, toothbrushing, grooming, toileting; cleaning clothing/personal items; avoiding “contaminated” objects/places |
| Checking | Checking locks, alarms, school supplies, homework, toys, books, etc; checking associated with washing, dressing, undressing, somatic concerns; checking that did/will not harm self or others; checking that nothing terrible did/will happen; checking for mistakes |
| Repeating | Rewriting; rereading; recopying; retying (eg, shoelaces); erasing; going in/out door or taking items in/out of schoolbag; getting up/down from seat; repeating words/phrases |
| Counting | Counting objects; mental counting (especially up to a “magic” number); counting steps, chewing, hair-brushing, etc |
| Ordering/arranging | Lining up objects in a certain way; arranging things in specific patterns; making objects/piles/groups “even”; making things symmetrical; “balancing” actions (eg, doing thing on the right and on the left) |
| Hoarding & saving | Keeping unimportant/unnecessary items and/or trash; storing items of no particular value; having difficulty throwing things away; sorting through trash to ensure that nothing important has been thrown away |
| Superstitions | Touching/tapping routines to prevent bad things from happening; avoiding stepping on cracks, lines, etc; avoiding “unlucky” objects/places |
| Reassurance-seeking | Asking a parent to repeatedly answer the same questions; asking parents to describe what they are doing/planning to do; forcing family members to do things in a certain way or at a certain time; forcing family members to avoid certain things/activities |
| Miscellaneous | Mental rituals; needing to tell/ask/confess; ritualized eating behaviors; excessive list-making; needing to touch/tap/rub; needing to do things until it feels “just right” hair-pulling; measures to prevent something bad from happening |
| Adapted from the Yale-Brown Obsessive-Compulsive Scale14-15 and the Children’s Yale-Brown Obsessive-Compulsive Scale.16 | |
Unique aspects of childhood OCD
The incidence and presentation of symptoms in pediatric-onset OCD may differ somewhat from those of adult-onset OCD. For example, strongly consider a diagnosis of OCD if a child or adolescent displays behavioral changes (eg, develops new fears or rituals) after exposure to the streptococcal virus. OCD falls under the category of Pediatric Autoimmune Neurological Disorders Associated with Streptococcus (PANDAS),8 and rapid symptom-onset may reflect this phenomenon.
Symptoms may cause no distress… Though many pediatric patients report multiple symptoms,9 some will not recognize that their symptoms are bizarre or excessive.10 In fact, a subset of pediatric patients may appear undistressed by their symptoms or report that they enjoy engaging in OCD behaviors.11
… or may be incapacitating. However, other children find OCD symptoms overwhelming and may even enlist the help of others (eg, family members) to complete their rituals. Parents of these children frequently report that their child experiences “meltdowns” when the OCD symptoms are not accommodated. Pediatric patients frequently report feeling “stuck” because OCD symptoms interfere with their ability to complete day-to-day tasks (eg, bathing, homework, eating, chores, etc). If you suspect this level of incapacitation, obtain information from parents regarding the impact of symptoms on both child and family functioning.
How to approach the evaluation
Given that symptoms of OCD overlap significantly with other psychiatric and neurologic disorders (eg, general anxiety, psychosis, and mood, pervasive-developmental, and tic disorders), a thorough assessment is crucial to the differential diagnosis of OCD.
Particularly with children, you need to distinguish possible symptoms of OCD from developmentally appropriate rituals (eg, bedtime routines) and fears.12
Inquire about a family history of OCD or other anxiety disorders, either of which increases the likelihood of a diagnosis of OCD.13
Several methods of assessment have been developed that may facilitate your attempt to identify OCD. These include diagnostic interviews, clinician-administered inventories, self-report measures, and (for pediatric patients) parent-report and teacher-report measures.
Diagnostic interviews effective but time consuming. In general, diagnostic interviews are reliable and valid measures that facilitate diagnostic decisions by using questions developed specifically to assess DSM-IV symptoms.7 Good examples include the Anxiety Disorders Interview Schedule for DSM-IV: Child & Parent Versions (ADIS),14 the Schedule for Affective Disorders and Schizophrenia for School-Age Children—Present & Lifetime version (K-SADS-PL),15 and the Structured Clinical Interview Diagnostic for DSM-IV (SCID).16
Each method is highly structured and clinician administered. Such interview techniques assess for anxiety disorders and also include sections to help uncover other psychiatric disorders (ie, disruptive behavior disorders, psychotic disorders, and mood disorders).
However, these interviews are fairly time-consuming and require training to administer. As a result, they are typically administered by a psychologist or other mental health professional.
Clinician-administered measures are reliable and efficient. These inventories allow trained clinicians to rate a patient’s level of impairment and distress compared with other patients they have seen. The most commonly-used “gold standard” measures are the Yale-Brown Obsessive Compulsive Scale (Y-BOCS)17,18 for adults, and the Children’s Yale-Brown Obsessive Com-pulsive Scale (CY-BOCS)19 for youth. The Y-BOCS and the CY-BOCS are semi-structured inventories of OCD symptom presence and severity over the previous week. Both measures have repeatedly demonstrated good reliability and validity,17-22 and they can be completed in approximately 15 minutes.
Self-report and parent-report questionnaires may be most helpful. You may find self- or parent-report questionnaires most useful in your practice, because they can be completed quickly and without your assistance. The measures are particularly useful as screening devices, and thus can also be used to identify patients who may benefit from referral to a psychologist or psychiatrist for a more comprehensive evaluation. An additional strength of these questionnaires is that they can easily be readministered to assess posttreatment change.
For the assessment of adult OCD, we use the Florida Obsessive Compulsive Inventory (FOCI)23 and Obsessive Compulsive Inventory—Revised (OCI-R).24 The FOCI, which is reprinted in APPENDIX A, is a brief measure that screens for common OCD symptoms and assesses the severity of OCD impairment in patients with OCD. The OCI-R is a theoretically-driven instrument that assesses the extent to which individuals are “distressed or bothered” by common OCD symptoms.
For assessment of pediatric OCD, several self-report and parent-report measures have been developed,25 and many are useful for diagnostic decisions.
First, the Children’s Obsessional Compulsive Inventory (ChOCI)26 assesses for obsessive symptoms and compulsive symptoms, and the degree of impairment experienced as a result of symptoms.
Second, the Children’s Yale-Brown Obsessive-Compulsive Scale—Child Report and Parent Report27 consist of 2 subscales assessing the distress and impairment caused by Obsessions and Compulsions. Items are related to 1) time devoted to obsessions/compulsions, 2) functional impairment, 3) level of distress, 4) attempts to resist obsessions/compulsions, and 5) success in resisting obsessions/compulsions. The parent-report version of this questionnaire is included in APPENDIX B.
Third, the Child Obsessive Compulsive Impact Scale (COIS)28 assesses the extent to which symptoms cause impairment in specific areas of child psychosocial functioning (eg, school activities, social activities, and home/family activities).
Fourth, the Florida Obsessive-Compulsive Student Inventory29 is a teacherrated measure that can be used to assess symptom presence and severity in the school setting.
Part 2 of this article discusses treatment strategies for OCD. Look for it in next month’s JFP.
CORRESPONDENCE
Eric A. Storch, PhD, Department of Psychiatry, University of Florida, Box 100234, Gainesville, FL 32610. E-mail: [email protected]
1. Douglass H, Moffit TE, Dar R, McGee E, Silva P. Obsessive-compulsive disorder in a birth cohort of 18-year-olds: Prevalence and predicators. J Am Acad Child Adolesc Psychiatry 1995;34:1424-1431.
2. Karno M, Golding JM, Sorenson SB, Burnam MA. The epidemiology of obsessive-compulsive disorder in five US communities. Arch Gen Psychiatry 1988;45:1094-1099.
3. Pauls DL, Alsobrook JP, Phil M, Goodman WK, Rasmussen SA, Leckman JF. A family study of obsessive-compulsive disorder. Am J Psychiatry 1995;152:76-84.
4. Mataix-Cols D, Rauch SL, Baer L, et al. Symptom stability in adult obsessive-compulsive disorder: Data from a naturalistic two-year follow-up study. Am J Psychiatry 2002;159:263-268.
5. Koran L, Thienemann M, Davenport R. Quality of life for patients with obsessive-compulsive disorder. Am J Psychiatry 1996;153:783-788.
6. Piacentini J, Bergman RL, Keller M, McCracken J. Functional impairment in children and adolescents with obsessive-compulsive disorder. J Child Adolesc Psychopharmacol 2003;13S-1:S61-S69.
7. American Psychiatric Association. Diagnostic and Statistical Manual of Mental Disorders. 4th ed. Washington, DC: American Psychiatric Association; 1994.
8. Murphy TK, Sajid M, Soto O, et al. Detecting pediatric autoimmune neuropsychiatric disorders associated with streptococcus in children with obsessive-compulsive disorder and tics. Biolog Psychiatry 2004;55:61-68.
9. Flament MF, Whitaker A, Rapoport JL. Obsessive compulsive disorder in adolescence: An epidemiological study. J Am Acad Child Adolesc Psychiatry 1988;27:764-771.
10. Practice Parameters for the assessment and treatment of children and adolescents with obsessive-compulsive disorder. J Am Acad Child Adolesc Psychiatry 1998;37:27S-45S.
11. Geffken GR, Storch EA, Lewin A, Adkins J, Merlo LJ, Murphy TK. Development of the Pediatric OCD Disturbance Scale: Assessing ego-syntonic OCD. Paper presented at the Anxiety Disorders Association of America Annual Meeting 2005; Seattle, Wash.
12. March JS, Mulle K. OCD in Children and Adolescents: A Cognitive-Behavioral Treatment Manual. New York: Guilford Press; 1998.
13. Black DW, Gaffney GR, Schlosser S, Gabel J. Children of parents with obsessive-compulsive disorder—a 2-year follow-up study. Acta Psychiatrica Scandinavica 2003;107:305-313.
14. Silverman WK, Albano AM. The Anxiety Disorders Interview Schedule for DSM-IV: Child and Parent Versions. San Antonio, Tex: Psychological Corporation; 1996.
15. Kaufman J, Birmaher B, Brent D, Rao U. Schedule for Affective Disorders and Schizophrenia for School-Age Children-Present and Lifetime version (K-SADS-PL): Initial reliability and validity data. J Am Acad Child Adolesc Psychiatry 1997;36:980-988.
16. First MB, Gibbon M, Spitzer RL, Williams JBW. User’s guide for the structured clinical Interview for DSM-IV for Axis I Disorders: Research Version (SCID-I, version 2.0, final version). 1996.
17. Goodman WK, Price LH, Rasmussen SA, Mazure C. The Yale-Brown Obsessive Compulsive Scale: II Validity. Arch Gen Psychiatry 1989;46:1012-1016.
18. Goodman WK, Price LH, Rasmussen SA, Mazure C. The Yale-Brown Obsessive Compulsive Scale: II Validity. Arch Gen Psychiatry 1989;46:1006-1011.
19. Scahill L, Riddle MA, McSwiggin-Hardin M, Ort SI. Children’s Yale-Brown Obsessive Compulsive Scale: Reliability and validity. J Am Acad Child Adolesc Psychiatry 1997;36:844-852.
20. Arrindell WA, de Vlaming IH, Eisenhardt BM, van Berkum DE, Kwee MGT. Cross-cultural validity of the Yale-Brown Obsessive Compulsive Scale. J Beh Therapy Exper Psychiatry 2002;33:159-176.
21. McKay D, Danyko S, Neziroglu F, Yaryura-Tobias JA. Factor structure of the Yale-Brown Obsessive-Compulsive Scale: A two dimensional measure. Beh Res Therapy 1995;33:865-869.
22. McKay D, Piacentini J, Greisberg S, et al. The Children’s Yale-Brown Obsessive-Compulsive Scale: item structure in an outpatient setting. Psych Assess 2003;15:578-581.
23. Storch EA, Bagner DM, Merlo LJ, et al. Florida Obsessive-Compulsive Inventory: Development, Reliability, and Validity, 2005.
24. Foa EB, Huppert JD, Leiberg S, et al. The Obsessive-Compulsive Inventory: Development and validation of a short version. Psych Assess 2002;14:485-496.
25. Merlo LJ, Storch EA, Murphy TK, Goodman WK, Geffken GR. Assessment of pediatric Obsessive-Compulsive Disorder: A critical review of current methodology. Child Psychiatry Human Develop, in press.
26. Shafran R, Frampton I, Heyman I, Reynolds M, Teachman B, Rachman S. The preliminary development of a new self-report measure for OCD in young people. J Adolesc 2003;26:137-142.
27. Storch EA, Geffken GR, Murphy TK, Goodman WK. Child- and parent-report versions of the Children’s Yale-Brown Obsessive-Compulsive Scale, 2004.
28. Piacentini J, Jaffer M. Measuring functional impairment in youngsters with OCD: Manual for the Child OCD Impact Scale (COIS). Los Angeles, Calif: UCLA Department of Psychiatry; 1999.
29. Merlo LJ, Storch EA. Development and preliminary validation of the Florida Obsessive-Compulsive Student Inventory. Unpublished manuscript, 2005.
Which patients taking SSRIs are at greatest risk of bleeding?
- For patients at high risk of abnormal bleeding, consider prescribing an antidepressant with low serotonin reuptake inhibition, which may lower risk.
- For patients taking high–serotonin reuptake inhibition antidepressants, recommend avoidance or minimal use of nonsteroidal anti-inflammatory drugs and aspirin.
Patients taking selective serotonin reuptake inhibitors (SSRIs) seem to be at higher risk of bleeding episodes than those taking non-SSRI antidepressants. But risk also varies within the SSRI category.
What the literature tells us
We identified 7 retrospective studies, 1 pilot study, and several case reports that discuss the relationship between SSRIs and bleeding. We also identified 2 additional papers that addressed the issue from epidemiologic and pharmacologic perspectives. While many case reports also document this relationship, our focus is on studies with larger samples.
Degree of reuptake inhibition matters
The most recent study1,2 examined SSRI use and the risk of abnormal bleeding associated with the degree of serotonin reuptake inhibition (SRI). Antidepressants were divided into 3 groups: high SRI (fluoxetine [Prozac], sertraline [Zoloft], paroxetine [Paxil]), intermediate SRI (venlafaxine [Effexor], amitriptyline [Limbitrol], fluvoxamine [Luvox]), and low SRI (mirtazapine [Remron], bupropion [Wellbutrin], nortriptyline [Aventyl, Pamelor]). The high-SRI group showed the greatest risk of hospitalization due to abnormal bleeding (odds ratio [OR]=2.6 compared with the low-SRI group), followed by the intermediate-SRI group (OR=1.9 compared with the low-SRI group).
Similarly, another study3 found a 3.7-fold increased risk of blood transfusion among elderly users of SSRIs (paroxetine, fluoxetine, clomipramine [Anafranil]) who underwent orthopedic surgery.
A third study4 showed patients taking high-SRI antidepressants (paroxetine, fluoxetine, sertraline, and clomipramine) had a higher risk of developing upper gastrointestinal (GI) bleeding compared with those taking low-SRI antidepressants (bupropion, nortriptyline, desipramine [Norpramin, Pertofrane]). This risk was even higher among patients with a history of GI bleeding.
NSAIDs, aspirin aggravate bleeding potential
A population-based case-control study5 also found an increased incidence of upper GI bleeding with SSRIs, though this effect was not found to be modified by age, sex, dose, or treatment duration. The effect however, was enhanced by the concurrent use of nonsteroidal anti-inflammatory drugs (NSAIDs), with a relative risk (RR) of 15.6 (95% CI, 6.6–36.6), as well as with aspirin but to a lesser degree (RR=7.2; 95% CI, 3.1–17.1).
A large (N=26,005) cohort study6 of all users of antidepressants in a Danish county found that the risk of upper GI bleeding was higher with SSRIs compared with non-SSRIs and other antidepressants. Concomitant use of aspirin and NSAIDs further increased the risk by 12.2 and 5.2 times, respectively.
Risk of bleeding not dependent on duration of therapy
A large observational cohort study7 found rates of abnormal bleeding 1 month after initiating SSRI therapy (fluoxetine, fluvoxamine, sertraline, paroxetine) did not differ significantly from 2 to 6 months into treatment. Nonetheless a combined SSRI cohort was found to be at greater risk for a hemorrhagic event compared with a baseline cohort.
The remaining 2 retrospective studies found no evidence of increased intracranial hemorrhage in patients taking SSRIs.8,9
In terms of clotting and bleeding parameters, a pilot study (n=10) did not show any significant differences before and after a trial of fluoxetine.10 One case report,11 however, has suggested that antidepressants may influence these parameters as was seen by a prolonged bleeding time.
The retrospective studies examined the degree that SRI increased the risk of abnormal bleeding, and considered confounding factors such as body mass index, NSAID use, smoking status, sex, and age. However, these were not randomized controlled trials and most participants were women.
Serotonin promotes platelet aggregation, and it is thought that SSRIs limit uptake of blood serotonin by platelets.1 The decreased amount of serotonin in platelets may increase the risk of abnormal bleeding.1 The decreased amount of serotonin in platelets may increase the risk of abnormal bleeding.1,3,4,6 SSRIs also appear to modify the formation of platelet plugs, as well as the responsiveness of peptide-induced activation of platelets through stimulation of the thrombin receptor.12
Take-home messages
SSRI use increases risk of bleeds, admission for abnormal bleeding, and perioperative transfusion. Moreover, the higher the degree of SRI, the higher the risk of bleeding.
Concomitant use of NSAIDs or aspirin further increases this risk.
Antidepressants with low SRI, such as bupropion and mirtazapine, may be associated with a lower risk of abnormal bleeding, although data are insufficient to make a definitive conclusion. Further research is needed to determine if these antidepressants may be more appropriate for patients at high risk of abnormal bleeding.
More research is also needed to clarify conflicting results to date on whether antidepressants cause abnormalities in bleeding or clotting profiles.
CORRESPONDENCE
Shree Bhalerao BA, BSc, Pgd, MD, FRCPC, St. Michael’s Hospital, Medical Psychiatry Service, 30 Bond St. Cardinal Carter Wing Rm 17046, Toronto, ON M5B 1W8 Canada. E-mail: [email protected].
1. Meijer WE, Heerdink ER, Nolen WA, Herings RM, Leufkens HG, Egberts AC. Association of risk of abnormal bleeding with degree of serotonin reuptake inhibition by antidepressants. Arch Intern Med 2004;164:2367-2370
2. Tatsumi M, Groshan K, Blakely RD, Richelson E. Pharmacological profile of antidepressants and related compounds at human monoamine transporters. Eur J Pharmacol 1997;340:249-258
3. Movig KL, Janssen MW, de Waal Malefijt J, Kabel PJ, Leufkens HG, Egberts AC. Relationship of serotonergic antidepressants and need for blood transfusion in orthopedic surgical patients. Arch Intern Med 2003;163:2354-2358
4. van Walraven C, Mamdani MM, Wells PS, Williams JI. Inhibition of serotonin reuptake by antidepressants and upper gastrointestinal bleeding in elderly patients: retrospective cohort study. BMJ 2001;323:655-658
5. de Abajo FJ, Rodriguez LA, Montero D. Association between selective serotonin reuptake inhibitors and upper gastrointestinal bleeding: population based case-control study. BMJ 1999;319:1106-1109
6. Dalton SO, Johansen C, Mellemkjaer L, Norgard B, Sorensen HT, Olsen JH. Use of selective serotonin reuptake inhibitors and risk of upper gastrointestinal tract bleeding: a population-based cohort study. Arch Intern Med 2003;163:59-64
7. Layton D, Clark DW, Pearce GL, Shakir SA. Is there an association between selective serotonin reuptake inhibitors and risk of abnormal bleeding? Results from a cohort study based on prescription event monitoring in England. Eur J Clin Pharmacol 2001;57:167-176
8. de Abajo FJ, Jick H, Derby L, Jick S, Schmitz S. Intracranial haemorrhage and use of selective serotonin reuptake inhibitors. Br J Clin Pharmacol 2000;50:43-47
9. Bak S, Tsiropoulos I, Kjaersgaard JO, et al. Selective serotonin reuptake inhibitors and the risk of stroke: a population-based case-control study. Stroke 2002;33:1465-1473
10. Berk M, Jacobson BF, Hurly E. Fluoxetine and hemostatic function: a pilot study. J Clin Psychiatry 1995;56:14-16
11. Calhoun JW, Calhoun DD. Prolonged bleeding time in a patient treated with sertraline. Am J Psychiatry 1996;153:443.-
12. Hergovich N, Aigner M, Eichler HG, Entlicher J, Drucker C, Jilma B. Paroxetine decreases platelet serotonin storage and platelet function in human beings. Clin Pharmacol Ther 2000;68:435-442
- For patients at high risk of abnormal bleeding, consider prescribing an antidepressant with low serotonin reuptake inhibition, which may lower risk.
- For patients taking high–serotonin reuptake inhibition antidepressants, recommend avoidance or minimal use of nonsteroidal anti-inflammatory drugs and aspirin.
Patients taking selective serotonin reuptake inhibitors (SSRIs) seem to be at higher risk of bleeding episodes than those taking non-SSRI antidepressants. But risk also varies within the SSRI category.
What the literature tells us
We identified 7 retrospective studies, 1 pilot study, and several case reports that discuss the relationship between SSRIs and bleeding. We also identified 2 additional papers that addressed the issue from epidemiologic and pharmacologic perspectives. While many case reports also document this relationship, our focus is on studies with larger samples.
Degree of reuptake inhibition matters
The most recent study1,2 examined SSRI use and the risk of abnormal bleeding associated with the degree of serotonin reuptake inhibition (SRI). Antidepressants were divided into 3 groups: high SRI (fluoxetine [Prozac], sertraline [Zoloft], paroxetine [Paxil]), intermediate SRI (venlafaxine [Effexor], amitriptyline [Limbitrol], fluvoxamine [Luvox]), and low SRI (mirtazapine [Remron], bupropion [Wellbutrin], nortriptyline [Aventyl, Pamelor]). The high-SRI group showed the greatest risk of hospitalization due to abnormal bleeding (odds ratio [OR]=2.6 compared with the low-SRI group), followed by the intermediate-SRI group (OR=1.9 compared with the low-SRI group).
Similarly, another study3 found a 3.7-fold increased risk of blood transfusion among elderly users of SSRIs (paroxetine, fluoxetine, clomipramine [Anafranil]) who underwent orthopedic surgery.
A third study4 showed patients taking high-SRI antidepressants (paroxetine, fluoxetine, sertraline, and clomipramine) had a higher risk of developing upper gastrointestinal (GI) bleeding compared with those taking low-SRI antidepressants (bupropion, nortriptyline, desipramine [Norpramin, Pertofrane]). This risk was even higher among patients with a history of GI bleeding.
NSAIDs, aspirin aggravate bleeding potential
A population-based case-control study5 also found an increased incidence of upper GI bleeding with SSRIs, though this effect was not found to be modified by age, sex, dose, or treatment duration. The effect however, was enhanced by the concurrent use of nonsteroidal anti-inflammatory drugs (NSAIDs), with a relative risk (RR) of 15.6 (95% CI, 6.6–36.6), as well as with aspirin but to a lesser degree (RR=7.2; 95% CI, 3.1–17.1).
A large (N=26,005) cohort study6 of all users of antidepressants in a Danish county found that the risk of upper GI bleeding was higher with SSRIs compared with non-SSRIs and other antidepressants. Concomitant use of aspirin and NSAIDs further increased the risk by 12.2 and 5.2 times, respectively.
Risk of bleeding not dependent on duration of therapy
A large observational cohort study7 found rates of abnormal bleeding 1 month after initiating SSRI therapy (fluoxetine, fluvoxamine, sertraline, paroxetine) did not differ significantly from 2 to 6 months into treatment. Nonetheless a combined SSRI cohort was found to be at greater risk for a hemorrhagic event compared with a baseline cohort.
The remaining 2 retrospective studies found no evidence of increased intracranial hemorrhage in patients taking SSRIs.8,9
In terms of clotting and bleeding parameters, a pilot study (n=10) did not show any significant differences before and after a trial of fluoxetine.10 One case report,11 however, has suggested that antidepressants may influence these parameters as was seen by a prolonged bleeding time.
The retrospective studies examined the degree that SRI increased the risk of abnormal bleeding, and considered confounding factors such as body mass index, NSAID use, smoking status, sex, and age. However, these were not randomized controlled trials and most participants were women.
Serotonin promotes platelet aggregation, and it is thought that SSRIs limit uptake of blood serotonin by platelets.1 The decreased amount of serotonin in platelets may increase the risk of abnormal bleeding.1 The decreased amount of serotonin in platelets may increase the risk of abnormal bleeding.1,3,4,6 SSRIs also appear to modify the formation of platelet plugs, as well as the responsiveness of peptide-induced activation of platelets through stimulation of the thrombin receptor.12
Take-home messages
SSRI use increases risk of bleeds, admission for abnormal bleeding, and perioperative transfusion. Moreover, the higher the degree of SRI, the higher the risk of bleeding.
Concomitant use of NSAIDs or aspirin further increases this risk.
Antidepressants with low SRI, such as bupropion and mirtazapine, may be associated with a lower risk of abnormal bleeding, although data are insufficient to make a definitive conclusion. Further research is needed to determine if these antidepressants may be more appropriate for patients at high risk of abnormal bleeding.
More research is also needed to clarify conflicting results to date on whether antidepressants cause abnormalities in bleeding or clotting profiles.
CORRESPONDENCE
Shree Bhalerao BA, BSc, Pgd, MD, FRCPC, St. Michael’s Hospital, Medical Psychiatry Service, 30 Bond St. Cardinal Carter Wing Rm 17046, Toronto, ON M5B 1W8 Canada. E-mail: [email protected].
1. Meijer WE, Heerdink ER, Nolen WA, Herings RM, Leufkens HG, Egberts AC. Association of risk of abnormal bleeding with degree of serotonin reuptake inhibition by antidepressants. Arch Intern Med 2004;164:2367-2370
2. Tatsumi M, Groshan K, Blakely RD, Richelson E. Pharmacological profile of antidepressants and related compounds at human monoamine transporters. Eur J Pharmacol 1997;340:249-258
3. Movig KL, Janssen MW, de Waal Malefijt J, Kabel PJ, Leufkens HG, Egberts AC. Relationship of serotonergic antidepressants and need for blood transfusion in orthopedic surgical patients. Arch Intern Med 2003;163:2354-2358
4. van Walraven C, Mamdani MM, Wells PS, Williams JI. Inhibition of serotonin reuptake by antidepressants and upper gastrointestinal bleeding in elderly patients: retrospective cohort study. BMJ 2001;323:655-658
5. de Abajo FJ, Rodriguez LA, Montero D. Association between selective serotonin reuptake inhibitors and upper gastrointestinal bleeding: population based case-control study. BMJ 1999;319:1106-1109
6. Dalton SO, Johansen C, Mellemkjaer L, Norgard B, Sorensen HT, Olsen JH. Use of selective serotonin reuptake inhibitors and risk of upper gastrointestinal tract bleeding: a population-based cohort study. Arch Intern Med 2003;163:59-64
7. Layton D, Clark DW, Pearce GL, Shakir SA. Is there an association between selective serotonin reuptake inhibitors and risk of abnormal bleeding? Results from a cohort study based on prescription event monitoring in England. Eur J Clin Pharmacol 2001;57:167-176
8. de Abajo FJ, Jick H, Derby L, Jick S, Schmitz S. Intracranial haemorrhage and use of selective serotonin reuptake inhibitors. Br J Clin Pharmacol 2000;50:43-47
9. Bak S, Tsiropoulos I, Kjaersgaard JO, et al. Selective serotonin reuptake inhibitors and the risk of stroke: a population-based case-control study. Stroke 2002;33:1465-1473
10. Berk M, Jacobson BF, Hurly E. Fluoxetine and hemostatic function: a pilot study. J Clin Psychiatry 1995;56:14-16
11. Calhoun JW, Calhoun DD. Prolonged bleeding time in a patient treated with sertraline. Am J Psychiatry 1996;153:443.-
12. Hergovich N, Aigner M, Eichler HG, Entlicher J, Drucker C, Jilma B. Paroxetine decreases platelet serotonin storage and platelet function in human beings. Clin Pharmacol Ther 2000;68:435-442