User login
Patient Knowledge and Attitudes About Fecal Microbiota Therapy for Clostridium difficile Infection
Clostridium difficile (C difficile) infection (CDI) is a leading cause of infectious diarrhea among hospitalized patients and, increasingly, in ambulatory patients.1,2 The high prevalence of CDI and the high recurrence rates (15%-30%) led the CDC to categorize C difficile as an "urgent" threat (the highest category) in its 2013 Antimicrobial Resistance Threat Report.3-5 The Infectious Diseases Society of America guideline recommended treatment for CDI is vancomycin or metronidazole; more recent studies also support fidaxomicin use.4,6,7
Patients experiencing recurrent CDI are at risk for further recurrences, such that after the third CDI episode, the risk of subsequent recurrences exceeds 50%.8 This recurrence rate has stimulated research into other treatments, including fecal microbiota transplantation (FMT). A recent systematic review of FMT reports that 85% of patients have resolution of symptoms without recurrence after FMT, although this is based on data from case series and 2 small randomized clinical trials.9
A commonly cited barrier to FMT is patient acceptance. In response to this concern, a previous survey demonstrated that 81% of respondents would opt for FMT to treat a hypothetical case of recurrent CDI.10 However, the surveyed population did not have CDI, and the 48% response rate is concerning, since those with a favorable opinion of FMT might be more willing to complete a survey than would other patients. Accordingly, the authors systematically surveyed hospitalized veterans with active CDI to assess their knowledge, attitudes, and opinions about FMT as a treatment for CDI.
Methods
In-person patient interviews were conducted by one of the study authors at the Minneapolis VA Health Care System (MVAHCS), consisting of 13 to 18 questions. Questions addressed any prior CDI episodes and knowledge of the following: CDI, recurrence risk, and FMT; preferred route and location of FMT administration; concerns regarding FMT; likelihood of agreeing to undergo FMT (if available); and likelihood of enrollment in a hypothetical study comparing FMT to standard antibiotic treatment. The survey was developed internally and was not validated. Questions used the Likert-scale (Survey).
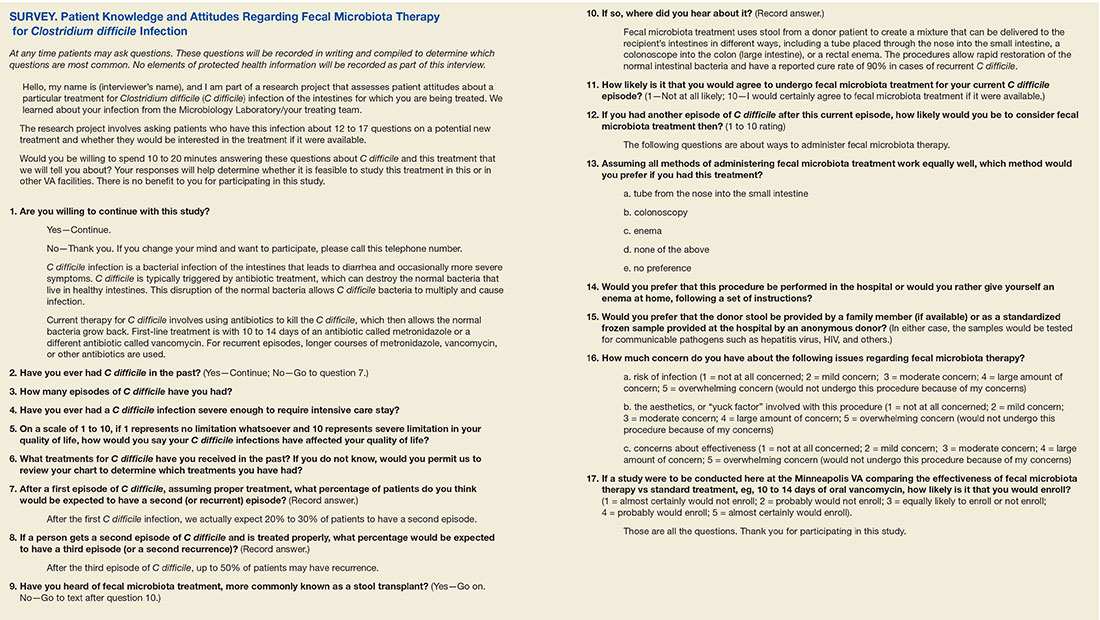
Patients with CDI were identified by monitoring for positive C difficile polymerase chain reaction (PCR) stool tests and then screened for inclusion by medical record review. Inclusion criteria were (1) MVAHCS hospitalization; and (2) written informed consent. Exclusion criteria were the inability to communicate or participate in an interview. Patient responses regarding their likelihood of agreeing to FMT for CDI treatment under different circumstances were compared using Wilcoxon rank sum test. These circumstances included FMT for their current episode of CDI, FMT for a subsequent episode, and FMT if recommended by their physician. Possible concerns regarding FMT also were solicited, including infection risk, effectiveness, and procedural aesthetics. The MVAHCS institutional review board approved the study.
Results
Stool PCR tests for CDI were monitored for 158 days from 2013 to 2014 (based on availability of study staff), yielding 106 positive results. Of those, 31 (29%) were from outpatients and not addressed further. Of the 75 positive CDI tests from 66 hospitalized patients (9 patients had duplicate tests), 18 of 66 (27%) were not able to provide consent and were excluded, leaving 48 eligible patients. Six (13%) were missed for logistic reasons (patient at a test or procedure, discharged before approached, etc), leaving 42 patients who were approached for participation. Among these, 34 (81%) consented to participate in the survey. Two subjects (6%) found the topic so unappealing that they terminated the interview.
The majority of enrolled subjects were men (32/34, 94%), with a mean age of 65.3 years (range, 31-89). Eleven subjects (32%) reported a prior CDI episode, with 10 reporting 1 such episode, and the other 2 episodes. Those with prior CDI reported the effect of CDI on their overall quality of life as 5.1 (1 = no limitation, 10 = severe limitation). Respondents were fairly accurate regarding the risk of recurrence after an initial episode of CDI, with the average expectedrecurrence rate estimated at 33%. In contrast, their estimation of the risk of recurrence after a second CDI episode was lower (28%), although the risk of recurrent episodes increases with each CDI recurrence.
Regarding FMT, 5 subjects indicated awareness of the procedure: 2 learning of it from a news source, 1 from family, 1 from a health care provider, and 1 was unsure of the source. After subjects received a description of FMT, their opinions regarding the procedure were elicited. When asked which route of delivery they would prefer if they were to undergo FMT, the 33 subjects who provided a response indicated a strong preference for either enema (15, 45%) or colonoscopy (10, 30%), compared with just 4 (12%) indicating no preference, 2 (6%) choosing nasogastric tube administration, and 2 (6%) indicating that they would not undergo FMT by any route (P < .001).
Regarding the location of FMT administration (hospital setting vs self-administered at home), 31 of 33 respondents (94%) indicated they would prefer FMT to occur in the hospital vs 2 (6%) preferring self-administration at home (P < .001). The preferred source of donor stool was more evenly distributed, with 14 of 32 respondents (44%) indicating a preference for an anonymous donor, 11 preferring a family member (34%), and 7 (21%) with no preference (P = .21).
Subjects were asked about concerns regarding FMT, and asked to rate each on a 5-point Likert scale (1 = not at all concerning; 5 = overwhelming concern). Concerns regarding risk of infection and effectiveness received an average score of 2.74 and 2.72, respectively, whereas concern regarding the aesthetics, or "yuck factor" was slightly lower (2.1: P = NS for all comparisons). Subjects also were asked to rate the likelihood of undergoing FMT, if it were available, for their current episode of CDI, a subsequent episode of CDI, or if their physician recommended undergoing FMT (10 point scale: 1 = not at all likely; 10 = certainly agree to FMT). The mean scores (SD) for agreeing to FMT for the current or a subsequent episode were 4.8 (SD 2.7) and 5.6 (SD 3.0); P = .12, but increased to 7.1 (SD 3.23) if FMT were recommended by their physician (P < .001 for FMT if physician recommended vs FMT for current episode; P = .001 for FMT if physician recommended vs FMT for a subsequent episode). Finally, subjects were asked about the likelihood of enrolling in a study comparing FMT to standard antimicrobial treatment, with answers ranging from 1 (almost certainly would not enroll) to 5 (almost certainly would enroll). Among the 32 respondents to this question, 17 (53%) answered either "probably would enroll" or "almost certainly would enroll," with a mean score of 3.2.
Discussion
Overall, VA patients with a current episode of CDI were not aware of FMT, with just 15% knowing about the procedure. However, after learning about FMT, patients expressed clear opinions regarding the route and setting of FMT administration, with enema or colonoscopy being the preferred routes, and a hospital the preferred setting. In contrast, subjects expressed ambivalence with regard to the source of donor stool, with no clear preference for stool from an anonymous donor vs from a family member.
When asked about concerns regarding FMT, none of the presented options (risk of infection, uncertain effectiveness, or procedural aesthetics) emerged as significantly more important than did others, although the oft-cited concern regarding FMT aesthetics engendered the lowest overall level of concern. In terms of FMT acceptance, 4 subjects (12%) were opposed to the procedure, indicating that they were not at all likely to agree to FMT for all scenarios (defined as a score of 1 or 2 on the 10-point Likert scale) or by terminating the survey because of the questions. However, 15 (44%) indicated that they would certainly agree to FMT (defined as a score of 9 or 10 on the 10-point Likert scale) if their physician recommended it. Physician recommendation for FMT resulted in the highest overall likelihood of agreeing to FMT, a finding in agreement with a previous survey of FMT for CDI.10 Most subjects indicated likely enrollment in a potential study comparing FMT with standard antimicrobial therapy.
Strengths/Limitations
Study strengths included surveying patients with current CDI, such that patients had personal experience with the disease in question. Use of in-person interviews also resulted in a robust response rate of 81% and allowed subjects to clarify any unclear questions with study personnel. Weaknesses included a relatively small sample size, underrepresentation of women, and lack of detail regarding respondent characteristics. Additionally, capsule delivery of FMT was not assessed since this method of delivery had not been published at the time of survey administration.
Conclusion
This survey of VA patients with CDI suggests that aesthetic concerns are not a critical deterrent for this population, and interest in FMT for the treatment of recurrent CDI exists. Physician recommendation to undergo FMT seems to be the most influential factor affecting the likelihood of agreeing to undergo FMT. These results support the feasibility of conducting clinical trials of FMT in the VA system.
1. Miller BA, Chen LF, Sexton DJ, Anderson DJ. Comparison of the burdens of hospital-onset, healthcare facility-associated Clostridium difficile Infection and of healthcare-associated infection due to methicillin-resistant Staphylococcus aureus in community hospitals. Infect Control Hosp Epidemiol. 2011;32(4):387-390.
2. Centers for Disease Control and Prevention. Severe Clostridium difficile-associated disease in populations previously at low risk--four states, 2005. MMWR Morb Mortal Wkly Rep. 2005;54(47):1201-1205.
3. Johnson S, Louie TJ, Gerding DN, et al; Polymer Alternative for CDI Treatment (PACT) investigators. Vancomycin, metronidazole, or tolevamer for Clostridium difficile infection: results from two multinational, randomized, controlled trials. Clin Infect Dis. 2014;59(3):345-354.
4. Louie TJ, Miller MA, Mullane KM, et al; OPT-80-003 Clinical Study Group. Fidaxomicin versus vancomycin for Clostridium difficile infection. N Engl J Med. 2011;364(5):422-431.
5. Centers for Disease Control and Prevention. Antibiotic resistance threats in the United States, 2013. http://www.cdc.gov/drugresistance/threat-report-2013. Updated July 17, 2014. Accessed November 16.2016.
6. Cohen SH, Gerding DN, Johnson S, et al; Society for Healthcare Epidemiology of America; Infectious Diseases Society of America. Clinical practice guidelines for Clostridium difficile infection in adults: 2010 update by the society for healthcare epidemiology of America (SHEA) and the Infectious Diseases Society of America (IDSA). Infect Control Hosp Epidemiol. 2010;31(5):431-455.
7. Cornely OA, Crook DW, Esposito R, et al; OPT-80-004 Clinical Study Group. Fidaxomicin versus vancomycin for infection with Clostridium difficile in Europe, Canada, and the USA: a double-blind, non-inferiority, randomised controlled trial. Lancet Infect Dis. 2012;12(4):281-289.
8. Johnson S. Recurrent Clostridium difficile infection: a review of risk factors, treatments, and outcomes. J Infect. 2009;58(6):403-410.
9. Drekonja DM, Reich J, Gezahegn S, et al. Fecal microbiota transplantation for Clostridium difficile infection--a systematic review. Ann Intern Med. 2015;162(9):630-638.
10. Zipursky JS, Sidorsky TI, Freedman CA, Sidorsky MN, Kirkland KB. Patient attitudes toward the use of fecal microbiota transplantation in the treatment of recurrent Clostridium difficile infection. Clin Infect Dis. 2012;55(12):1652-1658.
Clostridium difficile (C difficile) infection (CDI) is a leading cause of infectious diarrhea among hospitalized patients and, increasingly, in ambulatory patients.1,2 The high prevalence of CDI and the high recurrence rates (15%-30%) led the CDC to categorize C difficile as an "urgent" threat (the highest category) in its 2013 Antimicrobial Resistance Threat Report.3-5 The Infectious Diseases Society of America guideline recommended treatment for CDI is vancomycin or metronidazole; more recent studies also support fidaxomicin use.4,6,7
Patients experiencing recurrent CDI are at risk for further recurrences, such that after the third CDI episode, the risk of subsequent recurrences exceeds 50%.8 This recurrence rate has stimulated research into other treatments, including fecal microbiota transplantation (FMT). A recent systematic review of FMT reports that 85% of patients have resolution of symptoms without recurrence after FMT, although this is based on data from case series and 2 small randomized clinical trials.9
A commonly cited barrier to FMT is patient acceptance. In response to this concern, a previous survey demonstrated that 81% of respondents would opt for FMT to treat a hypothetical case of recurrent CDI.10 However, the surveyed population did not have CDI, and the 48% response rate is concerning, since those with a favorable opinion of FMT might be more willing to complete a survey than would other patients. Accordingly, the authors systematically surveyed hospitalized veterans with active CDI to assess their knowledge, attitudes, and opinions about FMT as a treatment for CDI.
Methods
In-person patient interviews were conducted by one of the study authors at the Minneapolis VA Health Care System (MVAHCS), consisting of 13 to 18 questions. Questions addressed any prior CDI episodes and knowledge of the following: CDI, recurrence risk, and FMT; preferred route and location of FMT administration; concerns regarding FMT; likelihood of agreeing to undergo FMT (if available); and likelihood of enrollment in a hypothetical study comparing FMT to standard antibiotic treatment. The survey was developed internally and was not validated. Questions used the Likert-scale (Survey).
Patients with CDI were identified by monitoring for positive C difficile polymerase chain reaction (PCR) stool tests and then screened for inclusion by medical record review. Inclusion criteria were (1) MVAHCS hospitalization; and (2) written informed consent. Exclusion criteria were the inability to communicate or participate in an interview. Patient responses regarding their likelihood of agreeing to FMT for CDI treatment under different circumstances were compared using Wilcoxon rank sum test. These circumstances included FMT for their current episode of CDI, FMT for a subsequent episode, and FMT if recommended by their physician. Possible concerns regarding FMT also were solicited, including infection risk, effectiveness, and procedural aesthetics. The MVAHCS institutional review board approved the study.
Results
Stool PCR tests for CDI were monitored for 158 days from 2013 to 2014 (based on availability of study staff), yielding 106 positive results. Of those, 31 (29%) were from outpatients and not addressed further. Of the 75 positive CDI tests from 66 hospitalized patients (9 patients had duplicate tests), 18 of 66 (27%) were not able to provide consent and were excluded, leaving 48 eligible patients. Six (13%) were missed for logistic reasons (patient at a test or procedure, discharged before approached, etc), leaving 42 patients who were approached for participation. Among these, 34 (81%) consented to participate in the survey. Two subjects (6%) found the topic so unappealing that they terminated the interview.
The majority of enrolled subjects were men (32/34, 94%), with a mean age of 65.3 years (range, 31-89). Eleven subjects (32%) reported a prior CDI episode, with 10 reporting 1 such episode, and the other 2 episodes. Those with prior CDI reported the effect of CDI on their overall quality of life as 5.1 (1 = no limitation, 10 = severe limitation). Respondents were fairly accurate regarding the risk of recurrence after an initial episode of CDI, with the average expectedrecurrence rate estimated at 33%. In contrast, their estimation of the risk of recurrence after a second CDI episode was lower (28%), although the risk of recurrent episodes increases with each CDI recurrence.
Regarding FMT, 5 subjects indicated awareness of the procedure: 2 learning of it from a news source, 1 from family, 1 from a health care provider, and 1 was unsure of the source. After subjects received a description of FMT, their opinions regarding the procedure were elicited. When asked which route of delivery they would prefer if they were to undergo FMT, the 33 subjects who provided a response indicated a strong preference for either enema (15, 45%) or colonoscopy (10, 30%), compared with just 4 (12%) indicating no preference, 2 (6%) choosing nasogastric tube administration, and 2 (6%) indicating that they would not undergo FMT by any route (P < .001).
Regarding the location of FMT administration (hospital setting vs self-administered at home), 31 of 33 respondents (94%) indicated they would prefer FMT to occur in the hospital vs 2 (6%) preferring self-administration at home (P < .001). The preferred source of donor stool was more evenly distributed, with 14 of 32 respondents (44%) indicating a preference for an anonymous donor, 11 preferring a family member (34%), and 7 (21%) with no preference (P = .21).
Subjects were asked about concerns regarding FMT, and asked to rate each on a 5-point Likert scale (1 = not at all concerning; 5 = overwhelming concern). Concerns regarding risk of infection and effectiveness received an average score of 2.74 and 2.72, respectively, whereas concern regarding the aesthetics, or "yuck factor" was slightly lower (2.1: P = NS for all comparisons). Subjects also were asked to rate the likelihood of undergoing FMT, if it were available, for their current episode of CDI, a subsequent episode of CDI, or if their physician recommended undergoing FMT (10 point scale: 1 = not at all likely; 10 = certainly agree to FMT). The mean scores (SD) for agreeing to FMT for the current or a subsequent episode were 4.8 (SD 2.7) and 5.6 (SD 3.0); P = .12, but increased to 7.1 (SD 3.23) if FMT were recommended by their physician (P < .001 for FMT if physician recommended vs FMT for current episode; P = .001 for FMT if physician recommended vs FMT for a subsequent episode). Finally, subjects were asked about the likelihood of enrolling in a study comparing FMT to standard antimicrobial treatment, with answers ranging from 1 (almost certainly would not enroll) to 5 (almost certainly would enroll). Among the 32 respondents to this question, 17 (53%) answered either "probably would enroll" or "almost certainly would enroll," with a mean score of 3.2.
Discussion
Overall, VA patients with a current episode of CDI were not aware of FMT, with just 15% knowing about the procedure. However, after learning about FMT, patients expressed clear opinions regarding the route and setting of FMT administration, with enema or colonoscopy being the preferred routes, and a hospital the preferred setting. In contrast, subjects expressed ambivalence with regard to the source of donor stool, with no clear preference for stool from an anonymous donor vs from a family member.
When asked about concerns regarding FMT, none of the presented options (risk of infection, uncertain effectiveness, or procedural aesthetics) emerged as significantly more important than did others, although the oft-cited concern regarding FMT aesthetics engendered the lowest overall level of concern. In terms of FMT acceptance, 4 subjects (12%) were opposed to the procedure, indicating that they were not at all likely to agree to FMT for all scenarios (defined as a score of 1 or 2 on the 10-point Likert scale) or by terminating the survey because of the questions. However, 15 (44%) indicated that they would certainly agree to FMT (defined as a score of 9 or 10 on the 10-point Likert scale) if their physician recommended it. Physician recommendation for FMT resulted in the highest overall likelihood of agreeing to FMT, a finding in agreement with a previous survey of FMT for CDI.10 Most subjects indicated likely enrollment in a potential study comparing FMT with standard antimicrobial therapy.
Strengths/Limitations
Study strengths included surveying patients with current CDI, such that patients had personal experience with the disease in question. Use of in-person interviews also resulted in a robust response rate of 81% and allowed subjects to clarify any unclear questions with study personnel. Weaknesses included a relatively small sample size, underrepresentation of women, and lack of detail regarding respondent characteristics. Additionally, capsule delivery of FMT was not assessed since this method of delivery had not been published at the time of survey administration.
Conclusion
This survey of VA patients with CDI suggests that aesthetic concerns are not a critical deterrent for this population, and interest in FMT for the treatment of recurrent CDI exists. Physician recommendation to undergo FMT seems to be the most influential factor affecting the likelihood of agreeing to undergo FMT. These results support the feasibility of conducting clinical trials of FMT in the VA system.
1. Miller BA, Chen LF, Sexton DJ, Anderson DJ. Comparison of the burdens of hospital-onset, healthcare facility-associated Clostridium difficile Infection and of healthcare-associated infection due to methicillin-resistant Staphylococcus aureus in community hospitals. Infect Control Hosp Epidemiol. 2011;32(4):387-390.
2. Centers for Disease Control and Prevention. Severe Clostridium difficile-associated disease in populations previously at low risk--four states, 2005. MMWR Morb Mortal Wkly Rep. 2005;54(47):1201-1205.
3. Johnson S, Louie TJ, Gerding DN, et al; Polymer Alternative for CDI Treatment (PACT) investigators. Vancomycin, metronidazole, or tolevamer for Clostridium difficile infection: results from two multinational, randomized, controlled trials. Clin Infect Dis. 2014;59(3):345-354.
4. Louie TJ, Miller MA, Mullane KM, et al; OPT-80-003 Clinical Study Group. Fidaxomicin versus vancomycin for Clostridium difficile infection. N Engl J Med. 2011;364(5):422-431.
5. Centers for Disease Control and Prevention. Antibiotic resistance threats in the United States, 2013. http://www.cdc.gov/drugresistance/threat-report-2013. Updated July 17, 2014. Accessed November 16.2016.
6. Cohen SH, Gerding DN, Johnson S, et al; Society for Healthcare Epidemiology of America; Infectious Diseases Society of America. Clinical practice guidelines for Clostridium difficile infection in adults: 2010 update by the society for healthcare epidemiology of America (SHEA) and the Infectious Diseases Society of America (IDSA). Infect Control Hosp Epidemiol. 2010;31(5):431-455.
7. Cornely OA, Crook DW, Esposito R, et al; OPT-80-004 Clinical Study Group. Fidaxomicin versus vancomycin for infection with Clostridium difficile in Europe, Canada, and the USA: a double-blind, non-inferiority, randomised controlled trial. Lancet Infect Dis. 2012;12(4):281-289.
8. Johnson S. Recurrent Clostridium difficile infection: a review of risk factors, treatments, and outcomes. J Infect. 2009;58(6):403-410.
9. Drekonja DM, Reich J, Gezahegn S, et al. Fecal microbiota transplantation for Clostridium difficile infection--a systematic review. Ann Intern Med. 2015;162(9):630-638.
10. Zipursky JS, Sidorsky TI, Freedman CA, Sidorsky MN, Kirkland KB. Patient attitudes toward the use of fecal microbiota transplantation in the treatment of recurrent Clostridium difficile infection. Clin Infect Dis. 2012;55(12):1652-1658.
‘Shared Learning’ Supports Pharmacist Program
Primary care physicians (PCPs) often don’t have the time to manage the complex medication needs of patients with chronic conditions. PCPs working in federally qualified health centers (FQHCs) while caring for low-income at-risk patients also face “particularly large barriers,” according to the Agency for Health Care Research and Quality (AHRQ). But that lack of time can contribute to low patient adherence to medication regimens.
While clinical pharmacists can help, they may not be available to FQHCs, PCP offices, and other primary care settings. To address this, innovators in Ohio established a statewide consortium or “shared learning community” that provides the resources for FQHCs to offer pharmacist-led medication therapy management (MTM) services to patients with diabetes or hypertension. The collaborating organizations include the Ohio Association for Community Health Centers, the Health Services Advisory Group, and 6 Ohio-based colleges of pharmacy.
Related: Best Practices: Utilization of Oncology Pharmacists in the VA
The program developers, Jennifer Rodis, PharmD, BCPS, FAPhA, Assistant Dean for Outreach and Engagement at Ohio State University College of Pharmacy, and Barbara Pryor, MS, RD, LD, manager, Chronic Disease Section, Ohio Department of Health, reported on the consortium’s program and successes in AHRQ’s Health Care Innovations Exchange.
Program leaders meet with participating pharmacists to orient them; those pharmacists then introduce the program to clinicians and staff at their respective practice sites. Every month, the participating pharmacists check in with program leaders from the Ohio Department of Health, the Ohio State University College of Pharmacy, and Ohio Association of Community Health Centers to give status updates and get guidance and troubleshooting advice.
Related: VA Treats Patients’ Impatience With Clinical Pharmacists
The consortium has markedly increased the number of FQHCs offering pharmacist-led MTM services, as well as boosting awareness and interest in MTM. When the program began in 2013, very few of the 41 FQCHs in Ohio had pharmacist-led MTM programs, the AHRQ report says. Nine FQHCs now participate in the consortium.
During the first year, the 3 participating sites enrolled nearly 400 eligible patients with out-of-control hypertension or diabetes. By the end of that year, 68% of hypertensive patients had controlled their blood pressure and 45% of patients with diabetes were controlling their hemoglobin A1c. What’s more, the pharmacists providing MTM addressed 75 adverse drug events and remedied 145 potential events.
Keeping Watch for Sepsis
Sepsis begins outside the hospital for 80% of patients, according to a recent CDC evaluation, reported in Vital Signs. CDC researchers who reviewed medical records of 246 adults and 79 children at 4 New York hospitals in Albany and Rochester found that 7 in 10 patients with sepsis had recently used health care services or had chronic diseases requiring frequent medical care.
Related: The Role of Procalcitonin in the Management of Infectious Diseases
Sepsis is most common in adults aged ≥ 65 years, infants < 1 year, people with weakened immune systems, or people with chronic conditions, such as diabetes. Nearly all the adults (97%) had at least 1 comorbidity, and 70% of children who developed sepsis had a health condition that may have put them at risk.
Although multiple infections and organisms were implicated, Staphylococcus aureus, Escherichia coli, and some types of Streptococcus were identified most often. Among adults with sepsis, 35% had a lung infection, 25% had a urinary tract infection, 11% had a gastrointestinal infection, and 11% had a skin infection.
Related: Mass Transit for Viruses
Most of the patients had recent interactions with the health care system before admission with sepsis, which likely reflects their vulnerability to infection, the researchers say, “it also suggests that health care facilities and providers could play a central role in sepsis prevention.” The CDC report advises the following for health care providers:
- Follow infection control requirements;
- Ensure that patients receive recommended vaccines (such as flu and pneumococcal);
- Educate patients and families, stressing the need to seek care if they see signs of severe infection or sepsis;
- “Think sepsis”—know the signs and symptoms and treat them early;
- Act fast—order tests to identify infection, start antibiotics and other care immediately; document dose, duration, and purpose; and
- Check patient progress frequently; reassess antibiotic therapy at 24 to 48 hours or sooner to change therapy if needed
BEST PRACTICES: Multiplex Technology Delivers a Novel Tool to Assist in Ruling Out Systemic Lupus Erythematosus

Ellen Field, MD
Private Practice, Rheumatology
Lehigh Valley, Pennsylvania
Staff, Lehigh Valley Hospital
St. Luke’s Hospital
Sacred Heart Hospital
Lehigh Valley, Pennsylvania
Clinical Assistant Adjunct Professor of Medicine
Temple University School of Medicine
Philadelphia, Pennsylvania
Q&A with
| Peter Rumore, MD Rheumatology Associates of Long Island Smithtown, New York | Alan Kivitz, MD Altoona Arthritis and Osteoporosis Center Duncansville, Pennsylvania |
Click here to read this Best Practices supplement
Is It All in the Eye of the Beholder? Comparing Pulmonologists’ and Radiologists’ Performance
Lung cancer remains a leading cause of cancer-related deaths, and screening with low-dose computed tomography (LDCT) has the potential to decrease the mortality rate of patients by 20%.1 Most major cancer societies have issued lung cancer screening recommendations. For example, the National Comprehensive Cancer Network recommends annual LDCT scans for high-risk patients (those at moderate or low risk need not be screened). High-risk patients are aged between 55 and 74 years (the U.S. Preventive Services Task Force upper age limit is 80 years) and have a smoking history of ≥ 30 pack-years, or if no longer smoking, a quit date within the past 15 years. Although length of screening needed is unclear, it is advised that patients have annual LDCT scans until they have been smoke free for 15 years, develop limited life expectancy, or are no longer eligible for definitive treatment for lung cancer. A strong antismoking commitment and a multidisciplinary approach are of paramount importance.2,3
Fleischner Society criteria are the most established guidelines for risk-stratifying pulmonary nodules (Table 1). Nodules are stratified by size and change in size over a 2-year period. There is interest in evaluating change in volume as well, but techniques are still emerging and have not been universally adopted.4,5 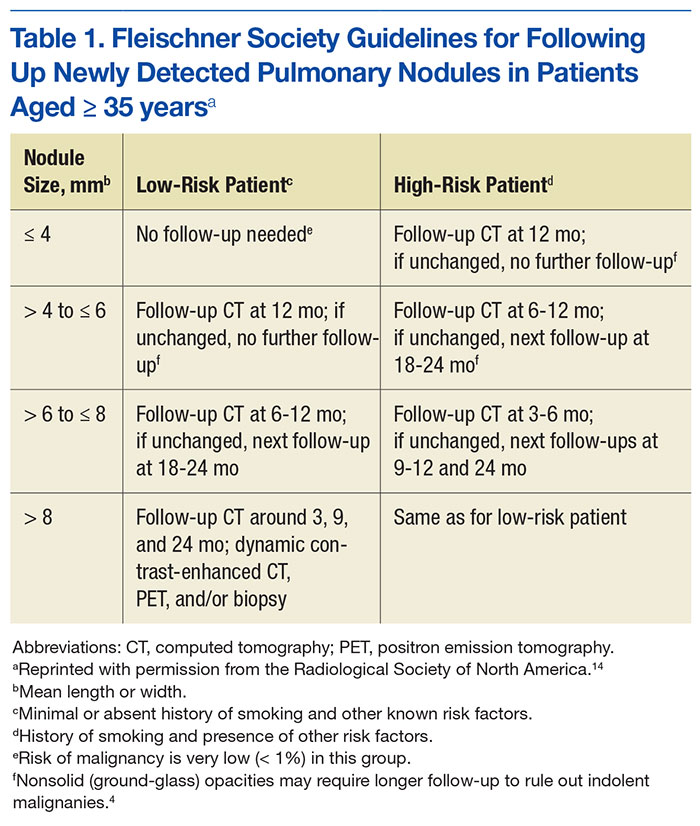
Lung nodule screening likely will require significant involvement of radiologists and pulmonologists in the workup of patients with positive screens. Radiologists have demonstrated a fair amount of interobserver agreement with respect to diagnosis, but there are no data comparing pulmonologists with other pulmonologists or with radiologists.6-8 In addition, although health care professionals have access to validated models for predicting risk of malignancy, there is evidence they do not use them.9,10 This study was conducted to determine whether pulmonologists and radiologists experienced in thoracic abnormalities are consistent in accurately diagnosing malignant lung nodules and masses noted on CT scans.
Methods
After obtaining institutional review board approval for this study, the authors evaluated all the lung nodule or lung mass referrals that had been made to the University of Arkansas for Medical Sciences (UAMS) and Central Arkansas Veterans Healthcare System (CAVHS) interventional pulmonary clinics between March 2009 and March 2013. Of the 1,512 referrals made, 250 were randomly se
In each case, a pulmonologist and a radiologist reviewed the patient’s CT images from the first visit. Reviewers were asked to determine and document the single most likely diagnosis. Diagnoses were grouped into primary lung cancer, metastatic disease, lymphoma, infectious/inflammatory etiology, benign neoplasm, and other (eg, sarcoma). A lesion with a diagnostic biopsy and stability at 2 years was deemed benign. A lesion that was culture-positive or responded rapidly to antibacterial or antifungal therapy was deemed infectious/inflammatory. Lesions were grouped by size: group 1 (≤ 10 mm), group 2 (11-30 mm), group 3 (31-50 mm), group 4 (≥ 51 mm).
Statistical Analyses
Student t tests were used to compare means. Concordance of the pulmonary reviewers and FD was assessed with the κ coefficient. The concordance was also evaluated between the radiology reviewers and FD. These statistical analyses were performed with SAS Version 9.4 (SAS Institute). P values were interpreted using the sliding-scale approach of Mendenhall and colleagues: P < .01 (highly significant); .01 < P < .05 (statistically significant); .05 < P < .10 (trending toward significance); P > .10 (not significant).11
Results
Of the 250 patients selected for the study, 111 had the pertinent data available, along with a follow-up appointment > 2 years afterward at the center. The patients included 40 women and 71 men; 79 white patients, 29 black patients, and 3 patients of other races. Mean age was 58 years (range, 21-93 years).
Risk factors for malignancy were older age, larger lesion, and history of smoking. The malignancy rates for women and men were almost identical (53% and 54%, respectively), and the difference was not statistically significant (P = .40).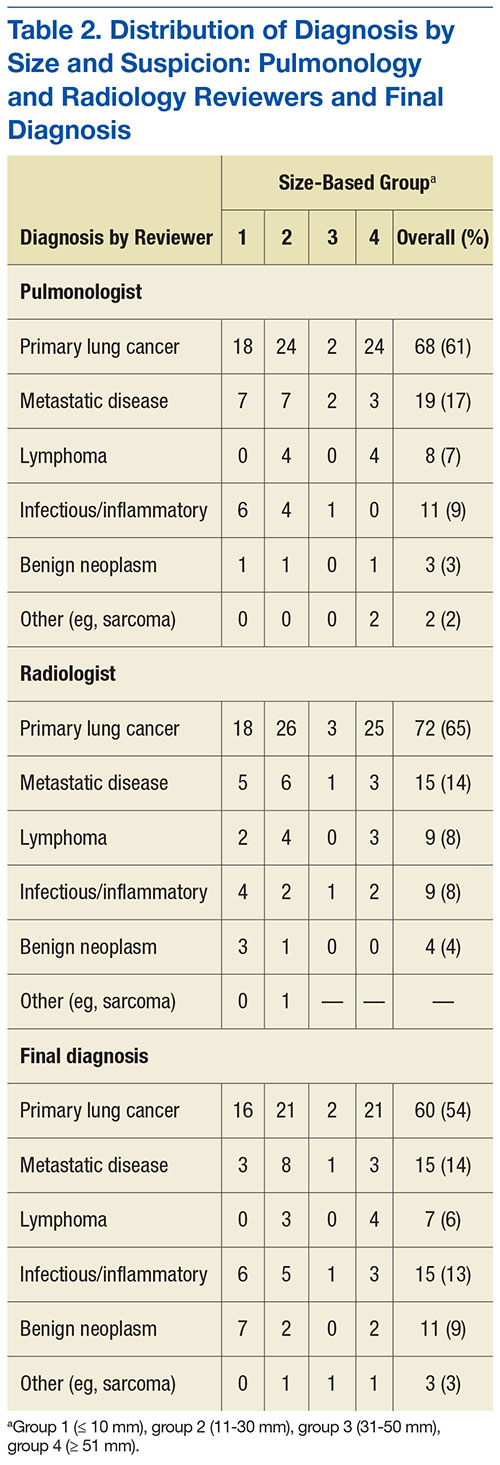
Diagnosis
Table 2 outlines the distribution of the reviewers’ diagnoses and the distribution of FD. Primary lung cancer was the dominant suspected diagnosis and accounted for 61%, 65%, and 54% of the cases reviewed by the pulmonologist, the radiologist, and FD, respectively. Metastatic disease was a distant second dominant diagnosis (17%, 15%, and 15%, respectively). There was no statistical difference between the reviews of the pulmonologist and radiologist, and the FD (P > .05).
Table 3 lists the κ results for the strength of agreement between pulmonologist and radiologist. Agreement for primary lung cancer was very good: 0.94 (95% confidence interval [CI], 0.89-0.99). With respect to group 1, agreement was perfect: 1.0 (95% CI, 1.000-1.000). Benign neoplasm had the weakest agreement. There was no statistical difference between pulmonologist and radiologist determinations across size-based groups.Agreement between pulmonologist and FD was almost perfect. The major discrepancy between the sets of reviewers remained benign neoplasm and infectious/inflammatory etiology.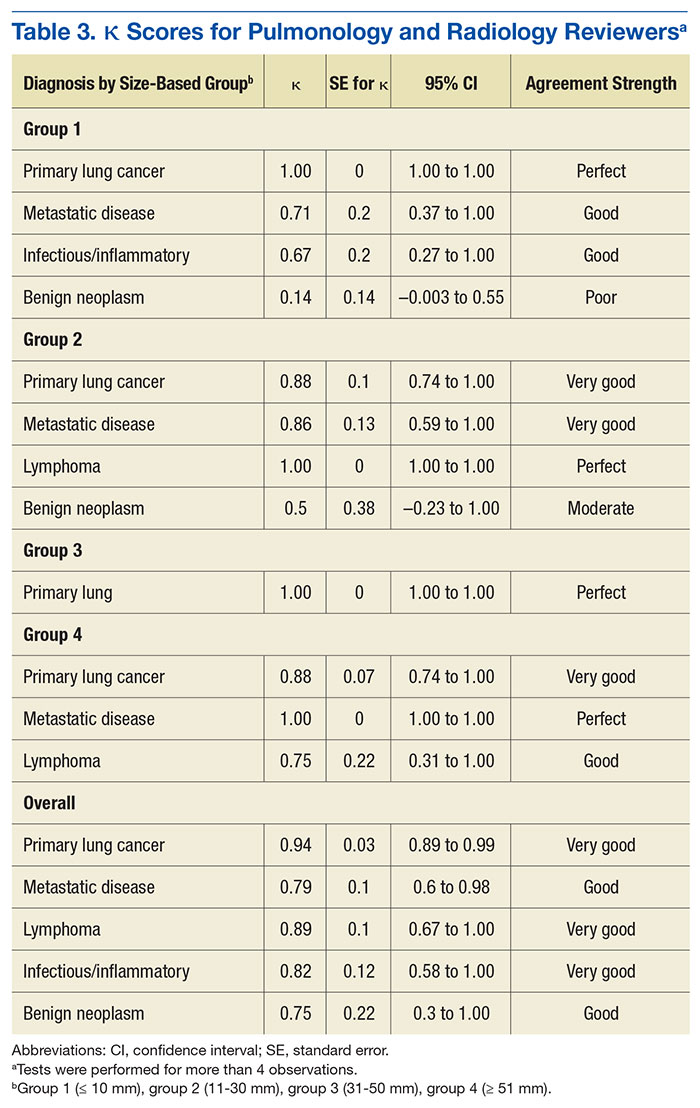
Of the 111 study patients, 68 (61%) and 72 (65%) were suspected of having primary lung cancer by pulmonologist and radiologist, respectively. However, only 60 (54%) actually had primary lung cancer; the differences were not statistically significant (P = .27 and .1, respectively). No cases were reclassified as primary lung cancer on final pathology.
Infectious/inflammatory etiologies did not always have positive cultures. Those with positive cultures included Streptococcus (S) viridans, Rhodococcus equi, Blastomyces dermatitidis, S constellatus, S anginosus, S intermedius, and Histoplasma capsulatum. Benign neoplasms included radiation injuries, benign fibrous tumor of the pleura, and hamartoma.
Pulmonologists and radiologists had identical high sensitivities for primary lung cancer: 1.0 (95% CI, 0.94-1.00). Specificities were 0.84 (95% CI, 0.77-0.84) for pulmonologists and 0.77(95% CI, 0.69-0.77) for radiologists, and the difference was not statistically significant (P = .28) (Table 4).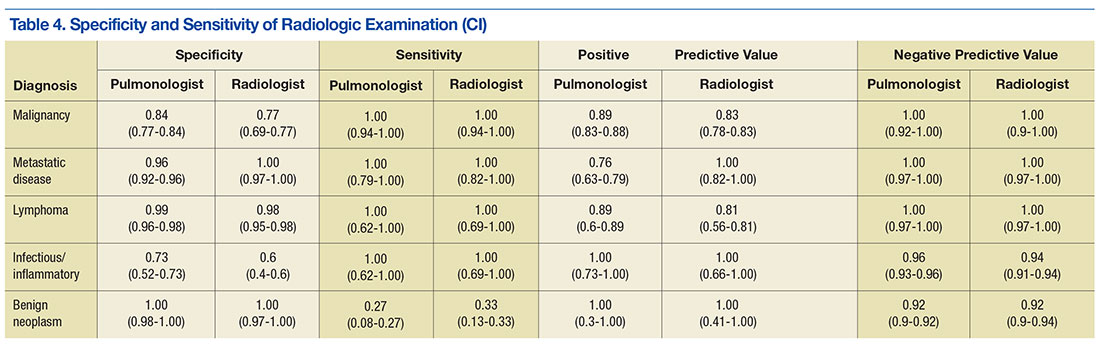
Discussion
Computed tomography scans are performed to evaluate a variety of diseases. An estimated 7 million CT scans are performed in the U.S. annually.6,12 As the National Lung Screening Trial recommendations are followed more routinely, almost 9 million people
Radiologists would understandably read most of these patients’ scans. However, patients referred to tertiary-care centers usually bring CT images with them; even scans performed at UAMS and CAVHS centers may not be read by a radiologist in time for an appointment. The result is that the clinic pulmonologist often must base decisions on a CT reading, but without the assistance of high-fidelity computer programs or a high-definition scan.5 These limitations indicate why it is important to know whether assessment by a pulmonologist compares favorably with assessment by a radiologist and with the eventual diagnosis.
The malignancy rate in the referred population is not insignificant. Halbert and colleagues found a 25% malignancy rate in their study,12 and the present study had an overall malignancy rate of 54%. The difference may be attributed to the possibility that the patients may have been prescreened prior to referral.
The reviewers overestimated the presence of malignant disease, though not to a level of statistical significance. About 88% of cases evaluated by a pulmonologist and 83% of cases evaluated by a radiologist were confirmed to be malignant. The reviewers’ sensitivity was perfect for all diagnoses except benign neoplasms, likely because these cases were classified malignant, thus increasing sensitivity but decreasing specificity.
This dynamic is important to understand, as it allows for a very high negative predictive value, which has real implications for resource management at VA hospitals, including CAVHS facility, where almost every CT scan with an abnormality is referred for pulmonologist consultation. In these cases, the radiologist not only lists the likely suspicion but includes a recommendation for follow-up or further workup based on Fleischner Society guidelines.4,14 The patient should be informed of findings as soon as the radiologist reads the CT scan, and a plan should be made on the basis of the recommendation. The patient should not have to unnecessarily wait—a potential source of anxiety—to see another specialist who would probably make the same recommendation.
Applying this study’s findings could improve workflow and the timing of CT scans. A patient should not be referred to a pulmonologist unless specifically recommended by a radiologist, thus decreasing the scheduling burden on the specialty clinic and allowing for appropriate patients to be scheduled at reasonable intervals. In addition, having only 1 person in charge of ordering CT scans could reduce the chance of duplicating orders and performing CT scans at inappropriate times.
Most important, these results should lead to more detailed physician–patient discussions about radiologic findings, hopefully alleviating any patient anxiety. A patient who still wants to see a specialist may, but with less stress that can accompany being told that there is “something abnormal” on the imaging and that the patient needs to see a lung doctor.
Limitations
This study had a few weaknesses. It was a small trial, and its data were collected retrospectively. In addition, generalizing its results may be difficult, as its reviewers had less than 5 years of training, and reviewers with more experience likely would be more accurate and have a higher rate of agreement.
Results could have been skewed by the study’s unusually large number of patients with malignant disease. Had the study been conducted with a larger population (patients at primary care offices), accuracy and agreement might have been lower.
Conclusion
This study answered its 2 questions. Although it is universally accepted that pulmonologists can review patients’ scans, to the authors’ knowledge this is the first study that asked, “Are pulmonologists as good as radiologists in reading CT scans?” The answer is yes. Also asked was, “Do pulmonologists’ and radiologists’ diagnoses predict the final path?” The reviewers’ were very accurate except in the case of benign neoplasms.
Experienced pulmonologists and radiologists are consistent in accurately diagnosing malignant lung nodules and lung masses noted on CT scans.
1. National Lung Screening Trial Research Team, Aberle DR, Adams AM, Berg CD, et al. Reduced lung-cancer mortality with low-dose computed tomographic screening. N Engl J Med. 2011;365(5):395-409.
2. Wood DE. National Comprehensive Cancer Network (NCCN) Clinical Practice Guidelines for Lung Cancer Screening. Thorac Surg Clin. 2015;25(2):185-197.
3. Humphrey LL, Deffebach M, Pappas M, et al. Screening for lung cancer with low-dose computed tomography: a systematic review to update the US Preventive Services task force recommendation. Ann Intern Med. 2013;159(6):411-420.
4. Naidich DP, Bankier AA, MacMahon H, et al. Recommendations for the management of subsolid pulmonary nodules detected at CT: a statement from the Fleischner Society. Radiology. 2013;266(1):304-317.
5. Mehta HJ, Ravenel JG, Shaftman SR, et al. The utility of nodule volume in the context of malignancy prediction for small pulmonary nodules. Chest. 2014;145(3):464-472.
6. Gierada DS, Pilgram TK, Ford M, et al. Lung cancer: interobserver agreement on interpretation of pulmonary findings at low-dose CT screening. Radiology. 2008;246(1):265-272.
7. McCarville MB, Lederman HM, Santana VM, et al. Distinguishing benign from malignant pulmonary nodules with helical chest CT in children with malignant solid tumors. Radiology. 2006;239(2):514-520.
8. Bogot NR, Kazerooni EA, Kelly AM, Quint LE, Desjardins B, Nan B. Interobserver and intraobserver variability in the assessment of pulmonary nodule size on CT using film and computer display methods. Acad Radiol. 2005;12(8):948-956.
9. Schultz EM, Sanders GD, Trotter PR, et al. Validation of two models to estimate the probability of malignancy in patients with solitary pulmonary nodules. Thorax. 2008;63(4):335-341.
10. Tanner NT, Aggarwal J, Gould MK, et al. Management of pulmonary nodules by community pulmonologists: a multicenter observational study. Chest. 2015;148(6):1405-1414.
11. Mendenhall W, Beaver RJ, Beaver BM. Introduction to Probability and Statistics. 13th ed. Belmont, CA: Brooks/Cole, Cengage Learning; 2009.
12. Halbert CL, Madtes DK, Vaughan AE, et al. Expression of human alpha1-antitrypsin in mice and dogs following AAV6 vector-mediated gene transfer to the lungs. Mol Ther. 2010;18(6):1165-1172.
13. Ma J, Ward EM, Smith R, Jemal A. Annual number of lung cancer deaths potentially avertable by screening in the United States. Cancer. 2013;119(7):1381-1385.
14. MacMahon H, Austin JH, Gamsu G, et al; Fleischner Society. Guidelines for management of small pulmonary nodules detected on CT scans: a statement from the Fleischner Society. Radiology. 2005;237(2):395-400.
Lung cancer remains a leading cause of cancer-related deaths, and screening with low-dose computed tomography (LDCT) has the potential to decrease the mortality rate of patients by 20%.1 Most major cancer societies have issued lung cancer screening recommendations. For example, the National Comprehensive Cancer Network recommends annual LDCT scans for high-risk patients (those at moderate or low risk need not be screened). High-risk patients are aged between 55 and 74 years (the U.S. Preventive Services Task Force upper age limit is 80 years) and have a smoking history of ≥ 30 pack-years, or if no longer smoking, a quit date within the past 15 years. Although length of screening needed is unclear, it is advised that patients have annual LDCT scans until they have been smoke free for 15 years, develop limited life expectancy, or are no longer eligible for definitive treatment for lung cancer. A strong antismoking commitment and a multidisciplinary approach are of paramount importance.2,3
Fleischner Society criteria are the most established guidelines for risk-stratifying pulmonary nodules (Table 1). Nodules are stratified by size and change in size over a 2-year period. There is interest in evaluating change in volume as well, but techniques are still emerging and have not been universally adopted.4,5
Lung nodule screening likely will require significant involvement of radiologists and pulmonologists in the workup of patients with positive screens. Radiologists have demonstrated a fair amount of interobserver agreement with respect to diagnosis, but there are no data comparing pulmonologists with other pulmonologists or with radiologists.6-8 In addition, although health care professionals have access to validated models for predicting risk of malignancy, there is evidence they do not use them.9,10 This study was conducted to determine whether pulmonologists and radiologists experienced in thoracic abnormalities are consistent in accurately diagnosing malignant lung nodules and masses noted on CT scans.
Methods
After obtaining institutional review board approval for this study, the authors evaluated all the lung nodule or lung mass referrals that had been made to the University of Arkansas for Medical Sciences (UAMS) and Central Arkansas Veterans Healthcare System (CAVHS) interventional pulmonary clinics between March 2009 and March 2013. Of the 1,512 referrals made, 250 were randomly se
In each case, a pulmonologist and a radiologist reviewed the patient’s CT images from the first visit. Reviewers were asked to determine and document the single most likely diagnosis. Diagnoses were grouped into primary lung cancer, metastatic disease, lymphoma, infectious/inflammatory etiology, benign neoplasm, and other (eg, sarcoma). A lesion with a diagnostic biopsy and stability at 2 years was deemed benign. A lesion that was culture-positive or responded rapidly to antibacterial or antifungal therapy was deemed infectious/inflammatory. Lesions were grouped by size: group 1 (≤ 10 mm), group 2 (11-30 mm), group 3 (31-50 mm), group 4 (≥ 51 mm).
Statistical Analyses
Student t tests were used to compare means. Concordance of the pulmonary reviewers and FD was assessed with the κ coefficient. The concordance was also evaluated between the radiology reviewers and FD. These statistical analyses were performed with SAS Version 9.4 (SAS Institute). P values were interpreted using the sliding-scale approach of Mendenhall and colleagues: P < .01 (highly significant); .01 < P < .05 (statistically significant); .05 < P < .10 (trending toward significance); P > .10 (not significant).11
Results
Of the 250 patients selected for the study, 111 had the pertinent data available, along with a follow-up appointment > 2 years afterward at the center. The patients included 40 women and 71 men; 79 white patients, 29 black patients, and 3 patients of other races. Mean age was 58 years (range, 21-93 years).
Risk factors for malignancy were older age, larger lesion, and history of smoking. The malignancy rates for women and men were almost identical (53% and 54%, respectively), and the difference was not statistically significant (P = .40).
Diagnosis
Table 2 outlines the distribution of the reviewers’ diagnoses and the distribution of FD. Primary lung cancer was the dominant suspected diagnosis and accounted for 61%, 65%, and 54% of the cases reviewed by the pulmonologist, the radiologist, and FD, respectively. Metastatic disease was a distant second dominant diagnosis (17%, 15%, and 15%, respectively). There was no statistical difference between the reviews of the pulmonologist and radiologist, and the FD (P > .05).
Table 3 lists the κ results for the strength of agreement between pulmonologist and radiologist. Agreement for primary lung cancer was very good: 0.94 (95% confidence interval [CI], 0.89-0.99). With respect to group 1, agreement was perfect: 1.0 (95% CI, 1.000-1.000). Benign neoplasm had the weakest agreement. There was no statistical difference between pulmonologist and radiologist determinations across size-based groups.Agreement between pulmonologist and FD was almost perfect. The major discrepancy between the sets of reviewers remained benign neoplasm and infectious/inflammatory etiology.
Of the 111 study patients, 68 (61%) and 72 (65%) were suspected of having primary lung cancer by pulmonologist and radiologist, respectively. However, only 60 (54%) actually had primary lung cancer; the differences were not statistically significant (P = .27 and .1, respectively). No cases were reclassified as primary lung cancer on final pathology.
Infectious/inflammatory etiologies did not always have positive cultures. Those with positive cultures included Streptococcus (S) viridans, Rhodococcus equi, Blastomyces dermatitidis, S constellatus, S anginosus, S intermedius, and Histoplasma capsulatum. Benign neoplasms included radiation injuries, benign fibrous tumor of the pleura, and hamartoma.
Pulmonologists and radiologists had identical high sensitivities for primary lung cancer: 1.0 (95% CI, 0.94-1.00). Specificities were 0.84 (95% CI, 0.77-0.84) for pulmonologists and 0.77(95% CI, 0.69-0.77) for radiologists, and the difference was not statistically significant (P = .28) (Table 4).
Discussion
Computed tomography scans are performed to evaluate a variety of diseases. An estimated 7 million CT scans are performed in the U.S. annually.6,12 As the National Lung Screening Trial recommendations are followed more routinely, almost 9 million people
Radiologists would understandably read most of these patients’ scans. However, patients referred to tertiary-care centers usually bring CT images with them; even scans performed at UAMS and CAVHS centers may not be read by a radiologist in time for an appointment. The result is that the clinic pulmonologist often must base decisions on a CT reading, but without the assistance of high-fidelity computer programs or a high-definition scan.5 These limitations indicate why it is important to know whether assessment by a pulmonologist compares favorably with assessment by a radiologist and with the eventual diagnosis.
The malignancy rate in the referred population is not insignificant. Halbert and colleagues found a 25% malignancy rate in their study,12 and the present study had an overall malignancy rate of 54%. The difference may be attributed to the possibility that the patients may have been prescreened prior to referral.
The reviewers overestimated the presence of malignant disease, though not to a level of statistical significance. About 88% of cases evaluated by a pulmonologist and 83% of cases evaluated by a radiologist were confirmed to be malignant. The reviewers’ sensitivity was perfect for all diagnoses except benign neoplasms, likely because these cases were classified malignant, thus increasing sensitivity but decreasing specificity.
This dynamic is important to understand, as it allows for a very high negative predictive value, which has real implications for resource management at VA hospitals, including CAVHS facility, where almost every CT scan with an abnormality is referred for pulmonologist consultation. In these cases, the radiologist not only lists the likely suspicion but includes a recommendation for follow-up or further workup based on Fleischner Society guidelines.4,14 The patient should be informed of findings as soon as the radiologist reads the CT scan, and a plan should be made on the basis of the recommendation. The patient should not have to unnecessarily wait—a potential source of anxiety—to see another specialist who would probably make the same recommendation.
Applying this study’s findings could improve workflow and the timing of CT scans. A patient should not be referred to a pulmonologist unless specifically recommended by a radiologist, thus decreasing the scheduling burden on the specialty clinic and allowing for appropriate patients to be scheduled at reasonable intervals. In addition, having only 1 person in charge of ordering CT scans could reduce the chance of duplicating orders and performing CT scans at inappropriate times.
Most important, these results should lead to more detailed physician–patient discussions about radiologic findings, hopefully alleviating any patient anxiety. A patient who still wants to see a specialist may, but with less stress that can accompany being told that there is “something abnormal” on the imaging and that the patient needs to see a lung doctor.
Limitations
This study had a few weaknesses. It was a small trial, and its data were collected retrospectively. In addition, generalizing its results may be difficult, as its reviewers had less than 5 years of training, and reviewers with more experience likely would be more accurate and have a higher rate of agreement.
Results could have been skewed by the study’s unusually large number of patients with malignant disease. Had the study been conducted with a larger population (patients at primary care offices), accuracy and agreement might have been lower.
Conclusion
This study answered its 2 questions. Although it is universally accepted that pulmonologists can review patients’ scans, to the authors’ knowledge this is the first study that asked, “Are pulmonologists as good as radiologists in reading CT scans?” The answer is yes. Also asked was, “Do pulmonologists’ and radiologists’ diagnoses predict the final path?” The reviewers’ were very accurate except in the case of benign neoplasms.
Experienced pulmonologists and radiologists are consistent in accurately diagnosing malignant lung nodules and lung masses noted on CT scans.
1. National Lung Screening Trial Research Team, Aberle DR, Adams AM, Berg CD, et al. Reduced lung-cancer mortality with low-dose computed tomographic screening. N Engl J Med. 2011;365(5):395-409.
2. Wood DE. National Comprehensive Cancer Network (NCCN) Clinical Practice Guidelines for Lung Cancer Screening. Thorac Surg Clin. 2015;25(2):185-197.
3. Humphrey LL, Deffebach M, Pappas M, et al. Screening for lung cancer with low-dose computed tomography: a systematic review to update the US Preventive Services task force recommendation. Ann Intern Med. 2013;159(6):411-420.
4. Naidich DP, Bankier AA, MacMahon H, et al. Recommendations for the management of subsolid pulmonary nodules detected at CT: a statement from the Fleischner Society. Radiology. 2013;266(1):304-317.
5. Mehta HJ, Ravenel JG, Shaftman SR, et al. The utility of nodule volume in the context of malignancy prediction for small pulmonary nodules. Chest. 2014;145(3):464-472.
6. Gierada DS, Pilgram TK, Ford M, et al. Lung cancer: interobserver agreement on interpretation of pulmonary findings at low-dose CT screening. Radiology. 2008;246(1):265-272.
7. McCarville MB, Lederman HM, Santana VM, et al. Distinguishing benign from malignant pulmonary nodules with helical chest CT in children with malignant solid tumors. Radiology. 2006;239(2):514-520.
8. Bogot NR, Kazerooni EA, Kelly AM, Quint LE, Desjardins B, Nan B. Interobserver and intraobserver variability in the assessment of pulmonary nodule size on CT using film and computer display methods. Acad Radiol. 2005;12(8):948-956.
9. Schultz EM, Sanders GD, Trotter PR, et al. Validation of two models to estimate the probability of malignancy in patients with solitary pulmonary nodules. Thorax. 2008;63(4):335-341.
10. Tanner NT, Aggarwal J, Gould MK, et al. Management of pulmonary nodules by community pulmonologists: a multicenter observational study. Chest. 2015;148(6):1405-1414.
11. Mendenhall W, Beaver RJ, Beaver BM. Introduction to Probability and Statistics. 13th ed. Belmont, CA: Brooks/Cole, Cengage Learning; 2009.
12. Halbert CL, Madtes DK, Vaughan AE, et al. Expression of human alpha1-antitrypsin in mice and dogs following AAV6 vector-mediated gene transfer to the lungs. Mol Ther. 2010;18(6):1165-1172.
13. Ma J, Ward EM, Smith R, Jemal A. Annual number of lung cancer deaths potentially avertable by screening in the United States. Cancer. 2013;119(7):1381-1385.
14. MacMahon H, Austin JH, Gamsu G, et al; Fleischner Society. Guidelines for management of small pulmonary nodules detected on CT scans: a statement from the Fleischner Society. Radiology. 2005;237(2):395-400.
VA Touts Telehealth Success Before House Panel
In fiscal year (FY) 2015, VA conducted 2.14 million telehealth visits, reaching more than 677,000 veterans. Telehealth “remains a critical strategy in ensuring veterans can access health care when and where they need it,” Kevin Galpin, MD, acting executive director for telehealth at the VHA told the House Committee on Veterans Affairs earlier this month. “With the support of Congress, we have an opportunity to shape the future and ensure that VA is leveraging cutting-edge technology to provide convenient, accessible, high-quality care to all veterans.”
Related: Madhulika Agarwal on Telehealth at the VHA
Telemental health, in particular, also has seen significant growth. From 2002 through July 2, 2016, Galpin reported, more than 2 million telemental health visits have been provided to more than 389,400 unique veterans. And use of telehealth in the Greater Los Angeles Health Care System alone increased by 61,500, including more than 20,000 telehealth visits, which reached more than 6,000 veterans in southern California.
“For the past 10 years, I have studied many telehealth models and have been most impressed by the VA model as both exemplary and successful,” Herb Rogove, DO, FCCM, FACP, president and chief executive officer, C30 Telemedicine and former board member of the American Telemedicine Association, reported in a statement to the committee.
Related: Telejustice: Reaching Incarcerated Veterans via Telehealth
The VA is testing a new system that will allow veterans to access telehealth from their personal mobile device, smartphone, tablet, or computer. The VA Video Connect (VVC) is currently undergoing field testing for real-time access to VA care and will be fully encrypted to protect patient information. It will complement the VA’s current offerings of home telehealth, using VA-provided devices and store-and-forward telehealth, which allows users to asynchronously acquire and store clinical information (such as data, images, sound, and video) that then can be examined by a provider at another location for clinical evaluation.
Related: Patients Benefit From ICU Telemedicine
Other important telehealth developments include:
- In FY 2015, more than 57,000 rehabilitation encounters for more than 33,000 unique veterans occurred using home telehealth.
- Store-and-forward telehealth has been particularly successful for dermatologic and retinal diagnosis and triage.
- The National Telemental Health Centers have provided access and consults to more than 4,600 veterans at more than 120 sites.
- The Tele-Intensive Care program links VA intensive care units to a central monitoring hub.
- Telesurgical consultation is being used to “enhance the diagnosis, the coordination of care, and the triage of surgical patients.”

VA Academic Detailing Service: Implementation and Lessons Learned
National and international studies have shown that academic detailing (AD) interventions improve the quality of evidence-based health care and provide a positive return on investment.1-5 Many health care systems are investing in AD to improve patient care. Existing systems typically tasked with containing drug costs address neither underprescribing and overselection of high-risk agents, which could result in adverse outcomes, nor nondrug alternatives to treatment.
Academic detailing uses marketing strategies (similar to those of the pharmaceutical industry) to deliver evidence-based information to health care providers (HCPs) but without sales goals. The information is disseminated primarily through one-on-one and small-group educational outreach sessions. The goal of AD is to influence clinician decision making and care delivery behavior and promote evidence-based treatment and monitoring. The academic detailer focuses on delivering targeted messages, embedded within provider handouts, and uses audit and feedback tools to help the clinician identify patients for whom treatment plan change may be warranted. Clinicians also are given patient education tools to use in their discussions with veterans. These tools are used to help veterans take charge of their health. Academic detailing has an advantage over didactic lectures because it provides customized content and barrier resolution strategies to meet clinicians’ individual needs and local constraints.
Although the ability of AD to effectively improve the quality of medical care has been thoroughly studied, much less is known about the cost-effectiveness of AD. Historically, capturing the short- and long-term benefits and costs of AD interventions has been difficult. Eliminating AD’s confounding variables also has proven difficult.
Effectiveness of AD
Principal areas that impact the effectiveness of AD programs include geographic concentration of the medical issue across the prescriber population, differences in costs/outcomes between current practice and optimal practice, number of detailing sessions required to effect change, and the short- and long-term impact on outcomes. These considerations should influence the design of AD programs to gain maximum program efficiency and effectiveness.
Concentration of the Medical Issue
The more geographically concentrated the priority prescribers are, the greater the potential impact of AD. Geographic concentration can reduce travel and administrative costs. Prescribers also may have a high concentration of the targeted patient population; therefore, an intervention specifically targeting high-volume or geographically concentrated populations can be more efficient and effective.
Differences Between Current and Optimal Practice
Academic detailing is most effective when a large gap between desired practice and actual practice has been identified. An AD intervention may be highly cost-effective without immediately reducing overall health care costs. For example, if the gap in practice is due to undertreatment of a disease, then an AD intervention may increase short-term treatment costs but eventually achieve better long-term outcomes in the target population. However, establishing cause-and-effect relationships when dealing with long-term outcomes and confounding variables can be difficult.
Interventions in which the evidence is compelling and current practices are not well established may require only 1 AD visit to induce change. In addition, accelerated integration of the evidence into practice can be seen when operational changes, such as formulary restrictions or policies, are mandated. Multiple sessions often are required to effect change when the change is complicated to initiate, when a formidable learning curve exists, or where current practice is heavily ingrained. Subsequently, intensive discussions and an investment in designing practice delivery of the recommendation are needed to consistently achieve the care delivery goal.
Short- vs Long-Term Impact on Outcomes
For some interventions, specific and readily measurable changes occur almost immediately. For example, switching a high-cost medication to a low-cost alternative provides an immediate cost benefit. In other interventions, such as reduction of future complications, the benefits might be long-term. In such cases, a longer period and a more complex analysis are necessary to measure the impact.
Academic Detailing Service
In 2010, a VA AD Service pilot program began as an intervention to improve evidence-based treatment of mental illness. The pilot was funded through the VA T21 Healthcare Transformational Initiatives, which are designed to support new programs that enhance veteran-centric health care. The VISN 21 and 22 pilot locations included 11 medical centers and 73 clinics in Nevada, California, the Pacific Islands, and the Philippines.
An oversight steering committee was formed. It included leaders from Patient Care Services, Mental Health Services (MHS), and Pharmacy Benefits Management Services (PBM). Clinical pharmacy specialists (CPSs) were chosen to function as academic detailers because they are considered medication experts by prescribers and health care teams. The pilot employed 6.0 full-time employment equivalents (FTEEs) CPSs who were residency trained, held doctorate degrees in pharmacy, and had VA practice experience. The VA AD Service used several strategies to promote evidence-based treatment of common mental health disorders.
Program Materials
The key components of the VA AD Service were educational outreach programming, informatics tool development and dissemination, and barrier resolution. The first step in each campaign was the development of educational program materials designed to facilitate discussion and promote evidence-based practice. The academic detailers along with key VA thought leaders developed provider handouts, provider pocket cards, and patient education materials to support each educational topic. The program materials required the translation of evidence-based research into clinical practice and strategic educational and operational development by individuals who understand complex pharmacotherapy.
Provider handouts, embedded with key messages, served as a summary guide to the information presented and included action statements that highlighted recommendations that would influence behaviors. The handout content reflected recommendations based on the VA/DoD Practice Guidelines, the VA National Formulary, and relevant new and emerging literature on the mental health topic being addressed. When possible, existing VA/DoD and MHS educational resources were used to supplement the handouts.
The pocket cards provided actionable information about treatment recommendations. For example, the provider handout for posttraumatic stress disorder (PTSD) recommended to “consider prazosin for use in veterans with combat associated nightmares” and reviewed the literature to support that recommendation. These pocket cards also provided information on prazosin dosing, titration, common drug interactions, and adverse effects. In addition, patient education resources such as handouts and brochures were designed to engage veterans in their mental health care. These educational materials were vital to ensuring the VA workforce and the veterans being served were well educated on evidence-based treatment and acting on the evolving information produced by the latest research.
Academic detailers used these tools during educational outreach sessions to inform and assess the provider’s knowledge of evidence-based treatment and to review areas where the provider desired further education of the evidence. These educational sessions focused on leadership in mental health, pharmacy service, the medical center overall, and priority clinicians identified as having the greatest opportunity for change. Academic detailers also met with the priority provider clinical support teams (nurses, pharmacists, social workers, psychologists, dieticians, etc) to ensure that the message passed along to veterans was consistent among all team members. Clinicians with the greatest opportunity for change, or priority HCPs, varied based on the particular educational topic. For example, if the educational topic were focused on PTSD, prescribers with large panels of patients with PTSD would be prioritized. Investment in the educational outreach specifically identified clinicians who had the greatest opportunity to transform practice with the clinical recommendations, which in turn, identified the greatest opportunity for the academic detailer to influence behavior changes and improve health care for veterans.
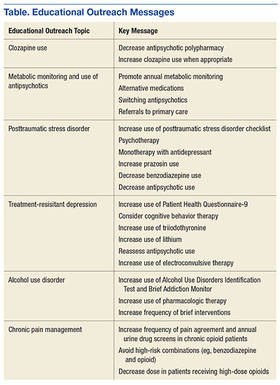
Dashboard
Clinicians were identified by the AD Service using the AD dashboard. This informatics tool included actionable patient information, which was developed for each educational topic. The dashboards were available for use by both academic detailers and clinical team members to support evidence-based treatment and to seek patients who might benefit from an evaluation of care. These audit and feedback tools leveraged regional and national data to produce a clinical performance dashboard that generated visually intuitive reports at the VISN, station, provider, and individual patient levels. Data collection for the dashboards included robust and complex data sets that were updated daily. These tools allowed clinicians to see a snapshot of their patient panel and assess patient-level information in order to change individual care.
Barrier resolution and implementation support is another important aspect of the VA AD program. Education without system solutions is cause for provider and patient frustration. Academic detailers worked with their local site to identify available resources, and they often resolved problems within the system to promote evidence-based treatment. Examples included assisting with the clozapine registration process, creating quick orders to assist with dosing for commonly used medications, and creating treatment letters within the computer system that HCPs could quickly send to the patient. Each academic detailer also worked with local facilities to assess where policies and protocols could support the AD campaign initiatives. Resources at each VA required tailored solutions and collaboration with leadership, and clinicians at each site were key to a successful AD program.
Educational outreach topics covered thus far by the VA AD program include clozapine utilization, metabolic monitoring and use of antipsychotics, PTSD, treatment-resistant depression, alcohol use disorder, and chronic pain management. Each topic focused on specific key messages or key points that are emphasized during the detailing visit with the provider (Table).
Lessons Learned
This pilot program identified several changes that should be considered for future implementation. First, leadership must endorse and support educational sessions with clinicians. Introduction of educational programming begins with creating a collaborative relationship with health care system leadership. Each medical center in the pilot program had an infrastructure of Mental Health, Primary Care, and Pharmacy Service leaders who supported the AD program. In addition, AD Service participation on committees, such as Mental Health Executive Committee, Mental Health Task Force, VISN PBM, and Medication Safety, allows the AD program’s members to network with clinicians and align its key messages with the goals of the facility and leadership. Aligning with existing programs enhances and promotes resources for clinicians and supports leadership and performance goals.
To collaborate, HCPs needs to understand how the AD program benefits them. Before clinicians are approached regarding participation, the AD program should be developed into a branded collaborative program that offers numerous benefits to them, their practice, and their patients. The program must provide a clear and credible answer to the question, “Why should I spend my time meeting with you?”
Second, reaching HCPs for face-to-face encounters over large geographic areas requires an organized network of academic detailers with adequate administrative support. Partnerships with staff already present in the clinic are essential for consistent reinforcement and delivery of the key messages. These partnerships allow station-level staff to continually identify opportunities to act on the key messages. By using local champions, the AD Service can effectively cover a large territory. Providing education to remote facilities can be done by telephone or video teleconferencing.
Third, many HCPs recognize the value this program can add to their practice and have requested follow-up sessions with the academic detailers. To better understand the needs, baseline knowledge, readiness, and receptivity of target audiences, the AD Service should deploy an informal needs assessment to HCPs. The feedback can be used to prepare the appropriate strategies and messaging during AD sessions.
Fourth, the VA chose to use CPSs with experience working as provider extenders for medication management as the primary academic detailers for this pilot. It should be noted that AD services in other national and international systems are successfully performed by other types of HCPs with this same level of qualifications and expertise. Regardless of profession, the academic detailer must have the qualifications and expertise necessary to empower clinical personnel. Without this expertise, provider buy-in is difficult to obtain. As a result, behavior change will be less likely. Pharmacists currently serve as the drug information experts for patients and health care teams. They are valued across professions for their knowledge of medication management, and they have the capacity to recommend nonpharmacologic evidence-based treatments. In addition, using drug information experts as academic detailers allows them to serve as a resource for more complex patient cases.
Finally, providing real-time audit and feedback tools with educational resources gives clinicians tangible actions to improve the care they deliver and proactively target interventions anticipated in the upcoming appointments. It is helpful for HCPs to see the culture of their prescribing compared with prescribers across the network because this can identify areas for improvement and highlight strong practices. Use of audit and feedback tools with a team approach allows for delegation of duties where team members may contribute and collaborate to reach patient goals and improve patient care. Using information technology to deliver this product to health care teams is an important component of the AD program. For successful implementation, resources are needed from both clinicians and the Office of Information and Technology to develop and maintain these powerful tools.
Conclusion
The VA AD Service uses a multifaceted approach to promote the use of evidence-based treatment in veterans with mental illness. Academic detailers, along with key thought leaders, identified opportunities to improve care with solutions for applying evidenced-based medicine. Several items are considered necessary for successful AD program implementation, based on the pilot program. These included endorsement and support by leadership; needs assessment prior to key message development to fully understand the needs, baseline knowledge, readiness, and receptivity of target audiences; highly qualified academic detailers with the training, expertise, and communication skills necessary to empower clinical personnel; and real-time audit and feedback tools with education to give clinicians tangible actions to improve care.
The VA AD Service, including provision of educational services, clinical consultation, health systems barrier resolution, and audit and feedback tools, presents a new opportunity for pharmacists to improve the quality of care of veterans. The impact of the VA AD program on evidence-based care prescribing is being analyzed and will be reported in the future.
1. O’Brien MA, Rogers S, Jamtvedt G, et al. Educational outreach visits: effects on professional practice and health care outcomes. Cochrane Database Syst Rev. 2007;4:CD000409.
2. Meehan TP, Van Hoof TJ, Giannotti TE, et al. A descriptive study of educational outreach to promote use of quality improvement tools in primary care private practice. Am J Med Qual. 2009;24(2):90-98.
3. Simon SR, Rodriguez HP, Majumdar SR, et al. Economic analysis of a randomized trial of academic detailing interventions to improve use of antihypertensive medications. J Clin Hypertens (Greenwich). 2007;9(1):15-20.
4. Solomon DH, Van Houten L, Glynn RJ, et al. Academic detailing to improve use of broad-spectrum antibiotics at an academic medical center. Arch Intern Med. 2001;161(15):1897-1902
5. Patel B, Afghan S. Effects of an educational outreach campaign (IMPACT) on depression management delivered to general practitioners in one primary care trust. Ment Health Fam Med. 2009;6(3):155-162.
National and international studies have shown that academic detailing (AD) interventions improve the quality of evidence-based health care and provide a positive return on investment.1-5 Many health care systems are investing in AD to improve patient care. Existing systems typically tasked with containing drug costs address neither underprescribing and overselection of high-risk agents, which could result in adverse outcomes, nor nondrug alternatives to treatment.
Academic detailing uses marketing strategies (similar to those of the pharmaceutical industry) to deliver evidence-based information to health care providers (HCPs) but without sales goals. The information is disseminated primarily through one-on-one and small-group educational outreach sessions. The goal of AD is to influence clinician decision making and care delivery behavior and promote evidence-based treatment and monitoring. The academic detailer focuses on delivering targeted messages, embedded within provider handouts, and uses audit and feedback tools to help the clinician identify patients for whom treatment plan change may be warranted. Clinicians also are given patient education tools to use in their discussions with veterans. These tools are used to help veterans take charge of their health. Academic detailing has an advantage over didactic lectures because it provides customized content and barrier resolution strategies to meet clinicians’ individual needs and local constraints.
Although the ability of AD to effectively improve the quality of medical care has been thoroughly studied, much less is known about the cost-effectiveness of AD. Historically, capturing the short- and long-term benefits and costs of AD interventions has been difficult. Eliminating AD’s confounding variables also has proven difficult.
Effectiveness of AD
Principal areas that impact the effectiveness of AD programs include geographic concentration of the medical issue across the prescriber population, differences in costs/outcomes between current practice and optimal practice, number of detailing sessions required to effect change, and the short- and long-term impact on outcomes. These considerations should influence the design of AD programs to gain maximum program efficiency and effectiveness.
Concentration of the Medical Issue
The more geographically concentrated the priority prescribers are, the greater the potential impact of AD. Geographic concentration can reduce travel and administrative costs. Prescribers also may have a high concentration of the targeted patient population; therefore, an intervention specifically targeting high-volume or geographically concentrated populations can be more efficient and effective.
Differences Between Current and Optimal Practice
Academic detailing is most effective when a large gap between desired practice and actual practice has been identified. An AD intervention may be highly cost-effective without immediately reducing overall health care costs. For example, if the gap in practice is due to undertreatment of a disease, then an AD intervention may increase short-term treatment costs but eventually achieve better long-term outcomes in the target population. However, establishing cause-and-effect relationships when dealing with long-term outcomes and confounding variables can be difficult.
Interventions in which the evidence is compelling and current practices are not well established may require only 1 AD visit to induce change. In addition, accelerated integration of the evidence into practice can be seen when operational changes, such as formulary restrictions or policies, are mandated. Multiple sessions often are required to effect change when the change is complicated to initiate, when a formidable learning curve exists, or where current practice is heavily ingrained. Subsequently, intensive discussions and an investment in designing practice delivery of the recommendation are needed to consistently achieve the care delivery goal.
Short- vs Long-Term Impact on Outcomes
For some interventions, specific and readily measurable changes occur almost immediately. For example, switching a high-cost medication to a low-cost alternative provides an immediate cost benefit. In other interventions, such as reduction of future complications, the benefits might be long-term. In such cases, a longer period and a more complex analysis are necessary to measure the impact.
Academic Detailing Service
In 2010, a VA AD Service pilot program began as an intervention to improve evidence-based treatment of mental illness. The pilot was funded through the VA T21 Healthcare Transformational Initiatives, which are designed to support new programs that enhance veteran-centric health care. The VISN 21 and 22 pilot locations included 11 medical centers and 73 clinics in Nevada, California, the Pacific Islands, and the Philippines.
An oversight steering committee was formed. It included leaders from Patient Care Services, Mental Health Services (MHS), and Pharmacy Benefits Management Services (PBM). Clinical pharmacy specialists (CPSs) were chosen to function as academic detailers because they are considered medication experts by prescribers and health care teams. The pilot employed 6.0 full-time employment equivalents (FTEEs) CPSs who were residency trained, held doctorate degrees in pharmacy, and had VA practice experience. The VA AD Service used several strategies to promote evidence-based treatment of common mental health disorders.
Program Materials
The key components of the VA AD Service were educational outreach programming, informatics tool development and dissemination, and barrier resolution. The first step in each campaign was the development of educational program materials designed to facilitate discussion and promote evidence-based practice. The academic detailers along with key VA thought leaders developed provider handouts, provider pocket cards, and patient education materials to support each educational topic. The program materials required the translation of evidence-based research into clinical practice and strategic educational and operational development by individuals who understand complex pharmacotherapy.
Provider handouts, embedded with key messages, served as a summary guide to the information presented and included action statements that highlighted recommendations that would influence behaviors. The handout content reflected recommendations based on the VA/DoD Practice Guidelines, the VA National Formulary, and relevant new and emerging literature on the mental health topic being addressed. When possible, existing VA/DoD and MHS educational resources were used to supplement the handouts.
The pocket cards provided actionable information about treatment recommendations. For example, the provider handout for posttraumatic stress disorder (PTSD) recommended to “consider prazosin for use in veterans with combat associated nightmares” and reviewed the literature to support that recommendation. These pocket cards also provided information on prazosin dosing, titration, common drug interactions, and adverse effects. In addition, patient education resources such as handouts and brochures were designed to engage veterans in their mental health care. These educational materials were vital to ensuring the VA workforce and the veterans being served were well educated on evidence-based treatment and acting on the evolving information produced by the latest research.
Academic detailers used these tools during educational outreach sessions to inform and assess the provider’s knowledge of evidence-based treatment and to review areas where the provider desired further education of the evidence. These educational sessions focused on leadership in mental health, pharmacy service, the medical center overall, and priority clinicians identified as having the greatest opportunity for change. Academic detailers also met with the priority provider clinical support teams (nurses, pharmacists, social workers, psychologists, dieticians, etc) to ensure that the message passed along to veterans was consistent among all team members. Clinicians with the greatest opportunity for change, or priority HCPs, varied based on the particular educational topic. For example, if the educational topic were focused on PTSD, prescribers with large panels of patients with PTSD would be prioritized. Investment in the educational outreach specifically identified clinicians who had the greatest opportunity to transform practice with the clinical recommendations, which in turn, identified the greatest opportunity for the academic detailer to influence behavior changes and improve health care for veterans.
Dashboard
Clinicians were identified by the AD Service using the AD dashboard. This informatics tool included actionable patient information, which was developed for each educational topic. The dashboards were available for use by both academic detailers and clinical team members to support evidence-based treatment and to seek patients who might benefit from an evaluation of care. These audit and feedback tools leveraged regional and national data to produce a clinical performance dashboard that generated visually intuitive reports at the VISN, station, provider, and individual patient levels. Data collection for the dashboards included robust and complex data sets that were updated daily. These tools allowed clinicians to see a snapshot of their patient panel and assess patient-level information in order to change individual care.
Barrier resolution and implementation support is another important aspect of the VA AD program. Education without system solutions is cause for provider and patient frustration. Academic detailers worked with their local site to identify available resources, and they often resolved problems within the system to promote evidence-based treatment. Examples included assisting with the clozapine registration process, creating quick orders to assist with dosing for commonly used medications, and creating treatment letters within the computer system that HCPs could quickly send to the patient. Each academic detailer also worked with local facilities to assess where policies and protocols could support the AD campaign initiatives. Resources at each VA required tailored solutions and collaboration with leadership, and clinicians at each site were key to a successful AD program.
Educational outreach topics covered thus far by the VA AD program include clozapine utilization, metabolic monitoring and use of antipsychotics, PTSD, treatment-resistant depression, alcohol use disorder, and chronic pain management. Each topic focused on specific key messages or key points that are emphasized during the detailing visit with the provider (Table).
Lessons Learned
This pilot program identified several changes that should be considered for future implementation. First, leadership must endorse and support educational sessions with clinicians. Introduction of educational programming begins with creating a collaborative relationship with health care system leadership. Each medical center in the pilot program had an infrastructure of Mental Health, Primary Care, and Pharmacy Service leaders who supported the AD program. In addition, AD Service participation on committees, such as Mental Health Executive Committee, Mental Health Task Force, VISN PBM, and Medication Safety, allows the AD program’s members to network with clinicians and align its key messages with the goals of the facility and leadership. Aligning with existing programs enhances and promotes resources for clinicians and supports leadership and performance goals.
To collaborate, HCPs needs to understand how the AD program benefits them. Before clinicians are approached regarding participation, the AD program should be developed into a branded collaborative program that offers numerous benefits to them, their practice, and their patients. The program must provide a clear and credible answer to the question, “Why should I spend my time meeting with you?”
Second, reaching HCPs for face-to-face encounters over large geographic areas requires an organized network of academic detailers with adequate administrative support. Partnerships with staff already present in the clinic are essential for consistent reinforcement and delivery of the key messages. These partnerships allow station-level staff to continually identify opportunities to act on the key messages. By using local champions, the AD Service can effectively cover a large territory. Providing education to remote facilities can be done by telephone or video teleconferencing.
Third, many HCPs recognize the value this program can add to their practice and have requested follow-up sessions with the academic detailers. To better understand the needs, baseline knowledge, readiness, and receptivity of target audiences, the AD Service should deploy an informal needs assessment to HCPs. The feedback can be used to prepare the appropriate strategies and messaging during AD sessions.
Fourth, the VA chose to use CPSs with experience working as provider extenders for medication management as the primary academic detailers for this pilot. It should be noted that AD services in other national and international systems are successfully performed by other types of HCPs with this same level of qualifications and expertise. Regardless of profession, the academic detailer must have the qualifications and expertise necessary to empower clinical personnel. Without this expertise, provider buy-in is difficult to obtain. As a result, behavior change will be less likely. Pharmacists currently serve as the drug information experts for patients and health care teams. They are valued across professions for their knowledge of medication management, and they have the capacity to recommend nonpharmacologic evidence-based treatments. In addition, using drug information experts as academic detailers allows them to serve as a resource for more complex patient cases.
Finally, providing real-time audit and feedback tools with educational resources gives clinicians tangible actions to improve the care they deliver and proactively target interventions anticipated in the upcoming appointments. It is helpful for HCPs to see the culture of their prescribing compared with prescribers across the network because this can identify areas for improvement and highlight strong practices. Use of audit and feedback tools with a team approach allows for delegation of duties where team members may contribute and collaborate to reach patient goals and improve patient care. Using information technology to deliver this product to health care teams is an important component of the AD program. For successful implementation, resources are needed from both clinicians and the Office of Information and Technology to develop and maintain these powerful tools.
Conclusion
The VA AD Service uses a multifaceted approach to promote the use of evidence-based treatment in veterans with mental illness. Academic detailers, along with key thought leaders, identified opportunities to improve care with solutions for applying evidenced-based medicine. Several items are considered necessary for successful AD program implementation, based on the pilot program. These included endorsement and support by leadership; needs assessment prior to key message development to fully understand the needs, baseline knowledge, readiness, and receptivity of target audiences; highly qualified academic detailers with the training, expertise, and communication skills necessary to empower clinical personnel; and real-time audit and feedback tools with education to give clinicians tangible actions to improve care.
The VA AD Service, including provision of educational services, clinical consultation, health systems barrier resolution, and audit and feedback tools, presents a new opportunity for pharmacists to improve the quality of care of veterans. The impact of the VA AD program on evidence-based care prescribing is being analyzed and will be reported in the future.
1. O’Brien MA, Rogers S, Jamtvedt G, et al. Educational outreach visits: effects on professional practice and health care outcomes. Cochrane Database Syst Rev. 2007;4:CD000409.
2. Meehan TP, Van Hoof TJ, Giannotti TE, et al. A descriptive study of educational outreach to promote use of quality improvement tools in primary care private practice. Am J Med Qual. 2009;24(2):90-98.
3. Simon SR, Rodriguez HP, Majumdar SR, et al. Economic analysis of a randomized trial of academic detailing interventions to improve use of antihypertensive medications. J Clin Hypertens (Greenwich). 2007;9(1):15-20.
4. Solomon DH, Van Houten L, Glynn RJ, et al. Academic detailing to improve use of broad-spectrum antibiotics at an academic medical center. Arch Intern Med. 2001;161(15):1897-1902
5. Patel B, Afghan S. Effects of an educational outreach campaign (IMPACT) on depression management delivered to general practitioners in one primary care trust. Ment Health Fam Med. 2009;6(3):155-162.
Implementing the EQUiPPED Medication Management Program
Suboptimal prescribing for older adults discharged from the emergency department (ED) is a recognized problem.1-4 At the Durham VAMC in North Carolina, for example, suboptimal prescribing was tracked in about 30% of patients discharged from the ED; 34% experienced an adverse medical event within 90 days, including repeated ED visits, hospitalization, or death.4
In 2012, the American Geriatrics Society (AGS) issued its Beers Criteria list of potentially inappropriate medications (PIMs) to avoid (updated again in 2015).5,6 As EDs are not suited to meet the needs of a vulnerable population with complex medical conditions and medication regimens, putting these evidence-based guidelines into practice represented both a challenge and an opportunity.7
In 2013, an investigator from the Birmingham/Atlanta Geriatric Research Education and Clinical Center (GRECC) teamed up with an internist at the Atlanta VAMC in Georgia to expand a local quality improvement intervention to reduce the use of PIMs prescribed to veterans at time of discharge from the ED. The project received funding from the VA Office of Geriatrics and Extended Care Transforming VA Healthcare for the 21st Century (T-21) initiative for a 3-site quality improvement project. In the second year, the project was expanded to 5 sites representing a collaboration of 4 different GRECCs.
With a common mission to develop and evaluate new models of geriatric care for veterans, GRECCs offer a national network for rapid implementation and potential dissemination of innovative clinical demonstration projects. Preliminary evaluation showed a significant and sustained reduction of ED-prescribed PIMs at the first implementation site, with favorable results suggested by subsequent sites.8,9
These results demonstrated success despite implementation challenges, including creating order sets and educating clinicians to change behavior. This article describes common and diverging factors across 5 implementation sites and presents an implementation process model that was developed by examining these factors.
Implementation
Enhancing Quality of Prescribing Practices for Older Veterans Dis-charged from the ED (EQUiPPED) is a multicomponent, interdisciplinaryquality-improvement initiative to reduce PIMs. The program imple-mented 3 evidence-based inter-ventions: (1) ED provider education; (2) clinical decision support in the form of pharmacy quick-order sets; and (3) individual provider academic detailing, audit and feedback, and peer benchmarking. 10,11
The original implementation sites in September 2013 were the Atlanta VAMC (Birmingham/Atlanta GRECC), the Durham VAMC (Durham GRECC), and the Tennessee Valley Healthcare System Nashville Campus (Tennessee Valley GRECC). In September 2014 the James J. Peters VAMC (Bronx GRECC) and the Birmingham VAMC (Birmingham/Atlanta GRECC) also were included. Provider characteristics varied by site (Table).
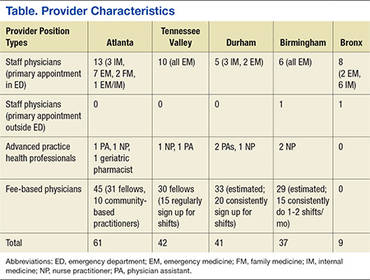
To ensure that the program was consistently implemented at each site, several standard definitions and formulas were developed. The investigators defined 34 PIMs and classes to avoid in adults aged ≥ 65 years regardless of diseases or conditions from the 2012 AGS Beers Criteria for Potentially Inappropriate Medication Use in Older Adults.5 However, the Beers List required interpretation on several important points. For example, the Beers List does not advise on how PIMs are to be measured and tracked. Also, it does not specify a goal other than to “improve care of older adults by reducing their exposure to PIMs.”5
Potentially inappropriate medications are now recognized as an important measure by the Centers for Medicare and Medicaid Services and by the Pharmacy Quality Alliance (PQA) and are used as a quality measure in the National Committee for Quality Assurance (NCQA) Healthcare Effectiveness Data and Information Set (HEDIS). They are typically measured as the number of patients aged ≥ 65 years who received either at least 1 PIM or at least 2 PIMs divided by the total number of patients aged ≥ 65 years during a given period (typically a year). The EQUiPPED program, however, is an intervention targeting providers rather than patients, and for regular monthly feedback, the EQUiPPED team designated its measure as the number of PIMs prescribed to veterans aged ≥ 65 years on discharge from the ED divided by the total number of medications prescribed at discharge in a particular month. Understanding that PIMs are sometimes necessary for treatment, the EQUiPPED team set a goal of reducing PIMs prescribed to below 5% of all discharge medications in the ED.
The EQUiPPED implementation team also operationalized other aspects of the Beers List recommendations. For example, providers are advised that oral nonsteroidal anti-inflammatory drugs (NSAIDs) should not be prescribed for chronic use “unless other alternatives are not effective and the patient can take a gastroprotective agent.”12 However, there is no guidance on the meaning of chronic use or on dosages. The team determined that the best operational definition of chronic NSAID use for EQUiPPED was prescription duration of ≥ 30 days.
To carry out the intervention, each EQUiPPED site used a letter from the VA Office of Geriatrics and Extended Care designating the analysis of outcomes data related to the intervention as an operational activity rather than as research. The EQUiPPED team developed pharmacy quick-order sets in dialogue with ED providers and clinical pharmacists. Clinical applications coordinators facilitated local integration of order sets into the Computerized Patient Record System (CPRS). Local clinical experts reviewed the order sets (eg, the Pharmacy & Therapeutics Committee, the Antimicrobial Stewardship Committee, and the Chief of Pharmacy Service) before implementation.
Once the order sets were implemented, the sites began educating providers about the order sets along with the information about Beers List medications. As soon as possible, usually 1 month after the educational sessions, the sites began evaluating data from the local corporate data warehouse regarding medications prescribed in order to calculate monthly PIM rates. Each provider received a report that showed their PIM rate and overall prescribing in the previous month and benchmarked this performance in relation to anonymized peers. The first feedback session was given in person by a physician or a physician-pharmacist team. All sites followed these standard EQUiPPED procedures.
Site Innovations and Adaptations
The Durham site developed a Beers List look-up tool to streamline the calculation of PIMs per provider every month and ensure the systematization of procedures. Although each site introduced education, order sets, and feedback in the same order, launch times differed. Varying levels of staff availability and expertise resulted in order-set rollout times that ranged from 3 weeks to 12 months. Some sites launched additional tools. For example, Durham, Atlanta, and Bronx added blue line alerts, a noninterruptive informational message in CPRS for every Beers List drug prescribed at their VA that warned prescribers to “use with caution in patients 65+.”
Some sites physically placed caution cards on the edge of ED computer screens listing the top 5 PIMS drugs at that site. Nashville, Birmingham, and Durham’s order sets included links to external sites, such as the World Health Organization analgesic ladder and to narcotics equivalency tables to simplify pain management. Nashville ED providers requested e-mail attachments of Beers List drugs, Beers alternatives, and reminders with monthly feedback reports.
Other differences depended on the makeup of the EQUiPPED intervention team and the patient population at each site. A physician champion within the ED, a geriatrician, and a geriatric pharmacist directed the lead Atlanta site. In contrast, a geriatrician led the Durham project and used incentives to help encourage ED provider participation. All Durham ED providers who participated in the program received laminated Beers pocket cards, a printed guide to download the Geriatrics at Your Fingertips app, and a gift card to purchase the app. Other sites distributed some of these materials but did not include the gift card.
Durham-trained resident physicians rotated through the ED each month, as did Atlanta’s. Durham also introduced pre- and posttraining quizzes for resident physicians to test knowledge gained.13 No other site followed this pattern. Differences in local formularies, priorities, patient groups, and preferences led sites to select different order sets for presentation and to adapt them if needed.
Tennessee Valley posted the largest array of order sets in the CPRS with 42 different medication order sets, Atlanta and Birmingham had 12 order sets, and Bronx used the fewest at 3. Durham chose to implement its order sets progressively, with an initial 3, then an additional 2, and then an additional 2. Durham sought feedback from providers during this staged rollout and incorporated changes into the development of the next set. Birmingham and Bronx began tracking use of order sets electronically. The Atlanta site conducted qualitative interviews with a subset of providers (both untrained and trained) to evaluate usage patterns. Nashville used the geriatric order sets as a template to develop order sets for other emergency conditions.
Implementation Model
By understanding practice variations and similarities at a heterogeneous group of VA hospitals, tracking prescribing data, and conducting a thematic content analysis of field reports from EQUiPPED sites, the investigators were able to develop a relatively standardized process model to improve ED prescribing practices for clinicians caring for older adults. The implementation model captures factors at the level of context (alignment with priorities of care), inputs (resources available), outputs (activities and participation), and outcomes (short, medium, and long-term). In addition to the process model, EQUiPPED has developed an implementation tool kit, which includes order set logic, the Beers look-up tool developed by Durham, education materials, and provider feedback templates.
The implementation model and components of the tool kit are available by request through the Birmingham/Atlanta GRECC. With these materials, the EQUiPPED project is poised for implementation at other VA EDs or at sites beyond the VA.
Conclusion
Successful implementation of EQUiPPED, an innovative geriatric practice intervention to reduce PIM prescribing in the ED, is dependent on careful planning and site customization. Distilling factors that differed across VA sites resulted in a model intended to promote implementation and dissemination of the EQUIPPED intervention.
1. Beers MH, Storrie M, Lee G. Potential adverse drug interactions in the emergency room: an issue in the quality of care. Ann Intern Med. 1990;112(1):61-64.
2. Chin MH, Wang LC, Jin L, et al. Appropriateness of medication selection for older persons in an urban academic emergency department. Acad Emerg Med. 1999;6(12):1232-1242.
3. Hustey FM, Wallis N, Miller J. Inappropriate prescribing in an older ED population. Am J Emerg Med. 2007;25(7):804-807.
4. Hastings SN, Schmader KE, Sloane RJ, et al. Quality of pharmacotherapy and outcomes for older veterans discharged from the emergency department. J Am Geriatr Soc. 2008;56(5):875-880.
5. The American Geriatrics Society 2012 Beers Criteria Update Expert Panel. American Geriatrics Society Updated Beers Criteria for Potentially Inappropriate Medication Use in Older Adults. J Am Geriatr Soc. 2012;60(4):616-631.
6. American Geriatrics Society 2015 Beers Criteria Update Expert Panel. American Geriatrics Society 2015 Updated Beers Criteria for Potentially Inappropriate Medication Use in Older Adults. J Am Geriatr Soc. 2015;63(11):2227-2246.
7. Hwang U, Shah MN, Han JH, Carpenter CR, Siu AL, Adams JG. Transforming emergency care for older adults. Health Aff (Millwood). 2013;32(12):2116-2121.
8. Stevens MB, Hastings SN, Powers J, et al. Enhancing the Quality of Prescribing Practices for Older Veterans Discharged from the Emergency Department (EQUiPPED): preliminary results from Enhancing Quality of Prescribing Practices for Older Veterans Discharged from the Emergency Department, a novel multicomponent interdisciplinary quality improvement initiative. J Am Geriatr Soc. 2015;63(5):1025-1029.
9. Moss JM, Bryan WE, Wilkerson LM, et al. Impact of clinical pharmacy specialists on the design and implementation of a quality improvement initiative to decrease inappropriate medications in a Veterans Affairs emergency deepartment. J Manag Care Spec Pharm. 2016;22(1):74-80.
10. O’Brien MA, Rogers S, Jamtvedt G, et al. Educational outreach visits: effects on professional practice and health care outcomes. Cochrane Database Syst Rev. 2007;(4):CD000409.
11. Terrell KM, Perkins AJ, Dexter PR, Hui SL, Callahan CM, Miller DK. Computerized decision support to reduce potentially inappropriate prescribing to older emergency department patients: a randomized, controlled trial. J Am Geriatr Soc. 2009;57(8):1388-1394.
12. The American Geriatrics Association. A Pocket Guide to the AGS Beers Criteria. New York, NY: The American Geriatrics Association; 2012.
13. Wilkerson LM, Owenby R, Bryan W, et al. An interdisciplinary academic detailing approach to decrease inappropriate medication prescribing for older veterans treated in the Emergency Department. In: Proceeding from the American Geriatrics Society 2015 Annual Scientific Meeting; May 14-17, 2015; National Harbor, MD. Abstract B67.
Suboptimal prescribing for older adults discharged from the emergency department (ED) is a recognized problem.1-4 At the Durham VAMC in North Carolina, for example, suboptimal prescribing was tracked in about 30% of patients discharged from the ED; 34% experienced an adverse medical event within 90 days, including repeated ED visits, hospitalization, or death.4
In 2012, the American Geriatrics Society (AGS) issued its Beers Criteria list of potentially inappropriate medications (PIMs) to avoid (updated again in 2015).5,6 As EDs are not suited to meet the needs of a vulnerable population with complex medical conditions and medication regimens, putting these evidence-based guidelines into practice represented both a challenge and an opportunity.7
In 2013, an investigator from the Birmingham/Atlanta Geriatric Research Education and Clinical Center (GRECC) teamed up with an internist at the Atlanta VAMC in Georgia to expand a local quality improvement intervention to reduce the use of PIMs prescribed to veterans at time of discharge from the ED. The project received funding from the VA Office of Geriatrics and Extended Care Transforming VA Healthcare for the 21st Century (T-21) initiative for a 3-site quality improvement project. In the second year, the project was expanded to 5 sites representing a collaboration of 4 different GRECCs.
With a common mission to develop and evaluate new models of geriatric care for veterans, GRECCs offer a national network for rapid implementation and potential dissemination of innovative clinical demonstration projects. Preliminary evaluation showed a significant and sustained reduction of ED-prescribed PIMs at the first implementation site, with favorable results suggested by subsequent sites.8,9
These results demonstrated success despite implementation challenges, including creating order sets and educating clinicians to change behavior. This article describes common and diverging factors across 5 implementation sites and presents an implementation process model that was developed by examining these factors.
Implementation
Enhancing Quality of Prescribing Practices for Older Veterans Dis-charged from the ED (EQUiPPED) is a multicomponent, interdisciplinaryquality-improvement initiative to reduce PIMs. The program imple-mented 3 evidence-based inter-ventions: (1) ED provider education; (2) clinical decision support in the form of pharmacy quick-order sets; and (3) individual provider academic detailing, audit and feedback, and peer benchmarking. 10,11
The original implementation sites in September 2013 were the Atlanta VAMC (Birmingham/Atlanta GRECC), the Durham VAMC (Durham GRECC), and the Tennessee Valley Healthcare System Nashville Campus (Tennessee Valley GRECC). In September 2014 the James J. Peters VAMC (Bronx GRECC) and the Birmingham VAMC (Birmingham/Atlanta GRECC) also were included. Provider characteristics varied by site (Table).
To ensure that the program was consistently implemented at each site, several standard definitions and formulas were developed. The investigators defined 34 PIMs and classes to avoid in adults aged ≥ 65 years regardless of diseases or conditions from the 2012 AGS Beers Criteria for Potentially Inappropriate Medication Use in Older Adults.5 However, the Beers List required interpretation on several important points. For example, the Beers List does not advise on how PIMs are to be measured and tracked. Also, it does not specify a goal other than to “improve care of older adults by reducing their exposure to PIMs.”5
Potentially inappropriate medications are now recognized as an important measure by the Centers for Medicare and Medicaid Services and by the Pharmacy Quality Alliance (PQA) and are used as a quality measure in the National Committee for Quality Assurance (NCQA) Healthcare Effectiveness Data and Information Set (HEDIS). They are typically measured as the number of patients aged ≥ 65 years who received either at least 1 PIM or at least 2 PIMs divided by the total number of patients aged ≥ 65 years during a given period (typically a year). The EQUiPPED program, however, is an intervention targeting providers rather than patients, and for regular monthly feedback, the EQUiPPED team designated its measure as the number of PIMs prescribed to veterans aged ≥ 65 years on discharge from the ED divided by the total number of medications prescribed at discharge in a particular month. Understanding that PIMs are sometimes necessary for treatment, the EQUiPPED team set a goal of reducing PIMs prescribed to below 5% of all discharge medications in the ED.
The EQUiPPED implementation team also operationalized other aspects of the Beers List recommendations. For example, providers are advised that oral nonsteroidal anti-inflammatory drugs (NSAIDs) should not be prescribed for chronic use “unless other alternatives are not effective and the patient can take a gastroprotective agent.”12 However, there is no guidance on the meaning of chronic use or on dosages. The team determined that the best operational definition of chronic NSAID use for EQUiPPED was prescription duration of ≥ 30 days.
To carry out the intervention, each EQUiPPED site used a letter from the VA Office of Geriatrics and Extended Care designating the analysis of outcomes data related to the intervention as an operational activity rather than as research. The EQUiPPED team developed pharmacy quick-order sets in dialogue with ED providers and clinical pharmacists. Clinical applications coordinators facilitated local integration of order sets into the Computerized Patient Record System (CPRS). Local clinical experts reviewed the order sets (eg, the Pharmacy & Therapeutics Committee, the Antimicrobial Stewardship Committee, and the Chief of Pharmacy Service) before implementation.
Once the order sets were implemented, the sites began educating providers about the order sets along with the information about Beers List medications. As soon as possible, usually 1 month after the educational sessions, the sites began evaluating data from the local corporate data warehouse regarding medications prescribed in order to calculate monthly PIM rates. Each provider received a report that showed their PIM rate and overall prescribing in the previous month and benchmarked this performance in relation to anonymized peers. The first feedback session was given in person by a physician or a physician-pharmacist team. All sites followed these standard EQUiPPED procedures.
Site Innovations and Adaptations
The Durham site developed a Beers List look-up tool to streamline the calculation of PIMs per provider every month and ensure the systematization of procedures. Although each site introduced education, order sets, and feedback in the same order, launch times differed. Varying levels of staff availability and expertise resulted in order-set rollout times that ranged from 3 weeks to 12 months. Some sites launched additional tools. For example, Durham, Atlanta, and Bronx added blue line alerts, a noninterruptive informational message in CPRS for every Beers List drug prescribed at their VA that warned prescribers to “use with caution in patients 65+.”
Some sites physically placed caution cards on the edge of ED computer screens listing the top 5 PIMS drugs at that site. Nashville, Birmingham, and Durham’s order sets included links to external sites, such as the World Health Organization analgesic ladder and to narcotics equivalency tables to simplify pain management. Nashville ED providers requested e-mail attachments of Beers List drugs, Beers alternatives, and reminders with monthly feedback reports.
Other differences depended on the makeup of the EQUiPPED intervention team and the patient population at each site. A physician champion within the ED, a geriatrician, and a geriatric pharmacist directed the lead Atlanta site. In contrast, a geriatrician led the Durham project and used incentives to help encourage ED provider participation. All Durham ED providers who participated in the program received laminated Beers pocket cards, a printed guide to download the Geriatrics at Your Fingertips app, and a gift card to purchase the app. Other sites distributed some of these materials but did not include the gift card.
Durham-trained resident physicians rotated through the ED each month, as did Atlanta’s. Durham also introduced pre- and posttraining quizzes for resident physicians to test knowledge gained.13 No other site followed this pattern. Differences in local formularies, priorities, patient groups, and preferences led sites to select different order sets for presentation and to adapt them if needed.
Tennessee Valley posted the largest array of order sets in the CPRS with 42 different medication order sets, Atlanta and Birmingham had 12 order sets, and Bronx used the fewest at 3. Durham chose to implement its order sets progressively, with an initial 3, then an additional 2, and then an additional 2. Durham sought feedback from providers during this staged rollout and incorporated changes into the development of the next set. Birmingham and Bronx began tracking use of order sets electronically. The Atlanta site conducted qualitative interviews with a subset of providers (both untrained and trained) to evaluate usage patterns. Nashville used the geriatric order sets as a template to develop order sets for other emergency conditions.
Implementation Model
By understanding practice variations and similarities at a heterogeneous group of VA hospitals, tracking prescribing data, and conducting a thematic content analysis of field reports from EQUiPPED sites, the investigators were able to develop a relatively standardized process model to improve ED prescribing practices for clinicians caring for older adults. The implementation model captures factors at the level of context (alignment with priorities of care), inputs (resources available), outputs (activities and participation), and outcomes (short, medium, and long-term). In addition to the process model, EQUiPPED has developed an implementation tool kit, which includes order set logic, the Beers look-up tool developed by Durham, education materials, and provider feedback templates.
The implementation model and components of the tool kit are available by request through the Birmingham/Atlanta GRECC. With these materials, the EQUiPPED project is poised for implementation at other VA EDs or at sites beyond the VA.
Conclusion
Successful implementation of EQUiPPED, an innovative geriatric practice intervention to reduce PIM prescribing in the ED, is dependent on careful planning and site customization. Distilling factors that differed across VA sites resulted in a model intended to promote implementation and dissemination of the EQUIPPED intervention.
1. Beers MH, Storrie M, Lee G. Potential adverse drug interactions in the emergency room: an issue in the quality of care. Ann Intern Med. 1990;112(1):61-64.
2. Chin MH, Wang LC, Jin L, et al. Appropriateness of medication selection for older persons in an urban academic emergency department. Acad Emerg Med. 1999;6(12):1232-1242.
3. Hustey FM, Wallis N, Miller J. Inappropriate prescribing in an older ED population. Am J Emerg Med. 2007;25(7):804-807.
4. Hastings SN, Schmader KE, Sloane RJ, et al. Quality of pharmacotherapy and outcomes for older veterans discharged from the emergency department. J Am Geriatr Soc. 2008;56(5):875-880.
5. The American Geriatrics Society 2012 Beers Criteria Update Expert Panel. American Geriatrics Society Updated Beers Criteria for Potentially Inappropriate Medication Use in Older Adults. J Am Geriatr Soc. 2012;60(4):616-631.
6. American Geriatrics Society 2015 Beers Criteria Update Expert Panel. American Geriatrics Society 2015 Updated Beers Criteria for Potentially Inappropriate Medication Use in Older Adults. J Am Geriatr Soc. 2015;63(11):2227-2246.
7. Hwang U, Shah MN, Han JH, Carpenter CR, Siu AL, Adams JG. Transforming emergency care for older adults. Health Aff (Millwood). 2013;32(12):2116-2121.
8. Stevens MB, Hastings SN, Powers J, et al. Enhancing the Quality of Prescribing Practices for Older Veterans Discharged from the Emergency Department (EQUiPPED): preliminary results from Enhancing Quality of Prescribing Practices for Older Veterans Discharged from the Emergency Department, a novel multicomponent interdisciplinary quality improvement initiative. J Am Geriatr Soc. 2015;63(5):1025-1029.
9. Moss JM, Bryan WE, Wilkerson LM, et al. Impact of clinical pharmacy specialists on the design and implementation of a quality improvement initiative to decrease inappropriate medications in a Veterans Affairs emergency deepartment. J Manag Care Spec Pharm. 2016;22(1):74-80.
10. O’Brien MA, Rogers S, Jamtvedt G, et al. Educational outreach visits: effects on professional practice and health care outcomes. Cochrane Database Syst Rev. 2007;(4):CD000409.
11. Terrell KM, Perkins AJ, Dexter PR, Hui SL, Callahan CM, Miller DK. Computerized decision support to reduce potentially inappropriate prescribing to older emergency department patients: a randomized, controlled trial. J Am Geriatr Soc. 2009;57(8):1388-1394.
12. The American Geriatrics Association. A Pocket Guide to the AGS Beers Criteria. New York, NY: The American Geriatrics Association; 2012.
13. Wilkerson LM, Owenby R, Bryan W, et al. An interdisciplinary academic detailing approach to decrease inappropriate medication prescribing for older veterans treated in the Emergency Department. In: Proceeding from the American Geriatrics Society 2015 Annual Scientific Meeting; May 14-17, 2015; National Harbor, MD. Abstract B67.
Polypharmacy Review of Vulnerable Elders: Can We IMPROVE Outcomes?
Investigators at the Atlanta site of the Birmingham/Atlanta VA Geriatric Research and Education Clinical Center (GRECC) developed the Integrated Management and Polypharmacy Review of Vulnerable Elders (IMPROVE) clinical demonstration project to enhance medication management and quality of prescribing for vulnerable older veterans. Poor quality prescribing in older adults is common and can result in adverse drug reactions (ADRs); increased emergency department, hospital, and primary care provider (PCP) use; and death. The ADRs alone, which are strongly correlated with multiple medication use, account for at least 10% of hospitalizations in older persons.1
Many factors contributing to poor quality prescribing in older persons include time constraints on health professionals, multiple providers, patient-driven prescribing, patients with low health literacy, and frequent transitions in care between home, hospital, and postacute care. Older veterans may be harmed by taking medications with no clear benefit, duplication of therapy, and omission of beneficial medications. Prescribing medications with known high risk for ADRs, inadequate monitoring, and limited patient education on how and why to take a medication can further increase the risk for adverse outcomes. Prescribing for multimorbid older veterans requires comprehensive, individualized care plans that take into account patients’ goals of care and quality of life, as well as evidence-based practice standards.
Clinical trials have repeatedly shown that individualized pharmacy review can reduce polypharmacy in older patients. Positive outcomes have included reduced ADRs, improved measures of prescribing quality, appropriate medication use, compliance with care recommendations, and reduction in the total number of medications.2-5 Optimal use of medications is achieved when a pharmacist works with other care team members to implement and oversee a care plan, as opposed to each provider working alone.2,5
In 2011, the VHA Geriatrics Pharmacy Taskforce recommended that facilities offer “individualized pharmacy review for high-risk patients on multiple medications.”6 This recommendation was in line with the increasingly integrated role of the clinical pharmacist in the patient aligned care team (PACT) and the recent requirement that Medicare Part D medication therapy management programs offer this service to select patients with chronic disease.
The IMPROVE Model
Given the high and growing numbers of older veterans enrolled in VA primary care who are at risk for ADRs, the Atlanta VA IMPROVE team implemented a GRECC-funded clinical demonstration project. The project supported the VA’s focus on PACTs in combination with existing best practice standards to improve medication management in high-risk older veterans. The Emory University Institutional Review Board ruled that IMPROVE was a quality improvement project, and therefore was exempt from review and VA research oversight.
For this clinical demonstration, IMPROVE targeted noninstitutionalized veterans aged ≥ 85 years taking 10 or more medications who received care in the VA primary care clinic and used the VA pharmacy for medications. This cohort represented the top 5% of medication users enrolled in the clinic. While age and number of medications are independently associated with increased risk for ADRs, other factors common in this cohort, including higher levels of comorbid disease, frequent care transitions, and cognitive impairment are also associated with higher ADR risk.7The IMPROVE model was designed to promote fully engaged partnerships among veterans, family caregivers, and the PACT with input from all parties in the design of the model. The IMPROVE team conducted individual, qualitative, semistructured interviews with 5 clinical pharmacists, 5 geriatricians, and 1 geriatric nurse practitioner on the challenges faced in the management of medications for older patients, individual needs/barriers to meet these challenges, the clinical pharmacist role in providing recommendations to providers, and attitudes and preferences for team communication.
Challenges discovered included time constraints during clinic visits, a need for joint decision making, and limited competency with principles of health literacy. The IMPROVE team also conducted focus groups with veterans (n = 4) and caregivers (n = 7) to determine medication management needs, values, preferences, and barriers to self-management. Key findings from these sessions included poor recognition of limitations in medication self-management, problems related to health literacy, and misunderstanding the role of the clinical pharmacist.8
Using the information gained from patients, family caregivers, and PACT members, the model was tailored to address concerns. The IMPROVE model engaged a PACT clinical pharmacist skilled in medication management and patient education to perform a face-to-face clinical consult with selected patients and their caregivers.5 Making veterans, families, and PACT members collaborators in IMPROVE’s design helped establish active partnerships that enabled effective execution of the project and promoted sustained culture and system change over time.
Pilot Program
High-risk veterans and their caregivers were recruited by letter, followed by a phone call to schedule an appointment for those interested, and a reminder to bring all their medications to the appointment. Twenty-eight male veterans participated in the pilot. The average age was 89 years; 52% were white; 53% had a diagnosis of dementia; 78% reported assistance with medication management; and patients took an average of 16 medications daily. Recruited high-risk veterans and their caregivers were seen in a 1 hour in-person visit with the clinical pharmacist.
To maximize the benefit of the session, the pharmacist was provided with several tools to assist in a systematic evaluation of medication management concerns and quality of prescribing. Tools included a quick reference card citing potentially inappropriate medications (PIMs) per the published 2012 Beers Criteria and a reference for potentially beneficial medications based on the START-STOPP criteria.9,10
A Computerized Patient Record System template was developed to guide the pharmacist visit. The template included medication reconciliation, a systematic review of all medications to verify indication and check for redundancies, drug interactions, PIMs, and proper therapeutic monitoring. The template also included assessments for level of medication assistance available, goals of care, health literacy, and barriers to adherence.
A collaborative review of the medication regimen was conducted with the veteran, caregiver, and pharmacist, resulting in individualized recommendations, education, strategies, and tools to improve the quality and safety of the medication regimen as well as patient adherence. When necessary, pill boxes, illustrated medication schedules, low vision aids, and other adaptive devices were provided.
Communication of recommendations with the PCP occurred by cosignature on the note. Same-day consultation with the PCP was also available for any urgent concerns or significant changes to the regimen. At the discretion of the pharmacist, a face-to-face follow-up visit with the pharmacist or a follow-up phone call was conducted.
Results
Both qualitative and quantitative outcomes measures were used to evaluate the IMPROVE model. Semi-structured postpilot interviews with PCPs showed that the model had high satisfaction, acceptability, and feasibility. Providers reported that the model helped them and their patients in an area that takes considerable time (medication review and education) and is not always feasible in a short clinic visit. Providers were willing to accept pharmacist recommendations, which was likely fostered by pre-intervention strategies to keep communication open about proposed medication changes. In a survey, 93% of patients and caregivers found the IMPROVE model helpful; 100% recommended the clinic to others.
Objective measures found 79% of patients in the pilot had at least 1 medication discontinued, 75% had ≥ 1 dosing or timing adjustments made, and PIMs were reduced 14%. Comparing the 6-month period before the pilot and the 6 months after, pharmacy cost savings averaged $64 per veteran per month. Health care use showed a decreasing trend in phone calls and visits to the PCP.7 Cost savings were comparable or greater than those previously reported for similar interventions.4
Conclusions
The results of the IMPROVE pilot suggest that an integrated model involving both pharmacists and PCPs in managing medications and empowering the patient and family caregivers as stakeholders in their own care can lead to improved quality of medication management and cost savings. Based on the success of the pilot, the IMPROVE model received VA Office of Rural Health funding to translate this model to target rural older veterans in community based outpatient clinics.
The success of the IMPROVE model was undoubtedly enhanced by engaged PACT members at the pilot site and a clinical pharmacist who championed the model. The effort involved in recruiting, scheduling, and assessing participants may limit generalizability to settings without such a champion and without dedicated time available with a pharmacist. Determining which groups of older veterans benefit most from individualized medication management and optimal methods to translate the program to other primary care settings are ongoing endeavors for the Atlanta GRECC IMPROVE team.
Acknowledgments
This project was supported by a VA Transformation-21 grant awarded through the Office of Geriatrics and Extended Care. The authors thank Christine Jasien, MS; for data management, Aaron Bozzorg, MS; for interview transcription, Joette Lowe, PharmD; for general consultation; and the VISN 7 leadership for their support.
1. Marcum ZA, Amuan ME, Hanlon JT, et al. Prevalence of unplanned hospitalizations caused by adverse drug reactions in older veterans. J Am Geriatr Soc. 2012;60(1):34-41.
2. Schmader KE, Hanlon JT, Pieper CF, et al. Effects of geriatric evaluation and management on adverse drug reactions and suboptimal prescribing in the frail elderly. Am J Med. 2004;116(6):394-401.
3. Krska J, Cromarty JA, Arris F, et al. Pharmacist‐led medication review in patients over 65: a randomized, controlled trial in primary care. Age Ageing. 2001;30(3):205-211.
4. Chumney EC, Robinson LC. The effects of pharmacist interventions on patients with polypharmacy. Pharm Pract (Granada). 2006;4(3):103-109.
5. Lee JK, Slack MK, Martin J, Ehrman C, Chrisholm-Burns M. Geriatric patient care by U.S. pharmacists in healthcare teams: systematic review and meta-analyses. J Am Geriatr Soc. 2013;61(7):1119-1127.
6. Veterans Health Administration Geriatrics Pharmacy Taskforce. Improving Patient-Centered Medication Management for Elderly Veterans: VHA Geriatrics Pharmacy Taskforce Report and Recommendations. August 2010.
7. Spinewine A, Schmader KE, Barber N, et al. Appropriate prescribing in elderly people: how well can it be measured and optimised? Lancet. 2007;370(9582):173-184.
8. Mirk A, Kemp L, Echt KV, Perkins MM. Integrated management and polypharmacy review of vulnerable elders: Can we IMPROVE outcomes? [abstract]. J Am Geriatr Soc. 2013;61(suppl 1):S92.
9. American Geriatrics Society 2012 Beers Criteria Update Expert Panel. American Geriatrics Society updated Beers Criteria for potentially inappropriate medication use in older adults. J Am Geriatr Soc. 2012;60(4):616-613.
10. Barry P, Gallagher P, Ryan C, O'Mahony D. START (screening tool to alert doctors to the right treatment)--an evidence-based screening tool to detect prescribing omissions in elderly patients. Age Ageing. 2007;36(6):632-638.
Investigators at the Atlanta site of the Birmingham/Atlanta VA Geriatric Research and Education Clinical Center (GRECC) developed the Integrated Management and Polypharmacy Review of Vulnerable Elders (IMPROVE) clinical demonstration project to enhance medication management and quality of prescribing for vulnerable older veterans. Poor quality prescribing in older adults is common and can result in adverse drug reactions (ADRs); increased emergency department, hospital, and primary care provider (PCP) use; and death. The ADRs alone, which are strongly correlated with multiple medication use, account for at least 10% of hospitalizations in older persons.1
Many factors contributing to poor quality prescribing in older persons include time constraints on health professionals, multiple providers, patient-driven prescribing, patients with low health literacy, and frequent transitions in care between home, hospital, and postacute care. Older veterans may be harmed by taking medications with no clear benefit, duplication of therapy, and omission of beneficial medications. Prescribing medications with known high risk for ADRs, inadequate monitoring, and limited patient education on how and why to take a medication can further increase the risk for adverse outcomes. Prescribing for multimorbid older veterans requires comprehensive, individualized care plans that take into account patients’ goals of care and quality of life, as well as evidence-based practice standards.
Clinical trials have repeatedly shown that individualized pharmacy review can reduce polypharmacy in older patients. Positive outcomes have included reduced ADRs, improved measures of prescribing quality, appropriate medication use, compliance with care recommendations, and reduction in the total number of medications.2-5 Optimal use of medications is achieved when a pharmacist works with other care team members to implement and oversee a care plan, as opposed to each provider working alone.2,5
In 2011, the VHA Geriatrics Pharmacy Taskforce recommended that facilities offer “individualized pharmacy review for high-risk patients on multiple medications.”6 This recommendation was in line with the increasingly integrated role of the clinical pharmacist in the patient aligned care team (PACT) and the recent requirement that Medicare Part D medication therapy management programs offer this service to select patients with chronic disease.
The IMPROVE Model
Given the high and growing numbers of older veterans enrolled in VA primary care who are at risk for ADRs, the Atlanta VA IMPROVE team implemented a GRECC-funded clinical demonstration project. The project supported the VA’s focus on PACTs in combination with existing best practice standards to improve medication management in high-risk older veterans. The Emory University Institutional Review Board ruled that IMPROVE was a quality improvement project, and therefore was exempt from review and VA research oversight.
For this clinical demonstration, IMPROVE targeted noninstitutionalized veterans aged ≥ 85 years taking 10 or more medications who received care in the VA primary care clinic and used the VA pharmacy for medications. This cohort represented the top 5% of medication users enrolled in the clinic. While age and number of medications are independently associated with increased risk for ADRs, other factors common in this cohort, including higher levels of comorbid disease, frequent care transitions, and cognitive impairment are also associated with higher ADR risk.7The IMPROVE model was designed to promote fully engaged partnerships among veterans, family caregivers, and the PACT with input from all parties in the design of the model. The IMPROVE team conducted individual, qualitative, semistructured interviews with 5 clinical pharmacists, 5 geriatricians, and 1 geriatric nurse practitioner on the challenges faced in the management of medications for older patients, individual needs/barriers to meet these challenges, the clinical pharmacist role in providing recommendations to providers, and attitudes and preferences for team communication.
Challenges discovered included time constraints during clinic visits, a need for joint decision making, and limited competency with principles of health literacy. The IMPROVE team also conducted focus groups with veterans (n = 4) and caregivers (n = 7) to determine medication management needs, values, preferences, and barriers to self-management. Key findings from these sessions included poor recognition of limitations in medication self-management, problems related to health literacy, and misunderstanding the role of the clinical pharmacist.8
Using the information gained from patients, family caregivers, and PACT members, the model was tailored to address concerns. The IMPROVE model engaged a PACT clinical pharmacist skilled in medication management and patient education to perform a face-to-face clinical consult with selected patients and their caregivers.5 Making veterans, families, and PACT members collaborators in IMPROVE’s design helped establish active partnerships that enabled effective execution of the project and promoted sustained culture and system change over time.
Pilot Program
High-risk veterans and their caregivers were recruited by letter, followed by a phone call to schedule an appointment for those interested, and a reminder to bring all their medications to the appointment. Twenty-eight male veterans participated in the pilot. The average age was 89 years; 52% were white; 53% had a diagnosis of dementia; 78% reported assistance with medication management; and patients took an average of 16 medications daily. Recruited high-risk veterans and their caregivers were seen in a 1 hour in-person visit with the clinical pharmacist.
To maximize the benefit of the session, the pharmacist was provided with several tools to assist in a systematic evaluation of medication management concerns and quality of prescribing. Tools included a quick reference card citing potentially inappropriate medications (PIMs) per the published 2012 Beers Criteria and a reference for potentially beneficial medications based on the START-STOPP criteria.9,10
A Computerized Patient Record System template was developed to guide the pharmacist visit. The template included medication reconciliation, a systematic review of all medications to verify indication and check for redundancies, drug interactions, PIMs, and proper therapeutic monitoring. The template also included assessments for level of medication assistance available, goals of care, health literacy, and barriers to adherence.
A collaborative review of the medication regimen was conducted with the veteran, caregiver, and pharmacist, resulting in individualized recommendations, education, strategies, and tools to improve the quality and safety of the medication regimen as well as patient adherence. When necessary, pill boxes, illustrated medication schedules, low vision aids, and other adaptive devices were provided.
Communication of recommendations with the PCP occurred by cosignature on the note. Same-day consultation with the PCP was also available for any urgent concerns or significant changes to the regimen. At the discretion of the pharmacist, a face-to-face follow-up visit with the pharmacist or a follow-up phone call was conducted.
Results
Both qualitative and quantitative outcomes measures were used to evaluate the IMPROVE model. Semi-structured postpilot interviews with PCPs showed that the model had high satisfaction, acceptability, and feasibility. Providers reported that the model helped them and their patients in an area that takes considerable time (medication review and education) and is not always feasible in a short clinic visit. Providers were willing to accept pharmacist recommendations, which was likely fostered by pre-intervention strategies to keep communication open about proposed medication changes. In a survey, 93% of patients and caregivers found the IMPROVE model helpful; 100% recommended the clinic to others.
Objective measures found 79% of patients in the pilot had at least 1 medication discontinued, 75% had ≥ 1 dosing or timing adjustments made, and PIMs were reduced 14%. Comparing the 6-month period before the pilot and the 6 months after, pharmacy cost savings averaged $64 per veteran per month. Health care use showed a decreasing trend in phone calls and visits to the PCP.7 Cost savings were comparable or greater than those previously reported for similar interventions.4
Conclusions
The results of the IMPROVE pilot suggest that an integrated model involving both pharmacists and PCPs in managing medications and empowering the patient and family caregivers as stakeholders in their own care can lead to improved quality of medication management and cost savings. Based on the success of the pilot, the IMPROVE model received VA Office of Rural Health funding to translate this model to target rural older veterans in community based outpatient clinics.
The success of the IMPROVE model was undoubtedly enhanced by engaged PACT members at the pilot site and a clinical pharmacist who championed the model. The effort involved in recruiting, scheduling, and assessing participants may limit generalizability to settings without such a champion and without dedicated time available with a pharmacist. Determining which groups of older veterans benefit most from individualized medication management and optimal methods to translate the program to other primary care settings are ongoing endeavors for the Atlanta GRECC IMPROVE team.
Acknowledgments
This project was supported by a VA Transformation-21 grant awarded through the Office of Geriatrics and Extended Care. The authors thank Christine Jasien, MS; for data management, Aaron Bozzorg, MS; for interview transcription, Joette Lowe, PharmD; for general consultation; and the VISN 7 leadership for their support.
1. Marcum ZA, Amuan ME, Hanlon JT, et al. Prevalence of unplanned hospitalizations caused by adverse drug reactions in older veterans. J Am Geriatr Soc. 2012;60(1):34-41.
2. Schmader KE, Hanlon JT, Pieper CF, et al. Effects of geriatric evaluation and management on adverse drug reactions and suboptimal prescribing in the frail elderly. Am J Med. 2004;116(6):394-401.
3. Krska J, Cromarty JA, Arris F, et al. Pharmacist‐led medication review in patients over 65: a randomized, controlled trial in primary care. Age Ageing. 2001;30(3):205-211.
4. Chumney EC, Robinson LC. The effects of pharmacist interventions on patients with polypharmacy. Pharm Pract (Granada). 2006;4(3):103-109.
5. Lee JK, Slack MK, Martin J, Ehrman C, Chrisholm-Burns M. Geriatric patient care by U.S. pharmacists in healthcare teams: systematic review and meta-analyses. J Am Geriatr Soc. 2013;61(7):1119-1127.
6. Veterans Health Administration Geriatrics Pharmacy Taskforce. Improving Patient-Centered Medication Management for Elderly Veterans: VHA Geriatrics Pharmacy Taskforce Report and Recommendations. August 2010.
7. Spinewine A, Schmader KE, Barber N, et al. Appropriate prescribing in elderly people: how well can it be measured and optimised? Lancet. 2007;370(9582):173-184.
8. Mirk A, Kemp L, Echt KV, Perkins MM. Integrated management and polypharmacy review of vulnerable elders: Can we IMPROVE outcomes? [abstract]. J Am Geriatr Soc. 2013;61(suppl 1):S92.
9. American Geriatrics Society 2012 Beers Criteria Update Expert Panel. American Geriatrics Society updated Beers Criteria for potentially inappropriate medication use in older adults. J Am Geriatr Soc. 2012;60(4):616-613.
10. Barry P, Gallagher P, Ryan C, O'Mahony D. START (screening tool to alert doctors to the right treatment)--an evidence-based screening tool to detect prescribing omissions in elderly patients. Age Ageing. 2007;36(6):632-638.
The Cost of Oncology Drugs: A Pharmacy Perspective, Part I
Health care costs are the fastest growing financial segment of the U.S. economy. The Centers for Medicare and Medicaid Services (CMS) estimates health care spending in the U.S. will increase from $3.0 trillion in 2014 to $5.4 trillion by 2024.1 About 19.3% of the U.S. gross domestic product is consumed by health care, which is twice that of any other country in the world. It is often stated that the increasing cost of health care is the most significant financial threat to the U.S. economy. The cost of medications, including those for treating cancer, is the leading cause of increased health care spending.2
The cost of cancer care is the most rapidly increasing component of U.S. health care spending and will increase from $125 billion in 2010 to an estimated $158 billion in 2020, a 27% increase.3 Most experts agree that the current escalation of costs is unsustainable and, if left unchecked, will have a devastating effect on the quality of health care and an increasing negative financial impact on individuals, businesses, and government. However, that discussion is outside the scope of this article.
The affordability of health care has become a major concern for most Americans. During the recent U.S. financial crisis, most of the focus was on the bursting of the housing bubble, plummeting real estate prices, the loss of jobs, and the failure of large financial institutions. However, medical bills were still the leading cause of personal bankruptcies during this period. In 2007, 62% of personal bankruptcies in the U.S. were due to medical costs, and 78% of those bankruptcies involved patients who had health insurance at the beginning of their illness.4
The cost of prescription medications is causing financial difficulties for many patients, especially elderly.
Americans who have multiple chronic medical conditions and live on fixed incomes. A recently released survey by the nonpartisan Kaiser Family Foundation found that the high cost of prescription medications, especially those to treat serious medical conditions such as cancer, is the top health concern of 77% of those Americans polled.5 In this environment, oncology providers face many challenges in their obligation to treat cancer patients in a cost-effective manner.
This article will appear in 2 parts. Part 1 will focus on the emerging discussion of the financial impact of high-cost drugs in the U.S. The drivers of increasing oncology drug costs will also be reviewed. Part 2 will focus on the challenges of high cost medications in the VA and the role the VA Pharmacy Benefits Management (PBM) Service has in evaluating new oncology agents. Clinical guidance tools designed to aid the clinician in the cost-effective use of these agents and results of a nationwide survey of VA oncology pharmacists regarding the use of cost-containment strategies will also be presented.
Background
When discussing the value of targeted therapies, it is useful to define both targeted therapy and value. A targeted therapy is a type of treatment using drugs or other substances to identify and attack cancer cells with less harm to normal cells, according to the National Cancer Institute. 6 Some targeted therapies block the action of certain enzymes, proteins, or other molecules involved in the growth and spread of cancer cells (the molecular target). Other types of targeted therapies help the immune system kill cancer cells or deliver toxic substances directly to cancer cells and kill them.
Targeted therapy may have fewer adverse effects (AEs) than do other types of cancer treatment. Most targeted therapies are either small molecules or monoclonal antibodies. Although imatinib, released in 2001, is the drug that coined the phrase targeted therapy, many drugs released earlier, such as rituximab, can be considered targeted therapies due to their specific, or targeted, mechanism of action.
Value is the price an object will bring in an open and competitive, or free, market as determined by the consumer. To put the definition of value in simpler terms, Warren Buffet has been quoted as saying, “Cost is what you pay, value is what you get.” The oncology market is not entirely free and open. Market price is determined by the manufacturer, entry into the market is regulated by the FDA, purchasers (like the VA and the Centers for Medicare and Medicaid Services) have only limited ability to negotiate prices, and refusing to pay for life-saving or life-prolonging medications often is not an option. As costs for oncology drugs rapidly increase, the cost-benefit ratio, or value, is being increasingly debated. When comparing the clinical benefits these agents provide with cost, the perception of value is highly subjective and can change significantly based on who is paying the bill.
Questioning High-Cost Drugs
Charles Moertel and colleagues published a landmark trial 25 years ago, which reported that treatment with fluorouracil and levamisole for 1 year decreased the death rate of patients with stage C (stage III) colon cancer by 33% following curative surgery.7 Although this trial was clinically significant, there was as much discussion about the high cost of levamisole (Ergamisol) tablets as there
was about its clinical benefit for patients.
In a 1991 letter to the New England Journal of Medicine, Rossof and colleagues questioned the high cost of the levamisole in the treatment regimen.8 Rossof and colleagues were surprised at the drug’s price on approval, about $5 for each tablet, and detailed their concerns on how this price was determined. “On the basis of the cost to a veterinarian, the calculated cost of a hypothetical 50-mg tablet should be in the range of 3 to 6 cents,” they argued. The total cost to the patient of 1 year of treament was nearly $1,200. Their conclusion was that “…the price chosen for the new American consumer is far too high and requires justification by the manufacturer.”
A reply from Janssen Pharmaceutica, the drug’s manufacturer, offered many justifications for the price.8 According to the company, Ergamisol was supplied free to 5,000 research patients prior to FDA approval. It was also given for free to indigent patients. The company also insisted that its pricing compared favorably with its competitors, such as zidovudine, octreotide, newer generation nonsteroidal anti-inflammatories, and antihypertension drugs. “Drug pricing includes additional expensive research, physician education, compassionate use programs, and ensuring high-quality control. Janssen scientists studied immunomodulating effect of Ergamisol for 25 years with no financial return. Drug development is high-risk, so companies must be able to derive a reasonable return on sales.”8
The cost of levamisole was $1,200 per year in 1991, and after adjustment for inflation would cost about $1,988 in 2015, or $166 per month. If these prices caused outrage in 1990, it is easy to see how current prices of well over $10,000 per month for therapies, which often render small clinical benefits, can seem outrageous by comparison.
Public Debate Over Cancer Drug Prices
In the U.S., about 1.66 million patients will be diagnosed with cancer in 2015.9 Although about 30% to 40% of these patients will be effectively cured, only 3% to 4% will be cured using pharmacotherapy (usually traditional chemotherapy) as a sole modality. Therefore, the use of oncology drugs by the vast majority of cancer patients is not to cure but to control or palliate patients with advanced cancer. It is important to note that the cost of most curative regimens is cheap compared with many medications used for advanced disease. Until a few years ago, discussion of the high costs of cancer treatment was rarely made public due to the devastating nature of cancer. However, with the rapid price increases and relatively disappointing clinical benefits of the many new drugs entering the market, the question of value can no longer be ignored. Many authors havepresented commentaries and strategies addressing the issues
surrounding the high cost of cancer drugs.10-15
It was a groundbreaking 2012 letter to the New York Times that brought the issue to public attention.16 Dr. Peter Bach and his colleagues at Memorial Sloan Kettering Cancer Center announced they would not purchase a “phenomenally expensive new cancer drug” for their patients, calling their decision a no-brainer. The drug, ziv-afilbercept (Zaltrap), was twice the price of a similar drug, bevacizumab (Avastin), but was no more efficacious in the treatment of metastatic colorectal cancer. Bach and colleagues went on to say how high drug prices are having a potentially devastating financial impact on patients and that laws protect drug manufacturers to set drug prices at what they feel the market will bear.
Considering the value of cancer treatments is now actively encouraged. To that point, the American Society of Clinical Oncology (ASCO) has recently published a groundbreaking paper entitled “A Conceptual Framework to Assess the Value of Cancer Treatment Options.”17 This tool, which is still in development, will allow oncologists to quantify clinical benefit, toxicity, and out-of-pocket drug costs so patients can compare treatment options with cost as a consideration.
The financial burden put on patients has become the driving force for drug cost reform. In an attempt to control their costs, third-party payers have increased the cost burden for patients by demanding larger copays and other out-of-pocket expenses for medications. It is felt that requiring patients to have more “skin in the game” would force them to make treatment decisions based on cost. Unfortunately, this approach may lead to devastating financial consequences for patients.18-20 The overwhelming emotions patients experience following the diagnosis of cancer make it difficult to focus on the financial impact of treatment recommendations. In addition, many oncologists are not comfortable, or even capable, of discussing costs so patients can make financially informed treatment decisions.14 Unfortunately for patients, “shopping for health care” has very little in common with shopping for a car, television sets, or any other commodity.
The VA Health Care System
The VA is government-sponsored health care and is therefore unique in the U.S. health care environment. The VA might be considered a form of “socialized medicine” that operates under a different economic model than do private health care systems. The treatment of VA patients for common diseases is based on nationally accepted evidence-based guidelines, which allow the best care in a cost-effective manner. For the treatment of cancer, the use of expensive therapies must be made in the context of the finite resources allocated for the treatment of all veterans within the system.
The VA provides lifelong free or minimal cost health care to eligible veterans. For veterans receiving care within the VA, out-of-pocket expenses are considerably less than for non-VA patients. Current medication copays range from free to $9 per month for all medications, regardless of acquisition cost. This is in stark contrast to the private sector, where patients must often pay large, percentage- based copays for oncology medications, which can reach several thousand dollars per month. VA patients are not subject to percentage-based copays; therefore, they are not a financial stakeholder in the treatment
decision process.
Prior to 1995, the VA was a much criticized and poorly performing health care system that had experienced significant budget cuts, forcing many veterans to lose their benefits and seek care outside the VA. Beginning in 1995 with the creation of PBM, a remarkable transformation occurred that modernized and transformed the VA into a system that consistently outperforms the private sector in quality of care, patient safety, and patient satisfaction while maintaining low overall costs. The role of the VA PBM was to develop and maintain the National Drug Formulary, create clinical guidance documents, and manage drug costs and use.
Part 2 of this article will more closely examine the high cost of cancer drugs. It will also discuss the role of VA PBM and other VA efforts to control cost
Author disclosures
The author reports no actual or potential conflicts of interest with regard to this article.
Disclaimer
The opinions expressed herein are those of the author and do not necessarily reflect those of Federal Practitioner, Frontline Medical Communications Inc., the U.S. Government, or any of its agencies. This article may discuss unlabeled or investigational use of certain drugs. Please review the complete prescribing information for specific drugs or drug combinations—including indications, contraindications, warnings, and adverse effects—before administering pharmacologic therapy to patients.
Click here for the digital edition.
1. Centers for Medicare and Medicaid. National health expenditure projections 2014-2024 Table 01. Centers for Medicare and Medicaid Website. https://www.cms.gov/research-statistics-data-and-systems/statistics-trends-and-reports/nationalhealthexpenddata/nationalhealthaccountsprojected.html. Updated July 30, 2015. Accessed January 11, 2016.
2. Bach PB. Limits of Medicare’s ability to control rising spending on cancer drugs. N Engl J Med. 2009;360(6):626-633.
3. Mariotto AB, Yabroff KR, Shao Y, Feuer EJ, Brown ML. Projections of the cost of cancer in the United States: 2010-2020. J Natl Cancer Inst. 2011;103(2):117-128.
4. Himmelstein DU, Thorne D, Warren E, Woolhandler S. Medical bankruptcy in the United States, 2007: results of a national study. Am J Med. 2009;122(8):741-746.
5. The Henry J. Kaiser Family Foundation. Prescription drug costs remain atop the public’s national health care agenda, well ahead of Affordable Care Act revisions and repeal [press release]. Kaiser Family Foundation Website. http://kff.org/health-costs/press-release/prescription-drug-costs-remain-atop-the-publics-national-health-care-agenda-well-ahead-of-affordable-care-act-revisions-and-repeal. Published October 28, 2015. Accessed January 11, 2016.
6. National Cancer Institute (NCI). NCI dictionary of cancer terms: targeted therapy. National Cancer Institute Website. http://www.cancer.gov/publications/dictionaries/cancer-terms?cdrid=270742. Accessed January 11, 2016.
7. Moertel CG, Fleming TR, Macdonald JS, et al. Levamisole and fluorouracil for adjuvant therapy resected colon carcinoma. N Engl J Med. 1990;322(6):352-358.
8. Rossof AH, Philpot TR, Bunch RS, Letcher J. The high cost of levamisole for humans. N Engl J Med. 1991;324(10):701-702.
9. Siegel RL, Miller KD, Jemal A. Cancer statistics, 2015. CA Cancer J Clin. 2015;65(1):5-29.
10. Nadler E, Eckert B, Neumann PJ. Do oncologists believe new cancer drugs offer good value? Oncologist. 2006;11(2):90-95.
11. Hillner BE, Smith TJ. Efficacy does not necessarily translate into cost effectiveness: a case study of the challenges associated with 21st century cancer drug pricing. J Clin Oncol. 2009;27(13):2111-2113.
12. Neumann PJ, Weinstein MC. Legislating against use of cost-effectiveness information. N Engl J Med. 2010;363(16):1495-1497.
13. Elkin EB, Bach PB. Cancer’s next frontier: addressing high and increasing costs. JAMA. 2010;303(11):1086-1087.
14. Smith TJ, Hillner BE. Bending the cost curve in cancer care. N Engl J Med. 2011;364(21):2060-2065.
15. Siddiqui M, Rajkumar SV. The high cost of cancer drugs and what we can do
about it. Mayo Clin Proc. 2012;87(10):935-943.
16. Bach PB, Saltz LB, Wittes RE. In cancer care, cost matters [op-ed]. New York Times. October 14, 2012.
17. Schnipper LE, Davidson NE, Wollins DS, et al; American Society of Clinical Oncology. American Society of Clinical Oncology statement: a conceptual framework to assess the value of cancer treatment options. J Clin Oncol. 2015;33(23): 2563-2577.
18. Zafar SY, Peppercorn JM, Schrag D, et al. The financial toxicity of cancer treatment: a pilot study assessing out-of-pocket expenses and the insured cancer patient’s experience. Oncologist. 2013;18(4):381-390.
19. Fenn KM, Evans SB, McCorkle R, et al. Impact of financial burden of cancer on
survivors’ quality of life. J Oncol Prac. 2014;10(5):332-338.
20. Zafar SY, McNeil RB, Thomas CM, Lathan CS, Ayanian JZ, Provenzale D. Population-based assessment of cancer survivors’ financial burden and quality of life: a prospective cohort study. J Oncol Pract. 2015;11(2):145-150.
Note: Page numbers differ between the print issue and digital edition.
Health care costs are the fastest growing financial segment of the U.S. economy. The Centers for Medicare and Medicaid Services (CMS) estimates health care spending in the U.S. will increase from $3.0 trillion in 2014 to $5.4 trillion by 2024.1 About 19.3% of the U.S. gross domestic product is consumed by health care, which is twice that of any other country in the world. It is often stated that the increasing cost of health care is the most significant financial threat to the U.S. economy. The cost of medications, including those for treating cancer, is the leading cause of increased health care spending.2
The cost of cancer care is the most rapidly increasing component of U.S. health care spending and will increase from $125 billion in 2010 to an estimated $158 billion in 2020, a 27% increase.3 Most experts agree that the current escalation of costs is unsustainable and, if left unchecked, will have a devastating effect on the quality of health care and an increasing negative financial impact on individuals, businesses, and government. However, that discussion is outside the scope of this article.
The affordability of health care has become a major concern for most Americans. During the recent U.S. financial crisis, most of the focus was on the bursting of the housing bubble, plummeting real estate prices, the loss of jobs, and the failure of large financial institutions. However, medical bills were still the leading cause of personal bankruptcies during this period. In 2007, 62% of personal bankruptcies in the U.S. were due to medical costs, and 78% of those bankruptcies involved patients who had health insurance at the beginning of their illness.4
The cost of prescription medications is causing financial difficulties for many patients, especially elderly.
Americans who have multiple chronic medical conditions and live on fixed incomes. A recently released survey by the nonpartisan Kaiser Family Foundation found that the high cost of prescription medications, especially those to treat serious medical conditions such as cancer, is the top health concern of 77% of those Americans polled.5 In this environment, oncology providers face many challenges in their obligation to treat cancer patients in a cost-effective manner.
This article will appear in 2 parts. Part 1 will focus on the emerging discussion of the financial impact of high-cost drugs in the U.S. The drivers of increasing oncology drug costs will also be reviewed. Part 2 will focus on the challenges of high cost medications in the VA and the role the VA Pharmacy Benefits Management (PBM) Service has in evaluating new oncology agents. Clinical guidance tools designed to aid the clinician in the cost-effective use of these agents and results of a nationwide survey of VA oncology pharmacists regarding the use of cost-containment strategies will also be presented.
Background
When discussing the value of targeted therapies, it is useful to define both targeted therapy and value. A targeted therapy is a type of treatment using drugs or other substances to identify and attack cancer cells with less harm to normal cells, according to the National Cancer Institute. 6 Some targeted therapies block the action of certain enzymes, proteins, or other molecules involved in the growth and spread of cancer cells (the molecular target). Other types of targeted therapies help the immune system kill cancer cells or deliver toxic substances directly to cancer cells and kill them.
Targeted therapy may have fewer adverse effects (AEs) than do other types of cancer treatment. Most targeted therapies are either small molecules or monoclonal antibodies. Although imatinib, released in 2001, is the drug that coined the phrase targeted therapy, many drugs released earlier, such as rituximab, can be considered targeted therapies due to their specific, or targeted, mechanism of action.
Value is the price an object will bring in an open and competitive, or free, market as determined by the consumer. To put the definition of value in simpler terms, Warren Buffet has been quoted as saying, “Cost is what you pay, value is what you get.” The oncology market is not entirely free and open. Market price is determined by the manufacturer, entry into the market is regulated by the FDA, purchasers (like the VA and the Centers for Medicare and Medicaid Services) have only limited ability to negotiate prices, and refusing to pay for life-saving or life-prolonging medications often is not an option. As costs for oncology drugs rapidly increase, the cost-benefit ratio, or value, is being increasingly debated. When comparing the clinical benefits these agents provide with cost, the perception of value is highly subjective and can change significantly based on who is paying the bill.
Questioning High-Cost Drugs
Charles Moertel and colleagues published a landmark trial 25 years ago, which reported that treatment with fluorouracil and levamisole for 1 year decreased the death rate of patients with stage C (stage III) colon cancer by 33% following curative surgery.7 Although this trial was clinically significant, there was as much discussion about the high cost of levamisole (Ergamisol) tablets as there
was about its clinical benefit for patients.
In a 1991 letter to the New England Journal of Medicine, Rossof and colleagues questioned the high cost of the levamisole in the treatment regimen.8 Rossof and colleagues were surprised at the drug’s price on approval, about $5 for each tablet, and detailed their concerns on how this price was determined. “On the basis of the cost to a veterinarian, the calculated cost of a hypothetical 50-mg tablet should be in the range of 3 to 6 cents,” they argued. The total cost to the patient of 1 year of treament was nearly $1,200. Their conclusion was that “…the price chosen for the new American consumer is far too high and requires justification by the manufacturer.”
A reply from Janssen Pharmaceutica, the drug’s manufacturer, offered many justifications for the price.8 According to the company, Ergamisol was supplied free to 5,000 research patients prior to FDA approval. It was also given for free to indigent patients. The company also insisted that its pricing compared favorably with its competitors, such as zidovudine, octreotide, newer generation nonsteroidal anti-inflammatories, and antihypertension drugs. “Drug pricing includes additional expensive research, physician education, compassionate use programs, and ensuring high-quality control. Janssen scientists studied immunomodulating effect of Ergamisol for 25 years with no financial return. Drug development is high-risk, so companies must be able to derive a reasonable return on sales.”8
The cost of levamisole was $1,200 per year in 1991, and after adjustment for inflation would cost about $1,988 in 2015, or $166 per month. If these prices caused outrage in 1990, it is easy to see how current prices of well over $10,000 per month for therapies, which often render small clinical benefits, can seem outrageous by comparison.
Public Debate Over Cancer Drug Prices
In the U.S., about 1.66 million patients will be diagnosed with cancer in 2015.9 Although about 30% to 40% of these patients will be effectively cured, only 3% to 4% will be cured using pharmacotherapy (usually traditional chemotherapy) as a sole modality. Therefore, the use of oncology drugs by the vast majority of cancer patients is not to cure but to control or palliate patients with advanced cancer. It is important to note that the cost of most curative regimens is cheap compared with many medications used for advanced disease. Until a few years ago, discussion of the high costs of cancer treatment was rarely made public due to the devastating nature of cancer. However, with the rapid price increases and relatively disappointing clinical benefits of the many new drugs entering the market, the question of value can no longer be ignored. Many authors havepresented commentaries and strategies addressing the issues
surrounding the high cost of cancer drugs.10-15
It was a groundbreaking 2012 letter to the New York Times that brought the issue to public attention.16 Dr. Peter Bach and his colleagues at Memorial Sloan Kettering Cancer Center announced they would not purchase a “phenomenally expensive new cancer drug” for their patients, calling their decision a no-brainer. The drug, ziv-afilbercept (Zaltrap), was twice the price of a similar drug, bevacizumab (Avastin), but was no more efficacious in the treatment of metastatic colorectal cancer. Bach and colleagues went on to say how high drug prices are having a potentially devastating financial impact on patients and that laws protect drug manufacturers to set drug prices at what they feel the market will bear.
Considering the value of cancer treatments is now actively encouraged. To that point, the American Society of Clinical Oncology (ASCO) has recently published a groundbreaking paper entitled “A Conceptual Framework to Assess the Value of Cancer Treatment Options.”17 This tool, which is still in development, will allow oncologists to quantify clinical benefit, toxicity, and out-of-pocket drug costs so patients can compare treatment options with cost as a consideration.
The financial burden put on patients has become the driving force for drug cost reform. In an attempt to control their costs, third-party payers have increased the cost burden for patients by demanding larger copays and other out-of-pocket expenses for medications. It is felt that requiring patients to have more “skin in the game” would force them to make treatment decisions based on cost. Unfortunately, this approach may lead to devastating financial consequences for patients.18-20 The overwhelming emotions patients experience following the diagnosis of cancer make it difficult to focus on the financial impact of treatment recommendations. In addition, many oncologists are not comfortable, or even capable, of discussing costs so patients can make financially informed treatment decisions.14 Unfortunately for patients, “shopping for health care” has very little in common with shopping for a car, television sets, or any other commodity.
The VA Health Care System
The VA is government-sponsored health care and is therefore unique in the U.S. health care environment. The VA might be considered a form of “socialized medicine” that operates under a different economic model than do private health care systems. The treatment of VA patients for common diseases is based on nationally accepted evidence-based guidelines, which allow the best care in a cost-effective manner. For the treatment of cancer, the use of expensive therapies must be made in the context of the finite resources allocated for the treatment of all veterans within the system.
The VA provides lifelong free or minimal cost health care to eligible veterans. For veterans receiving care within the VA, out-of-pocket expenses are considerably less than for non-VA patients. Current medication copays range from free to $9 per month for all medications, regardless of acquisition cost. This is in stark contrast to the private sector, where patients must often pay large, percentage- based copays for oncology medications, which can reach several thousand dollars per month. VA patients are not subject to percentage-based copays; therefore, they are not a financial stakeholder in the treatment
decision process.
Prior to 1995, the VA was a much criticized and poorly performing health care system that had experienced significant budget cuts, forcing many veterans to lose their benefits and seek care outside the VA. Beginning in 1995 with the creation of PBM, a remarkable transformation occurred that modernized and transformed the VA into a system that consistently outperforms the private sector in quality of care, patient safety, and patient satisfaction while maintaining low overall costs. The role of the VA PBM was to develop and maintain the National Drug Formulary, create clinical guidance documents, and manage drug costs and use.
Part 2 of this article will more closely examine the high cost of cancer drugs. It will also discuss the role of VA PBM and other VA efforts to control cost
Author disclosures
The author reports no actual or potential conflicts of interest with regard to this article.
Disclaimer
The opinions expressed herein are those of the author and do not necessarily reflect those of Federal Practitioner, Frontline Medical Communications Inc., the U.S. Government, or any of its agencies. This article may discuss unlabeled or investigational use of certain drugs. Please review the complete prescribing information for specific drugs or drug combinations—including indications, contraindications, warnings, and adverse effects—before administering pharmacologic therapy to patients.
Click here for the digital edition.
1. Centers for Medicare and Medicaid. National health expenditure projections 2014-2024 Table 01. Centers for Medicare and Medicaid Website. https://www.cms.gov/research-statistics-data-and-systems/statistics-trends-and-reports/nationalhealthexpenddata/nationalhealthaccountsprojected.html. Updated July 30, 2015. Accessed January 11, 2016.
2. Bach PB. Limits of Medicare’s ability to control rising spending on cancer drugs. N Engl J Med. 2009;360(6):626-633.
3. Mariotto AB, Yabroff KR, Shao Y, Feuer EJ, Brown ML. Projections of the cost of cancer in the United States: 2010-2020. J Natl Cancer Inst. 2011;103(2):117-128.
4. Himmelstein DU, Thorne D, Warren E, Woolhandler S. Medical bankruptcy in the United States, 2007: results of a national study. Am J Med. 2009;122(8):741-746.
5. The Henry J. Kaiser Family Foundation. Prescription drug costs remain atop the public’s national health care agenda, well ahead of Affordable Care Act revisions and repeal [press release]. Kaiser Family Foundation Website. http://kff.org/health-costs/press-release/prescription-drug-costs-remain-atop-the-publics-national-health-care-agenda-well-ahead-of-affordable-care-act-revisions-and-repeal. Published October 28, 2015. Accessed January 11, 2016.
6. National Cancer Institute (NCI). NCI dictionary of cancer terms: targeted therapy. National Cancer Institute Website. http://www.cancer.gov/publications/dictionaries/cancer-terms?cdrid=270742. Accessed January 11, 2016.
7. Moertel CG, Fleming TR, Macdonald JS, et al. Levamisole and fluorouracil for adjuvant therapy resected colon carcinoma. N Engl J Med. 1990;322(6):352-358.
8. Rossof AH, Philpot TR, Bunch RS, Letcher J. The high cost of levamisole for humans. N Engl J Med. 1991;324(10):701-702.
9. Siegel RL, Miller KD, Jemal A. Cancer statistics, 2015. CA Cancer J Clin. 2015;65(1):5-29.
10. Nadler E, Eckert B, Neumann PJ. Do oncologists believe new cancer drugs offer good value? Oncologist. 2006;11(2):90-95.
11. Hillner BE, Smith TJ. Efficacy does not necessarily translate into cost effectiveness: a case study of the challenges associated with 21st century cancer drug pricing. J Clin Oncol. 2009;27(13):2111-2113.
12. Neumann PJ, Weinstein MC. Legislating against use of cost-effectiveness information. N Engl J Med. 2010;363(16):1495-1497.
13. Elkin EB, Bach PB. Cancer’s next frontier: addressing high and increasing costs. JAMA. 2010;303(11):1086-1087.
14. Smith TJ, Hillner BE. Bending the cost curve in cancer care. N Engl J Med. 2011;364(21):2060-2065.
15. Siddiqui M, Rajkumar SV. The high cost of cancer drugs and what we can do
about it. Mayo Clin Proc. 2012;87(10):935-943.
16. Bach PB, Saltz LB, Wittes RE. In cancer care, cost matters [op-ed]. New York Times. October 14, 2012.
17. Schnipper LE, Davidson NE, Wollins DS, et al; American Society of Clinical Oncology. American Society of Clinical Oncology statement: a conceptual framework to assess the value of cancer treatment options. J Clin Oncol. 2015;33(23): 2563-2577.
18. Zafar SY, Peppercorn JM, Schrag D, et al. The financial toxicity of cancer treatment: a pilot study assessing out-of-pocket expenses and the insured cancer patient’s experience. Oncologist. 2013;18(4):381-390.
19. Fenn KM, Evans SB, McCorkle R, et al. Impact of financial burden of cancer on
survivors’ quality of life. J Oncol Prac. 2014;10(5):332-338.
20. Zafar SY, McNeil RB, Thomas CM, Lathan CS, Ayanian JZ, Provenzale D. Population-based assessment of cancer survivors’ financial burden and quality of life: a prospective cohort study. J Oncol Pract. 2015;11(2):145-150.
Note: Page numbers differ between the print issue and digital edition.