User login
Distal Radius Fractures: Reconstruction Approaches, Planning, and Principles
Take-Home Points
- Restore proper anatomic parameters; compare to the other side.
- Don't forget about the DRU joint.
- CT can aide in identifying subtle articular depression and severe comminution to change operative management.
- Remember, there still is a role for external fixators; an alternative remains an internal spanning plate.
- Respect the soft tissues, which can aide in reduction, however don't leave the operating room without feeling confident about your fixation.
Distal radius fracture (DRF), a common fracture, accounts for almost one sixth of all emergency department visits.1 With the advent of emerging technologies and refined technique, treatment options for DRFs have evolved. Although controversy remains regarding nonoperative vs operative treatment of DRFs in the elderly,2,3 select situations (open injuries, complex high-energy injuries, young age) warrant definitive fixation. Previously, internal fixation options were limited. Current technologies include locked fixed-angle plating, fragment-specific fixation, and locked variable-angle plating. These modalities aid in achieving and maintaining more anatomical fixation. This article summarizes tips, tricks, and planning for definitive external and internal fixation of complex DRFs.
Anatomical Considerations and Classification
The wrist joint, part of the complex articular network that begins at the forearm and ends at the distal interphalangeal joint, is the foundation for fine- and gross-motor skills. Understanding the anatomy of this network can provide a valuable roadmap for operative reconstruction.
At the wrist level, the radius bears most of the weight-bearing, and in some studies exhibits up to 80% of the load.1,4 The triangular distal radius bears this weight through a biconcave articular surface with facets for the lunate and scaphoid separated by an anteroposterior ridge.5-7 The radius also articulates with the ulnar head at the sigmoid notch to form the distal radioulnar (DRU) joint. Restoring the relationships of the DRU joint, the triangular fibrocartilage complex, and the ulnar variance is of paramount importance.1,8,9
Classical teaching calls for restoration of radial inclination to about 23°, volar tilt to 11° to 12°, and radial length to about 11 mm. Especially regarding volar tilt and radial length, however, cadaveric and clinical studies have found more variance, leading to use of the contralateral extremity as an operative template, particularly when closed reduction thought to be adequate deviates significantly from these parameters.1,4,7
DRF classification based on these principles has led to abundant representation in the literature.10-13 Many authors have focused on fracture lines, comminution degree, articular surface violation, and other anatomical or radiographic characteristics of DRF classification and operative fixation approach.10-13 In 2001, Fernandez9 proposed a classification system focused on energy or mechanism of injury. In comparisons,14 the Fernandez system had the highest interobserver reliability—higher than that of AO (Arbeitsgemeinschaft für Osteosynthesefragen).
Considerations for Operative Treatment: Column Theory
In the restoration of anatomical alignment in complex DRFs, it is important to consider the 3 joints and the 3 columns—radial, intermediate, and ulnar (Figure 1). [[{"fid":"201864","view_mode":"medstat_image_flush_left","attributes":{"class":"media-element file-medstat-image-flush-left","data-delta":"1"},"fields":{"format":"medstat_image_flush_left","field_file_image_caption[und][0][value]":"Figure 1.","field_file_image_credit[und][0][value]":"","field_file_image_caption[und][0][format]":"plain_text","field_file_image_credit[und][0][format]":"plain_text"},"type":"media","field_deltas":{"1":{"format":"medstat_image_flush_left","field_file_image_caption[und][0][value]":"Figure 1.","field_file_image_credit[und][0][value]":""}}}]]In addition, parallels between the distal radius and the tibial plateau can be considered because of similarities in operative goals. Restoration of mechanical axis, length, alignment, rotation, and articular surfaces is paramount.15 Considering multiple surgical approaches to address "bicolumnar injuries" and reconstructing the "simpler" columnar injury first are common principles.16
The goals of fracture fixation at the wrist are the same as at any other joint: anatomical reduction, stable fixation, and early range of motion (ROM). Column restoration can result in consistent achievement of those goals. Intuitively, there is a close correlation between anatomical alignment and functional results.17 Rebuilding the structural foundation of the columns with respect to buttressing and restoring the 3 radial articulations with the ulna, scaphoid, and lunate can consistently yield restoration of length, inclination, and tilt (Figure 2). [[{"fid":"201865","view_mode":"medstat_image_flush_right","attributes":{"class":"media-element file-medstat-image-flush-right","data-delta":"2"},"fields":{"format":"medstat_image_flush_right","field_file_image_caption[und][0][value]":"Figure 2.","field_file_image_credit[und][0][value]":"","field_file_image_caption[und][0][format]":"plain_text","field_file_image_credit[und][0][format]":"plain_text"},"type":"media","field_deltas":{"2":{"format":"medstat_image_flush_right","field_file_image_caption[und][0][value]":"Figure 2.","field_file_image_credit[und][0][value]":""}}}]]Next, we discuss the options available and how to use each to an advantage, individually or in hybrid constructs.
External Fixation: Is There Still a Role?
In the setting of highly comminuted, complex fractures, external fixation with Kirschner wires (K-wires) is a reasonable choice, with restoration of motion and strength within 75% to 80% of the uninjured wrist.18 In a 2-year study of 113 patients with comminuted metaphyseal DRFs randomly assigned to either external fixation or casting, Kreder and colleagues19 found a trend toward better clinical, functional, and radiographic outcomes with external fixation with or without K-wire fixation. There was improved restoration of radial length and palmar tilt with external fixation. A study of unstable DRF in patients with osteoporosis found that redisplacement was more common after treatment with a cast than after treatment with an external fixator.20 Although closed reduction and casting continue to have a role in the treatment of DRF, Kreder and colleagues19 found that remanipulation was necessary in at least 9% of cases. According to a meta-analysis21 of the literature on DRF treatment, 4 articles directly address the question of the superiority of external fixation over closed reduction and casting, and 3 of the 4 found more favorable radiographic and functional outcomes with external fixation.
External fixation is useful in treating complex DRFs with metaphyseal comminution. It can also be effective in the presence of simple articular involvement without depression of the joint surface. External fixation devices can span areas of soft-
tissue injury and are useful as manipulation tools in achieving anatomical reduction. Although external fixation is effective, its complications include pin-tract infection, nerve injury, loss of reduction, and loss of digital ROM. In a meta-analysis, Li-hai and colleagues22 found that external fixators had a complication rate of 30.9%. With this technique, it is important to avoid midcarpal distraction, excessive ulnar deviation, and excessive palmar flexion. Papadonikolakis and colleagues23 found that distraction of as little as 2 mm to 5 mm significantly affected the function of the flexor digitorum superficialis at the metacarpophalangeal joint. Over-distraction in wrist flexion can lead to lengthening of the extensor tendons and loss of full digital ROM. Excessive flexion and ulnar deviation can lead to median nerve compression and associated symptoms, as well as poor extensor and radial tendon length. In addition, prolonged distraction in excessive flexion combined with swelling and inflammation during fracture healing causes digital stiffness and contracture.23 Biomechanical studies have found that proximal pin placement in the radius, along with distal pin fixation in 6 metacarpal cortices through the second and third metacarpals, helps provide the strongest fixation.24
As for technique, pins are placed in the second metacarpal and radial shaft. With respect to the radius, the incision is made just proximal to the edge of the abductor pollicis longus muscle in the "bare area." Ideal pin placement is between the extensor carpi radialis longus and the extensor carpi radialis brevis, with care taken to avoid the radial sensory nerve, which lies between the extensor carpi radialis longus and the brachialis and emerges 9 cm proximal to the radial styloid.25 Next, a 2.5-cm to 3-cm incision is made over the palpable edge of the index metacarpal near the base. During drilling, the guide is placed at intersecting 45° angles, and the distal pin is placed 2 cm to 3 cm from the proximal pin. The proximal metacarpal pin is placed at the base of the metacarpal. The second metacarpal pin can also be placed first, with the external fixator used to judge proximal placement of the radial pin within the bare area.
Various supplements to external fixation have positive outcomes. Wolfe and colleagues18 found that using K-wires with the external fixation construct added stability in flexion/extension, radial/ulnar deviation, and rotational motion. They noted that fixation stability may depend more on the augmentation to fixation than on the external fixator itself. In a prospective, randomized trial, Moroni and colleagues26,27 found that, compared with standard pins, hydroxyapatite-coated pins had higher extraction torque, which was associated with improved fixation. When combined with external fixation, calcium phosphate cement also provided additional stability, allowing the bone filler to help maintain articular reduction and cortical continuity.28,29
External fixation has its disadvantages and complications. It can be bulky, and theoretically it contributes to higher rates of stiffness in the wrist and fingers.30-32 Higher rates of pin-site infection have been reported, along with hardware failure and associated loss of reduction, in patients treated with external fixation (Figures 3A-3C).31-33[[{"fid":"201866","view_mode":"medstat_image_flush_left","attributes":{"class":"media-element file-medstat-image-flush-left","data-delta":"3"},"fields":{"format":"medstat_image_flush_left","field_file_image_caption[und][0][value]":"Figure 3.","field_file_image_credit[und][0][value]":"","field_file_image_caption[und][0][format]":"plain_text","field_file_image_credit[und][0][format]":"plain_text"},"type":"media","field_deltas":{"3":{"format":"medstat_image_flush_left","field_file_image_caption[und][0][value]":"Figure 3.","field_file_image_credit[und][0][value]":""}}}]]In addition, joint overdistraction can adversely affect the length-tension curve and contribute to potential reflex sympathetic dystrophy, which can be devastating (Figures 4A, 4B).1,21,31,33 Despite these complications, external fixation remains a powerful tool in the treatment of high-energy DRFs. [[{"fid":"201867","view_mode":"medstat_image_flush_right","attributes":{"class":"media-element file-medstat-image-flush-right","data-delta":"4"},"fields":{"format":"medstat_image_flush_right","field_file_image_caption[und][0][value]":"Figure 4.","field_file_image_credit[und][0][value]":"","field_file_image_caption[und][0][format]":"plain_text","field_file_image_credit[und][0][format]":"plain_text"},"type":"media","field_deltas":{"4":{"format":"medstat_image_flush_right","field_file_image_caption[und][0][value]":"Figure 4.","field_file_image_credit[und][0][value]":""}}}]]In many cases, authors who compared open reduction and internal fixation (ORIF) with external fixation found no significant differences in outcome scores or function.31-34 In a meta-analysis of 917 patients, Margaliot and colleagues33 found no differences in pain, grip strength, wrist ROM, or radiographic parameters. More recently, in prospective randomized trials, both Egol and colleagues31 and Grewal and colleagues34 compared hybrid external fixation with ORIF, and, though early outcomes favored ORIF, 1-year follow-up comparisons were even, and there were no significant differences. These consistently reproducible results reaffirm keeping external fixation in the orthopedic toolbox.
Definitive Reconstruction With ORIF
Early nonlocked dorsal plating options for DRF fixation had unacceptable rates of plate failure, poor cosmesis, and extensor tendon complications.17,35-37 Subsequent technologic advances—multiple approaches, lower profile plating, and rigid, fragment-specific fixation—have allowed even the most complex fracture patterns to be addressed (Table). In malunited fractures, bone graft may not be required if the fracture is extra-articular and treated with a volar locking plate. [[{"fid":"201868","view_mode":"medstat_image_flush_left","attributes":{"class":"media-element file-medstat-image-flush-left","data-delta":"5"},"fields":{"format":"medstat_image_flush_left","field_file_image_caption[und][0][value]":"Table.","field_file_image_credit[und][0][value]":"","field_file_image_caption[und][0][format]":"plain_text","field_file_image_credit[und][0][format]":"plain_text"},"type":"media","field_deltas":{"5":{"format":"medstat_image_flush_left","field_file_image_caption[und][0][value]":"Table.","field_file_image_credit[und][0][value]":""}}}]]Other options include corticocancellous autograft from the iliac crest, hydroxyapatite synthetic grafts, and osteoconductive bone graft substitutes, such as bone morphogenic proteins. In addition, healing times are similar in cases, regardless of whether a graft was used.38
Involvement of the radial and intermediate columns should be addressed first. Although some may prefer a single volar plate, others may use fragment-specific fixation to buttress a comminuted radial styloid (in orthogonal fashion) and/or a dorsal ulnar fragment to restore the intermediate column and thereby fully restore the radial articular surface.39,40 Typically, restoring the radial and intermediate columns for radial articular reduction subsequently and simultaneously restores the majority of radial height and length. After the radial and intermediate columns are reduced and stabilized, the need for ulna column fixation can be determined. Important factors in ulna column restoration are severe osteoporosis and ulna head and/or neck comminution. Significant comminution throughout the metaphysis of both the radius and the ulna may also warrant stabilizing the ulna with internal fixation. Finally, any DRU joint instability noted on examination should also favor fixing the ulnar side.
Assessment of the distal ulna in these complex fractures goes beyond the involvement of an ulnar styloid fracture. Typically, fractures at the base of the ulnar styloid have been reported to have little clinical relevance, including a low incidence of associated DRU joint problems.41-43 Decisions to address the ulnar column are largely swayed by any instability found on DRU joint testing, as laxity caused by severe comminution can dictate the need for distal ring fixation to provide support. Even in the presence of a high-energy fracture in severely osteoporotic bone, the argument can be made to prevent instability by supporting the ulnar column. Stabilization of the ulnar articular surface can also be made more facile by creating an easier "A" fracture pattern (per AO classification) from a complex "C" to further aid in achieving efficient anatomical reduction. After preoperative planning is completed, depending on which columns need to be addressed, several surgical approaches can be considered to achieve maximum exposure and soft-tissue mobilization in order to successfully complete the operative fixation goals.
Volar Approach
An approach is selected for ideal exposure of a facile environment for definitive fixation. Access to the radial column can be gained with the extended flexor carpi radialis (FCR) approach. This approach allows visualization and removal of the appropriate deforming forces on the radial column to allow for fracture reduction by "opening the book," similar to that of tibial plateau reconstruction.44,45 It may be prudent to perform a preincision Allen test as well as a preoperative DRU joint examination for comparison after ORIF is complete. Compared with the classic Henry approach near the distal radius, going through the volar sheath of the FCR avoids many of the perforating radial artery branches. Avoiding stripping the radial artery of its surrounding fat and lymphatics prevents postoperative "cold intolerance." Retracting the FCR ulnarly and then incising the dorsal FCR sheath provide ready access to the pronator quadratus after collective ulnar mobilization of both the FCR and the flexor pollicis longus.44 In addition, for work near the distal FCR sheath, care must be taken to avoid the branch of the palmar cutaneous nerve that emerges about 5 cm proximal to the wrist flexion crease.46
Once at the level of the pronator quadratus, an "L-shape" incision can be made to reflect the muscle off the radius. Care must be taken when working too distal to avoid transection of the inserting volar wrist ligaments.44 Leaving a cuff for repair of the pronator remains controversial. In a recent case-control series, however, Hershman and colleagues47 did not find significant differences in function or complication rate in patients with and without repair. After reflection, adequate exposure of the radial column should be achieved. Ready access to the radial styloid for orthogonal plating can be obtained by releasing the brachioradialis, which simultaneously releases one of the primary fracture deforming forces.44 With this incision and exposure, if needed, dorsal bone grafting can be achieved from the volar side; however, care must be taken to protect the first dorsal compartment.48 The cutaneous branch of the median nerve may be at risk with this exposure, but avoiding dissection ulnar to the FCR tendon can help to reduce this risk.49
Before surgery, if the fracture pattern dictates a more ulnar approach, we prefer the extended carpal tunnel approach. Using the plane between the palmaris longus and the flexor digitorum superficialis medially and the FCR laterally, the extended carpal tunnel approach provides an obvious release of the flexor retinaculum but, more important, allows for extensile access to the sigmoid notch, the DRU joint, and the ulnar column.
Dorsal Approach
The dorsal approach is necessary in a few select cases. With a focus on fragment-specific fixation, presence of a significant dorsal ulnar fragment should warrant a dorsal approach.50 In addition, in select, rare cases in which volar access is limited or unavailable, dorsal access is the only option.50 Finally, if direct articular visualization is required, the dorsal approach typically is favored as the stronger radiocarpal ligaments found on the volar side are maintained.
Access should begin with an incision centered over the dorsal distal radius; a safe access point is just ulnar to the Lister tubercle. On incision of the retinaculum through a full-thickness excision, the third dorsal compartment is opened and the extensor pollicis longus (EPL) mobilized, fully exposing the dorsal distal radius. Work can be performed on either side of the EPL between the second and fourth dorsal compartments. Exposure typically is not an issue because of the pliable soft tissue of the dorsum, with ready access from styloid to styloid.44 Here, low-profile plates and/or mini-fragment-specific plate options should be used to minimize potential tendon damage.51 Care must also be taken to avoid damaging the radiocarpal or scapholunate ligaments.49 On closure, the retinaculum is repaired primarily; however, though some proponents advocate relocating the EPL tendon into its groove, we prefer leaving the EPL free within the surrounding soft tissue to reduce tension and promote unhindered excursion. The dorsal approach, though controversial and used inconsistently, should remain an important tool in anatomical restoration, especially in cases of complex fracture patterns.
Conclusion
Controversy still marks the lack of consensus on deciding which DRF treatment is optimal. Some investigators question moving away from external fixation and cite the lack of significantly better data relative to ORIF.21,52 The same proponents note that the only advantage over external fixation is earlier return to function and cite reports of tendon rupture and complications with both dorsal and volar fixation options.34,53-58 Other investigators find that operative treatment generally does not provide a significant improvement over nonoperative treatment.59
With the advent of lower profile locked plating, fragment-specific fixation, and variable-angle devices, comparative clinical trials are finding it difficult to keep up.60-64 Results from ongoing prospective randomized trials like ORCHID (Open Reduction and Internal Fixation Versus Casting for Highly Comminuted Intra-Articular Fractures of the Distal Radius; 500 patients >65 years old, 15 centers) will provide more definitive answers about ideal treatment.65
Anatomical restoration involves a versatile array of fragment fixation and reconstruction. Careful preoperative planning and a consistent approach to restoring the radial, intermediate, and ulnar columns, along with a proper surgical approach, are ideal. Many advances in internal fixation have been exceedingly helpful. Use of external fixation, especially in a bridging fashion with or without supplementation, is still valuable in many situations.
1. Liporace FA, Adams MR, Capo JT, Koval KJ. Distal radius fractures. J Orthop Trauma. 2009;23(10):739-748.
2. Lee YS, Wei TY, Cheng YC, Hsu TL, Huang CR. A comparative study of Colles’ fractures in patients between fifty and seventy years of age: percutaneous K-wiring versus volar locking plating. Int Orthop. 2012;36(4):789-794.
3. Diaz-Garcia RJ, Oda T, Shauver MJ, Chung KC. A systematic review of outcomes and complications of treating unstable distal radius fractures in the elderly. J Hand Surg Am. 2011;36(5):824-835.e2.
4. Ring D. Treatment of the neglected distal radius fracture. Clin Orthop Relat Res. 2005;(431):85-92.
5. Berger RA. Arthroscopic anatomy of the wrist and distal radioulnar joint. Hand Clin. 1999;15(3):393-413, vii.
6. Berger RA. The anatomy of the ligaments of the wrist and distal radioulnar joints. Clin Orthop Relat Res. 2001;(383):32-40.
7. McCann PA, Clarke D, Amirfeyz R, Bhatia R. The cadaveric anatomy of the distal radius: implications for the use of volar plates. Ann R Coll Surg Engl. 2012;94(2):116-120.
8. Ekenstam F. Osseous anatomy and articular relationships about the distal ulna. Hand Clin. 1998;14(2):161-164.
9. Fernandez DL. Distal radius fracture: the rationale of a classification. Chir Main. 2001;20(6):411-425.
10. Raskin KB, Melone CP Jr. Unstable articular fractures of the distal radius. Comparative techniques of ligamentotaxis. Orthop Clin North Am. 1993;24(2):275-286.
11. Melone CP Jr. Distal radius fractures: patterns of articular fragmentation. Orthop Clin North Am. 1993;24(2):239-253.
12. Jenkins NH. The unstable Colles’ fracture. J Hand Surg Br. 1989;14(2):149-154.
13. Cooney WP, Dobyns JH, Linscheid RL. Arthroscopy of the wrist: anatomy and classification of carpal instability. Arthroscopy. 1990;6(2):133-140.
14. Kural C, Sungur I, Kaya I, Ugras A, Ertürk A, Cetinus E. Evaluation of the reliability of classification systems used for distal radius fractures. Orthopedics. 2010;33(11):801.
15. Lipton HA, Wollstein R. Operative treatment of intraarticular distal radial fractures. Clin Orthop Relat Res. 1996;(327):110-124.
16. Wolfe SW. Distal radius fractures. Green’s Operative Hand Surgery. 6th ed. Philadelphia, PA: Churchill Livingstone; 2011:561-638.
17. Rikli DA, Regazzoni P. Fractures of the distal end of the radius treated by internal fixation and early function. A preliminary report of 20 cases. J Bone Joint Surg Br. 1996;78(4):
588-592.
18. Wolfe SW, Austin G, Lorenze M, Swigart CR, Panjabi MM. A biomechanical comparison of different wrist external fixators with and without K-wire augmentation. J Hand Surg Am. 1999;24(3):516-524.
19. Kreder HJ, Agel J, McKee MD, Schemitsch EH, Stephen D, Hanel DP. A randomized, controlled trial of distal radius fractures with metaphyseal displacement but without joint incongruity: closed reduction and casting versus closed reduction, spanning external fixation, and optional percutaneous K-wires. J Orthop Trauma. 2006;20(2):115-121.
20. Moroni A, Vannini F, Faldini C, Pegreffi F, Giannini S. Cast vs external fixation: a comparative study in elderly osteoporotic distal radial fracture patients. Scand J Surg. 2004;93(1):64-67.
21. Paksima N, Panchal A, Posner MA, Green SM, Mehiman CT, Hiebert R. A meta-analysis of the literature on distal radius fractures: review of 615 articles. Bull Hosp Jt Dis. 2004;62(1-2):40-46.
22. Li-hai Z, Ya-nan W, Zhi M, et al. Volar locking plate versus external fixation for the treatment of unstable distal radial fractures: a meta-analysis of randomized controlled trials.
J Surg Res. 2015;193(1):324-333.
23. Papadonikolakis A, Shen J, Garrett JP, Davis SM, Ruch DS. The effect of increasing distraction on digital motion after external fixation of the wrist. J Hand Surg Am. 2005;30(4):
773-779.
24. Seitz WH Jr, Froimson AI, Brooks DB, et al. Biomechanical analysis of pin placement and pin size for external fixation of distal radius fractures. Clin Orthop Relat Res. 1990;(251):
207-212.
25. Beldner S, Zlotolow DA, Melone CP Jr, Agnes AM, Jones MH. Anatomy of the lateral antebrachial cutaneous and superficial radial nerves in the forearm: a cadaveric and clinical study. J Hand Surg Am. 2005;30(6):1226-1230.
26. Moroni A, Faldini C, Marchetti S, Manca M, Consoli V, Giannini S. Improvement of the bone-pin interface strength in osteoporotic bone with use of hydroxyapatite-coated tapered external-fixation pins. A prospective, randomized clinical study of wrist fractures. J Bone Joint Surg Am. 2001;83(5):717-721.
27. Moroni A, Heikkila J, Magyar G, Toksvig-Larsen S, Giannini S. Fixation strength and pin tract infection of hydroxyapatite-coated tapered pins. Clin Orthop Relat Res. 2001;(388):209-217.
28. Higgins TF, Dodds SD, Wolfe SW. A biomechanical analysis of fixation of intra-articular distal radial fractures with calcium-phosphate bone cement. J Bone Joint Surg Am. 2002;84(9):1579-1586.
29. Tobe M, Mizutani K, Tsubuku Y. Treatment of distal radius fracture with the use of calcium phosphate bone cement as a filler. Tech Hand Up Extrem Surg. 2004;8(2):95-101.
30. Capo JT, Rossy W, Henry P, Maurer RJ, Naidu S, Chen L.
External fixation of distal radius fractures: effect of distraction and duration. J Hand Surg Am. 2009;34(9):1605-1611.
31. Egol K, Walsh M, Tejwani N, McLaurin T, Wynn C, Paksima N. Bridging external fixation and supplementary Kirschner-wire fixation versus volar locked plating for unstable fractures of the distal radius: a randomised, prospective trial. J Bone Joint Surg Br. 2008;90(9):1214-1221.
32. Egol KA, Paksima N, Puopolo S, Klugman J, Hiebert R, Koval KJ. Treatment of external fixation pins about the wrist: a prospective, randomized trial. J Bone Joint Surg Am. 2006;88(2):349-354.
33. Margaliot Z, Haase SC, Kotsis SV, Kim HM, Chung KC. A meta-analysis of outcomes of external fixation versus plate osteosynthesis for unstable distal radius fractures. J Hand Surg Am. 2005;30(6):1185-1199.
34. Grewal R, MacDermid JC, King GJ, Faber KJ. Open reduction internal fixation versus percutaneous pinning with external fixation of distal radius fractures: a prospective, randomized clinical trial. J Hand Surg Am. 2011;36(12):
1899-1906.
35. Axelrod TS, McMurtry RY. Open reduction and internal fixation of comminuted, intraarticular fractures of the distal radius. J Hand Surg Am. 1990;15(1):1-11.
36. Hove LM, Nilsen PT, Furnes O, Oulie HE, Solheim E, Mölster AO. Open reduction and internal fixation of displaced intraarticular fractures of the distal radius. 31 patients followed for 3-7 years. Acta Orthop Scand. 1997;68(1):59-63.
37. Carter PR, Frederick HA, Laseter GF. Open reduction and internal fixation of unstable distal radius fractures with a low-profile plate: a multicenter study of 73 fractures. J Hand Surg Am. 1998;23(2):300-307.
38. Mugnai R, Tarallo L, Lancellotti E, et al. Corrective osteotomies of the radius: grafting or not? World J Orthop. 2016;7(2):128-135.
39. Tang P, Ding A, Uzumcugil A. Radial column and volar plating (RCVP) for distal radius fractures with a radial styloid component or severe comminution. Tech Hand Up Extrem Surg. 2010;14(3):143-149.
40. Helmerhorst GT, Kloen P. Orthogonal plating of intra-articular distal radius fractures with an associated radial column fracture via a single volar approach. Injury. 2012;43(8):1307-1312.
41. May MM, Lawton JN, Blazar PE. Ulnar styloid fractures associated with distal radius fractures: incidence and implications for distal radioulnar joint instability. J Hand Surg Am. 2002;27(6):965-971.
42. Souer JS, Ring D, Matschke S, Audige L, Marent-Huber M, Jupiter JB; AOCID Prospective ORIF Distal Radius Study Group. Effect of an unrepaired fracture of the ulnar styloid base on outcome after plate-and-screw fixation of a distal radial fracture. J Bone Joint Surg Am. 2009;91(4):830-838.
43. Noda K, Goto A, Murase T, Sugamoto K, Yoshikawa H, Moritomo H. Interosseous membrane of the forearm: an anatomical study of ligament attachment locations. J Hand Surg Am. 2009;34(3):415-422.
44. Catalano LW 3rd, Zlotolow DA, Hitchcock PB, Shah SN, Barron OA. Surgical exposures of the radius and ulna. J Am Acad Orthop Surg. 2011;19(7):430-438.
45. Orbay JL, Badia A, Indriago IR, et al. The extended flexor carpi radialis approach: a new perspective for the distal radius fracture. Tech Hand Up Extrem Surg. 2001;5(4):204-211.
46. Hobbs RA, Magnussen PA, Tonkin MA. Palmar cutaneous branch of the median nerve. J Hand Surg Am. 1990;15(1):38-43.
47. Hershman SH, Immerman I, Bechtel C, Lekic N, Paksima N, Egol KA. The effects of pronator quadratus repair on outcomes after volar plating of distal radius fractures. J Orthop Trauma. 2013;27(3):130-133.
48. Prommersberger KJ, Lanz UB. Corrective osteotomy of the distal radius through volar approach. Tech Hand Up Extrem Surg. 2004;8(2):70-77.
49. Ilyas AM. Surgical approaches to the distal radius. Hand (N Y). 2011;6(1):8-17.
50. Tavakolian JD, Jupiter JB. Dorsal plating for distal radius fractures. Hand Clin. 2005;21(3):341-346.
51. Yu YR, Makhni MC, Tabrizi S, Rozental TD, Mundanthanam G, Day CS. Complications of low-profile dorsal versus volar locking plates in the distal radius: a comparative study. J Hand Surg Am. 2011;36(7):1135-1141.
52. Mattila VM, Huttunen TT, Sillanpää P, Niemi S, Pihlajamäki H, Kannus P. Significant change in the surgical treatment of distal radius fractures: a nationwide study between 1998 and 2008 in Finland. J Trauma. 2011;71(4):939-942.
53. Wilcke MK, Abbaszadegan H, Adolphson PY. Wrist function recovers more rapidly after volar locked plating than after external fixation but the outcomes are similar after 1 year. Acta Orthop. 2011;82(1):76-81.
54. Ward CM, Kuhl TL, Adams BD. Early complications of volar plating of distal radius fractures and their relationship to surgeon experience. Hand (N Y). 2011;6(2):185-189.
55. Soong M, van Leerdam R, Guitton TG, Got C, Katarincic J, Ring D. Fracture of the distal radius: risk factors for complications after locked volar plate fixation. J Hand Surg Am. 2011;36(1):3-9.
56. Soong M, Earp BE, Bishop G, Leung A, Blazar P. Volar locking plate implant prominence and flexor tendon rupture. J Bone Joint Surg Am. 2011;93(4):328-335.
57. Jeudy J, Steiger V, Boyer P, Cronier P, Bizot P, Massin P. Treatment of complex fractures of the distal radius: a prospective randomised comparison of external fixation ‘versus’ locked volar plating. Injury. 2012;43(2):174-179.
58. Berglund LM, Messer TM. Complications of volar plate fixation for managing distal radius fractures. J Am Acad Orthop Surg. 2009;17(6):369-377.
59. Egol KA, Walsh M, Romo-Cardoso S, Dorsky S, Paksima N. Distal radial fractures in the elderly: operative compared with nonoperative treatment. J Bone Joint Surg Am. 2010;92(9):1851-1857.
60. Wall LB, Brodt MD, Silva MJ, Boyer MI, Calfee RP. The effects of screw length on stability of simulated osteoporotic distal radius fractures fixed with volar locking plates. J Hand Surg Am. 2012;37(3):446-453.
61. Dahl WJ, Nassab PF, Burgess KM, et al. Biomechanical properties of fixed-angle volar distal radius plates under dynamic loading. J Hand Surg Am. 2012;37(7):1381-1387.
62. Park JH, Hagopian J, Ilyas AM. Variable-angle locking screw volar plating of distal radius fractures. Hand Clin. 2010;26(3):373-380, vi.
63. Pensy RA, Brunton LM, Parks BG, Higgins JP, Chhabra AB. Single-incision extensile volar approach to the distal radius and concurrent carpal tunnel release: cadaveric study. J Hand Surg Am. 2010;35(2):217-222.
64. Klos K, Rausch S, Löffler M, et al. A biomechanical comparison of a biodegradable volar locked plate with two titanium volar locked plates in a distal radius fracture model. J Trauma. 2010;68(4):984-991.
65. Bartl C, Stengel D, Bruckner T, et al. Open reduction and internal fixation versus casting for highly comminuted and intra-articular fractures of the distal radius (ORCHID): protocol for a randomized clinical multi-center trial. Trials. 2011;12:84
Take-Home Points
- Restore proper anatomic parameters; compare to the other side.
- Don't forget about the DRU joint.
- CT can aide in identifying subtle articular depression and severe comminution to change operative management.
- Remember, there still is a role for external fixators; an alternative remains an internal spanning plate.
- Respect the soft tissues, which can aide in reduction, however don't leave the operating room without feeling confident about your fixation.
Distal radius fracture (DRF), a common fracture, accounts for almost one sixth of all emergency department visits.1 With the advent of emerging technologies and refined technique, treatment options for DRFs have evolved. Although controversy remains regarding nonoperative vs operative treatment of DRFs in the elderly,2,3 select situations (open injuries, complex high-energy injuries, young age) warrant definitive fixation. Previously, internal fixation options were limited. Current technologies include locked fixed-angle plating, fragment-specific fixation, and locked variable-angle plating. These modalities aid in achieving and maintaining more anatomical fixation. This article summarizes tips, tricks, and planning for definitive external and internal fixation of complex DRFs.
Anatomical Considerations and Classification
The wrist joint, part of the complex articular network that begins at the forearm and ends at the distal interphalangeal joint, is the foundation for fine- and gross-motor skills. Understanding the anatomy of this network can provide a valuable roadmap for operative reconstruction.
At the wrist level, the radius bears most of the weight-bearing, and in some studies exhibits up to 80% of the load.1,4 The triangular distal radius bears this weight through a biconcave articular surface with facets for the lunate and scaphoid separated by an anteroposterior ridge.5-7 The radius also articulates with the ulnar head at the sigmoid notch to form the distal radioulnar (DRU) joint. Restoring the relationships of the DRU joint, the triangular fibrocartilage complex, and the ulnar variance is of paramount importance.1,8,9
Classical teaching calls for restoration of radial inclination to about 23°, volar tilt to 11° to 12°, and radial length to about 11 mm. Especially regarding volar tilt and radial length, however, cadaveric and clinical studies have found more variance, leading to use of the contralateral extremity as an operative template, particularly when closed reduction thought to be adequate deviates significantly from these parameters.1,4,7
DRF classification based on these principles has led to abundant representation in the literature.10-13 Many authors have focused on fracture lines, comminution degree, articular surface violation, and other anatomical or radiographic characteristics of DRF classification and operative fixation approach.10-13 In 2001, Fernandez9 proposed a classification system focused on energy or mechanism of injury. In comparisons,14 the Fernandez system had the highest interobserver reliability—higher than that of AO (Arbeitsgemeinschaft für Osteosynthesefragen).
Considerations for Operative Treatment: Column Theory
In the restoration of anatomical alignment in complex DRFs, it is important to consider the 3 joints and the 3 columns—radial, intermediate, and ulnar (Figure 1). [[{"fid":"201864","view_mode":"medstat_image_flush_left","attributes":{"class":"media-element file-medstat-image-flush-left","data-delta":"1"},"fields":{"format":"medstat_image_flush_left","field_file_image_caption[und][0][value]":"Figure 1.","field_file_image_credit[und][0][value]":"","field_file_image_caption[und][0][format]":"plain_text","field_file_image_credit[und][0][format]":"plain_text"},"type":"media","field_deltas":{"1":{"format":"medstat_image_flush_left","field_file_image_caption[und][0][value]":"Figure 1.","field_file_image_credit[und][0][value]":""}}}]]In addition, parallels between the distal radius and the tibial plateau can be considered because of similarities in operative goals. Restoration of mechanical axis, length, alignment, rotation, and articular surfaces is paramount.15 Considering multiple surgical approaches to address "bicolumnar injuries" and reconstructing the "simpler" columnar injury first are common principles.16
The goals of fracture fixation at the wrist are the same as at any other joint: anatomical reduction, stable fixation, and early range of motion (ROM). Column restoration can result in consistent achievement of those goals. Intuitively, there is a close correlation between anatomical alignment and functional results.17 Rebuilding the structural foundation of the columns with respect to buttressing and restoring the 3 radial articulations with the ulna, scaphoid, and lunate can consistently yield restoration of length, inclination, and tilt (Figure 2). [[{"fid":"201865","view_mode":"medstat_image_flush_right","attributes":{"class":"media-element file-medstat-image-flush-right","data-delta":"2"},"fields":{"format":"medstat_image_flush_right","field_file_image_caption[und][0][value]":"Figure 2.","field_file_image_credit[und][0][value]":"","field_file_image_caption[und][0][format]":"plain_text","field_file_image_credit[und][0][format]":"plain_text"},"type":"media","field_deltas":{"2":{"format":"medstat_image_flush_right","field_file_image_caption[und][0][value]":"Figure 2.","field_file_image_credit[und][0][value]":""}}}]]Next, we discuss the options available and how to use each to an advantage, individually or in hybrid constructs.
External Fixation: Is There Still a Role?
In the setting of highly comminuted, complex fractures, external fixation with Kirschner wires (K-wires) is a reasonable choice, with restoration of motion and strength within 75% to 80% of the uninjured wrist.18 In a 2-year study of 113 patients with comminuted metaphyseal DRFs randomly assigned to either external fixation or casting, Kreder and colleagues19 found a trend toward better clinical, functional, and radiographic outcomes with external fixation with or without K-wire fixation. There was improved restoration of radial length and palmar tilt with external fixation. A study of unstable DRF in patients with osteoporosis found that redisplacement was more common after treatment with a cast than after treatment with an external fixator.20 Although closed reduction and casting continue to have a role in the treatment of DRF, Kreder and colleagues19 found that remanipulation was necessary in at least 9% of cases. According to a meta-analysis21 of the literature on DRF treatment, 4 articles directly address the question of the superiority of external fixation over closed reduction and casting, and 3 of the 4 found more favorable radiographic and functional outcomes with external fixation.
External fixation is useful in treating complex DRFs with metaphyseal comminution. It can also be effective in the presence of simple articular involvement without depression of the joint surface. External fixation devices can span areas of soft-
tissue injury and are useful as manipulation tools in achieving anatomical reduction. Although external fixation is effective, its complications include pin-tract infection, nerve injury, loss of reduction, and loss of digital ROM. In a meta-analysis, Li-hai and colleagues22 found that external fixators had a complication rate of 30.9%. With this technique, it is important to avoid midcarpal distraction, excessive ulnar deviation, and excessive palmar flexion. Papadonikolakis and colleagues23 found that distraction of as little as 2 mm to 5 mm significantly affected the function of the flexor digitorum superficialis at the metacarpophalangeal joint. Over-distraction in wrist flexion can lead to lengthening of the extensor tendons and loss of full digital ROM. Excessive flexion and ulnar deviation can lead to median nerve compression and associated symptoms, as well as poor extensor and radial tendon length. In addition, prolonged distraction in excessive flexion combined with swelling and inflammation during fracture healing causes digital stiffness and contracture.23 Biomechanical studies have found that proximal pin placement in the radius, along with distal pin fixation in 6 metacarpal cortices through the second and third metacarpals, helps provide the strongest fixation.24
As for technique, pins are placed in the second metacarpal and radial shaft. With respect to the radius, the incision is made just proximal to the edge of the abductor pollicis longus muscle in the "bare area." Ideal pin placement is between the extensor carpi radialis longus and the extensor carpi radialis brevis, with care taken to avoid the radial sensory nerve, which lies between the extensor carpi radialis longus and the brachialis and emerges 9 cm proximal to the radial styloid.25 Next, a 2.5-cm to 3-cm incision is made over the palpable edge of the index metacarpal near the base. During drilling, the guide is placed at intersecting 45° angles, and the distal pin is placed 2 cm to 3 cm from the proximal pin. The proximal metacarpal pin is placed at the base of the metacarpal. The second metacarpal pin can also be placed first, with the external fixator used to judge proximal placement of the radial pin within the bare area.
Various supplements to external fixation have positive outcomes. Wolfe and colleagues18 found that using K-wires with the external fixation construct added stability in flexion/extension, radial/ulnar deviation, and rotational motion. They noted that fixation stability may depend more on the augmentation to fixation than on the external fixator itself. In a prospective, randomized trial, Moroni and colleagues26,27 found that, compared with standard pins, hydroxyapatite-coated pins had higher extraction torque, which was associated with improved fixation. When combined with external fixation, calcium phosphate cement also provided additional stability, allowing the bone filler to help maintain articular reduction and cortical continuity.28,29
External fixation has its disadvantages and complications. It can be bulky, and theoretically it contributes to higher rates of stiffness in the wrist and fingers.30-32 Higher rates of pin-site infection have been reported, along with hardware failure and associated loss of reduction, in patients treated with external fixation (Figures 3A-3C).31-33[[{"fid":"201866","view_mode":"medstat_image_flush_left","attributes":{"class":"media-element file-medstat-image-flush-left","data-delta":"3"},"fields":{"format":"medstat_image_flush_left","field_file_image_caption[und][0][value]":"Figure 3.","field_file_image_credit[und][0][value]":"","field_file_image_caption[und][0][format]":"plain_text","field_file_image_credit[und][0][format]":"plain_text"},"type":"media","field_deltas":{"3":{"format":"medstat_image_flush_left","field_file_image_caption[und][0][value]":"Figure 3.","field_file_image_credit[und][0][value]":""}}}]]In addition, joint overdistraction can adversely affect the length-tension curve and contribute to potential reflex sympathetic dystrophy, which can be devastating (Figures 4A, 4B).1,21,31,33 Despite these complications, external fixation remains a powerful tool in the treatment of high-energy DRFs. [[{"fid":"201867","view_mode":"medstat_image_flush_right","attributes":{"class":"media-element file-medstat-image-flush-right","data-delta":"4"},"fields":{"format":"medstat_image_flush_right","field_file_image_caption[und][0][value]":"Figure 4.","field_file_image_credit[und][0][value]":"","field_file_image_caption[und][0][format]":"plain_text","field_file_image_credit[und][0][format]":"plain_text"},"type":"media","field_deltas":{"4":{"format":"medstat_image_flush_right","field_file_image_caption[und][0][value]":"Figure 4.","field_file_image_credit[und][0][value]":""}}}]]In many cases, authors who compared open reduction and internal fixation (ORIF) with external fixation found no significant differences in outcome scores or function.31-34 In a meta-analysis of 917 patients, Margaliot and colleagues33 found no differences in pain, grip strength, wrist ROM, or radiographic parameters. More recently, in prospective randomized trials, both Egol and colleagues31 and Grewal and colleagues34 compared hybrid external fixation with ORIF, and, though early outcomes favored ORIF, 1-year follow-up comparisons were even, and there were no significant differences. These consistently reproducible results reaffirm keeping external fixation in the orthopedic toolbox.
Definitive Reconstruction With ORIF
Early nonlocked dorsal plating options for DRF fixation had unacceptable rates of plate failure, poor cosmesis, and extensor tendon complications.17,35-37 Subsequent technologic advances—multiple approaches, lower profile plating, and rigid, fragment-specific fixation—have allowed even the most complex fracture patterns to be addressed (Table). In malunited fractures, bone graft may not be required if the fracture is extra-articular and treated with a volar locking plate. [[{"fid":"201868","view_mode":"medstat_image_flush_left","attributes":{"class":"media-element file-medstat-image-flush-left","data-delta":"5"},"fields":{"format":"medstat_image_flush_left","field_file_image_caption[und][0][value]":"Table.","field_file_image_credit[und][0][value]":"","field_file_image_caption[und][0][format]":"plain_text","field_file_image_credit[und][0][format]":"plain_text"},"type":"media","field_deltas":{"5":{"format":"medstat_image_flush_left","field_file_image_caption[und][0][value]":"Table.","field_file_image_credit[und][0][value]":""}}}]]Other options include corticocancellous autograft from the iliac crest, hydroxyapatite synthetic grafts, and osteoconductive bone graft substitutes, such as bone morphogenic proteins. In addition, healing times are similar in cases, regardless of whether a graft was used.38
Involvement of the radial and intermediate columns should be addressed first. Although some may prefer a single volar plate, others may use fragment-specific fixation to buttress a comminuted radial styloid (in orthogonal fashion) and/or a dorsal ulnar fragment to restore the intermediate column and thereby fully restore the radial articular surface.39,40 Typically, restoring the radial and intermediate columns for radial articular reduction subsequently and simultaneously restores the majority of radial height and length. After the radial and intermediate columns are reduced and stabilized, the need for ulna column fixation can be determined. Important factors in ulna column restoration are severe osteoporosis and ulna head and/or neck comminution. Significant comminution throughout the metaphysis of both the radius and the ulna may also warrant stabilizing the ulna with internal fixation. Finally, any DRU joint instability noted on examination should also favor fixing the ulnar side.
Assessment of the distal ulna in these complex fractures goes beyond the involvement of an ulnar styloid fracture. Typically, fractures at the base of the ulnar styloid have been reported to have little clinical relevance, including a low incidence of associated DRU joint problems.41-43 Decisions to address the ulnar column are largely swayed by any instability found on DRU joint testing, as laxity caused by severe comminution can dictate the need for distal ring fixation to provide support. Even in the presence of a high-energy fracture in severely osteoporotic bone, the argument can be made to prevent instability by supporting the ulnar column. Stabilization of the ulnar articular surface can also be made more facile by creating an easier "A" fracture pattern (per AO classification) from a complex "C" to further aid in achieving efficient anatomical reduction. After preoperative planning is completed, depending on which columns need to be addressed, several surgical approaches can be considered to achieve maximum exposure and soft-tissue mobilization in order to successfully complete the operative fixation goals.
Volar Approach
An approach is selected for ideal exposure of a facile environment for definitive fixation. Access to the radial column can be gained with the extended flexor carpi radialis (FCR) approach. This approach allows visualization and removal of the appropriate deforming forces on the radial column to allow for fracture reduction by "opening the book," similar to that of tibial plateau reconstruction.44,45 It may be prudent to perform a preincision Allen test as well as a preoperative DRU joint examination for comparison after ORIF is complete. Compared with the classic Henry approach near the distal radius, going through the volar sheath of the FCR avoids many of the perforating radial artery branches. Avoiding stripping the radial artery of its surrounding fat and lymphatics prevents postoperative "cold intolerance." Retracting the FCR ulnarly and then incising the dorsal FCR sheath provide ready access to the pronator quadratus after collective ulnar mobilization of both the FCR and the flexor pollicis longus.44 In addition, for work near the distal FCR sheath, care must be taken to avoid the branch of the palmar cutaneous nerve that emerges about 5 cm proximal to the wrist flexion crease.46
Once at the level of the pronator quadratus, an "L-shape" incision can be made to reflect the muscle off the radius. Care must be taken when working too distal to avoid transection of the inserting volar wrist ligaments.44 Leaving a cuff for repair of the pronator remains controversial. In a recent case-control series, however, Hershman and colleagues47 did not find significant differences in function or complication rate in patients with and without repair. After reflection, adequate exposure of the radial column should be achieved. Ready access to the radial styloid for orthogonal plating can be obtained by releasing the brachioradialis, which simultaneously releases one of the primary fracture deforming forces.44 With this incision and exposure, if needed, dorsal bone grafting can be achieved from the volar side; however, care must be taken to protect the first dorsal compartment.48 The cutaneous branch of the median nerve may be at risk with this exposure, but avoiding dissection ulnar to the FCR tendon can help to reduce this risk.49
Before surgery, if the fracture pattern dictates a more ulnar approach, we prefer the extended carpal tunnel approach. Using the plane between the palmaris longus and the flexor digitorum superficialis medially and the FCR laterally, the extended carpal tunnel approach provides an obvious release of the flexor retinaculum but, more important, allows for extensile access to the sigmoid notch, the DRU joint, and the ulnar column.
Dorsal Approach
The dorsal approach is necessary in a few select cases. With a focus on fragment-specific fixation, presence of a significant dorsal ulnar fragment should warrant a dorsal approach.50 In addition, in select, rare cases in which volar access is limited or unavailable, dorsal access is the only option.50 Finally, if direct articular visualization is required, the dorsal approach typically is favored as the stronger radiocarpal ligaments found on the volar side are maintained.
Access should begin with an incision centered over the dorsal distal radius; a safe access point is just ulnar to the Lister tubercle. On incision of the retinaculum through a full-thickness excision, the third dorsal compartment is opened and the extensor pollicis longus (EPL) mobilized, fully exposing the dorsal distal radius. Work can be performed on either side of the EPL between the second and fourth dorsal compartments. Exposure typically is not an issue because of the pliable soft tissue of the dorsum, with ready access from styloid to styloid.44 Here, low-profile plates and/or mini-fragment-specific plate options should be used to minimize potential tendon damage.51 Care must also be taken to avoid damaging the radiocarpal or scapholunate ligaments.49 On closure, the retinaculum is repaired primarily; however, though some proponents advocate relocating the EPL tendon into its groove, we prefer leaving the EPL free within the surrounding soft tissue to reduce tension and promote unhindered excursion. The dorsal approach, though controversial and used inconsistently, should remain an important tool in anatomical restoration, especially in cases of complex fracture patterns.
Conclusion
Controversy still marks the lack of consensus on deciding which DRF treatment is optimal. Some investigators question moving away from external fixation and cite the lack of significantly better data relative to ORIF.21,52 The same proponents note that the only advantage over external fixation is earlier return to function and cite reports of tendon rupture and complications with both dorsal and volar fixation options.34,53-58 Other investigators find that operative treatment generally does not provide a significant improvement over nonoperative treatment.59
With the advent of lower profile locked plating, fragment-specific fixation, and variable-angle devices, comparative clinical trials are finding it difficult to keep up.60-64 Results from ongoing prospective randomized trials like ORCHID (Open Reduction and Internal Fixation Versus Casting for Highly Comminuted Intra-Articular Fractures of the Distal Radius; 500 patients >65 years old, 15 centers) will provide more definitive answers about ideal treatment.65
Anatomical restoration involves a versatile array of fragment fixation and reconstruction. Careful preoperative planning and a consistent approach to restoring the radial, intermediate, and ulnar columns, along with a proper surgical approach, are ideal. Many advances in internal fixation have been exceedingly helpful. Use of external fixation, especially in a bridging fashion with or without supplementation, is still valuable in many situations.
1. Liporace FA, Adams MR, Capo JT, Koval KJ. Distal radius fractures. J Orthop Trauma. 2009;23(10):739-748.
2. Lee YS, Wei TY, Cheng YC, Hsu TL, Huang CR. A comparative study of Colles’ fractures in patients between fifty and seventy years of age: percutaneous K-wiring versus volar locking plating. Int Orthop. 2012;36(4):789-794.
3. Diaz-Garcia RJ, Oda T, Shauver MJ, Chung KC. A systematic review of outcomes and complications of treating unstable distal radius fractures in the elderly. J Hand Surg Am. 2011;36(5):824-835.e2.
4. Ring D. Treatment of the neglected distal radius fracture. Clin Orthop Relat Res. 2005;(431):85-92.
5. Berger RA. Arthroscopic anatomy of the wrist and distal radioulnar joint. Hand Clin. 1999;15(3):393-413, vii.
6. Berger RA. The anatomy of the ligaments of the wrist and distal radioulnar joints. Clin Orthop Relat Res. 2001;(383):32-40.
7. McCann PA, Clarke D, Amirfeyz R, Bhatia R. The cadaveric anatomy of the distal radius: implications for the use of volar plates. Ann R Coll Surg Engl. 2012;94(2):116-120.
8. Ekenstam F. Osseous anatomy and articular relationships about the distal ulna. Hand Clin. 1998;14(2):161-164.
9. Fernandez DL. Distal radius fracture: the rationale of a classification. Chir Main. 2001;20(6):411-425.
10. Raskin KB, Melone CP Jr. Unstable articular fractures of the distal radius. Comparative techniques of ligamentotaxis. Orthop Clin North Am. 1993;24(2):275-286.
11. Melone CP Jr. Distal radius fractures: patterns of articular fragmentation. Orthop Clin North Am. 1993;24(2):239-253.
12. Jenkins NH. The unstable Colles’ fracture. J Hand Surg Br. 1989;14(2):149-154.
13. Cooney WP, Dobyns JH, Linscheid RL. Arthroscopy of the wrist: anatomy and classification of carpal instability. Arthroscopy. 1990;6(2):133-140.
14. Kural C, Sungur I, Kaya I, Ugras A, Ertürk A, Cetinus E. Evaluation of the reliability of classification systems used for distal radius fractures. Orthopedics. 2010;33(11):801.
15. Lipton HA, Wollstein R. Operative treatment of intraarticular distal radial fractures. Clin Orthop Relat Res. 1996;(327):110-124.
16. Wolfe SW. Distal radius fractures. Green’s Operative Hand Surgery. 6th ed. Philadelphia, PA: Churchill Livingstone; 2011:561-638.
17. Rikli DA, Regazzoni P. Fractures of the distal end of the radius treated by internal fixation and early function. A preliminary report of 20 cases. J Bone Joint Surg Br. 1996;78(4):
588-592.
18. Wolfe SW, Austin G, Lorenze M, Swigart CR, Panjabi MM. A biomechanical comparison of different wrist external fixators with and without K-wire augmentation. J Hand Surg Am. 1999;24(3):516-524.
19. Kreder HJ, Agel J, McKee MD, Schemitsch EH, Stephen D, Hanel DP. A randomized, controlled trial of distal radius fractures with metaphyseal displacement but without joint incongruity: closed reduction and casting versus closed reduction, spanning external fixation, and optional percutaneous K-wires. J Orthop Trauma. 2006;20(2):115-121.
20. Moroni A, Vannini F, Faldini C, Pegreffi F, Giannini S. Cast vs external fixation: a comparative study in elderly osteoporotic distal radial fracture patients. Scand J Surg. 2004;93(1):64-67.
21. Paksima N, Panchal A, Posner MA, Green SM, Mehiman CT, Hiebert R. A meta-analysis of the literature on distal radius fractures: review of 615 articles. Bull Hosp Jt Dis. 2004;62(1-2):40-46.
22. Li-hai Z, Ya-nan W, Zhi M, et al. Volar locking plate versus external fixation for the treatment of unstable distal radial fractures: a meta-analysis of randomized controlled trials.
J Surg Res. 2015;193(1):324-333.
23. Papadonikolakis A, Shen J, Garrett JP, Davis SM, Ruch DS. The effect of increasing distraction on digital motion after external fixation of the wrist. J Hand Surg Am. 2005;30(4):
773-779.
24. Seitz WH Jr, Froimson AI, Brooks DB, et al. Biomechanical analysis of pin placement and pin size for external fixation of distal radius fractures. Clin Orthop Relat Res. 1990;(251):
207-212.
25. Beldner S, Zlotolow DA, Melone CP Jr, Agnes AM, Jones MH. Anatomy of the lateral antebrachial cutaneous and superficial radial nerves in the forearm: a cadaveric and clinical study. J Hand Surg Am. 2005;30(6):1226-1230.
26. Moroni A, Faldini C, Marchetti S, Manca M, Consoli V, Giannini S. Improvement of the bone-pin interface strength in osteoporotic bone with use of hydroxyapatite-coated tapered external-fixation pins. A prospective, randomized clinical study of wrist fractures. J Bone Joint Surg Am. 2001;83(5):717-721.
27. Moroni A, Heikkila J, Magyar G, Toksvig-Larsen S, Giannini S. Fixation strength and pin tract infection of hydroxyapatite-coated tapered pins. Clin Orthop Relat Res. 2001;(388):209-217.
28. Higgins TF, Dodds SD, Wolfe SW. A biomechanical analysis of fixation of intra-articular distal radial fractures with calcium-phosphate bone cement. J Bone Joint Surg Am. 2002;84(9):1579-1586.
29. Tobe M, Mizutani K, Tsubuku Y. Treatment of distal radius fracture with the use of calcium phosphate bone cement as a filler. Tech Hand Up Extrem Surg. 2004;8(2):95-101.
30. Capo JT, Rossy W, Henry P, Maurer RJ, Naidu S, Chen L.
External fixation of distal radius fractures: effect of distraction and duration. J Hand Surg Am. 2009;34(9):1605-1611.
31. Egol K, Walsh M, Tejwani N, McLaurin T, Wynn C, Paksima N. Bridging external fixation and supplementary Kirschner-wire fixation versus volar locked plating for unstable fractures of the distal radius: a randomised, prospective trial. J Bone Joint Surg Br. 2008;90(9):1214-1221.
32. Egol KA, Paksima N, Puopolo S, Klugman J, Hiebert R, Koval KJ. Treatment of external fixation pins about the wrist: a prospective, randomized trial. J Bone Joint Surg Am. 2006;88(2):349-354.
33. Margaliot Z, Haase SC, Kotsis SV, Kim HM, Chung KC. A meta-analysis of outcomes of external fixation versus plate osteosynthesis for unstable distal radius fractures. J Hand Surg Am. 2005;30(6):1185-1199.
34. Grewal R, MacDermid JC, King GJ, Faber KJ. Open reduction internal fixation versus percutaneous pinning with external fixation of distal radius fractures: a prospective, randomized clinical trial. J Hand Surg Am. 2011;36(12):
1899-1906.
35. Axelrod TS, McMurtry RY. Open reduction and internal fixation of comminuted, intraarticular fractures of the distal radius. J Hand Surg Am. 1990;15(1):1-11.
36. Hove LM, Nilsen PT, Furnes O, Oulie HE, Solheim E, Mölster AO. Open reduction and internal fixation of displaced intraarticular fractures of the distal radius. 31 patients followed for 3-7 years. Acta Orthop Scand. 1997;68(1):59-63.
37. Carter PR, Frederick HA, Laseter GF. Open reduction and internal fixation of unstable distal radius fractures with a low-profile plate: a multicenter study of 73 fractures. J Hand Surg Am. 1998;23(2):300-307.
38. Mugnai R, Tarallo L, Lancellotti E, et al. Corrective osteotomies of the radius: grafting or not? World J Orthop. 2016;7(2):128-135.
39. Tang P, Ding A, Uzumcugil A. Radial column and volar plating (RCVP) for distal radius fractures with a radial styloid component or severe comminution. Tech Hand Up Extrem Surg. 2010;14(3):143-149.
40. Helmerhorst GT, Kloen P. Orthogonal plating of intra-articular distal radius fractures with an associated radial column fracture via a single volar approach. Injury. 2012;43(8):1307-1312.
41. May MM, Lawton JN, Blazar PE. Ulnar styloid fractures associated with distal radius fractures: incidence and implications for distal radioulnar joint instability. J Hand Surg Am. 2002;27(6):965-971.
42. Souer JS, Ring D, Matschke S, Audige L, Marent-Huber M, Jupiter JB; AOCID Prospective ORIF Distal Radius Study Group. Effect of an unrepaired fracture of the ulnar styloid base on outcome after plate-and-screw fixation of a distal radial fracture. J Bone Joint Surg Am. 2009;91(4):830-838.
43. Noda K, Goto A, Murase T, Sugamoto K, Yoshikawa H, Moritomo H. Interosseous membrane of the forearm: an anatomical study of ligament attachment locations. J Hand Surg Am. 2009;34(3):415-422.
44. Catalano LW 3rd, Zlotolow DA, Hitchcock PB, Shah SN, Barron OA. Surgical exposures of the radius and ulna. J Am Acad Orthop Surg. 2011;19(7):430-438.
45. Orbay JL, Badia A, Indriago IR, et al. The extended flexor carpi radialis approach: a new perspective for the distal radius fracture. Tech Hand Up Extrem Surg. 2001;5(4):204-211.
46. Hobbs RA, Magnussen PA, Tonkin MA. Palmar cutaneous branch of the median nerve. J Hand Surg Am. 1990;15(1):38-43.
47. Hershman SH, Immerman I, Bechtel C, Lekic N, Paksima N, Egol KA. The effects of pronator quadratus repair on outcomes after volar plating of distal radius fractures. J Orthop Trauma. 2013;27(3):130-133.
48. Prommersberger KJ, Lanz UB. Corrective osteotomy of the distal radius through volar approach. Tech Hand Up Extrem Surg. 2004;8(2):70-77.
49. Ilyas AM. Surgical approaches to the distal radius. Hand (N Y). 2011;6(1):8-17.
50. Tavakolian JD, Jupiter JB. Dorsal plating for distal radius fractures. Hand Clin. 2005;21(3):341-346.
51. Yu YR, Makhni MC, Tabrizi S, Rozental TD, Mundanthanam G, Day CS. Complications of low-profile dorsal versus volar locking plates in the distal radius: a comparative study. J Hand Surg Am. 2011;36(7):1135-1141.
52. Mattila VM, Huttunen TT, Sillanpää P, Niemi S, Pihlajamäki H, Kannus P. Significant change in the surgical treatment of distal radius fractures: a nationwide study between 1998 and 2008 in Finland. J Trauma. 2011;71(4):939-942.
53. Wilcke MK, Abbaszadegan H, Adolphson PY. Wrist function recovers more rapidly after volar locked plating than after external fixation but the outcomes are similar after 1 year. Acta Orthop. 2011;82(1):76-81.
54. Ward CM, Kuhl TL, Adams BD. Early complications of volar plating of distal radius fractures and their relationship to surgeon experience. Hand (N Y). 2011;6(2):185-189.
55. Soong M, van Leerdam R, Guitton TG, Got C, Katarincic J, Ring D. Fracture of the distal radius: risk factors for complications after locked volar plate fixation. J Hand Surg Am. 2011;36(1):3-9.
56. Soong M, Earp BE, Bishop G, Leung A, Blazar P. Volar locking plate implant prominence and flexor tendon rupture. J Bone Joint Surg Am. 2011;93(4):328-335.
57. Jeudy J, Steiger V, Boyer P, Cronier P, Bizot P, Massin P. Treatment of complex fractures of the distal radius: a prospective randomised comparison of external fixation ‘versus’ locked volar plating. Injury. 2012;43(2):174-179.
58. Berglund LM, Messer TM. Complications of volar plate fixation for managing distal radius fractures. J Am Acad Orthop Surg. 2009;17(6):369-377.
59. Egol KA, Walsh M, Romo-Cardoso S, Dorsky S, Paksima N. Distal radial fractures in the elderly: operative compared with nonoperative treatment. J Bone Joint Surg Am. 2010;92(9):1851-1857.
60. Wall LB, Brodt MD, Silva MJ, Boyer MI, Calfee RP. The effects of screw length on stability of simulated osteoporotic distal radius fractures fixed with volar locking plates. J Hand Surg Am. 2012;37(3):446-453.
61. Dahl WJ, Nassab PF, Burgess KM, et al. Biomechanical properties of fixed-angle volar distal radius plates under dynamic loading. J Hand Surg Am. 2012;37(7):1381-1387.
62. Park JH, Hagopian J, Ilyas AM. Variable-angle locking screw volar plating of distal radius fractures. Hand Clin. 2010;26(3):373-380, vi.
63. Pensy RA, Brunton LM, Parks BG, Higgins JP, Chhabra AB. Single-incision extensile volar approach to the distal radius and concurrent carpal tunnel release: cadaveric study. J Hand Surg Am. 2010;35(2):217-222.
64. Klos K, Rausch S, Löffler M, et al. A biomechanical comparison of a biodegradable volar locked plate with two titanium volar locked plates in a distal radius fracture model. J Trauma. 2010;68(4):984-991.
65. Bartl C, Stengel D, Bruckner T, et al. Open reduction and internal fixation versus casting for highly comminuted and intra-articular fractures of the distal radius (ORCHID): protocol for a randomized clinical multi-center trial. Trials. 2011;12:84
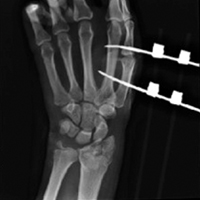
Comparison of Lateral Retinaculum Release and Lengthening in the Treatment of Patellofemoral Disorders
Take-Home Points
- Understanding the indications for treatment is essential.
- Identifying the superficial (oblique fibers) and deep layers (transverse fibers) of the LR is very important and can lengthen the LR by as much as 20 mm.
- Open procedures reduce the risk of hematomas and related pain.
- The goal is to obtain 1 or 2 patellar quadrants of medial and lateral patellar glide in extensino and a neutral patella.
- If the Z-plasty is combined with the MPFL reconstruction or tibial tubercle transfer, the LR is set to length after the tubercle transfer and before the MPFL reconstruction (to avoid overconstraint).
Anterior knee pain is a common clinical problem that can be challenging to correct, in large part because of multiple causative factors, including structural/anatomical, functional, alignment, and neuroperception/pain pathway factors. One difficult aspect of anatomical assessment is judging the soft-tissue balance between the medial restraints (medial patellofemoral ligament [MPFL]; medial quadriceps tendon to femoral ligament; medial patellotibial and patellomeniscal ligaments) and the lateral restraints (lateral retinaculum [LR] specifically). Both LR tightness and patellar instability can be interpreted as anterior knee pain. Differentiating these entities is one of the most difficult clinical challenges in orthopedics.
LR release (LRR) has been found to improve patellar mobility and tracking.1 In the absence of clearly defined guidelines, the procedure quickly gained in popularity because of its technical simplicity and the enticing "one tool fits all" treatment approach suggested in early reviews. Injudicious use of LRR, alone or in combination with other procedures, led to iatrogenic instability and chronic pain. LR lengthening (LRL) was introduced to address LR tightness while maintaining lateral soft-tissue integrity and avoiding some of the severe complications of LRR.2
Today, isolated use of LRR/LRL is recommended only for treatment of LR tightness and pain secondary to lateral patellar hypercompression.3 It can also be used as an adjunct treatment in the setting of patellofemoral instability. LRR/LRL should never be used as primary treatment for patellofemoral instability.
In this review of treatments for LR tightness and patellofemoral disorders, we compare the use of LRR and LRL.
Discussion
LR procedures are indicated for LR tightness, which is assessed by taking a history, performing a physical examination, and obtaining diagnostic imaging. Decisions should be based on all findings considered together and never on imaging findings alone.
Physical Examination
The physical examination should include assessment of limb alignment, patellar mobility, muscle balance, and dynamic patellar tracking.
Limb Alignment. Abnormal valgus, rotational deformities, and increased Q-angle are associated with LR tightness. Valgus alignment can be assessed on standing inspection; rotational deformities with increased hip anteversion by hip motion with the patient in the prone position (increased hip internal rotation, decreased hip external rotation); and Q-angle on weight-bearing standing examination and with the patient flexing and extending the knee while seated.
Patellar Mobility. The patellar glide and tilt tests provide the most direct evaluations of LR tightness. Medial displacement of <1 quadrant is consistent with tightness, and displacement of >3 quadrants is consistent with laxity. In full extension, the patellar glide test evaluates only the soft-tissue restraints; at 30° flexion, it also evaluates patellofemoral engagement. The patellar tilt test measures the lifting of the lateral edge of the patella. With normal elevation being 0° to 20°, lack of patellar tilt means the LR is tight, and tilt of >20° means it is loose. MPFL patency can be examined with the Lachman test; the examiner rapidly moves the patella laterally while feeling for the characteristic hard endpoint of lateral translation.
Muscle Balance. The tone, strength, and tightness of the core (abdomen, dorsal, and hip muscles) and lower extremities (quadriceps, hamstrings, gastrocnemius) should be evaluated.
Dynamic Patellar Tracking. The J-sign is the course (shaped like an inverted J) that the patella takes when it is medialized into the trochlea from its laterally displaced resting position as the knee goes from full extension to flexion. The J-sign can be associated with LR tightness, trochlear dysplasia, and patella alta.
Imaging
Although we cannot provide a comprehensive review of the imaging literature, the following radiologic examinations should be used to assess the patellofemoral joint.
30° Lateral Radiograph. Increased tilt is seen when the lateral facet is not anterior to the patellar ridge. Also evaluated are trochlear anatomy, patellar height, and other factors involved in patellofemoral disorders.
30° Flexed Axial (Merchant) Radiograph. Patellar tilt, subluxation, and trochlear dysplasia are evaluated. Images obtained with progressive flexion can be very useful in verifying patellar tilt reduction. Lack of reduction during early flexion suggests LR tightness.4
Alignment Axial Radiographs (Scanogram). Valgus alignment is assessed with this full-length, standing, long-leg examination.
Computed Tomography/Magnetic Resonance Imaging. Many parameters of patellar alignment have been described. Basic assessment should include evaluation of patellar tilt, angle by the line across posterior condyles and a line through the greatest patellar width (>20° indicates abnormality and LR tightness) and tibial tubercle-trochlear groove distance (computed tomography or magnetic resonance imaging scan of the knee is used to measure this distance, and to confirm a significant amount in light of complex patellofemoral malalignment5).
Indications
Lateral compression syndrome with LR tightness is often successfully treated with isolated LRR, and results are reproducible and predictable.6 Surgical intervention for patellofemoral pain should be undertaken only after failed extensive nonoperative treatment with physical therapy and bracing/taping. Patients with LR tightness on preoperative examination, lateral patellar tilt on imaging, and normal Q-angle can obtain satisfactory results with this procedure. Patellar subluxation or dislocation history, high Q-angle (>20°), grade 3 or 4 chondral injury, and patellofemoral arthritis are associated with poorer outcomes when the procedure is performed in isolation.6International Patellofemoral Study Group members agreed that LRR/LRL is a valid treatment option when indicated, but it is rarely performed in isolation and constitutes only 1% to 2% of surgeries performed by this group of experts.7 When lateral compression syndrome progresses to arthritis, LRR/LRL can be performed with lateral patella facetectomy for maximal improvement.4 In the setting of patellofemoral instability, LRR/LRL can be combined with proximal and/or distal realignment surgery if the LR is tight. The LR is the last line of defense limiting lateral translation in the setting of an incompetent MPFL. Isolated LRR/LRL in the setting of instability further destabilizes the patella and worsens the instability. Therefore, LRR/LRL
is a poor surgical option as an isolated procedure for this condition and should be used only as an adjunct in cases of patellofemoral instability with LR tightness that does not allow the patella to be centralized into the trochlea.8 LRR/LRL can also be performed to improve patellar tracking in patellofemoral arthroplasty and total knee arthroplasty.
Lateral Retinaculum Release Versus Lengthening
LRR was first described for the treatment of patellar instability in 1891.9 It was also used for the treatment of lateral patellar hypercompression syndrome associated with LR tightness that led to lateral patellar tracking, joint overload, degeneration, and anterior knee pain.10 Metcalf10 further popularized the procedure by describing a minimally invasive arthroscopic version. However, the arthroscopic technique is as aggressive as the open technique and may be performed with less control, potentially making its results more variable. As proximal and distal releases are performed from the "inside out," more capsule and muscle disruption is needed to release the more superficial layers.
Z-plasty lengthening of the LR was described as an alternative for maintaining lateral patellar soft-tissue integrity while reducing the tension of the lateral tissue restraints.3 This is our preferred method.
Performing LRL instead of LRR avoids iatrogenic medial patellar instability, avoids overrelease and muscle injury, and improves soft-tissue balance.3 Open release or lengthening reduces inadvertent injury to the lateral superior/inferior geniculate arteries and allows direct hemostasis. Two prospective randomized studies found functional knee outcomes and return to athletic activities were improved more after LRL than LRR.11,12 These procedures had similar rates of postoperative knee stiffness, decreased muscle mass, and decreased strength. Each prospective study used an extensive LRR technique for LRR cases (various authors have recommended performing the release until the patella is perpendicular to the trochlea), which may have affected outcomes. In any case, with lengthening, the surgeon is less likely to excessively disrupt the lateral tissues.
Lateral Retinaculum Release. LRR can be openly performed by lateral parapatellar incision,1 a mini-open percutaneous technique, or arthroscopy. For these open techniques, incisions of various sizes have been used to access the LR and incise it about 1 cm lateral to the patella starting at the distal end of the vastus lateralis and extending distally until patellar tilt reduction is sufficient. If tightness in deep flexion persists, the LRR can be extended distally to the tibial tubercle. Open techniques have the advantage of sparing the joint capsule. All-arthroscopic techniques involve using electrocautery to cut through the capsule and access the LR.
Lateral Retinaculum Lengthening.
The LR is sharply divided into a superficial layer of superficial oblique fibers from the anterior iliotibial band and a deep layer of transverse fibers from the femur. For LRR, these 2 layers must be identified separate from the articular capsule.13
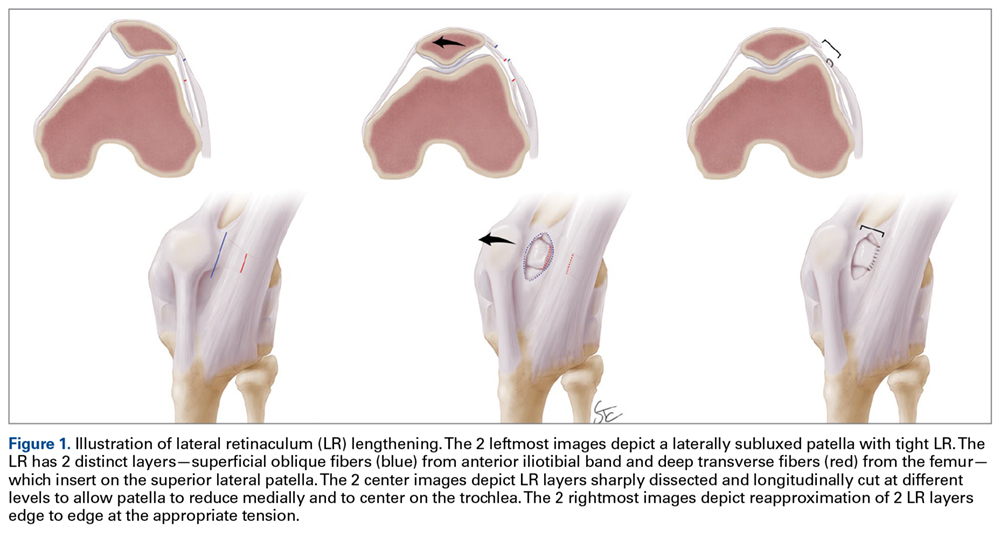
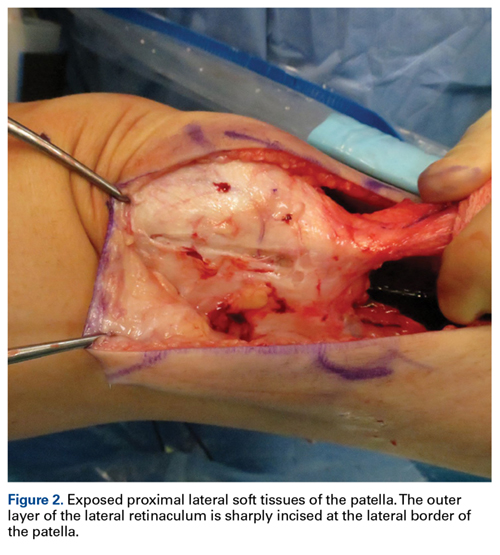
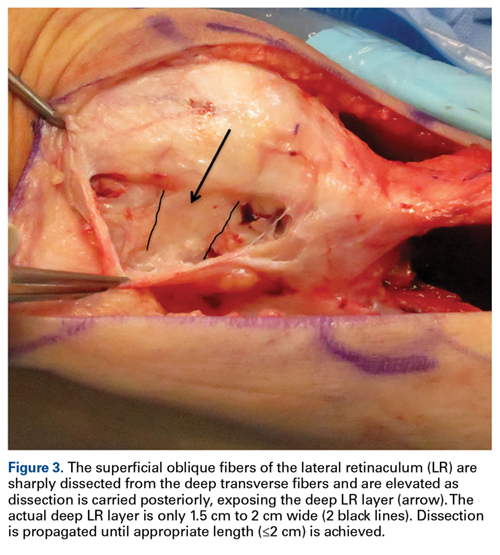
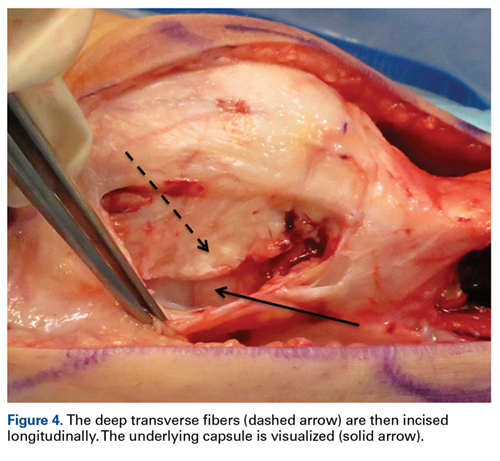
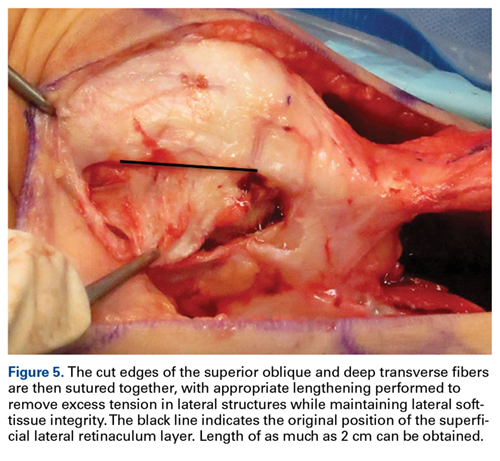
Complications
Complications of performing LRR/LRL to change the lateral restraint include medial patellar instability, increased lateral pain, repair failure, recurrent lateral instability, quadriceps weakness and atrophy, postoperative hemarthrosis, knee stiffness, wound complications, and thermal skin injury.7 These complications often result from poor surgical technique and too aggressive release. Although recommended patellar tilt historically has varied from 45° to 90°, the current goal is to normalize the tight soft-tissue restraints without creating secondary instability.
The most significant complication of LRR is medial patellar instability caused by muscle atrophy and loss of soft-tissue restraint.14 Medial instability can be difficult to diagnose and should be considered in any patient with patellofemoral pain, popping, or patellar instability after LRR.15 A positive medial subluxation test or medial patellar apprehension test suggests medial instability.
Medial patellar instability usually requires surgical treatment. Direct LR repair, lateral soft-tissue reconstruction, and other procedures can be used to restore lateral restraint.15 However, these are salvage techniques, and patients often remain significantly limited by pain or instability. Therefore, the LR must be carefully addressed and preferably should undergo lengthening rather than release.
1. Merchant AC, Mercer RL. Lateral release of the patella. A preliminary report. Clin Orthop Relat Res. 1974;(103):40-45.
2. Ceder LC, Larson RL. Z-plasty lateral retinacular release for the treatment of patellar compression syndrome. Clin Orthop Relat Res. 1979;(144):110-113.
3. Biedert R. Lateral patellar hypercompression, tilt and mild lateral subluxation. In: Biedert R, ed. Patellofemoral Disorders. Chichester, England: Wiley; 2004:161-166.
4. Hinckel BB, Arendt EA. Lateral retinaculum lengthening or release. Oper Tech Sports Med. 2015;23(2):100-106.
5. Seitlinger G, Scheurecker G, Högler R, Labey L, Innocenti B, Hofmann S. Tibial tubercle–posterior cruciate ligament distance: a new measurement to define the position of the tibial tubercle in patients with patellar dislocation. Am J Sports Med. 2012;40(5):1119-1125.
6. Lattermann C, Toth J, Bach BR Jr. The role of lateral retinacular release in the treatment of patellar instability. Sports Med Arthrosc. 2007;15(2):57-60.
7. Fithian DC, Paxton EW, Post WR, Panni AS; International Patellofemoral Study Group. Lateral retinacular release: a survey of the International Patellofemoral Study Group. Arthroscopy. 2004;20(5):463-468.
8. Christoforakis J, Bull AM, Strachan RK, Shymkiw R, Senavongse W, Amis AA. Effects of lateral retinacular release on the lateral stability of the patella. Knee Surg Sports Traumatol Arthrosc. 2006;14(3):273-277.
9. Pollard B. Old dislocation of patella by intra-articular operation. Lancet. 1891;(988):17-22.
10. Metcalf RW. An arthroscopic method for lateral release of subluxating or dislocating patella. Clin Orthop Relat Res. 1982;167:9-18.
11. Pagenstert G, Wolf N, Bachmann M, et al. Open lateral patellar retinacular lengthening versus open retinacular release in lateral patellar hypercompression syndrome: a prospective double-blinded comparative study on complications and outcome. Arthroscopy. 2012;28(6):788-797.
12. O’Neill DB. Open lateral retinacular lengthening compared with arthroscopic release. A prospective, randomized outcome study. J Bone Joint Surg Am. 1997;79(12):1759-1769.
13. Merican AM, Amis AA. Anatomy of the lateral retinaculum of the knee. J Bone Joint Surg Br. 2008;90(4):527-534.
14. Hughston JC, Deese M. Medial subluxation of the patella as a complication of lateral retinacular release. Am J Sports Med. 1988;16(4):383-388.
15. McCarthy MA, Bollier MJ. Medial patella subluxation: diagnosis and treatment. Iowa Orthop J. 2015;35:26-33.
Take-Home Points
- Understanding the indications for treatment is essential.
- Identifying the superficial (oblique fibers) and deep layers (transverse fibers) of the LR is very important and can lengthen the LR by as much as 20 mm.
- Open procedures reduce the risk of hematomas and related pain.
- The goal is to obtain 1 or 2 patellar quadrants of medial and lateral patellar glide in extensino and a neutral patella.
- If the Z-plasty is combined with the MPFL reconstruction or tibial tubercle transfer, the LR is set to length after the tubercle transfer and before the MPFL reconstruction (to avoid overconstraint).
Anterior knee pain is a common clinical problem that can be challenging to correct, in large part because of multiple causative factors, including structural/anatomical, functional, alignment, and neuroperception/pain pathway factors. One difficult aspect of anatomical assessment is judging the soft-tissue balance between the medial restraints (medial patellofemoral ligament [MPFL]; medial quadriceps tendon to femoral ligament; medial patellotibial and patellomeniscal ligaments) and the lateral restraints (lateral retinaculum [LR] specifically). Both LR tightness and patellar instability can be interpreted as anterior knee pain. Differentiating these entities is one of the most difficult clinical challenges in orthopedics.
LR release (LRR) has been found to improve patellar mobility and tracking.1 In the absence of clearly defined guidelines, the procedure quickly gained in popularity because of its technical simplicity and the enticing "one tool fits all" treatment approach suggested in early reviews. Injudicious use of LRR, alone or in combination with other procedures, led to iatrogenic instability and chronic pain. LR lengthening (LRL) was introduced to address LR tightness while maintaining lateral soft-tissue integrity and avoiding some of the severe complications of LRR.2
Today, isolated use of LRR/LRL is recommended only for treatment of LR tightness and pain secondary to lateral patellar hypercompression.3 It can also be used as an adjunct treatment in the setting of patellofemoral instability. LRR/LRL should never be used as primary treatment for patellofemoral instability.
In this review of treatments for LR tightness and patellofemoral disorders, we compare the use of LRR and LRL.
Discussion
LR procedures are indicated for LR tightness, which is assessed by taking a history, performing a physical examination, and obtaining diagnostic imaging. Decisions should be based on all findings considered together and never on imaging findings alone.
Physical Examination
The physical examination should include assessment of limb alignment, patellar mobility, muscle balance, and dynamic patellar tracking.
Limb Alignment. Abnormal valgus, rotational deformities, and increased Q-angle are associated with LR tightness. Valgus alignment can be assessed on standing inspection; rotational deformities with increased hip anteversion by hip motion with the patient in the prone position (increased hip internal rotation, decreased hip external rotation); and Q-angle on weight-bearing standing examination and with the patient flexing and extending the knee while seated.
Patellar Mobility. The patellar glide and tilt tests provide the most direct evaluations of LR tightness. Medial displacement of <1 quadrant is consistent with tightness, and displacement of >3 quadrants is consistent with laxity. In full extension, the patellar glide test evaluates only the soft-tissue restraints; at 30° flexion, it also evaluates patellofemoral engagement. The patellar tilt test measures the lifting of the lateral edge of the patella. With normal elevation being 0° to 20°, lack of patellar tilt means the LR is tight, and tilt of >20° means it is loose. MPFL patency can be examined with the Lachman test; the examiner rapidly moves the patella laterally while feeling for the characteristic hard endpoint of lateral translation.
Muscle Balance. The tone, strength, and tightness of the core (abdomen, dorsal, and hip muscles) and lower extremities (quadriceps, hamstrings, gastrocnemius) should be evaluated.
Dynamic Patellar Tracking. The J-sign is the course (shaped like an inverted J) that the patella takes when it is medialized into the trochlea from its laterally displaced resting position as the knee goes from full extension to flexion. The J-sign can be associated with LR tightness, trochlear dysplasia, and patella alta.
Imaging
Although we cannot provide a comprehensive review of the imaging literature, the following radiologic examinations should be used to assess the patellofemoral joint.
30° Lateral Radiograph. Increased tilt is seen when the lateral facet is not anterior to the patellar ridge. Also evaluated are trochlear anatomy, patellar height, and other factors involved in patellofemoral disorders.
30° Flexed Axial (Merchant) Radiograph. Patellar tilt, subluxation, and trochlear dysplasia are evaluated. Images obtained with progressive flexion can be very useful in verifying patellar tilt reduction. Lack of reduction during early flexion suggests LR tightness.4
Alignment Axial Radiographs (Scanogram). Valgus alignment is assessed with this full-length, standing, long-leg examination.
Computed Tomography/Magnetic Resonance Imaging. Many parameters of patellar alignment have been described. Basic assessment should include evaluation of patellar tilt, angle by the line across posterior condyles and a line through the greatest patellar width (>20° indicates abnormality and LR tightness) and tibial tubercle-trochlear groove distance (computed tomography or magnetic resonance imaging scan of the knee is used to measure this distance, and to confirm a significant amount in light of complex patellofemoral malalignment5).
Indications
Lateral compression syndrome with LR tightness is often successfully treated with isolated LRR, and results are reproducible and predictable.6 Surgical intervention for patellofemoral pain should be undertaken only after failed extensive nonoperative treatment with physical therapy and bracing/taping. Patients with LR tightness on preoperative examination, lateral patellar tilt on imaging, and normal Q-angle can obtain satisfactory results with this procedure. Patellar subluxation or dislocation history, high Q-angle (>20°), grade 3 or 4 chondral injury, and patellofemoral arthritis are associated with poorer outcomes when the procedure is performed in isolation.6International Patellofemoral Study Group members agreed that LRR/LRL is a valid treatment option when indicated, but it is rarely performed in isolation and constitutes only 1% to 2% of surgeries performed by this group of experts.7 When lateral compression syndrome progresses to arthritis, LRR/LRL can be performed with lateral patella facetectomy for maximal improvement.4 In the setting of patellofemoral instability, LRR/LRL can be combined with proximal and/or distal realignment surgery if the LR is tight. The LR is the last line of defense limiting lateral translation in the setting of an incompetent MPFL. Isolated LRR/LRL in the setting of instability further destabilizes the patella and worsens the instability. Therefore, LRR/LRL
is a poor surgical option as an isolated procedure for this condition and should be used only as an adjunct in cases of patellofemoral instability with LR tightness that does not allow the patella to be centralized into the trochlea.8 LRR/LRL can also be performed to improve patellar tracking in patellofemoral arthroplasty and total knee arthroplasty.
Lateral Retinaculum Release Versus Lengthening
LRR was first described for the treatment of patellar instability in 1891.9 It was also used for the treatment of lateral patellar hypercompression syndrome associated with LR tightness that led to lateral patellar tracking, joint overload, degeneration, and anterior knee pain.10 Metcalf10 further popularized the procedure by describing a minimally invasive arthroscopic version. However, the arthroscopic technique is as aggressive as the open technique and may be performed with less control, potentially making its results more variable. As proximal and distal releases are performed from the "inside out," more capsule and muscle disruption is needed to release the more superficial layers.
Z-plasty lengthening of the LR was described as an alternative for maintaining lateral patellar soft-tissue integrity while reducing the tension of the lateral tissue restraints.3 This is our preferred method.
Performing LRL instead of LRR avoids iatrogenic medial patellar instability, avoids overrelease and muscle injury, and improves soft-tissue balance.3 Open release or lengthening reduces inadvertent injury to the lateral superior/inferior geniculate arteries and allows direct hemostasis. Two prospective randomized studies found functional knee outcomes and return to athletic activities were improved more after LRL than LRR.11,12 These procedures had similar rates of postoperative knee stiffness, decreased muscle mass, and decreased strength. Each prospective study used an extensive LRR technique for LRR cases (various authors have recommended performing the release until the patella is perpendicular to the trochlea), which may have affected outcomes. In any case, with lengthening, the surgeon is less likely to excessively disrupt the lateral tissues.
Lateral Retinaculum Release. LRR can be openly performed by lateral parapatellar incision,1 a mini-open percutaneous technique, or arthroscopy. For these open techniques, incisions of various sizes have been used to access the LR and incise it about 1 cm lateral to the patella starting at the distal end of the vastus lateralis and extending distally until patellar tilt reduction is sufficient. If tightness in deep flexion persists, the LRR can be extended distally to the tibial tubercle. Open techniques have the advantage of sparing the joint capsule. All-arthroscopic techniques involve using electrocautery to cut through the capsule and access the LR.
Lateral Retinaculum Lengthening.
The LR is sharply divided into a superficial layer of superficial oblique fibers from the anterior iliotibial band and a deep layer of transverse fibers from the femur. For LRR, these 2 layers must be identified separate from the articular capsule.13
Complications
Complications of performing LRR/LRL to change the lateral restraint include medial patellar instability, increased lateral pain, repair failure, recurrent lateral instability, quadriceps weakness and atrophy, postoperative hemarthrosis, knee stiffness, wound complications, and thermal skin injury.7 These complications often result from poor surgical technique and too aggressive release. Although recommended patellar tilt historically has varied from 45° to 90°, the current goal is to normalize the tight soft-tissue restraints without creating secondary instability.
The most significant complication of LRR is medial patellar instability caused by muscle atrophy and loss of soft-tissue restraint.14 Medial instability can be difficult to diagnose and should be considered in any patient with patellofemoral pain, popping, or patellar instability after LRR.15 A positive medial subluxation test or medial patellar apprehension test suggests medial instability.
Medial patellar instability usually requires surgical treatment. Direct LR repair, lateral soft-tissue reconstruction, and other procedures can be used to restore lateral restraint.15 However, these are salvage techniques, and patients often remain significantly limited by pain or instability. Therefore, the LR must be carefully addressed and preferably should undergo lengthening rather than release.
1. Merchant AC, Mercer RL. Lateral release of the patella. A preliminary report. Clin Orthop Relat Res. 1974;(103):40-45.
2. Ceder LC, Larson RL. Z-plasty lateral retinacular release for the treatment of patellar compression syndrome. Clin Orthop Relat Res. 1979;(144):110-113.
3. Biedert R. Lateral patellar hypercompression, tilt and mild lateral subluxation. In: Biedert R, ed. Patellofemoral Disorders. Chichester, England: Wiley; 2004:161-166.
4. Hinckel BB, Arendt EA. Lateral retinaculum lengthening or release. Oper Tech Sports Med. 2015;23(2):100-106.
5. Seitlinger G, Scheurecker G, Högler R, Labey L, Innocenti B, Hofmann S. Tibial tubercle–posterior cruciate ligament distance: a new measurement to define the position of the tibial tubercle in patients with patellar dislocation. Am J Sports Med. 2012;40(5):1119-1125.
6. Lattermann C, Toth J, Bach BR Jr. The role of lateral retinacular release in the treatment of patellar instability. Sports Med Arthrosc. 2007;15(2):57-60.
7. Fithian DC, Paxton EW, Post WR, Panni AS; International Patellofemoral Study Group. Lateral retinacular release: a survey of the International Patellofemoral Study Group. Arthroscopy. 2004;20(5):463-468.
8. Christoforakis J, Bull AM, Strachan RK, Shymkiw R, Senavongse W, Amis AA. Effects of lateral retinacular release on the lateral stability of the patella. Knee Surg Sports Traumatol Arthrosc. 2006;14(3):273-277.
9. Pollard B. Old dislocation of patella by intra-articular operation. Lancet. 1891;(988):17-22.
10. Metcalf RW. An arthroscopic method for lateral release of subluxating or dislocating patella. Clin Orthop Relat Res. 1982;167:9-18.
11. Pagenstert G, Wolf N, Bachmann M, et al. Open lateral patellar retinacular lengthening versus open retinacular release in lateral patellar hypercompression syndrome: a prospective double-blinded comparative study on complications and outcome. Arthroscopy. 2012;28(6):788-797.
12. O’Neill DB. Open lateral retinacular lengthening compared with arthroscopic release. A prospective, randomized outcome study. J Bone Joint Surg Am. 1997;79(12):1759-1769.
13. Merican AM, Amis AA. Anatomy of the lateral retinaculum of the knee. J Bone Joint Surg Br. 2008;90(4):527-534.
14. Hughston JC, Deese M. Medial subluxation of the patella as a complication of lateral retinacular release. Am J Sports Med. 1988;16(4):383-388.
15. McCarthy MA, Bollier MJ. Medial patella subluxation: diagnosis and treatment. Iowa Orthop J. 2015;35:26-33.
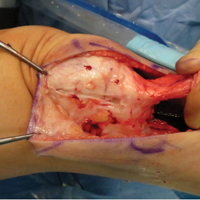
Patella Alta Sees You, Do You See It?
Take-Home Points
The decision to adda TTDO to an MPFL reconstruction is dependent on patellar height as assessed with the CDI, as well as multiple other patient and anatomical factors.
TTDOs that include a complete detachment of the tibial tubercle (as required for distalization) have increased risk of nonunion and hardware failure.
Poor surgical technique (failure to make a flat osteotomy cut, cortical only bone block, poor bony apposition of the detached bone block- particularly at the location of any transverse plane cut, and failure to minimize thermal damage through copious irrigation) can increase nonunion risk.
Postoperative rehabilitation should include a 6-week period of limited weight-bearing.
Reconstruction of the MPFL should be performed after any TTO is performed.
Patellar instability is the result of numerous anatomical factors, including trochlear dysplasia,1,2 patella alta,2-4 and increased tibial tubercle-trochlear groove (TT-TG) or tibial tubercle-posterior cruciate ligament distance.2,5 Of all the factors, TT-TG distance and the medial patellofemoral ligament (MPFL) have received the ost attention. Patellar height remains a crucial yet underappreciated contributor that is amenable to surgical correction with tibial tubercle distalization osteotomy (TTDO). The obvious question is how severe patella alta must be to require surgical correction. In other words, when is patella alta so severe that isolated MPFL reconstruction is insufficient to restore patellar stability?
The indications for TTDO are not completely clear and depend on multiple factors. Patient factors, physical examination findings, and radiographic measures must be considered. In general, adding TTDO to MPFL reconstruction should be considered when the degree of patella alta exceeds 1.4 on the Caton-Deschamps Index (CDI). Presence of trochlear dysplasia, patellar maltracking (J-sign), lateral patellar apprehension that persists at higher flexion angles, and decreased patellotrochlear articular cartilage contact on sagittal magnetic resonance imaging may drive the decision to proceed with TTDO when the CDI is lower.
Why You Need To Know About Patella Alta
Recurrent lateral patellar dislocation is a debilitating knee condition that often involves young, active patients and significantly affects their quality of life. The MPFL is a primary restraint to lateral patellar dislocation, and an MPFL injury is a key contributor to loss of patellar stability. MPFL reconstruction is increasingly being performed to treat recurrent lateral patellar instability.6 Patellar instability is the result of numerous anatomical factors, including trochlear dysplasia,1,2 patella alta,2-4 and increased TT-TG distance.2,5 This review focuses on patella alta.
The classic teaching of the Lyon School of Knee Surgery in France, the menu à la carte, is that patella alta exceeding 1.2 on the CDI is an indication for TTDO.2 Although this teaching is an excellent guide for normal anatomy, we must keep in mind that the classic surgical menu does not consider the influence of MPFL reconstruction, as development of the menu predated this surgical option. At that time, the proximal soft-tissue procedures included vastus medialis obliquus plasty and advancement, which are performed to balance soft tissues and treat patellar tilt. These procedures and MPFL reconstruction have different functions, and the difference may be important. Furthermore, performing TTDO alongside MPFL reconstruction significantly increases the risk of complications and alters the rehabilitation protocol. However, significant untreated patella alta has been implicated as a cause of failure of isolated MPFL reconstruction.7 Establishing when MPFL reconstruction alone is sufficient is therefore crucial in avoiding the increased morbidity associated with the addition of TTDO.
Discussion
Above a certain degree of patella alta, isolated MPFL reconstruction fails to restore patellar stability. What remains unknown is the appropriate CDI cutoff (1.4) and whether the same cutoff can be used for all patients. In 2013, Wagner and colleagues8 assessed the influence of patella alta on isolated MPFL reconstruction outcomes and found no significant difference, though their study did not include many patients with significant alta and was underpowered. In 2014, Feller and colleagues9 reported on a series of patients who were successfully treated with isolated MPFL reconstruction despite patella alta significantly exceeding the traditional CDI cutoff of 1.2. Their indication for performing the isolated procedure was normal patellar tracking—in particular, absence of the J-sign. Further analysis of these patients revealed a preponderance of relatively normal TT-TG distances and low-grade, if any, trochlear dysplasia in comparison with other patients treated with a combination of MPFL reconstruction and tibial tubercle osteotomy.
Together, the work of Wagner and colleagues8 and Feller and colleagues9 suggests the historical use of the CDI of 1.2 as a hard and fast indication for adding TTDO is aggressive. In fact, it is probably the case that there really is no single CDI cutoff that is an appropriate indication for adding TTDO in all patients with instability. This decision is, and should be, influenced by a multitude of other factors, including other anatomical factors, physical examination findings, patient factors, and, of course, patient preference.
An interesting idea to consider in treating patellar instability is the interplay of patella alta and trochlear dysplasia. Patella alta is theorized as contributing to patellar instability in part by delaying entry of the patella into the TG as the knee flexes, therefore requiring less force to laterally displace
the patella.10 Similarly, in the setting of trochlear dysplasia, a shallow TG leads to less bony constraint of the patella, particularly in the groove’s superior portions, which are more involved in lower grade dysplasia. Because trochlear dysplasia and patella alta decrease patellar stability by similar mechanisms, they clearly interact, and a patient with both is at higher risk for instability than a patient who exhibits either in isolation.11 Therefore, trochlear dysplasia, particularly higher grade, may be an indication for adding TTDO at lower CDI.
Other imaging and physical examination factors can provide additional insight into the process of patellar engagement into the trochlea in each patient. The patellotrochlear index (PTI) directly measures the relationship between the patella and the trochlea, rather than relative to the tibia, as with other measures of patellar height.12[[{"fid":"201853","view_mode":"medstat_image_flush_left","attributes":{"class":"media-element file-medstat-image-flush-left","data-delta":"1"},"fields":{"format":"medstat_image_flush_left","field_file_image_caption[und][0][value]":"Figure 1.","field_file_image_credit[und][0][value]":"","field_file_image_caption[und][0][format]":"plain_text","field_file_image_credit[und][0][format]":"plain_text"},"type":"media","field_deltas":{"1":{"format":"medstat_image_flush_left","field_file_image_caption[und][0][value]":"Figure 1.","field_file_image_credit[und][0][value]":""}}}]]The PTI is correlated with tibia-based measures of height, but the correlation is not perfect. Lower degrees of overlap between the patella and the trochlea (PTI <0.15) and significant functional patella alta may warrant adding TTDO in cases of borderline CDI (1.2-1.4). Figures 1A, 1B and 2A, 2B show the imaging of 2 patients with relatively similar patellar height (assessed with CDI) but quite different degrees of overlap between the patella and trochlea. [[{"fid":"201854","view_mode":"medstat_image_flush_right","attributes":{"class":"media-element file-medstat-image-flush-right","data-delta":"2"},"fields":{"format":"medstat_image_flush_right","field_file_image_caption[und][0][value]":"Figure 2.","field_file_image_credit[und][0][value]":"","field_file_image_caption[und][0][format]":"plain_text","field_file_image_credit[und][0][format]":"plain_text"},"type":"media","field_deltas":{"2":{"format":"medstat_image_flush_right","field_file_image_caption[und][0][value]":"Figure 2.","field_file_image_credit[und][0][value]":""}}}]]The patient with less overlap is more likely to have delayed patellar engagement and symptomatic patella alta and thus may be a poorer candidate for isolated MPFL reconstruction. For additional information, please refer to the work by Roland Biedert, MD, who has proposed trochlear lengthening in these situations.13
Physical examination (even in the era of advance imaging) continues to provide useful insight into whether to add TTDO. One physical examination test that can help in understanding patellar-
trochlear dynamics is the patellar apprehension and relief test. Patellar apprehension has been widely discussed, but equally important is the degree of knee flexion above which apprehension dissipates. As patella alta and trochlear dysplasia become more severe, more knee flexion is required to relieve apprehension. Apprehension that is relieved at 30° to 40° of flexion suggests that patellar stability stands a good chance of being restored with isolated MPFL reconstruction, whereas persistent instability >45° or especially 60° of knee flexion suggests that there is significant patella alta, trochlear dysplasia, or both and that TTDO should be added. A large J-sign during knee flexion and extension provides further evidence that entry of the patella into the TG is delayed, typically because of patella alta, trochlear dysplasia, or both, and possibly tight lateral structures or a lateralized tibial tubercle. This sign is another clue that isolated MPFL reconstruction may be insufficient to completely restore patellar stability.
1. Dejour H, Walch G, Neyret P, Adeleine P. Dysplasia of the femoral trochlea [in French]. Rev Chir Orthop Reparatrice Appar Mot. 1990;76(1):45-54.
2. Dejour H, Walch G, Nove-Josserand L, Guier C. Factors of patellar instability: an anatomic radiographic study. Knee Surg Sports Traumatol Arthrosc. 1994;2(1):19-26.
3. Geenen E, Molenaers G, Martens M. Patella alta in patellofemoral instability. Acta Orthop Belg. 1989;55(3):387-393.
4. Simmons E Jr, Cameron JC. Patella alta and recurrent dislocation of the patella. Clin Orthop Relat Res. 1992;(274):265-269.
5. Goutallier D, Bernageau J, Lecudonnec B. The measurement of the tibial tuberosity. Patella groove distanced technique and results (author’s transl) [in French]. Rev Chir Orthop Reparatrice Appar Mot. 1978;64(5):423-428.
6. Feller JA, Lind M, Nelson J, Diduch DR, Arendt E. Repair and reconstruction of the medial patellofemoral ligament for treatment of lateral patellar dislocations. In: Scott WN, ed. Insall & Scott—Surgery of the Knee. 5th ed. Philadelphia, PA: Churchill Livingstone; 2011:677-687.
7. Thaunat M, Erasmus PJ. Recurrent patellar dislocation after medial patellofemoral ligament reconstruction. Knee Surg Sports Traumatol Arthrosc. 2008;16(1):40-43.
8. Wagner D, Pfalzer F, Hingelbaum S, Huth J, Mauch F, Bauer G. The influence of risk factors on clinical outcomes following anatomical medial patellofemoral ligament (MPFL) reconstruction using the gracilis tendon. Knee Surg Sports Traumatol Arthrosc. 2013;21(2):318-324.
9. Feller JA, Richmond AK, Wasiak J. Medial patellofemoral ligament reconstruction as an isolated or combined procedure for recurrent patellar instability. Knee Surg Sports Traumatol Arthrosc. 2014;22(10):2470-2476.
10. Ward SR, Terk MR, Powers CM. Patella alta: association
with patellofemoral alignment and changes in contact area during weight-bearing. J Bone Joint Surg Am. 2007;89(8):
1749-1755.
11. Lewallen L, McIntosh A, Dahm D. First-time patellofemoral dislocation: risk factors for recurrent instability. J Knee Surg. 2015;28(4):303-309
12. Biedert RM, Albrecht S. The patellotrochlear index: a new index for assessing patellar height. Knee Surg Sports Traumatol Arthrosc. 2006;14(8):707-712.
13. Biedert RM. Trochlear lengthening osteotomy with or without elevation of the lateral trochlear facet. In: Zaffagnini S, Dejour D, Arendt EA, eds. Patellofemoral Pain, Instability, and Arthritis. Germany: Springer-Verlag Berlin Heidelberg; 2010:
209-215.
Take-Home Points
The decision to adda TTDO to an MPFL reconstruction is dependent on patellar height as assessed with the CDI, as well as multiple other patient and anatomical factors.
TTDOs that include a complete detachment of the tibial tubercle (as required for distalization) have increased risk of nonunion and hardware failure.
Poor surgical technique (failure to make a flat osteotomy cut, cortical only bone block, poor bony apposition of the detached bone block- particularly at the location of any transverse plane cut, and failure to minimize thermal damage through copious irrigation) can increase nonunion risk.
Postoperative rehabilitation should include a 6-week period of limited weight-bearing.
Reconstruction of the MPFL should be performed after any TTO is performed.
Patellar instability is the result of numerous anatomical factors, including trochlear dysplasia,1,2 patella alta,2-4 and increased tibial tubercle-trochlear groove (TT-TG) or tibial tubercle-posterior cruciate ligament distance.2,5 Of all the factors, TT-TG distance and the medial patellofemoral ligament (MPFL) have received the ost attention. Patellar height remains a crucial yet underappreciated contributor that is amenable to surgical correction with tibial tubercle distalization osteotomy (TTDO). The obvious question is how severe patella alta must be to require surgical correction. In other words, when is patella alta so severe that isolated MPFL reconstruction is insufficient to restore patellar stability?
The indications for TTDO are not completely clear and depend on multiple factors. Patient factors, physical examination findings, and radiographic measures must be considered. In general, adding TTDO to MPFL reconstruction should be considered when the degree of patella alta exceeds 1.4 on the Caton-Deschamps Index (CDI). Presence of trochlear dysplasia, patellar maltracking (J-sign), lateral patellar apprehension that persists at higher flexion angles, and decreased patellotrochlear articular cartilage contact on sagittal magnetic resonance imaging may drive the decision to proceed with TTDO when the CDI is lower.
Why You Need To Know About Patella Alta
Recurrent lateral patellar dislocation is a debilitating knee condition that often involves young, active patients and significantly affects their quality of life. The MPFL is a primary restraint to lateral patellar dislocation, and an MPFL injury is a key contributor to loss of patellar stability. MPFL reconstruction is increasingly being performed to treat recurrent lateral patellar instability.6 Patellar instability is the result of numerous anatomical factors, including trochlear dysplasia,1,2 patella alta,2-4 and increased TT-TG distance.2,5 This review focuses on patella alta.
The classic teaching of the Lyon School of Knee Surgery in France, the menu à la carte, is that patella alta exceeding 1.2 on the CDI is an indication for TTDO.2 Although this teaching is an excellent guide for normal anatomy, we must keep in mind that the classic surgical menu does not consider the influence of MPFL reconstruction, as development of the menu predated this surgical option. At that time, the proximal soft-tissue procedures included vastus medialis obliquus plasty and advancement, which are performed to balance soft tissues and treat patellar tilt. These procedures and MPFL reconstruction have different functions, and the difference may be important. Furthermore, performing TTDO alongside MPFL reconstruction significantly increases the risk of complications and alters the rehabilitation protocol. However, significant untreated patella alta has been implicated as a cause of failure of isolated MPFL reconstruction.7 Establishing when MPFL reconstruction alone is sufficient is therefore crucial in avoiding the increased morbidity associated with the addition of TTDO.
Discussion
Above a certain degree of patella alta, isolated MPFL reconstruction fails to restore patellar stability. What remains unknown is the appropriate CDI cutoff (1.4) and whether the same cutoff can be used for all patients. In 2013, Wagner and colleagues8 assessed the influence of patella alta on isolated MPFL reconstruction outcomes and found no significant difference, though their study did not include many patients with significant alta and was underpowered. In 2014, Feller and colleagues9 reported on a series of patients who were successfully treated with isolated MPFL reconstruction despite patella alta significantly exceeding the traditional CDI cutoff of 1.2. Their indication for performing the isolated procedure was normal patellar tracking—in particular, absence of the J-sign. Further analysis of these patients revealed a preponderance of relatively normal TT-TG distances and low-grade, if any, trochlear dysplasia in comparison with other patients treated with a combination of MPFL reconstruction and tibial tubercle osteotomy.
Together, the work of Wagner and colleagues8 and Feller and colleagues9 suggests the historical use of the CDI of 1.2 as a hard and fast indication for adding TTDO is aggressive. In fact, it is probably the case that there really is no single CDI cutoff that is an appropriate indication for adding TTDO in all patients with instability. This decision is, and should be, influenced by a multitude of other factors, including other anatomical factors, physical examination findings, patient factors, and, of course, patient preference.
An interesting idea to consider in treating patellar instability is the interplay of patella alta and trochlear dysplasia. Patella alta is theorized as contributing to patellar instability in part by delaying entry of the patella into the TG as the knee flexes, therefore requiring less force to laterally displace
the patella.10 Similarly, in the setting of trochlear dysplasia, a shallow TG leads to less bony constraint of the patella, particularly in the groove’s superior portions, which are more involved in lower grade dysplasia. Because trochlear dysplasia and patella alta decrease patellar stability by similar mechanisms, they clearly interact, and a patient with both is at higher risk for instability than a patient who exhibits either in isolation.11 Therefore, trochlear dysplasia, particularly higher grade, may be an indication for adding TTDO at lower CDI.
Other imaging and physical examination factors can provide additional insight into the process of patellar engagement into the trochlea in each patient. The patellotrochlear index (PTI) directly measures the relationship between the patella and the trochlea, rather than relative to the tibia, as with other measures of patellar height.12[[{"fid":"201853","view_mode":"medstat_image_flush_left","attributes":{"class":"media-element file-medstat-image-flush-left","data-delta":"1"},"fields":{"format":"medstat_image_flush_left","field_file_image_caption[und][0][value]":"Figure 1.","field_file_image_credit[und][0][value]":"","field_file_image_caption[und][0][format]":"plain_text","field_file_image_credit[und][0][format]":"plain_text"},"type":"media","field_deltas":{"1":{"format":"medstat_image_flush_left","field_file_image_caption[und][0][value]":"Figure 1.","field_file_image_credit[und][0][value]":""}}}]]The PTI is correlated with tibia-based measures of height, but the correlation is not perfect. Lower degrees of overlap between the patella and the trochlea (PTI <0.15) and significant functional patella alta may warrant adding TTDO in cases of borderline CDI (1.2-1.4). Figures 1A, 1B and 2A, 2B show the imaging of 2 patients with relatively similar patellar height (assessed with CDI) but quite different degrees of overlap between the patella and trochlea. [[{"fid":"201854","view_mode":"medstat_image_flush_right","attributes":{"class":"media-element file-medstat-image-flush-right","data-delta":"2"},"fields":{"format":"medstat_image_flush_right","field_file_image_caption[und][0][value]":"Figure 2.","field_file_image_credit[und][0][value]":"","field_file_image_caption[und][0][format]":"plain_text","field_file_image_credit[und][0][format]":"plain_text"},"type":"media","field_deltas":{"2":{"format":"medstat_image_flush_right","field_file_image_caption[und][0][value]":"Figure 2.","field_file_image_credit[und][0][value]":""}}}]]The patient with less overlap is more likely to have delayed patellar engagement and symptomatic patella alta and thus may be a poorer candidate for isolated MPFL reconstruction. For additional information, please refer to the work by Roland Biedert, MD, who has proposed trochlear lengthening in these situations.13
Physical examination (even in the era of advance imaging) continues to provide useful insight into whether to add TTDO. One physical examination test that can help in understanding patellar-
trochlear dynamics is the patellar apprehension and relief test. Patellar apprehension has been widely discussed, but equally important is the degree of knee flexion above which apprehension dissipates. As patella alta and trochlear dysplasia become more severe, more knee flexion is required to relieve apprehension. Apprehension that is relieved at 30° to 40° of flexion suggests that patellar stability stands a good chance of being restored with isolated MPFL reconstruction, whereas persistent instability >45° or especially 60° of knee flexion suggests that there is significant patella alta, trochlear dysplasia, or both and that TTDO should be added. A large J-sign during knee flexion and extension provides further evidence that entry of the patella into the TG is delayed, typically because of patella alta, trochlear dysplasia, or both, and possibly tight lateral structures or a lateralized tibial tubercle. This sign is another clue that isolated MPFL reconstruction may be insufficient to completely restore patellar stability.
1. Dejour H, Walch G, Neyret P, Adeleine P. Dysplasia of the femoral trochlea [in French]. Rev Chir Orthop Reparatrice Appar Mot. 1990;76(1):45-54.
2. Dejour H, Walch G, Nove-Josserand L, Guier C. Factors of patellar instability: an anatomic radiographic study. Knee Surg Sports Traumatol Arthrosc. 1994;2(1):19-26.
3. Geenen E, Molenaers G, Martens M. Patella alta in patellofemoral instability. Acta Orthop Belg. 1989;55(3):387-393.
4. Simmons E Jr, Cameron JC. Patella alta and recurrent dislocation of the patella. Clin Orthop Relat Res. 1992;(274):265-269.
5. Goutallier D, Bernageau J, Lecudonnec B. The measurement of the tibial tuberosity. Patella groove distanced technique and results (author’s transl) [in French]. Rev Chir Orthop Reparatrice Appar Mot. 1978;64(5):423-428.
6. Feller JA, Lind M, Nelson J, Diduch DR, Arendt E. Repair and reconstruction of the medial patellofemoral ligament for treatment of lateral patellar dislocations. In: Scott WN, ed. Insall & Scott—Surgery of the Knee. 5th ed. Philadelphia, PA: Churchill Livingstone; 2011:677-687.
7. Thaunat M, Erasmus PJ. Recurrent patellar dislocation after medial patellofemoral ligament reconstruction. Knee Surg Sports Traumatol Arthrosc. 2008;16(1):40-43.
8. Wagner D, Pfalzer F, Hingelbaum S, Huth J, Mauch F, Bauer G. The influence of risk factors on clinical outcomes following anatomical medial patellofemoral ligament (MPFL) reconstruction using the gracilis tendon. Knee Surg Sports Traumatol Arthrosc. 2013;21(2):318-324.
9. Feller JA, Richmond AK, Wasiak J. Medial patellofemoral ligament reconstruction as an isolated or combined procedure for recurrent patellar instability. Knee Surg Sports Traumatol Arthrosc. 2014;22(10):2470-2476.
10. Ward SR, Terk MR, Powers CM. Patella alta: association
with patellofemoral alignment and changes in contact area during weight-bearing. J Bone Joint Surg Am. 2007;89(8):
1749-1755.
11. Lewallen L, McIntosh A, Dahm D. First-time patellofemoral dislocation: risk factors for recurrent instability. J Knee Surg. 2015;28(4):303-309
12. Biedert RM, Albrecht S. The patellotrochlear index: a new index for assessing patellar height. Knee Surg Sports Traumatol Arthrosc. 2006;14(8):707-712.
13. Biedert RM. Trochlear lengthening osteotomy with or without elevation of the lateral trochlear facet. In: Zaffagnini S, Dejour D, Arendt EA, eds. Patellofemoral Pain, Instability, and Arthritis. Germany: Springer-Verlag Berlin Heidelberg; 2010:
209-215.
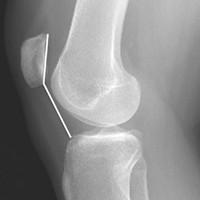
Cartilage Restoration in the Patellofemoral Joint
Take-Home Points
- Careful evaluation is key in attributing knee pain to patellofemoral cartilage lesions-that is, in making a "diagnosis by exclusion".
- Initial treatment is nonoperative management focused on weight loss and extensive "core-to-floor" rehabilitation.
- Optimization of anatomy and biomechanics is crucial.
- Factors important in surgical decision-making incude defect location and size, subchondral bone status, unipolar vs bipolar lesions, and previous cartilage procedure.
- The most commonly used surgical procedures-autologous chondrocyte implantation, osteochondral autograft transfer, and osteochondral allograft-have demonstrated improved intermediate-term outcomes.
Patellofemoral (PF) pain is often a component of more general anterior knee pain. One source of PF pain is chondral lesions. As these lesions are commonly seen on magnetic resonance imaging (MRI) and during arthroscopy, it is necessary to differentiate incidental and symptomatic lesions.1 In addition, the correlation between symptoms and lesion presence and severity is poor.
PF pain is multifactorial (structural lesions, malalignment, deconditioning, muscle imbalance and overuse) and can coexist with other lesions in the knee (ligament tears, meniscal injuries, and cartilage lesions in other compartments). Therefore, careful evaluation is key in attributing knee pain to PF cartilage lesions—that is, in making a "diagnosis by exclusion."
From the start, it must be appreciated that the vast majority of patients will not require surgery, and many who require surgery for pain will not require cartilage restoration. One key to success with PF patients is a good working relationship with an experienced physical therapist.
Etiology
The primary causes of PF cartilage lesions are patellar instability, chronic maltracking without instability, direct trauma, repetitive microtrauma, and idiopathic.
Patellar Instability
Patients with patellar instability often present with underlying anatomical risk factors (eg, trochlear dysplasia, increased Q-angle/tibial tubercle-trochlear groove [TT-TG] distance, patella alta, and unbalanced medial and lateral soft tissues2). These factors should be addressed before surgery.
Patellar instability can cause cartilage damage during the dislocation event or by chronic subluxation. Cartilage becomes damaged in up to 96% of patellar dislocations.3 Most commonly, the damage consists of fissuring and/or fibrillation, but chondral and osteochondral fractures can occur as well. During dislocation, the medial patella strikes the lateral aspect of the femur, and, as the knee collapses into flexion, the lateral aspect of the proximal lateral femoral condyle (weight-bearing area) can sustain damage. In the patella, typically the injury is distal-medial (occasionally crossing the median ridge). A shear lesion may involve the chondral surface or be osteochondral (Figure 1A). 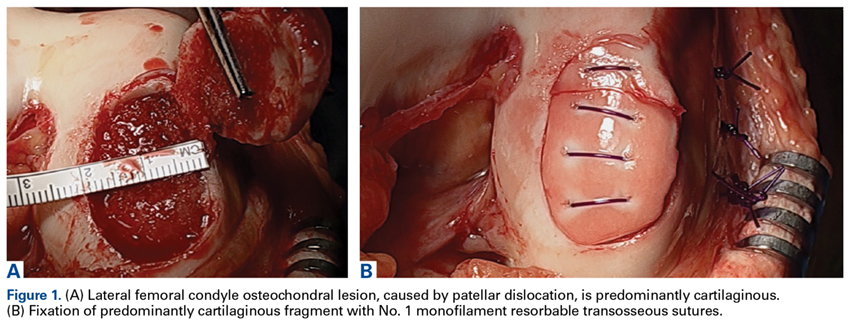
Chronic Maltracking Without Instability
Chronic maltracking is usually related to anatomical abnormalities, which include the same factors that can cause patellar instability. A common combination is trochlear dysplasia, increased TT-TG or TT-posterior cruciate ligament distance, and lateral soft-tissue contracture. These are often seen in PF joints that progress to lateral PF arthritis. As lateral PF arthritis progresses, lateral soft-tissue contracture worsens, compounding symptoms of laterally based pain. With respect to cartilage repair, these joints can be treated if recognized early; however, once osteoarthritis is fully established in the joint, facetectomy or PF replacement may be necessary.
Direct Trauma
With the knee in flexion during a direct trauma over the patella (eg, fall or dashboard trauma), all zones of cartilage and subchondral bone in both patella and trochlea can be injured, leading to macrostructural damage, chondral/osteochondral fracture, or, with a subcritical force, microstructural damage and chondrocyte death, subsequently causing cartilage degeneration (cartilage may look normal initially; the matrix takes months to years to deteriorate). Direct trauma usually occurs with the knee flexed. Therefore, these lesions typically are located in the distal trochlea and superior pole of the patella.
Repetitive Microtrauma
Minor injuries, which by themselves do not immediately cause apparent chondral or osteochondral fractures, may eventually exceed the capacity of natural cartilage homeostasis and result in repetitive microtrauma. Common causes are repeated jumping (as in basketball and volleyball) and prolonged flexed-knee position (eg, what a baseball catcher experiences), which may also be associated with other lesions caused by extensor apparatus overload (eg, quadriceps tendon or patellar tendon tendinitis, and fat pad impingement syndrome).
Idiopathic
In a subset of patients with osteochondritis dissecans, the patella is the lesion site. In another subset, idiopathic lesions may be related to a genetic predisposition to osteoarthritis and may not be restricted to the PF joint. In some cases, the PF joint is the first compartment to degenerate and is the most symptomatic in a setting of truly tricompartmental disease. In these cases, treating only the PF lesion can result in functional failure, owing to disease progression in other compartments. Even mild disease in other compartments should be carefully evaluated.
History and Physical Examination
Patients often report a history of anterior knee pain that worsens with stair use, prolonged sitting, and flexed-knee activities (eg, squatting). Compared with pain alone, swelling, though not specific to cartilage disease, is more suspicious for a cartilage etiology. Identifying the cartilage defect as the sole source of pain is particularly difficult in patients with recurrent patellar instability. In these patients, pain and swelling, even between instability episodes, suggest that cartilage damage is at least a component of the symptomology.
Important diagnostic components of physical examination are gait analysis, tibiofemoral alignment, and patellar alignment in all 3 planes, both static and functional. Patella-specific measurements include medial-lateral position and quadrants of excursion, lateral tilt, and patella alta, as well as J-sign and subluxation with quadriceps contraction in extension.
It is also important to document effusion; crepitus; active and passive range of motion (spine, hips, knees); site of pain or tenderness to palpation (medial, lateral, distal, retropatellar) and whether it matches the complaints and the location of the cartilage lesion; results of the grind test (placing downward force on the patella during flexion and extension) and whether they match the flexion angle of the tenderness and the flexion angle in which the cartilage lesion has increased PF contact; ligamentous and soft-tissue stability or imbalance (tibiofemoral and patellar; apprehension test, glide test, tilt test); and muscle strength, flexibility, and atrophy of the core (abdomen, dorsal and hip muscles) and lower extremities (quadriceps, hamstrings, gastrocnemius).
Imaging
Imaging should be used to evaluate both PF alignment and the cartilage lesions. For alignment, standard radiographs (weight-bearing knee sequence and axial view; full limb length when needed), computed tomography, and MRI can be used.
Meaningful evaluation requires MRI with cartilage-specific sequences, including standard spin-echo (SE) and gradient-recalled echo (GRE), fast SE, and, for cartilage morphology, T2-weighted fat suppression (FS) and 3-dimensional SE and GRE.5 For evaluation of cartilage function and metabolism, the collagen network, and proteoglycan content in the knee cartilage matrix, consideration should be given to compositional assessment techniques, such as T2 mapping, delayed gadolinium-enhanced MRI of cartilage, T1ρ imaging, sodium imaging, and diffusion-weighted sequences.5 Use of the latter functional sequences is still debatable, and these sequences are not widely available.
Treatment
In general, the initial approach is nonoperative management focused on weight loss and extensive core-to-floor rehabilitation, unless surgery is specifically indicated (eg, for loose body removal or osteochondral fracture reattachment). Rehabilitation focuses on achieving adequate range of motion of the spine, hips, and knees along with muscle strength and flexibility of the core (abdomen, dorsal and hip muscles) and lower limbs (quadriceps, hamstrings, gastrocnemius). Rehabilitation is not defined by time but rather by development of an optimized soft-tissue envelope that decreases joint reactive forces. The full process can take 6 to 9 months, but there should be some improvement by 3 months.
Corticosteroid, hyaluronic acid,6 or platelet-rich plasma7 injections can provide temporary relief and facilitate rehabilitation in the setting of pain inhibition. As stand-alone treatment, injections are more suitable for more diffuse degenerative lesions in older and low-demand patients than for focal traumatic lesions in young and high-demand patients.
Surgery is indicated for full-thickness or nearly full-thickness lesions (International Cartilage Repair Society grade 3a or higher) >1 cm2 after failed conservative treatment.
Optimization of anatomy and biomechanics is crucial, as persistent abnormalities lead to high rates of failure of cartilage procedures, and correction of those factors results in outcomes similar to those of patients without such abnormal anatomy.8 The procedures most commonly used to improve patellar tracking or unloading in the PF compartment are lateral retinacular lengthening and TT transfer: medialization and/or distalization for correction of malalignment, and straight anteriorization or anteromedialization for unloading. These procedures can improve symptoms and function in lateral and distal patellar and trochlear lesions even without the addition of a cartilage restoration procedure.
Factors that are important in surgical decision-making include defect location and size, subchondral bone status, unipolar vs bipolar lesions, and previous cartilage procedure.
Location. The shapes of the patella and trochlea vary much more than the shapes of the condyles and plateaus. This variability complicates morphology matching, particularly with involvement of the central TG and median patellar ridge. Therefore, focal contained lesions of the patella and trochlea may be more technically amenable to cell therapy techniques than to osteochondral procedures, which require contour matching between donor and recipient
Size. Although small lesions in the femoral condyles can be considered for microfracture (MFx) or osteochondral autograft transfer (OAT), MFx is less suitable because of poor results in the PF joint, and OAT because of donor-site morbidity in the trochlea.
Subchondral bone status. When subchondral bone is compromised, such as with bone loss, cysts, or significant bone edema, the entire osteochondral unit should be treated. Here, OAT and osteochondral allograft (OCA) are the preferred treatments, depending on lesion size.
Unipolar vs bipolar lesions. Compared with unipolar lesions, bipolar lesions tend to have worse outcomes. Therefore, an associated unloading procedure (TT osteotomy) should be given special consideration. Autologous chondrocyte implantation (ACI) appears to have better outcomes than OCA for bipolar PF lesions.9,10
Previous surgery. Although a failed cartilage procedure can negatively affect ACI outcomes, particularly in the presence of intralesional osteophytes,11 it does not affect OCA outcomes.12 Therefore, after previous MFx, OCA instead of ACI may be considered.
Fragment Fixation
Viable fragments from traumatic lesions (direct trauma or patellar dislocation) or osteochondritis dissecans should be repaired if possible, particularly in young patients. In a fragment that contains a substantial amount of bone, compression screws provide stable fixation. More recently, it has been recognized that fixation of predominantly cartilaginous fragments can be successful13 (Figure 1B). Débridement of soft tissue in the lesion bed and on the fragment is important in facilitating healing, as is removal of sclerotic bone.
MFx
Although MFx can have good outcomes in small contained femoral condyle lesions, in the PF joint treatment has been more challenging, and clinical outcomes have been poor (increased subchondral edema, increased effusion).14 In addition, deterioration becomes significant after 36 months. Therefore, MFx should be restricted to small (<2 cm2), well-contained trochlear defects, particularly in low-demand patients.
ACI and Matrix-Induced ACI
As stated, ACI (Figure 2) is suitable for PF joints because it intrinsically respects the complex anatomy. 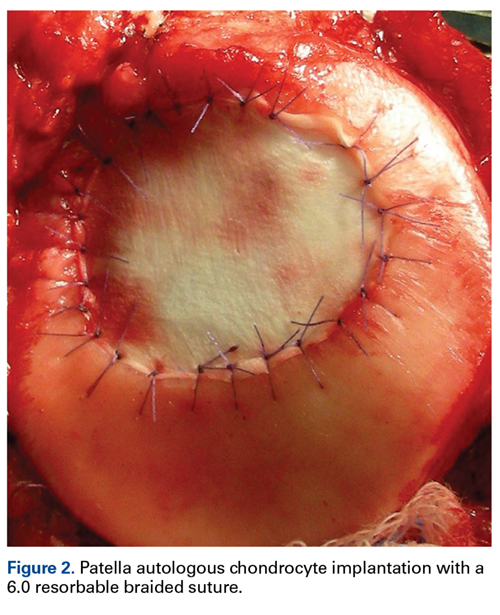
OAT
As mentioned, donor-site morbidity may compromise final outcomes of harvest and implantation in the PF joint. Nonetheless, in carefully selected patients with small lesions that are limited to 1 facet (not including the patellar ridge or the TG) and that require only 1 plug (Figure 3), OAT can have good clinical results.16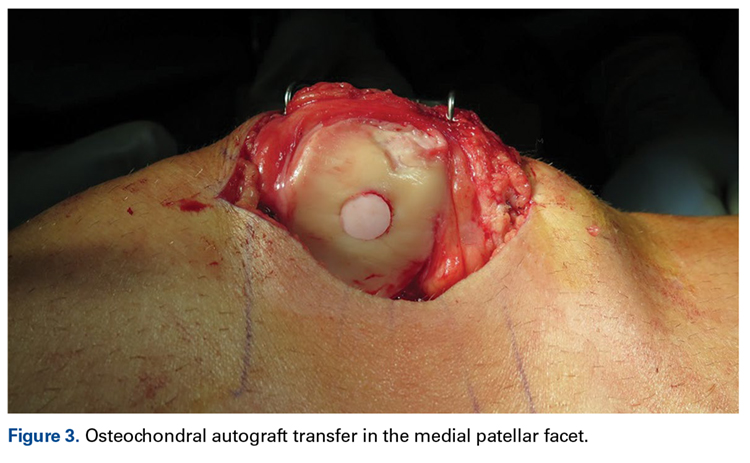
OCA
Two techniques can be used with OCA in the PF joint. The dowel technique, in which circular plugs are implanted, is predominantly used for defects that do not cross the midline (those located in their entirety on the medial or lateral aspect of the patella or trochlea). Central defects, which can be treated with the dowel technique as well, are technically more challenging to match perfectly, because of the complex geometry of the median ridge and the TG (Figure 4). 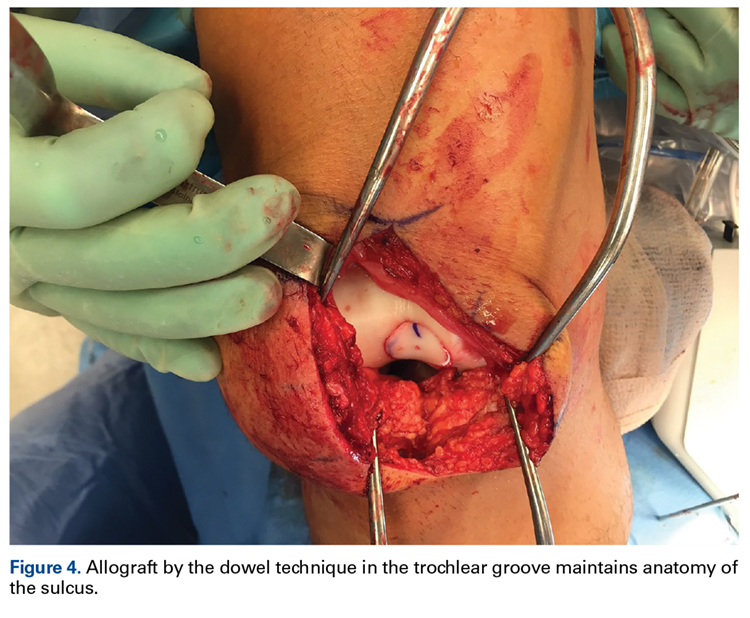
Experimental and Emerging Technologies
Biocartilage
Biocartilage, a dehydrated, micronized allogeneic cartilage scaffold implanted with platelet-rich plasma and fibrin glue added over a contained MFx-treated defect, can be used in the patella and trochlea and has the same indications as MFx (small lesions, contained lesions). There are limited clinical studies of short- or long-term outcomes.
Fresh and Viable OCA
Fresh OCA (ProChondrix; AlloSource) and viable/cryopreserved OCA (Cartiform; Arthrex) are thin osteochondral scaffolds that contain viable chondrocytes and growth factors. They can be implanted alone or used with MFx, and are indicated for lesions measuring 1 cm2 to 3 cm2. Aside from a case report,17 there are no clinical studies on outcomes.
Bone Marrow Aspirate Concentrate Implantation
Bone marrow aspirate concentrate from centrifuged iliac crest–harvested aspirate containing mesenchymal stem cells with chondrogenic potential is applied under a synthetic scaffold. Indications are the same as for ACI. Medium-term follow-up studies in the PF joint have shown good results, similar to those obtained with matrix-induced ACI.18
Particulated Juvenile Allograft Cartilage
Particulated juvenile allograft cartilage (DeNovo NT Graft; Zimmer Biomet) is minced cartilage allograft (from juvenile donors) that has been cut into cubes (~1 mm3). Indications are for patellar and trochlear lesions 1 cm2 to 6 cm2. For both the trochlea and the patella, short-term outcomes have been good.19,20
Rehabilitation After Surgery
Isolated PF cartilage restoration generally does not require prolonged weight-bearing restrictions, and ambulation with the knee locked in full extension is permitted as tolerated. Concurrent TT osteotomy, however, requires protection with 4 to 6 weeks of toe-touch weight-bearing to minimize the risk of tibial fracture.
Conclusion
Comprehensive preoperative assessment is essential and should include a thorough core-to-floor physical examination as well as PF-specific imaging. Treatment of symptomatic chondral lesions in the PF joint requires specific technical and postoperative management, which differs significantly from management involving the condyles. Attending to all these details makes the outcomes of PF cartilage treatment reproducible. These outcomes may rival those of condylar treatment.
1. Curl WW, Krome J, Gordon ES, Rushing J, Smith BP, Poehling GG. Cartilage injuries: a review of 31,516 knee arthroscopies. Arthroscopy. 1997;13(4):456-460.
2. Steensen RN, Bentley JC, Trinh TQ, Backes JR, Wiltfong RE. The prevalence and combined prevalences of anatomic factors associated with recurrent patellar dislocation: a magnetic resonance imaging study. Am J Sports Med. 2015;43(4):921-927.
3. Nomura E, Inoue M. Cartilage lesions of the patella in recurrent patellar dislocation. Am J Sports Med. 2004;32(2):498-502.
4. Vollnberg B, Koehlitz T, Jung T, et al. Prevalence of cartilage lesions and early osteoarthritis in patients with patellar dislocation. Eur Radiol. 2012;22(11):2347-2356.
5. Crema MD, Roemer FW, Marra MD, et al. Articular cartilage in the knee: current MR imaging techniques and applications in clinical practice and research. Radiographics. 2011;31(1):37-61.
6. Campbell KA, Erickson BJ, Saltzman BM, et al. Is local viscosupplementation injection clinically superior to other therapies in the treatment of osteoarthritis of the knee: a systematic review of overlapping meta-analyses. Arthroscopy. 2015;31(10):2036-2045.e14.
7. Saltzman BM, Jain A, Campbell KA, et al. Does the use of platelet-rich plasma at the time of surgery improve clinical outcomes in arthroscopic rotator cuff repair when compared with control cohorts? A systematic review of meta-analyses. Arthroscopy. 2016;32(5):906-918.
8. Gomoll AH, Gillogly SD, Cole BJ, et al. Autologous chondrocyte implantation in the patella: a multicenter experience. Am J Sports Med. 2014;42(5):1074-1081.
9. Meric G, Gracitelli GC, Gortz S, De Young AJ, Bugbee WD. Fresh osteochondral allograft transplantation for bipolar reciprocal osteochondral lesions of the knee. Am J Sports Med. 2015;43(3):709-714.
10. Peterson L, Vasiliadis HS, Brittberg M, Lindahl A. Autologous chondrocyte implantation: a long-term follow-up. Am J Sports Med. 2010;38(6):1117-1124.
11. Minas T, Gomoll AH, Rosenberger R, Royce RO, Bryant T. Increased failure rate of autologous chondrocyte implantation after previous treatment with marrow stimulation techniques. Am J Sports Med. 2009;37(5):902-908.
12. Gracitelli GC, Meric G, Briggs DT, et al. Fresh osteochondral allografts in the knee: comparison of primary transplantation versus transplantation after failure of previous subchondral marrow stimulation. Am J Sports Med. 2015;43(4):885-891.
13. Anderson CN, Magnussen RA, Block JJ, Anderson AF, Spindler KP. Operative fixation of chondral loose bodies in osteochondritis dissecans in the knee: a report of 5 cases. Orthop J Sports Med. 2013;1(2):2325967113496546.
14. Kreuz PC, Steinwachs MR, Erggelet C, et al. Results after microfracture of full-thickness chondral defects in different compartments in the knee. Osteoarthritis Cartilage. 2006;14(11):1119-1125.
15. Vasiliadis HS, Lindahl A, Georgoulis AD, Peterson L. Malalignment and cartilage lesions in the patellofemoral joint treated with autologous chondrocyte implantation. Knee Surg Sports Traumatol Arthrosc. 2011;19(3):452-457.
16. Astur DC, Arliani GG, Binz M, et al. Autologous osteochondral transplantation for treating patellar chondral injuries: evaluation, treatment, and outcomes of a two-year follow-up study. J Bone Joint Surg Am. 2014;96(10):816-823.
17. Hoffman JK, Geraghty S, Protzman NM. Articular cartilage repair using marrow simulation augmented with a viable chondral allograft: 9-month postoperative histological evaluation. Case Rep Orthop. 2015;2015:617365.
18. Gobbi A, Chaurasia S, Karnatzikos G, Nakamura N. Matrix-induced autologous chondrocyte implantation versus multipotent stem cells for the treatment of large patellofemoral chondral lesions: a nonrandomized prospective trial. Cartilage. 2015;6(2):82-97.
19. Farr J, Tabet SK, Margerrison E, Cole BJ. Clinical, radiographic, and histological outcomes after cartilage repair with particulated juvenile articular cartilage: a 2-year prospective study. Am J Sports Med. 2014;42(6):1417-1425.
20. Tompkins M, Hamann JC, Diduch DR, et al. Preliminary results of a novel single-stage cartilage restoration technique: particulated juvenile articular cartilage allograft for chondral defects of the patella. Arthroscopy. 2013;29(10):1661-1670.
Take-Home Points
- Careful evaluation is key in attributing knee pain to patellofemoral cartilage lesions-that is, in making a "diagnosis by exclusion".
- Initial treatment is nonoperative management focused on weight loss and extensive "core-to-floor" rehabilitation.
- Optimization of anatomy and biomechanics is crucial.
- Factors important in surgical decision-making incude defect location and size, subchondral bone status, unipolar vs bipolar lesions, and previous cartilage procedure.
- The most commonly used surgical procedures-autologous chondrocyte implantation, osteochondral autograft transfer, and osteochondral allograft-have demonstrated improved intermediate-term outcomes.
Patellofemoral (PF) pain is often a component of more general anterior knee pain. One source of PF pain is chondral lesions. As these lesions are commonly seen on magnetic resonance imaging (MRI) and during arthroscopy, it is necessary to differentiate incidental and symptomatic lesions.1 In addition, the correlation between symptoms and lesion presence and severity is poor.
PF pain is multifactorial (structural lesions, malalignment, deconditioning, muscle imbalance and overuse) and can coexist with other lesions in the knee (ligament tears, meniscal injuries, and cartilage lesions in other compartments). Therefore, careful evaluation is key in attributing knee pain to PF cartilage lesions—that is, in making a "diagnosis by exclusion."
From the start, it must be appreciated that the vast majority of patients will not require surgery, and many who require surgery for pain will not require cartilage restoration. One key to success with PF patients is a good working relationship with an experienced physical therapist.
Etiology
The primary causes of PF cartilage lesions are patellar instability, chronic maltracking without instability, direct trauma, repetitive microtrauma, and idiopathic.
Patellar Instability
Patients with patellar instability often present with underlying anatomical risk factors (eg, trochlear dysplasia, increased Q-angle/tibial tubercle-trochlear groove [TT-TG] distance, patella alta, and unbalanced medial and lateral soft tissues2). These factors should be addressed before surgery.
Patellar instability can cause cartilage damage during the dislocation event or by chronic subluxation. Cartilage becomes damaged in up to 96% of patellar dislocations.3 Most commonly, the damage consists of fissuring and/or fibrillation, but chondral and osteochondral fractures can occur as well. During dislocation, the medial patella strikes the lateral aspect of the femur, and, as the knee collapses into flexion, the lateral aspect of the proximal lateral femoral condyle (weight-bearing area) can sustain damage. In the patella, typically the injury is distal-medial (occasionally crossing the median ridge). A shear lesion may involve the chondral surface or be osteochondral (Figure 1A).
Chronic Maltracking Without Instability
Chronic maltracking is usually related to anatomical abnormalities, which include the same factors that can cause patellar instability. A common combination is trochlear dysplasia, increased TT-TG or TT-posterior cruciate ligament distance, and lateral soft-tissue contracture. These are often seen in PF joints that progress to lateral PF arthritis. As lateral PF arthritis progresses, lateral soft-tissue contracture worsens, compounding symptoms of laterally based pain. With respect to cartilage repair, these joints can be treated if recognized early; however, once osteoarthritis is fully established in the joint, facetectomy or PF replacement may be necessary.
Direct Trauma
With the knee in flexion during a direct trauma over the patella (eg, fall or dashboard trauma), all zones of cartilage and subchondral bone in both patella and trochlea can be injured, leading to macrostructural damage, chondral/osteochondral fracture, or, with a subcritical force, microstructural damage and chondrocyte death, subsequently causing cartilage degeneration (cartilage may look normal initially; the matrix takes months to years to deteriorate). Direct trauma usually occurs with the knee flexed. Therefore, these lesions typically are located in the distal trochlea and superior pole of the patella.
Repetitive Microtrauma
Minor injuries, which by themselves do not immediately cause apparent chondral or osteochondral fractures, may eventually exceed the capacity of natural cartilage homeostasis and result in repetitive microtrauma. Common causes are repeated jumping (as in basketball and volleyball) and prolonged flexed-knee position (eg, what a baseball catcher experiences), which may also be associated with other lesions caused by extensor apparatus overload (eg, quadriceps tendon or patellar tendon tendinitis, and fat pad impingement syndrome).
Idiopathic
In a subset of patients with osteochondritis dissecans, the patella is the lesion site. In another subset, idiopathic lesions may be related to a genetic predisposition to osteoarthritis and may not be restricted to the PF joint. In some cases, the PF joint is the first compartment to degenerate and is the most symptomatic in a setting of truly tricompartmental disease. In these cases, treating only the PF lesion can result in functional failure, owing to disease progression in other compartments. Even mild disease in other compartments should be carefully evaluated.
History and Physical Examination
Patients often report a history of anterior knee pain that worsens with stair use, prolonged sitting, and flexed-knee activities (eg, squatting). Compared with pain alone, swelling, though not specific to cartilage disease, is more suspicious for a cartilage etiology. Identifying the cartilage defect as the sole source of pain is particularly difficult in patients with recurrent patellar instability. In these patients, pain and swelling, even between instability episodes, suggest that cartilage damage is at least a component of the symptomology.
Important diagnostic components of physical examination are gait analysis, tibiofemoral alignment, and patellar alignment in all 3 planes, both static and functional. Patella-specific measurements include medial-lateral position and quadrants of excursion, lateral tilt, and patella alta, as well as J-sign and subluxation with quadriceps contraction in extension.
It is also important to document effusion; crepitus; active and passive range of motion (spine, hips, knees); site of pain or tenderness to palpation (medial, lateral, distal, retropatellar) and whether it matches the complaints and the location of the cartilage lesion; results of the grind test (placing downward force on the patella during flexion and extension) and whether they match the flexion angle of the tenderness and the flexion angle in which the cartilage lesion has increased PF contact; ligamentous and soft-tissue stability or imbalance (tibiofemoral and patellar; apprehension test, glide test, tilt test); and muscle strength, flexibility, and atrophy of the core (abdomen, dorsal and hip muscles) and lower extremities (quadriceps, hamstrings, gastrocnemius).
Imaging
Imaging should be used to evaluate both PF alignment and the cartilage lesions. For alignment, standard radiographs (weight-bearing knee sequence and axial view; full limb length when needed), computed tomography, and MRI can be used.
Meaningful evaluation requires MRI with cartilage-specific sequences, including standard spin-echo (SE) and gradient-recalled echo (GRE), fast SE, and, for cartilage morphology, T2-weighted fat suppression (FS) and 3-dimensional SE and GRE.5 For evaluation of cartilage function and metabolism, the collagen network, and proteoglycan content in the knee cartilage matrix, consideration should be given to compositional assessment techniques, such as T2 mapping, delayed gadolinium-enhanced MRI of cartilage, T1ρ imaging, sodium imaging, and diffusion-weighted sequences.5 Use of the latter functional sequences is still debatable, and these sequences are not widely available.
Treatment
In general, the initial approach is nonoperative management focused on weight loss and extensive core-to-floor rehabilitation, unless surgery is specifically indicated (eg, for loose body removal or osteochondral fracture reattachment). Rehabilitation focuses on achieving adequate range of motion of the spine, hips, and knees along with muscle strength and flexibility of the core (abdomen, dorsal and hip muscles) and lower limbs (quadriceps, hamstrings, gastrocnemius). Rehabilitation is not defined by time but rather by development of an optimized soft-tissue envelope that decreases joint reactive forces. The full process can take 6 to 9 months, but there should be some improvement by 3 months.
Corticosteroid, hyaluronic acid,6 or platelet-rich plasma7 injections can provide temporary relief and facilitate rehabilitation in the setting of pain inhibition. As stand-alone treatment, injections are more suitable for more diffuse degenerative lesions in older and low-demand patients than for focal traumatic lesions in young and high-demand patients.
Surgery is indicated for full-thickness or nearly full-thickness lesions (International Cartilage Repair Society grade 3a or higher) >1 cm2 after failed conservative treatment.
Optimization of anatomy and biomechanics is crucial, as persistent abnormalities lead to high rates of failure of cartilage procedures, and correction of those factors results in outcomes similar to those of patients without such abnormal anatomy.8 The procedures most commonly used to improve patellar tracking or unloading in the PF compartment are lateral retinacular lengthening and TT transfer: medialization and/or distalization for correction of malalignment, and straight anteriorization or anteromedialization for unloading. These procedures can improve symptoms and function in lateral and distal patellar and trochlear lesions even without the addition of a cartilage restoration procedure.
Factors that are important in surgical decision-making include defect location and size, subchondral bone status, unipolar vs bipolar lesions, and previous cartilage procedure.
Location. The shapes of the patella and trochlea vary much more than the shapes of the condyles and plateaus. This variability complicates morphology matching, particularly with involvement of the central TG and median patellar ridge. Therefore, focal contained lesions of the patella and trochlea may be more technically amenable to cell therapy techniques than to osteochondral procedures, which require contour matching between donor and recipient
Size. Although small lesions in the femoral condyles can be considered for microfracture (MFx) or osteochondral autograft transfer (OAT), MFx is less suitable because of poor results in the PF joint, and OAT because of donor-site morbidity in the trochlea.
Subchondral bone status. When subchondral bone is compromised, such as with bone loss, cysts, or significant bone edema, the entire osteochondral unit should be treated. Here, OAT and osteochondral allograft (OCA) are the preferred treatments, depending on lesion size.
Unipolar vs bipolar lesions. Compared with unipolar lesions, bipolar lesions tend to have worse outcomes. Therefore, an associated unloading procedure (TT osteotomy) should be given special consideration. Autologous chondrocyte implantation (ACI) appears to have better outcomes than OCA for bipolar PF lesions.9,10
Previous surgery. Although a failed cartilage procedure can negatively affect ACI outcomes, particularly in the presence of intralesional osteophytes,11 it does not affect OCA outcomes.12 Therefore, after previous MFx, OCA instead of ACI may be considered.
Fragment Fixation
Viable fragments from traumatic lesions (direct trauma or patellar dislocation) or osteochondritis dissecans should be repaired if possible, particularly in young patients. In a fragment that contains a substantial amount of bone, compression screws provide stable fixation. More recently, it has been recognized that fixation of predominantly cartilaginous fragments can be successful13 (Figure 1B). Débridement of soft tissue in the lesion bed and on the fragment is important in facilitating healing, as is removal of sclerotic bone.
MFx
Although MFx can have good outcomes in small contained femoral condyle lesions, in the PF joint treatment has been more challenging, and clinical outcomes have been poor (increased subchondral edema, increased effusion).14 In addition, deterioration becomes significant after 36 months. Therefore, MFx should be restricted to small (<2 cm2), well-contained trochlear defects, particularly in low-demand patients.
ACI and Matrix-Induced ACI
As stated, ACI (Figure 2) is suitable for PF joints because it intrinsically respects the complex anatomy.
OAT
As mentioned, donor-site morbidity may compromise final outcomes of harvest and implantation in the PF joint. Nonetheless, in carefully selected patients with small lesions that are limited to 1 facet (not including the patellar ridge or the TG) and that require only 1 plug (Figure 3), OAT can have good clinical results.16
OCA
Two techniques can be used with OCA in the PF joint. The dowel technique, in which circular plugs are implanted, is predominantly used for defects that do not cross the midline (those located in their entirety on the medial or lateral aspect of the patella or trochlea). Central defects, which can be treated with the dowel technique as well, are technically more challenging to match perfectly, because of the complex geometry of the median ridge and the TG (Figure 4).
Experimental and Emerging Technologies
Biocartilage
Biocartilage, a dehydrated, micronized allogeneic cartilage scaffold implanted with platelet-rich plasma and fibrin glue added over a contained MFx-treated defect, can be used in the patella and trochlea and has the same indications as MFx (small lesions, contained lesions). There are limited clinical studies of short- or long-term outcomes.
Fresh and Viable OCA
Fresh OCA (ProChondrix; AlloSource) and viable/cryopreserved OCA (Cartiform; Arthrex) are thin osteochondral scaffolds that contain viable chondrocytes and growth factors. They can be implanted alone or used with MFx, and are indicated for lesions measuring 1 cm2 to 3 cm2. Aside from a case report,17 there are no clinical studies on outcomes.
Bone Marrow Aspirate Concentrate Implantation
Bone marrow aspirate concentrate from centrifuged iliac crest–harvested aspirate containing mesenchymal stem cells with chondrogenic potential is applied under a synthetic scaffold. Indications are the same as for ACI. Medium-term follow-up studies in the PF joint have shown good results, similar to those obtained with matrix-induced ACI.18
Particulated Juvenile Allograft Cartilage
Particulated juvenile allograft cartilage (DeNovo NT Graft; Zimmer Biomet) is minced cartilage allograft (from juvenile donors) that has been cut into cubes (~1 mm3). Indications are for patellar and trochlear lesions 1 cm2 to 6 cm2. For both the trochlea and the patella, short-term outcomes have been good.19,20
Rehabilitation After Surgery
Isolated PF cartilage restoration generally does not require prolonged weight-bearing restrictions, and ambulation with the knee locked in full extension is permitted as tolerated. Concurrent TT osteotomy, however, requires protection with 4 to 6 weeks of toe-touch weight-bearing to minimize the risk of tibial fracture.
Conclusion
Comprehensive preoperative assessment is essential and should include a thorough core-to-floor physical examination as well as PF-specific imaging. Treatment of symptomatic chondral lesions in the PF joint requires specific technical and postoperative management, which differs significantly from management involving the condyles. Attending to all these details makes the outcomes of PF cartilage treatment reproducible. These outcomes may rival those of condylar treatment.
1. Curl WW, Krome J, Gordon ES, Rushing J, Smith BP, Poehling GG. Cartilage injuries: a review of 31,516 knee arthroscopies. Arthroscopy. 1997;13(4):456-460.
2. Steensen RN, Bentley JC, Trinh TQ, Backes JR, Wiltfong RE. The prevalence and combined prevalences of anatomic factors associated with recurrent patellar dislocation: a magnetic resonance imaging study. Am J Sports Med. 2015;43(4):921-927.
3. Nomura E, Inoue M. Cartilage lesions of the patella in recurrent patellar dislocation. Am J Sports Med. 2004;32(2):498-502.
4. Vollnberg B, Koehlitz T, Jung T, et al. Prevalence of cartilage lesions and early osteoarthritis in patients with patellar dislocation. Eur Radiol. 2012;22(11):2347-2356.
5. Crema MD, Roemer FW, Marra MD, et al. Articular cartilage in the knee: current MR imaging techniques and applications in clinical practice and research. Radiographics. 2011;31(1):37-61.
6. Campbell KA, Erickson BJ, Saltzman BM, et al. Is local viscosupplementation injection clinically superior to other therapies in the treatment of osteoarthritis of the knee: a systematic review of overlapping meta-analyses. Arthroscopy. 2015;31(10):2036-2045.e14.
7. Saltzman BM, Jain A, Campbell KA, et al. Does the use of platelet-rich plasma at the time of surgery improve clinical outcomes in arthroscopic rotator cuff repair when compared with control cohorts? A systematic review of meta-analyses. Arthroscopy. 2016;32(5):906-918.
8. Gomoll AH, Gillogly SD, Cole BJ, et al. Autologous chondrocyte implantation in the patella: a multicenter experience. Am J Sports Med. 2014;42(5):1074-1081.
9. Meric G, Gracitelli GC, Gortz S, De Young AJ, Bugbee WD. Fresh osteochondral allograft transplantation for bipolar reciprocal osteochondral lesions of the knee. Am J Sports Med. 2015;43(3):709-714.
10. Peterson L, Vasiliadis HS, Brittberg M, Lindahl A. Autologous chondrocyte implantation: a long-term follow-up. Am J Sports Med. 2010;38(6):1117-1124.
11. Minas T, Gomoll AH, Rosenberger R, Royce RO, Bryant T. Increased failure rate of autologous chondrocyte implantation after previous treatment with marrow stimulation techniques. Am J Sports Med. 2009;37(5):902-908.
12. Gracitelli GC, Meric G, Briggs DT, et al. Fresh osteochondral allografts in the knee: comparison of primary transplantation versus transplantation after failure of previous subchondral marrow stimulation. Am J Sports Med. 2015;43(4):885-891.
13. Anderson CN, Magnussen RA, Block JJ, Anderson AF, Spindler KP. Operative fixation of chondral loose bodies in osteochondritis dissecans in the knee: a report of 5 cases. Orthop J Sports Med. 2013;1(2):2325967113496546.
14. Kreuz PC, Steinwachs MR, Erggelet C, et al. Results after microfracture of full-thickness chondral defects in different compartments in the knee. Osteoarthritis Cartilage. 2006;14(11):1119-1125.
15. Vasiliadis HS, Lindahl A, Georgoulis AD, Peterson L. Malalignment and cartilage lesions in the patellofemoral joint treated with autologous chondrocyte implantation. Knee Surg Sports Traumatol Arthrosc. 2011;19(3):452-457.
16. Astur DC, Arliani GG, Binz M, et al. Autologous osteochondral transplantation for treating patellar chondral injuries: evaluation, treatment, and outcomes of a two-year follow-up study. J Bone Joint Surg Am. 2014;96(10):816-823.
17. Hoffman JK, Geraghty S, Protzman NM. Articular cartilage repair using marrow simulation augmented with a viable chondral allograft: 9-month postoperative histological evaluation. Case Rep Orthop. 2015;2015:617365.
18. Gobbi A, Chaurasia S, Karnatzikos G, Nakamura N. Matrix-induced autologous chondrocyte implantation versus multipotent stem cells for the treatment of large patellofemoral chondral lesions: a nonrandomized prospective trial. Cartilage. 2015;6(2):82-97.
19. Farr J, Tabet SK, Margerrison E, Cole BJ. Clinical, radiographic, and histological outcomes after cartilage repair with particulated juvenile articular cartilage: a 2-year prospective study. Am J Sports Med. 2014;42(6):1417-1425.
20. Tompkins M, Hamann JC, Diduch DR, et al. Preliminary results of a novel single-stage cartilage restoration technique: particulated juvenile articular cartilage allograft for chondral defects of the patella. Arthroscopy. 2013;29(10):1661-1670.

Individualizing Treatment of Hyperglycemia in Type 2 Diabetes
From the University of Arizona College of Pharmacy and the University of Arizona College of Medicine-Tucson, Tucson, AZ.
Abstract
- Objective: To summarize key issues relevant to managing hyperglycemia in patients with type 2 diabetes mellitus (T2DM) and review a strategy for initiating and intensifying therapy.
- Methods: Review of the literature.
- Results: The 6 most widely used pharmacologic treatment options for hyperglycemia in T2DM are metformin, sulfonylureas, dipeptidyl peptidase-4 inhibitors, glucagon-like peptide-1 receptor agonists, sodium-glucose cotransporter-2 inhibitors, and insulin. Recent guidelines stress the importance of an individualized, patient-centered approach to managing hyperglycemia in T2DM, although sufficient guidance for nonspecialists on how to individualize treatment is often lacking. For patients with no contraindications, metformin should be recommended concurrent with lifestyle intervention at the time of diabetes diagnosis. Due to the progressive nature of T2DM, glycemic control on metformin monotherapy is likely to deteriorate over time, and there is no consensus as to what the second-line agent should be. A second agent should be selected based on glycemic goal and potential advantages and disadvantages of each agent for any given patient. If the patient progresses to the point where dual therapy does not provide adequate control, either a third non-insulin agent or insulin can be added.
- Conclusion: Although research is increasingly focusing on what the ideal number and sequence of drugs should be when managing T2DM, investigating all possible combinations in diverse patient populations is not feasible. Physicians therefore must continue to rely on clinical judgment to determine how to apply trial data to the treatment of individual patients.
Key words: type 2 diabetes; patient-centered care; antihyper-glycemic drugs; insulin; therapeutic decision-making.
Diabetes mellitus affects approximately 29.1 million people, or 9.3% of the U.S. population [1,2]. The high prevalence of diabetes and its associated multiple complications, including cardiovascular disease (CVD), blindness, renal failure, lower extremity amputations, and premature death, lead to a tremendous overall burden of disease. The financial cost is staggering as well, with more than 1 in 5 health care dollars spent on treating diabetes or its complications [3]. The goal of diabetes treatment is to prevent acute complications and reduce the risk of long-term complications. Interventions that have been shown to improve diabetes outcomes include medications for glycemic control and treatment of cardiovascular risk factors, nutrition and physical activity counseling, smoking cessation, immunizations, psychosocial care, and ongoing surveillance and early treatment for eye, kidney, and foot problems [4].
Glycemic management in type 2 diabetes mellitus (T2DM), the focus of this review, is growing increasingly complex and has been the subject of numerous extensive reviews [5,6] and published guidelines [4,7]. In the context of an increasing array of available pharmacologic options, there are mounting uncertainties regarding the benefits of intensive glycemic control as well as increasing concerns about potential adverse treatment effects, hypoglycemia in particular. While previous guidelines encouraged specific approaches for most patients, more recent guidelines stress the importance of a patient-centered approach with shared decision-making [4]. Less prescriptive guidelines are more appropriate, given the current state of science, but they also may be viewed as providing insufficient guidance to some providers. It can be overwhelming for a non-specialist to try to match the nuances of antihyperglycemic medications to the nuances of each patient’s preferences and medical characteristics.
This article examines key issues faced by primary care providers when managing hyperglycemia in patients with T2DM and outlines a stepwise approach to determining the optimal antihyperglycemic agent(s) (Table 1). 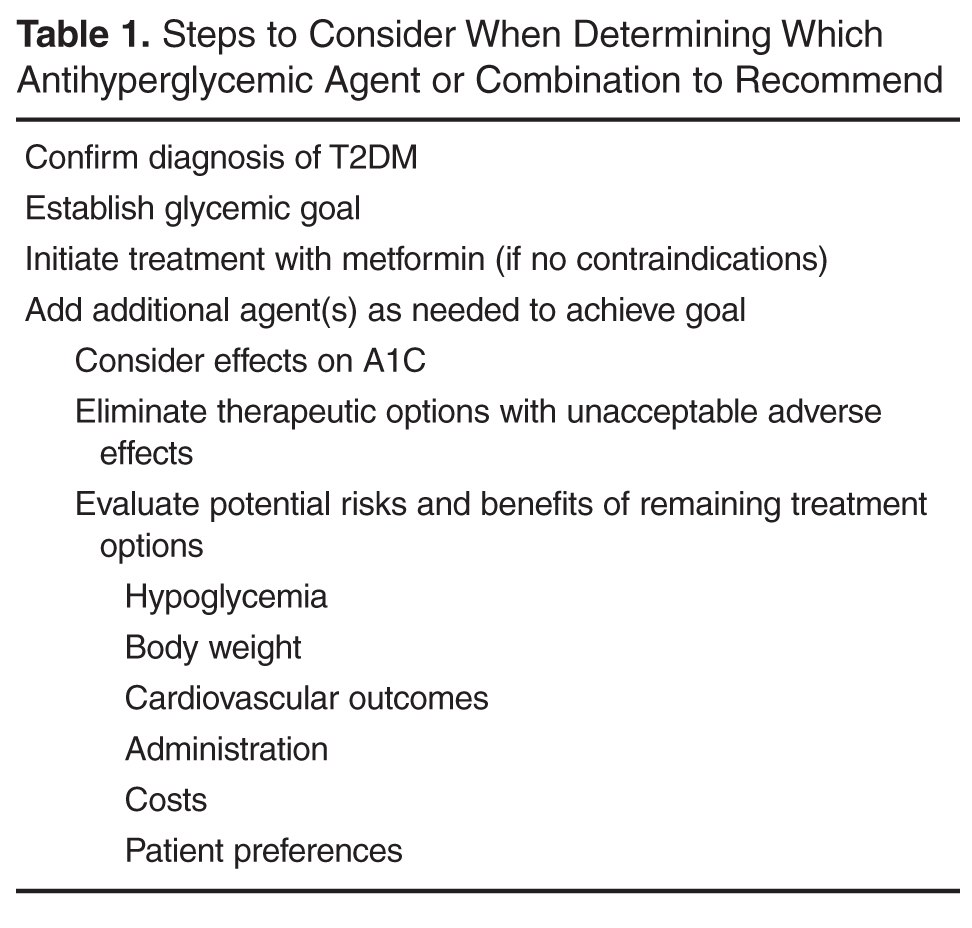
Confirm Diagnosis of T2DM
It can be difficult to distinguish between type 1 diabetes mellitus and T2DM in some individuals due to overlapping characteristics. However, correctly classifying a patient’s diabetes at the outset is essential, as the classification helps determine the best treatment regimen and is rarely reconsidered [4,8]. Considerable evidence suggests that misclassification of diabetes occurs frequently [9,10], resulting in patients receiving inappropriate treatment. Clinical characteristics suggestive of T2DM include older age and features of insulin resistance such as obesity, hyper-tension, hypertriglyceridemia, and low high-density lipoprotein cholesterol. When these features are not present, an alternate diagnosis should be entertained.
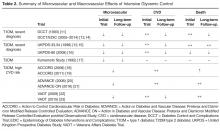
Establish Glycemic Goal
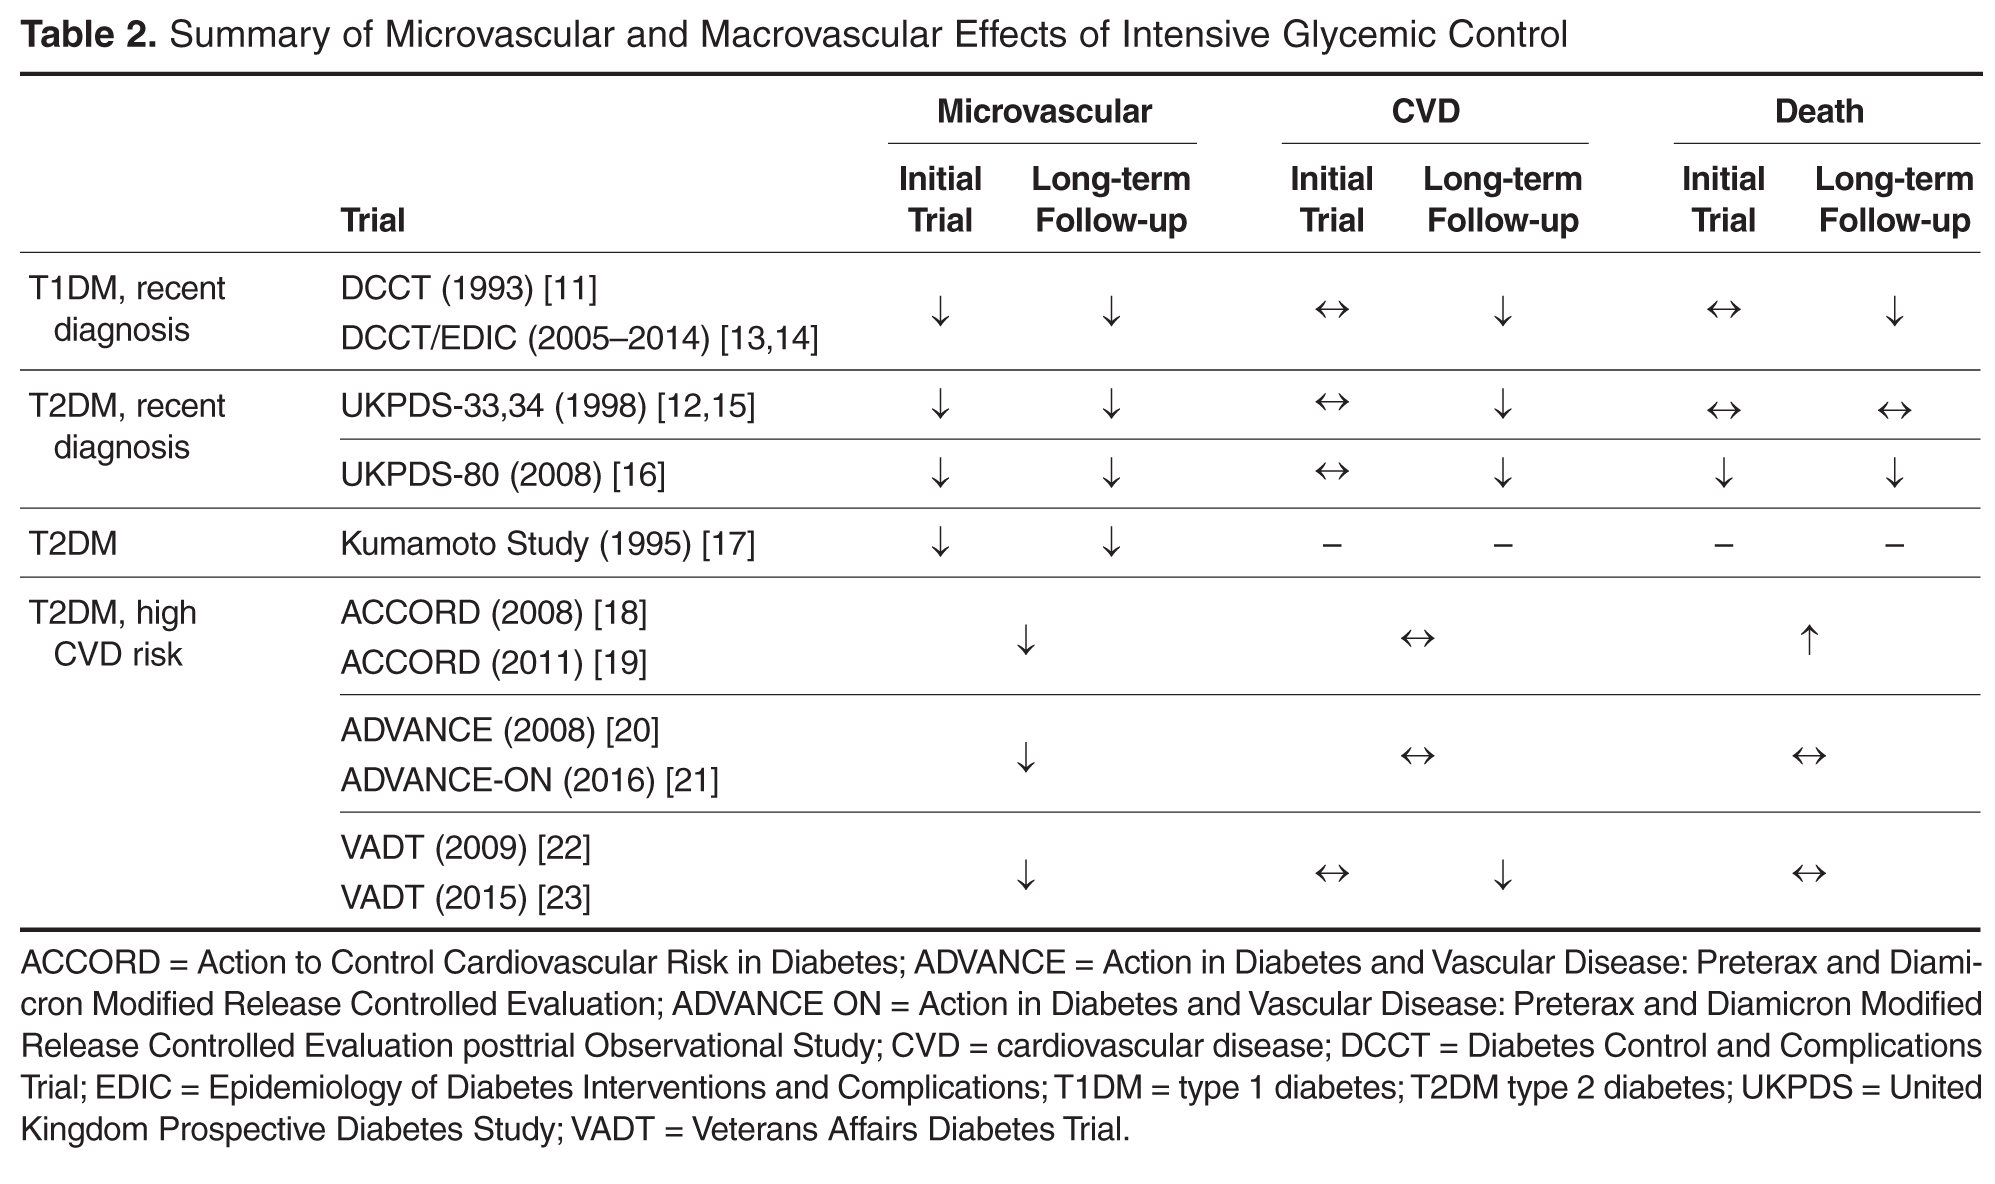
Research over the past decade has led to a growing appreciation of the enormous complexity of hyperglycemia management. During the 1990s, landmark trials such as the Diabetes Control and Complications Trial (DCCT) [11] and UK Prospective Diabetes Study (UKPDS) [12] demonstrated that improving glucose control could reduce the incidence of microvascular complications [11,12], prompting a lower-is-better philosophy regarding glucose targets. Despite limited evidence to support such thinking, this viewpoint was adopted by the developers of many guidelines. During the following decade more research was devoted to determining whether aggressively lowering a patient’s glucose could also improve macrovascular outcomes. Table 2 summarizes microvascular and macrovascular effects of intensive glycemic control seen in major trials [11–23]. After several major trials [20,22] found only mild cardiovascular benefits and even suggested harm [18], experts and policy makers began to reconsider the value of tightly controlling glucose levels [24]. Since then, other studies have demonstrated that the potential benefits and risks of glucose control are strongly related to individual patient factors, such as age and duration of diabetes, and associated comorbidities, such as CVD and impaired renal function [6].
A one-size-fits-all glycemic goal is no longer recommended. Personalization is necessary, balancing the potential benefits and risks of treatments required to achieve that goal. Whereas an A1C of < 7% is an appropriate target for some individuals with diabetes, glycemic targets may be more or less stringent based on patient features including life expectancy, duration of diabetes, comorbidities, and patient attitude and support system (Table 3) [4].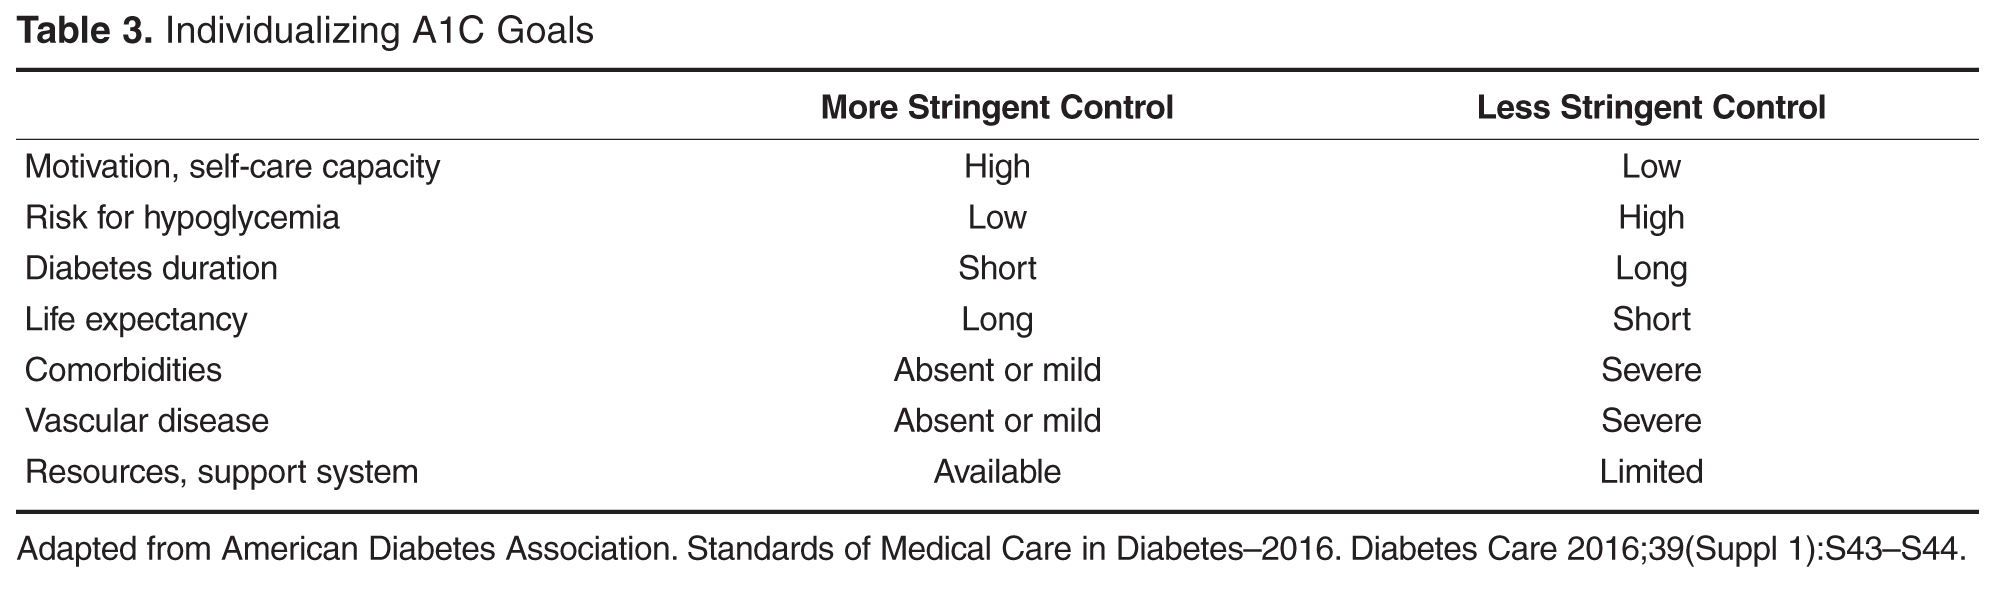
A particular group in which less stringent goals should be considered is older patients, especially those with complex or poor health status [4,25]. The risk of intensive glycemic control may exceed the benefits in these patients, as they are at higher risk of hypoglycemia and polypharmacy [26]. A goal A1C of 7% to 7.5% is now recommended for healthy older adults, and less stringent A1C goals of 7.5% to 8% and 8% to 8.5% should be considered based on the presence and severity of multiple coexisting chronic illnesses, decreased self-care ability, or cognitive impairment [4,25]. Unfortunately, overtreatment is frequently seen in this group. In a recent study of patients over age 65 years, about 40% of those with complex or poor health status had tight glycemic control with A1C below 6.5% [26]. An analysis of U.S. Veterans Affairs administration data showed that only 27% of 12,917 patients older than 65 with very low A1C (< 6%) and about 21% of those with A1C of 6% to 6.5% underwent treatment deintensification [27].
Initiate Treatment with Metformin
There is strong consensus that metformin is the preferred drug for monotherapy due to its long proven safety record, low cost, weight-reduction benefit, and potential cardiovascular advantages [4,16]. As long as there are no contraindications, metformin should be recommended concurrent with lifestyle intervention at the time of diabetes diagnosis. The recommendation is based on the fact that adherence to diet, weight reduction, and regular exercise is not sustained in most patients, and most patients ultimately will require treatment. Since metformin is usually well-tolerated, does not cause hypoglycemia, has a favorable effect on body weight, and is relatively inexpensive, potential benefits of early initiation of medication appear to outweigh potential risks.
The U.S. Food and Drug Administration (FDA) recently relaxed prescribing polices to extend the use of this important medication to patients who have mild–moderate, but stable, chronic kidney disease (CKD) [28]. Metformin is recommended as first-line therapy and should be used unless it is contraindicated (ie, estimated glomerular filtration rate [eGFR] < 30 mL/min/1.73 m2)[4,7,29].
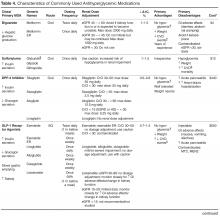
Add Additional Agent(s) as Needed to Achieve Goal
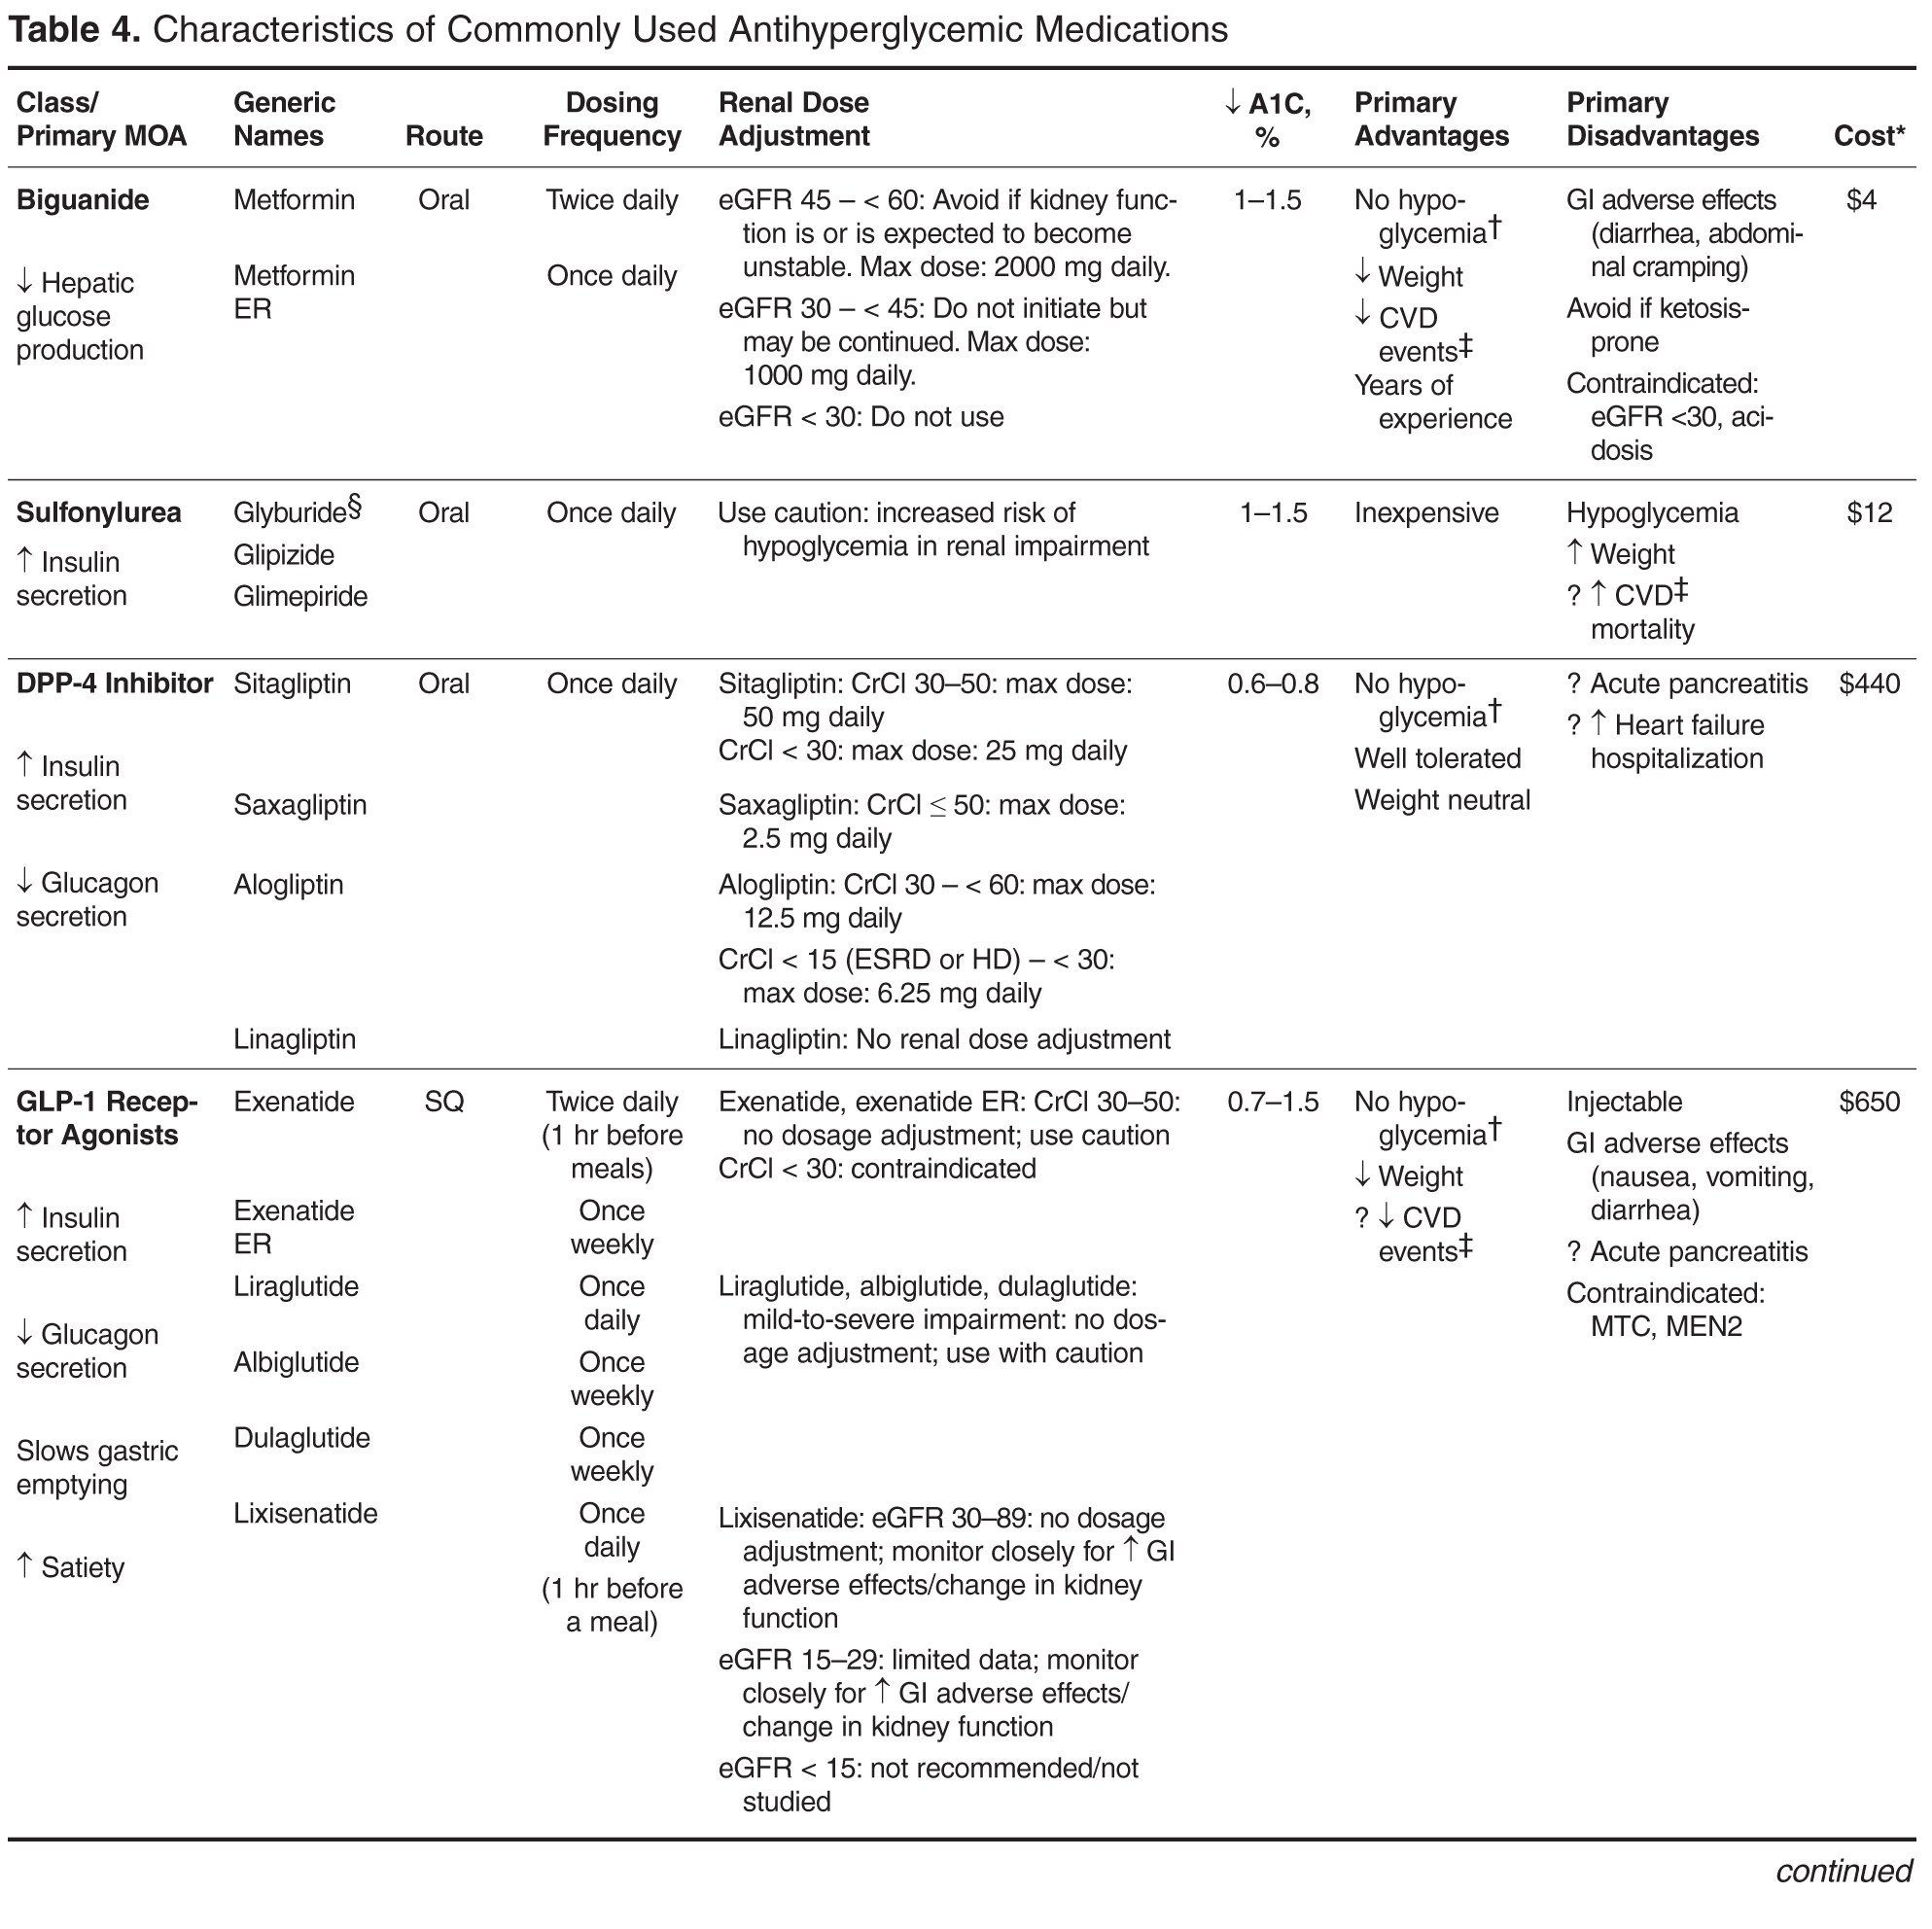
Other than metformin, evidence is limited for the optimal use of the burgeoning array of available agents, especially in dual or triple combinations [6,30]. Research is now starting to focus more on what the ideal number and sequence of drugs should be. The Glycemic Reduction Approach in Diabetes (GRADE) study, which will compare long-term benefits and risks of the 4 most widely used antihyperglycemic medications in combination with metformin, is now underway [31,32]. The 4 classes being studied are sulfonylurea, dipeptidyl peptidase-4 (DPP-4) inhibitors, glucagon-like peptide-1 (GLP-1) receptor agonists, and a basal, 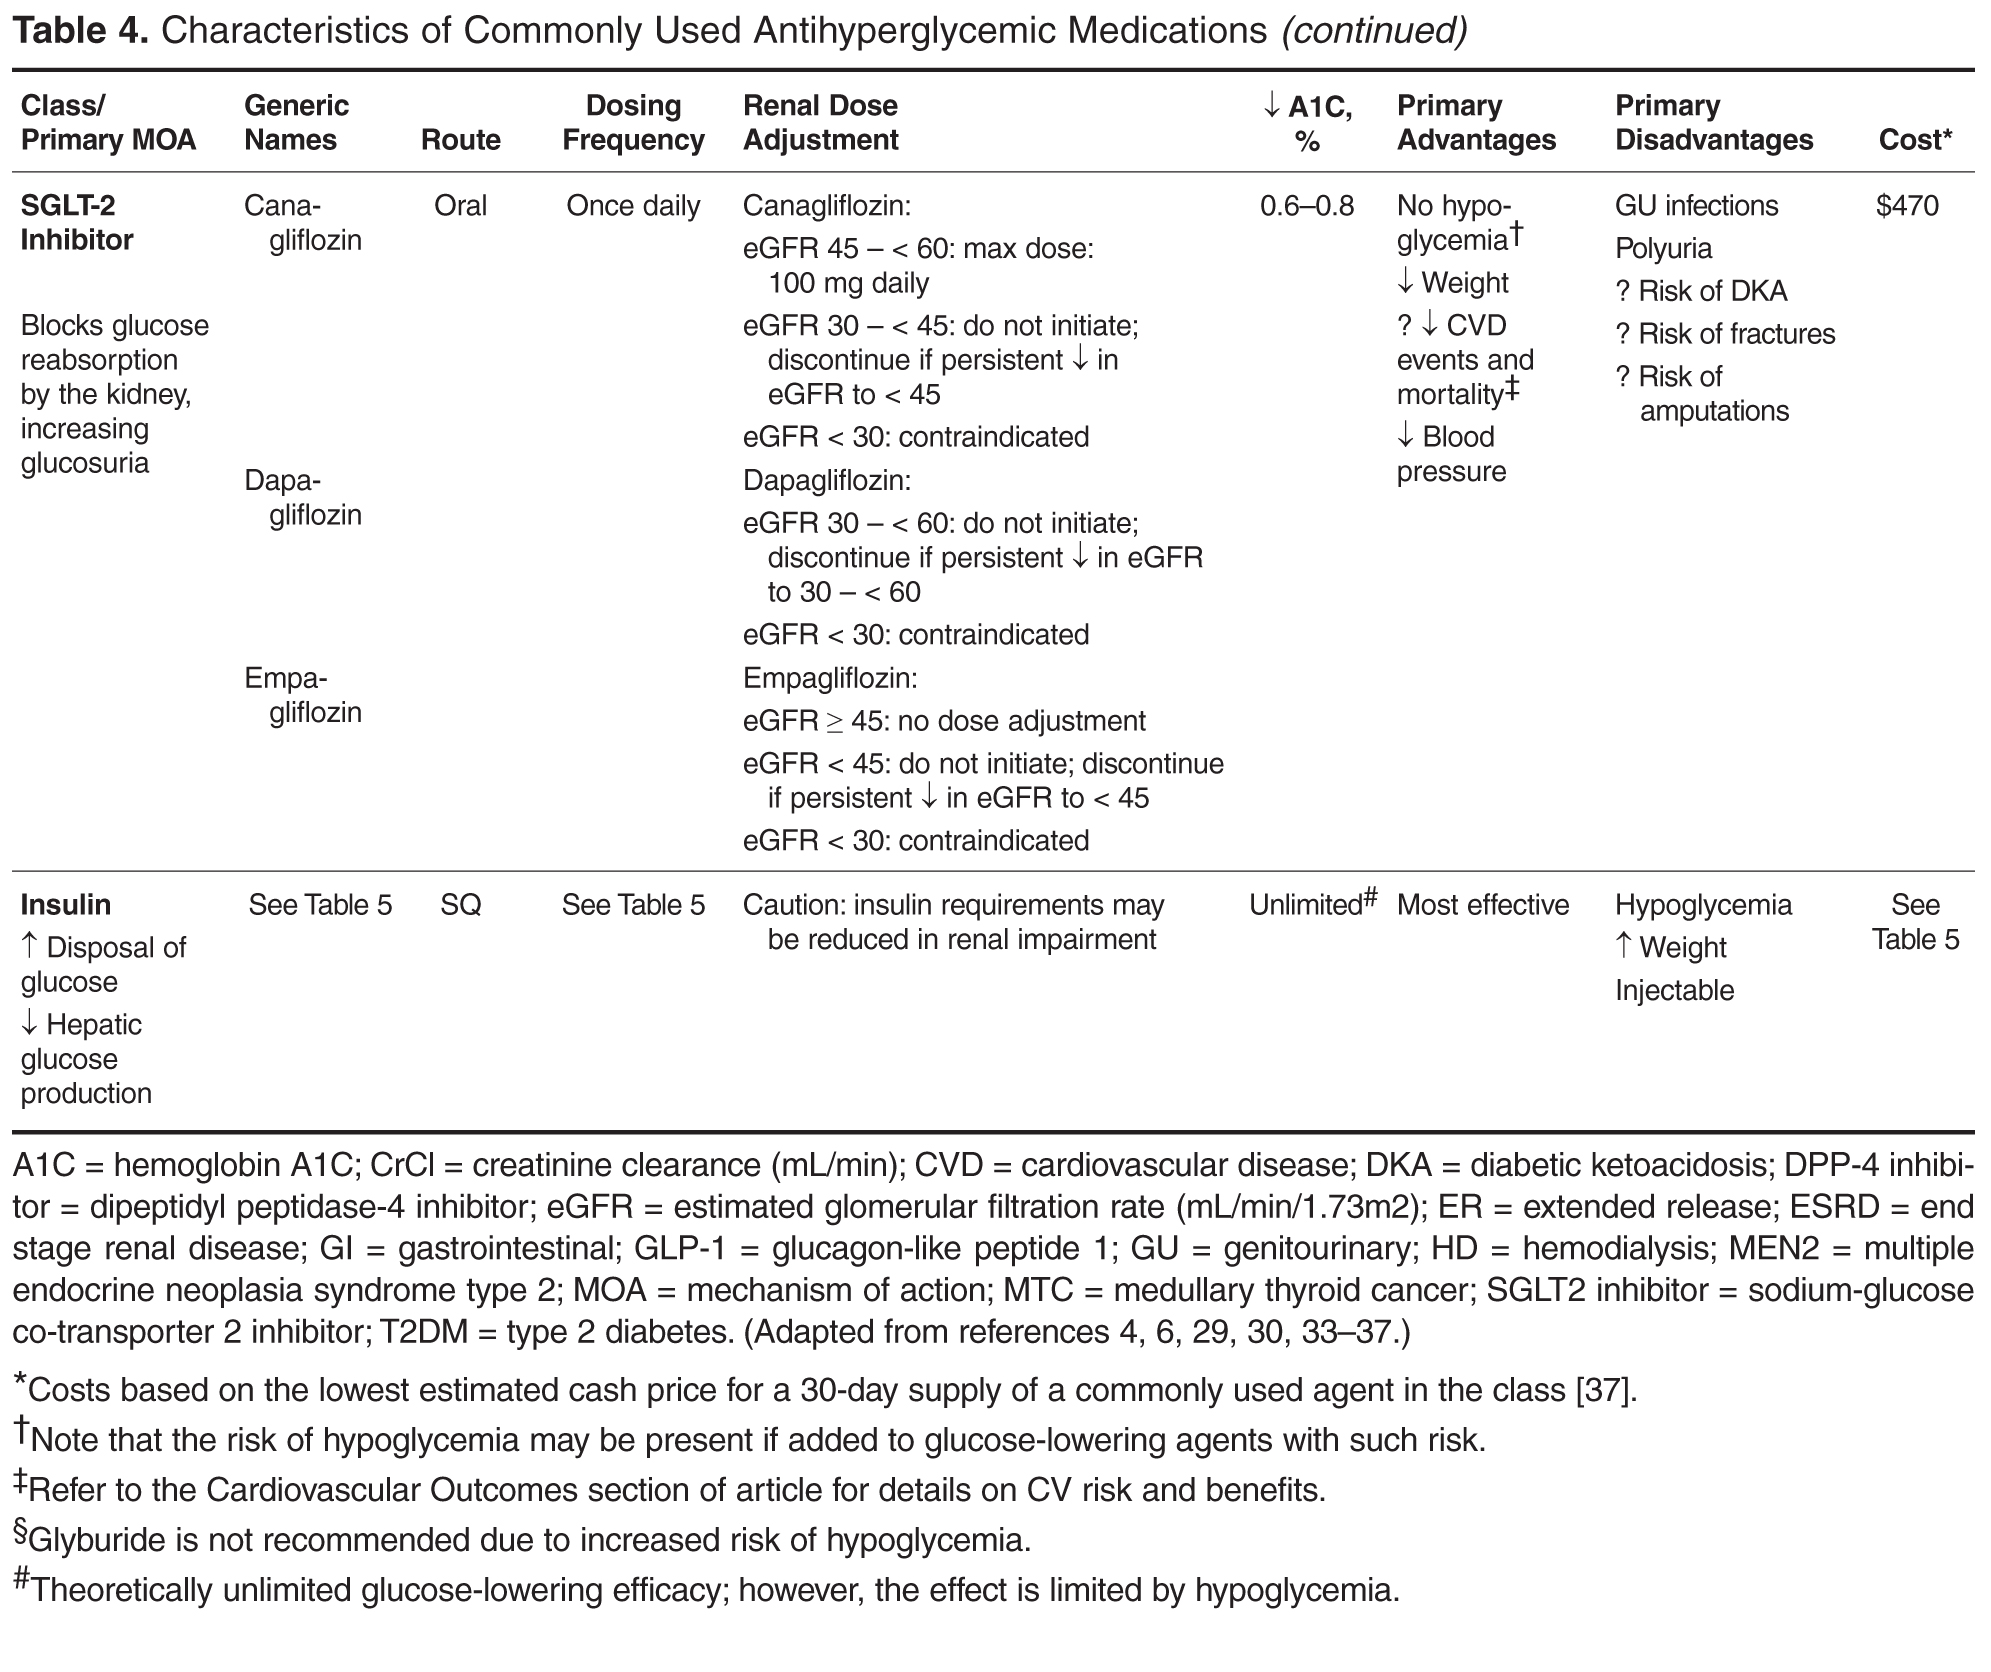
Eleven classes of non-insulin medications are currently approved for treating hyperglycemia in T2DM [4]. Within each class, numerous agents are available. Six of these classes (ie, α-glucosidase inhibitors, colesevelam, bromocriptine, pramlintide, meglitinides, and thiazolidinediones) are not used frequently 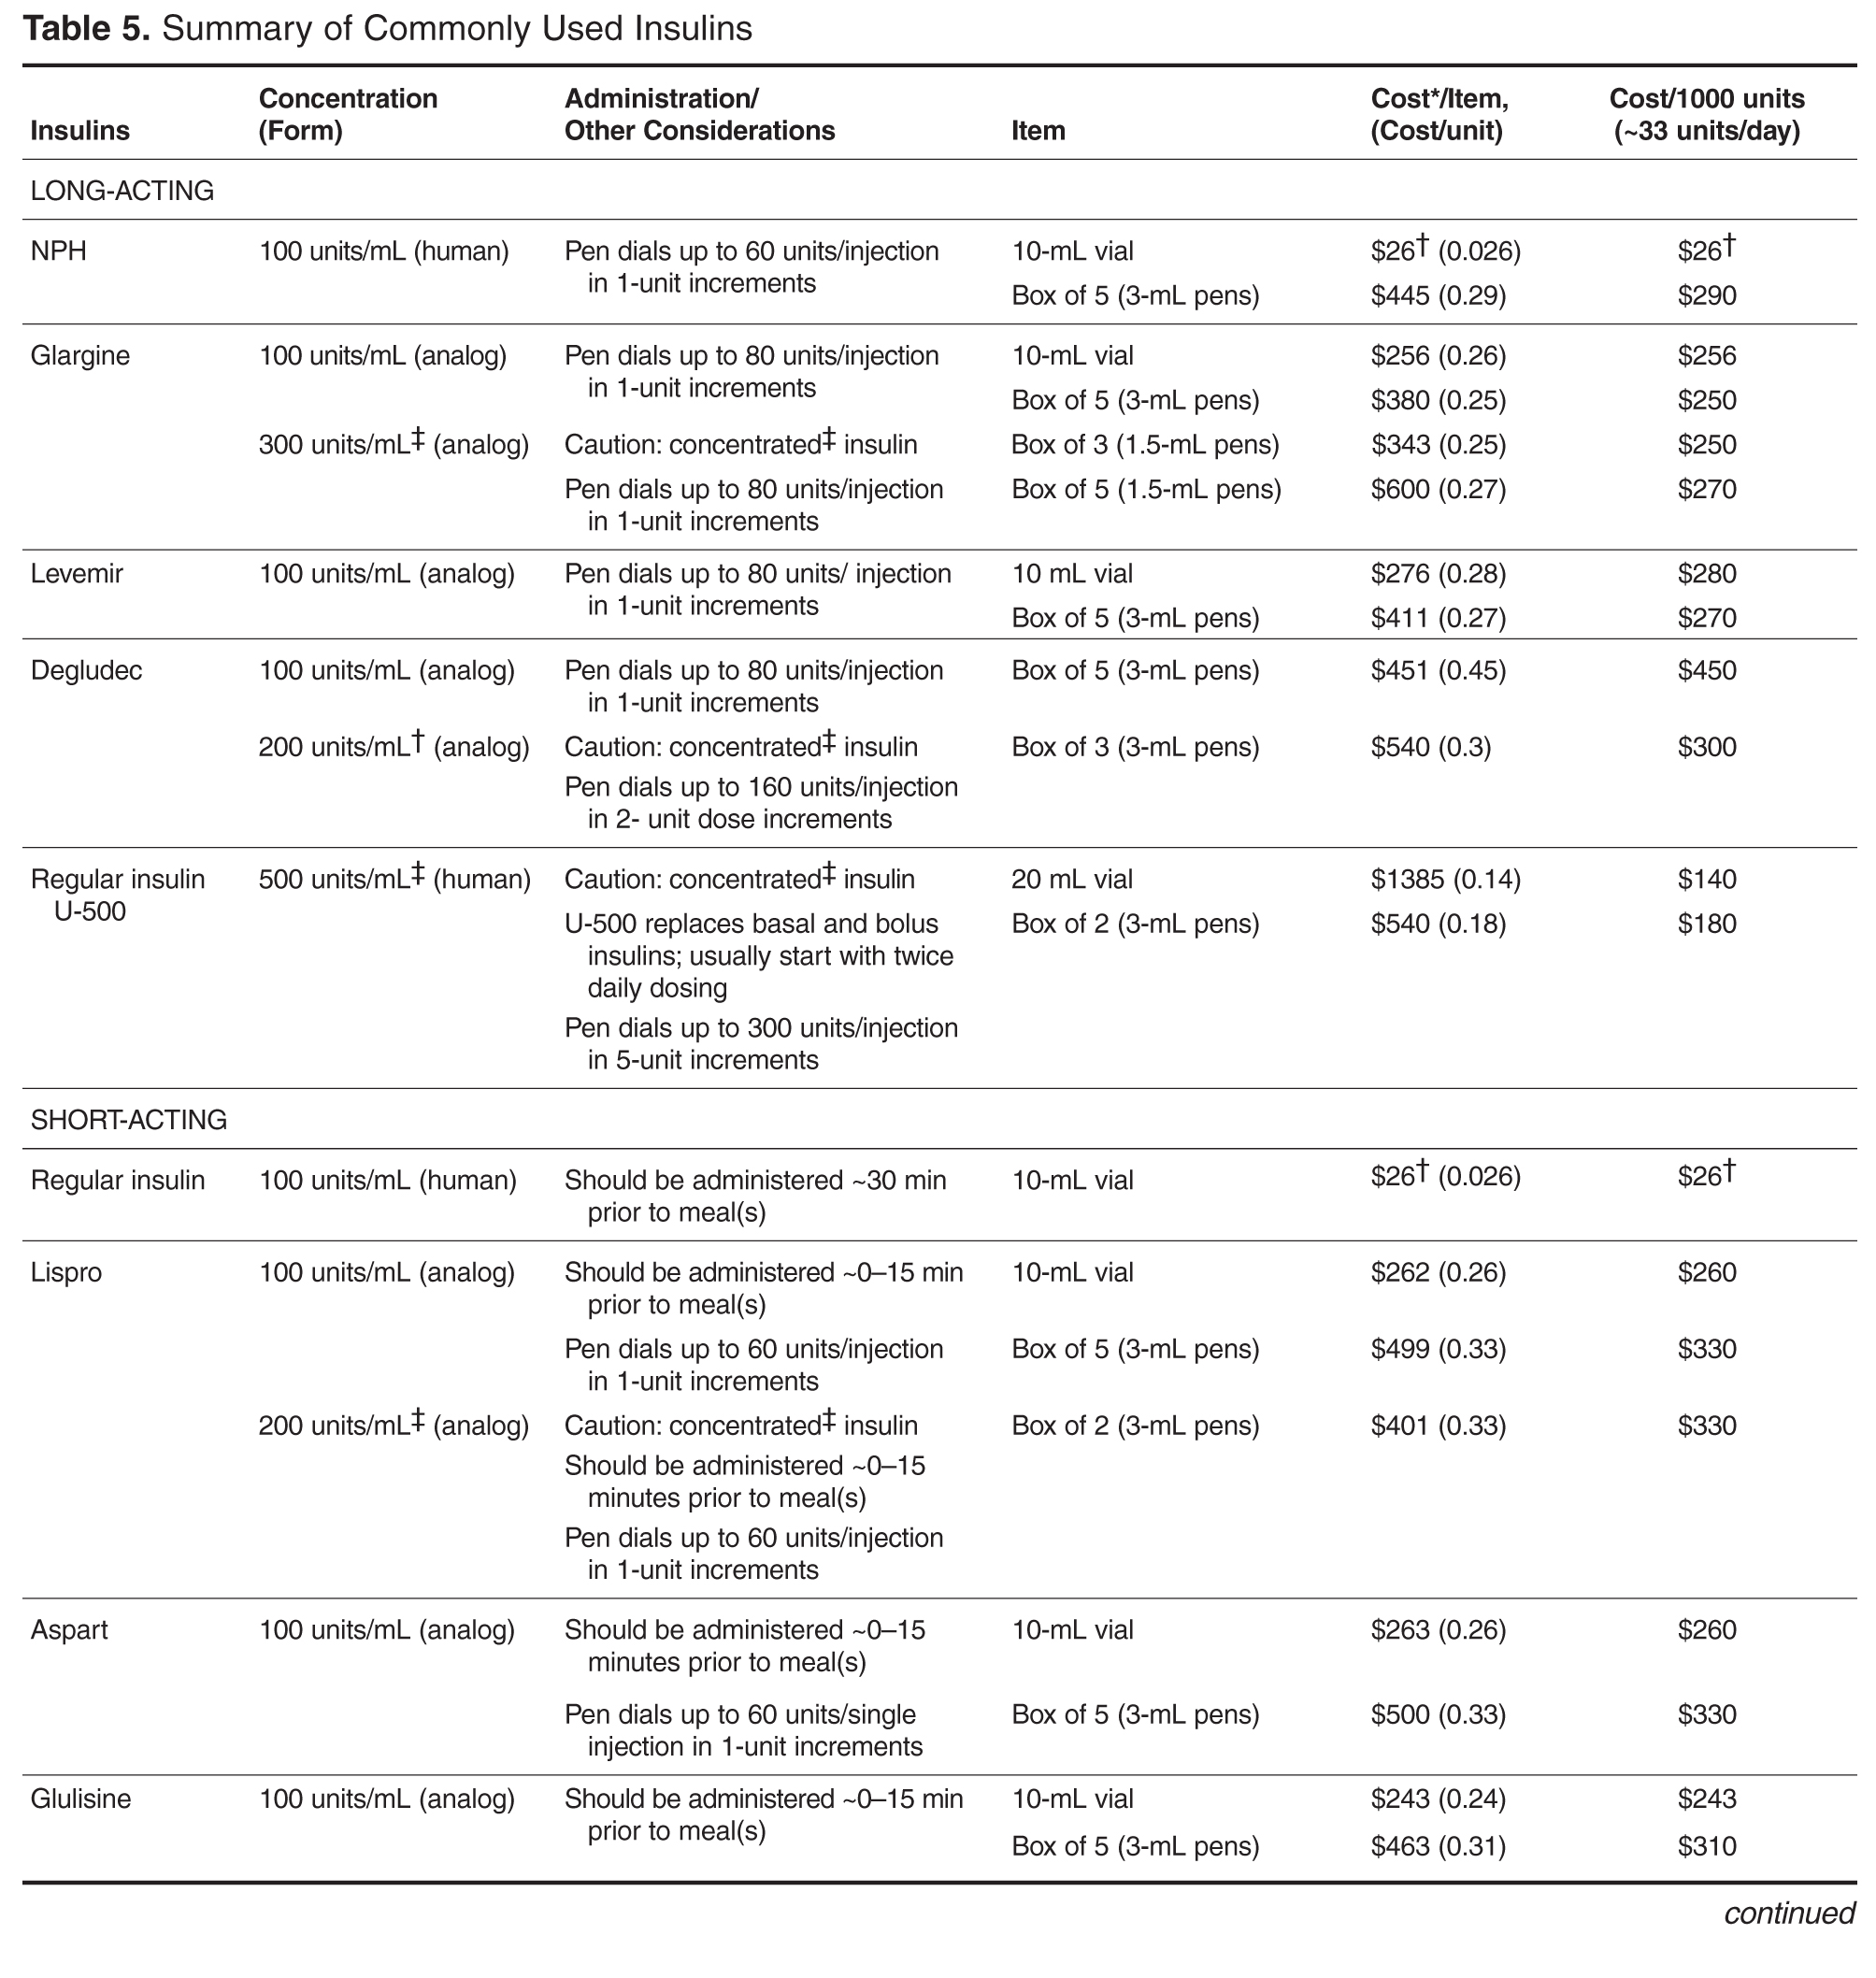
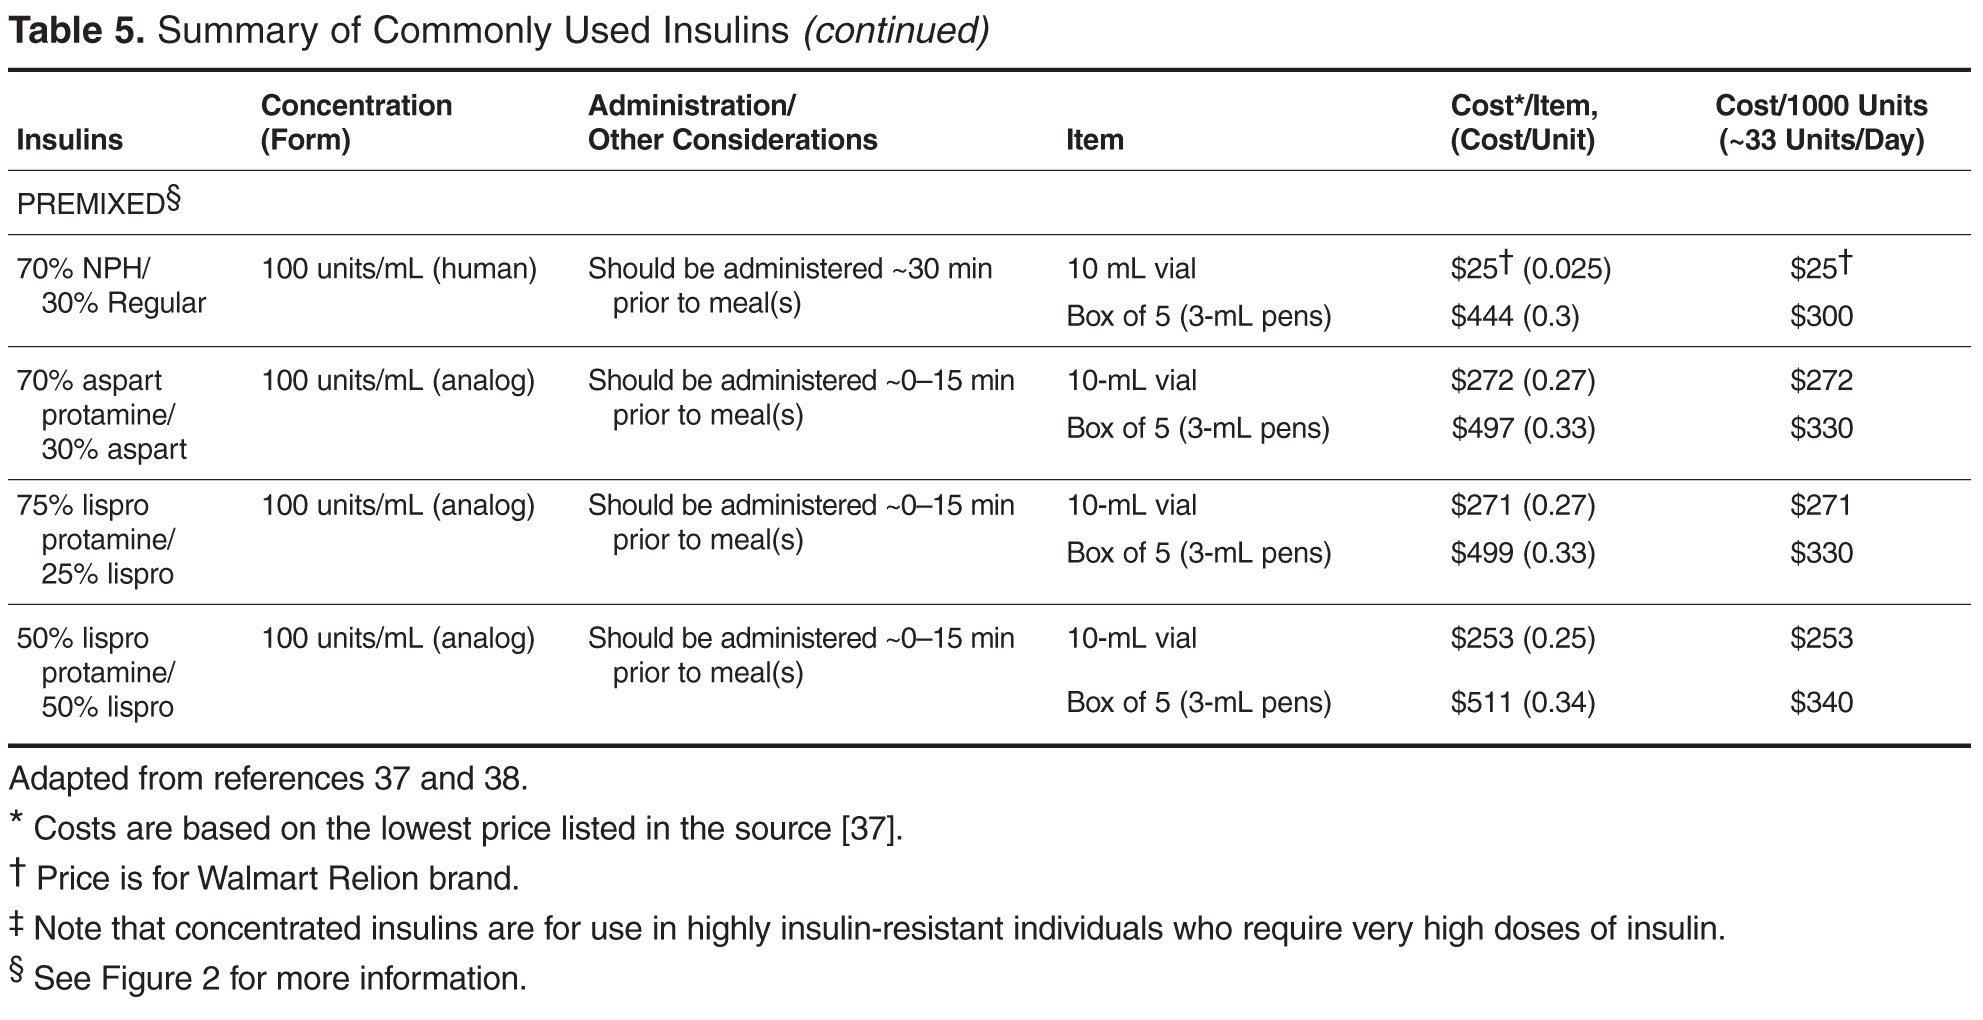
Consider Effects on A1C
There is a paucity of high-quality, head-to-head comparison trials evaluating the ability of available agents to achieve recommended glycemic targets. This is important because the glucose-lowering effectiveness of individual medications is strongly influenced by baseline characteristics such as A1C, duration of diabetes, and previous therapy. With these limitations in mind, the relative glucose-lowering effectiveness of commonly used agents is shown in Table 4. When used as monotherapy, A1C reductions of approximately 1% to 1.5% are achieved with metformin, sulfonylureas, and GLP-1 receptor agonists [6,30,34,35,39]. DPP-4 inhibitors and SGLT-2 inhibitors have more modest glucose-lowering efficacy, with A1C reductions of approximately 0.5% to 1% [6,30,34,35,39]. Larger effects may be seen in individuals with higher baseline A1C and those who are drug naïve. Insulin is the most effective glucose-lowering agent—it can reduce virtually any level of A1C down to the normal range, with hypoglycemia being the only limiting factor. When a patient has uncontrolled hyperglycemia on metformin monotherapy, or if there is a contraindication or intolerance to metformin, clinicians should consider the potential glucose-lowering effects of other available options and should choose an agent that conceivably could bring a patient close to meeting their treatment goal.
Eliminate Options with Unacceptable Adverse Effects
When the pharmacologic options with acceptable A1C-lowering potential have been identified, the ones with contraindications and potential serious adverse effects for the individual patient can immediately be eliminated (Table 4). For example, if a patient has an eGFR < 30 mL/min/1.73 m2, metformin, sulfonylureas, GLP-1 receptor agonists, most DPP-4 inhibitors, and SGLT-2 inhibitors are either contraindicated or should be used with caution. In patients with severe osteoporosis, SGLT-2 inhibitors may not be the best option. In patients with a history of diabetic ketoacidosis (DKA), caution should be used with metformin and SGLT-2 inhibitors. There have been concerns of possible acute pancreatitis and neoplasia with the incretin-based agents, the DPP-4 inhibitors and GLP-1 receptor agonists [40,41], although other clinical trials and observational data have not found increased risk [42–45]. Nevertheless, these agents potentially should be avoided in patients with a history of pancreatitis or neoplasm. SGLT-2 inhibitors may be associated with genitourinary infections and volume depletion [46–48] and probably should be avoided in patients at high risk for these conditions.
If the adverse effects are not serious, changing the way the medication is administered may allow the patient to tolerate agents with high potential benefits. For example, metformin is commonly associated with gastrointestinal (GI) adverse effects, which can be reduced or avoided with slow titration of the dose [6] or by switching to an extended-release formulation [49]. GLP-1 receptor agonists are associated with GI adverse effects [6] and in most cases slow titration is recommended.
Evaluate Potential Risks/Benefits of Remaining Options
Hypoglycemia. The barrier of hypoglycemia generally precludes maintenance of euglycemia and full realization of the long-term benefits of good glucose control over a lifetime. Once considered a trivial issue, concerns about hypoglycemia in T2DM are increasingly being raised [19,50–55]. Clearly, hypoglycemia occurs more often as glycemic targets are lowered to near-normal values, especially in those with advanced age and multiple comorbidities [55]. Various comorbidities frequently encountered particularly as patients age also are associated with increasing propensity for experiencing hypoglycemia and untoward outcomes from it. These include coronary artery disease, heart failure, renal and liver disease, and dementia. Hypoglycemia, when it occurs, may lead to dysrhythmias, dizziness, accidents and falls, work disability, and decreased quality of life. In addition to relaxing blood glucose targets in high-risk patients, drug selection should favor agents that do not precipitate such events (Table 4).
Fortunately, the commonly used non-insulin agents are not associated with hypoglycemia unless they are used in combination with sulfonylureas or insulin. Sulfonylureas should be used with caution and other options considered in patients with high risk for hypoglycemia. When insulin is required, regimens which minimize risk of hypoglycemia should be used. For example, adding a GLP-1 receptor agonist to basal insulin as an alternative to mealtime insulin has been shown to be equally effective with a lower risk of hypoglycemia [4,6]. Also, premixed insulin preparations should be avoided or used cautiously in individuals who miss meals frequently. Additionally, newer basal insulins that exhibit longer duration of action are now available in the United States. Preliminary studies have shown that the newly FDA-approved longer-acting basal insulins, insulin degludec and glargine U-300, may be associated with a reduced risk for hypoglycemia [56,57]. However, it remains unclear how and when these newer agents will best be incorporated into a treatment regimen.
Body weight. Nearly 90% of people living with T2DM are overweight or obese. Given the close tie between obesity and T2DM, treating obesity is an obvious consideration in diabetes treatment. Major trials have shown the effectiveness of lifestyle modifications and weight reduction in delaying, prevention, and management of T2DM [4,58,59].With this in mind, clinicians should consider preferentially using antihyperglycemic agents with weight-lowering or weight-neutral effects. Among commonly used antihyperglycemic agents, metformin, GLP-1 receptor agonists, and SGLT-2 inhibitors have been shown to have weight-reduction benefits, and DPP-4 inhibitors are weight neutral. On the other hand, sulfonylureas and insulin are associated with weight gain. A systematic review and meta-analysis including 204 studies with study durations ranging from 3 months to 8 years showed comparative effects of diabetes medications with a differential effect on weight of up to 5 kg (Table 4) [60].
Metformin is associated with an average weight loss of 1.9 to 3.1 kg that was sustained with long-term use for at least 10 years in the Diabetes Prevention Program Outcomes Study [61].A systematic review of 7 randomized trials showed that in patients with T2DM, the SGLT-2 inhibitors dapagliflozin and canagliflozin were associated with weight loss (mean weighted difference of –1.81 kg and –2.3 kg, respectively) [62]. A systematic review and meta-analysis of 25 randomized controlled trials showed greater weight loss (mean weighted difference of –2.9 kg) in overweight or obese patients with or without T2DM using GLP-1 receptor agonists when compared to placebo, insulin, or oral antihyperglycemic agents [63]. Of note, the GLP-1 receptor agonist liraglutide is now approved for weight loss in patients with or without diabetes [64]. The maximum doses approved for diabetes and obesity treatment are 1.8 and 3.0 mg/day, respectively.
Since weight loss is associated with improved glycemic control, an area of emerging interest is the use of antiobesity medications for managing diabetes. Although most older weight-loss medications were only approved for short-term use, some newer agents are approved for longer-term use. Lorcaserin and the combination drugs topiramate/phentermine and naltrexone/bupropion are approved for chronic therapy, provided certain conditions are met. Patients on weight reduction agents should be monitored regularly. 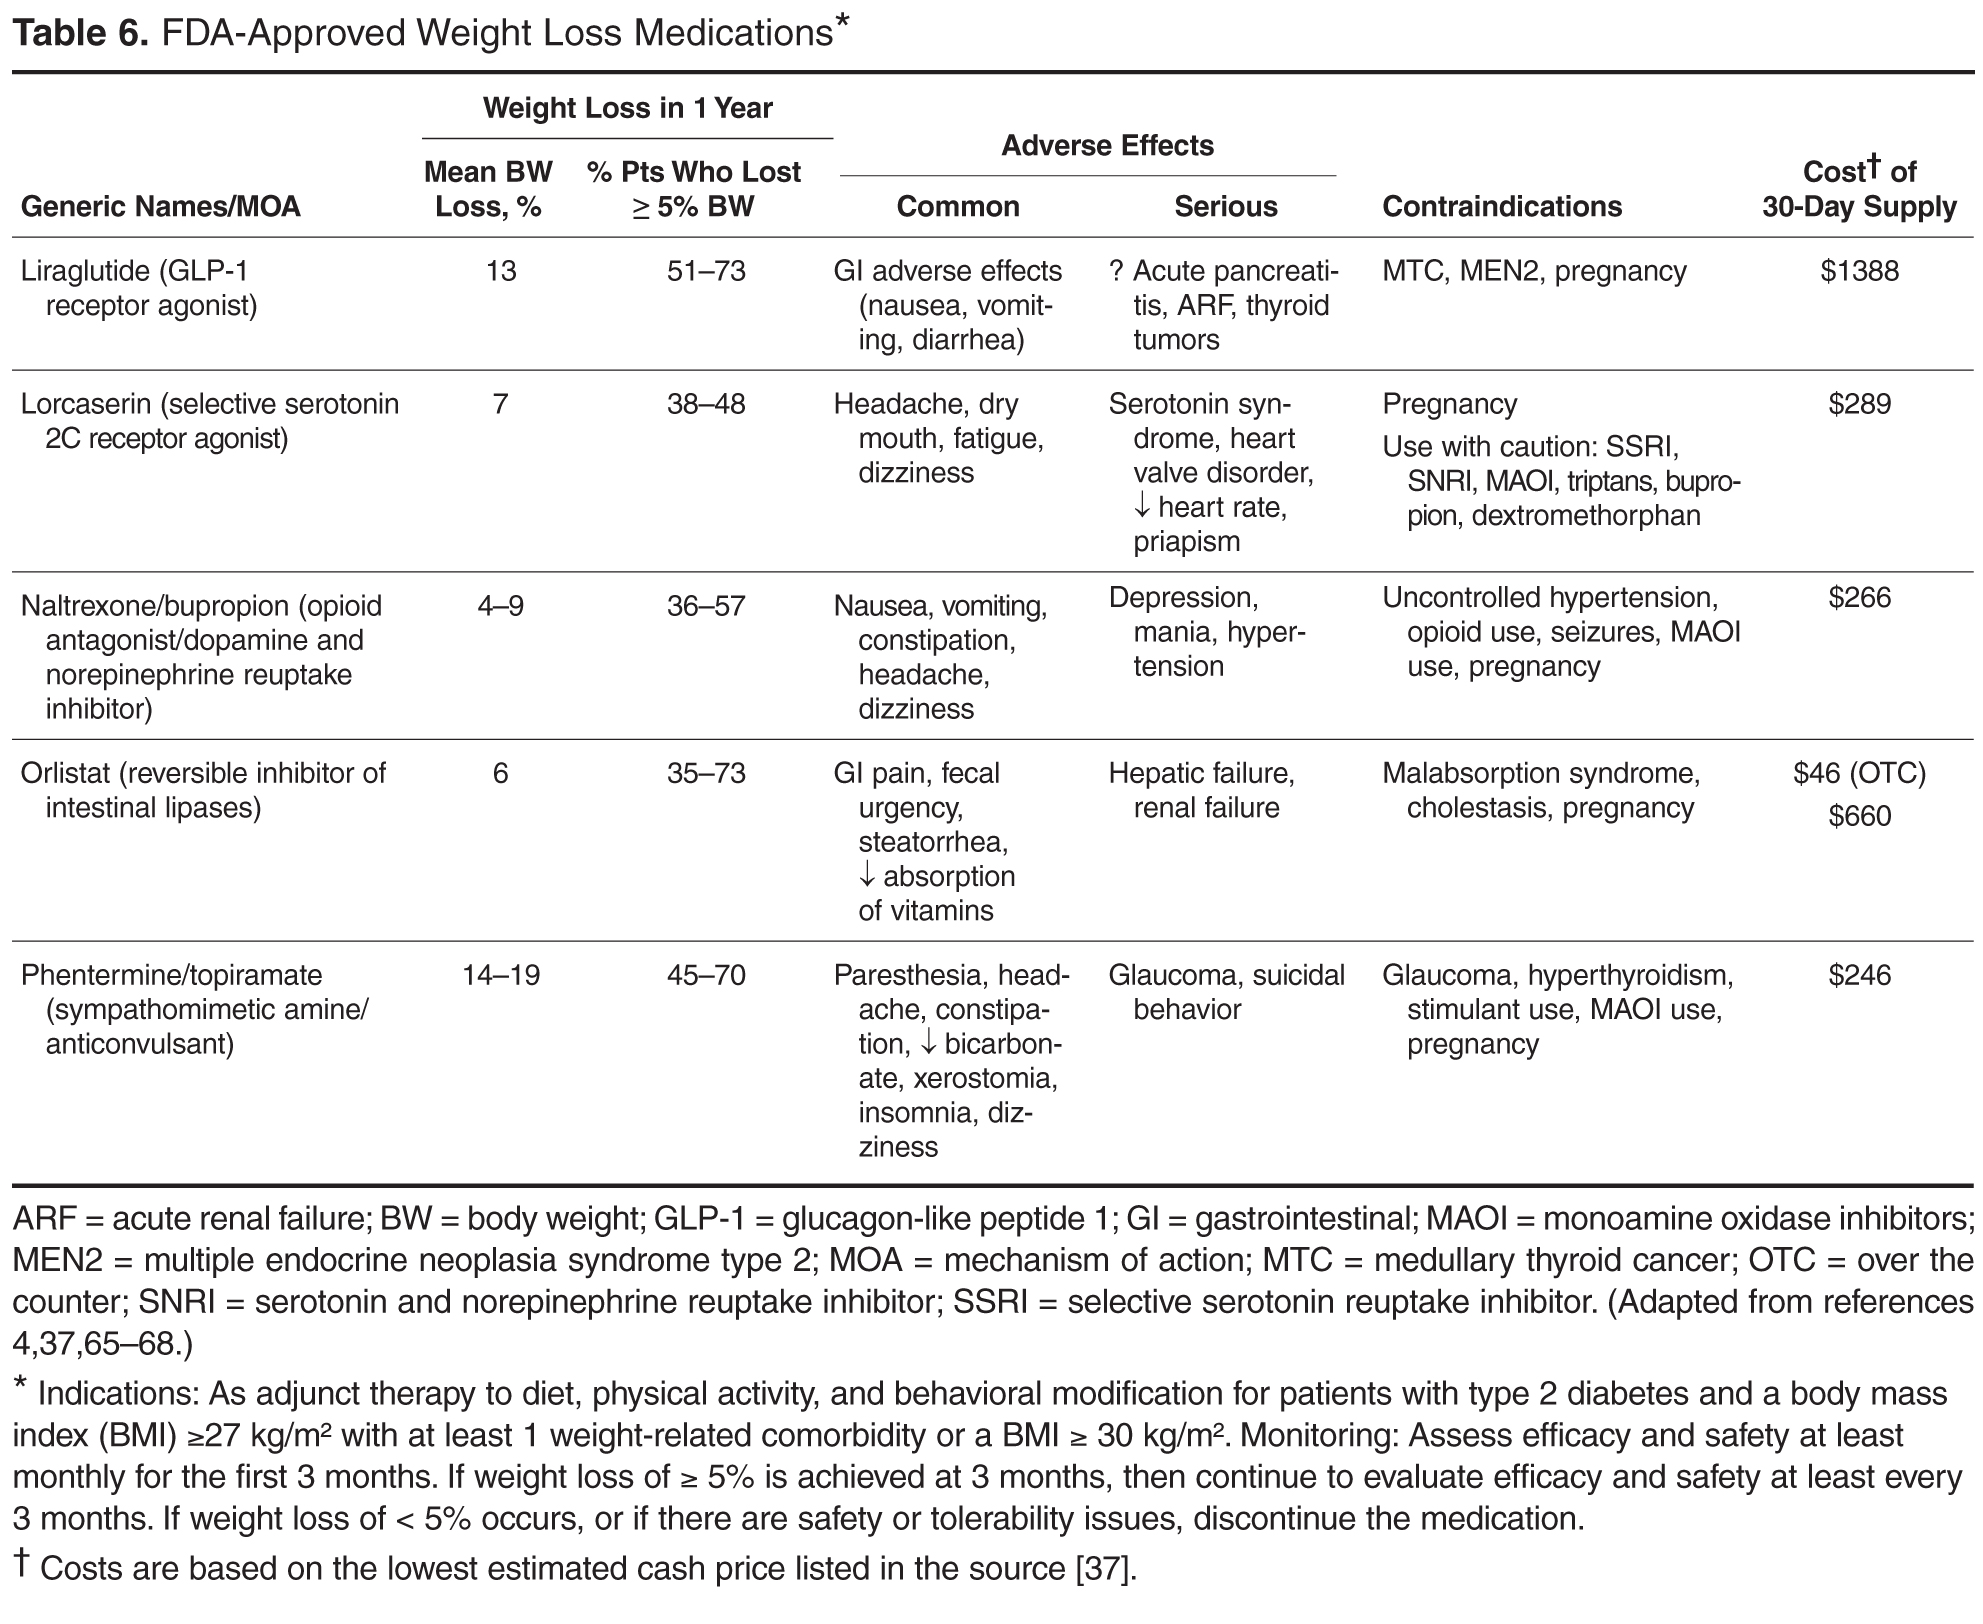
An even more radical departure from conventional therapy for diabetes is the consideration of metabolic, or weight-loss, surgery, which has been found to be associated with rapid and dramatic improvements in blood glucose control. Metabolic surgery has been shown to improve glucose control more effectively than any known pharmaceutical or behavioral approach. For example, in an observational study of obese patients with T2DM, bariatric surgery led to diabetes remission rates of 72.3% 2 years after surgery and 30.4% 15 years after surgery compared to 16.4% and 6.5%, respectively, in control patients [69]. With long-term follow-up, significant decreases in microvascular and macrovascular complications were seen in the surgical group [69]. Compared with medical therapy alone, bariatric surgery plus medical therapy has been associated with more weight loss, better glycemic control, less need for diabetes medications, and improved quality of life [70]. A 2016 joint statement by numerous international diabetes organizations recommends considering metabolic surgery as a treatment for T2DM and obesity [71]. American Diabetes Association guidelines recommend consideration of bariatric surgery in individuals with T2DM who have a body mass index greater than 35 kg/m2,especially if achieving disease control is difficult by means of lifestyle modifications and medications [4].
Cardiovascular outcomes. Cardiovascular risk is about 2 to 4 times higher in patients with diabetes, and about half of patients with this condition develop heart failure [4,72]. CVD is responsible for most of the mortality in T2DM [72]. Therefore, prevention of cardiovascular morbidity and mortality is an important goal for diabetes treatment. Due to concerns about potential cardiovascular risks associated with glucose-lowering medications [73–76], the FDA has issued regulatory requirements for manufacturers to monitor the cardiovascular risk profile for these drugs [77]. Recent trials have led to a better understanding of potential cardiovascular benefits or harms of antihyperglycemic medications.
Metformin, the widely recommended first-line therapy for T2DM, carries a large body of evidence supporting its cardiovascular benefits. For example, the UKPDS found that compared to conventional therapy (mostly diet), metformin reduced cardiovascular events and mortality in obese patients with T2DM [15]. This result was supported in Hyperinsulinemia: the Outcome of its Metabolic Effect (HOME) study where, as an add-on to insulin, metformin decreased macrovascular complications when compared to placebo [78]. Research over the past decade also has assuaged concerns about metformin safety in heart failure [60]. A systematic review of observational studies involving 34,000 patients conducted in 2013 showed that metformin is as safe as other glucose-lowering medications in patients with diabetes and heart failure even in the presence of CKD [4,79]. Furthermore, numerous investigations have found metformin is not associated with increased hospitalizations or risk of lactic acidosis [80]. Metformin can be used safely in patients with diabetes and heart failure [60].
Although sulfonylureas have long been a mainstay of diabetes therapy, concerns about their potential adverse cardiovascular effects have been raised by numerous studies [81]. Tolbutamide, a first-generation sulfonylurea, was removed from the market after the University Group Diabetes Program study found increased CVD deaths with this agent versus placebo. Subsequently, the FDA issued a warning for all sulfonylureas [74]. The increased cardiovascular risk associated with sulfonylureas is thought to be due to their effect on cardiac mitochondrial potassium ATP channels. Sulfonylureas bind to these channels, preventing a protective phenomenon called ischemic preconditioning and resulting in a weakened defense against myocardial injury [76]. A recent study showed an increased risk of coronary heart disease associated with long-term use of sulfonylureas in women with diabetes [81].
GLP-1 receptor agonists have recently received much attention for their potential beneficial effects on cardiovascular outcomes. In a recent trial, lixisenatide was shown to be safe in patients with T2DM and acute coronary syndrome when compared to placebo [82]. More recently, the Liraglutide Effect and Action in Diabetes: Evaluation of cardiovascular outcome Results (LEADER) trial demonstrated significant cardiovascular benefits with liraglutide in patients with T2DM and established or high CVD risk [83]. The composite outcome of the first occurrence of death from cardiovascular causes, nonfatal myocardial infarction (MI), or nonfatal stroke, occurred less frequently in the liraglutide group compared to placebo (13% versus 14.9%, respectively), and there were fewer deaths from cardiovascular causes in the liraglutide group compared to placebo (4.7% and 6.0%, respectively) [83]. Other trials investigating the cardiovascular outcomes of this class [84,85] are in progress.
Another class with potential cardiovascular benefits is the SGLT-2 inhibitors. In a recent cardiovascular outcome study, empagliflozin significantly lowered the composite of cardiovascular death, nonfatal MI, or nonfatal stroke in T2DM patients with high cardiovascular risk compared to placebo (10.5% and 12.1%, respectively) [86]. There are several large ongoing studies evaluating the cardiovascular effects of other SGLT-2 inhibitors [87–89].
DPP-4 inhibitors were examined in recent studies and have shown no cardiovascular benefits [42,44,90].The studies showed mixed results regarding an association between DPP-4 inhibitors and heart failure. In one study, saxagliptin was associated with increased hospitalization for heart failure compared to placebo [44], while 2 noninferiority trials did not show a significant increase in heart failure hospitalizations associated with alogliptin and sitagliptin when compared to placebo [42,90].
Administration Considerations
Many patients with T2DM require multiple agents for glycemic control. Additional medications used for comorbid conditions add to this burden. When choosing antihyperglycemic agents, the route and frequency of administration, as well as the patients’ preferences and ability, should be considered. Either once or twice daily dosing is available for most agents, and once weekly dosing is available for some of the GLP-1 receptor agonists. Once daily or once weekly formulations may improve adherence and be more desirable than preparations that are dosed twice daily. Most of the commonly used medications are dosed orally. Although many patients find this route of administration preferable to insulin or GLP-1 receptor agonists, which require injections, some patients may prefer the risk/benefit of injectable agents. All GLP-1 receptor agonists come in a pen delivery system, which eliminates mixing and provides more convenient administration. Extended-release exenatide also is available as a single-dose tray that requires mixing and may be more cumbersome to inject.
Insulin requires special consideration. There has been an enormous increase in the number of insulin products on the market in the past 2 decades. These products include insulin analogs, concentrated insulins (U-200, U-300, and U-500), premixed insulin preparations, and ultra-long-acting insulin [91]. The availability of insulin options with different concentrations, onsets, and durations of actions has made decision making on which insulin to use difficult. Clinicians need to consider patient preference, dosing frequency, and timing with regard to meals, insulin dose, administration, as well as cost. For example, concentrated insulin is preferred for a patient on high doses of insulin requiring injecting a large volume of insulin. Rapid-acting insulin analogs would be more appropriate for patients who have difficulty administering their regular insulin 20 to 30 minutes before eating. Premixed insulin preparations make it impossible to independently adjust short- and long-acting components. However, these may be good choices in patients who have consistent meal schedules and who want to simplify administration. Despite a prevailing misconception that NPH must be given twice a day, it has long been recognized that in T2DM, a single daily injection of NPH yields improvements in control similar to those achieved with 2 daily injections [92].
Cost Considerations
Treating T2DM imposes a great financial burden on individuals living with diabetes and their families due to the high cost of the medications. Table 4 and Table 5 provide information on the cost of non-insulin and insulin diabetes medications for patients who do not have prescription insurance coverage. From a practical standpoint, choice of diabetes agents is largely influenced by insurance formularies.
The older agents, metformin and the sulfonylureas, are available for a cash (no insurance) price of as little as $4 per month. This is in stark contrast to the SGLT-2 inhibitors, GLP-1 receptor agonists, and DPP-4 inhibitors, which range in cost between $400 and $600 per month. Of recent concern, the cost of insulin has been skyrocketing, with a more than 500% increase in the cost of certain insulins from 2001 to 2015 [93]. According to the Medical Expenditure Panel Survey (MEPS) from 2002 to 2013, the mean price of insulin increased by about 200% (from $4.34/mL to $12.92/mL) during this period, which was significantly higher than increases in the price of non-insulin comparators [94]. The introduction of biosimilar insulins to the market is expected to offer treatment options with lower cost. This will be tested when the biosimilar glargine, the first FDA-approved biosimilar insulin, becomes available in the U.S. market. However, a significant reduction in insulin prices is not expected soon [95].
When insulin is required, most patients with T2DM can be treated with older human insulins, which have similar efficacy and lower costs than the more expensive newer insulin analogs. A Cochrane review comparing basal insulin analogs to NPH showed similar efficacy in glycemic control with minimal clinical benefit in the form of less nocturnal hypoglycemia in the insulin analog arm [96]. Furthermore, similar glycemic control and risk of hypoglycemia was seen when regular insulin was compared with the rapid-acting insulin analogs [97]. The cost of human NPH insulin for a patient on a total daily dose of 60 units is approximately $52 per month. This contrasts with the most widely used insulin, insulin glargine, which has a cash price of about $500 per month for the same amount (Table 5). Insulin pens, which are convenient, are more expensive. Interestingly, human insulins do not require prescriptions, allowing underinsured, underfunded patients ongoing access to them.
Incorporating Patient Preferences
Research evidence is necessary but insufficient for making patient care decisions. Along with the potential benefits, harms, costs, and inconveniences of the management options, patient perspectives, beliefs, expectations, and health-related goals must be considered. Patients will undoubtedly have preferences regarding defining goals and ranking options. Clinicians should discuss therapeutic goals and treatment options and work collaboratively with patients in determining management strategies [98].
Summary

Potential treatment approaches for treating hyperglycemia in T2DM are summarized in Figure 1 and Figure 2 [4,7]. As long as there are no contraindications, metformin should be recommended concurrent with lifestyle intervention at the time of diabetes diagnosis. Even if metformin monotherapy is initially effective, glycemic control is likely to deteriorate over time due to progressive loss of β-cell function in T2DM.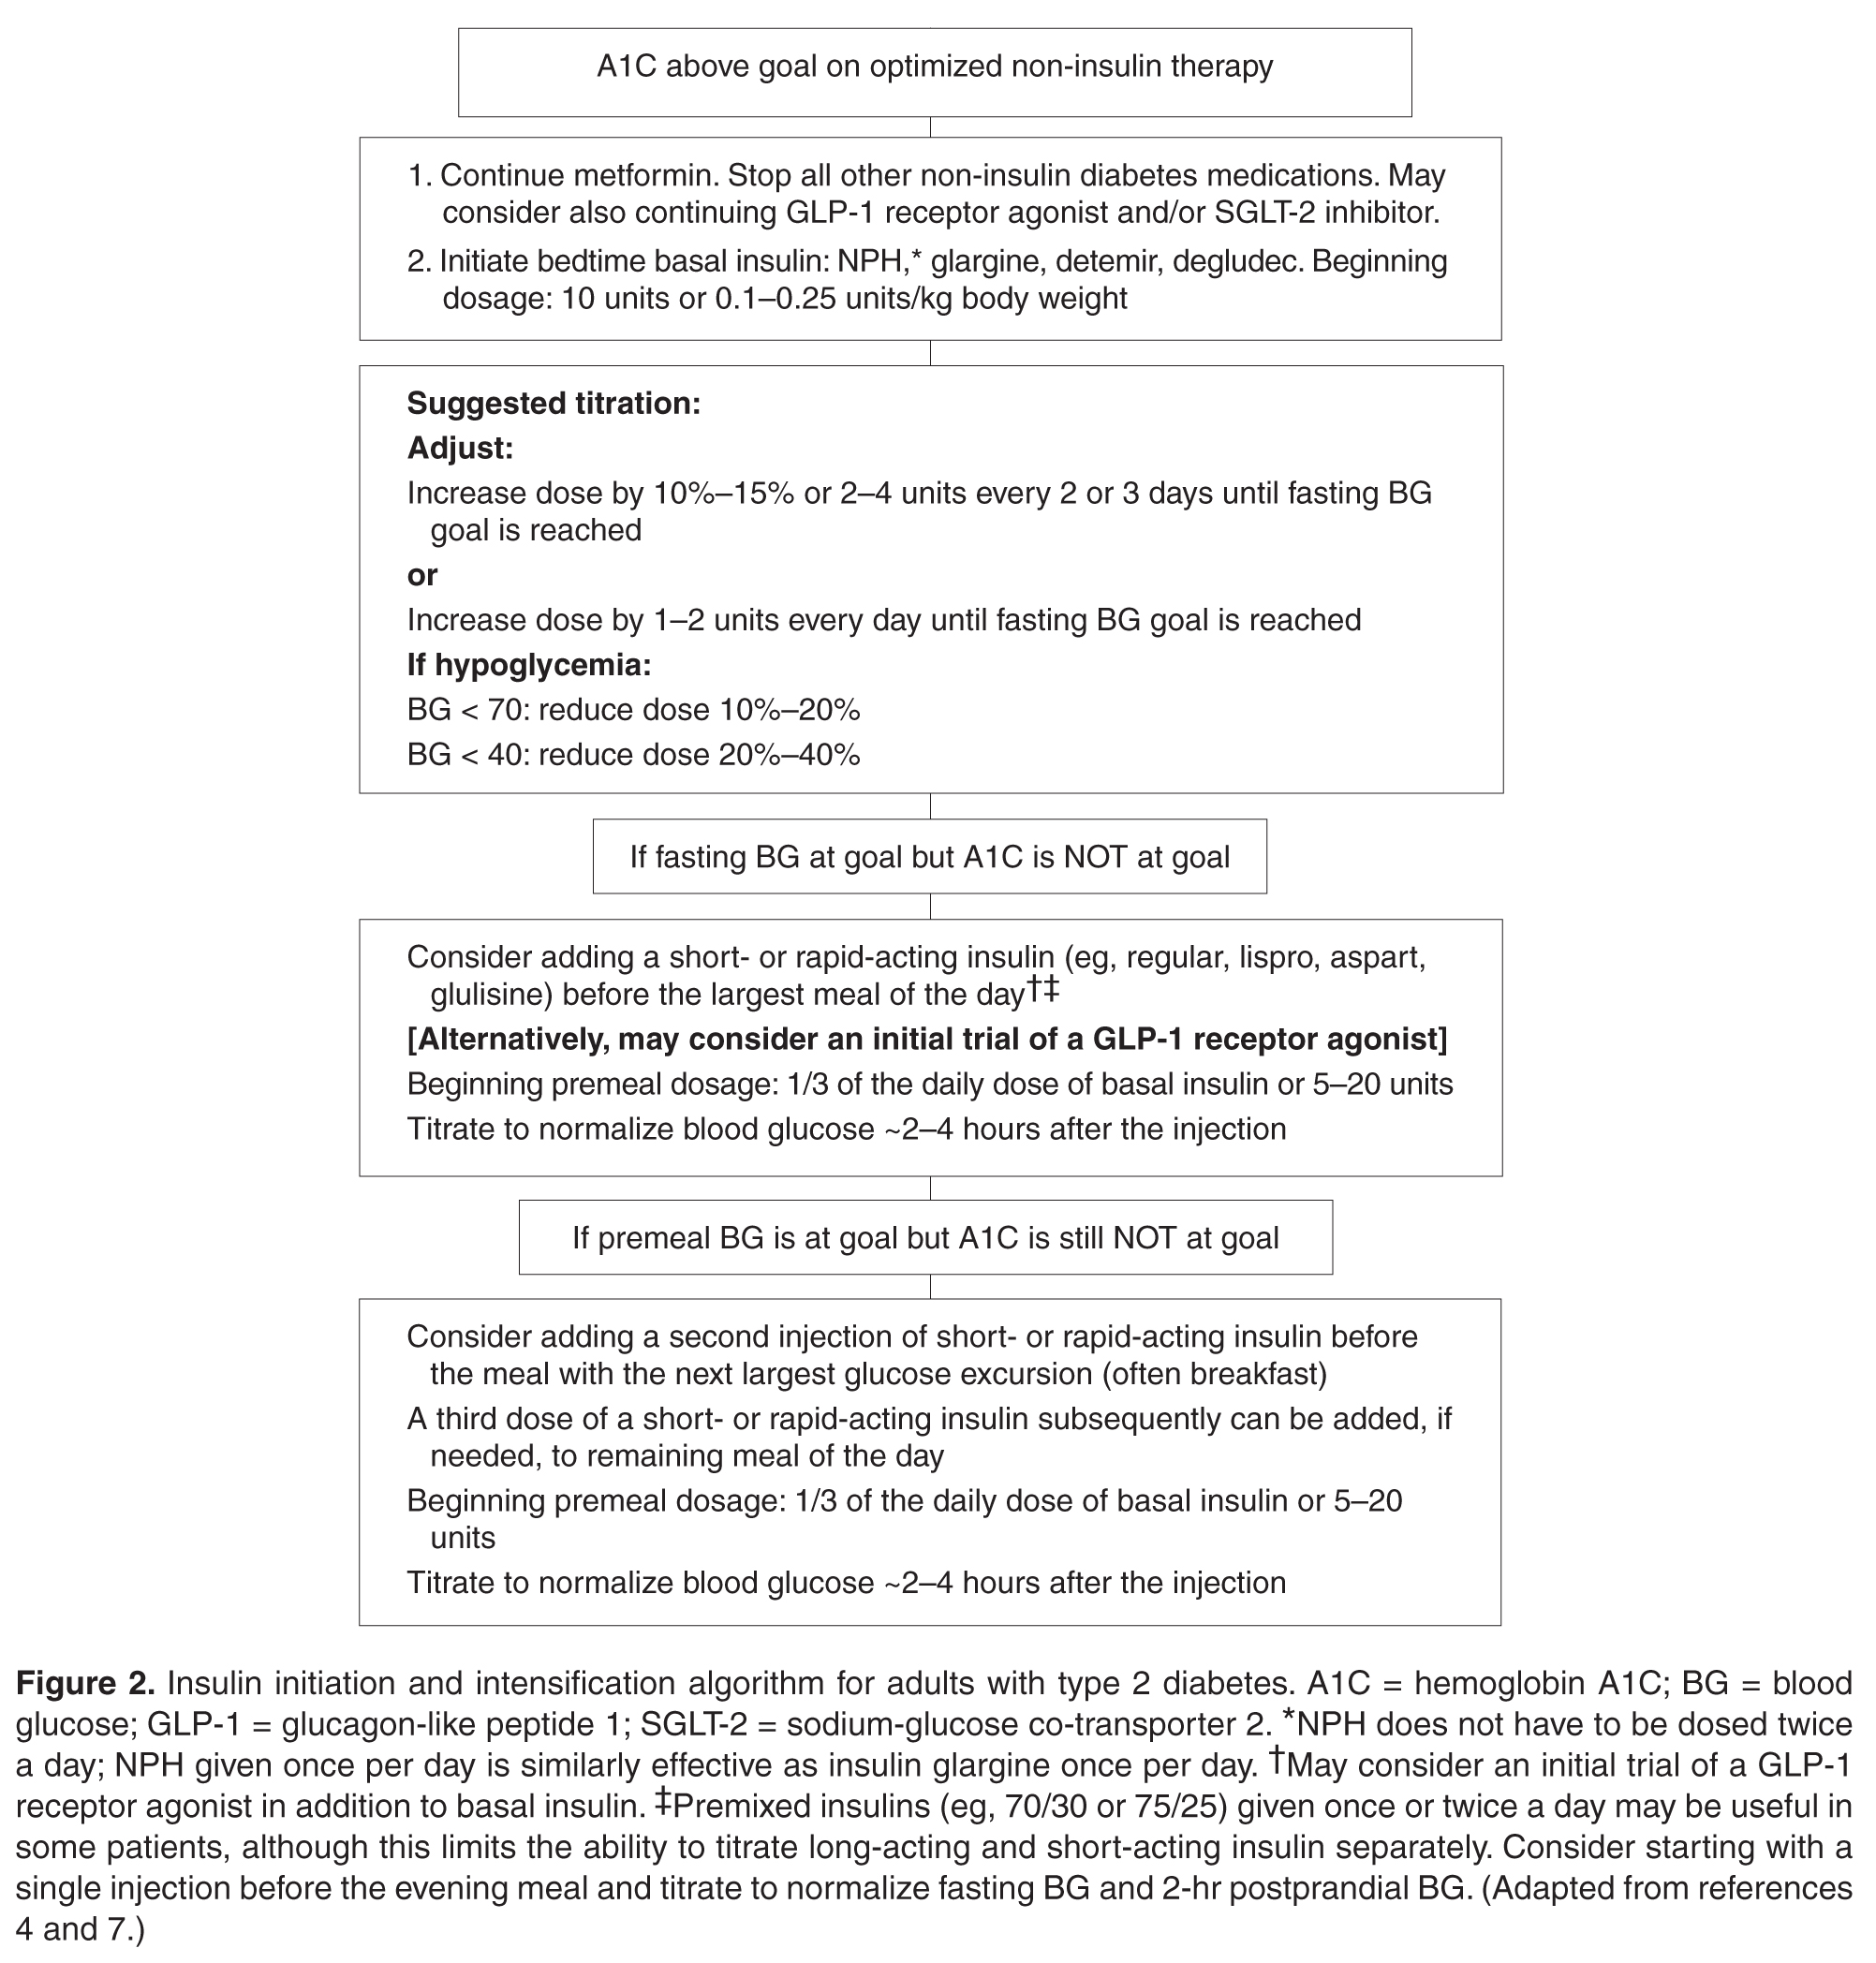
There is no consensus as to what the second-line agent should be. Selection of a second agent should be made based on potential advantages and disadvantages of each agent for any given patient. A patient-centered approach is preferred over a fixed algorithm. If the patient progresses to the point where dual therapy does not provide adequate control, either a third non-insulin agent or insulin can be added. In patients with modestly elevated A1C (below ~8%), addition of a third non-insulin agent may be equally effective as (but more expensive than) addition of insulin.
Patients with significantly elevated A1C levels on non-insulin agents usually should have insulin added to their regimen. When insulin is added, metformin should be continued. DPP-4 inhibitors and sulfonylureas are typically stopped. If SGLT-2 inhibitors and/or GLP-1 receptor agonists are continued, this may aid with weight maintenance. However, continuing these agents is likely to be expensive and associated with problems associated with polypharmacy.
The most widely recommended strategy for initiating insulin in T2DM is to add a single bedtime injection of basal insulin (ie, NPH, glargine, detemir, or degludec) to the patient’s regimen. This regimen has been found to be effective in numerous studies and controls hyperglycemia in up to 60% of patients [99]. If the patient is treated with a single bedtime injection of insulin and the fasting glucose level is within the target range but the A1C level remains above goal, addition of mealtime insulin injections is likely to be beneficial. Alternatively, addition of a GLP-1 receptor agonist to basal insulin has been shown to be equally beneficial [4,6]. When adding mealtime insulin, a common strategy is to add a single injection of a rapid-acting insulin (eg, lispro, aspart, glulisine) before the patient’s largest meal of the day. Additional premeal injections of rapid-acting insulin may be added as needed, based on self-monitoring blood glucose results. If glycemia remains significantly uncontrolled on more than 200 units of insulin per day, switching to a concentrated form of insulin (eg, U-200, U-300, or U-500) should be considered.
Corresponding author: Maryam Fazel, PharmD, BCPS, BCACP, CDE, 1295 N. Martin Ave. (Room B211B), Tucson, Arizona 85721-0202, [email protected].
Financial disclosures: None.
1. National diabetes statistics report: estimates of diabetes and its burden in the United States, 2014. Centers for Disease Control and Prevention Web site. www.cdc.gov/diabetes/pubs/statsreport14/national-diabetes-report-web.pdf. Accessed November 29, 2016.
2. Statistics about diabetes. American Diabetes Association Web site. www.diabetes.org/diabetes-basics/statistics/. Accessed November 29, 2016.
3. American Diabetes Association. Economic costs of diabetes in the U.S. in 2012. Diabetes Care 2013;36:1033–46.
4. American Diabetes Association. Standards of medical care in diabetes--2016. Diabetes Care 2016;39(Suppl. 1).
5. Raz I, Riddle MC, Rosenstock J, et al. Personalized management of hyperglycemia in type 2 diabetes: reflections from a Diabetes Care Editors’ Expert Forum. Diabetes Care 2013;36:1779–88.
6. Inzucchi SE, Bergenstal RM, Buse JB, et al. Management of hyperglycemia in type 2 diabetes, 2015: a patient-centered approach: update to a position statement of the American Diabetes Association and the European Association for the Study of Diabetes. Diabetes Care 2015;38:140–9.
7. Garber AJ, Abrahamson MJ, Barzilay JI, et al. Consensus Statement by the American Association of Clinical Endocrinologists and American College of Endocrinology on the Comprehensive Type 2 Diabetes Management Algorithm--2016 Executive Summary. Endocr Pract 2016;22:84–113.
8. Steenkamp DW, Alexanian SM, Sternthal E. Approach to the patient with atypical diabetes. CMAJ 2014;186:678–84.
9. de Lusignan S, Sadek N, Mulnier H, et al. Miscoding, misclassification and misdiagnosis of diabetes in primary care. Diabet Med 2012;29:181–9.
10. Tripathi A, Rizvi AA, Knight LM, Jerrell JM. Prevalence and impact of initial misclassification of pediatric type 1 diabetes mellitus. South Med J 2012;105:513–7.
11. The effect of intensive treatment of diabetes on the development and progression of long-term complications in insulin-dependent diabetes mellitus. The Diabetes Control and Complications Trial Research Group. N Engl J Med 1993;329:977–86.
12. Intensive blood-glucose control with sulphonylureas or insulin compared with conventional treatment and risk of complications in patients with type 2 diabetes (UKPDS 33). UK Prospective Diabetes Study (UKPDS) Group. Lancet 1998;352:837–53.
13. Nathan DM, Cleary PA, Backlund JY, et al. Intensive diabetes treatment and cardiovascular disease in patients with type 1 diabetes. N Engl J Med 2005;353:2643–53.
14. Nathan DM, DCCT/EDIC Research Group. The diabetes control and complications trial/epidemiology of diabetes interventions and complications study at 30 years: overview. Diabetes Care 2014;37:9–16.
15. Effect of intensive blood-glucose control with metformin on complications in overweight patients with type 2 diabetes (UKPDS 34). UK Prospective Diabetes Study (UKPDS) Group. Lancet 1998;352:854–65.
16. Holman RR, Paul SK, Bethel MA, et al. 10-Year follow-up of intensive glucose control in type 2 diabetes. N Engl J Med 2008;359:1577–89.
17. Ohkubo Y, Kishikawa H, Araki E, et al. Intensive insulin therapy prevents the progression of diabetic microvascular complications in Japanese patients with non-insulin-dependent diabetes mellitus: a randomized prospective 6-year study. Diabetes Res Clin Pract 1995;28:103–17.
18. Action to Control Cardiovascular Risk in Diabetes Study Group, Gerstein HC, Miller ME, Byington RP, et al. Effects of intensive glucose lowering in type 2 diabetes. N Engl J Med 2008;358:2545–59.
19. ACCORD Study Group, Gerstein HC, Miller ME, Genuth S, et al. Long-term effects of intensive glucose lowering on cardiovascular outcomes. N Engl J Med 2011;364:818–28.
20. ADVANCE Collaborative Group, Patel A, MacMahon S, Chalmers J, et al. Intensive blood glucose control and vascular outcomes in patients with type 2 diabetes. N Engl J Med 2008;358:2560–72.
21. Wong MG, Perkovic V, Chalmers J, et al. Long-term Benefits of Intensive Glucose Control for Preventing End-Stage Kidney Disease: ADVANCE-ON. Diabetes Care 2016;39:694–700.
22. Duckworth W, Abraira C, Moritz T, et al. Glucose control and vascular complications in veterans with type 2 diabetes. N Engl J Med 2009;360:129–39.
23. Hayward RA, Reaven PD, Wiitala WL, et al. Follow-up of glycemic control and cardiovascular outcomes in type 2 diabetes. N Engl J Med 2015;372:2197–206.
24. American Diabetes Association. Standards of medical care in diabetes--2009. Diabetes Care 2009;32 Suppl 1:S13–61.
25. American Geriatrics Society Expert Panel on Care of Older Adults with Diabetes Mellitus, Moreno G, Mangione CM, Kimbro L, Vaisberg E. Guidelines abstracted from the American Geriatrics Society Guidelines for Improving the Care of Older Adults with Diabetes Mellitus: 2013 update. J Am Geriatr Soc 2013;61:2020–6.
26. Lipska KJ, Ross JS, Miao Y, et al. Potential overtreatment of diabetes mellitus in older adults with tight glycemic control. JAMA Intern Med 2015;175:356–62.
27. Sussman JB, Kerr EA, Saini SD, et al. Rates of deintensification of blood pressure and glycemic medication treatment based on levels of control and life expectancy in older patients with diabetes mellitus. JAMA Intern Med 2015;175:1942–9.
28. FDA Drug Safety Communication: FDA revises warnings regarding use of the diabetes medicine metformin in certain patients with reduced kidney function. FDA Web site. www.fda.gov/Drugs/DrugSafety/ucm493244.htm. Accessed December 1, 2016.
29. Inzucchi SE, Lipska KJ, Mayo H, et al. Metformin in patients with type 2 diabetes and kidney disease: a systematic review. JAMA 2014;312:2668–75.
30. Nathan DM. Diabetes: advances in diagnosis and treatment. JAMA 2015;314:1052–62.
31. Nathan DM, Buse JB, Kahn SE, et al. Rationale and design of the glycemia reduction approaches in diabetes: a comparative effectiveness study (GRADE). Diabetes Care 2013;36:2254–61.
32. NIH begins recruitment for long-term study of diabetes drug efficacy. NIH Web site. www.nih.gov/news-events/news-releases/nih-begins-recruitment-long-term-study-diabetes-drug-efficacy. Accessed December 1, 2016.
33. Hermayer KL, Dake A. Newer oral and noninsulin therapies to treat type 2 diabetes mellitus. Cleve Clin J Med 2016;83(5 Suppl 1):S18–26.
34. Bolen S, Wilson L, Vassy J, et al. Systematic review: comparative effectiveness and safety of oral medications for type 2 diabetes mellitus. Ann Intern Med 2007;147:386–99.
35. Bolen S, Tseng E, Hutfless S, et al. Oral diabetes medications for adults with type 2 diabetes: an update. Agency for Healthcare Research and Quality (US); 2011 Mar Report No: 11-EHC038-EF. AHRQ Comparative Effectiveness Reviews.
36. Metformin, glyburide, glipizide, glimeperide, sitagliptin, saxagliptin, linagliptin, lixisenatide, alogliptin, exenatide, liraglutide, albiglutide, dulaglutide, canagliflozin, danagliflozin, empagliflozin: drug information. Waltham (MA): UpToDate, Inc.; 2016. Accessed September 23, 2016.
37. GoodRx Web site. http://www.goodrx.com. Accessed August 6, 2016 and December 2016.
38. Insulins available in the United States. Diabetesforcast Web site. Accessed August 6, 2016. www.diabetesforecast.org/2016/mar-apr/images/2016-insulin-chart-new.pdf.
39. Inzucchi SE, Bergenstal RM, Buse JB, et al. Management of hyperglycaemia in type 2 diabetes: a patient-centered approach. Position statement of the American Diabetes Association (ADA) and the European Association for the Study of Diabetes (EASD). Diabetologia 2012;55:577–96.
40. Elashoff M, Matveyenko AV, Gier B, et al. Pancreatitis, pancreatic, and thyroid cancer with glucagon-like peptide-1-based therapies. Gastroenterology 2011;141:150–6.
41. Butler AE, Campbell-Thompson M, Gurlo T, et al. Marked expansion of exocrine and endocrine pancreas with incretin therapy in humans with increased exocrine pancreas dysplasia and the potential for glucagon-producing neuroendocrine tumors. Diabetes 2013;62:2595–604.
42. Green JB, Bethel MA, Armstrong PW, et al. Effect of sitagliptin on cardiovascular outcomes in type 2 diabetes. N Engl J Med 2015;373:232–42.
43. White WB, Cannon CP, Heller SR, et al. Alogliptin after acute coronary syndrome in patients with type 2 diabetes. N Engl J Med 2013;369:1327–35.
44. Scirica BM, Bhatt DL, Braunwald E, et al. Saxagliptin and cardiovascular outcomes in patients with type 2 diabetes mellitus. N Engl J Med 2013;369:1317–26.
45. Egan AG, Blind E, Dunder K, et al. Pancreatic safety of incretin-based drugs--FDA and EMA assessment. N Engl J Med 2014;370:794–7.
46. Vasilakou D, Karagiannis T, Athanasiadou E, et al. Sodium-glucose cotransporter 2 inhibitors for type 2 diabetes: a systematic review and meta-analysis. Ann Intern Med 2013;159:262–74.
47. Nyirjesy P, Sobel JD, Fung A, et al. Genital mycotic infections with canagliflozin, a sodium glucose co-transporter 2 inhibitor, in patients with type 2 diabetes mellitus: a pooled analysis of clinical studies. Curr Med Res Opin 2014;30:1109–19.
48. Schernthaner G, Gross JL, Rosenstock J, et al. Canagliflozin compared with sitagliptin for patients with type 2 diabetes who do not have adequate glycemic control with metformin plus sulfonylurea: a 52-week randomized trial. Diabetes Care 2013;36:2508–15.
49. Blonde L, Dailey G, Jabbour S, et al. Gastrointestinal tolerability of extended-release metformin tablets compared to immediate-release metformin tablets: results of a retrospective cohort study. Curr Med Res Opin 2004;20:562–72.
50. Kalra S, Mukherjee JJ, Venkataraman S, et al. Hypoglycemia: the neglected complication. Indian J Endocrinol Metab 2013;17:819–34.
51. Paty BW. The role of hypoglycemia in cardiovascular outcomes in diabetes. Can J Diabetes 2015;39 Suppl 5:S155–9.
52. Zoungas S, Patel A, Chalmers J, et al. Severe hypoglycemia and risks of vascular events and death. N Engl J Med 2010;363:1410–8.
53. Whitmer RA, Karter AJ, Yaffe K, et al. Hypoglycemic episodes and risk of dementia in older patients with type 2 diabetes mellitus. JAMA 2009;301:1565–72.
54. McCoy RG, Van Houten HK, Ziegenfuss JY, et al. Increased mortality of patients with diabetes reporting severe hypoglycemia. Diabetes Care 2012;35:1897–901.
55. McCoy RG, Lipska KJ, Yao X, et al. Intensive treatment and severe hypoglycemia among adults with type 2 diabetes. JAMA Intern Med 2016;176:969–78.
56. Rodbard HW, Gough S, Lane W, et al. Reduced risk of hypoglycemia with insulin degludec versus insulin glargine in patients with type 2 diabetes requiring high doses of basal insulin: a meta-analysis of 5 randomized begin trials. Endocr Pract 2014;20:285–92.
57. Yki-Jarvinen H, Bergenstal R, Ziemen M, et al. New insulin glargine 300 units/mL versus glargine 100 units/mL in people with type 2 diabetes using oral agents and basal insulin: glucose control and hypoglycemia in a 6-month randomized controlled trial (EDITION 2). Diabetes Care 2014;37:3235–43.
58. Tuomilehto J, Lindstrom J, Eriksson JG, et al. Prevention of type 2 diabetes mellitus by changes in lifestyle among subjects with impaired glucose tolerance. N Engl J Med 2001;344:1343–50.
59. Knowler WC, Barrett-Connor E, Fowler SE, et al. Reduction in the incidence of type 2 diabetes with lifestyle intervention or metformin. N Engl J Med 2002;346:393–403.
60. Maruthur NM, Tseng E, Hutfless S, et al. Diabetes medications as monotherapy or metformin-based combination therapy for type 2 diabetes: a systematic review and meta-analysis. Ann Intern Med 2016;164:740–51.
61. Diabetes Prevention Program Research Group. Long-term safety, tolerability, and weight loss associated with metformin in the Diabetes Prevention Program Outcomes Study. Diabetes Care 2012;35:731–7.
62. Clar C, Gill JA, Court R, Waugh N. Systematic review of SGLT2 receptor inhibitors in dual or triple therapy in type 2 diabetes. BMJ Open 2012;2:10.1136/bmjopen,2012-001007.
63. Vilsboll T, Christensen M, Junker AE, et al. Effects of glucagon-like peptide-1 receptor agonists on weight loss: systematic review and meta-analyses of randomised controlled trials. BMJ 2012;344:d7771.
64. FDA approves weight-management drug Saxenda. FDA Web site www.fda.gov/NewsEvents/Newsroom/PressAnnouncements/ucm427913.htm. Accessed September 22, 2016.
65. Apovian CM, Aronne LJ, Bessesen DH, et al. Pharmacological management of obesity: an endocrine Society clinical practice guideline. J Clin Endocrinol Metab 2015;100:342–62.
66. Liraglutide, lorcaserin, naltrexone/bupropion, orlistat, phentermine/topiramate: drug information. Greenwood Village (CO): Truven Health Analytics; 2016. www.micromedexsolutions.com. Accessed May 13, 2016.
67. Liraglutide, lorcaserin, naltrexone/bupropion, orlistat, phentermine/topiramate: drug information. Waltham (MA): UpToDate, Inc.; 2016. Accessed May 13, 2016.
68. Yanovski SZ, Yanovski JA. Long-term drug treatment for obesity: a systematic and clinical review. JAMA 2014;311:74–86.
69. Sjostrom L, Peltonen M, Jacobson P, et al. Association of bariatric surgery with long-term remission of type 2 diabetes and with microvascular and macrovascular complications. JAMA 2014;311:2297–304.
70. Schauer PR, Bhatt DL, Kirwan JP, et al. Bariatric surgery versus intensive medical therapy for diabetes--3-year outcomes. N Engl J Med 2014;370:2002–13.
71. Rubino F, Nathan DM, Eckel RH, et al. Metabolic surgery in the treatment algorithm for type 2 diabetes: a joint statement by international diabetes organizations. Diabetes Care 2016;39:861–77.
72. Lathief S, Inzucchi SE. Approach to diabetes management in patients with CVD. Trends Cardiovasc Med 2016;26:165–79.
73. Nissen SE, Wolski K. Effect of rosiglitazone on the risk of myocardial infarction and death from cardiovascular causes. N Engl J Med 2007;356:2457–71.
74. Knatterud GL, Klimt CR, Levin ME, et al. Effects of hypoglycemic agents on vascular complications in patients with adult-onset diabetes. VII. Mortality and selected nonfatal events with insulin treatment. JAMA 1978;240:37–42.
75. Masoudi FA, Inzucchi SE, Wang Y, et al. Thiazolidinediones, metformin, and outcomes in older patients with diabetes and heart failure: an observational study. Circulation 2005;111:583–90.
76. Klepzig H, Kober G, Matter C, et al. Sulfonylureas and ischaemic preconditioning; a double-blind, placebo-controlled evaluation of glimepiride and glibenclamide. Eur Heart J 1999;20:439–46.
77. FDA announces new recommendations on evaluating cardiovascular risk in drugs intended to treat type 2 diabetes. FDA Web site. www.fda.gov/NewsEvents/Newsroom/PressAnnouncements/2008/ucm116994.htm. Accessed August 20, 2016.
78. Kooy A, de Jager J, Lehert P, et al. Long-term effects of metformin on metabolism and microvascular and macrovascular disease in patients with type 2 diabetes mellitus. Arch Intern Med 2009;169:616–25.
79. Eurich DT, Weir DL, Majumdar SR, et al. Comparative safety and effectiveness of metformin in patients with diabetes mellitus and heart failure: systematic review of observational studies involving 34,000 patients. Circ Heart Fail 2013;6:395–402.
80. Tahrani AA, Varughese GI, Scarpello JH, Hanna FW. Metformin, heart failure, and lactic acidosis: is metformin absolutely contraindicated? BMJ 2007;335:508–12.
81. Li Y, Hu Y, Ley SH, et al. Sulfonylurea use and incident cardiovascular disease among patients with type 2 diabetes: prospective cohort study among women. Diabetes Care 2014;37:3106–13.
82. Bentley-Lewis R, Aguilar D, Riddle MC, et al. Rationale, design, and baseline characteristics in Evaluation of LIXisenatide in Acute Coronary Syndrome, a long-term cardiovascular end point trial of lixisenatide versus placebo. Am Heart J 2015;169:631,638.e7.
83. Marso SP, Daniels GH, Brown-Frandsen K, et al. Liraglutide and cardiovascular outcomes in type 2 diabetes. N Engl J Med 2016;375:311–22.
84. Exenatide Study of Cardiovascular Event Lowering Trial (EXSCEL): A Trial To Evaluate Cardiovascular Outcomes After Treatment With Exenatide Once Weekly In Patients With Type 2 Diabetes Mellitus. clinicaltrials.gov Web site. https://clinicaltrials.gov/ct2/show/NCT01144338. 2016 Accessed September 23, 2016.
85. Researching Cardiovascular Events With a Weekly Incretin in Diabetes (REWIND). clinicaltrials.gov Web site. https://clinicaltrials.gov/ct2/show/NCT01394952. Accessed September 23, 2016.
86. Schernthaner G, Schernthaner-Reiter MH, Schernthaner GH. EMPA-REG and other cardiovascular outcome trials of glucose-lowering agents: implications for future treatment strategies in type 2 diabetes mellitus. Clin Ther 2016;38:1288–98.
87. CANVAS--CANagliflozin cardiovascular Assesssment Study (CANVAS). clinicaltrials.gov Web site. https://clinicaltrials.gov/ct2/show/NCT01032629. Accessed September 23, 2016.
88. Evaluation of the Effects of Canagliflozin on Renal and Cardiovascular Outcomes in Participants With Diabetic Nephropathy (CREDENCE). clinicaltrials.gov Web site. https://clinicaltrials.gov/ct2/show/NCT02065791. Accessed September 23, 2016.
89. Multicenter Trial to Evaluate the Effect of Dapagliflozin on the Incidence of Cardiovascular Events (DECLARE-TIMI58). clinicaltrials.gov Web site. https://clinicaltrials.gov/ct2/show/NCT01730534. Accessed September 23, 2016.
90. Zannad F, Cannon CP, Cushman WC, et al. Heart failure and mortality outcomes in patients with type 2 diabetes taking alogliptin versus placebo in EXAMINE: a multicentre, randomised, double-blind trial. Lancet 2015;385(9982):2067–76.
91. Van Klompenburg E, Heins JR. New insulin options for diabetic patients. S D Med 2016;69:84–5.
92. Rosenstock J, Schwartz SL, Clark CM Jr, et al. Basal insulin therapy in type 2 diabetes: 28-week comparison of insulin glargine (HOE 901) and NPH insulin. Diabetes Care 2001;24:631–6.
93. Tylee T, Hirsch IB. Costs associated with using different insulin preparations. JAMA 2015;314:665–6.
94. Hua X, Carvalho N, Tew M, et al. Expenditures and prices of antihyperglycemic medications in the United States: 2002-2013. JAMA 2016;315:1400–2.
95. Heinemann L. Biosimilar insulin and costs: what can we expect? J Diabetes Sci Technol 2016;10:457–62.
96. Horvath K, Jeitler K, Berghold A, et al. Long-acting insulin analogues versus NPH insulin (human isophane insulin) for type 2 diabetes mellitus. Cochrane Database Syst Rev 2007;(2)(2):CD005613.
97. Mannucci E, Monami M, Marchionni N. Short-acting insulin analogues vs. regular human insulin in type 2 diabetes: a meta-analysis. Diabetes Obes Metab 2009;11:53–9.
98. Powell PW, Corathers SD, Raymond J, Streisand R. New approaches to providing individualized diabetes care in the 21st century. Curr Diabetes Rev 2015;11:222–30.
99. Riddle MC, Rosenstock J, Gerich J, Insulin Glargine 4002 Study Investigators. The treat-to-target trial: randomized addition of glargine or human NPH insulin to oral therapy of type 2 diabetic patients. Diabetes Care 2003;26:3080–6.
From the University of Arizona College of Pharmacy and the University of Arizona College of Medicine-Tucson, Tucson, AZ.
Abstract
- Objective: To summarize key issues relevant to managing hyperglycemia in patients with type 2 diabetes mellitus (T2DM) and review a strategy for initiating and intensifying therapy.
- Methods: Review of the literature.
- Results: The 6 most widely used pharmacologic treatment options for hyperglycemia in T2DM are metformin, sulfonylureas, dipeptidyl peptidase-4 inhibitors, glucagon-like peptide-1 receptor agonists, sodium-glucose cotransporter-2 inhibitors, and insulin. Recent guidelines stress the importance of an individualized, patient-centered approach to managing hyperglycemia in T2DM, although sufficient guidance for nonspecialists on how to individualize treatment is often lacking. For patients with no contraindications, metformin should be recommended concurrent with lifestyle intervention at the time of diabetes diagnosis. Due to the progressive nature of T2DM, glycemic control on metformin monotherapy is likely to deteriorate over time, and there is no consensus as to what the second-line agent should be. A second agent should be selected based on glycemic goal and potential advantages and disadvantages of each agent for any given patient. If the patient progresses to the point where dual therapy does not provide adequate control, either a third non-insulin agent or insulin can be added.
- Conclusion: Although research is increasingly focusing on what the ideal number and sequence of drugs should be when managing T2DM, investigating all possible combinations in diverse patient populations is not feasible. Physicians therefore must continue to rely on clinical judgment to determine how to apply trial data to the treatment of individual patients.
Key words: type 2 diabetes; patient-centered care; antihyper-glycemic drugs; insulin; therapeutic decision-making.
Diabetes mellitus affects approximately 29.1 million people, or 9.3% of the U.S. population [1,2]. The high prevalence of diabetes and its associated multiple complications, including cardiovascular disease (CVD), blindness, renal failure, lower extremity amputations, and premature death, lead to a tremendous overall burden of disease. The financial cost is staggering as well, with more than 1 in 5 health care dollars spent on treating diabetes or its complications [3]. The goal of diabetes treatment is to prevent acute complications and reduce the risk of long-term complications. Interventions that have been shown to improve diabetes outcomes include medications for glycemic control and treatment of cardiovascular risk factors, nutrition and physical activity counseling, smoking cessation, immunizations, psychosocial care, and ongoing surveillance and early treatment for eye, kidney, and foot problems [4].
Glycemic management in type 2 diabetes mellitus (T2DM), the focus of this review, is growing increasingly complex and has been the subject of numerous extensive reviews [5,6] and published guidelines [4,7]. In the context of an increasing array of available pharmacologic options, there are mounting uncertainties regarding the benefits of intensive glycemic control as well as increasing concerns about potential adverse treatment effects, hypoglycemia in particular. While previous guidelines encouraged specific approaches for most patients, more recent guidelines stress the importance of a patient-centered approach with shared decision-making [4]. Less prescriptive guidelines are more appropriate, given the current state of science, but they also may be viewed as providing insufficient guidance to some providers. It can be overwhelming for a non-specialist to try to match the nuances of antihyperglycemic medications to the nuances of each patient’s preferences and medical characteristics.
This article examines key issues faced by primary care providers when managing hyperglycemia in patients with T2DM and outlines a stepwise approach to determining the optimal antihyperglycemic agent(s) (Table 1).
Confirm Diagnosis of T2DM
It can be difficult to distinguish between type 1 diabetes mellitus and T2DM in some individuals due to overlapping characteristics. However, correctly classifying a patient’s diabetes at the outset is essential, as the classification helps determine the best treatment regimen and is rarely reconsidered [4,8]. Considerable evidence suggests that misclassification of diabetes occurs frequently [9,10], resulting in patients receiving inappropriate treatment. Clinical characteristics suggestive of T2DM include older age and features of insulin resistance such as obesity, hyper-tension, hypertriglyceridemia, and low high-density lipoprotein cholesterol. When these features are not present, an alternate diagnosis should be entertained.
Establish Glycemic Goal
Research over the past decade has led to a growing appreciation of the enormous complexity of hyperglycemia management. During the 1990s, landmark trials such as the Diabetes Control and Complications Trial (DCCT) [11] and UK Prospective Diabetes Study (UKPDS) [12] demonstrated that improving glucose control could reduce the incidence of microvascular complications [11,12], prompting a lower-is-better philosophy regarding glucose targets. Despite limited evidence to support such thinking, this viewpoint was adopted by the developers of many guidelines. During the following decade more research was devoted to determining whether aggressively lowering a patient’s glucose could also improve macrovascular outcomes. Table 2 summarizes microvascular and macrovascular effects of intensive glycemic control seen in major trials [11–23]. After several major trials [20,22] found only mild cardiovascular benefits and even suggested harm [18], experts and policy makers began to reconsider the value of tightly controlling glucose levels [24]. Since then, other studies have demonstrated that the potential benefits and risks of glucose control are strongly related to individual patient factors, such as age and duration of diabetes, and associated comorbidities, such as CVD and impaired renal function [6].
A one-size-fits-all glycemic goal is no longer recommended. Personalization is necessary, balancing the potential benefits and risks of treatments required to achieve that goal. Whereas an A1C of < 7% is an appropriate target for some individuals with diabetes, glycemic targets may be more or less stringent based on patient features including life expectancy, duration of diabetes, comorbidities, and patient attitude and support system (Table 3) [4].
A particular group in which less stringent goals should be considered is older patients, especially those with complex or poor health status [4,25]. The risk of intensive glycemic control may exceed the benefits in these patients, as they are at higher risk of hypoglycemia and polypharmacy [26]. A goal A1C of 7% to 7.5% is now recommended for healthy older adults, and less stringent A1C goals of 7.5% to 8% and 8% to 8.5% should be considered based on the presence and severity of multiple coexisting chronic illnesses, decreased self-care ability, or cognitive impairment [4,25]. Unfortunately, overtreatment is frequently seen in this group. In a recent study of patients over age 65 years, about 40% of those with complex or poor health status had tight glycemic control with A1C below 6.5% [26]. An analysis of U.S. Veterans Affairs administration data showed that only 27% of 12,917 patients older than 65 with very low A1C (< 6%) and about 21% of those with A1C of 6% to 6.5% underwent treatment deintensification [27].
Initiate Treatment with Metformin
There is strong consensus that metformin is the preferred drug for monotherapy due to its long proven safety record, low cost, weight-reduction benefit, and potential cardiovascular advantages [4,16]. As long as there are no contraindications, metformin should be recommended concurrent with lifestyle intervention at the time of diabetes diagnosis. The recommendation is based on the fact that adherence to diet, weight reduction, and regular exercise is not sustained in most patients, and most patients ultimately will require treatment. Since metformin is usually well-tolerated, does not cause hypoglycemia, has a favorable effect on body weight, and is relatively inexpensive, potential benefits of early initiation of medication appear to outweigh potential risks.
The U.S. Food and Drug Administration (FDA) recently relaxed prescribing polices to extend the use of this important medication to patients who have mild–moderate, but stable, chronic kidney disease (CKD) [28]. Metformin is recommended as first-line therapy and should be used unless it is contraindicated (ie, estimated glomerular filtration rate [eGFR] < 30 mL/min/1.73 m2)[4,7,29].
Add Additional Agent(s) as Needed to Achieve Goal
Other than metformin, evidence is limited for the optimal use of the burgeoning array of available agents, especially in dual or triple combinations [6,30]. Research is now starting to focus more on what the ideal number and sequence of drugs should be. The Glycemic Reduction Approach in Diabetes (GRADE) study, which will compare long-term benefits and risks of the 4 most widely used antihyperglycemic medications in combination with metformin, is now underway [31,32]. The 4 classes being studied are sulfonylurea, dipeptidyl peptidase-4 (DPP-4) inhibitors, glucagon-like peptide-1 (GLP-1) receptor agonists, and a basal,
Eleven classes of non-insulin medications are currently approved for treating hyperglycemia in T2DM [4]. Within each class, numerous agents are available. Six of these classes (ie, α-glucosidase inhibitors, colesevelam, bromocriptine, pramlintide, meglitinides, and thiazolidinediones) are not used frequently
Consider Effects on A1C
There is a paucity of high-quality, head-to-head comparison trials evaluating the ability of available agents to achieve recommended glycemic targets. This is important because the glucose-lowering effectiveness of individual medications is strongly influenced by baseline characteristics such as A1C, duration of diabetes, and previous therapy. With these limitations in mind, the relative glucose-lowering effectiveness of commonly used agents is shown in Table 4. When used as monotherapy, A1C reductions of approximately 1% to 1.5% are achieved with metformin, sulfonylureas, and GLP-1 receptor agonists [6,30,34,35,39]. DPP-4 inhibitors and SGLT-2 inhibitors have more modest glucose-lowering efficacy, with A1C reductions of approximately 0.5% to 1% [6,30,34,35,39]. Larger effects may be seen in individuals with higher baseline A1C and those who are drug naïve. Insulin is the most effective glucose-lowering agent—it can reduce virtually any level of A1C down to the normal range, with hypoglycemia being the only limiting factor. When a patient has uncontrolled hyperglycemia on metformin monotherapy, or if there is a contraindication or intolerance to metformin, clinicians should consider the potential glucose-lowering effects of other available options and should choose an agent that conceivably could bring a patient close to meeting their treatment goal.
Eliminate Options with Unacceptable Adverse Effects
When the pharmacologic options with acceptable A1C-lowering potential have been identified, the ones with contraindications and potential serious adverse effects for the individual patient can immediately be eliminated (Table 4). For example, if a patient has an eGFR < 30 mL/min/1.73 m2, metformin, sulfonylureas, GLP-1 receptor agonists, most DPP-4 inhibitors, and SGLT-2 inhibitors are either contraindicated or should be used with caution. In patients with severe osteoporosis, SGLT-2 inhibitors may not be the best option. In patients with a history of diabetic ketoacidosis (DKA), caution should be used with metformin and SGLT-2 inhibitors. There have been concerns of possible acute pancreatitis and neoplasia with the incretin-based agents, the DPP-4 inhibitors and GLP-1 receptor agonists [40,41], although other clinical trials and observational data have not found increased risk [42–45]. Nevertheless, these agents potentially should be avoided in patients with a history of pancreatitis or neoplasm. SGLT-2 inhibitors may be associated with genitourinary infections and volume depletion [46–48] and probably should be avoided in patients at high risk for these conditions.
If the adverse effects are not serious, changing the way the medication is administered may allow the patient to tolerate agents with high potential benefits. For example, metformin is commonly associated with gastrointestinal (GI) adverse effects, which can be reduced or avoided with slow titration of the dose [6] or by switching to an extended-release formulation [49]. GLP-1 receptor agonists are associated with GI adverse effects [6] and in most cases slow titration is recommended.
Evaluate Potential Risks/Benefits of Remaining Options
Hypoglycemia. The barrier of hypoglycemia generally precludes maintenance of euglycemia and full realization of the long-term benefits of good glucose control over a lifetime. Once considered a trivial issue, concerns about hypoglycemia in T2DM are increasingly being raised [19,50–55]. Clearly, hypoglycemia occurs more often as glycemic targets are lowered to near-normal values, especially in those with advanced age and multiple comorbidities [55]. Various comorbidities frequently encountered particularly as patients age also are associated with increasing propensity for experiencing hypoglycemia and untoward outcomes from it. These include coronary artery disease, heart failure, renal and liver disease, and dementia. Hypoglycemia, when it occurs, may lead to dysrhythmias, dizziness, accidents and falls, work disability, and decreased quality of life. In addition to relaxing blood glucose targets in high-risk patients, drug selection should favor agents that do not precipitate such events (Table 4).
Fortunately, the commonly used non-insulin agents are not associated with hypoglycemia unless they are used in combination with sulfonylureas or insulin. Sulfonylureas should be used with caution and other options considered in patients with high risk for hypoglycemia. When insulin is required, regimens which minimize risk of hypoglycemia should be used. For example, adding a GLP-1 receptor agonist to basal insulin as an alternative to mealtime insulin has been shown to be equally effective with a lower risk of hypoglycemia [4,6]. Also, premixed insulin preparations should be avoided or used cautiously in individuals who miss meals frequently. Additionally, newer basal insulins that exhibit longer duration of action are now available in the United States. Preliminary studies have shown that the newly FDA-approved longer-acting basal insulins, insulin degludec and glargine U-300, may be associated with a reduced risk for hypoglycemia [56,57]. However, it remains unclear how and when these newer agents will best be incorporated into a treatment regimen.
Body weight. Nearly 90% of people living with T2DM are overweight or obese. Given the close tie between obesity and T2DM, treating obesity is an obvious consideration in diabetes treatment. Major trials have shown the effectiveness of lifestyle modifications and weight reduction in delaying, prevention, and management of T2DM [4,58,59].With this in mind, clinicians should consider preferentially using antihyperglycemic agents with weight-lowering or weight-neutral effects. Among commonly used antihyperglycemic agents, metformin, GLP-1 receptor agonists, and SGLT-2 inhibitors have been shown to have weight-reduction benefits, and DPP-4 inhibitors are weight neutral. On the other hand, sulfonylureas and insulin are associated with weight gain. A systematic review and meta-analysis including 204 studies with study durations ranging from 3 months to 8 years showed comparative effects of diabetes medications with a differential effect on weight of up to 5 kg (Table 4) [60].
Metformin is associated with an average weight loss of 1.9 to 3.1 kg that was sustained with long-term use for at least 10 years in the Diabetes Prevention Program Outcomes Study [61].A systematic review of 7 randomized trials showed that in patients with T2DM, the SGLT-2 inhibitors dapagliflozin and canagliflozin were associated with weight loss (mean weighted difference of –1.81 kg and –2.3 kg, respectively) [62]. A systematic review and meta-analysis of 25 randomized controlled trials showed greater weight loss (mean weighted difference of –2.9 kg) in overweight or obese patients with or without T2DM using GLP-1 receptor agonists when compared to placebo, insulin, or oral antihyperglycemic agents [63]. Of note, the GLP-1 receptor agonist liraglutide is now approved for weight loss in patients with or without diabetes [64]. The maximum doses approved for diabetes and obesity treatment are 1.8 and 3.0 mg/day, respectively.
Since weight loss is associated with improved glycemic control, an area of emerging interest is the use of antiobesity medications for managing diabetes. Although most older weight-loss medications were only approved for short-term use, some newer agents are approved for longer-term use. Lorcaserin and the combination drugs topiramate/phentermine and naltrexone/bupropion are approved for chronic therapy, provided certain conditions are met. Patients on weight reduction agents should be monitored regularly.
An even more radical departure from conventional therapy for diabetes is the consideration of metabolic, or weight-loss, surgery, which has been found to be associated with rapid and dramatic improvements in blood glucose control. Metabolic surgery has been shown to improve glucose control more effectively than any known pharmaceutical or behavioral approach. For example, in an observational study of obese patients with T2DM, bariatric surgery led to diabetes remission rates of 72.3% 2 years after surgery and 30.4% 15 years after surgery compared to 16.4% and 6.5%, respectively, in control patients [69]. With long-term follow-up, significant decreases in microvascular and macrovascular complications were seen in the surgical group [69]. Compared with medical therapy alone, bariatric surgery plus medical therapy has been associated with more weight loss, better glycemic control, less need for diabetes medications, and improved quality of life [70]. A 2016 joint statement by numerous international diabetes organizations recommends considering metabolic surgery as a treatment for T2DM and obesity [71]. American Diabetes Association guidelines recommend consideration of bariatric surgery in individuals with T2DM who have a body mass index greater than 35 kg/m2,especially if achieving disease control is difficult by means of lifestyle modifications and medications [4].
Cardiovascular outcomes. Cardiovascular risk is about 2 to 4 times higher in patients with diabetes, and about half of patients with this condition develop heart failure [4,72]. CVD is responsible for most of the mortality in T2DM [72]. Therefore, prevention of cardiovascular morbidity and mortality is an important goal for diabetes treatment. Due to concerns about potential cardiovascular risks associated with glucose-lowering medications [73–76], the FDA has issued regulatory requirements for manufacturers to monitor the cardiovascular risk profile for these drugs [77]. Recent trials have led to a better understanding of potential cardiovascular benefits or harms of antihyperglycemic medications.
Metformin, the widely recommended first-line therapy for T2DM, carries a large body of evidence supporting its cardiovascular benefits. For example, the UKPDS found that compared to conventional therapy (mostly diet), metformin reduced cardiovascular events and mortality in obese patients with T2DM [15]. This result was supported in Hyperinsulinemia: the Outcome of its Metabolic Effect (HOME) study where, as an add-on to insulin, metformin decreased macrovascular complications when compared to placebo [78]. Research over the past decade also has assuaged concerns about metformin safety in heart failure [60]. A systematic review of observational studies involving 34,000 patients conducted in 2013 showed that metformin is as safe as other glucose-lowering medications in patients with diabetes and heart failure even in the presence of CKD [4,79]. Furthermore, numerous investigations have found metformin is not associated with increased hospitalizations or risk of lactic acidosis [80]. Metformin can be used safely in patients with diabetes and heart failure [60].
Although sulfonylureas have long been a mainstay of diabetes therapy, concerns about their potential adverse cardiovascular effects have been raised by numerous studies [81]. Tolbutamide, a first-generation sulfonylurea, was removed from the market after the University Group Diabetes Program study found increased CVD deaths with this agent versus placebo. Subsequently, the FDA issued a warning for all sulfonylureas [74]. The increased cardiovascular risk associated with sulfonylureas is thought to be due to their effect on cardiac mitochondrial potassium ATP channels. Sulfonylureas bind to these channels, preventing a protective phenomenon called ischemic preconditioning and resulting in a weakened defense against myocardial injury [76]. A recent study showed an increased risk of coronary heart disease associated with long-term use of sulfonylureas in women with diabetes [81].
GLP-1 receptor agonists have recently received much attention for their potential beneficial effects on cardiovascular outcomes. In a recent trial, lixisenatide was shown to be safe in patients with T2DM and acute coronary syndrome when compared to placebo [82]. More recently, the Liraglutide Effect and Action in Diabetes: Evaluation of cardiovascular outcome Results (LEADER) trial demonstrated significant cardiovascular benefits with liraglutide in patients with T2DM and established or high CVD risk [83]. The composite outcome of the first occurrence of death from cardiovascular causes, nonfatal myocardial infarction (MI), or nonfatal stroke, occurred less frequently in the liraglutide group compared to placebo (13% versus 14.9%, respectively), and there were fewer deaths from cardiovascular causes in the liraglutide group compared to placebo (4.7% and 6.0%, respectively) [83]. Other trials investigating the cardiovascular outcomes of this class [84,85] are in progress.
Another class with potential cardiovascular benefits is the SGLT-2 inhibitors. In a recent cardiovascular outcome study, empagliflozin significantly lowered the composite of cardiovascular death, nonfatal MI, or nonfatal stroke in T2DM patients with high cardiovascular risk compared to placebo (10.5% and 12.1%, respectively) [86]. There are several large ongoing studies evaluating the cardiovascular effects of other SGLT-2 inhibitors [87–89].
DPP-4 inhibitors were examined in recent studies and have shown no cardiovascular benefits [42,44,90].The studies showed mixed results regarding an association between DPP-4 inhibitors and heart failure. In one study, saxagliptin was associated with increased hospitalization for heart failure compared to placebo [44], while 2 noninferiority trials did not show a significant increase in heart failure hospitalizations associated with alogliptin and sitagliptin when compared to placebo [42,90].
Administration Considerations
Many patients with T2DM require multiple agents for glycemic control. Additional medications used for comorbid conditions add to this burden. When choosing antihyperglycemic agents, the route and frequency of administration, as well as the patients’ preferences and ability, should be considered. Either once or twice daily dosing is available for most agents, and once weekly dosing is available for some of the GLP-1 receptor agonists. Once daily or once weekly formulations may improve adherence and be more desirable than preparations that are dosed twice daily. Most of the commonly used medications are dosed orally. Although many patients find this route of administration preferable to insulin or GLP-1 receptor agonists, which require injections, some patients may prefer the risk/benefit of injectable agents. All GLP-1 receptor agonists come in a pen delivery system, which eliminates mixing and provides more convenient administration. Extended-release exenatide also is available as a single-dose tray that requires mixing and may be more cumbersome to inject.
Insulin requires special consideration. There has been an enormous increase in the number of insulin products on the market in the past 2 decades. These products include insulin analogs, concentrated insulins (U-200, U-300, and U-500), premixed insulin preparations, and ultra-long-acting insulin [91]. The availability of insulin options with different concentrations, onsets, and durations of actions has made decision making on which insulin to use difficult. Clinicians need to consider patient preference, dosing frequency, and timing with regard to meals, insulin dose, administration, as well as cost. For example, concentrated insulin is preferred for a patient on high doses of insulin requiring injecting a large volume of insulin. Rapid-acting insulin analogs would be more appropriate for patients who have difficulty administering their regular insulin 20 to 30 minutes before eating. Premixed insulin preparations make it impossible to independently adjust short- and long-acting components. However, these may be good choices in patients who have consistent meal schedules and who want to simplify administration. Despite a prevailing misconception that NPH must be given twice a day, it has long been recognized that in T2DM, a single daily injection of NPH yields improvements in control similar to those achieved with 2 daily injections [92].
Cost Considerations
Treating T2DM imposes a great financial burden on individuals living with diabetes and their families due to the high cost of the medications. Table 4 and Table 5 provide information on the cost of non-insulin and insulin diabetes medications for patients who do not have prescription insurance coverage. From a practical standpoint, choice of diabetes agents is largely influenced by insurance formularies.
The older agents, metformin and the sulfonylureas, are available for a cash (no insurance) price of as little as $4 per month. This is in stark contrast to the SGLT-2 inhibitors, GLP-1 receptor agonists, and DPP-4 inhibitors, which range in cost between $400 and $600 per month. Of recent concern, the cost of insulin has been skyrocketing, with a more than 500% increase in the cost of certain insulins from 2001 to 2015 [93]. According to the Medical Expenditure Panel Survey (MEPS) from 2002 to 2013, the mean price of insulin increased by about 200% (from $4.34/mL to $12.92/mL) during this period, which was significantly higher than increases in the price of non-insulin comparators [94]. The introduction of biosimilar insulins to the market is expected to offer treatment options with lower cost. This will be tested when the biosimilar glargine, the first FDA-approved biosimilar insulin, becomes available in the U.S. market. However, a significant reduction in insulin prices is not expected soon [95].
When insulin is required, most patients with T2DM can be treated with older human insulins, which have similar efficacy and lower costs than the more expensive newer insulin analogs. A Cochrane review comparing basal insulin analogs to NPH showed similar efficacy in glycemic control with minimal clinical benefit in the form of less nocturnal hypoglycemia in the insulin analog arm [96]. Furthermore, similar glycemic control and risk of hypoglycemia was seen when regular insulin was compared with the rapid-acting insulin analogs [97]. The cost of human NPH insulin for a patient on a total daily dose of 60 units is approximately $52 per month. This contrasts with the most widely used insulin, insulin glargine, which has a cash price of about $500 per month for the same amount (Table 5). Insulin pens, which are convenient, are more expensive. Interestingly, human insulins do not require prescriptions, allowing underinsured, underfunded patients ongoing access to them.
Incorporating Patient Preferences
Research evidence is necessary but insufficient for making patient care decisions. Along with the potential benefits, harms, costs, and inconveniences of the management options, patient perspectives, beliefs, expectations, and health-related goals must be considered. Patients will undoubtedly have preferences regarding defining goals and ranking options. Clinicians should discuss therapeutic goals and treatment options and work collaboratively with patients in determining management strategies [98].
Summary
Potential treatment approaches for treating hyperglycemia in T2DM are summarized in Figure 1 and Figure 2 [4,7]. As long as there are no contraindications, metformin should be recommended concurrent with lifestyle intervention at the time of diabetes diagnosis. Even if metformin monotherapy is initially effective, glycemic control is likely to deteriorate over time due to progressive loss of β-cell function in T2DM.
There is no consensus as to what the second-line agent should be. Selection of a second agent should be made based on potential advantages and disadvantages of each agent for any given patient. A patient-centered approach is preferred over a fixed algorithm. If the patient progresses to the point where dual therapy does not provide adequate control, either a third non-insulin agent or insulin can be added. In patients with modestly elevated A1C (below ~8%), addition of a third non-insulin agent may be equally effective as (but more expensive than) addition of insulin.
Patients with significantly elevated A1C levels on non-insulin agents usually should have insulin added to their regimen. When insulin is added, metformin should be continued. DPP-4 inhibitors and sulfonylureas are typically stopped. If SGLT-2 inhibitors and/or GLP-1 receptor agonists are continued, this may aid with weight maintenance. However, continuing these agents is likely to be expensive and associated with problems associated with polypharmacy.
The most widely recommended strategy for initiating insulin in T2DM is to add a single bedtime injection of basal insulin (ie, NPH, glargine, detemir, or degludec) to the patient’s regimen. This regimen has been found to be effective in numerous studies and controls hyperglycemia in up to 60% of patients [99]. If the patient is treated with a single bedtime injection of insulin and the fasting glucose level is within the target range but the A1C level remains above goal, addition of mealtime insulin injections is likely to be beneficial. Alternatively, addition of a GLP-1 receptor agonist to basal insulin has been shown to be equally beneficial [4,6]. When adding mealtime insulin, a common strategy is to add a single injection of a rapid-acting insulin (eg, lispro, aspart, glulisine) before the patient’s largest meal of the day. Additional premeal injections of rapid-acting insulin may be added as needed, based on self-monitoring blood glucose results. If glycemia remains significantly uncontrolled on more than 200 units of insulin per day, switching to a concentrated form of insulin (eg, U-200, U-300, or U-500) should be considered.
Corresponding author: Maryam Fazel, PharmD, BCPS, BCACP, CDE, 1295 N. Martin Ave. (Room B211B), Tucson, Arizona 85721-0202, [email protected].
Financial disclosures: None.
1. National diabetes statistics report: estimates of diabetes and its burden in the United States, 2014. Centers for Disease Control and Prevention Web site. www.cdc.gov/diabetes/pubs/statsreport14/national-diabetes-report-web.pdf. Accessed November 29, 2016.
2. Statistics about diabetes. American Diabetes Association Web site. www.diabetes.org/diabetes-basics/statistics/. Accessed November 29, 2016.
3. American Diabetes Association. Economic costs of diabetes in the U.S. in 2012. Diabetes Care 2013;36:1033–46.
4. American Diabetes Association. Standards of medical care in diabetes--2016. Diabetes Care 2016;39(Suppl. 1).
5. Raz I, Riddle MC, Rosenstock J, et al. Personalized management of hyperglycemia in type 2 diabetes: reflections from a Diabetes Care Editors’ Expert Forum. Diabetes Care 2013;36:1779–88.
6. Inzucchi SE, Bergenstal RM, Buse JB, et al. Management of hyperglycemia in type 2 diabetes, 2015: a patient-centered approach: update to a position statement of the American Diabetes Association and the European Association for the Study of Diabetes. Diabetes Care 2015;38:140–9.
7. Garber AJ, Abrahamson MJ, Barzilay JI, et al. Consensus Statement by the American Association of Clinical Endocrinologists and American College of Endocrinology on the Comprehensive Type 2 Diabetes Management Algorithm--2016 Executive Summary. Endocr Pract 2016;22:84–113.
8. Steenkamp DW, Alexanian SM, Sternthal E. Approach to the patient with atypical diabetes. CMAJ 2014;186:678–84.
9. de Lusignan S, Sadek N, Mulnier H, et al. Miscoding, misclassification and misdiagnosis of diabetes in primary care. Diabet Med 2012;29:181–9.
10. Tripathi A, Rizvi AA, Knight LM, Jerrell JM. Prevalence and impact of initial misclassification of pediatric type 1 diabetes mellitus. South Med J 2012;105:513–7.
11. The effect of intensive treatment of diabetes on the development and progression of long-term complications in insulin-dependent diabetes mellitus. The Diabetes Control and Complications Trial Research Group. N Engl J Med 1993;329:977–86.
12. Intensive blood-glucose control with sulphonylureas or insulin compared with conventional treatment and risk of complications in patients with type 2 diabetes (UKPDS 33). UK Prospective Diabetes Study (UKPDS) Group. Lancet 1998;352:837–53.
13. Nathan DM, Cleary PA, Backlund JY, et al. Intensive diabetes treatment and cardiovascular disease in patients with type 1 diabetes. N Engl J Med 2005;353:2643–53.
14. Nathan DM, DCCT/EDIC Research Group. The diabetes control and complications trial/epidemiology of diabetes interventions and complications study at 30 years: overview. Diabetes Care 2014;37:9–16.
15. Effect of intensive blood-glucose control with metformin on complications in overweight patients with type 2 diabetes (UKPDS 34). UK Prospective Diabetes Study (UKPDS) Group. Lancet 1998;352:854–65.
16. Holman RR, Paul SK, Bethel MA, et al. 10-Year follow-up of intensive glucose control in type 2 diabetes. N Engl J Med 2008;359:1577–89.
17. Ohkubo Y, Kishikawa H, Araki E, et al. Intensive insulin therapy prevents the progression of diabetic microvascular complications in Japanese patients with non-insulin-dependent diabetes mellitus: a randomized prospective 6-year study. Diabetes Res Clin Pract 1995;28:103–17.
18. Action to Control Cardiovascular Risk in Diabetes Study Group, Gerstein HC, Miller ME, Byington RP, et al. Effects of intensive glucose lowering in type 2 diabetes. N Engl J Med 2008;358:2545–59.
19. ACCORD Study Group, Gerstein HC, Miller ME, Genuth S, et al. Long-term effects of intensive glucose lowering on cardiovascular outcomes. N Engl J Med 2011;364:818–28.
20. ADVANCE Collaborative Group, Patel A, MacMahon S, Chalmers J, et al. Intensive blood glucose control and vascular outcomes in patients with type 2 diabetes. N Engl J Med 2008;358:2560–72.
21. Wong MG, Perkovic V, Chalmers J, et al. Long-term Benefits of Intensive Glucose Control for Preventing End-Stage Kidney Disease: ADVANCE-ON. Diabetes Care 2016;39:694–700.
22. Duckworth W, Abraira C, Moritz T, et al. Glucose control and vascular complications in veterans with type 2 diabetes. N Engl J Med 2009;360:129–39.
23. Hayward RA, Reaven PD, Wiitala WL, et al. Follow-up of glycemic control and cardiovascular outcomes in type 2 diabetes. N Engl J Med 2015;372:2197–206.
24. American Diabetes Association. Standards of medical care in diabetes--2009. Diabetes Care 2009;32 Suppl 1:S13–61.
25. American Geriatrics Society Expert Panel on Care of Older Adults with Diabetes Mellitus, Moreno G, Mangione CM, Kimbro L, Vaisberg E. Guidelines abstracted from the American Geriatrics Society Guidelines for Improving the Care of Older Adults with Diabetes Mellitus: 2013 update. J Am Geriatr Soc 2013;61:2020–6.
26. Lipska KJ, Ross JS, Miao Y, et al. Potential overtreatment of diabetes mellitus in older adults with tight glycemic control. JAMA Intern Med 2015;175:356–62.
27. Sussman JB, Kerr EA, Saini SD, et al. Rates of deintensification of blood pressure and glycemic medication treatment based on levels of control and life expectancy in older patients with diabetes mellitus. JAMA Intern Med 2015;175:1942–9.
28. FDA Drug Safety Communication: FDA revises warnings regarding use of the diabetes medicine metformin in certain patients with reduced kidney function. FDA Web site. www.fda.gov/Drugs/DrugSafety/ucm493244.htm. Accessed December 1, 2016.
29. Inzucchi SE, Lipska KJ, Mayo H, et al. Metformin in patients with type 2 diabetes and kidney disease: a systematic review. JAMA 2014;312:2668–75.
30. Nathan DM. Diabetes: advances in diagnosis and treatment. JAMA 2015;314:1052–62.
31. Nathan DM, Buse JB, Kahn SE, et al. Rationale and design of the glycemia reduction approaches in diabetes: a comparative effectiveness study (GRADE). Diabetes Care 2013;36:2254–61.
32. NIH begins recruitment for long-term study of diabetes drug efficacy. NIH Web site. www.nih.gov/news-events/news-releases/nih-begins-recruitment-long-term-study-diabetes-drug-efficacy. Accessed December 1, 2016.
33. Hermayer KL, Dake A. Newer oral and noninsulin therapies to treat type 2 diabetes mellitus. Cleve Clin J Med 2016;83(5 Suppl 1):S18–26.
34. Bolen S, Wilson L, Vassy J, et al. Systematic review: comparative effectiveness and safety of oral medications for type 2 diabetes mellitus. Ann Intern Med 2007;147:386–99.
35. Bolen S, Tseng E, Hutfless S, et al. Oral diabetes medications for adults with type 2 diabetes: an update. Agency for Healthcare Research and Quality (US); 2011 Mar Report No: 11-EHC038-EF. AHRQ Comparative Effectiveness Reviews.
36. Metformin, glyburide, glipizide, glimeperide, sitagliptin, saxagliptin, linagliptin, lixisenatide, alogliptin, exenatide, liraglutide, albiglutide, dulaglutide, canagliflozin, danagliflozin, empagliflozin: drug information. Waltham (MA): UpToDate, Inc.; 2016. Accessed September 23, 2016.
37. GoodRx Web site. http://www.goodrx.com. Accessed August 6, 2016 and December 2016.
38. Insulins available in the United States. Diabetesforcast Web site. Accessed August 6, 2016. www.diabetesforecast.org/2016/mar-apr/images/2016-insulin-chart-new.pdf.
39. Inzucchi SE, Bergenstal RM, Buse JB, et al. Management of hyperglycaemia in type 2 diabetes: a patient-centered approach. Position statement of the American Diabetes Association (ADA) and the European Association for the Study of Diabetes (EASD). Diabetologia 2012;55:577–96.
40. Elashoff M, Matveyenko AV, Gier B, et al. Pancreatitis, pancreatic, and thyroid cancer with glucagon-like peptide-1-based therapies. Gastroenterology 2011;141:150–6.
41. Butler AE, Campbell-Thompson M, Gurlo T, et al. Marked expansion of exocrine and endocrine pancreas with incretin therapy in humans with increased exocrine pancreas dysplasia and the potential for glucagon-producing neuroendocrine tumors. Diabetes 2013;62:2595–604.
42. Green JB, Bethel MA, Armstrong PW, et al. Effect of sitagliptin on cardiovascular outcomes in type 2 diabetes. N Engl J Med 2015;373:232–42.
43. White WB, Cannon CP, Heller SR, et al. Alogliptin after acute coronary syndrome in patients with type 2 diabetes. N Engl J Med 2013;369:1327–35.
44. Scirica BM, Bhatt DL, Braunwald E, et al. Saxagliptin and cardiovascular outcomes in patients with type 2 diabetes mellitus. N Engl J Med 2013;369:1317–26.
45. Egan AG, Blind E, Dunder K, et al. Pancreatic safety of incretin-based drugs--FDA and EMA assessment. N Engl J Med 2014;370:794–7.
46. Vasilakou D, Karagiannis T, Athanasiadou E, et al. Sodium-glucose cotransporter 2 inhibitors for type 2 diabetes: a systematic review and meta-analysis. Ann Intern Med 2013;159:262–74.
47. Nyirjesy P, Sobel JD, Fung A, et al. Genital mycotic infections with canagliflozin, a sodium glucose co-transporter 2 inhibitor, in patients with type 2 diabetes mellitus: a pooled analysis of clinical studies. Curr Med Res Opin 2014;30:1109–19.
48. Schernthaner G, Gross JL, Rosenstock J, et al. Canagliflozin compared with sitagliptin for patients with type 2 diabetes who do not have adequate glycemic control with metformin plus sulfonylurea: a 52-week randomized trial. Diabetes Care 2013;36:2508–15.
49. Blonde L, Dailey G, Jabbour S, et al. Gastrointestinal tolerability of extended-release metformin tablets compared to immediate-release metformin tablets: results of a retrospective cohort study. Curr Med Res Opin 2004;20:562–72.
50. Kalra S, Mukherjee JJ, Venkataraman S, et al. Hypoglycemia: the neglected complication. Indian J Endocrinol Metab 2013;17:819–34.
51. Paty BW. The role of hypoglycemia in cardiovascular outcomes in diabetes. Can J Diabetes 2015;39 Suppl 5:S155–9.
52. Zoungas S, Patel A, Chalmers J, et al. Severe hypoglycemia and risks of vascular events and death. N Engl J Med 2010;363:1410–8.
53. Whitmer RA, Karter AJ, Yaffe K, et al. Hypoglycemic episodes and risk of dementia in older patients with type 2 diabetes mellitus. JAMA 2009;301:1565–72.
54. McCoy RG, Van Houten HK, Ziegenfuss JY, et al. Increased mortality of patients with diabetes reporting severe hypoglycemia. Diabetes Care 2012;35:1897–901.
55. McCoy RG, Lipska KJ, Yao X, et al. Intensive treatment and severe hypoglycemia among adults with type 2 diabetes. JAMA Intern Med 2016;176:969–78.
56. Rodbard HW, Gough S, Lane W, et al. Reduced risk of hypoglycemia with insulin degludec versus insulin glargine in patients with type 2 diabetes requiring high doses of basal insulin: a meta-analysis of 5 randomized begin trials. Endocr Pract 2014;20:285–92.
57. Yki-Jarvinen H, Bergenstal R, Ziemen M, et al. New insulin glargine 300 units/mL versus glargine 100 units/mL in people with type 2 diabetes using oral agents and basal insulin: glucose control and hypoglycemia in a 6-month randomized controlled trial (EDITION 2). Diabetes Care 2014;37:3235–43.
58. Tuomilehto J, Lindstrom J, Eriksson JG, et al. Prevention of type 2 diabetes mellitus by changes in lifestyle among subjects with impaired glucose tolerance. N Engl J Med 2001;344:1343–50.
59. Knowler WC, Barrett-Connor E, Fowler SE, et al. Reduction in the incidence of type 2 diabetes with lifestyle intervention or metformin. N Engl J Med 2002;346:393–403.
60. Maruthur NM, Tseng E, Hutfless S, et al. Diabetes medications as monotherapy or metformin-based combination therapy for type 2 diabetes: a systematic review and meta-analysis. Ann Intern Med 2016;164:740–51.
61. Diabetes Prevention Program Research Group. Long-term safety, tolerability, and weight loss associated with metformin in the Diabetes Prevention Program Outcomes Study. Diabetes Care 2012;35:731–7.
62. Clar C, Gill JA, Court R, Waugh N. Systematic review of SGLT2 receptor inhibitors in dual or triple therapy in type 2 diabetes. BMJ Open 2012;2:10.1136/bmjopen,2012-001007.
63. Vilsboll T, Christensen M, Junker AE, et al. Effects of glucagon-like peptide-1 receptor agonists on weight loss: systematic review and meta-analyses of randomised controlled trials. BMJ 2012;344:d7771.
64. FDA approves weight-management drug Saxenda. FDA Web site www.fda.gov/NewsEvents/Newsroom/PressAnnouncements/ucm427913.htm. Accessed September 22, 2016.
65. Apovian CM, Aronne LJ, Bessesen DH, et al. Pharmacological management of obesity: an endocrine Society clinical practice guideline. J Clin Endocrinol Metab 2015;100:342–62.
66. Liraglutide, lorcaserin, naltrexone/bupropion, orlistat, phentermine/topiramate: drug information. Greenwood Village (CO): Truven Health Analytics; 2016. www.micromedexsolutions.com. Accessed May 13, 2016.
67. Liraglutide, lorcaserin, naltrexone/bupropion, orlistat, phentermine/topiramate: drug information. Waltham (MA): UpToDate, Inc.; 2016. Accessed May 13, 2016.
68. Yanovski SZ, Yanovski JA. Long-term drug treatment for obesity: a systematic and clinical review. JAMA 2014;311:74–86.
69. Sjostrom L, Peltonen M, Jacobson P, et al. Association of bariatric surgery with long-term remission of type 2 diabetes and with microvascular and macrovascular complications. JAMA 2014;311:2297–304.
70. Schauer PR, Bhatt DL, Kirwan JP, et al. Bariatric surgery versus intensive medical therapy for diabetes--3-year outcomes. N Engl J Med 2014;370:2002–13.
71. Rubino F, Nathan DM, Eckel RH, et al. Metabolic surgery in the treatment algorithm for type 2 diabetes: a joint statement by international diabetes organizations. Diabetes Care 2016;39:861–77.
72. Lathief S, Inzucchi SE. Approach to diabetes management in patients with CVD. Trends Cardiovasc Med 2016;26:165–79.
73. Nissen SE, Wolski K. Effect of rosiglitazone on the risk of myocardial infarction and death from cardiovascular causes. N Engl J Med 2007;356:2457–71.
74. Knatterud GL, Klimt CR, Levin ME, et al. Effects of hypoglycemic agents on vascular complications in patients with adult-onset diabetes. VII. Mortality and selected nonfatal events with insulin treatment. JAMA 1978;240:37–42.
75. Masoudi FA, Inzucchi SE, Wang Y, et al. Thiazolidinediones, metformin, and outcomes in older patients with diabetes and heart failure: an observational study. Circulation 2005;111:583–90.
76. Klepzig H, Kober G, Matter C, et al. Sulfonylureas and ischaemic preconditioning; a double-blind, placebo-controlled evaluation of glimepiride and glibenclamide. Eur Heart J 1999;20:439–46.
77. FDA announces new recommendations on evaluating cardiovascular risk in drugs intended to treat type 2 diabetes. FDA Web site. www.fda.gov/NewsEvents/Newsroom/PressAnnouncements/2008/ucm116994.htm. Accessed August 20, 2016.
78. Kooy A, de Jager J, Lehert P, et al. Long-term effects of metformin on metabolism and microvascular and macrovascular disease in patients with type 2 diabetes mellitus. Arch Intern Med 2009;169:616–25.
79. Eurich DT, Weir DL, Majumdar SR, et al. Comparative safety and effectiveness of metformin in patients with diabetes mellitus and heart failure: systematic review of observational studies involving 34,000 patients. Circ Heart Fail 2013;6:395–402.
80. Tahrani AA, Varughese GI, Scarpello JH, Hanna FW. Metformin, heart failure, and lactic acidosis: is metformin absolutely contraindicated? BMJ 2007;335:508–12.
81. Li Y, Hu Y, Ley SH, et al. Sulfonylurea use and incident cardiovascular disease among patients with type 2 diabetes: prospective cohort study among women. Diabetes Care 2014;37:3106–13.
82. Bentley-Lewis R, Aguilar D, Riddle MC, et al. Rationale, design, and baseline characteristics in Evaluation of LIXisenatide in Acute Coronary Syndrome, a long-term cardiovascular end point trial of lixisenatide versus placebo. Am Heart J 2015;169:631,638.e7.
83. Marso SP, Daniels GH, Brown-Frandsen K, et al. Liraglutide and cardiovascular outcomes in type 2 diabetes. N Engl J Med 2016;375:311–22.
84. Exenatide Study of Cardiovascular Event Lowering Trial (EXSCEL): A Trial To Evaluate Cardiovascular Outcomes After Treatment With Exenatide Once Weekly In Patients With Type 2 Diabetes Mellitus. clinicaltrials.gov Web site. https://clinicaltrials.gov/ct2/show/NCT01144338. 2016 Accessed September 23, 2016.
85. Researching Cardiovascular Events With a Weekly Incretin in Diabetes (REWIND). clinicaltrials.gov Web site. https://clinicaltrials.gov/ct2/show/NCT01394952. Accessed September 23, 2016.
86. Schernthaner G, Schernthaner-Reiter MH, Schernthaner GH. EMPA-REG and other cardiovascular outcome trials of glucose-lowering agents: implications for future treatment strategies in type 2 diabetes mellitus. Clin Ther 2016;38:1288–98.
87. CANVAS--CANagliflozin cardiovascular Assesssment Study (CANVAS). clinicaltrials.gov Web site. https://clinicaltrials.gov/ct2/show/NCT01032629. Accessed September 23, 2016.
88. Evaluation of the Effects of Canagliflozin on Renal and Cardiovascular Outcomes in Participants With Diabetic Nephropathy (CREDENCE). clinicaltrials.gov Web site. https://clinicaltrials.gov/ct2/show/NCT02065791. Accessed September 23, 2016.
89. Multicenter Trial to Evaluate the Effect of Dapagliflozin on the Incidence of Cardiovascular Events (DECLARE-TIMI58). clinicaltrials.gov Web site. https://clinicaltrials.gov/ct2/show/NCT01730534. Accessed September 23, 2016.
90. Zannad F, Cannon CP, Cushman WC, et al. Heart failure and mortality outcomes in patients with type 2 diabetes taking alogliptin versus placebo in EXAMINE: a multicentre, randomised, double-blind trial. Lancet 2015;385(9982):2067–76.
91. Van Klompenburg E, Heins JR. New insulin options for diabetic patients. S D Med 2016;69:84–5.
92. Rosenstock J, Schwartz SL, Clark CM Jr, et al. Basal insulin therapy in type 2 diabetes: 28-week comparison of insulin glargine (HOE 901) and NPH insulin. Diabetes Care 2001;24:631–6.
93. Tylee T, Hirsch IB. Costs associated with using different insulin preparations. JAMA 2015;314:665–6.
94. Hua X, Carvalho N, Tew M, et al. Expenditures and prices of antihyperglycemic medications in the United States: 2002-2013. JAMA 2016;315:1400–2.
95. Heinemann L. Biosimilar insulin and costs: what can we expect? J Diabetes Sci Technol 2016;10:457–62.
96. Horvath K, Jeitler K, Berghold A, et al. Long-acting insulin analogues versus NPH insulin (human isophane insulin) for type 2 diabetes mellitus. Cochrane Database Syst Rev 2007;(2)(2):CD005613.
97. Mannucci E, Monami M, Marchionni N. Short-acting insulin analogues vs. regular human insulin in type 2 diabetes: a meta-analysis. Diabetes Obes Metab 2009;11:53–9.
98. Powell PW, Corathers SD, Raymond J, Streisand R. New approaches to providing individualized diabetes care in the 21st century. Curr Diabetes Rev 2015;11:222–30.
99. Riddle MC, Rosenstock J, Gerich J, Insulin Glargine 4002 Study Investigators. The treat-to-target trial: randomized addition of glargine or human NPH insulin to oral therapy of type 2 diabetic patients. Diabetes Care 2003;26:3080–6.
Patient Expectations and Total Knee Arthroplasty
From the Department of Physical Therapy, University of Alberta, Edmonton AB (Dr. Jones) and UT MD Anderson Cancer Center, Houston, TX (Dr. Suarez-Almazor).
Abstract
- Objective: To discuss patient expectations of total knee arthroplasty (TKA), instruments used to measure expectations, and the association between expectations, health outcomes, and satisfaction.
- Methods: Review of the literature.
- Results: TKA is an elective surgery for patients with persistent pain and disability caused by knee arthritis. Expectations regarding the surgical procedure and recovery can vary by diagnosis, personal characteristics, functional status, employment status, and trust in physicians. Patients have high overall expectations for recovery, particularly for pain relief and walking. Surgeons’ expectations tend to be more optimistic than patients’, although a subset of patients may have unrealistically high expectations. Although total joint replacement is an effective treatment for advanced arthritis, approximately 30% of potential candidates are unwilling to proceed with surgery. Potential surgical candidates unwilling to proceed with surgery tend to be older, female, and from ethnic minority groups. Several patient-related factors are associated with satisfaction with TKA, including primary diagnosis, preoperative pain and function, and mental health, including depression, but the relationships of satisfaction with gender, age, and comorbid conditions are less certain.
- Conclusion: A better understanding of patient expectations of TKA and recovery can identify knowledge gaps, misconceptions, and communication barriers, and ultimately improve shared decision making. A core set of reliable and valid instruments to measure expectations may encourage their routine use in both clinical and research settings.
Key words: total knee arthroplasty; osteoarthritis; patient expectations; shared decision making; joint replacement.
Total knee arthroplasty (TKA) is an elective surgery for patients with persistent pain and disability caused by knee arthritis. It is viewed as an effective and cost-effective surgical treatment for end-stage osteoarthritis (OA) [1–4]. As the population ages and obesity rates steadily increase, so will the utilization rates for TKA, with projected demand in the United States expected to grow 673% by 2030 [5–7]. The key indicators for receiving primary TKA are end-stage OA and joint pain [8]. Although TKA is a surgical option when conservative management is exhausted, no consensus exists as to the severity of symptoms required to consider surgery [9]. Variation in the utilization of TKA exists with respect to gender, racial/ethnicity, hospital, and geography [10,11]. These differences cannot be explained by prevalence of arthritis or symptoms or by access to health care alone. Increasingly, studies have shown these variations are largely attributable to patients’ preferences, driven by their beliefs, concerns, familiarity with the procedure, and expectations, along with physician opinion [12]. While physician opinions and recommendations clearly influence patients’ decisions, they do so primarily by modulating patients’ beliefs and expectations.
Patient expectations, not only of the effectiveness of the procedure itself but also of the recovery process, influence the decision to undergo an elective surgery such as joint arthroplasty. Ideally, these expectations should be informed by evidence, but often, lack of knowledge, preconceived beliefs, and misconceptions can taint informed decision making. A better understanding of patient expectations of TKA and recovery can identify knowledge gaps, misconceptions, and communication barriers, and ultimately improve shared decision making. Understanding patient expectations and factors that influence expectations provides a fuller appreciation of the outcomes that are meaningful to patients and can guide preoperative education and open dialogue with patients within a shared decision making model of care. In this paper, we discuss patient expectations of TKA, including expectations regarding outcomes and recovery, fulfillment of expectations, and the association of fulfilled expectations with satisfaction.
Measurement of Expectations
The construct of expectation is complex and situational. The ambiguity within the literature occurs most likely because expectations are multifaceted. Expectation involves the notion of expectancy, with respect to health care, that given events are likely to occur as a result of a medical procedure or treatment. This concept is in contrast to wants, which reflects a patient’s desire or wishes that an event will occur [13]. The term patient expectation, however, is commonly confused with patient preference or value. Preference implies a relative valuation or comparison by the patient and, unlike expectation, may not be explicitly expressed by the patient [13]. Different types of health care expectations exist that broadly relate to what patients expect regarding health care structure, process, and outcome [14].
Studies of patient expectations are diverse within the orthopedic research field and reflect differing theoretical underpinnings and lack of standardization. The lack of standardization makes measuring the complex concept of expectations challenging. While a number of conceptual models exist, Bowling and colleagues aptly recognize the multidimensionality of expectations and that no one conceptual model captures patient expectations [14]. The lack of standardization was noted in a systematic review by Haanstra and colleagues who found great variety in the definitions and measurements of expectations in studies examining their relationship with outcomes of total joint arthroplasty [15].
No gold standard measure exists for measuring patient expectations of orthopedic surgery. Zywiel’s systematic review [16] of 66 studies identified 7 validated instruments for measuring patient expectations for orthopedic surgery: of these, 2 were specific to TKA (Hospital for Special Surgery (HSS) Expectation Survey [17] and Expectation Domain of the New Knee Scoring System [18,19]), and 2 were generic to musculoskeletal conditions (Expectation domain of the Musculoskeletal Outcomes Data Evaluation and Management System (MODEMS) Instruments [20] and the Sunnybrook Surgery Expectation Survey [21]). A number of other measures used within the literature were identified; however, the psychometric properties for many of these measures were not reported and any evidence of testing and validation were lacking [16]. Some studies used a single question to measure expectations. As patient expectation is multi-dimensional, using a single item to evaluate expectations is problematic. Zywiel and others have called for a core set of reliable and valid instruments to measure expectations [14,22], which may encourage their routine use in both clinical and research settings.
Patients Expectations for TKA Recovery
Although patient concerns vary in terms of importance and severity [23], pain and physical limitations are primary concerns for patients seeking TKA. Patients have high overall expectations for recovery, particularly for pain relief and walking [24–32]. TKA is an elective surgical procedure that provides substantial pain relief and improvements in function and quality of life, with the largest gains seen within the first 6 months [33,34]. Both short-term and long-term effect sizes for pain relief and functional recovery are large, in excess of 1.0 [34]. Over 70% of patients undergoing TKA expect to be pain-free, and 35% expect to have no limitations with routine activities [24,28,31].
Expectations regarding the surgical procedure and recovery can vary by diagnosis, personal characteristics, functional status [17], employment status, and trust in physicians [32,35]. There is, however, inconsistent evidence on associative preoperative factors of recovery expectations. While some evidence supports an association between higher expectations and younger age and greater preoperative functional limitation [26–28,32,36–38], others have reported no significant association with several preoperative factors including age, gender, and preoperative functional status [24,26,37]. Lower overall expectations [28] and lower expectations for pain relief [21] were also seen for patients with a greater number of comorbid conditions.
It may be that patients with high preoperative expectations are more optimistic, interpret their health-reported quality of life gains more liberally, and are more likely to adhere to rehabilitation treatment [24,25]. Optimism is a generalized expectancy of a positive outcome that is related to indicators of well-being [39]. Presurgical optimism was shown to be associated with less postsurgical pain and anxiety in patients undergoing total hip and knee arthroplasty [40].
In addition to general future-oriented constructs, such as optimism, treatment-specific psychological constructs, such as treatment credibility and treatment expectancy, are seen in patients with total joint arthroplasty. A strong but not redundant association is seen between treatment expectancy and treatment credibility, that is, expectations of a treatment may be related as to how credible the treatment outcomes appear [41,42]. Haanstra and colleagues advocate further clinical work to explore which factor predicts total joint arthroplasty outcomes so that patients who are at a higher risk of poor outcomes can be identified [42].
Others have recognized that perspectives and expectations of surgical outcomes differ between patient and surgeon [43–45]. Overall, surgeons’ expectations tend to be more optimistic than patients expectations of outcomes, although a subset of patients may have unrealistically high expectations [46]. Patients do not always realize that some of their expectations cannot be met by current orthopedic procedures, and this gap in understanding is an important source of discrepancies in expectations and patient dissatisfaction [46]. Ghomrawi and colleagues reported that approximately one-third of 205 patients undergoing primary TKA had higher expectations than their surgeons did. Being male and having lower preoperative pain was associated with having discordantly higher preoperative expectations [44]. For realistic expectations to be set, patients need accurate and understandable information about expected positive outcomes of surgery such as level of function and symptom relief as well as the risk of joint failure, adverse events, complications, and activity limitations. Although little work has explored the alignment of patient and surgeon’s expectations, setting realistic expectations may be aided by using a shared decision making approach that incorporates patient preferences and values, the best available evidence, and the surgeon’s expertise.
Expectations and Willingness to Undergo Surgery
Although total joint replacement is an effective treatment for advanced arthritis, approximately 30% of potential candidates are “unwilling” to proceed with surgery [47,48]. Willingness is a component of the medical decision making process and is influenced by preferences. Potential surgical candidates unwilling to proceed with surgery tend to be older, female, and from ethnic minor-ity groups [12,47–49]. Preference-sensitive medical decisions, such as whether or not to proceed with TKA, are related to patients’ attitudes and perceptions, which can be affected by sociocultural influences. In a cohort of 627 male patients with moderate to severe OA who were viewed as “good” candidates for total joint arthroplasty, more African Americans (24%) than Caucasian Americans (15%) had lower expectations for outcomes of surgery [35]. In particular, African Americans expressed concerns about postoperative pain and walking. Similar findings were also reported in another study in which minority patients were less likely to consider TKA [12]. Determinants of preferences were patients’ beliefs about the efficacy of the procedure and knowing others who had already undergone TKA [12]. Ibrahim and colleagues postulated that outcome expectations mediated or influenced the willingness to undergo total joint arthroplasty surgery [49]. Interventional work that built upon this premise suggested that willingness to proceed with TKA could be modified by educational interventions. In a randomized controlled trial of 639 African American patients attending Veteran’s Affairs primary clinics who received a decision aid with or without brief counseling, willingness to proceed with TKA increased and patient-provider communication improved among the patients who received any intervention [50]. Yet in another randomized trial involving African American patients who received care from an academic center, a combination decision aid and motivational interviewing strategy was no better than an educational pamphlet in improving patients’ preferences toward joint replacement surgery for knee OA [51]. This led the authors to recommend further exploration of patients’ knowledge, beliefs, and attitudes regarding surgical treatments for OA.
Effect of Expectations on Health Outcomes and Satisfaction
Some evidence suggests that better outcomes are seen in patients with higher expectations of recovery and, in turn, expectations that are met influence patient satisfaction. A systematic review of several chronic conditions showed with consistency across studies that positive recovery expectations were associated with better health outcomes [22]. The effect size varied with the condition and measure; however, none of the 16 studies examined arthritis or joint arthroplasty. Conversely, a systematic review of 18 prospective longitudinal cohort studies examining the association between expectation and outcomes (ie, pain, function, stiffness, satisfaction, overall improvement) reported less than convincing evidence of an association between patient preoperative expectations and treatment outcomes for THA and TKA in terms of short- and long-term postoperative pain and functional outcomes [15]. No consistent associations were seen with adjusted analysis of patient expectations and pain or functional outcomes at greater than 6 weeks [15]. Inconsistencies seen among the reviewed articles may be related to a number of issues centred on terminology, construct, expectation measures, and confounding effects.
Although TKA is an effective surgical procedure with large gains reported, 14% to 25% participants report little or no symptom improvement and/or dissatisfaction up to 1 year after surgery [1,52–59]. In a study with 5 years of follow-up, a decline in the satisfaction rate was seen after 1 year, although this decline was seen more so with physical function than with pain [38]. Although dissatisfaction can be attributed to surgical complications, in many cases, no technical or medical reasons can be identified. In a subset of patients who received TKA, surgical intervention does not adequately address patients’ concerns of pain and activity limitation. To compound matters, fair agreement was reported between patient and surgeon regarding satisfaction at 6 and 12 months postoperative. Disagreement between the patient and surgeon was explained by unmet expectations and postoperative complications [60]. When there was discordance, more often than not patients were less satisfied with TKA outcomes than surgeons [60,61].
While several theories explain patient satisfaction [62–65], evidence from total joint arthroplasty studies support the concept that satisfaction is derived from fulfillment of expectations [17,52]. Preoperative expectations are not to be confused with postoperative fulfilment of expectations, which are reflective of whether expectations of treatment have been met. Satisfaction is a value judgment and can be viewed as an affective domain, whereas expectation is a cognitive domain [66]. Patient satisfaction is regarded as the extent of a person’s experience compared to their expectation. As with expectations, a number of theoretical constructs exist concerning patient satisfaction [14,67]. Many dimensions of satisfaction exist, with patient expectations being central to these constructs. Deviation from expectations, however, does not necessarily correspond to dissatisfaction [67].
Several patient-related factors are associated with satisfaction with TKA, including primary diagnosis, preoperative pain and function, and mental health, including depression, but the relationships of satisfaction with gender, age, and comorbid conditions are less certain [33,38,52,55,56,68]. Greater preoperative pain, postoperative complications, lower 1-year WOMAC scores and functional limitations were associated with dissatisfied patients [38,52,53,59]. While no consistent associations were seen with preoperative expectations, consistent evidence has shown that fulfillment of expectations has an impact on satisfaction [31,36,52,58,69].
It should be acknowledged that the concept of fulfillment of expectations is not the same as satisfaction. A patient can be satisfied with TKA even though their expectations have not been met. The fulfillment of expectations is dependent upon the type of expectation and the postoperative time period. Fulfillment of expectations were seen with pain relief, function, walking and health status [25,31,70] while patients expectations were not always met with leisure activities [38].
Shared Decision Making
The shared decision making process, in which the patient and physician share responsibility and actively participate in the clinical decision making process [71], may help in ensuring that patients’ expectations are met. Shared decision making requires eliciting patients’ preferences and values, providing clear information on the processes that will occur during surgery, recovery, rehabilitation, and in the longer phase of recovery, and what realistic outcomes can be expected. While a more “paternalistic” approach predominated in earlier years, the current trends indicate greater patient involvement in decision making with the surgeon, with open discussion of patient goals and expectations [71]. This approach also aids patients in their preparation for the recovery and rehabilitation stages, which can be challenging, especially if they are unaware as to what to expect. Patient expectations are more likely to be met when there is shared decision making and patients have been given relevant information and understand what is a reasonable outcome. While a shared decision making approach is advocated within orthopedics [72], patient expectations are largely not measured in the clinical setting.
Patient education is an integral component of assisting patients to make informed decisions; however, it is unknown whether education alone can modify expectations. Educational approaches can include group classes, videos, and written materials [73]. Limited evidence from a randomized controlled trial suggests that preoperative expectations can be modified by preoperative education classes by decreasing the number of expectations and having more expectations in agreement with the surgeons’ expectations [29]. Mancuso and colleagues, who looked at whether a preoperative education session could modify expectations found that larger changes in expectations were seen with those patients who had greater baseline expectation scores, worse pain and function, and were older [29]. Others have also reported that preoperative education reduces anxiety by providing patients with an understanding of what to expect [74,75]. An assumption is that expectations can be changed by improving knowledge, which underscores the need for relevant meaningful education to increase knowledge and instill realistic expectations. Others have surmised there is a proportion of patients who will continue to have unexpectedly high unrealistic expectations regardless of educational session [31,37]. This would suggest that education is not the only approach to modify expectations but rather different strategies may need to be implemented for a certain subsets of patients with unrealistic expectations.
Conclusion
Patient expectation is an important element to be considered in shared clinical decision making, as it can influ-ence preferences and subsequent satisfaction. Patients considering TKA have specific needs and expectations that they presume will be addressed with the surgery. If these are realistic, they can be met, and will result in greater patient satisfaction and better ongoing adherence to health care recommendations [76]. While much work has been conducted in identifying which patient characteristics may influence health expectations, additional research is needed to further determine how to shape expectations within a realistic, achievable framework. While traditional patient education is an important element to enhance knowledge, the limited available evidence suggests it is not sufficiently effective on its own. Other strategies such as use of individualized decision aids, provision of peer support, and enhanced provider-patient communication have been effective in many areas of health care and warrant evaluation in this field.
Corresponding author: Allyson Jones, PhD, Rm 2-50, Corbett Hall, University of Alberta, Edmonton, Alberta Canada T6G 2G4, [email protected].
Financial disclosures: None.
Author contributions: conception and design, CAJ, MES; analysis and interpretation of data, MES; drafting of article, CAJ, MES; critical revision of the article, CAJ, MES; collection and assembly of data, CAJ.
1. Jones CA, Voaklander DC, Johnston DW, Suarez-Almazor ME. Health related quality of life outcomes after total hip and knee arthroplasties in a community based population. J Rheumatol 2000;27:1745–52.
2. Waimann CA, Fernandez-Mazarambroz RJ, Cantor SB, et al. Cost-effectiveness of total knee replacement: a prospective cohort study. Arthritis Care Res 2014;66:592–9.
3. Jenkins PJ, Clement ND, Hamilton DF, et al. Predicting the cost-effectiveness of total hip and knee replacement: a health economic analysis. Bone Joint J 2013;95:115–21.
4. Losina E, Walensky RP, Kessler CL, et al. Cost-effectiveness of total knee arthroplasty in the United States: patient risk and hospital volume. Arch Intern Med 2009;169:1113–21.
5. Cram P, Lu X, Kates SL, et al. Total knee arthroplasty volume, utilization, and outcomes among Medicare beneficiaries, 1991-2010. JAMA 2012;308:1227–36.
6. Kurtz S, Ong K, Lau E, et al. Projections of primary and revision hip and knee arthroplasty in the United States from 2005 to 2030. J Bone Joint Surg Am 2007;89:780–5.
7. Jain NB, Higgins LD, Ozumba D, et al. Trends in epidemiology of knee arthroplasty in the United States, 1990-2000. Arthritis Rheum 2005;52:3928–33.
8. Engel C, Hamilton NA, Potter PT, Zautra AJ. Impact of two types of expectancy on recovery from total knee replacement surgery (TKR) in adults with osteoarthritis. Behav Med 2004;30:113–23.
9. Carr AJ, Robertsson O, Graves S, et al. Knee replacement. Lancet 2012;379:1331–40.
10. Skinner J, Weinstein JN, Sporer SM, Wennberg JE. Racial, ethnic, and geographic disparities in rates of knee arthroplasty among Medicare patients. N Engl J Med 2003;349:1350–9.
11. Cobos R, Latorre A, Aizpuru F, et al. Variability of indication criteria in knee and hip replacement: an observational study. BMC Musculoskelet Disord 2010;11:249.
12. Suarez-Almazor ME, Souchek J, Kelly PA, et al. Ethnic variation in knee replacement: patient preferences or uninformed disparity? Arch Intern Med 2005;165:1117–24.
13. Uhlmann RF, Inui TS, Carter WB. Patient requests and expectations. Definitions and clinical applications. Med Care 1984;22:681–5.
14. Bowling A, Rowe G, Lambert N, et al. The measurement of patients’ expectations for health care: a review and psychometric testing of a measure of patients’ expectations. Health Technology Assessment 2012;16:1–515.
15. Haanstra TM, van den Berg T, Ostelo RW, et al. Systematic review: do patient expectations influence treatment outcomes in total knee and total hip arthroplasty? Health Qual Life Outcomes 2012;10:152.
16. Zywiel MG, Mahomed A, Gandhi R, et al. Measuring expectations in orthopaedic surgery: a systematic review. Clin Orthop Rel Res 2013;471:3446–56.
17. Mancuso CA, Sculco TP, Wickiewicz TL, et al. Patients’ expectations of knee surgery. J Bone Joint Surg Am 2001;83A:1005–12.
18. Noble PC, Scuderi GR, Brekke AC, et al. Development of a new Knee Society scoring system. Clin Orthopaed Rel Res 2012;470:20–32.
19. Scuderi GR, Bourne RB, Noble PC, et al. The new Knee Society Knee Scoring System. Clin Orthop Relat Res 2012;470:3–19.
20. Saleh KJ, Bershadsky B, Cheng E, Kane R. Lessons learned from the hip and knee musculoskeletal outcomes data evaluation and management system. Clin Orthop Relat Res 2004; 272–8.
21. Razmjou H, Finkelstein JA, Yee A, et al. Relationship between preoperative patient characteristics and expectations in candidates for total knee arthroplasty. Physiotherapy Canada 2009;61:38–45.
22. Mondloch MV, Cole DC, Frank JW. Does how you do depend on how you think you’ll do? A systematic review of the evidence for a relation between patients’ recovery expectations and health outcomes. CMAJ 2001;165:174–9.
23. Wright JG, Santaguida PL, Young N, et al. Patient preferences before and after total knee arthroplasty. J Clin Epidemiol 2010;63:774–82.
24. Mahomed NN, Liang MH, Cook EF, et al.: The importance of patient expectations in predicting functional outcomes after total joint arthroplasty. J Rheumatology 2002;29:1273–9.
25. Gonzalez Saenz de Tejada M, Escobar A, Herrera C, et al. Patient expectations and health-related quality of life outcomes following total joint replacement. Value Health 2010;13:447–54.
26. Hepinstall MS, Rutledge JR, Bornstein LJ, et al. Factors that impact expectations before total knee arthroplasty. J Arthroplasty 2011;26:870–6.
27. Muniesa JM, Marco E, Tejero M, et al. Analysis of the expectations of elderly patients before undergoing total knee replacement. Arch Gerontol Geriatr 2010;51:E83-E87.
28. Lingard EA, Sledge CB, Learmonth ID. Patient expectations regarding total knee arthroplasty: Differences among the United States, United Kingdom, and Australia. J Bone Joint Surg Am 2006;88:1201–7.
29. Mancuso CA, Graziano S, Briskie LM, et al. Randomized trials to modify patients’ preoperative expectations of hip and knee arthroplasties. Clin Orthopaed Rel Res 2008;466:424–31.
30. de AS, Kallen MA, Amick B, et al. Patients’ expectations about total knee arthroplasty outcomes. Health Expect 2016;19:299–308.
31. Mannion AF, Kampfen S, Munzinger U, Kramers-de Q. The role of patient expectations in predicting outcome after total knee arthroplasty. Arthritis Res Ther 2009;11:R139.
32. Yoo JH, Chang CB, Kang YG, et al. Patient expectations of total knee replacement and their association with sociodemographic factors and functional status. J Bone Joint Surg Br 2011;93:337–44.
33. Ethgen O, Bruyere O, Richy F, et al. Health-related quality of life in total hip and total knee arthroplasty. A qualitative and systematic review of the literature. J Bone Joint Surg Am 2004;86:963–74.
34. Jones CA, Pohar S. Health-related quality of life after total joint arthroplasty: a scoping review. Clin Geriatr Med 2012;28:395–429.
35. Groeneveld PW, Kwoh CK, Mor MK, et al. Racial differences in expectations of joint replacement surgery outcomes. Arthritis Rheum 2008;59:730–7.
36. Scott CEH, Bugler KE, Clement ND, et al. Patient expectations of arthroplasty of the hip and knee. J Bone Joint Surg Br 2012;94:974–81.
37. Smith J, Soon VL, Boyd A, et al. What do Scottish patients expect of their total knee arthroplasty? J Arthroplasty 2016;31:786–92.
38. Nilsdotter AK, Toksvig-Larsen S, Roos EM. Knee arthroplasty: are patients’ expectations fulfilled? A prospective study of pain and function in 102 patients with 5-year follow-up. Acta Orthopaedica 2009;80:55–61.
39. Alarcon GM, Bowling NA, Khazon S. Great expectations: A meta-analytic examination of optimism and hope. Person Ind Diff 2013;54:821–7.
40. Pinto P, McIntyre T, Ferrero R, et al. Predictors of acute postsurgical pain and anxiety following primary total hip and knee arthroplasty. J Pain 2013;14:502–15.
41. Devilly GJ, Borkovec TD. Psychometric properties of the credibility/expectancy questionnaire. J Behav Ther Exp Psychiatry 2000;31:73–86.
42. Haanstra TM, Tilbury C, Kamper SJ, et al. Can optimism, pessimism, hope, treatment credibility and treatment expectancy be distinguished in patients undergoing total hip and total knee arthroplasty? PLoS One 2015;10.
43. Verbeek J, Sengers MJ, Riemens L, Haafkens J.Patient expectations of treatment for back pain: a systematic review of qualitative and quantitative studies. Spine 2004; 29:2309–18.
44. Ghomrawi HM, Mancuso CA, Westrich GH, et al. Discordance in TKA expectations between patients and surgeons. Clin Orthopaed Rel Res 2013;471:175–80.
45. Cordero-Ampuero J, Darder A, Santillana J, et al. Evaluation of patients’ and physicians’ expectations and attributes of osteoarthritis treatment using Kano methodology. Qual Life Res 2012;21:1391–404.
46. Noble PC, Fuller-Lafreniere S, Meftah M, Dwyer MK. Challenges in outcome measurement: discrepancies between patient and provider definitions of success. Clin Orthopaed Rel Res 2013;471:3437–45.
47. Hawker GA, Wright JG, Coyte PC, et al. Determining the need for hip and knee arthroplasty: the role of clinical severity and patients’ preferences. Med Care 2001;39:206–16.
48. Juni P, Dieppe P, Donovan J, et al. Population requirement for primary knee replacement surgery: a cross-sectional study. Rheumatology 2003;42:516–21.
49. Ibrahim SA, Siminoff LA, Burant CJ, Kwoh CK. Differences in expectations of outcome mediate African American/white patient differences in “willingness” to consider joint replacement. Arthritis Rheum 2002;46:2429–35.
50. Ibrahim SA, Hanusa BH, Hannon MJ, et al. Willingness and access to joint replacement among African American patients with knee osteoarthritis: a randomized, controlled intervention. Arthritis Rheum 2013;65:1253–61.
51. Vina ER, Richardson D, Medvedeva E, et al. Does a patient-centered educational intervention affect African-American access to knee replacement? A randomized trial. Clin Orthop Relat Res 2016;474:1755–64.
52. Noble PC, Conditt MA, Cook KF, Mathis KB. The John Insall Award - Patient expectations affect satisfaction with total knee arthroplasty. Clin Orthop Relat Res 2006; 35–43.
53. Robertsson O, Dunbar M, Pehrsson T, et al. Patient satisfaction after knee arthroplasty: a report on 27,372 knees operated on between 1981 and 1995 in Sweden. Acta Orthop Scand 2000;71:262–7.
54. Lau RL, Gandhi R, Mahomed S, Mahomed N. Patient satisfaction after total knee and hip arthroplasty. Clin Geriatr Med 2012;28:349–65.
55. Scott CEH, Howie CR, Macdonald D, Biant LC. Predicting dissatisfaction following total knee replacement. A prospective study of 1217 patients. J Bone Joint Surg Br 2010; 92B:1253–8.
56. Baker PN, van der Meulen JH, Lewsey J, Gregg PJ. The role of pain and function in determining patient satisfaction after total knee replacement. Data from the National Joint Registry for England and Wales. J Bone Joint Surg Br 2007;89:893–900.
57. Khatib Y, Madan A, Naylor JM, Harris IA: Do psychological factors predict poor outcome in patients undergoing TKA? a systematic review. Clin Orthopaed Rel Res 2015;473:2630–8.
58. Adie S, Dao A, Harris IA, et al. Satisfaction with joint replacement in public versus private hospitals: a cohort study. ANZ J Surg 2012;82:616–24.
59. Bourne RB, Chesworth BM, Davis AM, et al. Patient satisfaction after total knee arthroplasty: who is satisfied and who is not? Clin Orthop Relat Res 2010;468:57–63.
60. Harris IA, Harris AM, Naylor et al. Discordance between patient and surgeon satisfaction after total joint arthroplasty. J Arthroplasty 2013;28:722–7.
61. Choi YJ, Ra H. Patient satisfaction after total knee arthroplasty. Knee Surg Relat Res 2016;28:1–15.
62. Williams B. Patient satisfaction: a valid concept? Soc Sci Med 1994;38:509–16.
63. Ware JE Jr, Snyder MK, Wright WR, Davies AR. Defining and measuring patient satisfaction with medical care. Eval Program Plann 1983;6:247–63.
64. Linder-Pelz SU. Toward a theory of patient satisfaction. Soc Sci Med 1982;16:577–82.
65. Hudak PL, Hogg-Johnson S, Bombardier C, et al. Testing a new theory of patient satisfaction with treatment outcome. Med Care 2004;42:726–39.
66. Thompson AG, Sunol R. Expectations as determinants of patient satisfaction: concepts, theory and evidence. Int J Qual Health Care 1995;l7:127–41.
67. Pascoe GC. Patient satisfaction in primary health care: a literature review and analysis. Eval Program Plann 1983;6:185–210.
68. Gandhi R, Davey JR, Mahomed NN. Predicting patient dissatisfaction following joint replacement surgery. J Rheumatol 2008;35:2415–8.
69. Waljee J, McGlinn EP, Sears ED, Chung KC. Patient expectations and patient-reported outcomes in surgery: A systematic review. Surgery 2014;155:799-808.
70. Suda AJ, Seeger JB, Bitsch RG, et al. Are patients’ expectations of hip and knee arthroplasty fulfilled? A prospective study of 130 patients. Orthopedics 2010;33:76.
71. Slover J, Shue J, Koenig K. Shared decision-making in orthopaedic surgery. Clin Orthopaed Rel Res 2012;470:1046–53.
72. Weinstein JN. The missing piece: embracing shared decision making to reform health care. Spine 2000;25:1–4.
73 Aydin D, Klit J, Jacobsen S, et al. No major effects of preoperative education in patients undergoing hip or knee replacement--a systematic review. Dan Med J 2015;62.
74. Spalding NJ. Reducing anxiety by pre-operative education: make the future familiar. Occup Ther Int 2003;10:278–93.
75. Kearney M, Jennrich MK, Lyons S, et al. Effects of preoperative education on patient outcomes after joint replacement surgery. Orthop Nurs 2011;30:391–6.
76. Sherbourne CD, Hays RD, Ordway L, et al. Antecedents of adherence to medical recommendations: results from the Medical Outcomes Study. J Behav Med 1992;15:447–68.
From the Department of Physical Therapy, University of Alberta, Edmonton AB (Dr. Jones) and UT MD Anderson Cancer Center, Houston, TX (Dr. Suarez-Almazor).
Abstract
- Objective: To discuss patient expectations of total knee arthroplasty (TKA), instruments used to measure expectations, and the association between expectations, health outcomes, and satisfaction.
- Methods: Review of the literature.
- Results: TKA is an elective surgery for patients with persistent pain and disability caused by knee arthritis. Expectations regarding the surgical procedure and recovery can vary by diagnosis, personal characteristics, functional status, employment status, and trust in physicians. Patients have high overall expectations for recovery, particularly for pain relief and walking. Surgeons’ expectations tend to be more optimistic than patients’, although a subset of patients may have unrealistically high expectations. Although total joint replacement is an effective treatment for advanced arthritis, approximately 30% of potential candidates are unwilling to proceed with surgery. Potential surgical candidates unwilling to proceed with surgery tend to be older, female, and from ethnic minority groups. Several patient-related factors are associated with satisfaction with TKA, including primary diagnosis, preoperative pain and function, and mental health, including depression, but the relationships of satisfaction with gender, age, and comorbid conditions are less certain.
- Conclusion: A better understanding of patient expectations of TKA and recovery can identify knowledge gaps, misconceptions, and communication barriers, and ultimately improve shared decision making. A core set of reliable and valid instruments to measure expectations may encourage their routine use in both clinical and research settings.
Key words: total knee arthroplasty; osteoarthritis; patient expectations; shared decision making; joint replacement.
Total knee arthroplasty (TKA) is an elective surgery for patients with persistent pain and disability caused by knee arthritis. It is viewed as an effective and cost-effective surgical treatment for end-stage osteoarthritis (OA) [1–4]. As the population ages and obesity rates steadily increase, so will the utilization rates for TKA, with projected demand in the United States expected to grow 673% by 2030 [5–7]. The key indicators for receiving primary TKA are end-stage OA and joint pain [8]. Although TKA is a surgical option when conservative management is exhausted, no consensus exists as to the severity of symptoms required to consider surgery [9]. Variation in the utilization of TKA exists with respect to gender, racial/ethnicity, hospital, and geography [10,11]. These differences cannot be explained by prevalence of arthritis or symptoms or by access to health care alone. Increasingly, studies have shown these variations are largely attributable to patients’ preferences, driven by their beliefs, concerns, familiarity with the procedure, and expectations, along with physician opinion [12]. While physician opinions and recommendations clearly influence patients’ decisions, they do so primarily by modulating patients’ beliefs and expectations.
Patient expectations, not only of the effectiveness of the procedure itself but also of the recovery process, influence the decision to undergo an elective surgery such as joint arthroplasty. Ideally, these expectations should be informed by evidence, but often, lack of knowledge, preconceived beliefs, and misconceptions can taint informed decision making. A better understanding of patient expectations of TKA and recovery can identify knowledge gaps, misconceptions, and communication barriers, and ultimately improve shared decision making. Understanding patient expectations and factors that influence expectations provides a fuller appreciation of the outcomes that are meaningful to patients and can guide preoperative education and open dialogue with patients within a shared decision making model of care. In this paper, we discuss patient expectations of TKA, including expectations regarding outcomes and recovery, fulfillment of expectations, and the association of fulfilled expectations with satisfaction.
Measurement of Expectations
The construct of expectation is complex and situational. The ambiguity within the literature occurs most likely because expectations are multifaceted. Expectation involves the notion of expectancy, with respect to health care, that given events are likely to occur as a result of a medical procedure or treatment. This concept is in contrast to wants, which reflects a patient’s desire or wishes that an event will occur [13]. The term patient expectation, however, is commonly confused with patient preference or value. Preference implies a relative valuation or comparison by the patient and, unlike expectation, may not be explicitly expressed by the patient [13]. Different types of health care expectations exist that broadly relate to what patients expect regarding health care structure, process, and outcome [14].
Studies of patient expectations are diverse within the orthopedic research field and reflect differing theoretical underpinnings and lack of standardization. The lack of standardization makes measuring the complex concept of expectations challenging. While a number of conceptual models exist, Bowling and colleagues aptly recognize the multidimensionality of expectations and that no one conceptual model captures patient expectations [14]. The lack of standardization was noted in a systematic review by Haanstra and colleagues who found great variety in the definitions and measurements of expectations in studies examining their relationship with outcomes of total joint arthroplasty [15].
No gold standard measure exists for measuring patient expectations of orthopedic surgery. Zywiel’s systematic review [16] of 66 studies identified 7 validated instruments for measuring patient expectations for orthopedic surgery: of these, 2 were specific to TKA (Hospital for Special Surgery (HSS) Expectation Survey [17] and Expectation Domain of the New Knee Scoring System [18,19]), and 2 were generic to musculoskeletal conditions (Expectation domain of the Musculoskeletal Outcomes Data Evaluation and Management System (MODEMS) Instruments [20] and the Sunnybrook Surgery Expectation Survey [21]). A number of other measures used within the literature were identified; however, the psychometric properties for many of these measures were not reported and any evidence of testing and validation were lacking [16]. Some studies used a single question to measure expectations. As patient expectation is multi-dimensional, using a single item to evaluate expectations is problematic. Zywiel and others have called for a core set of reliable and valid instruments to measure expectations [14,22], which may encourage their routine use in both clinical and research settings.
Patients Expectations for TKA Recovery
Although patient concerns vary in terms of importance and severity [23], pain and physical limitations are primary concerns for patients seeking TKA. Patients have high overall expectations for recovery, particularly for pain relief and walking [24–32]. TKA is an elective surgical procedure that provides substantial pain relief and improvements in function and quality of life, with the largest gains seen within the first 6 months [33,34]. Both short-term and long-term effect sizes for pain relief and functional recovery are large, in excess of 1.0 [34]. Over 70% of patients undergoing TKA expect to be pain-free, and 35% expect to have no limitations with routine activities [24,28,31].
Expectations regarding the surgical procedure and recovery can vary by diagnosis, personal characteristics, functional status [17], employment status, and trust in physicians [32,35]. There is, however, inconsistent evidence on associative preoperative factors of recovery expectations. While some evidence supports an association between higher expectations and younger age and greater preoperative functional limitation [26–28,32,36–38], others have reported no significant association with several preoperative factors including age, gender, and preoperative functional status [24,26,37]. Lower overall expectations [28] and lower expectations for pain relief [21] were also seen for patients with a greater number of comorbid conditions.
It may be that patients with high preoperative expectations are more optimistic, interpret their health-reported quality of life gains more liberally, and are more likely to adhere to rehabilitation treatment [24,25]. Optimism is a generalized expectancy of a positive outcome that is related to indicators of well-being [39]. Presurgical optimism was shown to be associated with less postsurgical pain and anxiety in patients undergoing total hip and knee arthroplasty [40].
In addition to general future-oriented constructs, such as optimism, treatment-specific psychological constructs, such as treatment credibility and treatment expectancy, are seen in patients with total joint arthroplasty. A strong but not redundant association is seen between treatment expectancy and treatment credibility, that is, expectations of a treatment may be related as to how credible the treatment outcomes appear [41,42]. Haanstra and colleagues advocate further clinical work to explore which factor predicts total joint arthroplasty outcomes so that patients who are at a higher risk of poor outcomes can be identified [42].
Others have recognized that perspectives and expectations of surgical outcomes differ between patient and surgeon [43–45]. Overall, surgeons’ expectations tend to be more optimistic than patients expectations of outcomes, although a subset of patients may have unrealistically high expectations [46]. Patients do not always realize that some of their expectations cannot be met by current orthopedic procedures, and this gap in understanding is an important source of discrepancies in expectations and patient dissatisfaction [46]. Ghomrawi and colleagues reported that approximately one-third of 205 patients undergoing primary TKA had higher expectations than their surgeons did. Being male and having lower preoperative pain was associated with having discordantly higher preoperative expectations [44]. For realistic expectations to be set, patients need accurate and understandable information about expected positive outcomes of surgery such as level of function and symptom relief as well as the risk of joint failure, adverse events, complications, and activity limitations. Although little work has explored the alignment of patient and surgeon’s expectations, setting realistic expectations may be aided by using a shared decision making approach that incorporates patient preferences and values, the best available evidence, and the surgeon’s expertise.
Expectations and Willingness to Undergo Surgery
Although total joint replacement is an effective treatment for advanced arthritis, approximately 30% of potential candidates are “unwilling” to proceed with surgery [47,48]. Willingness is a component of the medical decision making process and is influenced by preferences. Potential surgical candidates unwilling to proceed with surgery tend to be older, female, and from ethnic minor-ity groups [12,47–49]. Preference-sensitive medical decisions, such as whether or not to proceed with TKA, are related to patients’ attitudes and perceptions, which can be affected by sociocultural influences. In a cohort of 627 male patients with moderate to severe OA who were viewed as “good” candidates for total joint arthroplasty, more African Americans (24%) than Caucasian Americans (15%) had lower expectations for outcomes of surgery [35]. In particular, African Americans expressed concerns about postoperative pain and walking. Similar findings were also reported in another study in which minority patients were less likely to consider TKA [12]. Determinants of preferences were patients’ beliefs about the efficacy of the procedure and knowing others who had already undergone TKA [12]. Ibrahim and colleagues postulated that outcome expectations mediated or influenced the willingness to undergo total joint arthroplasty surgery [49]. Interventional work that built upon this premise suggested that willingness to proceed with TKA could be modified by educational interventions. In a randomized controlled trial of 639 African American patients attending Veteran’s Affairs primary clinics who received a decision aid with or without brief counseling, willingness to proceed with TKA increased and patient-provider communication improved among the patients who received any intervention [50]. Yet in another randomized trial involving African American patients who received care from an academic center, a combination decision aid and motivational interviewing strategy was no better than an educational pamphlet in improving patients’ preferences toward joint replacement surgery for knee OA [51]. This led the authors to recommend further exploration of patients’ knowledge, beliefs, and attitudes regarding surgical treatments for OA.
Effect of Expectations on Health Outcomes and Satisfaction
Some evidence suggests that better outcomes are seen in patients with higher expectations of recovery and, in turn, expectations that are met influence patient satisfaction. A systematic review of several chronic conditions showed with consistency across studies that positive recovery expectations were associated with better health outcomes [22]. The effect size varied with the condition and measure; however, none of the 16 studies examined arthritis or joint arthroplasty. Conversely, a systematic review of 18 prospective longitudinal cohort studies examining the association between expectation and outcomes (ie, pain, function, stiffness, satisfaction, overall improvement) reported less than convincing evidence of an association between patient preoperative expectations and treatment outcomes for THA and TKA in terms of short- and long-term postoperative pain and functional outcomes [15]. No consistent associations were seen with adjusted analysis of patient expectations and pain or functional outcomes at greater than 6 weeks [15]. Inconsistencies seen among the reviewed articles may be related to a number of issues centred on terminology, construct, expectation measures, and confounding effects.
Although TKA is an effective surgical procedure with large gains reported, 14% to 25% participants report little or no symptom improvement and/or dissatisfaction up to 1 year after surgery [1,52–59]. In a study with 5 years of follow-up, a decline in the satisfaction rate was seen after 1 year, although this decline was seen more so with physical function than with pain [38]. Although dissatisfaction can be attributed to surgical complications, in many cases, no technical or medical reasons can be identified. In a subset of patients who received TKA, surgical intervention does not adequately address patients’ concerns of pain and activity limitation. To compound matters, fair agreement was reported between patient and surgeon regarding satisfaction at 6 and 12 months postoperative. Disagreement between the patient and surgeon was explained by unmet expectations and postoperative complications [60]. When there was discordance, more often than not patients were less satisfied with TKA outcomes than surgeons [60,61].
While several theories explain patient satisfaction [62–65], evidence from total joint arthroplasty studies support the concept that satisfaction is derived from fulfillment of expectations [17,52]. Preoperative expectations are not to be confused with postoperative fulfilment of expectations, which are reflective of whether expectations of treatment have been met. Satisfaction is a value judgment and can be viewed as an affective domain, whereas expectation is a cognitive domain [66]. Patient satisfaction is regarded as the extent of a person’s experience compared to their expectation. As with expectations, a number of theoretical constructs exist concerning patient satisfaction [14,67]. Many dimensions of satisfaction exist, with patient expectations being central to these constructs. Deviation from expectations, however, does not necessarily correspond to dissatisfaction [67].
Several patient-related factors are associated with satisfaction with TKA, including primary diagnosis, preoperative pain and function, and mental health, including depression, but the relationships of satisfaction with gender, age, and comorbid conditions are less certain [33,38,52,55,56,68]. Greater preoperative pain, postoperative complications, lower 1-year WOMAC scores and functional limitations were associated with dissatisfied patients [38,52,53,59]. While no consistent associations were seen with preoperative expectations, consistent evidence has shown that fulfillment of expectations has an impact on satisfaction [31,36,52,58,69].
It should be acknowledged that the concept of fulfillment of expectations is not the same as satisfaction. A patient can be satisfied with TKA even though their expectations have not been met. The fulfillment of expectations is dependent upon the type of expectation and the postoperative time period. Fulfillment of expectations were seen with pain relief, function, walking and health status [25,31,70] while patients expectations were not always met with leisure activities [38].
Shared Decision Making
The shared decision making process, in which the patient and physician share responsibility and actively participate in the clinical decision making process [71], may help in ensuring that patients’ expectations are met. Shared decision making requires eliciting patients’ preferences and values, providing clear information on the processes that will occur during surgery, recovery, rehabilitation, and in the longer phase of recovery, and what realistic outcomes can be expected. While a more “paternalistic” approach predominated in earlier years, the current trends indicate greater patient involvement in decision making with the surgeon, with open discussion of patient goals and expectations [71]. This approach also aids patients in their preparation for the recovery and rehabilitation stages, which can be challenging, especially if they are unaware as to what to expect. Patient expectations are more likely to be met when there is shared decision making and patients have been given relevant information and understand what is a reasonable outcome. While a shared decision making approach is advocated within orthopedics [72], patient expectations are largely not measured in the clinical setting.
Patient education is an integral component of assisting patients to make informed decisions; however, it is unknown whether education alone can modify expectations. Educational approaches can include group classes, videos, and written materials [73]. Limited evidence from a randomized controlled trial suggests that preoperative expectations can be modified by preoperative education classes by decreasing the number of expectations and having more expectations in agreement with the surgeons’ expectations [29]. Mancuso and colleagues, who looked at whether a preoperative education session could modify expectations found that larger changes in expectations were seen with those patients who had greater baseline expectation scores, worse pain and function, and were older [29]. Others have also reported that preoperative education reduces anxiety by providing patients with an understanding of what to expect [74,75]. An assumption is that expectations can be changed by improving knowledge, which underscores the need for relevant meaningful education to increase knowledge and instill realistic expectations. Others have surmised there is a proportion of patients who will continue to have unexpectedly high unrealistic expectations regardless of educational session [31,37]. This would suggest that education is not the only approach to modify expectations but rather different strategies may need to be implemented for a certain subsets of patients with unrealistic expectations.
Conclusion
Patient expectation is an important element to be considered in shared clinical decision making, as it can influ-ence preferences and subsequent satisfaction. Patients considering TKA have specific needs and expectations that they presume will be addressed with the surgery. If these are realistic, they can be met, and will result in greater patient satisfaction and better ongoing adherence to health care recommendations [76]. While much work has been conducted in identifying which patient characteristics may influence health expectations, additional research is needed to further determine how to shape expectations within a realistic, achievable framework. While traditional patient education is an important element to enhance knowledge, the limited available evidence suggests it is not sufficiently effective on its own. Other strategies such as use of individualized decision aids, provision of peer support, and enhanced provider-patient communication have been effective in many areas of health care and warrant evaluation in this field.
Corresponding author: Allyson Jones, PhD, Rm 2-50, Corbett Hall, University of Alberta, Edmonton, Alberta Canada T6G 2G4, [email protected].
Financial disclosures: None.
Author contributions: conception and design, CAJ, MES; analysis and interpretation of data, MES; drafting of article, CAJ, MES; critical revision of the article, CAJ, MES; collection and assembly of data, CAJ.
1. Jones CA, Voaklander DC, Johnston DW, Suarez-Almazor ME. Health related quality of life outcomes after total hip and knee arthroplasties in a community based population. J Rheumatol 2000;27:1745–52.
2. Waimann CA, Fernandez-Mazarambroz RJ, Cantor SB, et al. Cost-effectiveness of total knee replacement: a prospective cohort study. Arthritis Care Res 2014;66:592–9.
3. Jenkins PJ, Clement ND, Hamilton DF, et al. Predicting the cost-effectiveness of total hip and knee replacement: a health economic analysis. Bone Joint J 2013;95:115–21.
4. Losina E, Walensky RP, Kessler CL, et al. Cost-effectiveness of total knee arthroplasty in the United States: patient risk and hospital volume. Arch Intern Med 2009;169:1113–21.
5. Cram P, Lu X, Kates SL, et al. Total knee arthroplasty volume, utilization, and outcomes among Medicare beneficiaries, 1991-2010. JAMA 2012;308:1227–36.
6. Kurtz S, Ong K, Lau E, et al. Projections of primary and revision hip and knee arthroplasty in the United States from 2005 to 2030. J Bone Joint Surg Am 2007;89:780–5.
7. Jain NB, Higgins LD, Ozumba D, et al. Trends in epidemiology of knee arthroplasty in the United States, 1990-2000. Arthritis Rheum 2005;52:3928–33.
8. Engel C, Hamilton NA, Potter PT, Zautra AJ. Impact of two types of expectancy on recovery from total knee replacement surgery (TKR) in adults with osteoarthritis. Behav Med 2004;30:113–23.
9. Carr AJ, Robertsson O, Graves S, et al. Knee replacement. Lancet 2012;379:1331–40.
10. Skinner J, Weinstein JN, Sporer SM, Wennberg JE. Racial, ethnic, and geographic disparities in rates of knee arthroplasty among Medicare patients. N Engl J Med 2003;349:1350–9.
11. Cobos R, Latorre A, Aizpuru F, et al. Variability of indication criteria in knee and hip replacement: an observational study. BMC Musculoskelet Disord 2010;11:249.
12. Suarez-Almazor ME, Souchek J, Kelly PA, et al. Ethnic variation in knee replacement: patient preferences or uninformed disparity? Arch Intern Med 2005;165:1117–24.
13. Uhlmann RF, Inui TS, Carter WB. Patient requests and expectations. Definitions and clinical applications. Med Care 1984;22:681–5.
14. Bowling A, Rowe G, Lambert N, et al. The measurement of patients’ expectations for health care: a review and psychometric testing of a measure of patients’ expectations. Health Technology Assessment 2012;16:1–515.
15. Haanstra TM, van den Berg T, Ostelo RW, et al. Systematic review: do patient expectations influence treatment outcomes in total knee and total hip arthroplasty? Health Qual Life Outcomes 2012;10:152.
16. Zywiel MG, Mahomed A, Gandhi R, et al. Measuring expectations in orthopaedic surgery: a systematic review. Clin Orthop Rel Res 2013;471:3446–56.
17. Mancuso CA, Sculco TP, Wickiewicz TL, et al. Patients’ expectations of knee surgery. J Bone Joint Surg Am 2001;83A:1005–12.
18. Noble PC, Scuderi GR, Brekke AC, et al. Development of a new Knee Society scoring system. Clin Orthopaed Rel Res 2012;470:20–32.
19. Scuderi GR, Bourne RB, Noble PC, et al. The new Knee Society Knee Scoring System. Clin Orthop Relat Res 2012;470:3–19.
20. Saleh KJ, Bershadsky B, Cheng E, Kane R. Lessons learned from the hip and knee musculoskeletal outcomes data evaluation and management system. Clin Orthop Relat Res 2004; 272–8.
21. Razmjou H, Finkelstein JA, Yee A, et al. Relationship between preoperative patient characteristics and expectations in candidates for total knee arthroplasty. Physiotherapy Canada 2009;61:38–45.
22. Mondloch MV, Cole DC, Frank JW. Does how you do depend on how you think you’ll do? A systematic review of the evidence for a relation between patients’ recovery expectations and health outcomes. CMAJ 2001;165:174–9.
23. Wright JG, Santaguida PL, Young N, et al. Patient preferences before and after total knee arthroplasty. J Clin Epidemiol 2010;63:774–82.
24. Mahomed NN, Liang MH, Cook EF, et al.: The importance of patient expectations in predicting functional outcomes after total joint arthroplasty. J Rheumatology 2002;29:1273–9.
25. Gonzalez Saenz de Tejada M, Escobar A, Herrera C, et al. Patient expectations and health-related quality of life outcomes following total joint replacement. Value Health 2010;13:447–54.
26. Hepinstall MS, Rutledge JR, Bornstein LJ, et al. Factors that impact expectations before total knee arthroplasty. J Arthroplasty 2011;26:870–6.
27. Muniesa JM, Marco E, Tejero M, et al. Analysis of the expectations of elderly patients before undergoing total knee replacement. Arch Gerontol Geriatr 2010;51:E83-E87.
28. Lingard EA, Sledge CB, Learmonth ID. Patient expectations regarding total knee arthroplasty: Differences among the United States, United Kingdom, and Australia. J Bone Joint Surg Am 2006;88:1201–7.
29. Mancuso CA, Graziano S, Briskie LM, et al. Randomized trials to modify patients’ preoperative expectations of hip and knee arthroplasties. Clin Orthopaed Rel Res 2008;466:424–31.
30. de AS, Kallen MA, Amick B, et al. Patients’ expectations about total knee arthroplasty outcomes. Health Expect 2016;19:299–308.
31. Mannion AF, Kampfen S, Munzinger U, Kramers-de Q. The role of patient expectations in predicting outcome after total knee arthroplasty. Arthritis Res Ther 2009;11:R139.
32. Yoo JH, Chang CB, Kang YG, et al. Patient expectations of total knee replacement and their association with sociodemographic factors and functional status. J Bone Joint Surg Br 2011;93:337–44.
33. Ethgen O, Bruyere O, Richy F, et al. Health-related quality of life in total hip and total knee arthroplasty. A qualitative and systematic review of the literature. J Bone Joint Surg Am 2004;86:963–74.
34. Jones CA, Pohar S. Health-related quality of life after total joint arthroplasty: a scoping review. Clin Geriatr Med 2012;28:395–429.
35. Groeneveld PW, Kwoh CK, Mor MK, et al. Racial differences in expectations of joint replacement surgery outcomes. Arthritis Rheum 2008;59:730–7.
36. Scott CEH, Bugler KE, Clement ND, et al. Patient expectations of arthroplasty of the hip and knee. J Bone Joint Surg Br 2012;94:974–81.
37. Smith J, Soon VL, Boyd A, et al. What do Scottish patients expect of their total knee arthroplasty? J Arthroplasty 2016;31:786–92.
38. Nilsdotter AK, Toksvig-Larsen S, Roos EM. Knee arthroplasty: are patients’ expectations fulfilled? A prospective study of pain and function in 102 patients with 5-year follow-up. Acta Orthopaedica 2009;80:55–61.
39. Alarcon GM, Bowling NA, Khazon S. Great expectations: A meta-analytic examination of optimism and hope. Person Ind Diff 2013;54:821–7.
40. Pinto P, McIntyre T, Ferrero R, et al. Predictors of acute postsurgical pain and anxiety following primary total hip and knee arthroplasty. J Pain 2013;14:502–15.
41. Devilly GJ, Borkovec TD. Psychometric properties of the credibility/expectancy questionnaire. J Behav Ther Exp Psychiatry 2000;31:73–86.
42. Haanstra TM, Tilbury C, Kamper SJ, et al. Can optimism, pessimism, hope, treatment credibility and treatment expectancy be distinguished in patients undergoing total hip and total knee arthroplasty? PLoS One 2015;10.
43. Verbeek J, Sengers MJ, Riemens L, Haafkens J.Patient expectations of treatment for back pain: a systematic review of qualitative and quantitative studies. Spine 2004; 29:2309–18.
44. Ghomrawi HM, Mancuso CA, Westrich GH, et al. Discordance in TKA expectations between patients and surgeons. Clin Orthopaed Rel Res 2013;471:175–80.
45. Cordero-Ampuero J, Darder A, Santillana J, et al. Evaluation of patients’ and physicians’ expectations and attributes of osteoarthritis treatment using Kano methodology. Qual Life Res 2012;21:1391–404.
46. Noble PC, Fuller-Lafreniere S, Meftah M, Dwyer MK. Challenges in outcome measurement: discrepancies between patient and provider definitions of success. Clin Orthopaed Rel Res 2013;471:3437–45.
47. Hawker GA, Wright JG, Coyte PC, et al. Determining the need for hip and knee arthroplasty: the role of clinical severity and patients’ preferences. Med Care 2001;39:206–16.
48. Juni P, Dieppe P, Donovan J, et al. Population requirement for primary knee replacement surgery: a cross-sectional study. Rheumatology 2003;42:516–21.
49. Ibrahim SA, Siminoff LA, Burant CJ, Kwoh CK. Differences in expectations of outcome mediate African American/white patient differences in “willingness” to consider joint replacement. Arthritis Rheum 2002;46:2429–35.
50. Ibrahim SA, Hanusa BH, Hannon MJ, et al. Willingness and access to joint replacement among African American patients with knee osteoarthritis: a randomized, controlled intervention. Arthritis Rheum 2013;65:1253–61.
51. Vina ER, Richardson D, Medvedeva E, et al. Does a patient-centered educational intervention affect African-American access to knee replacement? A randomized trial. Clin Orthop Relat Res 2016;474:1755–64.
52. Noble PC, Conditt MA, Cook KF, Mathis KB. The John Insall Award - Patient expectations affect satisfaction with total knee arthroplasty. Clin Orthop Relat Res 2006; 35–43.
53. Robertsson O, Dunbar M, Pehrsson T, et al. Patient satisfaction after knee arthroplasty: a report on 27,372 knees operated on between 1981 and 1995 in Sweden. Acta Orthop Scand 2000;71:262–7.
54. Lau RL, Gandhi R, Mahomed S, Mahomed N. Patient satisfaction after total knee and hip arthroplasty. Clin Geriatr Med 2012;28:349–65.
55. Scott CEH, Howie CR, Macdonald D, Biant LC. Predicting dissatisfaction following total knee replacement. A prospective study of 1217 patients. J Bone Joint Surg Br 2010; 92B:1253–8.
56. Baker PN, van der Meulen JH, Lewsey J, Gregg PJ. The role of pain and function in determining patient satisfaction after total knee replacement. Data from the National Joint Registry for England and Wales. J Bone Joint Surg Br 2007;89:893–900.
57. Khatib Y, Madan A, Naylor JM, Harris IA: Do psychological factors predict poor outcome in patients undergoing TKA? a systematic review. Clin Orthopaed Rel Res 2015;473:2630–8.
58. Adie S, Dao A, Harris IA, et al. Satisfaction with joint replacement in public versus private hospitals: a cohort study. ANZ J Surg 2012;82:616–24.
59. Bourne RB, Chesworth BM, Davis AM, et al. Patient satisfaction after total knee arthroplasty: who is satisfied and who is not? Clin Orthop Relat Res 2010;468:57–63.
60. Harris IA, Harris AM, Naylor et al. Discordance between patient and surgeon satisfaction after total joint arthroplasty. J Arthroplasty 2013;28:722–7.
61. Choi YJ, Ra H. Patient satisfaction after total knee arthroplasty. Knee Surg Relat Res 2016;28:1–15.
62. Williams B. Patient satisfaction: a valid concept? Soc Sci Med 1994;38:509–16.
63. Ware JE Jr, Snyder MK, Wright WR, Davies AR. Defining and measuring patient satisfaction with medical care. Eval Program Plann 1983;6:247–63.
64. Linder-Pelz SU. Toward a theory of patient satisfaction. Soc Sci Med 1982;16:577–82.
65. Hudak PL, Hogg-Johnson S, Bombardier C, et al. Testing a new theory of patient satisfaction with treatment outcome. Med Care 2004;42:726–39.
66. Thompson AG, Sunol R. Expectations as determinants of patient satisfaction: concepts, theory and evidence. Int J Qual Health Care 1995;l7:127–41.
67. Pascoe GC. Patient satisfaction in primary health care: a literature review and analysis. Eval Program Plann 1983;6:185–210.
68. Gandhi R, Davey JR, Mahomed NN. Predicting patient dissatisfaction following joint replacement surgery. J Rheumatol 2008;35:2415–8.
69. Waljee J, McGlinn EP, Sears ED, Chung KC. Patient expectations and patient-reported outcomes in surgery: A systematic review. Surgery 2014;155:799-808.
70. Suda AJ, Seeger JB, Bitsch RG, et al. Are patients’ expectations of hip and knee arthroplasty fulfilled? A prospective study of 130 patients. Orthopedics 2010;33:76.
71. Slover J, Shue J, Koenig K. Shared decision-making in orthopaedic surgery. Clin Orthopaed Rel Res 2012;470:1046–53.
72. Weinstein JN. The missing piece: embracing shared decision making to reform health care. Spine 2000;25:1–4.
73 Aydin D, Klit J, Jacobsen S, et al. No major effects of preoperative education in patients undergoing hip or knee replacement--a systematic review. Dan Med J 2015;62.
74. Spalding NJ. Reducing anxiety by pre-operative education: make the future familiar. Occup Ther Int 2003;10:278–93.
75. Kearney M, Jennrich MK, Lyons S, et al. Effects of preoperative education on patient outcomes after joint replacement surgery. Orthop Nurs 2011;30:391–6.
76. Sherbourne CD, Hays RD, Ordway L, et al. Antecedents of adherence to medical recommendations: results from the Medical Outcomes Study. J Behav Med 1992;15:447–68.
Recurrent UTIs in Women: How to Refine Your Care

For the third time in nine months, Joan, 28, presents with complaints of painful, frequent, and urgent urination. Joan is sexually active; her medical history is otherwise unremarkable. In each of the previous two episodes, her urine culture grew Escherichia coli, and she was treated with a five-day course of nitrofurantoin. Now, she asks about the need for additional workup and treatment, as well as whether there is a way to prevent further infections.
Urinary tract infections (UTIs) are the most common bacterial infection in women and account for an estimated 5.4 million primary care office visits and 2.3 million emergency department visits annually.1,2 For women, the lifetime risk for a UTI is greater than 50%.3 In one study of UTI in a primary care setting, 36% of women younger than 55 and 53% of women older than 55 had a recurrent infection within a year.4 Most women with UTI are treated as outpatients, but 16.7% require hospitalization.5 In the United States, direct costs for evaluation and treatment of UTI total $1.6 billion each year.5
Accurately characterizing recurrent UTI
Bacteriuria is defined as the presence of 100,000 colony-forming units (ie, viable bacteria) per milliliter of urine collected midstream on two consecutive urinations.6 UTIs are symptomatic infections of the urinary tract and may involve the urethra, bladder, ureters, or kidneys.7 Infections of the lower tract (bladder and urethra) are commonly referred to as cystitis; infections of the upper tract (kidney and ureters) are referred to as pyelonephritis.
Most UTIs are uncomplicated and do not progress to more serious infections. However, patients who are pregnant or who have chronic medical conditions (eg, renal insufficiency or use of immunosuppressant medications), urinary obstruction, or calculi may develop complicated UTIs.8
Recurrent UTI is an infection that follows resolution of bacteriuria and symptoms of a prior UTI; the term applies when such an infection occurs within six months of the previous UTI or when three or more UTIs occur within a year.7 Recurrent infection can be further characterized as relapse or reinfection. Relapse occurs when the patient has a second UTI caused by the same pathogen within two weeks of the original treatment.9 Reinfection is a UTI that occurs more than two weeks after completion of treatment for the original UTI. The pathogen in a reinfection may be the same one that caused the original UTI or it may be a different agent.9
It’s also important to differentiate between recurrent and resistant UTI. In resistant UTI, bacteriuria fails to resolve following seven to 14 days of appropriate antibiotic treatment.9

FACTORS THAT INCREASE RISK FOR RECURRENT UTI
Premenopausal women
Both modifiable and nonmodifiable factors (see Table 1) have been associated with increased risk for recurrent UTI in premenopausal women.10-21 Among those with specific blood group phenotypes (Lewis non-secretor, in particular), rates of UTI rise secondary to increased adherence of bacteria to epithelial cells in the urinary tract.10 Other nonmodifiable risk factors include congenital urinary tract anomalies, obstruction of the urinary tract, and a history of UTI.11,12 Women whose mothers had UTIs are at higher risk for recurrent UTI than are those whose mothers had no such history.13
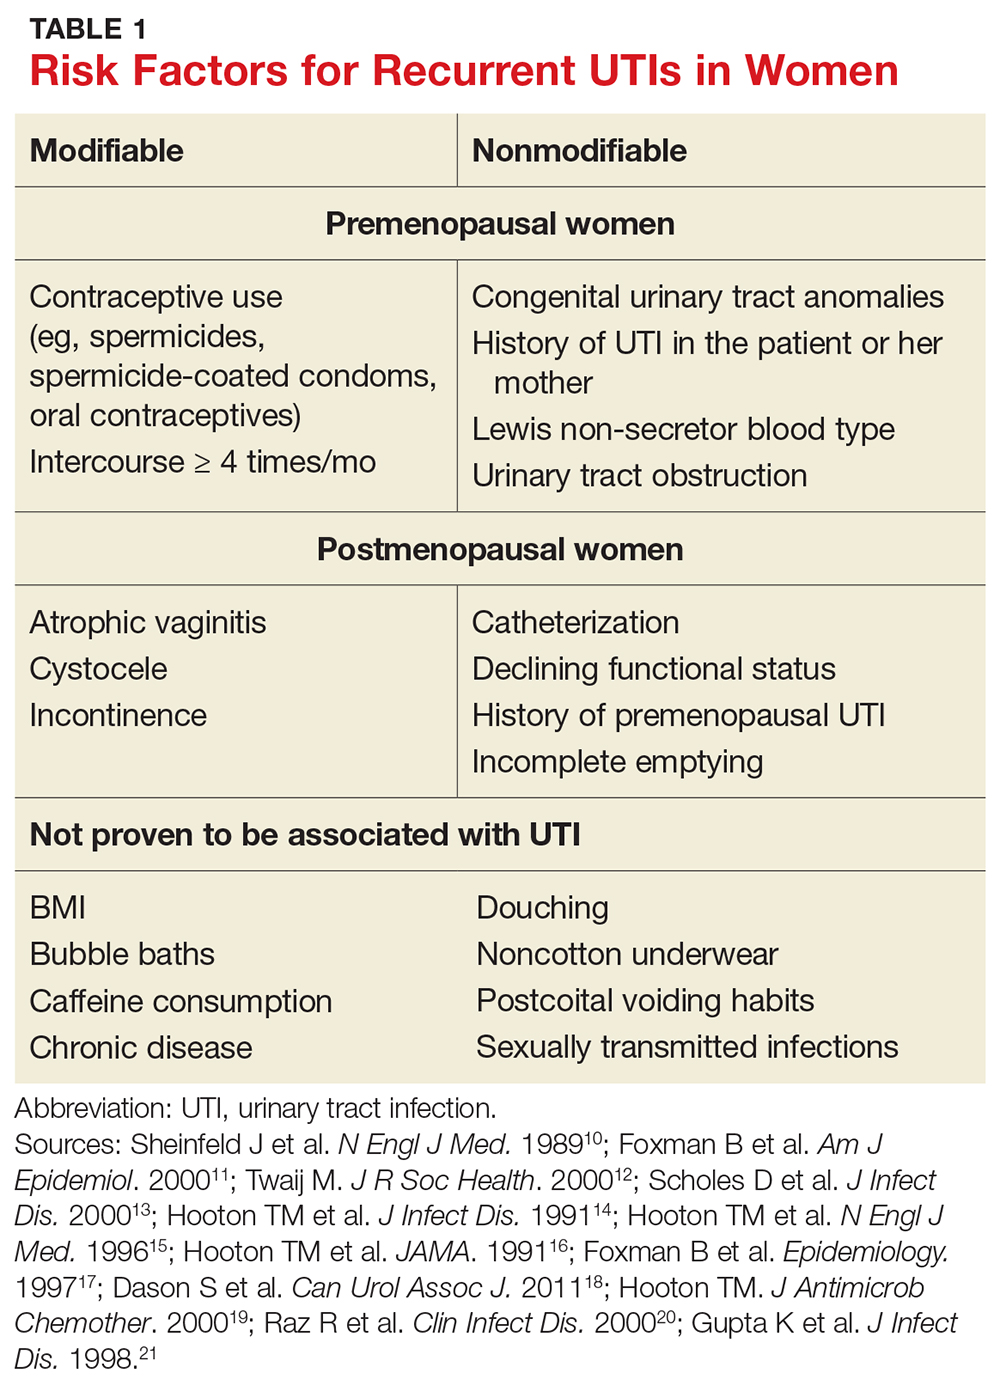
Modifiable risk factors for recurrent UTI include contraceptive use (spermicides, spermicide-coated condoms, and oral contraceptives) and frequency of intercourse (≥ 4 times/month).13 Spermicides alter the normal vaginal flora and lead to increased colonization of E coli, which increases the risk for UTI.14 Women with recurrent UTIs were 1.27 to 1.45 times more likely to use oral contraceptives than those without recurrent UTIs.13 Compared with college women who had not had intercourse, sexually active college women who had engaged in intercourse three times in a week had a 2.6-fold increase in relative risk for UTI.15 Those who had daily intercourse had a 9-fold increase in relative risk for UTI.15This elevated risk is due to trauma to the lower urogenital tract (urethra) and introduction of bacteria into the urethra via mechanical factors.16,17
Postmenopausal women
Atrophic vaginitis, catheterization, declining functional status, cystocele, incomplete emptying, incontinence, and history of premenopausal UTIs are all risk factors for recurrent UTI in postmenopausal women.19,20 Decreased estrogen and resulting vaginal atrophy appear to be associated with increased rates of UTI in these women. Additionally, postmenopausal women’s vaginas are more likely to be colonized with E coli and have fewer lactobacilli than those of premenopausal women, which is thought to predispose them to UTI.21 These risk factors are summarized in Table 1.10-21
INITIAL EVALUATION OF RECURRENT UTI
Patients with recurrent UTI experience signs and symptoms similar to those with isolated uncomplicated UTI: dysuria, frequency, urgency, and hematuria. Focus your history interview on potential causes of complicated UTI (see Table 2).18 Likewise, perform a pelvic exam to evaluate for predisposing anatomic abnormalities.22 Finally, obtain a urine culture with antibiotic sensitivities to ensure that previous treatment was appropriate and to rule out microbes associated with infected uroliths.18 Given the low probability of finding abnormalities on cystoscopy or imaging, neither one is routinely recommended for the evaluation of recurrent UTI.18
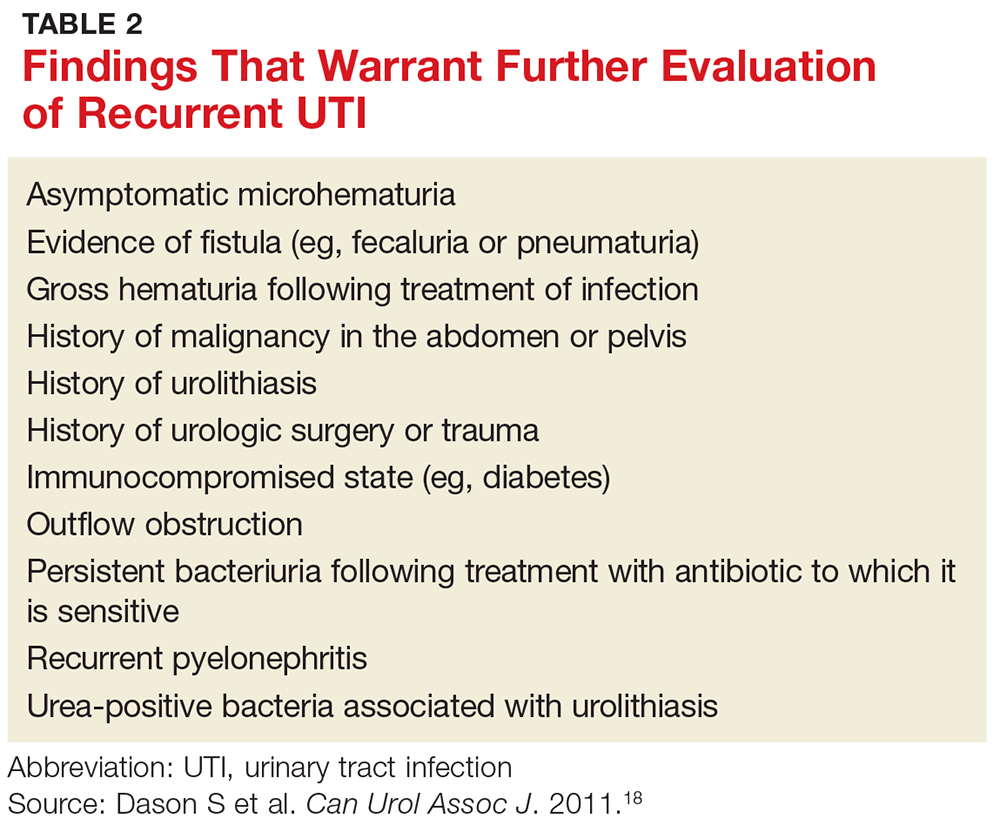
TREATMENT OPTIONS AND PRECAUTIONS
As with isolated UTI, E coli is the most common pathogen in recurrent UTI. However, recurrent UTI is more likely than isolated UTI to result from other pathogens (odds ratio [OR], 1.5), such as Klebsiella, Enterococcus, Proteus, and Citrobacter.23 Since a patient’s recurrent UTI most likely arises from the same pathogen that caused the prior infection, start an antibiotic you know is effective against it.8 Additionally, take into account local resistance rates; antibiotic availability, cost, and adverse effects; and a patient’s drug allergies.
Preferred antibiotics. Trimethoprim-sulfamethoxazole (TMP-SMX; 160 mg/800 mg bid for 3 d) has long been the mainstay of treatment for uncomplicated UTI. In recent years, however, resistance to TMP-SMX has increased. While it is still appropriate for many situations as firstline treatment, it is not recommended for empiric treatment if local resistance rates are higher than 20%.24 Nitrofurantoin (100 mg bid for 5 d) has efficacy similar to that of TMP-SMX but without significant bacterial resistance. While fosfomycin (3 g as a single dose) is still recommended as firstline treatment, it is less effective than either TMP-SMX or nitrofurantoin. Table 3 summarizes these antibiotic choices and their efficacies.24
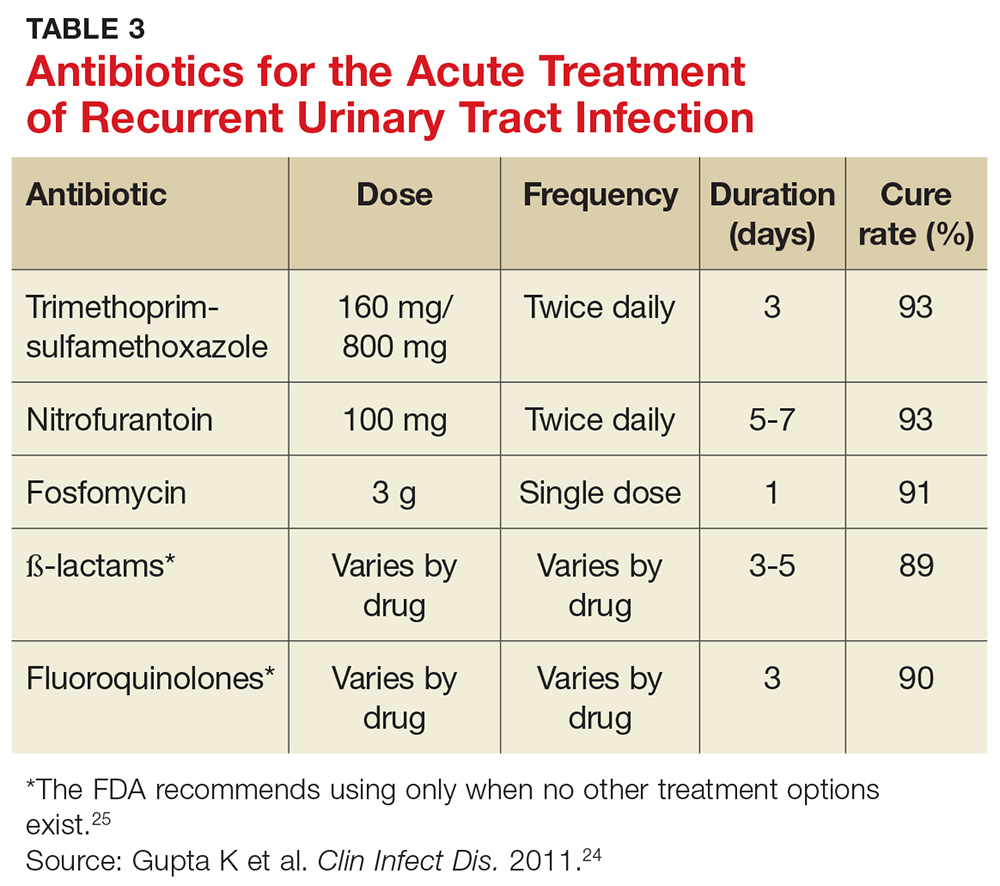
Agents to avoid or use only as a last resort. For patients who are unable to take any of the mentioned drugs, consider ß-lactam antibiotics—although they are typically less effective for this indication. While fluoroquinolones are very effective and have low (but rising) resistance rates, they are also associated with serious and potentially permanent adverse effects. As a result, on May 12, 2016, the FDA issued a Drug Safety Communication recommending that fluoroquinolones be used only in patients without other treatment options.24,25 Do not use ampicillin or amoxicillin, which lack effectiveness for this indication and are compromised by high levels of bacterial resistance.
Shorter course of treatment? When deciding on the length of treatment for recurrent UTI, remember that shorter antibiotic courses (3-5 d) are associated with similar rates of cure and progression to systemic infections as longer courses (7-10 d). Also, patients adhere better to the shorter treatment regimen and experience fewer adverse effects.26,27
Standing prescription? Studies have shown that women know when they have a UTI. Therefore, for those who experience recurrent UTI, consider giving them a standing prescription for antibiotics that they can initiate when symptoms arise (see Table 3).24 Patient-initiated treatment yields similar rates of efficacy as clinician-initiated treatment, while avoiding the adverse effects and costs associated with preventive strategies (see text).28
TIME FOR IMAGING AND REFERRAL?
For patients with a high risk for complicated UTI or a surgically amenable condition, either ultrasound or CT of the abdomen and pelvis with and without contrast is appropriate to evaluate for anatomic anomalies. While CT is the more sensitive imaging study to identify anomalies, ultrasound is less expensive and minimizes radiation exposure and is therefore also appropriate.18
Consider referring patients to a urologist if they have an underlying condition that may be amenable to surgery, such as bladder outlet obstruction, cystoceles, urinary tract diverticula, fistulae, pelvic floor dysfunction, ureteral stricture, urolithiasis, or vesicoureteral reflux.18 Additional risk factors for complicated UTI, which warrant referral as outlined by the Canadian Urologic Association, are summarized in Table 2.18
Two weeks later … and it’s back? Finally, for women who experience recurrent symptoms within two weeks of completing treatment, obtain a urine culture with antibiotic sensitivities to ensure that the infecting organism is not one typically associated with urolithiasis (Proteus and Yersinia) and that it is susceptible to planned antibiotic therapy.18Proteus and Yersinia are urease-positive bacteria that may cause stone formation in the urinary tract system. Evaluate any patient who has a UTI from either organism for urinary tract stones.
PREVENTION DOS AND DON’TS
Popular myth suggests that recurrent UTIs are more common in patients who do not void after intercourse or those who douche, consume caffeinated beverages, or wear noncotton underwear. Research, however, has failed to show a relationship between any of these factors and recurrent UTIs.13,18 Clinicians should therefore stop recommending that patients modify these behaviors to decrease recurrent infections.
Antibiotic prophylaxis decreases the rate of recurrent UTI by 95%.29 It has been recommended for women who have had two or more UTIs in the past six months or three or more UTIs in the past year. 29,30 Effective strategies to prevent recurrent UTI are low-dose continuous antibiotic prophylaxis or postcoital antibiotic prophylaxis.
While a test-of-cure culture is not typically recommended following treatment for uncomplicated UTI, you will want to obtain a confirmatory urine culture one to two weeks before starting low-dose antibiotic prophylaxis. Base your choice of antibiotic on known patient allergies and previous culture results. Agents typically used are trimethoprim, TMP-SMX, or nitrofurantoin (see Table 4), none of which demonstrated superiority in a Cochrane review.31-33 Although the same review showed no optimal duration of treatment, six to 24 months of treatment is usually recommended.29,33
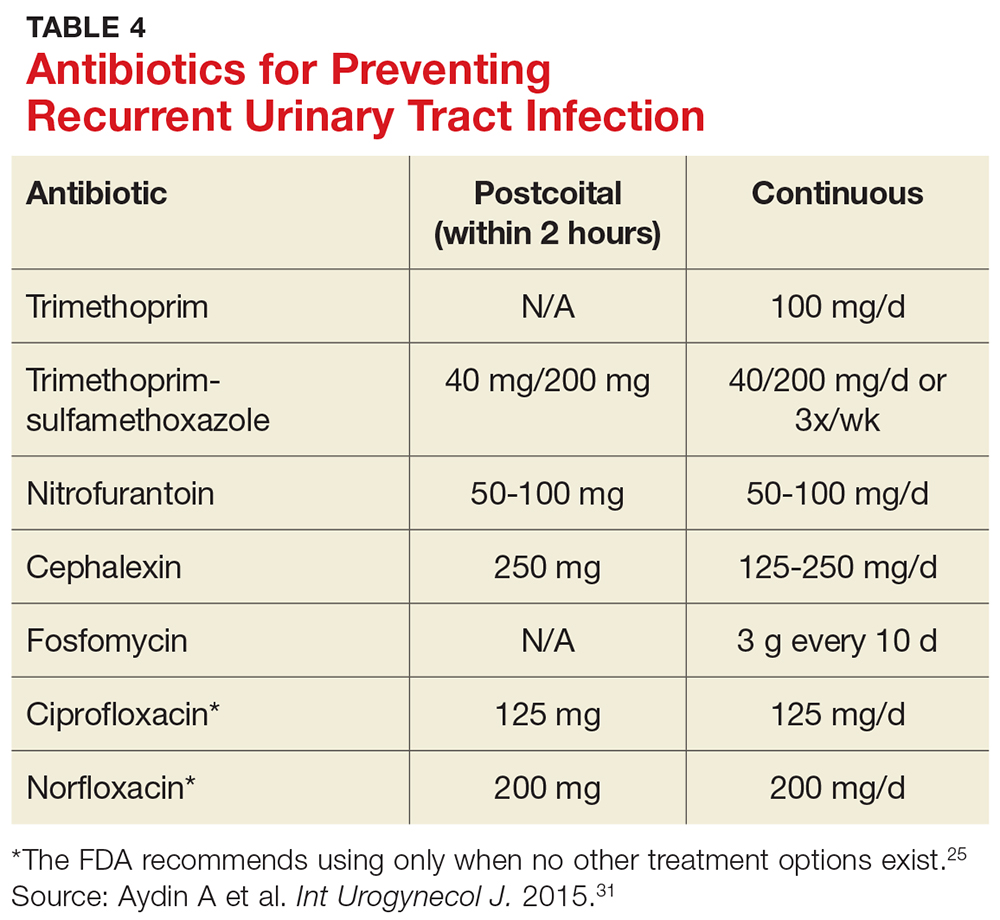
A single dose of antibiotic following intercourse may be as effective as daily low-dose prophylaxis for women whose UTIs are related to sexual activity.34 Studies have shown that single doses of TMP-SMX, nitrofurantoin, cephalexin, or a fluoroquinolone (see earlier notes about the FDA warning on fluoroquinolone use) are similarly effective in decreasing the rate of recurrence (see Table 4).31,35,36
Several nonpharmacologic strategies have been suggested for prevention of recurrent UTI. Among them are use of cranberry products, lactobacillus, vaginal estrogen in postmenopausal women, methenamine salts, and
A 2012 Cochrane review of 24 studies found that cranberry products were less effective in preventing recurrent UTIs than previously thought, with no statistically significant difference between women who took them and those who did not.37
Results have been mixed in using lactobacilli or probiotics to prevent recurrent UTIs. One study examining the use of lactobacilli to colonize the vaginal flora found a reduction in the number of recurrent infections in premenopausal women taking intravaginal lactobacillus over 12 months.38 A second study, involving postmenopausal women, found that those who were randomized to take lactobacillus tablets for 12 months had more frequent recurrences of UTIs than women randomized to take daily TMP-SMX.39 However, this last study was designed as a noninferiority trial, and its results do not negate the prior study’s findings. Additionally, vaginal estrogen, which is thought to work through colonization of the vagina with lactobacilli, has prevented recurrent UTIs in postmenopausal women.40
Ascorbic acid (which is bacteriostatic), methenamine salts (which are hydrolyzed to bactericidal ammonia and formaldehyde), and
As noted, the only behavioral modifications that have been shown to decrease the risk for recurrent UTI are discontinuing the use of spermicides/spermicide-coated condoms or oral contraceptives, and decreasing the frequency of intercourse.13
Joan is started on a three-day course of TMP-SMX. Further questioning reveals that each of her three UTIs followed sexual intercourse. Her clinician discusses the options of self-directed therapy using continuous prophylaxis or postcoital prophylaxis, either of which would be an appropriate evidence-based intervention for her. After engaging in shared decision-making, she is prescribed TMP-SMX to be taken as a single dose following intercourse in the future.
1. Nicolle LE. Epidemiology of urinary tract infections. Infect Med. 2001;18:153-162.
2. CDC. Annual number and percent distribution of ambulatory care visits by setting type according to diagnosis group: United States, 2009-2010. www.cdc.gov/nchs/data/ahcd/combined_tables/2009-2010_combined_web_table01.pdf. Accessed June 8, 2017.
3. Griebling TL. Urologic Diseases in America project: trends in resource use for urinary tract infections in women. J Urol. 2005;173:1281-1287.
4. Ikaheimo R, Siitonen A, Heiskanen T, et al. Recurrence of urinary tract infection in a primary care setting: analysis of a 1-year follow-up of 179 women. Clin Infect Dis. 1996;222:91-99.
5. Sammon JD, Sharma P, Rahbar H, et al. Predictors of admission in patients presenting to the emergency department with urinary tract infection. World J Urol. 2014;32:813-819.
6. Nicolle LE, Bradley S, Colgan R, et al. Infectious Diseases Society of America guidelines for the diagnosis and treatment of asymptomatic bacteriuria in adults. Clin Infect Dis. 2005;40:643-654.
7. Barber AE, Norton JP, Spivak AM, et al. Urinary tract infections: current and emerging management strategies. Clin Infect Dis. 2013;57:719-724.
8. Hooton TM. Clinical practice. Uncomplicated urinary tract infection. N Engl J Med. 2012;366:1028-1037.
9. American College of Obstetricians and Gynecologists. ACOG Practice Bulletin No. 91: treatment of urinary tract infections in nonpregnant women. Obstet Gynecol. 2008;111:785-794.
10. Sheinfeld J, Schaeffer AJ, Cordon-Cardo C, et al. Association of the Lewis blood group phenotype with recurrent urinary tract infections in women. N Engl J Med. 1989;320:773-777.
11. Foxman B, Gillespie B, Koopman J, et al. Risk factors for second urinary tract infection among college women. Am J Epidemiol. 2000;151:1194-1205.
12. Twaij M. Urinary tract infection in children: a review of its pathogenesis and risk factors. J R Soc Health. 2000;120:220-226.
13. Scholes D, Hooton TM, Roberts DL, et al. Risk factors for recurrent urinary tract infection in young women. J Infect Dis. 2000;182:1177-1182.
14. Hooton TM, Fennell CL, Clark AM, et al. Nonoxynol-9: differential antibacterial activity and enhancement of bacterial adherence to vaginal epithelial cells. J Infect Dis. 1991; 164: 1216-1219.
15. Hooton TM, Scholes D, Hughes JP, et al. A prospective study of risk factors for symptomatic urinary tract infection in young women. N Engl J Med. 1996;335:468-474.
16. Hooton TM, Hillier S, Johnson C, et al. Escherichia coli bacteriuria and contraceptive method. JAMA. 1991;265:64-69.
17. Foxman B, Marsh J, Gillespie B, et al. Condom use and first-time urinary tract infection. Epidemiology. 1997;8:637-641.
18. Dason S, Dason JT, Kapoor A. Guidelines for the diagnosis and management of recurrent urinary tract infection in women. Can Urol Assoc J. 2011;5:316-322.
19. Hooton TM. Pathogenesis of urinary tract infections: an update. J Antimicrob Chemother. 2000;46(suppl 1):1-7.
20. Raz R, Gennesin Y, Wasser J, et al. Recurrent urinary tract infections in postmenopausal women. Clin Infect Dis. 2000; 30:152-156.
21. Gupta K, Stapleton AE, Hooton TM, et al. Inverse association of H2O2-producing lactobacilli and vaginal Escherichia coli in women with recurrent urinary tract infections. J Infect Dis. 1998;178:446-450.
22. Neal DE. Complicated urinary tract infections. Urol Clin North Am. 2008;35:13-22.
23. Amna MA, Chazan B, Raz R, et al. Risk factors for non-Escherichia coli community-acquired bacteriuria. Infection. 2013;41:473-477.
24. Gupta K, Hooton TM, Naber KG, et al. International clinical practice guidelines for the treatment of acute uncomplicated cystitis and pyelonephritis in women: a 2010 update by the Infectious Diseases Society of America and the European Society for Microbiology and Infectious Diseases. Clin Infect Dis. 2011;52:e103-e120.
25. FDA. FDA drug safety communication. www.fda.gov/downloads/Drugs/DrugSafety/UCM500591.pdf. Accessed June 8, 2017.
26. Katchman EA, Milo G, Paul M, et al. Three-day vs longer duration of antibiotic treatment for cystitis in women: systematic review and meta-analysis. Am J Med. 2005;118:1196-1207.
27. Milo G, Katchman EA, Paul M, et al. Duration of antibacterial treatment for uncomplicated urinary tract infection in women. Cochrane Database Syst Rev. 2005;(2):CD004682.
28. Gupta K, Hooton TM, Roberts PL, et al. Patient-initiated treatment of uncomplicated recurrent urinary tract infections in young women. Ann Intern Med. 2001;135:9-16.
29. Nicolle LE, Ronald AR. Recurrent urinary tract infection in adult women: diagnosis and treatment. Infect Dis Clin North Am. 1987;1:793-806.
30. Ronald AR, Conway B. An approach to urinary tract infections in ambulatory women. Curr Clin Top Infect Dis. 1988; 9:76-125.
31. Aydin A, Ahmed K, Zaman I, et al. Recurrent urinary tract infections in women. Int Urogynecol J. 2015;26:795-804.
32. McLaughlin SP, Carson CC. Urinary tract infections in women. Med Clin North Am. 2004;88:417-429.
33. Albert X, Huertas I, Pereiro II, et al. Antibiotics for preventing recurrent urinary tract infection in non-pregnant women. Cochrane Database Syst Rev. 2004;(3):CD001209.
34. Melekos MD, Asbach HW, Gerharz E, et al. Post-intercourse versus daily ciprofloxacin prophylaxis for recurrent urinary tract infections in premenopausal women. J Urol. 1997;157: 935-939.
35. Chew LD, Fihn SD. Recurrent cystitis in nonpregnant women. West J Med. 1999;170:274-277.
36. Stapleton A, Latham RH, Johnson C, et al. Postcoital antimicrobial prophylaxis for recurrent urinary tract infection: A randomized, double-blind, placebo-controlled trial. JAMA. 1990;264:703-706.
37. Jepson RG, Williams G, Craig JC. Cranberries for preventing urinary tract infections. Cochrane Database Syst Rev. 2012; (10):CD001321.
38. Stapleton AE, Au-Yeung M, Hooton TM, et al. Randomized, placebo-controlled phase 2 trial of a Lactobacillus crispatus probiotic given intravaginally for prevention of recurrent urinary tract infection. Clin Infect Dis. 2011;52:1212-1217.
39. Beerepoot MA, ter Riet G, Nys S, et al. Lactobacilli vs antibiotics to prevent urinary tract infections: a randomized, double-blind, noninferiority trial in postmenopausal women. Arch Intern Med. 2012;172:704-712.
40. Perrotta C, Aznar M, Mejia R, et al. Oestrogens for preventing recurrent urinary tract infection in postmenopausal women. Cochrane Database Syst Rev. 2008;(2):CD005131.
41. Foxman B, Chi JW. Health behavior and urinary tract infection in college-aged women. J Clin Epidemiol. 1990;43:329-337.
42. Lee BB, Simpson JM, Craig JC, et al. Methenamine hippurate for preventing urinary tract infections. Cochrane Database Syst Rev. 2007;(4):CD003265.
43. Krancˇec B, Papeš D, Altarac S. D-mannose powder for prophylaxis of recurrent urinary tract infections in women: a randomized clinical trial. World J Urol. 2014;32:79-84.
For the third time in nine months, Joan, 28, presents with complaints of painful, frequent, and urgent urination. Joan is sexually active; her medical history is otherwise unremarkable. In each of the previous two episodes, her urine culture grew Escherichia coli, and she was treated with a five-day course of nitrofurantoin. Now, she asks about the need for additional workup and treatment, as well as whether there is a way to prevent further infections.
Urinary tract infections (UTIs) are the most common bacterial infection in women and account for an estimated 5.4 million primary care office visits and 2.3 million emergency department visits annually.1,2 For women, the lifetime risk for a UTI is greater than 50%.3 In one study of UTI in a primary care setting, 36% of women younger than 55 and 53% of women older than 55 had a recurrent infection within a year.4 Most women with UTI are treated as outpatients, but 16.7% require hospitalization.5 In the United States, direct costs for evaluation and treatment of UTI total $1.6 billion each year.5
Accurately characterizing recurrent UTI
Bacteriuria is defined as the presence of 100,000 colony-forming units (ie, viable bacteria) per milliliter of urine collected midstream on two consecutive urinations.6 UTIs are symptomatic infections of the urinary tract and may involve the urethra, bladder, ureters, or kidneys.7 Infections of the lower tract (bladder and urethra) are commonly referred to as cystitis; infections of the upper tract (kidney and ureters) are referred to as pyelonephritis.
Most UTIs are uncomplicated and do not progress to more serious infections. However, patients who are pregnant or who have chronic medical conditions (eg, renal insufficiency or use of immunosuppressant medications), urinary obstruction, or calculi may develop complicated UTIs.8
Recurrent UTI is an infection that follows resolution of bacteriuria and symptoms of a prior UTI; the term applies when such an infection occurs within six months of the previous UTI or when three or more UTIs occur within a year.7 Recurrent infection can be further characterized as relapse or reinfection. Relapse occurs when the patient has a second UTI caused by the same pathogen within two weeks of the original treatment.9 Reinfection is a UTI that occurs more than two weeks after completion of treatment for the original UTI. The pathogen in a reinfection may be the same one that caused the original UTI or it may be a different agent.9
It’s also important to differentiate between recurrent and resistant UTI. In resistant UTI, bacteriuria fails to resolve following seven to 14 days of appropriate antibiotic treatment.9
FACTORS THAT INCREASE RISK FOR RECURRENT UTI
Premenopausal women
Both modifiable and nonmodifiable factors (see Table 1) have been associated with increased risk for recurrent UTI in premenopausal women.10-21 Among those with specific blood group phenotypes (Lewis non-secretor, in particular), rates of UTI rise secondary to increased adherence of bacteria to epithelial cells in the urinary tract.10 Other nonmodifiable risk factors include congenital urinary tract anomalies, obstruction of the urinary tract, and a history of UTI.11,12 Women whose mothers had UTIs are at higher risk for recurrent UTI than are those whose mothers had no such history.13
Modifiable risk factors for recurrent UTI include contraceptive use (spermicides, spermicide-coated condoms, and oral contraceptives) and frequency of intercourse (≥ 4 times/month).13 Spermicides alter the normal vaginal flora and lead to increased colonization of E coli, which increases the risk for UTI.14 Women with recurrent UTIs were 1.27 to 1.45 times more likely to use oral contraceptives than those without recurrent UTIs.13 Compared with college women who had not had intercourse, sexually active college women who had engaged in intercourse three times in a week had a 2.6-fold increase in relative risk for UTI.15 Those who had daily intercourse had a 9-fold increase in relative risk for UTI.15This elevated risk is due to trauma to the lower urogenital tract (urethra) and introduction of bacteria into the urethra via mechanical factors.16,17
Postmenopausal women
Atrophic vaginitis, catheterization, declining functional status, cystocele, incomplete emptying, incontinence, and history of premenopausal UTIs are all risk factors for recurrent UTI in postmenopausal women.19,20 Decreased estrogen and resulting vaginal atrophy appear to be associated with increased rates of UTI in these women. Additionally, postmenopausal women’s vaginas are more likely to be colonized with E coli and have fewer lactobacilli than those of premenopausal women, which is thought to predispose them to UTI.21 These risk factors are summarized in Table 1.10-21
INITIAL EVALUATION OF RECURRENT UTI
Patients with recurrent UTI experience signs and symptoms similar to those with isolated uncomplicated UTI: dysuria, frequency, urgency, and hematuria. Focus your history interview on potential causes of complicated UTI (see Table 2).18 Likewise, perform a pelvic exam to evaluate for predisposing anatomic abnormalities.22 Finally, obtain a urine culture with antibiotic sensitivities to ensure that previous treatment was appropriate and to rule out microbes associated with infected uroliths.18 Given the low probability of finding abnormalities on cystoscopy or imaging, neither one is routinely recommended for the evaluation of recurrent UTI.18
TREATMENT OPTIONS AND PRECAUTIONS
As with isolated UTI, E coli is the most common pathogen in recurrent UTI. However, recurrent UTI is more likely than isolated UTI to result from other pathogens (odds ratio [OR], 1.5), such as Klebsiella, Enterococcus, Proteus, and Citrobacter.23 Since a patient’s recurrent UTI most likely arises from the same pathogen that caused the prior infection, start an antibiotic you know is effective against it.8 Additionally, take into account local resistance rates; antibiotic availability, cost, and adverse effects; and a patient’s drug allergies.
Preferred antibiotics. Trimethoprim-sulfamethoxazole (TMP-SMX; 160 mg/800 mg bid for 3 d) has long been the mainstay of treatment for uncomplicated UTI. In recent years, however, resistance to TMP-SMX has increased. While it is still appropriate for many situations as firstline treatment, it is not recommended for empiric treatment if local resistance rates are higher than 20%.24 Nitrofurantoin (100 mg bid for 5 d) has efficacy similar to that of TMP-SMX but without significant bacterial resistance. While fosfomycin (3 g as a single dose) is still recommended as firstline treatment, it is less effective than either TMP-SMX or nitrofurantoin. Table 3 summarizes these antibiotic choices and their efficacies.24
Agents to avoid or use only as a last resort. For patients who are unable to take any of the mentioned drugs, consider ß-lactam antibiotics—although they are typically less effective for this indication. While fluoroquinolones are very effective and have low (but rising) resistance rates, they are also associated with serious and potentially permanent adverse effects. As a result, on May 12, 2016, the FDA issued a Drug Safety Communication recommending that fluoroquinolones be used only in patients without other treatment options.24,25 Do not use ampicillin or amoxicillin, which lack effectiveness for this indication and are compromised by high levels of bacterial resistance.
Shorter course of treatment? When deciding on the length of treatment for recurrent UTI, remember that shorter antibiotic courses (3-5 d) are associated with similar rates of cure and progression to systemic infections as longer courses (7-10 d). Also, patients adhere better to the shorter treatment regimen and experience fewer adverse effects.26,27
Standing prescription? Studies have shown that women know when they have a UTI. Therefore, for those who experience recurrent UTI, consider giving them a standing prescription for antibiotics that they can initiate when symptoms arise (see Table 3).24 Patient-initiated treatment yields similar rates of efficacy as clinician-initiated treatment, while avoiding the adverse effects and costs associated with preventive strategies (see text).28
TIME FOR IMAGING AND REFERRAL?
For patients with a high risk for complicated UTI or a surgically amenable condition, either ultrasound or CT of the abdomen and pelvis with and without contrast is appropriate to evaluate for anatomic anomalies. While CT is the more sensitive imaging study to identify anomalies, ultrasound is less expensive and minimizes radiation exposure and is therefore also appropriate.18
Consider referring patients to a urologist if they have an underlying condition that may be amenable to surgery, such as bladder outlet obstruction, cystoceles, urinary tract diverticula, fistulae, pelvic floor dysfunction, ureteral stricture, urolithiasis, or vesicoureteral reflux.18 Additional risk factors for complicated UTI, which warrant referral as outlined by the Canadian Urologic Association, are summarized in Table 2.18
Two weeks later … and it’s back? Finally, for women who experience recurrent symptoms within two weeks of completing treatment, obtain a urine culture with antibiotic sensitivities to ensure that the infecting organism is not one typically associated with urolithiasis (Proteus and Yersinia) and that it is susceptible to planned antibiotic therapy.18Proteus and Yersinia are urease-positive bacteria that may cause stone formation in the urinary tract system. Evaluate any patient who has a UTI from either organism for urinary tract stones.
PREVENTION DOS AND DON’TS
Popular myth suggests that recurrent UTIs are more common in patients who do not void after intercourse or those who douche, consume caffeinated beverages, or wear noncotton underwear. Research, however, has failed to show a relationship between any of these factors and recurrent UTIs.13,18 Clinicians should therefore stop recommending that patients modify these behaviors to decrease recurrent infections.
Antibiotic prophylaxis decreases the rate of recurrent UTI by 95%.29 It has been recommended for women who have had two or more UTIs in the past six months or three or more UTIs in the past year. 29,30 Effective strategies to prevent recurrent UTI are low-dose continuous antibiotic prophylaxis or postcoital antibiotic prophylaxis.
While a test-of-cure culture is not typically recommended following treatment for uncomplicated UTI, you will want to obtain a confirmatory urine culture one to two weeks before starting low-dose antibiotic prophylaxis. Base your choice of antibiotic on known patient allergies and previous culture results. Agents typically used are trimethoprim, TMP-SMX, or nitrofurantoin (see Table 4), none of which demonstrated superiority in a Cochrane review.31-33 Although the same review showed no optimal duration of treatment, six to 24 months of treatment is usually recommended.29,33
A single dose of antibiotic following intercourse may be as effective as daily low-dose prophylaxis for women whose UTIs are related to sexual activity.34 Studies have shown that single doses of TMP-SMX, nitrofurantoin, cephalexin, or a fluoroquinolone (see earlier notes about the FDA warning on fluoroquinolone use) are similarly effective in decreasing the rate of recurrence (see Table 4).31,35,36
Several nonpharmacologic strategies have been suggested for prevention of recurrent UTI. Among them are use of cranberry products, lactobacillus, vaginal estrogen in postmenopausal women, methenamine salts, and
A 2012 Cochrane review of 24 studies found that cranberry products were less effective in preventing recurrent UTIs than previously thought, with no statistically significant difference between women who took them and those who did not.37
Results have been mixed in using lactobacilli or probiotics to prevent recurrent UTIs. One study examining the use of lactobacilli to colonize the vaginal flora found a reduction in the number of recurrent infections in premenopausal women taking intravaginal lactobacillus over 12 months.38 A second study, involving postmenopausal women, found that those who were randomized to take lactobacillus tablets for 12 months had more frequent recurrences of UTIs than women randomized to take daily TMP-SMX.39 However, this last study was designed as a noninferiority trial, and its results do not negate the prior study’s findings. Additionally, vaginal estrogen, which is thought to work through colonization of the vagina with lactobacilli, has prevented recurrent UTIs in postmenopausal women.40
Ascorbic acid (which is bacteriostatic), methenamine salts (which are hydrolyzed to bactericidal ammonia and formaldehyde), and
As noted, the only behavioral modifications that have been shown to decrease the risk for recurrent UTI are discontinuing the use of spermicides/spermicide-coated condoms or oral contraceptives, and decreasing the frequency of intercourse.13
Joan is started on a three-day course of TMP-SMX. Further questioning reveals that each of her three UTIs followed sexual intercourse. Her clinician discusses the options of self-directed therapy using continuous prophylaxis or postcoital prophylaxis, either of which would be an appropriate evidence-based intervention for her. After engaging in shared decision-making, she is prescribed TMP-SMX to be taken as a single dose following intercourse in the future.
1. Nicolle LE. Epidemiology of urinary tract infections. Infect Med. 2001;18:153-162.
2. CDC. Annual number and percent distribution of ambulatory care visits by setting type according to diagnosis group: United States, 2009-2010. www.cdc.gov/nchs/data/ahcd/combined_tables/2009-2010_combined_web_table01.pdf. Accessed June 8, 2017.
3. Griebling TL. Urologic Diseases in America project: trends in resource use for urinary tract infections in women. J Urol. 2005;173:1281-1287.
4. Ikaheimo R, Siitonen A, Heiskanen T, et al. Recurrence of urinary tract infection in a primary care setting: analysis of a 1-year follow-up of 179 women. Clin Infect Dis. 1996;222:91-99.
5. Sammon JD, Sharma P, Rahbar H, et al. Predictors of admission in patients presenting to the emergency department with urinary tract infection. World J Urol. 2014;32:813-819.
6. Nicolle LE, Bradley S, Colgan R, et al. Infectious Diseases Society of America guidelines for the diagnosis and treatment of asymptomatic bacteriuria in adults. Clin Infect Dis. 2005;40:643-654.
7. Barber AE, Norton JP, Spivak AM, et al. Urinary tract infections: current and emerging management strategies. Clin Infect Dis. 2013;57:719-724.
8. Hooton TM. Clinical practice. Uncomplicated urinary tract infection. N Engl J Med. 2012;366:1028-1037.
9. American College of Obstetricians and Gynecologists. ACOG Practice Bulletin No. 91: treatment of urinary tract infections in nonpregnant women. Obstet Gynecol. 2008;111:785-794.
10. Sheinfeld J, Schaeffer AJ, Cordon-Cardo C, et al. Association of the Lewis blood group phenotype with recurrent urinary tract infections in women. N Engl J Med. 1989;320:773-777.
11. Foxman B, Gillespie B, Koopman J, et al. Risk factors for second urinary tract infection among college women. Am J Epidemiol. 2000;151:1194-1205.
12. Twaij M. Urinary tract infection in children: a review of its pathogenesis and risk factors. J R Soc Health. 2000;120:220-226.
13. Scholes D, Hooton TM, Roberts DL, et al. Risk factors for recurrent urinary tract infection in young women. J Infect Dis. 2000;182:1177-1182.
14. Hooton TM, Fennell CL, Clark AM, et al. Nonoxynol-9: differential antibacterial activity and enhancement of bacterial adherence to vaginal epithelial cells. J Infect Dis. 1991; 164: 1216-1219.
15. Hooton TM, Scholes D, Hughes JP, et al. A prospective study of risk factors for symptomatic urinary tract infection in young women. N Engl J Med. 1996;335:468-474.
16. Hooton TM, Hillier S, Johnson C, et al. Escherichia coli bacteriuria and contraceptive method. JAMA. 1991;265:64-69.
17. Foxman B, Marsh J, Gillespie B, et al. Condom use and first-time urinary tract infection. Epidemiology. 1997;8:637-641.
18. Dason S, Dason JT, Kapoor A. Guidelines for the diagnosis and management of recurrent urinary tract infection in women. Can Urol Assoc J. 2011;5:316-322.
19. Hooton TM. Pathogenesis of urinary tract infections: an update. J Antimicrob Chemother. 2000;46(suppl 1):1-7.
20. Raz R, Gennesin Y, Wasser J, et al. Recurrent urinary tract infections in postmenopausal women. Clin Infect Dis. 2000; 30:152-156.
21. Gupta K, Stapleton AE, Hooton TM, et al. Inverse association of H2O2-producing lactobacilli and vaginal Escherichia coli in women with recurrent urinary tract infections. J Infect Dis. 1998;178:446-450.
22. Neal DE. Complicated urinary tract infections. Urol Clin North Am. 2008;35:13-22.
23. Amna MA, Chazan B, Raz R, et al. Risk factors for non-Escherichia coli community-acquired bacteriuria. Infection. 2013;41:473-477.
24. Gupta K, Hooton TM, Naber KG, et al. International clinical practice guidelines for the treatment of acute uncomplicated cystitis and pyelonephritis in women: a 2010 update by the Infectious Diseases Society of America and the European Society for Microbiology and Infectious Diseases. Clin Infect Dis. 2011;52:e103-e120.
25. FDA. FDA drug safety communication. www.fda.gov/downloads/Drugs/DrugSafety/UCM500591.pdf. Accessed June 8, 2017.
26. Katchman EA, Milo G, Paul M, et al. Three-day vs longer duration of antibiotic treatment for cystitis in women: systematic review and meta-analysis. Am J Med. 2005;118:1196-1207.
27. Milo G, Katchman EA, Paul M, et al. Duration of antibacterial treatment for uncomplicated urinary tract infection in women. Cochrane Database Syst Rev. 2005;(2):CD004682.
28. Gupta K, Hooton TM, Roberts PL, et al. Patient-initiated treatment of uncomplicated recurrent urinary tract infections in young women. Ann Intern Med. 2001;135:9-16.
29. Nicolle LE, Ronald AR. Recurrent urinary tract infection in adult women: diagnosis and treatment. Infect Dis Clin North Am. 1987;1:793-806.
30. Ronald AR, Conway B. An approach to urinary tract infections in ambulatory women. Curr Clin Top Infect Dis. 1988; 9:76-125.
31. Aydin A, Ahmed K, Zaman I, et al. Recurrent urinary tract infections in women. Int Urogynecol J. 2015;26:795-804.
32. McLaughlin SP, Carson CC. Urinary tract infections in women. Med Clin North Am. 2004;88:417-429.
33. Albert X, Huertas I, Pereiro II, et al. Antibiotics for preventing recurrent urinary tract infection in non-pregnant women. Cochrane Database Syst Rev. 2004;(3):CD001209.
34. Melekos MD, Asbach HW, Gerharz E, et al. Post-intercourse versus daily ciprofloxacin prophylaxis for recurrent urinary tract infections in premenopausal women. J Urol. 1997;157: 935-939.
35. Chew LD, Fihn SD. Recurrent cystitis in nonpregnant women. West J Med. 1999;170:274-277.
36. Stapleton A, Latham RH, Johnson C, et al. Postcoital antimicrobial prophylaxis for recurrent urinary tract infection: A randomized, double-blind, placebo-controlled trial. JAMA. 1990;264:703-706.
37. Jepson RG, Williams G, Craig JC. Cranberries for preventing urinary tract infections. Cochrane Database Syst Rev. 2012; (10):CD001321.
38. Stapleton AE, Au-Yeung M, Hooton TM, et al. Randomized, placebo-controlled phase 2 trial of a Lactobacillus crispatus probiotic given intravaginally for prevention of recurrent urinary tract infection. Clin Infect Dis. 2011;52:1212-1217.
39. Beerepoot MA, ter Riet G, Nys S, et al. Lactobacilli vs antibiotics to prevent urinary tract infections: a randomized, double-blind, noninferiority trial in postmenopausal women. Arch Intern Med. 2012;172:704-712.
40. Perrotta C, Aznar M, Mejia R, et al. Oestrogens for preventing recurrent urinary tract infection in postmenopausal women. Cochrane Database Syst Rev. 2008;(2):CD005131.
41. Foxman B, Chi JW. Health behavior and urinary tract infection in college-aged women. J Clin Epidemiol. 1990;43:329-337.
42. Lee BB, Simpson JM, Craig JC, et al. Methenamine hippurate for preventing urinary tract infections. Cochrane Database Syst Rev. 2007;(4):CD003265.
43. Krancˇec B, Papeš D, Altarac S. D-mannose powder for prophylaxis of recurrent urinary tract infections in women: a randomized clinical trial. World J Urol. 2014;32:79-84.
Menopause in HIV-Infected Women
From the University of Maryland School of Medicine, Baltimore, MD.
Abstract
- Objective: To review the current literature on menopause in HIV-infected women.
- Methods: We searched PubMed for articles published in English using the search terms HIV and menopause, HIV and amenorrhea, HIV and menopause symptoms, HIV and vasomotor symptoms, HIV and vaginal dryness, HIV and dyspareunia, HIV and menopause and cardiovascular disease, HIV and menopause and osteoporosis, HIV and menopause and cognition, HIV and menopause and cervical dysplasia, menopause and HIV transmission, and menopause and HIV progression. Major studies on menopause in other populations were also reviewed to provide background data.
- Results: While studies on the age of menopause in HIV-infected women give conflicting results, immuno-suppression associated with HIV appears to contribute to an earlier onset of menopause. HIV-infected women experience menopausal symptoms, especially vasomotor symptoms, earlier and in greater intensity. In addition, menopause and HIV infection have additive effects on one another, further increasing the disease risks of cardiovascular disease, osteoporosis, and progression of cervical dysplasia. The effects of menopause on HIV infection itself seems limited. While some data suggest an increased risk of acquisition in non–HIV-infected menopausal women, menopause has no effect on the transmission or progression of HIV in menopausal HIV-infected women.
- Conclusion: As HIV-infected individuals live longer, practitioners will encounter an increasing number of women entering menopause and living into their postmenopausal years. Future studies on the age of menopause, symptoms of menopause, and the effects of menopause on long term comorbidities such as cognitive decline, cardiovascular disease, and bone density loss are necessary to improve care of this expanding population of women living with HIV.
Since the introduction of highly active antiretroviral therapy (HAART) in 1996, there has been a significant decrease in morbidity and mortality worldwide among individuals living with human immunodeficiency virus (HIV) [1]. It is projected that by the year 2020, half of persons living with HIV infection in the United States will be over the age of 50 years [2]. For HIV-infected women, this longer survival translates into an increased number of women entering into menopause and living well beyond menopause. Enhancing our knowledge about menopause in HIV-infected women is important since the physiologic changes associated with menopause impact short- and long-term quality of life and mortality. Symptoms associated with menopause can be mistaken for symptoms suggestive of infections, cancers, and drug toxicity. Furthermore, changes in cognition, body composition, lipids, glucose metabolism, and bone mass are influential factors determining morbidity and mortality in later years.
Effect of HIV on the Menstrual Cycle
Menstrual irregularities, including amenorrhea and anovulation, are more frequently found in women of low socioeconomic class who experience more social and physical stress like poverty and physical illnesses [3]. In addition, women with low body mass index (BMI) have decreased serum estradiol levels which lead to amenorrhea [3,4]. Furthermore, several studies have demonstrated that methadone, heroin, and morphine use are associated with amenorrhea. Opiate use inhibits the central neural reproductive drive leading to amenorrhea even in the absence of menopause [5–7].
As these demographics, body habitus, and lifestyle characteristics are frequently found among HIV-infected women, it is not surprising that amenorrhea and anovulation are common in this population [8–14]. In fact, studies show that there is an increased prevalence of amenorrhea and anovulation among HIV-infected women when compared to non–HIV-infected women [8]. Some studies suggest that women with lower CD4 cell counts and higher viral loads have increased frequency of amenorrhea and irregular menstruation compared to those with higher CD4 cell counts and lower viral loads [9,10]. However, it remains unclear if HIV infection itself, instead of the associated social and medical factors, is responsible for the higher frequency of amenorrhea [11–13]. For example, in a prospective study comparing 802 HIV-infected women with 273 non–HIV-infected women, there was no difference in the prevalence of amenorrhea when controlling for BMI, substance use, and age [13].
The World Health Organization (WHO) currently defines natural menopause as the permanent cessation of menstruation for 12 consecutive months without any obvious pathological or physiologic causes [15]. However, given the increased prevalence of amenorrhea in HIV-infected women, amenorrhea seen with HIV infection can be mistaken for menopause. The Women’s Interagency HIV Study (WIHS), a multicenter, observational study of HIV-infected women and non–HIV-infected women of similar socioeconomic status, found that more than half of HIV-infected women with prolonged amenorrhea of at least 1 year had serum follicle-stimulating hormone (FSH) levels in the premenopausal range of less than 25 mIU/mL [16]. Hence, this implies that some of these women may have had prolonged amenorrhea rather than menopause [17]. The traditional definition of menopause may need to be altered in this population.
Age at Menopause
Natural menopause, retrospectively determined by the cessation of menstrual cycles for 12 consecutive months, is a reflection of complete, or near complete, ovarian follicular depletion with subsequent low estrogen levels and high FSH concentrations [18]. In the United States, studies have found the mean age of menopause to be between 50 to 52 years old [19,20]. These studies, however, focused predominantly on menopause in middle class, white women. Early menopause, defined as the permanent cessation of menstruation between 40 to 45 years of age, affects 5% of the women in the United States, while premature menopause or primary ovarian insufficiency, which occurs at younger than 40 years of age, affects 1% of the women [21].
As earlier menopause is associated with increased risks of diabetes [22], cardiovascular disease [23], stroke [24], and osteoporosis [25], identifying the mean age of menopause is important in the management of HIV-infected women. Among women in the United States, early menopause has been observed in women who are African American, nulliparous, have lower BMI, smoke tobacco, and have more stress, less education, and more unemployment [26–29]. Unhealthy lifestyles can also contribute to an earlier age of menopause. Smoking is one of the most consistent and modifiable risk factors associated with an earlier onset of natural menopause, accelerating menopause by up to 2 years [26,30]. Substances present in cigarettes are associated with irreversible damage of ovarian follicles and impaired liver estrogen metabolism [30]. Cocaine use has also been associated with lower estradiol levels, suggesting possible ovary-toxic effects [7,31].
Many of these characteristics and unhealthy lifestyles are prevalent among HIV-infected women. Prevalence of current smoking among HIV-infected persons is found to be approximately 42% [32] in comparison with the 19% seen in the general population in the United States [33]. Specifically, among women participating in WIHS, 56% of the women were found to be current smokers with an additional 16% of the women found to be prior smokers [34]. In addition, African Americans account for the highest proportion of new HIV infections in the United States with an estimated 64% of all new HIV infections in women found to be in African Americans [35]. Furthermore, HIV-infected women are of lower socioeconomic status, with increased prevalence of substance use than that typically found in women enrolled in studies on the age of menopause [36]. Hence, when examining the influence of HIV on the age of menopause, one needs to have a comparator of non–HIV-infected group with similar characteristics. Studies without comparison groups have reported the median age of menopause in HIV-infected women to be between 47 and 50 years old [37–42].
There are only few studies that have focused on the age of menopause in HIV-infected women with a similar comparative non–HIV-infected group.Cejtin et al studied the age of menopause in women enrolled in the WIHS [43]. HIV-infected women partaking in the WIHS were primarily African American and of lower socioeconomic status with heterosexual transmission rather than injection drug use as the major HIV risk factor [44]. They found no significant difference in the median age of menopause when HIV-infected women were compared to non–HIV-infected women. Median age of menopause was 47.7 years in HIV-infected women and 48.0 years in non–HIV-infected women [43].
In contrast, in the Ms Study, a prospective cohort comparing 302 HIV-infected with 259 non-HIV-infected women, HIV-infected women were 73% more likely to experience early menopause than non-HIV-infected women [45]. Similar to the WIHS, there was a high prevalence of African Americans but unlike the WIHS the majority of participants had used heroin or cocaine within the past 5 years. The high prevalence of drug use and current or former cigarette use in the Ms Study likely contributed to the relatively early onset of menopause. Furthermore, the WIHS and Ms Study used different definition of menopause. The WIHS defined menopause as 6 consecutive months of amenorrhea with an FSH level greater than 25 mIU/mL while the Ms Study defined menopause as the cessation of menstrual period for 12 consecutive months [43,45]. Given the fact that 52% of the women in the Ms Study had high-risk behaviors associated with amenorrhea and that menopause was defined as 12 months of amenorrhea without corresponding FSH levels, it is possible that the Ms Study included many women with amenorrhea who had not yet reached menopause. On the other hand, although the 6 months’ duration of amenorrhea used in the WIHS to define menopause had the potential to include women who only had amenorrhea without menopause, the use of FSH levels to define menopause most likely eliminated women who only had amenorrhea.
HIV-infected women have several factors associated with early menopause which are similar to that in the general population, including African American race, injection drug use, cigarette smoking, and menarche before age of 11 [37,41]. In addition, multiple studies have shown that a key factor associated with early age of menopause among HIV-infected women is the degree of immunosuppression [37,41,45]. The Ms Study found that women with CD4 cell counts < 200 cells/mm3 had an increased risk ofamenorrhea lasting at least 12 months when compared to women with CD4 cell counts ≥ 200 cells/mm3. The median age of menopause was 42.5 years in women with CD4 cell counts < 200 cells/mm3, 46.0 years in women with CD4 cell counts between 200 cells/mm3 and 500 cells/mm3, and 46.5 years in women with CD4 cell counts > 500 cells/mm3 [45]. Similarly, in a cohort of 667 Brazilian HIV-infected women, among whom 160 women were postmenopausal, Calvet et al found 33% of women with CD4 cell counts < 50 cells/mm3 to have premature menopause, compared to 8% of women with CD4 cell counts ≥ 350 cells/mm3 [41]. De Pommerol et al studied 404 HIV-infected women among whom 69 were found to be postmenopausal. They found that women with CD4 cell counts < 200 cells/mm3 were more likely to have premature menopause compared to women with CD4 cell counts ≥ 350 cells/mm3 [37].
Besides the degree of immunosuppression, another factor contributing to early menopause unique to HIV-infected women is chronic hepatitis C infection [41].
Menopause-Associated Symptoms
The perimenopausal period, which begins on average 4 years prior to the final menstrual period, is characterized by hormonal fluctuations leading to irregular menstrual cycles. Symptoms associated with these physiologic changes during the perimenopausal period include vasomotor symptoms (hot flashes), genitourinary symptoms (vaginal dryness and dyspareunia), anxiety, depression, sleep disturbances, and joint aches [46–53]. Such menopausal symptoms can be distressing, negatively impacting quality of life [54].
It can be difficult to determine which symptoms are caused by the physiologic changes of menopause in HIV-infected women as they have multiple potential reasons for these symptoms, such as antiretroviral therapy, comorbidities, and HIV infection itself [55]. However, several studies clearly show that there are symptoms that occur more commonly in the perimenopausal period and that HIV-infected women experience these symptoms earlier and with greater intensity [38–40,42,56,57]. In a cross-sectional study of 536 women among whom 54% were HIV-infected, Miller et al found that menopausal symptoms were reported significantly more frequently in HIV-infected women compared with non–HIV-infected women [56]. As symptoms can occur in greater intensity and impair quality of life, it is important that providers be able to recognize, understand, and appropriately treat menopausal symptoms in HIV-infected women.
Vasomotor Symptoms
In the United States the most common symptom during perimenopause is hot flashes, which occur in 38% to 80% of women [58,59]. Vasomotor symptoms are most common in women who smoke, use illicit substances, have a high BMI, are of lower socioeconomic status, and are African American [19]. As expected, prior studies focusing on hot flash prevalence among premenopausal, perimenopausal, and postmenopausal HIV-infected women found that postmenopausal women experience more hot flashes than premenopausal or perimenopausal women [40,42]. In addition, a comparison of HIV-infected and non–HIV-infected women demonstrated a higher prevalence of hot flashes among HIV-infected women [38,56]. Ferreira et al found that 78% of Brazilian HIV-infected women reported vasomotor symptoms compared to 60% of non–HIV-infected women [38]. Similarly, Miller et al reported that 64% of HIV-infected women reported vasomotor symptoms compared to 58% of non–HIV-infected women [56].
Vasomotor symptoms can be severely distressing with hot flashes contributing to increased risk of depression [56,60]. In a cross-sectional analysis of 835 HIV-infected and 335 non–HIV-infected women from the WIHS, persistent vasomotor symptoms predicted elevated depressive symptoms in both HIV-infected and non-HIV-infected women [60]. In a similar cross-sectional analysis of 536 women, among whom 54% were HIV positive and 37% were perimenopausal, psychological symptoms were prevalent in 61% of the women with vasomotor symptoms [56].
Oddly enough, higher CD4 cell counts appear to be associated with increased prevalence of vasomotor symptoms [39,56]. Clark et al demonstrated that menopausal HIV-infected women with CD4 cell counts > 500 cells/mm3 were more likely to report hot flashes [39]. Similarly, Miller et al observed a reduction in the prevalence of menopausal symptoms as CD4 cell counts declined among HIV-infected non-HAART users [56]. The rationale behind this is unclear but some experts postulated that it may be due to the effects of HAART.
Genitourinary Symptoms
With estrogen deficiency, which accompanies the perimenopausal period, vulvovaginal atrophy (VVA) occurs leading to symptoms of vaginal dryness, itching, burning, urgency, and dyspareunia (painful intercourse) [59,61,62]. Unlike vasomotor symptoms, which diminish with time, genitourinary symptoms generally worsen if left untreated [63]. Furthermore, these symptoms are often underreported and underdiagnosed [64,65]. Several studies using telephone and online surveys have found that the prevalence of symptoms of VVA is between 43% and 63% in postmenopausal women [66–69]. Even higher rates were found in the Agata Study in which pelvic exams in 913 Italian women were performed to obtain objective signs of VVA [62]. The prevalence of VVA was 64% 1 year after menopause and 84% 6 years after menopause. Vaginal dryness was found in 100% of participants with VVA or 82% of total study participants. In addition, 77% of women with VVA, or 40% of total study participants, reported dyspareunia.
Genitourinary symptoms are most common among women who are African American, have an increased BMI, are from lower socioeconomic class, use tobacco [19], have prior history of pelvic inflammatory disease, and have anxiety and depression [70,71]. Similarly to hot flashes, many of these predisposing factors are more common in HIV-infected women. Fantry et al found that 49.6% of HIV-infected women had vaginal dryness. Although 56% of postmenopausal women and 36% of perimenopausal women complained of vaginal dryness, in a multivariate analysis only cocaine use, which can decrease estradiol levels [7,31] was associated with a higher frequency of vaginal dryness [40].
Similarly, dyspareunia is also common among HIV-infected women. In a cross-sectional study of 178 non–HIV-infected and 128 HIV-infected women between 40 and 60 years of age, Valadares et al found that the frequency of dyspareunia in HIV-infected women was high at 41.8% [72]. However, this was not significantly higher compared to the prevalence of 34.8% in non–HIV-infected women. HIV infection itself was not associated with the presence of dyspareunia
Psychiatric Symptoms
Anxiety and depression are also common symptoms in perimenopausal women [73–76]. Studies have shown that depression is diagnosed 2.5 times more frequently among perimenopausal than premenopausal women [76].
In a study by Miller et al that focused on 536 HIV-infected women, among whom 37% were perimenopausal, 89% reported psychological symptoms [56]. Ferreira et al found that HIV-infected perimenopausal women had an increased incidence of psychological symptoms compared to non–HIV-infected women [38]. Whether this increased prevalence of psychological symptoms seen in HIV-infected women can be attributed to menopause is unclear since one third to one half of men and women living with HIV experience symptoms of depression [77]. However, in the WIHS, which compared 835 HIV-infected with 335 non-HIV-infected women from all menopausal stages, elevated depressive symptoms were seen in the early perimenopausal period [60]. There was no increased incidence of such symptoms during the premenopausal or postmenopausal period, suggesting the contribution of menopause to depressive symptoms during the perimenopausal period [60].
Persistent menopausal symptoms, especially hot flashes, also predicted elevated depressive symptoms in several studies [56,60] suggesting the importance of appropriately identifying and treating menopausal symptoms. In addition, cognitive decline associated with menopause contributes to depression [78–80].
Other Symptoms
Sleep disturbances are also common among perimenopausal women, with prevalence estimated to be between 38% and 46% [81–84]. Hot flashes, anxiety, and depression appear to be contributing factors [81–84]. In a cross-sectional study of 273 HIV-infected and 264 non-HIV-infected women between 40 and 60 years of age, insomnia was found in 51% of perimenopausal and 53% of postmenopausal HIV-infected women. HIV-infected women had the same prevalence of insomnia compared to non–HIV-infected women [85]. Joint aches are also commonly reported in the perimenopausal period, with prevalence as high as 50% to 60% among perimenopausal women in the United States [52,53]. In HIV-infected women, Miller et al found that 63% of menopausal women reported arthralgia [56].
Treatment
For women experiencing severe hot flashes and vaginal dryness, short-term menopausal hormone therapy (MHT) is indicated to relieve symptoms. MHT should be limited to the shortest period of time at the lowest effective dose as MHT is associated with increased risks of breast cancer, cardiovascular disease, thromboembolism, and increased morbidity [86]. Despite the increased severity of menopausal symptoms experienced among HIV-infected women, the prevalence of the use of MHT in this population is lower compared to non–HIV-infected women [85].
Topical treatment is recommended for women who are experiencing solely vaginal atrophy. First-line treatment is topical nonhormonal therapy such as moisturizers and lubricants [87]. If symptoms are not relieved, then topical vaginal estrogen therapy is recommended [87]. Although topical therapy can result in estrogen absorption into the circulation, it is to a much lesser extent than systemic estrogen therapy [88].
Overall, there is lack of data on the potential interactions between MHT and HAART. Much of the potential interactions are inferred from pharmacokinetic and pharmacodynamics studies between HAART and oral contraceptives. Hormone therapy, protease inhibitors (PIs), colbicistat, and non-nucleoside reverse transcriptase inhibitors (NNRTIs) are all metabolized by the CYP3A4 enzyme [89–91]. Current evidence suggests that concomitant use of hormone therapy with NNRTIs and PIs does not significantly alter the pharmacokinetics of HAART or the clinical outcomes of HIV [91]. However, there is evidence that concomitant use of nevirapine and PIs boosted with ritonavir leads to decrease in estrogen levels so higher doses of MHT may have to be used to achieve symptomatic relief [91]. There is no data on the interaction between PIs boosted with colbicistat and estrogen [92]. Integrase inhibitors, nucleoside and nucleotide reverse transcriptase inhibitors (NRTIs), and the CCR5 antagonist maraviroc have no significant interactions with estrogen containing compounds [89,90,92].
Cardiovascular Risk
Estrogen deficiency resulting from menopause leads to several long-term effects, including cardiovascular disease and osteoporosis. The loss of protective effects of estrogen leads to an increased risk of cardiovascular disease particularly with changes in lipid profiles [93]. Perimenopausal women experience changes in body composition with increased fat mass and waist circumference, as well as dyslipidemia and insulin resistance, all of which are associated with higher risk of cardiovascular disease [94].
HIV infection also incurs a higher risk of cardiovascular disease [95–99]. The inflammatory effects of HIV, HAART, and traditional risk factors including dyslipidemia all contribute to cardiovascular disease but the degree to which each factor contributes to elevated risk is unknown [95,98]. In addition, modifiable risk factors for cardiovascular disease such as decreased fitness and smoking are more commonly seen in HIV-infected women [100]. Even prior to menopause, HIV-infected women experience lipodystrophy syndrome with increase in truncal visceral adiposity and decrease in subcutaneous fat and muscle mass [101,102]. Whether such changes in body composition are exacerbated during the perimenopausal period remain unclear. In the SWEET study, which focused on 702 South African women among whom 21% were HIV-infected, there was lower lean mass but minimal difference in the fat mass of postmenopausal women compared to premenopausal women [103]. As the study was based in South Africa with only 21% HIV-infected, the results of this study should be viewed with caution. While changes in body composition were not observed in postmenopausal women in the SWEET study, increased truncal adiposity seen in premenopausal HIV-infected women is likely to pose an additional risk for cardiovascular disease during the menopause transition.
Several studies have been conducted to demonstrate an increased risk of cardiovascular disease, especially among young HIV-infected men [95–99]. However, no study has focused specifically on the risk of cardiovascular disease in postmenopausal HIV-infected women to date. Despite the lack of studies, it is plausible that the increased risk of cardiovascular disease seen in HIV infection is likely to be compounded with the increased risk seen during menopause. Postmenopausal HIV-infected women may be at significantly higher risk of cardiovascular disease. Appropriate measures such as lipid control, antiplatelet therapy, smoking cessation, and other lifestyle changes should be initiated as in any other population. Further studies are necessary focusing on the effects of menopause on cardiovascular disease risk in HIV-infected women.
Osteoporosis
Menopause, with its associated estrogen deficiency, is the most important risk factor associated with increased bone turnover and bone loss and can worsen HIV associated bone loss [104]. Among HIV-infected individuals, low bone mineral density (BMD) has been described even among premenopausal women and younger men [105–107]. Evidence suggests that the decreased BMD associated with HIV stabilizes or even improves after initiation of HAART in the younger population [105–107]. However, once HIV-infected women enter menopause, they have higher rates of bone loss compared to non–HIV-infected women with significantly increased prevalence of osteoporosis compared to non–HIV-infected women [108–112].
Chronic inflammation by HIV stimulates osteoclast differentiation and resorption [113]. In addition, HAART [114–116], vitamin D deficiency [117], low BMI, poor nutrition [118], inactivity, use of tobacco, alcohol, and illicit drugs [119,120], and coinfection with hepatitis B and C [121] all appear to contribute to decreased BMD among HIV-infected men and women [118]. Among HIV-infected postmenopausal women, those taking ritonavir were found to have increased differentiation of osteoclast cells and increased bone loss [122]. Similarly, methadone use in postmenopausal women has been associated with increased BMD decline [123]. African-American, HIV-infected postmenopausal women appear to be at the greatest risk for bone loss [109].
Multiple studies focusing on HIV-infected men have demonstrated an increased prevalence of fractures compared to non–HIV-infected men [124–126]. However, current studies on postmenopausal HIV-infected women demonstrate that fracture incidence is similar between HIV-infected and non–HIV-infected postmenopausal women [108,112]. Nevertheless, given the evidence of low BMD and increased fracture risk seen during menopause among non–HIV-infected women compounded with the additional bone loss seen in HIV-infected individuals, enhanced screening in postmenopausal HIV-infected women is prudent. Although the U.S. Preventive Services Task Force (USPSTF) makes no mention of HIV as a risk factor for enhanced screening [127] and the Infectious Diseases Society of America (IDSA) only recommends screening beginning at the age of 50 years old if there are additional risk factors other than HIV [128], the more recently published Primary care guidelines for the management of persons infected with HIV recommends screening postmenopausal women ≥ 50 years of age with dual-energy X-ray absorptiometry (DEXA) scan [86]. Preventative therapy such as smoking cessation, adequate nutrition, alcohol reduction, weight bearing exercises, and adequate daily vitamin D and calcium should be discussed and recommended in all menopausal HIV-infected women [129]. If the DEXA scan shows osteoporosis, bisphosphonates or other medical therapy should be considered. Although the data are limited, bisphosphonates have been shown to be effective in improving BMD [130–132].
Cognition
The menopause transition is characterized by cognitive changes such as memory loss and difficulty concentrating [133–136]. Both HIV-infected men and women are at higher risk of cognitive impairment [137–139]. Cognitive impairment can range from minor cognitive-motor disorder to HIV-associated dementia due to the immunologic, hormonal, and inflammatory effects of HIV on cognition [137–139]. In addition, those with HIV infection appear to have increased risk factors for cognitive impairment including low education level, psychiatric illnesses, increased social stress, and chemical dependence [137].
Studies focusing on the effects of both HIV infection and menopause on cognition have been limited thus far. In a cross-sectional study of 708 HIV-infected and 278 non–HIV-infected premenopausal, perimenopausal, and postmenopausal women, Rubin et al demonstrated that HIV infection, but not menopausal stage, was associated with worse performance on cognitive measures [140]. While menopausal stage was not associated with cognitive decline, menopausal symptoms like depression, anxiety, and vasomotor symptoms were associated with lower cognitive performance [140].
Though limited, current data appear to indicate that HIV infection, not menopause, contributes to cognitive dysfunction [140]. Symptoms of menopause, however, do appear to exacerbate cognitive decline indicating the importance of recognition and treatment of menopausal symptoms. This is especially important in HIV-infected women since decrease in cognition and depression can interfere with day to day function including medication adherence [141,142].
Cervical Dysplasia
As more HIV-infected women reach older age, the effects of prolonged survival and especially menopause on squamous intraepithelial lesions (SILs) are being investigated to determine if general guidelines of cervical cancer screening should be applied to postmenopausal women.
In a retrospective analysis of Papanicolaou smear results of 245 HIV-infected women, Kim et al noted that menopausal women had a 70% higher risk of progression of SILs than premenopausal women [143]. Similar results were found in a smaller retrospective study of 18 postmenopausal HIV-infected women in which postmenopausal women had a higher prevalence of SILs and persistence of low-grade SILs [144].
Although studies on progression to cervical cancer in postmenopausal HIV-infected women remain limited, current data suggest that postmenopausal HIV-infected women should continue to be monitored and screened similarly to the screening recommendations for premenopausal women. Nevertheless, further studies examining the natural course of cervical lesions are needed to establish the best practice guidelines for screening postmenopausal women.
HIV Acquisition and Transmission
The incidence of new HIV infections in older American women has increased. HIV acquisition from heterosexual contact appears to be higher in older women compared to younger women, with a study suggesting that women over age 45 years had almost a fourfold higher risk of HIV acquisition compared to those under the age of 45 years [145]. While the lack of awareness of HIV risk and less frequent use of protection may contribute to increases in new HIV infection in older women, hormonal changes associated with older age, specifically menopause, may be playing a role. Vaginal wall thinning that occurs during menopause may serve as a risk factor for HIV acquisition.
In a study by Meditz et al, the percentage of endocervical or blood CD4 T cells did not differ between premenopausal and postmenopausal women, but postmenopausal women had greater percentage of CCR5 expression. As CCR5 serves as an entry point of HIV into target cells, this suggests the possibility that postmenopausal women may be at increased risk for HIV acquisition [146]. More recently, Chappell et al also revealed that anti-HIV-1 activity was significantly decreased in postmenopausal compared to premenopausal women, suggesting that there may be an increased susceptibility to HIV-1 infection in postmenopausal women [147]. Hence there appears to be menopause-related immunologic changes of the cervix that may contribute to an increased risk of HIV acquisition in postmenopausal women.
In contrast, although data is limited, postmenopausal HIV-infected women do not appear to be at increased risk of transmitting HIV to non–HIV-infected individuals. Melo et al compared the intensity of HIV shedding between premenopausal and postmenopausal women and found that HIV shedding did not differ between premenopausal or postmenopausal women [148].
HIV Progression
Several studies have focused on the effects of HIV infection on menopause, but minimal data are available on the effects of menopause on the progression of HIV infection. With prior data suggesting that younger persons experience better immunological and virological responses to HAART [149–151], it has previously been hypothesized that virologic and immunologic responses to HAART can decline once HIV-infected women reach menopause. However, current evidence suggests that treatment responses to HAART, determined by the median changes in CD4 cell counts and percentages and viral load, in HAART-naive patients did not differ between premenopausal and postmenopausal women [152]. In addition, there appears to be no significant changes in CD4 cell counts as HIV-infected women progress through menopause [153]. These studies suggest that menopause does not affect the progression of HIV and that HAART-naive women should respond to HAART regardless of their menopausal status.
Conclusion
As HIV-infected individuals live longer, increasing number of women will enter into menopause and live many years beyond menopause. HIV-infected women experience earlier and more severe menopausal symptoms, but knowledge is still lacking on the appropriate management of these symptoms. In addition, current evidence suggests that immunosuppression associated with HIV contributes to an early onset of menopause which leads to increased risks of cardiovascular disease, osteoporosis, and progression of cervical dysplasia. These conditions require proper surveillance and can be prevented with improved understanding of influences of menopause on HIV-infected women. Furthermore, although there is some evidence suggesting that menopause has no effect on HIV transmission and progression, further studies on the immunologic and virologic effects of menopause are necessary.
There still remain significant gaps in our understanding of menopause in HIV-infected women. As practitioners encounter an increasing number of perimenopausal and postmenopausal HIV-infected women, future studies on the effects of HIV on co-morbidities and symptoms of menopause and their appropriate management are necessary to improve care of women living with HIV.
Corresponding author: Lori E. Fantry, MD, MPH, 29 S. Greene St., Suite 300, Baltimore, MD 21201, [email protected].
Financial disclosures: None.
1. CASCADE Collaboration. Survival after introduction of HAART in people with known duration of HIV-1 infection. Lancet 2000;355:1158–9.
2. Brooks JT, Buchaz K, Gebo KA, Mermin J. HIV infection and older Americans: the public health perspective. Am J Pub Health 2012;102:1516–26.
3. Munster K, Helm P, Schmidt L. Secondary amenorrhea: Prevalence and medical contract–A cross sectional study from a Danish county. Br J Obstet Gynecol 1992;99:430–3.
4. Vyver E, Steinegger C, Katzman DK, et al. Eating disorders and menstrual dysfunction in adolescents. Ann N Y Acad Sci 2008;1135:253–64.
5. Abs R, Verhelst J, Maeyaert J, et al. Endocrine consequences of long-term intrathecal administration of opioids. J Clin Endocrinol Metab 2000;85:2215–22.
6. Pelosi MA, Sama JC, Caterini H, et al. Galactorrhea-amenorrhea syndrome associated with heroin addiction. Am J Obstet Gynecol 1974;118:966–70.
7. Bai J, Greenwald E, Caterini H, et al. Drug-related menstrual aberrations. Obstet Gynecol 1974;44:713–9.
8. Chirgwin KD, Feldman J, Muneyyirci-Delale O, et al. Menstrual function in HIV-infected women without AIDS. J Acquir Immune Defic Syndr Hum Retrovirol 1996;12:489–94.
9. Clark RA, Mulligan K, Stamenovic E, et al. Frequency of anovulation and early menopause among women enrolled in selected adult AIDS clinical trials group studies. J Infect Dis 2001;184:1325–7.
10. Watts DH, Spino C, Zaborski L. Comparison of gynecologic history and laboratory results in HIV-positive women with CDR+ lymphocyte counts between 200 and 500 cells/µl and below 100 cells/ µl. J Acquir Immune Defic Syndr Hum Retrovirol 1999;20:455–62.
11. Ellerbrock TV, Wrig TC, Bush TJ, et al. Characteristics of menstruation in women infected with HIV. Obstet Gynecol 1996;87:1030–4.
12. Shah PN, Smith JR, Wells C, et al. Menstrual symptoms in women infected by the HIV. Obstet Gynecol 1994;83:397–400.
13. Harlow SC, Schuman P, Cohen M, et al. Effect of HIV infection on menstrual cycle length. J Acquir Immune Defic Syndr Hum Retrovirol 2000;24:68–75.
14. Grinspoon S, Corocran C, Miller K, et al. Bone composition and endocrine function in women with AIDS wasting. J Clin Edocrinol Metab 1997;82:1332–7.
15. Research on the menopause in the 1990s. Report of a WHO scientific group. World Health Organ Tech Rep Ser 1996;866:1–107.
16. Cejtin HE, Kalinowski A, Bacchetti P. Effects of human immunodeficiency virus on protracted amenorrhea and ovarian dysfunction. Obstet Gynecol 2006;108:1423–31.
17. Freeman EW, Sammel MD, Garcia CR, et al. Follicular phase hormone levels and menstrual bleeding status in the approach to menopause. Fertil Steril 2005;83:383–92.
18. Soules MR, Sherman S, Parrott E, et al. Executive summary: Stages of Reproductive Aging Workshop (STRAW). Fertil Steril 2001;76:874–8.
19. Gold EB, Crawford SL, Avis NE, et al. Factors related to age at natural menopause: longitudinal analyses from SWAN. Am J Epidemiol 2013;178:70–83.
20. Thomas F, Renaud F, Benefice E, et al. International variability of ages at menarche and menopause: patterns and main determinants. Hum Biol 2001;73:271–90.
21. Shuster LT, Rhodes DJ, Gostout BS, et al. Premature menopause or early menopause: long-term health consequences. Maturitas 2010;65:161–6.
22. Carr MC. The emergence of the metabolic syndrome with menopause. J Clin Endocrinol Metab 2003;88:2404–11.
23. Wellons M, Ouyang P, Schreiner PJ, et al. Early menopause predicts future coronary heart disease and stroke: the multi-ethnic study of atherosclerosis. Menopause 2012;19:1081–7.
24. Rocca WA, Grossardt BR, Miller VM, et al. Premature menopause or early menopause and risk of ischemic stroke. Menopause 2012;19:272–7.
25. Svejme O, Ahlborg HG, Nilsson JA, et al. Early menopause and risk of osteoporosis, fracture and mortality: a 34-year prospective observational study in 390 women. BJOG 2012;119:810–6.
26. Cooper GS, Sandler DP, Bohlig M. Active and passive smoking and the occurrence of natural menopause. Epidemiology 1999;10:771–3.
27. Luoto R, Kaprio J, Uutela A. Age at natural menopause and socioeconomic status in Finland. Am J Epidemiol 1994;139:64–76.
28. Bromberger JT, Matthews KA, Kuller LH, et al. Prospective study of the determinants of age at menopause. Am J Epidemiol 1997;145:24–33.
29. Gold EB, Crawford SL, Avis NE, et al. Factors related to age at natural menopause: longitudinal analyses from SWAN. Am J Epidemiol 2013;178:70–83.
30. Tziomalos K, Charsoulis F. Endocrine effects of tobacco smoking. Clin Endocrinol 2004;61:664–74.
31. Potter DA, Moreno A, Luther MF, et al. Effects of follicular-phase cocaine administration on menstrual and ovarian cyclicity in rhesus monkeys. Am J Obstet Gynecol 1998;178:118–25.
32. Mdodo R, Frazier EL, Dube SR, et al. Cigarette smoking prevalence among adults with HIV compared with the general adult population in the United States: Cross-sectional survey. Ann Intern Med 2015;162:335–44.
33. Centers for Disease Control and Prevention (CDC). Vital signs: current cigarette smoking among adults aged ≥ 18 years–United States, 2005-2010. MMWR Morb Mortal Wkly Rep 2011;60:1207–12.
34. Feldman J, Mikoff H, Schneider M, et al. Association of cigarette smoking with HIV prognosis among women in the HAART era: A report from the Women’s Interagency HIV study. Am J Public Health 2006:96:1060–5.
35. Centers for Disease Control and Prevention. Estimated HIV incidence among adults and adolescents in the United States, 2007–2010. HIV Surveillance Supplemental Report 2012;17(4).
36. Galea S, Ahren J, Vlahov D. Contextual determinants of drug use risk behavior: a theoretical framework. J Urban Health 2003;80:50–8.
37. de Pommerol M, Hessamfar M, Lawson-Ayayi S, et al. Menopause and HIV infection: age at onset and associated factors, ANRS CO3 Aquitaine cohort. Int J STD AIDS 2011;22:67–72.
38. Ferreira CE, Pinto-Neto AM, Conde DM, et al. Menopausal symptoms in women infected with HIV: prevalence and associated factors. Gynecol Endocrinol 2007;23:198–205.
39. Clark RA, Cohn SE, Jarck C, et al. Perimenopausal symptomatology among HIV infected women at least 40 years of age. J Acquir Immune Defic Syndr Hum Retrovirol 2000;23:99–100.
40. Fantry L, Zhan M, Taylor G, et al. Age at menopause and menopausal symptoms in HIV-infected women. AIDS Patient Care STD 2005;19:703–11.
41. Calvet G, Grinsztejn G. Predictors of early menopause in HIV infected women: a prospective cohort study. Am J Obstet Gynecol 2015;212:765.
42. Boonyanurak P, Bunupuradah T, Wilawan K, et al. Age at menopause and menopause-related symptoms in human immunodeficiency virus-infected Thai women. Menopause 2012;19:820–4.
43. Cejtin SH, Taylor R, Watts DH. Assessment of menopausal status among women in the Women’s Interagency HIV study (WIHS). Proceedings of the 57th International AIDS Conference 2004; Bangkok, Thailand.
44. WIHS Data Management and Analysis Center (WDMAC). Women’s Interagency HIV Study (WIHS) Dossier. October 2014. Available at https://statepiaps.jhsph.edu/wihs/invest-info/dossier.pdf.
45. Schoenbaum E, Hartel D, Lo Y, et al. HIV infection, drug use, and onset of natural menopause. Clinical Infect Dis 2005;41:1517–24.
46. Taffe JR, Dennerstein L. Menstrual patterns leading to the final menstrual period. Menopause 2002;9:32–40.
47. Miro F, Parker SW, Aspinall LJ, et al. Origins and consequences of the elongation of the human menstrual cycle during the menopausal transition: the FREEDOM Study. J Clin Endocrinol Metab 2004;89:4910–5.
48. Harlow SD, Gass M, Hall JE, et al. Executive summary of the Stages of Reproductive Aging Workshop + 10: addressing the unfinished agenda of staging reproductive aging. J Clin Endocrinol Metab 2012;97:1159–68.
49. Freeman EW, Sammel MD, Gracia CR, et al. Follicular phase hormone levels and menstrual bleeding status in the approach to menopause. Fertil Steril 2005;83:383–92.
50. Burger HG, Hale GE, Dennerstein L, Robertson DM. Cycle and hormone changes during perimenopause: the key role of ovarian function. Menopause 2008;15:603–12.
51. McKinlay SM, Brambilla DJ, Posner JG. The normal menopause transition. Maturitas 1992;14:103–15.
52. Szoeke CE, Cicuttini F, Guthrie J, Dennerstein L. Self-reported arthritis and the menopause. Climacteric 2005;8:49–55.
53. Blümel JE, Chedraui P, Baron G, et al. Menopause could be involved in the pathogenesis of muscle and joint aches in mid-aged women. Maturitas 2013;75:94–100.
54. Woods NF, Mitchell ES. Symptoms interference with work and relationships during the menopausal transition and early postmenopause: observations from the Seattle Midlife Women’s Health Study. Menopause 2011;18:654–61.
55. Johnson TM, Cohen HW, Howard AA, et al. Attribution of menopause symptoms in human immunodeficiency virus–infected or at-risk drug-using women Menopause 2008;15:551–7.
56. Miller SA, Santoro N, Lo Y. Menopausal symptoms in HIV-infected and drug-using women. Menopause 2005;12:348–56.
57. Looby S, Shifren J, Corless I. Increased hot flash severity and related interference in perimenopausal HIV-infected women. Menopause 2014;21:403–9.
58. Thurston RC, Joffe H. Vasomotor symptoms and menopause: findings from the Study of Women’s Health across the Nation. Obstet Gynecol Clin North Am 2011;38:489–501.
59. Woods NF, Mitchell ES. Symptoms during the perimenopause: prevalence, severity, trajectory, and significance in women’s lives. Am J Med 2005;118 Suppl 12B:14.
60. Maki PM, Rubin LH, Cohen M, et al. Depressive symptoms are increased in the early perimenopausal stage in ethnically diverse human immunodeficiency virus-infected and human immunodeficiency virus-uninfected women. Menopause 2012;19:1215–33.
61. Dennerstein L, Dudley EC, Hopper JL, et al. A prospective population-based study of menopausal symptoms. Obstet Gynecol 2000;96:351–8.
62. Palma F, Volpe A, Villa P, et al. Vaginal atrophy of women in postmenopause. Results from a multicentric observational study: The AGATA study. Maturitas 2015 Sep 14.
63. Cutler WB, Garcia CR, McCoy N. Perimenopausal sexuality. Arch Sex Behav 1987;16:225–34.
64. Moreira ED, Glasser DB, Nicolosi A, et al. GSSAB Investigators’ Group. Sexual problems and help-seeking behavior in adults in the United Kingdom and continental Europe. BJU Int 2008;101:1005–11.
65. MacBride MB, Rhodes DJ, Shuster LT. Vulvovaginal atrophy. Mayo Clin Proc 2010;85:87–94.
66. Nappi RE, Kokot-Kierepa M. Women’s voices in the menopause: results from an international survey on vaginal atrophy. Maturitas 2010;67:233–8.
67. Santoro N, Komi J. Prevalence and impact of vaginal symptoms among postmenopausal women. J Sex Med 2009;6:2133–42.
68. Levine KB, Williams RE, Hartmann KE. Vulvovaginal atrophy is strongly associated with female sexual dysfunction among sexually active post-menopausal women. Menopause 2008;15(4 Pt 1):661–6.
69. Cumming GP, Currie HD, Moncur R, Lee AJ. Web-based survey on the effect of menopause on women’s libido in a computer-literate population. Menopause Int 2009;15:8–12.
70. Valadares AL, Pinto-Neto AM, Conde DM, et al. A population-based study of dyspareunia in a cohort of middle-aged Brazilian women. Menopause 2008;15:1184–90.
71. Latthe P, Migini L, Gray R, et al. Factors predisposing women to chronic pelvic pain: a systemic review. BMJ 2006;332:749–55.
72. Valadares AL, Pinto-Neto AM, Gomes D, et al. Dyspareunia in HIV-positive and HIV-negative middle-aged women: a cross-sectional study. BMJ Open 2014;4:e004974.
73. Bromberger JT, Meyer PM, Kravitz HM, et al. Psychologic distress and natural menopause: a multiethnic community study. Am J Public Health 2001;91:1435–42.
74. Avis NE, Brambilla D, McKinlay SM, Vass K. A longitudinal analysis of the association between menopause and depression. Results from the Massachusetts Women’s Health Study. Ann Epidemiol 1994;4:214–20.
75. Cohen LS, Soares CN, Joffe H. Diagnosis and management of mood disorders during the menopausal transition. Am J Med 2005;118 Suppl 12B:93–7.
76. Freeman EW, Sammel MD, Lin H, Nelson DB. Associations of hormones and menopausal status with depressed mood in women with no history of depression. Arch Gen Psychiatry 2006;63:375–82.
77. Eller LS, Corless I, Bunch EH, et al. Self-care strategies for depressive symptoms in people with HIV disease. J Adv Nurs 2005;51:119–30.
78. Fuh JL, Wang SJ, Lee SJ, et al. A longitudinal study of cognition change during early menopausal transition in a rural community. Maturitas 2006;53:447–53.
79. Greendale GA, Huang MH, Wight RG, et al. Effects of the menopause transition and hormone use on cognitive performance in midlife women. Neurology 2009;72:1850–7.
80. Hinkin CH, Castellon SA, Atkinson JH, et al. Neuropsychiatric aspects of HIV infection among older adults. J Clin Epidemiol 2001;54:S44–52.
81. Kravitz HM, Ganz PA, Bromberger J, et al. Sleep difficulty in women at midlife: a community survey of sleep and the menopausal transition. Menopause 2003;10:19–28.
82. Freedman RR, Roehrs TA. Effects of REM sleep and ambient temperature on hot flash-induced sleep disturbance. Menopause 2006;13:576–83.
83. Erlik Y, Tataryn IV, Meldrum DR, et al. Association of waking episodes with menopausal hot flushes. JAMA 1981; 245:1741–4.
84. Freedman RR, Roehrs TA. Sleep disturbance in menopause. Menopause 2007;14:826–9.
85. Lui-Filho JF, Valadares AR, Gomes D, et al. Menopausal symptoms and associated factors in HIV-positive women. Maturitas 2013;76:172–8.
86. Aberg JA, Gallant JE, Ghanem KG, et al, Infectious Diseases Society of America. Primary care guidelines for the management of persons infected with HIV: 2013 update by the HIV medicine association of the Infectious Diseases Society of America. Clin Infect Dis 2014;58:e1–34.
87. The role of local vaginal estrogen for treatment of vaginal atrophy in postmenopausal women: 2007 position statement of The North American Menopause Society. Menopause 2007;14:357–69.
88. Dorr MB, Nelson AL, Mayer PR, et al. Plasma estrogen concentrations after oral and vaginal estrogen administration in women with atrophic vaginitis. Fertil Steril 2010;94:2365–8.
89. El-Ibiary SY, Cocohoba JM. Effects of antiretrovirals on the pharmacokinetics of hormonal contraception. Eur J Contracept Reprod Health Care 2008;13:123–32.
90. Tittle V, Bull L, Boffito M, Nwokolo N. Pharmacokinetic and pharmacodynamics drug interactions between antiretrovirals and oral contraceptives. Clin Pharmacokinet 2015;54:23–34.
91. Thurman AR, Anderson S, Doncel G. Effects of hormonal contraception on anti-retroviral drug metabolism, pharmacokinetics and pharmacodynamics. Am J Reprod Immunol 2014:71:523–30.
92. Panel on Antiretroviral Guidelines for Adults and Adolescents. Guidelines for the use of antiretroviral agents in HIV-1-infected adults and adolescents. US. Department of Health and Human Services. Availabe at www.aidsinfo.nih.gov/ContentFiles/AdultandAdolescentGL.pdf.
93. Berg G, Mesch V, Boero L, et al. Lipid and lipoprotein profile in menopausal transition: effects of hormones, age and fat distribution. Hormone Metab Res 2004;36:215–20.
94. Sower M, Zheng H, Tomey K, et al. Changes in body composition in women over six years at midlife: ovarian and chronological aging. J Clin Endocrin Metab 2007;92:895–901.
95. Flooris-Moore M, Howard AA, Lo Y, et al. Increased serum lipids are associated with higher CD4 lymphocyte count in HIV-infected women. HIV Med 2006;7:421–30.
96. Grunfeld C, Delaney JA, Wanke C, et al. Preclinical atherosclerosis due to HIV infection: carotid intima-medial thickness measurements from the FRAM study. AIDS 2009;23:1841–9.
97. Palacios R, Alonso I, Hidalgo A, et al. Peripheral arterial disease in HIV patients older than 50 years of age. AIDS Res Hum Retroviruses 2008;24:1043–6.
98. Hadigan C, Meigs JB, Corcoran C, et al. Metabolic abnormalities and cardiovascular disease risk factors in adults with human immunodeficiency virus infection and lipodystrophy. Clin Infect Dis 2001;32:130–9.
99. Triant VA, Lee H, Hadigan C, Grinspoon SK. Increased acute myocardial infarction rates and cardiovascular risk factors among patients with human immunodeficiency virus disease. J Clin Endocrin Metab 2007;92:2506–12.
100. Dolan SE, Frontera W, Librizzi J et al. The effects of a supervised home based aerobic and progressive resistance training regimen in HIV-infected women: randomized trial. Arch Intern Med 2006;166:1225–31.
101. Grinspoon S, Carr A. Cardiovascular risk and body fat abnormalities in HIV-infected adults. N Engl J Med 2005;352:48–62
102. Study of Fat Redistribution and Metabolic Change in HIV Infection (FRAM). Fat distribution in women with HIV infection. J Acquir Immune Defic Syndr 2006;42:562–71.
103. Jaff NG, Norris SA, Snyman T, et al. Body composition in the study of women entering and in Endocrine Transition (SWEET): A perspective of African women who have a high prevalence of obesity and HIV infection. Metabolism 2015;64:1031–41.
104. Akhter MP, Lappe JM, Davies KM, et al. Transmenopausal changes in the trabecular bone structure. Bone 2007;41:111–6.
105. Cassetti I, Madruga JV, Suleiman JM, et al. The safety and efficacy of tenofovir DF in combination with lamivudine and efavirenz through 6 years in antiretroviral-naive HIV-1-infected patients. HIV Clin Trials 2007;8:164–72.
106. McComsey GA, Kitch D, Daar ES, et al. Bone mineral density and fractures in antiretroviral-naive persons randomized to receive abacavir-lamivudine or tenofovir disoproxil fumarate-emtricitabine along with efavirenz or atazanavir-ritonavir: AIDS Clinical Trials Group A5224s, a substudy of ACTG A5202. J Infect Dis 2011;203:1791–801.
107. Hansen AB, Obel N, Nielsen H, et al. Bone mineral density changes in protease inhibitor-sparing vs. nucleoside reverse transcriptase inhibitor-sparing highly active antiretroviral therapy: Data from a randomized trial. HIV Med 2011;12:157–65.
108. Yin MT, Zhang CA, McMahon DJ, et al. Higher rates of bone loss in postmenopausal HIV-infected women: a longitudinal study. J Clin Endocrinol Metab 2012;97:554–62.
109. Sharma A, Flom PL, Rosen CJ, et al. Racial differences in bone loss and relation to menopause among HIV-infected and uninfected women. Bone 2015;77:24–30.
110. Caputo BV, Traversa-Caputo GC, Costa C, et al. Evaluation of bone alterations in the jaws of HIV-infected menopausal women. Braz Oral Res 2013;27:231–7.
111. Bone mass and mineral metabolism in HIV+ postmenopausal women. Osteoporos Int 2005;26:1345–52.
112. Yin MT, Mcmahon DJ, Ferris DC, et al. Low bone mass and high bone turnover in postmenopausal human immunodeficiency virus-infected women. J Clin Endocrinol Metab 2010;95:620–9.
113. Gibellini D, De Crignis E, Ponti C. HIV-1 triggers apoptosis in primary osteoblasts and HOBIT cells through TNF-alpha activation. J Med Virol 2008;80:1507–14.
114. Tebas P, Powderly WG, Claxton S, et al. Accelerated bone mineral loss in HIV-infected patients receiving potent antiretroviral therapy. AIDS 2000;14:F63–7.
115. Van Rompay KK, Brignolo LL, Meyer DJ, et al. Biological effects of short-term or prolonged administration of 9-[2(phosphonomethoxy)propyl] adenine (tenofovir) to newborn and infant rhesus macaques. Antimicrob Agents Chemother 2004;48:1469–87.
116. Brown TT, Qaqish RB. Antiretroviral therapy and the prevalence of osteopenia and osteoporosis: a meta-analytic review. AIDS 2006;20:2165–74.
117. Dao CN, Patel P, Overton ET, Rhame F, et al. Study to understand the natural history of HIV and AIDS in the era of effective therapy (SUN) investigators. Low vitamin D among HIV-infected adults: prevalence of and risk factors for low vitamin D levels in cohort of HIV-infected adults and comparison to prevalence among adults in the US general population. Clin Infect Dis 2011;52:396–405.
118. Jacobson DL, Spiegelman D, Know TK, Wilson IB. Evolution and predictors of change in total bone mineral density over time in HIV-infected men and women in the nutrition for healthy living study. J Acquir Immune Defic Syndr Hum Retrovirol 2008;49:298–308.
119. Kanis JA, Borgstrom F, De Laet C, et al. Assessment of fracture risk. Osteoporosis Int 2005;16:581–9
120. Pedrazzoni M, Vescovi L, Maninetti M, et al. Effects of chronic heroine abuse on bone and mineral metabolism. Acta Endocrinol 1993;129:42–5.
121. Lo Re V 3rd, Guaraldi G, Leonard MB, et al. Viral hepatitis is associated with reduced bone mineral density in HIV-infected women but not men. AIDS 1990;23:2191–8.
122. Yin MT, Modarresi R, Shane E, et al. Effects of HIV infection and antiretroviral therapy with ritonavir on induction of osteoclast-like cells in postmenopausal women. Osteoporos Int 2011;22:1459–66.
123. Sharma A, Cohen HW, Freeman R, et al. Prospective evaluation of bone mineral density among middle-aged HIV-infected and uninfected women: association between methadone use and bone loss. Maturitas 2011;70:295–301.
124. Triant VA, Brown TT, Lee H, Grinspoon SK. Fracture prevalence among human immunodeficiency virus (HIV)-infected versus non-HIV-infected patients in a large U.S. healthcare system. J Clin Endocrinol Metab 2008;93:3499–504.
125. Womack JA, Goulet JL, Gibert C, et al. Veterans Aging Cohort Study Project Team. Increased risk of fragility fractures among HIV infected compared to uninfected male veterans. PLoS One Feb 16 2011;6:e17217.
126. Young B, Dao CN, Buchacz K, et al, HIV Outpatient Study (HOPS) Investigators. Increased rates of bone fracture among HIV-infected persons in the HIV Outpatient Study (HOPS) compared with the US general population, 2000–2006. Clin Infect Dis 2011;52:1061–8.
127. U.S. Preventive Services Task Force. Screening for osteoporosis: U.S. Preventive Services Task Force recommendation statement. Ann Intern Med 2011; 154:356–64.
128. Aberg JA, Kaplan JE, Libman H, et al; HIV Medicine Association of the Infectious Diseases Society of America. Primary care guidelines for the management of persons infected with human immunodeficiency virus: 2009 update by the HIV medicine Association of the Infectious Diseases Society of America. Clin Infect Dis 2009;49:651–81.
129. National Osteoporosis Foundation. Clinician’s guide to prevention and treatment of osteoporosis 2014. Washington, DC: National Osteoporosis Foundation; 2014.
130. McComsey GA, Tebas P, Shane E, et al. Bone disease in HIV infection: a practical review and recommendations for HIV care providers. Clin Infect Dis 2010;51:937–46.
131. McComsey GA, Kendall MA, Tebas P, et al. Alendronate with calcium and vitamin D supplementation is safe and effective for the treatment of decreased bone mineral density in HIV. AIDS 2007;21:2473–82.
132. Lin D, Rieder MJ. Interventions for the treatment of decreased bone mineral density associated with HIV infection. Cochrane Database Syst Rev 2007:CD005645.
133. Haring B, Leng X, Robinson J. Cardiovascular disease and cognitive decline in postmenopausal women: results from the Women’s Health Initiative Memory Study. J Am Heart Assoc 2013;2:e000369.
134. Soares CN, Maki PM. Menopausal transition, mood, and cognition: an integrated view to close the gaps. Menopause 2010;17:812–4.
135. Greendale GA, Derby CA, Maki PM. Perimenopause and cognition. Obstet Gynecol Clin North Am 2011;38:519–35.
136. Greendale GA, Wight RG, Huang MH, et al. Menopause-associated symptoms and cognitive performance: results from the study of women’s health across the nation. Am J Epidemiol 2010;171:1214–24.
137. Price RW. Neurological complications of HIV infection. Lancet 1996;348:445–52.
138. Antinori A, Arendt G, Becker JT, et al. Updated research nosology for HIV-associated neurocognitive disorders. Neurology 2007;69:1789–99.
139. Gisslén M, Price RW, Nilsson S. The definition of HIV-associated neurocognitive disorders: are we overestimating the real prevalence? BMC Infect Dis 2011;11:356.
140. Rubin LH, Sundermann EE, Cook JA, et al. An investigation of menopausal stage and symptoms on cognition in HIV-infected women. Menopause 2014;21:997–1006.
141. Cook JA, Cohen MH, Burke J, et al. Effects of depressive symptoms and mental health quality of life on use of highly active antiretroviral therapy among HIV-seropositive women. J Acquir Immune Defic Syndr 2002;30:401–9.
142. Cook JA, Grey D, Burke J, et al. Depressive symptoms and AIDS-related mortality among a multisite cohort of HIV-positive women. Am J Pub Health 2004;94:1133–40.
143. Kim SC, Messing S, Shah K, et al. Effects of highly active antiretroviral therapy (HAART) and menopause on risk of progression of cervical dysplasia in human immune deficiency virus (HIV) infected women. Infect Dis Obstet Gynecol 2013;2013:784718.
144. Ceccaldi PF, Ferreira C, Coussy F, et al. Cervical disease in postmenopausal HIV-1 infected women. J Gynecol Obstet Biol Reprod 2010;39:466–70.
145. European Study Group on Heterosexual Transmission of HIV. Comparison of female to male and male to female transmission of HIV in 563 stable couples. BMJ 1992;304:809–13.
146. Meditz AL, Moreau KL, MaWhinney S, et al. CCR5 expression is elevated on endocervical CD4+ T cells in healthy postmenopausal women. J Acquir Immune Defic Syndr 2012;59:221–8.
147. Chappell CA, Isaacs CE, Xu W, et al. The effect of menopause on the innate antiviral activity of cervicovaginal lavage. Am J Obstet Gynecol 2015;213:204.
148. Melo KC, Melo MR, Ricci BV, Segurado AC. Correlates of human immunodeficiency virus cervicovaginal shedding among postmenopausal and fertile-aged women. Menopause 2012;19:150–6.
149. Viard JP, Mocroft A, Chiesi A, et al. Influence of age of CD4 cell recovery in human immunodeficiency virus-infected patients receiving highly active antiretroviral therapy: evidence from the Euro SIDA study. J Infect Dis 2001;193:1290–4.
150. Grabar S, Kousignian I, Sobel A, et al. Immunological and clinical responses to highly active antiretroviral therapy over 50 years of age. Results from the French Hospital Database on HIV. AIDS 2004;18:2029–38.
151. Cuzin L, Delpierre C, Gerard S, et al. Immunologic and clinical responses to highly active antiretroviral therapy in patients with HIV infection aged >50 years. Clin Infect Dis 2007;45:654–7.
152. Patterson KB, Cohn SE, Uynik J, et al. Treatment responses in antiretroviral treatment-naïve premenopausal and postmenopausal HIV-1 infected women: an analysis from AIDS clinical trials group studies. Clin Infect Dis 2009;49:473–6.
153. van Benthem BH, Vernazza P, Coutinho RA, et al. The impact of pregnancy and menopause on CD4 lymphocyte count in HIV-infected women. AIDS 2002;16:919–24.
From the University of Maryland School of Medicine, Baltimore, MD.
Abstract
- Objective: To review the current literature on menopause in HIV-infected women.
- Methods: We searched PubMed for articles published in English using the search terms HIV and menopause, HIV and amenorrhea, HIV and menopause symptoms, HIV and vasomotor symptoms, HIV and vaginal dryness, HIV and dyspareunia, HIV and menopause and cardiovascular disease, HIV and menopause and osteoporosis, HIV and menopause and cognition, HIV and menopause and cervical dysplasia, menopause and HIV transmission, and menopause and HIV progression. Major studies on menopause in other populations were also reviewed to provide background data.
- Results: While studies on the age of menopause in HIV-infected women give conflicting results, immuno-suppression associated with HIV appears to contribute to an earlier onset of menopause. HIV-infected women experience menopausal symptoms, especially vasomotor symptoms, earlier and in greater intensity. In addition, menopause and HIV infection have additive effects on one another, further increasing the disease risks of cardiovascular disease, osteoporosis, and progression of cervical dysplasia. The effects of menopause on HIV infection itself seems limited. While some data suggest an increased risk of acquisition in non–HIV-infected menopausal women, menopause has no effect on the transmission or progression of HIV in menopausal HIV-infected women.
- Conclusion: As HIV-infected individuals live longer, practitioners will encounter an increasing number of women entering menopause and living into their postmenopausal years. Future studies on the age of menopause, symptoms of menopause, and the effects of menopause on long term comorbidities such as cognitive decline, cardiovascular disease, and bone density loss are necessary to improve care of this expanding population of women living with HIV.
Since the introduction of highly active antiretroviral therapy (HAART) in 1996, there has been a significant decrease in morbidity and mortality worldwide among individuals living with human immunodeficiency virus (HIV) [1]. It is projected that by the year 2020, half of persons living with HIV infection in the United States will be over the age of 50 years [2]. For HIV-infected women, this longer survival translates into an increased number of women entering into menopause and living well beyond menopause. Enhancing our knowledge about menopause in HIV-infected women is important since the physiologic changes associated with menopause impact short- and long-term quality of life and mortality. Symptoms associated with menopause can be mistaken for symptoms suggestive of infections, cancers, and drug toxicity. Furthermore, changes in cognition, body composition, lipids, glucose metabolism, and bone mass are influential factors determining morbidity and mortality in later years.
Effect of HIV on the Menstrual Cycle
Menstrual irregularities, including amenorrhea and anovulation, are more frequently found in women of low socioeconomic class who experience more social and physical stress like poverty and physical illnesses [3]. In addition, women with low body mass index (BMI) have decreased serum estradiol levels which lead to amenorrhea [3,4]. Furthermore, several studies have demonstrated that methadone, heroin, and morphine use are associated with amenorrhea. Opiate use inhibits the central neural reproductive drive leading to amenorrhea even in the absence of menopause [5–7].
As these demographics, body habitus, and lifestyle characteristics are frequently found among HIV-infected women, it is not surprising that amenorrhea and anovulation are common in this population [8–14]. In fact, studies show that there is an increased prevalence of amenorrhea and anovulation among HIV-infected women when compared to non–HIV-infected women [8]. Some studies suggest that women with lower CD4 cell counts and higher viral loads have increased frequency of amenorrhea and irregular menstruation compared to those with higher CD4 cell counts and lower viral loads [9,10]. However, it remains unclear if HIV infection itself, instead of the associated social and medical factors, is responsible for the higher frequency of amenorrhea [11–13]. For example, in a prospective study comparing 802 HIV-infected women with 273 non–HIV-infected women, there was no difference in the prevalence of amenorrhea when controlling for BMI, substance use, and age [13].
The World Health Organization (WHO) currently defines natural menopause as the permanent cessation of menstruation for 12 consecutive months without any obvious pathological or physiologic causes [15]. However, given the increased prevalence of amenorrhea in HIV-infected women, amenorrhea seen with HIV infection can be mistaken for menopause. The Women’s Interagency HIV Study (WIHS), a multicenter, observational study of HIV-infected women and non–HIV-infected women of similar socioeconomic status, found that more than half of HIV-infected women with prolonged amenorrhea of at least 1 year had serum follicle-stimulating hormone (FSH) levels in the premenopausal range of less than 25 mIU/mL [16]. Hence, this implies that some of these women may have had prolonged amenorrhea rather than menopause [17]. The traditional definition of menopause may need to be altered in this population.
Age at Menopause
Natural menopause, retrospectively determined by the cessation of menstrual cycles for 12 consecutive months, is a reflection of complete, or near complete, ovarian follicular depletion with subsequent low estrogen levels and high FSH concentrations [18]. In the United States, studies have found the mean age of menopause to be between 50 to 52 years old [19,20]. These studies, however, focused predominantly on menopause in middle class, white women. Early menopause, defined as the permanent cessation of menstruation between 40 to 45 years of age, affects 5% of the women in the United States, while premature menopause or primary ovarian insufficiency, which occurs at younger than 40 years of age, affects 1% of the women [21].
As earlier menopause is associated with increased risks of diabetes [22], cardiovascular disease [23], stroke [24], and osteoporosis [25], identifying the mean age of menopause is important in the management of HIV-infected women. Among women in the United States, early menopause has been observed in women who are African American, nulliparous, have lower BMI, smoke tobacco, and have more stress, less education, and more unemployment [26–29]. Unhealthy lifestyles can also contribute to an earlier age of menopause. Smoking is one of the most consistent and modifiable risk factors associated with an earlier onset of natural menopause, accelerating menopause by up to 2 years [26,30]. Substances present in cigarettes are associated with irreversible damage of ovarian follicles and impaired liver estrogen metabolism [30]. Cocaine use has also been associated with lower estradiol levels, suggesting possible ovary-toxic effects [7,31].
Many of these characteristics and unhealthy lifestyles are prevalent among HIV-infected women. Prevalence of current smoking among HIV-infected persons is found to be approximately 42% [32] in comparison with the 19% seen in the general population in the United States [33]. Specifically, among women participating in WIHS, 56% of the women were found to be current smokers with an additional 16% of the women found to be prior smokers [34]. In addition, African Americans account for the highest proportion of new HIV infections in the United States with an estimated 64% of all new HIV infections in women found to be in African Americans [35]. Furthermore, HIV-infected women are of lower socioeconomic status, with increased prevalence of substance use than that typically found in women enrolled in studies on the age of menopause [36]. Hence, when examining the influence of HIV on the age of menopause, one needs to have a comparator of non–HIV-infected group with similar characteristics. Studies without comparison groups have reported the median age of menopause in HIV-infected women to be between 47 and 50 years old [37–42].
There are only few studies that have focused on the age of menopause in HIV-infected women with a similar comparative non–HIV-infected group.Cejtin et al studied the age of menopause in women enrolled in the WIHS [43]. HIV-infected women partaking in the WIHS were primarily African American and of lower socioeconomic status with heterosexual transmission rather than injection drug use as the major HIV risk factor [44]. They found no significant difference in the median age of menopause when HIV-infected women were compared to non–HIV-infected women. Median age of menopause was 47.7 years in HIV-infected women and 48.0 years in non–HIV-infected women [43].
In contrast, in the Ms Study, a prospective cohort comparing 302 HIV-infected with 259 non-HIV-infected women, HIV-infected women were 73% more likely to experience early menopause than non-HIV-infected women [45]. Similar to the WIHS, there was a high prevalence of African Americans but unlike the WIHS the majority of participants had used heroin or cocaine within the past 5 years. The high prevalence of drug use and current or former cigarette use in the Ms Study likely contributed to the relatively early onset of menopause. Furthermore, the WIHS and Ms Study used different definition of menopause. The WIHS defined menopause as 6 consecutive months of amenorrhea with an FSH level greater than 25 mIU/mL while the Ms Study defined menopause as the cessation of menstrual period for 12 consecutive months [43,45]. Given the fact that 52% of the women in the Ms Study had high-risk behaviors associated with amenorrhea and that menopause was defined as 12 months of amenorrhea without corresponding FSH levels, it is possible that the Ms Study included many women with amenorrhea who had not yet reached menopause. On the other hand, although the 6 months’ duration of amenorrhea used in the WIHS to define menopause had the potential to include women who only had amenorrhea without menopause, the use of FSH levels to define menopause most likely eliminated women who only had amenorrhea.
HIV-infected women have several factors associated with early menopause which are similar to that in the general population, including African American race, injection drug use, cigarette smoking, and menarche before age of 11 [37,41]. In addition, multiple studies have shown that a key factor associated with early age of menopause among HIV-infected women is the degree of immunosuppression [37,41,45]. The Ms Study found that women with CD4 cell counts < 200 cells/mm3 had an increased risk ofamenorrhea lasting at least 12 months when compared to women with CD4 cell counts ≥ 200 cells/mm3. The median age of menopause was 42.5 years in women with CD4 cell counts < 200 cells/mm3, 46.0 years in women with CD4 cell counts between 200 cells/mm3 and 500 cells/mm3, and 46.5 years in women with CD4 cell counts > 500 cells/mm3 [45]. Similarly, in a cohort of 667 Brazilian HIV-infected women, among whom 160 women were postmenopausal, Calvet et al found 33% of women with CD4 cell counts < 50 cells/mm3 to have premature menopause, compared to 8% of women with CD4 cell counts ≥ 350 cells/mm3 [41]. De Pommerol et al studied 404 HIV-infected women among whom 69 were found to be postmenopausal. They found that women with CD4 cell counts < 200 cells/mm3 were more likely to have premature menopause compared to women with CD4 cell counts ≥ 350 cells/mm3 [37].
Besides the degree of immunosuppression, another factor contributing to early menopause unique to HIV-infected women is chronic hepatitis C infection [41].
Menopause-Associated Symptoms
The perimenopausal period, which begins on average 4 years prior to the final menstrual period, is characterized by hormonal fluctuations leading to irregular menstrual cycles. Symptoms associated with these physiologic changes during the perimenopausal period include vasomotor symptoms (hot flashes), genitourinary symptoms (vaginal dryness and dyspareunia), anxiety, depression, sleep disturbances, and joint aches [46–53]. Such menopausal symptoms can be distressing, negatively impacting quality of life [54].
It can be difficult to determine which symptoms are caused by the physiologic changes of menopause in HIV-infected women as they have multiple potential reasons for these symptoms, such as antiretroviral therapy, comorbidities, and HIV infection itself [55]. However, several studies clearly show that there are symptoms that occur more commonly in the perimenopausal period and that HIV-infected women experience these symptoms earlier and with greater intensity [38–40,42,56,57]. In a cross-sectional study of 536 women among whom 54% were HIV-infected, Miller et al found that menopausal symptoms were reported significantly more frequently in HIV-infected women compared with non–HIV-infected women [56]. As symptoms can occur in greater intensity and impair quality of life, it is important that providers be able to recognize, understand, and appropriately treat menopausal symptoms in HIV-infected women.
Vasomotor Symptoms
In the United States the most common symptom during perimenopause is hot flashes, which occur in 38% to 80% of women [58,59]. Vasomotor symptoms are most common in women who smoke, use illicit substances, have a high BMI, are of lower socioeconomic status, and are African American [19]. As expected, prior studies focusing on hot flash prevalence among premenopausal, perimenopausal, and postmenopausal HIV-infected women found that postmenopausal women experience more hot flashes than premenopausal or perimenopausal women [40,42]. In addition, a comparison of HIV-infected and non–HIV-infected women demonstrated a higher prevalence of hot flashes among HIV-infected women [38,56]. Ferreira et al found that 78% of Brazilian HIV-infected women reported vasomotor symptoms compared to 60% of non–HIV-infected women [38]. Similarly, Miller et al reported that 64% of HIV-infected women reported vasomotor symptoms compared to 58% of non–HIV-infected women [56].
Vasomotor symptoms can be severely distressing with hot flashes contributing to increased risk of depression [56,60]. In a cross-sectional analysis of 835 HIV-infected and 335 non–HIV-infected women from the WIHS, persistent vasomotor symptoms predicted elevated depressive symptoms in both HIV-infected and non-HIV-infected women [60]. In a similar cross-sectional analysis of 536 women, among whom 54% were HIV positive and 37% were perimenopausal, psychological symptoms were prevalent in 61% of the women with vasomotor symptoms [56].
Oddly enough, higher CD4 cell counts appear to be associated with increased prevalence of vasomotor symptoms [39,56]. Clark et al demonstrated that menopausal HIV-infected women with CD4 cell counts > 500 cells/mm3 were more likely to report hot flashes [39]. Similarly, Miller et al observed a reduction in the prevalence of menopausal symptoms as CD4 cell counts declined among HIV-infected non-HAART users [56]. The rationale behind this is unclear but some experts postulated that it may be due to the effects of HAART.
Genitourinary Symptoms
With estrogen deficiency, which accompanies the perimenopausal period, vulvovaginal atrophy (VVA) occurs leading to symptoms of vaginal dryness, itching, burning, urgency, and dyspareunia (painful intercourse) [59,61,62]. Unlike vasomotor symptoms, which diminish with time, genitourinary symptoms generally worsen if left untreated [63]. Furthermore, these symptoms are often underreported and underdiagnosed [64,65]. Several studies using telephone and online surveys have found that the prevalence of symptoms of VVA is between 43% and 63% in postmenopausal women [66–69]. Even higher rates were found in the Agata Study in which pelvic exams in 913 Italian women were performed to obtain objective signs of VVA [62]. The prevalence of VVA was 64% 1 year after menopause and 84% 6 years after menopause. Vaginal dryness was found in 100% of participants with VVA or 82% of total study participants. In addition, 77% of women with VVA, or 40% of total study participants, reported dyspareunia.
Genitourinary symptoms are most common among women who are African American, have an increased BMI, are from lower socioeconomic class, use tobacco [19], have prior history of pelvic inflammatory disease, and have anxiety and depression [70,71]. Similarly to hot flashes, many of these predisposing factors are more common in HIV-infected women. Fantry et al found that 49.6% of HIV-infected women had vaginal dryness. Although 56% of postmenopausal women and 36% of perimenopausal women complained of vaginal dryness, in a multivariate analysis only cocaine use, which can decrease estradiol levels [7,31] was associated with a higher frequency of vaginal dryness [40].
Similarly, dyspareunia is also common among HIV-infected women. In a cross-sectional study of 178 non–HIV-infected and 128 HIV-infected women between 40 and 60 years of age, Valadares et al found that the frequency of dyspareunia in HIV-infected women was high at 41.8% [72]. However, this was not significantly higher compared to the prevalence of 34.8% in non–HIV-infected women. HIV infection itself was not associated with the presence of dyspareunia
Psychiatric Symptoms
Anxiety and depression are also common symptoms in perimenopausal women [73–76]. Studies have shown that depression is diagnosed 2.5 times more frequently among perimenopausal than premenopausal women [76].
In a study by Miller et al that focused on 536 HIV-infected women, among whom 37% were perimenopausal, 89% reported psychological symptoms [56]. Ferreira et al found that HIV-infected perimenopausal women had an increased incidence of psychological symptoms compared to non–HIV-infected women [38]. Whether this increased prevalence of psychological symptoms seen in HIV-infected women can be attributed to menopause is unclear since one third to one half of men and women living with HIV experience symptoms of depression [77]. However, in the WIHS, which compared 835 HIV-infected with 335 non-HIV-infected women from all menopausal stages, elevated depressive symptoms were seen in the early perimenopausal period [60]. There was no increased incidence of such symptoms during the premenopausal or postmenopausal period, suggesting the contribution of menopause to depressive symptoms during the perimenopausal period [60].
Persistent menopausal symptoms, especially hot flashes, also predicted elevated depressive symptoms in several studies [56,60] suggesting the importance of appropriately identifying and treating menopausal symptoms. In addition, cognitive decline associated with menopause contributes to depression [78–80].
Other Symptoms
Sleep disturbances are also common among perimenopausal women, with prevalence estimated to be between 38% and 46% [81–84]. Hot flashes, anxiety, and depression appear to be contributing factors [81–84]. In a cross-sectional study of 273 HIV-infected and 264 non-HIV-infected women between 40 and 60 years of age, insomnia was found in 51% of perimenopausal and 53% of postmenopausal HIV-infected women. HIV-infected women had the same prevalence of insomnia compared to non–HIV-infected women [85]. Joint aches are also commonly reported in the perimenopausal period, with prevalence as high as 50% to 60% among perimenopausal women in the United States [52,53]. In HIV-infected women, Miller et al found that 63% of menopausal women reported arthralgia [56].
Treatment
For women experiencing severe hot flashes and vaginal dryness, short-term menopausal hormone therapy (MHT) is indicated to relieve symptoms. MHT should be limited to the shortest period of time at the lowest effective dose as MHT is associated with increased risks of breast cancer, cardiovascular disease, thromboembolism, and increased morbidity [86]. Despite the increased severity of menopausal symptoms experienced among HIV-infected women, the prevalence of the use of MHT in this population is lower compared to non–HIV-infected women [85].
Topical treatment is recommended for women who are experiencing solely vaginal atrophy. First-line treatment is topical nonhormonal therapy such as moisturizers and lubricants [87]. If symptoms are not relieved, then topical vaginal estrogen therapy is recommended [87]. Although topical therapy can result in estrogen absorption into the circulation, it is to a much lesser extent than systemic estrogen therapy [88].
Overall, there is lack of data on the potential interactions between MHT and HAART. Much of the potential interactions are inferred from pharmacokinetic and pharmacodynamics studies between HAART and oral contraceptives. Hormone therapy, protease inhibitors (PIs), colbicistat, and non-nucleoside reverse transcriptase inhibitors (NNRTIs) are all metabolized by the CYP3A4 enzyme [89–91]. Current evidence suggests that concomitant use of hormone therapy with NNRTIs and PIs does not significantly alter the pharmacokinetics of HAART or the clinical outcomes of HIV [91]. However, there is evidence that concomitant use of nevirapine and PIs boosted with ritonavir leads to decrease in estrogen levels so higher doses of MHT may have to be used to achieve symptomatic relief [91]. There is no data on the interaction between PIs boosted with colbicistat and estrogen [92]. Integrase inhibitors, nucleoside and nucleotide reverse transcriptase inhibitors (NRTIs), and the CCR5 antagonist maraviroc have no significant interactions with estrogen containing compounds [89,90,92].
Cardiovascular Risk
Estrogen deficiency resulting from menopause leads to several long-term effects, including cardiovascular disease and osteoporosis. The loss of protective effects of estrogen leads to an increased risk of cardiovascular disease particularly with changes in lipid profiles [93]. Perimenopausal women experience changes in body composition with increased fat mass and waist circumference, as well as dyslipidemia and insulin resistance, all of which are associated with higher risk of cardiovascular disease [94].
HIV infection also incurs a higher risk of cardiovascular disease [95–99]. The inflammatory effects of HIV, HAART, and traditional risk factors including dyslipidemia all contribute to cardiovascular disease but the degree to which each factor contributes to elevated risk is unknown [95,98]. In addition, modifiable risk factors for cardiovascular disease such as decreased fitness and smoking are more commonly seen in HIV-infected women [100]. Even prior to menopause, HIV-infected women experience lipodystrophy syndrome with increase in truncal visceral adiposity and decrease in subcutaneous fat and muscle mass [101,102]. Whether such changes in body composition are exacerbated during the perimenopausal period remain unclear. In the SWEET study, which focused on 702 South African women among whom 21% were HIV-infected, there was lower lean mass but minimal difference in the fat mass of postmenopausal women compared to premenopausal women [103]. As the study was based in South Africa with only 21% HIV-infected, the results of this study should be viewed with caution. While changes in body composition were not observed in postmenopausal women in the SWEET study, increased truncal adiposity seen in premenopausal HIV-infected women is likely to pose an additional risk for cardiovascular disease during the menopause transition.
Several studies have been conducted to demonstrate an increased risk of cardiovascular disease, especially among young HIV-infected men [95–99]. However, no study has focused specifically on the risk of cardiovascular disease in postmenopausal HIV-infected women to date. Despite the lack of studies, it is plausible that the increased risk of cardiovascular disease seen in HIV infection is likely to be compounded with the increased risk seen during menopause. Postmenopausal HIV-infected women may be at significantly higher risk of cardiovascular disease. Appropriate measures such as lipid control, antiplatelet therapy, smoking cessation, and other lifestyle changes should be initiated as in any other population. Further studies are necessary focusing on the effects of menopause on cardiovascular disease risk in HIV-infected women.
Osteoporosis
Menopause, with its associated estrogen deficiency, is the most important risk factor associated with increased bone turnover and bone loss and can worsen HIV associated bone loss [104]. Among HIV-infected individuals, low bone mineral density (BMD) has been described even among premenopausal women and younger men [105–107]. Evidence suggests that the decreased BMD associated with HIV stabilizes or even improves after initiation of HAART in the younger population [105–107]. However, once HIV-infected women enter menopause, they have higher rates of bone loss compared to non–HIV-infected women with significantly increased prevalence of osteoporosis compared to non–HIV-infected women [108–112].
Chronic inflammation by HIV stimulates osteoclast differentiation and resorption [113]. In addition, HAART [114–116], vitamin D deficiency [117], low BMI, poor nutrition [118], inactivity, use of tobacco, alcohol, and illicit drugs [119,120], and coinfection with hepatitis B and C [121] all appear to contribute to decreased BMD among HIV-infected men and women [118]. Among HIV-infected postmenopausal women, those taking ritonavir were found to have increased differentiation of osteoclast cells and increased bone loss [122]. Similarly, methadone use in postmenopausal women has been associated with increased BMD decline [123]. African-American, HIV-infected postmenopausal women appear to be at the greatest risk for bone loss [109].
Multiple studies focusing on HIV-infected men have demonstrated an increased prevalence of fractures compared to non–HIV-infected men [124–126]. However, current studies on postmenopausal HIV-infected women demonstrate that fracture incidence is similar between HIV-infected and non–HIV-infected postmenopausal women [108,112]. Nevertheless, given the evidence of low BMD and increased fracture risk seen during menopause among non–HIV-infected women compounded with the additional bone loss seen in HIV-infected individuals, enhanced screening in postmenopausal HIV-infected women is prudent. Although the U.S. Preventive Services Task Force (USPSTF) makes no mention of HIV as a risk factor for enhanced screening [127] and the Infectious Diseases Society of America (IDSA) only recommends screening beginning at the age of 50 years old if there are additional risk factors other than HIV [128], the more recently published Primary care guidelines for the management of persons infected with HIV recommends screening postmenopausal women ≥ 50 years of age with dual-energy X-ray absorptiometry (DEXA) scan [86]. Preventative therapy such as smoking cessation, adequate nutrition, alcohol reduction, weight bearing exercises, and adequate daily vitamin D and calcium should be discussed and recommended in all menopausal HIV-infected women [129]. If the DEXA scan shows osteoporosis, bisphosphonates or other medical therapy should be considered. Although the data are limited, bisphosphonates have been shown to be effective in improving BMD [130–132].
Cognition
The menopause transition is characterized by cognitive changes such as memory loss and difficulty concentrating [133–136]. Both HIV-infected men and women are at higher risk of cognitive impairment [137–139]. Cognitive impairment can range from minor cognitive-motor disorder to HIV-associated dementia due to the immunologic, hormonal, and inflammatory effects of HIV on cognition [137–139]. In addition, those with HIV infection appear to have increased risk factors for cognitive impairment including low education level, psychiatric illnesses, increased social stress, and chemical dependence [137].
Studies focusing on the effects of both HIV infection and menopause on cognition have been limited thus far. In a cross-sectional study of 708 HIV-infected and 278 non–HIV-infected premenopausal, perimenopausal, and postmenopausal women, Rubin et al demonstrated that HIV infection, but not menopausal stage, was associated with worse performance on cognitive measures [140]. While menopausal stage was not associated with cognitive decline, menopausal symptoms like depression, anxiety, and vasomotor symptoms were associated with lower cognitive performance [140].
Though limited, current data appear to indicate that HIV infection, not menopause, contributes to cognitive dysfunction [140]. Symptoms of menopause, however, do appear to exacerbate cognitive decline indicating the importance of recognition and treatment of menopausal symptoms. This is especially important in HIV-infected women since decrease in cognition and depression can interfere with day to day function including medication adherence [141,142].
Cervical Dysplasia
As more HIV-infected women reach older age, the effects of prolonged survival and especially menopause on squamous intraepithelial lesions (SILs) are being investigated to determine if general guidelines of cervical cancer screening should be applied to postmenopausal women.
In a retrospective analysis of Papanicolaou smear results of 245 HIV-infected women, Kim et al noted that menopausal women had a 70% higher risk of progression of SILs than premenopausal women [143]. Similar results were found in a smaller retrospective study of 18 postmenopausal HIV-infected women in which postmenopausal women had a higher prevalence of SILs and persistence of low-grade SILs [144].
Although studies on progression to cervical cancer in postmenopausal HIV-infected women remain limited, current data suggest that postmenopausal HIV-infected women should continue to be monitored and screened similarly to the screening recommendations for premenopausal women. Nevertheless, further studies examining the natural course of cervical lesions are needed to establish the best practice guidelines for screening postmenopausal women.
HIV Acquisition and Transmission
The incidence of new HIV infections in older American women has increased. HIV acquisition from heterosexual contact appears to be higher in older women compared to younger women, with a study suggesting that women over age 45 years had almost a fourfold higher risk of HIV acquisition compared to those under the age of 45 years [145]. While the lack of awareness of HIV risk and less frequent use of protection may contribute to increases in new HIV infection in older women, hormonal changes associated with older age, specifically menopause, may be playing a role. Vaginal wall thinning that occurs during menopause may serve as a risk factor for HIV acquisition.
In a study by Meditz et al, the percentage of endocervical or blood CD4 T cells did not differ between premenopausal and postmenopausal women, but postmenopausal women had greater percentage of CCR5 expression. As CCR5 serves as an entry point of HIV into target cells, this suggests the possibility that postmenopausal women may be at increased risk for HIV acquisition [146]. More recently, Chappell et al also revealed that anti-HIV-1 activity was significantly decreased in postmenopausal compared to premenopausal women, suggesting that there may be an increased susceptibility to HIV-1 infection in postmenopausal women [147]. Hence there appears to be menopause-related immunologic changes of the cervix that may contribute to an increased risk of HIV acquisition in postmenopausal women.
In contrast, although data is limited, postmenopausal HIV-infected women do not appear to be at increased risk of transmitting HIV to non–HIV-infected individuals. Melo et al compared the intensity of HIV shedding between premenopausal and postmenopausal women and found that HIV shedding did not differ between premenopausal or postmenopausal women [148].
HIV Progression
Several studies have focused on the effects of HIV infection on menopause, but minimal data are available on the effects of menopause on the progression of HIV infection. With prior data suggesting that younger persons experience better immunological and virological responses to HAART [149–151], it has previously been hypothesized that virologic and immunologic responses to HAART can decline once HIV-infected women reach menopause. However, current evidence suggests that treatment responses to HAART, determined by the median changes in CD4 cell counts and percentages and viral load, in HAART-naive patients did not differ between premenopausal and postmenopausal women [152]. In addition, there appears to be no significant changes in CD4 cell counts as HIV-infected women progress through menopause [153]. These studies suggest that menopause does not affect the progression of HIV and that HAART-naive women should respond to HAART regardless of their menopausal status.
Conclusion
As HIV-infected individuals live longer, increasing number of women will enter into menopause and live many years beyond menopause. HIV-infected women experience earlier and more severe menopausal symptoms, but knowledge is still lacking on the appropriate management of these symptoms. In addition, current evidence suggests that immunosuppression associated with HIV contributes to an early onset of menopause which leads to increased risks of cardiovascular disease, osteoporosis, and progression of cervical dysplasia. These conditions require proper surveillance and can be prevented with improved understanding of influences of menopause on HIV-infected women. Furthermore, although there is some evidence suggesting that menopause has no effect on HIV transmission and progression, further studies on the immunologic and virologic effects of menopause are necessary.
There still remain significant gaps in our understanding of menopause in HIV-infected women. As practitioners encounter an increasing number of perimenopausal and postmenopausal HIV-infected women, future studies on the effects of HIV on co-morbidities and symptoms of menopause and their appropriate management are necessary to improve care of women living with HIV.
Corresponding author: Lori E. Fantry, MD, MPH, 29 S. Greene St., Suite 300, Baltimore, MD 21201, [email protected].
Financial disclosures: None.
1. CASCADE Collaboration. Survival after introduction of HAART in people with known duration of HIV-1 infection. Lancet 2000;355:1158–9.
2. Brooks JT, Buchaz K, Gebo KA, Mermin J. HIV infection and older Americans: the public health perspective. Am J Pub Health 2012;102:1516–26.
3. Munster K, Helm P, Schmidt L. Secondary amenorrhea: Prevalence and medical contract–A cross sectional study from a Danish county. Br J Obstet Gynecol 1992;99:430–3.
4. Vyver E, Steinegger C, Katzman DK, et al. Eating disorders and menstrual dysfunction in adolescents. Ann N Y Acad Sci 2008;1135:253–64.
5. Abs R, Verhelst J, Maeyaert J, et al. Endocrine consequences of long-term intrathecal administration of opioids. J Clin Endocrinol Metab 2000;85:2215–22.
6. Pelosi MA, Sama JC, Caterini H, et al. Galactorrhea-amenorrhea syndrome associated with heroin addiction. Am J Obstet Gynecol 1974;118:966–70.
7. Bai J, Greenwald E, Caterini H, et al. Drug-related menstrual aberrations. Obstet Gynecol 1974;44:713–9.
8. Chirgwin KD, Feldman J, Muneyyirci-Delale O, et al. Menstrual function in HIV-infected women without AIDS. J Acquir Immune Defic Syndr Hum Retrovirol 1996;12:489–94.
9. Clark RA, Mulligan K, Stamenovic E, et al. Frequency of anovulation and early menopause among women enrolled in selected adult AIDS clinical trials group studies. J Infect Dis 2001;184:1325–7.
10. Watts DH, Spino C, Zaborski L. Comparison of gynecologic history and laboratory results in HIV-positive women with CDR+ lymphocyte counts between 200 and 500 cells/µl and below 100 cells/ µl. J Acquir Immune Defic Syndr Hum Retrovirol 1999;20:455–62.
11. Ellerbrock TV, Wrig TC, Bush TJ, et al. Characteristics of menstruation in women infected with HIV. Obstet Gynecol 1996;87:1030–4.
12. Shah PN, Smith JR, Wells C, et al. Menstrual symptoms in women infected by the HIV. Obstet Gynecol 1994;83:397–400.
13. Harlow SC, Schuman P, Cohen M, et al. Effect of HIV infection on menstrual cycle length. J Acquir Immune Defic Syndr Hum Retrovirol 2000;24:68–75.
14. Grinspoon S, Corocran C, Miller K, et al. Bone composition and endocrine function in women with AIDS wasting. J Clin Edocrinol Metab 1997;82:1332–7.
15. Research on the menopause in the 1990s. Report of a WHO scientific group. World Health Organ Tech Rep Ser 1996;866:1–107.
16. Cejtin HE, Kalinowski A, Bacchetti P. Effects of human immunodeficiency virus on protracted amenorrhea and ovarian dysfunction. Obstet Gynecol 2006;108:1423–31.
17. Freeman EW, Sammel MD, Garcia CR, et al. Follicular phase hormone levels and menstrual bleeding status in the approach to menopause. Fertil Steril 2005;83:383–92.
18. Soules MR, Sherman S, Parrott E, et al. Executive summary: Stages of Reproductive Aging Workshop (STRAW). Fertil Steril 2001;76:874–8.
19. Gold EB, Crawford SL, Avis NE, et al. Factors related to age at natural menopause: longitudinal analyses from SWAN. Am J Epidemiol 2013;178:70–83.
20. Thomas F, Renaud F, Benefice E, et al. International variability of ages at menarche and menopause: patterns and main determinants. Hum Biol 2001;73:271–90.
21. Shuster LT, Rhodes DJ, Gostout BS, et al. Premature menopause or early menopause: long-term health consequences. Maturitas 2010;65:161–6.
22. Carr MC. The emergence of the metabolic syndrome with menopause. J Clin Endocrinol Metab 2003;88:2404–11.
23. Wellons M, Ouyang P, Schreiner PJ, et al. Early menopause predicts future coronary heart disease and stroke: the multi-ethnic study of atherosclerosis. Menopause 2012;19:1081–7.
24. Rocca WA, Grossardt BR, Miller VM, et al. Premature menopause or early menopause and risk of ischemic stroke. Menopause 2012;19:272–7.
25. Svejme O, Ahlborg HG, Nilsson JA, et al. Early menopause and risk of osteoporosis, fracture and mortality: a 34-year prospective observational study in 390 women. BJOG 2012;119:810–6.
26. Cooper GS, Sandler DP, Bohlig M. Active and passive smoking and the occurrence of natural menopause. Epidemiology 1999;10:771–3.
27. Luoto R, Kaprio J, Uutela A. Age at natural menopause and socioeconomic status in Finland. Am J Epidemiol 1994;139:64–76.
28. Bromberger JT, Matthews KA, Kuller LH, et al. Prospective study of the determinants of age at menopause. Am J Epidemiol 1997;145:24–33.
29. Gold EB, Crawford SL, Avis NE, et al. Factors related to age at natural menopause: longitudinal analyses from SWAN. Am J Epidemiol 2013;178:70–83.
30. Tziomalos K, Charsoulis F. Endocrine effects of tobacco smoking. Clin Endocrinol 2004;61:664–74.
31. Potter DA, Moreno A, Luther MF, et al. Effects of follicular-phase cocaine administration on menstrual and ovarian cyclicity in rhesus monkeys. Am J Obstet Gynecol 1998;178:118–25.
32. Mdodo R, Frazier EL, Dube SR, et al. Cigarette smoking prevalence among adults with HIV compared with the general adult population in the United States: Cross-sectional survey. Ann Intern Med 2015;162:335–44.
33. Centers for Disease Control and Prevention (CDC). Vital signs: current cigarette smoking among adults aged ≥ 18 years–United States, 2005-2010. MMWR Morb Mortal Wkly Rep 2011;60:1207–12.
34. Feldman J, Mikoff H, Schneider M, et al. Association of cigarette smoking with HIV prognosis among women in the HAART era: A report from the Women’s Interagency HIV study. Am J Public Health 2006:96:1060–5.
35. Centers for Disease Control and Prevention. Estimated HIV incidence among adults and adolescents in the United States, 2007–2010. HIV Surveillance Supplemental Report 2012;17(4).
36. Galea S, Ahren J, Vlahov D. Contextual determinants of drug use risk behavior: a theoretical framework. J Urban Health 2003;80:50–8.
37. de Pommerol M, Hessamfar M, Lawson-Ayayi S, et al. Menopause and HIV infection: age at onset and associated factors, ANRS CO3 Aquitaine cohort. Int J STD AIDS 2011;22:67–72.
38. Ferreira CE, Pinto-Neto AM, Conde DM, et al. Menopausal symptoms in women infected with HIV: prevalence and associated factors. Gynecol Endocrinol 2007;23:198–205.
39. Clark RA, Cohn SE, Jarck C, et al. Perimenopausal symptomatology among HIV infected women at least 40 years of age. J Acquir Immune Defic Syndr Hum Retrovirol 2000;23:99–100.
40. Fantry L, Zhan M, Taylor G, et al. Age at menopause and menopausal symptoms in HIV-infected women. AIDS Patient Care STD 2005;19:703–11.
41. Calvet G, Grinsztejn G. Predictors of early menopause in HIV infected women: a prospective cohort study. Am J Obstet Gynecol 2015;212:765.
42. Boonyanurak P, Bunupuradah T, Wilawan K, et al. Age at menopause and menopause-related symptoms in human immunodeficiency virus-infected Thai women. Menopause 2012;19:820–4.
43. Cejtin SH, Taylor R, Watts DH. Assessment of menopausal status among women in the Women’s Interagency HIV study (WIHS). Proceedings of the 57th International AIDS Conference 2004; Bangkok, Thailand.
44. WIHS Data Management and Analysis Center (WDMAC). Women’s Interagency HIV Study (WIHS) Dossier. October 2014. Available at https://statepiaps.jhsph.edu/wihs/invest-info/dossier.pdf.
45. Schoenbaum E, Hartel D, Lo Y, et al. HIV infection, drug use, and onset of natural menopause. Clinical Infect Dis 2005;41:1517–24.
46. Taffe JR, Dennerstein L. Menstrual patterns leading to the final menstrual period. Menopause 2002;9:32–40.
47. Miro F, Parker SW, Aspinall LJ, et al. Origins and consequences of the elongation of the human menstrual cycle during the menopausal transition: the FREEDOM Study. J Clin Endocrinol Metab 2004;89:4910–5.
48. Harlow SD, Gass M, Hall JE, et al. Executive summary of the Stages of Reproductive Aging Workshop + 10: addressing the unfinished agenda of staging reproductive aging. J Clin Endocrinol Metab 2012;97:1159–68.
49. Freeman EW, Sammel MD, Gracia CR, et al. Follicular phase hormone levels and menstrual bleeding status in the approach to menopause. Fertil Steril 2005;83:383–92.
50. Burger HG, Hale GE, Dennerstein L, Robertson DM. Cycle and hormone changes during perimenopause: the key role of ovarian function. Menopause 2008;15:603–12.
51. McKinlay SM, Brambilla DJ, Posner JG. The normal menopause transition. Maturitas 1992;14:103–15.
52. Szoeke CE, Cicuttini F, Guthrie J, Dennerstein L. Self-reported arthritis and the menopause. Climacteric 2005;8:49–55.
53. Blümel JE, Chedraui P, Baron G, et al. Menopause could be involved in the pathogenesis of muscle and joint aches in mid-aged women. Maturitas 2013;75:94–100.
54. Woods NF, Mitchell ES. Symptoms interference with work and relationships during the menopausal transition and early postmenopause: observations from the Seattle Midlife Women’s Health Study. Menopause 2011;18:654–61.
55. Johnson TM, Cohen HW, Howard AA, et al. Attribution of menopause symptoms in human immunodeficiency virus–infected or at-risk drug-using women Menopause 2008;15:551–7.
56. Miller SA, Santoro N, Lo Y. Menopausal symptoms in HIV-infected and drug-using women. Menopause 2005;12:348–56.
57. Looby S, Shifren J, Corless I. Increased hot flash severity and related interference in perimenopausal HIV-infected women. Menopause 2014;21:403–9.
58. Thurston RC, Joffe H. Vasomotor symptoms and menopause: findings from the Study of Women’s Health across the Nation. Obstet Gynecol Clin North Am 2011;38:489–501.
59. Woods NF, Mitchell ES. Symptoms during the perimenopause: prevalence, severity, trajectory, and significance in women’s lives. Am J Med 2005;118 Suppl 12B:14.
60. Maki PM, Rubin LH, Cohen M, et al. Depressive symptoms are increased in the early perimenopausal stage in ethnically diverse human immunodeficiency virus-infected and human immunodeficiency virus-uninfected women. Menopause 2012;19:1215–33.
61. Dennerstein L, Dudley EC, Hopper JL, et al. A prospective population-based study of menopausal symptoms. Obstet Gynecol 2000;96:351–8.
62. Palma F, Volpe A, Villa P, et al. Vaginal atrophy of women in postmenopause. Results from a multicentric observational study: The AGATA study. Maturitas 2015 Sep 14.
63. Cutler WB, Garcia CR, McCoy N. Perimenopausal sexuality. Arch Sex Behav 1987;16:225–34.
64. Moreira ED, Glasser DB, Nicolosi A, et al. GSSAB Investigators’ Group. Sexual problems and help-seeking behavior in adults in the United Kingdom and continental Europe. BJU Int 2008;101:1005–11.
65. MacBride MB, Rhodes DJ, Shuster LT. Vulvovaginal atrophy. Mayo Clin Proc 2010;85:87–94.
66. Nappi RE, Kokot-Kierepa M. Women’s voices in the menopause: results from an international survey on vaginal atrophy. Maturitas 2010;67:233–8.
67. Santoro N, Komi J. Prevalence and impact of vaginal symptoms among postmenopausal women. J Sex Med 2009;6:2133–42.
68. Levine KB, Williams RE, Hartmann KE. Vulvovaginal atrophy is strongly associated with female sexual dysfunction among sexually active post-menopausal women. Menopause 2008;15(4 Pt 1):661–6.
69. Cumming GP, Currie HD, Moncur R, Lee AJ. Web-based survey on the effect of menopause on women’s libido in a computer-literate population. Menopause Int 2009;15:8–12.
70. Valadares AL, Pinto-Neto AM, Conde DM, et al. A population-based study of dyspareunia in a cohort of middle-aged Brazilian women. Menopause 2008;15:1184–90.
71. Latthe P, Migini L, Gray R, et al. Factors predisposing women to chronic pelvic pain: a systemic review. BMJ 2006;332:749–55.
72. Valadares AL, Pinto-Neto AM, Gomes D, et al. Dyspareunia in HIV-positive and HIV-negative middle-aged women: a cross-sectional study. BMJ Open 2014;4:e004974.
73. Bromberger JT, Meyer PM, Kravitz HM, et al. Psychologic distress and natural menopause: a multiethnic community study. Am J Public Health 2001;91:1435–42.
74. Avis NE, Brambilla D, McKinlay SM, Vass K. A longitudinal analysis of the association between menopause and depression. Results from the Massachusetts Women’s Health Study. Ann Epidemiol 1994;4:214–20.
75. Cohen LS, Soares CN, Joffe H. Diagnosis and management of mood disorders during the menopausal transition. Am J Med 2005;118 Suppl 12B:93–7.
76. Freeman EW, Sammel MD, Lin H, Nelson DB. Associations of hormones and menopausal status with depressed mood in women with no history of depression. Arch Gen Psychiatry 2006;63:375–82.
77. Eller LS, Corless I, Bunch EH, et al. Self-care strategies for depressive symptoms in people with HIV disease. J Adv Nurs 2005;51:119–30.
78. Fuh JL, Wang SJ, Lee SJ, et al. A longitudinal study of cognition change during early menopausal transition in a rural community. Maturitas 2006;53:447–53.
79. Greendale GA, Huang MH, Wight RG, et al. Effects of the menopause transition and hormone use on cognitive performance in midlife women. Neurology 2009;72:1850–7.
80. Hinkin CH, Castellon SA, Atkinson JH, et al. Neuropsychiatric aspects of HIV infection among older adults. J Clin Epidemiol 2001;54:S44–52.
81. Kravitz HM, Ganz PA, Bromberger J, et al. Sleep difficulty in women at midlife: a community survey of sleep and the menopausal transition. Menopause 2003;10:19–28.
82. Freedman RR, Roehrs TA. Effects of REM sleep and ambient temperature on hot flash-induced sleep disturbance. Menopause 2006;13:576–83.
83. Erlik Y, Tataryn IV, Meldrum DR, et al. Association of waking episodes with menopausal hot flushes. JAMA 1981; 245:1741–4.
84. Freedman RR, Roehrs TA. Sleep disturbance in menopause. Menopause 2007;14:826–9.
85. Lui-Filho JF, Valadares AR, Gomes D, et al. Menopausal symptoms and associated factors in HIV-positive women. Maturitas 2013;76:172–8.
86. Aberg JA, Gallant JE, Ghanem KG, et al, Infectious Diseases Society of America. Primary care guidelines for the management of persons infected with HIV: 2013 update by the HIV medicine association of the Infectious Diseases Society of America. Clin Infect Dis 2014;58:e1–34.
87. The role of local vaginal estrogen for treatment of vaginal atrophy in postmenopausal women: 2007 position statement of The North American Menopause Society. Menopause 2007;14:357–69.
88. Dorr MB, Nelson AL, Mayer PR, et al. Plasma estrogen concentrations after oral and vaginal estrogen administration in women with atrophic vaginitis. Fertil Steril 2010;94:2365–8.
89. El-Ibiary SY, Cocohoba JM. Effects of antiretrovirals on the pharmacokinetics of hormonal contraception. Eur J Contracept Reprod Health Care 2008;13:123–32.
90. Tittle V, Bull L, Boffito M, Nwokolo N. Pharmacokinetic and pharmacodynamics drug interactions between antiretrovirals and oral contraceptives. Clin Pharmacokinet 2015;54:23–34.
91. Thurman AR, Anderson S, Doncel G. Effects of hormonal contraception on anti-retroviral drug metabolism, pharmacokinetics and pharmacodynamics. Am J Reprod Immunol 2014:71:523–30.
92. Panel on Antiretroviral Guidelines for Adults and Adolescents. Guidelines for the use of antiretroviral agents in HIV-1-infected adults and adolescents. US. Department of Health and Human Services. Availabe at www.aidsinfo.nih.gov/ContentFiles/AdultandAdolescentGL.pdf.
93. Berg G, Mesch V, Boero L, et al. Lipid and lipoprotein profile in menopausal transition: effects of hormones, age and fat distribution. Hormone Metab Res 2004;36:215–20.
94. Sower M, Zheng H, Tomey K, et al. Changes in body composition in women over six years at midlife: ovarian and chronological aging. J Clin Endocrin Metab 2007;92:895–901.
95. Flooris-Moore M, Howard AA, Lo Y, et al. Increased serum lipids are associated with higher CD4 lymphocyte count in HIV-infected women. HIV Med 2006;7:421–30.
96. Grunfeld C, Delaney JA, Wanke C, et al. Preclinical atherosclerosis due to HIV infection: carotid intima-medial thickness measurements from the FRAM study. AIDS 2009;23:1841–9.
97. Palacios R, Alonso I, Hidalgo A, et al. Peripheral arterial disease in HIV patients older than 50 years of age. AIDS Res Hum Retroviruses 2008;24:1043–6.
98. Hadigan C, Meigs JB, Corcoran C, et al. Metabolic abnormalities and cardiovascular disease risk factors in adults with human immunodeficiency virus infection and lipodystrophy. Clin Infect Dis 2001;32:130–9.
99. Triant VA, Lee H, Hadigan C, Grinspoon SK. Increased acute myocardial infarction rates and cardiovascular risk factors among patients with human immunodeficiency virus disease. J Clin Endocrin Metab 2007;92:2506–12.
100. Dolan SE, Frontera W, Librizzi J et al. The effects of a supervised home based aerobic and progressive resistance training regimen in HIV-infected women: randomized trial. Arch Intern Med 2006;166:1225–31.
101. Grinspoon S, Carr A. Cardiovascular risk and body fat abnormalities in HIV-infected adults. N Engl J Med 2005;352:48–62
102. Study of Fat Redistribution and Metabolic Change in HIV Infection (FRAM). Fat distribution in women with HIV infection. J Acquir Immune Defic Syndr 2006;42:562–71.
103. Jaff NG, Norris SA, Snyman T, et al. Body composition in the study of women entering and in Endocrine Transition (SWEET): A perspective of African women who have a high prevalence of obesity and HIV infection. Metabolism 2015;64:1031–41.
104. Akhter MP, Lappe JM, Davies KM, et al. Transmenopausal changes in the trabecular bone structure. Bone 2007;41:111–6.
105. Cassetti I, Madruga JV, Suleiman JM, et al. The safety and efficacy of tenofovir DF in combination with lamivudine and efavirenz through 6 years in antiretroviral-naive HIV-1-infected patients. HIV Clin Trials 2007;8:164–72.
106. McComsey GA, Kitch D, Daar ES, et al. Bone mineral density and fractures in antiretroviral-naive persons randomized to receive abacavir-lamivudine or tenofovir disoproxil fumarate-emtricitabine along with efavirenz or atazanavir-ritonavir: AIDS Clinical Trials Group A5224s, a substudy of ACTG A5202. J Infect Dis 2011;203:1791–801.
107. Hansen AB, Obel N, Nielsen H, et al. Bone mineral density changes in protease inhibitor-sparing vs. nucleoside reverse transcriptase inhibitor-sparing highly active antiretroviral therapy: Data from a randomized trial. HIV Med 2011;12:157–65.
108. Yin MT, Zhang CA, McMahon DJ, et al. Higher rates of bone loss in postmenopausal HIV-infected women: a longitudinal study. J Clin Endocrinol Metab 2012;97:554–62.
109. Sharma A, Flom PL, Rosen CJ, et al. Racial differences in bone loss and relation to menopause among HIV-infected and uninfected women. Bone 2015;77:24–30.
110. Caputo BV, Traversa-Caputo GC, Costa C, et al. Evaluation of bone alterations in the jaws of HIV-infected menopausal women. Braz Oral Res 2013;27:231–7.
111. Bone mass and mineral metabolism in HIV+ postmenopausal women. Osteoporos Int 2005;26:1345–52.
112. Yin MT, Mcmahon DJ, Ferris DC, et al. Low bone mass and high bone turnover in postmenopausal human immunodeficiency virus-infected women. J Clin Endocrinol Metab 2010;95:620–9.
113. Gibellini D, De Crignis E, Ponti C. HIV-1 triggers apoptosis in primary osteoblasts and HOBIT cells through TNF-alpha activation. J Med Virol 2008;80:1507–14.
114. Tebas P, Powderly WG, Claxton S, et al. Accelerated bone mineral loss in HIV-infected patients receiving potent antiretroviral therapy. AIDS 2000;14:F63–7.
115. Van Rompay KK, Brignolo LL, Meyer DJ, et al. Biological effects of short-term or prolonged administration of 9-[2(phosphonomethoxy)propyl] adenine (tenofovir) to newborn and infant rhesus macaques. Antimicrob Agents Chemother 2004;48:1469–87.
116. Brown TT, Qaqish RB. Antiretroviral therapy and the prevalence of osteopenia and osteoporosis: a meta-analytic review. AIDS 2006;20:2165–74.
117. Dao CN, Patel P, Overton ET, Rhame F, et al. Study to understand the natural history of HIV and AIDS in the era of effective therapy (SUN) investigators. Low vitamin D among HIV-infected adults: prevalence of and risk factors for low vitamin D levels in cohort of HIV-infected adults and comparison to prevalence among adults in the US general population. Clin Infect Dis 2011;52:396–405.
118. Jacobson DL, Spiegelman D, Know TK, Wilson IB. Evolution and predictors of change in total bone mineral density over time in HIV-infected men and women in the nutrition for healthy living study. J Acquir Immune Defic Syndr Hum Retrovirol 2008;49:298–308.
119. Kanis JA, Borgstrom F, De Laet C, et al. Assessment of fracture risk. Osteoporosis Int 2005;16:581–9
120. Pedrazzoni M, Vescovi L, Maninetti M, et al. Effects of chronic heroine abuse on bone and mineral metabolism. Acta Endocrinol 1993;129:42–5.
121. Lo Re V 3rd, Guaraldi G, Leonard MB, et al. Viral hepatitis is associated with reduced bone mineral density in HIV-infected women but not men. AIDS 1990;23:2191–8.
122. Yin MT, Modarresi R, Shane E, et al. Effects of HIV infection and antiretroviral therapy with ritonavir on induction of osteoclast-like cells in postmenopausal women. Osteoporos Int 2011;22:1459–66.
123. Sharma A, Cohen HW, Freeman R, et al. Prospective evaluation of bone mineral density among middle-aged HIV-infected and uninfected women: association between methadone use and bone loss. Maturitas 2011;70:295–301.
124. Triant VA, Brown TT, Lee H, Grinspoon SK. Fracture prevalence among human immunodeficiency virus (HIV)-infected versus non-HIV-infected patients in a large U.S. healthcare system. J Clin Endocrinol Metab 2008;93:3499–504.
125. Womack JA, Goulet JL, Gibert C, et al. Veterans Aging Cohort Study Project Team. Increased risk of fragility fractures among HIV infected compared to uninfected male veterans. PLoS One Feb 16 2011;6:e17217.
126. Young B, Dao CN, Buchacz K, et al, HIV Outpatient Study (HOPS) Investigators. Increased rates of bone fracture among HIV-infected persons in the HIV Outpatient Study (HOPS) compared with the US general population, 2000–2006. Clin Infect Dis 2011;52:1061–8.
127. U.S. Preventive Services Task Force. Screening for osteoporosis: U.S. Preventive Services Task Force recommendation statement. Ann Intern Med 2011; 154:356–64.
128. Aberg JA, Kaplan JE, Libman H, et al; HIV Medicine Association of the Infectious Diseases Society of America. Primary care guidelines for the management of persons infected with human immunodeficiency virus: 2009 update by the HIV medicine Association of the Infectious Diseases Society of America. Clin Infect Dis 2009;49:651–81.
129. National Osteoporosis Foundation. Clinician’s guide to prevention and treatment of osteoporosis 2014. Washington, DC: National Osteoporosis Foundation; 2014.
130. McComsey GA, Tebas P, Shane E, et al. Bone disease in HIV infection: a practical review and recommendations for HIV care providers. Clin Infect Dis 2010;51:937–46.
131. McComsey GA, Kendall MA, Tebas P, et al. Alendronate with calcium and vitamin D supplementation is safe and effective for the treatment of decreased bone mineral density in HIV. AIDS 2007;21:2473–82.
132. Lin D, Rieder MJ. Interventions for the treatment of decreased bone mineral density associated with HIV infection. Cochrane Database Syst Rev 2007:CD005645.
133. Haring B, Leng X, Robinson J. Cardiovascular disease and cognitive decline in postmenopausal women: results from the Women’s Health Initiative Memory Study. J Am Heart Assoc 2013;2:e000369.
134. Soares CN, Maki PM. Menopausal transition, mood, and cognition: an integrated view to close the gaps. Menopause 2010;17:812–4.
135. Greendale GA, Derby CA, Maki PM. Perimenopause and cognition. Obstet Gynecol Clin North Am 2011;38:519–35.
136. Greendale GA, Wight RG, Huang MH, et al. Menopause-associated symptoms and cognitive performance: results from the study of women’s health across the nation. Am J Epidemiol 2010;171:1214–24.
137. Price RW. Neurological complications of HIV infection. Lancet 1996;348:445–52.
138. Antinori A, Arendt G, Becker JT, et al. Updated research nosology for HIV-associated neurocognitive disorders. Neurology 2007;69:1789–99.
139. Gisslén M, Price RW, Nilsson S. The definition of HIV-associated neurocognitive disorders: are we overestimating the real prevalence? BMC Infect Dis 2011;11:356.
140. Rubin LH, Sundermann EE, Cook JA, et al. An investigation of menopausal stage and symptoms on cognition in HIV-infected women. Menopause 2014;21:997–1006.
141. Cook JA, Cohen MH, Burke J, et al. Effects of depressive symptoms and mental health quality of life on use of highly active antiretroviral therapy among HIV-seropositive women. J Acquir Immune Defic Syndr 2002;30:401–9.
142. Cook JA, Grey D, Burke J, et al. Depressive symptoms and AIDS-related mortality among a multisite cohort of HIV-positive women. Am J Pub Health 2004;94:1133–40.
143. Kim SC, Messing S, Shah K, et al. Effects of highly active antiretroviral therapy (HAART) and menopause on risk of progression of cervical dysplasia in human immune deficiency virus (HIV) infected women. Infect Dis Obstet Gynecol 2013;2013:784718.
144. Ceccaldi PF, Ferreira C, Coussy F, et al. Cervical disease in postmenopausal HIV-1 infected women. J Gynecol Obstet Biol Reprod 2010;39:466–70.
145. European Study Group on Heterosexual Transmission of HIV. Comparison of female to male and male to female transmission of HIV in 563 stable couples. BMJ 1992;304:809–13.
146. Meditz AL, Moreau KL, MaWhinney S, et al. CCR5 expression is elevated on endocervical CD4+ T cells in healthy postmenopausal women. J Acquir Immune Defic Syndr 2012;59:221–8.
147. Chappell CA, Isaacs CE, Xu W, et al. The effect of menopause on the innate antiviral activity of cervicovaginal lavage. Am J Obstet Gynecol 2015;213:204.
148. Melo KC, Melo MR, Ricci BV, Segurado AC. Correlates of human immunodeficiency virus cervicovaginal shedding among postmenopausal and fertile-aged women. Menopause 2012;19:150–6.
149. Viard JP, Mocroft A, Chiesi A, et al. Influence of age of CD4 cell recovery in human immunodeficiency virus-infected patients receiving highly active antiretroviral therapy: evidence from the Euro SIDA study. J Infect Dis 2001;193:1290–4.
150. Grabar S, Kousignian I, Sobel A, et al. Immunological and clinical responses to highly active antiretroviral therapy over 50 years of age. Results from the French Hospital Database on HIV. AIDS 2004;18:2029–38.
151. Cuzin L, Delpierre C, Gerard S, et al. Immunologic and clinical responses to highly active antiretroviral therapy in patients with HIV infection aged >50 years. Clin Infect Dis 2007;45:654–7.
152. Patterson KB, Cohn SE, Uynik J, et al. Treatment responses in antiretroviral treatment-naïve premenopausal and postmenopausal HIV-1 infected women: an analysis from AIDS clinical trials group studies. Clin Infect Dis 2009;49:473–6.
153. van Benthem BH, Vernazza P, Coutinho RA, et al. The impact of pregnancy and menopause on CD4 lymphocyte count in HIV-infected women. AIDS 2002;16:919–24.
Incontinentia Pigmenti: Do You Know the Signs?
IN THIS ARTICLE
- Presenting stages
- Diagnostic criteria
- Management of IP
A 21-year-old woman with type 1 diabetes is admitted for recurrent diabetic ketoacidosis. Physical exam reveals hypopigmented, linear, streaky patches on the medial aspects of the bilateral lower legs (Figure 1A). The patient denies tenderness, pruritus, or paresthesia. There is obvious symmetrical hair loss on the lateral aspects of the eyebrows, as well as slightly wooly male-pattern hair distribution with patchy alopecia on the vertex of the head (Figure 1B). She has very poor dentition with hypodontia and malformed teeth (Figure 1C). Her fingernails and toenails appear normal, with no visible atrophy (Figure 1D). What explains her condition?
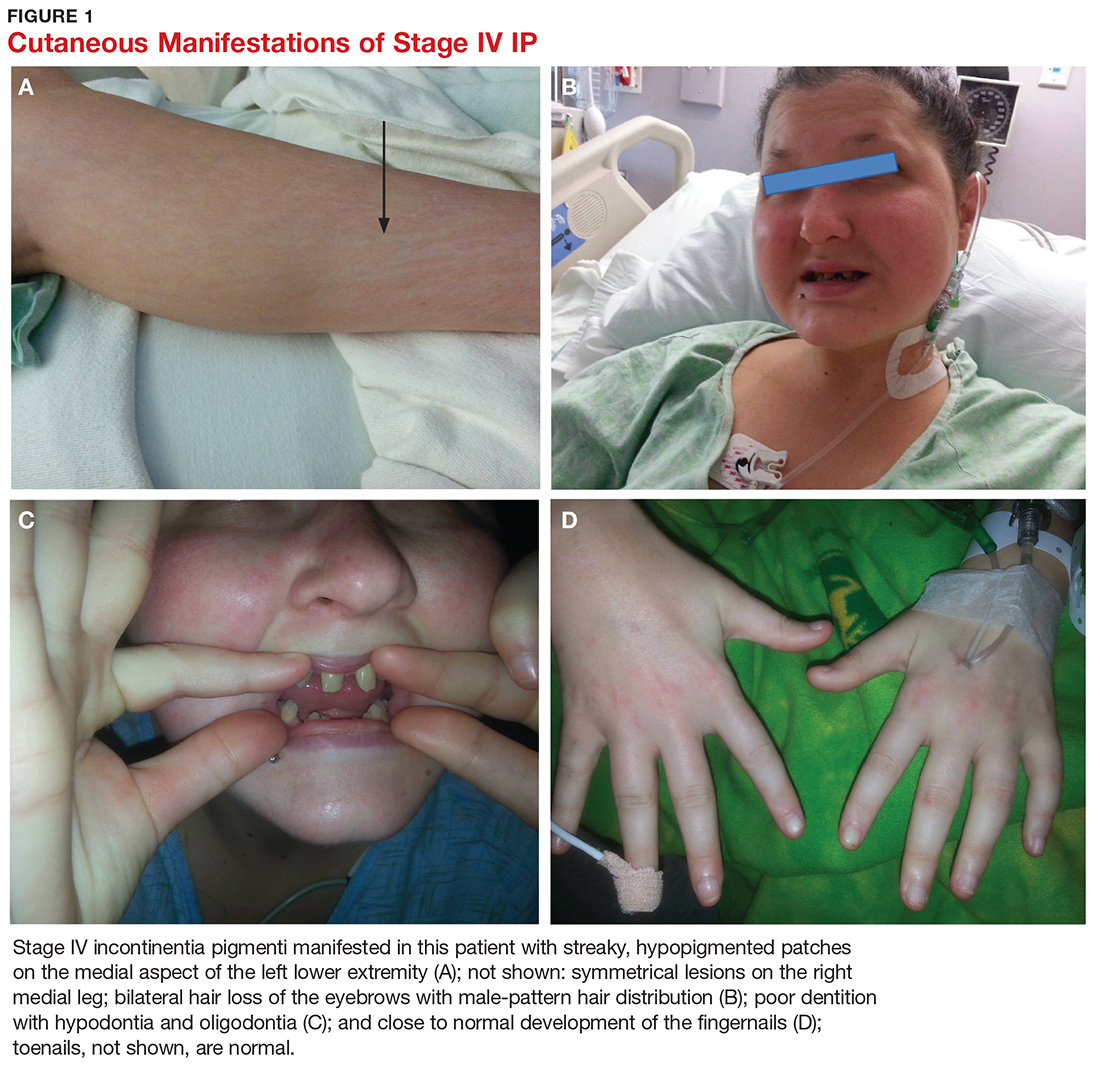
Incontinentia pigmenti (IP), also known as Bloch-Sulzberger syndrome, is a rare, X-linked dominant genodermatosis involving the cutaneous, ophthalmic, neurologic, and dental systems.1-3 It results from X-inactivation due to mutations in the NF-kappaB essential modulator (NEMO) gene with deletion of exons 4-10 in most cases. The NEMO gene encodes a regulatory component of the IkappaB kinase complex required to activate the NF-kappa B pathway, which is important for many immune, inflammatory, and apoptotic processes.4-6 This deletional mutation is typically lethal in normal 46,XY male karyotypes. Male fetuses with this mutation usually die in utero, making the reported cases predominantly female.4,7
The estimated incidence of IP is between 1/10,000 and 1/100,000.4 Due to the rarity of the condition, IP may be underrecognized and underdiagnosed.
CLINICAL PRESENTATION
Characteristic skin lesions of IP begin to develop at birth or in utero, in an evolving pattern that consists of four stages:
- The vesicular stage (stage I) is characterized by linear erythematous papules and blisters that manifest in newborns.
- The verrucous stage (stage II) begins as the blisters start to heal—usually after several weeks—and is distinguished by hyperkeratotic warty papules in linear or swirling distribution. This stage resolves on its own within months.
- The hyperpigmentation stage (stage III) is when swirling macules or patches develop. This hallmark stage of IP tends to remain static until adolescence.
- The hypopigmentation stage (stage IV) manifests with faded streaky patches, which may be subtly atrophic. This final stage usually develops in the second or third decade of life.2,3
All these cutaneous lesions follow Blaschko lines—invisible lines believed to result from embryonic cell migration that become visible with the manifestation of cutaneous or mucous lesions.6
Other associated cutaneous findings include patchy alopecia, nail dystrophy, and oral/dental anomalies such as hypodontia, oligodontia, and tooth deformities. In addition, ophthalmologic involvement can result in strabismus, cataracts, and retinal vascular changes that can lead to blindness. Central nervous system manifestations include seizures, cognitive impairment, and spastic paralysis.3
DIFFERENTIAL DIAGNOSIS
Because IP is uncommon, it may be easily overlooked or misdiagnosed as another, similar cutaneous manifestation. Cutaneous sarcoidosis, for example, is a skin lesion of noncaseating granuloma. It can present as patches, papules, ulcers, scars, ichthyosis, and alopecia. The development of cutaneous sarcoidosis can be idiopathic or iatrogenic, particularly in patients using anti-TNF therapy. The diagnosis is made clinically and can be confirmed pathologically.8
Stage I IP can also be confused with neonatal herpes simplex virus-1 (HSV-1) infection, given the similarities in vesicular morphology and linear distribution. The diagnosis of HSV-1 can be made based on history, physical exam, and pathology. Given the serious sequelae of neonatal HSV-1 infection, antiviral therapy should not be delayed until confirmation of the diagnosis in infants with vesicular eruptions.9
Erythema multiforme (EM) is another dermatologic condition frequently encountered in children and young adults. Its characteristic round target lesion usually has two rings surrounding the dusky-appearing central zone. Atypical lesions can be bullous or crusty, mimicking the appearance of stage I or II IP. EM is usually a self-limiting condition, but specific treatment may be required if the infectious agent is identified.10
Vitiligo, the development of white patches due to the loss of melanocytes, is another item in the differential. Although it most commonly involves the skin, the hair may also be affected. The diagnosis is made clinically and can be confirmed with skin biopsy if needed.11
DIAGNOSIS
Diagnostic criteria for IP have been proposed, with family history playing a role (see Table).2,3,12 Results of a case-study series indicate that 28% of patients with IP have a family history involving at least one first-degree female relative. IP was considered “sporadic” in 62% of cases studied.3
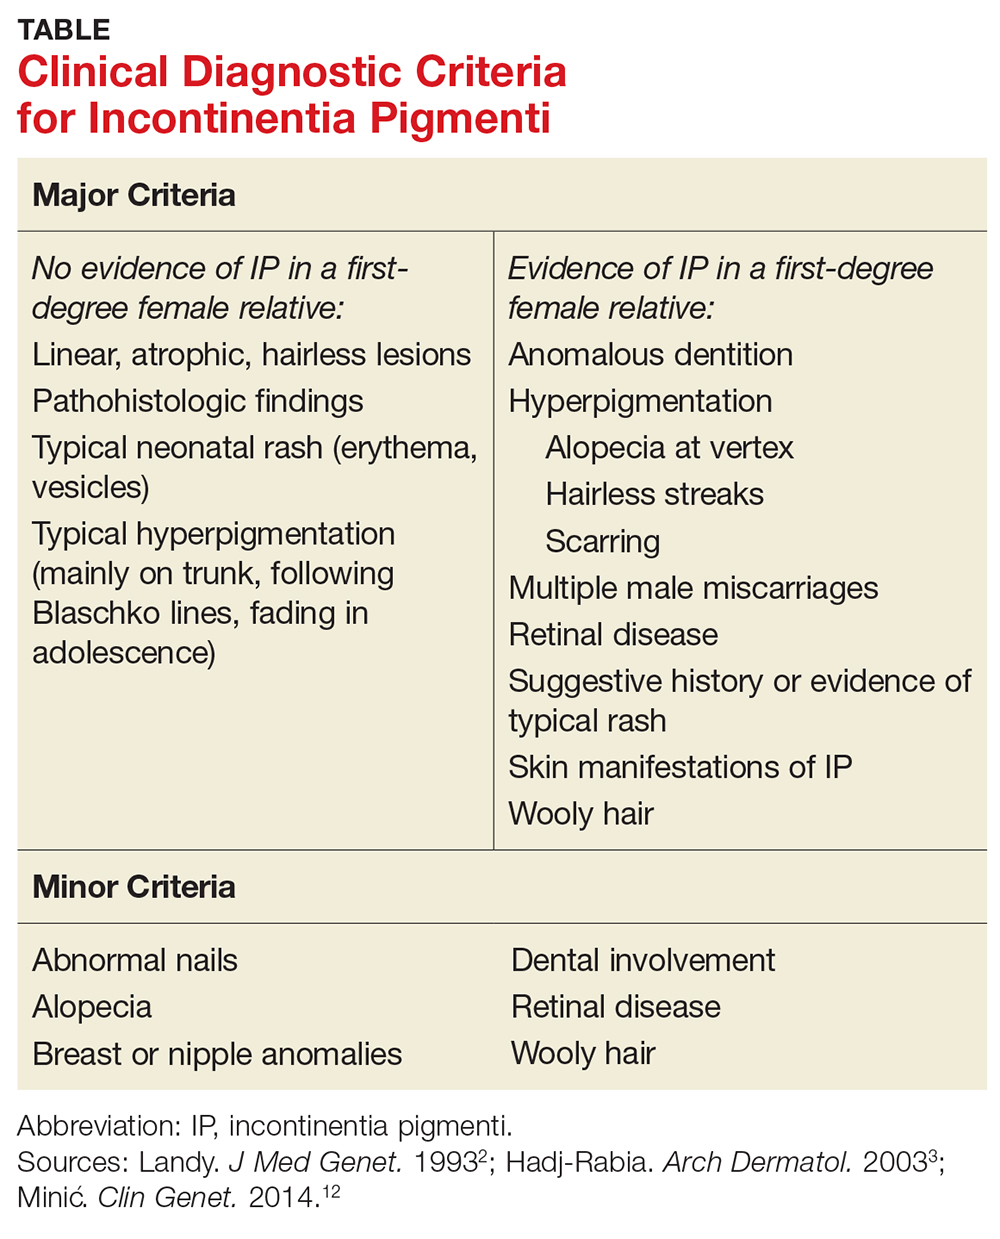
Without a family history of IP, at least one major criterion must be present to support the diagnosis. These include
- Neonatal rash (erythema, vesicles)
- Linear, atrophic, hairless lesions
- Hyperpigmentation (mainly on trunk, following Blaschko lines)
In a patient with a family history of IP, the presence of any major criterion strongly supports the diagnosis. These, as well as minor criteria, are outlined in the Table.2,3,12
In stages I and II of IP, pathologic features include spongiotic dermatitis with characteristic eosinophils and large dyskeratotic cells.3,13 In stage IV, skin biopsies may reveal slight atrophy and scattered apoptotic cells in the epidermis and epidermal hypopigmentation due to reduced melanocytes. The dermis typically appears thickened and is absent hair follicles and sweat glands.14 In a 2014 update, these pathologic features were proposed to be included in the major diagnostic criteria.12
TREATMENT/MANAGEMENT
Treatment of IP is centered on the involved organ systems. For cutaneous lesions, treatment is not usually necessary unless inflammation persists. In such cases, topical steroids or tacrolimus have been used with some success.15,16 In the vesicular stage, the patient should be monitored for bacterial infection, with appropriate prevention or treatment as necessary.
With other involved systems—such as dental, ophthalmologic, or neurologic (eg, seizures or other encephalopathy) anomalies—consultation and follow-up with the relevant specialist is warranted.
In this case, the patient denied family history of IP. She did have a history of infantile cataract and seizure. Her presenting signs were typical of stage IV IP: hypopigmented streaky patches on the skin of the lower legs, dental abnormalities, somewhat wooly hair, alopecia on the head, and loss of hair on the lateral aspects of the eyebrows. The uniqueness of this case is that the patient also had type 1 diabetes, a condition with a strong genetic predisposition. However, there is no evidence supporting an association between IP and either type of diabetes.
CONCLUSION
Although rare, when IP does occur, its manifestations are vast and severe enough to significantly reduce quality of life for patients; when it occurs in males, it is usually lethal. This genetic disorder can affect multiple body systems, making knowledge of its symptoms essential for proper diagnosis. Because its characteristic stages may be present at birth or in infancy, early identification and diagnosis of IP can help guide treatment intervention.
1. Roberts AP. Incontinentia pigmenti (Bloch-Sulzberger). Br Med. J. 1958;1(5079):1106-1107.
2. Landy SJ, Donnai D. Incontinentia pigmenti (Bloch-Sulzberger syndrome). J Med Genet. 1993;30(1):53-59.
3. Hadj-Rabia S, Froidevaux N, Bodak D, et al. Clinical study of 40 cases of incontinentia pigmenti. Arch Dermatol. 2003; 139(9):1163-1170.
4. Smahi A, Courtois G, Vabres P, et al. Genomic rearrangement in NEMO impairs NF-kappaB activation and is a cause of incontinentia pigmenti. Nature. 2000;405(6785):466-472.
5. Aradhya S, Courtois G, Rajkovic A, et al. Atypical forms of incontinentia pigmenti in male individuals result from mutations of a cytosine tract in exon 10 of NEMO (IKK-gamma). Am J Hum Genet. 2001;68(3):765-771.
6. Poziomczyk CS, Recuero JK, Bringhenti L, et al. Incontinentia pigmenti. An Bras Dermatol. 2014;89(1):26-36.
7. Kenwrick S, Woffendin H, Jakins T, et al. Survival of male patients with incontinentia pigmenti carrying a lethal mutation can be explained by somatic mosaicism or Klinefelter Syndrome. Am J Hum Genet. 2001;69(6):1210-1217.
8. Katta R. Cutaneous sarcoidosis: a dermatologic masquerader. Am Fam Physician. 2002;65(8):1581-1584.
9. Faloyin M, Levitt J, Bercowitz E, et al. All that is vesicular is not herpes: incontinentia pigmenti masquerading as herpes simplex virus in a newborn. Pediatrics. 2004;114(2):e270-272.
10. Siedner-Weintraub Y, Gross I, David A, et al. Paediatric erythema multiforme: epidemiological, clinical and laboratory characteristics. Acta Derm Venereol. 2016 Nov 10. doi: 10.2340/00015555-2569.
11. Gawkrodger DJ, Ormerod AD, Shaw L, et al. Guideline for the diagnosis and management of vitiligo. Br J Dermatol. 2008;159(5):1051-1076.
12. Minic´ S, Trpinac D, Obradovic´ M. Incontinentia pigmenti diagnostic criteria update. Clin Genet. 2014;85(6):536-542.
13. Jean-Baptiste S, O’Toole EA, Chen M, et al. Expression of eotaxin, an eosinophil-selective chemokine, parallels eosinophil accumulation in the vesiculobullous stage of incontinentia pigmenti. Clin Exp Immunol. 2002;127(3):470-478.
14. Hadj-Rabia S, Rimella A, Smahi A, et al. Clinical and histologic features of incontinentia pigmenti in adults with nuclear factor-κ B essential modulator gene mutations. J Am Acad Dermatol. 2011;64(3):508-515.
15. Kaya TI, Tursen U, Ikizoglu G. Therapeutic use of topical corticosteroids in the vesiculobullous lesions of incontinentia pigmenti. Clin Exp Dermatol. 2009;34(8):e611-613.
16. Jessup CJ, Morgan SC, Cohen LM, Viders DE. Incontinentia pigmenti: treatment of IP with topical tacrolimus. J Drugs Dermatol. 2009;8(10):944-946.
IN THIS ARTICLE
- Presenting stages
- Diagnostic criteria
- Management of IP
A 21-year-old woman with type 1 diabetes is admitted for recurrent diabetic ketoacidosis. Physical exam reveals hypopigmented, linear, streaky patches on the medial aspects of the bilateral lower legs (Figure 1A). The patient denies tenderness, pruritus, or paresthesia. There is obvious symmetrical hair loss on the lateral aspects of the eyebrows, as well as slightly wooly male-pattern hair distribution with patchy alopecia on the vertex of the head (Figure 1B). She has very poor dentition with hypodontia and malformed teeth (Figure 1C). Her fingernails and toenails appear normal, with no visible atrophy (Figure 1D). What explains her condition?
Incontinentia pigmenti (IP), also known as Bloch-Sulzberger syndrome, is a rare, X-linked dominant genodermatosis involving the cutaneous, ophthalmic, neurologic, and dental systems.1-3 It results from X-inactivation due to mutations in the NF-kappaB essential modulator (NEMO) gene with deletion of exons 4-10 in most cases. The NEMO gene encodes a regulatory component of the IkappaB kinase complex required to activate the NF-kappa B pathway, which is important for many immune, inflammatory, and apoptotic processes.4-6 This deletional mutation is typically lethal in normal 46,XY male karyotypes. Male fetuses with this mutation usually die in utero, making the reported cases predominantly female.4,7
The estimated incidence of IP is between 1/10,000 and 1/100,000.4 Due to the rarity of the condition, IP may be underrecognized and underdiagnosed.
CLINICAL PRESENTATION
Characteristic skin lesions of IP begin to develop at birth or in utero, in an evolving pattern that consists of four stages:
- The vesicular stage (stage I) is characterized by linear erythematous papules and blisters that manifest in newborns.
- The verrucous stage (stage II) begins as the blisters start to heal—usually after several weeks—and is distinguished by hyperkeratotic warty papules in linear or swirling distribution. This stage resolves on its own within months.
- The hyperpigmentation stage (stage III) is when swirling macules or patches develop. This hallmark stage of IP tends to remain static until adolescence.
- The hypopigmentation stage (stage IV) manifests with faded streaky patches, which may be subtly atrophic. This final stage usually develops in the second or third decade of life.2,3
All these cutaneous lesions follow Blaschko lines—invisible lines believed to result from embryonic cell migration that become visible with the manifestation of cutaneous or mucous lesions.6
Other associated cutaneous findings include patchy alopecia, nail dystrophy, and oral/dental anomalies such as hypodontia, oligodontia, and tooth deformities. In addition, ophthalmologic involvement can result in strabismus, cataracts, and retinal vascular changes that can lead to blindness. Central nervous system manifestations include seizures, cognitive impairment, and spastic paralysis.3
DIFFERENTIAL DIAGNOSIS
Because IP is uncommon, it may be easily overlooked or misdiagnosed as another, similar cutaneous manifestation. Cutaneous sarcoidosis, for example, is a skin lesion of noncaseating granuloma. It can present as patches, papules, ulcers, scars, ichthyosis, and alopecia. The development of cutaneous sarcoidosis can be idiopathic or iatrogenic, particularly in patients using anti-TNF therapy. The diagnosis is made clinically and can be confirmed pathologically.8
Stage I IP can also be confused with neonatal herpes simplex virus-1 (HSV-1) infection, given the similarities in vesicular morphology and linear distribution. The diagnosis of HSV-1 can be made based on history, physical exam, and pathology. Given the serious sequelae of neonatal HSV-1 infection, antiviral therapy should not be delayed until confirmation of the diagnosis in infants with vesicular eruptions.9
Erythema multiforme (EM) is another dermatologic condition frequently encountered in children and young adults. Its characteristic round target lesion usually has two rings surrounding the dusky-appearing central zone. Atypical lesions can be bullous or crusty, mimicking the appearance of stage I or II IP. EM is usually a self-limiting condition, but specific treatment may be required if the infectious agent is identified.10
Vitiligo, the development of white patches due to the loss of melanocytes, is another item in the differential. Although it most commonly involves the skin, the hair may also be affected. The diagnosis is made clinically and can be confirmed with skin biopsy if needed.11
DIAGNOSIS
Diagnostic criteria for IP have been proposed, with family history playing a role (see Table).2,3,12 Results of a case-study series indicate that 28% of patients with IP have a family history involving at least one first-degree female relative. IP was considered “sporadic” in 62% of cases studied.3
Without a family history of IP, at least one major criterion must be present to support the diagnosis. These include
- Neonatal rash (erythema, vesicles)
- Linear, atrophic, hairless lesions
- Hyperpigmentation (mainly on trunk, following Blaschko lines)
In a patient with a family history of IP, the presence of any major criterion strongly supports the diagnosis. These, as well as minor criteria, are outlined in the Table.2,3,12
In stages I and II of IP, pathologic features include spongiotic dermatitis with characteristic eosinophils and large dyskeratotic cells.3,13 In stage IV, skin biopsies may reveal slight atrophy and scattered apoptotic cells in the epidermis and epidermal hypopigmentation due to reduced melanocytes. The dermis typically appears thickened and is absent hair follicles and sweat glands.14 In a 2014 update, these pathologic features were proposed to be included in the major diagnostic criteria.12
TREATMENT/MANAGEMENT
Treatment of IP is centered on the involved organ systems. For cutaneous lesions, treatment is not usually necessary unless inflammation persists. In such cases, topical steroids or tacrolimus have been used with some success.15,16 In the vesicular stage, the patient should be monitored for bacterial infection, with appropriate prevention or treatment as necessary.
With other involved systems—such as dental, ophthalmologic, or neurologic (eg, seizures or other encephalopathy) anomalies—consultation and follow-up with the relevant specialist is warranted.
In this case, the patient denied family history of IP. She did have a history of infantile cataract and seizure. Her presenting signs were typical of stage IV IP: hypopigmented streaky patches on the skin of the lower legs, dental abnormalities, somewhat wooly hair, alopecia on the head, and loss of hair on the lateral aspects of the eyebrows. The uniqueness of this case is that the patient also had type 1 diabetes, a condition with a strong genetic predisposition. However, there is no evidence supporting an association between IP and either type of diabetes.
CONCLUSION
Although rare, when IP does occur, its manifestations are vast and severe enough to significantly reduce quality of life for patients; when it occurs in males, it is usually lethal. This genetic disorder can affect multiple body systems, making knowledge of its symptoms essential for proper diagnosis. Because its characteristic stages may be present at birth or in infancy, early identification and diagnosis of IP can help guide treatment intervention.
1. Roberts AP. Incontinentia pigmenti (Bloch-Sulzberger). Br Med. J. 1958;1(5079):1106-1107.
2. Landy SJ, Donnai D. Incontinentia pigmenti (Bloch-Sulzberger syndrome). J Med Genet. 1993;30(1):53-59.
3. Hadj-Rabia S, Froidevaux N, Bodak D, et al. Clinical study of 40 cases of incontinentia pigmenti. Arch Dermatol. 2003; 139(9):1163-1170.
4. Smahi A, Courtois G, Vabres P, et al. Genomic rearrangement in NEMO impairs NF-kappaB activation and is a cause of incontinentia pigmenti. Nature. 2000;405(6785):466-472.
5. Aradhya S, Courtois G, Rajkovic A, et al. Atypical forms of incontinentia pigmenti in male individuals result from mutations of a cytosine tract in exon 10 of NEMO (IKK-gamma). Am J Hum Genet. 2001;68(3):765-771.
6. Poziomczyk CS, Recuero JK, Bringhenti L, et al. Incontinentia pigmenti. An Bras Dermatol. 2014;89(1):26-36.
7. Kenwrick S, Woffendin H, Jakins T, et al. Survival of male patients with incontinentia pigmenti carrying a lethal mutation can be explained by somatic mosaicism or Klinefelter Syndrome. Am J Hum Genet. 2001;69(6):1210-1217.
8. Katta R. Cutaneous sarcoidosis: a dermatologic masquerader. Am Fam Physician. 2002;65(8):1581-1584.
9. Faloyin M, Levitt J, Bercowitz E, et al. All that is vesicular is not herpes: incontinentia pigmenti masquerading as herpes simplex virus in a newborn. Pediatrics. 2004;114(2):e270-272.
10. Siedner-Weintraub Y, Gross I, David A, et al. Paediatric erythema multiforme: epidemiological, clinical and laboratory characteristics. Acta Derm Venereol. 2016 Nov 10. doi: 10.2340/00015555-2569.
11. Gawkrodger DJ, Ormerod AD, Shaw L, et al. Guideline for the diagnosis and management of vitiligo. Br J Dermatol. 2008;159(5):1051-1076.
12. Minic´ S, Trpinac D, Obradovic´ M. Incontinentia pigmenti diagnostic criteria update. Clin Genet. 2014;85(6):536-542.
13. Jean-Baptiste S, O’Toole EA, Chen M, et al. Expression of eotaxin, an eosinophil-selective chemokine, parallels eosinophil accumulation in the vesiculobullous stage of incontinentia pigmenti. Clin Exp Immunol. 2002;127(3):470-478.
14. Hadj-Rabia S, Rimella A, Smahi A, et al. Clinical and histologic features of incontinentia pigmenti in adults with nuclear factor-κ B essential modulator gene mutations. J Am Acad Dermatol. 2011;64(3):508-515.
15. Kaya TI, Tursen U, Ikizoglu G. Therapeutic use of topical corticosteroids in the vesiculobullous lesions of incontinentia pigmenti. Clin Exp Dermatol. 2009;34(8):e611-613.
16. Jessup CJ, Morgan SC, Cohen LM, Viders DE. Incontinentia pigmenti: treatment of IP with topical tacrolimus. J Drugs Dermatol. 2009;8(10):944-946.