User login
Management of Status Epilepticus in Adults
From the Johns Hopkins Hospital, Baltimore, MD (Dr. Ramadan), and the Henry Ford Hospital, Detroit, MI (Dr. Varelas).
Abstract
- Objective: To review the management of status epilepticus (SE).
- Methods: Review of the literature.
- Results: SE is a relatively common condition that accounts for 3% to 5% of all emergency department evaluations for seizure disorders and occurs in 2% to 16% of all epilepsy patients. The 3 most common etiologies are low levels of antiepileptic drugs, remote symptomatic etiologies, and cerebrovascular accidents. The majority of SEs are convulsant, but there is growing awareness of non-convulsive SEs, which can be diagnosed only via electroencephalogram. Management, which must be initiated at the earliest possible time, has evolved to incorporate pre-hospital measures and 4 treatment stages, with supportive measures and benzodiazepine administration remaining the mainstay initially and followed by older and newer antiepileptic drugs and anesthetics for resistant cases.
- Conclusion: SE is a neurological emergency that still carries significant mortality and morbidity if not treated immediately and properly.
Key words: status epilepticus; seizures; convulsive status epilepticus; nonconvulsive status epilepticus.
Status epilepticus (SE) is a relatively common condition that accounts for 3% to 5% of all emergency department (ED) evaluations for seizure disorders and occurs in 2% to 16% of all epilepsy patients [1]. It remains a major neurological emergency that, if not properly and timely treated, leads to death or permanent neurological injury. Since most of patients with convulsive SE are admitted to the hospital via the ED and are then transferred to the intensive care unit (ICU), our focus in this review will be on the latter.
Although only a handful prospective, randomized studies have been reported, guidelines on SE have been published in Europe [2] and the US [3,4]. In this paper, we review the evolving definition and types of SE, its incidence, etiology, and pathophysiology, its diagnosis and treatment algorithms, and its outcome. Our goal is to provide the reader with a concise but thorough review of this still lethal neurological emergency.
Definitions
The International Classification of Epileptic Seizures had previously defined SE as any seizure lasting ≥ 30 minutes or intermittent seizures lasting for > 30 min without recovery of consciousness interictally [5,6]. More recently, a duration of 5 or more minutes of (a) continuous seizures or (b) 2 or more discrete seizures with incomplete recovery of consciousness in-between, proposed by Lowenstein [3,7], offers the advantage of incorporating new knowledge. The shortening of the convulsive period to 5 minutes was based on the fact that the majority of tonic-clonic seizures last for only 1 to 2 minutes, that those lasting > 5 minutes do not stop spontaneously [8], that permanent neuronal injury occurs before 30 minutes, and that refractoriness to treatment increases with longer seizure duration [9].
Refractory SE (RSE) has been defined as SE not controlled after adequate doses of an initial benzodiazepine followed by a second acceptable antiepileptic drug (AED) or SE not controlled after the initial parenteral therapy with a minimum number of standard “front-line” AEDs (either 2 or 3) or SE with a minimum duration of seizures that persist despite treatment (eg, at least or 2 hours) [3,10]. Super-refractory SE (SRSE) is defined as SE that continues or recurs 24 hours or more after the onset of anesthetic therapy or recurs on the reduction or withdrawal of anesthesia [11].
Non-convulsive SE (NCSE) is defined as the presence of altered consciousness or behavior for ≥ 30 minutes, the absence of overt clinical signs of convulsive activity during that period, and the electroencephalographic (EEG) confirmation of seizures or activity that responds to treatment together with improvement of consciousness [12–15]. Two major types of NCSE can be encountered: the one in patients with epileptic encephalopathy/coma and the one in patients with absence or complex partial seizures, who are not usually admitted to ICU and are functional yet impaired. Because of the confusion between these 2 extremes in the NCSE spectrum, working criteria for standardization of reporting, utilizing the frequency of electroencephalographic epileptiform discharges or delta/theta waveforms have been proposed [15]. A recent compendium of 123 cases of NCSE with clinical descriptions and EEG patterns following a syndromic classification approach has also been published [16].
Types of SE
Three major categories of SE have been described: generalized convulsive SE (GCSE), focal motor SE (FMSE or epilepsia partialis continua [EPC]) of Kojevnikov, and NCSE. GCSE and FMSE are easily recognized due to overt convulsions. NCSE, however, has a more obscure phenotype and can be subdivided into a spectrum encompassing typical absence and complex partial SE, atypical absence SE and tonic SE (usually in children with learning disabilities), epileptic behavioral disturbance and psychosis, including Balint–like syndrome [17], confusional states or delirium with epileptiform discharges) and SE in coma (after significant brain injuries, such as hypoxia-ischemia, most commonly encountered in ICUs) [13,18]. The 2 extremes in this NCSE spectrum have completely different prognoses, with absence SE the most benign and SE in coma the most dismal.
Lastly, SE presents either spontaneously or can be “semi-intentional” iatrogenic, encountered either in the neuro-ICU or epilepsy monitoring unit, when AEDs are withdrawn under continuous EEG recording in order for seizures to emerge and be recorded with surface or intracranial electrodes.
Incidence of SE
In a prospective population-based epidemiological study, the incidence of SE was estimated at 41–61/100,000 patients/year. For the US, this translates to 125,000 to 195,000 episodes per year [19].
The highest incidence of SE occurs during the first year of life and during the decades beyond 60 years, and is also dependent on the SE subtype. Partial SE occurs in 25% of cases of SE and NCSE accounts for another 4% to 26 % [19,20], but the incidence for the latter is considered an underestimate due to the need for continuous EEG monitoring (which is not widely available). For example, NCSE was discovered in no patient with acute stroke [21], 8% of comatose ICU patients [22], 7% of patients with intracerebral hemorrhage [23], 3% to 8% of patients with subarachnoid hemorrhage [24–26], 6% of patients with metastatic cancer [27], and 6% of patients with head trauma [28].
The incidence of RSE and SRSE is also unknown. In a recent retrospective study from a neuro-ICU in a West China hospital, the percentage of non-refractory SE, RSE, and SRSE were 67.3%, 20.4% and 12.2%, respectively [29]. Other retrospective studies have shown that 12% to 43% of SE cases become refractory [30–33] and that approximately 10% to 15% of all cases of hospital-admitted SE will become super-refractory at some point, but no prospective studies have been published.
Risk factors that have been identified for RSE are encephalitis as a cause, severe consciousness impairment, de novo episodes of SE, delay in initiation of treatment, NCSE, and focal motor seizures at onset [30,32,34,35]. In a more recent study from ICU patients in Switzerland and the US, acute SE etiology (traumatic brain injuries, cerebrovascular accidents, meningoencephalitis, brain tumors, surgical brain lesions, exposure to, or withdrawal from, recreational drugs, prescription drugs, alcohol, metabolic disturbances and fever), coma/stupor, and serum albumin < 35 g/L at SE onset were independent predictors for RSE [36].
Etiology of SE
The 3 most common etiologies for SE are low levels of antiepileptic drugs (AEDs) in 34% of the cases (usually due to noncompliance), remote symptomatic etiologies (history of neurological insults remote to the first unprovoked SE episode, 24%), and cerebrovascular accidents (ischemic and hemorrhagic strokes, 22%). These are followed by hypoxia (13%) and metabolic disturbances (15%). Because 82% of patients in the remote group have a history of cerebrovascular disease, almost 50% have either acute or remote cerebrovascular disease as etiology of SE [19].

In general ICUs, metabolic abnormalities can account for 33% of seizures, drug withdrawal for 33%, drug toxicity for 14.5%, and stroke for 9% to 39% [37,38]. In ICUs, sepsis remains a common etiology of electrographic seizures or periodic epileptiform discharges [39,40], and legal or illegal drugs, such as ciprofloxacin, levofloxacin, piperacillin/tazobactam, cefepime and carbapenems [41–43], lithium or theophylline intoxication, vigabatrin, tiagabine or crack/cocaine, are another [18] (especially when their metabolism is altered due to interactions with other drugs or when their excretion is impaired due to hepatic or renal failure).
Beyond these common causes of SE, a workup for rare etiologies should be entertained. In a systematic review of 513 papers on SE, 181 uncommon causes of SE were identified and subdivided into immunologically mediated disorders, mitochondrial diseases, rare infectious disorders, genetic disorders, and drugs or toxins [18,44].
The most recent knowledge in this category is the contribution of paraneoplastic or autoimmune conditions to a large percentage of previously cryptogenic pharmaco-resistant seizures or super-refractory SE, most in the context of limbic encephalitis. Many of these patients have never experienced seizures or SE before and a new acronym has been devised for them: new-onset refractory status epilepticus (NORSE), ie, a state of persistent seizures with no identifiable etiology in patients without preexisting epilepsy that lasts longer than 24 hour despite optimal therapy [45]. A growing array of autoantibodies against intracellular and surface or synaptic neuronal targets has been described in addition to the previous literature of Rassmussen’s encephalitis and Hashimoto’s encephalopathy [46]. The most common autoantibodies associated with seizures and SE include anti-Hu, anti-Ma2, anti-CV2/CRMP5, anti-Ri, ANNA3, anti-amphiphysin, anti-NMDA receptor, anti-LGI1 and CASPR2, anti-GABA-beta, anti-GluR3, anti-mGluR5 and alpha 3 ganglionic acetylcholine receptor [47,48]. The diagnosis frequently remains elusive due to lack of knowledge or absence of widespread availability of serologic testing (with sometimes weeks-long delay for the results to be available), but the response to treatment with removal of tumor, plasmapheresis, or immunomodulation and immunosuppression is often dramatic.
Pathophysiology of SE
Most seizures are self-terminating phenomena lasting from a few seconds to a few minutes [49]. One of the distinguishing characteristics of seizures evolving into SE, however, is the switch to a self-sustaining situation, which is time-dependent. Seizures lasting more than 30 minutes would rarely stop spontaneously compared to 47% of those lasting between 10 to 29 minutes, which are self-resolving [50]. Moreover, in one study no self-limited seizure lasted more than 11 minutes [8].
The self-limiting character of seizures is due to inhibitory circuitry that suppresses their duration and propagation in the brain. Under specific circumstances, however, the inhibitory mechanisms fail and seizures progress to SE, which leads to synaptic reorganization, blood-brain barrier disruption, inflammation, metabolic crisis, more tissue damage, and further seizures. Neuronal injury during SE is the result of increased excitotoxicity [51–53] but also stems from systemic derangements such as hypoxia, acidosis, hypotension, or multiorgan dysfunction [54]. The seminal animal studies by Meldrum have shed a light on the systemic effects: after prolonged bicuculine-induced convulsive SE in baboons, neuronal damage and cell loss was evident in the neocortex, cerebellum and hippocampus. When systemic factors were kept within normal physiological limits (paralyzed and artificially ventilated animals with adequate serum glucose levels), there was decreased but still present neocortical and hippocampal cell damage, but absent cerebellar cell injury [55,56]. These experiments showed more than 40 years ago that the seizure activity per se is responsible for the neuronal damage and the systemic derangements play an additional role.
The direct neuronal injury as a result of the ongoing seizures, the perpetuation of seizures into SE, the resistance to treatment and the refractoriness that ensues have also been elucidated at a molecular level during the last decades. Initially, the g-aminobutyric acid (GABA) inhibitory circuits may be deficient and this is the reason why benzodiazepines or barbiturates, which work through GABAergic receptor agonism, are very effective during this early period. As time passes however, GABA receptors undergo a significant shift in their ability to respond to benzodiazepines [57,58]. This is due to changes in receptor presence at the inhibitory synapse, a phenomenon that has been called “receptor trafficking” by Arancibia and Kittler in 2009 [59]. There are differences in the type of GABAA receptors found synaptically and extrasynaptically. GABAA receptors containing the γ subunit are located synaptically and mediate phasic inhibition. Conversely, the δ subunit-containing GABAA receptors are located exclusively extrasynaptically and mediate tonic inhibition [60,61]. Smith and Kittler described the highly dynamic state of receptor presence on the surface of axons and explained how receptors move laterally from extrasynaptic sites to the synapse and then out of it to be internalized and either recycled to the surface or degraded [62]. This “receptor trafficking” intensifies during SE, and the overall effect becomes a reduction in the number of functional GABAA receptors in the synapses. As GABA is the principle inhib-itory transmitter, this reduction in GABAergic activity may be an important reason for seizures to become persistent.
However, this is not all. Additional mechanisms leading to refractoriness include the following:
(a) Excessive relocation of N-methyl-D-aspartate (NMDA)type glutamate receptors to the cell surface after 1 hour of SE, leading to increase of miniature excitatory NMDA currents and NMDA neurotransmission, with potentiation of glutamate excitotoxicity [53,63]
(b) Increased brain expression of drug efflux transporters, such as P-glycoprotein at the blood-brain barrier, which may reduce concentrations of AEDs at their brain targets [64]
(c) Up- and down-regulation of specific ATP-gated ion channels (P2X receptors) inducing altered response to ATP release [65]
(d) Change in the extracellular ionic environment (for example, the normally inhibitory GABAA receptor-mediated currents may become excitatory with changes in extracellular chloride concentrations) [66]
(e) Mitochondrial insufficiency or failure, which would lead to cell necrosis and apoptosis [67]
(f) Inflammatory processes, with opening of the blood-brain barrier (BBB) contributing to perpetuation of seizures [44]. The underlying mechanism is a maladaptive response of the astrocytes to the BBB damage, leading to activation of the innate immune system and disturbed homeostasis of the extracellular potassium and glutamate [68].
(g) Large-scale changes in gene expression within the affected brain regions; these are regulated by micro-RNAs, influencing protein levels playing a role in excitability, neuronal death and neuroinflammation [69].
All of these pathophysiologic derangements may become targets for future antiepileptic treatments.
Although the direct and indirect injury from ongoing convulsive SE is not in doubt, the significance of NCSE or the ictal-interictal continuum on inflicting additional injury has been more controversial. Recent data, however, do not support a benign process in these situations. It has been shown lately that nonconvulsive seizures lead to physiologic changes in the brain, including elevated intracranial pressure, changes in the brain metabolism, and delayed increase in cerebral blood flow [25]. In addition, using microdialysis, elevated lactate/puruvate ratio, indicating metabolic crisis, has been shown during periods of nonconvulsive seizures or periodic discharges [70]. Similarly, high-frequency periodic discharges lead to inadequate increase in cerebral blood flow and tissue hypoxia [71], and lateralized periodic discharges, lateralized rhythmic delta activity, and generalized periodic discharges are associated with seizures [72].
Diagnosis of SE
The diagnosis of SE is primarily clinical and encompasses motor phenomena and alteration of mental status. Focal-onset convulsions can remain focal, follow a Jacksonian march, or immediately generalize to involve the whole body with loss of consciousness. Most of the time, this secondary generalization can only be appreciated during EEG recording. In addition, mental status alteration can differentiate simple partial SE (no change in mental status) from complex partial SE (disturbed sensorium).
The presence or absence of motor phenomena and loss of consciousness do not necessarily correlate with the EEG activity during or after SE. For example, persistent electrographic seizures or NCSE after control of convulsive SE have been demonstrated with continuous EEG [73]. Conversely, altered mental status is also a poor clinical differentiator, since 87% of patients successfully treated for convulsive SE and 100% treated for NCSE remained comatose 12 hours following the initiation of therapy [20]. In addition, only 27% of motor, seizure-like phenomena in the ICU were proven to be seizures in a retrospective study [74]. Psychogenic nonepileptic attacks, occurring in between 3.8% and 9.5% of ICU patients presenting with seizures [74,75], is another situation that may lead to confusion, inappropriate intubation, and ICU admission. Strange phenomena, such as fasciobrachial seizures (brief facial grimacing and ipsilateral arm posturing) many times preceding the onset of amnesia, confusion, or temporal lobe seizures have been described in patients who have non-paraneoplastic limbic encephalitis associated with voltage-gated potassium channel (VGKC) antibodies, especially against the leucine-rich glioma inactivated-1 (LGI1) protein [76,77].Without a continuous video EEG, these phenomena may not be captured or appreciated. Therefore, EEG monitoring is an important tool for the evaluation of these patients and criteria for its use have been published [78]. The EEG criteria for convulsive SE have been clearly delineated, but for NCSE a mix of clinical and EEG criteria should be met [14,15,79].
In addition to clinical observation and EEG, there has been interest lately in multimodality monitoring of acutely brain-injured patients for seizures or SE using electrocorticography or mini depth electrode placement, partial brain tissue oxygen tension, cerebral blood flow, and microdialysis in addition to scalp EEG. Although preliminary and limited in few academic centers, this approach has produced interesting findings. For example, in a study from Columbia University, 38% of 48 patients with subarachnoid hemorrhage and multimodality monitoring had intracortical seizures, while only 8% of them had surface seizures, all nonconvulsive [25]. In another study, 68% of seizures and 23% of periodic discharges were only captured on the depth electrodes and were missed on the surface ones [71]. Therefore, detection of SE may change in the future with use of more sensitive techniques than scalp EEG.
Treatment
Significant practice variations exist in the management of SE even among academic centers in the US [80] despite the fact that the goals of treatment are concrete. These include (1) emergent medical management, (2) termination of seizures, (3) prevention of recurrence of seizures, and (4) prevention or treatment of complications.
Management of SE must begin in a prehospital setting by the emergency medical services, because the faster the treatment is offered, the better the response. Several studies have attempted to assess the possibility of aborting SE even prior to the hospital. In a randomized, double-blinded study, lorazepam was 4.8 times and diazepam 2.3 times more effective than placebo in terminating SE on arrival in the ED when given intravenously (IV) by paramedics [81]. The RAMPART study was a double-blind, randomized, non-inferiority trial comparing the efficacy of intramuscular (IM) midazolam (10 mg followed by placebo IV) with that of IM placebo followed by intravenous lorazepam (4 mg) for children and adults in SE treated by paramedics. At the time of arrival in the ED, seizures had ceased without rescue therapy in 73.4% and 63.4%, respectively, favoring midazolam [82].

Emergent Initial Phase
During the emergent initial phase, the goals are protection of the airway, oxygenation, maintenance of blood pressure, exclusion of easily 
Urgent Control
If seizures continue, stage 2 medications should be used for benzodiazepine-refractory SE as urgent control treatment. There are some data suggesting better response rate to valproate after failure to control seizures with phenytoin than to phenytoin after failure of valproate [88]. If available, IV fosphenytoin is preferable to IV phenytoin due to potentially lower risk of side effects. Levetiracetam and phenobarbital IV are also acceptable choices. Levetiracetam can be administered as an off-label loading dose of 20–60 mg/kg IV (although the initial manufacturer was not supporting a “loading” dose; dose of up to 60 mg/kg IV up to 4500 mg maximum has been supported by the latest American Epilepsy Society guidelines [4]). This AED at an initial dose of 2–3 g/day confers an estimated success rate around 70% [89]. In a systematic review of 27 studies (798 cases of convulsive SE) comparing 5 AEDs in the treatment of benzodiazepine-resistant convulsive SE, phenobarbital and valproate had the highest efficacy (73.6% and 75.7%, respectively), followed by levetiracetam (68.5%) and phenytoin (50.2%). Lacosamide studies were excluded from the meta-analysis due to insufficient data [90], but its efficacy has been reported for patients with convulsive and NCSE [91,92]. There is not enough evidence at this point, however, to recommend its routine use for benzodiazepine refractory SE [90].
Refractory SE
When seizures continue despite the use of benzodiazepines and 2nd stage AEDs, SE becomes refractory (stage 3). Treatment of these resistant cases is frequently initiated in the ED and continued in an ICU. Outcomes were not significantly better in patients with SE admitted and managed in a neuro-ICU compared to a general medical ICU in a retrospective study, but the numbers were small (only 27% of SE were admitted to the former) [93] and this may change in the future. Intubation and mechanical ventilation is the first step, if not already present (only 21% of patients in the RAMPART study received endotracheal intubation, with 6.4% in the prehospital setting and 93.6% after admission [87]). Hemodynamic support with pressors or inotropes may be required as most anesthetic agents may decrease the blood pressure. Because of the urgency of controlling the seizures during SE, the potential aspiration risk and the questionable enteral absorption per os administration of additional AEDs is problematic, and IV formulations should be used.
Currently in the US, phenytoin, valproic acid, phenobarbital, levetiracetam, lacosamide, diazepam, lorazepam are available in IV formulations. In February 2016, the FDA also approved brivaracetam (which also is available in an IV formulation) and in October of the same year IV carbamazepine. None of these AEDs has an FDA indication for SE, although they are widely used. Parenteral lacosamide has a success rate of 33% to 67.7% (200–400 mg over 3–5 min was the most common bolus dose) depending on its use as second or third AED [94–96]. In lacosamide-naive patients with RSE on continuous EEG monitoring, the success rate for cessation of SE was 15.7, 25.5, 58.8, and 82.4 % by 4, 12, 24, and 48 hours, respectively [97]. Alternatively, topiramate in doses 300–1600 mg/day per oro/nasogastric tube can be considered [98]. In a study of 35 patients with RSE treated with topiramate as an adjunct AED, the response rate was 86% (as the third AED), and remained stable at 67% after administration as the fourth to seventh AED. Overall, RSE was terminated in 71% of patients within 72 hours after first administration of topiramate [99]. Other studies, however, adjusting for co-variates, did not prove topiramate to be effective in RSE [100]. Clobazam, a unique oral 1,5-benzodiazepine with excellent absorption, has been also used in the treatment of RSE. Seventeen patients with RSE (11 with prior epilepsy) were successfully treated with clobazam, which was introduced after a median duration of 4 days and after a median of 3 failed AEDs. Termination of RSE within 24 hours of administration, without addition or modification of concurrent AED and with successful wean of anesthetic infusions, was seen in 13 patients, whereas indeterminate response was seen in another 3. Clobazam was deemed unsuccessful in 1 patient [101]. In another recent report of 70 episodes of RSE, clobazam was used in 24 (34.3%) of them. If clobazam was the last AED added to therapy before RSE termination, the success was attributed to this drug. Based on this definition, clobazam led to 6 episodes (25%) of successful RSE resolution [102]. If primary or metastatic brain tumor is the presumed cause of SE, a combination of IV phenytoin, IV levetiracetam (median dose 3 g/d) and enterically administered pregabalin (median dose 375 mg/day) led to 70% control of SE on average 24 hours after addition of the third AED [103]. However, the major treatment options, which should not be delayed in unresponsive RSE, are propofol or midazolam infusions at high rates and under continuous EEG monitoring. These infusions should be continued for at least 24 hours and then held to reassess the situation. By that time, cocurrent metabolic derangements and low AED levels from noncompliance should have been corrected. Prolonged and high-dose propofol should be avoided because of the risk for propofol infusion syndrome, especially if pressors/inotropes are co-infused [104].
Super-refractory SE
Should seizures continue or recur, stage 4 options for SRSE are considered [105]. Pentobarbital with shorter half-life is favored to phenobarbital. The main disadvantages of barbiturates are compromised neuro-exam (which has to be assessed frequently), cardiovascular depression and hypotension, respiratory depression with need for full ventilator support, cough suppression with increased risk for atelectasis and pneumonia, immunosuppression increasing the risk for infection or sepsis, immobility increasing the risk for thromboembolism and ileus mandating parenteral nutrition [106,107]. The depth and duration of the EEG suppression that must be achieved by barbiturates is unknown. Some experts recommend instead of burst-suppression pattern complete suppression or “flat record” because of better seizure control and fewer relapses [108]. Moreover, patients with more prolonged barbiturate treatment (> 96 hours) and those receiving phenobarbital at the time of pentobarbital taper are less likely to relapse [109]. European guidelines recommend titration of propofol and barbiturate to EEG burst-suppression, and midazolam to seizure suppression, maintained for at least 24 h [2]. In recent reviews, it was found that barbiturates control refractory and super-refractory SE in 64% of patients and are ineffective in only 5% [11,110].
If SE continues or recurs after emergence from barbiturate coma, ketamine may be an option [11,83]. Ketamine offers the advantage of NMDA receptor antagonism, which may be important in the late phase of SE and lacks cardiodepressant or hypotensive properties. Early [111] or late [112] use of ketamine has been reported in small case series with various success rates. In a recent multicenter retrospective study from North America and Europe, evaluating 58 patients with 60 RSE, ketamine was likely responsible for seizure control in 12% and possibly responsible in an additional 20%. No responses were observed when infusion rate was lower than 0.9 mg/kg/h or when ketamine was introduced 8 days or more after onset of SE or after failure of seven or more drugs [113].
If all these measures have failed, stage 4.2 treatment options are available (Table 2), but these are mostly based on small case series and expert opinions (except for the recent hypothermia study). Pyridoxine hydrochloride in an IV or enteral form at a dose of 100–300 mg/day for few days can be used in stage 4 or earlier stages, as it is a cofactor in the synthesis of the inhibitory neurotransmitter GABA [114]. There are no strong data for its effectiveness, but it can be used as a cheap and safe alternative [115]. Magnesium has been successfully used in 2 girls with juvenile Alper’s syndrome [116] and is the treatment of choice for eclamptic seizures. Ketogenic diet may also be an optionfor these patients [117]. Resection of the epileptic focus after mapping with intracranial EEG electrodes may be highly effective but cannot be used in many patients due to lack of focus or eloquence location [83,106,115]. Use of steroids, plasmapheresis or IVIG, followed by immunosuppression can be tried, but one should balance risks and benefits. These immunosuppressive or immunomodulating treatments should be especially considered in patients with NORSE or suspected autoimmune or paraneoplastic encephalitides, where AEDs usually have no effect [46]. These therapies though often precede the diagnosis, since it takes time for the autoantibody panel results to return and the treating physician has to make a decision to blindly start treatment for SRSE.
There were some promising data regarding hypothermia use in these desperate situations [118,119] until the HYBERNATUS study, conducted in France, was recently published. In this study, 270 patients with convulsive SE were randomized in to hypothermia (32° to 34°C for 24 hours) in addition to standard care or to standard care alone. A Glasgow Outcome Scale score of 5 (primary outcome) occurred in 49% of patients in the hypothermia group and in 43% in the control group (a nonstatistical difference). Secondary outcomes, including mortality at 90 days, RSE on day 1, SRSE and functional sequelae on day 90 were not different except for the rate of progression to EEG-confirmed SE on the first day, which was lower in the hypothermia group (11% vs. 22% in the controls). Adverse events were more frequent in the hypothermia group than in the control group [120].
Additional anecdotal treatments are presented in Table 2, but their efficacy is questionable.
This staged management approach may change in the future to a more physiologic and rational treatment with polytherapy based on synaptic receptor trafficking during SE [63]. For example, in an animal model of severe SE, combinations of a benzodiazepine with ketamine and valproate, or with ketamine and brivaracetam, were more effective and less toxic than benzodiazepine monotherapy [121]. Allopregnalonone, a metabolite of progesterone, is an endogenous, naturally occurring neuroactive steroid produced in the ovary, the adrenal cortex and the central nervous system. It is a potent positive allosteric modulator of synaptic and extrasynaptic GABAA receptors with antiepileptic activity [122]. Neuroactive steroids, such as allopregnanolone, are currently evaluated in SE.
Outcomes
SE still carries significant mortality and morbidity. Distinct variants of SE carry different mortalities, and the range is quite broad: from zero mortality for absence or complex partial SE in ambulatory patients [12], to 19% to 27% 30-day mortality for generalized tonic-clonic SE [20,123] and to 64.7% 30-day mortality for subtle SE [20]. Variables playing an important role in the outcome are the underlying cause (regarded by most authorities the most important variable), the duration of SE (mortality 32% if persistent for > 1 hour vs 2.7% if < 1 hour), the type of SE, the treatment administered, and the age of the patient (children have better outcomes than adults) [123–125]. The etiology of SE still remains the most important prognostic factor, with alcohol and AED-withdrawal/noncompliance having the best outcomes; structural brain injuries, such as anoxia-ischemia, vascular lesions, or brain tumors, have the worst prognosis.
The most resistant cases pose significant dilemmas regarding the length of treatment using barbiturate coma and the potential for acceptable prognosis or the need to withdraw life support. For RSE, for example, in-hospital mortality is 31.7% and 76.2% of patients reach poor functional outcome. Long-term outcomes are also dismal: at 1 year post-discharge, 74% are dead or in a state of unresponsive wakefulness, 16% severely disabled, and only 10% have no or minimal disability [126]. Duration of drug-induced coma, arrhythmias requiring intervention, and pneumonia are associated with poor functional outcome, whereas prolonged mechanical ventilation with mortality and seizure control without burst-suppression or isoelectric EEG are associated with good functional outcome [127,128].
Treatment with barbiturates may contribute to these outcomes, although it is very challenging to prove causality in such a complex and prolonged ICU environment. Some data have shed light towards that direction: in a recent retrospective study of 171 patients with SE, of which 37% were treated with IV anesthetic drugs, there was a higher risk for infections and a 2.9-fold relative risk for death after adjustment for confounders in the group treated with IV anesthetics compared to the group without these agents [129].
The SE Severity Score (STESS, range 0–6) is a prognostic score for survival [130] and can be used as a scaffold for discussions with families and covariate adjustment tool for research. A favorable score of 0–2 has a negative predictive value of 0.97 for survival and likelihood to return to baseline clinical condition in survivors, although an unfavorable score (3–6) had a positive predictive value for death of only 0.39 [131].
The risk for recurrence of afebrile SE in a population-based study in Minnesota has been estimated at 31.7% over a 10-year follow-up period. The risk for recurrence was about 25% regardless of the underlying etiology, except in those patients with SE occurring in the setting of a progressive brain disorder (who had a 100% risk). Female gender, generalized (vs partial) SE and lack of response to the first AED after the initial episode of SE were independent factors for recurrence [132].
Conclusion
Despite the use of better diagnostic tools (continuous video EEG), advances in technology in the ICU, and availability of new AEDs, SE still carries significant mortality and morbidity, which depends mainly on age and etiology. The current treatment is still staged, with supportive measures and benzodiazepine administration remaining the mainstay initially and followed by older and newer AEDs and anesthetics for resistant cases. With the advance of pathophysiologic mechanisms elucidation at a molecular/receptor level, combinations of AEDs may become the foundation of future SE control.
Corresponding author: Panayiotis N. Varelas, MD, PhD, FNCS, Division Head, Neuro-Critical Care Service, Henry Ford Hospital, K-11, 2799 W. Grand Blvd., Detroit, MI 48202, [email protected].
Financial disclosures: Dr. Varelas was local principal investigator for a super-refractory status epilepticus study sponsored by Sage Therapeutics.
Author contributions: conception and design, ARR, PNV; analysis and interpretation of data, PNV; drafting of article, PNV; critical revision of the article, ARR, PNV; administrative or technical support, PNV; collection and assembly of data, ARR, PNV.
1. Hauser WA. Status epilepticus: epidemiologic considerations. Neurology 1990;40:9–13.
2. Meierkord H, Boon P, Engelsen B, et al. EFNS guideline on the management of status epilepticus. Eur J Neurology 2006;13:445–50.
3. Brophy GM, Bell R, Claassen J, et al. Guidelines for the evaluation and management of status epilepticus. Neurocrit Care 2012;17:3–23.
4. Glauser T, Shinnar S, Gloss D, et al. Evidence-based guideline: treatment of convulsive status epilepticus in children and adults: Report of the Guideline Committee of the American Epilepsy Society. Epilepsy Curr 2016;16:48–61.
5. Gastaut H. Classification of status epilepticus. Adv Neurol 1983;34:15–35.
6. Treatment of convulsive status epilepticus. Recommendations of the Epilepsy Foundation of America’s Working Group on Status Epilepticus. JAMA 1993;270:854–9.
7. Lowenstein DH. Status epilepticus: an overview of the clinical problem. Epilepsia 1999;40 Suppl 1:S3–8; discussion S21–22.
8. Jenssen S, Gracely EJ, Sperling MR. How long do most seizures last? A systematic comparison of seizures recorded in the epilepsy monitoring unit. Epilepsia 2006;47:1499–503.
9. Goodkin HP, Kapur J. Responsiveness of status epilepticus to treatment with diazepan decreases rapidly as seizure duration increases. Epilepsy Curr 2003;3:11–2.
10. Lowenstein DH. The management of refractory status epilepticus: an update. Epilepsia 2006;47 Suppl 1:35–40.
11. Shorvon S, Ferlisi M. The treatment of super-refractory status epilepticus: a critical review of available therapies and a clinical treatment protocol. Brain 2011;134:2802–18.
12. Kaplan PW. Assessing the outcomes in patients with nonconvulsive status epilepticus: nonconvulsive status epilepticus is underdiagnosed, potentially overtreated, and confounded by comorbidity. J Clin Neurophysiol 1999;16:341–52.
13. Walker MD. Diagnosis and treatment of nonconvulsive status epilepticus. CNS Drugs 2001;15:931–9.
14. Kaplan PW. EEG criteria for nonconvulsive status epilepticus. Epilepsia 2007;48 Suppl 8:39–41.
15. Beniczky S, Hirsch LJ, Kaplan PW, et al. Unified EEG terminology and criteria for nonconvulsive status epilepticus. Epilepsia 2013;54 Suppl 6:28–9.
16. Sutter R, Kaplan PW. Electroencephalographic criteria for nonconvulsive status epilepticus: synopsis and comprehensive survey. Epilepsia 2012;53 Suppl 3:1–51.
17. Ristic AJ, Marjanovic I, Brajkovic L, et al. Balint-like syndrome as an unusual representation of non-convulsive status epilepticus. Epileptic Disord 2012;14:80–4.
18. Trinka E, Hofler J, Zerbs A. Causes of status epilepticus. Epilepsia 2012;53 Suppl 4:127–38.
19. DeLorenzo RJ, Hauser WA, Towne AR, et al. A prospective, population-based epidemiologic study of status epilepticus in Richmond, Virginia. Neurology 1996;46:1029–35.
20. Treiman DM, Meyers PD, Walton NY, et al. A comparison of four treatments for generalized convulsive status epilepticus. Veterans Affairs Status Epilepticus Cooperative Study Group. N Engl J Med 1998;339:792–8.
21. Carrera E, Michel P, Despland PA, et al. Continuous assessment of electrical epileptic activity in acute stroke. Neurology 2006;67:99–104.
22. Towne AR, Waterhouse EJ, Boggs JG, et al. Prevalence of nonconvulsive status epilepticus in comatose patients. Neurology 2000;54:340–5.
23. Claassen J, Jette N, Chum F, et al. Electrographic seizures and periodic discharges after intracerebral hemorrhage. Neurology 2007;69:1356–65.
24. Claassen J, Peery S, Kreiter KT, et al. Predictors and clinical impact of epilepsy after subarachnoid hemorrhage. Neurology 2003;60:208–14.
25. Claassen J, Perotte A, Albers D, et al. Nonconvulsive seizures after subarachnoid hemorrhage: Multimodal detection and outcomes. Ann Neurol 2013;74:53–64.
26. Lindgren C, Nordh E, Naredi S, Olivecrona M. Frequency of non-convulsive seizures and non-convulsive status epilepticus in subarachnoid hemorrhage patients in need of controlled ventilation and sedation. Neurocrit Care 2012;17:367–73.
27. Cocito L, Audenino D, Primavera A. Altered mental state and nonconvulsive status epilepticus in patients with cancer. Arch Neurol 2001;58:1310.
28. Vespa PM, Nuwer MR, Nenov V, et al. Increased incidence and impact of nonconvulsive and convulsive seizures after traumatic brain injury as detected by continuous electroencephalographic monitoring. J Neurosurg 1999;91:750–60.
29. Tian L, Li Y, Xue X, et al. Super-refractory status epilepticus in West China. Acta Neurol Scand 2015;132:1–6.
30. Holtkamp M, Othman J, Buchheim K, et al. A “malignant” variant of status epilepticus. Arch Neurol 2005;62:1428–31.
31. Lowenstein DH, Alldredge BK. Status epilepticus at an urban public hospital in the 1980s. Neurology 1993;43:483–8.
32. Mayer SA, Claassen J, Lokin J, et al. Refractory status epilepticus: frequency, risk factors, and impact on outcome. Arch Neurol 2002;59:205–10.
33. Rossetti AO, Logroscino G, Bromfield EB. Refractory status epilepticus: effect of treatment aggressiveness on prognosis. Arch Neurol 2005;62:1698–702.
34. Novy J, Logroscino G, Rossetti AO. Refractory status epilepticus: a prospective observational study. Epilepsia 2010;51:251–6.
35. Garzon E, Fernandes RM, Sakamoto AC. Analysis of clinical characteristics and risk factors for mortality in human status epilepticus. Seizure 2003;12:337–45.
36. Sutter R, Kaplan PW, Marsch S, et al. Early predictors of refractory status epilepticus: an international two-center study. Eur J Neurol 2015;22:79–85.
37. Wijdicks EF, Sharbrough FW. New-onset seizures in critically ill patients. Neurology 1993;43:1042–4.
38. Bleck TP, Smith MD, Pierre-Louis SJ, et al. Neurologic complications of critical medical illnesses. Crit Care Med 1993;21:98–103.
39. Oddo M, Carrera E, Claassen J, et al. Continuous electroencephalography in the medical intensive care unit. Crit Care Med 2009;37:2051–6.
40. Gilmore EJ, Gaspard N, Choi HA, et al. Acute brain failure in severe sepsis: a prospective study in the medical intensive care unit utilizing continuous EEG monitoring. Intensive Care Med 2015;41:686–94.
41. Misra UK, Kalita J, Patel, R. Sodium valproate vs phenytoin in status epilepticus: a pilot study. Neurology 2006;67:340–2.
42. Kim A, Kim JE, Paek YM, et al. Cefepime-induced non-convulsive status epilepticus (NCSE). J Epilepsy Res 2013;3:39–41.
43. Naeije G, Lorent S, Vincent JL, Legros B. Continuous epileptiform discharges in patients treated with cefepime or meropenem. Arch Neurol 2011;68:1303–7.
44. Tan RY, Neligan A, Shorvon SD. The uncommon causes of status epilepticus: a systematic review. Epilepsy Res 2010;91:111–22.
45. Khawaja AM, DeWolfe JL, Miller DW, Szaflarski JP. New-onset refractory status epilepticus (NORSE) - The potential role for immunotherapy. Epilepsy Behav 2015;47:17–23.
46. Davis R, Dalmau J. Autoimmunity, seizures, and status epilepticus. Epilepsia 2013;54 Suppl 6:46–9.
47. Lopinto-Khoury C, Sperling MR. Autoimmune status epilepticus. Curr Treat Options Neurol 2013;15:545–56.
48. Bansal P, Zutshi D, Suchdev K, et al. Alpha 3 ganglionic acetylcholine receptor antibody associated refractory status epilepticus. Seizure 2016;35:1–3.
49. Chen JW, Wasterlain CG. Status epilepticus: pathophysiology and management in adults. Lancet Neurol 2006;5:246–56.
50. DeLorenzo RJ, Garnett LK, Towne AR, et al. Comparison of status epilepticus with prolonged seizure episodes lasting from 10 to 29 minutes. Epilepsia 1999;40:164–9.
51. Lowenstein DH, Alldredge BK. Status epilepticus. N Engl J Med 1998;338:970–6.
52. Millikan D, Rice B, Silbergleit R. Emergency treatment of status epilepticus: current thinking. Emerg Med Clin North Am 2009;27:101–13, ix.
53. Fountain NB. Status epilepticus: risk factors and complications. Epilepsia 2000;41 Suppl 2:S23–30.
54. Aminoff MJ, Simon RP. Status epilepticus. Causes, clinical features and consequences in 98 patients. Am J Med 1980;69:657–66.
55. Meldrum BS, Brierley JB. Prolonged epileptic seizures in primates. Ischemic cell change and its relation to ictal physiological events. Arch Neurol 1973;28:10–7.
56. Meldrum BS, Vigouroux RA, Brierley JB. Systemic factors and epileptic brain damage. Prolonged seizures in paralyzed, artificially ventilated baboons. Arch Neurol 1973;29:82–7.
57. Loscher W. Mechanisms of drug resistance in status epilepticus. Epilepsia 2007;48 Suppl 8:74–7.
58. Jacob TC, Moss SJ, Jurd R. GABA(A) receptor trafficking and its role in the dynamic modulation of neuronal inhibition. Nat Rev Neurosci 2008;9:331–43.
59. Arancibia-Carcamo IL, Kittler JT. Regulation of GABA(A) receptor membrane trafficking and synaptic localization. Pharmacol Ther 2009;123:17–31.
60. Bohnsack JP, Carlson SL, Morrow AL. Differential regulation of synaptic and extrasynaptic alpha4 GABA(A) receptor populations by protein kinase A and protein kinase C in cultured cortical neurons. Neuropharmacology 2016;105:124–32.
61. Farrant M, Nusser Z. Variations on an inhibitory theme: phasic and tonic activation of GABA(A) receptors. Nat Rev Neurosci 2005;6:215–29.
62. Smith KR, Kittler JT. The cell biology of synaptic inhibition in health and disease. Curr Opin Neurobiol 2010;20:550–6.
63. Wasterlain CG, Naylor DE, Liu H, et al. Trafficking of NMDA receptors during status epilepticus: therapeutic implications. Epilepsia 2013;54 Suppl 6:78–80.
64. Bankstahl JP, Loscher W. Resistance to antiepileptic drugs and expression of P-glycoprotein in two rat models of status epilepticus. Epilepsy Res 2008;82:70–85.
65. Henshall DC, Diaz-Hernandez M, Miras-Portugal MT, Engel T. P2X receptors as targets for the treatment of status epilepticus. Front Cell Neurosci 2013;7:237.
66. Lamsa K, Taira T. Use-dependent shift from inhibitory to excitatory GABAA receptor action in SP-O interneurons in the rat hippocampal CA3 area. J Neurophysiol 2003;90:1983–95.
67. Cock HR, Tong X, Hargreaves IP, et al. Mitochondrial dysfunction associated with neuronal death following status epilepticus in rat. Epilepsy Res 2002;48:157–68.
68. Friedman A, Dingledine R, Molecular cascades that mediate the influence of inflammation on epilepsy. Epilepsia 2011;52 Suppl 3:33–39.
69. Henshall DC. MicroRNAs in the pathophysiology and treatment of status epilepticus. Front Mol Neurosci 2013;6:37.
70. Vespa P, Tubi M, Claassen J, et al. Metabolic crisis occurs with seizures and periodic discharges after brain trauma. Ann Neurol 2016;79:579–90.
71. Witsch J, Frey HP, Schmidt JM, et al. Electroencephalographic periodic discharges and frequency-dependent brain tissue hypoxia in acute brain injury. JAMA Neurol 2017;74:301–9.
72. Rodriguez Ruiz A, Vlachy J, Lee JW, et al. Association of periodic and rhythmic electroencephalographic patterns with seizures in critically ill patients. JAMA Neurol 2017;74:181–8.
73. DeLorenzo RJ, Waterhouse EJ, Towne AR, et al. Persistent nonconvulsive status epilepticus after the control of convulsive status epilepticus. Epilepsia 1998;39:833–40.
74. Benbadis SR, Chen S, Melo M. What’s shaking in the ICU? The differential diagnosis of seizures in the intensive care setting. Epilepsia 2010;51:2338–40.
75. Pandian JD, Cascino GD, So EL, et al. Digital video-electroencephalographic monitoring in the neurological-neurosurgical intensive care unit: clinical features and outcome. Arch Neurol 2004;61:1090–4.
76. Irani SR, Vincent A, Schott JM. Autoimmune encephalitis. BMJ 2011;342:d1918.
77. Irani SR, Michell AW, Lang B, et al. Faciobrachial dystonic seizures precede Lgi1 antibody limbic encephalitis. Ann Neurol 2011;69:892–900.
78. Herman ST, Abend NS, Bleck TP, et al. Consensus statement on continuous EEG in critically ill adults and children, part I: indications. J Clin Neurophysiol 2015;32:87–95.
79. Brenner RP. Is it status? Epilepsia 2002;43 Suppl 3:103–113.
80. Cook AM, Castle A, Green A, et al. Practice variations in the management of status epilepticus. Neurocrit Care 2012;17:24–30.
81. Alldredge BK, Gelb AM, Isaacs SM, et al. A comparison of lorazepam, diazepam, and placebo for the treatment of out-of-hospital status epilepticus. N Engl J Med 2001;345:631–7.
82. Silbergleit R, Durkalski V, Lowenstein D, et al. Intramuscular versus intravenous therapy for prehospital status epilepticus. N Engl J Med 2012;366:591–600.
83. Shorvon S. Super-refractory status epilepticus: an approach to therapy in this difficult clinical situation. Epilepsia 2011;52 Suppl 8:53–6.
84. Varelas P, Mirski MA. Management of status epilepticus in adults. Hosp Physician Board Rev Man 2014;2:1–15.
85. McIntyre J, Robertson S, Norris E, et al. Safety and efficacy of buccal midazolam versus rectal diazepam for emergency treatment of seizures in children: a randomised controlled trial. Lancet 2005;366:205–10.
86. Misra UK, Kalita J, Maurya PK. Levetiracetam versus lorazepam in status epilepticus: a randomized, open labeled pilot study. J Neurol 2012;259:645–8.
87. Vohra TT, Miller JB, Nicholas KS, et al. Endotracheal intubation in patients treated for prehospital status epilepticus. Neurocrit Care 2015;23:33–43.
88. Agarwal P, Kumar N, Chandra R, et al. Randomized study of intravenous valproate and phenytoin in status epilepticus. Seizure 2007;16:527–32.
89. Trinka E. What is the evidence to use new intravenous AEDs in status epilepticus? Epilepsia 2011;52 Suppl 8:35–38.
90. Yasiry Z, Shorvon SD. The relative effectiveness of five antiepileptic drugs in treatment of benzodiazepine-resistant convulsive status epilepticus: a meta-analysis of published studies. Seizure 2014;23:167–74.
91. Moreno Morales EY, Fernandez Peleteiro M, Bondy Pena EC, et al. Observational study of intravenous lacosamide in patients with convulsive versus non-convulsive status epilepticus. Clin Drug Investig 2015;35:463–9.
92. Paquette V, Culley C, Greanya ED, Ensom MH. Lacosamide as adjunctive therapy in refractory epilepsy in adults: a systematic review. Seizure 2015;25:1–17.
93. Varelas PN, Corry J, Rehman M, et al. Management of status epilepticus in neurological versus medical intensive care unit: does it matter? Neurocrit Care 2013;19:4–9.
94. Hofler J, Trinka E. Lacosamide as a new treatment option in status epilepticus. Epilepsia 2013;54:393–404.
95. Kellinghaus C, Berning S, Stogbauer F. Intravenous lacosamide or phenytoin for treatment of refractory status epilepticus. Acta Neurol Scand 2014;129:294–9.
96. Santamarina E, Toledo M, Sueiras M, et al. Usefulness of intravenous lacosamide in status epilepticus. J Neurol 2013;260:3122–8.
97. Newey CR, Le NM, Ahrens C, et al. The safety and effectiveness of intravenous lacosamide for refractory status epilepticus in the critically ill. Neurocrit Care 2017;26:273–9.
98. Towne AR, Garnett LK, Waterhouse EJ, et al. The use of topiramate in refractory status epilepticus. Neurology 2003;60:332–4.
99. Hottinger A, Sutter R, Marsch S, Ruegg S. Topiramate as an adjunctive treatment in patients with refractory status epilepticus: an observational cohort study. CNS Drugs 2012;26:761–72.
100. Madzar D, Kuramatsu JB, Gerner ST, et al. Assessing the value of topiramate in refractory status epilepticus. Seizure 2016;38:7–10.
101. Sivakumar S, Ibrahim M, Parker D Jr, et al. An effective add-on therapy in refractory status epilepticus. Epilepsia 2015;56:e83–89.
102. Madzar D, Geyer A, Knappe RU, et al. Effects of clobazam for treatment of refractory status epilepticus. BMC Neurol 2016;16:202.
103. Swisher CB, Doreswamy M, Gingrich KJ, et al. Phenytoin, levetiracetam, and pregabalin in the acute management of refractory status epilepticus in patients with brain tumors. Neurocrit Care 2012;16:109–13.
104. Smith H, Sinson G, Varelas P. Vasopressors and propofol infusion syndrome in severe head trauma. Neurocrit Care 2009;10:166–72.
105. Cuero MR, Varelas PN. Super-refractory status epilepticus. Curr Neurol Neurosci Rep 2015;15:74.
106. Varelas PN. How I treat status epilepticus in the Neuro-ICU. Neurocrit Care 2008;9:153–7.
107. Varelas PN, Spanaki MV, Mirski MA. Status epilepticus: an update. Curr Neurol Neurosci Rep 2013;13:357.
108. Krishnamurthy KB, Drislane FW. Depth of EEG suppression and outcome in barbiturate anesthetic treatment for refractory status epilepticus. Epilepsia 1999;40:759–62.
109. Krishnamurthy KB, Drislane FW. Relapse and survival after barbiturate anesthetic treatment of refractory status epilepticus. Epilepsia 1996;37:863–7.
110. Ferlisi M, Shorvon S. The outcome of therapies in refractory and super-refractory convulsive status epilepticus and recommendations for therapy. Brain 2012;135:2314–28.
111. Kramer AH. Early ketamine to treat refractory status epilepticus. Neurocrit Care 2012;16:299–305.
112. Synowiec AS, Singh DS, Yenugadhati V, et al. Ketamine use in the treatment of refractory status epilepticus. Epilepsy Res 2013;105:183–8.
113. Gaspard N, Foreman B, Judd LM, et al. Intravenous ketamine for the treatment of refractory status epilepticus: a retrospective multicenter study. Epilepsia 2013;54:1498–503.
114. Schulze-Bonhage A, Kurthen M, Walger P, Elger CE. Pharmacorefractory status epilepticus due to low vitamin B6 levels during pregnancy. Epilepsia 2004;45:81–4.
115. Shorvon S. Clinical trials in acute repetitive seizures and status epilepticus. Epileptic Disord 2012;14:138–47.
116. Visser NA, Braun KP, Leijten FS, et al. Magnesium treatment for patients with refractory status epilepticus due to POLG1-mutations. J Neurol 2011;258:218–22.
117. Thakur KT, Probasco JC, Hocker SE, et al. Ketogenic diet for adults in super-refractory status epilepticus. Neurology 2014;82:665–70.
118. Corry JJ, Dhar R, Murphy T, Diringer MN. Hypothermia for refractory status epilepticus. Neurocrit Care 2008;9:189–97.
119. Guilliams K, Rosen M, Buttram S, et al. Hypothermia for pediatric refractory status epilepticus. Epilepsia 2013;54:1586–94.
120. Legriel S, Lemiale V, Schenck M, et al. Hypothermia for neuroprotection in convulsive status epilepticus. N Engl J Med 2016;375:2457–67.
121. Wasterlain CG, Baldwin R, Naylor DE, et al. Rational polytherapy in the treatment of acute seizures and status epilepticus. Epilepsia 2011;52 Suppl 8:70–1.
122. Rogawski MA, Loya CM, Reddy K, et al. Neuroactive steroids for the treatment of status epilepticus. Epilepsia 2013;54 Suppl 6:93–8.
123. Towne AR, Pellock JM, Ko D, DeLorenzo RJ. Determinants of mortality in status epilepticus. Epilepsia 1994;35:27–34.
124. DeLorenzo RJ, Towne AR, Pellock JM, Ko D. Status epilepticus in children, adults, and the elderly. Epilepsia 1992;33 Suppl 4:S15–25.
125. Legriel S, Mourvillier B, Bele N, et al. Outcomes in 140 critically ill patients with status epilepticus. Intensive Care Med 2008;34:476–80.
126. Pugin D, Foreman B, De Marchis GM, et al. Is pentobarbital safe and efficacious in the treatment of super-refractory status epilepticus: a cohort study. Crit Care 2014;18:R103.
127. Hocker SE, Britton JW, Mandrekar JN, et al. Predictors of outcome in refractory status epilepticus. JAMA Neurol 2013;70:72–7.
128. Hocker S, Tatum WO, LaRoche S, Freeman WD. Refractory and super-refractory status epilepticus--an update. Curr Neurol Neurosci Rep 2014;14:452.
129. Sutter R, Marsch S, Fuhr P, et al. Anesthetic drugs in status epilepticus: risk or rescue? A 6-year cohort study. Neurology 2014;82:656–64.
130. Rossetti AO, Logroscino G, Bromfield EB. A clinical score for prognosis of status epilepticus in adults. Neurology 2006;66:1736–8.
131. Rossetti AO, Logroscino G, Milligan TA, et al. Status Epilepticus Severity Score (STESS): a tool to orient early treatment strategy. J Neurol 2008;255:1561–6.
132. Hesdorffer DC, Logroscino G, Cascino GD, Hauser WA. Recurrence of afebrile status epilepticus in a population-based study in Rochester, Minnesota. Neurology 2007;69:73–8.
133. Varelas PN, Mirski MA. Seizures in the adult intensive care unit. J Neurosurg Anesthesiol 2001;13:163–75.
134. Varelas PN, Mirski MA. Status epilepticus. Curr Neurol Neurosci Rep 2009;9:469–76.
From the Johns Hopkins Hospital, Baltimore, MD (Dr. Ramadan), and the Henry Ford Hospital, Detroit, MI (Dr. Varelas).
Abstract
- Objective: To review the management of status epilepticus (SE).
- Methods: Review of the literature.
- Results: SE is a relatively common condition that accounts for 3% to 5% of all emergency department evaluations for seizure disorders and occurs in 2% to 16% of all epilepsy patients. The 3 most common etiologies are low levels of antiepileptic drugs, remote symptomatic etiologies, and cerebrovascular accidents. The majority of SEs are convulsant, but there is growing awareness of non-convulsive SEs, which can be diagnosed only via electroencephalogram. Management, which must be initiated at the earliest possible time, has evolved to incorporate pre-hospital measures and 4 treatment stages, with supportive measures and benzodiazepine administration remaining the mainstay initially and followed by older and newer antiepileptic drugs and anesthetics for resistant cases.
- Conclusion: SE is a neurological emergency that still carries significant mortality and morbidity if not treated immediately and properly.
Key words: status epilepticus; seizures; convulsive status epilepticus; nonconvulsive status epilepticus.
Status epilepticus (SE) is a relatively common condition that accounts for 3% to 5% of all emergency department (ED) evaluations for seizure disorders and occurs in 2% to 16% of all epilepsy patients [1]. It remains a major neurological emergency that, if not properly and timely treated, leads to death or permanent neurological injury. Since most of patients with convulsive SE are admitted to the hospital via the ED and are then transferred to the intensive care unit (ICU), our focus in this review will be on the latter.
Although only a handful prospective, randomized studies have been reported, guidelines on SE have been published in Europe [2] and the US [3,4]. In this paper, we review the evolving definition and types of SE, its incidence, etiology, and pathophysiology, its diagnosis and treatment algorithms, and its outcome. Our goal is to provide the reader with a concise but thorough review of this still lethal neurological emergency.
Definitions
The International Classification of Epileptic Seizures had previously defined SE as any seizure lasting ≥ 30 minutes or intermittent seizures lasting for > 30 min without recovery of consciousness interictally [5,6]. More recently, a duration of 5 or more minutes of (a) continuous seizures or (b) 2 or more discrete seizures with incomplete recovery of consciousness in-between, proposed by Lowenstein [3,7], offers the advantage of incorporating new knowledge. The shortening of the convulsive period to 5 minutes was based on the fact that the majority of tonic-clonic seizures last for only 1 to 2 minutes, that those lasting > 5 minutes do not stop spontaneously [8], that permanent neuronal injury occurs before 30 minutes, and that refractoriness to treatment increases with longer seizure duration [9].
Refractory SE (RSE) has been defined as SE not controlled after adequate doses of an initial benzodiazepine followed by a second acceptable antiepileptic drug (AED) or SE not controlled after the initial parenteral therapy with a minimum number of standard “front-line” AEDs (either 2 or 3) or SE with a minimum duration of seizures that persist despite treatment (eg, at least or 2 hours) [3,10]. Super-refractory SE (SRSE) is defined as SE that continues or recurs 24 hours or more after the onset of anesthetic therapy or recurs on the reduction or withdrawal of anesthesia [11].
Non-convulsive SE (NCSE) is defined as the presence of altered consciousness or behavior for ≥ 30 minutes, the absence of overt clinical signs of convulsive activity during that period, and the electroencephalographic (EEG) confirmation of seizures or activity that responds to treatment together with improvement of consciousness [12–15]. Two major types of NCSE can be encountered: the one in patients with epileptic encephalopathy/coma and the one in patients with absence or complex partial seizures, who are not usually admitted to ICU and are functional yet impaired. Because of the confusion between these 2 extremes in the NCSE spectrum, working criteria for standardization of reporting, utilizing the frequency of electroencephalographic epileptiform discharges or delta/theta waveforms have been proposed [15]. A recent compendium of 123 cases of NCSE with clinical descriptions and EEG patterns following a syndromic classification approach has also been published [16].
Types of SE
Three major categories of SE have been described: generalized convulsive SE (GCSE), focal motor SE (FMSE or epilepsia partialis continua [EPC]) of Kojevnikov, and NCSE. GCSE and FMSE are easily recognized due to overt convulsions. NCSE, however, has a more obscure phenotype and can be subdivided into a spectrum encompassing typical absence and complex partial SE, atypical absence SE and tonic SE (usually in children with learning disabilities), epileptic behavioral disturbance and psychosis, including Balint–like syndrome [17], confusional states or delirium with epileptiform discharges) and SE in coma (after significant brain injuries, such as hypoxia-ischemia, most commonly encountered in ICUs) [13,18]. The 2 extremes in this NCSE spectrum have completely different prognoses, with absence SE the most benign and SE in coma the most dismal.
Lastly, SE presents either spontaneously or can be “semi-intentional” iatrogenic, encountered either in the neuro-ICU or epilepsy monitoring unit, when AEDs are withdrawn under continuous EEG recording in order for seizures to emerge and be recorded with surface or intracranial electrodes.
Incidence of SE
In a prospective population-based epidemiological study, the incidence of SE was estimated at 41–61/100,000 patients/year. For the US, this translates to 125,000 to 195,000 episodes per year [19].
The highest incidence of SE occurs during the first year of life and during the decades beyond 60 years, and is also dependent on the SE subtype. Partial SE occurs in 25% of cases of SE and NCSE accounts for another 4% to 26 % [19,20], but the incidence for the latter is considered an underestimate due to the need for continuous EEG monitoring (which is not widely available). For example, NCSE was discovered in no patient with acute stroke [21], 8% of comatose ICU patients [22], 7% of patients with intracerebral hemorrhage [23], 3% to 8% of patients with subarachnoid hemorrhage [24–26], 6% of patients with metastatic cancer [27], and 6% of patients with head trauma [28].
The incidence of RSE and SRSE is also unknown. In a recent retrospective study from a neuro-ICU in a West China hospital, the percentage of non-refractory SE, RSE, and SRSE were 67.3%, 20.4% and 12.2%, respectively [29]. Other retrospective studies have shown that 12% to 43% of SE cases become refractory [30–33] and that approximately 10% to 15% of all cases of hospital-admitted SE will become super-refractory at some point, but no prospective studies have been published.
Risk factors that have been identified for RSE are encephalitis as a cause, severe consciousness impairment, de novo episodes of SE, delay in initiation of treatment, NCSE, and focal motor seizures at onset [30,32,34,35]. In a more recent study from ICU patients in Switzerland and the US, acute SE etiology (traumatic brain injuries, cerebrovascular accidents, meningoencephalitis, brain tumors, surgical brain lesions, exposure to, or withdrawal from, recreational drugs, prescription drugs, alcohol, metabolic disturbances and fever), coma/stupor, and serum albumin < 35 g/L at SE onset were independent predictors for RSE [36].
Etiology of SE
The 3 most common etiologies for SE are low levels of antiepileptic drugs (AEDs) in 34% of the cases (usually due to noncompliance), remote symptomatic etiologies (history of neurological insults remote to the first unprovoked SE episode, 24%), and cerebrovascular accidents (ischemic and hemorrhagic strokes, 22%). These are followed by hypoxia (13%) and metabolic disturbances (15%). Because 82% of patients in the remote group have a history of cerebrovascular disease, almost 50% have either acute or remote cerebrovascular disease as etiology of SE [19].
In general ICUs, metabolic abnormalities can account for 33% of seizures, drug withdrawal for 33%, drug toxicity for 14.5%, and stroke for 9% to 39% [37,38]. In ICUs, sepsis remains a common etiology of electrographic seizures or periodic epileptiform discharges [39,40], and legal or illegal drugs, such as ciprofloxacin, levofloxacin, piperacillin/tazobactam, cefepime and carbapenems [41–43], lithium or theophylline intoxication, vigabatrin, tiagabine or crack/cocaine, are another [18] (especially when their metabolism is altered due to interactions with other drugs or when their excretion is impaired due to hepatic or renal failure).
Beyond these common causes of SE, a workup for rare etiologies should be entertained. In a systematic review of 513 papers on SE, 181 uncommon causes of SE were identified and subdivided into immunologically mediated disorders, mitochondrial diseases, rare infectious disorders, genetic disorders, and drugs or toxins [18,44].
The most recent knowledge in this category is the contribution of paraneoplastic or autoimmune conditions to a large percentage of previously cryptogenic pharmaco-resistant seizures or super-refractory SE, most in the context of limbic encephalitis. Many of these patients have never experienced seizures or SE before and a new acronym has been devised for them: new-onset refractory status epilepticus (NORSE), ie, a state of persistent seizures with no identifiable etiology in patients without preexisting epilepsy that lasts longer than 24 hour despite optimal therapy [45]. A growing array of autoantibodies against intracellular and surface or synaptic neuronal targets has been described in addition to the previous literature of Rassmussen’s encephalitis and Hashimoto’s encephalopathy [46]. The most common autoantibodies associated with seizures and SE include anti-Hu, anti-Ma2, anti-CV2/CRMP5, anti-Ri, ANNA3, anti-amphiphysin, anti-NMDA receptor, anti-LGI1 and CASPR2, anti-GABA-beta, anti-GluR3, anti-mGluR5 and alpha 3 ganglionic acetylcholine receptor [47,48]. The diagnosis frequently remains elusive due to lack of knowledge or absence of widespread availability of serologic testing (with sometimes weeks-long delay for the results to be available), but the response to treatment with removal of tumor, plasmapheresis, or immunomodulation and immunosuppression is often dramatic.
Pathophysiology of SE
Most seizures are self-terminating phenomena lasting from a few seconds to a few minutes [49]. One of the distinguishing characteristics of seizures evolving into SE, however, is the switch to a self-sustaining situation, which is time-dependent. Seizures lasting more than 30 minutes would rarely stop spontaneously compared to 47% of those lasting between 10 to 29 minutes, which are self-resolving [50]. Moreover, in one study no self-limited seizure lasted more than 11 minutes [8].
The self-limiting character of seizures is due to inhibitory circuitry that suppresses their duration and propagation in the brain. Under specific circumstances, however, the inhibitory mechanisms fail and seizures progress to SE, which leads to synaptic reorganization, blood-brain barrier disruption, inflammation, metabolic crisis, more tissue damage, and further seizures. Neuronal injury during SE is the result of increased excitotoxicity [51–53] but also stems from systemic derangements such as hypoxia, acidosis, hypotension, or multiorgan dysfunction [54]. The seminal animal studies by Meldrum have shed a light on the systemic effects: after prolonged bicuculine-induced convulsive SE in baboons, neuronal damage and cell loss was evident in the neocortex, cerebellum and hippocampus. When systemic factors were kept within normal physiological limits (paralyzed and artificially ventilated animals with adequate serum glucose levels), there was decreased but still present neocortical and hippocampal cell damage, but absent cerebellar cell injury [55,56]. These experiments showed more than 40 years ago that the seizure activity per se is responsible for the neuronal damage and the systemic derangements play an additional role.
The direct neuronal injury as a result of the ongoing seizures, the perpetuation of seizures into SE, the resistance to treatment and the refractoriness that ensues have also been elucidated at a molecular level during the last decades. Initially, the g-aminobutyric acid (GABA) inhibitory circuits may be deficient and this is the reason why benzodiazepines or barbiturates, which work through GABAergic receptor agonism, are very effective during this early period. As time passes however, GABA receptors undergo a significant shift in their ability to respond to benzodiazepines [57,58]. This is due to changes in receptor presence at the inhibitory synapse, a phenomenon that has been called “receptor trafficking” by Arancibia and Kittler in 2009 [59]. There are differences in the type of GABAA receptors found synaptically and extrasynaptically. GABAA receptors containing the γ subunit are located synaptically and mediate phasic inhibition. Conversely, the δ subunit-containing GABAA receptors are located exclusively extrasynaptically and mediate tonic inhibition [60,61]. Smith and Kittler described the highly dynamic state of receptor presence on the surface of axons and explained how receptors move laterally from extrasynaptic sites to the synapse and then out of it to be internalized and either recycled to the surface or degraded [62]. This “receptor trafficking” intensifies during SE, and the overall effect becomes a reduction in the number of functional GABAA receptors in the synapses. As GABA is the principle inhib-itory transmitter, this reduction in GABAergic activity may be an important reason for seizures to become persistent.
However, this is not all. Additional mechanisms leading to refractoriness include the following:
(a) Excessive relocation of N-methyl-D-aspartate (NMDA)type glutamate receptors to the cell surface after 1 hour of SE, leading to increase of miniature excitatory NMDA currents and NMDA neurotransmission, with potentiation of glutamate excitotoxicity [53,63]
(b) Increased brain expression of drug efflux transporters, such as P-glycoprotein at the blood-brain barrier, which may reduce concentrations of AEDs at their brain targets [64]
(c) Up- and down-regulation of specific ATP-gated ion channels (P2X receptors) inducing altered response to ATP release [65]
(d) Change in the extracellular ionic environment (for example, the normally inhibitory GABAA receptor-mediated currents may become excitatory with changes in extracellular chloride concentrations) [66]
(e) Mitochondrial insufficiency or failure, which would lead to cell necrosis and apoptosis [67]
(f) Inflammatory processes, with opening of the blood-brain barrier (BBB) contributing to perpetuation of seizures [44]. The underlying mechanism is a maladaptive response of the astrocytes to the BBB damage, leading to activation of the innate immune system and disturbed homeostasis of the extracellular potassium and glutamate [68].
(g) Large-scale changes in gene expression within the affected brain regions; these are regulated by micro-RNAs, influencing protein levels playing a role in excitability, neuronal death and neuroinflammation [69].
All of these pathophysiologic derangements may become targets for future antiepileptic treatments.
Although the direct and indirect injury from ongoing convulsive SE is not in doubt, the significance of NCSE or the ictal-interictal continuum on inflicting additional injury has been more controversial. Recent data, however, do not support a benign process in these situations. It has been shown lately that nonconvulsive seizures lead to physiologic changes in the brain, including elevated intracranial pressure, changes in the brain metabolism, and delayed increase in cerebral blood flow [25]. In addition, using microdialysis, elevated lactate/puruvate ratio, indicating metabolic crisis, has been shown during periods of nonconvulsive seizures or periodic discharges [70]. Similarly, high-frequency periodic discharges lead to inadequate increase in cerebral blood flow and tissue hypoxia [71], and lateralized periodic discharges, lateralized rhythmic delta activity, and generalized periodic discharges are associated with seizures [72].
Diagnosis of SE
The diagnosis of SE is primarily clinical and encompasses motor phenomena and alteration of mental status. Focal-onset convulsions can remain focal, follow a Jacksonian march, or immediately generalize to involve the whole body with loss of consciousness. Most of the time, this secondary generalization can only be appreciated during EEG recording. In addition, mental status alteration can differentiate simple partial SE (no change in mental status) from complex partial SE (disturbed sensorium).
The presence or absence of motor phenomena and loss of consciousness do not necessarily correlate with the EEG activity during or after SE. For example, persistent electrographic seizures or NCSE after control of convulsive SE have been demonstrated with continuous EEG [73]. Conversely, altered mental status is also a poor clinical differentiator, since 87% of patients successfully treated for convulsive SE and 100% treated for NCSE remained comatose 12 hours following the initiation of therapy [20]. In addition, only 27% of motor, seizure-like phenomena in the ICU were proven to be seizures in a retrospective study [74]. Psychogenic nonepileptic attacks, occurring in between 3.8% and 9.5% of ICU patients presenting with seizures [74,75], is another situation that may lead to confusion, inappropriate intubation, and ICU admission. Strange phenomena, such as fasciobrachial seizures (brief facial grimacing and ipsilateral arm posturing) many times preceding the onset of amnesia, confusion, or temporal lobe seizures have been described in patients who have non-paraneoplastic limbic encephalitis associated with voltage-gated potassium channel (VGKC) antibodies, especially against the leucine-rich glioma inactivated-1 (LGI1) protein [76,77].Without a continuous video EEG, these phenomena may not be captured or appreciated. Therefore, EEG monitoring is an important tool for the evaluation of these patients and criteria for its use have been published [78]. The EEG criteria for convulsive SE have been clearly delineated, but for NCSE a mix of clinical and EEG criteria should be met [14,15,79].
In addition to clinical observation and EEG, there has been interest lately in multimodality monitoring of acutely brain-injured patients for seizures or SE using electrocorticography or mini depth electrode placement, partial brain tissue oxygen tension, cerebral blood flow, and microdialysis in addition to scalp EEG. Although preliminary and limited in few academic centers, this approach has produced interesting findings. For example, in a study from Columbia University, 38% of 48 patients with subarachnoid hemorrhage and multimodality monitoring had intracortical seizures, while only 8% of them had surface seizures, all nonconvulsive [25]. In another study, 68% of seizures and 23% of periodic discharges were only captured on the depth electrodes and were missed on the surface ones [71]. Therefore, detection of SE may change in the future with use of more sensitive techniques than scalp EEG.
Treatment
Significant practice variations exist in the management of SE even among academic centers in the US [80] despite the fact that the goals of treatment are concrete. These include (1) emergent medical management, (2) termination of seizures, (3) prevention of recurrence of seizures, and (4) prevention or treatment of complications.
Management of SE must begin in a prehospital setting by the emergency medical services, because the faster the treatment is offered, the better the response. Several studies have attempted to assess the possibility of aborting SE even prior to the hospital. In a randomized, double-blinded study, lorazepam was 4.8 times and diazepam 2.3 times more effective than placebo in terminating SE on arrival in the ED when given intravenously (IV) by paramedics [81]. The RAMPART study was a double-blind, randomized, non-inferiority trial comparing the efficacy of intramuscular (IM) midazolam (10 mg followed by placebo IV) with that of IM placebo followed by intravenous lorazepam (4 mg) for children and adults in SE treated by paramedics. At the time of arrival in the ED, seizures had ceased without rescue therapy in 73.4% and 63.4%, respectively, favoring midazolam [82].
Emergent Initial Phase
During the emergent initial phase, the goals are protection of the airway, oxygenation, maintenance of blood pressure, exclusion of easily
Urgent Control
If seizures continue, stage 2 medications should be used for benzodiazepine-refractory SE as urgent control treatment. There are some data suggesting better response rate to valproate after failure to control seizures with phenytoin than to phenytoin after failure of valproate [88]. If available, IV fosphenytoin is preferable to IV phenytoin due to potentially lower risk of side effects. Levetiracetam and phenobarbital IV are also acceptable choices. Levetiracetam can be administered as an off-label loading dose of 20–60 mg/kg IV (although the initial manufacturer was not supporting a “loading” dose; dose of up to 60 mg/kg IV up to 4500 mg maximum has been supported by the latest American Epilepsy Society guidelines [4]). This AED at an initial dose of 2–3 g/day confers an estimated success rate around 70% [89]. In a systematic review of 27 studies (798 cases of convulsive SE) comparing 5 AEDs in the treatment of benzodiazepine-resistant convulsive SE, phenobarbital and valproate had the highest efficacy (73.6% and 75.7%, respectively), followed by levetiracetam (68.5%) and phenytoin (50.2%). Lacosamide studies were excluded from the meta-analysis due to insufficient data [90], but its efficacy has been reported for patients with convulsive and NCSE [91,92]. There is not enough evidence at this point, however, to recommend its routine use for benzodiazepine refractory SE [90].
Refractory SE
When seizures continue despite the use of benzodiazepines and 2nd stage AEDs, SE becomes refractory (stage 3). Treatment of these resistant cases is frequently initiated in the ED and continued in an ICU. Outcomes were not significantly better in patients with SE admitted and managed in a neuro-ICU compared to a general medical ICU in a retrospective study, but the numbers were small (only 27% of SE were admitted to the former) [93] and this may change in the future. Intubation and mechanical ventilation is the first step, if not already present (only 21% of patients in the RAMPART study received endotracheal intubation, with 6.4% in the prehospital setting and 93.6% after admission [87]). Hemodynamic support with pressors or inotropes may be required as most anesthetic agents may decrease the blood pressure. Because of the urgency of controlling the seizures during SE, the potential aspiration risk and the questionable enteral absorption per os administration of additional AEDs is problematic, and IV formulations should be used.
Currently in the US, phenytoin, valproic acid, phenobarbital, levetiracetam, lacosamide, diazepam, lorazepam are available in IV formulations. In February 2016, the FDA also approved brivaracetam (which also is available in an IV formulation) and in October of the same year IV carbamazepine. None of these AEDs has an FDA indication for SE, although they are widely used. Parenteral lacosamide has a success rate of 33% to 67.7% (200–400 mg over 3–5 min was the most common bolus dose) depending on its use as second or third AED [94–96]. In lacosamide-naive patients with RSE on continuous EEG monitoring, the success rate for cessation of SE was 15.7, 25.5, 58.8, and 82.4 % by 4, 12, 24, and 48 hours, respectively [97]. Alternatively, topiramate in doses 300–1600 mg/day per oro/nasogastric tube can be considered [98]. In a study of 35 patients with RSE treated with topiramate as an adjunct AED, the response rate was 86% (as the third AED), and remained stable at 67% after administration as the fourth to seventh AED. Overall, RSE was terminated in 71% of patients within 72 hours after first administration of topiramate [99]. Other studies, however, adjusting for co-variates, did not prove topiramate to be effective in RSE [100]. Clobazam, a unique oral 1,5-benzodiazepine with excellent absorption, has been also used in the treatment of RSE. Seventeen patients with RSE (11 with prior epilepsy) were successfully treated with clobazam, which was introduced after a median duration of 4 days and after a median of 3 failed AEDs. Termination of RSE within 24 hours of administration, without addition or modification of concurrent AED and with successful wean of anesthetic infusions, was seen in 13 patients, whereas indeterminate response was seen in another 3. Clobazam was deemed unsuccessful in 1 patient [101]. In another recent report of 70 episodes of RSE, clobazam was used in 24 (34.3%) of them. If clobazam was the last AED added to therapy before RSE termination, the success was attributed to this drug. Based on this definition, clobazam led to 6 episodes (25%) of successful RSE resolution [102]. If primary or metastatic brain tumor is the presumed cause of SE, a combination of IV phenytoin, IV levetiracetam (median dose 3 g/d) and enterically administered pregabalin (median dose 375 mg/day) led to 70% control of SE on average 24 hours after addition of the third AED [103]. However, the major treatment options, which should not be delayed in unresponsive RSE, are propofol or midazolam infusions at high rates and under continuous EEG monitoring. These infusions should be continued for at least 24 hours and then held to reassess the situation. By that time, cocurrent metabolic derangements and low AED levels from noncompliance should have been corrected. Prolonged and high-dose propofol should be avoided because of the risk for propofol infusion syndrome, especially if pressors/inotropes are co-infused [104].
Super-refractory SE
Should seizures continue or recur, stage 4 options for SRSE are considered [105]. Pentobarbital with shorter half-life is favored to phenobarbital. The main disadvantages of barbiturates are compromised neuro-exam (which has to be assessed frequently), cardiovascular depression and hypotension, respiratory depression with need for full ventilator support, cough suppression with increased risk for atelectasis and pneumonia, immunosuppression increasing the risk for infection or sepsis, immobility increasing the risk for thromboembolism and ileus mandating parenteral nutrition [106,107]. The depth and duration of the EEG suppression that must be achieved by barbiturates is unknown. Some experts recommend instead of burst-suppression pattern complete suppression or “flat record” because of better seizure control and fewer relapses [108]. Moreover, patients with more prolonged barbiturate treatment (> 96 hours) and those receiving phenobarbital at the time of pentobarbital taper are less likely to relapse [109]. European guidelines recommend titration of propofol and barbiturate to EEG burst-suppression, and midazolam to seizure suppression, maintained for at least 24 h [2]. In recent reviews, it was found that barbiturates control refractory and super-refractory SE in 64% of patients and are ineffective in only 5% [11,110].
If SE continues or recurs after emergence from barbiturate coma, ketamine may be an option [11,83]. Ketamine offers the advantage of NMDA receptor antagonism, which may be important in the late phase of SE and lacks cardiodepressant or hypotensive properties. Early [111] or late [112] use of ketamine has been reported in small case series with various success rates. In a recent multicenter retrospective study from North America and Europe, evaluating 58 patients with 60 RSE, ketamine was likely responsible for seizure control in 12% and possibly responsible in an additional 20%. No responses were observed when infusion rate was lower than 0.9 mg/kg/h or when ketamine was introduced 8 days or more after onset of SE or after failure of seven or more drugs [113].
If all these measures have failed, stage 4.2 treatment options are available (Table 2), but these are mostly based on small case series and expert opinions (except for the recent hypothermia study). Pyridoxine hydrochloride in an IV or enteral form at a dose of 100–300 mg/day for few days can be used in stage 4 or earlier stages, as it is a cofactor in the synthesis of the inhibitory neurotransmitter GABA [114]. There are no strong data for its effectiveness, but it can be used as a cheap and safe alternative [115]. Magnesium has been successfully used in 2 girls with juvenile Alper’s syndrome [116] and is the treatment of choice for eclamptic seizures. Ketogenic diet may also be an optionfor these patients [117]. Resection of the epileptic focus after mapping with intracranial EEG electrodes may be highly effective but cannot be used in many patients due to lack of focus or eloquence location [83,106,115]. Use of steroids, plasmapheresis or IVIG, followed by immunosuppression can be tried, but one should balance risks and benefits. These immunosuppressive or immunomodulating treatments should be especially considered in patients with NORSE or suspected autoimmune or paraneoplastic encephalitides, where AEDs usually have no effect [46]. These therapies though often precede the diagnosis, since it takes time for the autoantibody panel results to return and the treating physician has to make a decision to blindly start treatment for SRSE.
There were some promising data regarding hypothermia use in these desperate situations [118,119] until the HYBERNATUS study, conducted in France, was recently published. In this study, 270 patients with convulsive SE were randomized in to hypothermia (32° to 34°C for 24 hours) in addition to standard care or to standard care alone. A Glasgow Outcome Scale score of 5 (primary outcome) occurred in 49% of patients in the hypothermia group and in 43% in the control group (a nonstatistical difference). Secondary outcomes, including mortality at 90 days, RSE on day 1, SRSE and functional sequelae on day 90 were not different except for the rate of progression to EEG-confirmed SE on the first day, which was lower in the hypothermia group (11% vs. 22% in the controls). Adverse events were more frequent in the hypothermia group than in the control group [120].
Additional anecdotal treatments are presented in Table 2, but their efficacy is questionable.
This staged management approach may change in the future to a more physiologic and rational treatment with polytherapy based on synaptic receptor trafficking during SE [63]. For example, in an animal model of severe SE, combinations of a benzodiazepine with ketamine and valproate, or with ketamine and brivaracetam, were more effective and less toxic than benzodiazepine monotherapy [121]. Allopregnalonone, a metabolite of progesterone, is an endogenous, naturally occurring neuroactive steroid produced in the ovary, the adrenal cortex and the central nervous system. It is a potent positive allosteric modulator of synaptic and extrasynaptic GABAA receptors with antiepileptic activity [122]. Neuroactive steroids, such as allopregnanolone, are currently evaluated in SE.
Outcomes
SE still carries significant mortality and morbidity. Distinct variants of SE carry different mortalities, and the range is quite broad: from zero mortality for absence or complex partial SE in ambulatory patients [12], to 19% to 27% 30-day mortality for generalized tonic-clonic SE [20,123] and to 64.7% 30-day mortality for subtle SE [20]. Variables playing an important role in the outcome are the underlying cause (regarded by most authorities the most important variable), the duration of SE (mortality 32% if persistent for > 1 hour vs 2.7% if < 1 hour), the type of SE, the treatment administered, and the age of the patient (children have better outcomes than adults) [123–125]. The etiology of SE still remains the most important prognostic factor, with alcohol and AED-withdrawal/noncompliance having the best outcomes; structural brain injuries, such as anoxia-ischemia, vascular lesions, or brain tumors, have the worst prognosis.
The most resistant cases pose significant dilemmas regarding the length of treatment using barbiturate coma and the potential for acceptable prognosis or the need to withdraw life support. For RSE, for example, in-hospital mortality is 31.7% and 76.2% of patients reach poor functional outcome. Long-term outcomes are also dismal: at 1 year post-discharge, 74% are dead or in a state of unresponsive wakefulness, 16% severely disabled, and only 10% have no or minimal disability [126]. Duration of drug-induced coma, arrhythmias requiring intervention, and pneumonia are associated with poor functional outcome, whereas prolonged mechanical ventilation with mortality and seizure control without burst-suppression or isoelectric EEG are associated with good functional outcome [127,128].
Treatment with barbiturates may contribute to these outcomes, although it is very challenging to prove causality in such a complex and prolonged ICU environment. Some data have shed light towards that direction: in a recent retrospective study of 171 patients with SE, of which 37% were treated with IV anesthetic drugs, there was a higher risk for infections and a 2.9-fold relative risk for death after adjustment for confounders in the group treated with IV anesthetics compared to the group without these agents [129].
The SE Severity Score (STESS, range 0–6) is a prognostic score for survival [130] and can be used as a scaffold for discussions with families and covariate adjustment tool for research. A favorable score of 0–2 has a negative predictive value of 0.97 for survival and likelihood to return to baseline clinical condition in survivors, although an unfavorable score (3–6) had a positive predictive value for death of only 0.39 [131].
The risk for recurrence of afebrile SE in a population-based study in Minnesota has been estimated at 31.7% over a 10-year follow-up period. The risk for recurrence was about 25% regardless of the underlying etiology, except in those patients with SE occurring in the setting of a progressive brain disorder (who had a 100% risk). Female gender, generalized (vs partial) SE and lack of response to the first AED after the initial episode of SE were independent factors for recurrence [132].
Conclusion
Despite the use of better diagnostic tools (continuous video EEG), advances in technology in the ICU, and availability of new AEDs, SE still carries significant mortality and morbidity, which depends mainly on age and etiology. The current treatment is still staged, with supportive measures and benzodiazepine administration remaining the mainstay initially and followed by older and newer AEDs and anesthetics for resistant cases. With the advance of pathophysiologic mechanisms elucidation at a molecular/receptor level, combinations of AEDs may become the foundation of future SE control.
Corresponding author: Panayiotis N. Varelas, MD, PhD, FNCS, Division Head, Neuro-Critical Care Service, Henry Ford Hospital, K-11, 2799 W. Grand Blvd., Detroit, MI 48202, [email protected].
Financial disclosures: Dr. Varelas was local principal investigator for a super-refractory status epilepticus study sponsored by Sage Therapeutics.
Author contributions: conception and design, ARR, PNV; analysis and interpretation of data, PNV; drafting of article, PNV; critical revision of the article, ARR, PNV; administrative or technical support, PNV; collection and assembly of data, ARR, PNV.
1. Hauser WA. Status epilepticus: epidemiologic considerations. Neurology 1990;40:9–13.
2. Meierkord H, Boon P, Engelsen B, et al. EFNS guideline on the management of status epilepticus. Eur J Neurology 2006;13:445–50.
3. Brophy GM, Bell R, Claassen J, et al. Guidelines for the evaluation and management of status epilepticus. Neurocrit Care 2012;17:3–23.
4. Glauser T, Shinnar S, Gloss D, et al. Evidence-based guideline: treatment of convulsive status epilepticus in children and adults: Report of the Guideline Committee of the American Epilepsy Society. Epilepsy Curr 2016;16:48–61.
5. Gastaut H. Classification of status epilepticus. Adv Neurol 1983;34:15–35.
6. Treatment of convulsive status epilepticus. Recommendations of the Epilepsy Foundation of America’s Working Group on Status Epilepticus. JAMA 1993;270:854–9.
7. Lowenstein DH. Status epilepticus: an overview of the clinical problem. Epilepsia 1999;40 Suppl 1:S3–8; discussion S21–22.
8. Jenssen S, Gracely EJ, Sperling MR. How long do most seizures last? A systematic comparison of seizures recorded in the epilepsy monitoring unit. Epilepsia 2006;47:1499–503.
9. Goodkin HP, Kapur J. Responsiveness of status epilepticus to treatment with diazepan decreases rapidly as seizure duration increases. Epilepsy Curr 2003;3:11–2.
10. Lowenstein DH. The management of refractory status epilepticus: an update. Epilepsia 2006;47 Suppl 1:35–40.
11. Shorvon S, Ferlisi M. The treatment of super-refractory status epilepticus: a critical review of available therapies and a clinical treatment protocol. Brain 2011;134:2802–18.
12. Kaplan PW. Assessing the outcomes in patients with nonconvulsive status epilepticus: nonconvulsive status epilepticus is underdiagnosed, potentially overtreated, and confounded by comorbidity. J Clin Neurophysiol 1999;16:341–52.
13. Walker MD. Diagnosis and treatment of nonconvulsive status epilepticus. CNS Drugs 2001;15:931–9.
14. Kaplan PW. EEG criteria for nonconvulsive status epilepticus. Epilepsia 2007;48 Suppl 8:39–41.
15. Beniczky S, Hirsch LJ, Kaplan PW, et al. Unified EEG terminology and criteria for nonconvulsive status epilepticus. Epilepsia 2013;54 Suppl 6:28–9.
16. Sutter R, Kaplan PW. Electroencephalographic criteria for nonconvulsive status epilepticus: synopsis and comprehensive survey. Epilepsia 2012;53 Suppl 3:1–51.
17. Ristic AJ, Marjanovic I, Brajkovic L, et al. Balint-like syndrome as an unusual representation of non-convulsive status epilepticus. Epileptic Disord 2012;14:80–4.
18. Trinka E, Hofler J, Zerbs A. Causes of status epilepticus. Epilepsia 2012;53 Suppl 4:127–38.
19. DeLorenzo RJ, Hauser WA, Towne AR, et al. A prospective, population-based epidemiologic study of status epilepticus in Richmond, Virginia. Neurology 1996;46:1029–35.
20. Treiman DM, Meyers PD, Walton NY, et al. A comparison of four treatments for generalized convulsive status epilepticus. Veterans Affairs Status Epilepticus Cooperative Study Group. N Engl J Med 1998;339:792–8.
21. Carrera E, Michel P, Despland PA, et al. Continuous assessment of electrical epileptic activity in acute stroke. Neurology 2006;67:99–104.
22. Towne AR, Waterhouse EJ, Boggs JG, et al. Prevalence of nonconvulsive status epilepticus in comatose patients. Neurology 2000;54:340–5.
23. Claassen J, Jette N, Chum F, et al. Electrographic seizures and periodic discharges after intracerebral hemorrhage. Neurology 2007;69:1356–65.
24. Claassen J, Peery S, Kreiter KT, et al. Predictors and clinical impact of epilepsy after subarachnoid hemorrhage. Neurology 2003;60:208–14.
25. Claassen J, Perotte A, Albers D, et al. Nonconvulsive seizures after subarachnoid hemorrhage: Multimodal detection and outcomes. Ann Neurol 2013;74:53–64.
26. Lindgren C, Nordh E, Naredi S, Olivecrona M. Frequency of non-convulsive seizures and non-convulsive status epilepticus in subarachnoid hemorrhage patients in need of controlled ventilation and sedation. Neurocrit Care 2012;17:367–73.
27. Cocito L, Audenino D, Primavera A. Altered mental state and nonconvulsive status epilepticus in patients with cancer. Arch Neurol 2001;58:1310.
28. Vespa PM, Nuwer MR, Nenov V, et al. Increased incidence and impact of nonconvulsive and convulsive seizures after traumatic brain injury as detected by continuous electroencephalographic monitoring. J Neurosurg 1999;91:750–60.
29. Tian L, Li Y, Xue X, et al. Super-refractory status epilepticus in West China. Acta Neurol Scand 2015;132:1–6.
30. Holtkamp M, Othman J, Buchheim K, et al. A “malignant” variant of status epilepticus. Arch Neurol 2005;62:1428–31.
31. Lowenstein DH, Alldredge BK. Status epilepticus at an urban public hospital in the 1980s. Neurology 1993;43:483–8.
32. Mayer SA, Claassen J, Lokin J, et al. Refractory status epilepticus: frequency, risk factors, and impact on outcome. Arch Neurol 2002;59:205–10.
33. Rossetti AO, Logroscino G, Bromfield EB. Refractory status epilepticus: effect of treatment aggressiveness on prognosis. Arch Neurol 2005;62:1698–702.
34. Novy J, Logroscino G, Rossetti AO. Refractory status epilepticus: a prospective observational study. Epilepsia 2010;51:251–6.
35. Garzon E, Fernandes RM, Sakamoto AC. Analysis of clinical characteristics and risk factors for mortality in human status epilepticus. Seizure 2003;12:337–45.
36. Sutter R, Kaplan PW, Marsch S, et al. Early predictors of refractory status epilepticus: an international two-center study. Eur J Neurol 2015;22:79–85.
37. Wijdicks EF, Sharbrough FW. New-onset seizures in critically ill patients. Neurology 1993;43:1042–4.
38. Bleck TP, Smith MD, Pierre-Louis SJ, et al. Neurologic complications of critical medical illnesses. Crit Care Med 1993;21:98–103.
39. Oddo M, Carrera E, Claassen J, et al. Continuous electroencephalography in the medical intensive care unit. Crit Care Med 2009;37:2051–6.
40. Gilmore EJ, Gaspard N, Choi HA, et al. Acute brain failure in severe sepsis: a prospective study in the medical intensive care unit utilizing continuous EEG monitoring. Intensive Care Med 2015;41:686–94.
41. Misra UK, Kalita J, Patel, R. Sodium valproate vs phenytoin in status epilepticus: a pilot study. Neurology 2006;67:340–2.
42. Kim A, Kim JE, Paek YM, et al. Cefepime-induced non-convulsive status epilepticus (NCSE). J Epilepsy Res 2013;3:39–41.
43. Naeije G, Lorent S, Vincent JL, Legros B. Continuous epileptiform discharges in patients treated with cefepime or meropenem. Arch Neurol 2011;68:1303–7.
44. Tan RY, Neligan A, Shorvon SD. The uncommon causes of status epilepticus: a systematic review. Epilepsy Res 2010;91:111–22.
45. Khawaja AM, DeWolfe JL, Miller DW, Szaflarski JP. New-onset refractory status epilepticus (NORSE) - The potential role for immunotherapy. Epilepsy Behav 2015;47:17–23.
46. Davis R, Dalmau J. Autoimmunity, seizures, and status epilepticus. Epilepsia 2013;54 Suppl 6:46–9.
47. Lopinto-Khoury C, Sperling MR. Autoimmune status epilepticus. Curr Treat Options Neurol 2013;15:545–56.
48. Bansal P, Zutshi D, Suchdev K, et al. Alpha 3 ganglionic acetylcholine receptor antibody associated refractory status epilepticus. Seizure 2016;35:1–3.
49. Chen JW, Wasterlain CG. Status epilepticus: pathophysiology and management in adults. Lancet Neurol 2006;5:246–56.
50. DeLorenzo RJ, Garnett LK, Towne AR, et al. Comparison of status epilepticus with prolonged seizure episodes lasting from 10 to 29 minutes. Epilepsia 1999;40:164–9.
51. Lowenstein DH, Alldredge BK. Status epilepticus. N Engl J Med 1998;338:970–6.
52. Millikan D, Rice B, Silbergleit R. Emergency treatment of status epilepticus: current thinking. Emerg Med Clin North Am 2009;27:101–13, ix.
53. Fountain NB. Status epilepticus: risk factors and complications. Epilepsia 2000;41 Suppl 2:S23–30.
54. Aminoff MJ, Simon RP. Status epilepticus. Causes, clinical features and consequences in 98 patients. Am J Med 1980;69:657–66.
55. Meldrum BS, Brierley JB. Prolonged epileptic seizures in primates. Ischemic cell change and its relation to ictal physiological events. Arch Neurol 1973;28:10–7.
56. Meldrum BS, Vigouroux RA, Brierley JB. Systemic factors and epileptic brain damage. Prolonged seizures in paralyzed, artificially ventilated baboons. Arch Neurol 1973;29:82–7.
57. Loscher W. Mechanisms of drug resistance in status epilepticus. Epilepsia 2007;48 Suppl 8:74–7.
58. Jacob TC, Moss SJ, Jurd R. GABA(A) receptor trafficking and its role in the dynamic modulation of neuronal inhibition. Nat Rev Neurosci 2008;9:331–43.
59. Arancibia-Carcamo IL, Kittler JT. Regulation of GABA(A) receptor membrane trafficking and synaptic localization. Pharmacol Ther 2009;123:17–31.
60. Bohnsack JP, Carlson SL, Morrow AL. Differential regulation of synaptic and extrasynaptic alpha4 GABA(A) receptor populations by protein kinase A and protein kinase C in cultured cortical neurons. Neuropharmacology 2016;105:124–32.
61. Farrant M, Nusser Z. Variations on an inhibitory theme: phasic and tonic activation of GABA(A) receptors. Nat Rev Neurosci 2005;6:215–29.
62. Smith KR, Kittler JT. The cell biology of synaptic inhibition in health and disease. Curr Opin Neurobiol 2010;20:550–6.
63. Wasterlain CG, Naylor DE, Liu H, et al. Trafficking of NMDA receptors during status epilepticus: therapeutic implications. Epilepsia 2013;54 Suppl 6:78–80.
64. Bankstahl JP, Loscher W. Resistance to antiepileptic drugs and expression of P-glycoprotein in two rat models of status epilepticus. Epilepsy Res 2008;82:70–85.
65. Henshall DC, Diaz-Hernandez M, Miras-Portugal MT, Engel T. P2X receptors as targets for the treatment of status epilepticus. Front Cell Neurosci 2013;7:237.
66. Lamsa K, Taira T. Use-dependent shift from inhibitory to excitatory GABAA receptor action in SP-O interneurons in the rat hippocampal CA3 area. J Neurophysiol 2003;90:1983–95.
67. Cock HR, Tong X, Hargreaves IP, et al. Mitochondrial dysfunction associated with neuronal death following status epilepticus in rat. Epilepsy Res 2002;48:157–68.
68. Friedman A, Dingledine R, Molecular cascades that mediate the influence of inflammation on epilepsy. Epilepsia 2011;52 Suppl 3:33–39.
69. Henshall DC. MicroRNAs in the pathophysiology and treatment of status epilepticus. Front Mol Neurosci 2013;6:37.
70. Vespa P, Tubi M, Claassen J, et al. Metabolic crisis occurs with seizures and periodic discharges after brain trauma. Ann Neurol 2016;79:579–90.
71. Witsch J, Frey HP, Schmidt JM, et al. Electroencephalographic periodic discharges and frequency-dependent brain tissue hypoxia in acute brain injury. JAMA Neurol 2017;74:301–9.
72. Rodriguez Ruiz A, Vlachy J, Lee JW, et al. Association of periodic and rhythmic electroencephalographic patterns with seizures in critically ill patients. JAMA Neurol 2017;74:181–8.
73. DeLorenzo RJ, Waterhouse EJ, Towne AR, et al. Persistent nonconvulsive status epilepticus after the control of convulsive status epilepticus. Epilepsia 1998;39:833–40.
74. Benbadis SR, Chen S, Melo M. What’s shaking in the ICU? The differential diagnosis of seizures in the intensive care setting. Epilepsia 2010;51:2338–40.
75. Pandian JD, Cascino GD, So EL, et al. Digital video-electroencephalographic monitoring in the neurological-neurosurgical intensive care unit: clinical features and outcome. Arch Neurol 2004;61:1090–4.
76. Irani SR, Vincent A, Schott JM. Autoimmune encephalitis. BMJ 2011;342:d1918.
77. Irani SR, Michell AW, Lang B, et al. Faciobrachial dystonic seizures precede Lgi1 antibody limbic encephalitis. Ann Neurol 2011;69:892–900.
78. Herman ST, Abend NS, Bleck TP, et al. Consensus statement on continuous EEG in critically ill adults and children, part I: indications. J Clin Neurophysiol 2015;32:87–95.
79. Brenner RP. Is it status? Epilepsia 2002;43 Suppl 3:103–113.
80. Cook AM, Castle A, Green A, et al. Practice variations in the management of status epilepticus. Neurocrit Care 2012;17:24–30.
81. Alldredge BK, Gelb AM, Isaacs SM, et al. A comparison of lorazepam, diazepam, and placebo for the treatment of out-of-hospital status epilepticus. N Engl J Med 2001;345:631–7.
82. Silbergleit R, Durkalski V, Lowenstein D, et al. Intramuscular versus intravenous therapy for prehospital status epilepticus. N Engl J Med 2012;366:591–600.
83. Shorvon S. Super-refractory status epilepticus: an approach to therapy in this difficult clinical situation. Epilepsia 2011;52 Suppl 8:53–6.
84. Varelas P, Mirski MA. Management of status epilepticus in adults. Hosp Physician Board Rev Man 2014;2:1–15.
85. McIntyre J, Robertson S, Norris E, et al. Safety and efficacy of buccal midazolam versus rectal diazepam for emergency treatment of seizures in children: a randomised controlled trial. Lancet 2005;366:205–10.
86. Misra UK, Kalita J, Maurya PK. Levetiracetam versus lorazepam in status epilepticus: a randomized, open labeled pilot study. J Neurol 2012;259:645–8.
87. Vohra TT, Miller JB, Nicholas KS, et al. Endotracheal intubation in patients treated for prehospital status epilepticus. Neurocrit Care 2015;23:33–43.
88. Agarwal P, Kumar N, Chandra R, et al. Randomized study of intravenous valproate and phenytoin in status epilepticus. Seizure 2007;16:527–32.
89. Trinka E. What is the evidence to use new intravenous AEDs in status epilepticus? Epilepsia 2011;52 Suppl 8:35–38.
90. Yasiry Z, Shorvon SD. The relative effectiveness of five antiepileptic drugs in treatment of benzodiazepine-resistant convulsive status epilepticus: a meta-analysis of published studies. Seizure 2014;23:167–74.
91. Moreno Morales EY, Fernandez Peleteiro M, Bondy Pena EC, et al. Observational study of intravenous lacosamide in patients with convulsive versus non-convulsive status epilepticus. Clin Drug Investig 2015;35:463–9.
92. Paquette V, Culley C, Greanya ED, Ensom MH. Lacosamide as adjunctive therapy in refractory epilepsy in adults: a systematic review. Seizure 2015;25:1–17.
93. Varelas PN, Corry J, Rehman M, et al. Management of status epilepticus in neurological versus medical intensive care unit: does it matter? Neurocrit Care 2013;19:4–9.
94. Hofler J, Trinka E. Lacosamide as a new treatment option in status epilepticus. Epilepsia 2013;54:393–404.
95. Kellinghaus C, Berning S, Stogbauer F. Intravenous lacosamide or phenytoin for treatment of refractory status epilepticus. Acta Neurol Scand 2014;129:294–9.
96. Santamarina E, Toledo M, Sueiras M, et al. Usefulness of intravenous lacosamide in status epilepticus. J Neurol 2013;260:3122–8.
97. Newey CR, Le NM, Ahrens C, et al. The safety and effectiveness of intravenous lacosamide for refractory status epilepticus in the critically ill. Neurocrit Care 2017;26:273–9.
98. Towne AR, Garnett LK, Waterhouse EJ, et al. The use of topiramate in refractory status epilepticus. Neurology 2003;60:332–4.
99. Hottinger A, Sutter R, Marsch S, Ruegg S. Topiramate as an adjunctive treatment in patients with refractory status epilepticus: an observational cohort study. CNS Drugs 2012;26:761–72.
100. Madzar D, Kuramatsu JB, Gerner ST, et al. Assessing the value of topiramate in refractory status epilepticus. Seizure 2016;38:7–10.
101. Sivakumar S, Ibrahim M, Parker D Jr, et al. An effective add-on therapy in refractory status epilepticus. Epilepsia 2015;56:e83–89.
102. Madzar D, Geyer A, Knappe RU, et al. Effects of clobazam for treatment of refractory status epilepticus. BMC Neurol 2016;16:202.
103. Swisher CB, Doreswamy M, Gingrich KJ, et al. Phenytoin, levetiracetam, and pregabalin in the acute management of refractory status epilepticus in patients with brain tumors. Neurocrit Care 2012;16:109–13.
104. Smith H, Sinson G, Varelas P. Vasopressors and propofol infusion syndrome in severe head trauma. Neurocrit Care 2009;10:166–72.
105. Cuero MR, Varelas PN. Super-refractory status epilepticus. Curr Neurol Neurosci Rep 2015;15:74.
106. Varelas PN. How I treat status epilepticus in the Neuro-ICU. Neurocrit Care 2008;9:153–7.
107. Varelas PN, Spanaki MV, Mirski MA. Status epilepticus: an update. Curr Neurol Neurosci Rep 2013;13:357.
108. Krishnamurthy KB, Drislane FW. Depth of EEG suppression and outcome in barbiturate anesthetic treatment for refractory status epilepticus. Epilepsia 1999;40:759–62.
109. Krishnamurthy KB, Drislane FW. Relapse and survival after barbiturate anesthetic treatment of refractory status epilepticus. Epilepsia 1996;37:863–7.
110. Ferlisi M, Shorvon S. The outcome of therapies in refractory and super-refractory convulsive status epilepticus and recommendations for therapy. Brain 2012;135:2314–28.
111. Kramer AH. Early ketamine to treat refractory status epilepticus. Neurocrit Care 2012;16:299–305.
112. Synowiec AS, Singh DS, Yenugadhati V, et al. Ketamine use in the treatment of refractory status epilepticus. Epilepsy Res 2013;105:183–8.
113. Gaspard N, Foreman B, Judd LM, et al. Intravenous ketamine for the treatment of refractory status epilepticus: a retrospective multicenter study. Epilepsia 2013;54:1498–503.
114. Schulze-Bonhage A, Kurthen M, Walger P, Elger CE. Pharmacorefractory status epilepticus due to low vitamin B6 levels during pregnancy. Epilepsia 2004;45:81–4.
115. Shorvon S. Clinical trials in acute repetitive seizures and status epilepticus. Epileptic Disord 2012;14:138–47.
116. Visser NA, Braun KP, Leijten FS, et al. Magnesium treatment for patients with refractory status epilepticus due to POLG1-mutations. J Neurol 2011;258:218–22.
117. Thakur KT, Probasco JC, Hocker SE, et al. Ketogenic diet for adults in super-refractory status epilepticus. Neurology 2014;82:665–70.
118. Corry JJ, Dhar R, Murphy T, Diringer MN. Hypothermia for refractory status epilepticus. Neurocrit Care 2008;9:189–97.
119. Guilliams K, Rosen M, Buttram S, et al. Hypothermia for pediatric refractory status epilepticus. Epilepsia 2013;54:1586–94.
120. Legriel S, Lemiale V, Schenck M, et al. Hypothermia for neuroprotection in convulsive status epilepticus. N Engl J Med 2016;375:2457–67.
121. Wasterlain CG, Baldwin R, Naylor DE, et al. Rational polytherapy in the treatment of acute seizures and status epilepticus. Epilepsia 2011;52 Suppl 8:70–1.
122. Rogawski MA, Loya CM, Reddy K, et al. Neuroactive steroids for the treatment of status epilepticus. Epilepsia 2013;54 Suppl 6:93–8.
123. Towne AR, Pellock JM, Ko D, DeLorenzo RJ. Determinants of mortality in status epilepticus. Epilepsia 1994;35:27–34.
124. DeLorenzo RJ, Towne AR, Pellock JM, Ko D. Status epilepticus in children, adults, and the elderly. Epilepsia 1992;33 Suppl 4:S15–25.
125. Legriel S, Mourvillier B, Bele N, et al. Outcomes in 140 critically ill patients with status epilepticus. Intensive Care Med 2008;34:476–80.
126. Pugin D, Foreman B, De Marchis GM, et al. Is pentobarbital safe and efficacious in the treatment of super-refractory status epilepticus: a cohort study. Crit Care 2014;18:R103.
127. Hocker SE, Britton JW, Mandrekar JN, et al. Predictors of outcome in refractory status epilepticus. JAMA Neurol 2013;70:72–7.
128. Hocker S, Tatum WO, LaRoche S, Freeman WD. Refractory and super-refractory status epilepticus--an update. Curr Neurol Neurosci Rep 2014;14:452.
129. Sutter R, Marsch S, Fuhr P, et al. Anesthetic drugs in status epilepticus: risk or rescue? A 6-year cohort study. Neurology 2014;82:656–64.
130. Rossetti AO, Logroscino G, Bromfield EB. A clinical score for prognosis of status epilepticus in adults. Neurology 2006;66:1736–8.
131. Rossetti AO, Logroscino G, Milligan TA, et al. Status Epilepticus Severity Score (STESS): a tool to orient early treatment strategy. J Neurol 2008;255:1561–6.
132. Hesdorffer DC, Logroscino G, Cascino GD, Hauser WA. Recurrence of afebrile status epilepticus in a population-based study in Rochester, Minnesota. Neurology 2007;69:73–8.
133. Varelas PN, Mirski MA. Seizures in the adult intensive care unit. J Neurosurg Anesthesiol 2001;13:163–75.
134. Varelas PN, Mirski MA. Status epilepticus. Curr Neurol Neurosci Rep 2009;9:469–76.
2017 Update on contraception
According to the most recent data (2011–2013), 62% of women of childbearing age (15–44 years) use some method of contraception. Of these “contracepting” women, about 25% reported relying on permanent contraception, making it one of the most common methods of contraception used by women in the United States (FIGURE 1).1,2 Women either can choose to have a permanent contraception procedure performed immediately postpartum, which occurs after approximately 9% of all hospital deliveries in the United States,3 or at a time separate from pregnancy.
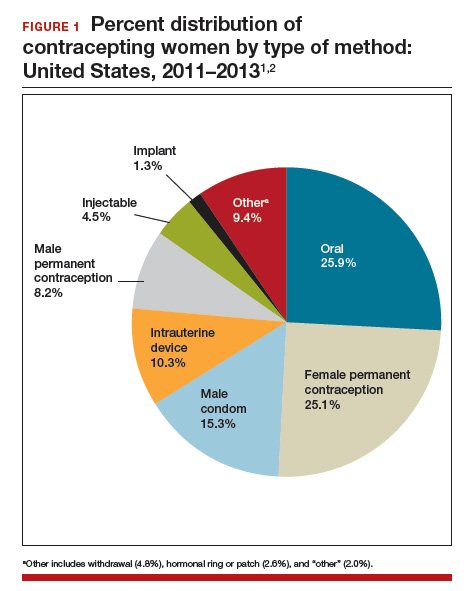
The most common methods of permanent contraception include partial salpingectomy at the time of cesarean delivery or within 24 hours after vaginal delivery and laparoscopic occlusive procedures at a time unrelated to the postpartum period.3 Hysteroscopic occlusion of the tubal ostia is a newer option, introduced in 2002; its worldwide use is concentrated in the United States, which accounts for 80% of sales based on revenue.4
Historically, for procedures remote from pregnancy, the laparoscopic approach evolved with less sophisticated laparoscopic equipment and limited visualization, which resulted in efficiency and safety being the primary goals of the procedure.5 Accordingly, rapid occlusive procedures were commonplace. However, advancement of laparoscopic technology related to insufflation systems, surgical equipment, and video capabilities did not change this practice.
Recent literature has suggested that complete fallopian tube removal provides additional benefits. With increasing knowledge about the origin of ovarian cancer, as well as increasing data to support the hypothesis that complete tubal excision results in increased ovarian cancer protection when compared with occlusive or partial salpingectomies, both the American College of Obstetricians and Gynecologists (ACOG)6 and the Society of Gynecologic Oncology (SGO)7 recommend discussing bilateral total salpingectomy with patients desiring permanent contraception. Although occlusive procedures decrease a woman’s lifetime risk of ovarian cancer by 24% to 34%,8,9 total salpingectomy likely reduces this risk by 49% to 65%.10,11
With this new evidence, McAlpine and colleagues initiated an educational campaign, targeting all ObGyns in British Columbia, which outlined the role of the fallopian tube in ovarian cancer and urged the consideration of total salpingectomy for permanent contraception in place of occlusive or partial salpingectomy procedures. They found that this one-time targeted education increased the use of total salpingectomy for permanent contraception from 0.5% at 2 years before the intervention to 33.3% by 2 years afterwards.12 On average, laparoscopic bilateral salpingectomy took 10 minutes longer to complete than occlusive procedures. Most importantly, they found no significant differences in complication rates, including hospital readmissions or blood transfusions.
Although our community can be applauded for the rapid uptake of concomitant bilateral salpingectomy at the time of benign hysterectomy,12,13 offering total salpingectomy for permanent contraception is far from common practice. Similarly, while multiple studies have been published to support the practice of opportunistic salpingectomy at the time of hysterectomy, little has been published about the use of bilateral salpingectomy for permanent contraception until this past year.
In this article, we review some of the first publications to focus specifically on the feasibility and safety profile of performing either immediate postpartum total salpingectomy or interval total salpingectomy in women desiring permanent contraception.
Family Planning experts are now strongly discouraging the use of terms like “sterilization,” “permanent sterilization,” and “tubal ligation” due to sterilization abuses that affected vulnerable and marginalized populations in the United States during the early-to mid-20th century.
In 1907, Indiana was the first state to enact a eugenics-based permanent sterilization law, which initiated an aggressive eugenics movement across the United States. This movement lasted for approximately 70 years and resulted in the sterilization of more than 60,000 women, men, and children against their will or without their knowledge. One of the major contributors to this movement was the state of California, which sterilized more than 20,000 women, men, and children.
They defined sterilization as a prophylactic measure that could simultaneously defend public health, preserve precious fiscal resources, and mitigate menace of the “unfit and feebleminded.” The US eugenics movement even inspired Hitler and the Nazi eugenics movement in Germany.
Because of these reproductive rights atrocities, a large counter movement to protect the rights of women, men, and children resulted in the creation of the Medicaid permanent sterilization consents that we still use today. Although some experts question whether the current Medicaid protective policy should be reevaluated, many are focused on the use of less offensive language when discussing the topic.
Current recommendations are to use the phrase “permanent contraception” or simply refer to the procedure name (salpingectomy, vasectomy, tubal occlusion, etc.) to move away from the connection to the eugenics movement.
Read about a total salpingectomy at delivery
Total salpingectomy: A viable option for permanent contraception after vaginal or at cesarean delivery
Shinar S, Blecher Y, Alpern S, et al. Total bilateral salpingectomy versus partial bilateral salpingectomy for permanent sterilization during cesarean delivery. Arch Gynecol Obstet. 2017;295(5):1185-1189.
Danis RB, Della Badia CR, Richard SD. Postpartum permanent sterilization: could bilateral salpingectomy replace bilateral tubal ligation? J Minim Invasive Gynecol. 2016;23(6):928-932.
Shinar and colleagues presented a retrospective case series that included women undergoing permanent contraception procedures during cesarean delivery at a single tertiary medical center. The authors evaluated outcomes before and after a global hospital policy changed the preferred permanent contraception procedure from partial to total salpingectomy.
Details of the Shinar technique and outcomes
Of the 149 women included, 99 underwent partial salpingectomy via the modified Pomeroy technique and 50 underwent total salpingectomy using an electrothermal bipolar tissue-sealing instrument (Ligasure). The authors found no difference in operative times and similar rates of complications. Composite adverse outcomes, defined as surgery duration greater than 45 minutes, hemoglobin decline greater than 1.2 g/dL, need for blood transfusion, prolonged hospitalization, ICU admission, or re-laparotomy, were comparable and were reported as 30.3% and 36.0% in the partial and total salpingectomy groups, respectively, (P = .57).One major complication occurred in the total salpingectomy cohort; postoperatively the patient had hemodynamic instability and was found to have hemoperitoneum requiring exploratory laparotomy. Significant bleeding from the bilateral mesosalpinges was discovered, presumably directly related to the total salpingectomy.
Related article:
Hysteroscopic tubal occlusion: How new product labeling can be a resource for patient counseling
Details of Danis et al
Intuitively, performing salpingectomy at the time of cesarean delivery does not seem as significant a change in practice as would performing salpingectomy through a small periumbilical incision after vaginal delivery. However, Danis and colleagues did just that; they published a retrospective case series of total salpingectomy performed within 24 hours after a vaginal delivery at an urban, academic institution. They included all women admitted for full-term vaginal deliveries who desired permanent contraception, with no exclusion criteria related to body mass index (BMI). The authors reported on 80 women, including 64 (80%) who underwent partial salpingectomy via the modified Pomeroy or Parkland technique and 16 (20%) who underwent total salpingectomy. Most women had a BMI of less than 30 kg/m2; less than 15% of the women in each group had a BMI greater than 40 kg/m2.
The technique for total salpingectomy involved a 2- to 3-cm vertical incision at the level of the umbilicus, elevation of the entire fallopian tube with 2 Babcock clamps, followed by the development of 2 to 3 windows with monopolar electrocautery in the mesosalpinx and subsequent suture ligation with polyglactin 910 (Vicryl, Ethicon).
Major findings included slightly longer operative time in the total salpingectomy compared with the partial salpingectomy group (a finding consistent with other studies12,14,15) and no difference in complication rates. The average (SD) surgical time in the partial salpingectomy group was 59 (16) minutes, compared with 71 (6) minutes in the total salpingectomy group (P = .003). The authors reported 4 (6.3%) complications in the partial salpingectomy group--ileus, excessive bleeding from mesosalpinx, and incisional site hematoma--and no complications in the total salpingectomy group (P = .58).
These 2 studies, although small retrospective case series, demonstrate the feasibility of performing total salpingectomies with minimal operative time differences when compared with more traditional partial salpingectomy procedures. The re-laparotomy complication noted in the Shinar series cannot be dismissed, as this is a major morbidity, but it also should not dictate the conversation.
Overall, the need for blood transfusion or unintended major surgery after permanent contraception procedures is rare. In the U.S. Collaborative Review of Sterilization study, none of the 282 women who had a permanent contraception procedure performed via laparotomy experienced either of these outcomes.16 Only 1 of the 9,475 women (0.01%) having a laparoscopic procedure in this study required blood transfusion and 14 (0.15%) required reoperation secondary to a procedure complication.17 The complication reported in the Shinar study reminds us that the technique for salpingectomy in the postpartum period, whether partial or total, should be considered carefully, being mindful of the anatomical changes that occur in pregnancy.
While larger studies should be performed to confirm these initial findings, these 2 articles provide the reassurance that many providers may need before beginning to offer total salpingectomy procedures in the immediate postpartum period.
When women present for permanent contraception counseling, we must remember that our patients' needs are often far too diverse and dynamic to allow a universal counseling technique. Every provider likely has a counseling style, with a structure and language that has been altered and changed through years of practice, patient experiences, and new scientific technologies and data. Unfortunately, provider biases and past coercive practices also influence contraceptive counseling.
Historically, some providers used formulas related to a woman's age and parity to decide if she could have a permanent contraception procedure, possibly based on fears of patient regret. Such practices are an embarrassment to the principles of patient autonomy and empowerment, which should serve as the foundation for any contraceptive conversation. Studies of regret after permanent contraception procedures are often misinterpreted; although younger women experience higher rates of regret, the absolute rate still favors performing the procedure.1,2 When comparing women aged 30 or younger to those older than 30 years at the time of procedure, the vast majority (about 80%) of those 30 and younger do not express regret.1 Less than 5% of women who express regret access a reversal procedure.2,3 Our job as providers is to educate and allow women to understand the options--and with permanent contraception that also means explaining the potential for regret; however, empowering women does not mean limiting an opportunity for the majority to potentially impact the minority.
Our contraceptive counseling philosophy follows the shared decision-making model. This model informs the patient, tailors the conversation toward her priorities, and maintains patient autonomy, while empowering the patient to take control of her reproductive health and future. When a patient expresses the desire for permanent contraception, we ensure she understands the permanence of the procedure and offer information about other Tier 1 contraceptive options, including long-acting reversible methods and vasectomy. We use the evidence-based World Health Organization counseling table4,5 to assist with the discussion and provide vasectomy referral and further information about specific intrauterine devices or the contraceptive implant based on the woman's interests.
For women who desire a female permanent contraception procedure, we also provide information tables comparing laparoscopic tubal occlusion procedures, laparoscopic bilateral salpingectomy, and hysteroscopic tubal occlusion. These tables review how each procedure is performed; risks and benefits, including failure rates over time; and ovarian cancer protection estimates. Our office also has devised tables to inform women seeking permanent contraception immediately after delivery and unrelated to pregnancy. Ultimately, the woman can choose what makes the most sense for her at that specific time in her life, and as providers we must support and uphold that decision.
References
- Hills SD, Marchbanks PA, Tylor LR, Peterson HB. Poststerilization regret: findings from the United States Collaborative Review of Sterilization. Obstet Gynecol. 1999;93(6):889-895.
- Curtis KM, Mohllajee AP, Peterson HB. Regret following female sterilization at a young age: a systematic review. Contraception. 2006;73(2):205-210.
- Schmidt JE, Hillis SD, Marchbanks PA, Jeng G, Peterson HB. Requesting information about and obtaining reversal after tubal sterilization: findings from the U.S. Collaborative Review of Sterilization. Fertil Steril. 2000;74(5):892-898.
- Steiner MJ, Trussell J, Mehta N, Condon S, Subramaniam S, Bourne D. Communicating contraceptive effectiveness: a randomized controlled trial to inform a World Health Organization family planning handbook. Am J Obstet Gynecol. 2006;195(1):85-91.
- Steiner MJ, Trussell J, Johnson S. Communicating contraceptive effectiveness: an updated counseling chart. Am J Obstet Gynecol. 2007;197(1):118.
Read about interval permanent contraception
Feasibility of interval laparoscopic permanent contraception via bilateral salpingectomy
Westberg J, Scott F, Creinin MD. Safety outcomes of female sterilization by salpingectomy and tubal occlusion. Contraception. 2017;95(5):505-508.
In this retrospective study, authors used billing data to identify women undergoing interval laparoscopic permanent contraception at a single academic medical center. They educated physicians and patients about the potential benefits to ovarian cancer risk with total salpingectomy (similar to the educational initiative done in British Columbia) and discussed the requirement for the extra incision and more time for the surgery. From 2013 to 2015 use of salpingectomy for permanent contraception changed from 45% of the procedures to 85%, a fairly dramatic trend.18 With these data, the authors compared outcomes between the women receiving tubal occlusive procedures and women receiving bilateral salpingectomy.
Related article:
Risk-reducing salpingectomy at benign hysterectomy: Have surgeons embraced this practice?
Details of surgical time and complications
Tubal occlusion procedures were performed through 2 abdominal ports, and device placement was at the discretion of the provider. Bilateral salpingectomies were performed through 3 abdominal port sites with an electrothermal bipolar tissue-sealing instrument. A total of 149 procedures were identified, 68 tubal occlusions (19% Falope rings, 32% bipolar cautery, and 47% Filshie clips) and 81 bilateral salpingectomies.
The surgical time average (SD) was 6 minutes longer for the salpingectomies (44 [13] minutes vs 38 [15] minutes; P = .018). As would be expected, more experienced residents had shorter surgical times when compared with less experienced residents for both procedures (FIGURE 2).15 Similar rates of both immediate and short-term surgical complications were noted. One immediate complication was reported in each group, both of which were secondary to anesthesia issues.
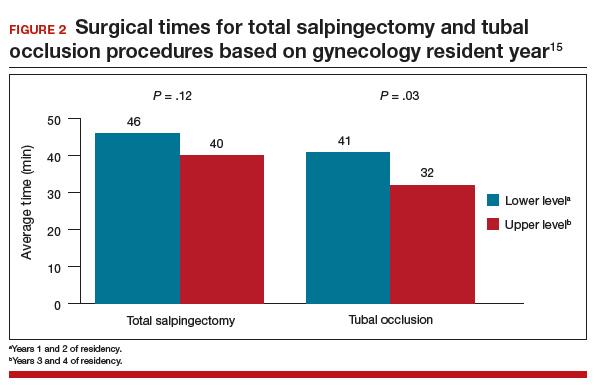
Interestingly, short-term complications were lower in the salpingectomy group (4.9%) versus the tubal occlusion group (14.7%), although this difference was barely not statistically significant (P = .051). These complications included 1 incisional site infection requiring oral antibiotics and 3 cases of increased pain in the salpingectomy group and 4 incisional site infections with 6 patients reporting increased pain in the tubal occlusion group.
This retrospective analysis provides further reassurance regarding the safety of offering bilateral salpingectomy to patients desiring permanent contraception. This study again consistently demonstrates that bilateral salpingectomy increases the operative time, but only minimally, which is unlikely clinically significant, especially when considering the potential benefits from total salpingectomy (increased ovarian cancer protection, higher contraceptive efficacy, decreased ectopic pregnancy rates, reduced risk of future surgeries for such tubal pathology as hydrosalpinx, etc). The study also shows that educational initiatives targeted at providers likely will increase acceptability as well as uptake of this practice for permanent contraception.
Read about tube removal and ovarian reserve
Does total removal of the tubes affect ovarian reserve?
Ganer Herman H, Gluck O, Keidar R, et al. Ovarian reserve following cesarean section with salpingectomy vs tubal ligation: a randomized trial. Am J Obstet Gynecol. 2017;doi: 10.1016/j.ajog.2017.04.028.
As acceptability of total salpingectomy for permanent contraception increases, one concern is that complete removal may alter blood supply to the ovary, resulting in decreased ovarian reserve and, subsequently, earlier menopause. Several studies have addressed the potential effect of salpingectomy on ovarian function when performed at the time of hysterectomy, most of which have noted no difference in anti-Müllerian hormone (AMH) levels and sonographic parameters following surgery.19 However, very little has been published to assess this same question when the salpingectomy is performed for the purpose of permanent contraception.
Ganer Herman and colleagues aimed to assess short-term ovarian reserve by measuring AMH levels preoperatively and 6 to 8 weeks postoperatively in patients undergoing partial or total salpingectomy at the time of elective cesarean delivery.
Related article:
Salpingectomy after vaginal hysterectomy: Technique, tips, and pearls
Details of the study
The study included women aged 18 to 45 who presented for elective cesarean delivery and who requested permanent contraception. Exclusion criteria included previous tubal surgery, emergent cesarean delivery, personal history of breast carcinoma, familial history of ovarian carcinoma, and BRCA carriage.
Women were randomly assigned at a 1:1 ratio to bilateral total salpingectomy or bilateral partial salpingectomy. A complete blood count and AMH level were drawn the night prior to surgery. Intraoperatively, after delivery and hysterotomy closure, partial salpingectomy, via the Parkland technique, or total salpingectomy, using a suture ligation technique, was performed.
Of the 46 women enrolled, follow-up was completed by 16 of 22 women (72%) in the total salpingectomy group and 18 of 24 women (75%) in the partial salpingectomy group. Patients in the total salpingectomy group were slightly older (mean age, 37 vs 34 years; P = .02), but otherwise all demographic and obstetric characteristics were comparable.
No differences were noted in preoperative and postoperative AMH levels between groups, with an average (SD) increase of 0.58 (0.98) ng/mL versus 0.39 (0.41) ng/mL in the total salpingectomy and partial salpingectomy groups, respectively (P = .45), consistent with known postpartum AMH level trends.
Other findings included an average 13-minute increase in operative time in the total salpingectomy cases, similar safety profile of the 2 methods as there were no postoperative complications during the study period, and no differences in postoperative hemoglobin levels.
This study was designed as a pilot trial to assess feasibility of enrollment, safety, and short-term ovarian reserve after salpingectomy for permanent contraception. Although the study is small and does not assess long-term effects, the findings are reassuring, especially in conjunction with other data.
A meta-analysis demonstrated no effect on ovarian reserve up to 18 months after salpingectomy based on AMH changes.19 A 5-year follow-up evaluation of 71 women undergoing total laparoscopic hysterectomy with bilateral salpingectomy also showed no effect on ovarian reserve as measured by multiple hormone levels including AMH and ultrasonographic findings.20 Thus, it is highly unlikely that a permanent contraception procedure that does not include removal of the uterus will have long-term ovarian reserve effects.
Additionally, consistent with other trials, Ganer Herman and colleagues demonstrate a slightly increased operative time and no increased complications. The surgical technique used in the study reflects the concern for postoperative bleeding from the mesosalpinx, and methods that ensure excellent hemostasis with suture ligation were used.
Conclusion
The studies reviewed in this article are some of the first to evaluate the feasibility and safety of opportunistic, or total, salpingectomy for permanent contraception since the ACOG and SGO recommendations were published. Just as our community has adopted the common practice of opportunistic salpingectomy at the time of hysterectomy, we should continue to advocate for a similar practice when discussing permanent contraception. Additionally, the Westberg study provides good evidence that educational initiatives can influence provider practices, which upholds the data published by McAlpine and colleagues in British Columbia. This information is promising and valuable.
Our universal goal as ObGyns is to provide the best reproductive health care possible based on the most recent evidence available. Continuing to advocate for opportunistic salpingectomy for permanent contraception purposes meets this goal and potentially provides significant noncontraceptive benefits.
Share your thoughts! Send your Letter to the Editor to [email protected]. Please include your name and the city and state in which you practice.
- Daniels K, Daugherty J, Jones J, Mosher W. Current contraceptive use and variation by selected characteristics among women aged 15-44: United States, 2011-2013. Natl Health Stat Report. 2015;86:1–14.
- Kavanaugh ML, Jerman J, Finer LB. Changes in use of long-acting reversible contraceptive methods among U.S. women, 2009-2012. Obstet Gynecol. 2015;126(5):17–927.
- Chan LM, Westhoff CL. Tubal sterilization trends in the United States. Fertil Steril. 2010;94(1):1–6.
- Essure system for permanent birth control: Executive summary. Bayer Healthcare: Berlin, Germany; 2015:1–89. https://www.fda.gov/downloads/AdvisoryCommittees/UCM463460.pdf. Accessed July 19, 2017.
- Creinin MD, Zite N. Female tubal sterilization: the time has come to routinely consider removal. Obstet Gynecol. 2014;124(3):596–599.
- American College of Obstetrics and Gynecology Committee opinion no. 620: salpingectomy for ovarian cancer prevention. Obstet Gynecol. 2015;125(1):279–281.
- Society of Gynecologic Oncology website. SGO clinical practice statement: salpingectomy for ovarian cancer. https://www.sgo.org/clinical-practice/guidelines/sgo-clinical-practice-statement-salpingectomy-for-ovarian-cancer-prevention/. Published November 2013. Accessed July 21, 2017.
- Cibula D, Widschwendter M, Majek O, Dusek L. Tubal ligation and the risk of ovarian cancer: review and meta-analysis. Hum Reprod Update. 2011;17(1): 55–67.
- Sieh W, Salvador S, McGuire V, et al. Tubal ligation and risk of ovarian cancer subtypes: a pooled analysis of case-control studies. Int J Epidemiol. 2013;42(2): 579–589.
- Yoon SH, Kim SN, Shim SH, Kang SB, Lee SJ. Bilateral salpingectomy can reduce the risk of ovarian cancer in the general population: a meta-analysis. Eur J Cancer. 2016;55:38–46.
- Falconer H, Yin L, Grönberg H, Altman D. Ovarian cancer risk after salpingectomy: a nationwide population-based study. J Natl Cancer Inst. 2015;107(2).
- McAlpine JN, Hanley GE, Woo MM, et al. Opportunistic salpingectomy: uptake, risks, and complications of a regional initiative for ovarian cancer prevention. Am J Obstet Gynecol. 2014;210(5):471e1–e11.
- Garcia C, Martin M, Tucker LY, et al. Experience with opportunistic salpingectomy in a large, community-based health system in the United States. Obstet Gynecol. 2016;128(2):277–283.
- Shinar S, Blecher Y, Alpern A, et al. Total bilateral salpingectomy versus partial bilateral salpingectomy for permanent sterilization during cesarean delivery. Arch Gynecol Obstet. 2017;295(5):1185–1189.
- Westberg J, Scott F, Creinin MD. Safety outcomes of female sterilization by salpingectomy and tubal occlusion. Contraception. 2017;95(5):505–508.
- Layde PM, Peterson HB, Dicker RC, DeStefano F, Rubin GL, Ory HW. Risk factors for complications of interval tubal sterilization by laparotomy. Obstet Gynecol. 1983;62(2):180–184.
- Jamieson DJ, Hillis SD, Duerr A, Marchbanks PA, Costello C, Peterson HB. Complications of interval laparoscopic tubal sterilization: findings from the United States Collaborative Review of Sterilization. Obstet Gynecol. 2000;96(6):997–1002.
- Westberg JM, Scott F, Cansino C, Creinin MD. Recent trends in incidence of different permanent female sterilization methods. Obstet Gynecol. 2016;127(suppl):127S.
- Mohamed AA, Yosef AH, James C, Al-Hussaini TK, Bedaiwy MA, Amer SAKS. Ovarian reserve after salpingectomy: a systematic review and meta-analysis. Acta Obstet Gynecol Scand. 2017;96(7):795–803.
- Venturella R, Lico D, Borelli M, et al. 3 to 5 years later: long-term effects of prophylactic bilateral salpingectomy on ovarian function. J Minim Invasive Gynecol. 2017;24(1):145–150.
According to the most recent data (2011–2013), 62% of women of childbearing age (15–44 years) use some method of contraception. Of these “contracepting” women, about 25% reported relying on permanent contraception, making it one of the most common methods of contraception used by women in the United States (FIGURE 1).1,2 Women either can choose to have a permanent contraception procedure performed immediately postpartum, which occurs after approximately 9% of all hospital deliveries in the United States,3 or at a time separate from pregnancy.
The most common methods of permanent contraception include partial salpingectomy at the time of cesarean delivery or within 24 hours after vaginal delivery and laparoscopic occlusive procedures at a time unrelated to the postpartum period.3 Hysteroscopic occlusion of the tubal ostia is a newer option, introduced in 2002; its worldwide use is concentrated in the United States, which accounts for 80% of sales based on revenue.4
Historically, for procedures remote from pregnancy, the laparoscopic approach evolved with less sophisticated laparoscopic equipment and limited visualization, which resulted in efficiency and safety being the primary goals of the procedure.5 Accordingly, rapid occlusive procedures were commonplace. However, advancement of laparoscopic technology related to insufflation systems, surgical equipment, and video capabilities did not change this practice.
Recent literature has suggested that complete fallopian tube removal provides additional benefits. With increasing knowledge about the origin of ovarian cancer, as well as increasing data to support the hypothesis that complete tubal excision results in increased ovarian cancer protection when compared with occlusive or partial salpingectomies, both the American College of Obstetricians and Gynecologists (ACOG)6 and the Society of Gynecologic Oncology (SGO)7 recommend discussing bilateral total salpingectomy with patients desiring permanent contraception. Although occlusive procedures decrease a woman’s lifetime risk of ovarian cancer by 24% to 34%,8,9 total salpingectomy likely reduces this risk by 49% to 65%.10,11
With this new evidence, McAlpine and colleagues initiated an educational campaign, targeting all ObGyns in British Columbia, which outlined the role of the fallopian tube in ovarian cancer and urged the consideration of total salpingectomy for permanent contraception in place of occlusive or partial salpingectomy procedures. They found that this one-time targeted education increased the use of total salpingectomy for permanent contraception from 0.5% at 2 years before the intervention to 33.3% by 2 years afterwards.12 On average, laparoscopic bilateral salpingectomy took 10 minutes longer to complete than occlusive procedures. Most importantly, they found no significant differences in complication rates, including hospital readmissions or blood transfusions.
Although our community can be applauded for the rapid uptake of concomitant bilateral salpingectomy at the time of benign hysterectomy,12,13 offering total salpingectomy for permanent contraception is far from common practice. Similarly, while multiple studies have been published to support the practice of opportunistic salpingectomy at the time of hysterectomy, little has been published about the use of bilateral salpingectomy for permanent contraception until this past year.
In this article, we review some of the first publications to focus specifically on the feasibility and safety profile of performing either immediate postpartum total salpingectomy or interval total salpingectomy in women desiring permanent contraception.
Family Planning experts are now strongly discouraging the use of terms like “sterilization,” “permanent sterilization,” and “tubal ligation” due to sterilization abuses that affected vulnerable and marginalized populations in the United States during the early-to mid-20th century.
In 1907, Indiana was the first state to enact a eugenics-based permanent sterilization law, which initiated an aggressive eugenics movement across the United States. This movement lasted for approximately 70 years and resulted in the sterilization of more than 60,000 women, men, and children against their will or without their knowledge. One of the major contributors to this movement was the state of California, which sterilized more than 20,000 women, men, and children.
They defined sterilization as a prophylactic measure that could simultaneously defend public health, preserve precious fiscal resources, and mitigate menace of the “unfit and feebleminded.” The US eugenics movement even inspired Hitler and the Nazi eugenics movement in Germany.
Because of these reproductive rights atrocities, a large counter movement to protect the rights of women, men, and children resulted in the creation of the Medicaid permanent sterilization consents that we still use today. Although some experts question whether the current Medicaid protective policy should be reevaluated, many are focused on the use of less offensive language when discussing the topic.
Current recommendations are to use the phrase “permanent contraception” or simply refer to the procedure name (salpingectomy, vasectomy, tubal occlusion, etc.) to move away from the connection to the eugenics movement.
Read about a total salpingectomy at delivery
Total salpingectomy: A viable option for permanent contraception after vaginal or at cesarean delivery
Shinar S, Blecher Y, Alpern S, et al. Total bilateral salpingectomy versus partial bilateral salpingectomy for permanent sterilization during cesarean delivery. Arch Gynecol Obstet. 2017;295(5):1185-1189.
Danis RB, Della Badia CR, Richard SD. Postpartum permanent sterilization: could bilateral salpingectomy replace bilateral tubal ligation? J Minim Invasive Gynecol. 2016;23(6):928-932.
Shinar and colleagues presented a retrospective case series that included women undergoing permanent contraception procedures during cesarean delivery at a single tertiary medical center. The authors evaluated outcomes before and after a global hospital policy changed the preferred permanent contraception procedure from partial to total salpingectomy.
Details of the Shinar technique and outcomes
Of the 149 women included, 99 underwent partial salpingectomy via the modified Pomeroy technique and 50 underwent total salpingectomy using an electrothermal bipolar tissue-sealing instrument (Ligasure). The authors found no difference in operative times and similar rates of complications. Composite adverse outcomes, defined as surgery duration greater than 45 minutes, hemoglobin decline greater than 1.2 g/dL, need for blood transfusion, prolonged hospitalization, ICU admission, or re-laparotomy, were comparable and were reported as 30.3% and 36.0% in the partial and total salpingectomy groups, respectively, (P = .57).One major complication occurred in the total salpingectomy cohort; postoperatively the patient had hemodynamic instability and was found to have hemoperitoneum requiring exploratory laparotomy. Significant bleeding from the bilateral mesosalpinges was discovered, presumably directly related to the total salpingectomy.
Related article:
Hysteroscopic tubal occlusion: How new product labeling can be a resource for patient counseling
Details of Danis et al
Intuitively, performing salpingectomy at the time of cesarean delivery does not seem as significant a change in practice as would performing salpingectomy through a small periumbilical incision after vaginal delivery. However, Danis and colleagues did just that; they published a retrospective case series of total salpingectomy performed within 24 hours after a vaginal delivery at an urban, academic institution. They included all women admitted for full-term vaginal deliveries who desired permanent contraception, with no exclusion criteria related to body mass index (BMI). The authors reported on 80 women, including 64 (80%) who underwent partial salpingectomy via the modified Pomeroy or Parkland technique and 16 (20%) who underwent total salpingectomy. Most women had a BMI of less than 30 kg/m2; less than 15% of the women in each group had a BMI greater than 40 kg/m2.
The technique for total salpingectomy involved a 2- to 3-cm vertical incision at the level of the umbilicus, elevation of the entire fallopian tube with 2 Babcock clamps, followed by the development of 2 to 3 windows with monopolar electrocautery in the mesosalpinx and subsequent suture ligation with polyglactin 910 (Vicryl, Ethicon).
Major findings included slightly longer operative time in the total salpingectomy compared with the partial salpingectomy group (a finding consistent with other studies12,14,15) and no difference in complication rates. The average (SD) surgical time in the partial salpingectomy group was 59 (16) minutes, compared with 71 (6) minutes in the total salpingectomy group (P = .003). The authors reported 4 (6.3%) complications in the partial salpingectomy group--ileus, excessive bleeding from mesosalpinx, and incisional site hematoma--and no complications in the total salpingectomy group (P = .58).
These 2 studies, although small retrospective case series, demonstrate the feasibility of performing total salpingectomies with minimal operative time differences when compared with more traditional partial salpingectomy procedures. The re-laparotomy complication noted in the Shinar series cannot be dismissed, as this is a major morbidity, but it also should not dictate the conversation.
Overall, the need for blood transfusion or unintended major surgery after permanent contraception procedures is rare. In the U.S. Collaborative Review of Sterilization study, none of the 282 women who had a permanent contraception procedure performed via laparotomy experienced either of these outcomes.16 Only 1 of the 9,475 women (0.01%) having a laparoscopic procedure in this study required blood transfusion and 14 (0.15%) required reoperation secondary to a procedure complication.17 The complication reported in the Shinar study reminds us that the technique for salpingectomy in the postpartum period, whether partial or total, should be considered carefully, being mindful of the anatomical changes that occur in pregnancy.
While larger studies should be performed to confirm these initial findings, these 2 articles provide the reassurance that many providers may need before beginning to offer total salpingectomy procedures in the immediate postpartum period.
When women present for permanent contraception counseling, we must remember that our patients' needs are often far too diverse and dynamic to allow a universal counseling technique. Every provider likely has a counseling style, with a structure and language that has been altered and changed through years of practice, patient experiences, and new scientific technologies and data. Unfortunately, provider biases and past coercive practices also influence contraceptive counseling.
Historically, some providers used formulas related to a woman's age and parity to decide if she could have a permanent contraception procedure, possibly based on fears of patient regret. Such practices are an embarrassment to the principles of patient autonomy and empowerment, which should serve as the foundation for any contraceptive conversation. Studies of regret after permanent contraception procedures are often misinterpreted; although younger women experience higher rates of regret, the absolute rate still favors performing the procedure.1,2 When comparing women aged 30 or younger to those older than 30 years at the time of procedure, the vast majority (about 80%) of those 30 and younger do not express regret.1 Less than 5% of women who express regret access a reversal procedure.2,3 Our job as providers is to educate and allow women to understand the options--and with permanent contraception that also means explaining the potential for regret; however, empowering women does not mean limiting an opportunity for the majority to potentially impact the minority.
Our contraceptive counseling philosophy follows the shared decision-making model. This model informs the patient, tailors the conversation toward her priorities, and maintains patient autonomy, while empowering the patient to take control of her reproductive health and future. When a patient expresses the desire for permanent contraception, we ensure she understands the permanence of the procedure and offer information about other Tier 1 contraceptive options, including long-acting reversible methods and vasectomy. We use the evidence-based World Health Organization counseling table4,5 to assist with the discussion and provide vasectomy referral and further information about specific intrauterine devices or the contraceptive implant based on the woman's interests.
For women who desire a female permanent contraception procedure, we also provide information tables comparing laparoscopic tubal occlusion procedures, laparoscopic bilateral salpingectomy, and hysteroscopic tubal occlusion. These tables review how each procedure is performed; risks and benefits, including failure rates over time; and ovarian cancer protection estimates. Our office also has devised tables to inform women seeking permanent contraception immediately after delivery and unrelated to pregnancy. Ultimately, the woman can choose what makes the most sense for her at that specific time in her life, and as providers we must support and uphold that decision.
References
- Hills SD, Marchbanks PA, Tylor LR, Peterson HB. Poststerilization regret: findings from the United States Collaborative Review of Sterilization. Obstet Gynecol. 1999;93(6):889-895.
- Curtis KM, Mohllajee AP, Peterson HB. Regret following female sterilization at a young age: a systematic review. Contraception. 2006;73(2):205-210.
- Schmidt JE, Hillis SD, Marchbanks PA, Jeng G, Peterson HB. Requesting information about and obtaining reversal after tubal sterilization: findings from the U.S. Collaborative Review of Sterilization. Fertil Steril. 2000;74(5):892-898.
- Steiner MJ, Trussell J, Mehta N, Condon S, Subramaniam S, Bourne D. Communicating contraceptive effectiveness: a randomized controlled trial to inform a World Health Organization family planning handbook. Am J Obstet Gynecol. 2006;195(1):85-91.
- Steiner MJ, Trussell J, Johnson S. Communicating contraceptive effectiveness: an updated counseling chart. Am J Obstet Gynecol. 2007;197(1):118.
Read about interval permanent contraception
Feasibility of interval laparoscopic permanent contraception via bilateral salpingectomy
Westberg J, Scott F, Creinin MD. Safety outcomes of female sterilization by salpingectomy and tubal occlusion. Contraception. 2017;95(5):505-508.
In this retrospective study, authors used billing data to identify women undergoing interval laparoscopic permanent contraception at a single academic medical center. They educated physicians and patients about the potential benefits to ovarian cancer risk with total salpingectomy (similar to the educational initiative done in British Columbia) and discussed the requirement for the extra incision and more time for the surgery. From 2013 to 2015 use of salpingectomy for permanent contraception changed from 45% of the procedures to 85%, a fairly dramatic trend.18 With these data, the authors compared outcomes between the women receiving tubal occlusive procedures and women receiving bilateral salpingectomy.
Related article:
Risk-reducing salpingectomy at benign hysterectomy: Have surgeons embraced this practice?
Details of surgical time and complications
Tubal occlusion procedures were performed through 2 abdominal ports, and device placement was at the discretion of the provider. Bilateral salpingectomies were performed through 3 abdominal port sites with an electrothermal bipolar tissue-sealing instrument. A total of 149 procedures were identified, 68 tubal occlusions (19% Falope rings, 32% bipolar cautery, and 47% Filshie clips) and 81 bilateral salpingectomies.
The surgical time average (SD) was 6 minutes longer for the salpingectomies (44 [13] minutes vs 38 [15] minutes; P = .018). As would be expected, more experienced residents had shorter surgical times when compared with less experienced residents for both procedures (FIGURE 2).15 Similar rates of both immediate and short-term surgical complications were noted. One immediate complication was reported in each group, both of which were secondary to anesthesia issues.
Interestingly, short-term complications were lower in the salpingectomy group (4.9%) versus the tubal occlusion group (14.7%), although this difference was barely not statistically significant (P = .051). These complications included 1 incisional site infection requiring oral antibiotics and 3 cases of increased pain in the salpingectomy group and 4 incisional site infections with 6 patients reporting increased pain in the tubal occlusion group.
This retrospective analysis provides further reassurance regarding the safety of offering bilateral salpingectomy to patients desiring permanent contraception. This study again consistently demonstrates that bilateral salpingectomy increases the operative time, but only minimally, which is unlikely clinically significant, especially when considering the potential benefits from total salpingectomy (increased ovarian cancer protection, higher contraceptive efficacy, decreased ectopic pregnancy rates, reduced risk of future surgeries for such tubal pathology as hydrosalpinx, etc). The study also shows that educational initiatives targeted at providers likely will increase acceptability as well as uptake of this practice for permanent contraception.
Read about tube removal and ovarian reserve
Does total removal of the tubes affect ovarian reserve?
Ganer Herman H, Gluck O, Keidar R, et al. Ovarian reserve following cesarean section with salpingectomy vs tubal ligation: a randomized trial. Am J Obstet Gynecol. 2017;doi: 10.1016/j.ajog.2017.04.028.
As acceptability of total salpingectomy for permanent contraception increases, one concern is that complete removal may alter blood supply to the ovary, resulting in decreased ovarian reserve and, subsequently, earlier menopause. Several studies have addressed the potential effect of salpingectomy on ovarian function when performed at the time of hysterectomy, most of which have noted no difference in anti-Müllerian hormone (AMH) levels and sonographic parameters following surgery.19 However, very little has been published to assess this same question when the salpingectomy is performed for the purpose of permanent contraception.
Ganer Herman and colleagues aimed to assess short-term ovarian reserve by measuring AMH levels preoperatively and 6 to 8 weeks postoperatively in patients undergoing partial or total salpingectomy at the time of elective cesarean delivery.
Related article:
Salpingectomy after vaginal hysterectomy: Technique, tips, and pearls
Details of the study
The study included women aged 18 to 45 who presented for elective cesarean delivery and who requested permanent contraception. Exclusion criteria included previous tubal surgery, emergent cesarean delivery, personal history of breast carcinoma, familial history of ovarian carcinoma, and BRCA carriage.
Women were randomly assigned at a 1:1 ratio to bilateral total salpingectomy or bilateral partial salpingectomy. A complete blood count and AMH level were drawn the night prior to surgery. Intraoperatively, after delivery and hysterotomy closure, partial salpingectomy, via the Parkland technique, or total salpingectomy, using a suture ligation technique, was performed.
Of the 46 women enrolled, follow-up was completed by 16 of 22 women (72%) in the total salpingectomy group and 18 of 24 women (75%) in the partial salpingectomy group. Patients in the total salpingectomy group were slightly older (mean age, 37 vs 34 years; P = .02), but otherwise all demographic and obstetric characteristics were comparable.
No differences were noted in preoperative and postoperative AMH levels between groups, with an average (SD) increase of 0.58 (0.98) ng/mL versus 0.39 (0.41) ng/mL in the total salpingectomy and partial salpingectomy groups, respectively (P = .45), consistent with known postpartum AMH level trends.
Other findings included an average 13-minute increase in operative time in the total salpingectomy cases, similar safety profile of the 2 methods as there were no postoperative complications during the study period, and no differences in postoperative hemoglobin levels.
This study was designed as a pilot trial to assess feasibility of enrollment, safety, and short-term ovarian reserve after salpingectomy for permanent contraception. Although the study is small and does not assess long-term effects, the findings are reassuring, especially in conjunction with other data.
A meta-analysis demonstrated no effect on ovarian reserve up to 18 months after salpingectomy based on AMH changes.19 A 5-year follow-up evaluation of 71 women undergoing total laparoscopic hysterectomy with bilateral salpingectomy also showed no effect on ovarian reserve as measured by multiple hormone levels including AMH and ultrasonographic findings.20 Thus, it is highly unlikely that a permanent contraception procedure that does not include removal of the uterus will have long-term ovarian reserve effects.
Additionally, consistent with other trials, Ganer Herman and colleagues demonstrate a slightly increased operative time and no increased complications. The surgical technique used in the study reflects the concern for postoperative bleeding from the mesosalpinx, and methods that ensure excellent hemostasis with suture ligation were used.
Conclusion
The studies reviewed in this article are some of the first to evaluate the feasibility and safety of opportunistic, or total, salpingectomy for permanent contraception since the ACOG and SGO recommendations were published. Just as our community has adopted the common practice of opportunistic salpingectomy at the time of hysterectomy, we should continue to advocate for a similar practice when discussing permanent contraception. Additionally, the Westberg study provides good evidence that educational initiatives can influence provider practices, which upholds the data published by McAlpine and colleagues in British Columbia. This information is promising and valuable.
Our universal goal as ObGyns is to provide the best reproductive health care possible based on the most recent evidence available. Continuing to advocate for opportunistic salpingectomy for permanent contraception purposes meets this goal and potentially provides significant noncontraceptive benefits.
Share your thoughts! Send your Letter to the Editor to [email protected]. Please include your name and the city and state in which you practice.
- Daniels K, Daugherty J, Jones J, Mosher W. Current contraceptive use and variation by selected characteristics among women aged 15-44: United States, 2011-2013. Natl Health Stat Report. 2015;86:1–14.
- Kavanaugh ML, Jerman J, Finer LB. Changes in use of long-acting reversible contraceptive methods among U.S. women, 2009-2012. Obstet Gynecol. 2015;126(5):17–927.
- Chan LM, Westhoff CL. Tubal sterilization trends in the United States. Fertil Steril. 2010;94(1):1–6.
- Essure system for permanent birth control: Executive summary. Bayer Healthcare: Berlin, Germany; 2015:1–89. https://www.fda.gov/downloads/AdvisoryCommittees/UCM463460.pdf. Accessed July 19, 2017.
- Creinin MD, Zite N. Female tubal sterilization: the time has come to routinely consider removal. Obstet Gynecol. 2014;124(3):596–599.
- American College of Obstetrics and Gynecology Committee opinion no. 620: salpingectomy for ovarian cancer prevention. Obstet Gynecol. 2015;125(1):279–281.
- Society of Gynecologic Oncology website. SGO clinical practice statement: salpingectomy for ovarian cancer. https://www.sgo.org/clinical-practice/guidelines/sgo-clinical-practice-statement-salpingectomy-for-ovarian-cancer-prevention/. Published November 2013. Accessed July 21, 2017.
- Cibula D, Widschwendter M, Majek O, Dusek L. Tubal ligation and the risk of ovarian cancer: review and meta-analysis. Hum Reprod Update. 2011;17(1): 55–67.
- Sieh W, Salvador S, McGuire V, et al. Tubal ligation and risk of ovarian cancer subtypes: a pooled analysis of case-control studies. Int J Epidemiol. 2013;42(2): 579–589.
- Yoon SH, Kim SN, Shim SH, Kang SB, Lee SJ. Bilateral salpingectomy can reduce the risk of ovarian cancer in the general population: a meta-analysis. Eur J Cancer. 2016;55:38–46.
- Falconer H, Yin L, Grönberg H, Altman D. Ovarian cancer risk after salpingectomy: a nationwide population-based study. J Natl Cancer Inst. 2015;107(2).
- McAlpine JN, Hanley GE, Woo MM, et al. Opportunistic salpingectomy: uptake, risks, and complications of a regional initiative for ovarian cancer prevention. Am J Obstet Gynecol. 2014;210(5):471e1–e11.
- Garcia C, Martin M, Tucker LY, et al. Experience with opportunistic salpingectomy in a large, community-based health system in the United States. Obstet Gynecol. 2016;128(2):277–283.
- Shinar S, Blecher Y, Alpern A, et al. Total bilateral salpingectomy versus partial bilateral salpingectomy for permanent sterilization during cesarean delivery. Arch Gynecol Obstet. 2017;295(5):1185–1189.
- Westberg J, Scott F, Creinin MD. Safety outcomes of female sterilization by salpingectomy and tubal occlusion. Contraception. 2017;95(5):505–508.
- Layde PM, Peterson HB, Dicker RC, DeStefano F, Rubin GL, Ory HW. Risk factors for complications of interval tubal sterilization by laparotomy. Obstet Gynecol. 1983;62(2):180–184.
- Jamieson DJ, Hillis SD, Duerr A, Marchbanks PA, Costello C, Peterson HB. Complications of interval laparoscopic tubal sterilization: findings from the United States Collaborative Review of Sterilization. Obstet Gynecol. 2000;96(6):997–1002.
- Westberg JM, Scott F, Cansino C, Creinin MD. Recent trends in incidence of different permanent female sterilization methods. Obstet Gynecol. 2016;127(suppl):127S.
- Mohamed AA, Yosef AH, James C, Al-Hussaini TK, Bedaiwy MA, Amer SAKS. Ovarian reserve after salpingectomy: a systematic review and meta-analysis. Acta Obstet Gynecol Scand. 2017;96(7):795–803.
- Venturella R, Lico D, Borelli M, et al. 3 to 5 years later: long-term effects of prophylactic bilateral salpingectomy on ovarian function. J Minim Invasive Gynecol. 2017;24(1):145–150.
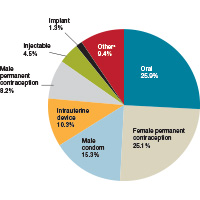
Managing psychiatric illness during pregnancy and breastfeeding: Tools for decision making
Increasingly, women with psychiatric illness are undergoing pharmacologic treatment during pregnancy. In the United States, an estimated 8% of pregnant women are prescribed antidepressants, and the number of such cases has risen over the past 15 years.1 Women with a psychiatric diagnosis were once instructed either to discontinue all medication immediately on learning they were pregnant, or to forgo motherhood because their illness might have a negative effect on a child or because avoiding medication during pregnancy might lead to a relapse.
Fortunately, women with depression, anxiety, bipolar disorder, or schizophrenia no longer are being told that they cannot become mothers. For many women, however, stopping medication is not an option. Furthermore, psychiatric illness sometimes is diagnosed initially during pregnancy and requires treatment.

Pregnant women and their physicians need accurate information about when to taper off medication, when to start or continue, and which medications are safest. Even for clinicians with a solid knowledge base, counseling a woman who needs or may need psychotropic medication during pregnancy and breastfeeding is a daunting task. Some clinicians still recommend no drug treatment as the safest and best option, given the potential risks to the fetus.
In this review we offer a methodologic approach for decision making about pharmacologic treatment during pregnancy. As the scientific literature is constantly being updated, it is imperative to have the most current information on psychotropics and to know how to individualize that information when counseling a pregnant woman and her family. Using this framework for analyzing the risks and benefits for both mother and fetus, clinicians can avoid the unanswerable question of which medication is the “safest.”
A patient’s mental health care provider is a useful resource for information about a woman’s mental health history and current stability, but he or she may not be expert or comfortable in recommending treatment for a pregnant patient. During pregnancy, a woman’s obstetrician often becomes the “expert” for all treatment decisions.
Antidepressants. Previous studies may have overestimated the association between prenatal use of antidepressants and attention deficit/hyperactivity disorder (ADHD) in children because they did not control for shared family factors, according to investigators who say that their recent study findings raise the possibility that "confounding by indication" might partially explain the observed association.1
In a population-based cohort study in Hong Kong, Man and colleagues analyzed the records of 190,618 maternal-child pairs.1 A total of 1,252 children were exposed to maternal antidepressant use during pregnancy. Medications included selective serotonin reuptake inhibitors (SSRIs), non-SSRIs, and antipsychotics as monotherapy or in various combination regimens. Overall, 5,659 of the cohort children (3%) were diagnosed with or received treatment for ADHD.
When gestational medication users were compared with nongestational users, the crude hazard ratio (HR) of antidepressant use during pregnancy and ADHD was 2.26 (P<.01). After adjusting for potential confounding factors (such as maternal psychiatric disorders and use of other psychotropic drugs), this reduced to 1.39 (95% confidence interval [CI], 1.07-1.82; P = .01). Children of mothers with psychiatric disorders had a higher risk of ADHD than did children of mothers without psychiatric disorders (HR, 1.84; 95% CI, 1.54-2.18; P<.01), even if the mothers had never used antidepressants.
While acknowledging the potential for type 2 error in the study analysis, the investigators proposed that the results "further strengthen our hypothesis that confounding by indication may play a major role in the observed positive association between gestational use of antidepressants and ADHD in offspring."
Lithium. Similarly, investigators of another recently published study found that the magnitude of the association between prenatal lithium use and increased risk of cardiac malformations in infants was smaller than previously shown.2 This finding may be important clinically because lithium is a first-line treatment for many US women of reproductive age with bipolar disorder.
Most earlier data were derived from a database registry, case reports, and small studies that often had conflicting results. However, Patorno and colleagues conducted a large retrospective cohort study that involved data on 1,325,563 pregnancies in women enrolled in Medicaid.2 Exposure to lithium was defined as at least 1 filled prescription during the first trimester, and the primary reference group included women with no lithium or lamotrigine (another mood stabilizer not associated with congenital malformations) dispensing during the 3 months before the start of pregnancy or during the first trimester.
A total of 663 pregnancies (0.05%) were exposed to lithium and 1,945 (0.15%) were exposed to lamotrigine during the first trimester. The adjusted risk ratios for cardiac malformations among infants exposed to lithium were 1.65 (95% CI, 1.02-2.68) as compared with nonexposed infants and 2.25 (95% CI, 1.17-4.34) as compared with lamotrigine-exposed infants. Notably, all right ventricular outflow tract obstruction defects identified in the infants exposed to lithium occurred with a daily dose of more than 600 mg.
Although the study results suggest an increased risk of cardiac malformations--of approximately 1 additional case per 100 live births--associated with lithium use in early pregnancy, the magnitude of risk is much lower than originally proposed based on early lithium registry data.
-- Kathy Christie, Senior Editor
References
- Man KC, Chan EW, Ip P, et al. Prenatal antidepressant use and risk of attention-deficit/hyperactivity disorder in offspring: population based cohort study. BMJ. 2017;357:j2350.
- Patorno E, Huybrechts KR, Bateman BT, et al. Lithium use in pregnancy and risk of cardiac malformations. N Engl J Med. 2017;376(23):2245-2254.
Analyze risks and benefits of medication versus no medication
The US Food and Drug Administration (FDA) has not approved any psychotropic medication for use during pregnancy. While a clinical study would provide more scientifically rigorous safety data, conducting a double-blinded, placebo-controlled trial in pregnant women with a psychiatric disorder is unethical. Thus, the literature consists mostly of reports on case series, retrospective chart reviews, prospective naturalistic studies, and analyses of large registry databases. Each has benefits and limitations. It is important to understand the limitations when making treatment decisions.
In 1979, the FDA developed a 5-lettersystem (A, B, C, D, X) for classifying the relative safety of medications used during pregnancy.2 Many clinicians and pregnant women relied on this system to decide which medications were safe. Unfortunately, the information in the system was inadequate for making informed decisions. For example, although a class B medication might have appeared safer than one in class C, the studies of risk in humans might not have been adequate to permit comparisons. Drug safety classifications were seldom changed, despite the availability of additional data.
In June 2015, the FDA changed the requirements for the Pregnancy and Lactation subsections of the labeling for human prescription drugs and biologic products. Drug manufacturers must now include in each subsection a risk summary, clinical considerations supporting patient care decisions and counseling, and detailed data. These subsections provide information on available human and animal studies, known or potential maternal or fetal adverse reactions, and dose adjustments needed during pregnancy and the postpartum period. In addition, the FDA added a subsection: Females and Males of Reproductive Potential.3
These changes acknowledge there is no list of “safe” medications. The safest medication generally is the one that works for a particular patient at the lowest effective dose. As each woman’s history of illness and effective treatment is different, the best medication may differ as well, even among women with the same illness. Therefore, medication should be individualized to the patient. A risk–benefit analysis comparing psychotropic medication treatment with no medication treatment must be performed for each patient according to her personal history and the best available data.
Read about the risks of untreated illness during pregnancy
What is the risk of untreated illness during pregnancy?
During pregnancy, women are treated for many medical disorders, including psychiatric illness. One general guideline is that, if a pregnant woman does not need a medication—whether it be for an allergy, hypertension, or another disorder—she should not take it. Conversely, if a medication is required for a patient’s well-being, her physician should continue it or switch to a safer one. This general guideline is the same for women with depression, anxiety, or a psychotic disorder.
Managing hypertension during pregnancy is an example of choosing treatment when the risk of the illness to the mother and the infant outweighs the likely small risk associated with taking a medication. Blood pressure is monitored, and, when it reaches a threshold, an antihypertensive is started promptly to avoid morbidity and mortality.
Psychiatric illness carries risks for both mother and fetus as well, but no data show a clear threshold for initiating pharmacologic treatment. Therefore, in prescribing medication the most important steps are to take a complete history and perform a thorough evaluation. Important information includes the number and severity of previous episodes, prior history of hospitalization or suicidal thoughts or attempts, and any history of psychotic or manic status.
Whether to continue or discontinue medication is often decided after inquiring about other times a medication was discontinued. A patient who in the past stayed well for several years after stopping a medication may be able to taper off a medication and conceive during a window of wellness. Some women who have experienced only one episode of illness and have been stable for at least a year may be able to taper off a medication before conceiving (TABLE 1).
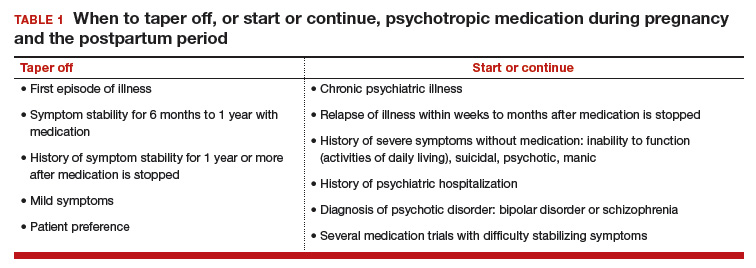
In the risk–benefit analysis, assess the need for pharmacologic treatment by considering the risk that untreated illness poses for both mother and fetus, the benefits of treatment for both, and the risk of medication exposure for the fetus.4
Mother: Risk of untreated illness versus benefit of treatment
A complete history and a current symptom evaluation are needed to assess the risk that nonpharmacologic treatment poses for the mother. Women with functional impairment, including inability to work, to perform activities of daily living, or to take care of other children, likely require treatment. Studies have found that women who discontinue treatment for a psychiatric illness around the time of conception are likely to experience a recurrence of illness during pregnancy, often in the first trimester, and must restart medication.5,6 For some diagnoses, particularly bipolar disorder, symptoms during a relapse can be more severe and more difficult to treat, and they carry a risk for both mother and fetus.7 A longitudinal study of pregnant women who stopped medication for bipolar disorder found a 71% rate of relapse.7 In cases in which there is a history of hospitalization, suicide attempt, or psychosis, discontinuing treatment is not an option; instead, the physician must determine which medication is safest for the particular patient.
Related article:
Does PTSD during pregnancy increase the likelihood of preterm birth?
Fetus: Risk of untreated illness versus benefit of treatment
Mothers with untreated psychiatric illness are at higher risk for poor prenatal care, substance abuse, and inadequate nutrition, all of which increase the risk of negative obstetric and neonatal outcomes.8 Evidence indicates that untreated maternal depression increases the risk of preterm delivery and low birth weight.9 Children born to mothers with depression have more behavioral problems, more psychiatric illness, more visits to pediatricians, lower IQ scores, and attachment issues.10 Some of the long-term negative effects of intrauterine stress, which include hypertension, coronary heart disease, and autoimmune disorders, persist into adulthood.11
Fetus: Risk of medication exposure
With any pharmacologic treatment, the timing of fetal exposure affects resultant risks and therefore must be considered in the management plan.
Before conception. Is there any effect on ovulation or fertilization?
Implantation. Does the exposure impair the blastocyst’s ability to implant in the uterine lining?
First trimester. This is the period of organogenesis. Regardless of drug exposure, there is a 2% to 4% baseline risk of a major malformation during any pregnancy. The risk of a particular malformation must be weighed against this baseline risk.
According to limited data, selective serotonin reuptake inhibitors (SSRIs) may increase the risk of early miscarriage.12 SSRIs also have been implicated in increasing the risk of cardiovascular malformations, although the data are conflicting.13,14
Antiepileptics such as valproate and carbamazepine are used as mood stabilizers in the treatment of bipolar disorder.15 Extensive data have shown an association with teratogenicity. Pregnant women who require either of these medications also should be prescribed folic acid 4 or 5 mg/day. Given the high risk of birth defects and cognitive delay, valproate no longer is recommended for women of reproductive potential.16
Lithium, one of the safest medications used in the treatment of bipolar disorder, is associated with a very small risk of Ebstein anomaly.17
Lamotrigine is used to treat bipolar depression and appears to have a good safety profile, along with a possible small increased risk of oral clefts.18,19
Atypical antipsychotics (such as aripiprazole, olanzapine, quetiapine, and risperidone) are often used first-line in the treatment of psychotic disorders and bipolar disorder in women who are not pregnant. Although the safety data on use of these drugs during pregnancy are limited, a recent analysis of pregnant Medicaid enrollees found no increased risk of birth defects after controlling for potential confounding factors.20 Common practice is to avoid these newer agents, given their limited data and the time needed for rare malformations to emerge (adequate numbers require many exposures during pregnancy).
Read additional fetal risks of medication exposure
Second trimester. This is a period of growth and neural development. A 2006 study suggested that SSRI exposure after pregnancy week 20 increases the risk of persistent pulmonary hypertension of the newborn (PPHN).21 In 2011, however, the FDA removed the PPHN warning label for SSRIs, citing inconsistent data. Whether the PPHN risk is increased with SSRI use is unclear, but the risk is presumed to be smaller than previously suggested.22 Stopping SSRIs before week 20 puts the mother at risk for relapse during pregnancy and increases her risk of developing postpartum depression. If we follow the recommendation to prescribe medication only for women who need it most, then stopping the medication at any time during pregnancy is not an option.
Third trimester. This is a period of continued growth and lung maturation.
Delivery. Is there a potential for impairment in parturition?
Neonatal adaptation. Newborns are active mainly in adapting to extrauterine life: They regulate their temperature and muscle tone and learn to coordinate sucking, swallowing, and breathing. Does medication exposure impair adaptation, or are signs or symptoms of withdrawal or toxicity present? The evidence that in utero SSRI exposure increases the risk of neonatal adaptation syndrome is consistent, but symptoms are mild and self-limited.23 Tapering off SSRIs before delivery currently is not recommended, as doing so increases the mother’s risk for postpartum depression and, according to one study, does not prevent symptoms of neonatal adaptation syndrome from developing.24
Behavioral teratogenicity. What are the long-term developmental outcomes for the child? Are there any differences in IQ, speech and language, or psychiatric illness? One study found an increased risk of autism with in utero exposure to sertraline, but the study had many methodologic flaws and its findings have not been replicated.25 Most studies have not found consistent differences in speech, IQ, or behavior between infants exposed and infants not exposed to antidepressants.26,27 By contrast, in utero exposure to anticonvulsants, particularly valproate, has led to significant developmental problems in children.28 The data on atypical antipsychotics are limited.
Related article:
Do antidepressants really cause autism?
None of the medications used to treat depression, bipolar disorder, anxiety, or schizophrenia is considered first-line or safest therapy for the pregnant woman. For any woman who is doing well on a certain medication, but particularly for a pregnant woman, there is no compelling, data-supported reason to switch to another agent. For depression, options include all of the SSRIs, with the possible exception of paroxetine (TABLE 2). In conflicting studies, paroxetine was no different from any other SSRI in not being associated with cardiovascular defects.29
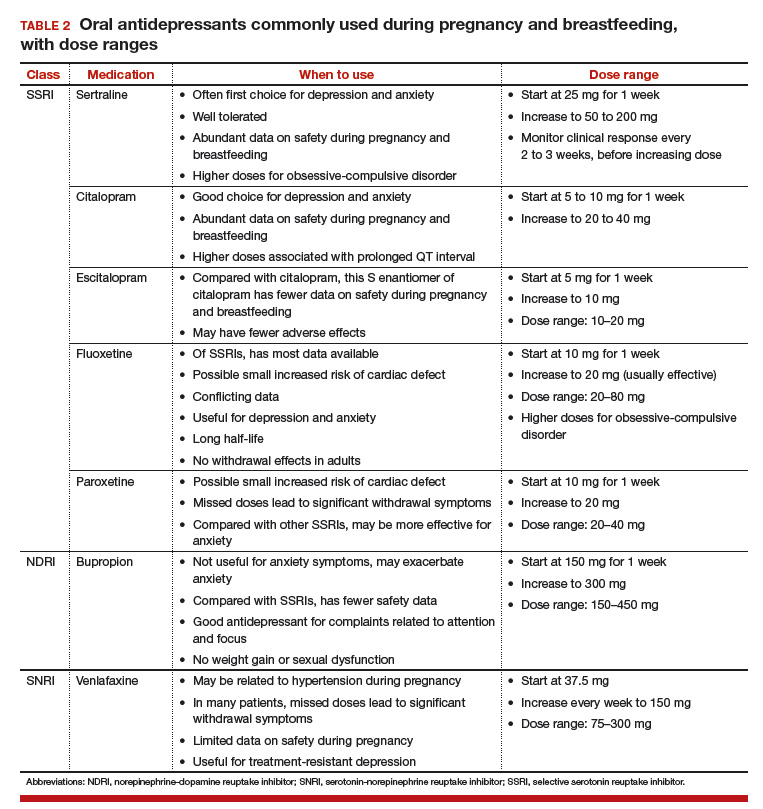
One goal in treatment is to use a medication that previously was effective in the remission of symptoms and to use it at the lowest dose possible. Treating simply to maintain a low dose of drug, however, and not to effect symptom remission, exposes the fetus to both the drug and the illness. Again, the lowest effective dose is the best choice.
Read about treatment during breastfeeding
Treatment during breastfeeding
Women are encouraged to breastfeed for physical and psychological health benefits, for both themselves and their babies. Many medications are compatible with breastfeeding.30 The amount of drug an infant receives through breast milk is considerably less than the amount received during the mother’s pregnancy. Breastfeeding generally is allowed if the calculated infant dose is less than 10% of the weight-adjusted maternal dose.31
The amount of drug transferred from maternal plasma into milk is highest for drugs with low protein binding and high lipid solubility.32 Drug clearance in infants must be considered as well. Renal clearance is decreased in newborns and does not reach adult levels until 5 or 6 months of age. In addition, liver metabolism is impaired in neonates and even more so in premature infants.33 Drugs that require extensive first-pass metabolism may have higher bioavailability, and this factor should be considered.
Some clinicians recommend pumping and discarding breast milk when the drug in it is at its peak level; although the drug is not eliminated, the infant ingests less of it.34 Most women who are anxious about breastfeeding while on medication “pump and dump” until they are more comfortable nursing and the infants are doing well. Except in cases of mother preference, most physicians with expertise in reproductive mental health generally recommend against pumping and discarding milk.
Through breast milk, infants ingest drugs in varying amounts. The amount depends on the qualities of the medication, the timing and duration of breastfeeding, and the characteristics of the infant. Few psychotropic drugs have significant effects on breastfed infants. Even lithium, previously contraindicated, is successfully used, with infant monitoring, during breastfeeding.35 Given breastfeeding’s benefits for both mother and child, many more women on psychotropic medications are choosing to breastfeed.
Related article:
USPSTF Recommendations to Support Breastfeeding
Balance the pros and cons
Deciding to use medication during pregnancy and breastfeeding involves considering the risk of untreated illness versus the benefit of treatment for both mother and fetus, and the risk of medication exposure for the fetus. Mother and fetus are inseparable, and neither can be isolated from the other in treatment decisions. Avoiding psychotropic medication during pregnancy is not always the safest option for mother or fetus. The patient and her clinician and support system must make an informed decision that is based on the best available data and that takes into account the mother’s history of illness and effective treatment. Many women with psychiatric illness no longer have to choose between mental health and starting a family, and their babies will be healthy.
Share your thoughts! Send your Letter to the Editor to [email protected]. Please include your name and the city and state in which you practice.
- Andrade SE, Raebel MA, Brown J, et al. Use of antidepressant medications during pregnancy: a multisite study. Am J Obstet Gynecol. 2008;198(2):194.e1–e5.
- Hecht A. Drug safety labeling for doctors. FDA Consum. 1979;13(8):12–13.
- Ramoz LL, Patel-Shori NM. Recent changes in pregnancy and lactation labeling: retirement of risk categories. Pharmacotherapy. 2014;34(4):389–395.
- Yonkers KA, Wisner KL, Stewart DE, et al. The management of depression during pregnancy: a report from the American Psychiatric Association and the American College of Obstetricians and Gynecologists. Gen Hosp Psychiatry. 2009;31(5):403–413.
- Cohen LS, Altshuler LL, Harlow BL, et al. Relapse of major depression during pregnancy in women who maintain or discontinue antidepressant treatment. JAMA. 2006;295(5):499–507.
- O’Brien L, Laporte A, Koren G. Estimating the economic costs of antidepressant discontinuation during pregnancy. Can J Psychiatry. 2009;54(6):399–408.
- Viguera AC, Whitfield T, Baldessarini RJ, et al. Risk of recurrence in women with bipolar disorder during pregnancy: prospective study of mood stabilizer discontinuation. Am J Psychiatry. 2007;164(12):1817–1824.
- Bonari L, Pinto N, Ahn E, Einarson A, Steiner M, Koren G. Perinatal risks of untreated depression during pregnancy. Can J Psychiatry. 2004;49(11):726–735.
- Straub H, Adams M, Kim JJ, Silver RK. Antenatal depressive symptoms increase the likelihood of preterm birth. Am J Obstet Gynecol. 2012;207(4):329.e1–e4.
- Hayes LJ, Goodman SH, Carlson E. Maternal antenatal depression and infant disorganized attachment at 12 months. Attach Hum Dev. 2013;15(2):133–153.
- Field T. Prenatal depression effects on early development: a review. Infant Behav Dev. 2011;34(1):1–14.
- Kjaersgaard MI, Parner ET, Vestergaard M, et al. Prenatal antidepressant exposure and risk of spontaneous abortion—a population-based study. PLoS One. 2013;8(8):e72095.
- Nordeng H, van Gelder MM, Spigset O, Koren G, Einarson A, Eberhard-Gran M. Pregnancy outcome after exposure to antidepressants and the role of maternal depression: results from the Norwegian Mother and Child Cohort Study. J Clin Psychopharmacol. 2012;32(2):186–194.
- Källén BA, Otterblad Olausson P. Maternal use of selective serotonin re-uptake inhibitors in early pregnancy and infant congenital malformations. Birth Defects Res A Clin Mol Teratol. 2007;79(4):301–308.
- Tomson T, Battino D. Teratogenic effects of antiepileptic drugs. Lancet Neurol. 2012;11(9):803–813.
- Balon R, Riba M. Should women of childbearing potential be prescribed valproate? A call to action. J Clin Psychiatry. 2016;77(4):525–526.
- Giles JJ, Bannigan JG. Teratogenic and developmental effects of lithium. Curr Pharm Design. 2006;12(12):1531–1541.
- Nguyen HT, Sharma V, McIntyre RS. Teratogenesis associated with antibipolar agents. Adv Ther. 2009;26(3):281–294.
- Campbell E, Kennedy F, Irwin B, et al. Malformation risks of antiepileptic drug monotherapies in pregnancy. J Neurol Neurosurg Psychiatry. 2013;84(11):e2.
- Huybrechts KF, Hernández-Díaz S, Patorno E, et al. Antipsychotic use in pregnancy and the risk for congenital malformations. JAMA Psychiatry. 2016;73(9):938–946.
- Chambers CD, Hernández-Díaz S, Van Marter LJ, et al. Selective serotonin-reuptake inhibitors and risk of persistent pulmonary hypertension of the newborn. N Engl J Med. 2006;354(6):579–587.
- ‘t Jong GW, Einarson T, Koren G, Einarson A. Antidepressant use in pregnancy and persistent pulmonary hypertension of the newborn (PPHN): a systematic review. Reprod Toxicol. 2012;34(3):293–297.
- Oberlander TF, Misri S, Fitzgerald CE, Kostaras X, Rurak D, Riggs W. Pharmacologic factors associated with transient neonatal symptoms following prenatal psychotropic medication exposure. J Clin Psychiatry. 2004;65(2):230–237.
- Warburton W, Hertzman C, Oberlander TF. A register study of the impact of stopping third trimester selective serotonin reuptake inhibitor exposure on neonatal health. Acta Psychiatr Scand. 2010;121(6):471–479.
- Croen LA, Grether JK, Yoshida CK, Odouli R, Hendrick V. Antidepressant use during pregnancy and childhood autism spectrum disorders. Arch Gen Psychiatry. 2011;68(11):1104–1112.
- Batton B, Batton E, Weigler K, Aylward G, Batton D. In utero antidepressant exposure and neurodevelopment in preterm infants. Am J Perinatol. 2013;30(4):297–301.
- Austin MP, Karatas JC, Mishra P, Christl B, Kennedy D, Oei J. Infant neurodevelopment following in utero exposure to antidepressant medication. Acta Paediatr. 2013;102(11):1054–1059.
- Bromley RL, Mawer GE, Briggs M, et al. The prevalence of neurodevelopmental disorders in children prenatally exposed to antiepileptic drugs. J Neurol Neurosurg Psychiatry. 2013;84(6):637–643.
- Einarson A, Pistelli A, DeSantis M, et al. Evaluation of the risk of congenital cardiovascular defects associated with use of paroxetine during pregnancy. Am J Psychiatry. 2008;165(6):749–752.
- Davanzo R, Copertino M, De Cunto A, Minen F, Amaddeo A. Antidepressant drugs and breastfeeding: a review of the literature. Breastfeed Med. 2011;6(2):89–98.
- Ito S. Drug therapy for breast-feeding women. N Engl J Med. 2000;343(2):118–126.
- Suri RA, Altshuler LL, Burt VK, Hendrick VC. Managing psychiatric medications in the breast-feeding woman. Medscape Womens Health. 1998;3(1):1.
- Milsap RL, Jusko WJ. Pharmacokinetics in the infant. Environ Health Perspect. 1994;102(suppl 11):107–110.
- Newport DJ, Hostetter A, Arnold A, Stowe ZN. The treatment of postpartum depression: minimizing infant exposures. J Clin Psychiatry. 2002;63(suppl 7):31–44.
- Viguera AC, Newport DJ, Ritchie J, et al. Lithium in breast milk and nursing infants: clinical implications. Am J Psychiatry. 2007;164(2):342–345.

Dr. Puryear is Associate Professor and Medical Director, Center for Reproductive Psychiatry, Department of Obstetrics and Gynecology and Menninger Department of Psychiatry, Baylor College of Medicine, Texas Children’s Hospital–Pavilion for Women, Houston.

At the time of this writing, Dr. Hall was Assistant Professor, Baylor College of Medicine, Texas Children’s Hospital–Pavilion for Women, and is currently an obstetrician-gynecologist with Georgia Perinatal Consultants, Atlanta.
Dr. Monga is Professor and Vice Chair (Clinical), Department of Obstetrics and Gynecology, Baylor College of Medicine, Texas Children’s Hospital–Pavilion for Women.

Dr. Ramin is Henry and Emma Meyer Chair in Obstetrics and Gynecology, and Professor and Vice Chair for Education, Department of Obstetrics and Gynecology, Baylor College of Medicine, Texas Children’s Hospital–Pavilion for Women.
Dr. Puryear is Associate Professor and Medical Director, Center for Reproductive Psychiatry, Department of Obstetrics and Gynecology and Menninger Department of Psychiatry, Baylor College of Medicine, Texas Children’s Hospital–Pavilion for Women, Houston.
At the time of this writing, Dr. Hall was Assistant Professor, Baylor College of Medicine, Texas Children’s Hospital–Pavilion for Women, and is currently an obstetrician-gynecologist with Georgia Perinatal Consultants, Atlanta.
Dr. Monga is Professor and Vice Chair (Clinical), Department of Obstetrics and Gynecology, Baylor College of Medicine, Texas Children’s Hospital–Pavilion for Women.
Dr. Ramin is Henry and Emma Meyer Chair in Obstetrics and Gynecology, and Professor and Vice Chair for Education, Department of Obstetrics and Gynecology, Baylor College of Medicine, Texas Children’s Hospital–Pavilion for Women.
Increasingly, women with psychiatric illness are undergoing pharmacologic treatment during pregnancy. In the United States, an estimated 8% of pregnant women are prescribed antidepressants, and the number of such cases has risen over the past 15 years.1 Women with a psychiatric diagnosis were once instructed either to discontinue all medication immediately on learning they were pregnant, or to forgo motherhood because their illness might have a negative effect on a child or because avoiding medication during pregnancy might lead to a relapse.
Fortunately, women with depression, anxiety, bipolar disorder, or schizophrenia no longer are being told that they cannot become mothers. For many women, however, stopping medication is not an option. Furthermore, psychiatric illness sometimes is diagnosed initially during pregnancy and requires treatment.
Pregnant women and their physicians need accurate information about when to taper off medication, when to start or continue, and which medications are safest. Even for clinicians with a solid knowledge base, counseling a woman who needs or may need psychotropic medication during pregnancy and breastfeeding is a daunting task. Some clinicians still recommend no drug treatment as the safest and best option, given the potential risks to the fetus.
In this review we offer a methodologic approach for decision making about pharmacologic treatment during pregnancy. As the scientific literature is constantly being updated, it is imperative to have the most current information on psychotropics and to know how to individualize that information when counseling a pregnant woman and her family. Using this framework for analyzing the risks and benefits for both mother and fetus, clinicians can avoid the unanswerable question of which medication is the “safest.”
A patient’s mental health care provider is a useful resource for information about a woman’s mental health history and current stability, but he or she may not be expert or comfortable in recommending treatment for a pregnant patient. During pregnancy, a woman’s obstetrician often becomes the “expert” for all treatment decisions.
Antidepressants. Previous studies may have overestimated the association between prenatal use of antidepressants and attention deficit/hyperactivity disorder (ADHD) in children because they did not control for shared family factors, according to investigators who say that their recent study findings raise the possibility that "confounding by indication" might partially explain the observed association.1
In a population-based cohort study in Hong Kong, Man and colleagues analyzed the records of 190,618 maternal-child pairs.1 A total of 1,252 children were exposed to maternal antidepressant use during pregnancy. Medications included selective serotonin reuptake inhibitors (SSRIs), non-SSRIs, and antipsychotics as monotherapy or in various combination regimens. Overall, 5,659 of the cohort children (3%) were diagnosed with or received treatment for ADHD.
When gestational medication users were compared with nongestational users, the crude hazard ratio (HR) of antidepressant use during pregnancy and ADHD was 2.26 (P<.01). After adjusting for potential confounding factors (such as maternal psychiatric disorders and use of other psychotropic drugs), this reduced to 1.39 (95% confidence interval [CI], 1.07-1.82; P = .01). Children of mothers with psychiatric disorders had a higher risk of ADHD than did children of mothers without psychiatric disorders (HR, 1.84; 95% CI, 1.54-2.18; P<.01), even if the mothers had never used antidepressants.
While acknowledging the potential for type 2 error in the study analysis, the investigators proposed that the results "further strengthen our hypothesis that confounding by indication may play a major role in the observed positive association between gestational use of antidepressants and ADHD in offspring."
Lithium. Similarly, investigators of another recently published study found that the magnitude of the association between prenatal lithium use and increased risk of cardiac malformations in infants was smaller than previously shown.2 This finding may be important clinically because lithium is a first-line treatment for many US women of reproductive age with bipolar disorder.
Most earlier data were derived from a database registry, case reports, and small studies that often had conflicting results. However, Patorno and colleagues conducted a large retrospective cohort study that involved data on 1,325,563 pregnancies in women enrolled in Medicaid.2 Exposure to lithium was defined as at least 1 filled prescription during the first trimester, and the primary reference group included women with no lithium or lamotrigine (another mood stabilizer not associated with congenital malformations) dispensing during the 3 months before the start of pregnancy or during the first trimester.
A total of 663 pregnancies (0.05%) were exposed to lithium and 1,945 (0.15%) were exposed to lamotrigine during the first trimester. The adjusted risk ratios for cardiac malformations among infants exposed to lithium were 1.65 (95% CI, 1.02-2.68) as compared with nonexposed infants and 2.25 (95% CI, 1.17-4.34) as compared with lamotrigine-exposed infants. Notably, all right ventricular outflow tract obstruction defects identified in the infants exposed to lithium occurred with a daily dose of more than 600 mg.
Although the study results suggest an increased risk of cardiac malformations--of approximately 1 additional case per 100 live births--associated with lithium use in early pregnancy, the magnitude of risk is much lower than originally proposed based on early lithium registry data.
-- Kathy Christie, Senior Editor
References
- Man KC, Chan EW, Ip P, et al. Prenatal antidepressant use and risk of attention-deficit/hyperactivity disorder in offspring: population based cohort study. BMJ. 2017;357:j2350.
- Patorno E, Huybrechts KR, Bateman BT, et al. Lithium use in pregnancy and risk of cardiac malformations. N Engl J Med. 2017;376(23):2245-2254.
Analyze risks and benefits of medication versus no medication
The US Food and Drug Administration (FDA) has not approved any psychotropic medication for use during pregnancy. While a clinical study would provide more scientifically rigorous safety data, conducting a double-blinded, placebo-controlled trial in pregnant women with a psychiatric disorder is unethical. Thus, the literature consists mostly of reports on case series, retrospective chart reviews, prospective naturalistic studies, and analyses of large registry databases. Each has benefits and limitations. It is important to understand the limitations when making treatment decisions.
In 1979, the FDA developed a 5-lettersystem (A, B, C, D, X) for classifying the relative safety of medications used during pregnancy.2 Many clinicians and pregnant women relied on this system to decide which medications were safe. Unfortunately, the information in the system was inadequate for making informed decisions. For example, although a class B medication might have appeared safer than one in class C, the studies of risk in humans might not have been adequate to permit comparisons. Drug safety classifications were seldom changed, despite the availability of additional data.
In June 2015, the FDA changed the requirements for the Pregnancy and Lactation subsections of the labeling for human prescription drugs and biologic products. Drug manufacturers must now include in each subsection a risk summary, clinical considerations supporting patient care decisions and counseling, and detailed data. These subsections provide information on available human and animal studies, known or potential maternal or fetal adverse reactions, and dose adjustments needed during pregnancy and the postpartum period. In addition, the FDA added a subsection: Females and Males of Reproductive Potential.3
These changes acknowledge there is no list of “safe” medications. The safest medication generally is the one that works for a particular patient at the lowest effective dose. As each woman’s history of illness and effective treatment is different, the best medication may differ as well, even among women with the same illness. Therefore, medication should be individualized to the patient. A risk–benefit analysis comparing psychotropic medication treatment with no medication treatment must be performed for each patient according to her personal history and the best available data.
Read about the risks of untreated illness during pregnancy
What is the risk of untreated illness during pregnancy?
During pregnancy, women are treated for many medical disorders, including psychiatric illness. One general guideline is that, if a pregnant woman does not need a medication—whether it be for an allergy, hypertension, or another disorder—she should not take it. Conversely, if a medication is required for a patient’s well-being, her physician should continue it or switch to a safer one. This general guideline is the same for women with depression, anxiety, or a psychotic disorder.
Managing hypertension during pregnancy is an example of choosing treatment when the risk of the illness to the mother and the infant outweighs the likely small risk associated with taking a medication. Blood pressure is monitored, and, when it reaches a threshold, an antihypertensive is started promptly to avoid morbidity and mortality.
Psychiatric illness carries risks for both mother and fetus as well, but no data show a clear threshold for initiating pharmacologic treatment. Therefore, in prescribing medication the most important steps are to take a complete history and perform a thorough evaluation. Important information includes the number and severity of previous episodes, prior history of hospitalization or suicidal thoughts or attempts, and any history of psychotic or manic status.
Whether to continue or discontinue medication is often decided after inquiring about other times a medication was discontinued. A patient who in the past stayed well for several years after stopping a medication may be able to taper off a medication and conceive during a window of wellness. Some women who have experienced only one episode of illness and have been stable for at least a year may be able to taper off a medication before conceiving (TABLE 1).
In the risk–benefit analysis, assess the need for pharmacologic treatment by considering the risk that untreated illness poses for both mother and fetus, the benefits of treatment for both, and the risk of medication exposure for the fetus.4
Mother: Risk of untreated illness versus benefit of treatment
A complete history and a current symptom evaluation are needed to assess the risk that nonpharmacologic treatment poses for the mother. Women with functional impairment, including inability to work, to perform activities of daily living, or to take care of other children, likely require treatment. Studies have found that women who discontinue treatment for a psychiatric illness around the time of conception are likely to experience a recurrence of illness during pregnancy, often in the first trimester, and must restart medication.5,6 For some diagnoses, particularly bipolar disorder, symptoms during a relapse can be more severe and more difficult to treat, and they carry a risk for both mother and fetus.7 A longitudinal study of pregnant women who stopped medication for bipolar disorder found a 71% rate of relapse.7 In cases in which there is a history of hospitalization, suicide attempt, or psychosis, discontinuing treatment is not an option; instead, the physician must determine which medication is safest for the particular patient.
Related article:
Does PTSD during pregnancy increase the likelihood of preterm birth?
Fetus: Risk of untreated illness versus benefit of treatment
Mothers with untreated psychiatric illness are at higher risk for poor prenatal care, substance abuse, and inadequate nutrition, all of which increase the risk of negative obstetric and neonatal outcomes.8 Evidence indicates that untreated maternal depression increases the risk of preterm delivery and low birth weight.9 Children born to mothers with depression have more behavioral problems, more psychiatric illness, more visits to pediatricians, lower IQ scores, and attachment issues.10 Some of the long-term negative effects of intrauterine stress, which include hypertension, coronary heart disease, and autoimmune disorders, persist into adulthood.11
Fetus: Risk of medication exposure
With any pharmacologic treatment, the timing of fetal exposure affects resultant risks and therefore must be considered in the management plan.
Before conception. Is there any effect on ovulation or fertilization?
Implantation. Does the exposure impair the blastocyst’s ability to implant in the uterine lining?
First trimester. This is the period of organogenesis. Regardless of drug exposure, there is a 2% to 4% baseline risk of a major malformation during any pregnancy. The risk of a particular malformation must be weighed against this baseline risk.
According to limited data, selective serotonin reuptake inhibitors (SSRIs) may increase the risk of early miscarriage.12 SSRIs also have been implicated in increasing the risk of cardiovascular malformations, although the data are conflicting.13,14
Antiepileptics such as valproate and carbamazepine are used as mood stabilizers in the treatment of bipolar disorder.15 Extensive data have shown an association with teratogenicity. Pregnant women who require either of these medications also should be prescribed folic acid 4 or 5 mg/day. Given the high risk of birth defects and cognitive delay, valproate no longer is recommended for women of reproductive potential.16
Lithium, one of the safest medications used in the treatment of bipolar disorder, is associated with a very small risk of Ebstein anomaly.17
Lamotrigine is used to treat bipolar depression and appears to have a good safety profile, along with a possible small increased risk of oral clefts.18,19
Atypical antipsychotics (such as aripiprazole, olanzapine, quetiapine, and risperidone) are often used first-line in the treatment of psychotic disorders and bipolar disorder in women who are not pregnant. Although the safety data on use of these drugs during pregnancy are limited, a recent analysis of pregnant Medicaid enrollees found no increased risk of birth defects after controlling for potential confounding factors.20 Common practice is to avoid these newer agents, given their limited data and the time needed for rare malformations to emerge (adequate numbers require many exposures during pregnancy).
Read additional fetal risks of medication exposure
Second trimester. This is a period of growth and neural development. A 2006 study suggested that SSRI exposure after pregnancy week 20 increases the risk of persistent pulmonary hypertension of the newborn (PPHN).21 In 2011, however, the FDA removed the PPHN warning label for SSRIs, citing inconsistent data. Whether the PPHN risk is increased with SSRI use is unclear, but the risk is presumed to be smaller than previously suggested.22 Stopping SSRIs before week 20 puts the mother at risk for relapse during pregnancy and increases her risk of developing postpartum depression. If we follow the recommendation to prescribe medication only for women who need it most, then stopping the medication at any time during pregnancy is not an option.
Third trimester. This is a period of continued growth and lung maturation.
Delivery. Is there a potential for impairment in parturition?
Neonatal adaptation. Newborns are active mainly in adapting to extrauterine life: They regulate their temperature and muscle tone and learn to coordinate sucking, swallowing, and breathing. Does medication exposure impair adaptation, or are signs or symptoms of withdrawal or toxicity present? The evidence that in utero SSRI exposure increases the risk of neonatal adaptation syndrome is consistent, but symptoms are mild and self-limited.23 Tapering off SSRIs before delivery currently is not recommended, as doing so increases the mother’s risk for postpartum depression and, according to one study, does not prevent symptoms of neonatal adaptation syndrome from developing.24
Behavioral teratogenicity. What are the long-term developmental outcomes for the child? Are there any differences in IQ, speech and language, or psychiatric illness? One study found an increased risk of autism with in utero exposure to sertraline, but the study had many methodologic flaws and its findings have not been replicated.25 Most studies have not found consistent differences in speech, IQ, or behavior between infants exposed and infants not exposed to antidepressants.26,27 By contrast, in utero exposure to anticonvulsants, particularly valproate, has led to significant developmental problems in children.28 The data on atypical antipsychotics are limited.
Related article:
Do antidepressants really cause autism?
None of the medications used to treat depression, bipolar disorder, anxiety, or schizophrenia is considered first-line or safest therapy for the pregnant woman. For any woman who is doing well on a certain medication, but particularly for a pregnant woman, there is no compelling, data-supported reason to switch to another agent. For depression, options include all of the SSRIs, with the possible exception of paroxetine (TABLE 2). In conflicting studies, paroxetine was no different from any other SSRI in not being associated with cardiovascular defects.29
One goal in treatment is to use a medication that previously was effective in the remission of symptoms and to use it at the lowest dose possible. Treating simply to maintain a low dose of drug, however, and not to effect symptom remission, exposes the fetus to both the drug and the illness. Again, the lowest effective dose is the best choice.
Read about treatment during breastfeeding
Treatment during breastfeeding
Women are encouraged to breastfeed for physical and psychological health benefits, for both themselves and their babies. Many medications are compatible with breastfeeding.30 The amount of drug an infant receives through breast milk is considerably less than the amount received during the mother’s pregnancy. Breastfeeding generally is allowed if the calculated infant dose is less than 10% of the weight-adjusted maternal dose.31
The amount of drug transferred from maternal plasma into milk is highest for drugs with low protein binding and high lipid solubility.32 Drug clearance in infants must be considered as well. Renal clearance is decreased in newborns and does not reach adult levels until 5 or 6 months of age. In addition, liver metabolism is impaired in neonates and even more so in premature infants.33 Drugs that require extensive first-pass metabolism may have higher bioavailability, and this factor should be considered.
Some clinicians recommend pumping and discarding breast milk when the drug in it is at its peak level; although the drug is not eliminated, the infant ingests less of it.34 Most women who are anxious about breastfeeding while on medication “pump and dump” until they are more comfortable nursing and the infants are doing well. Except in cases of mother preference, most physicians with expertise in reproductive mental health generally recommend against pumping and discarding milk.
Through breast milk, infants ingest drugs in varying amounts. The amount depends on the qualities of the medication, the timing and duration of breastfeeding, and the characteristics of the infant. Few psychotropic drugs have significant effects on breastfed infants. Even lithium, previously contraindicated, is successfully used, with infant monitoring, during breastfeeding.35 Given breastfeeding’s benefits for both mother and child, many more women on psychotropic medications are choosing to breastfeed.
Related article:
USPSTF Recommendations to Support Breastfeeding
Balance the pros and cons
Deciding to use medication during pregnancy and breastfeeding involves considering the risk of untreated illness versus the benefit of treatment for both mother and fetus, and the risk of medication exposure for the fetus. Mother and fetus are inseparable, and neither can be isolated from the other in treatment decisions. Avoiding psychotropic medication during pregnancy is not always the safest option for mother or fetus. The patient and her clinician and support system must make an informed decision that is based on the best available data and that takes into account the mother’s history of illness and effective treatment. Many women with psychiatric illness no longer have to choose between mental health and starting a family, and their babies will be healthy.
Share your thoughts! Send your Letter to the Editor to [email protected]. Please include your name and the city and state in which you practice.
- Andrade SE, Raebel MA, Brown J, et al. Use of antidepressant medications during pregnancy: a multisite study. Am J Obstet Gynecol. 2008;198(2):194.e1–e5.
- Hecht A. Drug safety labeling for doctors. FDA Consum. 1979;13(8):12–13.
- Ramoz LL, Patel-Shori NM. Recent changes in pregnancy and lactation labeling: retirement of risk categories. Pharmacotherapy. 2014;34(4):389–395.
- Yonkers KA, Wisner KL, Stewart DE, et al. The management of depression during pregnancy: a report from the American Psychiatric Association and the American College of Obstetricians and Gynecologists. Gen Hosp Psychiatry. 2009;31(5):403–413.
- Cohen LS, Altshuler LL, Harlow BL, et al. Relapse of major depression during pregnancy in women who maintain or discontinue antidepressant treatment. JAMA. 2006;295(5):499–507.
- O’Brien L, Laporte A, Koren G. Estimating the economic costs of antidepressant discontinuation during pregnancy. Can J Psychiatry. 2009;54(6):399–408.
- Viguera AC, Whitfield T, Baldessarini RJ, et al. Risk of recurrence in women with bipolar disorder during pregnancy: prospective study of mood stabilizer discontinuation. Am J Psychiatry. 2007;164(12):1817–1824.
- Bonari L, Pinto N, Ahn E, Einarson A, Steiner M, Koren G. Perinatal risks of untreated depression during pregnancy. Can J Psychiatry. 2004;49(11):726–735.
- Straub H, Adams M, Kim JJ, Silver RK. Antenatal depressive symptoms increase the likelihood of preterm birth. Am J Obstet Gynecol. 2012;207(4):329.e1–e4.
- Hayes LJ, Goodman SH, Carlson E. Maternal antenatal depression and infant disorganized attachment at 12 months. Attach Hum Dev. 2013;15(2):133–153.
- Field T. Prenatal depression effects on early development: a review. Infant Behav Dev. 2011;34(1):1–14.
- Kjaersgaard MI, Parner ET, Vestergaard M, et al. Prenatal antidepressant exposure and risk of spontaneous abortion—a population-based study. PLoS One. 2013;8(8):e72095.
- Nordeng H, van Gelder MM, Spigset O, Koren G, Einarson A, Eberhard-Gran M. Pregnancy outcome after exposure to antidepressants and the role of maternal depression: results from the Norwegian Mother and Child Cohort Study. J Clin Psychopharmacol. 2012;32(2):186–194.
- Källén BA, Otterblad Olausson P. Maternal use of selective serotonin re-uptake inhibitors in early pregnancy and infant congenital malformations. Birth Defects Res A Clin Mol Teratol. 2007;79(4):301–308.
- Tomson T, Battino D. Teratogenic effects of antiepileptic drugs. Lancet Neurol. 2012;11(9):803–813.
- Balon R, Riba M. Should women of childbearing potential be prescribed valproate? A call to action. J Clin Psychiatry. 2016;77(4):525–526.
- Giles JJ, Bannigan JG. Teratogenic and developmental effects of lithium. Curr Pharm Design. 2006;12(12):1531–1541.
- Nguyen HT, Sharma V, McIntyre RS. Teratogenesis associated with antibipolar agents. Adv Ther. 2009;26(3):281–294.
- Campbell E, Kennedy F, Irwin B, et al. Malformation risks of antiepileptic drug monotherapies in pregnancy. J Neurol Neurosurg Psychiatry. 2013;84(11):e2.
- Huybrechts KF, Hernández-Díaz S, Patorno E, et al. Antipsychotic use in pregnancy and the risk for congenital malformations. JAMA Psychiatry. 2016;73(9):938–946.
- Chambers CD, Hernández-Díaz S, Van Marter LJ, et al. Selective serotonin-reuptake inhibitors and risk of persistent pulmonary hypertension of the newborn. N Engl J Med. 2006;354(6):579–587.
- ‘t Jong GW, Einarson T, Koren G, Einarson A. Antidepressant use in pregnancy and persistent pulmonary hypertension of the newborn (PPHN): a systematic review. Reprod Toxicol. 2012;34(3):293–297.
- Oberlander TF, Misri S, Fitzgerald CE, Kostaras X, Rurak D, Riggs W. Pharmacologic factors associated with transient neonatal symptoms following prenatal psychotropic medication exposure. J Clin Psychiatry. 2004;65(2):230–237.
- Warburton W, Hertzman C, Oberlander TF. A register study of the impact of stopping third trimester selective serotonin reuptake inhibitor exposure on neonatal health. Acta Psychiatr Scand. 2010;121(6):471–479.
- Croen LA, Grether JK, Yoshida CK, Odouli R, Hendrick V. Antidepressant use during pregnancy and childhood autism spectrum disorders. Arch Gen Psychiatry. 2011;68(11):1104–1112.
- Batton B, Batton E, Weigler K, Aylward G, Batton D. In utero antidepressant exposure and neurodevelopment in preterm infants. Am J Perinatol. 2013;30(4):297–301.
- Austin MP, Karatas JC, Mishra P, Christl B, Kennedy D, Oei J. Infant neurodevelopment following in utero exposure to antidepressant medication. Acta Paediatr. 2013;102(11):1054–1059.
- Bromley RL, Mawer GE, Briggs M, et al. The prevalence of neurodevelopmental disorders in children prenatally exposed to antiepileptic drugs. J Neurol Neurosurg Psychiatry. 2013;84(6):637–643.
- Einarson A, Pistelli A, DeSantis M, et al. Evaluation of the risk of congenital cardiovascular defects associated with use of paroxetine during pregnancy. Am J Psychiatry. 2008;165(6):749–752.
- Davanzo R, Copertino M, De Cunto A, Minen F, Amaddeo A. Antidepressant drugs and breastfeeding: a review of the literature. Breastfeed Med. 2011;6(2):89–98.
- Ito S. Drug therapy for breast-feeding women. N Engl J Med. 2000;343(2):118–126.
- Suri RA, Altshuler LL, Burt VK, Hendrick VC. Managing psychiatric medications in the breast-feeding woman. Medscape Womens Health. 1998;3(1):1.
- Milsap RL, Jusko WJ. Pharmacokinetics in the infant. Environ Health Perspect. 1994;102(suppl 11):107–110.
- Newport DJ, Hostetter A, Arnold A, Stowe ZN. The treatment of postpartum depression: minimizing infant exposures. J Clin Psychiatry. 2002;63(suppl 7):31–44.
- Viguera AC, Newport DJ, Ritchie J, et al. Lithium in breast milk and nursing infants: clinical implications. Am J Psychiatry. 2007;164(2):342–345.

The pelvic exam revisited
More than 44 million pelvic examinations are performed annually in the United States.1 In March 2017, the United States Preventive Services Task Force (USPSTF) published an updated recommendation statement regarding the need for routine screening pelvic examinations in asymptomatic adult women (18 years and older) receiving primary care: “The USPSTF concludes that the current evidence is insufficient to assess the balance of benefits and harms of performing screening pelvic examinations in asymptomatic, nonpregnant adult women.”2
That statement, however, was assigned a grade of I, which means that evidence is lacking, of poor quality, or conflicting, and that the balance of benefits and harms cannot be determined. This USPSTF recommendation statement thus will not change practice for ObGyn providers but likely will renew our commitment to provide individualized well-woman care. There was inadequate or poor quality evidence for benefits related to all-cause mortality, disease-specific morbidity, and quality of life, as well as inadequate evidence on harms related to false-positive findings and anxiety stemming from screening pelvic exams.
Read about coding and billing for a standard pelvic exam
Melanie Witt, RN, MA
Coding and billing for the care provided at a well-woman visit can be uncomplicated if you know the right codes for the right program. The information presented here concerns straightforward preventive care and assumes that the patient also has not presented with a significant problem at the same visit.
First, a patient who is not Medicare-eligible might have insurance coverage for an annual preventive care examination every year. Normally, this service would be billed using the Current Procedural Terminology (CPT) preventive medicine codes, but some insurers require the use of special codes for an annual gynecologic exam. These special codes are:
- S0610, Annual gynecological examination, new patient
- S0612, Annual gynecological examination, established patient
- S0613, Annual gynecological examination; clinical breast examination without pelvic evaluation.
Notably, Aetna, Cigna, and UnitedHealthcare require these codes to signify that a pelvic examination has been performed (except for code S0613), but many Blue Cross Blue Shield programs, for whom these codes were originally created, are now reverting to the CPT preventive medicine codes for all preventive care.
CPT outlines the requirements for use of the preventive medicine codes as: an initial or periodic comprehensive preventive medicine evaluation or reevaluation and management (E/M) service, which includes an age- and gender-appropriate history, examination, counseling/anticipatory guidance/risk factor reduction interventions, and the ordering of laboratory/diagnostic procedures. The codes are divided into new or established patient categories by age range as follows:
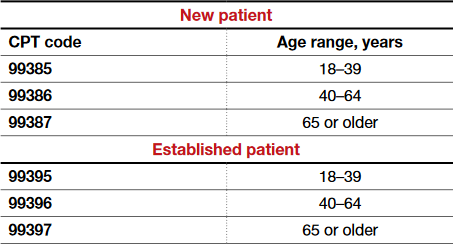
The Medicare E/M documentation guidelines do not apply to preventive services, and a head-to-toe examination also is not required. CPT recognizes the American College of Obstetricians and Gynecologists (ACOG) as an authoritative body to make recommendations for the expected preventive service for women, and if such a service is provided and documented, the preventive care codes are to be reported. The payers who use the S codes for a gynecologic exam will require that a pelvic examination has been performed, but such an examination would not be required when using the CPT codes or ACOG's guidelines if the physician and patient agreed that such an exam was not warranted every year. The other components of a preventive service applicable to the female patient's age, however, should be documented in order to report the CPT codes for preventive medicine services.
If a pelvic examination is not performed, say because the patient is young and not sexually active, but an examination of other areas is carried out, the diagnosis code would change from Z01.411, Encounter for gynecological examination (general) (routine) with abnormal findings, or Z01.419, Encounter for gynecological examination (general) (routine) without abnormal findings, to a general health exam: Z00.00, Encounter for general adult medical examination without abnormal findings, or Z00.01, Encounter for general adult medical examination with abnormal findings.
What about Medicare?
Medicare requirements are somewhat different. First, Medicare covers only a small portion of the preventive care service; that is, it covers a physical examination of the genital organs and breasts and the collection and conveyance of a Pap specimen to the laboratory every 2 years for a low-risk patient. Second, the codes required to get reimbursed for the examination are:
- G0101, Cervical or vaginal cancer screening; pelvic and clinical breast examination
- Q0091, Screening Papanicolaou smear; obtaining, preparing, and conveyance of cervical or vaginal smear to laboratory.
It is not necessary to perform both of these services every 2 years (for instance, the patient may not need a Pap smear every 2 years based on her age and history), but the benefit is available if the service is performed. If the woman is at high risk for developing cervical or vaginal cancer, Medicare will cover this portion of the encounter every year so long as the Medicare-defined criteria for high risk have been documented at the time of the exam.
Related article:
GYN coding changes to note for your maximized reimbursement

Ms. Witt is an independent coding and documentation consultant and former program manager, department of coding and nomenclature, American Congress of Obstetricians and Gynecologists.
The author reports no financial relationships relevant to this article.
Read the authors’ interpretation of the new USPSTF statement
Interpreting the new USPSTF statement
We understand the USPSTF statement to mean that pelvic exams should not be abandoned, but rather should be individualized to each patient for her specific visit. We agree that for visits focused on counseling and routine screening in asymptomatic, nonpregnant women, pelvic exams likely will not increase the early detection and treatment of disease and more benefit likely would be derived by performing and discussing evidence-based and age-appropriate health services. A classic example would be for initiation or maintenance of oral contraception in an 18-year-old patient for whom an exam could cause unnecessary trauma, pain, or psychological distress leading to future avoidance or barriers to seeking health care. For long-acting reversible contraception placement, however, a pelvic exam clearly would be necessary for insertion of an intrauterine device.
Related article:
Women’s Preventive Services Initiative Guidelines provide consensus for practicing ObGyns
Indications for pelvic examination
Remember that the pelvic examination has 3 distinct parts (and that not all parts need to be routinely conducted)3:
- general inspection of the external genitalia and vulva
- speculum examination and evaluation of the vagina and cervix
- bimanual examination with possible rectovaginal examination in age-appropriate or symptomatic women.
According to the Well-Woman Task Force of the American College of Obstetricians and Gynecologists (ACOG), “For women 21 years and older, external exam may be performed annually and that inclusion of speculum examination, bimanual examination, or both in otherwise healthy women should be a shared, informed decision between patient and provider.”4
Indications for performing certain parts of the pelvic exam include4:
- routine screening for cervical cancer (Pap test)
- routine screening for gonorrhea, chlamydia infection, and other sexually transmitted infections
- evaluation of abnormal vaginal discharge
- evaluation of abnormal bleeding, pelvic pain, and pelvic floor disorders, such as prolapse, urinary incontinence, and accidental bowel leakage
- evaluation of menopausal symptoms, such as dryness, dyspareunia, and the genitourinary syndrome of menopause
- evaluation of women at increased risk for gynecologic malignancy, such as women with known hereditary breast–ovarian cancer syndromes.
In 2016, ACOG launched the Women’s Preventive Services Initiative (WPSI) in conjunction with the Health Resources and Services Administration (HRSA) of the US Department of Health and Human Services. In this 5-year collaboration, the agencies are endeavoring to review and update the recommendations for women’s preventive health care services, including well-woman visits, human papillomavirus testing, and contraception, among many others.5 Once the HRSA adopts these recommendations, women will be able to access comprehensive preventive health services without incurring any out-of-pocket expenses.
Roshanak Mansouri Zinn, MD, and Rebekah L. Williams, MD, MS
No literature addresses the utility of screening pelvic examination in the pediatric and adolescent population. According to the American College of Obstetricians and Gynecologists Committee on Adolescent Health Care opinion on the initial reproductive health visit for screening and preventive reproductive health care (reaffirmed in 2016), a screening internal exam is not necessary, but an external genital exam may be indicated and may vary depending on the patient's concerns and prior clinical encounters.1 The American Academy of Pediatrics promotes annual screening external genital examination for all female patients as part of routine primary care, with internal examinations only as indicated.2
Age-appropriate pelvic examination for girls and nonsexually active adolescents usually is limited to an external genital exam to evaluate the anatomy and note the sexual maturity rating (Tanner stage), an important indicator of normal pubertal development. As in adults, the potential benefits of screening examination in this population include detection of benign gynecologic conditions (including vulvar skin conditions and abnormalities of hymenal or vaginal development). Additionally, early reproductive health visits are an important time for clinicians to build rapport with younger patients and to provide anticipatory education on menstruation, hygiene, and anatomy. These visits can destigmatize and demystify the pelvic examination and help young women seek care more appropriately and more comfortably if problems do arise.
Even when a pelvic exam is indicated, a patient's young age can give providers pause as to what type of exam to perform. Patients with vulvovaginal symptoms, abnormal vaginal bleeding, vaginal discharge, or pelvic or abdominal pain should receive complete evaluation with external genital examination. If external vaginal examination does not allow for complete assessment of the problem, the patient and provider can assess the likelihood of her tolerating an internal exam in the clinic versus undergoing vaginoscopy under sedation. Limited laboratory evaluation and transabdominal pelvic ultrasonography may provide sufficient information for appropriate clinical decision making and management without internal examination. If symptoms persist or do not respond to first-line treatment, an internal exam should be performed.
Patients of any age may experience anxiety or physical discomfort or may even delay or avoid seeking care because of fear of a pelvic exam. However, providers of reproductive health care for children and adolescents can offer early education, reassurance, and a more comfortable experience when pelvic examination is necessary in this population.
References
- American College of Obstetricians and Gynecologists Committee on Adolescent Health Care. Committee Opinion No. 598: Committee on Adolescent Health Care: the initial reproductive health visit. Obstet Gynecol. 2014;123(5):1143-1147.
- Braverman PK, Breech L; Committee on Adolescence. American Academy of Pediatrics. Clinical report: gynecologic examination for adolescents in the pediatric office setting. Pediatrics. 2010;126(3):583-590.

Dr. Mansouri Zinn is Assistant Professor, Department of Women's Health, University of Texas at Austin.

Dr. Williams is Assistant Professor, Clinical Pediatrics, Section of Adolescent Medicine, Indiana University School of Medicine, Indianapolis.
![]()
Developed in collaboration with the North American Society for Pediatric and Adolescent Gynecology
The authors report no financial relationships relevant to this article.
How will the USPSTF statement affect practice?
In an editorial in the Journal of the American Medical Association commenting on the USPSTF statement, McNicholas and Peipert stated, “Based on the recommendation from the task force, clinicians may ask whether the pelvic examination should be abandoned. The answer is not found in this recommendation statement, but instead in a renewed commitment to shared decision making.”6 We wholeheartedly agree with this statement. The health care provider and the patient should make the decision, taking into consideration the patient’s risk factors for gynecologic cancers and other conditions, her personal preferences, and her overall values.
This new USPSTF recommendation statement will not change how we currently practice, and the statement’s grade I rating should not impact insurance coverage for pelvic exams. Additionally, further research is needed to better elucidate the role of the pelvic exam at well-woman visits, with hopes of obtaining more precise guidelines from the USPSTF and ACOG.
Share your thoughts! Send your Letter to the Editor to [email protected]. Please include your name and the city and state in which you practice.
- Centers for Disease Control and Prevention. National Center for Health Statistics. National Ambulatory Medical Care Survey: 2012 state and national summary tables. https://www.cdc.gov/nchs/data/ahcd/namcs_summary/2012_namcs_web_tables.pdf. Accessed May 11, 2017.
- Bibbins-Domingo K, Grossman DC, Curry SJ, et al; US Preventive Services Task Force. Screening for gynecologic conditions with pelvic examination: US Preventive Services Task Force recommendation statement. JAMA. 2017;317(9):947–953.
- American College of Obstetricians and Gynecologists Committee on Gynecologic Practice. Committee Opinion No. 534: Well-woman visit. Obstet Gynecol. 2012;120(2 pt 1):421–424.
- Conry JA, Brown H. Well-Woman Task Force: components of the well-woman visit. Obstet Gynecol. 2015;126(4):697–701.
- American College of Obstetricians and Gynecologists. The Women’s Preventive Services Initiative (WPSI). https://www.womenspreventivehealth.org. Accessed May 11, 2017.
- McNicholas C, Peipert JF. Is it time to abandon the routine pelvic examination in asymptomatic nonpregnant women? JAMA. 2017;317(9):910–911.

Dr. Higgins is a 2017 graduate of the ObGyn residency program at MedStar Washington Hospital Center/Georgetown University Hospital, Washington, DC. She is currently a Clinical Instructor and simulation Fellow at NYU Langone Medical Center, New York, New York.

Dr. Iglesia is Director, Section of Female Pelvic Medicine and Reconstructive Surgery, MedStar Washington Hospital Center, Washington, DC, and Professor, Departments of Obstetrics/Gynecology and Urology, Georgetown University School of Medicine, Washington, DC. Dr. Iglesia serves on the
The authors report no financial relationships relevant to this article.
Dr. Higgins is a 2017 graduate of the ObGyn residency program at MedStar Washington Hospital Center/Georgetown University Hospital, Washington, DC. She is currently a Clinical Instructor and simulation Fellow at NYU Langone Medical Center, New York, New York.
Dr. Iglesia is Director, Section of Female Pelvic Medicine and Reconstructive Surgery, MedStar Washington Hospital Center, Washington, DC, and Professor, Departments of Obstetrics/Gynecology and Urology, Georgetown University School of Medicine, Washington, DC. Dr. Iglesia serves on the
The authors report no financial relationships relevant to this article.
More than 44 million pelvic examinations are performed annually in the United States.1 In March 2017, the United States Preventive Services Task Force (USPSTF) published an updated recommendation statement regarding the need for routine screening pelvic examinations in asymptomatic adult women (18 years and older) receiving primary care: “The USPSTF concludes that the current evidence is insufficient to assess the balance of benefits and harms of performing screening pelvic examinations in asymptomatic, nonpregnant adult women.”2
That statement, however, was assigned a grade of I, which means that evidence is lacking, of poor quality, or conflicting, and that the balance of benefits and harms cannot be determined. This USPSTF recommendation statement thus will not change practice for ObGyn providers but likely will renew our commitment to provide individualized well-woman care. There was inadequate or poor quality evidence for benefits related to all-cause mortality, disease-specific morbidity, and quality of life, as well as inadequate evidence on harms related to false-positive findings and anxiety stemming from screening pelvic exams.
Read about coding and billing for a standard pelvic exam
Melanie Witt, RN, MA
Coding and billing for the care provided at a well-woman visit can be uncomplicated if you know the right codes for the right program. The information presented here concerns straightforward preventive care and assumes that the patient also has not presented with a significant problem at the same visit.
First, a patient who is not Medicare-eligible might have insurance coverage for an annual preventive care examination every year. Normally, this service would be billed using the Current Procedural Terminology (CPT) preventive medicine codes, but some insurers require the use of special codes for an annual gynecologic exam. These special codes are:
- S0610, Annual gynecological examination, new patient
- S0612, Annual gynecological examination, established patient
- S0613, Annual gynecological examination; clinical breast examination without pelvic evaluation.
Notably, Aetna, Cigna, and UnitedHealthcare require these codes to signify that a pelvic examination has been performed (except for code S0613), but many Blue Cross Blue Shield programs, for whom these codes were originally created, are now reverting to the CPT preventive medicine codes for all preventive care.
CPT outlines the requirements for use of the preventive medicine codes as: an initial or periodic comprehensive preventive medicine evaluation or reevaluation and management (E/M) service, which includes an age- and gender-appropriate history, examination, counseling/anticipatory guidance/risk factor reduction interventions, and the ordering of laboratory/diagnostic procedures. The codes are divided into new or established patient categories by age range as follows:
The Medicare E/M documentation guidelines do not apply to preventive services, and a head-to-toe examination also is not required. CPT recognizes the American College of Obstetricians and Gynecologists (ACOG) as an authoritative body to make recommendations for the expected preventive service for women, and if such a service is provided and documented, the preventive care codes are to be reported. The payers who use the S codes for a gynecologic exam will require that a pelvic examination has been performed, but such an examination would not be required when using the CPT codes or ACOG's guidelines if the physician and patient agreed that such an exam was not warranted every year. The other components of a preventive service applicable to the female patient's age, however, should be documented in order to report the CPT codes for preventive medicine services.
If a pelvic examination is not performed, say because the patient is young and not sexually active, but an examination of other areas is carried out, the diagnosis code would change from Z01.411, Encounter for gynecological examination (general) (routine) with abnormal findings, or Z01.419, Encounter for gynecological examination (general) (routine) without abnormal findings, to a general health exam: Z00.00, Encounter for general adult medical examination without abnormal findings, or Z00.01, Encounter for general adult medical examination with abnormal findings.
What about Medicare?
Medicare requirements are somewhat different. First, Medicare covers only a small portion of the preventive care service; that is, it covers a physical examination of the genital organs and breasts and the collection and conveyance of a Pap specimen to the laboratory every 2 years for a low-risk patient. Second, the codes required to get reimbursed for the examination are:
- G0101, Cervical or vaginal cancer screening; pelvic and clinical breast examination
- Q0091, Screening Papanicolaou smear; obtaining, preparing, and conveyance of cervical or vaginal smear to laboratory.
It is not necessary to perform both of these services every 2 years (for instance, the patient may not need a Pap smear every 2 years based on her age and history), but the benefit is available if the service is performed. If the woman is at high risk for developing cervical or vaginal cancer, Medicare will cover this portion of the encounter every year so long as the Medicare-defined criteria for high risk have been documented at the time of the exam.
Related article:
GYN coding changes to note for your maximized reimbursement
Ms. Witt is an independent coding and documentation consultant and former program manager, department of coding and nomenclature, American Congress of Obstetricians and Gynecologists.
The author reports no financial relationships relevant to this article.
Read the authors’ interpretation of the new USPSTF statement
Interpreting the new USPSTF statement
We understand the USPSTF statement to mean that pelvic exams should not be abandoned, but rather should be individualized to each patient for her specific visit. We agree that for visits focused on counseling and routine screening in asymptomatic, nonpregnant women, pelvic exams likely will not increase the early detection and treatment of disease and more benefit likely would be derived by performing and discussing evidence-based and age-appropriate health services. A classic example would be for initiation or maintenance of oral contraception in an 18-year-old patient for whom an exam could cause unnecessary trauma, pain, or psychological distress leading to future avoidance or barriers to seeking health care. For long-acting reversible contraception placement, however, a pelvic exam clearly would be necessary for insertion of an intrauterine device.
Related article:
Women’s Preventive Services Initiative Guidelines provide consensus for practicing ObGyns
Indications for pelvic examination
Remember that the pelvic examination has 3 distinct parts (and that not all parts need to be routinely conducted)3:
- general inspection of the external genitalia and vulva
- speculum examination and evaluation of the vagina and cervix
- bimanual examination with possible rectovaginal examination in age-appropriate or symptomatic women.
According to the Well-Woman Task Force of the American College of Obstetricians and Gynecologists (ACOG), “For women 21 years and older, external exam may be performed annually and that inclusion of speculum examination, bimanual examination, or both in otherwise healthy women should be a shared, informed decision between patient and provider.”4
Indications for performing certain parts of the pelvic exam include4:
- routine screening for cervical cancer (Pap test)
- routine screening for gonorrhea, chlamydia infection, and other sexually transmitted infections
- evaluation of abnormal vaginal discharge
- evaluation of abnormal bleeding, pelvic pain, and pelvic floor disorders, such as prolapse, urinary incontinence, and accidental bowel leakage
- evaluation of menopausal symptoms, such as dryness, dyspareunia, and the genitourinary syndrome of menopause
- evaluation of women at increased risk for gynecologic malignancy, such as women with known hereditary breast–ovarian cancer syndromes.
In 2016, ACOG launched the Women’s Preventive Services Initiative (WPSI) in conjunction with the Health Resources and Services Administration (HRSA) of the US Department of Health and Human Services. In this 5-year collaboration, the agencies are endeavoring to review and update the recommendations for women’s preventive health care services, including well-woman visits, human papillomavirus testing, and contraception, among many others.5 Once the HRSA adopts these recommendations, women will be able to access comprehensive preventive health services without incurring any out-of-pocket expenses.
Roshanak Mansouri Zinn, MD, and Rebekah L. Williams, MD, MS
No literature addresses the utility of screening pelvic examination in the pediatric and adolescent population. According to the American College of Obstetricians and Gynecologists Committee on Adolescent Health Care opinion on the initial reproductive health visit for screening and preventive reproductive health care (reaffirmed in 2016), a screening internal exam is not necessary, but an external genital exam may be indicated and may vary depending on the patient's concerns and prior clinical encounters.1 The American Academy of Pediatrics promotes annual screening external genital examination for all female patients as part of routine primary care, with internal examinations only as indicated.2
Age-appropriate pelvic examination for girls and nonsexually active adolescents usually is limited to an external genital exam to evaluate the anatomy and note the sexual maturity rating (Tanner stage), an important indicator of normal pubertal development. As in adults, the potential benefits of screening examination in this population include detection of benign gynecologic conditions (including vulvar skin conditions and abnormalities of hymenal or vaginal development). Additionally, early reproductive health visits are an important time for clinicians to build rapport with younger patients and to provide anticipatory education on menstruation, hygiene, and anatomy. These visits can destigmatize and demystify the pelvic examination and help young women seek care more appropriately and more comfortably if problems do arise.
Even when a pelvic exam is indicated, a patient's young age can give providers pause as to what type of exam to perform. Patients with vulvovaginal symptoms, abnormal vaginal bleeding, vaginal discharge, or pelvic or abdominal pain should receive complete evaluation with external genital examination. If external vaginal examination does not allow for complete assessment of the problem, the patient and provider can assess the likelihood of her tolerating an internal exam in the clinic versus undergoing vaginoscopy under sedation. Limited laboratory evaluation and transabdominal pelvic ultrasonography may provide sufficient information for appropriate clinical decision making and management without internal examination. If symptoms persist or do not respond to first-line treatment, an internal exam should be performed.
Patients of any age may experience anxiety or physical discomfort or may even delay or avoid seeking care because of fear of a pelvic exam. However, providers of reproductive health care for children and adolescents can offer early education, reassurance, and a more comfortable experience when pelvic examination is necessary in this population.
References
- American College of Obstetricians and Gynecologists Committee on Adolescent Health Care. Committee Opinion No. 598: Committee on Adolescent Health Care: the initial reproductive health visit. Obstet Gynecol. 2014;123(5):1143-1147.
- Braverman PK, Breech L; Committee on Adolescence. American Academy of Pediatrics. Clinical report: gynecologic examination for adolescents in the pediatric office setting. Pediatrics. 2010;126(3):583-590.
Dr. Mansouri Zinn is Assistant Professor, Department of Women's Health, University of Texas at Austin.
Dr. Williams is Assistant Professor, Clinical Pediatrics, Section of Adolescent Medicine, Indiana University School of Medicine, Indianapolis.
![]()
Developed in collaboration with the North American Society for Pediatric and Adolescent Gynecology
The authors report no financial relationships relevant to this article.
How will the USPSTF statement affect practice?
In an editorial in the Journal of the American Medical Association commenting on the USPSTF statement, McNicholas and Peipert stated, “Based on the recommendation from the task force, clinicians may ask whether the pelvic examination should be abandoned. The answer is not found in this recommendation statement, but instead in a renewed commitment to shared decision making.”6 We wholeheartedly agree with this statement. The health care provider and the patient should make the decision, taking into consideration the patient’s risk factors for gynecologic cancers and other conditions, her personal preferences, and her overall values.
This new USPSTF recommendation statement will not change how we currently practice, and the statement’s grade I rating should not impact insurance coverage for pelvic exams. Additionally, further research is needed to better elucidate the role of the pelvic exam at well-woman visits, with hopes of obtaining more precise guidelines from the USPSTF and ACOG.
Share your thoughts! Send your Letter to the Editor to [email protected]. Please include your name and the city and state in which you practice.
- Centers for Disease Control and Prevention. National Center for Health Statistics. National Ambulatory Medical Care Survey: 2012 state and national summary tables. https://www.cdc.gov/nchs/data/ahcd/namcs_summary/2012_namcs_web_tables.pdf. Accessed May 11, 2017.
- Bibbins-Domingo K, Grossman DC, Curry SJ, et al; US Preventive Services Task Force. Screening for gynecologic conditions with pelvic examination: US Preventive Services Task Force recommendation statement. JAMA. 2017;317(9):947–953.
- American College of Obstetricians and Gynecologists Committee on Gynecologic Practice. Committee Opinion No. 534: Well-woman visit. Obstet Gynecol. 2012;120(2 pt 1):421–424.
- Conry JA, Brown H. Well-Woman Task Force: components of the well-woman visit. Obstet Gynecol. 2015;126(4):697–701.
- American College of Obstetricians and Gynecologists. The Women’s Preventive Services Initiative (WPSI). https://www.womenspreventivehealth.org. Accessed May 11, 2017.
- McNicholas C, Peipert JF. Is it time to abandon the routine pelvic examination in asymptomatic nonpregnant women? JAMA. 2017;317(9):910–911.

Antimicrobial Stewardship Programs: Effects on Clinical and Economic Outcomes and Future Directions
From the Ernest Mario School of Pharmacy, Rutgers, The State University of New Jersey, Piscataway, NJ.
Abstract
- Objective: To review the evidence evaluating inpatient antimicrobial stewardship programs (ASPs) with a focus on clinical and economic outcomes.
- Methods: Pubmed/MEDLINE and the Cochrane Database of Systematic Reviews were used to identify systematic reviews, meta-analyses, randomized controlled trials, and other relevant literature evaluating the clinical and economic impact of ASP interventions.
- Results: A total of 5 meta-analyses, 3 systematic reviews, and 10 clinical studies (2 randomized controlled, 5 observational, and 3 quasi-experimental studies) were identified for analysis. ASPs were associated with a reduction in antimicrobial consumption and use. However, due to the heterogeneity of outcomes measured among studies, the effectiveness of ASPs varied with the measures used. There are data supporting the cost savings associated with ASPs, but these studies are more sparse. Most of the available evidence supporting ASPs is of low quality, and intervention strategies vary widely among available studies.
- Conclusion: Much of the evidence reviewed supports the assertion that ASPs result in a more judicious use of antimicrobials and lead to better patient care in the inpatient setting. While clinical outcomes vary between programs, there are ubiquitous positive benefits associated with ASPs in terms of antimicrobial consumption, C. difficile infection rates, and resistance, with few adverse effects. To date, economic outcomes have been difficult to uniformly quantify, but there are data supporting the economic benefits of ASPs. As the number of ASPs continues to grow, it is imperative that standardized metrics are considered in order to accurately measure the benefits of these essential programs.
Key words: Antimicrobial stewardship; antimicrobial consumption; resistance.
Antimicrobial resistance is a public health concern that has been escalating over the years and is now identified as a global crisis [1–3]. This is partly due to the widespread use of the same antibiotics that have existed for decades, combined with a lack of sufficient novel antibiotic discovery and development [4]. Bacteria that are resistant to our last-line-of-defense medications have recently emerged, and these resistant organisms may spread to treatment-naive patients [5]. Multidrug-resistant organisms are often found, treated, and likely originate within the hospital practice setting, where antimicrobials can be prescribed by any licensed provider [6]. Upwards of 50% of antibiotics administered are unnecessary and contribute to the problem of increasing resistance [7]. The seriousness of this situation is increasingly apparent; in 2014 the World Health Organization (WHO), President Obama, and Prime Minister Cameron issued statements urging solutions to the resistance crisis [8].
While the urgency of the situation is recognized today, efforts aimed at a more judicious use of antibiotics to curb resistance began as early as the 1960s and led to the first antimicrobial stewardship programs (ASPs) [9–11]. ASPs have since been defined as “coordinated interventions designed to improve and measure the appropriate use of antimicrobial agents by promoting the selection of the optimal antimicrobial drug regimen including dosing, duration of therapy, and route of administration” [1]. The primary objectives of these types of programs are to avoid or reduce adverse events (eg, Clostridium difficile infection) and resistance driven by a shift in minimum inhibitory concentrations (MICs) and to reverse the unnecessary economic burden caused by the inappropriate prescribing of these agents [1].
This article examines the evidence evaluating the reported effectiveness of inpatient ASPs, examining both clinical and economic outcomes. In addition, we touch on ASP history, current status, and future directions in light of current trends. While ASPs are expanding into the outpatient and nursing home settings, we will limit our review here to the inpatient setting.
Historical Background
Modern antibiotics date back to the late 1930s when penicillin and sulfonamides were introduced to the medical market, and resistance to these drug classes was reported just a few years after their introduction. The same bacterial resistance mechanisms that neutralized their efficacy then exist today, and these mechanisms continue to confer resistance among those classes [5].
While “stewardship” was not described as such until the late 1990s [12], institutions have historically been proactive in creating standards around antimicrobial utilization to encourage judicious use of these agents. The earliest form of tracking antibiotic use was in the form of paper charts as “antibiotic logs” [9] and “punch cards” [10] in the 1960s. The idea of a team approach to stewardship dates back to the 1970s, with the example of Hartford Hospital in Hartford, Connecticut, which employed an antimicrobial standards model run by an infectious disease (ID) physician and clinical pharmacists [11]. In 1977, the Infectious Diseases Society of America (IDSA) released a statement that clinical pharmacists may have a substantial impact on patient care, including in ID, contributing to the idea that a team of physicians collaborating with pharmacists presents the best way to combat inappropriate medication use. Pharmacist involvement has since been shown to restrict broad overutilized antimicrobial agents and reduce the rate of C. difficile infection by a significant amount [13].
In 1997 the IDSA and the Society for Healthcare Epidemiology of America (SHEA) published guidelines to assist in the prevention of the growing issue of resistance, mentioning the importance of antimicrobial stewardship [14]. A decade later they released joint guidelines for ASP implementation [15], and the Pediatric Infectious Disease Society (PIDS) joined them in 2012 to publish a joint statement acknowledging and endorsing stewardship [16]. In 2014, the Centers of Disease Control and Prevention (CDC) recommended that every hospital should have an ASP. As of 1 January 2017, the Joint Commission requires an ASP as a standard for accreditation at hospitals, critical access hospitals, and nursing care [17]. Guidelines for implementation of an ASP are currently available through the IDSA and SHEA [1,16].
ASP Interventions
There are 2 main strategies that ASPs have to combat inappropriate antimicrobial use, and each has its own set of systematic interventions. These strategies are referred to as “prospective audit with intervention and feedback” and “prior authorization” [6]. Although most ASPs will incorporate these main strategies, each institution typically creates its own strategies and regulations independently.
Prospective audit with intervention and feedback describes the process of providing recommendations after reviewing utilization and trends of antimicrobial use. This is sometimes referred to as the “back-end” intervention, in which decisions are made after antibiotics have been administered. Interventions that are commonly used under this strategy include discontinuation of antibiotics due to culture data, de-escalation to drugs with narrower spectra, IV to oral conversions, and cessation of surgical prophylaxis [6].
Prior authorization, also referred to as a “front-end” intervention, is the process of approving medications before they are used. Interventions include a restricted formulary for antimicrobials that can be managed through a paging system or a built-in computer restriction program, as well as other guidelines and protocols for dosing and duration of therapy. Restrictions typically focus on broad spectrum antibiotics as well as the more costly drugs on formularies. These solutions reduce the need for manual intervention as technology makes it possible to create automated restriction-based services that prevent inappropriate prescribing [6].
Aside from these main techniques, other strategies are taken to achieve the goal of attaining optimal clinical outcomes while limiting further antimicrobial resistance and adverse effects. Different clinical settings have different needs, and ASPs are customized to each setting’s resources, prescribing habits, and other local specificities [1]. These differences present difficulty with interpreting diverse datasets, but certain themes arise in the literature: commonly assessed clinical outcomes of inpatient ASPs include hospital length of stay (LOS) and readmission, reinfection, mortality, and resistance rates. These outcomes are putatively driven by the more prudent use of antimicrobials, particularly by decreased rates of antimicrobial consumption.
ASP Team Members
While ASPs may differ between institutions, the staff members involved are typically the same, and leadership is always an important aspect of a program. The CDC recommends that ASP leadership consist of a program leader (an ID physician) and a pharmacy leader, who co-lead the team [18]. In addition, the Joint Commission recommends that the multidisciplinary team should include an infection preventionist (ie, infection control and hospital epidemiologist) and practitioner [17]; these specialists have a role in prevention, awareness, and policy [19]. The integration of infection control with stewardship yields the best results [15], as infection control aims to prevent antibiotic use altogether, while stewardship increases the quality of antibiotic regimens that are being prescribed [20].
It is also beneficial to incorporate a microbiologist as an integral part of the team, responsible for performing and interpreting laboratory data (ie, cultures). Nurses should be integrated into ASPs due to the overlap of their routine activities with ASP interventions [21]; other clinicians (regardless of their infectious disease clinical background), quality control, information technology, and environmental services should all collaborate in the hospital-wide systems related to the program where appropriate [18].
Evidence Review
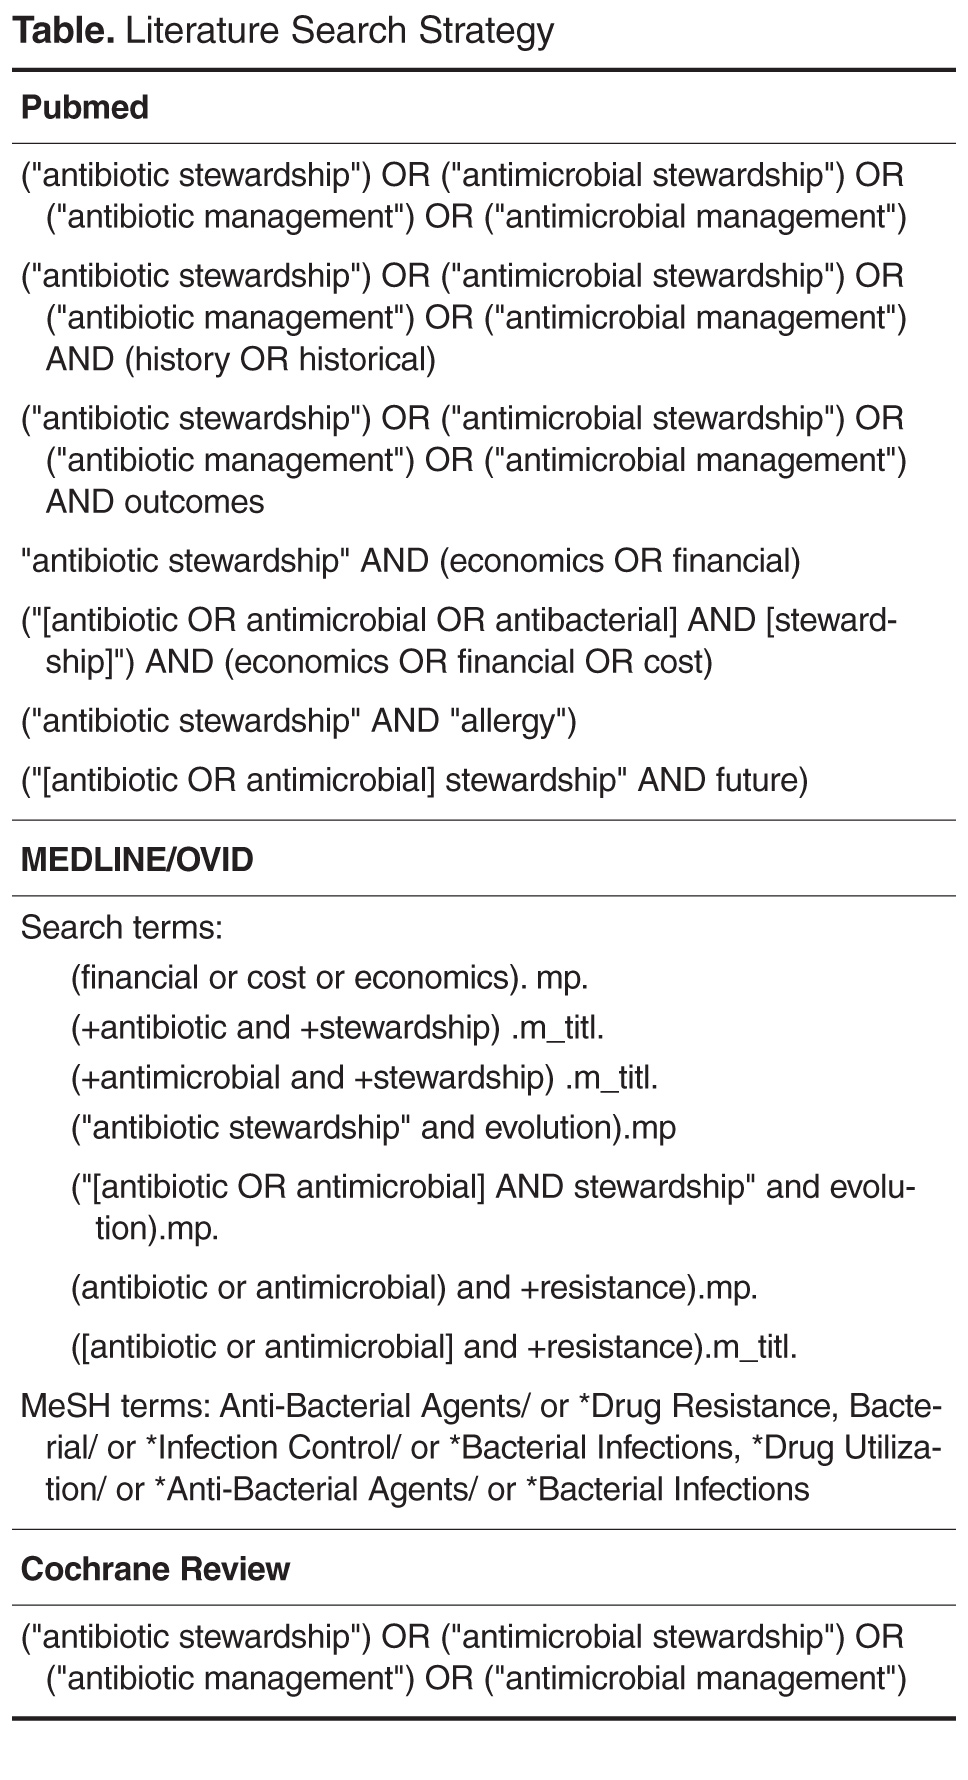
Results
Antimicrobial Usage
The most widely studied aspect of ASPs in the current review was the effect of ASP interventions on antimicrobial consumption and use. Three systematic reviews [22–24] showed improved antibiotic prescribing practices and reduced consumption rates overall, as did several studies inside and outside the intensive care unit (ICU) [25–31].One study found an insignificant declining usage trend [32]. An important underlying facet of this observation is that even as total antibiotic consumption decreases, certain antibiotic and antibiotic class consumption may increase. This is evident in several studies, which showed that as aminoglycoside, carbapenem, and β-lactam-β-lactamase inhibitor use increased, clindamycin (1 case), glycopeptide, fluoroquinolone, and macrolide use decreased [27,28,30]. A potential confounding factor relating to decreased glycopeptide use in Bevilacqua et al [30] was that there was an epidemic of glycopeptide-resistant enterococci during the study period, potentially causing prescribers to naturally avoid it. In any case, since the aim of ASPs is to encourage a more judicious usage of antimicrobials, the observed decreases in consumption of those restricted medications is intuitive. These observations about antimicrobial consumption related to ASPs are relevant because they putatively drive improvements in clinical outcomes, especially those related to reduced adverse events associated with these agents, such as the risk of C. difficile infection with certain drugs (eg, fluoroquinolones, clindamycin, and broad-spectrum antibiotics) and prolonged antibiotic usage [33–35]. There is evidence that these benefits are not limited to antibiotics but extend to antifungal agents and possibly antivirals [22,27,36].
Utilization, Mortality, and Infection Rates
ASPs typically intend to improve patient-focused clinical parameters such as hospital LOS, hospital readmissions, mortality, and incidence of infections acquired secondary to antibiotic usage during a hospital stay, especially C. difficile infection. Most of the reviewed evidence indicates that there has been no significant LOS benefit due to stewardship interventions [24–26,32,37], and one meta-analysis noted that when overall hospital LOS was significantly reduced, ICU-specific LOS was not [22]. Generally, there was also not a significant change in hospital readmission rates [24,26,32]. However, 2 retrospective observational studies found mixed results for both LOS and readmission rates relative to ASP interventions; while both noted a significantly reduced LOS, one study [38] showed an all-cause readmission benefit in a fairly healthy patient population (but no benefit for readmissions due to the specific infections of interest), and the another [29] showed a benefit for readmissions due to infections but an increased rate of readmissions in the intervention group overall. In this latter study, hospitalizations within the previous 3 months were significantly higher at baseline for the intervention group (55% vs. 46%, P = 0.042), suggesting sicker patients and possibly providing an explanation for this unique observation. Even so, a meta-analysis of 5 studies found a significantly elevated risk of readmission associated with ASP interventions (RR 1.26, 95% CI 1.02–1.57; P = 0.03); the authors noted that non–infection-related readmissions accounted for 61% of readmissions, but this was not significantly different between intervention and non-intervention arms [37].
With regard to mortality, most studies found no significant reductions related to stewardship interventions [22,24,26,29,32]. In a prospective randomized controlled trial, all reported deaths (7/160, 4.4%) were in the ASP intervention arm, but these were attributed to the severities of infection or an underlying, chronic disease [25]. One meta-analysis, however, found that there were significant mortality reductions related to stewardship guidelines for empirical antibiotic treatment (OR 0.65, 95% CI 0.54–0.80, P < 0.001; I2 = 65%) and to de-escalation of therapy based on culture results (RR 0.44, 95% CI 0.30–0.66, P < 0.001; I2 = 59%), based on 40 and 25 studies, respectively [39]; but both results exhibited substantial heterogeneity (defined as I2 = 50%–90% [40]) among the relevant studies. Another meta-analysis found that there was no significant change in mortality related to stewardship interventions intending to improve antibiotic appropriateness (RR 0.92, 95% CI 0.69–1.2, P = 0.56; I2 = 72%) or intending to reduce excessive prescribing (RR 0.92, 95% CI 0.81–1.06, P = 0.25; I2 = 0%), but that there was a significant mortality benefit associated with interventions aimed at increasing guideline compliance for pneumonia diagnoses (RR 0.89, 95% CI 0.82–0.97, P = 0.005; I2 = 0%) [37]. In the case of Schuts et al [39], search criteria specifically sought studies that assessed clinical outcomes (eg, mortality), whereas the search of Davey et al [37] focused on studies whose aim was to improve antibiotic prescribing, with a main comparison being between restrictive and persuasive interventions; while the difference may seem subtle, the body of data compiled from these searches may characterize the ASP effect of mortality differently. No significant evidence was found to suggest that reduced antimicrobial consumption increases mortality.
Improving the use of antimicrobial agents should limit collateral damage associated with their use (eg, damage to normal flora and increased resistance), and ideally infections should be better managed. As previously mentioned, one of the concerns with antibiotic usage (particularly fluoroquinolones, macrolides, and broad-spectrum agents) is that collateral damage could lead to increased rates of C. difficile infection. One meta-analysis showed no significant reduction in the rate of C. difficile infection (as well as overall infection rate) relative to ASPs [22]; however, this finding was based on only 3 of the 26 studies analyzed, and only 1 of those 3 studies utilized restrictions for flouroquinolones and cephalosporins. An interrupted time series (ITS) study similarly found no significant reduction in C. difficile infection rate [32]; however, this study was conducted in a hospital with low baseline antibiotic prescribing (it was ranked second-to-last in terms of antibiotic usage among its peer institutions), inherently limiting the risk of C. difficile infection among patients in the pre-ASP setting. In contrast to these findings, a meta-analysis specifically designed to assess the incidence of C. difficile infection relative to stewardship programs found a significantly reduced risk of infection based on 16 studies (RR 0.48, 95% CI 0.38–0.62, P < 0.001; I2 = 76%) [41], and the systematic review conducted by Filice et al [24] found a significant benefit with regard to the C. difficile infection rate in 4 of 6 studies. These results are consistent with those presented as evidence for the impact of stewardship on C. difficile infection by the CDC [42]. Aside from C. difficile infection, one retrospective observational study found that the 14-day reinfection rate (ie, reinfection with the same infection at the same anatomical location) was significantly reduced following stewardship intervention (0% vs. 10%, P = 0.009) [29]. This finding, combined with the C. difficile infection examples, provide evidence for better infection management of ASPs.
While the general trend seems to suggest mixed or no significant benefit for several clinical outcomes, it is important to note that variation in outcomes could be due to differences in the types of ASP interventions and intervention study periods across differing programs. Davey et al [37] found variation in prescribing outcomes based on whether restrictive (ie, restrict prescriber freedom with antimicrobials) or persuasive (ie, suggest changes to prescriber) interventions were used, and on the timeframe in which they were used. At one month into an ASP, restrictive interventions resulted in better prescribing practices relative to persuasive interventions based on 27 studies (effect size 32.0%, 95% CI 2.5%–61.4%), but by 6 months the 2 were not statistically different (effect size 10.1%, 95% CI –47.5% to 66.0%). At 12 and 24 months, persuasive interventions demonstrated greater effects on prescribing outcomes, but these were not significant. These findings provide evidence that different study timeframes can impact ASP practices differently (and these already vary widely in the literature). Considering the variety of ASP interventions employed across the different studies, these factors almost certainly impact the reported antimicrobial consumption rates and outcomes to different degrees as a consequence. A high degree of heterogeneity among an analyzed dataset could itself be the reason for net non-significance within single systematic reviews and meta-analyses.
Resistance
Another goal of ASPs is the prevention of antimicrobial resistance, an area where the evidence generally suggests benefit associated with ASP interventions. Resistance rates to common troublesome organisms, such as methicillin-resistant S. aureus (MRSA), imipenem-resistant P. aeruginosa, and extended-spectrum β-lactamase (ESBL)–producing Klebsiella spp were significantly reduced in a meta-analysis; ESBL-producing E. coli infections were not, however [22]. An ITS study found significantly reduced MRSA resistance, as well as reduced Pseudomonal resistance to imipenem-cilastin and levofloxacin (all P < 0.001), but no significant changes with respect to piperacillin/tazobactam, cefepime, or amikacin resistance [32]. This study also noted increased E. coli resistance to levofloxacin and ceftriaxone (both P < 0.001). No significant changes in resistance were noted for vancomycin-resistant enterococci. It may be a reasonable expectation that decreasing inappropriate antimicrobial use may decrease long-term antimicrobial resistance; but as most studies only span a few years, only the minute changes in resistance are understood [23]. Longer duration studies are needed to better understand resistance outcomes.
Of note is a phenomenon known as the “squeezing the balloon” effect. This can be associated with ASPs, potentially resulting in paradoxically increased resistance [43]. That is, when usage restrictions are placed on certain antibiotics, the use of other non-restricted antibiotics may increase, possibly leading to increased resistance of those non-restricted antibiotics [22] (“constraining one end [of a balloon] causes the other end to bulge … limiting the use of one class of compounds may be counteracted by corresponding changes in prescribing and drug resistance that are even more ominous” [43]). Karanika et al [22] took this phenomonen into consideration, and assessed restricted and non-restricted antimicrobial consumption separately. They found a reduction in consumption for both restricted and non-restricted antibiotics, which included “high potential resistance” antibiotics, specifically carbapenems and glycopeptides. In the study conducted by Cairns et al [28], a similar effect was observed; while the use of other classes of antibiotics decreased (eg, cephalosporins and aminoglycosides), the use of β–lactam–β–lactamase inhibitor combinations actually increased by 48% (change in use: +48.2% [95% CI 21.8%–47.9%]). Hohn et al [26] noted an increased usage rate of carbapenems, even though several other classes of antibiotics had reduced usage. Unfortunately, neither study reported resistance rates, so the impact of these findings is unknown. Finally, Jenkins et al [32] assessed trends in antimicrobial use as changes in rates of consumption. Among the various antibiotics assessed in this study, the rate of flouroquinolone use decreased both before and after the intervention period, although the rate of decreased usage slowed post-ASP (the change in rate post-ASP was +2.2% [95% CI 1.4%–3.1%], P < 0.001). They observed a small (but significant) increase in resistance of E. coli to levofloxacin pre- vs. post-intervention (11.0% vs. 13.9%, P < 0.001); in contrast, a significant decrease in resistance of P. aeruginosa was observed (30.5% vs. 21.4%, P < 0.001). While these examples help illustrate the concept of changes in antibiotic usage patterns associated with an ASP, at best they approximate the “squeezing the balloon” effect since these studies present data for antibiotics that were either restricted or for which restriction was not clearly specified. The “squeezing the balloon” effect is most relevant for the unintended, potentially increased usage of non-restricted drugs secondary to ASP restrictions. Higher resistance rates among certain drug classes observed in the context of this effect would constitute a drawback to an ASP program.
Adverse Effects
Reduced toxicities and adverse effects are expected with reduced usage of antimicrobials. The systematic review conducted by Filice et al [24] examined the incidence of adverse effects related to antibiotic usage, and their findings suggest, at the least, that stewardship programs generally do not cause harm, as only 2 of the studies they examined reported adverse events. Following stewardship interventions, 5.5% of the patients deteriorated; and of those, the large majority (75%) deteriorated due to progression of oncological malignancies. To further illustrate the effect of stewardship interventions on toxicities and side effects of antimicrobials, Schuts et al demonstrated that the risk of nephrotoxicity while on antimicrobial therapy was reduced based on 14 studies of moderate heterogeneity as a result of an ASP (OR 0.46, 95% CI 0.28–0.77, P = 0.003; I2 = 34%) [39,44]. It is intuitive that reduced drug exposure results in reduced adverse effects, as such these results are expected.
Economic Outcomes
Although the focus of ASPs is often to improve clinical outcomes, economic outcomes are an important component of ASPs; these programs bring associated economic value that should be highlighted and further detailed [22,45,46]. Since clinical outcomes are often the main objective of ASPs, most available studies have been clinical effect studies (rather than economic analyses), in which economic assessments are often a secondary consideration, if included.
As a result, cost evaluations are conducted on direct cost reductions whereas indirect cost reductions are often not critically evaluated. ASPs reduce hospital expenditures by limiting hospital-acquired infections and the associated medical costs where they are effective at decreasing consumption of antimicrobials [22,45], and by reducing antibiotic misuse, iatrogenic infections, and the rates of antibiotic-resistant organisms [47]. In one retrospective observational study, annual costs of antibiotics dropped by 33% with re-implementation of an ASP, mirrored by an overall decrease in antibiotic consumption of about 10%, over the course of the intervention study period [30]. Of note is that at 1 year post-ASP re-implementation, antibiotic consumption actually increased (by 5.4%); however, because antibiotic usage had changed to more appropriate and cost-effective therapies, cost expenditures associated with antibiotics were still reduced by 13% for that year relative to pre-ASP re-implementation. Aside from economic evaluations centered on consumption rates, there is the potential to further evaluate economic benefits associated with stewardship when looking at other outcomes, including hospital LOS [22], as well as indirect costs such as morbidity and mortality, societal, and operational costs [46]. Currently, these detailed analyses are lacking. In conjunction with more standardized clinical metrics, these assessments are needed to better delineate the full cost effectiveness of ASPs.
Evidence Summary
The evidence for inpatient ASP effectiveness is promising but mixed. Much of the evidence is low-level, based on observational studies that are retrospective in nature, and systematic reviews and meta-analyses are based on these types of studies. Studies have been conducted over a range of years, and the duration of intervention periods often vary widely between studies; it is difficult to capture and account for all of the infection, prescribing, and drug availability patterns (as well as the intervention differences or new drug approvals) throughout these time periods. To complicate the matter, both the quality of data as well as the quality of the ASPs are highly variable.
As such, the findings across pooled studies for ASPs are hard to amalgamate and draw concrete conclusions from. This difficulty is due to the inherent heterogeneity when comparing smaller individual studies in systematic reviews and meta-analyses. Currently, there are numerous ways to implement an ASP, but there is not a standardized system of specific interventions or metrics. Until we can directly compare similar ASPs and interventions among various institutions, it will be challenging to generalize positive benefits from systematic reviews and meta-analyses. Currently, the CDC is involved in a new initiative in which data from various hospitals are compiled to create a surveillance database [48]. Although this is a step in the right direction for standardized metrics for stewardship, for the current review the lack of standard metrics leads to conflicting results of heterogenic studies, making it difficult to show clear benefits in clinical outcomes.
Despite the vast array of ASPs, their differences, and a range of clinical measures—many with conflicting evidence—there is a noticeable trend toward a more prudent use of antimicrobials. Based on the review of available evidence, inpatient ASPs improve patient care and preserve an important health care resource—antibiotics. As has been presented, this is demonstrated by the alterations in consumption of these agents, has ramifications for secondary outcomes such as reduced instances of C. difficile infections, resistance, and adverse effects, and overall translates into better patient care and reduced costs. But while we can conclude that the direct interventions of stewardship in reducing and restricting antibiotic use have been effective, we cannot clearly state the overall magnitude of benefit, the effectiveness of various ASP structures and components on clinical outcomes (such as LOS, mortality, etc.), and the cost savings due to the heterogeneity of the available evidence.
Future Directions
Moving forward, the future of ASPs encompasses several potential developments. First and foremost, as technological advancements continue to develop, there is a need to integrate and utilize developments in information technology (IT). Baysari et al conducted a review on the value of utilizing IT interventions, focusing mainly on decision support (stand-alone or as a component of other hospital procedures), approval, and surveillance systems [49]. There was benefit associated with these IT interventions in terms of the improvement in the appropriate use of antimicrobials (RR 1.49, 95% CI, 1.07–2.08, P < 0.05; I2 = 93%), but there was no demonstrated benefit in terms of patient mortality or hospital LOS. Aside from this study, broad evidence is still lacking to support the use of IT systems in ASPs because meaningful comparisons amongst the interventions have not been made due to widespread variability in study design and outcome measures. However, it is generally agreed that ASPs must integrate with IT systems as the widespread use of technology within the healthcare field continues to grow. Evidence needs to be provided in the form of higher quality studies centered on similar outcomes to show appropriate approaches for ASPs to leverage IT systems. At a minimum, the integration of IT into ASPs should not hinder clinical outcomes. An important consideration is the variation in practice settings where antibiotic stewardship is to be implemented; eg, a small community hospital will be less equipped to incorporate and support technological tools compared to a large tertiary teaching hospital. Therefore, any antibiotic stewardship IT intervention must be customized to meet local needs, prescriber behaviors, minimize barriers to implementation, and utilize available resources.
Another area of focus for future ASPs is the use of rapid diagnostics. Currently, when patients present with signs and symptoms of an infection, an empiric antimicrobial regimen is started that is then de-escalated as necessary; rapid testing will help to initiate appropriate therapy more quickly and increase antimicrobial effectiveness. Rapid tests range from rapid polymerase chain reaction (PCR)-based screening [50], to Verigene gram-positive blood culture (BC-GP) tests [51], next-generation sequencing methods, and matrix assisted laser desorption/ionization time-of-flight mass spectrometry (MALDI-TOF MS) [52]. Rapid diagnostic tools should be viewed as aides to assist ASPs in decreasing antibiotic consumption and improving patient outcomes; these various tools have been shown to improve clinical outcomes when integrated into ASPs, but offer little value addressing the goals of ASPs when used outside of stewardship programs and their sensitive timeframes [53].
In terms of future ASP expansion, stewardship implementation can become more unified and broad in scope. ASPs should expand to include antifungal interventions, an area which is showing progress [36]. ASPs can also be implemented in new areas throughout the hospital (eg, pediatrics and emergency room), as well as areas outside of the hospital setting, including long-term care facilities, dialysis centers, and other institutions [54–56]. A prospective randomized control study was conducted in 30 nursing homes to evaluate the use of a novel resident antimicrobial management plan (RAMP) for improved use of antimicrobials [57]. This study found that the RAMP had no associated adverse effects and suggests that ASP is an important tool in nursing homes. In addition, the general outpatient and pediatric settings show promise for ASPs [56,58,59], but more research is needed to support expansion and to identify how ASP interventions should be applied in these various practice settings. The antimicrobial stewardship interventions that will be utilized will need to be carefully delineated to consider the scale, underlying need, and potential challenges in those settings.
While the future of antibiotic stewardship is unclear, there is certainty that it will continue to develop in both scope and depth to encompass new areas of focus, new settings to improve outcomes, and employ new tools to refine approaches. An important first step for the continued development of ASPs is alignment and standardization, since without alignment it will continue to be difficult to compare outcomes. This issue is currently being addressed by a number of different organizations. With current support from the Joint Commission, the CDC, as well as the President’s Council of Advisors on Science and Technology (PCAST) [8], regulatory requirements for ASPs are well underway, and these drivers will appropriately position ASPs for further advancements. By reducing variability amongst ASPs and delineating implementation of ASPs, there can be a clear identification of both economic and clinical benefits associated with specific interventions.
Corresponding author: Luigi Brunetti, PharmD, MPH, Rutgers, The State University of New Jersey, 160 Frelinghuysen Rd., Piscataway, NJ 08854, [email protected].
Financial disclosures: None.
1. Barlam TF, Cosgrove SE, Abbo AM, et al. Implementing an antimicrobial stewardship program: guidelines by the Infectious Diseases Society of America and the Society of Healthcare Epidemiology of America. Clin Infect Dis 2016;62:e51–77.
2. Hughes D. Selection and evolution of resistance to antimicrobial drugs. IUBMB Life 2014;66:521–9.
3. World Health Organzation. The evolving threat of antimicrobial resistance – options for action. Geneva: WHO Press; 2012.
4. Gould IM, Bal AM. New antibiotic agents in the pipeline and how they can help overcome microbial resistance. Virulence 2013;4:185–91.
5. Davies J, Davies D. Origins and evolution of antibiotic resistance. Microbiol Mol Biol Rev 2010;74:417–33.
6. Owens RC Jr. Antimicrobial stewardship: concepts and strategies in the 21st century. Diagn Microbiol Infect Dis 2008;61:110–28.
7. Antibiotic resistance threats in the United States, 2013 [Internet]. Centers for Disease Control and Prevention. Available at www.cdc.gov/drugresistance/pdf/ar-threats-2013-508.pdf.
8. Nathan C, Cars O. Antibiotic resistance – problems, progress, prospects. N Engl J Med 2014;371:1761–3.
9. McGoldrick, M. Antimicrobial stewardship. Home Healthc Nurse 2014;32:559–60.
10. Ruedy J. A method of determining patterns of use of antibacterial drugs. Can Med Assoc J 1966;95:807–12.
11. Briceland LL, Nightingdale CH, Quintiliani R, et al. Antibiotic streamlining from combination therapy to monotherapy utilizing an interdisciplinary approach. Arch Inter Med 1988;148:2019–22.
12. McGowan JE Jr, Gerding DN. Does antibiotic restriction prevent resistance? New Horiz 1996;4: 370–6.
13. Cappelletty D, Jacobs D. Evaluating the impact of a pharmacist’s absence from an antimicrobial stewardship team. Am J Health Syst Pharm 2013;70:1065–69.
14. Shales DM, Gerding DN, John JF Jr, et al. Society for Healthcare Epidemiology of America and Infectious Diseases Society of America Joint Committee on the prevention of antimicrobial resistance: guidelines for the prevention of antimicrobial resistance in hospitals. Infect Control Hosp Epidemiol 1997;18:275–91.
15. Dellit TH, Owens RC, McGowan JE, et al. Infectious Diseases Society of America and the Society for Healthcare Epidemiology of America guidelines for developing an institutional program to enhance antimicrobial stewardship. Clin Infect Dis 2007;44:159–77.
16. Policy statement on antimicrobial stewardship by the Society for Healthcare Epidemiology of America (SHEA), the Infectious Diseases Society of America (IDSA), and the Pediatric Infectious Diseases Society (PIDS). Infect Ctrl Hosp Epidemiol 2012;33:322–7.
17. The Joint Commission. Approved: New antimicrobial stewardship standard. Joint Commission Perspectives 2016;36:1–8.
18. Pollack LA, Srinivasan A. Core elements of hospital antibiotic stewardship programs from the Centers for Disease Control and Prevention. Clin Infect Dis 2014;59(Suppl 3):S97–100.
19. Moody J. Infection preventionists have a role in accelerating progress toward preventing the emergence and cross-transmission of MDROs. Prevention Strategist 2012 Summer:52–6.
20. Spellberg B, Bartlett JG, Gilbert DN. The future of antibiotics and resistance. N Engl J Med 2013;368:299–302.
21. Olans RN, Olans RD, Demaria A. The critical role of the staff nurse in antimicrobial stewardship--unrecognized, but already there. Clin Infect Dis 2016;62:84–9.
22. Karanika S, Paudel S, Grigoras C, et al. Systematic review and meta-analysis of clinical and economic outcomes from the implementation of hospital-based antimicrobial stewardship programs. Antimicrob Agents Chemother 2016;60:4840–52.
23. Wagner B, Filice GA, Drekonja D, et al. Antimicrobial stewardship programs in inpatient hospital settings: a systematic review. Infect Control Hosp Epidemiol 2014;35:1209–28.
24. Filice G, Drekonja D, Greer N, et al. Antimicrobial stewardship programs in inpatient settings: a systematic review. VA-ESP Project #09-009; 2013.
25. Cairns KA, Doyle JS, Trevillyan JM, et al. The impact of a multidisciplinary antimicrobial stewardship team on the timeliness of antimicrobial therapy in patients with positive blood cultures: a randomized controlled trial. J Antimicrob Chemother 2016;71:3276–83.
26. Hohn A, Heising B, Hertel S, et al. Antibiotic consumption after implementation of a procalcitonin-guided antimicrobial stewardship programme in surgical patients admitted to an intensive care unit: a retrospective before-and-after analysis. Infection 2015;43:405–12.
27. Singh S, Zhang YZ, Chalkley S, et al. A three-point time series study of antibiotic usage on an intensive care unit, following an antibiotic stewardship programme, after an outbreak of multi-resistant Acinetobacter baumannii. Eur J Clin Microbiol Infect Dis 2015;34:1893–900.
28. Cairns KA, Jenney AW, Abbott IJ, et al. Prescribing trends before and after implementation of an antimicrobial stewardship program. Med J Aust 2013;198:262–6.
29. Liew YX, Lee W, Loh JC, et al. Impact of an antimicrobial stewardship programme on patient safety in Singapore General Hospital. Int J Antimicrob Agents 2012;40:55–60.
30. Bevilacqua S, Demoré B, Boschetti E, et al. 15 years of antibiotic stewardship policy in the Nancy Teaching Hospital. Med Mal Infect 2011;41:532–9.
31. Danaher PJ, Milazzo NA, Kerr KJ, et al. The antibiotic support team--a successful educational approach to antibiotic stewardship. Mil Med 2009;174:201–5.
32. Jenkins TC, Knepper BC, Shihadeh K, et al. Long-term outcomes of an antimicrobial stewardship program implemented in a hospital with low baseline antibiotic use. Infect Control Hosp Epidemiol 2015;36:664–72.
33. Brown KA, Khanafer N, Daneman N, Fisman DN. Meta-analysis of antibiotics and the risk of community-associated Clostridium difficile infection. Antimicrob Agents Chemother 2013;57:2326–32.
34. Deshpande A, Pasupuleti V, Thota P, et al. Community-associated Clostridium difficile infection and antibiotics: a meta-analysis. J Antimicrob Chemother 2013;68:1951–61.
35. Slimings C, Riley TV. Antibiotics and hospital-acquired Clostridium difficile infection: update of systematic review and meta-analysis. J Antimicrob Chemother 2014;69:881–91.
36. Antworth A, Collins CD, Kunapuli A, et al. Impact of an antimicrobial stewardship program comprehensive care bundle on management of candidemia. Pharmacotherapy 2013;33:137–43.
37. Davey P, Brown E, Charani E, et al. Interventions to improve antibiotic prescribing practices for hospital inpatients. Cochrane Database Syst Rev 2013;4:CD003543.
38. Pasquale TR, Trienski TL, Olexia DE, et al. Impact of an antimicrobial stewardship program on patients with acute bacterial skin and skin structure infections. Am J Health Syst Pharm 2014;71:1136–9.
39. Schuts EC, Hulscher ME, Mouton JW, et al. Current evidence on hospital antimicrobial stewardship objectives: a systematic review and meta-analysis. Lancet Infect Dis 2016;16:847–56.
40. Higgins JPT, Green S, editors. Identifying and measuring heterogeneity. Cochrane Handbook for Systematic Reviews of Interventions, version 5.1.0. [Internet]. The Cochrane Collaboration, March 2011. Available at http://handbook.cochrane.org/chapter_9/9_5_2_identifying_and_measuring_heterogeneity.htm.
41. Feazel LM, Malhotra A, Perencevich EN, et al. Effect of antibiotic stewardship programmes on Clostridium difficile incidence: a systematic review and meta-analysis. J Antimicrob Chemother 2014;69:1748–54.
42. Impact of antibiotic stewardship programs on Clostridium difficile (C. diff) infections [Internet]. Centers for Disease Control and Prevention. [Updated 2016 May 13; cited 2016 Oct 11]. Available at www.cdc.gov/getsmart/healthcare/evidence/asp-int-cdiff.html.
43. Burke JP. Antibiotic resistance – squeezing the balloon? JAMA 1998;280:1270–1.
44. This nephrotoxicity result is corrected from the originally published result; communicated by Jan M Prins on behalf of the authors for reference [39]. Prins, JM (Department of Internal Medicine, Division of Infectious Diseases, Academic Medical Centre, Amsterdam, Netherlands). Email communication with Joseph Eckart (Pharmacy Practice & Administration, Ernest Mario School of Pharmacy, Rutgers University, Piscataway, NJ). 2016 Oct 9.
45. Coulter S, Merollini K, Roberts JA, et al. The need for cost-effectiveness analyses of antimicrobial stewardship programmes: a structured review. Int J Antimicrob Agents 2015;46:140–9.
46. Dik J, Vemer P, Friedrich A, et al. Financial evaluations of antibiotic stewardship programs—a systematic review. Frontiers Microbiol 2015;6:317.
47. Campbell KA, Stein S, Looze C, Bosco JA. Antibiotic stewardship in orthopaedic surgery: principles and practice. J Am Acad Orthop Surg 2014;22:772–81.
48. Surveillance for antimicrobial use and antimicrobial resistance options, 2015 [Internet]. Centers for Disease Control and Prevention. [Updated 2016 May 3; cited 2016 Nov 22]. Available at www.cdc.gov/nhsn/acute-care-hospital/aur/index.html.
49. Baysari MT, Lehnbom EC, Li L, Hargreaves A, et al. The effectiveness of information technology to improve antimicrobial prescribing in hospitals: a systematic review and meta-analysis. Int J Med Inform. 2016;92:15-34.
50. Bauer KA, West JE, Balada-llasat JM, et al. An antimicrobial stewardship program’s impact with rapid polymerase chain reaction methicillin-resistant Staphylococcus aureus/S. aureus blood culture test in patients with S. aureus bacteremia. Clin Infect Dis 2010;51:1074–80.
51. Sango A, Mccarter YS, Johnson D, et al. Stewardship approach for optimizing antimicrobial therapy through use of a rapid microarray assay on blood cultures positive for Enterococcus species. J Clin Microbiol 2013;51:4008–11.
52. Perez KK, Olsen RJ, Musick WL, et al. Integrating rapid diagnostics and antimicrobial stewardship improves outcomes in patients with antibiotic-resistant Gram-negative bacteremia. J Infect 2014;69:216–25.
53. Bauer KA, Perez KK, Forrest GN, Goff DA. Review of rapid diagnostic tests used by antimicrobial stewardship programs. Clin Infect Dis 2014;59 Suppl 3:S134–145.
54. Dyar OJ, Pagani L, Pulcini C. Strategies and challenges of antimicrobial stewardship in long-term care facilities. Clin Microbiol Infect 2015;21:10–9.
55. D’Agata EM. Antimicrobial use and stewardship programs among dialysis centers. Semin Dial 2013;26:457–64.
56. Smith MJ, Gerber JS, Hersh AL. Inpatient antimicrobial stewardship in pediatrics: a systematic review. J Pediatric Infect Dis Soc 2015;4:e127–135.
57. Fleet E, Gopal Rao G, Patel B, et al. Impact of implementation of a novel antimicrobial stewardship tool on antibiotic use in nursing homes: a prospective cluster randomized control pilot study. J Antimicrob Chemother 2014;69:2265–73.
58. Drekonja DM, Filice GA, Greer N, et al. Antimicrobial stewardship in outpatient settings: a systematic review. Infect Control Hosp Epidemiol 2015;36:142–52.
59. Drekonja D, Filice G, Greer N, et al. Antimicrobial stewardship programs in outpatient settings: a systematic review. VA-ESP Project #09-009; 2014.
60. Zhang YZ, Singh S. Antibiotic stewardship programmes in intensive care units: why, how, and where are they leading us. World J Crit Care Med 2015;4:13–28. (referenced in online Table)
From the Ernest Mario School of Pharmacy, Rutgers, The State University of New Jersey, Piscataway, NJ.
Abstract
- Objective: To review the evidence evaluating inpatient antimicrobial stewardship programs (ASPs) with a focus on clinical and economic outcomes.
- Methods: Pubmed/MEDLINE and the Cochrane Database of Systematic Reviews were used to identify systematic reviews, meta-analyses, randomized controlled trials, and other relevant literature evaluating the clinical and economic impact of ASP interventions.
- Results: A total of 5 meta-analyses, 3 systematic reviews, and 10 clinical studies (2 randomized controlled, 5 observational, and 3 quasi-experimental studies) were identified for analysis. ASPs were associated with a reduction in antimicrobial consumption and use. However, due to the heterogeneity of outcomes measured among studies, the effectiveness of ASPs varied with the measures used. There are data supporting the cost savings associated with ASPs, but these studies are more sparse. Most of the available evidence supporting ASPs is of low quality, and intervention strategies vary widely among available studies.
- Conclusion: Much of the evidence reviewed supports the assertion that ASPs result in a more judicious use of antimicrobials and lead to better patient care in the inpatient setting. While clinical outcomes vary between programs, there are ubiquitous positive benefits associated with ASPs in terms of antimicrobial consumption, C. difficile infection rates, and resistance, with few adverse effects. To date, economic outcomes have been difficult to uniformly quantify, but there are data supporting the economic benefits of ASPs. As the number of ASPs continues to grow, it is imperative that standardized metrics are considered in order to accurately measure the benefits of these essential programs.
Key words: Antimicrobial stewardship; antimicrobial consumption; resistance.
Antimicrobial resistance is a public health concern that has been escalating over the years and is now identified as a global crisis [1–3]. This is partly due to the widespread use of the same antibiotics that have existed for decades, combined with a lack of sufficient novel antibiotic discovery and development [4]. Bacteria that are resistant to our last-line-of-defense medications have recently emerged, and these resistant organisms may spread to treatment-naive patients [5]. Multidrug-resistant organisms are often found, treated, and likely originate within the hospital practice setting, where antimicrobials can be prescribed by any licensed provider [6]. Upwards of 50% of antibiotics administered are unnecessary and contribute to the problem of increasing resistance [7]. The seriousness of this situation is increasingly apparent; in 2014 the World Health Organization (WHO), President Obama, and Prime Minister Cameron issued statements urging solutions to the resistance crisis [8].
While the urgency of the situation is recognized today, efforts aimed at a more judicious use of antibiotics to curb resistance began as early as the 1960s and led to the first antimicrobial stewardship programs (ASPs) [9–11]. ASPs have since been defined as “coordinated interventions designed to improve and measure the appropriate use of antimicrobial agents by promoting the selection of the optimal antimicrobial drug regimen including dosing, duration of therapy, and route of administration” [1]. The primary objectives of these types of programs are to avoid or reduce adverse events (eg, Clostridium difficile infection) and resistance driven by a shift in minimum inhibitory concentrations (MICs) and to reverse the unnecessary economic burden caused by the inappropriate prescribing of these agents [1].
This article examines the evidence evaluating the reported effectiveness of inpatient ASPs, examining both clinical and economic outcomes. In addition, we touch on ASP history, current status, and future directions in light of current trends. While ASPs are expanding into the outpatient and nursing home settings, we will limit our review here to the inpatient setting.
Historical Background
Modern antibiotics date back to the late 1930s when penicillin and sulfonamides were introduced to the medical market, and resistance to these drug classes was reported just a few years after their introduction. The same bacterial resistance mechanisms that neutralized their efficacy then exist today, and these mechanisms continue to confer resistance among those classes [5].
While “stewardship” was not described as such until the late 1990s [12], institutions have historically been proactive in creating standards around antimicrobial utilization to encourage judicious use of these agents. The earliest form of tracking antibiotic use was in the form of paper charts as “antibiotic logs” [9] and “punch cards” [10] in the 1960s. The idea of a team approach to stewardship dates back to the 1970s, with the example of Hartford Hospital in Hartford, Connecticut, which employed an antimicrobial standards model run by an infectious disease (ID) physician and clinical pharmacists [11]. In 1977, the Infectious Diseases Society of America (IDSA) released a statement that clinical pharmacists may have a substantial impact on patient care, including in ID, contributing to the idea that a team of physicians collaborating with pharmacists presents the best way to combat inappropriate medication use. Pharmacist involvement has since been shown to restrict broad overutilized antimicrobial agents and reduce the rate of C. difficile infection by a significant amount [13].
In 1997 the IDSA and the Society for Healthcare Epidemiology of America (SHEA) published guidelines to assist in the prevention of the growing issue of resistance, mentioning the importance of antimicrobial stewardship [14]. A decade later they released joint guidelines for ASP implementation [15], and the Pediatric Infectious Disease Society (PIDS) joined them in 2012 to publish a joint statement acknowledging and endorsing stewardship [16]. In 2014, the Centers of Disease Control and Prevention (CDC) recommended that every hospital should have an ASP. As of 1 January 2017, the Joint Commission requires an ASP as a standard for accreditation at hospitals, critical access hospitals, and nursing care [17]. Guidelines for implementation of an ASP are currently available through the IDSA and SHEA [1,16].
ASP Interventions
There are 2 main strategies that ASPs have to combat inappropriate antimicrobial use, and each has its own set of systematic interventions. These strategies are referred to as “prospective audit with intervention and feedback” and “prior authorization” [6]. Although most ASPs will incorporate these main strategies, each institution typically creates its own strategies and regulations independently.
Prospective audit with intervention and feedback describes the process of providing recommendations after reviewing utilization and trends of antimicrobial use. This is sometimes referred to as the “back-end” intervention, in which decisions are made after antibiotics have been administered. Interventions that are commonly used under this strategy include discontinuation of antibiotics due to culture data, de-escalation to drugs with narrower spectra, IV to oral conversions, and cessation of surgical prophylaxis [6].
Prior authorization, also referred to as a “front-end” intervention, is the process of approving medications before they are used. Interventions include a restricted formulary for antimicrobials that can be managed through a paging system or a built-in computer restriction program, as well as other guidelines and protocols for dosing and duration of therapy. Restrictions typically focus on broad spectrum antibiotics as well as the more costly drugs on formularies. These solutions reduce the need for manual intervention as technology makes it possible to create automated restriction-based services that prevent inappropriate prescribing [6].
Aside from these main techniques, other strategies are taken to achieve the goal of attaining optimal clinical outcomes while limiting further antimicrobial resistance and adverse effects. Different clinical settings have different needs, and ASPs are customized to each setting’s resources, prescribing habits, and other local specificities [1]. These differences present difficulty with interpreting diverse datasets, but certain themes arise in the literature: commonly assessed clinical outcomes of inpatient ASPs include hospital length of stay (LOS) and readmission, reinfection, mortality, and resistance rates. These outcomes are putatively driven by the more prudent use of antimicrobials, particularly by decreased rates of antimicrobial consumption.
ASP Team Members
While ASPs may differ between institutions, the staff members involved are typically the same, and leadership is always an important aspect of a program. The CDC recommends that ASP leadership consist of a program leader (an ID physician) and a pharmacy leader, who co-lead the team [18]. In addition, the Joint Commission recommends that the multidisciplinary team should include an infection preventionist (ie, infection control and hospital epidemiologist) and practitioner [17]; these specialists have a role in prevention, awareness, and policy [19]. The integration of infection control with stewardship yields the best results [15], as infection control aims to prevent antibiotic use altogether, while stewardship increases the quality of antibiotic regimens that are being prescribed [20].
It is also beneficial to incorporate a microbiologist as an integral part of the team, responsible for performing and interpreting laboratory data (ie, cultures). Nurses should be integrated into ASPs due to the overlap of their routine activities with ASP interventions [21]; other clinicians (regardless of their infectious disease clinical background), quality control, information technology, and environmental services should all collaborate in the hospital-wide systems related to the program where appropriate [18].
Evidence Review
Results
Antimicrobial Usage
The most widely studied aspect of ASPs in the current review was the effect of ASP interventions on antimicrobial consumption and use. Three systematic reviews [22–24] showed improved antibiotic prescribing practices and reduced consumption rates overall, as did several studies inside and outside the intensive care unit (ICU) [25–31].One study found an insignificant declining usage trend [32]. An important underlying facet of this observation is that even as total antibiotic consumption decreases, certain antibiotic and antibiotic class consumption may increase. This is evident in several studies, which showed that as aminoglycoside, carbapenem, and β-lactam-β-lactamase inhibitor use increased, clindamycin (1 case), glycopeptide, fluoroquinolone, and macrolide use decreased [27,28,30]. A potential confounding factor relating to decreased glycopeptide use in Bevilacqua et al [30] was that there was an epidemic of glycopeptide-resistant enterococci during the study period, potentially causing prescribers to naturally avoid it. In any case, since the aim of ASPs is to encourage a more judicious usage of antimicrobials, the observed decreases in consumption of those restricted medications is intuitive. These observations about antimicrobial consumption related to ASPs are relevant because they putatively drive improvements in clinical outcomes, especially those related to reduced adverse events associated with these agents, such as the risk of C. difficile infection with certain drugs (eg, fluoroquinolones, clindamycin, and broad-spectrum antibiotics) and prolonged antibiotic usage [33–35]. There is evidence that these benefits are not limited to antibiotics but extend to antifungal agents and possibly antivirals [22,27,36].
Utilization, Mortality, and Infection Rates
ASPs typically intend to improve patient-focused clinical parameters such as hospital LOS, hospital readmissions, mortality, and incidence of infections acquired secondary to antibiotic usage during a hospital stay, especially C. difficile infection. Most of the reviewed evidence indicates that there has been no significant LOS benefit due to stewardship interventions [24–26,32,37], and one meta-analysis noted that when overall hospital LOS was significantly reduced, ICU-specific LOS was not [22]. Generally, there was also not a significant change in hospital readmission rates [24,26,32]. However, 2 retrospective observational studies found mixed results for both LOS and readmission rates relative to ASP interventions; while both noted a significantly reduced LOS, one study [38] showed an all-cause readmission benefit in a fairly healthy patient population (but no benefit for readmissions due to the specific infections of interest), and the another [29] showed a benefit for readmissions due to infections but an increased rate of readmissions in the intervention group overall. In this latter study, hospitalizations within the previous 3 months were significantly higher at baseline for the intervention group (55% vs. 46%, P = 0.042), suggesting sicker patients and possibly providing an explanation for this unique observation. Even so, a meta-analysis of 5 studies found a significantly elevated risk of readmission associated with ASP interventions (RR 1.26, 95% CI 1.02–1.57; P = 0.03); the authors noted that non–infection-related readmissions accounted for 61% of readmissions, but this was not significantly different between intervention and non-intervention arms [37].
With regard to mortality, most studies found no significant reductions related to stewardship interventions [22,24,26,29,32]. In a prospective randomized controlled trial, all reported deaths (7/160, 4.4%) were in the ASP intervention arm, but these were attributed to the severities of infection or an underlying, chronic disease [25]. One meta-analysis, however, found that there were significant mortality reductions related to stewardship guidelines for empirical antibiotic treatment (OR 0.65, 95% CI 0.54–0.80, P < 0.001; I2 = 65%) and to de-escalation of therapy based on culture results (RR 0.44, 95% CI 0.30–0.66, P < 0.001; I2 = 59%), based on 40 and 25 studies, respectively [39]; but both results exhibited substantial heterogeneity (defined as I2 = 50%–90% [40]) among the relevant studies. Another meta-analysis found that there was no significant change in mortality related to stewardship interventions intending to improve antibiotic appropriateness (RR 0.92, 95% CI 0.69–1.2, P = 0.56; I2 = 72%) or intending to reduce excessive prescribing (RR 0.92, 95% CI 0.81–1.06, P = 0.25; I2 = 0%), but that there was a significant mortality benefit associated with interventions aimed at increasing guideline compliance for pneumonia diagnoses (RR 0.89, 95% CI 0.82–0.97, P = 0.005; I2 = 0%) [37]. In the case of Schuts et al [39], search criteria specifically sought studies that assessed clinical outcomes (eg, mortality), whereas the search of Davey et al [37] focused on studies whose aim was to improve antibiotic prescribing, with a main comparison being between restrictive and persuasive interventions; while the difference may seem subtle, the body of data compiled from these searches may characterize the ASP effect of mortality differently. No significant evidence was found to suggest that reduced antimicrobial consumption increases mortality.
Improving the use of antimicrobial agents should limit collateral damage associated with their use (eg, damage to normal flora and increased resistance), and ideally infections should be better managed. As previously mentioned, one of the concerns with antibiotic usage (particularly fluoroquinolones, macrolides, and broad-spectrum agents) is that collateral damage could lead to increased rates of C. difficile infection. One meta-analysis showed no significant reduction in the rate of C. difficile infection (as well as overall infection rate) relative to ASPs [22]; however, this finding was based on only 3 of the 26 studies analyzed, and only 1 of those 3 studies utilized restrictions for flouroquinolones and cephalosporins. An interrupted time series (ITS) study similarly found no significant reduction in C. difficile infection rate [32]; however, this study was conducted in a hospital with low baseline antibiotic prescribing (it was ranked second-to-last in terms of antibiotic usage among its peer institutions), inherently limiting the risk of C. difficile infection among patients in the pre-ASP setting. In contrast to these findings, a meta-analysis specifically designed to assess the incidence of C. difficile infection relative to stewardship programs found a significantly reduced risk of infection based on 16 studies (RR 0.48, 95% CI 0.38–0.62, P < 0.001; I2 = 76%) [41], and the systematic review conducted by Filice et al [24] found a significant benefit with regard to the C. difficile infection rate in 4 of 6 studies. These results are consistent with those presented as evidence for the impact of stewardship on C. difficile infection by the CDC [42]. Aside from C. difficile infection, one retrospective observational study found that the 14-day reinfection rate (ie, reinfection with the same infection at the same anatomical location) was significantly reduced following stewardship intervention (0% vs. 10%, P = 0.009) [29]. This finding, combined with the C. difficile infection examples, provide evidence for better infection management of ASPs.
While the general trend seems to suggest mixed or no significant benefit for several clinical outcomes, it is important to note that variation in outcomes could be due to differences in the types of ASP interventions and intervention study periods across differing programs. Davey et al [37] found variation in prescribing outcomes based on whether restrictive (ie, restrict prescriber freedom with antimicrobials) or persuasive (ie, suggest changes to prescriber) interventions were used, and on the timeframe in which they were used. At one month into an ASP, restrictive interventions resulted in better prescribing practices relative to persuasive interventions based on 27 studies (effect size 32.0%, 95% CI 2.5%–61.4%), but by 6 months the 2 were not statistically different (effect size 10.1%, 95% CI –47.5% to 66.0%). At 12 and 24 months, persuasive interventions demonstrated greater effects on prescribing outcomes, but these were not significant. These findings provide evidence that different study timeframes can impact ASP practices differently (and these already vary widely in the literature). Considering the variety of ASP interventions employed across the different studies, these factors almost certainly impact the reported antimicrobial consumption rates and outcomes to different degrees as a consequence. A high degree of heterogeneity among an analyzed dataset could itself be the reason for net non-significance within single systematic reviews and meta-analyses.
Resistance
Another goal of ASPs is the prevention of antimicrobial resistance, an area where the evidence generally suggests benefit associated with ASP interventions. Resistance rates to common troublesome organisms, such as methicillin-resistant S. aureus (MRSA), imipenem-resistant P. aeruginosa, and extended-spectrum β-lactamase (ESBL)–producing Klebsiella spp were significantly reduced in a meta-analysis; ESBL-producing E. coli infections were not, however [22]. An ITS study found significantly reduced MRSA resistance, as well as reduced Pseudomonal resistance to imipenem-cilastin and levofloxacin (all P < 0.001), but no significant changes with respect to piperacillin/tazobactam, cefepime, or amikacin resistance [32]. This study also noted increased E. coli resistance to levofloxacin and ceftriaxone (both P < 0.001). No significant changes in resistance were noted for vancomycin-resistant enterococci. It may be a reasonable expectation that decreasing inappropriate antimicrobial use may decrease long-term antimicrobial resistance; but as most studies only span a few years, only the minute changes in resistance are understood [23]. Longer duration studies are needed to better understand resistance outcomes.
Of note is a phenomenon known as the “squeezing the balloon” effect. This can be associated with ASPs, potentially resulting in paradoxically increased resistance [43]. That is, when usage restrictions are placed on certain antibiotics, the use of other non-restricted antibiotics may increase, possibly leading to increased resistance of those non-restricted antibiotics [22] (“constraining one end [of a balloon] causes the other end to bulge … limiting the use of one class of compounds may be counteracted by corresponding changes in prescribing and drug resistance that are even more ominous” [43]). Karanika et al [22] took this phenomonen into consideration, and assessed restricted and non-restricted antimicrobial consumption separately. They found a reduction in consumption for both restricted and non-restricted antibiotics, which included “high potential resistance” antibiotics, specifically carbapenems and glycopeptides. In the study conducted by Cairns et al [28], a similar effect was observed; while the use of other classes of antibiotics decreased (eg, cephalosporins and aminoglycosides), the use of β–lactam–β–lactamase inhibitor combinations actually increased by 48% (change in use: +48.2% [95% CI 21.8%–47.9%]). Hohn et al [26] noted an increased usage rate of carbapenems, even though several other classes of antibiotics had reduced usage. Unfortunately, neither study reported resistance rates, so the impact of these findings is unknown. Finally, Jenkins et al [32] assessed trends in antimicrobial use as changes in rates of consumption. Among the various antibiotics assessed in this study, the rate of flouroquinolone use decreased both before and after the intervention period, although the rate of decreased usage slowed post-ASP (the change in rate post-ASP was +2.2% [95% CI 1.4%–3.1%], P < 0.001). They observed a small (but significant) increase in resistance of E. coli to levofloxacin pre- vs. post-intervention (11.0% vs. 13.9%, P < 0.001); in contrast, a significant decrease in resistance of P. aeruginosa was observed (30.5% vs. 21.4%, P < 0.001). While these examples help illustrate the concept of changes in antibiotic usage patterns associated with an ASP, at best they approximate the “squeezing the balloon” effect since these studies present data for antibiotics that were either restricted or for which restriction was not clearly specified. The “squeezing the balloon” effect is most relevant for the unintended, potentially increased usage of non-restricted drugs secondary to ASP restrictions. Higher resistance rates among certain drug classes observed in the context of this effect would constitute a drawback to an ASP program.
Adverse Effects
Reduced toxicities and adverse effects are expected with reduced usage of antimicrobials. The systematic review conducted by Filice et al [24] examined the incidence of adverse effects related to antibiotic usage, and their findings suggest, at the least, that stewardship programs generally do not cause harm, as only 2 of the studies they examined reported adverse events. Following stewardship interventions, 5.5% of the patients deteriorated; and of those, the large majority (75%) deteriorated due to progression of oncological malignancies. To further illustrate the effect of stewardship interventions on toxicities and side effects of antimicrobials, Schuts et al demonstrated that the risk of nephrotoxicity while on antimicrobial therapy was reduced based on 14 studies of moderate heterogeneity as a result of an ASP (OR 0.46, 95% CI 0.28–0.77, P = 0.003; I2 = 34%) [39,44]. It is intuitive that reduced drug exposure results in reduced adverse effects, as such these results are expected.
Economic Outcomes
Although the focus of ASPs is often to improve clinical outcomes, economic outcomes are an important component of ASPs; these programs bring associated economic value that should be highlighted and further detailed [22,45,46]. Since clinical outcomes are often the main objective of ASPs, most available studies have been clinical effect studies (rather than economic analyses), in which economic assessments are often a secondary consideration, if included.
As a result, cost evaluations are conducted on direct cost reductions whereas indirect cost reductions are often not critically evaluated. ASPs reduce hospital expenditures by limiting hospital-acquired infections and the associated medical costs where they are effective at decreasing consumption of antimicrobials [22,45], and by reducing antibiotic misuse, iatrogenic infections, and the rates of antibiotic-resistant organisms [47]. In one retrospective observational study, annual costs of antibiotics dropped by 33% with re-implementation of an ASP, mirrored by an overall decrease in antibiotic consumption of about 10%, over the course of the intervention study period [30]. Of note is that at 1 year post-ASP re-implementation, antibiotic consumption actually increased (by 5.4%); however, because antibiotic usage had changed to more appropriate and cost-effective therapies, cost expenditures associated with antibiotics were still reduced by 13% for that year relative to pre-ASP re-implementation. Aside from economic evaluations centered on consumption rates, there is the potential to further evaluate economic benefits associated with stewardship when looking at other outcomes, including hospital LOS [22], as well as indirect costs such as morbidity and mortality, societal, and operational costs [46]. Currently, these detailed analyses are lacking. In conjunction with more standardized clinical metrics, these assessments are needed to better delineate the full cost effectiveness of ASPs.
Evidence Summary
The evidence for inpatient ASP effectiveness is promising but mixed. Much of the evidence is low-level, based on observational studies that are retrospective in nature, and systematic reviews and meta-analyses are based on these types of studies. Studies have been conducted over a range of years, and the duration of intervention periods often vary widely between studies; it is difficult to capture and account for all of the infection, prescribing, and drug availability patterns (as well as the intervention differences or new drug approvals) throughout these time periods. To complicate the matter, both the quality of data as well as the quality of the ASPs are highly variable.
As such, the findings across pooled studies for ASPs are hard to amalgamate and draw concrete conclusions from. This difficulty is due to the inherent heterogeneity when comparing smaller individual studies in systematic reviews and meta-analyses. Currently, there are numerous ways to implement an ASP, but there is not a standardized system of specific interventions or metrics. Until we can directly compare similar ASPs and interventions among various institutions, it will be challenging to generalize positive benefits from systematic reviews and meta-analyses. Currently, the CDC is involved in a new initiative in which data from various hospitals are compiled to create a surveillance database [48]. Although this is a step in the right direction for standardized metrics for stewardship, for the current review the lack of standard metrics leads to conflicting results of heterogenic studies, making it difficult to show clear benefits in clinical outcomes.
Despite the vast array of ASPs, their differences, and a range of clinical measures—many with conflicting evidence—there is a noticeable trend toward a more prudent use of antimicrobials. Based on the review of available evidence, inpatient ASPs improve patient care and preserve an important health care resource—antibiotics. As has been presented, this is demonstrated by the alterations in consumption of these agents, has ramifications for secondary outcomes such as reduced instances of C. difficile infections, resistance, and adverse effects, and overall translates into better patient care and reduced costs. But while we can conclude that the direct interventions of stewardship in reducing and restricting antibiotic use have been effective, we cannot clearly state the overall magnitude of benefit, the effectiveness of various ASP structures and components on clinical outcomes (such as LOS, mortality, etc.), and the cost savings due to the heterogeneity of the available evidence.
Future Directions
Moving forward, the future of ASPs encompasses several potential developments. First and foremost, as technological advancements continue to develop, there is a need to integrate and utilize developments in information technology (IT). Baysari et al conducted a review on the value of utilizing IT interventions, focusing mainly on decision support (stand-alone or as a component of other hospital procedures), approval, and surveillance systems [49]. There was benefit associated with these IT interventions in terms of the improvement in the appropriate use of antimicrobials (RR 1.49, 95% CI, 1.07–2.08, P < 0.05; I2 = 93%), but there was no demonstrated benefit in terms of patient mortality or hospital LOS. Aside from this study, broad evidence is still lacking to support the use of IT systems in ASPs because meaningful comparisons amongst the interventions have not been made due to widespread variability in study design and outcome measures. However, it is generally agreed that ASPs must integrate with IT systems as the widespread use of technology within the healthcare field continues to grow. Evidence needs to be provided in the form of higher quality studies centered on similar outcomes to show appropriate approaches for ASPs to leverage IT systems. At a minimum, the integration of IT into ASPs should not hinder clinical outcomes. An important consideration is the variation in practice settings where antibiotic stewardship is to be implemented; eg, a small community hospital will be less equipped to incorporate and support technological tools compared to a large tertiary teaching hospital. Therefore, any antibiotic stewardship IT intervention must be customized to meet local needs, prescriber behaviors, minimize barriers to implementation, and utilize available resources.
Another area of focus for future ASPs is the use of rapid diagnostics. Currently, when patients present with signs and symptoms of an infection, an empiric antimicrobial regimen is started that is then de-escalated as necessary; rapid testing will help to initiate appropriate therapy more quickly and increase antimicrobial effectiveness. Rapid tests range from rapid polymerase chain reaction (PCR)-based screening [50], to Verigene gram-positive blood culture (BC-GP) tests [51], next-generation sequencing methods, and matrix assisted laser desorption/ionization time-of-flight mass spectrometry (MALDI-TOF MS) [52]. Rapid diagnostic tools should be viewed as aides to assist ASPs in decreasing antibiotic consumption and improving patient outcomes; these various tools have been shown to improve clinical outcomes when integrated into ASPs, but offer little value addressing the goals of ASPs when used outside of stewardship programs and their sensitive timeframes [53].
In terms of future ASP expansion, stewardship implementation can become more unified and broad in scope. ASPs should expand to include antifungal interventions, an area which is showing progress [36]. ASPs can also be implemented in new areas throughout the hospital (eg, pediatrics and emergency room), as well as areas outside of the hospital setting, including long-term care facilities, dialysis centers, and other institutions [54–56]. A prospective randomized control study was conducted in 30 nursing homes to evaluate the use of a novel resident antimicrobial management plan (RAMP) for improved use of antimicrobials [57]. This study found that the RAMP had no associated adverse effects and suggests that ASP is an important tool in nursing homes. In addition, the general outpatient and pediatric settings show promise for ASPs [56,58,59], but more research is needed to support expansion and to identify how ASP interventions should be applied in these various practice settings. The antimicrobial stewardship interventions that will be utilized will need to be carefully delineated to consider the scale, underlying need, and potential challenges in those settings.
While the future of antibiotic stewardship is unclear, there is certainty that it will continue to develop in both scope and depth to encompass new areas of focus, new settings to improve outcomes, and employ new tools to refine approaches. An important first step for the continued development of ASPs is alignment and standardization, since without alignment it will continue to be difficult to compare outcomes. This issue is currently being addressed by a number of different organizations. With current support from the Joint Commission, the CDC, as well as the President’s Council of Advisors on Science and Technology (PCAST) [8], regulatory requirements for ASPs are well underway, and these drivers will appropriately position ASPs for further advancements. By reducing variability amongst ASPs and delineating implementation of ASPs, there can be a clear identification of both economic and clinical benefits associated with specific interventions.
Corresponding author: Luigi Brunetti, PharmD, MPH, Rutgers, The State University of New Jersey, 160 Frelinghuysen Rd., Piscataway, NJ 08854, [email protected].
Financial disclosures: None.
1. Barlam TF, Cosgrove SE, Abbo AM, et al. Implementing an antimicrobial stewardship program: guidelines by the Infectious Diseases Society of America and the Society of Healthcare Epidemiology of America. Clin Infect Dis 2016;62:e51–77.
2. Hughes D. Selection and evolution of resistance to antimicrobial drugs. IUBMB Life 2014;66:521–9.
3. World Health Organzation. The evolving threat of antimicrobial resistance – options for action. Geneva: WHO Press; 2012.
4. Gould IM, Bal AM. New antibiotic agents in the pipeline and how they can help overcome microbial resistance. Virulence 2013;4:185–91.
5. Davies J, Davies D. Origins and evolution of antibiotic resistance. Microbiol Mol Biol Rev 2010;74:417–33.
6. Owens RC Jr. Antimicrobial stewardship: concepts and strategies in the 21st century. Diagn Microbiol Infect Dis 2008;61:110–28.
7. Antibiotic resistance threats in the United States, 2013 [Internet]. Centers for Disease Control and Prevention. Available at www.cdc.gov/drugresistance/pdf/ar-threats-2013-508.pdf.
8. Nathan C, Cars O. Antibiotic resistance – problems, progress, prospects. N Engl J Med 2014;371:1761–3.
9. McGoldrick, M. Antimicrobial stewardship. Home Healthc Nurse 2014;32:559–60.
10. Ruedy J. A method of determining patterns of use of antibacterial drugs. Can Med Assoc J 1966;95:807–12.
11. Briceland LL, Nightingdale CH, Quintiliani R, et al. Antibiotic streamlining from combination therapy to monotherapy utilizing an interdisciplinary approach. Arch Inter Med 1988;148:2019–22.
12. McGowan JE Jr, Gerding DN. Does antibiotic restriction prevent resistance? New Horiz 1996;4: 370–6.
13. Cappelletty D, Jacobs D. Evaluating the impact of a pharmacist’s absence from an antimicrobial stewardship team. Am J Health Syst Pharm 2013;70:1065–69.
14. Shales DM, Gerding DN, John JF Jr, et al. Society for Healthcare Epidemiology of America and Infectious Diseases Society of America Joint Committee on the prevention of antimicrobial resistance: guidelines for the prevention of antimicrobial resistance in hospitals. Infect Control Hosp Epidemiol 1997;18:275–91.
15. Dellit TH, Owens RC, McGowan JE, et al. Infectious Diseases Society of America and the Society for Healthcare Epidemiology of America guidelines for developing an institutional program to enhance antimicrobial stewardship. Clin Infect Dis 2007;44:159–77.
16. Policy statement on antimicrobial stewardship by the Society for Healthcare Epidemiology of America (SHEA), the Infectious Diseases Society of America (IDSA), and the Pediatric Infectious Diseases Society (PIDS). Infect Ctrl Hosp Epidemiol 2012;33:322–7.
17. The Joint Commission. Approved: New antimicrobial stewardship standard. Joint Commission Perspectives 2016;36:1–8.
18. Pollack LA, Srinivasan A. Core elements of hospital antibiotic stewardship programs from the Centers for Disease Control and Prevention. Clin Infect Dis 2014;59(Suppl 3):S97–100.
19. Moody J. Infection preventionists have a role in accelerating progress toward preventing the emergence and cross-transmission of MDROs. Prevention Strategist 2012 Summer:52–6.
20. Spellberg B, Bartlett JG, Gilbert DN. The future of antibiotics and resistance. N Engl J Med 2013;368:299–302.
21. Olans RN, Olans RD, Demaria A. The critical role of the staff nurse in antimicrobial stewardship--unrecognized, but already there. Clin Infect Dis 2016;62:84–9.
22. Karanika S, Paudel S, Grigoras C, et al. Systematic review and meta-analysis of clinical and economic outcomes from the implementation of hospital-based antimicrobial stewardship programs. Antimicrob Agents Chemother 2016;60:4840–52.
23. Wagner B, Filice GA, Drekonja D, et al. Antimicrobial stewardship programs in inpatient hospital settings: a systematic review. Infect Control Hosp Epidemiol 2014;35:1209–28.
24. Filice G, Drekonja D, Greer N, et al. Antimicrobial stewardship programs in inpatient settings: a systematic review. VA-ESP Project #09-009; 2013.
25. Cairns KA, Doyle JS, Trevillyan JM, et al. The impact of a multidisciplinary antimicrobial stewardship team on the timeliness of antimicrobial therapy in patients with positive blood cultures: a randomized controlled trial. J Antimicrob Chemother 2016;71:3276–83.
26. Hohn A, Heising B, Hertel S, et al. Antibiotic consumption after implementation of a procalcitonin-guided antimicrobial stewardship programme in surgical patients admitted to an intensive care unit: a retrospective before-and-after analysis. Infection 2015;43:405–12.
27. Singh S, Zhang YZ, Chalkley S, et al. A three-point time series study of antibiotic usage on an intensive care unit, following an antibiotic stewardship programme, after an outbreak of multi-resistant Acinetobacter baumannii. Eur J Clin Microbiol Infect Dis 2015;34:1893–900.
28. Cairns KA, Jenney AW, Abbott IJ, et al. Prescribing trends before and after implementation of an antimicrobial stewardship program. Med J Aust 2013;198:262–6.
29. Liew YX, Lee W, Loh JC, et al. Impact of an antimicrobial stewardship programme on patient safety in Singapore General Hospital. Int J Antimicrob Agents 2012;40:55–60.
30. Bevilacqua S, Demoré B, Boschetti E, et al. 15 years of antibiotic stewardship policy in the Nancy Teaching Hospital. Med Mal Infect 2011;41:532–9.
31. Danaher PJ, Milazzo NA, Kerr KJ, et al. The antibiotic support team--a successful educational approach to antibiotic stewardship. Mil Med 2009;174:201–5.
32. Jenkins TC, Knepper BC, Shihadeh K, et al. Long-term outcomes of an antimicrobial stewardship program implemented in a hospital with low baseline antibiotic use. Infect Control Hosp Epidemiol 2015;36:664–72.
33. Brown KA, Khanafer N, Daneman N, Fisman DN. Meta-analysis of antibiotics and the risk of community-associated Clostridium difficile infection. Antimicrob Agents Chemother 2013;57:2326–32.
34. Deshpande A, Pasupuleti V, Thota P, et al. Community-associated Clostridium difficile infection and antibiotics: a meta-analysis. J Antimicrob Chemother 2013;68:1951–61.
35. Slimings C, Riley TV. Antibiotics and hospital-acquired Clostridium difficile infection: update of systematic review and meta-analysis. J Antimicrob Chemother 2014;69:881–91.
36. Antworth A, Collins CD, Kunapuli A, et al. Impact of an antimicrobial stewardship program comprehensive care bundle on management of candidemia. Pharmacotherapy 2013;33:137–43.
37. Davey P, Brown E, Charani E, et al. Interventions to improve antibiotic prescribing practices for hospital inpatients. Cochrane Database Syst Rev 2013;4:CD003543.
38. Pasquale TR, Trienski TL, Olexia DE, et al. Impact of an antimicrobial stewardship program on patients with acute bacterial skin and skin structure infections. Am J Health Syst Pharm 2014;71:1136–9.
39. Schuts EC, Hulscher ME, Mouton JW, et al. Current evidence on hospital antimicrobial stewardship objectives: a systematic review and meta-analysis. Lancet Infect Dis 2016;16:847–56.
40. Higgins JPT, Green S, editors. Identifying and measuring heterogeneity. Cochrane Handbook for Systematic Reviews of Interventions, version 5.1.0. [Internet]. The Cochrane Collaboration, March 2011. Available at http://handbook.cochrane.org/chapter_9/9_5_2_identifying_and_measuring_heterogeneity.htm.
41. Feazel LM, Malhotra A, Perencevich EN, et al. Effect of antibiotic stewardship programmes on Clostridium difficile incidence: a systematic review and meta-analysis. J Antimicrob Chemother 2014;69:1748–54.
42. Impact of antibiotic stewardship programs on Clostridium difficile (C. diff) infections [Internet]. Centers for Disease Control and Prevention. [Updated 2016 May 13; cited 2016 Oct 11]. Available at www.cdc.gov/getsmart/healthcare/evidence/asp-int-cdiff.html.
43. Burke JP. Antibiotic resistance – squeezing the balloon? JAMA 1998;280:1270–1.
44. This nephrotoxicity result is corrected from the originally published result; communicated by Jan M Prins on behalf of the authors for reference [39]. Prins, JM (Department of Internal Medicine, Division of Infectious Diseases, Academic Medical Centre, Amsterdam, Netherlands). Email communication with Joseph Eckart (Pharmacy Practice & Administration, Ernest Mario School of Pharmacy, Rutgers University, Piscataway, NJ). 2016 Oct 9.
45. Coulter S, Merollini K, Roberts JA, et al. The need for cost-effectiveness analyses of antimicrobial stewardship programmes: a structured review. Int J Antimicrob Agents 2015;46:140–9.
46. Dik J, Vemer P, Friedrich A, et al. Financial evaluations of antibiotic stewardship programs—a systematic review. Frontiers Microbiol 2015;6:317.
47. Campbell KA, Stein S, Looze C, Bosco JA. Antibiotic stewardship in orthopaedic surgery: principles and practice. J Am Acad Orthop Surg 2014;22:772–81.
48. Surveillance for antimicrobial use and antimicrobial resistance options, 2015 [Internet]. Centers for Disease Control and Prevention. [Updated 2016 May 3; cited 2016 Nov 22]. Available at www.cdc.gov/nhsn/acute-care-hospital/aur/index.html.
49. Baysari MT, Lehnbom EC, Li L, Hargreaves A, et al. The effectiveness of information technology to improve antimicrobial prescribing in hospitals: a systematic review and meta-analysis. Int J Med Inform. 2016;92:15-34.
50. Bauer KA, West JE, Balada-llasat JM, et al. An antimicrobial stewardship program’s impact with rapid polymerase chain reaction methicillin-resistant Staphylococcus aureus/S. aureus blood culture test in patients with S. aureus bacteremia. Clin Infect Dis 2010;51:1074–80.
51. Sango A, Mccarter YS, Johnson D, et al. Stewardship approach for optimizing antimicrobial therapy through use of a rapid microarray assay on blood cultures positive for Enterococcus species. J Clin Microbiol 2013;51:4008–11.
52. Perez KK, Olsen RJ, Musick WL, et al. Integrating rapid diagnostics and antimicrobial stewardship improves outcomes in patients with antibiotic-resistant Gram-negative bacteremia. J Infect 2014;69:216–25.
53. Bauer KA, Perez KK, Forrest GN, Goff DA. Review of rapid diagnostic tests used by antimicrobial stewardship programs. Clin Infect Dis 2014;59 Suppl 3:S134–145.
54. Dyar OJ, Pagani L, Pulcini C. Strategies and challenges of antimicrobial stewardship in long-term care facilities. Clin Microbiol Infect 2015;21:10–9.
55. D’Agata EM. Antimicrobial use and stewardship programs among dialysis centers. Semin Dial 2013;26:457–64.
56. Smith MJ, Gerber JS, Hersh AL. Inpatient antimicrobial stewardship in pediatrics: a systematic review. J Pediatric Infect Dis Soc 2015;4:e127–135.
57. Fleet E, Gopal Rao G, Patel B, et al. Impact of implementation of a novel antimicrobial stewardship tool on antibiotic use in nursing homes: a prospective cluster randomized control pilot study. J Antimicrob Chemother 2014;69:2265–73.
58. Drekonja DM, Filice GA, Greer N, et al. Antimicrobial stewardship in outpatient settings: a systematic review. Infect Control Hosp Epidemiol 2015;36:142–52.
59. Drekonja D, Filice G, Greer N, et al. Antimicrobial stewardship programs in outpatient settings: a systematic review. VA-ESP Project #09-009; 2014.
60. Zhang YZ, Singh S. Antibiotic stewardship programmes in intensive care units: why, how, and where are they leading us. World J Crit Care Med 2015;4:13–28. (referenced in online Table)
Determinants of Suboptimal Migraine Diagnosis and Treatment in the Primary Care Setting
From the Mayo Clinic, Scottsdale, AZ.
Abstract
- Objective: To review the impact of migraine and explore the barriers to optimal migraine diagnosis and treatment.
- Methods: Review of the literature.
- Results: Several factors may play a role in the inadequate care of migraine patients, including issues related to poor access to care, diagnostic insight, misdiagnosis, adherence to treatment, and management of comorbidities. Both patient and physician factors play an important role and many be modifiable.
- Conclusions: A focus on education of both patients and physicians is of paramount importance to improve the care provided to migraine patients. Patient evaluations should be multisystemic and include addressing comorbid conditions as well as a discussion about appropriate use of prevention and avoidance of medication overuse.
Key words: migraine; triptans; medication overuse headache; medication adherence; primary care.
Migraine is a common, debilitating condition that is a significant source of reduced productivity and increased disability [1]. According to the latest government statistics, 14.2% of US adults have reported having migraine or severe headaches in the previous 3 months, with an overall age-adjusted 3-month prevalence of 19.1% in females and 9.0% in males [2]. In a self-administered headache questionnaire mailed to 120,000 representative US households, the 1-year period prevalence for migraine was 11.7% (17.1% in women and 5.6% in men). Prevalence peaked in middle life and was lower in adolescents and those older than age 60 years [3]. Migraine is an important cause of reduced health-related quality of life and has a very high economic burden [4]. This effect is even more marked in those with chronic migraine, who are even more likely to have professional and social absenteeism and experience more severe disability [4].
Migraine and headache are a common reason for primary care physician (PCP) visits. Some estimates suggest that as many as 10% of primary care consultations are due to headache [5]. Approximately 75% of all patients complaining of headache in primary care will eventually be diagnosed with migraine [6]. Of these, as many as 1% to 5% will have chronic migraine [6].
Despite the high frequency and social and economic impact of migraine, migraine is underrecognized and undertreated. A survey of US households revealed that only 13% of migraineurs were currently using a preventive thrapy while 43.3% had never used one [3]. This is despite the fact that 32.4% met expert criteria for consideration of a preventive medication [3]. The reasons for underrecognition and undertreatment are multifactorial and include both patient and physician factors.
Physician Factors
Although migraine and headache are a leading cause of physicians visits, most physicians have had little formal training in headache. In the United States, medical students spend an average of 1 hour of preclinical and 2 hours of clinical education in headache [7]. Furthermore, primary care physicians receive little formal training in headache during residency [8]. In addition to the lack of formal training, there is also a lack of substantial clinic time available to fully evaluate and treat a new headache patient in the primary care setting [8]. Headache consultations can often be timely and detail-driven in order to determine the correct diagnosis and treatment [9].
Misdiagnosis
Evidence suggests that misdiagnosis plays a large role in the suboptimal management of migraineurs. Studies have shown that as many as 59.7% of migraineurs were not given a diagnosis of migraine by their primary care provider [10]. Common mistaken diagnoses include tension-type headache [11], “sinus headache” [12], cervical pain syndrome or cervicogenic headache [13], and “stress headache” [14].
The reasons for these misdiagnoses is not certain. It may be that the patient and practitioner assume that location of the pain is suggestive of the cause [13]. This is even though more than half of those with migraine have associated neck pain [15]. A recent study suggests that 60% of migraineurs who self-reported a diagnosis of cervical pain have been subsequently diagnosed with cervicalgia by a physician [13]. If patients endorse stress as a precipitant or the presence of cervical pain, they are more likely to obtain a diagnosis other than migraine. The presence of aura in association with the headache appears to be protective against misdiagnosis [13].
Similarly, patients are often given a diagnosis of “sinus headache.” This diagnosis is often made without radiologic evidence of sinusitis and even in those with a more typical migraine headache [16]. In one survey, 40% of patients meeting criteria for migraine were given this diagnosis. Many of these patients did have nasal symptoms or facial pain without clear evidence or rhinosinusitis, and in some cases these symptoms would respond to migraine treatments [16]. This is a particularly important misdiagnosis to highlight, as attributing symptoms to sinus disease may lead to unnecessary consultations and even sinus instrumentation.
In addition to common misdiagnoses, many PCPs are unfamiliar with the “red flags” that may indicate a secondary headache disorder and are also unfamiliar with appropriate use of neuroimaging in headache patients [17].
Misuse of As-Needed Medications
Studies have suggested that a large proportion of PCPs will prescribe nonspecific analgesics for migraine rather than migraine-specific medications [18]. These treatments may include NSAIDs, acetaminophen, barbiturates, and even opiates. This appears to be the pattern even for those with severe attacks [18], suggesting that migraine-specific medications such as triptans may be underused in the primary care setting. Postulated reasons for this pattern include lack of physician knowledge regarding the specific recommendations for managing migraine, the cost of medications, as well as lack of insurance coverage for these medications [19]. Misuse of as-needed medications can lead to medication overuse headache (MOH), which is an underrecognized problem in the primary care setting [20]. In a survey of PCPs in Boston, only 54% of PCPs were aware that barbiturates can cause MOH and only 34% were aware that opiates can cause MOH [17]. The same survey revealed that approximately 20% of PCPs had never made the diagnosis of MOH [17].
Underuse of Preventive Medications
As many as 40% of migraineurs need preventive therapy, but only approximately 13% are currently receiving it [3]. Additionally, the average time from diagnosis of migraine to instituting preventive treatment is 4.3 years, and often there is only a single preventive medication trial if one is instituted [21]. The reasons for this appear to be complex. The physician factors contributing to the underuse of preventive medications include inadequate education, discomfort and inadequate time for assessments. Only 27.8% of surveyed PCPs were aware of the American Academy of Neurology guidelines for prescribing preventive medications [17].
There may be an underestimate of the disability experienced by migraineurs, which can explain some of the underuse of preventive medications. While many PCPs endorse inquiring about headache-related disability, many do not used validated scales such as the Migraine Disability Assessment Score (MIDAS) or the Headache Impact Test (HIT) [17]. In addition, patients often underreport their headache days and report only their severe exacerbations unless clearly asked about a daily headache [22]. This may be part of the reason why only 20% of migraineurs who meet criteria for chronic migraine are diagnosed as such and why preventatives may not be offered [23].
After preventatives are started, less than 25% of patients will be adherent to oral migraine preventive agents at 1 year [24]. Common reasons for discontinuing preventives include adverse effects and perceived inefficacy [22]. Preventive medications may need a 6- to 8-week trial before efficacy is determined, but in practice medications may be stopped before this threshold is reached. Inadequate follow-up and lack of detail with regard to medication trials may result in the perception of an intractable patient prematurely. It has been suggested that a systematic approach to documenting and choosing preventive agents is helpful in the treatment of migraine [25], although this is not always practical in the primary care setting.
Another contributor to underuse of effective prophylaxis is related to access. Treatment with onabotulinumtoxin A, an efficacious prophylactic treatment approved for select chronic migraine patients [26], will usually require referral to a headache specialist, which is not always available to PCPs in a timely manner [7].
Nonpharmacologic Approaches
Effective nonpharmacologic treatment modalities for migraine, such as cognitive-behavioral therapy and biofeedback [27], are not commonly recommended by PCPs [17]. Instead, there appears to be more focus on avoidance of triggers and referral to non–evidence-based resources, such as special diets and massage therapy [17]. While these methods are not always inappropriate, it should be noted that they often have little or no evidence for efficacy.
Patients often wish for non-medication approaches to migraine management, but for those with significant and severe disability, these are probably insufficient. In these patients, non-medication approaches may best be used as a supplement to pharmacological treatment, with education on pharmacologic prevention given. Neuromodulation is a promising, novel approach that is emerging as a new treatment for migraine, but likely will require referral to a headache specialist.
Suboptimal Management of Migraine Comorbidities
There are several disorders that are commonly comorbid with migraine. Among the most common are anxiety, depression, medication (and caffeine) overuse, obesity, and sleep disorders [22]. A survey of PCPs reveals that only 50.6% of PCPs screen for anxiety, 60.2% for depression, and 73.5% for sleep disorders [17]. They are, for the most part, modifiable or treatable conditions and their proper management may help ease migraine disability.
In addition, the presence of these comorbidities may alter choice of treatment, for example, favoring the use of an serotonin and norepinephrine reuptake inhibitor such as venlafaxine for treatment in those with comorbid anxiety and depression. It is also worthwhile to have a high index of suspicion for obstructive sleep apnea in patients with headache, particularly in the obese and in those who endorse nonrestorative sleep or excessive daytime somnolence. It appears that patients who are adherent to the treatment of sleep apnea are more likely to report improvement in their headache [28].
Given the time constraints that often exist in the PCP office setting, addressing these comorbidities thoroughly is not always possible. It is reasonable, however, to have patients use screening tools while in the waiting room or prior to an appointment, to better identify those with modifiable comorbidities. Depression, anxiety, and excessive daytime sleepiness can all be screened for relatively easily with tools such as the PHQ-9 [29], GAD-7 [30] and Epworth Sleepiness Scale [31], respectively. A positive screen on any of these could lead the PCP to further investigate these entities as a possible contributor to migraine.
Patient Factors
In addition to the physician factors identified above, patient factors can contribute to the suboptimal management of migraine as well. These factors include a lack insight into diagnosis, poor compliance with treatment of migraine or its comorbidities, and overuse of abortive medications. There are also less modifiable patient factors such as socioeconomic status and the stigma that may be associated with migraine.
Poor Insight Into Diagnosis
Despite the high prevalence and burden of migraine in the general population, there is a staggering lack of awareness among migraineurs. Some estimates state that as many as 54% of patients were unaware that their headaches represented migraine [32]. The most common self-reported diagnoses in migraineurs are sinus headache (39%), tension-type headache (31%) and stress headache (29%) [14]. In addition, many patients believe they are suffering from cervical spine–related pain [13]. This is likely due to the common presence of posteriorly located pain, attacks triggered by poor sleep, or attacks associated with weather changes [13]. Patients presenting with aura are more likely to report and to receive a physician diagnosis of migraine [14]. Women are more likely to receive and report a diagnosis of migraine compared with men [32].
There are many factors that play a role in poor insight. Many patients appear to believe that the location of the pain is suggestive of the cause [13]. Many patients never seek out consultation for their headaches, and thus never receive a proper diagnosis [33]. Some patients may seek out medical care for their headaches, but fail to remember their diagnosis or receive an improper diagnosis [34].
Poor Adherence
The body of literature examining adherence with headache treatment is growing, but remains small [35]. In a recent systematic review of treatment adherence in pediatric and adult patients with headache, adherence rates in adults with headache ranged from 25% to 94% [35]. In this review, prescription claims data analyses found poor persistence in patients prescribed triptans for migraine treatment. In one large claims-based study, 53.8% of patients receiving a new triptan prescription did not persistently refill their index triptan [36]. Although some of these patients switched to an alternative triptan, the majority switched to a non-triptan migraine medication, including opioids and nonsteroidal anti-inflammatory drugs [36].
Cady and colleagues’ study of lapsed and sustained triptan users found that sustained users were significantly more satisfied with their medication, confident in the medication’s ability to control headache, and reported control of migraine with fewer doses of medication [37]. The authors concluded that the findings suggest that lapsed users may not be receiving optimal treatment. In a review by Rains et al [38], the authors found that headache treatment adherence declines “with more frequent and complex dosing regimens, side effects, and costs, and is subject to a wide range of psychosocial influences.”
Adherence issues also exist for migraine prevention. Less than 25% of chronic migraine patients continue to take oral preventive therapies at 1 year [24]. The reasons for this nonadherence are not completely clear, but are likely multifactorial. Preventives may take several weeks to months to become effective, which may contribute to noncompliance. In addition, migraineurs appears to have inadequate follow-up for migraine. Studies from France suggest that only 18% of those aware of their migraine diagnosis received medical follow-up [39].
Medication Overuse
While the data is not entirely clear, it is likely that overuse of as-needed medication plays a role in migraine chronification [40]. The reasons for medication overuse in the migraine population include some of the issues already highlighted above, including inadequate patient education, poor insight into diagnosis, not seeking care, misdiagnosis, and treatment nonadherence. Patients should be educated on the proper use of as-needed medication. Limits to medication use should be set during the physician-patient encounter. Patients should be counselled to limit their as-needed medication to no more than 10 days per month to reduce the risk of medication overuse headache. Ideally, opiates and barbiturates should be avoided, and never used as first-line therapy in patients who lack contraindications to NSAIDs and triptans. If their use in unavoidable for other reasons, they should be used sparingly, as use on as few as 5 to 8 days per month can be problematic [41]. Furthermore it is important to note that if patients are using several different acute analgesics, the combined total use of all as-needed pain medications needs to be less than 10 days per month to reduce the potential for medication overuse headache.
Socioeconomic Factors
Low socioeconomic status has been associated with an increased prevalence for all headache forms and an increased migraine attack frequency [42], but there appear to be few studies looking at the impact of low socioeconomic status and treatment. Lipton et al found that health insurance status was an important predictor of persons with migraine consulting a health care professional [43]. Among consulters, women were far more likely to be diagnosed than men, suggesting that gender bias in diagnosis may be an important barrier for men. Higher household income appeared to be a predictor for receiving a correct diagnosis of migraine. These researchers also found economic barriers related to use of appropriate prescription medications [43]. Differences in diagnosis and treatment may indicate racial and ethnic disparities in access and quality of care for minority patients [44].
Stigma
At least 1 study has reported that migraine patients experience stigma. In Young et al’s study of 123 episodic migraine patients, 123 chronic migraine patients, and 62 epilepsy patients, adjusted stigma was similar for chronic migraine and epilepsy, which were greater than for episodic migraine [45]. Stigma correlated most strongly with inability to work. Migraine patients reported equally high stigma scores across age, income, and education. The stigma of migraine may pose a barrier to seeking consultation and treatment. Further, the perception that migraine is “just a headache” may lead to stigmatizing attitudes on the part of friends, family, and coworkers of patients with migraine.
Conclusions and Recommendations
Migraine is a prevalent and frequently disabling condition that is underrecognized and undertreated in the primary care setting. Both physician and patient factors pose barriers to the optimal diagnosis and treatment of migraine. Remedies to address these barriers include education of both patients and physicians first and foremost. Targeting physician education in medical school and during residency training, including in primary care subspecialties, could include additional didactic teaching, but also clinical encounters in headache subspecialty clinics to increase exposure. Patient advocacy groups and public campaigns to improve understanding of migraine in the community may be a means for improving patient education and reducing stigma. Patients should be encouraged to seek out consultations for headache to reduce long-term headache disability. Management of comorbidities is paramount, and screening tools for migraine-associated disability, anxiety, depression, and medication use may be helpful to implement in the primary care setting as they are easy to use and time saving.
Recent surveys of PCPs suggest that the resource that is most desired is ready access to subspecialists for advice and “curb-side” consultation [17]. While this solution is not always practical, it may be worthwhile exploring closer relationships between primary care and subspecialty headache clinics, or perhaps more access to e-consultation or telephone consultation for more rural areas. Recently, Minen et al examined education strategies for PCPs. While in-person education sessions with PCPs were poorly attended, multiple possibilities for further education were identified. It was suggested that PCPs having real-time access to resources during the patient encounter would improve their comfort in managing patients. This includes online databases, simple algorithms for treatment, and directions for when to refer to a neurologist [46]. In addition, it may be worthwhile to train not only PCPs but also nursing and allied health staff so that they can provide headache education to patients. This may help ease some of the time burden on PCPs as well as provide a collaborative environment in which headache can be managed [46].
Corresponding author: William S. Kingston, MD, Mayo Clinic, 13400 E. Shea Blvd., Scottsdale, AZ 85259.
Financial disclosures: None.
1. Stewart WF, Schechter A, Lipton RB. Migraine heterogeneity. Disability, pain intensity and attack frequency and duration. Neurology 1994; 44(suppl 4):S24–S39
2. Burch RC, Loder S, Loder E, Smitherman TA. The prevalence of migraine and severe headache in the United States: updated statistics from government health surveillance studies. Headache 2015;55:21–34.
3. Lipton RB, Bigal ME, Diamond M, et al. Migraine prevalence, disease burden, and the need for preventive therapy. Neurology 2007;68:343–9.
4. Blumenfeld AM, Varon SF, Wilcox TK, et al. Disability, HRQoL and resource use amoung chronic and episodic migraineurs: results from the International Burden of Migraine Study (IBMS). Cephalalgia 2011;31:301–15.
5. Ahmed F. Headache disorders: differentiating and managing the common subtypes. Br J Pain 2012;6:124–32.
6. Natoli JL, Manack A, Dean B, et al. Global prevalence of chronic migraine: a systemic review. Cephalalgia 2010;30: 599–609.
7. Finkel AG. American academic headache specialists in neurology: Practice characteristics and culture. Cephalalgia 2004; 24:522–7.
8. Sheftell FD, Cady RK, Borchert LD, et al. Optimizing the diagnosis and treatment of migraine. J Am Acad Nurse Pract 2005;17:309–17.
9. Lipton RB, Scher AI, Steiner TJ, et al. Patterns of health care utilization for migraine in England and in the United States. Neurology 2003;60:441–8.
10. De Diego EV, Lanteri-Minet M. Recognition and management of migraine in primary care: Influence of functional impact measures by the Headache Impact Test (HIT). Cephalalgia 2005;25:184–90.
11. Miller S, Matharu MS. Migraine is underdiagnosed and undertreated. Practitioner 2014;258:19–24.
12. Al-Hashel JY, Ahmed SF, Alroughani R, et al. Migraine misdiagnosis as sinusitis, a delay that can last for many years. J Headache Pain 2013;14:97.
13. Viana M, Sances G, Terrazzino S, et al. When cervical pain is actually migraine: an observational study in 207 patients. Cephalalgia 2016. Epub ahead of print.
14. Diamond MD, Bigal ME, Silberstein S, et al. Patterns of diagnosis and acute and preventive treatment for migraine in the United States: Results from the American Migraine Prevalence and Prevention Study. Headache 2007;47:355–63.
15. Aguila MR, Rebbeck T, Mendoza KG, et al. Definitions and participant characteristics of frequent recurrent headache types in clinical trials: A systematic review. Cephalalgia 2017. Epub ahead of print.
16. Senbil N, Yavus Gurer YK, Uner C, Barut Y. Sinusitis in children and adolescents with chronic or recurrent headache: A case-control study. J Headache Pain 2008;9:33–6.
17. Minen MT, Loder E, Tishler L, Silbersweig D. Migraine diagnosis and treatment: A knowledge and needs assessment amoung primary care providers. Cephalalgia 2016; 36:358–70.
18. MacGregor EA, Brandes J, Eikerman A. Migraine prevalence and treatment patterns: The global migraine and zolmitriptan evaluation survey. Headache 2003;33:19–26.
19. Khan S, Mascarenhas A, Moore JE, et al. Access to triptans for acute episodic migraine: a qualitative study. Headache 2015; 44(suppl 4):199–211.
20. Tepper SJ. Medication-overuse headache. Continuum 2012;18:807–22.
21. Dekker F, Dielemann J, Neven AK, et al. Preventive treatment for migraine in primary care, a population based study in the Netherlands. Cephalalgia 2013;33:1170–8.
22. Starling AJ, Dodick DW. Best practices for patients with chronic migraine: burden, diagnosis and management in primary care. Mayo Clin Proc 2015;90:408–14.
23. Bigal ME, Serrano D, Reed M, Lipton RB. Chronic migraine in the population: burden, diagnosis, and satisfaction with treatment. Neurology 2008;71:559–66.
24. Hepp Z, Dodick D, Varon S, et al. Adherence to oral migraine preventive-medications among patients with chronic migraine. Cephalalgia 2015;35:478–88.
25. Smith JH, Schwedt TJ. What constitutes an “adequate” trial in migraine prevention? Curr Pain Headache Rep 2015;19:52.
26. Dodick DW, Turkel CC, DeGryse RE, et al. OnabotulinumtoxinA for treatment of chronic migraine: pooled results from the double blind, randomized, placebo-controlled phases of the PREEMPT clinical program. Headache 2010;50:921–36.
27. Silberstein SD. Practice parameter: evidence based guidelines for migraine headache (an evidence-based review): report of the Quality Standards Subcommittee of the American Academy of Neurology. Neurology 2000;55: 754–62.
28. Johnson KG, Ziemba AM, Garb JL. Improvement in headaches with continuous positive airway pressure for obstructive sleep apnea: a retrospective analysis. Headache 2013;53:333–43.
29. Altura KC, Patten SB, FIest KM, et al. Suicidal ideation in persons with neurological conditions: prevalence, associations and validation of the PHQ-9 for suicidal ideation. Gen Hosp Psychiatry 2016;42:22–6.
30. Seo JG, Park SP. Validation of the Generalized Anxiety Disorder-7 (GAD-7) and GAD-2 in patients with migraine. J Headache Pain 2015;16:97.
31. Corlateanu A, Pylchenko S, DIrcu V, Botnaru V. Predictors of daytime sleepiness in patients with obstructive sleep apnea. Pneumologia 2015;64:21–5.
32. Linde M, Dahlof C. Attitudes and burden of disease among self-considered migraineurs – a nation-wide population-based survey in Sweden. Cephalalgia 2004;24:455–65.
33. Osterhaus JT, Gutterman DL, Plachetka JR. Health care resources and lost labor costs of migraine headaches in the United States. Pharmacoeconomics 1992;36:69–76.
34. Tepper SJ, Dahlof CG, Dowson A et al. Prevalence and diagnosis of migraine in patients consulting their physician with a complaint of headache: Data from the Landmark Study. Headache 2004;44:856–64.
35. Ramsey RR, Ryan JL, Hershey AD, et al. Treatment adherence in patients with headache: a systematic review. Headache 2014;54:795–816.
36. Katic BJ, Rajagopalan S, Ho TW, et al. Triptan persistency among newly initiated users in a pharmacy claims database. Cephalalgia 2011;31:488–500.
37. Cady RK, Maizels M, Reeves DL, Levinson DM, Evans JK. Predictors of adherence to triptans: factors of sustained vs lapsed users. Headache 2009;49:386–94.
38. Rains JC, Lipchik GL, Penzien DB. Behavioral facilitation of medical treatment for headache--part I: Review of headache treatment compliance. Headache 2006;46:1387–94.
39. Lucas C, Chaffaut C, Artaz MA, Lanteri-Minet M. FRAMIG 2000: Medical and therapeutic management of migraine in France. Cephalalgia 2005;25:267–79.
40. Bigal ME, Serrano D, Buse D et al. Acute migraine medications and evolution from episodic to chronic migraine: a longitudinal population-based study. Headache 2008;48:1157–68.
41. Diener HC, Limmroth V. Medication-overuse headache: a worldwide problem. Lancet Neurol 2004;3:475–83.
42. Winter AC, Berger K, Buring JE, Kurth T. Associations of socioeconomic status with migraine and non-migraine headache. Cephalalgia 2012;32:159–70.
43. Lipton, RB, Serrano D, Holland S et al. Barriers to the diagnosis and treatment of migraine: effects of sex, income, and headache features. Headache 2013;53: 81–92.
44. Loder S, Sheikh HU, Loder E. The prevalence, burden, and treatment of severe, frequent, and migraine headaches in US minority populations: statistics from National Survey studies. Headache 2015;55:214–28.
45. Young WB, Park JE, Tian IX, Kempner J. The stigma of migraine. PLoS One 2013;8:e54074.
46. Minen A, Shome A, Hapern A, et al. A migraine training program for primary care providers: an overview of a survey and pilot study findings, lessons learned, and consideration for further research. Headache 2016;56:725–40.
From the Mayo Clinic, Scottsdale, AZ.
Abstract
- Objective: To review the impact of migraine and explore the barriers to optimal migraine diagnosis and treatment.
- Methods: Review of the literature.
- Results: Several factors may play a role in the inadequate care of migraine patients, including issues related to poor access to care, diagnostic insight, misdiagnosis, adherence to treatment, and management of comorbidities. Both patient and physician factors play an important role and many be modifiable.
- Conclusions: A focus on education of both patients and physicians is of paramount importance to improve the care provided to migraine patients. Patient evaluations should be multisystemic and include addressing comorbid conditions as well as a discussion about appropriate use of prevention and avoidance of medication overuse.
Key words: migraine; triptans; medication overuse headache; medication adherence; primary care.
Migraine is a common, debilitating condition that is a significant source of reduced productivity and increased disability [1]. According to the latest government statistics, 14.2% of US adults have reported having migraine or severe headaches in the previous 3 months, with an overall age-adjusted 3-month prevalence of 19.1% in females and 9.0% in males [2]. In a self-administered headache questionnaire mailed to 120,000 representative US households, the 1-year period prevalence for migraine was 11.7% (17.1% in women and 5.6% in men). Prevalence peaked in middle life and was lower in adolescents and those older than age 60 years [3]. Migraine is an important cause of reduced health-related quality of life and has a very high economic burden [4]. This effect is even more marked in those with chronic migraine, who are even more likely to have professional and social absenteeism and experience more severe disability [4].
Migraine and headache are a common reason for primary care physician (PCP) visits. Some estimates suggest that as many as 10% of primary care consultations are due to headache [5]. Approximately 75% of all patients complaining of headache in primary care will eventually be diagnosed with migraine [6]. Of these, as many as 1% to 5% will have chronic migraine [6].
Despite the high frequency and social and economic impact of migraine, migraine is underrecognized and undertreated. A survey of US households revealed that only 13% of migraineurs were currently using a preventive thrapy while 43.3% had never used one [3]. This is despite the fact that 32.4% met expert criteria for consideration of a preventive medication [3]. The reasons for underrecognition and undertreatment are multifactorial and include both patient and physician factors.
Physician Factors
Although migraine and headache are a leading cause of physicians visits, most physicians have had little formal training in headache. In the United States, medical students spend an average of 1 hour of preclinical and 2 hours of clinical education in headache [7]. Furthermore, primary care physicians receive little formal training in headache during residency [8]. In addition to the lack of formal training, there is also a lack of substantial clinic time available to fully evaluate and treat a new headache patient in the primary care setting [8]. Headache consultations can often be timely and detail-driven in order to determine the correct diagnosis and treatment [9].
Misdiagnosis
Evidence suggests that misdiagnosis plays a large role in the suboptimal management of migraineurs. Studies have shown that as many as 59.7% of migraineurs were not given a diagnosis of migraine by their primary care provider [10]. Common mistaken diagnoses include tension-type headache [11], “sinus headache” [12], cervical pain syndrome or cervicogenic headache [13], and “stress headache” [14].
The reasons for these misdiagnoses is not certain. It may be that the patient and practitioner assume that location of the pain is suggestive of the cause [13]. This is even though more than half of those with migraine have associated neck pain [15]. A recent study suggests that 60% of migraineurs who self-reported a diagnosis of cervical pain have been subsequently diagnosed with cervicalgia by a physician [13]. If patients endorse stress as a precipitant or the presence of cervical pain, they are more likely to obtain a diagnosis other than migraine. The presence of aura in association with the headache appears to be protective against misdiagnosis [13].
Similarly, patients are often given a diagnosis of “sinus headache.” This diagnosis is often made without radiologic evidence of sinusitis and even in those with a more typical migraine headache [16]. In one survey, 40% of patients meeting criteria for migraine were given this diagnosis. Many of these patients did have nasal symptoms or facial pain without clear evidence or rhinosinusitis, and in some cases these symptoms would respond to migraine treatments [16]. This is a particularly important misdiagnosis to highlight, as attributing symptoms to sinus disease may lead to unnecessary consultations and even sinus instrumentation.
In addition to common misdiagnoses, many PCPs are unfamiliar with the “red flags” that may indicate a secondary headache disorder and are also unfamiliar with appropriate use of neuroimaging in headache patients [17].
Misuse of As-Needed Medications
Studies have suggested that a large proportion of PCPs will prescribe nonspecific analgesics for migraine rather than migraine-specific medications [18]. These treatments may include NSAIDs, acetaminophen, barbiturates, and even opiates. This appears to be the pattern even for those with severe attacks [18], suggesting that migraine-specific medications such as triptans may be underused in the primary care setting. Postulated reasons for this pattern include lack of physician knowledge regarding the specific recommendations for managing migraine, the cost of medications, as well as lack of insurance coverage for these medications [19]. Misuse of as-needed medications can lead to medication overuse headache (MOH), which is an underrecognized problem in the primary care setting [20]. In a survey of PCPs in Boston, only 54% of PCPs were aware that barbiturates can cause MOH and only 34% were aware that opiates can cause MOH [17]. The same survey revealed that approximately 20% of PCPs had never made the diagnosis of MOH [17].
Underuse of Preventive Medications
As many as 40% of migraineurs need preventive therapy, but only approximately 13% are currently receiving it [3]. Additionally, the average time from diagnosis of migraine to instituting preventive treatment is 4.3 years, and often there is only a single preventive medication trial if one is instituted [21]. The reasons for this appear to be complex. The physician factors contributing to the underuse of preventive medications include inadequate education, discomfort and inadequate time for assessments. Only 27.8% of surveyed PCPs were aware of the American Academy of Neurology guidelines for prescribing preventive medications [17].
There may be an underestimate of the disability experienced by migraineurs, which can explain some of the underuse of preventive medications. While many PCPs endorse inquiring about headache-related disability, many do not used validated scales such as the Migraine Disability Assessment Score (MIDAS) or the Headache Impact Test (HIT) [17]. In addition, patients often underreport their headache days and report only their severe exacerbations unless clearly asked about a daily headache [22]. This may be part of the reason why only 20% of migraineurs who meet criteria for chronic migraine are diagnosed as such and why preventatives may not be offered [23].
After preventatives are started, less than 25% of patients will be adherent to oral migraine preventive agents at 1 year [24]. Common reasons for discontinuing preventives include adverse effects and perceived inefficacy [22]. Preventive medications may need a 6- to 8-week trial before efficacy is determined, but in practice medications may be stopped before this threshold is reached. Inadequate follow-up and lack of detail with regard to medication trials may result in the perception of an intractable patient prematurely. It has been suggested that a systematic approach to documenting and choosing preventive agents is helpful in the treatment of migraine [25], although this is not always practical in the primary care setting.
Another contributor to underuse of effective prophylaxis is related to access. Treatment with onabotulinumtoxin A, an efficacious prophylactic treatment approved for select chronic migraine patients [26], will usually require referral to a headache specialist, which is not always available to PCPs in a timely manner [7].
Nonpharmacologic Approaches
Effective nonpharmacologic treatment modalities for migraine, such as cognitive-behavioral therapy and biofeedback [27], are not commonly recommended by PCPs [17]. Instead, there appears to be more focus on avoidance of triggers and referral to non–evidence-based resources, such as special diets and massage therapy [17]. While these methods are not always inappropriate, it should be noted that they often have little or no evidence for efficacy.
Patients often wish for non-medication approaches to migraine management, but for those with significant and severe disability, these are probably insufficient. In these patients, non-medication approaches may best be used as a supplement to pharmacological treatment, with education on pharmacologic prevention given. Neuromodulation is a promising, novel approach that is emerging as a new treatment for migraine, but likely will require referral to a headache specialist.
Suboptimal Management of Migraine Comorbidities
There are several disorders that are commonly comorbid with migraine. Among the most common are anxiety, depression, medication (and caffeine) overuse, obesity, and sleep disorders [22]. A survey of PCPs reveals that only 50.6% of PCPs screen for anxiety, 60.2% for depression, and 73.5% for sleep disorders [17]. They are, for the most part, modifiable or treatable conditions and their proper management may help ease migraine disability.
In addition, the presence of these comorbidities may alter choice of treatment, for example, favoring the use of an serotonin and norepinephrine reuptake inhibitor such as venlafaxine for treatment in those with comorbid anxiety and depression. It is also worthwhile to have a high index of suspicion for obstructive sleep apnea in patients with headache, particularly in the obese and in those who endorse nonrestorative sleep or excessive daytime somnolence. It appears that patients who are adherent to the treatment of sleep apnea are more likely to report improvement in their headache [28].
Given the time constraints that often exist in the PCP office setting, addressing these comorbidities thoroughly is not always possible. It is reasonable, however, to have patients use screening tools while in the waiting room or prior to an appointment, to better identify those with modifiable comorbidities. Depression, anxiety, and excessive daytime sleepiness can all be screened for relatively easily with tools such as the PHQ-9 [29], GAD-7 [30] and Epworth Sleepiness Scale [31], respectively. A positive screen on any of these could lead the PCP to further investigate these entities as a possible contributor to migraine.
Patient Factors
In addition to the physician factors identified above, patient factors can contribute to the suboptimal management of migraine as well. These factors include a lack insight into diagnosis, poor compliance with treatment of migraine or its comorbidities, and overuse of abortive medications. There are also less modifiable patient factors such as socioeconomic status and the stigma that may be associated with migraine.
Poor Insight Into Diagnosis
Despite the high prevalence and burden of migraine in the general population, there is a staggering lack of awareness among migraineurs. Some estimates state that as many as 54% of patients were unaware that their headaches represented migraine [32]. The most common self-reported diagnoses in migraineurs are sinus headache (39%), tension-type headache (31%) and stress headache (29%) [14]. In addition, many patients believe they are suffering from cervical spine–related pain [13]. This is likely due to the common presence of posteriorly located pain, attacks triggered by poor sleep, or attacks associated with weather changes [13]. Patients presenting with aura are more likely to report and to receive a physician diagnosis of migraine [14]. Women are more likely to receive and report a diagnosis of migraine compared with men [32].
There are many factors that play a role in poor insight. Many patients appear to believe that the location of the pain is suggestive of the cause [13]. Many patients never seek out consultation for their headaches, and thus never receive a proper diagnosis [33]. Some patients may seek out medical care for their headaches, but fail to remember their diagnosis or receive an improper diagnosis [34].
Poor Adherence
The body of literature examining adherence with headache treatment is growing, but remains small [35]. In a recent systematic review of treatment adherence in pediatric and adult patients with headache, adherence rates in adults with headache ranged from 25% to 94% [35]. In this review, prescription claims data analyses found poor persistence in patients prescribed triptans for migraine treatment. In one large claims-based study, 53.8% of patients receiving a new triptan prescription did not persistently refill their index triptan [36]. Although some of these patients switched to an alternative triptan, the majority switched to a non-triptan migraine medication, including opioids and nonsteroidal anti-inflammatory drugs [36].
Cady and colleagues’ study of lapsed and sustained triptan users found that sustained users were significantly more satisfied with their medication, confident in the medication’s ability to control headache, and reported control of migraine with fewer doses of medication [37]. The authors concluded that the findings suggest that lapsed users may not be receiving optimal treatment. In a review by Rains et al [38], the authors found that headache treatment adherence declines “with more frequent and complex dosing regimens, side effects, and costs, and is subject to a wide range of psychosocial influences.”
Adherence issues also exist for migraine prevention. Less than 25% of chronic migraine patients continue to take oral preventive therapies at 1 year [24]. The reasons for this nonadherence are not completely clear, but are likely multifactorial. Preventives may take several weeks to months to become effective, which may contribute to noncompliance. In addition, migraineurs appears to have inadequate follow-up for migraine. Studies from France suggest that only 18% of those aware of their migraine diagnosis received medical follow-up [39].
Medication Overuse
While the data is not entirely clear, it is likely that overuse of as-needed medication plays a role in migraine chronification [40]. The reasons for medication overuse in the migraine population include some of the issues already highlighted above, including inadequate patient education, poor insight into diagnosis, not seeking care, misdiagnosis, and treatment nonadherence. Patients should be educated on the proper use of as-needed medication. Limits to medication use should be set during the physician-patient encounter. Patients should be counselled to limit their as-needed medication to no more than 10 days per month to reduce the risk of medication overuse headache. Ideally, opiates and barbiturates should be avoided, and never used as first-line therapy in patients who lack contraindications to NSAIDs and triptans. If their use in unavoidable for other reasons, they should be used sparingly, as use on as few as 5 to 8 days per month can be problematic [41]. Furthermore it is important to note that if patients are using several different acute analgesics, the combined total use of all as-needed pain medications needs to be less than 10 days per month to reduce the potential for medication overuse headache.
Socioeconomic Factors
Low socioeconomic status has been associated with an increased prevalence for all headache forms and an increased migraine attack frequency [42], but there appear to be few studies looking at the impact of low socioeconomic status and treatment. Lipton et al found that health insurance status was an important predictor of persons with migraine consulting a health care professional [43]. Among consulters, women were far more likely to be diagnosed than men, suggesting that gender bias in diagnosis may be an important barrier for men. Higher household income appeared to be a predictor for receiving a correct diagnosis of migraine. These researchers also found economic barriers related to use of appropriate prescription medications [43]. Differences in diagnosis and treatment may indicate racial and ethnic disparities in access and quality of care for minority patients [44].
Stigma
At least 1 study has reported that migraine patients experience stigma. In Young et al’s study of 123 episodic migraine patients, 123 chronic migraine patients, and 62 epilepsy patients, adjusted stigma was similar for chronic migraine and epilepsy, which were greater than for episodic migraine [45]. Stigma correlated most strongly with inability to work. Migraine patients reported equally high stigma scores across age, income, and education. The stigma of migraine may pose a barrier to seeking consultation and treatment. Further, the perception that migraine is “just a headache” may lead to stigmatizing attitudes on the part of friends, family, and coworkers of patients with migraine.
Conclusions and Recommendations
Migraine is a prevalent and frequently disabling condition that is underrecognized and undertreated in the primary care setting. Both physician and patient factors pose barriers to the optimal diagnosis and treatment of migraine. Remedies to address these barriers include education of both patients and physicians first and foremost. Targeting physician education in medical school and during residency training, including in primary care subspecialties, could include additional didactic teaching, but also clinical encounters in headache subspecialty clinics to increase exposure. Patient advocacy groups and public campaigns to improve understanding of migraine in the community may be a means for improving patient education and reducing stigma. Patients should be encouraged to seek out consultations for headache to reduce long-term headache disability. Management of comorbidities is paramount, and screening tools for migraine-associated disability, anxiety, depression, and medication use may be helpful to implement in the primary care setting as they are easy to use and time saving.
Recent surveys of PCPs suggest that the resource that is most desired is ready access to subspecialists for advice and “curb-side” consultation [17]. While this solution is not always practical, it may be worthwhile exploring closer relationships between primary care and subspecialty headache clinics, or perhaps more access to e-consultation or telephone consultation for more rural areas. Recently, Minen et al examined education strategies for PCPs. While in-person education sessions with PCPs were poorly attended, multiple possibilities for further education were identified. It was suggested that PCPs having real-time access to resources during the patient encounter would improve their comfort in managing patients. This includes online databases, simple algorithms for treatment, and directions for when to refer to a neurologist [46]. In addition, it may be worthwhile to train not only PCPs but also nursing and allied health staff so that they can provide headache education to patients. This may help ease some of the time burden on PCPs as well as provide a collaborative environment in which headache can be managed [46].
Corresponding author: William S. Kingston, MD, Mayo Clinic, 13400 E. Shea Blvd., Scottsdale, AZ 85259.
Financial disclosures: None.
1. Stewart WF, Schechter A, Lipton RB. Migraine heterogeneity. Disability, pain intensity and attack frequency and duration. Neurology 1994; 44(suppl 4):S24–S39
2. Burch RC, Loder S, Loder E, Smitherman TA. The prevalence of migraine and severe headache in the United States: updated statistics from government health surveillance studies. Headache 2015;55:21–34.
3. Lipton RB, Bigal ME, Diamond M, et al. Migraine prevalence, disease burden, and the need for preventive therapy. Neurology 2007;68:343–9.
4. Blumenfeld AM, Varon SF, Wilcox TK, et al. Disability, HRQoL and resource use amoung chronic and episodic migraineurs: results from the International Burden of Migraine Study (IBMS). Cephalalgia 2011;31:301–15.
5. Ahmed F. Headache disorders: differentiating and managing the common subtypes. Br J Pain 2012;6:124–32.
6. Natoli JL, Manack A, Dean B, et al. Global prevalence of chronic migraine: a systemic review. Cephalalgia 2010;30: 599–609.
7. Finkel AG. American academic headache specialists in neurology: Practice characteristics and culture. Cephalalgia 2004; 24:522–7.
8. Sheftell FD, Cady RK, Borchert LD, et al. Optimizing the diagnosis and treatment of migraine. J Am Acad Nurse Pract 2005;17:309–17.
9. Lipton RB, Scher AI, Steiner TJ, et al. Patterns of health care utilization for migraine in England and in the United States. Neurology 2003;60:441–8.
10. De Diego EV, Lanteri-Minet M. Recognition and management of migraine in primary care: Influence of functional impact measures by the Headache Impact Test (HIT). Cephalalgia 2005;25:184–90.
11. Miller S, Matharu MS. Migraine is underdiagnosed and undertreated. Practitioner 2014;258:19–24.
12. Al-Hashel JY, Ahmed SF, Alroughani R, et al. Migraine misdiagnosis as sinusitis, a delay that can last for many years. J Headache Pain 2013;14:97.
13. Viana M, Sances G, Terrazzino S, et al. When cervical pain is actually migraine: an observational study in 207 patients. Cephalalgia 2016. Epub ahead of print.
14. Diamond MD, Bigal ME, Silberstein S, et al. Patterns of diagnosis and acute and preventive treatment for migraine in the United States: Results from the American Migraine Prevalence and Prevention Study. Headache 2007;47:355–63.
15. Aguila MR, Rebbeck T, Mendoza KG, et al. Definitions and participant characteristics of frequent recurrent headache types in clinical trials: A systematic review. Cephalalgia 2017. Epub ahead of print.
16. Senbil N, Yavus Gurer YK, Uner C, Barut Y. Sinusitis in children and adolescents with chronic or recurrent headache: A case-control study. J Headache Pain 2008;9:33–6.
17. Minen MT, Loder E, Tishler L, Silbersweig D. Migraine diagnosis and treatment: A knowledge and needs assessment amoung primary care providers. Cephalalgia 2016; 36:358–70.
18. MacGregor EA, Brandes J, Eikerman A. Migraine prevalence and treatment patterns: The global migraine and zolmitriptan evaluation survey. Headache 2003;33:19–26.
19. Khan S, Mascarenhas A, Moore JE, et al. Access to triptans for acute episodic migraine: a qualitative study. Headache 2015; 44(suppl 4):199–211.
20. Tepper SJ. Medication-overuse headache. Continuum 2012;18:807–22.
21. Dekker F, Dielemann J, Neven AK, et al. Preventive treatment for migraine in primary care, a population based study in the Netherlands. Cephalalgia 2013;33:1170–8.
22. Starling AJ, Dodick DW. Best practices for patients with chronic migraine: burden, diagnosis and management in primary care. Mayo Clin Proc 2015;90:408–14.
23. Bigal ME, Serrano D, Reed M, Lipton RB. Chronic migraine in the population: burden, diagnosis, and satisfaction with treatment. Neurology 2008;71:559–66.
24. Hepp Z, Dodick D, Varon S, et al. Adherence to oral migraine preventive-medications among patients with chronic migraine. Cephalalgia 2015;35:478–88.
25. Smith JH, Schwedt TJ. What constitutes an “adequate” trial in migraine prevention? Curr Pain Headache Rep 2015;19:52.
26. Dodick DW, Turkel CC, DeGryse RE, et al. OnabotulinumtoxinA for treatment of chronic migraine: pooled results from the double blind, randomized, placebo-controlled phases of the PREEMPT clinical program. Headache 2010;50:921–36.
27. Silberstein SD. Practice parameter: evidence based guidelines for migraine headache (an evidence-based review): report of the Quality Standards Subcommittee of the American Academy of Neurology. Neurology 2000;55: 754–62.
28. Johnson KG, Ziemba AM, Garb JL. Improvement in headaches with continuous positive airway pressure for obstructive sleep apnea: a retrospective analysis. Headache 2013;53:333–43.
29. Altura KC, Patten SB, FIest KM, et al. Suicidal ideation in persons with neurological conditions: prevalence, associations and validation of the PHQ-9 for suicidal ideation. Gen Hosp Psychiatry 2016;42:22–6.
30. Seo JG, Park SP. Validation of the Generalized Anxiety Disorder-7 (GAD-7) and GAD-2 in patients with migraine. J Headache Pain 2015;16:97.
31. Corlateanu A, Pylchenko S, DIrcu V, Botnaru V. Predictors of daytime sleepiness in patients with obstructive sleep apnea. Pneumologia 2015;64:21–5.
32. Linde M, Dahlof C. Attitudes and burden of disease among self-considered migraineurs – a nation-wide population-based survey in Sweden. Cephalalgia 2004;24:455–65.
33. Osterhaus JT, Gutterman DL, Plachetka JR. Health care resources and lost labor costs of migraine headaches in the United States. Pharmacoeconomics 1992;36:69–76.
34. Tepper SJ, Dahlof CG, Dowson A et al. Prevalence and diagnosis of migraine in patients consulting their physician with a complaint of headache: Data from the Landmark Study. Headache 2004;44:856–64.
35. Ramsey RR, Ryan JL, Hershey AD, et al. Treatment adherence in patients with headache: a systematic review. Headache 2014;54:795–816.
36. Katic BJ, Rajagopalan S, Ho TW, et al. Triptan persistency among newly initiated users in a pharmacy claims database. Cephalalgia 2011;31:488–500.
37. Cady RK, Maizels M, Reeves DL, Levinson DM, Evans JK. Predictors of adherence to triptans: factors of sustained vs lapsed users. Headache 2009;49:386–94.
38. Rains JC, Lipchik GL, Penzien DB. Behavioral facilitation of medical treatment for headache--part I: Review of headache treatment compliance. Headache 2006;46:1387–94.
39. Lucas C, Chaffaut C, Artaz MA, Lanteri-Minet M. FRAMIG 2000: Medical and therapeutic management of migraine in France. Cephalalgia 2005;25:267–79.
40. Bigal ME, Serrano D, Buse D et al. Acute migraine medications and evolution from episodic to chronic migraine: a longitudinal population-based study. Headache 2008;48:1157–68.
41. Diener HC, Limmroth V. Medication-overuse headache: a worldwide problem. Lancet Neurol 2004;3:475–83.
42. Winter AC, Berger K, Buring JE, Kurth T. Associations of socioeconomic status with migraine and non-migraine headache. Cephalalgia 2012;32:159–70.
43. Lipton, RB, Serrano D, Holland S et al. Barriers to the diagnosis and treatment of migraine: effects of sex, income, and headache features. Headache 2013;53: 81–92.
44. Loder S, Sheikh HU, Loder E. The prevalence, burden, and treatment of severe, frequent, and migraine headaches in US minority populations: statistics from National Survey studies. Headache 2015;55:214–28.
45. Young WB, Park JE, Tian IX, Kempner J. The stigma of migraine. PLoS One 2013;8:e54074.
46. Minen A, Shome A, Hapern A, et al. A migraine training program for primary care providers: an overview of a survey and pilot study findings, lessons learned, and consideration for further research. Headache 2016;56:725–40.
First EDition: ED Visits Increased in States That Expanded Medicaid, more
BY JEFF BAUER
There was a substantial increase in the number of ED visits in states that expanded Medicaid coverage in 2014, after the Affordable Care Act was implemented, and a decrease in the number of ED visits by uninsured patients, according to a study published in Annals of Emergency Medicine.
Researchers analyzed quarterly data on ED visits from the Agency for Healthcare Research and Quality’s Fast Stats database, which is an early-release, aggregated version of the State Emergency Department Databases and State Inpatient Databases. They compared changes in ED visits per capita and changes in share of ED visits by payer (Medicaid, uninsured, and private insurance) in states that did and did not expand Medicaid coverage in 2014.
The analysis included 25 states: 14 Medicaid expansion states (Arizona, California, Hawaii, Iowa, Illinois, Kentucky, Maryland, Minnesota, North Dakota, New Jersey, Nevada, New York, Rhode Island, and Vermont) and 11 nonexpansion states (Florida, Georgia, Indiana, Kansas, Missouri, North Carolina, Nebraska, South Carolina, South Dakota, Tennessee, and Wisconsin). Researchers defined visits that occurred during all 4 quarters of 2012 and the first 3 quarters of 2013 as the pre-expansion period, and visits from the first through fourth quarters of 2014 as the postexpansion period. Visits that occurred during the fourth quarter of 2013 were not included in the analysis because Medicaid coverage began to increase in the final quarter of 2013 for most states.
Overall, researchers found that after 2014, ED use per 1,000 people per quarter increased by 2.5 visits more in expansion states compared to nonexpansion states. Researchers estimated that 1.13 million ED visits in 2014 could be attributed to Medicaid expansion in these states. In expansion states, the share of ED visits by Medicaid patients increased by 8.8 percentage points and the share of visits by insured patients decreased by 5.3 percentage points, compared to nonexpansion states. The share of visits by insured patients did not change for expansion states but increased slightly for nonexpansion states.
An American College of Emergency Physicians press release about this study included editorial comments by Ari Friedman, MD, of Beth Israel Deaconess Medical Center in Boston, who said, “More emergency department visits by Medicaid beneficiaries is neither clearly bad nor clearly good. Insurance increases access to care, including emergency department care. We need to move beyond the value judgments that have dominated so much study of emergency department utilization towards a more rational basis for how we structure unscheduled visits in the health system. If we want to meet patients’ care needs as patients themselves define them, the emergency department has a key role to play in a flexible system.”
Nikpay S, Freedman S, Levy H, Buchmueller T. Effect of the Affordable Care Act Medicaid expansion on emergency department visits: evidence from state-level emergency department databases. Ann Emerg Med. 2017 June 26. [Epub ahead of print]. doi:http://dx.doi.org/10.1016/j.annemergmed.2017.03.023.
Child Firearm Suicide at Highest Rate in More Than a Decade
MOLLIE KALAYCIO
FRONTLINE MEDICAL NEWS
Boys, older children, and minorities are disproportionately affected when it comes to firearm injuries and deaths in US children and adolescents, and child firearm suicide rates are at the highest they have been in more than a decade, new study results revealed.
Approximately 19 children are either medically treated for a gunshot wound or killed by one every day in the United States. “The majority of these children are boys 13-17 years old, African American in the case of firearm homicide, and white and American Indian in the case of firearm suicide. Pediatric firearm injuries and deaths are an important public health problem in the United States, contributing substantially each year to premature death, illness, and disability of children,” said Katherine A. Fowler, PhD, of the National Center for Injury Prevention and Control, Atlanta, and her associates. “Finding ways to prevent such injuries and ensure that all children have safe, stable, nurturing relationships and environments remains one of our most important priorities.”
National data on fatal firearm injuries in 2011-2014 for this study were derived from death certificate data from the Centers for Disease Control and Prevention’s (CDC’s) National Vital Statistics System, obtained via the CDC’s Web-based Injury Statistics Query and Reporting System. Data on nonfatal firearm injuries for 2011-2014 were obtained from the National Electronic Injury Surveillance System.
“From 2012 to 2014, the average annual case fatality rate was 74% for firearm-related self-harm, 14% for firearm-related assaults, and 6% for unintentional firearm injuries,” the investigators reported.
Boys accounted for 82% of all child firearm deaths from 2012 to 2014. In this time period, the annual rate of firearm death for boys was 4.5 times higher than the annual rate for girls (2.8 vs. 0.6 per 100,000). This difference was even more pronounced by age, with the rate for 13- to 17-year-old boys being six times higher than the rate for same-aged girls. Similarly, boys suffer the majority of nonfatal firearm injuries treated in US EDs, accounting for 84% of all nonfatal firearm injuries medically treated each year from 2012 to 2014. The average annual rate of nonfatal firearm injuries for boys was five times the rate for girls at 13 vs. 3 per 100,000.
The annual rate of firearm homicide was 10 times higher among 13- to 17-year-olds vs. 0- to 12-year-olds (3 vs. 0.3 per 100,000). Unintentional firearm death rates were approximately twice as high when comparing these two groups (0.2 vs. 0.1 per 100,000).
Dr Fowler and her associates wrote, “Our findings indicate that most children who died of unintentional firearm injuries were shot by another child in their own age range and most often in the context of playing with a gun or showing it to others. More than one-third of the deaths of older children occurred in incidents in which the shooter thought that the gun was unloaded or thought that the safety was engaged.”
“Child firearm suicide rates showed a significant upward trend between 2007 and 2014, increasing 60% from 1.0 to 1.6 (P < .05) to the highest rate seen over the period examined,” Dr Fowler and her associates said.
Firearm suicide rates were 11 times higher among 13- to 17-year-olds vs. 10- to 12-year-olds (2 vs. 0.2 per 100,000). Older children also accounted for 88% of all nonfatal firearm injuries treated in an ED. The overall average annual rate of nonfatal firearm injuries for older children was 19 times that of younger children (24 vs. 1 per 100,000).
The annual firearm homicide rate for African American children was nearly 10 times higher than the rate for white children (4 vs. 0.4 per 100,000). However, the annual rate of firearm suicide among white children was nearly four times higher than the rate for African American children (2. vs. 0.6 per 100,000).
Awareness of the availability of firearms during times of crisis is crucial because suicides are often impulsive in young people, Dr Fowler and her associates said, “with previous findings indicating that many who attempt suicide spend 10 minutes or less deliberating. Safe storage practices (ie, unloading and locking all firearms and ammunition) can potentially be lifesaving in these instances,” as the results of previous studies in this age group attest.
Firearm deaths are the third leading cause of
Fowler KA, Dahlberg LL, Haileyesus T, Gutierrez C, Bacon S. Childhood firearm injuries in the united states. Pediatrics. 2017;140(1):e20163486.

Topical Cannabinoids in Dermatology
The prevalence of topical cannabinoids has risen sharply in recent years. Commercial advertisers promote their usage as a safe means to treat a multitude of skin disorders, including atopic dermatitis (AD), psoriasis, and acne. Topical compounds have garnered interest in laboratory studies, but the purchase of commercial formulations is limited to over-the-counter products from unregulated suppliers. In this article, we review the scientific evidence behind topical cannabinoids and evaluate their role in clinical dermatology.
Background
Cannabis is designated as a Schedule I drug, according to the Controlled Substances Act of 1970. This listing is given to substances with no therapeutic value and a high potential for abuse. However, as of 2017, 29 states and the District of Columbia have laws legalizing cannabis in some capacity. These regulations typically apply to medicinal use, though several states have now legalized recreational use.
Cannabinoids represent a broad class of chemical compounds derived from the cannabis plant. Originally, this class only comprised phytocannabinoids, cannabinoids produced by the cannabis plant. Tetrahydrocannabinol (THC) is the most well-known phytocannabinoid and leads to the psychoactive effects typically associated with cannabis use. Later investigation led to the discovery of endocannabinoids, cannabinoids that are naturally produced by human and animal bodies, as well as synthetic cannabinoids.1 Cannabidiol is a phytocannabinoid that has been investigated in neurologic and anti-inflammatory conditions.2-4
Cannabinoids act as agonists on 2 principal receptors— cannabinoid receptor type 1 (CB1) and cannabinoid receptor type 2 (CB2)—which are both G protein–coupled receptors (Figure).5 Both have distinct distributions throughout different organ systems, to which cannabinoids (eg, THC, cannabidiol, endocannabinoids) show differential binding.6,7 Importantly, the expression of CB1 and CB2 has been identified on sensory nerve fibers, inflammatory cells, and adnexal structures of human skin.8 Based on these associations, topical application of cannabinoids has become a modality of interest for dermatological disorders. These formulations aim to influence cutaneous morphology without producing psychoactive effects.
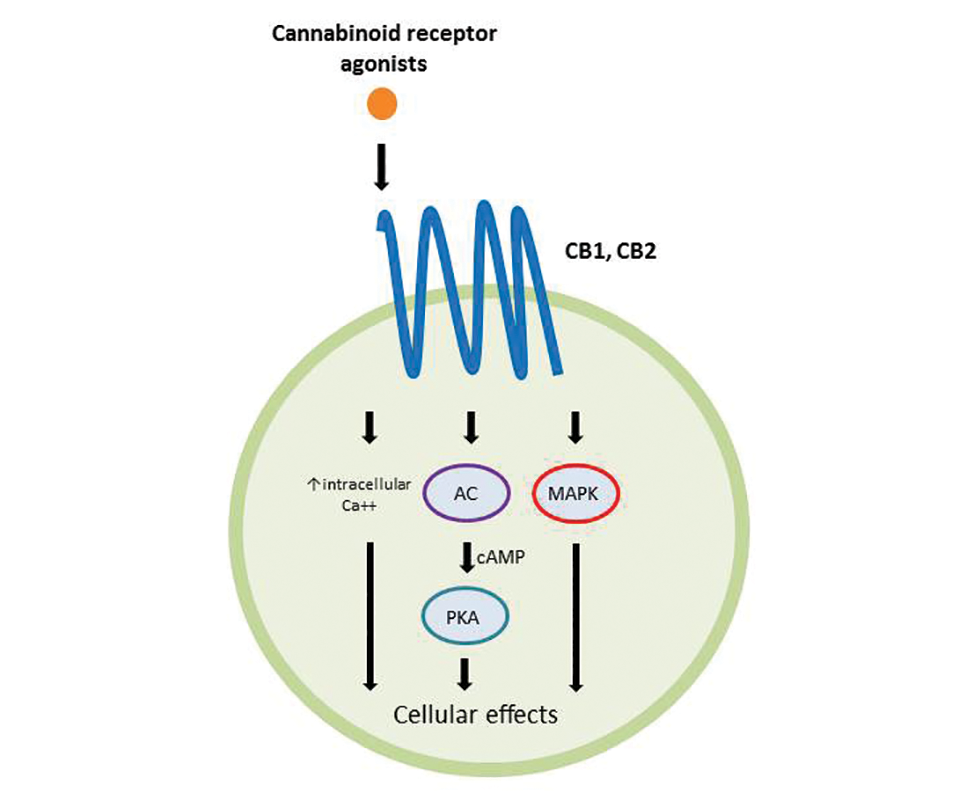
Topical Cannabinoids in Inflammatory Disorders
Atopic dermatitis has emerged as an active area of investigation for cannabinoid receptors and topical agonists (Table 1). In an animal model, Kim et al9 examined the effects of CB1 agonism on skin inflammation. Mice treated with topical CB1 agonists showed greater recovery of epidermal barrier function in acutely abrogated skin relative to those treated with a vehicle preparation. In addition, agonism of CB1 led to significant (P<.001) decreases in skin fold thickness among models of acute and chronic skin inflammation.9
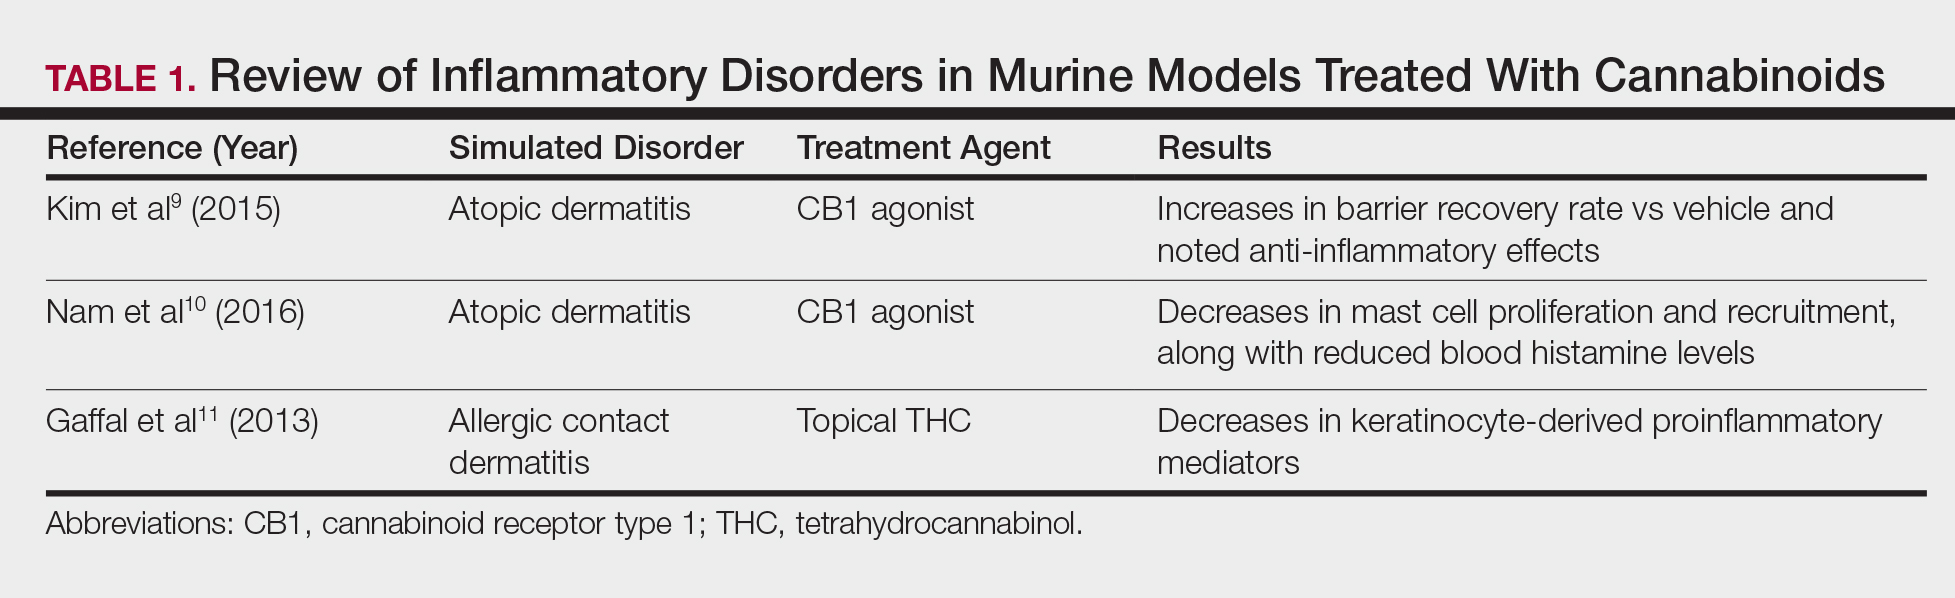
Nam et al10 also examined the role of topical CB1 agonists in mice with induced AD-like symptoms. Relative to treatment with vehicle, CB1 agonists significantly reduced the recruitment of mast cells (P<.01) and lowered the blood concentration of histamine (P<.05). Given the noted decrease in the release of inflammatory mediators, the authors speculated that topical agonsim of CB1 may prove useful in several conditions related to mast cell activation, such as AD, contact dermatitis, and psoriasis.10
The anti-inflammatory properties of topical THC were evaluated by Gaffal et al.11 In a mouse model of allergic contact dermatitis, mice treated with topical THC showed decreases in myeloid immune cell infiltration, with these beneficial effects existing even in mice with deficient CB1 and CB2 receptors. These results support a potentially wide anti-inflammatory activity of topical THC.11
Topical Cannabinoids in Pain Management
The effects of smoked cannabis in treating pain have undergone thorough investigation over recent years. Benefits have been noted in treating neuropathic pain, particularly in human immunodeficiency virus–associated sensory neuropathy.12-15 Smoked cannabis also may provide value as a synergistic therapy with opioids, thereby allowing for lower opioid doses.16
In contrast, research into the relationship between topical application of cannabinoids and nociception remains in preliminary stages (Table 2). In a mouse model, Dogrul et al17 assessed the topical antinociceptive potential of a mixed CB1-CB2 agonist. Results showed significant (P<.01) and dose-dependent antinociceptive effects relative to treatment with a vehicle.17 In a related study, Yesilyurt et al18 evaluated whether a mixed CB1-CB2 agonist could enhance the antinociceptive effects of topical opioids. Among mice treated with the combination of a cannabinoid agonist and topical morphine, a significantly (P<.05) greater analgesic effect was demonstrated relative to topical morphine alone.18
Studies in humans have been far more limited. Phan et al19 conducted a small, nonrandomized, open-label trial of a topical cannabinoid cream in patients with facial postherpetic neuralgia. Of 8 patients treated, 5 noted a mean pain reduction of 87.8%. No comparison vehicle was used. Based on this narrow study design, it is difficult to extrapolate these positive results to a broader patient population.19
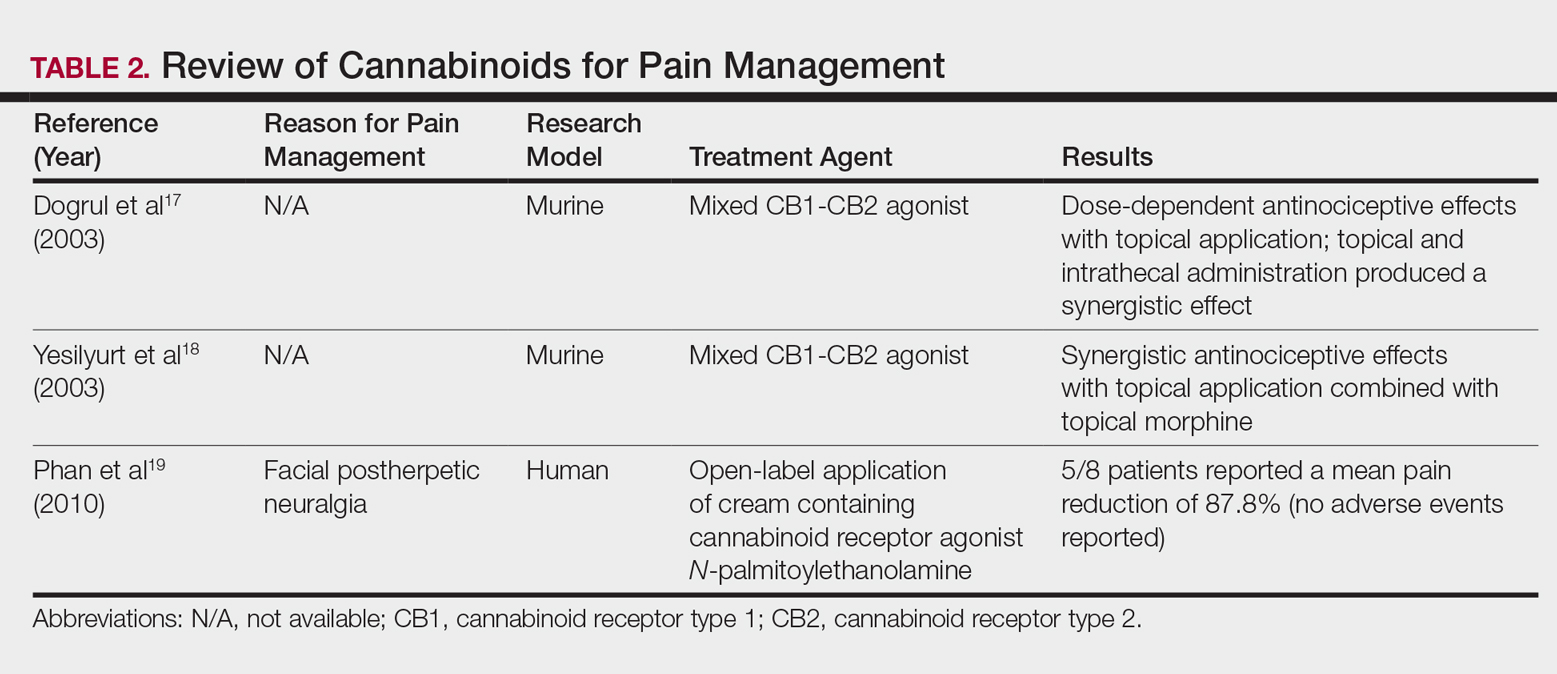
Commercial Products
Although preliminary models with topical cannabinoids have shown potential, large-scale clinical trials in humans have yet to be performed. Despite this lack of investigation, commercial formulations of topical cannabinoids are available to dermatology patients. These formulations are nonstandardized, and no safety data exists regarding their use. Topical cannabinoids on the market may contain various amounts of active ingredient and may be combined with a range of other compounds.
In dermatology offices, it is not uncommon for patients to express an intention to use topical cannabinoid products following their planned treatment or procedure. Patients also have been known to use topical cannabinoid products prior to dermatologic procedures, sometimes in place of an approved topical anesthetic, without consulting the physician performing the procedure. With interventions that lead to active areas of wound healing, the application of such products may increase the risk for contamination and infection. Therefore, patients should be counseled that the use of commercial topical cannabinoids could jeopardize the success of their planned procedure, put them at risk for infection, and possibly lead to systemic absorption and/or changes in wound-healing capacities.
Conclusion
Based on the results from recent animal models, cannabinoids may have a role in future treatment algorithms for several inflammatory conditions. However, current efficacy and safety data are almost entirely limited to preliminary animal studies in rodents. In addition, the formulation of topical cannabinoid products is nonstandardized and poorly regulated. As such, the present evidence does not support the use of topical cannabinoids in dermatology practices. Dermatologists should ask patients about the use of any cannabinoid products as part of a treatment program, especially given the unsubstantiated claims often made by unscrupulous advertisers. This issue highlights the need for further research and regulation.
- Pacher P, Batkai S, Kunos G. The endocannabinoid system as an emerging target of pharmacotherapy. Pharmacol Rev. 2006;58:389-462.
- Giacoppo S, Galuppo M, Pollastro F, et al. A new formulation of cannabidiol in cream shows therapeutic effects in a mouse model of experimental autoimmune encephalomyelitis. Daru. 2015;23:48.
- Hammell DC, Zhang LP, Ma F, et al. Transdermal cannabidiol reduces inflammation and pain-related behaviours in a rat model of arthritis. Eur J Pain. 2016;20:936-948.
- Schicho R, Storr M. Topical and systemic cannabidiol improves trinitrobenzene sulfonic acid colitis in mice. Pharmacology. 2012;89:149-155.
- Howlett AC, Barth F, Bonner TI, et al. International Union of Pharmacology. XXVII. Classification of cannabinoid receptors. Pharmacol Rev. 2002;54:161-202.
- Pertwee RG. The diverse CB1 and CB2 receptor pharmacology of three plant cannabinoids: delta9-tetrahydrocannabinol, cannabidiol and delta9-tetrahydrocannabivarin. Br J Pharmacol. 2008;153:199-215.
- Svizenska I, Dubovy P, Sulcova A. Cannabinoid receptors 1 and 2 (CB1 and CB2), their distribution, ligands and functional involvement in nervous system structures—a short review. Pharmacol Biochem Behav. 2008;90:501-511.
- Stander S, Schmelz M, Metze D, et al. Distribution of cannabinoid receptor 1 (CB1) and 2 (CB2) on sensory nerve fibers and adnexal structures in human skin. J Dermatol Sci. 2005;38:177-188.
- Kim HJ, Kim B, Park BM, et al. Topical cannabinoid receptor 1 agonist attenuates the cutaneous inflammatory responses in oxazolone-induced atopic dermatitis model. Int J Dermatol. 2015;54:E401-E408.
- Nam G, Jeong SK, Park BM, et al. Selective cannabinoid receptor-1 agonists regulate mast cell activation in an oxazolone-induced atopic dermatitis model. Ann Dermatol. 2016;28:22-29.
- Gaffal E, Cron M, Glodde N, et al. Anti-inflammatory activity of topical THC in DNFB-mediated mouse allergic contact dermatitis independent of CB1 and CB2 receptors. Allergy. 2013;68:994-1000.
- Abrams DI, Jay CA, Shade SB, et al. Cannabis in painful HIV-associated sensory neuropathy: a randomized placebo-controlled trial. Neurology. 2007;68:515-521.
- Ellis RJ, Toperoff W, Vaida F, et al. Smoked medicinal cannabis for neuropathic pain in HIV: a randomized, crossover clinical trial. Neuropsychopharmacology. 2009;34:672-680.
- Wilsey B, Marcotte T, Deutsch R, et al. Low-dose vaporized cannabis significantly improves neuropathic pain. J Pain. 2013;14:136-148.
- Wilsey B, Marcotte T, Tsodikov A, et al. A randomized, placebo-controlled, crossover trial of cannabis cigarettes in neuropathic pain. J Pain. 2008;9:506-521.
- Abrams DI, Couey P, Shade SB, et al. Cannabinoid-opioid interaction in chronic pain. Clin Pharmacol Ther. 2011;90:844-851.
- Dogrul A, Gul H, Akar A, et al. Topical cannabinoid antinociception: synergy with spinal sites. Pain. 2003;105:11-16.
- Yesilyurt O, Dogrul A, Gul H, et al. Topical cannabinoid enhances topical morphine antinociception. Pain. 2003;105:303-308.
- Phan NQ, Siepmann D, Gralow I, et al. Adjuvant topical therapy with a cannabinoid receptor agonist in facial postherpetic neuralgia. J Dtsch Dermatol Ges. 2010;8:88-91.
The prevalence of topical cannabinoids has risen sharply in recent years. Commercial advertisers promote their usage as a safe means to treat a multitude of skin disorders, including atopic dermatitis (AD), psoriasis, and acne. Topical compounds have garnered interest in laboratory studies, but the purchase of commercial formulations is limited to over-the-counter products from unregulated suppliers. In this article, we review the scientific evidence behind topical cannabinoids and evaluate their role in clinical dermatology.
Background
Cannabis is designated as a Schedule I drug, according to the Controlled Substances Act of 1970. This listing is given to substances with no therapeutic value and a high potential for abuse. However, as of 2017, 29 states and the District of Columbia have laws legalizing cannabis in some capacity. These regulations typically apply to medicinal use, though several states have now legalized recreational use.
Cannabinoids represent a broad class of chemical compounds derived from the cannabis plant. Originally, this class only comprised phytocannabinoids, cannabinoids produced by the cannabis plant. Tetrahydrocannabinol (THC) is the most well-known phytocannabinoid and leads to the psychoactive effects typically associated with cannabis use. Later investigation led to the discovery of endocannabinoids, cannabinoids that are naturally produced by human and animal bodies, as well as synthetic cannabinoids.1 Cannabidiol is a phytocannabinoid that has been investigated in neurologic and anti-inflammatory conditions.2-4
Cannabinoids act as agonists on 2 principal receptors— cannabinoid receptor type 1 (CB1) and cannabinoid receptor type 2 (CB2)—which are both G protein–coupled receptors (Figure).5 Both have distinct distributions throughout different organ systems, to which cannabinoids (eg, THC, cannabidiol, endocannabinoids) show differential binding.6,7 Importantly, the expression of CB1 and CB2 has been identified on sensory nerve fibers, inflammatory cells, and adnexal structures of human skin.8 Based on these associations, topical application of cannabinoids has become a modality of interest for dermatological disorders. These formulations aim to influence cutaneous morphology without producing psychoactive effects.
Topical Cannabinoids in Inflammatory Disorders
Atopic dermatitis has emerged as an active area of investigation for cannabinoid receptors and topical agonists (Table 1). In an animal model, Kim et al9 examined the effects of CB1 agonism on skin inflammation. Mice treated with topical CB1 agonists showed greater recovery of epidermal barrier function in acutely abrogated skin relative to those treated with a vehicle preparation. In addition, agonism of CB1 led to significant (P<.001) decreases in skin fold thickness among models of acute and chronic skin inflammation.9
Nam et al10 also examined the role of topical CB1 agonists in mice with induced AD-like symptoms. Relative to treatment with vehicle, CB1 agonists significantly reduced the recruitment of mast cells (P<.01) and lowered the blood concentration of histamine (P<.05). Given the noted decrease in the release of inflammatory mediators, the authors speculated that topical agonsim of CB1 may prove useful in several conditions related to mast cell activation, such as AD, contact dermatitis, and psoriasis.10
The anti-inflammatory properties of topical THC were evaluated by Gaffal et al.11 In a mouse model of allergic contact dermatitis, mice treated with topical THC showed decreases in myeloid immune cell infiltration, with these beneficial effects existing even in mice with deficient CB1 and CB2 receptors. These results support a potentially wide anti-inflammatory activity of topical THC.11
Topical Cannabinoids in Pain Management
The effects of smoked cannabis in treating pain have undergone thorough investigation over recent years. Benefits have been noted in treating neuropathic pain, particularly in human immunodeficiency virus–associated sensory neuropathy.12-15 Smoked cannabis also may provide value as a synergistic therapy with opioids, thereby allowing for lower opioid doses.16
In contrast, research into the relationship between topical application of cannabinoids and nociception remains in preliminary stages (Table 2). In a mouse model, Dogrul et al17 assessed the topical antinociceptive potential of a mixed CB1-CB2 agonist. Results showed significant (P<.01) and dose-dependent antinociceptive effects relative to treatment with a vehicle.17 In a related study, Yesilyurt et al18 evaluated whether a mixed CB1-CB2 agonist could enhance the antinociceptive effects of topical opioids. Among mice treated with the combination of a cannabinoid agonist and topical morphine, a significantly (P<.05) greater analgesic effect was demonstrated relative to topical morphine alone.18
Studies in humans have been far more limited. Phan et al19 conducted a small, nonrandomized, open-label trial of a topical cannabinoid cream in patients with facial postherpetic neuralgia. Of 8 patients treated, 5 noted a mean pain reduction of 87.8%. No comparison vehicle was used. Based on this narrow study design, it is difficult to extrapolate these positive results to a broader patient population.19
Commercial Products
Although preliminary models with topical cannabinoids have shown potential, large-scale clinical trials in humans have yet to be performed. Despite this lack of investigation, commercial formulations of topical cannabinoids are available to dermatology patients. These formulations are nonstandardized, and no safety data exists regarding their use. Topical cannabinoids on the market may contain various amounts of active ingredient and may be combined with a range of other compounds.
In dermatology offices, it is not uncommon for patients to express an intention to use topical cannabinoid products following their planned treatment or procedure. Patients also have been known to use topical cannabinoid products prior to dermatologic procedures, sometimes in place of an approved topical anesthetic, without consulting the physician performing the procedure. With interventions that lead to active areas of wound healing, the application of such products may increase the risk for contamination and infection. Therefore, patients should be counseled that the use of commercial topical cannabinoids could jeopardize the success of their planned procedure, put them at risk for infection, and possibly lead to systemic absorption and/or changes in wound-healing capacities.
Conclusion
Based on the results from recent animal models, cannabinoids may have a role in future treatment algorithms for several inflammatory conditions. However, current efficacy and safety data are almost entirely limited to preliminary animal studies in rodents. In addition, the formulation of topical cannabinoid products is nonstandardized and poorly regulated. As such, the present evidence does not support the use of topical cannabinoids in dermatology practices. Dermatologists should ask patients about the use of any cannabinoid products as part of a treatment program, especially given the unsubstantiated claims often made by unscrupulous advertisers. This issue highlights the need for further research and regulation.
- Pacher P, Batkai S, Kunos G. The endocannabinoid system as an emerging target of pharmacotherapy. Pharmacol Rev. 2006;58:389-462.
- Giacoppo S, Galuppo M, Pollastro F, et al. A new formulation of cannabidiol in cream shows therapeutic effects in a mouse model of experimental autoimmune encephalomyelitis. Daru. 2015;23:48.
- Hammell DC, Zhang LP, Ma F, et al. Transdermal cannabidiol reduces inflammation and pain-related behaviours in a rat model of arthritis. Eur J Pain. 2016;20:936-948.
- Schicho R, Storr M. Topical and systemic cannabidiol improves trinitrobenzene sulfonic acid colitis in mice. Pharmacology. 2012;89:149-155.
- Howlett AC, Barth F, Bonner TI, et al. International Union of Pharmacology. XXVII. Classification of cannabinoid receptors. Pharmacol Rev. 2002;54:161-202.
- Pertwee RG. The diverse CB1 and CB2 receptor pharmacology of three plant cannabinoids: delta9-tetrahydrocannabinol, cannabidiol and delta9-tetrahydrocannabivarin. Br J Pharmacol. 2008;153:199-215.
- Svizenska I, Dubovy P, Sulcova A. Cannabinoid receptors 1 and 2 (CB1 and CB2), their distribution, ligands and functional involvement in nervous system structures—a short review. Pharmacol Biochem Behav. 2008;90:501-511.
- Stander S, Schmelz M, Metze D, et al. Distribution of cannabinoid receptor 1 (CB1) and 2 (CB2) on sensory nerve fibers and adnexal structures in human skin. J Dermatol Sci. 2005;38:177-188.
- Kim HJ, Kim B, Park BM, et al. Topical cannabinoid receptor 1 agonist attenuates the cutaneous inflammatory responses in oxazolone-induced atopic dermatitis model. Int J Dermatol. 2015;54:E401-E408.
- Nam G, Jeong SK, Park BM, et al. Selective cannabinoid receptor-1 agonists regulate mast cell activation in an oxazolone-induced atopic dermatitis model. Ann Dermatol. 2016;28:22-29.
- Gaffal E, Cron M, Glodde N, et al. Anti-inflammatory activity of topical THC in DNFB-mediated mouse allergic contact dermatitis independent of CB1 and CB2 receptors. Allergy. 2013;68:994-1000.
- Abrams DI, Jay CA, Shade SB, et al. Cannabis in painful HIV-associated sensory neuropathy: a randomized placebo-controlled trial. Neurology. 2007;68:515-521.
- Ellis RJ, Toperoff W, Vaida F, et al. Smoked medicinal cannabis for neuropathic pain in HIV: a randomized, crossover clinical trial. Neuropsychopharmacology. 2009;34:672-680.
- Wilsey B, Marcotte T, Deutsch R, et al. Low-dose vaporized cannabis significantly improves neuropathic pain. J Pain. 2013;14:136-148.
- Wilsey B, Marcotte T, Tsodikov A, et al. A randomized, placebo-controlled, crossover trial of cannabis cigarettes in neuropathic pain. J Pain. 2008;9:506-521.
- Abrams DI, Couey P, Shade SB, et al. Cannabinoid-opioid interaction in chronic pain. Clin Pharmacol Ther. 2011;90:844-851.
- Dogrul A, Gul H, Akar A, et al. Topical cannabinoid antinociception: synergy with spinal sites. Pain. 2003;105:11-16.
- Yesilyurt O, Dogrul A, Gul H, et al. Topical cannabinoid enhances topical morphine antinociception. Pain. 2003;105:303-308.
- Phan NQ, Siepmann D, Gralow I, et al. Adjuvant topical therapy with a cannabinoid receptor agonist in facial postherpetic neuralgia. J Dtsch Dermatol Ges. 2010;8:88-91.
Practice Points
- Topical cannabinoids are advertised by companies as treatment options for numerous dermatologic conditions.
- Despite promising data in rodent models, there have been no rigorous studies to date confirming efficacy or safety in humans.
- Dermatologists should therefore inquire with patients about the use of any topical cannabinoid products, especially around the time of planned procedures, as they may affect treatment outcomes.

Systematic Review of Novel Synovial Fluid Markers and Polymerase Chain Reaction in the Diagnosis of Prosthetic Joint Infection
Take-Home Points
- Novel synovial markers and PCR have the potential to improve the detection of PJIs.
- 10Difficult-to-detect infections of prosthetic joints pose a diagnostic problem to surgeons and can lead to suboptimal outcomes.
- AD is a highly sensitive and specific synovial fluid marker for detecting PJIs.
- AD has shown promising results in detecting low virulence organisms.
- Studies are needed to determine how to best incorporate novel synovial markers and PCR to current diagnostic criteria in order to improve diagnostic accuracy.
Approximately 7 million Americans are living with a hip or knee replacement.1 According to projections, primary hip arthroplasties will increase by 174% and knee arthroplasties by 673% by 2030. Revision arthroplasties are projected to increase by 137% for hips and 601% for knees during the same time period.2 Infection and aseptic loosening are the most common causes of implant failure.3 The literature shows that infection is the most common cause of failure within 2 years after surgery and that aseptic loosening is the most common cause for late revision.3
Recent studies suggest that prosthetic joint infection (PJI) may be underreported because of difficulty making a diagnosis and that cases of aseptic loosening may in fact be attributable to infections with low-virulence organisms.2,3 These findings have led to new efforts to develop uniform criteria for diagnosing PJIs. In 2011, the Musculoskeletal Infection Society (MSIS) offered a new definition for PJI diagnosis, based on clinical and laboratory criteria, to increase the accuracy of PJI diagnosis.4 The MSIS committee acknowledged that PJI may be present even if these criteria are not met, particularly in the case of low-virulence organisms, as patients may not present with clinical signs of infection and may have normal inflammatory markers and joint aspirates. Reports of PJI cases misdiagnosed as aseptic loosening suggest that current screening and diagnostic tools are not sensitive enough to detect all infections and that PJI is likely underdiagnosed.
According to MSIS criteria, the diagnosis of PJI can be made when there is a sinus tract communicating with the prosthesis, when a pathogen is isolated by culture from 2 or more separate tissue or fluid samples obtained from the affected prosthetic joint, or when 4 of 6 criteria are met. The 6 criteria are (1) elevated serum erythrocyte sedimentation rate (ESR) (>30 mm/hour) and elevated C-reactive protein (CRP) level (>10 mg/L); (2) elevated synovial white blood cell (WBC) count (1100-4000 cells/μL); (3) elevated synovial polymorphonuclear leukocytes (>64%); (4) purulence in affected joint; (5) isolation of a microorganism in a culture of periprosthetic tissue or fluid; and (6) more than 5 neutrophils per high-power field in 5 high-power fields observed.
In this review article, we discuss recently developed novel synovial biomarkers and polymerase chain reaction (PCR) technologies that may help increase the sensitivity and specificity of diagnostic guidelines for PJI.
Methods
Using PRISMA (Preferred Reporting Items for Systematic Reviews and Meta-Analyses), we performed a systematic review of specific synovial fluid markers and PCR used in PJI diagnosis. In May 2016, we searched the PubMed database for these criteria: ((((((PCR[Text Word]) OR IL-6[Text Word]) OR leukocyte esterase[Text Word]) OR alpha defensin[Text Word]) AND ((“infection/diagnosis”[MeSH Terms] OR “infection/surgery”[MeSH Terms])))) AND (prosthetic joint infection[MeSH Terms] OR periprosthetic joint infection[MeSH Terms]).
We included patients who had undergone total hip, knee, or shoulder arthroplasty (THA, TKA, TSA). Index tests were PCR and the synovial fluid markers α-defensin (AD), interleukin 6 (IL-6), and leukocyte esterase (LE). Reference tests included joint fluid/serum analysis or tissue analysis (ESR/CRP level, cell count, culture, frozen section), which defined the MSIS criteria for PJI. Primary outcomes of interest were sensitivity and specificity, and secondary outcomes of interest included positive predictive value (PPV), negative predictive value (NPV), positive likelihood ratio (+LR), and negative likelihood ratio (–LR). Randomized controlled trials and controlled cohort studies in humans published within the past 10 years were included.
Results
Our full-text review yielded 15 papers that met our study inclusion criteria (Figure 1).
α-Defensin
One of the novel synovial biomarkers that has shown significant promise in diagnosing PJIs, even with difficult-to-detect organisms, is AD. 
AD has shown even more impressive results as a biomarker for PJI in the hip and knee, where infection with low virulence organism is less common. In 2014, Deirmengian and colleagues6 conducted a prospective clinical study of 149 patients who underwent revision THA or TKA for aseptic loosening (n = 112) or PJI (n = 37) as defined by MSIS criteria. Aseptic loosening was diagnosed when there was no identifiable reason for pain, and MSIS criteria were not met. Synovial fluid aspirates were collected before or during surgery. AD correctly identified 143 of the 149 patients with confirmed infection with sensitivity of 97.3% (95% confidence interval [CI], 85.8%-99.6%) and specificity of 95.5% (95% CI, 89.9%-98.5%). Similarly, Bingham and colleagues7 conducted a retrospective clinical study of 61 assays done on 57 patients who underwent revision arthroplasty for PJI as defined by MSIS criteria. Synovial fluid aspirates were collected before or during surgery. AD correctly identified all 19 PJIs with sensitivity of 100% (95% CI, 79%-100%) and specificity of 95% (95% CI, 83%-99%). Sensitivity and specificity of the AD assay more accurately predicted infection than synovial cell count or serum ESR/CRP level did.
These results are supported by another prospective study by Deirmengian and colleagues8 differentiating aseptic failures and PJIs in THA or TKA. The sensitivity and specificity of AD in diagnosing PJI were 100% (95% CI, 85.05%-100%). 
In a prospective study of 102 patients who underwent revision THA or TKA secondary to aseptic loosening or PJI, Frangiamore and colleagues9 also demonstrated the value of AD as a diagnostic for PJI in primary and revision hip and knee arthroplasty. 
Table 1 and Figure 2 provide a concise review of the findings of each study.
Interleukin 6
Another synovial fluid biomarker that has shown promise in PJI diagnosis is IL-6. In 2015, Frangiamore and colleagues10 conducted a prospective clinical study of 32 patients who underwent revision TSA. Synovial fluid aspiration was obtained before or during surgery. MSIS criteria were used to establish the diagnosis of PJI. IL-6 had sensitivity of 87% and specificity of 90%, with +LR of 8.45 and –LR of 0.15 in predicting PJI. Synovial fluid IL-6 had strong associations with frozen section histology and growth of P acnes. Frangiamore and colleagues10 recommended an ideal IL-6 cutoff of 359.1 pg/mL and reported that, though not as accurate as AD, synovial fluid IL-6 levels can help predict positive cultures in patients who undergo revision TSA.
Lenski and Scherer11 conducted another retrospective clinical study of the diagnostic value of IL-6 in PJI. 
Randau and colleagues12 conducted a prospective clinical study of 120 patients who presented with painful THA or TKA and underwent revision for PJI, aseptic failure, or aseptic revision without signs of infection or loosening. Synovial fluid aspirate was collected before or during surgery. 
Table 2 and Figure 3 provide a concise review of the findings of each study.
Leukocyte Esterase
LE strips are an inexpensive screening tool for PJI, according to some studies. In a prospective clinical study of 364 endoprosthetic joint (hip, knee, shoulder) interventions, Guenther and colleagues13 collected synovial fluid before surgery. Samples were tested with graded LE strips using PJI criteria set by the authors. Results were correlated with preoperative synovial fluid aspirations, serum CRP level, serum WBC count, and intraoperative histopathologic and microbiological findings. Whereas 293 (93.31%) of the 314 aseptic cases had negative test strip readings, 100% of the 50 infected cases were positive. LE had sensitivity of 100%, specificity of 96.5%, PPV of 82%, and NPV of 100%.
Wetters et al14 performed a prospective clinical study on 223 patients who underwent TKAs and THAs for suspected PJI based on having criteria defined by the authors of the study. Synovial fluid samples were collected either preoperatively or intraoperatively. 
Other authors have reported different findings that LE is an unreliable marker in PJI diagnosis. In one prospective clinical study of 85 patients who underwent primary or revision TSA, synovial fluid was collected during surgery.15 According to MSIS criteria, only 5 positive LE results predicted PJI among 21 primary and revision patients with positive cultures. Of the 7 revision patients who met the MSIS criteria for PJI, only 2 had a positive LE test. LE had sensitivity of 28.6%, specificity of 63.6%, PPV of 28.6%, and NPV of 87.5%. Six of the 7 revision patients grew P acnes. These results showed that LE was unreliable in detecting shoulder PJI.15
In another prospective clinical study, Tischler and colleagues16 enrolled 189 patients who underwent revision TKA or THA for aseptic failure or PJI as defined by the MSIS criteria. Synovial fluid was collected intraoperatively. 
Table 3 and Figure 4 provide a concise review of the findings of each study.
Polymerase Chain Reaction
Studies have found that PCR analysis of synovial fluid is effective in detecting bacteria on the surface of implants removed during revision arthroplasties. Comparison of the 16S rRNA gene sequences of bacterial genomes showed a diverse range of bacterial species within biofilms on the surface of clinical and subclinical infections.17 These findings, along with those of other studies, suggest that PCR analysis of synovial fluid is useful in diagnosing PJI and identifying organisms and their sensitivities to antibiotics.
Gallo and colleagues18 performed a prospective clinical study on 115 patients who underwent revision TKAs or THAs. Synovial fluid was collected intraoperatively. PCR assays targeting the 16S rDNA were carried out on 101 patients. PJIs were classified based on criteria of the authors of this study, of which there were 42. The sensitivity, specificity, PPV, NPV, +LR, and -LR for PCR were 71.4% (95% CI, 61.5%-75.5%), 97% (95% CI, 91.7%-99.1%), 92.6% (95% CI, 79.8%-97.9%), 86.5% (95% CI, 81.8%-88.4%), 23.6 (95% CI, 5.9%-93.8%), and 0.29 (95% CI, 0.17%-0.49%), respectively. Of note the most common organism detected in 42 PJIs was coagulase-negative Staphylococcus.
Marin and colleagues19 conducted a prospective study of 122 patients who underwent arthroplasty for suspected infection or aseptic loosening as defined by the authors’ clinicohistopathologic criteria. Synovial fluid and biopsy specimens were collected during surgery, and 40 patients met the infection criteria. The authors concluded that 16S PCR is more specific and has better PPV than culture does as one positive 16S PCR resulted in a specificity and PPV of PJI of 96.3% and 91.7%, respectively. However, they noted that culture was more sensitive in diagnosing PJI.
Jacovides and colleagues20 conducted a prospective study on 82 patients undergoing primary TKA, revision TKA, and revision THA.
The low PCR sensitivities reported in the literature were explained in a review by Hartley and Harris.21 They wrote that BR 16S rDNA and sequencing of PJI samples inherently have low sensitivity because of the contamination that can occur from the PCR reagents themselves or from sample mishandling. Techniques that address contaminant (extraneous DNA) removal, such as ultraviolet irradiation and DNase treatment, reduce Taq DNA polymerase activity, which reduces PCR sensitivity. 
Table 4 and Figure 5 provide a concise review of the findings of each study.
Discussion
Although there is no gold standard for the diagnosis of PJIs, several clinical and laboratory criteria guidelines are currently used to help clinicians diagnose infections of prosthetic joints. However, despite standardization of diagnostic criteria, PJI continue to be a diagnostic challenge.
AD is a highly sensitive and specific synovial fluid biomarker in detecting common PJIs. 

In summary, 5 AD studies5-9 had sensitivity ranging from 63% to 100% and specificity ranging from 95% to 100%; 3 IL-6 studies10-12 had sensitivity ranging from 46.8% to 90.9% and specificity ranging from 85.7% to 97.6%; 4 LE studies13-16 had sensitivity ranging from 28.6% to 100% and specificity ranging from 63.6% to 96.5%; and 3 PCR studies18-20 had sensitivity ranging from 67.1% to 95.7% and specificity ranging from 12.3% to 97.8%. Sensitivity and specificity were consistently higher for AD than for IL-6, LE, and PCR, though there was significant overlap, heterogeneity, and variation across all the included studies. 
Although the overall incidence of PJI is low, infected revisions remain a substantial financial burden to hospitals, as annual costs of infected revisions is estimated to exceed $1.62 billion by 2020.25 The usefulness of novel biomarkers and PCR in diagnosing PJI can be found in their ability to diagnose infections and facilitate appropriate early treatment. Several of these tests are readily available commercially and have the potential to be cost-effective diagnostic tools. The price to perform an AD test from Synovasure TM (Zimmer Biomet) ranges from $93 to $143. LE also provides an economic option for diagnosing PJI, as LE strips are commercially available for the cost of about 25 cents. PCR has also become an economic option, as costs can average $15.50 per sample extraction or PCR assay and $42.50 per amplicon sequence as reported in a study by Vandercam and colleagues.26 Future studies are needed to determine a diagnostic algorithm which incorporates these novel synovial markers to improve diagnostic accuracy of PJI in the most cost effective manner.
The current literature supports that AD can potentially be used to screen for PJI. Our findings suggest novel synovial fluid biomarkers may become of significant diagnostic use when combined with current laboratory and clinical diagnostic criteria. We recommend use of AD in cases in which pain, stiffness, and poor TJA outcome cannot be explained by errors in surgical technique, and infection is suspected despite MSIS criteria not being met.
The studies reviewed in this manuscript were limited in that none presented level I evidence (12 had level II evidence, and 3 had level III evidence), and there was significant heterogeneity (some studies used their own diagnostic standard, and others used the MSIS criteria). Larger scale prospective studies comparing serum ESR/CRP level and synovial fluid analysis to novel synovial markers are needed.
Am J Orthop. 2017;46(4):190-198. Copyright Frontline Medical Communications Inc. 2017. All rights reserved.
1. Maradit Kremers H, Larson DR, Crowson CS, et al. Prevalence of total hip and knee replacement in the United States. J Bone Joint Surg Am. 2015;97(17):1386-1397.
2. Kurtz S, Ong K, Lau E, Mowat F, Halpern M. Projections of primary and revision hip and knee arthroplasty in the United States from 2005 to 2030. J Bone Joint Surg Am. 2007;89(4):780-785.
3. Sharkey PF, Lichstein PM, Shen C, Tokarski AT, Parvizi J. Why are total knee arthroplasties failing today—has anything changed after 10 years? J Arthroplasty. 2014;29(9):1774-1778.
4. Butler-Wu SM, Burns EM, Pottinger PS, et al. Optimization of periprosthetic culture for diagnosis of Propionibacterium acnes prosthetic joint infection. J Clin Microbiol. 2011;49(7):2490-2495.
5. Frangiamore SJ, Saleh A, Grosso MJ, et al. α-Defensin as a predictor of periprosthetic shoulder infection. J Shoulder Elbow Surg. 2015;24(7):1021-1027.
6. Deirmengian C, Kardos K, Kilmartin P, Cameron A, Schiller K, Parvizi J. Combined measurement of synovial fluid α-defensin and C-reactive protein levels: highly accurate for diagnosing periprosthetic joint infection. J Bone Joint Surg Am. 2014;96(17):1439-1445.
7. Bingham J, Clarke H, Spangehl M, Schwartz A, Beauchamp C, Goldberg B. The alpha defensin-1 biomarker assay can be used to evaluate the potentially infected total joint arthroplasty. Clin Orthop Relat Res. 2014;472(12):4006-4009.
8. Deirmengian C, Kardos K, Kilmartin P, et al. The alpha-defensin test for periprosthetic joint infection outperforms the leukocyte esterase test strip. Clin Orthop Relat Res. 2015;473(1):198-203.
9. Frangiamore SJ, Gajewski ND, Saleh A, Farias-Kovac M, Barsoum WK, Higuera CA. α-Defensin accuracy to diagnose periprosthetic joint infection—best available test? J Arthroplasty. 2016;31(2):456-460.
10. Frangiamore SJ, Saleh A, Kovac MF, et al. Synovial fluid interleukin-6 as a predictor of periprosthetic shoulder infection. J Bone Joint Surg Am. 2015;97(1):63-70.
11. Lenski M, Scherer MA. Synovial IL-6 as inflammatory marker in periprosthetic joint infections. J Arthroplasty. 2014;29(6):1105-1109.
12. Randau TM, Friedrich MJ, Wimmer MD, et al. Interleukin-6 in serum and in synovial fluid enhances the differentiation between periprosthetic joint infection and aseptic loosening. PLoS One. 2014;9(2):e89045.
13. Guenther D, Kokenge T, Jacobs O, et al. Excluding infections in arthroplasty using leucocyte esterase test. Int Orthop. 2014;38(11):2385-2390.
14. Wetters NG, Berend KR, Lombardi AV, Morris MJ, Tucker TL, Della Valle CJ. Leukocyte esterase reagent strips for the rapid diagnosis of periprosthetic joint infection. J Arthroplasty. 2012;27(8 suppl):8-11.
15. Nelson GN, Paxton ES, Narzikul A, Williams G, Lazarus MD, Abboud JA. Leukocyte esterase in the diagnosis of shoulder periprosthetic joint infection. J Shoulder Elbow Surg. 2015;24(9):1421-1426.
16. Tischler EH, Cavanaugh PK, Parvizi J. Leukocyte esterase strip test: matched for Musculoskeletal Infection Society criteria. J Bone Joint Surg Am. 2014;96(22):1917-1920.
17. Dempsey KE, Riggio MP, Lennon A, et al. Identification of bacteria on the surface of clinically infected and non-infected prosthetic hip joints removed during revision arthroplasties by 16S rRNA gene sequencing and by microbiological culture. Arthritis Res Ther. 2007;9(3):R46.
18. Gallo J, Kolar M, Dendis M, et al. Culture and PCR analysis of joint fluid in the diagnosis of prosthetic joint infection. New Microbiol. 2008;31(1):97-104.
19. Marin M, Garcia-Lechuz JM, Alonso P, et al. Role of universal 16S rRNA gene PCR and sequencing in diagnosis of prosthetic joint infection. J Clin Microbiol. 2012;50(3):583-589.
20. Jacovides CL, Kreft R, Adeli B, Hozack B, Ehrlich GD, Parvizi J. Successful identification of pathogens by polymerase chain reaction (PCR)-based electron spray ionization time-of-flight mass spectrometry (ESI-TOF-MS) in culture-negative periprosthetic joint infection. J Bone Joint Surg Am. 2012;94(24):2247-2254.
21. Hartley JC, Harris KA. Molecular techniques for diagnosing prosthetic joint infections. J Antimicrob Chemother. 2014;69(suppl 1):i21-i24.
22. Zappe B, Graf S, Ochsner PE, Zimmerli W, Sendi P. Propionibacterium spp. in prosthetic joint infections: a diagnostic challenge. Arch Orthop Trauma Surg. 2008;128(10):1039-1046.
23. Rasouli MR, Harandi AA, Adeli B, Purtill JJ, Parvizi J. Revision total knee arthroplasty: infection should be ruled out in all cases. J Arthroplasty. 2012;27(6):1239-1243.e1-e2.
24. Hunt RW, Bond MJ, Pater GD. Psychological responses to cancer: a case for cancer support groups. Community Health Stud. 1990;14(1):35-38.
25. Kurtz SM, Lau E, Schmier J, Ong KL, Zhao K, Parvizi J. Infection burden for hip and knee arthroplasty in the United States. J Arthroplasty. 2008;23(7):984-991.
26. Vandercam B, Jeumont S, Cornu O, et al. Amplification-based DNA analysis in the diagnosis of prosthetic joint infection. J Mol Diagn. 2008;10(6):537-543.
Take-Home Points
- Novel synovial markers and PCR have the potential to improve the detection of PJIs.
- 10Difficult-to-detect infections of prosthetic joints pose a diagnostic problem to surgeons and can lead to suboptimal outcomes.
- AD is a highly sensitive and specific synovial fluid marker for detecting PJIs.
- AD has shown promising results in detecting low virulence organisms.
- Studies are needed to determine how to best incorporate novel synovial markers and PCR to current diagnostic criteria in order to improve diagnostic accuracy.
Approximately 7 million Americans are living with a hip or knee replacement.1 According to projections, primary hip arthroplasties will increase by 174% and knee arthroplasties by 673% by 2030. Revision arthroplasties are projected to increase by 137% for hips and 601% for knees during the same time period.2 Infection and aseptic loosening are the most common causes of implant failure.3 The literature shows that infection is the most common cause of failure within 2 years after surgery and that aseptic loosening is the most common cause for late revision.3
Recent studies suggest that prosthetic joint infection (PJI) may be underreported because of difficulty making a diagnosis and that cases of aseptic loosening may in fact be attributable to infections with low-virulence organisms.2,3 These findings have led to new efforts to develop uniform criteria for diagnosing PJIs. In 2011, the Musculoskeletal Infection Society (MSIS) offered a new definition for PJI diagnosis, based on clinical and laboratory criteria, to increase the accuracy of PJI diagnosis.4 The MSIS committee acknowledged that PJI may be present even if these criteria are not met, particularly in the case of low-virulence organisms, as patients may not present with clinical signs of infection and may have normal inflammatory markers and joint aspirates. Reports of PJI cases misdiagnosed as aseptic loosening suggest that current screening and diagnostic tools are not sensitive enough to detect all infections and that PJI is likely underdiagnosed.
According to MSIS criteria, the diagnosis of PJI can be made when there is a sinus tract communicating with the prosthesis, when a pathogen is isolated by culture from 2 or more separate tissue or fluid samples obtained from the affected prosthetic joint, or when 4 of 6 criteria are met. The 6 criteria are (1) elevated serum erythrocyte sedimentation rate (ESR) (>30 mm/hour) and elevated C-reactive protein (CRP) level (>10 mg/L); (2) elevated synovial white blood cell (WBC) count (1100-4000 cells/μL); (3) elevated synovial polymorphonuclear leukocytes (>64%); (4) purulence in affected joint; (5) isolation of a microorganism in a culture of periprosthetic tissue or fluid; and (6) more than 5 neutrophils per high-power field in 5 high-power fields observed.
In this review article, we discuss recently developed novel synovial biomarkers and polymerase chain reaction (PCR) technologies that may help increase the sensitivity and specificity of diagnostic guidelines for PJI.
Methods
Using PRISMA (Preferred Reporting Items for Systematic Reviews and Meta-Analyses), we performed a systematic review of specific synovial fluid markers and PCR used in PJI diagnosis. In May 2016, we searched the PubMed database for these criteria: ((((((PCR[Text Word]) OR IL-6[Text Word]) OR leukocyte esterase[Text Word]) OR alpha defensin[Text Word]) AND ((“infection/diagnosis”[MeSH Terms] OR “infection/surgery”[MeSH Terms])))) AND (prosthetic joint infection[MeSH Terms] OR periprosthetic joint infection[MeSH Terms]).
We included patients who had undergone total hip, knee, or shoulder arthroplasty (THA, TKA, TSA). Index tests were PCR and the synovial fluid markers α-defensin (AD), interleukin 6 (IL-6), and leukocyte esterase (LE). Reference tests included joint fluid/serum analysis or tissue analysis (ESR/CRP level, cell count, culture, frozen section), which defined the MSIS criteria for PJI. Primary outcomes of interest were sensitivity and specificity, and secondary outcomes of interest included positive predictive value (PPV), negative predictive value (NPV), positive likelihood ratio (+LR), and negative likelihood ratio (–LR). Randomized controlled trials and controlled cohort studies in humans published within the past 10 years were included.
Results
Our full-text review yielded 15 papers that met our study inclusion criteria (Figure 1).
α-Defensin
One of the novel synovial biomarkers that has shown significant promise in diagnosing PJIs, even with difficult-to-detect organisms, is AD.
AD has shown even more impressive results as a biomarker for PJI in the hip and knee, where infection with low virulence organism is less common. In 2014, Deirmengian and colleagues6 conducted a prospective clinical study of 149 patients who underwent revision THA or TKA for aseptic loosening (n = 112) or PJI (n = 37) as defined by MSIS criteria. Aseptic loosening was diagnosed when there was no identifiable reason for pain, and MSIS criteria were not met. Synovial fluid aspirates were collected before or during surgery. AD correctly identified 143 of the 149 patients with confirmed infection with sensitivity of 97.3% (95% confidence interval [CI], 85.8%-99.6%) and specificity of 95.5% (95% CI, 89.9%-98.5%). Similarly, Bingham and colleagues7 conducted a retrospective clinical study of 61 assays done on 57 patients who underwent revision arthroplasty for PJI as defined by MSIS criteria. Synovial fluid aspirates were collected before or during surgery. AD correctly identified all 19 PJIs with sensitivity of 100% (95% CI, 79%-100%) and specificity of 95% (95% CI, 83%-99%). Sensitivity and specificity of the AD assay more accurately predicted infection than synovial cell count or serum ESR/CRP level did.
These results are supported by another prospective study by Deirmengian and colleagues8 differentiating aseptic failures and PJIs in THA or TKA. The sensitivity and specificity of AD in diagnosing PJI were 100% (95% CI, 85.05%-100%).
In a prospective study of 102 patients who underwent revision THA or TKA secondary to aseptic loosening or PJI, Frangiamore and colleagues9 also demonstrated the value of AD as a diagnostic for PJI in primary and revision hip and knee arthroplasty.
Table 1 and Figure 2 provide a concise review of the findings of each study.
Interleukin 6
Another synovial fluid biomarker that has shown promise in PJI diagnosis is IL-6. In 2015, Frangiamore and colleagues10 conducted a prospective clinical study of 32 patients who underwent revision TSA. Synovial fluid aspiration was obtained before or during surgery. MSIS criteria were used to establish the diagnosis of PJI. IL-6 had sensitivity of 87% and specificity of 90%, with +LR of 8.45 and –LR of 0.15 in predicting PJI. Synovial fluid IL-6 had strong associations with frozen section histology and growth of P acnes. Frangiamore and colleagues10 recommended an ideal IL-6 cutoff of 359.1 pg/mL and reported that, though not as accurate as AD, synovial fluid IL-6 levels can help predict positive cultures in patients who undergo revision TSA.
Lenski and Scherer11 conducted another retrospective clinical study of the diagnostic value of IL-6 in PJI.
Randau and colleagues12 conducted a prospective clinical study of 120 patients who presented with painful THA or TKA and underwent revision for PJI, aseptic failure, or aseptic revision without signs of infection or loosening. Synovial fluid aspirate was collected before or during surgery.
Table 2 and Figure 3 provide a concise review of the findings of each study.
Leukocyte Esterase
LE strips are an inexpensive screening tool for PJI, according to some studies. In a prospective clinical study of 364 endoprosthetic joint (hip, knee, shoulder) interventions, Guenther and colleagues13 collected synovial fluid before surgery. Samples were tested with graded LE strips using PJI criteria set by the authors. Results were correlated with preoperative synovial fluid aspirations, serum CRP level, serum WBC count, and intraoperative histopathologic and microbiological findings. Whereas 293 (93.31%) of the 314 aseptic cases had negative test strip readings, 100% of the 50 infected cases were positive. LE had sensitivity of 100%, specificity of 96.5%, PPV of 82%, and NPV of 100%.
Wetters et al14 performed a prospective clinical study on 223 patients who underwent TKAs and THAs for suspected PJI based on having criteria defined by the authors of the study. Synovial fluid samples were collected either preoperatively or intraoperatively.
Other authors have reported different findings that LE is an unreliable marker in PJI diagnosis. In one prospective clinical study of 85 patients who underwent primary or revision TSA, synovial fluid was collected during surgery.15 According to MSIS criteria, only 5 positive LE results predicted PJI among 21 primary and revision patients with positive cultures. Of the 7 revision patients who met the MSIS criteria for PJI, only 2 had a positive LE test. LE had sensitivity of 28.6%, specificity of 63.6%, PPV of 28.6%, and NPV of 87.5%. Six of the 7 revision patients grew P acnes. These results showed that LE was unreliable in detecting shoulder PJI.15
In another prospective clinical study, Tischler and colleagues16 enrolled 189 patients who underwent revision TKA or THA for aseptic failure or PJI as defined by the MSIS criteria. Synovial fluid was collected intraoperatively.
Table 3 and Figure 4 provide a concise review of the findings of each study.
Polymerase Chain Reaction
Studies have found that PCR analysis of synovial fluid is effective in detecting bacteria on the surface of implants removed during revision arthroplasties. Comparison of the 16S rRNA gene sequences of bacterial genomes showed a diverse range of bacterial species within biofilms on the surface of clinical and subclinical infections.17 These findings, along with those of other studies, suggest that PCR analysis of synovial fluid is useful in diagnosing PJI and identifying organisms and their sensitivities to antibiotics.
Gallo and colleagues18 performed a prospective clinical study on 115 patients who underwent revision TKAs or THAs. Synovial fluid was collected intraoperatively. PCR assays targeting the 16S rDNA were carried out on 101 patients. PJIs were classified based on criteria of the authors of this study, of which there were 42. The sensitivity, specificity, PPV, NPV, +LR, and -LR for PCR were 71.4% (95% CI, 61.5%-75.5%), 97% (95% CI, 91.7%-99.1%), 92.6% (95% CI, 79.8%-97.9%), 86.5% (95% CI, 81.8%-88.4%), 23.6 (95% CI, 5.9%-93.8%), and 0.29 (95% CI, 0.17%-0.49%), respectively. Of note the most common organism detected in 42 PJIs was coagulase-negative Staphylococcus.
Marin and colleagues19 conducted a prospective study of 122 patients who underwent arthroplasty for suspected infection or aseptic loosening as defined by the authors’ clinicohistopathologic criteria. Synovial fluid and biopsy specimens were collected during surgery, and 40 patients met the infection criteria. The authors concluded that 16S PCR is more specific and has better PPV than culture does as one positive 16S PCR resulted in a specificity and PPV of PJI of 96.3% and 91.7%, respectively. However, they noted that culture was more sensitive in diagnosing PJI.
Jacovides and colleagues20 conducted a prospective study on 82 patients undergoing primary TKA, revision TKA, and revision THA.
The low PCR sensitivities reported in the literature were explained in a review by Hartley and Harris.21 They wrote that BR 16S rDNA and sequencing of PJI samples inherently have low sensitivity because of the contamination that can occur from the PCR reagents themselves or from sample mishandling. Techniques that address contaminant (extraneous DNA) removal, such as ultraviolet irradiation and DNase treatment, reduce Taq DNA polymerase activity, which reduces PCR sensitivity.
Table 4 and Figure 5 provide a concise review of the findings of each study.
Discussion
Although there is no gold standard for the diagnosis of PJIs, several clinical and laboratory criteria guidelines are currently used to help clinicians diagnose infections of prosthetic joints. However, despite standardization of diagnostic criteria, PJI continue to be a diagnostic challenge.
AD is a highly sensitive and specific synovial fluid biomarker in detecting common PJIs.
In summary, 5 AD studies5-9 had sensitivity ranging from 63% to 100% and specificity ranging from 95% to 100%; 3 IL-6 studies10-12 had sensitivity ranging from 46.8% to 90.9% and specificity ranging from 85.7% to 97.6%; 4 LE studies13-16 had sensitivity ranging from 28.6% to 100% and specificity ranging from 63.6% to 96.5%; and 3 PCR studies18-20 had sensitivity ranging from 67.1% to 95.7% and specificity ranging from 12.3% to 97.8%. Sensitivity and specificity were consistently higher for AD than for IL-6, LE, and PCR, though there was significant overlap, heterogeneity, and variation across all the included studies.
Although the overall incidence of PJI is low, infected revisions remain a substantial financial burden to hospitals, as annual costs of infected revisions is estimated to exceed $1.62 billion by 2020.25 The usefulness of novel biomarkers and PCR in diagnosing PJI can be found in their ability to diagnose infections and facilitate appropriate early treatment. Several of these tests are readily available commercially and have the potential to be cost-effective diagnostic tools. The price to perform an AD test from Synovasure TM (Zimmer Biomet) ranges from $93 to $143. LE also provides an economic option for diagnosing PJI, as LE strips are commercially available for the cost of about 25 cents. PCR has also become an economic option, as costs can average $15.50 per sample extraction or PCR assay and $42.50 per amplicon sequence as reported in a study by Vandercam and colleagues.26 Future studies are needed to determine a diagnostic algorithm which incorporates these novel synovial markers to improve diagnostic accuracy of PJI in the most cost effective manner.
The current literature supports that AD can potentially be used to screen for PJI. Our findings suggest novel synovial fluid biomarkers may become of significant diagnostic use when combined with current laboratory and clinical diagnostic criteria. We recommend use of AD in cases in which pain, stiffness, and poor TJA outcome cannot be explained by errors in surgical technique, and infection is suspected despite MSIS criteria not being met.
The studies reviewed in this manuscript were limited in that none presented level I evidence (12 had level II evidence, and 3 had level III evidence), and there was significant heterogeneity (some studies used their own diagnostic standard, and others used the MSIS criteria). Larger scale prospective studies comparing serum ESR/CRP level and synovial fluid analysis to novel synovial markers are needed.
Am J Orthop. 2017;46(4):190-198. Copyright Frontline Medical Communications Inc. 2017. All rights reserved.
1. Maradit Kremers H, Larson DR, Crowson CS, et al. Prevalence of total hip and knee replacement in the United States. J Bone Joint Surg Am. 2015;97(17):1386-1397.
2. Kurtz S, Ong K, Lau E, Mowat F, Halpern M. Projections of primary and revision hip and knee arthroplasty in the United States from 2005 to 2030. J Bone Joint Surg Am. 2007;89(4):780-785.
3. Sharkey PF, Lichstein PM, Shen C, Tokarski AT, Parvizi J. Why are total knee arthroplasties failing today—has anything changed after 10 years? J Arthroplasty. 2014;29(9):1774-1778.
4. Butler-Wu SM, Burns EM, Pottinger PS, et al. Optimization of periprosthetic culture for diagnosis of Propionibacterium acnes prosthetic joint infection. J Clin Microbiol. 2011;49(7):2490-2495.
5. Frangiamore SJ, Saleh A, Grosso MJ, et al. α-Defensin as a predictor of periprosthetic shoulder infection. J Shoulder Elbow Surg. 2015;24(7):1021-1027.
6. Deirmengian C, Kardos K, Kilmartin P, Cameron A, Schiller K, Parvizi J. Combined measurement of synovial fluid α-defensin and C-reactive protein levels: highly accurate for diagnosing periprosthetic joint infection. J Bone Joint Surg Am. 2014;96(17):1439-1445.
7. Bingham J, Clarke H, Spangehl M, Schwartz A, Beauchamp C, Goldberg B. The alpha defensin-1 biomarker assay can be used to evaluate the potentially infected total joint arthroplasty. Clin Orthop Relat Res. 2014;472(12):4006-4009.
8. Deirmengian C, Kardos K, Kilmartin P, et al. The alpha-defensin test for periprosthetic joint infection outperforms the leukocyte esterase test strip. Clin Orthop Relat Res. 2015;473(1):198-203.
9. Frangiamore SJ, Gajewski ND, Saleh A, Farias-Kovac M, Barsoum WK, Higuera CA. α-Defensin accuracy to diagnose periprosthetic joint infection—best available test? J Arthroplasty. 2016;31(2):456-460.
10. Frangiamore SJ, Saleh A, Kovac MF, et al. Synovial fluid interleukin-6 as a predictor of periprosthetic shoulder infection. J Bone Joint Surg Am. 2015;97(1):63-70.
11. Lenski M, Scherer MA. Synovial IL-6 as inflammatory marker in periprosthetic joint infections. J Arthroplasty. 2014;29(6):1105-1109.
12. Randau TM, Friedrich MJ, Wimmer MD, et al. Interleukin-6 in serum and in synovial fluid enhances the differentiation between periprosthetic joint infection and aseptic loosening. PLoS One. 2014;9(2):e89045.
13. Guenther D, Kokenge T, Jacobs O, et al. Excluding infections in arthroplasty using leucocyte esterase test. Int Orthop. 2014;38(11):2385-2390.
14. Wetters NG, Berend KR, Lombardi AV, Morris MJ, Tucker TL, Della Valle CJ. Leukocyte esterase reagent strips for the rapid diagnosis of periprosthetic joint infection. J Arthroplasty. 2012;27(8 suppl):8-11.
15. Nelson GN, Paxton ES, Narzikul A, Williams G, Lazarus MD, Abboud JA. Leukocyte esterase in the diagnosis of shoulder periprosthetic joint infection. J Shoulder Elbow Surg. 2015;24(9):1421-1426.
16. Tischler EH, Cavanaugh PK, Parvizi J. Leukocyte esterase strip test: matched for Musculoskeletal Infection Society criteria. J Bone Joint Surg Am. 2014;96(22):1917-1920.
17. Dempsey KE, Riggio MP, Lennon A, et al. Identification of bacteria on the surface of clinically infected and non-infected prosthetic hip joints removed during revision arthroplasties by 16S rRNA gene sequencing and by microbiological culture. Arthritis Res Ther. 2007;9(3):R46.
18. Gallo J, Kolar M, Dendis M, et al. Culture and PCR analysis of joint fluid in the diagnosis of prosthetic joint infection. New Microbiol. 2008;31(1):97-104.
19. Marin M, Garcia-Lechuz JM, Alonso P, et al. Role of universal 16S rRNA gene PCR and sequencing in diagnosis of prosthetic joint infection. J Clin Microbiol. 2012;50(3):583-589.
20. Jacovides CL, Kreft R, Adeli B, Hozack B, Ehrlich GD, Parvizi J. Successful identification of pathogens by polymerase chain reaction (PCR)-based electron spray ionization time-of-flight mass spectrometry (ESI-TOF-MS) in culture-negative periprosthetic joint infection. J Bone Joint Surg Am. 2012;94(24):2247-2254.
21. Hartley JC, Harris KA. Molecular techniques for diagnosing prosthetic joint infections. J Antimicrob Chemother. 2014;69(suppl 1):i21-i24.
22. Zappe B, Graf S, Ochsner PE, Zimmerli W, Sendi P. Propionibacterium spp. in prosthetic joint infections: a diagnostic challenge. Arch Orthop Trauma Surg. 2008;128(10):1039-1046.
23. Rasouli MR, Harandi AA, Adeli B, Purtill JJ, Parvizi J. Revision total knee arthroplasty: infection should be ruled out in all cases. J Arthroplasty. 2012;27(6):1239-1243.e1-e2.
24. Hunt RW, Bond MJ, Pater GD. Psychological responses to cancer: a case for cancer support groups. Community Health Stud. 1990;14(1):35-38.
25. Kurtz SM, Lau E, Schmier J, Ong KL, Zhao K, Parvizi J. Infection burden for hip and knee arthroplasty in the United States. J Arthroplasty. 2008;23(7):984-991.
26. Vandercam B, Jeumont S, Cornu O, et al. Amplification-based DNA analysis in the diagnosis of prosthetic joint infection. J Mol Diagn. 2008;10(6):537-543.