User login
Guidelines for Treatment of Lateral Patella Dislocations in Skeletally Mature Patients
Take-Home Points
- Lateral patella dislocation is sufficiently treated with modern versions of patellofemoral surgery.
- Comprehensive assessment for underlying osseous pathology is paramount (torsional abnormalities of the femur or tibia, trochlea dysplasia, patella alta, etc).
- In such cases, isolated medial patellofemoral ligament reconstructions will fail. Instead, the underlying osseous abnormalities must be addressed during concomitant procedures (derotational osteotomy, tibial tubercle transfer, trochleoplasty, etc).
The incidence of patellar instability is high, particularly in young females. In principle, cases of patellar instability can be classified as traumatic (dislocation is caused by external, often direct forces) or nontraumatic (anatomy predisposes to instability).1-4 
Anatomy Predisposing to Patella Dislocation
Most patients present with specific anatomical factors that predispose to patellar instability (isolated or combined). 
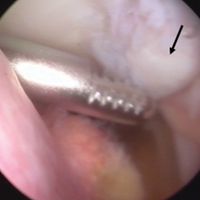
Of the osteochondral factors, dysplasia of the femoral trochlea (trochlea groove [TG]) is most important. In healthy patients, the concave trochlea stabilizes the patella in knee flexion angles above 20°. In particular, the lateral facet of the trochlea plays a key role in withstanding the lateralizing quadriceps vector. The dysplastic trochlea, which has a flat or even a convex surface, destabilizes the patella (Figure 1). Moreover, patella alta is a pivotal factor in the development of LPD. 

The anteromedial soft tissue of the knee (retinaculum) has 3 layers, the second of which contains the 


Diagnostics
Physical Examination
It is recommended that the physician starts the examination by assessing the walking and standing patient while focusing on torsional malalignment of the lower extremities (increased antetorsion of the femur, increased external torsion of the tibia), which is often indicated by squinting patellae.8,27,28


Imaging
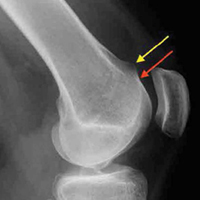
Radiographs are the basis for each patient’s imaging analysis. For a patient with valgus or varus clinical appearance, a weight-bearing whole-leg radiograph is used to precisely assess the degree of deformity in the frontal plane. A true lateral radiograph (congruent posterior condyles) provides information about patellar height (patella alta/infera). Most indices that quantify patellar height use the tibia as reference (eg, tuberosity, anterior aspect of articulation surface). 


MRI is the gold standard for LPD diagnosis—it can be used to easily identify soft-tissue lesions and establish their patellar or femoral location (eg, MPFL rupture). MRI also provides information on potential pathologies of quadriceps tendon, patella tendon, and infrapatellar fat pad. Compared with radiographs, MRI is more sensitive in detecting osteochondral lesions in LPD. 


Treatment
MPFL Reconstruction
Isolated MPFL reconstruction is commonly regarded as a standard, straightforward procedure. 


Trochleoplasty
In cases of recurrent LPD or a flat or convex trochlea (Dejour type B, C, or D dysplasia), deepening trochleoplasty should be considered. 

Osteotomy
The most popular type of osteotomy in the setting of LPD is the transfer of the TT (TTT). 

Derotational osteotomies of the femur (externally rotating) provide good outcomes in patients with LPD and associated torsional deformities,61-63 though the literature is incongruent with respect to whether rotational osteotomies of the femur should be performed at the proximal or distal aspect.64-67 In the majority of our LPD cases, we combine femoral derotation with MPFL reconstruction.
Treatment Algorithms
We suggest using different algorithms for primary LPD (Figure 22, Tables 1-2) and recurrent LPD (Figure 23).
Conclusion
In skeletally mature patients, LPD is sufficiently treated with modern versions of patellofemoral surgery. Comprehensive assessment for underlying pathology is paramount as preparation for developing an appropriate surgical plan for the patient.
Am J Orthop. 2017;46(2):E86-E96. Copyright Frontline Medical Communications Inc. 2017. All rights reserved.
1. Atkin DM, Fithian DC, Marangi KS, Stone ML, Dobson BE, Mendelsohn C. Characteristics of patients with primary acute lateral patellar dislocation and their recovery within the first 6 months of injury. Am J Sports Med. 2000;28(4):472-479.
2. Fithian DC, Paxton EW, Stone ML, et al. Epidemiology and natural history of acute patellar dislocation. Am J Sports Med. 2004;32(5):1114-1121.
3. Hawkins RJ, Bell RH, Anisette G. Acute patellar dislocations. The natural history. Am J Sports Med. 1986;14(2):117-120.
4. Sillanpää P, Mattila VM, Iivonen T, Visuri T, Pihlajamäki H. Incidence and risk factors of acute traumatic primary patellar dislocation. Med Sci Sports Exerc. 2008;40(4):606-611.
5. Ward SR, Terk MR, Powers CM. Patella alta: association with patellofemoral alignment and changes in contact area during weight-bearing. J Bone Joint Surg Am. 2007;89(8):1749-1755.
6. Dejour H, Walch G, Nove-Josserand L, Guier C. Factors of patellar instability: an anatomic radiographic study. Knee Surg Sports Traumatol Arthrosc. 1994;2(1):19-26.
7. Biedert RM. Osteotomies [in German]. Orthopade. 2008;37(9):872, 874-876, 878-880 passim.
8. Bruce WD, Stevens PM. Surgical correction of miserable malalignment syndrome. J Pediatr Orthop. 2004;24(4):392-396.
9. Lee TQ, Anzel SH, Bennett KA, Pang D, Kim WC. The influence of fixed rotational deformities of the femur on the patellofemoral contact pressures in human cadaver knees. Clin Orthop Relat Res. 1994;(302):69-74.
10. Feller JA, Amis AA, Andrish JT, Arendt EA, Erasmus PJ, Powers CM. Surgical biomechanics of the patellofemoral joint. Arthroscopy. 2007;23(5):542-553.
11. Post WR, Teitge R, Amis A. Patellofemoral malalignment: looking beyond the viewbox. Clin Sports Med. 2002;21(3):521-546, x.
12. Elias DA, White LM, Fithian DC. Acute lateral patellar dislocation at MR imaging: injury patterns of medial patellar soft-tissue restraints and osteochondral injuries of the inferomedial patella. Radiology. 2002;225(3):736-743.
13. Warren LA, Marshall JL, Girgis F. The prime static stabilizer of the medical side of the knee. J Bone Joint Surg Am. 1974;56(4):665-674.
14. Amis AA. Current concepts on anatomy and biomechanics of patellar stability. Sports Med Arthrosc. 2007;15(2):48-56.
15. Amis AA, Firer P, Mountney J, Senavongse W, Thomas NP. Anatomy and biomechanics of the medial patellofemoral ligament. Knee. 2003;10(3):215-220.
16. Conlan T, Garth WP Jr, Lemons JE. Evaluation of the medial soft-tissue restraints of the extensor mechanism of the knee. J Bone Joint Surg Am. 1993;75(5):682-693.
17. Tuxøe JI, Teir M, Winge S, Nielsen PL. The medial patellofemoral ligament: a dissection study. Knee Surg Sports Traumatol Arthrosc. 2002;10(3):138-140.
18. Desio SM, Burks RT, Bachus KN. Soft tissue restraints to lateral patellar translation in the human knee. Am J Sports Med. 1998;26(1):59-65.
19. Hautamaa PV, Fithian DC, Kaufman KR, Daniel DM, Pohlmeyer AM. Medial soft tissue restraints in lateral patellar instability and repair. Clin Orthop Relat Res. 1998;(349):174-182.
20. Nomura E, Horiuchi Y, Kihara M. Medial patellofemoral ligament restraint in lateral patellar translation and reconstruction. Knee. 2000;7(2):121-127.
21. Burks RT, Desio SM, Bachus KN, Tyson L, Springer K. Biomechanical evaluation of lateral patellar dislocations. Am J Knee Surg. 1998;11(1):24-31.
22. Muneta T, Sekiya I, Tsuchiya M, Shinomiya K. A technique for reconstruction of the medial patellofemoral ligament. Clin Orthop Relat Res. 1999;(359):151-155.
23. Nomura E, Inoue M, Osada N. Augmented repair of avulsion-tear type medial patellofemoral ligament injury in acute patellar dislocation. Knee Surg Sports Traumatol Arthrosc. 2005;13(5):346-351.
24. Christoforakis J, Bull AM, Strachan RK, Shymkiw R, Senavongse W, Amis AA. Effects of lateral retinacular release on the lateral stability of the patella. Knee Surg Sports Traumatol Arthrosc. 2006;14(3):273-277.
25. Merican AM, Kondo E, Amis AA. The effect on patellofemoral joint stability of selective cutting of lateral retinacular and capsular structures. J Biomech. 2009;42(3):291-296.
26. Ostermeier S, Holst M, Hurschler C, Windhagen H, Stukenborg-Colsman C. Dynamic measurement of patellofemoral kinematics and contact pressure after lateral retinacular release: an in vitro study. Knee Surg Sports Traumatol Arthrosc. 2007;15(5):547-554.
27. Scuderi GR. Surgical treatment for patellar instability. Orthop Clin North Am. 1992;23(4):619-630.
28. James SL, Bates BT, Osternig LR. Injuries to runners. Am J Sports Med. 1978;6(2):40-50.
29. Powers CM, Ward SR, Fredericson M, Guillet M, Shellock FG. Patellofemoral kinematics during weight-bearing and non-weight-bearing knee extension in persons with lateral subluxation of the patella: a preliminary study. J Orthop Sports Phys Ther. 2003;33(11):677-685.
30. Loudon JK, Wiesner D, Goist-Foley HL, Asjes C, Loudon KL. Intrarater reliability of functional performance tests for subjects with patellofemoral pain syndrome. J Athl Train. 2002;37(3):256-261.
31. Kolowich PA, Paulos LE, Rosenberg TD, Farnsworth S. Lateral release of the patella: indications and contraindications. Am J Sports Med. 1990;18(4):359-365.
32. Fairbank HA. Internal derangement of the knee in children and adolescents: (Section of Orthopaedics). Proc R Soc Med. 1937;30(4):427-432.
33. Hughston JC. Subluxation of the patella. J Bone Joint Surg Am. 1968;50(5):1003-1026.
34. Caton JH, Dejour D. Tibial tubercle osteotomy in patello-femoral instability and in patellar height abnormality. Int Orthop. 2010;34(2):305-309.
35. Biedert RM, Albrecht S. The patellotrochlear index: a new index for assessing patellar height. Knee Surg Sports Traumatol Arthrosc. 2006;14(8):707-712.
36. Shah JN, Howard JS, Flanigan DC, Brophy RH, Carey JL, Lattermann C. A systematic review of complications and failures associated with medial patellofemoral ligament reconstruction for recurrent patellar dislocation. Am J Sports Med. 2012;40(8):1916-1923.
37. Hopper GP, Leach WJ, Rooney BP, Walker CR, Blyth MJ. Does degree of trochlear dysplasia and position of femoral tunnel influence outcome after medial patellofemoral ligament reconstruction? Am J Sports Med. 2014;42(3):716-722.
38. Wagner D, Pfalzer F, Hingelbaum S, Huth J, Mauch F, Bauer G. The influence of risk factors on clinical outcomes following anatomical medial patellofemoral ligament (MPFL) reconstruction using the gracilis tendon. Knee Surg Sports Traumatol Arthrosc. 2013;21(2):318-324.
39. Mackay ND, Smith NA, Parsons N, Spalding T, Thompson P, Sprowson AP. Medial patellofemoral ligament reconstruction for patellar dislocation: a systematic review. Orthop J Sports Med. 2014;2(8):2325967114544021.
40. Stupay KL, Swart E, Shubin Stein BE. Widespread implementation of medial patellofemoral ligament reconstruction for recurrent patellar instability maintains functional outcomes at midterm to long-term follow-up while decreasing complication rates: a systematic review. Arthroscopy. 2015;31(7):1372-1380.
41. Neumann MV, Stalder M, Schuster AJ. Reconstructive surgery for patellofemoral joint incongruency. Knee Surg Sports Traumatol Arthrosc. 2016;24(3):873-878.
42. Banke IJ, Kohn LM, Meidinger G, et al. Combined trochleoplasty and MPFL reconstruction for treatment of chronic patellofemoral instability: a prospective minimum 2-year follow-up study. Knee Surg Sports Traumatol Arthrosc. 2014;22(11):2591-2598.
43. Dejour D, Byn P, Ntagiopoulos PG. The Lyon’s sulcus-deepening trochleoplasty in previous unsuccessful patellofemoral surgery. Int Orthop. 2013;37(3):433-439.
44. Thaunat M, Bessiere C, Pujol N, Boisrenoult P, Beaufils P. Recession wedge trochleoplasty as an additional procedure in the surgical treatment of patellar instability with major trochlear dysplasia: early results. Orthop Traumatol Surg Res. 2011;97(8):833-845.
45. Utting MR, Mulford JS, Eldridge JD. A prospective evaluation of trochleoplasty for the treatment of patellofemoral dislocation and instability. J Bone Joint Surg Br. 2008;90(2):180-185.
46. Blønd L, Haugegaard M. Combined arthroscopic deepening trochleoplasty and reconstruction of the medial patellofemoral ligament for patients with recurrent patella dislocation and trochlear dysplasia. Knee Surg Sports Traumatol Arthrosc. 2014;22(10):2484-2490.
47. Nelitz M, Dreyhaupt J, Lippacher S. Combined trochleoplasty and medial patellofemoral ligament reconstruction for recurrent patellar dislocations in severe trochlear dysplasia: a minimum 2-year follow-up study. Am J Sports Med. 2013;41(5):1005-1012.
48. Ntagiopoulos PG, Byn P, Dejour D. Midterm results of comprehensive surgical reconstruction including sulcus-deepening trochleoplasty in recurrent patellar dislocations with high-grade trochlear dysplasia. Am J Sports Med. 2013;41(5):998-1004.
49. Biedert R. Trochleoplasty—simple or tricky? Knee. 2014;21(6):1297-1298.
50. Ntagiopoulos PG, Dejour D. Current concepts on trochleoplasty procedures for the surgical treatment of trochlear dysplasia. Knee Surg Sports Traumatol Arthrosc. 2014;22(10):2531-2539.
51. Nelitz M, Theile M, Dornacher D, Wölfle J, Reichel H, Lippacher S. Analysis of failed surgery for patellar instability in children with open growth plates. Knee Surg Sports Traumatol Arthrosc. 2012;20(5):822-828.
52. Schöttle PB, Fucentese SF, Pfirrmann C, Bereiter H, Romero J. Trochleaplasty for patellar instability due to trochlear dysplasia: a minimum 2-year clinical and radiological follow-up of 19 knees. Acta Orthop. 2005;76(5):693-698.
53. Longo UG, Rizzello G, Ciuffreda M, et al. Elmslie-Trillat, Maquet, Fulkerson, Roux Goldthwait, and other distal realignment procedures for the management of patellar dislocation: systematic review and quantitative synthesis of the literature. Arthroscopy. 2016;32(5):929-943.
54. Barber FA, McGarry JE. Elmslie-Trillat procedure for the treatment of recurrent patellar instability. Arthroscopy. 2008;24(1):77-81.
55. Karataglis D, Green MA, Learmonth DJ. Functional outcome following modified Elmslie-Trillat procedure. Knee. 2006;13(6):464-468.
56. Kumar A, Jones S, Bickerstaff DR, Smith TW. A functional evaluation of the modified Elmslie-Trillat procedure for patello-femoral dysfunction. Knee. 2001;8(4):287-292.
57. Nakagawa K, Wada Y, Minamide M, Tsuchiya A, Moriya H. Deterioration of long-term clinical results after the Elmslie-Trillat procedure for dislocation of the patella. J Bone Joint Surg Br. 2002;84(6):861-864.
58. Magnussen RA, De Simone V, Lustig S, Neyret P, Flanigan DC. Treatment of patella alta in patients with episodic patellar dislocation: a systematic review. Knee Surg Sports Traumatol Arthrosc. 2014;22(10):2545-2550.
59. Mayer C, Magnussen RA, Servien E, et al. Patellar tendon tenodesis in association with tibial tubercle distalization for the treatment of episodic patellar dislocation with patella alta. Am J Sports Med. 2012;40(2):346-351.
60. Burnham JM, Howard JS, Hayes CB, Lattermann C. Medial patellofemoral ligament reconstruction with concomitant tibial tubercle transfer: a systematic review of outcomes and complications. Arthroscopy. 2016;32(6):1185-1195.
61. Dickschas J, Harrer J, Pfefferkorn R, Strecker W. Operative treatment of patellofemoral maltracking with torsional osteotomy. Arch Orthop Trauma Surg. 2012;132(3):289-298.
62. Nelitz M, Dreyhaupt J, Williams SR, Dornacher D. Combined supracondylar femoral derotation osteotomy and patellofemoral ligament reconstruction for recurrent patellar dislocation and severe femoral anteversion syndrome: surgical technique and clinical outcome. Int Orthop. 2015;39(12):2355-2362.
63. Strecker W, Dickschas J. Torsional osteotomy: operative treatment of patellofemoral maltracking [in German]. Oper Orthop Traumatol. 2015;27(6):505-524.
64. Bruce WD, Stevens PM. Surgical correction of miserable malalignment syndrome. J Pediatr Orthop. 2004;24(4):392-396.
65. Delgado ED, Schoenecker PL, Rich MM, Capelli AM. Treatment of severe torsional malalignment syndrome. J Pediatr Orthop. 1996;16(4):484-488.
66. Dickschas J, Harrer J, Reuter B, Schwitulla J, Strecker W. Torsional osteotomies of the femur. J Orthop Res. 2015;33(3):318-324.
67. Stevens PM, Gililland JM, Anderson LA, Mickelson JB, Nielson J, Klatt JW. Success of torsional correction surgery after failed surgeries for patellofemoral pain and instability. Strategies Trauma Limb Reconstr. 2014;9(1):5-12.
68. Balcarek P, Oberthür S, Hopfensitz S, et al. Which patellae are likely to redislocate? Knee Surg Sports Traumatol Arthrosc. 2014;22(10):2308-2314.
69. Jaquith BP, Parikh SN. Predictors of recurrent patellar instability in children and adolescents after first-time dislocation [published online October 21, 2015]. J Pediatr Orthop. doi:10.1097/BPO.0000000000000674.
Take-Home Points
- Lateral patella dislocation is sufficiently treated with modern versions of patellofemoral surgery.
- Comprehensive assessment for underlying osseous pathology is paramount (torsional abnormalities of the femur or tibia, trochlea dysplasia, patella alta, etc).
- In such cases, isolated medial patellofemoral ligament reconstructions will fail. Instead, the underlying osseous abnormalities must be addressed during concomitant procedures (derotational osteotomy, tibial tubercle transfer, trochleoplasty, etc).
The incidence of patellar instability is high, particularly in young females. In principle, cases of patellar instability can be classified as traumatic (dislocation is caused by external, often direct forces) or nontraumatic (anatomy predisposes to instability).1-4
Anatomy Predisposing to Patella Dislocation
Most patients present with specific anatomical factors that predispose to patellar instability (isolated or combined).
Of the osteochondral factors, dysplasia of the femoral trochlea (trochlea groove [TG]) is most important. In healthy patients, the concave trochlea stabilizes the patella in knee flexion angles above 20°. In particular, the lateral facet of the trochlea plays a key role in withstanding the lateralizing quadriceps vector. The dysplastic trochlea, which has a flat or even a convex surface, destabilizes the patella (Figure 1). Moreover, patella alta is a pivotal factor in the development of LPD.
The anteromedial soft tissue of the knee (retinaculum) has 3 layers, the second of which contains the
Diagnostics
Physical Examination
It is recommended that the physician starts the examination by assessing the walking and standing patient while focusing on torsional malalignment of the lower extremities (increased antetorsion of the femur, increased external torsion of the tibia), which is often indicated by squinting patellae.8,27,28
Imaging
Radiographs are the basis for each patient’s imaging analysis. For a patient with valgus or varus clinical appearance, a weight-bearing whole-leg radiograph is used to precisely assess the degree of deformity in the frontal plane. A true lateral radiograph (congruent posterior condyles) provides information about patellar height (patella alta/infera). Most indices that quantify patellar height use the tibia as reference (eg, tuberosity, anterior aspect of articulation surface).
MRI is the gold standard for LPD diagnosis—it can be used to easily identify soft-tissue lesions and establish their patellar or femoral location (eg, MPFL rupture). MRI also provides information on potential pathologies of quadriceps tendon, patella tendon, and infrapatellar fat pad. Compared with radiographs, MRI is more sensitive in detecting osteochondral lesions in LPD.
Treatment
MPFL Reconstruction
Isolated MPFL reconstruction is commonly regarded as a standard, straightforward procedure.
Trochleoplasty
In cases of recurrent LPD or a flat or convex trochlea (Dejour type B, C, or D dysplasia), deepening trochleoplasty should be considered.
Osteotomy
The most popular type of osteotomy in the setting of LPD is the transfer of the TT (TTT).
Derotational osteotomies of the femur (externally rotating) provide good outcomes in patients with LPD and associated torsional deformities,61-63 though the literature is incongruent with respect to whether rotational osteotomies of the femur should be performed at the proximal or distal aspect.64-67 In the majority of our LPD cases, we combine femoral derotation with MPFL reconstruction.
Treatment Algorithms
We suggest using different algorithms for primary LPD (Figure 22, Tables 1-2) and recurrent LPD (Figure 23).
Conclusion
In skeletally mature patients, LPD is sufficiently treated with modern versions of patellofemoral surgery. Comprehensive assessment for underlying pathology is paramount as preparation for developing an appropriate surgical plan for the patient.
Am J Orthop. 2017;46(2):E86-E96. Copyright Frontline Medical Communications Inc. 2017. All rights reserved.
1. Atkin DM, Fithian DC, Marangi KS, Stone ML, Dobson BE, Mendelsohn C. Characteristics of patients with primary acute lateral patellar dislocation and their recovery within the first 6 months of injury. Am J Sports Med. 2000;28(4):472-479.
2. Fithian DC, Paxton EW, Stone ML, et al. Epidemiology and natural history of acute patellar dislocation. Am J Sports Med. 2004;32(5):1114-1121.
3. Hawkins RJ, Bell RH, Anisette G. Acute patellar dislocations. The natural history. Am J Sports Med. 1986;14(2):117-120.
4. Sillanpää P, Mattila VM, Iivonen T, Visuri T, Pihlajamäki H. Incidence and risk factors of acute traumatic primary patellar dislocation. Med Sci Sports Exerc. 2008;40(4):606-611.
5. Ward SR, Terk MR, Powers CM. Patella alta: association with patellofemoral alignment and changes in contact area during weight-bearing. J Bone Joint Surg Am. 2007;89(8):1749-1755.
6. Dejour H, Walch G, Nove-Josserand L, Guier C. Factors of patellar instability: an anatomic radiographic study. Knee Surg Sports Traumatol Arthrosc. 1994;2(1):19-26.
7. Biedert RM. Osteotomies [in German]. Orthopade. 2008;37(9):872, 874-876, 878-880 passim.
8. Bruce WD, Stevens PM. Surgical correction of miserable malalignment syndrome. J Pediatr Orthop. 2004;24(4):392-396.
9. Lee TQ, Anzel SH, Bennett KA, Pang D, Kim WC. The influence of fixed rotational deformities of the femur on the patellofemoral contact pressures in human cadaver knees. Clin Orthop Relat Res. 1994;(302):69-74.
10. Feller JA, Amis AA, Andrish JT, Arendt EA, Erasmus PJ, Powers CM. Surgical biomechanics of the patellofemoral joint. Arthroscopy. 2007;23(5):542-553.
11. Post WR, Teitge R, Amis A. Patellofemoral malalignment: looking beyond the viewbox. Clin Sports Med. 2002;21(3):521-546, x.
12. Elias DA, White LM, Fithian DC. Acute lateral patellar dislocation at MR imaging: injury patterns of medial patellar soft-tissue restraints and osteochondral injuries of the inferomedial patella. Radiology. 2002;225(3):736-743.
13. Warren LA, Marshall JL, Girgis F. The prime static stabilizer of the medical side of the knee. J Bone Joint Surg Am. 1974;56(4):665-674.
14. Amis AA. Current concepts on anatomy and biomechanics of patellar stability. Sports Med Arthrosc. 2007;15(2):48-56.
15. Amis AA, Firer P, Mountney J, Senavongse W, Thomas NP. Anatomy and biomechanics of the medial patellofemoral ligament. Knee. 2003;10(3):215-220.
16. Conlan T, Garth WP Jr, Lemons JE. Evaluation of the medial soft-tissue restraints of the extensor mechanism of the knee. J Bone Joint Surg Am. 1993;75(5):682-693.
17. Tuxøe JI, Teir M, Winge S, Nielsen PL. The medial patellofemoral ligament: a dissection study. Knee Surg Sports Traumatol Arthrosc. 2002;10(3):138-140.
18. Desio SM, Burks RT, Bachus KN. Soft tissue restraints to lateral patellar translation in the human knee. Am J Sports Med. 1998;26(1):59-65.
19. Hautamaa PV, Fithian DC, Kaufman KR, Daniel DM, Pohlmeyer AM. Medial soft tissue restraints in lateral patellar instability and repair. Clin Orthop Relat Res. 1998;(349):174-182.
20. Nomura E, Horiuchi Y, Kihara M. Medial patellofemoral ligament restraint in lateral patellar translation and reconstruction. Knee. 2000;7(2):121-127.
21. Burks RT, Desio SM, Bachus KN, Tyson L, Springer K. Biomechanical evaluation of lateral patellar dislocations. Am J Knee Surg. 1998;11(1):24-31.
22. Muneta T, Sekiya I, Tsuchiya M, Shinomiya K. A technique for reconstruction of the medial patellofemoral ligament. Clin Orthop Relat Res. 1999;(359):151-155.
23. Nomura E, Inoue M, Osada N. Augmented repair of avulsion-tear type medial patellofemoral ligament injury in acute patellar dislocation. Knee Surg Sports Traumatol Arthrosc. 2005;13(5):346-351.
24. Christoforakis J, Bull AM, Strachan RK, Shymkiw R, Senavongse W, Amis AA. Effects of lateral retinacular release on the lateral stability of the patella. Knee Surg Sports Traumatol Arthrosc. 2006;14(3):273-277.
25. Merican AM, Kondo E, Amis AA. The effect on patellofemoral joint stability of selective cutting of lateral retinacular and capsular structures. J Biomech. 2009;42(3):291-296.
26. Ostermeier S, Holst M, Hurschler C, Windhagen H, Stukenborg-Colsman C. Dynamic measurement of patellofemoral kinematics and contact pressure after lateral retinacular release: an in vitro study. Knee Surg Sports Traumatol Arthrosc. 2007;15(5):547-554.
27. Scuderi GR. Surgical treatment for patellar instability. Orthop Clin North Am. 1992;23(4):619-630.
28. James SL, Bates BT, Osternig LR. Injuries to runners. Am J Sports Med. 1978;6(2):40-50.
29. Powers CM, Ward SR, Fredericson M, Guillet M, Shellock FG. Patellofemoral kinematics during weight-bearing and non-weight-bearing knee extension in persons with lateral subluxation of the patella: a preliminary study. J Orthop Sports Phys Ther. 2003;33(11):677-685.
30. Loudon JK, Wiesner D, Goist-Foley HL, Asjes C, Loudon KL. Intrarater reliability of functional performance tests for subjects with patellofemoral pain syndrome. J Athl Train. 2002;37(3):256-261.
31. Kolowich PA, Paulos LE, Rosenberg TD, Farnsworth S. Lateral release of the patella: indications and contraindications. Am J Sports Med. 1990;18(4):359-365.
32. Fairbank HA. Internal derangement of the knee in children and adolescents: (Section of Orthopaedics). Proc R Soc Med. 1937;30(4):427-432.
33. Hughston JC. Subluxation of the patella. J Bone Joint Surg Am. 1968;50(5):1003-1026.
34. Caton JH, Dejour D. Tibial tubercle osteotomy in patello-femoral instability and in patellar height abnormality. Int Orthop. 2010;34(2):305-309.
35. Biedert RM, Albrecht S. The patellotrochlear index: a new index for assessing patellar height. Knee Surg Sports Traumatol Arthrosc. 2006;14(8):707-712.
36. Shah JN, Howard JS, Flanigan DC, Brophy RH, Carey JL, Lattermann C. A systematic review of complications and failures associated with medial patellofemoral ligament reconstruction for recurrent patellar dislocation. Am J Sports Med. 2012;40(8):1916-1923.
37. Hopper GP, Leach WJ, Rooney BP, Walker CR, Blyth MJ. Does degree of trochlear dysplasia and position of femoral tunnel influence outcome after medial patellofemoral ligament reconstruction? Am J Sports Med. 2014;42(3):716-722.
38. Wagner D, Pfalzer F, Hingelbaum S, Huth J, Mauch F, Bauer G. The influence of risk factors on clinical outcomes following anatomical medial patellofemoral ligament (MPFL) reconstruction using the gracilis tendon. Knee Surg Sports Traumatol Arthrosc. 2013;21(2):318-324.
39. Mackay ND, Smith NA, Parsons N, Spalding T, Thompson P, Sprowson AP. Medial patellofemoral ligament reconstruction for patellar dislocation: a systematic review. Orthop J Sports Med. 2014;2(8):2325967114544021.
40. Stupay KL, Swart E, Shubin Stein BE. Widespread implementation of medial patellofemoral ligament reconstruction for recurrent patellar instability maintains functional outcomes at midterm to long-term follow-up while decreasing complication rates: a systematic review. Arthroscopy. 2015;31(7):1372-1380.
41. Neumann MV, Stalder M, Schuster AJ. Reconstructive surgery for patellofemoral joint incongruency. Knee Surg Sports Traumatol Arthrosc. 2016;24(3):873-878.
42. Banke IJ, Kohn LM, Meidinger G, et al. Combined trochleoplasty and MPFL reconstruction for treatment of chronic patellofemoral instability: a prospective minimum 2-year follow-up study. Knee Surg Sports Traumatol Arthrosc. 2014;22(11):2591-2598.
43. Dejour D, Byn P, Ntagiopoulos PG. The Lyon’s sulcus-deepening trochleoplasty in previous unsuccessful patellofemoral surgery. Int Orthop. 2013;37(3):433-439.
44. Thaunat M, Bessiere C, Pujol N, Boisrenoult P, Beaufils P. Recession wedge trochleoplasty as an additional procedure in the surgical treatment of patellar instability with major trochlear dysplasia: early results. Orthop Traumatol Surg Res. 2011;97(8):833-845.
45. Utting MR, Mulford JS, Eldridge JD. A prospective evaluation of trochleoplasty for the treatment of patellofemoral dislocation and instability. J Bone Joint Surg Br. 2008;90(2):180-185.
46. Blønd L, Haugegaard M. Combined arthroscopic deepening trochleoplasty and reconstruction of the medial patellofemoral ligament for patients with recurrent patella dislocation and trochlear dysplasia. Knee Surg Sports Traumatol Arthrosc. 2014;22(10):2484-2490.
47. Nelitz M, Dreyhaupt J, Lippacher S. Combined trochleoplasty and medial patellofemoral ligament reconstruction for recurrent patellar dislocations in severe trochlear dysplasia: a minimum 2-year follow-up study. Am J Sports Med. 2013;41(5):1005-1012.
48. Ntagiopoulos PG, Byn P, Dejour D. Midterm results of comprehensive surgical reconstruction including sulcus-deepening trochleoplasty in recurrent patellar dislocations with high-grade trochlear dysplasia. Am J Sports Med. 2013;41(5):998-1004.
49. Biedert R. Trochleoplasty—simple or tricky? Knee. 2014;21(6):1297-1298.
50. Ntagiopoulos PG, Dejour D. Current concepts on trochleoplasty procedures for the surgical treatment of trochlear dysplasia. Knee Surg Sports Traumatol Arthrosc. 2014;22(10):2531-2539.
51. Nelitz M, Theile M, Dornacher D, Wölfle J, Reichel H, Lippacher S. Analysis of failed surgery for patellar instability in children with open growth plates. Knee Surg Sports Traumatol Arthrosc. 2012;20(5):822-828.
52. Schöttle PB, Fucentese SF, Pfirrmann C, Bereiter H, Romero J. Trochleaplasty for patellar instability due to trochlear dysplasia: a minimum 2-year clinical and radiological follow-up of 19 knees. Acta Orthop. 2005;76(5):693-698.
53. Longo UG, Rizzello G, Ciuffreda M, et al. Elmslie-Trillat, Maquet, Fulkerson, Roux Goldthwait, and other distal realignment procedures for the management of patellar dislocation: systematic review and quantitative synthesis of the literature. Arthroscopy. 2016;32(5):929-943.
54. Barber FA, McGarry JE. Elmslie-Trillat procedure for the treatment of recurrent patellar instability. Arthroscopy. 2008;24(1):77-81.
55. Karataglis D, Green MA, Learmonth DJ. Functional outcome following modified Elmslie-Trillat procedure. Knee. 2006;13(6):464-468.
56. Kumar A, Jones S, Bickerstaff DR, Smith TW. A functional evaluation of the modified Elmslie-Trillat procedure for patello-femoral dysfunction. Knee. 2001;8(4):287-292.
57. Nakagawa K, Wada Y, Minamide M, Tsuchiya A, Moriya H. Deterioration of long-term clinical results after the Elmslie-Trillat procedure for dislocation of the patella. J Bone Joint Surg Br. 2002;84(6):861-864.
58. Magnussen RA, De Simone V, Lustig S, Neyret P, Flanigan DC. Treatment of patella alta in patients with episodic patellar dislocation: a systematic review. Knee Surg Sports Traumatol Arthrosc. 2014;22(10):2545-2550.
59. Mayer C, Magnussen RA, Servien E, et al. Patellar tendon tenodesis in association with tibial tubercle distalization for the treatment of episodic patellar dislocation with patella alta. Am J Sports Med. 2012;40(2):346-351.
60. Burnham JM, Howard JS, Hayes CB, Lattermann C. Medial patellofemoral ligament reconstruction with concomitant tibial tubercle transfer: a systematic review of outcomes and complications. Arthroscopy. 2016;32(6):1185-1195.
61. Dickschas J, Harrer J, Pfefferkorn R, Strecker W. Operative treatment of patellofemoral maltracking with torsional osteotomy. Arch Orthop Trauma Surg. 2012;132(3):289-298.
62. Nelitz M, Dreyhaupt J, Williams SR, Dornacher D. Combined supracondylar femoral derotation osteotomy and patellofemoral ligament reconstruction for recurrent patellar dislocation and severe femoral anteversion syndrome: surgical technique and clinical outcome. Int Orthop. 2015;39(12):2355-2362.
63. Strecker W, Dickschas J. Torsional osteotomy: operative treatment of patellofemoral maltracking [in German]. Oper Orthop Traumatol. 2015;27(6):505-524.
64. Bruce WD, Stevens PM. Surgical correction of miserable malalignment syndrome. J Pediatr Orthop. 2004;24(4):392-396.
65. Delgado ED, Schoenecker PL, Rich MM, Capelli AM. Treatment of severe torsional malalignment syndrome. J Pediatr Orthop. 1996;16(4):484-488.
66. Dickschas J, Harrer J, Reuter B, Schwitulla J, Strecker W. Torsional osteotomies of the femur. J Orthop Res. 2015;33(3):318-324.
67. Stevens PM, Gililland JM, Anderson LA, Mickelson JB, Nielson J, Klatt JW. Success of torsional correction surgery after failed surgeries for patellofemoral pain and instability. Strategies Trauma Limb Reconstr. 2014;9(1):5-12.
68. Balcarek P, Oberthür S, Hopfensitz S, et al. Which patellae are likely to redislocate? Knee Surg Sports Traumatol Arthrosc. 2014;22(10):2308-2314.
69. Jaquith BP, Parikh SN. Predictors of recurrent patellar instability in children and adolescents after first-time dislocation [published online October 21, 2015]. J Pediatr Orthop. doi:10.1097/BPO.0000000000000674.
Acute Compartment Syndrome
Acute extremity pain is a common presentation seen daily in EDs. While most etiologies of extremity pain are benign, the complications of acute compartment syndrome are associated with significant morbidity. Moreover, acute compartment syndrome remains a difficult diagnosis that is often missed on initial presentation. Morbidity results from an increased pressure in an anatomically closed space, progressing to decreased perfusion and rapid tissue destruction.
Case
An obese 55-year-old man with a medical history of coronary artery disease, for which he was on aspirin therapy, presented for evaluation of right shin pain. The patient stated that he completed a 5-km race earlier that morning with his son. Immediately following the race, he experienced increasing right shin pain, which he attempted to initially manage with ice compresses and over-the-counter ibuprofen. He noted that neither the ice compresses nor the ibuprofen relieved his pain and that by 5:00
Upon arrival at the ED, the patient was ambulatory but had significant pain at both rest and movement. His vital signs and his oxygen saturation on room air were normal. On physical examination, he had normal sensation to the entire right lower extremity and had equal pulses in both feet. The anterolateral aspect of the shin was exquisitely tender to light touch, and the patient was unable to dorsiflex or plantar flex without extreme pain. On passive dorsiflexion and plantar flexion of his right foot, he had exquisite pain. On palpation, the anterior shin was firm compared to the other muscle beds.
Epidemiology
Acute compartment syndrome—elevation of interstitial pressure in closed fascial compartment—affects 10 times as many men as women, at an average age of 32 years old and with an annual incidence of 7.3 per 100,000 men and 0.7 per 100,000 for women.1 McQueen et al1 found that the most common cause of acute compartment syndrome was fracture (69%), followed by soft tissue injury (23%). Younger patients are more likely to develop acute compartment syndrome from trauma because they typically have larger muscle beds with more tissue to become edematous compared to the older, hypotrophic muscles of elderly patients.
Pathophysiology
The fascia surrounds the major muscle groups and neurovascular bundles in the extremities to create distinct compartments. Since the fascia is not a compliant structure, it is typically not able to tolerate increases in volume or pressure in a given compartment. Compartment perfusion pressure is the mean arterial pressure minus the compartment pressure. Normal compartment pressure in adults is between 0 to 8 mm Hg.2 When compartment perfusion pressures are below 70 to 80 mm Hg, there is an increased risk of compartment syndrome.
Although the exact pathophysiology of acute compartment syndrome is still debated,3 the most commonly accepted theory is the arteriovenous pressure gradient theory.4 In this theory, the rise in intracompartment pressure increases venous pressure, which in turn reduces the arteriovenous pressure gradient, reducing local tissue perfusion. The reduction in tissue perfusion, coupled with a reduction in venous drainage, causes significant tissue edema. This change in vascular pressure also causes a reduction in lymphatic drainage, further increasing pressure in the compartment. Finally, the edematous tissue compresses the arterioles leading to end-organ ischemia.
Initially an absolute threshold compartment pressure was thought to cause irreversible tissue ischemia
In 1996, McQueen and Court-Brown6 prospectively admitted all tibial diaphyseal fractures and continuously monitored their anterior compartment pressure. Using a delta pressure value of less than 30 mm Hg, only three patients were diagnosed with acute compartment syndrome and required fasciotomy. The patients’ absolute compartment pressures were 45 mm Hg, 65 mm Hg, and 75 mm Hg, while the delta pressures were 15 mm Hg, 10 mm Hg, and 15 mm Hg, respectively. Conversely, 53 patients had absolute compartment pressures over 30 mm Hg; 30 patients had pressure over 40 mm Hg; four patients had pressure over 50 mm Hg; and none required fasciotomy. This study highlights that the absolute compartment pressure is not helpful in making the diagnosis, and it is the elevated delta pressure that secures the diagnosis.
Etiology
Compartment syndrome is the end result of many different injury patterns. While fracture is the number one cause of compartment syndrome, many types of soft tissue injuries can also lead to compartment syndrome. Nonfracture etiologies of compartment syndrome are relatively uncommon, and as such can lead to a delay in diagnosis.
Fracture
Almost 70% of all cases of compartment syndrome are due to fracture.1 Fractures of the tibia, distal radius, and ulna are the most common injuries that lead to acute compartment syndrome. Interestingly, acute compartment syndrome is caused by an equal distribution of high-energy and low-energy mechanisms of injuries.1 Because the increase in compartment pressure is highest at the fracture site,9 it is imperative to measure pressures at the site of the fracture. Contrary to traditional teaching, an open fracture does not reduce the risk of compartment syndrome. McQueen and Court-Brown6 found there was no difference in the intracompartment pressure between open and closed fractures.
Fracture reduction and manipulation can actually increase the risk of compartment syndrome. In one case series, fracture manipulation increased compartment pressure by reducing the total volume in a stretched compartment.10 Dresing et al10 found the average pressure increased by 21 mm Hg
McQueen et al11 evaluated the risk factors for the development of acute compartment syndrome from tibial diaphyseal fractures and found that younger patients were at the highest risk. Patients between ages 10 to 19 years old had an odds ratio (OR) of 12.09; 20 to 29 years old had an OR of 9.84; and patients older than age 40 years had an OR of 1.11 As previously stated, younger patients have larger muscle volumes compared to their older counterparts and therefore have less space for edema after the primary muscle injury.
Soft Tissue Injury
Direct soft tissue injury can lead to a rise in compartment pressures due to trauma, infections, and burns even in the absence of fractures. Unfortunately, under these circumstances, patients with direct soft tissue injury are at high risk for a delay in diagnosis.12 The primary injury can be worsened by underlying coagulopathies.1 A circumferential constrictive eschar from burns can also cause external compression to a compartment13 as well as edema, which decreases the compliance of the fascia, leading to a rise in compartment pressure.
Vascular Injuries and Unusual Causes
Arterial Vessel Damage. Injuries to single arterial vessels can also lend to the development of acute compartment syndrome. Arterial damage from high-energy trauma causes acute compartment syndromes due to the rapid development of a hematoma and pressure in affected compartments. Loss of the arterial blood flow from the traumatized artery also causes cell necrosis and edema to the muscle bed, further increasing the compartment pressure. The result of these injuries is the development of acute compartment syndrome in uncommon locations such as the thigh14 and foot.15
Arterial damage from relatively low-energy ankle-inversion injuries have also been implicated in development of acute compartment syndrome of the foot.15 Conversely, damage to branches of an artery may cause symptoms in the compartments of the proximal extremity, but spare the blood flow and pulsations to the distal portion.13 This atypical mechanism of injury requires the physician to maintain a high index of suspicion and consider arteriography and direct pressure management in diagnosis and treatment of this condition.
Deep Vein Thrombosis. Deep vein thrombosis (DVT) can also be associated with acute compartment syndrome. A large clot burden, such as that observed in phlegmasia cerulea dolens, can lead to reduced venous flow and increased pressure, resulting in decreased arteriovenous gradient and tissue perfusion. Acute compartment syndrome caused by extensive DVT is often treated with anticoagulation therapy, thrombolysis or thrombectomy, but fasciotomy also has a role as an adjunct treatment to reduce compartment pressure sufficiently to return blood flow.16
Medication-Induced Compartment Syndrome
Injections of medications or illicit drugs can lead to increased compartment pressure through several independent mechanisms (Table).17 Local tissue vasotoxicity from direct injection of a caustic agent can cause direct muscle necrosis and edema. In addition, prolonged external compression while lying in a coma-like state induced by alcohol intoxication or central nervous system suppressant drugs, or a state of unconsciousness from any cause, can produce direct injury to the compartment (Table).

Diagnosis
Signs and Symptoms
Diagnosis of acute compartment syndrome is primarily clinical, using compartment pressure measurement as an adjunct in evaluation. Because the features of early acute compartment syndrome are nonspecific, a high clinical suspicion must be maintained for all at-risk populations.
The classic features such as pain, pallor, paresthesias, paralysis, and pulselessness are all late findings of acute compartment syndrome and are associated with irreversible damage. However, pain out of proportion to injury and pain with passive stretch of muscles are early symptoms that require further attention and monitoring.8
The earliest objective finding on physical examination is compartment firmness.8 Unfortunately, the sensitivity of physical examination by orthopedic physicians is low (22%-26%) on cadaver models with elevated compartment pressures.18 Peripheral nerve tissue is very sensitive to ischemia and will stop functioning after 75 minutes.9 A review of clinical findings in acute compartment syndrome showed that the positive predictive values of these individual symptoms are low, but there is a high likelihood of compartment syndrome when at least three clinical findings are present simultaneously.19 In patients who are at high risk for developing acute compartment syndrome, but who may not be able to describe or who do not show clear symptoms (eg, patients who are obtunded, intubated, or very young/old), compartment pressure measurement can be a valuable aid in the diagnosis.
Compartment Pressure Measurement
There are several readily available methods to directly measure the compartment pressure. It is imperative to measure the compartment pressure closest to the fracture location (within 5 cm) because the pressure dissipates as distance increases from the fracture site.20
Solid-State Transducer Intracompartmental Catheter. The Stryker Intra-Compartmental Pressure Monitor System (Stryker Surgical) is a commonly used solid-state transducer intracompartmental catheter (STIC) that allows measurement of compartment pressure.
The STIC system consists of a side-port needle, syringe of saline flush, and a digital read-out manometer. It has been validated against commonly used alternatives and found to be accurate21,22 with a confidence interval between ± 5 to 6.23. This device uses a side port needle to allow for testing multiple compartments with the same needle as it is less likely to be occluded by tissue when compared to a standard needle.
The following technique should be employed to properly measure compartment pressure using the Stryker STIC device23:
1. Place the side port needle on the tapered end of the diaphragm chamber.
2. Connect the prefilled syringe of normal saline to the diaphragm chamber.
3. Place the diaphragm chamber in the pressure monitor with the black side down and push until it is seated in the device.
4. Close the cover until it snaps.
5. Place the needle up and fill the system with normal saline from the syringe until there are no air bubbles in the system.
6. Turn the pressure monitor on.
7. Select an intended angle and press the “Zero” button and wait until it reads “00.”
8. Under sterile technique and appropriately anesthetized skin, insert the device into the compartment. Once in the compartment, slowly inject a small amount of saline into the compartment and record the provided number.
For details on needle-placement techniques, including depths, see Figures 1 to 4 for lower extremity compartments and Figures 5 to 7 for upper extremity compartments.24

Arterial Line Transducer System. An arterial pressure monitoring system can be adapted to measure compartment pressures. This technique has been validated against commercially available products.1,7,8
The following technique should be followed to properly measure compartment pressure using an arterial monitoring system25,26:
1. Connect 1 L of normal saline to the pressure-monitoring tubing.
2. Place the normal saline into a pressure bag.
3. Flush the line and all stopcocks in the pressure monitoring tubing.
4. Inflate the pressure bag to 300 mm Hg.
5. “Zero” the system that is level with the compartment you are testing.
6. Connect an 18-gauge spinal needle to the arterial line tubing.
7. Flush fluid through the needle.
8. Under sterile technique and appropriately anesthetized skin, insert the needle into the compartment approximately 2 to 3 cm deep.
9. To confirm the needle is in the correct location, squeeze the compartment to note a transient rise on the monitor.

Laboratory Evaluation
Although the diagnosis of compartment syndrome is made by clinical findings and direct pressure measurement, laboratory tests can support the diagnosis.
Serum creatinine phosphokinase (CPK) is elevated with muscle necrosis. Both CPK and myoglobin proteins are glomerulotoxic, and acute kidney injury is a common complication of acute compartment syndrome. A CPK of greater than 1,000 IU/L has a sensitivity of 0.91 for acute compartment syndrome, but a specificity of only 0.52.2
In a multivariate model for predicting acute compartment syndrome, CPK greater than 4,000 IU/L, chloride greater than 104 mEq/L, and a blood urea nitrogen less than 10 mmol/L were found to be predictive of compartment syndrome during a patient’s hospital admission. No patient had compartment syndrome when all three variables were negative, and all patients with all three positive variables had acute compartment syndrome.22 This model was conducted on admitted patients during their inpatient hospital stay; therefore its application in the ED may not be valid, and the model has yet to be validated prospectively.
Treatment
Prompt surgical consultation for decompressive fasciotomy is paramount to the management of acute compartment syndrome in the ED. When acute compartment syndrome is suspected, elevation of the affected extremity is suggested in an attempt to decrease swelling.27 The optimum height of elevation remains controversial; to prevent a decrease in arterial blood flow, it has been suggested not to raise the affected extremity above the level of the heart.8
A low systemic BP should be corrected to hopefully increase the compartment perfusion, and any applied external compressive forces (eg, casts, splints, dressings, eschars) should be removed.8 Removal of a cast can reduce the intracompartment pressure by 85%.5 Finally, applying cool compresses to the affected region can help reduce edema as a temporizing measure. Direct application of ice to the skin should be avoided to prevent cold-induced injury to the skin.
Appropriate medical resuscitation is imperative to good outcomes. Identifying and intervening when hypotension is present is necessary to improve tissue perfusion. Cellular derangement and death that can lead to hypocalcaemia, hyperkalemia, metabolic acidosis, and renal failure, require prompt recognition and correction.
At-Risk Populations
Pediatric Patients
Diagnosis of acute compartment syndrome in the general pediatric population is very difficult and therefore unfortunately associated with delays in diagnosis. The average time from injury to diagnosis can vary from 18.2to 31.1 hours.28,29 In children younger than age 3 years, 60% of acute compartment syndrome cases are due to trauma; 27% are due to invasive infections; and 13% develop from intravenous (IV) infiltration.30 Supracondylar humerus fractures are associated with increased risk of compartment syndrome. The volar compartment of the forearm is at risk after reduction of the fracture and when the elbow is flexed beyond 90°.31
Intubated and Obtunded Patients
Intubated and obtunded patients require special attention to prevent and/or identify the presence of acute compartment syndrome. Since clinical examination for compartment syndrome in these patients is unreliable, serial or continuous compartment pressure measurements are required to monitor for acute compartment syndrome.
Laboratory analysis, including monitoring of CPK levels, can also help identify developing compartment syndrome in intubated, sedated, or neurologically compromised patients.32 Onset of unexplained myoglobinuria or acute renal failure in an intubated patient should lead to consideration of compartment syndrome. In addition to laboratory studies, examination of atypical locations, such as the back or gluteal compartments, can also assist in identifying compartment syndrome in impaired patients.
Complications
The complications of compartment syndrome can be severe, and are typically organized as early and late stages of the disease.
Early Clinical Complications
Even with prompt diagnosis, acute compartment syndrome can lead to significant metabolic derangements. Patients with compartment syndrome are at significant risk for rhabdomyolysis and resultant renal failure from acute tubal necrosis. Likewise, both myocyte damage and death can cause extracellular electrolyte shifts, and hyperkalemia, metabolic acidosis, and hypocalcemia are frequently encountered under these circumstances.
Late Clinical Complications
Necrotic muscle is a significant risk factor for bacterial superinfection.33 Necrotic muscle may quickly be seeded by bacteria, and lead to sepsis. Necrotic muscle may therefore require repeated debridement and even possible extremity amputation for infection control. Likewise, muscle necrosis can lead to muscle contractures and loss of function of the affected extremity.3
Medicolegal Complications
Delay in the diagnosis of acute compartment syndrome has become an increasing source of medicolegal liability. In a 2004 review by Bhattacharyya and Vrahas34 of 23 years of claims from a medical malpractice insurer, only 19 claims were made for compartment syndrome. In this series, the following four risk factors were associated with an unsuccessful defense: (1) a linear association between the number of documented cardinal signs of compartment syndrome and an indemnity payment; (2) delays in fasciotomy; (3) poor communication with the patient and nursing staff; (4) and failure to intervene after documentation of an abnormal physical finding. All of the above were associated with a negative legal outcome.
Case Conclusion
The patient had a firm anterior compartment, CPK of 9,100 IU/L, normal renal function, compartment pressure of 60 mm Hg, and diastolic pressure of 80 mm Hg at the time of the procedure. Because the patient had a delta pressure of 20 mm Hg, orthopedic services were consulted, and the patient was taken to the operating room, where he underwent a bicompartment fasciotomy of the right lateral calf. The compartments were tense when opened and there was no evidence of myonecrosis. The patient was given continuous IV fluids and observed in the hospital for 2 days as his CPKs trended downward without subsequent renal injury.
Conclusion
Compartment syndrome requires high clinical suspicion for early diagnosis and treatment to prevent major disability. Early recognition of this condition is paramount, as the classical presentation of the five “Ps”—pain, pallor, pulselessness, paresthesias, and paralysis—are all late findings associated with irreversible consequences.
Given the difficulty in establishing the diagnosis by physical examination findings, the emergency physician (EP) should check and monitor compartment pressures when considering the diagnosis of acute compartment syndrome. In patients with acute compartment syndrome, delayed fasciotomies lead to poor outcomes and a 10-fold increase in surgical complications, such as infection and renal failure.35
Although traumatic fractures are the most common cause of acute compartment syndrome, EPs must also recognize that obtundation, intubation, coagulopathies, and seemingly minor traumas all can potentially cause or lead to acute compartment syndrome.
1. McQueen MM, Gaston P, Court-Brown CM. Acute compartment syndrome. Who is at risk? J Bone Joint Surg Br. 2000;82(2):200-203.
2. Klenerman L. The evolution of the compartment syndrome since 1948 as recorded in the JBJS (B). J Bone Joint Surg Br. 2007;89(10):1280-1282. doi:10.1302/0301-620X.89B10.19717.
3. Frink M, Hildebrand F, Krettek C, Brand J, Hankemeier S. Compartment syndrome of the lower leg and foot. Clin Orthop Relat Res. 2010;468(4):940-950. doi:10.1007/s11999-009-0891-x.
4. Elliott KG, Johnstone AJ. Diagnosing acute compartment syndrome. J Bone Joint Surg Br. 2003;85(5):625-632.
5. Gourgiotis S, Villias C, Germanos S, Foukas A, Ridolfini MP. Acute limb compartment syndrome: a review. J Surg Educ. 2007;64(3):178-186. doi:10.1016/j.jsurg.2007.03.006.
6. McQueen MM, Court-Brown CM. Compartment monitoring in tibial fractures. The pressure threshold for decompression. J Bone Joint Surg Br. 1996;78(1):99-104.
7. Szabo RM, Gelberman RH, Williamson RV, Hargens AR. Effects of increased systemic blood pressure on the tissue fluid pressure threshold of peripheral nerve. J Orthop Res. 1983;1(2):172-178. doi:10.1002/jor.1100010208.
8. Olson SA, Glasgow RR. Acute compartment syndrome in lower extremity musculoskeletal trauma. J Am Acad Orthop Surg. 2005;13(7):436-444.
9. Matava MJ, Whitesides TE Jr, Seiler JG 3rd, Hewan-Lowe K, Hutton WC. Determination of the compartment pressure threshold of muscle ischemia in a canine model. J Trauma. 1994;37(1):50-58.
10. Dresing K, Peterson T, Schmit-Neuerburg KP. Compartment pressure in the carpal tunnel in distal fractures of the radius. A prospective study. Arch Orthop Trauma Surg. 1994;113(5):285-289.
11. McQueen MM, Duckworth AD, Aitken SA, Sharma RA, Court-Brown CM. Predictors of compartment syndrome after tibial fracture. J Orthop Trauma. 2015;29(10):451-455. doi:10.1097/BOT.0000000000000347.
12. Hope MJ, McQueen MM. Acute compartment syndrome in the absence of fracture. J Orthop Trauma. 2004;18(4):220-224.
13. Perron AD, Brady WJ, Keats TE. Orthopedic pitfalls in the ED: acute compartment syndrome. Am J Emerg Med. 2001;19:413-416. doi:10.1053/ajem.2001.24464.
14. Suzuki T, Moirmura N, Kawai K, Sugiyama M. Arterial injury associated with acute compartment syndrome of the thigh following blunt trauma. Injury. 2005;36(1):151-159. doi:10.1016/j.injury.2004.03.022.
15. Dhawan A, Doukas WC. Acute compartment syndrome of the foot following an inversion injury of the ankle with disruption of the anterior tibial artery. A case report. J Bone Joint Surg Am. 2003;85-A(3):528-532.
16. Rahm M, Probe R. Extensive deep venous thrombosis resulting in compartment syndrome of the thigh and leg. A case report. J Bone Joint Surg Am. 1994;76(12):1854-1857.
17. Franc-Law JM, Rossignol M, Vernec A, Somogyi D, Shrier I. Poisoning-induced acute atraumatic compartment syndrome. Am J Emerg Med. 2000;18(5):616-621. doi:10.1053/ajem.2000.9271.
18. Shuler FD, Dietz MJ. Physicians’ ability to manually detect isolated elevations in leg intracompartmental pressure. J Bone Joint Surg Am. 2010;92(2):361-367. doi:10.2106/JBJS.I.00411.
19. Ulmer T. The clinical diagnosis of compartment syndrome of the lower leg: are clinical findings predictive of the disorder? J Orthop Trauma. 2002;16(8):572-577.
20. Heckman MM, Whitesides TE Jr, Grewe SR, Rooks MD. Compartment pressure in association with closed tibial fractures. The relationship between tissue pressure, compartment, and the distance from the site of the fracture. J Bone Joint Surg Am. 1994;76(9):1285-1292.
21. Boody AR, Wongworawat MD. Accuracy in the measurement of compartment pressures: a comparison of three commonly used devices. J Bone Joint Surg Am. 2005;87(11):2415-2422. doi:10.2106/JBJS.D.02826.
22. Uliasz A, Ishida JT, Fleming JK, Yamamoto LG. Comparing the methods of measuring compartment pressures in acute compartment syndrome. Am J Emerg Med. 2003;21(2):143-145. doi:10.1053/ajem.2003.50035.
23. Intra-compartmental Pressure Monitor System (product information #295-1). Kalamazoo, MI: Stryker Instruments; 2006. http://lcaudill.fatcow.com/wp-content/uploads/2014/08/Quick-Measure-set-Compartment.pdf. Accessed February 9, 2017.
24. Custalow C. Color Atlas of Emergency Department Procedures. Philadelphia, PA: Saunders; 2004.
25. McCanny P, Colreavy F, Bakker J; European Society of Intensive Care Medicine. An ESICM multidisciplinary distance learning programme for intensive care training. Haemodynamic monitoring and management: skills and techniques 2013. http://pact.esicm.org/media/HaemMon%20and%20Mgt%208%20April%202013%20final.pdf. Accessed February 15, 2017.
26. Jagminas L, Schraga ED. Compartment Pressure Measurement Technique. http://emedicine.medscape.com/article/140002-technique. Updated May 16, 2016. Accessed February 9, 2017.
27. Garner MR, Taylor SA, Gausden E, Lyden JP. Compartment syndrome: diagnosis, management, and unique concerns in the twenty-first century. HSS J. 2014;10(2):143-152. doi:10.1007/s11420-014-9386-8.
28. Flynn JM, Bashyal RK, Yeger-McKeever M, Garner MR, Launay F, Sponseller PD. Acute traumatic compartment syndrome of the leg in children: diagnosis and outcome. J Bone Joint Surg Am. 2011;93(10):937-941. doi:10.2106/JBJS.J.00285.
29. Valdez C, Schroeder E, Amdur R, Pascual J, Sarani B. Serum creatine kinase levels are associated with extremity compartment syndrome. J Trauma Acute Care Surg. 2013;74(2):441-445; discussion 445-447. doi:10.1097/TA.0b013e31827a0a36.
30. Broom A, Schur MD, Arkader A, Flynn J, Gornitzky A, Choi PD. Compartment syndrome in infants and toddlers. J Child Orthop. 2016;10(5):453-460. doi:10.1007/s11832-016-0766-0.
31. Hosseinzadeh P, Hayes CB. Compartment syndrome in children. Orthop Clin North Am. 2016;47(3):579-587. doi:10.1016/j.ocl.2016.02.004.
32. Shadgan B, Menon M, O’Brien PJ, Reid WD. Diagnostic techniques in acute compartment syndrome of the leg. J Orthop Trauma. 2008;22(8):581-587. doi:10.1097/BOT.0b013e318183136d.
33. von Keudell AG, Weaver MJ, Appleton PT, et al. Diagnosis and treatment of acute extremity compartment syndrome. Lancet. 2015;386:1299-1310. doi:10.1016/S0140-6736(15)00277-9.
34. Bhattacharyya T, Vrahas MS. The medical-legal aspects of compartment syndrome. J Bone Joint Surg Am. 2004;86-A(4):864-868.
35. Sheridan GW, Matsen FA 3rd. Fasciotomy in the treatment of the acute compartment syndrome. J Bone Joint Surg Am. 1976;58(1):112-115.
Acute extremity pain is a common presentation seen daily in EDs. While most etiologies of extremity pain are benign, the complications of acute compartment syndrome are associated with significant morbidity. Moreover, acute compartment syndrome remains a difficult diagnosis that is often missed on initial presentation. Morbidity results from an increased pressure in an anatomically closed space, progressing to decreased perfusion and rapid tissue destruction.
Case
An obese 55-year-old man with a medical history of coronary artery disease, for which he was on aspirin therapy, presented for evaluation of right shin pain. The patient stated that he completed a 5-km race earlier that morning with his son. Immediately following the race, he experienced increasing right shin pain, which he attempted to initially manage with ice compresses and over-the-counter ibuprofen. He noted that neither the ice compresses nor the ibuprofen relieved his pain and that by 5:00
Upon arrival at the ED, the patient was ambulatory but had significant pain at both rest and movement. His vital signs and his oxygen saturation on room air were normal. On physical examination, he had normal sensation to the entire right lower extremity and had equal pulses in both feet. The anterolateral aspect of the shin was exquisitely tender to light touch, and the patient was unable to dorsiflex or plantar flex without extreme pain. On passive dorsiflexion and plantar flexion of his right foot, he had exquisite pain. On palpation, the anterior shin was firm compared to the other muscle beds.
Epidemiology
Acute compartment syndrome—elevation of interstitial pressure in closed fascial compartment—affects 10 times as many men as women, at an average age of 32 years old and with an annual incidence of 7.3 per 100,000 men and 0.7 per 100,000 for women.1 McQueen et al1 found that the most common cause of acute compartment syndrome was fracture (69%), followed by soft tissue injury (23%). Younger patients are more likely to develop acute compartment syndrome from trauma because they typically have larger muscle beds with more tissue to become edematous compared to the older, hypotrophic muscles of elderly patients.
Pathophysiology
The fascia surrounds the major muscle groups and neurovascular bundles in the extremities to create distinct compartments. Since the fascia is not a compliant structure, it is typically not able to tolerate increases in volume or pressure in a given compartment. Compartment perfusion pressure is the mean arterial pressure minus the compartment pressure. Normal compartment pressure in adults is between 0 to 8 mm Hg.2 When compartment perfusion pressures are below 70 to 80 mm Hg, there is an increased risk of compartment syndrome.
Although the exact pathophysiology of acute compartment syndrome is still debated,3 the most commonly accepted theory is the arteriovenous pressure gradient theory.4 In this theory, the rise in intracompartment pressure increases venous pressure, which in turn reduces the arteriovenous pressure gradient, reducing local tissue perfusion. The reduction in tissue perfusion, coupled with a reduction in venous drainage, causes significant tissue edema. This change in vascular pressure also causes a reduction in lymphatic drainage, further increasing pressure in the compartment. Finally, the edematous tissue compresses the arterioles leading to end-organ ischemia.
Initially an absolute threshold compartment pressure was thought to cause irreversible tissue ischemia
In 1996, McQueen and Court-Brown6 prospectively admitted all tibial diaphyseal fractures and continuously monitored their anterior compartment pressure. Using a delta pressure value of less than 30 mm Hg, only three patients were diagnosed with acute compartment syndrome and required fasciotomy. The patients’ absolute compartment pressures were 45 mm Hg, 65 mm Hg, and 75 mm Hg, while the delta pressures were 15 mm Hg, 10 mm Hg, and 15 mm Hg, respectively. Conversely, 53 patients had absolute compartment pressures over 30 mm Hg; 30 patients had pressure over 40 mm Hg; four patients had pressure over 50 mm Hg; and none required fasciotomy. This study highlights that the absolute compartment pressure is not helpful in making the diagnosis, and it is the elevated delta pressure that secures the diagnosis.
Etiology
Compartment syndrome is the end result of many different injury patterns. While fracture is the number one cause of compartment syndrome, many types of soft tissue injuries can also lead to compartment syndrome. Nonfracture etiologies of compartment syndrome are relatively uncommon, and as such can lead to a delay in diagnosis.
Fracture
Almost 70% of all cases of compartment syndrome are due to fracture.1 Fractures of the tibia, distal radius, and ulna are the most common injuries that lead to acute compartment syndrome. Interestingly, acute compartment syndrome is caused by an equal distribution of high-energy and low-energy mechanisms of injuries.1 Because the increase in compartment pressure is highest at the fracture site,9 it is imperative to measure pressures at the site of the fracture. Contrary to traditional teaching, an open fracture does not reduce the risk of compartment syndrome. McQueen and Court-Brown6 found there was no difference in the intracompartment pressure between open and closed fractures.
Fracture reduction and manipulation can actually increase the risk of compartment syndrome. In one case series, fracture manipulation increased compartment pressure by reducing the total volume in a stretched compartment.10 Dresing et al10 found the average pressure increased by 21 mm Hg
McQueen et al11 evaluated the risk factors for the development of acute compartment syndrome from tibial diaphyseal fractures and found that younger patients were at the highest risk. Patients between ages 10 to 19 years old had an odds ratio (OR) of 12.09; 20 to 29 years old had an OR of 9.84; and patients older than age 40 years had an OR of 1.11 As previously stated, younger patients have larger muscle volumes compared to their older counterparts and therefore have less space for edema after the primary muscle injury.
Soft Tissue Injury
Direct soft tissue injury can lead to a rise in compartment pressures due to trauma, infections, and burns even in the absence of fractures. Unfortunately, under these circumstances, patients with direct soft tissue injury are at high risk for a delay in diagnosis.12 The primary injury can be worsened by underlying coagulopathies.1 A circumferential constrictive eschar from burns can also cause external compression to a compartment13 as well as edema, which decreases the compliance of the fascia, leading to a rise in compartment pressure.
Vascular Injuries and Unusual Causes
Arterial Vessel Damage. Injuries to single arterial vessels can also lend to the development of acute compartment syndrome. Arterial damage from high-energy trauma causes acute compartment syndromes due to the rapid development of a hematoma and pressure in affected compartments. Loss of the arterial blood flow from the traumatized artery also causes cell necrosis and edema to the muscle bed, further increasing the compartment pressure. The result of these injuries is the development of acute compartment syndrome in uncommon locations such as the thigh14 and foot.15
Arterial damage from relatively low-energy ankle-inversion injuries have also been implicated in development of acute compartment syndrome of the foot.15 Conversely, damage to branches of an artery may cause symptoms in the compartments of the proximal extremity, but spare the blood flow and pulsations to the distal portion.13 This atypical mechanism of injury requires the physician to maintain a high index of suspicion and consider arteriography and direct pressure management in diagnosis and treatment of this condition.
Deep Vein Thrombosis. Deep vein thrombosis (DVT) can also be associated with acute compartment syndrome. A large clot burden, such as that observed in phlegmasia cerulea dolens, can lead to reduced venous flow and increased pressure, resulting in decreased arteriovenous gradient and tissue perfusion. Acute compartment syndrome caused by extensive DVT is often treated with anticoagulation therapy, thrombolysis or thrombectomy, but fasciotomy also has a role as an adjunct treatment to reduce compartment pressure sufficiently to return blood flow.16
Medication-Induced Compartment Syndrome
Injections of medications or illicit drugs can lead to increased compartment pressure through several independent mechanisms (Table).17 Local tissue vasotoxicity from direct injection of a caustic agent can cause direct muscle necrosis and edema. In addition, prolonged external compression while lying in a coma-like state induced by alcohol intoxication or central nervous system suppressant drugs, or a state of unconsciousness from any cause, can produce direct injury to the compartment (Table).
Diagnosis
Signs and Symptoms
Diagnosis of acute compartment syndrome is primarily clinical, using compartment pressure measurement as an adjunct in evaluation. Because the features of early acute compartment syndrome are nonspecific, a high clinical suspicion must be maintained for all at-risk populations.
The classic features such as pain, pallor, paresthesias, paralysis, and pulselessness are all late findings of acute compartment syndrome and are associated with irreversible damage. However, pain out of proportion to injury and pain with passive stretch of muscles are early symptoms that require further attention and monitoring.8
The earliest objective finding on physical examination is compartment firmness.8 Unfortunately, the sensitivity of physical examination by orthopedic physicians is low (22%-26%) on cadaver models with elevated compartment pressures.18 Peripheral nerve tissue is very sensitive to ischemia and will stop functioning after 75 minutes.9 A review of clinical findings in acute compartment syndrome showed that the positive predictive values of these individual symptoms are low, but there is a high likelihood of compartment syndrome when at least three clinical findings are present simultaneously.19 In patients who are at high risk for developing acute compartment syndrome, but who may not be able to describe or who do not show clear symptoms (eg, patients who are obtunded, intubated, or very young/old), compartment pressure measurement can be a valuable aid in the diagnosis.
Compartment Pressure Measurement
There are several readily available methods to directly measure the compartment pressure. It is imperative to measure the compartment pressure closest to the fracture location (within 5 cm) because the pressure dissipates as distance increases from the fracture site.20
Solid-State Transducer Intracompartmental Catheter. The Stryker Intra-Compartmental Pressure Monitor System (Stryker Surgical) is a commonly used solid-state transducer intracompartmental catheter (STIC) that allows measurement of compartment pressure.
The STIC system consists of a side-port needle, syringe of saline flush, and a digital read-out manometer. It has been validated against commonly used alternatives and found to be accurate21,22 with a confidence interval between ± 5 to 6.23. This device uses a side port needle to allow for testing multiple compartments with the same needle as it is less likely to be occluded by tissue when compared to a standard needle.
The following technique should be employed to properly measure compartment pressure using the Stryker STIC device23:
1. Place the side port needle on the tapered end of the diaphragm chamber.
2. Connect the prefilled syringe of normal saline to the diaphragm chamber.
3. Place the diaphragm chamber in the pressure monitor with the black side down and push until it is seated in the device.
4. Close the cover until it snaps.
5. Place the needle up and fill the system with normal saline from the syringe until there are no air bubbles in the system.
6. Turn the pressure monitor on.
7. Select an intended angle and press the “Zero” button and wait until it reads “00.”
8. Under sterile technique and appropriately anesthetized skin, insert the device into the compartment. Once in the compartment, slowly inject a small amount of saline into the compartment and record the provided number.
For details on needle-placement techniques, including depths, see Figures 1 to 4 for lower extremity compartments and Figures 5 to 7 for upper extremity compartments.24
Arterial Line Transducer System. An arterial pressure monitoring system can be adapted to measure compartment pressures. This technique has been validated against commercially available products.1,7,8
The following technique should be followed to properly measure compartment pressure using an arterial monitoring system25,26:
1. Connect 1 L of normal saline to the pressure-monitoring tubing.
2. Place the normal saline into a pressure bag.
3. Flush the line and all stopcocks in the pressure monitoring tubing.
4. Inflate the pressure bag to 300 mm Hg.
5. “Zero” the system that is level with the compartment you are testing.
6. Connect an 18-gauge spinal needle to the arterial line tubing.
7. Flush fluid through the needle.
8. Under sterile technique and appropriately anesthetized skin, insert the needle into the compartment approximately 2 to 3 cm deep.
9. To confirm the needle is in the correct location, squeeze the compartment to note a transient rise on the monitor.
Laboratory Evaluation
Although the diagnosis of compartment syndrome is made by clinical findings and direct pressure measurement, laboratory tests can support the diagnosis.
Serum creatinine phosphokinase (CPK) is elevated with muscle necrosis. Both CPK and myoglobin proteins are glomerulotoxic, and acute kidney injury is a common complication of acute compartment syndrome. A CPK of greater than 1,000 IU/L has a sensitivity of 0.91 for acute compartment syndrome, but a specificity of only 0.52.2
In a multivariate model for predicting acute compartment syndrome, CPK greater than 4,000 IU/L, chloride greater than 104 mEq/L, and a blood urea nitrogen less than 10 mmol/L were found to be predictive of compartment syndrome during a patient’s hospital admission. No patient had compartment syndrome when all three variables were negative, and all patients with all three positive variables had acute compartment syndrome.22 This model was conducted on admitted patients during their inpatient hospital stay; therefore its application in the ED may not be valid, and the model has yet to be validated prospectively.
Treatment
Prompt surgical consultation for decompressive fasciotomy is paramount to the management of acute compartment syndrome in the ED. When acute compartment syndrome is suspected, elevation of the affected extremity is suggested in an attempt to decrease swelling.27 The optimum height of elevation remains controversial; to prevent a decrease in arterial blood flow, it has been suggested not to raise the affected extremity above the level of the heart.8
A low systemic BP should be corrected to hopefully increase the compartment perfusion, and any applied external compressive forces (eg, casts, splints, dressings, eschars) should be removed.8 Removal of a cast can reduce the intracompartment pressure by 85%.5 Finally, applying cool compresses to the affected region can help reduce edema as a temporizing measure. Direct application of ice to the skin should be avoided to prevent cold-induced injury to the skin.
Appropriate medical resuscitation is imperative to good outcomes. Identifying and intervening when hypotension is present is necessary to improve tissue perfusion. Cellular derangement and death that can lead to hypocalcaemia, hyperkalemia, metabolic acidosis, and renal failure, require prompt recognition and correction.
At-Risk Populations
Pediatric Patients
Diagnosis of acute compartment syndrome in the general pediatric population is very difficult and therefore unfortunately associated with delays in diagnosis. The average time from injury to diagnosis can vary from 18.2to 31.1 hours.28,29 In children younger than age 3 years, 60% of acute compartment syndrome cases are due to trauma; 27% are due to invasive infections; and 13% develop from intravenous (IV) infiltration.30 Supracondylar humerus fractures are associated with increased risk of compartment syndrome. The volar compartment of the forearm is at risk after reduction of the fracture and when the elbow is flexed beyond 90°.31
Intubated and Obtunded Patients
Intubated and obtunded patients require special attention to prevent and/or identify the presence of acute compartment syndrome. Since clinical examination for compartment syndrome in these patients is unreliable, serial or continuous compartment pressure measurements are required to monitor for acute compartment syndrome.
Laboratory analysis, including monitoring of CPK levels, can also help identify developing compartment syndrome in intubated, sedated, or neurologically compromised patients.32 Onset of unexplained myoglobinuria or acute renal failure in an intubated patient should lead to consideration of compartment syndrome. In addition to laboratory studies, examination of atypical locations, such as the back or gluteal compartments, can also assist in identifying compartment syndrome in impaired patients.
Complications
The complications of compartment syndrome can be severe, and are typically organized as early and late stages of the disease.
Early Clinical Complications
Even with prompt diagnosis, acute compartment syndrome can lead to significant metabolic derangements. Patients with compartment syndrome are at significant risk for rhabdomyolysis and resultant renal failure from acute tubal necrosis. Likewise, both myocyte damage and death can cause extracellular electrolyte shifts, and hyperkalemia, metabolic acidosis, and hypocalcemia are frequently encountered under these circumstances.
Late Clinical Complications
Necrotic muscle is a significant risk factor for bacterial superinfection.33 Necrotic muscle may quickly be seeded by bacteria, and lead to sepsis. Necrotic muscle may therefore require repeated debridement and even possible extremity amputation for infection control. Likewise, muscle necrosis can lead to muscle contractures and loss of function of the affected extremity.3
Medicolegal Complications
Delay in the diagnosis of acute compartment syndrome has become an increasing source of medicolegal liability. In a 2004 review by Bhattacharyya and Vrahas34 of 23 years of claims from a medical malpractice insurer, only 19 claims were made for compartment syndrome. In this series, the following four risk factors were associated with an unsuccessful defense: (1) a linear association between the number of documented cardinal signs of compartment syndrome and an indemnity payment; (2) delays in fasciotomy; (3) poor communication with the patient and nursing staff; (4) and failure to intervene after documentation of an abnormal physical finding. All of the above were associated with a negative legal outcome.
Case Conclusion
The patient had a firm anterior compartment, CPK of 9,100 IU/L, normal renal function, compartment pressure of 60 mm Hg, and diastolic pressure of 80 mm Hg at the time of the procedure. Because the patient had a delta pressure of 20 mm Hg, orthopedic services were consulted, and the patient was taken to the operating room, where he underwent a bicompartment fasciotomy of the right lateral calf. The compartments were tense when opened and there was no evidence of myonecrosis. The patient was given continuous IV fluids and observed in the hospital for 2 days as his CPKs trended downward without subsequent renal injury.
Conclusion
Compartment syndrome requires high clinical suspicion for early diagnosis and treatment to prevent major disability. Early recognition of this condition is paramount, as the classical presentation of the five “Ps”—pain, pallor, pulselessness, paresthesias, and paralysis—are all late findings associated with irreversible consequences.
Given the difficulty in establishing the diagnosis by physical examination findings, the emergency physician (EP) should check and monitor compartment pressures when considering the diagnosis of acute compartment syndrome. In patients with acute compartment syndrome, delayed fasciotomies lead to poor outcomes and a 10-fold increase in surgical complications, such as infection and renal failure.35
Although traumatic fractures are the most common cause of acute compartment syndrome, EPs must also recognize that obtundation, intubation, coagulopathies, and seemingly minor traumas all can potentially cause or lead to acute compartment syndrome.
1. McQueen MM, Gaston P, Court-Brown CM. Acute compartment syndrome. Who is at risk? J Bone Joint Surg Br. 2000;82(2):200-203.
2. Klenerman L. The evolution of the compartment syndrome since 1948 as recorded in the JBJS (B). J Bone Joint Surg Br. 2007;89(10):1280-1282. doi:10.1302/0301-620X.89B10.19717.
3. Frink M, Hildebrand F, Krettek C, Brand J, Hankemeier S. Compartment syndrome of the lower leg and foot. Clin Orthop Relat Res. 2010;468(4):940-950. doi:10.1007/s11999-009-0891-x.
4. Elliott KG, Johnstone AJ. Diagnosing acute compartment syndrome. J Bone Joint Surg Br. 2003;85(5):625-632.
5. Gourgiotis S, Villias C, Germanos S, Foukas A, Ridolfini MP. Acute limb compartment syndrome: a review. J Surg Educ. 2007;64(3):178-186. doi:10.1016/j.jsurg.2007.03.006.
6. McQueen MM, Court-Brown CM. Compartment monitoring in tibial fractures. The pressure threshold for decompression. J Bone Joint Surg Br. 1996;78(1):99-104.
7. Szabo RM, Gelberman RH, Williamson RV, Hargens AR. Effects of increased systemic blood pressure on the tissue fluid pressure threshold of peripheral nerve. J Orthop Res. 1983;1(2):172-178. doi:10.1002/jor.1100010208.
8. Olson SA, Glasgow RR. Acute compartment syndrome in lower extremity musculoskeletal trauma. J Am Acad Orthop Surg. 2005;13(7):436-444.
9. Matava MJ, Whitesides TE Jr, Seiler JG 3rd, Hewan-Lowe K, Hutton WC. Determination of the compartment pressure threshold of muscle ischemia in a canine model. J Trauma. 1994;37(1):50-58.
10. Dresing K, Peterson T, Schmit-Neuerburg KP. Compartment pressure in the carpal tunnel in distal fractures of the radius. A prospective study. Arch Orthop Trauma Surg. 1994;113(5):285-289.
11. McQueen MM, Duckworth AD, Aitken SA, Sharma RA, Court-Brown CM. Predictors of compartment syndrome after tibial fracture. J Orthop Trauma. 2015;29(10):451-455. doi:10.1097/BOT.0000000000000347.
12. Hope MJ, McQueen MM. Acute compartment syndrome in the absence of fracture. J Orthop Trauma. 2004;18(4):220-224.
13. Perron AD, Brady WJ, Keats TE. Orthopedic pitfalls in the ED: acute compartment syndrome. Am J Emerg Med. 2001;19:413-416. doi:10.1053/ajem.2001.24464.
14. Suzuki T, Moirmura N, Kawai K, Sugiyama M. Arterial injury associated with acute compartment syndrome of the thigh following blunt trauma. Injury. 2005;36(1):151-159. doi:10.1016/j.injury.2004.03.022.
15. Dhawan A, Doukas WC. Acute compartment syndrome of the foot following an inversion injury of the ankle with disruption of the anterior tibial artery. A case report. J Bone Joint Surg Am. 2003;85-A(3):528-532.
16. Rahm M, Probe R. Extensive deep venous thrombosis resulting in compartment syndrome of the thigh and leg. A case report. J Bone Joint Surg Am. 1994;76(12):1854-1857.
17. Franc-Law JM, Rossignol M, Vernec A, Somogyi D, Shrier I. Poisoning-induced acute atraumatic compartment syndrome. Am J Emerg Med. 2000;18(5):616-621. doi:10.1053/ajem.2000.9271.
18. Shuler FD, Dietz MJ. Physicians’ ability to manually detect isolated elevations in leg intracompartmental pressure. J Bone Joint Surg Am. 2010;92(2):361-367. doi:10.2106/JBJS.I.00411.
19. Ulmer T. The clinical diagnosis of compartment syndrome of the lower leg: are clinical findings predictive of the disorder? J Orthop Trauma. 2002;16(8):572-577.
20. Heckman MM, Whitesides TE Jr, Grewe SR, Rooks MD. Compartment pressure in association with closed tibial fractures. The relationship between tissue pressure, compartment, and the distance from the site of the fracture. J Bone Joint Surg Am. 1994;76(9):1285-1292.
21. Boody AR, Wongworawat MD. Accuracy in the measurement of compartment pressures: a comparison of three commonly used devices. J Bone Joint Surg Am. 2005;87(11):2415-2422. doi:10.2106/JBJS.D.02826.
22. Uliasz A, Ishida JT, Fleming JK, Yamamoto LG. Comparing the methods of measuring compartment pressures in acute compartment syndrome. Am J Emerg Med. 2003;21(2):143-145. doi:10.1053/ajem.2003.50035.
23. Intra-compartmental Pressure Monitor System (product information #295-1). Kalamazoo, MI: Stryker Instruments; 2006. http://lcaudill.fatcow.com/wp-content/uploads/2014/08/Quick-Measure-set-Compartment.pdf. Accessed February 9, 2017.
24. Custalow C. Color Atlas of Emergency Department Procedures. Philadelphia, PA: Saunders; 2004.
25. McCanny P, Colreavy F, Bakker J; European Society of Intensive Care Medicine. An ESICM multidisciplinary distance learning programme for intensive care training. Haemodynamic monitoring and management: skills and techniques 2013. http://pact.esicm.org/media/HaemMon%20and%20Mgt%208%20April%202013%20final.pdf. Accessed February 15, 2017.
26. Jagminas L, Schraga ED. Compartment Pressure Measurement Technique. http://emedicine.medscape.com/article/140002-technique. Updated May 16, 2016. Accessed February 9, 2017.
27. Garner MR, Taylor SA, Gausden E, Lyden JP. Compartment syndrome: diagnosis, management, and unique concerns in the twenty-first century. HSS J. 2014;10(2):143-152. doi:10.1007/s11420-014-9386-8.
28. Flynn JM, Bashyal RK, Yeger-McKeever M, Garner MR, Launay F, Sponseller PD. Acute traumatic compartment syndrome of the leg in children: diagnosis and outcome. J Bone Joint Surg Am. 2011;93(10):937-941. doi:10.2106/JBJS.J.00285.
29. Valdez C, Schroeder E, Amdur R, Pascual J, Sarani B. Serum creatine kinase levels are associated with extremity compartment syndrome. J Trauma Acute Care Surg. 2013;74(2):441-445; discussion 445-447. doi:10.1097/TA.0b013e31827a0a36.
30. Broom A, Schur MD, Arkader A, Flynn J, Gornitzky A, Choi PD. Compartment syndrome in infants and toddlers. J Child Orthop. 2016;10(5):453-460. doi:10.1007/s11832-016-0766-0.
31. Hosseinzadeh P, Hayes CB. Compartment syndrome in children. Orthop Clin North Am. 2016;47(3):579-587. doi:10.1016/j.ocl.2016.02.004.
32. Shadgan B, Menon M, O’Brien PJ, Reid WD. Diagnostic techniques in acute compartment syndrome of the leg. J Orthop Trauma. 2008;22(8):581-587. doi:10.1097/BOT.0b013e318183136d.
33. von Keudell AG, Weaver MJ, Appleton PT, et al. Diagnosis and treatment of acute extremity compartment syndrome. Lancet. 2015;386:1299-1310. doi:10.1016/S0140-6736(15)00277-9.
34. Bhattacharyya T, Vrahas MS. The medical-legal aspects of compartment syndrome. J Bone Joint Surg Am. 2004;86-A(4):864-868.
35. Sheridan GW, Matsen FA 3rd. Fasciotomy in the treatment of the acute compartment syndrome. J Bone Joint Surg Am. 1976;58(1):112-115.

Who Overdoses on Opioids at a VA Emergency Department?
Editor’s Note: This article has been adapted from an article originally published in Federal Practitioner (Clement C, Stock C. Who overdoses at a VA emergency department? Fed Prac. 2016;33[11]:14-19. http://www.fedprac.com).
Overdose deaths remain epidemic throughout the United States. The rates of unintentional overdose deaths, increasing by 137% between 2000 and 2014, have been driven by a 4-fold increase in prescription opioid overdoses during that period.1-3
Veterans died of accidental overdose at a rate of 19.85 deaths/100,000 people compared with a rate of 10.49 deaths in the general population, based on 2005 data.4 There is wide state-by-state variation, with the lowest age-adjusted opioid overdose death rate of 1.9 deaths/100,000 person-years among veterans in Mississippi and the highest rate in Utah of 33.9 deaths/100,000 person-years, using 2001 to 2009 data.5 These data can be compared with a crude general population overdose death rate of 10.6 deaths per 100,000 person-years in Mississippi and 18.4 deaths per 100,000 person-years in the general Utah population during that same period.6
Overdose deaths in the United States occur most often in persons aged 25 to 54 years.7 Older age has been associated with iatrogenic opioid overdose in hospitalized patients.8 Pulmonary disease, cardiovascular disease (CVD), and psychiatric disorders, including past or present substance use, have been associated with an increased risk of opioid overdose.9 However, veterans with substance use disorders are less likely to be prescribed opioids than are nonveterans with substance use disorders.10 Also, concomitant use of sedating medications, such as benzodiazepines (BZDs), can increase mortality from opioid overdose.11 Patients prescribed opioids for chronic pain conditions often take BZDs for various reasons.12 Veterans seem more likely to receive opioids to treat chronic pain but at lower average daily doses than doses prescribed to nonveterans.10
Emergency management of life-threatening opioid overdose includes prompt administration of naloxone.13 Naloxone is approved by the US Food and Drug Administration for complete or partial reversal of opioid-induced clinical effects, most critically respiratory depression.14,15 Naloxone administration in the ED may serve as a surrogate for an overdose event. During the study period, naloxone take-home kits were not available in the Veterans Affairs (VA) setting.
A 2010 ED study described demographic information and comorbidities in opioid overdose, but the study did not include veterans.16 The clinical characteristics of veterans treated for opioid overdose have not been published. Because identifying characteristics of veterans who overdose may help tailor overdose-prevention efforts, the objective of this study is to describe clinical characteristics of veterans treated for opioid overdose.
Methods
A retrospective chart review and archived data study was approved by the University of Utah and VA Institutional Review Boards, and conducted at the George E. Wahlen Veterans Affairs Medical Center (VAMC) in Salt Lake City, Utah. This chart review included veterans who were admitted to the ED and treated with naloxone between January 1, 2009 and January 1, 2013.
The authors used the Pharmacy Benefits Management Data Manager to extract data from the VA Data Warehouse and verified the data by open chart review (Table). The following data were collected: ED visit date (overdose date); demographic information, including age, gender, and race; evidence of next of kin or other contact at the same address as the veteran; diagnoses based on International Classification of Diseases, 9th Revision (ICD-9) codes, including sleep apnea, obesity, cardiac disease, pulmonary disease, mental health diagnoses (ICD-9 codes 290-302 [wild card characters (*) included many subdiagnoses]), cancer, and substance use disorders and/or dependencies (SUDD); tobacco use; VA-issued prescription opioid and BZD availability, including dose, fill dates, quantities dispensed, and day supplies; specialty of opioid prescriber; urine-drug screening (UDS) results; and outcome of the overdose.

No standardized research criteria identify overdose in medical chart review.17 For each identified patient, the authors reviewed provider and nursing notes charted during an ED visit that included naloxone administration. The event was included as an opioid overdose when notes indicated that the veteran was unresponsive and given naloxone, which resulted in increased respirations or increased responsiveness. Cases were excluded if the reason for naloxone administration was anything other than opioid overdose.
Medical, mental health, and SUDD diagnoses were included only if the veteran had more than three patient-care encounters (PCE) with ICD-9 codes for a specific diagnosis entered by providers. A PCE used in the electronic medical record (EMR) helps collect, manage, and display outpatient encounter data, including providers, procedure codes, and diagnostic codes. Tobacco use was extracted from health factors documented during primary care visit screenings. (Health factors help capture data entered in note templates in the EMR and can be used to query trends.) A diagnosis of obesity was based on a calculated body mass index of at or greater than 30 kg/m2 on the day of the ED visit date or the most recently charted height and weight. The type of SUDD was stratified into opioids (ICD-9 codes 304.0*), sedatives (ICD-9 codes 304.1*), alcohol (ICD-9 codes 303.*), and other (ICD-9 codes 304.2-305.9).
The dosage of opioids and BZDs available to a veteran was determined by using methods similar to those described by Gomes et al18: the dose of opioids and BZDs available based on prescriptions dispensed during the 120 days prior to the ED visit date and the dose available on the day of the ED visit date if prescription instructions were being followed. Prescription opioids and BZDs were converted to daily morphineequivalent dose (MED) and daily lorazepam equivalent dose (LED), using established methods.19,20
Veterans were stratified into four groups based on prescribed medication availability: opioids only, BZDs only, opioids and BZDs, and neither opioids nor BZDs. The specialty of the opioid prescribers was categorized as primary care, pain specialist, surgeon, emergency specialist, or hospitalist (discharge prescription). Veteran EMRs contain a list of medications obtained outside the VA facility, referred to as non-VA prescriptions. These medications were not included in the analysis because accuracy could not be verified.
A study author reviewed the results of any UDS performed up to 120 days before the ED visit date to determine whether the result reflected the currently prescribed prescription medications. If the UDS was positive for the prescribed opioids and/or BZDs and for any nonprescribed drug, including alcohol, the UDS was classified as not reflective. If the prescribed BZD was alprazolam, clonazepam, or lorazepam, a BZD-positive UDS was not required for the UDS to be considered reflective because of the sensitivity of the UDS BZD immunoassay used at the George E. Wahlen VAMC clinical laboratory.21
Outcomes of the overdose were categorized as discharged, hospitalized, or deceased. Descriptive statistical analyses were performed using Microsoft Excel. Group comparisons were performed using Pearson chi-square or Student t test.
Results
The ED at the George E. Wahlen VAMC averages 64 visits per day, almost 94,000 visits within the study period. One hundred seventy ED visits between January 1, 2009 and January 1, 2013, involved naloxone administration. Ninety-two visits met the inclusion criteria of opioid overdose, representing about 0.002% of all ED visits at this facility (Figure 1). Six veterans had multiple ED visits within the study period, including four veterans who were in the opioid-only group.

The majority of veterans in this study were non-Hispanic white (n = 83, 90%), male (n = 88, 96%), with a mean age of 63 years. Less than 40% listed a next of kin or contact person living at their address.
Based on prescriptions available within 120 days before the overdose, 67 veterans (73%) possessed opioid and/or BZD prescriptions. In this group, the MED available on the day of the ED visit ranged from 7.5 mg to 830 mg. The MED was less than or equal to 200 mg in 71.6% and less than or equal to 50 mg in 34.3% of these cases. Veterans prescribed both opioids and BZDs had higher MED (average, 259 mg) available within 120 days of the ED visit than did those prescribed opioids only (average, 118 mg) (P = .015; standard deviation [SD], 132.9). The LED ranged from 1 mg to 12 mg for veterans with available BZDs.
Based on prescriptions available on the day of opioid overdose, 53 veterans (58%) had opioid prescriptions. The ranges of MED and LED available on the day of overdose were the same as the 120-day availability period. The average MED was 183 mg in veterans prescribed both opioids and BZDs and 126 mg in those prescribed opioids only (P = .283; SD, 168.65; Figure 2). The time between the last opioid fill date and the overdose visit date averaged 20 days (range, 0 to 28 days) in veterans prescribed opioids.
All veterans had at least one diagnosis that in previous studies was associated with increased risk of overdose.9,15 The most common diagnoses included CVD, mental health disorders, pulmonary diseases, and cancer. Other SUDDs not including tobacco use were documented in at least half the veterans with prescribed opioids and/or BZDs. No veteran in the sample had a documented history of opioid SUDD.
Hydrocodone products were available in greater than 50% of cases. None of the veterans were prescribed buprenorphine products; other opioids, including tramadol, comprised the remainder (Figure 3). Primary care providers prescribed 72% of opioid prescriptions, with pain specialists, discharge physicians, ED providers, and surgeons prescribing the rest. When both opioids and BZDs were available, combinations of a hydrocodone product plus clonazepam or lorazepam were most common.
Overall, 64% of the sample had UDS results prior to the ED visit. Of veterans prescribed opioids and/or BZDs, 53% of UDSs reflected prescribed regimens.
On the day of the ED visit, 1 death occurred. Ninety-one veterans (99%) survived the overdose; 79 veterans (86%) were hospitalized, most for less than 24 hours.
Discussion
This retrospective review identified 92 veterans who were treated with naloxone in the ED for opioid overdose during a 4-year period at the George E. Wahlen VAMC. Seventy-eight cases were excluded because the reason entered in charts for naloxone administration was itching, constipation, altered mental status, or unclear documentation.
Veterans in this study were, on average, older than the overdose fatalities in the United States. Opioid-overdose deaths in all US states and in Utah alone occur most frequently in non-Hispanic white men aged between 35 and 54 years.7,22,23 In the 2010 Nationwide Emergency Department Sample of 136,000 opioid overdoses, of which 98% survived, most were aged 18 to 54 years.16 The older age in this study most likely reflects the age range of veterans served in the Veterans Health Administration (VHA); however, as more young veterans enter the VHA, the age range of overdose victims may more closely resemble the age ranges found in previous studies. Post hoc analysis showed eight veterans (9%) with probable intentional opioid overdose based on chart review, whereas the incidence of intentional prescription drug overdose in the United States is 17.1%.24
In Utah, almost 93% of fatal overdoses occur at a residential location.22 Less than half of the veterans in this study had a contact or next of kin listed as living at the same address. Although veterans may not have identified someone living with them, in many cases, it is likely another person witnessed the overdose. Relying on EMRs to identify who should receive prevention education in addition to the veteran, may result in missed opportunities to include another person likely to witness an overdose.25 Prescribers should make a conscious effort to ask veterans to identify someone who may be able to assist with rescue efforts in the event of an overdose.
Diagnoses associated with increased risk of opioid-overdose death include sleep apnea, morbid obesity, pulmonary disease or CVD, and/or a history of psychiatric disorders and SUDD.8,9,16 In a large sample of older veterans, only 64% had at least one medical or psychiatric diagnosis.26 Less than half of the 18,000 VA primary care patients in five VA centers had any psychiatric condition, and less than 65% had CVD, pulmonary disease, or cancer.27 All veterans in this study had medical and psychiatric comorbidity.
In contrast, a large ED sample described by Yokell et al16 found chronic mental conditions in 33.9%, circulatory disorders in 29.1%, and respiratory conditions in 25.6% of their sample. Bohnert et al9 found a significantly elevated hazard ratio (HR) for any psychiatric disorder in a sample of nearly 4,500 veterans. There was variation in the HR when individual psychiatric diagnoses were broken out, with bipolar disorder having the largest HR and schizophrenia having the lowest but still elevated HR.9 In this study, individual diagnoses were not broken out because the smaller sample size could diminish the clinical significance of any apparent differences.
Edlund et al10 found that less than 8% of veterans treated with opioids for chronic noncancer pain had nonopioid SUDD. Bohnert et al9 found an HR of 21.95 for overdose death among those with opioid-use disorders. The sample in this study had a much higher incidence of nonopioid SUDD compared with that of the study by Edlund et al,10 but none of the veterans in this study had a documented history of opioid-use disorder. The absence of opioid-use disorders in this sample is unexpected and points to a need for providers to screen for opioid-use disorder whenever opioids are prescribed or renewed. If prevention practices were directed only to those with opioid SUDDs, none of the veterans in this study would have been included in those efforts. Non-SUDD providers should address the risks of opioid overdose in veterans with sleep apnea, morbid obesity, pulmonary disease or CVD, and/or a history of psychiatric disorders.
Gomes et al18 found that greater than 100 mg MED available on the day of overdose doubled the risk of opioid-related mortality. The VA/Department of Defense Clinical Practice Guideline for Management of Opioid Therapy for Chronic Pain identifies 200 mg MED as a threshold to define high-dose opioid therapy.28 Fulton-Kehoe et al29 found that 28% of overdose victims were prescribed less than 50 mg MED. In this study, the average dose available to veterans was greater than 100 mg MED; however, one-third of all study veterans had less than 50 mg MED available. Using a threshold dose of 50 mg MED to target prevention efforts would capture only two-thirds of those who experienced overdose; a 200-mg MED threshold would exclude the majority, based on the average MED in each group in this study. Overdose education should be provided to veterans with access to opioids, regardless of dose.
Use of BZDs with opioids may result in greater central nervous system (CNS) depression, pharmacokinetic interactions, or pharmacodynamic interactions at the µ- opioid receptor.30-32 About one-third of veterans in this study were prescribed opioids and BZDs concurrently, a combination noted in about 33% of opioid overdose deaths reported by the Centers for Disease Control and Prevention.24 Individuals taking methadone combined with BZDs have been found to have severe medical outcomes.33 If preventive efforts are targeted to those receiving opioids and other CNS depressants, such as BZDs, about half (42%) of the veterans in this study would not receive a potentially life-saving message about preventing overdoses. All veterans with opioids should be educated about the additional risk of overdose posed by drug interactions with other CNS depressants.
The time since the last fill of an opioid prescription ranged from 0 to 28 days. This time frame indicates that some overdoses may have occurred on the day an opioid was filled but most occurred near the end of the expected days’ supply. Because information about adherence or use of the opioid was not studied, it cannot be assumed that medication misuse is the primary reason for the overdose. Providing prevention efforts only at the time of medication dispensing would be insufficient. Clinicians should review local and remote prescription data, including via their states’ prescription drug monitoring program, when discussing the risk of overdose with veterans.
Most veterans had at least one UDS result in the chart. Although half the UDSs obtained reflected prescribed medications, the possibility of aberrant behaviors, which increases the risk of overdose, cannot be ruled out with the methods used in this study.34 Medication management agreements that require UDSs for veterans with chronic pain were not mandatory at the George E. Wahlen VAMC during the study period, and those used did not mandate discontinuation of opioid therapy if suspected aberrant behaviors were present.
A Utah study based on interviews of overdose victims’ next of kin found that 76% were concerned about victims’ aberrant behaviors, such as medication misuse, prior to the death.22 In contrast, a study of commercial and Medicaid recipients estimated medication misuse rates in at or less than 30% of the sample.35 Urine-drug screening results not reflective of the prescribed regimens have been found in up to 50% of patients receiving chronic opioid therapy.
The UDS findings in this study were determined by the authors and did not capture clinical decisions or interpretations made after results were available or whether these decisions resulted in overdose-prevention strategies, such as targeted education or changes in prescription availability. Targeting preventive efforts toward veterans only with UDS results suggesting medication misuse would have missed more than half the veterans in this study. Urine-drug screening should be used as a clinical monitoring tool whenever opioids, BZDs, or other substances are used or prescribed.
The VA now has a nationwide program, Opioid Overdose Education and Naloxone Distribution (OEND), promoting overdose education and take-home naloxone distribution for providers and patients to prevent opioid-related overdose deaths. A national SharePoint site has been created within the VA that lists resources to support this effort.
Almost all veterans in this review survived the overdose and were hospitalized following the ED visit. Other investigators also have found that the majority (51% to 98%) of overdose victims reaching the ED survived, but fewer patients (3% to 51%) in those studies were hospitalized.16,36 It is unknown whether there are differences in risk factors associated with survived or fatal overdoses.
Limitations
Although Utah ranked third for drug-overdose death rates in 2008 and had the highest death rate among veterans from 2001 to 2009, this review captured only overdoses among veterans treated during the study period at the George E. Wahlen VAMC ED.5,6 The number and characteristics of veterans during this same period who were treated for overdose in other community EDs or urgent care centers throughout Utah is unknown.
The definition of opioid and BZD dose available in this study may not represent actual use of opioids or BZDs because it was based on chart review of prescription dispensing information and UDS procedures at the George E. Wahlen VAMC, and medication misuse cannot be ruled out. This study did not evaluate specific aberrant behaviors.
Conclusion
Current overdose-prevention screening efforts primarily identify patients on high-dose opioids and those with SUDD. Many veterans in this study were older than the average US victims’ age, did not have SUDD, were prescribed opioid doses not considered high risk by current guidelines, were nearer the end of their medication supply, and had UDS reflective of prescribed medications. This study suggests that any veteran with access to opioids, whether prescribed or not, is at risk for an opioid overdose. Established risk factors may aid in developing overdose-prevention programs, but prevention should not be limited to veterans with prescribed opioids and known risk factors. Clinicians should screen patients for opioid-use disorder whenever opioids are prescribed and continue to screen them throughout therapy. Broader screening for overdose risk is needed to avoid missing important opportunities for overdose prevention.
Acknowledgments
Gale Anderson, VISN 19 PBM Data Manager, performed initial data query for the study.
1. Rudd RA, Aleshire N, Zibbell JE, Gladden RM. Increases in drug and opioid overdose deaths—United States, 2000-2014. MMWR. 2015;64(50):1-5.
2. Compton WM, Jones CM, Baldwin GT. Relationship between nonmedical prescription-opioid use and heroin use. N Engl J Med . 2016;374(2):154-163.
3. Okie S. A flood of opioids, a rising tide of deaths. N Engl J Med . 2010;363(21):1981-1985.
4. Bohnert AS, Ilgen MA, Galea S, McCarthy JF, Blow FC. Accidental poisoning mortality among patients in the Department of Veterans Affairs Health System. Med Care . 2011;49(4):393-396.
5. Bohnert AS, Ilgen MA, Trafton JA, et al. Trends and regional variation in opioid overdose mortality among Veterans Health Administration patients, fiscal year 2001 to 2009. Clin J Pain. 2014;30(7):605-612.
6. Centers for Disease Control and Prevention. Policy impact: prescription, painkiller, overdoses. http://www.cdc.gov/drugoverdose/pdf/policyimpact-prescriptionpainkillerod-a.pdf. Published November 2011. Accessed August 25, 2016.
7. Xu J, Murphy SL, Kochanek KD, Bastian BA; Division of Vital Statistics. Deaths: final data for 2013. http://www.cdc.gov/nchs/data/nvsr/nvsr64/nvsr64_02.pdf. Published February 16, 2016. Accessed August 25, 2016.
8. The Joint Commission. Sentinel event alert issue 49: safe use of opioids in the hospital. https://www.jointcommission.org/assets/1/18/SEA_49_opioids_8_2_12_final.pdf. Published August 8, 2012. Accessed April 25, 2015.
9. Bohnert AS, Ilgen MA, Ignacio RV, McCarthy JF, Valenstein M, Blow FC. Risk of death from accidental overdose associated with psychiatric and substance use disorders. Am J Psychiatry . 2012;169(1):64-70.
10. Edlund MJ, Austen MA, Sullivan MD, et al. Patterns of opioid use for chronic noncancer pain in the Veterans Health Administration from 2009 to 2011. Pain . 2014;155:2337-2343.
11. Jann M, Kennedy WK, Lopez G. Benzodiazepines: a major component in unintentional prescription drug overdoses with opioid analgesics. J Pharm Pract . 2014;27(1):5-16.
12. McMillin G, Kusukawa N, Nelson G. Benzodiazepines. Salt Lake City, UT: ARUP Laboratories; 2012.
13. Naloxone hydrochloride [package insert]. Lake Forest, IL: Hospira Inc; 2007.
14. Boyer EW. Management of opioid analgesic overdose. N Engl J Med . 2012;367(2):146-155.
15. Hoffman JR, Schriger DL, Luo JS. The empiric use of naloxone in patients with altered mental status: a reappraisal. Ann Emerg Med. 1991;20(3):246-252.
16. Yokell MA, Delgado MK, Zaller ND, Wang NE, McGowan SK, Green TC. Presentation of prescription and nonprescription opioid overdoses to US emergency departments. JAMA Intern Med . 2014;174(12):2034-2037.
17. Binswanger I, Gardner E, Gabella B, Broderick K, Glanz K. Development of case criteria to define pharmaceutical opioid and heroin overdoses in clinical records. Platform presented at: Association for Medical Education and Research in Substance Abuse 38th Annual National Conference; November 7, 2014; San Francisco, CA.
18. Gomes T, Mamdani MM, Dhalla IA, Paterson JM, Juurlink DN. Opioid dose and drug-related mortality in patients with nonmalignant pain. Arch Intern Med . 2011;171(7):686-691.
19. Jaeger TM, Lohr RH, Pankratz VS. Symptom-triggered therapy for alcohol withdrawal syndrome in medical inpatients. Mayo Clin Proc. 2001;76(7):695-701.
20. Washington State Agency Medical Directors’ Group. Opioid dose calculator. http://www.agen cymeddirectors.wa.gov/Calculator/DoseCalculator.htm. Accessed October 10, 2016.
21. EMIT II Plus Benzodiazepine Assay [package insert]. Brea, CA: Beckman Coulter, Inc; 2010.
22. Johnson EM, Lanier WA, Merrill RM, et al. Unintentional prescription opioid-related overdose deaths: description of decedents by next of kin or best contact, Utah, 2008-2009. J Gen Intern Med . 2013;28(4):522-529.
23. Utah Department of Health. Fact sheet: prescription pain medication deaths in Utah, 2012. https://www.health.utah.gov/vipp/pdf/FactSheets/2012RxOpioidDeaths.pdf. Updated October 2013. Accessed October 10, 2016.
24. Jones CM, Mack KA, Paulozzi LJ. Pharmaceutical overdose deaths, United States, 2010. JAMA . 2013;309(7):657-659.
25. Bohnert AS, Tracy M, Galea S. Characteristics of drug users who witness many overdoses: implications for overdose prevention. Drug Alcohol Depend. 2012;120(1-3):168-173.
26. Yoon J, Zulman D, Scott JY, Maciejewski ML. Costs associated with multimorbidity among VA patients. Med Care . 2014;52(suppl 3):S31-S36.
27. Yoon J, Yano EM, Altman L, et al. Reducing costs of acute care for ambulatory care-sensitive medical conditions: the central roles of comorbid mental illness. Med Care . 2012;50(8):705-713.
28. Department of Veterans Affairs, Department of Defense. VA/DoD Clinical Practice Guideline for Management of Opioid Therapy for Chronic Pain. Guideline summary. http://www.va.gov/painmanagement/docs/cpg_opioidtherapy_summary.pdf. Published May 2010. Accessed August 25, 2016
29. Fulton-Kehoe D, Sullivan MD, Turner JA, et al. Opioid poisonings in Washington state Medicaid: trends, dosing, and guidelines. Med Care . 2015;53(8):679-685.
30. Gudin JA, Mogali S, Jones JD, Comer SD. Risks, management, and monitoring of combination opioid, benzodiazepines, and/or alcohol use. Postgrad Med . 2013;125(4):115-130.
31. Poisnel G, Dhilly M, Le Boisselier R, Barre L, Debruyne D. Comparison of five benzodiazepine-receptor agonists on buprenorphine-induced mu-opioid receptor regulation. J Pharmacol Sci. 2009;110(1):36-46.
32. Webster LR, Cochella S, Dasgupta N, et al. An analysis of the root causes for opioid-related overdose deaths in the United States. Pain Med . 2011;12(suppl 2):S26-S35.
33. Lee SC, Klein-Schwartz W, Doyon S, Welsh C. Comparison of toxicity associated with nonmedical use of benzodiazepines with buprenorphine or methadone. Drug Alcohol Depend . 2014;138:118-123.
34. Owen GT, Burton AW, Schade CM, Passik S. Urine drug testing: current recommendations and best practices. Pain Physician . 2012;15(suppl 3):ES119–ES133.
35. Sullivan MD, Edlund MJ, Fan MY, Devries A, Brennan Braden J, Martin BC. Risks for possible and probable opioid misuse among recipients of chronic opioid therapy in commercial and medicaid insurance plans: the TROUP study. Pain. 2010;150(2):332-339.
36. Sporer KA, Firestone J, Isaacs SM. Out-of-hospital treatment of opioid overdoses in an urban setting. Acad Emerg Med . 1996;3(7):660-667.
Editor’s Note: This article has been adapted from an article originally published in Federal Practitioner (Clement C, Stock C. Who overdoses at a VA emergency department? Fed Prac. 2016;33[11]:14-19. http://www.fedprac.com).
Overdose deaths remain epidemic throughout the United States. The rates of unintentional overdose deaths, increasing by 137% between 2000 and 2014, have been driven by a 4-fold increase in prescription opioid overdoses during that period.1-3
Veterans died of accidental overdose at a rate of 19.85 deaths/100,000 people compared with a rate of 10.49 deaths in the general population, based on 2005 data.4 There is wide state-by-state variation, with the lowest age-adjusted opioid overdose death rate of 1.9 deaths/100,000 person-years among veterans in Mississippi and the highest rate in Utah of 33.9 deaths/100,000 person-years, using 2001 to 2009 data.5 These data can be compared with a crude general population overdose death rate of 10.6 deaths per 100,000 person-years in Mississippi and 18.4 deaths per 100,000 person-years in the general Utah population during that same period.6
Overdose deaths in the United States occur most often in persons aged 25 to 54 years.7 Older age has been associated with iatrogenic opioid overdose in hospitalized patients.8 Pulmonary disease, cardiovascular disease (CVD), and psychiatric disorders, including past or present substance use, have been associated with an increased risk of opioid overdose.9 However, veterans with substance use disorders are less likely to be prescribed opioids than are nonveterans with substance use disorders.10 Also, concomitant use of sedating medications, such as benzodiazepines (BZDs), can increase mortality from opioid overdose.11 Patients prescribed opioids for chronic pain conditions often take BZDs for various reasons.12 Veterans seem more likely to receive opioids to treat chronic pain but at lower average daily doses than doses prescribed to nonveterans.10
Emergency management of life-threatening opioid overdose includes prompt administration of naloxone.13 Naloxone is approved by the US Food and Drug Administration for complete or partial reversal of opioid-induced clinical effects, most critically respiratory depression.14,15 Naloxone administration in the ED may serve as a surrogate for an overdose event. During the study period, naloxone take-home kits were not available in the Veterans Affairs (VA) setting.
A 2010 ED study described demographic information and comorbidities in opioid overdose, but the study did not include veterans.16 The clinical characteristics of veterans treated for opioid overdose have not been published. Because identifying characteristics of veterans who overdose may help tailor overdose-prevention efforts, the objective of this study is to describe clinical characteristics of veterans treated for opioid overdose.
Methods
A retrospective chart review and archived data study was approved by the University of Utah and VA Institutional Review Boards, and conducted at the George E. Wahlen Veterans Affairs Medical Center (VAMC) in Salt Lake City, Utah. This chart review included veterans who were admitted to the ED and treated with naloxone between January 1, 2009 and January 1, 2013.
The authors used the Pharmacy Benefits Management Data Manager to extract data from the VA Data Warehouse and verified the data by open chart review (Table). The following data were collected: ED visit date (overdose date); demographic information, including age, gender, and race; evidence of next of kin or other contact at the same address as the veteran; diagnoses based on International Classification of Diseases, 9th Revision (ICD-9) codes, including sleep apnea, obesity, cardiac disease, pulmonary disease, mental health diagnoses (ICD-9 codes 290-302 [wild card characters (*) included many subdiagnoses]), cancer, and substance use disorders and/or dependencies (SUDD); tobacco use; VA-issued prescription opioid and BZD availability, including dose, fill dates, quantities dispensed, and day supplies; specialty of opioid prescriber; urine-drug screening (UDS) results; and outcome of the overdose.
No standardized research criteria identify overdose in medical chart review.17 For each identified patient, the authors reviewed provider and nursing notes charted during an ED visit that included naloxone administration. The event was included as an opioid overdose when notes indicated that the veteran was unresponsive and given naloxone, which resulted in increased respirations or increased responsiveness. Cases were excluded if the reason for naloxone administration was anything other than opioid overdose.
Medical, mental health, and SUDD diagnoses were included only if the veteran had more than three patient-care encounters (PCE) with ICD-9 codes for a specific diagnosis entered by providers. A PCE used in the electronic medical record (EMR) helps collect, manage, and display outpatient encounter data, including providers, procedure codes, and diagnostic codes. Tobacco use was extracted from health factors documented during primary care visit screenings. (Health factors help capture data entered in note templates in the EMR and can be used to query trends.) A diagnosis of obesity was based on a calculated body mass index of at or greater than 30 kg/m2 on the day of the ED visit date or the most recently charted height and weight. The type of SUDD was stratified into opioids (ICD-9 codes 304.0*), sedatives (ICD-9 codes 304.1*), alcohol (ICD-9 codes 303.*), and other (ICD-9 codes 304.2-305.9).
The dosage of opioids and BZDs available to a veteran was determined by using methods similar to those described by Gomes et al18: the dose of opioids and BZDs available based on prescriptions dispensed during the 120 days prior to the ED visit date and the dose available on the day of the ED visit date if prescription instructions were being followed. Prescription opioids and BZDs were converted to daily morphineequivalent dose (MED) and daily lorazepam equivalent dose (LED), using established methods.19,20
Veterans were stratified into four groups based on prescribed medication availability: opioids only, BZDs only, opioids and BZDs, and neither opioids nor BZDs. The specialty of the opioid prescribers was categorized as primary care, pain specialist, surgeon, emergency specialist, or hospitalist (discharge prescription). Veteran EMRs contain a list of medications obtained outside the VA facility, referred to as non-VA prescriptions. These medications were not included in the analysis because accuracy could not be verified.
A study author reviewed the results of any UDS performed up to 120 days before the ED visit date to determine whether the result reflected the currently prescribed prescription medications. If the UDS was positive for the prescribed opioids and/or BZDs and for any nonprescribed drug, including alcohol, the UDS was classified as not reflective. If the prescribed BZD was alprazolam, clonazepam, or lorazepam, a BZD-positive UDS was not required for the UDS to be considered reflective because of the sensitivity of the UDS BZD immunoassay used at the George E. Wahlen VAMC clinical laboratory.21
Outcomes of the overdose were categorized as discharged, hospitalized, or deceased. Descriptive statistical analyses were performed using Microsoft Excel. Group comparisons were performed using Pearson chi-square or Student t test.
Results
The ED at the George E. Wahlen VAMC averages 64 visits per day, almost 94,000 visits within the study period. One hundred seventy ED visits between January 1, 2009 and January 1, 2013, involved naloxone administration. Ninety-two visits met the inclusion criteria of opioid overdose, representing about 0.002% of all ED visits at this facility (Figure 1). Six veterans had multiple ED visits within the study period, including four veterans who were in the opioid-only group.
The majority of veterans in this study were non-Hispanic white (n = 83, 90%), male (n = 88, 96%), with a mean age of 63 years. Less than 40% listed a next of kin or contact person living at their address.
Based on prescriptions available within 120 days before the overdose, 67 veterans (73%) possessed opioid and/or BZD prescriptions. In this group, the MED available on the day of the ED visit ranged from 7.5 mg to 830 mg. The MED was less than or equal to 200 mg in 71.6% and less than or equal to 50 mg in 34.3% of these cases. Veterans prescribed both opioids and BZDs had higher MED (average, 259 mg) available within 120 days of the ED visit than did those prescribed opioids only (average, 118 mg) (P = .015; standard deviation [SD], 132.9). The LED ranged from 1 mg to 12 mg for veterans with available BZDs.
Based on prescriptions available on the day of opioid overdose, 53 veterans (58%) had opioid prescriptions. The ranges of MED and LED available on the day of overdose were the same as the 120-day availability period. The average MED was 183 mg in veterans prescribed both opioids and BZDs and 126 mg in those prescribed opioids only (P = .283; SD, 168.65; Figure 2). The time between the last opioid fill date and the overdose visit date averaged 20 days (range, 0 to 28 days) in veterans prescribed opioids.
All veterans had at least one diagnosis that in previous studies was associated with increased risk of overdose.9,15 The most common diagnoses included CVD, mental health disorders, pulmonary diseases, and cancer. Other SUDDs not including tobacco use were documented in at least half the veterans with prescribed opioids and/or BZDs. No veteran in the sample had a documented history of opioid SUDD.
Hydrocodone products were available in greater than 50% of cases. None of the veterans were prescribed buprenorphine products; other opioids, including tramadol, comprised the remainder (Figure 3). Primary care providers prescribed 72% of opioid prescriptions, with pain specialists, discharge physicians, ED providers, and surgeons prescribing the rest. When both opioids and BZDs were available, combinations of a hydrocodone product plus clonazepam or lorazepam were most common.
Overall, 64% of the sample had UDS results prior to the ED visit. Of veterans prescribed opioids and/or BZDs, 53% of UDSs reflected prescribed regimens.
On the day of the ED visit, 1 death occurred. Ninety-one veterans (99%) survived the overdose; 79 veterans (86%) were hospitalized, most for less than 24 hours.
Discussion
This retrospective review identified 92 veterans who were treated with naloxone in the ED for opioid overdose during a 4-year period at the George E. Wahlen VAMC. Seventy-eight cases were excluded because the reason entered in charts for naloxone administration was itching, constipation, altered mental status, or unclear documentation.
Veterans in this study were, on average, older than the overdose fatalities in the United States. Opioid-overdose deaths in all US states and in Utah alone occur most frequently in non-Hispanic white men aged between 35 and 54 years.7,22,23 In the 2010 Nationwide Emergency Department Sample of 136,000 opioid overdoses, of which 98% survived, most were aged 18 to 54 years.16 The older age in this study most likely reflects the age range of veterans served in the Veterans Health Administration (VHA); however, as more young veterans enter the VHA, the age range of overdose victims may more closely resemble the age ranges found in previous studies. Post hoc analysis showed eight veterans (9%) with probable intentional opioid overdose based on chart review, whereas the incidence of intentional prescription drug overdose in the United States is 17.1%.24
In Utah, almost 93% of fatal overdoses occur at a residential location.22 Less than half of the veterans in this study had a contact or next of kin listed as living at the same address. Although veterans may not have identified someone living with them, in many cases, it is likely another person witnessed the overdose. Relying on EMRs to identify who should receive prevention education in addition to the veteran, may result in missed opportunities to include another person likely to witness an overdose.25 Prescribers should make a conscious effort to ask veterans to identify someone who may be able to assist with rescue efforts in the event of an overdose.
Diagnoses associated with increased risk of opioid-overdose death include sleep apnea, morbid obesity, pulmonary disease or CVD, and/or a history of psychiatric disorders and SUDD.8,9,16 In a large sample of older veterans, only 64% had at least one medical or psychiatric diagnosis.26 Less than half of the 18,000 VA primary care patients in five VA centers had any psychiatric condition, and less than 65% had CVD, pulmonary disease, or cancer.27 All veterans in this study had medical and psychiatric comorbidity.
In contrast, a large ED sample described by Yokell et al16 found chronic mental conditions in 33.9%, circulatory disorders in 29.1%, and respiratory conditions in 25.6% of their sample. Bohnert et al9 found a significantly elevated hazard ratio (HR) for any psychiatric disorder in a sample of nearly 4,500 veterans. There was variation in the HR when individual psychiatric diagnoses were broken out, with bipolar disorder having the largest HR and schizophrenia having the lowest but still elevated HR.9 In this study, individual diagnoses were not broken out because the smaller sample size could diminish the clinical significance of any apparent differences.
Edlund et al10 found that less than 8% of veterans treated with opioids for chronic noncancer pain had nonopioid SUDD. Bohnert et al9 found an HR of 21.95 for overdose death among those with opioid-use disorders. The sample in this study had a much higher incidence of nonopioid SUDD compared with that of the study by Edlund et al,10 but none of the veterans in this study had a documented history of opioid-use disorder. The absence of opioid-use disorders in this sample is unexpected and points to a need for providers to screen for opioid-use disorder whenever opioids are prescribed or renewed. If prevention practices were directed only to those with opioid SUDDs, none of the veterans in this study would have been included in those efforts. Non-SUDD providers should address the risks of opioid overdose in veterans with sleep apnea, morbid obesity, pulmonary disease or CVD, and/or a history of psychiatric disorders.
Gomes et al18 found that greater than 100 mg MED available on the day of overdose doubled the risk of opioid-related mortality. The VA/Department of Defense Clinical Practice Guideline for Management of Opioid Therapy for Chronic Pain identifies 200 mg MED as a threshold to define high-dose opioid therapy.28 Fulton-Kehoe et al29 found that 28% of overdose victims were prescribed less than 50 mg MED. In this study, the average dose available to veterans was greater than 100 mg MED; however, one-third of all study veterans had less than 50 mg MED available. Using a threshold dose of 50 mg MED to target prevention efforts would capture only two-thirds of those who experienced overdose; a 200-mg MED threshold would exclude the majority, based on the average MED in each group in this study. Overdose education should be provided to veterans with access to opioids, regardless of dose.
Use of BZDs with opioids may result in greater central nervous system (CNS) depression, pharmacokinetic interactions, or pharmacodynamic interactions at the µ- opioid receptor.30-32 About one-third of veterans in this study were prescribed opioids and BZDs concurrently, a combination noted in about 33% of opioid overdose deaths reported by the Centers for Disease Control and Prevention.24 Individuals taking methadone combined with BZDs have been found to have severe medical outcomes.33 If preventive efforts are targeted to those receiving opioids and other CNS depressants, such as BZDs, about half (42%) of the veterans in this study would not receive a potentially life-saving message about preventing overdoses. All veterans with opioids should be educated about the additional risk of overdose posed by drug interactions with other CNS depressants.
The time since the last fill of an opioid prescription ranged from 0 to 28 days. This time frame indicates that some overdoses may have occurred on the day an opioid was filled but most occurred near the end of the expected days’ supply. Because information about adherence or use of the opioid was not studied, it cannot be assumed that medication misuse is the primary reason for the overdose. Providing prevention efforts only at the time of medication dispensing would be insufficient. Clinicians should review local and remote prescription data, including via their states’ prescription drug monitoring program, when discussing the risk of overdose with veterans.
Most veterans had at least one UDS result in the chart. Although half the UDSs obtained reflected prescribed medications, the possibility of aberrant behaviors, which increases the risk of overdose, cannot be ruled out with the methods used in this study.34 Medication management agreements that require UDSs for veterans with chronic pain were not mandatory at the George E. Wahlen VAMC during the study period, and those used did not mandate discontinuation of opioid therapy if suspected aberrant behaviors were present.
A Utah study based on interviews of overdose victims’ next of kin found that 76% were concerned about victims’ aberrant behaviors, such as medication misuse, prior to the death.22 In contrast, a study of commercial and Medicaid recipients estimated medication misuse rates in at or less than 30% of the sample.35 Urine-drug screening results not reflective of the prescribed regimens have been found in up to 50% of patients receiving chronic opioid therapy.
The UDS findings in this study were determined by the authors and did not capture clinical decisions or interpretations made after results were available or whether these decisions resulted in overdose-prevention strategies, such as targeted education or changes in prescription availability. Targeting preventive efforts toward veterans only with UDS results suggesting medication misuse would have missed more than half the veterans in this study. Urine-drug screening should be used as a clinical monitoring tool whenever opioids, BZDs, or other substances are used or prescribed.
The VA now has a nationwide program, Opioid Overdose Education and Naloxone Distribution (OEND), promoting overdose education and take-home naloxone distribution for providers and patients to prevent opioid-related overdose deaths. A national SharePoint site has been created within the VA that lists resources to support this effort.
Almost all veterans in this review survived the overdose and were hospitalized following the ED visit. Other investigators also have found that the majority (51% to 98%) of overdose victims reaching the ED survived, but fewer patients (3% to 51%) in those studies were hospitalized.16,36 It is unknown whether there are differences in risk factors associated with survived or fatal overdoses.
Limitations
Although Utah ranked third for drug-overdose death rates in 2008 and had the highest death rate among veterans from 2001 to 2009, this review captured only overdoses among veterans treated during the study period at the George E. Wahlen VAMC ED.5,6 The number and characteristics of veterans during this same period who were treated for overdose in other community EDs or urgent care centers throughout Utah is unknown.
The definition of opioid and BZD dose available in this study may not represent actual use of opioids or BZDs because it was based on chart review of prescription dispensing information and UDS procedures at the George E. Wahlen VAMC, and medication misuse cannot be ruled out. This study did not evaluate specific aberrant behaviors.
Conclusion
Current overdose-prevention screening efforts primarily identify patients on high-dose opioids and those with SUDD. Many veterans in this study were older than the average US victims’ age, did not have SUDD, were prescribed opioid doses not considered high risk by current guidelines, were nearer the end of their medication supply, and had UDS reflective of prescribed medications. This study suggests that any veteran with access to opioids, whether prescribed or not, is at risk for an opioid overdose. Established risk factors may aid in developing overdose-prevention programs, but prevention should not be limited to veterans with prescribed opioids and known risk factors. Clinicians should screen patients for opioid-use disorder whenever opioids are prescribed and continue to screen them throughout therapy. Broader screening for overdose risk is needed to avoid missing important opportunities for overdose prevention.
Acknowledgments
Gale Anderson, VISN 19 PBM Data Manager, performed initial data query for the study.
1. Rudd RA, Aleshire N, Zibbell JE, Gladden RM. Increases in drug and opioid overdose deaths—United States, 2000-2014. MMWR. 2015;64(50):1-5.
2. Compton WM, Jones CM, Baldwin GT. Relationship between nonmedical prescription-opioid use and heroin use. N Engl J Med . 2016;374(2):154-163.
3. Okie S. A flood of opioids, a rising tide of deaths. N Engl J Med . 2010;363(21):1981-1985.
4. Bohnert AS, Ilgen MA, Galea S, McCarthy JF, Blow FC. Accidental poisoning mortality among patients in the Department of Veterans Affairs Health System. Med Care . 2011;49(4):393-396.
5. Bohnert AS, Ilgen MA, Trafton JA, et al. Trends and regional variation in opioid overdose mortality among Veterans Health Administration patients, fiscal year 2001 to 2009. Clin J Pain. 2014;30(7):605-612.
6. Centers for Disease Control and Prevention. Policy impact: prescription, painkiller, overdoses. http://www.cdc.gov/drugoverdose/pdf/policyimpact-prescriptionpainkillerod-a.pdf. Published November 2011. Accessed August 25, 2016.
7. Xu J, Murphy SL, Kochanek KD, Bastian BA; Division of Vital Statistics. Deaths: final data for 2013. http://www.cdc.gov/nchs/data/nvsr/nvsr64/nvsr64_02.pdf. Published February 16, 2016. Accessed August 25, 2016.
8. The Joint Commission. Sentinel event alert issue 49: safe use of opioids in the hospital. https://www.jointcommission.org/assets/1/18/SEA_49_opioids_8_2_12_final.pdf. Published August 8, 2012. Accessed April 25, 2015.
9. Bohnert AS, Ilgen MA, Ignacio RV, McCarthy JF, Valenstein M, Blow FC. Risk of death from accidental overdose associated with psychiatric and substance use disorders. Am J Psychiatry . 2012;169(1):64-70.
10. Edlund MJ, Austen MA, Sullivan MD, et al. Patterns of opioid use for chronic noncancer pain in the Veterans Health Administration from 2009 to 2011. Pain . 2014;155:2337-2343.
11. Jann M, Kennedy WK, Lopez G. Benzodiazepines: a major component in unintentional prescription drug overdoses with opioid analgesics. J Pharm Pract . 2014;27(1):5-16.
12. McMillin G, Kusukawa N, Nelson G. Benzodiazepines. Salt Lake City, UT: ARUP Laboratories; 2012.
13. Naloxone hydrochloride [package insert]. Lake Forest, IL: Hospira Inc; 2007.
14. Boyer EW. Management of opioid analgesic overdose. N Engl J Med . 2012;367(2):146-155.
15. Hoffman JR, Schriger DL, Luo JS. The empiric use of naloxone in patients with altered mental status: a reappraisal. Ann Emerg Med. 1991;20(3):246-252.
16. Yokell MA, Delgado MK, Zaller ND, Wang NE, McGowan SK, Green TC. Presentation of prescription and nonprescription opioid overdoses to US emergency departments. JAMA Intern Med . 2014;174(12):2034-2037.
17. Binswanger I, Gardner E, Gabella B, Broderick K, Glanz K. Development of case criteria to define pharmaceutical opioid and heroin overdoses in clinical records. Platform presented at: Association for Medical Education and Research in Substance Abuse 38th Annual National Conference; November 7, 2014; San Francisco, CA.
18. Gomes T, Mamdani MM, Dhalla IA, Paterson JM, Juurlink DN. Opioid dose and drug-related mortality in patients with nonmalignant pain. Arch Intern Med . 2011;171(7):686-691.
19. Jaeger TM, Lohr RH, Pankratz VS. Symptom-triggered therapy for alcohol withdrawal syndrome in medical inpatients. Mayo Clin Proc. 2001;76(7):695-701.
20. Washington State Agency Medical Directors’ Group. Opioid dose calculator. http://www.agen cymeddirectors.wa.gov/Calculator/DoseCalculator.htm. Accessed October 10, 2016.
21. EMIT II Plus Benzodiazepine Assay [package insert]. Brea, CA: Beckman Coulter, Inc; 2010.
22. Johnson EM, Lanier WA, Merrill RM, et al. Unintentional prescription opioid-related overdose deaths: description of decedents by next of kin or best contact, Utah, 2008-2009. J Gen Intern Med . 2013;28(4):522-529.
23. Utah Department of Health. Fact sheet: prescription pain medication deaths in Utah, 2012. https://www.health.utah.gov/vipp/pdf/FactSheets/2012RxOpioidDeaths.pdf. Updated October 2013. Accessed October 10, 2016.
24. Jones CM, Mack KA, Paulozzi LJ. Pharmaceutical overdose deaths, United States, 2010. JAMA . 2013;309(7):657-659.
25. Bohnert AS, Tracy M, Galea S. Characteristics of drug users who witness many overdoses: implications for overdose prevention. Drug Alcohol Depend. 2012;120(1-3):168-173.
26. Yoon J, Zulman D, Scott JY, Maciejewski ML. Costs associated with multimorbidity among VA patients. Med Care . 2014;52(suppl 3):S31-S36.
27. Yoon J, Yano EM, Altman L, et al. Reducing costs of acute care for ambulatory care-sensitive medical conditions: the central roles of comorbid mental illness. Med Care . 2012;50(8):705-713.
28. Department of Veterans Affairs, Department of Defense. VA/DoD Clinical Practice Guideline for Management of Opioid Therapy for Chronic Pain. Guideline summary. http://www.va.gov/painmanagement/docs/cpg_opioidtherapy_summary.pdf. Published May 2010. Accessed August 25, 2016
29. Fulton-Kehoe D, Sullivan MD, Turner JA, et al. Opioid poisonings in Washington state Medicaid: trends, dosing, and guidelines. Med Care . 2015;53(8):679-685.
30. Gudin JA, Mogali S, Jones JD, Comer SD. Risks, management, and monitoring of combination opioid, benzodiazepines, and/or alcohol use. Postgrad Med . 2013;125(4):115-130.
31. Poisnel G, Dhilly M, Le Boisselier R, Barre L, Debruyne D. Comparison of five benzodiazepine-receptor agonists on buprenorphine-induced mu-opioid receptor regulation. J Pharmacol Sci. 2009;110(1):36-46.
32. Webster LR, Cochella S, Dasgupta N, et al. An analysis of the root causes for opioid-related overdose deaths in the United States. Pain Med . 2011;12(suppl 2):S26-S35.
33. Lee SC, Klein-Schwartz W, Doyon S, Welsh C. Comparison of toxicity associated with nonmedical use of benzodiazepines with buprenorphine or methadone. Drug Alcohol Depend . 2014;138:118-123.
34. Owen GT, Burton AW, Schade CM, Passik S. Urine drug testing: current recommendations and best practices. Pain Physician . 2012;15(suppl 3):ES119–ES133.
35. Sullivan MD, Edlund MJ, Fan MY, Devries A, Brennan Braden J, Martin BC. Risks for possible and probable opioid misuse among recipients of chronic opioid therapy in commercial and medicaid insurance plans: the TROUP study. Pain. 2010;150(2):332-339.
36. Sporer KA, Firestone J, Isaacs SM. Out-of-hospital treatment of opioid overdoses in an urban setting. Acad Emerg Med . 1996;3(7):660-667.
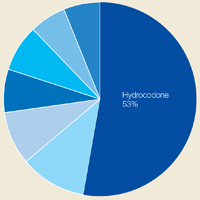
First EDition: Emergency Physicians’ Rates of Opioid Prescribing, more
BY JEFF BAUER
A large retrospective analysis found a wide variation in opioid prescribing among emergency physicians (EPs) working within the same ED. The study also found that Medicare patients treated by EPs who wrote the most prescriptions for opioids were more likely to use opioids for 6 months after their ED visit than were those treated by EPs who wrote fewer opioid prescriptions.
Researchers evaluated initial visits to an ED by approximately 378,000 Medicare beneficiaries (average age: 68 years) from 2008 through 2011. None of these patients had received a prescription for an opioid in the 6 months before the ED visit, and none of the visits resulted in a hospital admission. Prescriptions for opioids (excluding methadone) were identified by the national drug code in the Medicare Part D database. An opioid prescription was attributed to the treating EP if the patient filled the prescription within 3 days after the ED visit.
Investigators categorized the treating EPs in this study as “high-intensity” or “low-intensity” opioid prescribers by calculating the proportion of all ED visits that resulted in an opioid prescription being filled. They then grouped the EPs into quartiles of opioid prescribing within each hospital. High-intensity prescribers were those in the top quartile of opioid prescribing rates, and low-intensity prescribers were those in the bottom quartile.
The primary outcome was long-term opioid use, defined as 6 months or more of opioids supplied in the 12 months after the initial ED visit. This did not include prescriptions filled within 30 days of the initial visit.
Overall, approximately 215,700 patients were treated by low-intensity prescribers and 162,000 by high-intensity prescribers. In general, the patient characteristics and diagnoses were similar in both groups. The rate of opioid prescribing of high-intensity prescribers was approximately triple the rate of low-intensity prescribers. High-intensity prescribers provided an opioid prescription for 21.4% of ED visits, compared to 7.3% among low-intensity prescribers.
Long-term opioid use at 12 months was significantly higher among patients who had been initially treated by high-intensity prescribers compared to those who had been treated by low-intensity prescribers (1.51% vs 1.16%; unadjusted odds ratio [OR], 1.31). There was minimal change in this difference after the results were adjusted for the patients’ age, race, sex, disability status, and presence of chronic conditions (OR, 1.30). The number needed to harm was calculated as 49, meaning theoretically, for every 49 patients who received a new opioid prescription in the ED, one would become a long-term user. The authors noted, however, that “…prescriptions provided by other physicians in the months after an [ED] visit are necessary for long-term opioid use to take hold.”
Researchers pointed out several limitations to their study. Because the study was observational, it could not establish causality. Researchers were not able to directly attribute opioid prescriptions to the treating EPs, but instead used prescriptions filled within 3 days of an ED visits as a surrogate; some opioid prescriptions could have been written by another clinician, such as the patient’s primary care physician during a follow-up visit. Because the study focused on Medicare patients, the results may not be applicable to younger patients. Based on their analysis, researchers could not determine whether an opioid prescription was appropriate, and therefore they could not quantify the extent of opioid overprescribing.
For more on EPs and opioid prescribing, see “The New Opioid Epidemic and the Law of Unintended Consequences” by Emergency Medicine Editor in Chief Neal Flomenbaum, MD (Emergency Medicine. 2017;49[2]:52) and “The New Opioid Epidemic: Prescriptions, Synthetics, and Street Drugs” by Rama B. Rao, MD and Emergency Medicine Associate Editor, Toxicology Lewis S. Nelson, MD (Emergency Medicine. 2017;49[2]:64-70).
Barnett ML, Olenski AR, Jena AB. Opioid-prescribing patterns of emergency physicians and risk of long-term use. N Engl J Med. 2017;376(7):663-673. doi:10.1056/NEJMsa1610524.
Lower Admission Rates, Other Factors Tied to High Rate of Death Soon After ED Discharge Among Older Adults
BY JEFF BAUER
Each year, approximately 10,000 older adult patients die within 7 days of discharge from an ED in the United States, despite having no obvious life-threatening illness, according to a large retrospective study. Emergency departments with lower rates of inpatient admission from the ED, lower patient volumes, and lower charges had significantly higher rates of death after discharge.
Researchers evaluated Medicare claims data related to slightly more than 10 million ED visits from 2007 to 2012. Because the goal was to study generally healthy patients, the following patients were excluded: individuals who were age 90 years and older; were receiving palliative or hospice care; or had received a life-limiting diagnosis, such as a myocardial infarction (MI) or a malignancy, either in the ED or in the year prior to the ED visit. The primary outcome was death within 7 days after discharge from an ED. The cause of death was determined by linking claims to death certificates; this information was available only for a subset of patients who visited an ED in 2007 or 2008.
Overall, during the 6-year study, 0.12% of discharged patients died within 7 days of discharge; this translates to more than 10,000 early deaths per year nationally. The leading causes of death were atherosclerotic heart disease (13.6%), MI (10.3%), and chronic obstructive pulmonary disease (9.6%).
Emergency departments ranked in the lowest fifth for admission rates admitted 15% of patients, compared to 56% of patients at EDs with the highest admission rates. The early death rate of patients treated at EDs with the lowest rates of inpatient admissions from the ED was 3.4 times higher than the death rate seen in EDs with the highest inpatient admission rates (0.27% vs 0.08%, respectively). This was true despite the fact that EDs with low-admission rates treated healthier patients, as evidenced by the overall 7-day mortality rate of all patients treated in the ED, whether they were admitted or discharged. Emergency departments that saw higher volumes of patients and had higher charges for visits had significantly fewer deaths.
Obermeyer Z, Cohn B, Wilson M, Jena AB, Cutler DM. Early death after discharge from emergency departments: analysis of national US insurance claims data. BMJ. 2017;356:j239. doi:10.1136/bmj.j239.
Tertiary Center Repeat Computed Tomography Scans Find Additional Injuries
MICHELE G. SULLIVAN
FRONTLINE MEDICAL NEWS
Imaging obtained at nontertiary trauma centers (NTCs) probably does not tell the whole story of a trauma patient’s injuries, according to a new retrospective study.
Repeat scans done at a Level 1 trauma center identified new injuries in 76% of patients who were transferred, Morgan Bonds, MD, reported at the annual scientific assembly of the Eastern Association for the Surgery of Trauma. About half of these previously unobserved injuries were considered clinically significant, said Dr Bonds, a surgical resident at the University of Oklahoma, Oklahoma City.
Her study examined imaging and clinical assessment of 203 trauma patients who were initially worked up at an NTC, and then transferred to the Level 1 University of Oklahoma tertiary trauma center (TTC). The facility’s primary radiologist reviewed all of the initial computed tomography (CT) scans while blinded to the NTC interpretation. The initial scans and interpretations were then compared with those done at the TTC.
The team split imaging and interpretation disconnects into four categories:
- Type A errors: A missed injury on the NTC scan. “This represents the expertise and experience of our primary radiologist,” Dr Bonds said.
- Type B errors: Missed injuries on scans where NTC radiologists saw other injuries that the TTC radiologist did not confirm. “This represents the experience of our radiologist and also the inexperience and overreaction of the NTC radiologists.”
- Type C errors: New injuries seen on additional TTC imaging of the same body area. “This represents the quality of the image.”
- Type D errors: New injuries found upon any new imaging, whether of a previously scanned or newly scanned body area. “This represents quality of work-up—the decision of the trauma team to more fully investigate the patient’s injuries, as well as the quality of the CT tech performing the scan.”
During the study period, 203 patients presented at the TTC with prior scans conducted at an NTC.
The mean age of the patients was 43 years; most (67%) were men. The mean Injury Severity Score was 16; 97% had experienced blunt trauma. Shock was present in 3% and a traumatic brain injury in 8%. Repeat scans were most common for neck and cervical spine injuries (54%) and thoracic/lumbar spine injuries (53%), and least common for chest injuries (32%).
An inadequate NTC work-up as judged by the TTC attending was the most common reason for obtaining new images (76%). Poor image quality was the next most common reason (31%).
Among the 203 patients, 99 (49%) had a type A error. Of these injuries missed on the initial scan, 90% were considered to be clinically significant.
Type B errors occurred in 15% of patients. Type C errors (new injuries in different body area) occurred in 54% of patients and, of these, 76% were considered clinically significant. Type D errors (new injuries seen in any imaging of any area) occurred in 73% of patients.
“This study confirms that images are often repeated or completed after having images done at NTCs,” Dr Bonds said. “Relying on NTC image interpretation can lead to undertreating our patients. One potential solution to this issue could be image sharing between NTCs and TTCs. This might reduce both the rate of missed injuries and the need for repeat scans.”
Cutaneous Eruption Reported in Pregnant Woman With Locally Acquired Zika Virus
M. ALEXANDER OTTO
FRONTLINE MEDICAL NEWS
Zika presented in a young, pregnant Florida woman as erythematous follicular macules and papules on the trunk and arms, scattered tender pink papules on the palms, and a few petechiae on the hard palate, according to a report in the New England Journal of Medicine.
The report advises how Zika virus may present during pregnancy. “Medical providers on the front line should be aware of the constellation of symptoms in patients reporting travel to endemic areas, including areas in Southern Florida, where other non-travel-associated cases have been confirmed,” wrote investigators led by Lucy Chen, MD, of the University of Miami.
The 23-year-old woman presented on July 7, 2016 at 23 weeks and 3 days’ gestation with a 3-day history of fever, widespread pruritic rash, and sore throat, which were followed by myalgias and joint pain 2 days later. The cutaneous eruption was noted on physical examination; neither conjunctivitis nor lymphadenopathy was present. The patient and her partner said they had not traveled outside the United States for 2 years.
Zika virus RNA was detected in the woman’s urine and serum specimens with the use of reverse-transcriptase polymerase chain reaction and persisted for 2 weeks in urine samples and for 6 weeks in serum samples. On histopathology, skin lesions revealed a mild perivascular lymphocytic infiltration in the upper dermis, admixed with some neutrophils. Liver and renal functions were normal.
Fetal ultrasonography performed on the day of presentation showed an estimated fetal weight of 644 g (53rd percentile), an estimated head circumference of 221 mm (63rd percentile), and normal intracranial anatomy. Fevers and rash subsided after 3 days of supportive care. Screening for measles, varicella, rubella, syphilis, Epstein-Barr virus, influenza, hepatitis B, hepatitis C, mumps, and dengue was negative.
An initial immunoglobulin M test on July 7 was negative; seroconversion occurred 1 week after presentation and remained positive through delivery.
A full-term infant weighing 2,990 g was delivered vaginally. Neonatal ultrasonography and magnetic resonance imaging of the head showed a normal head size and intracranial anatomy, with no calcifications. Placental tissue was negative for Zika virus, and neonatal laboratory testing revealed no evidence of infection.
The case was confirmed by the Miami-Dade County Department of Health as the first non-travel-associated Zika infection in the United States.
Chen L, Hafeez F, Curry CL, Elgart G. Cutaneous eruption in a U.S. woman with locally acquired Zika virus infection. N Engl J Med. 2017;376(4):400-401. doi:10.1056/NEJMc1610614.
Lab Values Poor Surrogate for Detecting Pediatric Rocky Mountain Spotted Fever in Children
WHITNEY MCKNIGHT
FRONTLINE MEDICAL NEWS
Three fatalities observed in a retrospective analysis of six cases of Rocky Mountain spotted fever (RMSF) in children were associated with either a delayed diagnosis pending laboratory findings or delayed anti-rickettsia treatment, researchers said.
“The fact that all fatal cases died before the convalescent period emphasizes that diagnosis should be based on clinical findings instead of RMSF serologic and histologic testing,” wrote the authors of a study published online in Pediatric Dermatology.
Rechelle Tull of the department of dermatology, Wake Forest University, Winston-Salem, NC, and her colleagues conducted a retrospective review of 3,912 inpatient dermatology consultations over a period of 10 years at a tertiary care center, and identified six patients aged 22 months to 2 years (mean, 5.1 years) diagnosed with RMSF. The patients were evaluated in the months of April, May, and June, and three of the six patients infected with the vector-borne obligate intracellular bacterium, Rickettsia rickettsii, had died within 4 days of hospitalization, according to the authors.
Two of the fatal cases involved delayed anti-rickettsial therapy after the patients were misdiagnosed with group A Streptococcus. None of the six children were initially evaluated for R rickettsii; they averaged three encounters with their clinician before being admitted for acute inpatient care, where they received intravenous doxycycline after nearly a week of symptoms.
“All fatal cases were complicated by neurologic manifestations, including seizures, obtundation, and uncal herniation,” a finding that is consistent with the literature, the authors said.
Although the high-fatality rate might be the result of the small study size, Ms Tull and her coinvestigators concluded that the disease should be considered in all differential diagnoses for children who present with a fever and rash during the summer months in endemic areas, particularly since pediatric cases of the disease are associated with poorer outcomes than adult cases.
Given that RMSF often remains subclinical in its early stages, and typically presents with nonspecific symptoms of fever, rash, headache, and abdominal pain when it does emerge, physicians might be tempted to defer treatment until after serological and histological results are in, as is the standard method. Concerns over doxycycline’s tendency to stain teeth and cause enamel hypoplasia are also common. However, empirical administration could mean the difference between life and death, since treatment within the first 5 days following infection is associated with better outcomes—an algorithm complicated by the fact that symptoms caused by R rickettsii have been known to take as long as 21 days to appear.
In the study, Ms Tull and her colleagues found that the average time between exposure to the tick and the onset of symptoms was 6.6 days (range, 1-21 days).
Currently, there are no diagnostic tests “that reliably diagnose RMSF during the first 7 days of illness,” and most patients “do not develop detectable antibodies until the second week of illness,” the investigators reported. Even then, sensitivity of indirect fluorescent antibody serum testing after the second week of illness is only between 86% and 94%, they noted. Further, the sensitivity of immunohistochemical (IHC) tissue staining has been reported at 70%, and false-negative IHC results are common in acute disease when antibody response is harder to detect.
Ms Tull and her colleagues found that five of the six patients in their study had negative IHC testing; two of the six had positive serum antibody titers. For this reason, they concluded that RMSF diagnosis should be based on “clinical history, examination, and laboratory abnormalities” rather than laboratory testing, and urged that “prompt treatment should be instituted empirically.”
Tull R, Ahn C, Daniel A, Yosipovitch G, Strowd LC. Retrospective study of Rocky Mountain spotted fever in children. Pediatr Dermatol. 2016 Dec 19. doi:10.1111/pde.13053. [Epub ahead of print]
BY JEFF BAUER
A large retrospective analysis found a wide variation in opioid prescribing among emergency physicians (EPs) working within the same ED. The study also found that Medicare patients treated by EPs who wrote the most prescriptions for opioids were more likely to use opioids for 6 months after their ED visit than were those treated by EPs who wrote fewer opioid prescriptions.
Researchers evaluated initial visits to an ED by approximately 378,000 Medicare beneficiaries (average age: 68 years) from 2008 through 2011. None of these patients had received a prescription for an opioid in the 6 months before the ED visit, and none of the visits resulted in a hospital admission. Prescriptions for opioids (excluding methadone) were identified by the national drug code in the Medicare Part D database. An opioid prescription was attributed to the treating EP if the patient filled the prescription within 3 days after the ED visit.
Investigators categorized the treating EPs in this study as “high-intensity” or “low-intensity” opioid prescribers by calculating the proportion of all ED visits that resulted in an opioid prescription being filled. They then grouped the EPs into quartiles of opioid prescribing within each hospital. High-intensity prescribers were those in the top quartile of opioid prescribing rates, and low-intensity prescribers were those in the bottom quartile.
The primary outcome was long-term opioid use, defined as 6 months or more of opioids supplied in the 12 months after the initial ED visit. This did not include prescriptions filled within 30 days of the initial visit.
Overall, approximately 215,700 patients were treated by low-intensity prescribers and 162,000 by high-intensity prescribers. In general, the patient characteristics and diagnoses were similar in both groups. The rate of opioid prescribing of high-intensity prescribers was approximately triple the rate of low-intensity prescribers. High-intensity prescribers provided an opioid prescription for 21.4% of ED visits, compared to 7.3% among low-intensity prescribers.
Long-term opioid use at 12 months was significantly higher among patients who had been initially treated by high-intensity prescribers compared to those who had been treated by low-intensity prescribers (1.51% vs 1.16%; unadjusted odds ratio [OR], 1.31). There was minimal change in this difference after the results were adjusted for the patients’ age, race, sex, disability status, and presence of chronic conditions (OR, 1.30). The number needed to harm was calculated as 49, meaning theoretically, for every 49 patients who received a new opioid prescription in the ED, one would become a long-term user. The authors noted, however, that “…prescriptions provided by other physicians in the months after an [ED] visit are necessary for long-term opioid use to take hold.”
Researchers pointed out several limitations to their study. Because the study was observational, it could not establish causality. Researchers were not able to directly attribute opioid prescriptions to the treating EPs, but instead used prescriptions filled within 3 days of an ED visits as a surrogate; some opioid prescriptions could have been written by another clinician, such as the patient’s primary care physician during a follow-up visit. Because the study focused on Medicare patients, the results may not be applicable to younger patients. Based on their analysis, researchers could not determine whether an opioid prescription was appropriate, and therefore they could not quantify the extent of opioid overprescribing.
For more on EPs and opioid prescribing, see “The New Opioid Epidemic and the Law of Unintended Consequences” by Emergency Medicine Editor in Chief Neal Flomenbaum, MD (Emergency Medicine. 2017;49[2]:52) and “The New Opioid Epidemic: Prescriptions, Synthetics, and Street Drugs” by Rama B. Rao, MD and Emergency Medicine Associate Editor, Toxicology Lewis S. Nelson, MD (Emergency Medicine. 2017;49[2]:64-70).
Barnett ML, Olenski AR, Jena AB. Opioid-prescribing patterns of emergency physicians and risk of long-term use. N Engl J Med. 2017;376(7):663-673. doi:10.1056/NEJMsa1610524.
Lower Admission Rates, Other Factors Tied to High Rate of Death Soon After ED Discharge Among Older Adults
BY JEFF BAUER
Each year, approximately 10,000 older adult patients die within 7 days of discharge from an ED in the United States, despite having no obvious life-threatening illness, according to a large retrospective study. Emergency departments with lower rates of inpatient admission from the ED, lower patient volumes, and lower charges had significantly higher rates of death after discharge.
Researchers evaluated Medicare claims data related to slightly more than 10 million ED visits from 2007 to 2012. Because the goal was to study generally healthy patients, the following patients were excluded: individuals who were age 90 years and older; were receiving palliative or hospice care; or had received a life-limiting diagnosis, such as a myocardial infarction (MI) or a malignancy, either in the ED or in the year prior to the ED visit. The primary outcome was death within 7 days after discharge from an ED. The cause of death was determined by linking claims to death certificates; this information was available only for a subset of patients who visited an ED in 2007 or 2008.
Overall, during the 6-year study, 0.12% of discharged patients died within 7 days of discharge; this translates to more than 10,000 early deaths per year nationally. The leading causes of death were atherosclerotic heart disease (13.6%), MI (10.3%), and chronic obstructive pulmonary disease (9.6%).
Emergency departments ranked in the lowest fifth for admission rates admitted 15% of patients, compared to 56% of patients at EDs with the highest admission rates. The early death rate of patients treated at EDs with the lowest rates of inpatient admissions from the ED was 3.4 times higher than the death rate seen in EDs with the highest inpatient admission rates (0.27% vs 0.08%, respectively). This was true despite the fact that EDs with low-admission rates treated healthier patients, as evidenced by the overall 7-day mortality rate of all patients treated in the ED, whether they were admitted or discharged. Emergency departments that saw higher volumes of patients and had higher charges for visits had significantly fewer deaths.
Obermeyer Z, Cohn B, Wilson M, Jena AB, Cutler DM. Early death after discharge from emergency departments: analysis of national US insurance claims data. BMJ. 2017;356:j239. doi:10.1136/bmj.j239.
Tertiary Center Repeat Computed Tomography Scans Find Additional Injuries
MICHELE G. SULLIVAN
FRONTLINE MEDICAL NEWS
Imaging obtained at nontertiary trauma centers (NTCs) probably does not tell the whole story of a trauma patient’s injuries, according to a new retrospective study.
Repeat scans done at a Level 1 trauma center identified new injuries in 76% of patients who were transferred, Morgan Bonds, MD, reported at the annual scientific assembly of the Eastern Association for the Surgery of Trauma. About half of these previously unobserved injuries were considered clinically significant, said Dr Bonds, a surgical resident at the University of Oklahoma, Oklahoma City.
Her study examined imaging and clinical assessment of 203 trauma patients who were initially worked up at an NTC, and then transferred to the Level 1 University of Oklahoma tertiary trauma center (TTC). The facility’s primary radiologist reviewed all of the initial computed tomography (CT) scans while blinded to the NTC interpretation. The initial scans and interpretations were then compared with those done at the TTC.
The team split imaging and interpretation disconnects into four categories:
- Type A errors: A missed injury on the NTC scan. “This represents the expertise and experience of our primary radiologist,” Dr Bonds said.
- Type B errors: Missed injuries on scans where NTC radiologists saw other injuries that the TTC radiologist did not confirm. “This represents the experience of our radiologist and also the inexperience and overreaction of the NTC radiologists.”
- Type C errors: New injuries seen on additional TTC imaging of the same body area. “This represents the quality of the image.”
- Type D errors: New injuries found upon any new imaging, whether of a previously scanned or newly scanned body area. “This represents quality of work-up—the decision of the trauma team to more fully investigate the patient’s injuries, as well as the quality of the CT tech performing the scan.”
During the study period, 203 patients presented at the TTC with prior scans conducted at an NTC.
The mean age of the patients was 43 years; most (67%) were men. The mean Injury Severity Score was 16; 97% had experienced blunt trauma. Shock was present in 3% and a traumatic brain injury in 8%. Repeat scans were most common for neck and cervical spine injuries (54%) and thoracic/lumbar spine injuries (53%), and least common for chest injuries (32%).
An inadequate NTC work-up as judged by the TTC attending was the most common reason for obtaining new images (76%). Poor image quality was the next most common reason (31%).
Among the 203 patients, 99 (49%) had a type A error. Of these injuries missed on the initial scan, 90% were considered to be clinically significant.
Type B errors occurred in 15% of patients. Type C errors (new injuries in different body area) occurred in 54% of patients and, of these, 76% were considered clinically significant. Type D errors (new injuries seen in any imaging of any area) occurred in 73% of patients.
“This study confirms that images are often repeated or completed after having images done at NTCs,” Dr Bonds said. “Relying on NTC image interpretation can lead to undertreating our patients. One potential solution to this issue could be image sharing between NTCs and TTCs. This might reduce both the rate of missed injuries and the need for repeat scans.”
Cutaneous Eruption Reported in Pregnant Woman With Locally Acquired Zika Virus
M. ALEXANDER OTTO
FRONTLINE MEDICAL NEWS
Zika presented in a young, pregnant Florida woman as erythematous follicular macules and papules on the trunk and arms, scattered tender pink papules on the palms, and a few petechiae on the hard palate, according to a report in the New England Journal of Medicine.
The report advises how Zika virus may present during pregnancy. “Medical providers on the front line should be aware of the constellation of symptoms in patients reporting travel to endemic areas, including areas in Southern Florida, where other non-travel-associated cases have been confirmed,” wrote investigators led by Lucy Chen, MD, of the University of Miami.
The 23-year-old woman presented on July 7, 2016 at 23 weeks and 3 days’ gestation with a 3-day history of fever, widespread pruritic rash, and sore throat, which were followed by myalgias and joint pain 2 days later. The cutaneous eruption was noted on physical examination; neither conjunctivitis nor lymphadenopathy was present. The patient and her partner said they had not traveled outside the United States for 2 years.
Zika virus RNA was detected in the woman’s urine and serum specimens with the use of reverse-transcriptase polymerase chain reaction and persisted for 2 weeks in urine samples and for 6 weeks in serum samples. On histopathology, skin lesions revealed a mild perivascular lymphocytic infiltration in the upper dermis, admixed with some neutrophils. Liver and renal functions were normal.
Fetal ultrasonography performed on the day of presentation showed an estimated fetal weight of 644 g (53rd percentile), an estimated head circumference of 221 mm (63rd percentile), and normal intracranial anatomy. Fevers and rash subsided after 3 days of supportive care. Screening for measles, varicella, rubella, syphilis, Epstein-Barr virus, influenza, hepatitis B, hepatitis C, mumps, and dengue was negative.
An initial immunoglobulin M test on July 7 was negative; seroconversion occurred 1 week after presentation and remained positive through delivery.
A full-term infant weighing 2,990 g was delivered vaginally. Neonatal ultrasonography and magnetic resonance imaging of the head showed a normal head size and intracranial anatomy, with no calcifications. Placental tissue was negative for Zika virus, and neonatal laboratory testing revealed no evidence of infection.
The case was confirmed by the Miami-Dade County Department of Health as the first non-travel-associated Zika infection in the United States.
Chen L, Hafeez F, Curry CL, Elgart G. Cutaneous eruption in a U.S. woman with locally acquired Zika virus infection. N Engl J Med. 2017;376(4):400-401. doi:10.1056/NEJMc1610614.
Lab Values Poor Surrogate for Detecting Pediatric Rocky Mountain Spotted Fever in Children
WHITNEY MCKNIGHT
FRONTLINE MEDICAL NEWS
Three fatalities observed in a retrospective analysis of six cases of Rocky Mountain spotted fever (RMSF) in children were associated with either a delayed diagnosis pending laboratory findings or delayed anti-rickettsia treatment, researchers said.
“The fact that all fatal cases died before the convalescent period emphasizes that diagnosis should be based on clinical findings instead of RMSF serologic and histologic testing,” wrote the authors of a study published online in Pediatric Dermatology.
Rechelle Tull of the department of dermatology, Wake Forest University, Winston-Salem, NC, and her colleagues conducted a retrospective review of 3,912 inpatient dermatology consultations over a period of 10 years at a tertiary care center, and identified six patients aged 22 months to 2 years (mean, 5.1 years) diagnosed with RMSF. The patients were evaluated in the months of April, May, and June, and three of the six patients infected with the vector-borne obligate intracellular bacterium, Rickettsia rickettsii, had died within 4 days of hospitalization, according to the authors.
Two of the fatal cases involved delayed anti-rickettsial therapy after the patients were misdiagnosed with group A Streptococcus. None of the six children were initially evaluated for R rickettsii; they averaged three encounters with their clinician before being admitted for acute inpatient care, where they received intravenous doxycycline after nearly a week of symptoms.
“All fatal cases were complicated by neurologic manifestations, including seizures, obtundation, and uncal herniation,” a finding that is consistent with the literature, the authors said.
Although the high-fatality rate might be the result of the small study size, Ms Tull and her coinvestigators concluded that the disease should be considered in all differential diagnoses for children who present with a fever and rash during the summer months in endemic areas, particularly since pediatric cases of the disease are associated with poorer outcomes than adult cases.
Given that RMSF often remains subclinical in its early stages, and typically presents with nonspecific symptoms of fever, rash, headache, and abdominal pain when it does emerge, physicians might be tempted to defer treatment until after serological and histological results are in, as is the standard method. Concerns over doxycycline’s tendency to stain teeth and cause enamel hypoplasia are also common. However, empirical administration could mean the difference between life and death, since treatment within the first 5 days following infection is associated with better outcomes—an algorithm complicated by the fact that symptoms caused by R rickettsii have been known to take as long as 21 days to appear.
In the study, Ms Tull and her colleagues found that the average time between exposure to the tick and the onset of symptoms was 6.6 days (range, 1-21 days).
Currently, there are no diagnostic tests “that reliably diagnose RMSF during the first 7 days of illness,” and most patients “do not develop detectable antibodies until the second week of illness,” the investigators reported. Even then, sensitivity of indirect fluorescent antibody serum testing after the second week of illness is only between 86% and 94%, they noted. Further, the sensitivity of immunohistochemical (IHC) tissue staining has been reported at 70%, and false-negative IHC results are common in acute disease when antibody response is harder to detect.
Ms Tull and her colleagues found that five of the six patients in their study had negative IHC testing; two of the six had positive serum antibody titers. For this reason, they concluded that RMSF diagnosis should be based on “clinical history, examination, and laboratory abnormalities” rather than laboratory testing, and urged that “prompt treatment should be instituted empirically.”
Tull R, Ahn C, Daniel A, Yosipovitch G, Strowd LC. Retrospective study of Rocky Mountain spotted fever in children. Pediatr Dermatol. 2016 Dec 19. doi:10.1111/pde.13053. [Epub ahead of print]

Treatment Guidelines for the Use of Antiretroviral Agents in HIV-Infected Adults and Adolescents: An Update
On April 8, 2015, HSS released updated HIV treatment guidelines.1 The original 1998 guidelines for the use of antiretroviral agents for treating adults and adolescents infected with HIV emphasized the benefit of potent combination antiretroviral therapies (ARTs) that included protease inhibitors (PIs).2,3 Since then there have been more than 25 HSS guidelines focusing primarily on when to initiate ART and which ART to prescribe. The question of when to start ART had been controversial, but the most recently issued guidelines have addressed this question. For the first time, HSS recommends ART for all individuals infected with HIV regardless of CD4+ T-cell count.1 The timely initiation of effective ART with an associated reduction in HIV viremia benefits patients infected with HIV and substantially decreases transmission of HIV to uninfected sexual partners.3
Three large, international randomized placebo-controlled studies conducted between 2002 and 2015 provide evidence that the benefits of ART outweigh the potential deleterious effects of long-term ART. The Strategies for Management of Antiretroviral Therapy (SMART) was the first published study in this trifecta.4,5 Given concern about the adverse effects (AEs) of ART, particularly PIs, this study was designed to investigate whether long-term ART was associated with more toxicities than was deferred therapy, determined by CD4+ cell counts. The study was halted prematurely, because the risk of death or grade-4 toxicity was statistically greater among those receiving episodic ART than among those on continuous therapy. The SMART trial demonstrated that ART therapy was beneficial, but it did not determine when to initiate ART, particularly in asymptomatic persons.5
It was thought that the risk of transmission of HIV through sexual contact or shared drug paraphernalia was significantly lower for patients on ART who achieve viral suppression compared with those with uncontrolled viremia. The HIV Prevention Trials Network study enrolled HIV-serodiscordant couples to examine transmission of HIV. The trial compared HIV-positive patients who initiated ART when their CD4+ cell count was between 350 to 550 cells/mm3 with patients who began therapy when their CD4+ cell count was < 250 cells/mm3 or when an AIDS-defining illness was diagnosed. The difference in the rate of transmission to a HIV-negative partner was dramatic. The rate was 96% less among those in the early-therapy group vs those in the deferred-therapy group. In addition, there was a 40% reduction in the progression of HIV-related disease in the participants randomized to the early-therapy group.6
In March 2011, the International Network for Strategic Initiatives in Global HIV Trials (INSIGHT), which conducted SMART, initiated the Strategic Timing of AntiRetroviral Treatment (START) study to define the optimal time to begin ART among asymptomatic patients with a CD4+ count of > 350 cells/mm3. Patients with a CD4+ cell count of > 500 cells/mm3 were randomized to either initiate ART, or defer ART until the CD4+ cell count fell to < 350 cells/mm3 or until an AIDS-defining illness occurred.7 On May 15, 2015, the study was terminated early. Based on an interim analysis, the data safety and monitoring board announced that the risk for a serious AIDS-related event, serious non-AIDS-related event, or death from any cause was 57% less in the early treatment group. When compared with patients who delayed ART, for those on ART, serious AIDS-related events were reduced 72%, and serious non-AIDS events were reduced 39%.8 A similar study conducted in the Ivory Coast from March 2008 to January 2015 also favored early rather than deferred ART.9
Experience in clinical practice, these landmark clinical trials, and several cohort studies served as the basis of the changes in the new HSS guidelines that endorse ART for all HIV-infected persons. The World Health Organization (WHO) has recently published similar guidelines.10 It is yet to be determined whether the guidelines have been implemented successfully. Nonetheless, for both the clinician and the patient where access to ongoing care and ART are available, the new guidelines greatly simplify the treatment choices.
What's New in the Guidelines?
The Guidelines for the Use of Antiretroviral Agents in HIV-Infected Adults and Adolescents presents significant changes in several of the tables that are most clinically useful, including Tables 6, 7, and 8.1 Table 6 presents recommended, alternative, and other antiretroviral regimen options. The guidelines also added new tables describing antiretroviral regimen considerations for initial therapy and the mechanisms of antiretroviral-associated drug interactions.
Initial Combination Regimens for the Antiretroviral-Naïve Patient
Five regimens are now recommended for ART-naïve patients: 4 are integrase strand transfer inhibitor-based regimens, and 1 is a ritonavir-boosted PI-based regimen (Table 1). A nonnucleoside reverse transcriptase inhibitor-based regimen is no longer recommended. The guidelines include regimens that are now considered less favorable for a variety of reasons, including reduced virologic activity and greater risk of toxicities, higher pill burden, and more potential drug interactions. Several regimens that have been widely used are now included in this latter option, in particular efavirenz plus abacavir/lamivudine (3TC), lopinavir/ritonavir plus abacavir (ABC)/3TC, and tenofovir fumarate (TDF)/emtricitabine (FTC).
The most significant change in the guideline is the reclassification of efavirenz from a recommended to an alternative therapy. The principal reasons for this change are central nervous system (CNS) AEs, which can include depression and a reported 2-fold increase in the risk of suicide or suicidal ideation.11
In November 2015, the FDA approved Genvoya, a once-daily, fixed-dose combination tablet containing elvitegravir, cobicistat, FTC, and tenofovir alafenamide (TAF).12 With this approval, there are now 5 once-daily HIV treatment options. This new drug is similar to elvitegravir/cobicistat/TDF/FTC, but it substitutes TAF for TDF. The benefits of this substitution include less bone loss and decreased renal toxicity.13-15 Genvoya may be prescribed in patients with a 30 mL/min creatinine clearance. The TAF-containing once-daily formulation achieves higher intracellular levels and lower blood levels of TAF. Therefore, the cholesterol-lowering benefits are less than those of the TDF-containing alternative.
In the 2015 guidelines, Table 7 provides concise guidance on the selection of an ART regimen based on patient and regimen characteristics, including food-based AEs; the presence of other medical and/or psychiatric conditions; and the presence of co-infections, including hepatitis B virus (HBV), hepatitis C virus (HCV), and tuberculosis.1 In addition, Table 8 outlines the advantages and disadvantages of the different classes of ART.1 For example, dolutegravir may have a higher barrier to resistance than that of elvitegravir or raltegravir.16 It is now possible for those living with HIV to have ongoing viral suppression, which will not only improve their lives, but also decrease the risk of HIV transmission to sexual partners. Starting from the time of diagnosis, achieving viral suppression is dependent on a link to care with initiation of ART and retention in care. The 5 once-daily options should improve adherence. The infrastructure to ensure lifelong retention in care, medication availability, and adherence still poses many challenges.
Treatment-Experienced Patients
The guidelines were updated to include more direction on virologic failure to a first-line regimen as well as a second-line regimen failure or beyond. It includes a discussion of treatment options for achieving full virologic suppression. There also are treatment recommendations for patients with multidrug viral resistance in whom maximal viral suppression may not be achieved. For such patients, ART should be continued to preserve immunologic function, lessen clinical progression, and minimize resistance to drug classes that could include new efficacious drugs.17,18
There is also a discussion in the guidelines of the issues surrounding isolated CNS virologic failure and the onset of new neurologic symptoms. With CNS virologic failure, magnetic resonance brain imaging may be abnormal with a lymphocytic pleocytosis in the cerebrospinal fluid (CSF). If available to guide therapy, CSF HIV RNA should be measured, and HIV drug resistance in the CSF should be tested. Central nervous system viral escape should be differentiated from other CNS conditions, such as herpes zoster infection; incidental mild CSF HIV RNA increases; or the now relatively common but chronic neurocognitive impairment seen with HIV infection.19,20
Poor CD4+ Recovery and Persistent Inflammation Despite Viral Suppression
For patients on ART who achieve viral suppression but fail to have a significant increase in CD4+ cell count over time (particularly for the patient with a CD4+ cell count < 200 cells/mm3), the guidelines do not endorse additional ARTs or switching the regimen. However, there may be an increased risk of non-AIDS mortality and morbidity, including cardiovascular disease. For such patients, interleukin-2 adjunctive therapy has no demonstrated clinical benefit.21 Interleukin-7 and recombinant human growth hormone should be used only as part of a clinical trial.
It is now evident that immune activation and inflammation, although lessened, persist despite ART-mediated viral suppression.22,23 There is no recommendation to monitor markers of immune activation and inflammation. Efforts should focus on risk factor modifications, such as smoking cessation, improved diet, treatment of alcohol abuse and dependence, regular exercise, and maintenance of appropriate weight. Emphasis should be on treating chronic comorbidities, such as hypertension, diabetes, osteoporosis, and hyperlipidemia.
HIV/HCV Co-infection
According to the WHO, 130 to 150 million people worldwide have chronic HCV infection.24 In the U.S., it is estimated that up to one-quarter of HIV-infected persons have HCV co-infection.25 With the currently available oral direct-acting agents (DAAs) for the treatment of chronic HCV infection in patients with HIV/HCV co-infection, rates of sustained virologic response to treatment are comparable in patients with HIV/HCV co-infection with those of patients with HCV monoinfection.26 Accordingly, all HIV-infected patients should be screened for HCV infection, and HIV ART should not be deferred for most patients.
For patients with a CD4+ cell count of < 200 cells/mm3, treatment of HCV should be deferred until the patients are on a stable and effective ART regimen. Whereas for those with a CD4+ cell count > 500 cells/mm3, HCV can be treated before initiating HIV ART. When initiating
HCV therapy, clinicians must pay attention to drug-drug interactions. Patients with cirrhosis are particularly at risk. The most recent guidelines for the treatment of HCV co-infection should be reviewed when selecting a DAA to treat HCV.27 Many patients are now being treated successfully for HCV co-infection. Extending such therapy to all patients with HIV/HCV co-infection for whom treatment is appropriate should be a priority for clinicians, insurance providers, and policy makers.
Drug Interactions
Given the availability of numerous once-daily ART regimens, prescribing ART has been greatly simplified. Nonetheless, there are many pharmacokinetic drug-drug interactions between antiretroviral drugs and concomitant medications. When changing either the ART or adding or changing other medications, the clinician must always pay attention to potential drug-drug interactions. Consideration must be given to the interaction with drugs that affect antiretroviral absorption—particularly, acid-reducing agents and products that contain polyvalent cations, including calcium and magnesium.
When antiretrovirals that undergo hepatic metabolism are given with other drugs that also are metabolized by the cytochrome P450 enzyme system or other hepatic enzymes, the levels of antiretrovirals or other drug may be significantly increased or decreased.1 The 2 booster—cobicistat and ritonavir—used to increase certain antiretrovirals levels also may alter the metabolism of other drugs.28,29 The new guidelines contain updated and detailed tables on drug-drug interactions. Given the comorbid conditions, particularly among those aging with HIV, polypharmacy is an increasingly common concern. It is essential for clinicians to work with knowledgeable HIV pharmacists to ensure the correct and safe prescribing of all medications.
HIV/AIDS Demographics in U.S.
Of the more than 1.2 million people aged > 13 years in the U.S. living with HIV, about 1 in 8 are unaware of their infection.30 The Centers for Disease Control and Prevention (CDC) estimates that about 50,000 people are newly infected every year.31 Men who have sex with men (MSM) are the group most impacted by HIV, and African American MSM are disproportionately represented. Although MSM were only about 4% of the U.S. male population in 2010, 78% of the newly diagnosed HIV infections among males were in MSM (63% of all new HIV infections).32,33 The groups at greatest risk of HIV infection are now young black and Latino MSM aged 13 to 24 years.33 Decreasing the rate of new HIV infections in this high-risk population remains challenging.
Across the U.S., the HIV epidemic continues to disproportionately impact southern states. An estimated 44% of all people living with HIV in the U.S. reside in the District of Columbia and in 16 southern states.34 Among the 10 states with the highest death rate for persons diagnosed with HIV, 7 are southern states–Louisiana, Alabama, Mississippi, South Carolina, Kentucky, and Maryland.35,36 The HIV epidemic in southern states is not confined to urban centers but instead extends across rural areas that have limited access to adequate health care and high rates of poverty.37
HIV Care Continuum
In July 2013, President Obama established the HIV Continuum Care Initiative directing federal departments to accelerate efforts and direct resources to increase the proportion of HIV-infected persons successfully receiving care in each stage of the continuum as part of the National HIV/AIDS Strategy.38,39 In November 2014, the CDC released a report on HIV in the U.S. that found about 14% of those with HIV infection have never been diagnosed, and only 40% are receiving HIV medical care.40 Despite the much improved and simplified ART regimens, only 30% of those living with HIV infection in the U.S. have achieved viral suppression. The CDC has outlined 4 steps for achieving viral suppression, the ultimate goal of all HIV treatment (Table 2).41
In the U.S. and Canada, a person diagnosed with HIV aged 20 years who adheres to a HIV ART regimen has a life expectancy of 71 years. The same person not taking ART has a dramatically shortened life expectancy of 32 years.42 The successful implementation of ART can help those living with HIV to enjoy an average life expectancy no different from that of persons without HIV infection.
The Future of the HIV/AIDS Epidemic
In 2014, the Joint United Nations Program on HIV/ AIDS estimated that 35 million people were living with HIV/AIDS and that 13 million were receiving ART globally. Three of 5 people with HIV infection, about 22 million, did not have access to ART. Less than one quarter of HIV-infected children are on ART.43 Changing the course of the HIV/AIDS pandemic in the U.S. and worldwide is within reach, and the new HSS and WHO guidelines provide an evidence-based framework to alter this course. Significantly expanding screening for HIV and ensuring treatment access
for all persons diagnosed with HIV as well as appropriate provision of pre-exposure prophylaxis would irrevocably alter the lives of the millions of people living with HIV/AIDS and others in their communities. It remains to be seen whether the goal to eliminate AIDS by 2020, set in both the National HIV/AIDS Strategy and the UN global commitment will be achieved.
Click here to read the digital edition.
1. DHHS Panel on Antiretroviral Guidelines for Adults and Adolescents. Guidelines for the use of antiretroviral agents in HIV-1 infected adults and adolescents. AIDSinfo Website. https://aidsinfo.nih.gov/contentfiles/lvguidelines/adultandadolescentgl.pdf. Updated January 28, 2016. Accessed March 9, 2016.
2. NIH Panel to Define Principles of Therapy of HIV Infection. Report of the NIH panel to define principles of therapy of HIV infection and Guidelines for the Use of Antiretroviral Agents in HIV-Infected Adults and Adolescents. MMWR Recomm Rep. 1988;47(RR-5):1-41.
3. Stanley SK, Kaplan JE, National Center for HIV, STD, and TB Prevention Division of HIV/AIDS Prevention Surveillance, and Epidemiology. Guidelines for the use of antiretroviral agents in HIV-infected adults and adolescents. MMWR Recomm Rep. 1988;47(RR-5):42-82.
4. Fauci AS, Marston HD. Ending the HIV-AIDS pandemic—follow the science. N Engl J Med. 2015;373(23):2197-2199.
5. El-Sadr WM, Lundgren J, Neaton JD, et al; The Strategies for Management of Antiretroviral Therapy (SMART) Study Group. CD4+ count-guided interruption of antiretroviral treatment. N Engl J Med. 2006;355(22):2283-2296.
6. Cohen MS, Chen YQ, McCauley M. et al; HPTN 052 Study Team. Prevention of HIV-1 infection with early antiretroviral therapy. N Engl J Med. 2011;365(6):493-505.
7. Lundgren JD, Babiker AG, et al; The INSIGHT START Study Group. Initiation of antiretroviral therapy in early asymptomatic HIV infection. N Engl J Med. 2015;373(9):795-807.
8. National Institutes of Health. Starting antiretroviral therapy early improves outcomes for HIV-infected individuals [news release]. U.S. Dept. of Health and Human Services Website. http://www.nih.gov/news-events/news-releases/starting-antiretroviral-treatment-early-improves-outcomes-hiv-infected-individuals, Published May 27, 2015. Accessed March 9, 2016.
9. Danel C, Moh R, et al; The TEMPRANO ANRS 12136 Study Group. A trial of early antiretrovirals and isoniazid preventive therapy in Africa. N Engl J Med. 2015;373(9):808-822.
10. World Health Organization. Guidelines on when to start antiretroviral therapy and on pre-exposure prophylaxis for HIV. World Health Organization Website. http://apps.who.int/iris/bitstream/10665/186275/1/9789241509565_eng.pdf. Published September 2015. Accessed March 9, 2016.
11. Mollan KR, Smurzynski M, Eron JJ, et al. Association between efavirenz as initial therapy for HIV-1 infection and increased risk for suicidal ideation or attempted or completed suicide: an analysis of trial data. Ann Intern Med. 2014;161(1):1-10.
12. FDA approves new treatment for HIV [news release]. U.S. Food and Drug Administration Website. http://www.fda.gov/NewsEvents/Newsroom/PressAnnouncements/ucm471300.htm. Published November 5, 2015. Accessed March 9, 2016.
13. Mills A, Aribas JR, Andrade-Villanueve J, et al. Switching from tenofovir disoproxil fumarate to tenofovir alafenamide in antiretroviral regimens for virologically suppressed adults with HIV-1 infection: a randomized, active-controlled, multicentre, open-label, phase 3, non-inferiority study. Lancet Infect Dis. 2016;16(1):43-52.
14. Sax PE, Zolopa A, Brar I, et al. Tenofovir alafenamide vs. tenofovir disoproxil fumarate in single tablet regimens for initial HIV-1 therapy: a randomized phase 2 study. J Acquir Immune Defic Syndr. 2014;67(1):52-58.
15. Sax PE, Wohl A, Yin MT, et al; GS-US-292-0104/0111 Study Team. Tenofovir alafenamide versus tenofovir disoproxil fumarate, coformulated with elvitegravir, cobicistat, and emtricitabine, for initial treatment of HIV-1 infection: two randomised, double-blind, phase 3, non-inferiority trials. Lancet. 2015;385(9987):2602-2615.
16. Fanrauzzi A, Messaroma I. Dolutegravir: clinical efficacy and role in HIV therapy. Ther Adv Chronic Dis. 2014;5(4):164-177.
17. Miller V, Sabon C, Hertogs K, et al. Virological and immunological effects of treatment interruptions in HIV-1 infected patients with treatment failure. AIDS. 2000;14(18):2857-2867.
18. Raffanti SP, Fusco JS, Sherrill BH, et al; Collaborations in HIV Outcomes Research/United States Project. Effect of persistent moderate viremia on disease progression during HIV therapy. J Acquir Immune Defic Syndr. 2004;37(1):1174-1154.
19. Canestri A, Lescure FX, Jaureguiberry S, et al. Discordance between cerebral spinal fluid and plasma HIV replication in patients with neurological symptoms who are receiving suppressive antiretroviral therapy. Clin Infect Dis. 2010;50(5):773-778.
20. Peluso MJ, Ferretti F, Peterson J, et al. Cerebrospinal fluid HIV escape associated with progressive neurologic dysfunction in patients on antiretroviral therapy with well controlled plasma viral load. AIDS. 2012;26(14):1765-1774.
21. Abrams D, Levy Y, Losso MH, et al. Interleukin-2 therapy in patients with HIV infection. N Engl J Med. 2009;361(16):1548-1559.
22. Tien PC, Choi AI, Zolopa AR, et al. Inflammation and mortality in HIV-infected adults: analysis of the FRAM study cohort. J Acquir Immune Defic Syndr. 2010;55(3):316-322.
23. Lederman MM, Funderburg NT, Sekaly RP, Klatt NR, Hunt PW. Residual immune dysregulation syndrome in treated HIV infection. Adv Immunol. 2013;119:51-83.
24. Mohd Hanafiah K, Groeger J, Flaxman AD, Wiersma ST. Global epidemiology of hepatitis C virus infection new estimates of age-specific antibody to HCV seroprevalence. Hepatology. 2013;57(4):1333-1342.
25. Sherman KE, Rouster SD, Chung RT, Rajicic N. Hepatitis C virus prevalence among patients infected with human immunodeficiency virus: a crosssectional analysis of the US adult AIDS Clinical Trials Group. Clin Infect Dis. 2002;34(6):831-837.
26. Cachay ER, Wyles D, Hill L, et al. The impact of direct-acting antivirals in the hepatitis C-sustained viral response in human immunodeficiency virus-infected patients with ongoing barriers to care. Open Forum Infect Dis. 2015;2(4):ofv168.
27. American Association for the Study of Liver Diseases, Infectious Diseases Society of American. Recommendations for testing, managing, and treating hepatitis C. American Association for the Study of Liver Diseases and the Infectious Diseases Society of America Website. http://hcvguidelines.org/sites/default/files/HCV-Guidance_February_2016_a1.pdf. Updated February 24, 2016. Accessed March 8, 2016.
28. Shah BM, Schafer JJ, Priano J, Squires KE. Cobicistat: a new booster for the treatment of human immunodeficiency virus infection. Pharmacotherapy. 2013;33(10):1107-1116.
29. Hull MW, Montaner JS. Ritonavir-boosted protease inhibitors in HIV therapy. Ann Med. 2011;43(5):375-388.
30. Centers for Disease Control and Prevention. HIV in the United States: at a glance. Centers for Disease Control and Prevention Website. http://www.cdc.gov/hiv/statistics/overview/ataglance.html. Updated September 29, 2015. Accessed March 8, 2016.
31. Prejean J, Song R, Hernandez A, et al. Estimated HIV incidence in the United States, 2006-2009. PLoS One. 2011;6(8):e17502.
32. Purcell DW, Johnson CH, Lansky A, et al. Estimating the population size of men who have sex with men in the United States to obtain HIV and syphilis rates. Open AIDS J. 2012;6:98-107.
33. Centers for Disease Control and Prevention. Estimated HIV incidence in the United States, 2007-2010. HIV Surveillance Report: Supplemental Report 2012;17(4). http://www.cdc.gov/hiv/pdf/statistics_hssr_vol_17_no_4.pdf. Published December 2012. Accessed Mar 23, 2016.
34. Centers for Disease Control and Prevention. HIV in the Southern United States. Centers for Disease Control and Prevention Website. http://www.cdc.gov/hiv/pdf /policies/cdc-hiv-in-the-south-issue-brief.pdf. Published December 2015. Accessed March 22, 2016.
35. Centers for Disease Control and Prevention. Southern states lag behind the rest of the nation in HIV treatment, testing [release]. Centers for Disease Control and Prevention Website. http://www.cdc.gov/nchhstp/newsroom/2015 /nhpc-press-release-southern-states.html. Published December 6, 2015. Accessed March 23, 2016.
36. Krawczyk CS, Funkhouser E, Kilbe JM, Vermund SH. Delayed access to HIV diagnosis and care: special concerns for the Southern United States. AIDS Care. 2006;18(suppl 1):S35-S44.
37. Reif S, Pence BW, Hall I, Hu X, Whetten K, Wilson E. HIV diagnosis, prevalence and outcomes in nine southern states. J Community Health. 2015;40(4);642-651.
38. Office of National AIDS Policy. National HIV/AIDS strategy. Improving outcomes: accelerating progress along the HIV care continuum. White House Website. https://www.whitehouse.gov/sites/default/files/onap_nhas_improving_outcomes _dec_2013.pdf. Published December 2013. Accessed March 8, 2016.
39. The White House Office of National AIDS Policy. National HIV/AIDS Strategy: Federal implementation plan. White House Website. http://www.whitehouse.gov/files/documents/nhas-implementation.pdf. Published July 2010. Accessed March 8, 2016.
40. Bradley H, Hall HI, Wolitski RJ, et al. Vital signs: HIV diagnosis, care, and treatment among persons living with HIV—United States, 2011. MMWR Morb Mortal Wkly Rep. 2014;63(47):1113-1117.
41. Centers for Disease Control and Prevention. CDC Vitalsigns. HIV care saves lives: viral suppression is key. Centers for Disease Control and Prevention Website. http://www.cdc.gov/vitalsigns/hiv-aids-medical-care. Published November 2014. Accessed March 8, 2016.
42. Samji H, Cescon A, Hogg RS, et al; North American AIDS Cohort Collaboration on Research and Design (NA-ACCORD) of IeDEA. Closing the gap: increases in life expectancy among treated HIV-positive individuals in the United States and Canada. PLoS One. 2013;8(12):e81355.
43. Joint United Nations Programme on HIV/AIDS. UNAIDS report shows that 19 million of the 35 million people living with HIV today do not know that they have the virus [press release]. UNAIDS Website. http://www.unaids.org/sites/default/files/web_story/20140716_PR_GapReport_en.pdf. Published July 16, 2014. Accessed March 8, 2016.
On April 8, 2015, HSS released updated HIV treatment guidelines.1 The original 1998 guidelines for the use of antiretroviral agents for treating adults and adolescents infected with HIV emphasized the benefit of potent combination antiretroviral therapies (ARTs) that included protease inhibitors (PIs).2,3 Since then there have been more than 25 HSS guidelines focusing primarily on when to initiate ART and which ART to prescribe. The question of when to start ART had been controversial, but the most recently issued guidelines have addressed this question. For the first time, HSS recommends ART for all individuals infected with HIV regardless of CD4+ T-cell count.1 The timely initiation of effective ART with an associated reduction in HIV viremia benefits patients infected with HIV and substantially decreases transmission of HIV to uninfected sexual partners.3
Three large, international randomized placebo-controlled studies conducted between 2002 and 2015 provide evidence that the benefits of ART outweigh the potential deleterious effects of long-term ART. The Strategies for Management of Antiretroviral Therapy (SMART) was the first published study in this trifecta.4,5 Given concern about the adverse effects (AEs) of ART, particularly PIs, this study was designed to investigate whether long-term ART was associated with more toxicities than was deferred therapy, determined by CD4+ cell counts. The study was halted prematurely, because the risk of death or grade-4 toxicity was statistically greater among those receiving episodic ART than among those on continuous therapy. The SMART trial demonstrated that ART therapy was beneficial, but it did not determine when to initiate ART, particularly in asymptomatic persons.5
It was thought that the risk of transmission of HIV through sexual contact or shared drug paraphernalia was significantly lower for patients on ART who achieve viral suppression compared with those with uncontrolled viremia. The HIV Prevention Trials Network study enrolled HIV-serodiscordant couples to examine transmission of HIV. The trial compared HIV-positive patients who initiated ART when their CD4+ cell count was between 350 to 550 cells/mm3 with patients who began therapy when their CD4+ cell count was < 250 cells/mm3 or when an AIDS-defining illness was diagnosed. The difference in the rate of transmission to a HIV-negative partner was dramatic. The rate was 96% less among those in the early-therapy group vs those in the deferred-therapy group. In addition, there was a 40% reduction in the progression of HIV-related disease in the participants randomized to the early-therapy group.6
In March 2011, the International Network for Strategic Initiatives in Global HIV Trials (INSIGHT), which conducted SMART, initiated the Strategic Timing of AntiRetroviral Treatment (START) study to define the optimal time to begin ART among asymptomatic patients with a CD4+ count of > 350 cells/mm3. Patients with a CD4+ cell count of > 500 cells/mm3 were randomized to either initiate ART, or defer ART until the CD4+ cell count fell to < 350 cells/mm3 or until an AIDS-defining illness occurred.7 On May 15, 2015, the study was terminated early. Based on an interim analysis, the data safety and monitoring board announced that the risk for a serious AIDS-related event, serious non-AIDS-related event, or death from any cause was 57% less in the early treatment group. When compared with patients who delayed ART, for those on ART, serious AIDS-related events were reduced 72%, and serious non-AIDS events were reduced 39%.8 A similar study conducted in the Ivory Coast from March 2008 to January 2015 also favored early rather than deferred ART.9
Experience in clinical practice, these landmark clinical trials, and several cohort studies served as the basis of the changes in the new HSS guidelines that endorse ART for all HIV-infected persons. The World Health Organization (WHO) has recently published similar guidelines.10 It is yet to be determined whether the guidelines have been implemented successfully. Nonetheless, for both the clinician and the patient where access to ongoing care and ART are available, the new guidelines greatly simplify the treatment choices.
What's New in the Guidelines?
The Guidelines for the Use of Antiretroviral Agents in HIV-Infected Adults and Adolescents presents significant changes in several of the tables that are most clinically useful, including Tables 6, 7, and 8.1 Table 6 presents recommended, alternative, and other antiretroviral regimen options. The guidelines also added new tables describing antiretroviral regimen considerations for initial therapy and the mechanisms of antiretroviral-associated drug interactions.
Initial Combination Regimens for the Antiretroviral-Naïve Patient
Five regimens are now recommended for ART-naïve patients: 4 are integrase strand transfer inhibitor-based regimens, and 1 is a ritonavir-boosted PI-based regimen (Table 1). A nonnucleoside reverse transcriptase inhibitor-based regimen is no longer recommended. The guidelines include regimens that are now considered less favorable for a variety of reasons, including reduced virologic activity and greater risk of toxicities, higher pill burden, and more potential drug interactions. Several regimens that have been widely used are now included in this latter option, in particular efavirenz plus abacavir/lamivudine (3TC), lopinavir/ritonavir plus abacavir (ABC)/3TC, and tenofovir fumarate (TDF)/emtricitabine (FTC).
The most significant change in the guideline is the reclassification of efavirenz from a recommended to an alternative therapy. The principal reasons for this change are central nervous system (CNS) AEs, which can include depression and a reported 2-fold increase in the risk of suicide or suicidal ideation.11
In November 2015, the FDA approved Genvoya, a once-daily, fixed-dose combination tablet containing elvitegravir, cobicistat, FTC, and tenofovir alafenamide (TAF).12 With this approval, there are now 5 once-daily HIV treatment options. This new drug is similar to elvitegravir/cobicistat/TDF/FTC, but it substitutes TAF for TDF. The benefits of this substitution include less bone loss and decreased renal toxicity.13-15 Genvoya may be prescribed in patients with a 30 mL/min creatinine clearance. The TAF-containing once-daily formulation achieves higher intracellular levels and lower blood levels of TAF. Therefore, the cholesterol-lowering benefits are less than those of the TDF-containing alternative.
In the 2015 guidelines, Table 7 provides concise guidance on the selection of an ART regimen based on patient and regimen characteristics, including food-based AEs; the presence of other medical and/or psychiatric conditions; and the presence of co-infections, including hepatitis B virus (HBV), hepatitis C virus (HCV), and tuberculosis.1 In addition, Table 8 outlines the advantages and disadvantages of the different classes of ART.1 For example, dolutegravir may have a higher barrier to resistance than that of elvitegravir or raltegravir.16 It is now possible for those living with HIV to have ongoing viral suppression, which will not only improve their lives, but also decrease the risk of HIV transmission to sexual partners. Starting from the time of diagnosis, achieving viral suppression is dependent on a link to care with initiation of ART and retention in care. The 5 once-daily options should improve adherence. The infrastructure to ensure lifelong retention in care, medication availability, and adherence still poses many challenges.
Treatment-Experienced Patients
The guidelines were updated to include more direction on virologic failure to a first-line regimen as well as a second-line regimen failure or beyond. It includes a discussion of treatment options for achieving full virologic suppression. There also are treatment recommendations for patients with multidrug viral resistance in whom maximal viral suppression may not be achieved. For such patients, ART should be continued to preserve immunologic function, lessen clinical progression, and minimize resistance to drug classes that could include new efficacious drugs.17,18
There is also a discussion in the guidelines of the issues surrounding isolated CNS virologic failure and the onset of new neurologic symptoms. With CNS virologic failure, magnetic resonance brain imaging may be abnormal with a lymphocytic pleocytosis in the cerebrospinal fluid (CSF). If available to guide therapy, CSF HIV RNA should be measured, and HIV drug resistance in the CSF should be tested. Central nervous system viral escape should be differentiated from other CNS conditions, such as herpes zoster infection; incidental mild CSF HIV RNA increases; or the now relatively common but chronic neurocognitive impairment seen with HIV infection.19,20
Poor CD4+ Recovery and Persistent Inflammation Despite Viral Suppression
For patients on ART who achieve viral suppression but fail to have a significant increase in CD4+ cell count over time (particularly for the patient with a CD4+ cell count < 200 cells/mm3), the guidelines do not endorse additional ARTs or switching the regimen. However, there may be an increased risk of non-AIDS mortality and morbidity, including cardiovascular disease. For such patients, interleukin-2 adjunctive therapy has no demonstrated clinical benefit.21 Interleukin-7 and recombinant human growth hormone should be used only as part of a clinical trial.
It is now evident that immune activation and inflammation, although lessened, persist despite ART-mediated viral suppression.22,23 There is no recommendation to monitor markers of immune activation and inflammation. Efforts should focus on risk factor modifications, such as smoking cessation, improved diet, treatment of alcohol abuse and dependence, regular exercise, and maintenance of appropriate weight. Emphasis should be on treating chronic comorbidities, such as hypertension, diabetes, osteoporosis, and hyperlipidemia.
HIV/HCV Co-infection
According to the WHO, 130 to 150 million people worldwide have chronic HCV infection.24 In the U.S., it is estimated that up to one-quarter of HIV-infected persons have HCV co-infection.25 With the currently available oral direct-acting agents (DAAs) for the treatment of chronic HCV infection in patients with HIV/HCV co-infection, rates of sustained virologic response to treatment are comparable in patients with HIV/HCV co-infection with those of patients with HCV monoinfection.26 Accordingly, all HIV-infected patients should be screened for HCV infection, and HIV ART should not be deferred for most patients.
For patients with a CD4+ cell count of < 200 cells/mm3, treatment of HCV should be deferred until the patients are on a stable and effective ART regimen. Whereas for those with a CD4+ cell count > 500 cells/mm3, HCV can be treated before initiating HIV ART. When initiating
HCV therapy, clinicians must pay attention to drug-drug interactions. Patients with cirrhosis are particularly at risk. The most recent guidelines for the treatment of HCV co-infection should be reviewed when selecting a DAA to treat HCV.27 Many patients are now being treated successfully for HCV co-infection. Extending such therapy to all patients with HIV/HCV co-infection for whom treatment is appropriate should be a priority for clinicians, insurance providers, and policy makers.
Drug Interactions
Given the availability of numerous once-daily ART regimens, prescribing ART has been greatly simplified. Nonetheless, there are many pharmacokinetic drug-drug interactions between antiretroviral drugs and concomitant medications. When changing either the ART or adding or changing other medications, the clinician must always pay attention to potential drug-drug interactions. Consideration must be given to the interaction with drugs that affect antiretroviral absorption—particularly, acid-reducing agents and products that contain polyvalent cations, including calcium and magnesium.
When antiretrovirals that undergo hepatic metabolism are given with other drugs that also are metabolized by the cytochrome P450 enzyme system or other hepatic enzymes, the levels of antiretrovirals or other drug may be significantly increased or decreased.1 The 2 booster—cobicistat and ritonavir—used to increase certain antiretrovirals levels also may alter the metabolism of other drugs.28,29 The new guidelines contain updated and detailed tables on drug-drug interactions. Given the comorbid conditions, particularly among those aging with HIV, polypharmacy is an increasingly common concern. It is essential for clinicians to work with knowledgeable HIV pharmacists to ensure the correct and safe prescribing of all medications.
HIV/AIDS Demographics in U.S.
Of the more than 1.2 million people aged > 13 years in the U.S. living with HIV, about 1 in 8 are unaware of their infection.30 The Centers for Disease Control and Prevention (CDC) estimates that about 50,000 people are newly infected every year.31 Men who have sex with men (MSM) are the group most impacted by HIV, and African American MSM are disproportionately represented. Although MSM were only about 4% of the U.S. male population in 2010, 78% of the newly diagnosed HIV infections among males were in MSM (63% of all new HIV infections).32,33 The groups at greatest risk of HIV infection are now young black and Latino MSM aged 13 to 24 years.33 Decreasing the rate of new HIV infections in this high-risk population remains challenging.
Across the U.S., the HIV epidemic continues to disproportionately impact southern states. An estimated 44% of all people living with HIV in the U.S. reside in the District of Columbia and in 16 southern states.34 Among the 10 states with the highest death rate for persons diagnosed with HIV, 7 are southern states–Louisiana, Alabama, Mississippi, South Carolina, Kentucky, and Maryland.35,36 The HIV epidemic in southern states is not confined to urban centers but instead extends across rural areas that have limited access to adequate health care and high rates of poverty.37
HIV Care Continuum
In July 2013, President Obama established the HIV Continuum Care Initiative directing federal departments to accelerate efforts and direct resources to increase the proportion of HIV-infected persons successfully receiving care in each stage of the continuum as part of the National HIV/AIDS Strategy.38,39 In November 2014, the CDC released a report on HIV in the U.S. that found about 14% of those with HIV infection have never been diagnosed, and only 40% are receiving HIV medical care.40 Despite the much improved and simplified ART regimens, only 30% of those living with HIV infection in the U.S. have achieved viral suppression. The CDC has outlined 4 steps for achieving viral suppression, the ultimate goal of all HIV treatment (Table 2).41
In the U.S. and Canada, a person diagnosed with HIV aged 20 years who adheres to a HIV ART regimen has a life expectancy of 71 years. The same person not taking ART has a dramatically shortened life expectancy of 32 years.42 The successful implementation of ART can help those living with HIV to enjoy an average life expectancy no different from that of persons without HIV infection.
The Future of the HIV/AIDS Epidemic
In 2014, the Joint United Nations Program on HIV/ AIDS estimated that 35 million people were living with HIV/AIDS and that 13 million were receiving ART globally. Three of 5 people with HIV infection, about 22 million, did not have access to ART. Less than one quarter of HIV-infected children are on ART.43 Changing the course of the HIV/AIDS pandemic in the U.S. and worldwide is within reach, and the new HSS and WHO guidelines provide an evidence-based framework to alter this course. Significantly expanding screening for HIV and ensuring treatment access
for all persons diagnosed with HIV as well as appropriate provision of pre-exposure prophylaxis would irrevocably alter the lives of the millions of people living with HIV/AIDS and others in their communities. It remains to be seen whether the goal to eliminate AIDS by 2020, set in both the National HIV/AIDS Strategy and the UN global commitment will be achieved.
Click here to read the digital edition.
1. DHHS Panel on Antiretroviral Guidelines for Adults and Adolescents. Guidelines for the use of antiretroviral agents in HIV-1 infected adults and adolescents. AIDSinfo Website. https://aidsinfo.nih.gov/contentfiles/lvguidelines/adultandadolescentgl.pdf. Updated January 28, 2016. Accessed March 9, 2016.
2. NIH Panel to Define Principles of Therapy of HIV Infection. Report of the NIH panel to define principles of therapy of HIV infection and Guidelines for the Use of Antiretroviral Agents in HIV-Infected Adults and Adolescents. MMWR Recomm Rep. 1988;47(RR-5):1-41.
3. Stanley SK, Kaplan JE, National Center for HIV, STD, and TB Prevention Division of HIV/AIDS Prevention Surveillance, and Epidemiology. Guidelines for the use of antiretroviral agents in HIV-infected adults and adolescents. MMWR Recomm Rep. 1988;47(RR-5):42-82.
4. Fauci AS, Marston HD. Ending the HIV-AIDS pandemic—follow the science. N Engl J Med. 2015;373(23):2197-2199.
5. El-Sadr WM, Lundgren J, Neaton JD, et al; The Strategies for Management of Antiretroviral Therapy (SMART) Study Group. CD4+ count-guided interruption of antiretroviral treatment. N Engl J Med. 2006;355(22):2283-2296.
6. Cohen MS, Chen YQ, McCauley M. et al; HPTN 052 Study Team. Prevention of HIV-1 infection with early antiretroviral therapy. N Engl J Med. 2011;365(6):493-505.
7. Lundgren JD, Babiker AG, et al; The INSIGHT START Study Group. Initiation of antiretroviral therapy in early asymptomatic HIV infection. N Engl J Med. 2015;373(9):795-807.
8. National Institutes of Health. Starting antiretroviral therapy early improves outcomes for HIV-infected individuals [news release]. U.S. Dept. of Health and Human Services Website. http://www.nih.gov/news-events/news-releases/starting-antiretroviral-treatment-early-improves-outcomes-hiv-infected-individuals, Published May 27, 2015. Accessed March 9, 2016.
9. Danel C, Moh R, et al; The TEMPRANO ANRS 12136 Study Group. A trial of early antiretrovirals and isoniazid preventive therapy in Africa. N Engl J Med. 2015;373(9):808-822.
10. World Health Organization. Guidelines on when to start antiretroviral therapy and on pre-exposure prophylaxis for HIV. World Health Organization Website. http://apps.who.int/iris/bitstream/10665/186275/1/9789241509565_eng.pdf. Published September 2015. Accessed March 9, 2016.
11. Mollan KR, Smurzynski M, Eron JJ, et al. Association between efavirenz as initial therapy for HIV-1 infection and increased risk for suicidal ideation or attempted or completed suicide: an analysis of trial data. Ann Intern Med. 2014;161(1):1-10.
12. FDA approves new treatment for HIV [news release]. U.S. Food and Drug Administration Website. http://www.fda.gov/NewsEvents/Newsroom/PressAnnouncements/ucm471300.htm. Published November 5, 2015. Accessed March 9, 2016.
13. Mills A, Aribas JR, Andrade-Villanueve J, et al. Switching from tenofovir disoproxil fumarate to tenofovir alafenamide in antiretroviral regimens for virologically suppressed adults with HIV-1 infection: a randomized, active-controlled, multicentre, open-label, phase 3, non-inferiority study. Lancet Infect Dis. 2016;16(1):43-52.
14. Sax PE, Zolopa A, Brar I, et al. Tenofovir alafenamide vs. tenofovir disoproxil fumarate in single tablet regimens for initial HIV-1 therapy: a randomized phase 2 study. J Acquir Immune Defic Syndr. 2014;67(1):52-58.
15. Sax PE, Wohl A, Yin MT, et al; GS-US-292-0104/0111 Study Team. Tenofovir alafenamide versus tenofovir disoproxil fumarate, coformulated with elvitegravir, cobicistat, and emtricitabine, for initial treatment of HIV-1 infection: two randomised, double-blind, phase 3, non-inferiority trials. Lancet. 2015;385(9987):2602-2615.
16. Fanrauzzi A, Messaroma I. Dolutegravir: clinical efficacy and role in HIV therapy. Ther Adv Chronic Dis. 2014;5(4):164-177.
17. Miller V, Sabon C, Hertogs K, et al. Virological and immunological effects of treatment interruptions in HIV-1 infected patients with treatment failure. AIDS. 2000;14(18):2857-2867.
18. Raffanti SP, Fusco JS, Sherrill BH, et al; Collaborations in HIV Outcomes Research/United States Project. Effect of persistent moderate viremia on disease progression during HIV therapy. J Acquir Immune Defic Syndr. 2004;37(1):1174-1154.
19. Canestri A, Lescure FX, Jaureguiberry S, et al. Discordance between cerebral spinal fluid and plasma HIV replication in patients with neurological symptoms who are receiving suppressive antiretroviral therapy. Clin Infect Dis. 2010;50(5):773-778.
20. Peluso MJ, Ferretti F, Peterson J, et al. Cerebrospinal fluid HIV escape associated with progressive neurologic dysfunction in patients on antiretroviral therapy with well controlled plasma viral load. AIDS. 2012;26(14):1765-1774.
21. Abrams D, Levy Y, Losso MH, et al. Interleukin-2 therapy in patients with HIV infection. N Engl J Med. 2009;361(16):1548-1559.
22. Tien PC, Choi AI, Zolopa AR, et al. Inflammation and mortality in HIV-infected adults: analysis of the FRAM study cohort. J Acquir Immune Defic Syndr. 2010;55(3):316-322.
23. Lederman MM, Funderburg NT, Sekaly RP, Klatt NR, Hunt PW. Residual immune dysregulation syndrome in treated HIV infection. Adv Immunol. 2013;119:51-83.
24. Mohd Hanafiah K, Groeger J, Flaxman AD, Wiersma ST. Global epidemiology of hepatitis C virus infection new estimates of age-specific antibody to HCV seroprevalence. Hepatology. 2013;57(4):1333-1342.
25. Sherman KE, Rouster SD, Chung RT, Rajicic N. Hepatitis C virus prevalence among patients infected with human immunodeficiency virus: a crosssectional analysis of the US adult AIDS Clinical Trials Group. Clin Infect Dis. 2002;34(6):831-837.
26. Cachay ER, Wyles D, Hill L, et al. The impact of direct-acting antivirals in the hepatitis C-sustained viral response in human immunodeficiency virus-infected patients with ongoing barriers to care. Open Forum Infect Dis. 2015;2(4):ofv168.
27. American Association for the Study of Liver Diseases, Infectious Diseases Society of American. Recommendations for testing, managing, and treating hepatitis C. American Association for the Study of Liver Diseases and the Infectious Diseases Society of America Website. http://hcvguidelines.org/sites/default/files/HCV-Guidance_February_2016_a1.pdf. Updated February 24, 2016. Accessed March 8, 2016.
28. Shah BM, Schafer JJ, Priano J, Squires KE. Cobicistat: a new booster for the treatment of human immunodeficiency virus infection. Pharmacotherapy. 2013;33(10):1107-1116.
29. Hull MW, Montaner JS. Ritonavir-boosted protease inhibitors in HIV therapy. Ann Med. 2011;43(5):375-388.
30. Centers for Disease Control and Prevention. HIV in the United States: at a glance. Centers for Disease Control and Prevention Website. http://www.cdc.gov/hiv/statistics/overview/ataglance.html. Updated September 29, 2015. Accessed March 8, 2016.
31. Prejean J, Song R, Hernandez A, et al. Estimated HIV incidence in the United States, 2006-2009. PLoS One. 2011;6(8):e17502.
32. Purcell DW, Johnson CH, Lansky A, et al. Estimating the population size of men who have sex with men in the United States to obtain HIV and syphilis rates. Open AIDS J. 2012;6:98-107.
33. Centers for Disease Control and Prevention. Estimated HIV incidence in the United States, 2007-2010. HIV Surveillance Report: Supplemental Report 2012;17(4). http://www.cdc.gov/hiv/pdf/statistics_hssr_vol_17_no_4.pdf. Published December 2012. Accessed Mar 23, 2016.
34. Centers for Disease Control and Prevention. HIV in the Southern United States. Centers for Disease Control and Prevention Website. http://www.cdc.gov/hiv/pdf /policies/cdc-hiv-in-the-south-issue-brief.pdf. Published December 2015. Accessed March 22, 2016.
35. Centers for Disease Control and Prevention. Southern states lag behind the rest of the nation in HIV treatment, testing [release]. Centers for Disease Control and Prevention Website. http://www.cdc.gov/nchhstp/newsroom/2015 /nhpc-press-release-southern-states.html. Published December 6, 2015. Accessed March 23, 2016.
36. Krawczyk CS, Funkhouser E, Kilbe JM, Vermund SH. Delayed access to HIV diagnosis and care: special concerns for the Southern United States. AIDS Care. 2006;18(suppl 1):S35-S44.
37. Reif S, Pence BW, Hall I, Hu X, Whetten K, Wilson E. HIV diagnosis, prevalence and outcomes in nine southern states. J Community Health. 2015;40(4);642-651.
38. Office of National AIDS Policy. National HIV/AIDS strategy. Improving outcomes: accelerating progress along the HIV care continuum. White House Website. https://www.whitehouse.gov/sites/default/files/onap_nhas_improving_outcomes _dec_2013.pdf. Published December 2013. Accessed March 8, 2016.
39. The White House Office of National AIDS Policy. National HIV/AIDS Strategy: Federal implementation plan. White House Website. http://www.whitehouse.gov/files/documents/nhas-implementation.pdf. Published July 2010. Accessed March 8, 2016.
40. Bradley H, Hall HI, Wolitski RJ, et al. Vital signs: HIV diagnosis, care, and treatment among persons living with HIV—United States, 2011. MMWR Morb Mortal Wkly Rep. 2014;63(47):1113-1117.
41. Centers for Disease Control and Prevention. CDC Vitalsigns. HIV care saves lives: viral suppression is key. Centers for Disease Control and Prevention Website. http://www.cdc.gov/vitalsigns/hiv-aids-medical-care. Published November 2014. Accessed March 8, 2016.
42. Samji H, Cescon A, Hogg RS, et al; North American AIDS Cohort Collaboration on Research and Design (NA-ACCORD) of IeDEA. Closing the gap: increases in life expectancy among treated HIV-positive individuals in the United States and Canada. PLoS One. 2013;8(12):e81355.
43. Joint United Nations Programme on HIV/AIDS. UNAIDS report shows that 19 million of the 35 million people living with HIV today do not know that they have the virus [press release]. UNAIDS Website. http://www.unaids.org/sites/default/files/web_story/20140716_PR_GapReport_en.pdf. Published July 16, 2014. Accessed March 8, 2016.
Hepatitis B: Screening, Awareness, and the Need to Treat
Globally, chronic hepatitis B virus (HBV) infection is the leading cause of liver-related morbidity and mortality. Worldwide, more than 2 billion people have been exposed to HBV, and about 250 million are chronically infected.1
The prevalence of hepatitis B surface antigen (HBsAg), the serologic marker of chronicity, varies significantly worldwide. The highest rates of HBsAg are reported in Asia, Sub-Saharan Africa, and the Amazon basin. The overall prevalence of chronic HBV infection in the U.S. is low, 800,000 to 1.4 million persons. The disease is predominantly seen in immigrants, with > 90% of cases in persons from countries of intermediate or high HBV prevalence, such as East Asia, Africa, Pacific Islands, parts of Africa, and Eastern Europe.2
The prevalence of chronic HBV infection in the U.S. may be underestimated and closer to 2.2 million persons, because many foreign-born persons are generally excluded from national prevalence surveys.3 More worrisome, studies suggest that a majority of individuals with chronic HBV infection are unaware of their diagnosis, and consequently, many patients who might benefit from therapy do not receive appropriate care or treatment.4 This review will discuss screening recommendations for HBV in the U.S., identify knowledge gaps regarding the disease, and present a cogent argument for why treatment-eligible patients should be entered into management programs and evaluated for therapy.
Hepatitis B Screening
Chronic hepatitis B meets the criteria established by the World Health Organization as a disease for which screening would be beneficial to public health. Chronic HBV infection is an important health problem that can result in serious sequelae, such as cirrhosis, hepatocellular carcinoma, and liver-related mortality. Moreover, persons unaware of their diagnosis may unwittingly transmit the virus to unprotected individuals.
A simple, relatively inexpensive test is widely available to identify chronic HBV infection. The test allows physicians to confirm a diagnosis before symptoms develop and offer a safe and effective therapy. Modeling studies suggest that screening populations with a prevalence of chronic HBV infection ≥ 2% also would be cost-effective in reducing the burden of HBV-associated liver cancer and chronic liver disease in high-risk populations.5,6 However, a number of barriers exist that limit screening (Table 1).
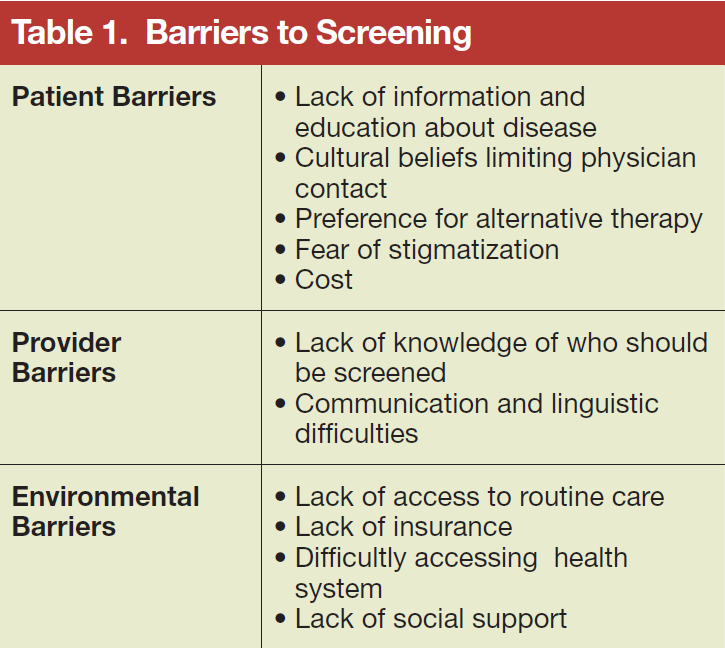
Who to Screen?
All guidelines recommend that persons at high risk for HBV infection should be screened. Broadly, these include persons from geographic areas with a high prevalence of chronic infection, persons at high risk for acquiring HBV infection, persons with increased risk of transmitting HBV, and persons at risk for reactivation of HBV. In addition to previous recommendations, the Centers for Disease Control and Prevention (CDC) updated 2008 guidelines now recommend testing all persons born in geographic areas with a HBsAg prevalence of ≥ 2%, U.S.-born persons not vaccinated as infants whose parents were born in regions with HBsAg prevalence ≥ 8%, persons who inject drugs, men who have sex with men, persons with elevated alanine transaminase and aspartate transaminase of unknown etiology, and persons with selected medical conditions that require immunosuppressive therapy (Table 2).7 In 2014, the U.S. Preventive Services Task Force provided updated guidance on screening of nonpregnant adolescents and adults that aligned with the CDC guidelines and also recommended screening individuals at high risk for HBV infection.8 The American Association for the Study of Liver Diseases and other professional liver organizations support these recommendations.9
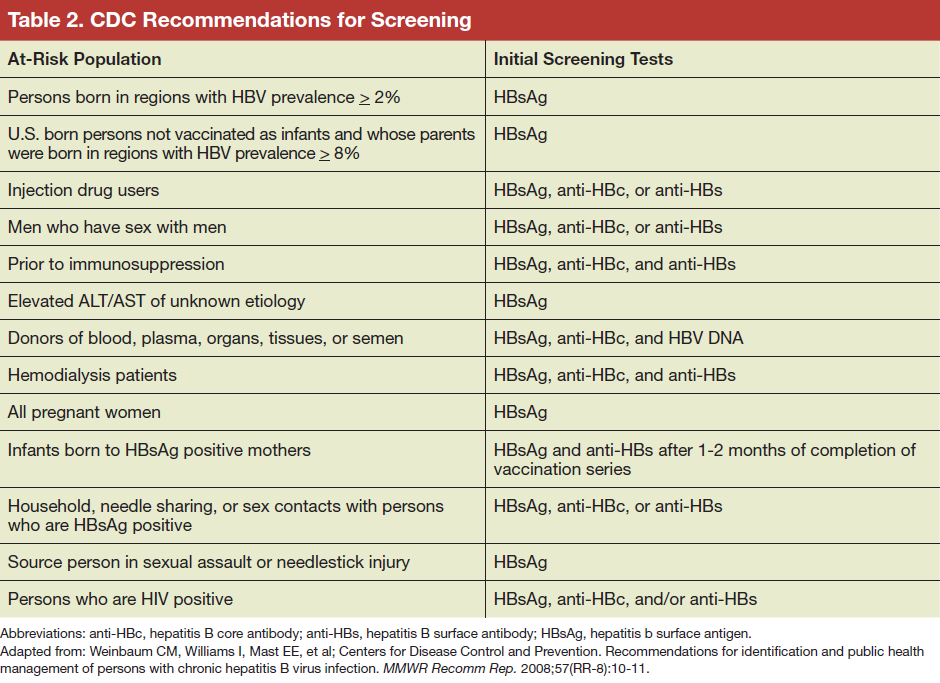
Which Test to Use
Serologic testing for HBsAg is the recommended method to identify persons with chronic HBV infection. Testing for HBV infection in high-risk groups should be performed with a FDA-licensed or FDA-approved serologic assay for HBsAg (sensitivity and specificity of > 98%) according to the manufacturer’s recommendations. Initially, reactive specimens should be confirmed with a licensed confirmatory test.
A positive HBsAg result indicates active infection, either acute or chronic. Other serological markers of HBV infection, such as presence of hepatitis B core IgM antibody, and the clinical context are used to differentiate between acute, chronic, or resolving infection. For identification of individuals who are at risk for chronic infection, the screening strategy should be with HBsAg only. For identifying susceptible persons who should be offered HBV vaccination, or patients that are at risk of reactivation or transmission of HBV, screening should include
testing for HBsAg, hepatitis B core antibody (anti-HBc) and hepatitis B surface antibody (anti-HBs).
The interpretation of HBV screening serology is shown in Table 3. Persons with chronic HBV infection are treated, if needed, per practice guidelines based on the initial test results and interpretation of the stage of the disease and counseled regarding transmission of infection. 9,10 Vaccination is recommended for uninfected persons.
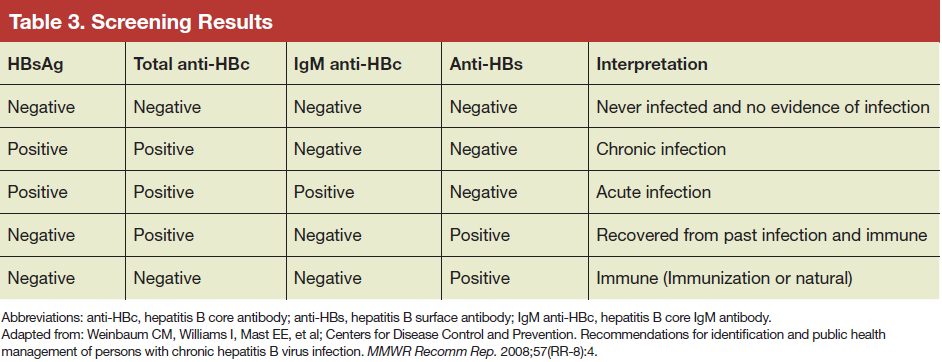
Hepatitis B Education
There is relatively poor awareness of HBV among highrisk individuals and health care professionals (HCPs). A study examining the prevalence of chronic hepatitis B in an Asian and Pacific Islander population reported that about 15% of participants had not been previously tested for hepatitis B.11 Another study that surveyed 3,163 Asian American adults in the San Francisco Bay Area found that of those screened and identified with chronic HBV infection (8.9%), two-thirds were unaware that they were infected.12
Primary care providers in San Francisco correctly identified that Chinese immigrants have a higher prevalence of chronic hepatitis B than that of non-Hispanic white or U.S.-born Chinese people, but the providers incorrectly identified persons with HIV infection, men who have sex with men, and persons who inject drugs as having higher prevalence than that of Chinese immigrants in a survey.13 Lack of awareness probably contributes to poor outcomes from the infection among at-risk persons as well as continued transmission to susceptible individuals. Furthermore, lack of knowledge is a barrier to testing, prevention, and care. Increased awareness to identify the at-risk population and early treatment is an important step to prevent morbidity and mortality from chronic hepatitis B.
Public Awareness
Many at-risk populations are unaware of HBV, its possible routes of transmission, or that a safe and effective vaccine exists for HBV prevention. Moreover, many foreign-born persons with chronic HBV infection feel stigmatized by others or have cultural barriers against Western medicine and prefer alternative therapies. As a result, the Institute of Medicine (IOM) has suggested that innovative approaches need to be developed to promote a better understanding of transmission, prevent and treat HBV, increase HBV vaccination rates among children and at-risk adults, educate women about vertical transmission risk, reduce stigmatization, and provide culturally sensitive and understandable educational material.14
Awareness Among Health Care Professionals
Studies have identified knowledge gaps among HCPs regarding the prevalence of HBV in the general U.S. population, outcome of infection, who should be screened and vaccinated against HBV, appropriate methods for screening and interpretation of serologic tests for HBV, and proper treatment of persons with chronic infection. As a consequence, the IOM recommended educational programs for HCPs on the prevalence of HBV infection in the general U.S. population and at-risk populations, particularly foreign-born persons. In addition, these educational programs should target all levels of HCPs, including undergraduates and postgraduates, and include information on screening and prevention, testing, and interpretation of tests.14
Need to Treat
The global HBV disease burden remains high despite the existence of an effective vaccine. Worldwide, there are an estimated 4.5 million new infections and 780,000 HBVrelated deaths each year.15 In the U.S., the highest rates of mortality are seen in Asians and Pacific Islanders and among persons aged 55 to 64 years. Asians and Pacific Islanders also have the highest rate of liver cancer deaths.16,17
The natural history of chronic hepatitis B is highly variable and dependent on a complex interplay between the virus and the host immune response. It is estimated that between 25% and 40% of persons with chronic hepatitis B will be at risk for progression to cirrhosis.7,18,19 In a study among persons with cirrhosis, the 5-year cumulative risk of developing hepatocellular carcinoma was 17% in Asian patients and 10% in white Americans and Europeans. The 5-year liver-related death rate was 14% among East Asians and 15% among white Europeans.18
A significant proportion of individuals infected with HBV are unaware of their diagnosis, not enrolled in care, or not receiving therapy.7,12,20-24 Data from several prospective and retrospective cohort studies have demonstrated that prolonged viral suppression achieved with therapy is associated with regression of fibrosis and reversal of cirrhosis in a substantial proportion of individuals.25,26 Treatment has also been associated with a reduction in rates of liver decompensation, HCC, liverrelated, and all-cause mortality among patients with liver cirrhosis.27
Given the risk of serious complications and the availability of safe and effective therapy, it is imperative that persons identified as having chronic hepatitis B be referred for evaluation to determine whether therapy is warranted. However, it is also important to recognize that a cure for HBV infection is currently not available, and most patients who initiate therapy will require longterm treatment. In addition, persons who are not currently treatment candidates may become candidates due to changes in disease activity. This underscores the point that patients with chronic hepatitis B require lifelong monitoring regardless of whether they are receiving treatment.
Conclusions
The primary reasons to screen for HBV are to reduce morbidity and mortality related to liver disease and to prevent transmission. Significant barriers remain to screening and referral for care for HBV in the U.S. Educational programs to increase knowledge and awareness among HCPs and the public together with improved access to care are critical to improve disease outcomes and prevent transmission. Despite the availability of an effective vaccine for 3 decades, the global prevalence of HBV has not substantially declined. Further research is needed to explore strategies to overcome screening barriers, improve vaccination rates, and to develop new models of health care delivery to reduce the burden of disease-related to HBV.
Click here to read the digital edition.
1. Schweitzer A, Horn J, Mikolajczyk RT, Krause G, Ott JJ. Estimations of worldwide prevalence of chronic hepatitis B virus infection: a systematic review of data published between 1965 and 2013. Lancet. 2015;386(10003):1546-1555.
2. Mitchell T, Armstrong GL, Hu DJ, Wasley A, Painter JA. The increasing burden of imported chronic hepatitis B--United States, 1974-2008. PLoS One. 2011;6(12):e27717.
3. Kowdley KV, Wang CC, Welch S, Roberts H, Brosgart CL. Prevalence of chronic hepatitis B among foreign-born persons living in the United States by country of origin. Hepatology. 2012;56(2):422-433.
4. Cohen C, Holmberg SD, McMahon BJ, et al. Is chronic hepatitis B being undertreated in the United States? J Viral Hepat. 2011;18(6):377-383.
5. Hutton DW, Tan D, So SK, Brandeau ML. Cost-effectiveness of screening and vaccinating Asian and Pacific Islander adults for hepatitis B. Ann Intern Med. 2007;147(7):460-469.
6. Eckman MH, Kaiser TE, Sherman KE. The cost-effectiveness of screening for chronic hepatitis B infection in the United States. Clin Infect Dis. 2011;52(11):1294-1306.
7. Weinbaum CM, Williams I, Mast EE, et al; Centers for Disease Control and Prevention (CDC). Recommendations for identification and public health management of persons with chronic hepatitis B virus infection. MMWR Recomm Rep. 2008;57(RR-8):1-20.
8. LeFevre ML; U.S. Preventive Services Task Force. Screening for hepatitis B virus infection in nonpregnant adolescents and adults: U.S. Preventive Services Task Force recommendation statement. Ann Intern Med. 2014;161(1):58-66.
9. Lok AS, McMahon BJ. Chronic hepatitis B: update 2009. Hepatology. 2009;50(3):661-662.
10. Terrault NA, Bzowej NH, Chang KM, Hwang JP, Jonas MM, Murad MH. AASLD guidelines for treatment of chronic hepatitis B. Hepatology. 2016;63(1):261-283.
11. Centers for Disease Control and Prevention (CDC). Screening for chronic hepatitis B among Asian/Pacific Islander populations--New York City, 2005. MMWR Morb Mortal Wkly Rep. 2006;55(18):505-509.
12. Lin SY, Chang ET, So SK. Why we should routinely screen Asian American adults for hepatitis B: a cross-sectional study of Asians in California. Hepatology. 2007;46(4):1034-1040.
13. Lai CJ, Nguyen TT, Hwang J, Stewart SL, Kwan A, McPhee SJ. Provider knowledge and practice regarding hepatitis B screening in Chinese-speaking patients. J Cancer Educ. 2007;22(1):37-41.
14. Colvin HM, Mitchell AE, eds; Committee on the Prevention and Control of Viral Hepatitis Infections Board on Population Health and Public Health Practice. Hepatitis and liver cancer: a national strategy for prevention and control of hepatitis B and C. Washington, DC: National Academies Press; 2010:xix, 232.
15. Hepatitis B Fact Sheet No. 204. World Health Organization Website. http://www.who.int/entity/mediacentre/factsheets/fs204/en/. Updated July 2015. Accessed March 17, 2016.
16. Perz JF, Openo K, Ahmed F, Bell BP. P.382 Trends in mortality from liver cancer in the USA, 1993-2002. J Clin Virol. 2006;36(suppl 2):S178.
17. Chang ET, Keegan TH, Gomez SL, et al. The burden of liver cancer in Asians and Pacific Islanders in the Greater San Francisco Bay Area, 1990 through 2004. Cancer. 2007;109(10):2100-2108.
18. Fattovich G1, Bortolotti F, Donato F. Natural history of chronic hepatitis B: special emphasis on disease progression and prognostic factors. J Hepatol. 2008;48(2):335-352.
19. Chou R, Dana T, Bougatsos C, Blazina I, Khangura J, Zakher B. Screening for hepatitis B virus infection in adolescents and adults: a systematic review to update the U.S. Preventive Services Task Force recommendation. Ann Intern Med. 2014;161(1):31-45.
20. Wan KJ, Miyoshi T, Fryer G, et al. Screening for hepatitis B virus infection by primary care physicians in New York City: are screening recommendations for persons born inendemic countries being followed?[abstract 1454]. Hepatology. 2007;46(suppl):889A-890A.
21. Thompson MJ, Taylor VM, Jackson JC, et al. Hepatitis B knowledge and practices among Chinese American women in Seattle, Washington. J Cancer Educ. 2002;17(4):222-226.
22. Ma GX, Fang CY, Shive SE, Toubbeh J, Tan Y, Siu P. Risk perceptions and barriers to hepatitis B screening and vaccination among Vietnamese immigrants. J Immigr Minor Health. 2007;9(3):213-220.
23. Taylor VM, Choe JH, Yasui Y, Li Lin, Burke N, Jackson JC. Hepatitis B awareness, testing, and knowledge among Vietnamese American men and women. J Community Health. 2005;30(6):477-490.
24. Weinbaum CM, Lyerla R, Mackellar DA, et al; Young Men’s Survey Study Group. The young men’s survey phase II: hepatitis B immunization and infection among young men who have sex with men. Am J Public Health. 2008;98(5):839-845.
25. Marcellin P, Gane E, Buti M. Regression of cirrhosis during treatment with tenofovir disoproxil fumarate for chronic hepatitis B: a 5-year open-label follow-up study. Lancet. 2013;381(9865):468-475.
26. Chang TT, Liaw YF, Wu SS. Long-term entecavir therapy results in the reversal of fibrosis/cirrhosis and continued histological improvement in patients with chronic hepatitis B. Hepatology. 2010;52(3):886-893.
27. Wong GL, Chan HL, Mak CW. Entecavir treatment reduces hepatic events and deaths in chronic hepatitis B patients with liver cirrhosis. Hepatology.2013;58(5):1537-1547.
Globally, chronic hepatitis B virus (HBV) infection is the leading cause of liver-related morbidity and mortality. Worldwide, more than 2 billion people have been exposed to HBV, and about 250 million are chronically infected.1
The prevalence of hepatitis B surface antigen (HBsAg), the serologic marker of chronicity, varies significantly worldwide. The highest rates of HBsAg are reported in Asia, Sub-Saharan Africa, and the Amazon basin. The overall prevalence of chronic HBV infection in the U.S. is low, 800,000 to 1.4 million persons. The disease is predominantly seen in immigrants, with > 90% of cases in persons from countries of intermediate or high HBV prevalence, such as East Asia, Africa, Pacific Islands, parts of Africa, and Eastern Europe.2
The prevalence of chronic HBV infection in the U.S. may be underestimated and closer to 2.2 million persons, because many foreign-born persons are generally excluded from national prevalence surveys.3 More worrisome, studies suggest that a majority of individuals with chronic HBV infection are unaware of their diagnosis, and consequently, many patients who might benefit from therapy do not receive appropriate care or treatment.4 This review will discuss screening recommendations for HBV in the U.S., identify knowledge gaps regarding the disease, and present a cogent argument for why treatment-eligible patients should be entered into management programs and evaluated for therapy.
Hepatitis B Screening
Chronic hepatitis B meets the criteria established by the World Health Organization as a disease for which screening would be beneficial to public health. Chronic HBV infection is an important health problem that can result in serious sequelae, such as cirrhosis, hepatocellular carcinoma, and liver-related mortality. Moreover, persons unaware of their diagnosis may unwittingly transmit the virus to unprotected individuals.
A simple, relatively inexpensive test is widely available to identify chronic HBV infection. The test allows physicians to confirm a diagnosis before symptoms develop and offer a safe and effective therapy. Modeling studies suggest that screening populations with a prevalence of chronic HBV infection ≥ 2% also would be cost-effective in reducing the burden of HBV-associated liver cancer and chronic liver disease in high-risk populations.5,6 However, a number of barriers exist that limit screening (Table 1).
Who to Screen?
All guidelines recommend that persons at high risk for HBV infection should be screened. Broadly, these include persons from geographic areas with a high prevalence of chronic infection, persons at high risk for acquiring HBV infection, persons with increased risk of transmitting HBV, and persons at risk for reactivation of HBV. In addition to previous recommendations, the Centers for Disease Control and Prevention (CDC) updated 2008 guidelines now recommend testing all persons born in geographic areas with a HBsAg prevalence of ≥ 2%, U.S.-born persons not vaccinated as infants whose parents were born in regions with HBsAg prevalence ≥ 8%, persons who inject drugs, men who have sex with men, persons with elevated alanine transaminase and aspartate transaminase of unknown etiology, and persons with selected medical conditions that require immunosuppressive therapy (Table 2).7 In 2014, the U.S. Preventive Services Task Force provided updated guidance on screening of nonpregnant adolescents and adults that aligned with the CDC guidelines and also recommended screening individuals at high risk for HBV infection.8 The American Association for the Study of Liver Diseases and other professional liver organizations support these recommendations.9
Which Test to Use
Serologic testing for HBsAg is the recommended method to identify persons with chronic HBV infection. Testing for HBV infection in high-risk groups should be performed with a FDA-licensed or FDA-approved serologic assay for HBsAg (sensitivity and specificity of > 98%) according to the manufacturer’s recommendations. Initially, reactive specimens should be confirmed with a licensed confirmatory test.
A positive HBsAg result indicates active infection, either acute or chronic. Other serological markers of HBV infection, such as presence of hepatitis B core IgM antibody, and the clinical context are used to differentiate between acute, chronic, or resolving infection. For identification of individuals who are at risk for chronic infection, the screening strategy should be with HBsAg only. For identifying susceptible persons who should be offered HBV vaccination, or patients that are at risk of reactivation or transmission of HBV, screening should include
testing for HBsAg, hepatitis B core antibody (anti-HBc) and hepatitis B surface antibody (anti-HBs).
The interpretation of HBV screening serology is shown in Table 3. Persons with chronic HBV infection are treated, if needed, per practice guidelines based on the initial test results and interpretation of the stage of the disease and counseled regarding transmission of infection. 9,10 Vaccination is recommended for uninfected persons.
Hepatitis B Education
There is relatively poor awareness of HBV among highrisk individuals and health care professionals (HCPs). A study examining the prevalence of chronic hepatitis B in an Asian and Pacific Islander population reported that about 15% of participants had not been previously tested for hepatitis B.11 Another study that surveyed 3,163 Asian American adults in the San Francisco Bay Area found that of those screened and identified with chronic HBV infection (8.9%), two-thirds were unaware that they were infected.12
Primary care providers in San Francisco correctly identified that Chinese immigrants have a higher prevalence of chronic hepatitis B than that of non-Hispanic white or U.S.-born Chinese people, but the providers incorrectly identified persons with HIV infection, men who have sex with men, and persons who inject drugs as having higher prevalence than that of Chinese immigrants in a survey.13 Lack of awareness probably contributes to poor outcomes from the infection among at-risk persons as well as continued transmission to susceptible individuals. Furthermore, lack of knowledge is a barrier to testing, prevention, and care. Increased awareness to identify the at-risk population and early treatment is an important step to prevent morbidity and mortality from chronic hepatitis B.
Public Awareness
Many at-risk populations are unaware of HBV, its possible routes of transmission, or that a safe and effective vaccine exists for HBV prevention. Moreover, many foreign-born persons with chronic HBV infection feel stigmatized by others or have cultural barriers against Western medicine and prefer alternative therapies. As a result, the Institute of Medicine (IOM) has suggested that innovative approaches need to be developed to promote a better understanding of transmission, prevent and treat HBV, increase HBV vaccination rates among children and at-risk adults, educate women about vertical transmission risk, reduce stigmatization, and provide culturally sensitive and understandable educational material.14
Awareness Among Health Care Professionals
Studies have identified knowledge gaps among HCPs regarding the prevalence of HBV in the general U.S. population, outcome of infection, who should be screened and vaccinated against HBV, appropriate methods for screening and interpretation of serologic tests for HBV, and proper treatment of persons with chronic infection. As a consequence, the IOM recommended educational programs for HCPs on the prevalence of HBV infection in the general U.S. population and at-risk populations, particularly foreign-born persons. In addition, these educational programs should target all levels of HCPs, including undergraduates and postgraduates, and include information on screening and prevention, testing, and interpretation of tests.14
Need to Treat
The global HBV disease burden remains high despite the existence of an effective vaccine. Worldwide, there are an estimated 4.5 million new infections and 780,000 HBVrelated deaths each year.15 In the U.S., the highest rates of mortality are seen in Asians and Pacific Islanders and among persons aged 55 to 64 years. Asians and Pacific Islanders also have the highest rate of liver cancer deaths.16,17
The natural history of chronic hepatitis B is highly variable and dependent on a complex interplay between the virus and the host immune response. It is estimated that between 25% and 40% of persons with chronic hepatitis B will be at risk for progression to cirrhosis.7,18,19 In a study among persons with cirrhosis, the 5-year cumulative risk of developing hepatocellular carcinoma was 17% in Asian patients and 10% in white Americans and Europeans. The 5-year liver-related death rate was 14% among East Asians and 15% among white Europeans.18
A significant proportion of individuals infected with HBV are unaware of their diagnosis, not enrolled in care, or not receiving therapy.7,12,20-24 Data from several prospective and retrospective cohort studies have demonstrated that prolonged viral suppression achieved with therapy is associated with regression of fibrosis and reversal of cirrhosis in a substantial proportion of individuals.25,26 Treatment has also been associated with a reduction in rates of liver decompensation, HCC, liverrelated, and all-cause mortality among patients with liver cirrhosis.27
Given the risk of serious complications and the availability of safe and effective therapy, it is imperative that persons identified as having chronic hepatitis B be referred for evaluation to determine whether therapy is warranted. However, it is also important to recognize that a cure for HBV infection is currently not available, and most patients who initiate therapy will require longterm treatment. In addition, persons who are not currently treatment candidates may become candidates due to changes in disease activity. This underscores the point that patients with chronic hepatitis B require lifelong monitoring regardless of whether they are receiving treatment.
Conclusions
The primary reasons to screen for HBV are to reduce morbidity and mortality related to liver disease and to prevent transmission. Significant barriers remain to screening and referral for care for HBV in the U.S. Educational programs to increase knowledge and awareness among HCPs and the public together with improved access to care are critical to improve disease outcomes and prevent transmission. Despite the availability of an effective vaccine for 3 decades, the global prevalence of HBV has not substantially declined. Further research is needed to explore strategies to overcome screening barriers, improve vaccination rates, and to develop new models of health care delivery to reduce the burden of disease-related to HBV.
Click here to read the digital edition.
1. Schweitzer A, Horn J, Mikolajczyk RT, Krause G, Ott JJ. Estimations of worldwide prevalence of chronic hepatitis B virus infection: a systematic review of data published between 1965 and 2013. Lancet. 2015;386(10003):1546-1555.
2. Mitchell T, Armstrong GL, Hu DJ, Wasley A, Painter JA. The increasing burden of imported chronic hepatitis B--United States, 1974-2008. PLoS One. 2011;6(12):e27717.
3. Kowdley KV, Wang CC, Welch S, Roberts H, Brosgart CL. Prevalence of chronic hepatitis B among foreign-born persons living in the United States by country of origin. Hepatology. 2012;56(2):422-433.
4. Cohen C, Holmberg SD, McMahon BJ, et al. Is chronic hepatitis B being undertreated in the United States? J Viral Hepat. 2011;18(6):377-383.
5. Hutton DW, Tan D, So SK, Brandeau ML. Cost-effectiveness of screening and vaccinating Asian and Pacific Islander adults for hepatitis B. Ann Intern Med. 2007;147(7):460-469.
6. Eckman MH, Kaiser TE, Sherman KE. The cost-effectiveness of screening for chronic hepatitis B infection in the United States. Clin Infect Dis. 2011;52(11):1294-1306.
7. Weinbaum CM, Williams I, Mast EE, et al; Centers for Disease Control and Prevention (CDC). Recommendations for identification and public health management of persons with chronic hepatitis B virus infection. MMWR Recomm Rep. 2008;57(RR-8):1-20.
8. LeFevre ML; U.S. Preventive Services Task Force. Screening for hepatitis B virus infection in nonpregnant adolescents and adults: U.S. Preventive Services Task Force recommendation statement. Ann Intern Med. 2014;161(1):58-66.
9. Lok AS, McMahon BJ. Chronic hepatitis B: update 2009. Hepatology. 2009;50(3):661-662.
10. Terrault NA, Bzowej NH, Chang KM, Hwang JP, Jonas MM, Murad MH. AASLD guidelines for treatment of chronic hepatitis B. Hepatology. 2016;63(1):261-283.
11. Centers for Disease Control and Prevention (CDC). Screening for chronic hepatitis B among Asian/Pacific Islander populations--New York City, 2005. MMWR Morb Mortal Wkly Rep. 2006;55(18):505-509.
12. Lin SY, Chang ET, So SK. Why we should routinely screen Asian American adults for hepatitis B: a cross-sectional study of Asians in California. Hepatology. 2007;46(4):1034-1040.
13. Lai CJ, Nguyen TT, Hwang J, Stewart SL, Kwan A, McPhee SJ. Provider knowledge and practice regarding hepatitis B screening in Chinese-speaking patients. J Cancer Educ. 2007;22(1):37-41.
14. Colvin HM, Mitchell AE, eds; Committee on the Prevention and Control of Viral Hepatitis Infections Board on Population Health and Public Health Practice. Hepatitis and liver cancer: a national strategy for prevention and control of hepatitis B and C. Washington, DC: National Academies Press; 2010:xix, 232.
15. Hepatitis B Fact Sheet No. 204. World Health Organization Website. http://www.who.int/entity/mediacentre/factsheets/fs204/en/. Updated July 2015. Accessed March 17, 2016.
16. Perz JF, Openo K, Ahmed F, Bell BP. P.382 Trends in mortality from liver cancer in the USA, 1993-2002. J Clin Virol. 2006;36(suppl 2):S178.
17. Chang ET, Keegan TH, Gomez SL, et al. The burden of liver cancer in Asians and Pacific Islanders in the Greater San Francisco Bay Area, 1990 through 2004. Cancer. 2007;109(10):2100-2108.
18. Fattovich G1, Bortolotti F, Donato F. Natural history of chronic hepatitis B: special emphasis on disease progression and prognostic factors. J Hepatol. 2008;48(2):335-352.
19. Chou R, Dana T, Bougatsos C, Blazina I, Khangura J, Zakher B. Screening for hepatitis B virus infection in adolescents and adults: a systematic review to update the U.S. Preventive Services Task Force recommendation. Ann Intern Med. 2014;161(1):31-45.
20. Wan KJ, Miyoshi T, Fryer G, et al. Screening for hepatitis B virus infection by primary care physicians in New York City: are screening recommendations for persons born inendemic countries being followed?[abstract 1454]. Hepatology. 2007;46(suppl):889A-890A.
21. Thompson MJ, Taylor VM, Jackson JC, et al. Hepatitis B knowledge and practices among Chinese American women in Seattle, Washington. J Cancer Educ. 2002;17(4):222-226.
22. Ma GX, Fang CY, Shive SE, Toubbeh J, Tan Y, Siu P. Risk perceptions and barriers to hepatitis B screening and vaccination among Vietnamese immigrants. J Immigr Minor Health. 2007;9(3):213-220.
23. Taylor VM, Choe JH, Yasui Y, Li Lin, Burke N, Jackson JC. Hepatitis B awareness, testing, and knowledge among Vietnamese American men and women. J Community Health. 2005;30(6):477-490.
24. Weinbaum CM, Lyerla R, Mackellar DA, et al; Young Men’s Survey Study Group. The young men’s survey phase II: hepatitis B immunization and infection among young men who have sex with men. Am J Public Health. 2008;98(5):839-845.
25. Marcellin P, Gane E, Buti M. Regression of cirrhosis during treatment with tenofovir disoproxil fumarate for chronic hepatitis B: a 5-year open-label follow-up study. Lancet. 2013;381(9865):468-475.
26. Chang TT, Liaw YF, Wu SS. Long-term entecavir therapy results in the reversal of fibrosis/cirrhosis and continued histological improvement in patients with chronic hepatitis B. Hepatology. 2010;52(3):886-893.
27. Wong GL, Chan HL, Mak CW. Entecavir treatment reduces hepatic events and deaths in chronic hepatitis B patients with liver cirrhosis. Hepatology.2013;58(5):1537-1547.
Assessment and Treatment of Late-Life Depression
From the Department of Neuropsychiatry and Behavioral Sceince, University of South Carolina School of Medicine, Columbia, SC.
Abstract
- Objective: To review the identification, clinical assessment and treatment of patients with late-life depression.
- Methods: Review of the literature.
- Results: Depressive symptoms are present in up to 1 in 4 older adults. Comprehensive evaluation of depressive symptoms in this population often requires a multidisciplinary and collaborative approach between primary care, mental health, and other ancillary providers. Key aspects include a detailed history, physical and mental status examinations, cognitive and functional status assessment, and suicide risk assessment. Treatment options include anti-depressants, psychotherapy, and electroconvulsive therapy.
- Conclusion: A systematic approach to evaluating depressive symptoms in the elderly can enhance timely recognition and treatment.
Key words: Late-life depression; clinical assessment; antidepressants; psychotherapy; electroconvulsive therapy.
The U.S. population is aging, and with this comes the potential for increased health care needs. In 2014, there were over 46 million Americans age 65 and over (14.5% of the U.S. population). This number is projected to increase to 88 million by the year 2050 [1]. One in 4 older adults suffers with depressive symptoms that cause distress and functional impairment [2]. The World Health Organization Global Burden of Disease Study found depressive disorders to be the leading cause of disability-adjusted life years (DALYs) and the second leading cause of years lived with disability (YLDs). The burden of disease due to depressive disorders increased by 37.5% between 1990 and 2010, and 10.4% was attributable to aging [3]. These figures underscore the importance of accurate assessment and treatment of depression in the elderly. In this article, we review the identification, clinical assessment, and treatment of patients with late-life depression.
Diagnostic Criteria
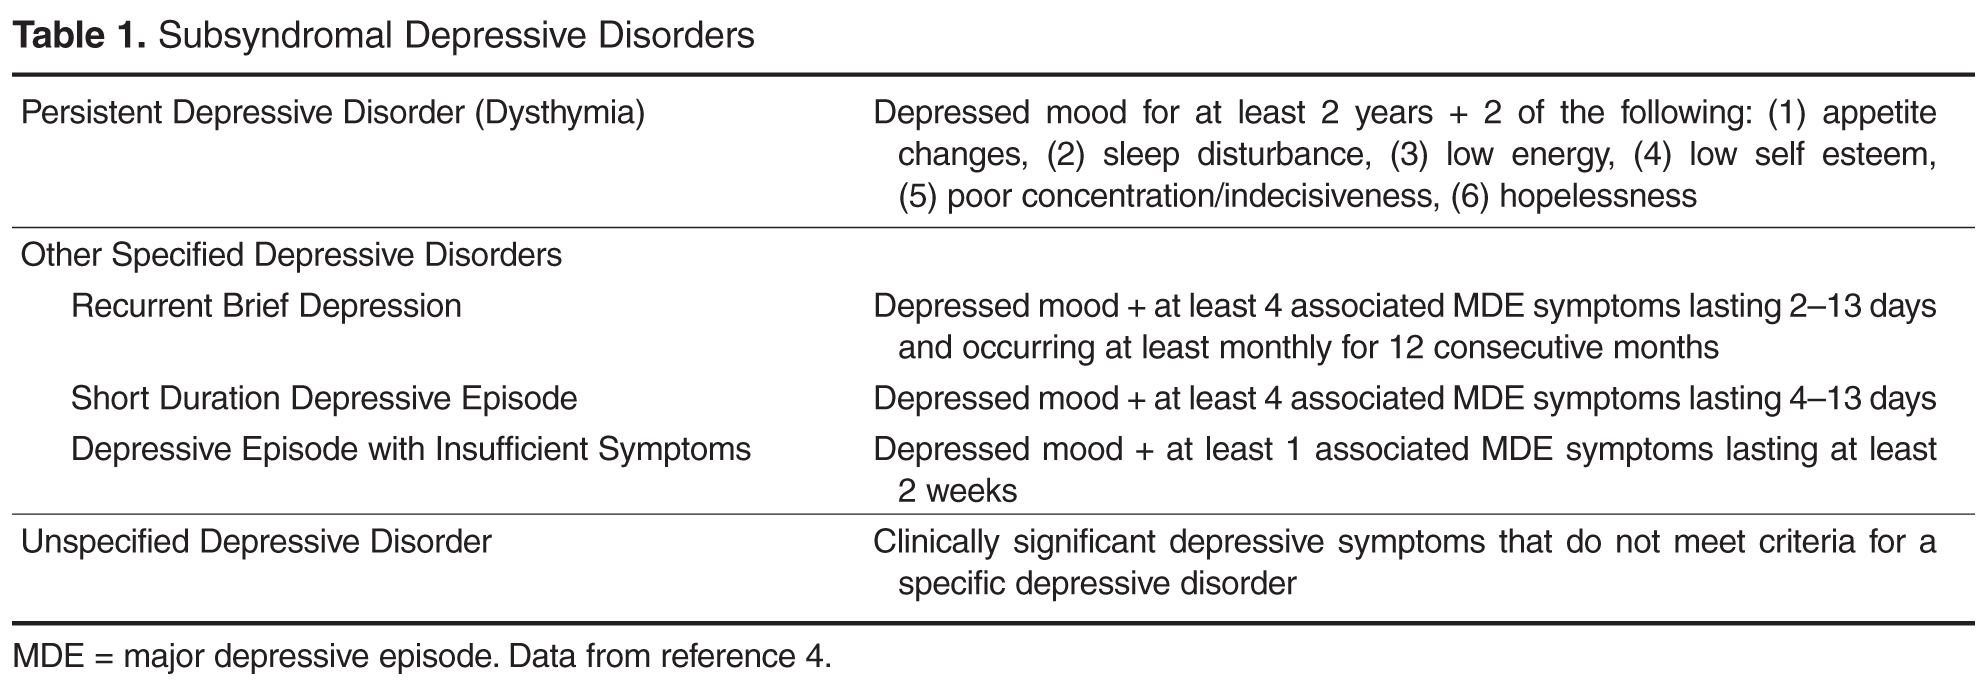
Prevalence
It is estimated that 1% to 4% of community-dwelling adults age 65 and older suffer from MDD, with women more likely to be affected than men (prevalence of 4.4% vs. 2.7) [2,5–7]. This estimate is low compared with lifetime prevalence of almost 20% in the general adult population [8]. However, when depressive symptoms that do not meet criteria for MDD are considered, prevalence rates increase up to 25% [2,9]. These estimates also vary by clinical setting, with the highest rates (up to 40%) among elderly patients in long-term care facilities [10,11]. While individuals with subsyndromal depression may experience fewer symptoms than those with MDD, clinically significant distress persists, impacting health and functional status. Depression is associated with overall poor social or occupational functioning, cognitive decline, increased health care utilization and cost, increased morbidity and mortality from medical illness, and increased suicide mortality [5,9,10,12].
Identifying LLD
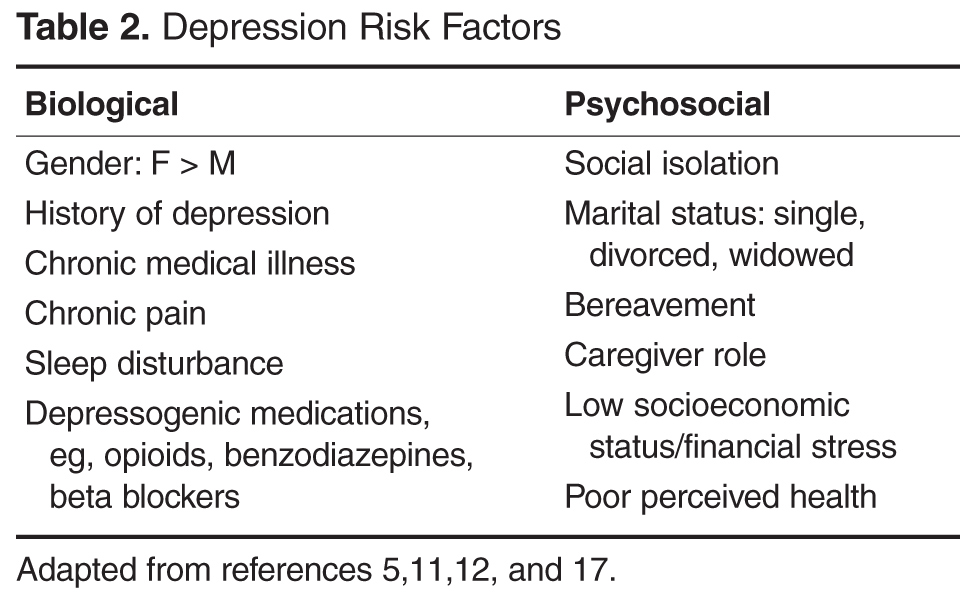
Accurate identification of LLD also requires recognition of the differences in the presentation of LLD compared with onset in earlier life. Depression in younger adults is often marked by depressed mood and loss of interest [18]. In contrast, older adults may present with increased anger or irritability [5]. Younger adults are more likely to report suicidal thoughts while older patients report feelings of hopelessness and thoughts of death [18]. LLD is often characterized by increased somatic complaints, hypochondriasis, or pain [5,18,19]. Another major difference lies in the presentation of cognitive difficulties. Younger patients typically complain of poor concentration or indecisiveness. Geriatric patients may present with cognitive changes including objective findings of slower processing speed and executive dysfunction on neuropsychological testing [17].
Depression rating scales may aid in identification of LLD. They are not a substitute for clinical diagnosis but can be useful as screening tools. Two commonly utilized depression rating scales are the Geriatric Depression Scale (GDS) and the Patient Health Questionnaire-9 (PHQ-9). GDS is a 30-item instrument developed specifically for older adults. Shorter 15-item, 5-item, and 4-item versions exist. The scale utilizes a Yes/No format and can be self- or clinician-administered [20]. One advantage of the GDS lies in its focus on psychological and cognitive aspects of depression rather than neurovegetative symptoms that may overlap with medical illnesses common in older adults [21]. The PHQ-9 is a 9-item self- or clinician-administered screening tool designed for use in primary care settings and has also been validated in geriatric populations [22,23]. The 9 items on this scale correspond to the DSM-5 criteria for major depression. A shorter 2-item version (PHQ-2) has also been validated, and a positive screen on this test should prompt administration of the full-length version. Both versions have approximately 80% sensitivity and specificity in detecting depression. An added advantage of PHQ-9 over GDS is that it can be useful in monitoring treatment response over time [22,23]
Comprehensive Assessment of LLD
The comprehensive assessment of patients with LLD can be carried out by health professionals in both mental health or primary care settings. In a multidisciplinary approach, psychiatrists and mental health professionals have collaborated with primary care providers using depression care managers with successful outcomes in managing depression in older adults [24,25]. Complete evaluation of a patient with suspected LLD begins with a history and physical and mental status examination. Other essential components of the evaluation include assessment of cognition, functional status, and suicide risk. Laboratory and neuroimaging studies may be necessary as well. Due to the comprehensive nature of this assessment, a multidisciplinary approach with collaboration between primary care, psychiatry, psychology, and ancillary services such as social work may be necessary. Multiple patient interactions may be required to complete a thorough evaluation.
History and Mental Status Examination
As with many other psychiatric illnesses, LLD is a clinical diagnosis. A careful history should be obtained initially utilizing open-ended questions. This should be followed by more directed questions as indicated to elicit the presence of depressive symptoms. The history should be obtained from the patient. A relevant collateral informant can be invaluable in the assessment, especially in cases where there is a comorbid neurocognitive disorder. However, the patient’s informed consent must be obtained prior to obtaining collateral information whenever possible. Psychosocial stressors that may have precipitated or may be perpetuating symptoms should be explored. Such stressors may include recent changes in living situation, loss of social support, recent deaths, or financial difficulties. Biological precipitants also need to be explored including presence of physical illness, depressogenic medications, and comorbid alcohol or other substance use. The patient’s past psychiatric history, psychiatric hospitalizations, and past medication trials should be ascertained. Any family history of depression, other psychiatric disorders, substance use disorders, and suicide attempts should be documented. A full mental status exam including cognitive assessment should be completed [21,26].
Cognitive Assessment
Cognitive impairment can be associated with LLD and may be due to the underlying depression or represent a comorbid neurocognitive disorder. Furthermore, the burden of medical illness as well as cerebrovascular and cardiovascular risk factors have been linked to executive dysfunction and reduced processing speed in individuals with LDD [27,28]. Distinguishing between these can be challenging; however, chronology of symptom onset is often helpful. Depression is more likely the etiology of cognitive impairment when depressive symptoms precede onset of cognitive deficits. This type of cognitive impairment is termed dementia syndrome of depression and may improve with treatment of depression [5]. Some patients may progress to develop major cognitive decline, and it remains unclear whether LLD represents a risk factor or prodrome to developing a major neurocognitive disorder [29]. On the other hand, if depression develops later in the course of cognitive decline, there may be an underlying neurocognitive disorder [17]. Up to 20% of individuals with major neurocognitive disorder due to Alzheimer’s disease also have major depression [11]. For these reasons, concomitant assessment of cognition is essential to the evaluation of the older adult presenting with depressive symptoms [30]. Cognitive domains that may be affected include learning and memory, language, attention, perceptual motor abilities, social cognition, and executive function [4]. Many of these domains can be assessed during the mental status examination, with brief cognitive screening tools, or with formal neuropsychological testing.
While there are numerous cognitive screening tools, some commonly used, brief tools include the Mini-Cog, the Folstein Mini-Mental State Exam (MMSE), and the Montreal Cognitive Assessment (MoCA). The Mini-Cog consists of a 3-item registration, delayed recall, and clock drawing test and has several advantages over other screening tools. It is a brief test (taking approximately 3 minutes to administer) with good sensitivity and specificity of 80% or greater. Compared with other cognitive screening tools, it is less influenced by level of education, language, or cultural background [31–33]. The MMSE is a longer screening tool consisting of 19 items and requires about 10 minutes to administer. Unlike the Mini-Cog, performance on the MMSE can be affected by level of education and cultural background. However, the MMSE can be administered serially to monitor changes in cognition over time [34,35]. The MoCA is a 10-minute cognitive screening tool first developed to detect mild cognitive impairment (MCI) [36]. The MoCA consists of 7 subscore sections covering visuospatial/executive function, naming, memory (delayed recall), attention, language, abstraction, and orientation. The total score is 30, and 1 point is added to the score if the testing subject has less than high school/12 years of education. The MoCA has demonstrated better sensitivity than the MMSE for the detection of MCI [36]. Elderly patients with depression often perform poorly on these cognitive screening tests due to apathy and poor effort.
Functional Assessment
The diagnosis of LLD requires that symptoms cause significant distress or interfere with functioning. A functional assessment is especially important in the evaluation of the older adult in that it allows clinicians to determine an individual’s ability to live independently and attend to daily needs. Basic activities of daily living (ADLs) include bathing, dressing, grooming, toileting, and self-transferring. Instrumental activities of daily living (IADLs) include more complex daily activities such as preparing meals, administering medications, driving, managing finances, and using simple electronics such as the telephone or remote control [26]. Impairment in IADLs is associated with increased depression severity. Conversely, the severity of depressive symptoms along with associated cognitive impairment predicts IADL impairment [37]. The Philadelphia Multilevel Assessment Instrument is a tool that can aid in the assessment of ADLs and IADLs and has been utilized in studies examining disability in depressed elderly patients [37,38]. Other available scales to quantify functional status include OARS Physical Activities of Daily Living, OARS Instrumental Activities of Daily Living Scale, and Direct Assessment of Functional Status Scale [26].
Suicide Assessment
Assessment for suicidality is an integral part of all psychiatric evaluations and is especially important in the evaluation of the depressed older adult. According to the Centers for Disease Control and Prevention, the suicide rate for individuals age 65 and older is 16.6 per 100,000, a figure that is comparable to that for individuals 18–64 years of age [39]. Non-Hispanic Caucasian males age 85 and older have the highest rate of completed suicide (56.5 per 100,000), underscoring the importance of a thorough suicide assessment [39]. Suicidality can range from passive thoughts of death and wishing that one were not alive, to active thoughts of self-harm with plan and intent. A Canadian study found 2% of community-dwelling adults age 55 and older had suicidal thoughts over a 12-month period and, of these, 28% had major depression [40]. A suicide assessment begins with inquiring about the presence of suicidal thoughts, plans, and intent. The 3 most frequently used methods of completed suicide in the elderly are firearms (28%), hanging (24%) and poisoning (21%) [41]. Access to weapons or other lethal means of self-harm such has hoarding of medications should be ascertained.
A complete suicide assessment requires attention to suicide risk factors, protective factors, and warning signs of impending suicide. Risk factors for suicide in the older adult include mood disorders, chronic medical illnesses and associated functional impairment, chronic pain, and psychosocial factors such as social isolation [42]. Mood disorders are present in 54% to 87% of cases of completed suicide, with major depression being the most common [42]. Chronic medical illness and pain can result in functional impairment leading to feelings of excessive guilt or being a burden to loved ones. Protective factors such as social connectedness, spirituality, religious beliefs, and cultural attitudes against suicide may serve as buffers against these risk factors [43]. Warning signs of impending suicide may indicate preparations for suicide and include feelings of hopelessness or lack of purpose, feeling trapped, talking about death, threatening suicide, agitation, social withdrawal, increased substance use and reckless behavior. Warning signs should prompt action to ensure the safety of the individual [44,45].
Physical Examination, Laboratory Studies, and Neuroimaging
Evaluation of LLD is not complete without a physical examination and ancillary studies to identify underlying medical conditions possibly contributing to or mimicking depressive symptoms. Routine laboratory studies include complete blood count, complete metabolic panel, thyroid studies, and urine drug screen. Signs and symptoms of underlying medical conditions may necessitate further laboratory studies [46]. Neuroimaging may reveal signs of cerebrovascular disease which can predispose, precipitate, or perpetuate depression in older adults [47].
Treatment
Treatment of LLD can take many forms and occur in various settings. Geriatric psychiatrists have expertise in the assessment and treatment of mental illness in the elderly. Workforce estimates for 2010 revealed 1 geriatric psychiatrist per 10,000 adults age 75 and over. This figure is estimated to decrease to 0.5 per 10,000 by the year 2030, underscoring the importance of increasing the knowledge base of clinicians across specialties who provide care to the depressed elderly [48]. The primary care setting is often the locus of care for depression in older adults; however, studies suggest that patients are often left untreated or undertreated [49]. Collaborative care models whereby mental health care is integrated into primary care have been shown to improve outcomes. The Prevention of Suicide in Primary Care Elderly: Collaborative Trial (PROSPECT) study found that use of care managers to assist primary care providers in identification of depression, offer algorithm-based treatment recommendations, monitor symptoms and medication side effects, and provide follow-up yielded improvement in outcomes. Patients in the intervention group were more likely to receive pharmacotherapy or psychotherapy, achieve remission, and showed greater decline in suicidal ideation [50]. Similar results were found in the Improving Mood-Promoting Access to Collaborative Treatment (IMPACT) study in which intervention patients treated under a collaborative care model showed lower depression severity, less functional impairment, and greater reduction in depressive symptoms [25].
Just as a collaborative care model can lead to improved outcomes, the overall strategy of treating depression must be multifaceted. The biopsychosocial model of disease first described in the 1970s emphasizes biological and psychosocial determinants of illness that must be addressed when treatment is considered [51]. This includes nonmodifiable biological factors such as age, gender, and genetic predisposition that may affect treatment options, as well as modifiable biological factors such as comorbid medical illness, medications, or substance use disorders. Psychological factors that can affect depressive symptoms include coping skills and defense mechanisms in the face of stressful life events. Social factors including the role of culture, environment, and family dynamics in disease presentation must be considered as well [52].
Pharmacologic Treatment of LLD
The primary pharmacologic treatment for depression is antidepressants. Treatment consists of 3 phases—acute, continuation, and maintenance. In the acute phase, the goal is remission of current symptoms and restoration of function. The continuation phase, extending up to 6 months after remission, aims to prevent relapse back into a depressive episode. Maintenance therapy is geared at preventing recurrence of future depressive episodes [53]. Studies have found a 50% risk of relapse after 1 episode of depression and 80% after 2 episodes. Up to 20% will develop chronic symptoms. For this reason, maintenance therapy is often necessary for recurrent depression [54].
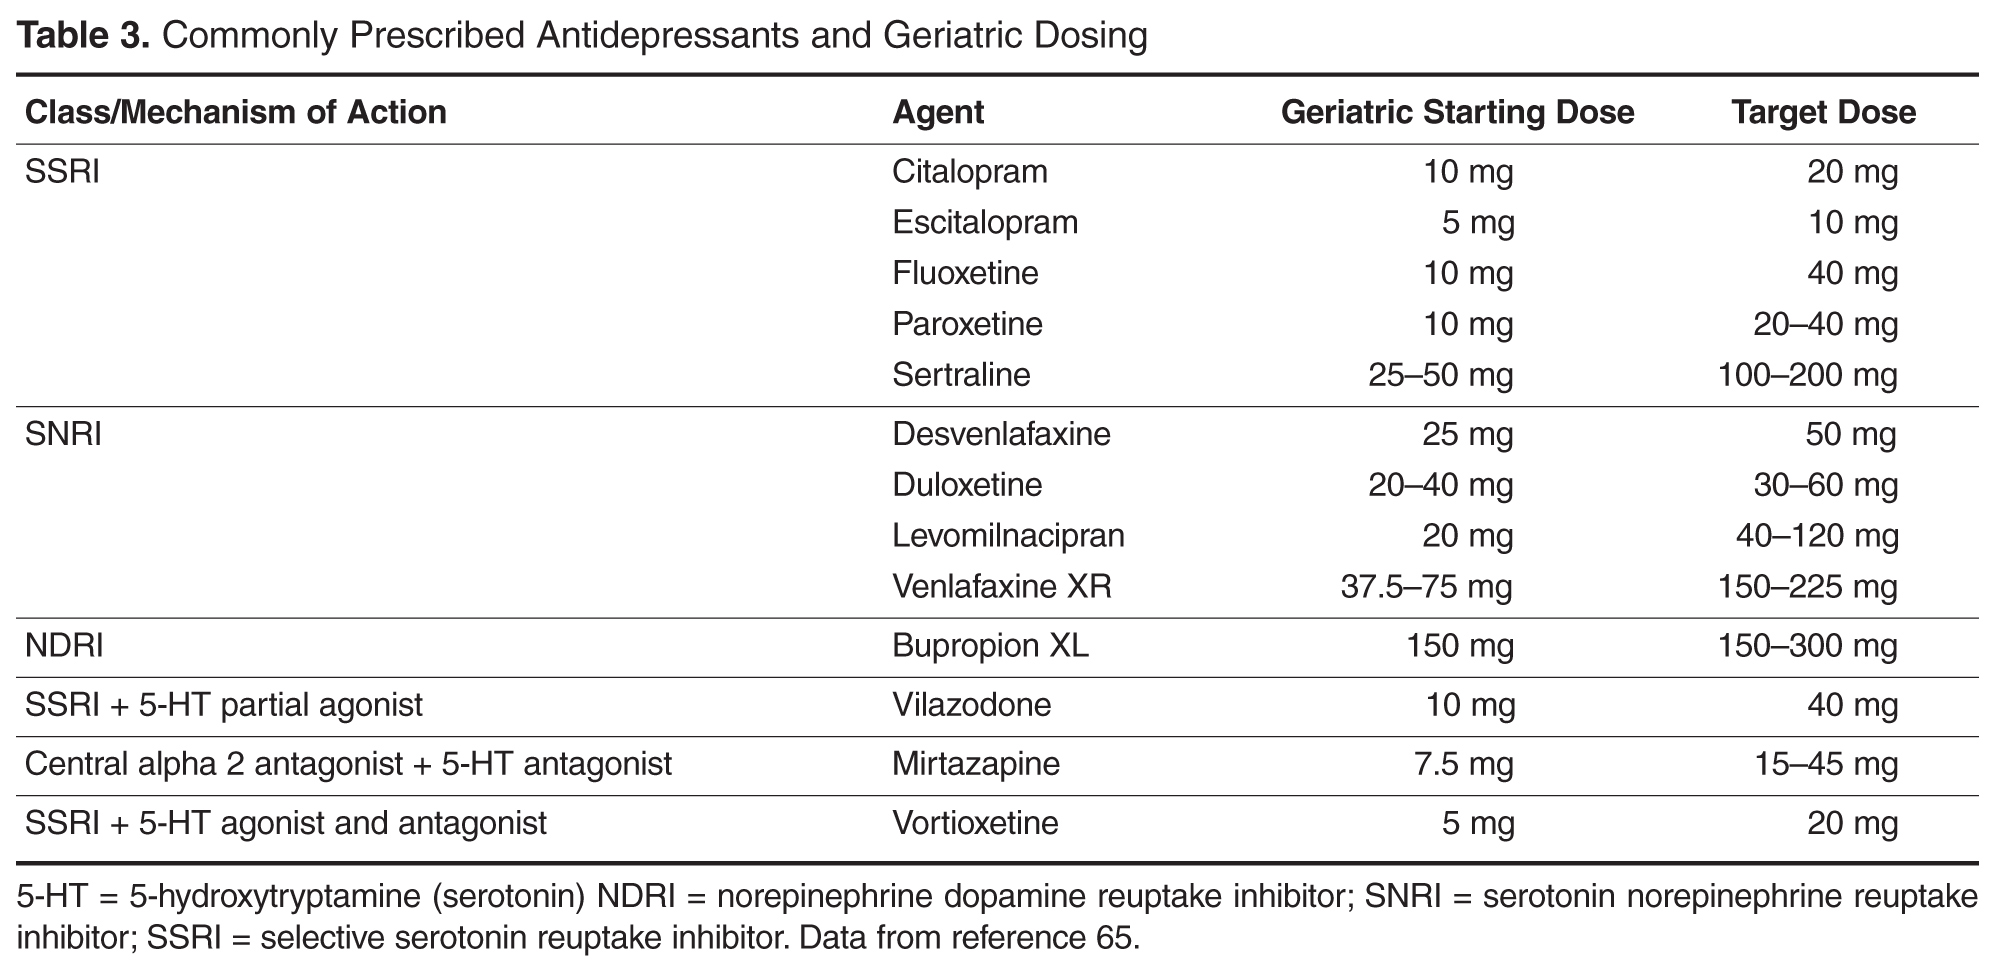
While cognitive impairment may affect antidepressant efficacy, age does not appear to be a determinant. Gildengers et al examined antidepressant response in young, middle, and older-old patients and found no significant difference in response rates [59]. Early onset versus late onset of first depressive episode also does not predict antidepressant response in patients age 55 and over [60]. There is scant evidence for efficacy of antidepressants in depressed patients with neurocognitive disorders. A 2002 Cochrane review with 4 studies in the meta-analysis (n = 137) concluded that there was weak support for antidepressant efficacy in this population [61]. A 2011 meta-analysis with 330 participants also yielded inconclusive results [62]. The paucity of evidence for antidepressant efficacy in depressed patients with neurocognitive disorders should prompt careful consideration of potential benefits versus adverse effects.
Antidepressants are generally well tolerated in older adults. Side effects vary by medication and contribute to discontinuation in up to 25% of new users (versus 22% for new users who discontinue for reasons other than side effects) [63]. Potential adverse effects shared by most SSRIs and SNRIs include GI disturbance (nausea, diarrhea or constipation), sexual dysfunction, headache, and sleep disturbance [64,65]. In addition, abrupt discontinuation can precipitate serotonin withdrawal syndrome characterized by sensory disturbance (paresthesia, tremor, and irritability) as well as headache, lightheadedness, diaphoresis, insomnia, and agitation. Other medication-specific side effects include risk of seizure with bupropion and sedation with mirtazapine [65].
Despite superiority of antidepressants to placebo in treating depression, up to one-third of patients may not respond to a trial of antidepressants. Sequential treatment protocols such as switching to a different antidepressant or augmentation can increase the proportion of antidepressant responders [66–68]. Studies have found particularly favorable response to augmentation with lithium, with one study achieving a 33% remission rate in treatment- resistant geriatric depression [67,69]. Other pharmacologic augmentation strategies include the addition of mood stabilizers such as lamotrigine, antipsychotics (aripiprazole, olanzapine, quetiapine, and risperidone), and psychostimulants [70–73]. Electroconvulsive therapy (ECT) is a nonpharmacologic option for treatment-resistant depression that will be reviewed later.
Psychotherapeutic and Psychosocial Interventions
Psychotherapeutic interventions have demonstrated efficacy in the treatment of geriatric depression, including but not limited to cognitive behavioral therapy (CBT), interpersonal therapy (IPT), problem-solving therapy (PST), reminiscence and life review, and brief psychodynamic psychotherapy [74]. Some older adults may prefer psychotherapy to pharmacologic treatment (57% vs. 43%) [75]. Potential benefits of psychotherapy include ability to directly address psychosocial stressors that may precipitate or perpetuate depressive symptoms. In addition, psychotherapy is associated with few to no side effects and avoids drug interactions. Barriers to employing psychotherapy may include cost and access to trained psychotherapists [76]. Efficacy of several psychotherapeutic approaches in the care of older depressed adults has been examined. CBT, brief psychodynamic psychotherapy, and IPT will be briefly reviewed here.
CBT. Cognitive therapy was first described by Aaron Beck in the 1960s [77]. It is a highly structured therapy built on the premise that beliefs and assumptions an individual holds can influence emotions and behavior. CBT aims to identify maladaptive belief systems, test the validity of these cognitive distortions, and help individuals formulate more realistic cognitions [78]. Symptom improvement results from addressing these cognitive aspects as well as integration of behavioral activation and skills training to overcome maladaptive behavioral patterns [78]. CBT approaches have been applied to older adults with depression and results show acceptability [79] and efficacy in this population [80–82]. A 2008 Cochrane review (n = 153) found CBT to be superior to waitlist controls [82].
Brief psychodynamic psychotherapy. Brief psychodynamic psychotherapy, unlike highly structured CBT, aims to alter behavior by examining how past experiences and unresolved conflicts influence current emotions and behavior. While studies on application to the treatment of geriatric depression are scarce, limited data demonstrate efficacy in treating geriatric depression [81] and no significant difference in outcomes when compared to CBT [82].
IPT. Like CBT, IPT is a structured time-limited psychotherapeutic treatment approach first developed in the late 1960s by Klerman and Weissman [83]. IPT focuses on the impact of interpersonal relationships on depressive symptoms and examines 4 domains: interpersonal conflict, interpersonal deficits, role transitions, and grief [74].
Studies have shown efficacy of IPT in reducing depressive symptoms in the elderly when compared to usual care [84]. Reynolds et al found IPT combined with nortriptyline (a tricyclic antidepressant) to be superior to either nortriptyline alone or IPT alone in preventing recurrent depressive episodes [85]. Interestingly, a similar study investigating the efficacy of IPT in combination with paroxetine (an SSRI) failed to show added benefit of IPT in preventing recurrence, suggesting that further studies are needed [86].
Psychosocial interventions are integral in the care of the elderly depressed patient. Studies have shown positive benefits of aerobic exercise on depressive symptoms [87]. Yoga, Tai Chi, and other mindfulness-based exercises can increase sense of emotional and physical wellbeing [88–90]. Spirituality, religious beliefs, and involvement with a faith group may be protective against development of mental illness while at the same time provide avenues for increased social connectedness [91]. These and other avenues for socialization should be encouraged as part of the treatment plan for older depressed patients [92]
Electroconvulsive Therapy
ECT is indicated for the treatment of mood and psychotic disorders and has demonstrated efficacy in the treatment of severe depression [93]. It is typically initiated when patients fail to respond to pharmacotherapy and psychotherapy. Circumstances in which ECT can be considered first-line treatment include situations that require a rapid response (severe inanition, weight loss, or suicidality), situations where risks of ECT are lower than that of alternative treatments, previous positive response to ECT, or strong patient preference [94]. ECT is performed under general anesthesia and involves the induction of a generalized tonic-clonic seizure, which is theorized to enhance serotonergic, noradrenergic, and dopaminergic neurotransmission. A typical course of ECT involves treatments 3 times a week for an average of 6 to 12 treatments in total [95]. Elderly patients and those suffering from severe depression with psychotic features respond more robustly to ECT [93,96]. Estimated remission rates after an ECT series have been higher than 80% [93], making this modality the most effective treatment for severe depression to date.
Conclusion
As the population continues to age, clinicians are increasingly likely to encounter patients with late-life depression. A thorough evaluation includes not only assessment of depressive symptoms, but also cognitive, functional, and suicide assessment. Treatment options include pharmaco-therapy, psychotherapy, and in some cases electroconvulsive therapy. Utilization of assessment and treatment nuances unique to the geriatric population, with a multidisciplinary and collaborative approach involving primary care, mental health, and other ancillary providers, will serve to ultimately enhance patient care.
Corresponding author: Corresponding author: Juliet Glover, MD, Dept. of Neuropsychiatry and Behavioral Science, Univ. of South Carolina School of Medicine, 15 Medical Park, Suite 301, Columbia, SC 29203, [email protected].
Financial disclosures: None reported.
Author contributions: conception and design, JAG, SS; drafting of article, JAG, SS; critical revision of the article, JAG, SS.
1. Vincent GK, Velkoff VA. The next four decades: the older population in the United States: 2010 to 2050. US Census Bureau: May 2010.
2. Koenig HG, Blazer DG. Epidemiology of geriatric affective disorders. Clinc Geriatr Med 1992; 8:235–51.
3. Ferrari AJ, Charlson FJ, Norman RE, et al. Burden of depressive disorders by country, sex, age, and year: findings from the global gurden of disease study 2010. PLoS Med 2013;10:e1001547.
4 .American Psychiatric Association. Diagnostic and statistical manual of mental disorders. 5th ed. Arlington, VA: American Psychiatric Publishing; 2013.
5 .Ellison JM, Kyomen HH, Harper DG. Depression in later life: an overview with treatment recommendations. Psychiatr Clin North Am 2012;35:203–29.
6. Hasin DS, Goodwin RD, Stinson FS, Grant BF. Epidemiology of major depressive disorder: results from the National Epidemiologic Survey on Alcoholism and Related Conditions. Arch Gen Psychiatry 2005;62:1097–106.
7. Steffens DC, Skoog I, Norton MC, et al. Prevalence of depression and its treatment in an elderly population: the Cache County study. Arch Gen Psychiatry 2000;57:601–7.
8. Kessler RC, Berglund P, Demler O, et al. The epidemiology of major depressive disorder: results from the National Comorbidity Survey Replication (NCS-R). JAMA 2003;289:3095–105.
9. McKinney BC, Sibille E. The age-by-disease interaction hypothesis of late-life depression. Am J Geriatr Psychiatry 2013;21:418–32.
10. Djernes JK. Prevalence and predictors of depression in populations of elderly: a review. Acta Psychiatr Scand 2006;113:372–87.
11. Blazer DG. Depression in late life: review and commentary. J Gerontol A Biol Sci Med Sci 2003;58:249–65.
12. Cole MG, Dendukuri N. Risk factors for depression among elderly community subjects: a systematic review and meta-analysis. Am J Psychiatry 2003;160:1147–56.
13. Ritchie K. Late-life depression. European Psychiatry 2014;29:577.
14. Hegeman JM, de Waal MW, Comijs HC, et al. Depression in later life: a more somatic presentation? J Affect Disord 2015;170:196–202.
15. Lackamp J, Schlachet R, Sajatovic M. Assessment and management of major depressive disorder in older adults. Psychiatria Danubina 2016;28(Suppl 1):95–98.
16. Morichi V, Dell’Aquila G, Trotta F, et al. Diagnosing and treating depression in older and oldest old. Curr Pharm Des 2015;21:1690–8.
17. Fiske AJ, Wetherell JL, Gatz M. Depression in older adults. Annu Rev Clin Psychol 2009;5:363–89.
18. Balsis S, Cully JA. Comparing depression diagnostic symptoms across younger and older adults. Aging Ment Health 2008;12:800–6.
19. Hegeman JM, Kok RM, van der Mast RC, Giltay EJ. Phenomenology of depression in older compared with younger adults: meta-analysis. Br J Psychiatry 2012;200:275–81.
20. Mitchell AJ, Bird V, Rizzo M, Meader N. Which version of the geriatric depression scale is most useful in medical settings and nursing homes? Diagnostic validity meta-analysis. Am J Geriatr Psychiatry 2010;18:1066–77.
21. Blazer DG. The psychiatric interview of older adults. In: Blazer D, Steffens D, Busse E, editors. Textbook of geriatric psychiatry. 3rd ed. Arlington, VA: American Psychiatric Publishing; 2004.
22. Spitzer RL, Kroenke K, Williams JW. Validation and utility of a self-report version of PRIME-MD: the PHQ primary care study. Primary Care Evaluation of Mental Disorders. Patient Health Questionnaire. JAMA 1999;282:1737–44.
23. Richardson TM, He H, Podgorski C, et al. Screening for depression in aging services clients. Am J Geriatr Psychiatry 2010;18:1116–23.
24. Archer J, Bower P, Gilbody S, et al. Collaborative care for depression and anxiety problems. Cochrane Database Syst Rev 2012 Oct 17.
25. Unutzer J, Katon W, Callahan CM, et al. Collaborative care management of late-life depression in the primary care setting a randomized controlled trial. JAMA 2002;288:2836–45.
26. Silver I, Herrmann N. Comprehensive psychiatric evaluation. In: Sadavoy J, Jarvik L, Grossberg G, Meyers B, editors. Comprehensive textbook of geriatric psychiatry. 3rd ed. New York: W.W. Norton; 2004.
27. Rapp MA, Dahlman K, Sano M, et al. Neuropsychological differences between late-onset and recurrent geriatric major depression. Am J Psychiatry 2005;162:691–8.
28. Sheline YI, Barch DM, Garcia K, et al. Cognitive function in late life depression: relationships to depression severity, cerebrovascular risk factors and processing speed. Biol Psychiatry 2006; 60:58–65.
29. Barnes DE, Yaffe K, Byers AL, et al. Midlife vs late-life depressive symptoms and risk of dementia: differential effects for Alzheimer disease and vascular dementia. Arch Gen Psychiatry 2012;69:493–8.
30. Morimoto SS, Kanellopoulos D, Manning KJ, Alexopoulos GS. Diagnosis and treatment of depression and cognitive impairment in late life. Ann NY Acad Sci 2015;1345:36–46.
31. Borson S, Scanlan J, Brush M, et al. The mini-cog: a cognitive ‘vital signs’ measure for dementia screening in multi-lingual elderly. Int J Geriatr Psychiatry 2000;15:1021–7.
32. Brodaty H, Low LF, Gibson L, Burns K. What is the best dementia screening instrument for general practitioners to use? Am J Geriatr Psychiatry 2006;14:391–400.
33. Ismail Z, Rajji TK, Shulman KI. Brief cognitive screening instruments: an update. Int J Geriatr Psychiatry 2010;25:111–20.
34. Folstein MF, Folstein SE, McHugh PR. “Mini-mental state”. A practical method for grading the cognitive state of patients for the clinician. J Psychiatr Res 1975;12:189–98.
35. Vertesi A, Lever JA, Molloy DW, et al. Standardized Mini-Mental State Examination. Use and interpretation. Can Fam Physician 2001;47: 2018–23.
36. Nasreddine ZS, Phillips NA, Bédirian V, et al. The Montreal Cognitive Assessment, MoCA: a brief screening tool for mild cognitive impairment. J Am Geriatr Soc 2005;53:695–9.
37. Kiosses DN, Alexopoulos GS. IADL functions, cognitive deficits, and severity of depression: a preliminary study. Am J Geriatr Psychiatry 2005;13:244–9.
38. Alexopoulos GS, Vrontou C, Kakuma T, et al. Disability in geriatric depression. Am J Psychiatry 1996;153:877–85.
39. Centers for Disease Control and Prevention. National Center for Injury Prevention and Control. Web-Based Injury Statistics Query and Reporting System (WISQARS). Accessed 9 Feb 2016 at http://webappa.cdc.gov/sasweb/ncipc/dataRestriction_inj.html.
40. Corna LM, Cairney J, Streiner DL. Suicide ideation in older adults: relationship to mental health problems and service use. Gerontologist 2010;50:785–97.
41. Juurlink DN, Herrmann N, Szalai JP, et al. Medical illness and the risk of suicide in the elderly. Arch Intern Med 2004;164:1179–84.
42. Van Orden K, Conwell Y. Suicides in late life. Curr Psychiatry Rep 2011;13:234–41.
43. Conwell Y, Van Orden K, Caine ED. Suicide in older adults. Psychiatr Clin North Am 2011;34:451–68, ix.
44. Rudd MD, Berman AL, Joiner TE, et al. Warning signs for suicide: theory, research, and clinical applications. Suicide Life Threat Behav 2006;36:255–62.
45. Know the warning signs of suicide. American Association of Suicidology. Accessed 9 Feb 2016 at www.suicidology.org/resources/warning-signs.
46. Taylor W, Doraiswamy P. Use of the laboratory in the diagnostic workup of older adults. In: Blazer D, Steffen D, Busse E, editors. Textbook of geriatric psychiatry. 3rd ed. Arlington, VA: American Psychiatric Publishing; 2004.
47. Alexopoulos GS, Meyers BS, Young RC, et al. ‘Vascular depression’ hypothesis. Arch Gen Psychiatry 1997;54:915–22.
48. ADGAP Status of Geriatrics Workforce Study. Accessed 26 Dec 2016 at www.americangeriatrics.org/files/documents/gwps/Table%201_29.pdf.
49. Alexopoulos G. Late-life mood disorders. In: Sadavoy J, Jarvik L, Grossberg G, Meyers B, editors. Comprehensive textbook of geriatric psychiatry. 3rd ed. New York: W.W. Norton; 2004.
50. Alexopoulos GS, Reynolds CF, Bruce ML, et al. Reducing suicidal ideation and depression in older primary care patients: 24-month outcomes of the PROSPECT study. Am J Psychiatry 2009;166:882–90.
51. Engel GL. The need for a new medical model: a challenge for biomedicine. Science 1977;196:129–36.
52. Schotte CKW, Van den Bossche B, Doncker DD, et al. A biopsychosocial model as a guide for psychoeducation and treatment of depression. Depression Anxiety 2006;23:312–24.
53. Kupfer DJ, Frank E. The interaction of drug-and psychotherapy in the long-term treatment of depression. J Affect Disord 2001;62:131–7.
54. Katon W, Rutter C, Ludman EJ, et al. A randomized trial of relpase prevention of depression in primary care. Arch Gen Psychiatry 2001;58:241–7.
55. Kok RM, Nolen WA, Heeren TJ. Efficacy of treatment in older depressed patients: a systematic review and meta-analysis of double-blind randomized controlled trials with antidepressants. J Affect Disord 2012;141:103–15.
56. Hamilton M. A rating scale for depression. J Neurol Neurosurg Psychiatry 1960;23:56–62.
57. Montgomery SA, Asberg M. A new depression scale designed to be sensitive to change. Br J Psychiatry 1979;134:382–9.
58. Mukai Y, Tampi RR. Treatment of depression in the elderly: a review of the recent literature on the efficacy of single- versus dual-action antidepressants. Clin Ther 2009;31:945–61.
59. Gildengers AG, Houck PR, Mulsant BH, et al. Course and rate of antidepressant response in the very old. J Affect Disord 2002;69:177–84.
60. Kozel FA, Trivedi MH, Wisniewski SR, et al. Treatment outcomes for older depressed patients with earlier versus late onset of first depressive episode. Am J Geriatr Psychiatry 2008;16:58–64.
61. Bains J, Birks J, Dening T. Antidepressants for treating depression in dementia. Cochrane Databse Syst Rev 2002;(4):CD003944.
62. Nelson JC, Devanand DP. A systematic review and meta-analysis of placebo-controlled antidepressant studies in people with depression and dementia. J Am Geriatr Soc 2011;59:577–85.
63. Mark TL, Joish VN, Hay JW, et al. Antidepressant use in geriatric populations: the burden of side effects and interactions and their impact on adherence and costs. Am J Geriatr Psychiatry 2011;19:211–21.
64. Frank C. Pharmacologic treatment of depression in the elderly. Can Fam Physician 2014;60:121–6.
65. Kennedy GJ, Marcus P. Use of antidepressants in older patients with co-morbid medical conditions: guidance from studies of depression in somatic illness. Drugs Aging 2005;22:273–87.
66. Sackheim HA, Kupfer DJ, Luther J, Fava M. Acute and longer-tern outcomes in depressed outpatients requiring one or several treatment steps: a STAR*D report. Am J Psychiatry 2006;163:1905–17.
67. Kok RM, Nolen WA, Hereen TJ. Outcome of late-life depression after 3 years of sequential treatment. Acta Psychiatr Scand 2009;119:274–81.
68. Whyte EM, Basinski J, Farhi P, et al. Geriatric depression treatment in nonresponders to selective serotonin reuptake inhibitors. J Clin Psychiatry 2004;65:1634–41.
69. Kok RM, Vink D, Hereen TJ, Nolen WA. Lithium augmentation compared with phenelzine in treatment-resistant depression in the elderly; an open, randomized, controlled trial. J Clin Psychiatry 2006;68:1177–85.
70. Kok RM. What is the role of medications in late life depression? Psychiatr Clin North Am 2003;36:597–605.
71. Wen XJ, Wang LM, Liu ZL,. Meta-analysis on the efficacy and tolerability of the augmentation of antidepressants with atypical antipsychotics in patients with major depressive disorder. Braz J Med Biol Res 2014;47:605–16.
72. Lenze EJ, Mulsant BH, Blumberger DM, et al. Efficacy, safety, and tolerability of augmentation pharmacotherapy with aripiprazole for treatment-resistant depression in late life: a randomised double-blind, placebo-controlled trial. Lancet 2015;386:2404–12.
73. Alexopoulos GS, Canuso CM, Gharabawi GM, et al. Placebo-controlled study of relapse prevention with risperidone augmentation in older patients with resistant depression. Am J Geriatr Psychiatry 2008;16:21–30.
74. Francis JL, Kumar A. Psychological treatment of late-life depression. Psychiatr Clin North Am 2013;36:561–75.
75. Gum AM, Arean PA, Hunkeler E, et al. Depression treatment preferences in older primary care patients. Gerontologist 2006;46:14–22.
76. Pinquart M, Duberstein PR, Lyness JM. Treatments for late-life depressive conditions: a meta-analytic comparison of pharmacotherapy and psychotherapy. Am J Psychiatry 2006;163:1493–501.
77. Beck Institute for Cognitive Behavior Therapy. Accessed 28 Dec 2016 at www.beckinstitute.org
78. Beck AT. Cognitive therapy: nature and relation to behavior therapy. Behav Ther 1970;1:184–200.
79. Landrevile P, Landry J, Baillargeon L, et al. Older adults’ acceptance of psychological and pharmacological treatments for depression. J Gerontology B Psychol Sci Soc Sci 2001;56:P285–91.
80. Thompson LW, Gallagher D, Breckenridge JS. Comparitive effectiveness of psychotherapies for depressed elders. J Consult Clin Psychol 1987;55:385–90.
81. Gallagher-Thompson D, Steffen AM. Comparative effects of cognitive-behavioral and brief psychodynamic psychotherapies for depressed family caregivers. J Consult Clin Psychol 1994;62:543–9.
82. Wilson KC, Mottram PG, Vassilas C. Psychotherapeutic treatments for older depressed people. Cochrane Database Syst Rev 2008;(1):CD004853
83. Markowitz JC, Weissman MM. Interpersonal psychotherapy: past, present and future. Clin Psychol Psychother 2012;19:99–105.
84. Van Schaik A, van Marwijk H, Ader H, et al. Interpersonal psychotherapy for elderly patients in primary care. Am J Geriatr Psychiatry 2006;14:777–86.
85. Reynolds CF 3rd, Frank E, Perel JM, et al. Nortriptyline and interpersonal psychotherapy as maintenance therapies for recurrent major depression: a randomized controlled trial in patients older than 59 years. JAMA 1999;281:39–45.
86. Reynolds CF 3rd, Dew MA, Pollock BG, et al. Maintenance treatment of major depression in old age. N Engl J Med 2006;354:1130–8.
87. Blumenthal JA, Babyak MA, Moore KA, et al. Effects of exercise training on older patients with major depression. Arch Intern Med 1999;159:2349–56.
88. Krishnamurthy MN, Telles S. Assessing depression following two ancient Indian interventions: effects of yoga and ayurveda on older adults in a residential home. J Gerontol Nurs 2007;33:17–23.
89. Wang C, Bannuru R, Ramel J, et al. Tai Chi on psychological well-being: systematic review and meta-analysis. BMC Complement Altern Med 2010;10:23.
90. Cho KL. Effect of tai chi on depressive symptoms amongst Chinese older patients with depressive disorders: a randomized clinical trial. Med Sport Sci 2008;52:146–54.
91. Moritz S, Quan H, Rickhi B, et al. A home study-based spirituality education program decreases emotional distress and increases quality of life- a randomized, controlled trial. Altern Ther Health Med 2006;12:26–35.
92. Nyer M, Doorley J, Durham K, et al. What is the role of alternative treatments in late-life depression? Psychiatr Clin North Am 2013;36:577–96.
93. Petrides G, Fink M, Husain MM, et al. ECT remission rates in psychotic versus nonpsychotic depressed patients: a report from CORE. J ECT 2001;17:244–53.
94. Mankad MV, Beyer JL, Weiner RD, Krystal AD. Clinical manual of electroconvulsive therapy. American Psychiatric Publishing; 2010.
95. Kellner CH, Greenberg RM, Murrough JW, et al. ECT in treatment-resistant depression. Am J Psychiatry 2012;169:1238–44.
96. Flint AJ, Gagnon N. Effective use of electroconvulsive therapy in late-life depression. Can J Psychiatry 2002;47:734–41.
From the Department of Neuropsychiatry and Behavioral Sceince, University of South Carolina School of Medicine, Columbia, SC.
Abstract
- Objective: To review the identification, clinical assessment and treatment of patients with late-life depression.
- Methods: Review of the literature.
- Results: Depressive symptoms are present in up to 1 in 4 older adults. Comprehensive evaluation of depressive symptoms in this population often requires a multidisciplinary and collaborative approach between primary care, mental health, and other ancillary providers. Key aspects include a detailed history, physical and mental status examinations, cognitive and functional status assessment, and suicide risk assessment. Treatment options include anti-depressants, psychotherapy, and electroconvulsive therapy.
- Conclusion: A systematic approach to evaluating depressive symptoms in the elderly can enhance timely recognition and treatment.
Key words: Late-life depression; clinical assessment; antidepressants; psychotherapy; electroconvulsive therapy.
The U.S. population is aging, and with this comes the potential for increased health care needs. In 2014, there were over 46 million Americans age 65 and over (14.5% of the U.S. population). This number is projected to increase to 88 million by the year 2050 [1]. One in 4 older adults suffers with depressive symptoms that cause distress and functional impairment [2]. The World Health Organization Global Burden of Disease Study found depressive disorders to be the leading cause of disability-adjusted life years (DALYs) and the second leading cause of years lived with disability (YLDs). The burden of disease due to depressive disorders increased by 37.5% between 1990 and 2010, and 10.4% was attributable to aging [3]. These figures underscore the importance of accurate assessment and treatment of depression in the elderly. In this article, we review the identification, clinical assessment, and treatment of patients with late-life depression.
Diagnostic Criteria
Prevalence
It is estimated that 1% to 4% of community-dwelling adults age 65 and older suffer from MDD, with women more likely to be affected than men (prevalence of 4.4% vs. 2.7) [2,5–7]. This estimate is low compared with lifetime prevalence of almost 20% in the general adult population [8]. However, when depressive symptoms that do not meet criteria for MDD are considered, prevalence rates increase up to 25% [2,9]. These estimates also vary by clinical setting, with the highest rates (up to 40%) among elderly patients in long-term care facilities [10,11]. While individuals with subsyndromal depression may experience fewer symptoms than those with MDD, clinically significant distress persists, impacting health and functional status. Depression is associated with overall poor social or occupational functioning, cognitive decline, increased health care utilization and cost, increased morbidity and mortality from medical illness, and increased suicide mortality [5,9,10,12].
Identifying LLD
Accurate identification of LLD also requires recognition of the differences in the presentation of LLD compared with onset in earlier life. Depression in younger adults is often marked by depressed mood and loss of interest [18]. In contrast, older adults may present with increased anger or irritability [5]. Younger adults are more likely to report suicidal thoughts while older patients report feelings of hopelessness and thoughts of death [18]. LLD is often characterized by increased somatic complaints, hypochondriasis, or pain [5,18,19]. Another major difference lies in the presentation of cognitive difficulties. Younger patients typically complain of poor concentration or indecisiveness. Geriatric patients may present with cognitive changes including objective findings of slower processing speed and executive dysfunction on neuropsychological testing [17].
Depression rating scales may aid in identification of LLD. They are not a substitute for clinical diagnosis but can be useful as screening tools. Two commonly utilized depression rating scales are the Geriatric Depression Scale (GDS) and the Patient Health Questionnaire-9 (PHQ-9). GDS is a 30-item instrument developed specifically for older adults. Shorter 15-item, 5-item, and 4-item versions exist. The scale utilizes a Yes/No format and can be self- or clinician-administered [20]. One advantage of the GDS lies in its focus on psychological and cognitive aspects of depression rather than neurovegetative symptoms that may overlap with medical illnesses common in older adults [21]. The PHQ-9 is a 9-item self- or clinician-administered screening tool designed for use in primary care settings and has also been validated in geriatric populations [22,23]. The 9 items on this scale correspond to the DSM-5 criteria for major depression. A shorter 2-item version (PHQ-2) has also been validated, and a positive screen on this test should prompt administration of the full-length version. Both versions have approximately 80% sensitivity and specificity in detecting depression. An added advantage of PHQ-9 over GDS is that it can be useful in monitoring treatment response over time [22,23]
Comprehensive Assessment of LLD
The comprehensive assessment of patients with LLD can be carried out by health professionals in both mental health or primary care settings. In a multidisciplinary approach, psychiatrists and mental health professionals have collaborated with primary care providers using depression care managers with successful outcomes in managing depression in older adults [24,25]. Complete evaluation of a patient with suspected LLD begins with a history and physical and mental status examination. Other essential components of the evaluation include assessment of cognition, functional status, and suicide risk. Laboratory and neuroimaging studies may be necessary as well. Due to the comprehensive nature of this assessment, a multidisciplinary approach with collaboration between primary care, psychiatry, psychology, and ancillary services such as social work may be necessary. Multiple patient interactions may be required to complete a thorough evaluation.
History and Mental Status Examination
As with many other psychiatric illnesses, LLD is a clinical diagnosis. A careful history should be obtained initially utilizing open-ended questions. This should be followed by more directed questions as indicated to elicit the presence of depressive symptoms. The history should be obtained from the patient. A relevant collateral informant can be invaluable in the assessment, especially in cases where there is a comorbid neurocognitive disorder. However, the patient’s informed consent must be obtained prior to obtaining collateral information whenever possible. Psychosocial stressors that may have precipitated or may be perpetuating symptoms should be explored. Such stressors may include recent changes in living situation, loss of social support, recent deaths, or financial difficulties. Biological precipitants also need to be explored including presence of physical illness, depressogenic medications, and comorbid alcohol or other substance use. The patient’s past psychiatric history, psychiatric hospitalizations, and past medication trials should be ascertained. Any family history of depression, other psychiatric disorders, substance use disorders, and suicide attempts should be documented. A full mental status exam including cognitive assessment should be completed [21,26].
Cognitive Assessment
Cognitive impairment can be associated with LLD and may be due to the underlying depression or represent a comorbid neurocognitive disorder. Furthermore, the burden of medical illness as well as cerebrovascular and cardiovascular risk factors have been linked to executive dysfunction and reduced processing speed in individuals with LDD [27,28]. Distinguishing between these can be challenging; however, chronology of symptom onset is often helpful. Depression is more likely the etiology of cognitive impairment when depressive symptoms precede onset of cognitive deficits. This type of cognitive impairment is termed dementia syndrome of depression and may improve with treatment of depression [5]. Some patients may progress to develop major cognitive decline, and it remains unclear whether LLD represents a risk factor or prodrome to developing a major neurocognitive disorder [29]. On the other hand, if depression develops later in the course of cognitive decline, there may be an underlying neurocognitive disorder [17]. Up to 20% of individuals with major neurocognitive disorder due to Alzheimer’s disease also have major depression [11]. For these reasons, concomitant assessment of cognition is essential to the evaluation of the older adult presenting with depressive symptoms [30]. Cognitive domains that may be affected include learning and memory, language, attention, perceptual motor abilities, social cognition, and executive function [4]. Many of these domains can be assessed during the mental status examination, with brief cognitive screening tools, or with formal neuropsychological testing.
While there are numerous cognitive screening tools, some commonly used, brief tools include the Mini-Cog, the Folstein Mini-Mental State Exam (MMSE), and the Montreal Cognitive Assessment (MoCA). The Mini-Cog consists of a 3-item registration, delayed recall, and clock drawing test and has several advantages over other screening tools. It is a brief test (taking approximately 3 minutes to administer) with good sensitivity and specificity of 80% or greater. Compared with other cognitive screening tools, it is less influenced by level of education, language, or cultural background [31–33]. The MMSE is a longer screening tool consisting of 19 items and requires about 10 minutes to administer. Unlike the Mini-Cog, performance on the MMSE can be affected by level of education and cultural background. However, the MMSE can be administered serially to monitor changes in cognition over time [34,35]. The MoCA is a 10-minute cognitive screening tool first developed to detect mild cognitive impairment (MCI) [36]. The MoCA consists of 7 subscore sections covering visuospatial/executive function, naming, memory (delayed recall), attention, language, abstraction, and orientation. The total score is 30, and 1 point is added to the score if the testing subject has less than high school/12 years of education. The MoCA has demonstrated better sensitivity than the MMSE for the detection of MCI [36]. Elderly patients with depression often perform poorly on these cognitive screening tests due to apathy and poor effort.
Functional Assessment
The diagnosis of LLD requires that symptoms cause significant distress or interfere with functioning. A functional assessment is especially important in the evaluation of the older adult in that it allows clinicians to determine an individual’s ability to live independently and attend to daily needs. Basic activities of daily living (ADLs) include bathing, dressing, grooming, toileting, and self-transferring. Instrumental activities of daily living (IADLs) include more complex daily activities such as preparing meals, administering medications, driving, managing finances, and using simple electronics such as the telephone or remote control [26]. Impairment in IADLs is associated with increased depression severity. Conversely, the severity of depressive symptoms along with associated cognitive impairment predicts IADL impairment [37]. The Philadelphia Multilevel Assessment Instrument is a tool that can aid in the assessment of ADLs and IADLs and has been utilized in studies examining disability in depressed elderly patients [37,38]. Other available scales to quantify functional status include OARS Physical Activities of Daily Living, OARS Instrumental Activities of Daily Living Scale, and Direct Assessment of Functional Status Scale [26].
Suicide Assessment
Assessment for suicidality is an integral part of all psychiatric evaluations and is especially important in the evaluation of the depressed older adult. According to the Centers for Disease Control and Prevention, the suicide rate for individuals age 65 and older is 16.6 per 100,000, a figure that is comparable to that for individuals 18–64 years of age [39]. Non-Hispanic Caucasian males age 85 and older have the highest rate of completed suicide (56.5 per 100,000), underscoring the importance of a thorough suicide assessment [39]. Suicidality can range from passive thoughts of death and wishing that one were not alive, to active thoughts of self-harm with plan and intent. A Canadian study found 2% of community-dwelling adults age 55 and older had suicidal thoughts over a 12-month period and, of these, 28% had major depression [40]. A suicide assessment begins with inquiring about the presence of suicidal thoughts, plans, and intent. The 3 most frequently used methods of completed suicide in the elderly are firearms (28%), hanging (24%) and poisoning (21%) [41]. Access to weapons or other lethal means of self-harm such has hoarding of medications should be ascertained.
A complete suicide assessment requires attention to suicide risk factors, protective factors, and warning signs of impending suicide. Risk factors for suicide in the older adult include mood disorders, chronic medical illnesses and associated functional impairment, chronic pain, and psychosocial factors such as social isolation [42]. Mood disorders are present in 54% to 87% of cases of completed suicide, with major depression being the most common [42]. Chronic medical illness and pain can result in functional impairment leading to feelings of excessive guilt or being a burden to loved ones. Protective factors such as social connectedness, spirituality, religious beliefs, and cultural attitudes against suicide may serve as buffers against these risk factors [43]. Warning signs of impending suicide may indicate preparations for suicide and include feelings of hopelessness or lack of purpose, feeling trapped, talking about death, threatening suicide, agitation, social withdrawal, increased substance use and reckless behavior. Warning signs should prompt action to ensure the safety of the individual [44,45].
Physical Examination, Laboratory Studies, and Neuroimaging
Evaluation of LLD is not complete without a physical examination and ancillary studies to identify underlying medical conditions possibly contributing to or mimicking depressive symptoms. Routine laboratory studies include complete blood count, complete metabolic panel, thyroid studies, and urine drug screen. Signs and symptoms of underlying medical conditions may necessitate further laboratory studies [46]. Neuroimaging may reveal signs of cerebrovascular disease which can predispose, precipitate, or perpetuate depression in older adults [47].
Treatment
Treatment of LLD can take many forms and occur in various settings. Geriatric psychiatrists have expertise in the assessment and treatment of mental illness in the elderly. Workforce estimates for 2010 revealed 1 geriatric psychiatrist per 10,000 adults age 75 and over. This figure is estimated to decrease to 0.5 per 10,000 by the year 2030, underscoring the importance of increasing the knowledge base of clinicians across specialties who provide care to the depressed elderly [48]. The primary care setting is often the locus of care for depression in older adults; however, studies suggest that patients are often left untreated or undertreated [49]. Collaborative care models whereby mental health care is integrated into primary care have been shown to improve outcomes. The Prevention of Suicide in Primary Care Elderly: Collaborative Trial (PROSPECT) study found that use of care managers to assist primary care providers in identification of depression, offer algorithm-based treatment recommendations, monitor symptoms and medication side effects, and provide follow-up yielded improvement in outcomes. Patients in the intervention group were more likely to receive pharmacotherapy or psychotherapy, achieve remission, and showed greater decline in suicidal ideation [50]. Similar results were found in the Improving Mood-Promoting Access to Collaborative Treatment (IMPACT) study in which intervention patients treated under a collaborative care model showed lower depression severity, less functional impairment, and greater reduction in depressive symptoms [25].
Just as a collaborative care model can lead to improved outcomes, the overall strategy of treating depression must be multifaceted. The biopsychosocial model of disease first described in the 1970s emphasizes biological and psychosocial determinants of illness that must be addressed when treatment is considered [51]. This includes nonmodifiable biological factors such as age, gender, and genetic predisposition that may affect treatment options, as well as modifiable biological factors such as comorbid medical illness, medications, or substance use disorders. Psychological factors that can affect depressive symptoms include coping skills and defense mechanisms in the face of stressful life events. Social factors including the role of culture, environment, and family dynamics in disease presentation must be considered as well [52].
Pharmacologic Treatment of LLD
The primary pharmacologic treatment for depression is antidepressants. Treatment consists of 3 phases—acute, continuation, and maintenance. In the acute phase, the goal is remission of current symptoms and restoration of function. The continuation phase, extending up to 6 months after remission, aims to prevent relapse back into a depressive episode. Maintenance therapy is geared at preventing recurrence of future depressive episodes [53]. Studies have found a 50% risk of relapse after 1 episode of depression and 80% after 2 episodes. Up to 20% will develop chronic symptoms. For this reason, maintenance therapy is often necessary for recurrent depression [54].
While cognitive impairment may affect antidepressant efficacy, age does not appear to be a determinant. Gildengers et al examined antidepressant response in young, middle, and older-old patients and found no significant difference in response rates [59]. Early onset versus late onset of first depressive episode also does not predict antidepressant response in patients age 55 and over [60]. There is scant evidence for efficacy of antidepressants in depressed patients with neurocognitive disorders. A 2002 Cochrane review with 4 studies in the meta-analysis (n = 137) concluded that there was weak support for antidepressant efficacy in this population [61]. A 2011 meta-analysis with 330 participants also yielded inconclusive results [62]. The paucity of evidence for antidepressant efficacy in depressed patients with neurocognitive disorders should prompt careful consideration of potential benefits versus adverse effects.
Antidepressants are generally well tolerated in older adults. Side effects vary by medication and contribute to discontinuation in up to 25% of new users (versus 22% for new users who discontinue for reasons other than side effects) [63]. Potential adverse effects shared by most SSRIs and SNRIs include GI disturbance (nausea, diarrhea or constipation), sexual dysfunction, headache, and sleep disturbance [64,65]. In addition, abrupt discontinuation can precipitate serotonin withdrawal syndrome characterized by sensory disturbance (paresthesia, tremor, and irritability) as well as headache, lightheadedness, diaphoresis, insomnia, and agitation. Other medication-specific side effects include risk of seizure with bupropion and sedation with mirtazapine [65].
Despite superiority of antidepressants to placebo in treating depression, up to one-third of patients may not respond to a trial of antidepressants. Sequential treatment protocols such as switching to a different antidepressant or augmentation can increase the proportion of antidepressant responders [66–68]. Studies have found particularly favorable response to augmentation with lithium, with one study achieving a 33% remission rate in treatment- resistant geriatric depression [67,69]. Other pharmacologic augmentation strategies include the addition of mood stabilizers such as lamotrigine, antipsychotics (aripiprazole, olanzapine, quetiapine, and risperidone), and psychostimulants [70–73]. Electroconvulsive therapy (ECT) is a nonpharmacologic option for treatment-resistant depression that will be reviewed later.
Psychotherapeutic and Psychosocial Interventions
Psychotherapeutic interventions have demonstrated efficacy in the treatment of geriatric depression, including but not limited to cognitive behavioral therapy (CBT), interpersonal therapy (IPT), problem-solving therapy (PST), reminiscence and life review, and brief psychodynamic psychotherapy [74]. Some older adults may prefer psychotherapy to pharmacologic treatment (57% vs. 43%) [75]. Potential benefits of psychotherapy include ability to directly address psychosocial stressors that may precipitate or perpetuate depressive symptoms. In addition, psychotherapy is associated with few to no side effects and avoids drug interactions. Barriers to employing psychotherapy may include cost and access to trained psychotherapists [76]. Efficacy of several psychotherapeutic approaches in the care of older depressed adults has been examined. CBT, brief psychodynamic psychotherapy, and IPT will be briefly reviewed here.
CBT. Cognitive therapy was first described by Aaron Beck in the 1960s [77]. It is a highly structured therapy built on the premise that beliefs and assumptions an individual holds can influence emotions and behavior. CBT aims to identify maladaptive belief systems, test the validity of these cognitive distortions, and help individuals formulate more realistic cognitions [78]. Symptom improvement results from addressing these cognitive aspects as well as integration of behavioral activation and skills training to overcome maladaptive behavioral patterns [78]. CBT approaches have been applied to older adults with depression and results show acceptability [79] and efficacy in this population [80–82]. A 2008 Cochrane review (n = 153) found CBT to be superior to waitlist controls [82].
Brief psychodynamic psychotherapy. Brief psychodynamic psychotherapy, unlike highly structured CBT, aims to alter behavior by examining how past experiences and unresolved conflicts influence current emotions and behavior. While studies on application to the treatment of geriatric depression are scarce, limited data demonstrate efficacy in treating geriatric depression [81] and no significant difference in outcomes when compared to CBT [82].
IPT. Like CBT, IPT is a structured time-limited psychotherapeutic treatment approach first developed in the late 1960s by Klerman and Weissman [83]. IPT focuses on the impact of interpersonal relationships on depressive symptoms and examines 4 domains: interpersonal conflict, interpersonal deficits, role transitions, and grief [74].
Studies have shown efficacy of IPT in reducing depressive symptoms in the elderly when compared to usual care [84]. Reynolds et al found IPT combined with nortriptyline (a tricyclic antidepressant) to be superior to either nortriptyline alone or IPT alone in preventing recurrent depressive episodes [85]. Interestingly, a similar study investigating the efficacy of IPT in combination with paroxetine (an SSRI) failed to show added benefit of IPT in preventing recurrence, suggesting that further studies are needed [86].
Psychosocial interventions are integral in the care of the elderly depressed patient. Studies have shown positive benefits of aerobic exercise on depressive symptoms [87]. Yoga, Tai Chi, and other mindfulness-based exercises can increase sense of emotional and physical wellbeing [88–90]. Spirituality, religious beliefs, and involvement with a faith group may be protective against development of mental illness while at the same time provide avenues for increased social connectedness [91]. These and other avenues for socialization should be encouraged as part of the treatment plan for older depressed patients [92]
Electroconvulsive Therapy
ECT is indicated for the treatment of mood and psychotic disorders and has demonstrated efficacy in the treatment of severe depression [93]. It is typically initiated when patients fail to respond to pharmacotherapy and psychotherapy. Circumstances in which ECT can be considered first-line treatment include situations that require a rapid response (severe inanition, weight loss, or suicidality), situations where risks of ECT are lower than that of alternative treatments, previous positive response to ECT, or strong patient preference [94]. ECT is performed under general anesthesia and involves the induction of a generalized tonic-clonic seizure, which is theorized to enhance serotonergic, noradrenergic, and dopaminergic neurotransmission. A typical course of ECT involves treatments 3 times a week for an average of 6 to 12 treatments in total [95]. Elderly patients and those suffering from severe depression with psychotic features respond more robustly to ECT [93,96]. Estimated remission rates after an ECT series have been higher than 80% [93], making this modality the most effective treatment for severe depression to date.
Conclusion
As the population continues to age, clinicians are increasingly likely to encounter patients with late-life depression. A thorough evaluation includes not only assessment of depressive symptoms, but also cognitive, functional, and suicide assessment. Treatment options include pharmaco-therapy, psychotherapy, and in some cases electroconvulsive therapy. Utilization of assessment and treatment nuances unique to the geriatric population, with a multidisciplinary and collaborative approach involving primary care, mental health, and other ancillary providers, will serve to ultimately enhance patient care.
Corresponding author: Corresponding author: Juliet Glover, MD, Dept. of Neuropsychiatry and Behavioral Science, Univ. of South Carolina School of Medicine, 15 Medical Park, Suite 301, Columbia, SC 29203, [email protected].
Financial disclosures: None reported.
Author contributions: conception and design, JAG, SS; drafting of article, JAG, SS; critical revision of the article, JAG, SS.
1. Vincent GK, Velkoff VA. The next four decades: the older population in the United States: 2010 to 2050. US Census Bureau: May 2010.
2. Koenig HG, Blazer DG. Epidemiology of geriatric affective disorders. Clinc Geriatr Med 1992; 8:235–51.
3. Ferrari AJ, Charlson FJ, Norman RE, et al. Burden of depressive disorders by country, sex, age, and year: findings from the global gurden of disease study 2010. PLoS Med 2013;10:e1001547.
4 .American Psychiatric Association. Diagnostic and statistical manual of mental disorders. 5th ed. Arlington, VA: American Psychiatric Publishing; 2013.
5 .Ellison JM, Kyomen HH, Harper DG. Depression in later life: an overview with treatment recommendations. Psychiatr Clin North Am 2012;35:203–29.
6. Hasin DS, Goodwin RD, Stinson FS, Grant BF. Epidemiology of major depressive disorder: results from the National Epidemiologic Survey on Alcoholism and Related Conditions. Arch Gen Psychiatry 2005;62:1097–106.
7. Steffens DC, Skoog I, Norton MC, et al. Prevalence of depression and its treatment in an elderly population: the Cache County study. Arch Gen Psychiatry 2000;57:601–7.
8. Kessler RC, Berglund P, Demler O, et al. The epidemiology of major depressive disorder: results from the National Comorbidity Survey Replication (NCS-R). JAMA 2003;289:3095–105.
9. McKinney BC, Sibille E. The age-by-disease interaction hypothesis of late-life depression. Am J Geriatr Psychiatry 2013;21:418–32.
10. Djernes JK. Prevalence and predictors of depression in populations of elderly: a review. Acta Psychiatr Scand 2006;113:372–87.
11. Blazer DG. Depression in late life: review and commentary. J Gerontol A Biol Sci Med Sci 2003;58:249–65.
12. Cole MG, Dendukuri N. Risk factors for depression among elderly community subjects: a systematic review and meta-analysis. Am J Psychiatry 2003;160:1147–56.
13. Ritchie K. Late-life depression. European Psychiatry 2014;29:577.
14. Hegeman JM, de Waal MW, Comijs HC, et al. Depression in later life: a more somatic presentation? J Affect Disord 2015;170:196–202.
15. Lackamp J, Schlachet R, Sajatovic M. Assessment and management of major depressive disorder in older adults. Psychiatria Danubina 2016;28(Suppl 1):95–98.
16. Morichi V, Dell’Aquila G, Trotta F, et al. Diagnosing and treating depression in older and oldest old. Curr Pharm Des 2015;21:1690–8.
17. Fiske AJ, Wetherell JL, Gatz M. Depression in older adults. Annu Rev Clin Psychol 2009;5:363–89.
18. Balsis S, Cully JA. Comparing depression diagnostic symptoms across younger and older adults. Aging Ment Health 2008;12:800–6.
19. Hegeman JM, Kok RM, van der Mast RC, Giltay EJ. Phenomenology of depression in older compared with younger adults: meta-analysis. Br J Psychiatry 2012;200:275–81.
20. Mitchell AJ, Bird V, Rizzo M, Meader N. Which version of the geriatric depression scale is most useful in medical settings and nursing homes? Diagnostic validity meta-analysis. Am J Geriatr Psychiatry 2010;18:1066–77.
21. Blazer DG. The psychiatric interview of older adults. In: Blazer D, Steffens D, Busse E, editors. Textbook of geriatric psychiatry. 3rd ed. Arlington, VA: American Psychiatric Publishing; 2004.
22. Spitzer RL, Kroenke K, Williams JW. Validation and utility of a self-report version of PRIME-MD: the PHQ primary care study. Primary Care Evaluation of Mental Disorders. Patient Health Questionnaire. JAMA 1999;282:1737–44.
23. Richardson TM, He H, Podgorski C, et al. Screening for depression in aging services clients. Am J Geriatr Psychiatry 2010;18:1116–23.
24. Archer J, Bower P, Gilbody S, et al. Collaborative care for depression and anxiety problems. Cochrane Database Syst Rev 2012 Oct 17.
25. Unutzer J, Katon W, Callahan CM, et al. Collaborative care management of late-life depression in the primary care setting a randomized controlled trial. JAMA 2002;288:2836–45.
26. Silver I, Herrmann N. Comprehensive psychiatric evaluation. In: Sadavoy J, Jarvik L, Grossberg G, Meyers B, editors. Comprehensive textbook of geriatric psychiatry. 3rd ed. New York: W.W. Norton; 2004.
27. Rapp MA, Dahlman K, Sano M, et al. Neuropsychological differences between late-onset and recurrent geriatric major depression. Am J Psychiatry 2005;162:691–8.
28. Sheline YI, Barch DM, Garcia K, et al. Cognitive function in late life depression: relationships to depression severity, cerebrovascular risk factors and processing speed. Biol Psychiatry 2006; 60:58–65.
29. Barnes DE, Yaffe K, Byers AL, et al. Midlife vs late-life depressive symptoms and risk of dementia: differential effects for Alzheimer disease and vascular dementia. Arch Gen Psychiatry 2012;69:493–8.
30. Morimoto SS, Kanellopoulos D, Manning KJ, Alexopoulos GS. Diagnosis and treatment of depression and cognitive impairment in late life. Ann NY Acad Sci 2015;1345:36–46.
31. Borson S, Scanlan J, Brush M, et al. The mini-cog: a cognitive ‘vital signs’ measure for dementia screening in multi-lingual elderly. Int J Geriatr Psychiatry 2000;15:1021–7.
32. Brodaty H, Low LF, Gibson L, Burns K. What is the best dementia screening instrument for general practitioners to use? Am J Geriatr Psychiatry 2006;14:391–400.
33. Ismail Z, Rajji TK, Shulman KI. Brief cognitive screening instruments: an update. Int J Geriatr Psychiatry 2010;25:111–20.
34. Folstein MF, Folstein SE, McHugh PR. “Mini-mental state”. A practical method for grading the cognitive state of patients for the clinician. J Psychiatr Res 1975;12:189–98.
35. Vertesi A, Lever JA, Molloy DW, et al. Standardized Mini-Mental State Examination. Use and interpretation. Can Fam Physician 2001;47: 2018–23.
36. Nasreddine ZS, Phillips NA, Bédirian V, et al. The Montreal Cognitive Assessment, MoCA: a brief screening tool for mild cognitive impairment. J Am Geriatr Soc 2005;53:695–9.
37. Kiosses DN, Alexopoulos GS. IADL functions, cognitive deficits, and severity of depression: a preliminary study. Am J Geriatr Psychiatry 2005;13:244–9.
38. Alexopoulos GS, Vrontou C, Kakuma T, et al. Disability in geriatric depression. Am J Psychiatry 1996;153:877–85.
39. Centers for Disease Control and Prevention. National Center for Injury Prevention and Control. Web-Based Injury Statistics Query and Reporting System (WISQARS). Accessed 9 Feb 2016 at http://webappa.cdc.gov/sasweb/ncipc/dataRestriction_inj.html.
40. Corna LM, Cairney J, Streiner DL. Suicide ideation in older adults: relationship to mental health problems and service use. Gerontologist 2010;50:785–97.
41. Juurlink DN, Herrmann N, Szalai JP, et al. Medical illness and the risk of suicide in the elderly. Arch Intern Med 2004;164:1179–84.
42. Van Orden K, Conwell Y. Suicides in late life. Curr Psychiatry Rep 2011;13:234–41.
43. Conwell Y, Van Orden K, Caine ED. Suicide in older adults. Psychiatr Clin North Am 2011;34:451–68, ix.
44. Rudd MD, Berman AL, Joiner TE, et al. Warning signs for suicide: theory, research, and clinical applications. Suicide Life Threat Behav 2006;36:255–62.
45. Know the warning signs of suicide. American Association of Suicidology. Accessed 9 Feb 2016 at www.suicidology.org/resources/warning-signs.
46. Taylor W, Doraiswamy P. Use of the laboratory in the diagnostic workup of older adults. In: Blazer D, Steffen D, Busse E, editors. Textbook of geriatric psychiatry. 3rd ed. Arlington, VA: American Psychiatric Publishing; 2004.
47. Alexopoulos GS, Meyers BS, Young RC, et al. ‘Vascular depression’ hypothesis. Arch Gen Psychiatry 1997;54:915–22.
48. ADGAP Status of Geriatrics Workforce Study. Accessed 26 Dec 2016 at www.americangeriatrics.org/files/documents/gwps/Table%201_29.pdf.
49. Alexopoulos G. Late-life mood disorders. In: Sadavoy J, Jarvik L, Grossberg G, Meyers B, editors. Comprehensive textbook of geriatric psychiatry. 3rd ed. New York: W.W. Norton; 2004.
50. Alexopoulos GS, Reynolds CF, Bruce ML, et al. Reducing suicidal ideation and depression in older primary care patients: 24-month outcomes of the PROSPECT study. Am J Psychiatry 2009;166:882–90.
51. Engel GL. The need for a new medical model: a challenge for biomedicine. Science 1977;196:129–36.
52. Schotte CKW, Van den Bossche B, Doncker DD, et al. A biopsychosocial model as a guide for psychoeducation and treatment of depression. Depression Anxiety 2006;23:312–24.
53. Kupfer DJ, Frank E. The interaction of drug-and psychotherapy in the long-term treatment of depression. J Affect Disord 2001;62:131–7.
54. Katon W, Rutter C, Ludman EJ, et al. A randomized trial of relpase prevention of depression in primary care. Arch Gen Psychiatry 2001;58:241–7.
55. Kok RM, Nolen WA, Heeren TJ. Efficacy of treatment in older depressed patients: a systematic review and meta-analysis of double-blind randomized controlled trials with antidepressants. J Affect Disord 2012;141:103–15.
56. Hamilton M. A rating scale for depression. J Neurol Neurosurg Psychiatry 1960;23:56–62.
57. Montgomery SA, Asberg M. A new depression scale designed to be sensitive to change. Br J Psychiatry 1979;134:382–9.
58. Mukai Y, Tampi RR. Treatment of depression in the elderly: a review of the recent literature on the efficacy of single- versus dual-action antidepressants. Clin Ther 2009;31:945–61.
59. Gildengers AG, Houck PR, Mulsant BH, et al. Course and rate of antidepressant response in the very old. J Affect Disord 2002;69:177–84.
60. Kozel FA, Trivedi MH, Wisniewski SR, et al. Treatment outcomes for older depressed patients with earlier versus late onset of first depressive episode. Am J Geriatr Psychiatry 2008;16:58–64.
61. Bains J, Birks J, Dening T. Antidepressants for treating depression in dementia. Cochrane Databse Syst Rev 2002;(4):CD003944.
62. Nelson JC, Devanand DP. A systematic review and meta-analysis of placebo-controlled antidepressant studies in people with depression and dementia. J Am Geriatr Soc 2011;59:577–85.
63. Mark TL, Joish VN, Hay JW, et al. Antidepressant use in geriatric populations: the burden of side effects and interactions and their impact on adherence and costs. Am J Geriatr Psychiatry 2011;19:211–21.
64. Frank C. Pharmacologic treatment of depression in the elderly. Can Fam Physician 2014;60:121–6.
65. Kennedy GJ, Marcus P. Use of antidepressants in older patients with co-morbid medical conditions: guidance from studies of depression in somatic illness. Drugs Aging 2005;22:273–87.
66. Sackheim HA, Kupfer DJ, Luther J, Fava M. Acute and longer-tern outcomes in depressed outpatients requiring one or several treatment steps: a STAR*D report. Am J Psychiatry 2006;163:1905–17.
67. Kok RM, Nolen WA, Hereen TJ. Outcome of late-life depression after 3 years of sequential treatment. Acta Psychiatr Scand 2009;119:274–81.
68. Whyte EM, Basinski J, Farhi P, et al. Geriatric depression treatment in nonresponders to selective serotonin reuptake inhibitors. J Clin Psychiatry 2004;65:1634–41.
69. Kok RM, Vink D, Hereen TJ, Nolen WA. Lithium augmentation compared with phenelzine in treatment-resistant depression in the elderly; an open, randomized, controlled trial. J Clin Psychiatry 2006;68:1177–85.
70. Kok RM. What is the role of medications in late life depression? Psychiatr Clin North Am 2003;36:597–605.
71. Wen XJ, Wang LM, Liu ZL,. Meta-analysis on the efficacy and tolerability of the augmentation of antidepressants with atypical antipsychotics in patients with major depressive disorder. Braz J Med Biol Res 2014;47:605–16.
72. Lenze EJ, Mulsant BH, Blumberger DM, et al. Efficacy, safety, and tolerability of augmentation pharmacotherapy with aripiprazole for treatment-resistant depression in late life: a randomised double-blind, placebo-controlled trial. Lancet 2015;386:2404–12.
73. Alexopoulos GS, Canuso CM, Gharabawi GM, et al. Placebo-controlled study of relapse prevention with risperidone augmentation in older patients with resistant depression. Am J Geriatr Psychiatry 2008;16:21–30.
74. Francis JL, Kumar A. Psychological treatment of late-life depression. Psychiatr Clin North Am 2013;36:561–75.
75. Gum AM, Arean PA, Hunkeler E, et al. Depression treatment preferences in older primary care patients. Gerontologist 2006;46:14–22.
76. Pinquart M, Duberstein PR, Lyness JM. Treatments for late-life depressive conditions: a meta-analytic comparison of pharmacotherapy and psychotherapy. Am J Psychiatry 2006;163:1493–501.
77. Beck Institute for Cognitive Behavior Therapy. Accessed 28 Dec 2016 at www.beckinstitute.org
78. Beck AT. Cognitive therapy: nature and relation to behavior therapy. Behav Ther 1970;1:184–200.
79. Landrevile P, Landry J, Baillargeon L, et al. Older adults’ acceptance of psychological and pharmacological treatments for depression. J Gerontology B Psychol Sci Soc Sci 2001;56:P285–91.
80. Thompson LW, Gallagher D, Breckenridge JS. Comparitive effectiveness of psychotherapies for depressed elders. J Consult Clin Psychol 1987;55:385–90.
81. Gallagher-Thompson D, Steffen AM. Comparative effects of cognitive-behavioral and brief psychodynamic psychotherapies for depressed family caregivers. J Consult Clin Psychol 1994;62:543–9.
82. Wilson KC, Mottram PG, Vassilas C. Psychotherapeutic treatments for older depressed people. Cochrane Database Syst Rev 2008;(1):CD004853
83. Markowitz JC, Weissman MM. Interpersonal psychotherapy: past, present and future. Clin Psychol Psychother 2012;19:99–105.
84. Van Schaik A, van Marwijk H, Ader H, et al. Interpersonal psychotherapy for elderly patients in primary care. Am J Geriatr Psychiatry 2006;14:777–86.
85. Reynolds CF 3rd, Frank E, Perel JM, et al. Nortriptyline and interpersonal psychotherapy as maintenance therapies for recurrent major depression: a randomized controlled trial in patients older than 59 years. JAMA 1999;281:39–45.
86. Reynolds CF 3rd, Dew MA, Pollock BG, et al. Maintenance treatment of major depression in old age. N Engl J Med 2006;354:1130–8.
87. Blumenthal JA, Babyak MA, Moore KA, et al. Effects of exercise training on older patients with major depression. Arch Intern Med 1999;159:2349–56.
88. Krishnamurthy MN, Telles S. Assessing depression following two ancient Indian interventions: effects of yoga and ayurveda on older adults in a residential home. J Gerontol Nurs 2007;33:17–23.
89. Wang C, Bannuru R, Ramel J, et al. Tai Chi on psychological well-being: systematic review and meta-analysis. BMC Complement Altern Med 2010;10:23.
90. Cho KL. Effect of tai chi on depressive symptoms amongst Chinese older patients with depressive disorders: a randomized clinical trial. Med Sport Sci 2008;52:146–54.
91. Moritz S, Quan H, Rickhi B, et al. A home study-based spirituality education program decreases emotional distress and increases quality of life- a randomized, controlled trial. Altern Ther Health Med 2006;12:26–35.
92. Nyer M, Doorley J, Durham K, et al. What is the role of alternative treatments in late-life depression? Psychiatr Clin North Am 2013;36:577–96.
93. Petrides G, Fink M, Husain MM, et al. ECT remission rates in psychotic versus nonpsychotic depressed patients: a report from CORE. J ECT 2001;17:244–53.
94. Mankad MV, Beyer JL, Weiner RD, Krystal AD. Clinical manual of electroconvulsive therapy. American Psychiatric Publishing; 2010.
95. Kellner CH, Greenberg RM, Murrough JW, et al. ECT in treatment-resistant depression. Am J Psychiatry 2012;169:1238–44.
96. Flint AJ, Gagnon N. Effective use of electroconvulsive therapy in late-life depression. Can J Psychiatry 2002;47:734–41.
Communicating with Families About HPV Vaccines
From the University of Colorado Denver, Aurora, CO.
Abstract
- Objective: To provide evidence-based guidance on strategies that are likely or unlikely to be successful in navigating HPV vaccine conversations with patients and parents.
- Methods: Nonsystematic review of the literature.
- Results: This review highlights some of the most recent innovations in provider HPV vaccine communication and describes provider communication strategies that have been found to improve adolescent vaccination rates in rigorous scientific studies. Promising strategies for which additional research is needed and strategies that probably do not work are also described.
- Conclusion: By understanding what works, what may work, and what not to do when it comes to communicating with families about HPV vaccines, providers can be better prepared for maximizing the impact they can have on adolescent HPV vaccination rates.
Key words: human papillomavirus; vaccine hesitancy; health communication; parents; immunization.
In the United States, more than 14 million people newly acquire genital human papillomavirus (HPV) annually, and 75 million Americans are infected at any given time [1]. As the most common sexually transmitted disease, more than 80% of sexually active U.S. adults are estimated to be infected with HPV by the age of 50 [1,2]. Although the majority of infections are “silent” and resolve without clinical sequelae, a proportion of infected individuals will go on to develop HPV-related diseases. In women, these include cervical cancer and pre-cancer (ie, abnormal Pap smears); cancers of the vagina, vulva, anus, and oropharynx; and genital warts [3]. Males also bear a high burden of HPV-related disease in the form of penile, anal, and oropharyngeal cancers, as well as genital warts [3]. While once thought of as primarily a “woman’s disease” [4], recent research demonstrates men are also significantly impacted by HPV—particularly in the form of oropharyngeal cancers, which are 2 to 3 times more common in men than in women [5]. In fact, it is estimated by the year 2020 more men will die of HPV-related oropharyngeal cancer than women will die of cervical cancer [6,7]. The combined cost of HPV-associated cancers and other conditions is estimated to be $8 billion per year in the United States [8–11].
HPV Vaccines
Effective HPV vaccines have been available for females aged 9 to 26 years since 2006 (bivalent and quadrivalent vaccines) and for males aged 9 to 26 since 2010 (quadrivalent vaccine only) [12]. These vaccines have been shown in clinical trials to be highly efficacious in preventing HPV infection, cervical pre-cancer, and anal, vaginal, penile, and vulvar cancers caused by the HPV types covered in the vaccine [2]. Although their effectiveness against head and neck cancer has not been studied in clinical trials, most experts believe that these vaccines will also provide protection against at least a proportion of these cancers [13,14]. In 2015 the U.S. Food and Drug Administration approved licensure of a 9-valent HPV vaccine that will soon replace the quadrivalent vaccine in the U.S. market [15]. The 9-valent vaccine is licensed for both males and females aged 9 to 26 and is expected to prevent an even higher proportion of HPV-related cancers than earlier HPV vaccines due to the protection against 5 additional oncogenic HPV types [15].
Despite the potential of HPV vaccines to drastically reduce the incidence of HPV-related cancers and other diseases, these vaccines are not being as widely used in the United States as was hoped. The most recent national data from 2015 demonstrates that only 41.9% of girls and 28.1% of boys have received all 3 doses recommended in the HPV vaccine series [16]. This level of vaccine utilization is significantly lower than the Healthy People 2020 goal of 80% coverage [17], and also significantly lower than that of other developed countries such as Australia and the United Kingdom, which have achieved vaccination levels of ~70% among their target adolescent populations [18,19]. In the future, these low vaccination levels will likely be mitigated somewhat by the recent approval from the FDA and recent recommendation from the Advisory Committee on Immunization Practices (ACIP) for only 2 doses of the 9-valent HPV vaccine (spaced 6 to 12 months apart) for adolescents less than 15 years of age [20,21]. Three doses are still recommended for those aged 15 to 26 years.
Provider Communication About HPV Vaccines
How providers communicate with parents and patients about HPV vaccines is a key influential factor driving current U.S. adolescent HPV vaccination levels [22,23]. Numerous studies demonstrate that a provider’s recommendation generally has the largest impact on whether or not an adolescent receives the vaccine, even above that of parent factors such as attitudes and beliefs about the vaccine and patient characteristics such as age and insurance status [23–31]. Moreover, parents consistently cite their adolescent’s provider as one of the most trusted and impactful resources for obtaining vaccine information [22,32].
Unfortunately, research also shows that providers often fail to adequately recommend the HPV vaccine for their patients, especially for 11 to 12 year olds for whom the vaccine is preferentially recommended [33,34]. For example, in a national study of parents done in 2013, not being recommended by a provider was one of the top 5 reasons parents of males and of females aged 11 to 17 gave for not getting their adolescent vaccinated against HPV [35]. Supporting this also is a 2014 study of 776 pediatricians and family medicine providers nationally, in which Gilkey and colleagues found that more than 1 out of 4 providers did not highly endorse the HPV vaccine for 11 to 12 year olds despite this having been the recommended practice from ACIP for the prior 8 years for girls and 4 years for boys. This is in comparison to the other adolescents vaccines that were reported in the same study as being endorsed highly by these providers > 95% of the time [36].
Recognizing that providers’ HPV vaccine recommendations are often suboptimal, researchers have begun to define what components comprise “high-quality” HPV vaccine recommendations. This has been operationalized by one research group as (1) timeliness—routinely recommending the vaccine starting when the patient is ≤ 12 years; (2) consistency—recommending the vaccine for all eligible adolescents as opposed to an approach based on providers’ perception of their patients’ risk for HPV infection; (3) urgency—recommending that the vaccine be given on the same day the vaccine is being discussed, rather than offering the option of getting it at a future visit; and (4) strength—using language that clearly conveys that the provider believes the vaccine is very important for the adolescent to receive. A national study of primary care providers done in 2014 examined how frequently these quality components were implemented [37]. The results were startling and discouraging. Nearly half of providers (49%) reported they usually recommended that 11 to 12 year olds get the vaccine at a later visit, 41% used a risk-based approach for deciding when to recommend the vaccine, 27% did not tell the parents the vaccine was “very or extremely important,” and a large proportion did not start routinely recommending the vaccine before the age of 13 (39% for male patients and 25% for females) [37].
Much research has now accumulated to explain the underlying reasons why providers may not give consistent and high-quality HPV vaccine recommendations to all eligible adolescents [22]. Issues such as providers’ own knowledge about HPV-related diseases, personal beliefs about the vaccine’s safety and necessity, concern that a discussion about the vaccine will necessitate a discussion about adolescent sexuality with the parent, belief that parents will not want their child vaccinated if asked, perceptions that a provider can adequately select those patients most “in need” of HPV vaccination, and concern that raising the vaccine discussion with vaccine-hesitant parents will result in prolonged discussions have been shown to impact whether and how providers communicate about HPV vaccination during clinical visits [22,36–45]. Now that these barriers have been defined and described, there is a great need to use this knowledge to develop and evaluate interventions that help to mitigate these barriers and improve providers’ vaccine communication abilities. Such interventions are needed not only for HPV, but for all vaccines [46,47].
Possible Strategies for Helping Providers Communicate About HPV Vaccines
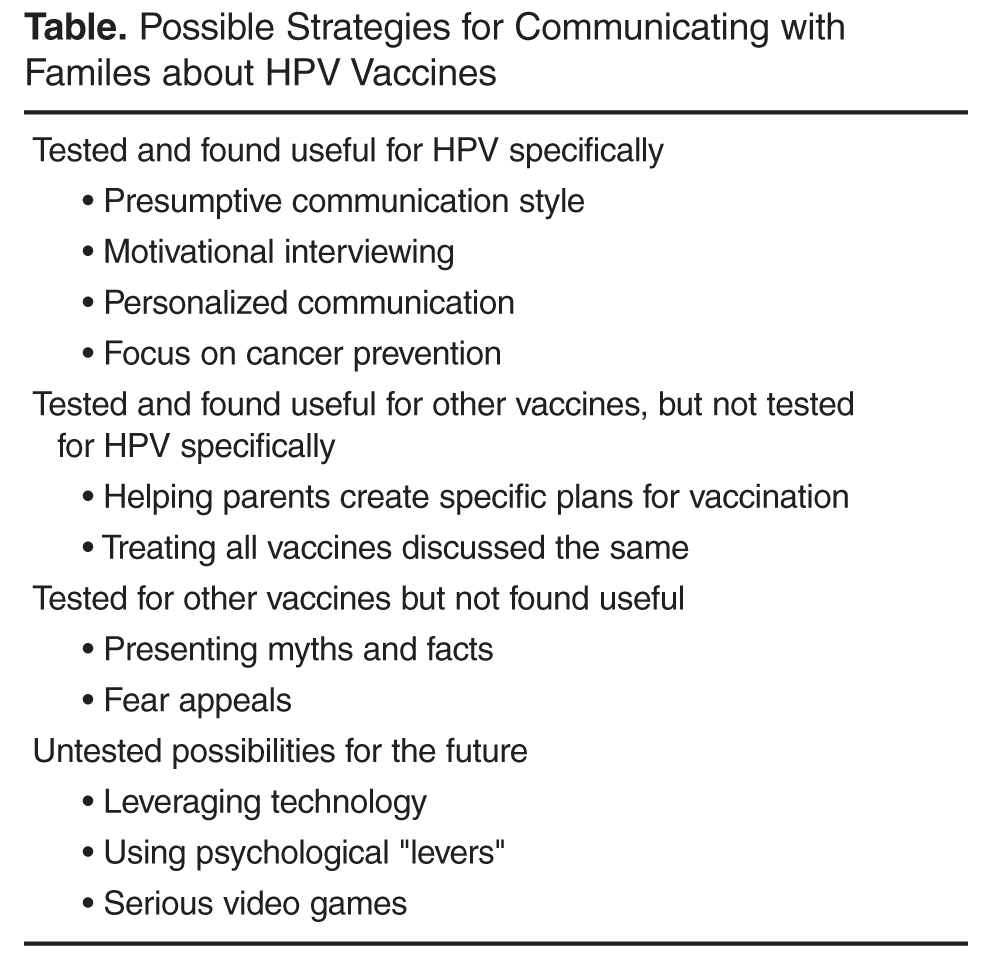
Before discussing these interventions, it is worth noting that several of the passive and active strategies have been shown in clinical trials to improve adolescent HPV vaccination rates. Although these are beyond the scope of this article, inclusion of these strategies should certainly be considered by any practice as a mechanism to increase vaccination levels, especially given that the most successful interventions to improve vaccination levels consist of multiple components [48]. Also useful is a recently described “taxonomy of vaccine communication interventions” that provides additional perspective on the scope and complexity of interventions to improve vaccine delivery [49]. There are several well-written review articles that describe interventions that focus on passive and active strategies at the practice or community level [50–52].
Interpersonal Communication Strategies Shown to Increase HPV Vaccination
Presumptive Communication
One of the first studies to examine the specific “way” in which providers communicate about vaccines focused not on HPV but rather on young childhood vaccines. In 2013 Opel and colleagues performed a study in which they taped clinical encounters between a pediatrician and a parent of a child aged 1 to 19 months [53]. Of the 111 encounters recorded, 50% of parents were classified as vaccine hesitant. Parents were aware they were being taped but not aware that the overall purpose of the study was to examine providers’ communication related to vaccination. The researchers found that providers generally used one of 2 communication styles to introduce the vaccine discussion. The first, called the “presumptive” style, assumed that parents would agree to vaccination and presented the vaccines as routine (ie, “We have to do some shots today”). The second style, called “participatory,” was more parent-oriented and used language suggesting shared decision-making (ie, “So what do you want to do about shots today?”). The study showed that the odds of resisting the provider’s vaccine recommendations were significantly higher when providers used a participatory approach than a presumptive one, suggesting that even small changes in language can have a major impact on the likelihood of vaccination. However, given the study design, causality between providers’ recommendation style and parents vaccination decisions could not be delineated.
In 2015 Moss and colleagues performed a study that examined the use of these 2 communication styles with regard to HPV vaccination [54]. This study used data from the 2010 National Immunization Survey–Teen, a national survey on childhood vaccination that includes provider verification of vaccines given [16]. Researchers categorized provider vaccine communication styles into “provider-driven,” which was similar to the presumptive style described Opel, and “patient-driven,” which was similar to Opel’s permissive style. Parents who received a more provider-driven style of HPV vaccine recommendation were far more likely to have allowed their adolescent to be vaccinated than those receiving patient-driven recommendations [54]. Further supporting this communication approach are results from a qualitative study done by Hughes and colleagues in which triads of mothers, adolescents, and providers were interviewed after a preventive care visit to assess the communication that occurred regarding HPV vaccination [39]. Providers’ communication style was categorized into 1 of 3 groups: paternalistic (clinician makes the vaccination decision and communicates this to the family); informed (patient and family gathers information from the clinician and other sources to reach a vaccination decision); and shared (medical and personal information is exchanged between the provider and family and then a decision is reached jointly). Providers who typically adopted the paternalistic approach perceived that they had the highest success in convincing parents to vaccinate—a perception that was confirmed in quantitative assessments of vaccination status among adolescents in the study sample [39]. Our own research demonstrates that learning and implementing a presumptive/paternalistic HPV vaccine recommendation style is easy for primary care providers to do and is perceived as often shortening the time taken during clinical visits to discuss the vaccine [55,56]. Thus, providers should consider opening the HPV vaccine conversation using this approach, and then turning to some of the other communication techniques described below when met with parental resistance or questions.
Motivational Interviewing
A second communication technique that seems effective for promoting HPV vaccination, especially for vaccine hesitant parents, is motivational interviewing. Motivational interviewing describes a communication technique in which the provider leverages a parents’ or patients’ intrinsic motivation to engage in a preferred health behavior [57]. Motivational interviewing was originally developed to combat substance abuse [58,59] but has subsequently been successfully applied to a number of other health issues [60–64]. There is growing interest from public health and medical providers in using this technique for increasing vaccination [39,65–68]. Our research group performed a large, cluster-randomized controlled trial of 16 pediatric and family medicine clinics to examine the impact of a provider communication “toolkit” on adolescent HPV vaccine series initiation and completion [50,69]. The toolkit consisted of motivational interviewing training for providers related to HPV vaccination and training on 3 tangible resources providers could also use with parents—an HPV fact sheet, an HPV vaccine decision aid, and an educational website. Results from the study demonstrated that motivational interviewing was the toolkit component most widely utilized by providers and was also perceived as being the most useful. More importantly, HPV vaccine series initiation levels were significantly higher among adolescents in practices receiving the toolkit than in control practices. There was no impact on HPV vaccine series completion (unpublished results). The usefulness of motivational interviewing for vaccination is further supported by a small study in which community pharmacists receiving motivational interviewing training for adult vaccination reported significantly higher patient readiness to receive vaccines following their interaction with the pharmacist than those who did not receive the training [70]. Finally, Perkins et al performed a cluster randomized controlled trial that evaluated the impact of a provider-focused intervention on adolescent HPV vaccination rates. The intervention included frequent provider support meetings, education on HPV infection and vaccination, feedback on providers’ individual HPV vaccination rates, provider incentives, and “basic motivational interviewing principles with vaccine-hesitant parents.” HPV vaccination series initiation and completion rates were significantly higher in intervention practices than controls, and this effect was sustained for at least 6 months after the active intervention period was over [67]. However, it was unknown how much the motivational interviewing contributed to these results. Based on the above information, and the long history of success of motivational interviewing for improving patient compliance with other recommended health behaviors, this technique appears to have a reasonable evidence base and should be considered for communicating with families that express resistance to HPV vaccination.
Personalized Communication
Parents’ reasons for not having their adolescent vaccinated against HPV are often complex and multifactorial [71,72]. Personalized approaches are needed to account for each parent’s unique informational needs, beliefs, and prior experiences [65]. Unfortunately, given the short amount of time allotted for clinical visits, it is often difficult to provide adequate information to parents during these encounters [73–75]. Indeed, concern about prolonged HPV vaccine discussions has been identified as an important barrier for providers that cause some to forgo recommending the vaccine [36,75].
One potential solution to this issue is to leverage technology in the form of web-based interventions that use software to tailor materials to each individual’s unique informational needs. Feasibility for this idea comes from the knowledge that many parents already use the web to research health issues related to their children [76], and that doctors’ offices are increasingly using patient portals and other web-based resources to help parents prepare for upcoming visits, especially those focused on health maintenance [77,78]. Tailored messaging interventions have been shown across populations and health issues to generally result in superior adherence with health behaviors when compared to untailored controls [79–82]. Several researchers have thus begun exploring whether such a personalized communication strategy may be similarly effective for adolescent HPV vaccination [50,83–85]. As an example, Maertens and colleagues used community-based participatory research techniques to develop a web-based tailored messaging intervention for Latinos regarding HPV vaccination [86]. A subsequent randomized controlled trial of the intervention in over 1200 parents of adolescents and young adults demonstrated that the intervention improved participants’ intentions to vaccinate compared to usual care [87], and among adolescents, higher HPV vaccine series initiation levels (unpublished data). Although additional work is needed to understand the feasibility of implementing such an intervention more broadly, additional support for the usefulness of a tailored messaging approach comes from a study of female university students that demonstrated higher HPV vaccination intentions after exposure to tailored information compared to untailored information. However, the impact on actual HPV vaccine utilization was not measured in the study [84]. Contrasting results were found in a different study of university students where researchers failed to find an impact of message tailoring on HPV vaccination utilization. However, this study was limited by a low response rate (~50%) to the follow up survey where vaccination status was assessed, and also by overall low levels of HPV vaccine initiation among the entire study sample (8%) [85]. Given the low number of studies in this area, and some conflicting data, additional research is needed to better understand the impact of personalized communication on HPV vaccination levels. However, results from these studies suggest that a modest benefit may be achieved with this approach, especially if coupled with other, evidence-based, clinic-level interventions to promote vaccination (eg, vaccine reminders, extended office hours), as is suggested by the Task Force on Community Preventive Services [48].
Focusing Communication on Cancer Prevention
HPV vaccines are unique in that they are only 1 of 2 vaccines for cancer prevention (the other being hepatitis B). Provider and parent surveys suggest that while most providers do mention cancer prevention when discussing HPV vaccines [40,88,89], this may be more commonly done with female patients than males [22]. Focusing on cancer prevention rather than sexual transmissibility is a communication technique suggested by the Centers for Disease Control and Prevention (CDC) as many parents cite this aspect of the vaccine as one of the most compelling reasons for vaccinating [45,90]. CDC’s “You are the Key” program [91] uses cancer prevention as a central theme in their physician and patient communication materials, based on significant prior market research on the acceptability and impact of such messages among parents and providers. In 2016 Malo and colleagues tested the potential impact of brief messages related to HPV vaccination, including cancer prevention messages, among a national sample of 776 medical providers and 1504 parents of adolescents [92]. In addition to their potential to motivate parents to vaccination, associations between parental endorsement of each message and their adolescent’s vaccination status were also examined. The cancer prevention messages were among those most highly endorsed by both parents and providers as being motivating for parents to get their adolescent vaccinated. More importantly, among parents these endorsements were associated with a significantly higher likelihood of the adolescent having been vaccinated against HPV. Interestingly, one of the briefest messages in the study, “I [the physician] strongly believe in the importance of this cancer preventing vaccine for [child’s name],” was perceived as the most persuasive message by parents.
Further support for the positive impact of framing HPV vaccines primarily as cancer prevention comes from another national study of 1495 parents of 11 to 17 year olds that examined 3 measures of quality of their adolescent provider’s HPV vaccine recommendation, and the relationship between recommendation quality and likelihood of adolescent HPV vaccination [40]. The 3 quality indicators assessed included providing information about cancer prevention, encouraging the vaccine “strongly,” and recommending it be given on the same day as it was being discussed. While 49% of parents reported receiving no HPV vaccine recommendation from their adolescents’ provider, of those that did, 86% received a cancer prevention message. Parents who had been given high quality recommendations that included either 2 or 3 of the quality indicator measures had over 9 times the odds of vaccine series initiation and 3 times the odds of vaccine series follow through than those who had not received any recommendation, and also significantly higher odds of vaccination than parents who had received low quality recommendations (ie, included only 1 indicator). Taken together, these results suggest that focusing discussions about HPV vaccines on their ability to prevent cancer is likely to be persuasive for some parents.
Strategies That Are Promising But Not Thoroughly Tested
Helping Parents Create Vaccination Plans
A recent commentary suggested that instead of focusing on changing beliefs or “educating” parents and patients about the need for a given vaccine, perhaps a better way to craft interventions for increasing vaccination is to focus on structuring the environment to make vaccination “easy” [93,94]. Examples of this include strategies such as extended office hours and making the vaccine available in other locations such as schools and pharmacies, both of which have been shown in some populations and settings to improve vaccine utilization [48,95]. One aspect of structuring a vaccine-conducive environment that relates to provider communication is helping parents create “implementation intentions” for future vaccination visits. In its most obvious form, this would mean providers provide office resources that facilitate making an appointment for the next dose in the HPV vaccine series during a clinic visit where the first dose was provided. But such an approach could also potentially extend to parents who are on the fence about the vaccine—to make an appointment before the parent leaves the office with an unvaccinated child to either re-discuss the vaccine in the future or to actually start the vaccine series. Support for such a strategy comes primarily from the social sciences, which suggest that implementation intentions work by increasing attention to specific cues to action, making it more likely that that the cue will be acted upon [96–98]. Creating implementation intentions has been shown to be helpful for improving adherence with a variety of health behaviors [99–105], and there is a growing evidence base related to how implementation intentions may facilitate vaccination specifically. For example Vet and colleagues performed a randomized controlled trial among 616 men who have sex with men with either strong or weak intentions to receive the hepatitis B vaccine [106]. Half of the participants were asked to create an implementation intention plan where they described when, where and how they would obtain the vaccine. Those in the control arm were not given this prompt. Regardless of whether their initial vaccination intention was weak or strong, those who had been asked to create an implementation plan had more than double the likelihood of actually getting the vaccine than participants who did not receive the implementation plan prompt. Similarly, a study of influenza vaccination rates among corporate employees found that those who were asked to write down the day and time they planned to go to employee health to get the free vaccine were somewhat more likely (4% higher) to be vaccinated than those who did not receive this prompt [107]. In addition, a study of elderly individuals found that influenza vaccination rates were significantly higher among those who had received “action instructions” on how, when and where to get the vaccine than those who did not [108]. These studies suggest that helping parents craft a definitive follow-up plan regarding vaccination could have a significant impact on vaccination rates—particularly for vaccines like HPV that require multiple doses.
Treating all Adolescent Vaccines the Same
Prior research has demonstrated that providers often communicate differently about HPV vaccines than other adolescent vaccines such as the tetanus-diphtheria-pertussis (Tdap) and meningococcal (MCV) vaccines [22,36]. Providers often tend to discuss the HPV vaccine last among these 3 vaccines, provide weaker endorsements of the vaccine, and pre-emptively give much more detail about the HPV compared to the other vaccines, even in the absence of a parent’s request for additional information [36,39,41]. The CDC and the American Academy of Pediatrics now suggest putting HPV at the beginning or middle of the list of vaccines recommended to the adolescent (ie, “HPV, Tdap and MCV”), and treating all recommended vaccines equivalently in terms of the level of detail provided to parents in the absence of a parent’s request for more information [109,110]. Through these suggestions have face validity, their specific impact on HPV vaccination rates, and on patient and provider satisfaction with the visit have yet to be evaluated.
Strategies that Probably Don’t Work
Presenting Myths and Facts
Research related to promoting other vaccines provides insight into communication activities that probably would not work well for promoting HPV vaccination. A 2012 study by Nyhan and colleagues examined the impact of 2 different messages related to influenza vaccines on participants’ beliefs about the vaccine’s safety and intentions to get vaccinated [111]. One group received information to correct the commonly held belief that influenza vaccine can cause the flu while the other received information about the risks associated with contracting an influenza infection. While the correction of myths did improve participants’ perceptions of the vaccine’s safety, information about influenza dangers did not. Neither message impacted intentions to vaccinate in the study subjects overall. However, in sub-analyses the correction of myths actually decreased intentions to vaccinate among those with high baseline levels of concern about the vaccine’s side effects—that is, among those most concerned that the flu vaccine can give someone the flu, correcting this myth actually decreased the likelihood that they would receive the vaccine. Similar findings have been reported in other studies related to vaccination [112–114], and suggest that the “threat” generated by providing information opposing a person’s beliefs may actually entrench these beliefs further as part of the threat response—a phenomenon known as attitude polarization [115]. These results also are consistent with the concept of negativity bias, which posits that negative information influences people’s risk perceptions more than positive information, and that the more strongly a risk is attempted to be negated, the lower the effectiveness and perceived trust of the information [116].
Using Fear Appeals
One tactic that has been suggested by some as a way to promote vaccination is to provide graphic depictions of the possible sequelae of vaccine-preventable diseases. The thought behind this idea is that because vaccination is so successful, most parents will have never experienced significant impacts from vaccine preventable diseases that, in the past, had been a major motivator for parents to vaccinate. Thus, in order to counter beliefs about “controversial” issues like vaccination, highly emotionally compelling and engaging information may be especially useful. This is a common tactic used by anti-vaccination groups to spread their own messages [117]. However, several studies suggested that using “fear appeals” (aka scare tactics) such as this to promote vaccination can actually have a negative effect on vaccination intentions. For example, in a 2011 study of a nationally representative sample of parents of children < 18 years, 4 different message formats were tested for their impact on parental intentions to vaccinate a future child with the measles-mumps-rubella vaccine (MMR) [113]. Message formats included correcting the misinformation that MMR causes autism, presenting information on MMR-related disease risk, providing a dramatic narrative about a child endangered by measles, and showing pictures of infants affected by these diseases. Counter to the study’s hypotheses, the dramatic narrative message actually increased parents’ perceptions that MMR vaccines had serious side effects, and the pictures increased parents’ belief that the MMR vaccine could cause autism. These counter-intuitive results are consistent with other studies that have examined the impact of message framing on adults’ vaccination intentions for HPV and influenza [108,118,119]. Taken together, fear appeals seem unlikely to sway many hesitant parents towards HPV vaccination.
Looking Into the Future
Moving forward, additional interventions to improve providers’ ability to communicate with families about HPV vaccination will undoubtedly be developed. A major area of interest in this regard is leveraging the power of technology and the internet, including using social media, mobile technologies, and online interventions to augment the provider/parent interaction that occurs during the clinical visit [50,120]. Web-based approaches have the benefit of generally being low cost and easy to disseminate to large populations. Such interventions have already been developed for a number of other health issues, some of which have proven effective [121,122]. However, use of the internet to promote healthy behaviors in general, and vaccination specifically, is still in its infancy. There is still much to be learned about how to create effective web-based tools, how to engage patients with them, and how to assess their impact on health outcomes [123].
Another interesting area for future research is identifying psychological “levers” to motivate parents’ vaccination intentions [94]. One example is focusing on using parents’ values (ie, protecting my child from harm) as an intervention target rather than beliefs or attitudes. This is because values tend to be inherent and static over time, compared to beliefs and attitudes, which are subject to change depending on the context [124]. Prior research has shown that interventions that leverage values rather than facts can be an effective way to overcome beliefs that are highly emotional or controversial, and that individuals are more likely to trust sources and individuals with shared values than those without [125], suggesting that this may be a useful way to motivate parents toward vaccinating their children. Self-affirmation is another example of a psychological lever that has a significant evidence base from the social science literature as a helpful tool for moving patients towards a desired health behavior [126,127], but it has not been extensively applied to the field of vaccination. Researchers in the field of vaccine delivery are increasingly recognizing the potential value of these unique intervention approaches [101,128–134], and it may be fruitful in the future to more closely examine the efficacy of interventions that target things like values, self-affirmation or other psychological levers to change parents’ HPV vaccination behaviors.
A final notable area for intervention research related to HPV vaccination is the use of video games. Although not likely to be used directly during patient visits, this strategy could be conceptualized as a potential way to augment the information conveyed to a parent by a provider directly during a clinical encounter. A meta-analysis from 2016 identified 16 different “serious” video games that were used to train and educate users about specific vaccine preventable diseases (usually influenza, none for HPV) and the need for vaccination [135]. In many of them, the objective of the game was to protect a virtual community from a vaccine preventable disease and/or manage outbreaks. Only 2 of the games evaluated outcomes in the short term (ie, at the time the game was being played). None have evaluated longer-term impacts such as vaccination intention or utilization. In the era of “plugged in” parents and adolescents, video games represent a unique but understudied mechanism for helping providers “communicate,” albeit indirectly, with families about the need for vaccination. Imagine providing a prescription to an HPV-vaccine hesitant family to “go play Zombie Wars HPV!” One would expect the curiosity factor alone would result in significant engagement with this intervention tool.
Conclusion
With persistently lagging HPV vaccination rates among U.S. adolescents, there is a growing need for effective interventions to improve adolescent HPV vaccine utilization. How providers communicate with families is one of the most influential factors in parents’ vaccination decisions. Emerging research is beginning to delineate potentially effective communication techniques such as presumptive approaches to making the vaccine recommendation, framing the vaccine as cancer preventing, and using motivational interviewing and personalized messaging when met with parental vaccine resistance. Moving forward the list of evidence-based interventions to improve providers’ HPV vaccine communication is likely to grow, and to increasingly leverage technology based solutions. However, given the complexities of the vaccination decision [136] and the ever growing spread of vaccine hesitancy [137], it is unlikely that a single intervention approach will be effective for getting adolescent HPV vaccine levels up to the national goal of 80% coverage. As has been recognized in the past, the most effective interventions for HPV vaccination in the future are likely to be multicomponent, including not only provider communication strategies but also clinic-, community-, and parent-level interventions [48].
Corresponding author: Amanda Dempsey, MD, PhD, MPH, 13199 East Montview Blvd, Suite 300, Aurora, CO 80045, [email protected].
Financial disclosures: None reported.
1. Centers for Disease Control and Prevention. Genital HPV infection - CDC fact sheet. 2012. Accessed 26 Jun 2012 at www.cdc.gov/std/HPV/STDFact-HPV.htm.
2. Markowitz LE, Dunne EF, Saraiya M, et al. Quadrivalent human papillomavirus vaccine: Recommendations of the Advisory Committee on Immunization Practices (ACIP). MMWR Recomm Rep 2007;56(RR-2):1–24.
3. Viens LJ, Henley SJ, Watson M, et al. Human papillomavirus-associated cancers - United States, 2008-2012. MMWR Morb Mortal Wkly Rep 2016;65:661–6.
4. Daley EM, Vamos CA, Zimet GD, et al. The feminization of HPV: Reversing gender biases in US human papillomavirus vaccine policy. Am J Public Health 2016;106:983–4.
5. Rettig EM, D’Souza G. Epidemiology of head and neck cancer. Surg Oncol Clin North Am 2015;24:379–96.
6. Louie KS, Mehanna H, Sasieni P. Trends in head and neck cancers in England from 1995 to 2011 and projections up to 2025. Oral Oncol 2015;51:341–8.
7. Mehanna H, Beech T, Nicholson T, et al. Prevalence of human papillomavirus in oropharyngeal and nonoropharyngeal head and neck cancer--systematic review and meta-analysis of trends by time and region. Head Neck 2013;35:747–55.
8. Chesson HW, Markowitz LE, Hariri S, et al. The impact and cost-effectiveness of nonavalent HPV vaccination in the United States: Estimates from a simplified transmission model. Hum Vaccin Immunother 2016;12:1363–72.
9. Insinga RP, Glass AG, Rush BB, et al. The health care costs of cervical human papillomavirus-related disease. Am J Obstet Gynecol 2004;191:114–20.
10. Chesson HW, Blandford JM, Gift TL, et al. The estimated direct medical cost of sexually transmitted diseases among American youth, 2000. Perspect Sex Reprod Health 2004;36:11–9.
11. Chesson HW, Ekwueme DU, Saraiya M, et al. Estimates of the annual direct medical costs of the prevention and treatment of disease associated with human papillomavirus in the United States. Vaccine 2012;30:6016–9.
12. Food and Drug Administration. Product approval information - licensing action, package insert: Gardasil. 2010. Accessed at www.fda.gov/downloads/BiologicsBloodVaccines/Vaccines/ApprovedProducts/UCM111263.pdf.
13. Ward G, Mehta V, Moore M. Morbidity, mortality and cost from HPV-related oropharyngeal cancer: Impact of 2-, 4- and 9-valent vaccines. Hum Vaccin Immunother 2016;12:1343–7.
14. Guo T, Eisele DW, Fakhry C. The potential impact of prophylactic human papillomavirus vaccination on oropharyngeal cancer. Cancer 2016;122:2313–23.
15. Food and Drug Administration. Product approval information - licensing action, package insert: Gardasil 9. 2014. Accessed at www.fda.gov/BiologicsBloodVaccines/Vaccines/ApprovedProducts/ucm426445.htm.
16. Reagan-Steiner S, Yankey D, Jeyarajah J, et al. National, regional, state, and selected local area vaccination coverage among adolescents aged 13-17 Years - United States, 2015. MMWR Morb Mortal Wkly Rep 2016;65:850–8.
17. Healthy People 2020. Accessed at www.healthypeople.gov/2020/topics-objectives/national-snapshot/hpv-vaccine-adolescents-2008%E2%80%932012.
18. Garland SM. The Australian experience with the human papillomavirus vaccine. Clin Therapeut 2014;36:17–23.
19. Brabin L, Roberts SA, Stretch R, et al. Uptake of first two doses of human papillomavirus vaccine by adolescent schoolgirls in Manchester: prospective cohort study. BMJ 2008;336:1056–8.
20. Food and Drug Administration. Prescribing information [package insert]. Gardasil 9. 2016. Accessed at www.fda.gov/downloads/BiologicsBloodVaccines/Vaccines/ApprovedProducts/UCM426457.pdf
21. Meites E, Kempe A, Markowitz LE. Use of a 2-dose schedule for human papillomavirus vaccination - updated recommendations of the Advisory Committee on Immunization Practices. MMWR Morb Mortal Wkly Rep 2016;65:1405–8.
22. Gilkey MB, McRee AL. Provider communication about HPV vaccination: a systematic review. Hum Vaccin Immunother 2016;12:1454–68.
23. Clark SJ, Cowan AE, Filipp SL, et al. Parent perception of provider interactions influences hpv vaccination status of adolescent females. Clin Pediatr (Phila) 2016;55:701–6.
24. Ferrer HB, Trotter C, Hickman M, Audrey S. Barriers and facilitators to HPV vaccination of young women in high-income countries: a qualitative systematic review and evidence synthesis. BMC Public Health 2014;14:700.
25. Clark SJ, Cowan AE, Filipp SL, et al. Parent HPV vaccine perspectives and the likelihood of HPV vaccination of adolescent males. Hum Vaccin Immunother 2016;12:47–51.
26. Darden PM, Jacobson RM. Impact of a physician recommendation. Hum Vaccin Immunother 2014;10:2632–5.
27. Darden PM, Thompson DM, Roberts JR, et al. Reasons for not vaccinating adolescents: national immunization survey of teens, 2008-2010. Pediatrics 2013;131:645–51.
28. Gargano LM, Herbert NL, Painter JE, et al. Impact of a physician recommendation and parental immunization attitudes on receipt or intention to receive adolescent vaccines. Hum Vaccin Immunother 2013;9:2627–33.
29. Ylitalo KR, Lee H, Mehta NK. Health care provider recommendation, human papillomavirus vaccination, and race/ethnicity in the US National Immunization Survey. Am J Public Health 2013;103:164–9.
30. Brewer NT, Gottlieb SL, Reiter PL, et al. Longitudinal predictors of human papillomavirus vaccine initiation among adolescent girls in a high-risk geographic area. Sex Transm Dis 2011;38:197–204.
31. Reiter PL, McRee AL, Pepper JK, et al. Longitudinal predictors of human papillomavirus vaccination among a national sample of adolescent males. Am J Public Health 2013;103:1419–27.
32. Gottvall M, Grandahl M, Hoglund AT, et al. Trust versus concerns-how parents reason when they accept HPV vaccination for their young daughter. Ups J Med Sci 2013;118:263–70.
33. Vadaparampil ST, Malo TL, Kahn JA, et al. Physicians’ human papillomavirus vaccine recommendations, 2009 and 2011. Am J Prev Med 2014;46:80–4.
34. Vadaparampil ST, Malo TL, Sutton SK, et al. Missing the target for routine human papillomavirus vaccination: consistent and strong physician recommendations are lacking for 11- to 12-year-old males. Cancer Epidemiol Biomarkers Prev 2016;25:1435–46.
35. Stokley S, Jeyarajah J, Yankey D, et al. Human papillomavirus vaccination coverage among adolescents, 2007-2013, and postlicensure vaccine safety monitoring, 2006-2014 - United States. MMWR Morb Mortal Wkly Rep 2014;63:620–4.
36. Gilkey MB, Moss JL, Coyne-Beasley T, et al. Physician communication about adolescent vaccination: How is human papillomavirus vaccine different? Prev Med 2015;77:181–5.
37. Gilkey MB, Malo TL, Shah PD, et al. Quality of physician communication about human papillomavirus vaccine: findings from a national survey. Cancer Epidemiol Biomarkers Prev 2015;24:1673–9.
38. Herzog R, Alvarez-Pasquin MJ, Diaz C, et al. Are healthcare workers’ intentions to vaccinate related to their knowledge, beliefs and attitudes? A systematic review. BMC Pub Health 2013;13:154.
39. Hughes CC, Jones AL, Feemster KA, Fiks AG. HPV vaccine decision making in pediatric primary care: a semi-structured interview study. BMC Pediatr 2011;11:74.
40. Gilkey MB, Calo WA, Moss JL, et al. Provider communication and HPV vaccination: the impact of recommendation quality. Vaccine 2016;34:1187–92.
41. Malo TL, Ali KN, Sutton SK, et al. The content and context of physicians’ communication with males about human papillomavirus vaccination. Hum Vaccin Immunother 2016;12:1511–8.
42. Moss JL, Gilkey MB, Rimer BK, Brewer NT. Disparities in collaborative patient-provider communication about human papillomavirus (HPV) vaccination. Hum Vaccin Immunother 2016:0.
43. Suryadevara M, Handel A, Bonville CA, et al. Pediatric provider vaccine hesitancy: an under-recognized obstacle to immunizing children. Vaccine 2015;33:6629–34.
44. Mohammed KA, Geneus CJ, Osazuwa-Peters N, et al. Disparities in provider recommendation of human papillomavirus vaccination for U.S. adolescents. J Adolesc Health 2016;59:592–8.
45. Perkins RB, Clark JA. Providers’ perceptions of parental concerns about HPV vaccination. J Health Care Poor Underserved 2013;24:828–39.
46. Bloom BR, Marcuse E, Mnookin S. Addressing vaccine hesitancy. Science 2014;344:339.
47. Zimet GD. Health care professionals and adolescent vaccination. A call for intervention research. Hum Vaccin Immunother 2014;10:2629–30.
48. Task Force on Community Preventive Services. The guide to community preventive services: increasing appropriate vaccination. 2014. Accessed at www.thecommunityguide.org/vaccines/index.html.
49. Willis N, Hill S, Kaufman J, et al. “Communicate to vaccinate”: the development of a taxonomy of communication interventions to improve routine childhood vaccination. BMC Int Health Hum Rights 2013;13:23.
50. Dempsey AF, Zimet GD. Interventions to improve adolescent vaccination: what may work and what still needs to be tested. Vaccine 2015;33 Suppl 4:D106–113.
51. Walling EB, Benzoni N, Dornfeld J, et al. Interventions to improve HPV vaccine uptake: a systematic review. Pediatrics 2016;138(1).
52. Smulian EA, Mitchell KR, Stokley S. Interventions to increase HPV vaccination coverage: a systematic review. Hum Vaccin Immunother 2016;12:1566–88.
53. Opel DJ, Heritage J, Taylor JA, et al. The architecture of provider-parent vaccine discussions at health supervision visits. Pediatrics 2013;132:1037–46.
54. Moss JL, Reiter PL, Rimer BK, Brewer NT. Collaborative patient-provider communication and uptake of adolescent vaccines. Soc Sci Med 2016;159:100–7.
55. Lockhart S, Barnard J, O’Leary ST, et al. Exploring the feasibility of implementing a multifaceted toolkit to improve HPV vaccine provider communication in primary care settings. Presented at: Annual Meeting of the American Public Health Association; 2016; Denver, CO.
56. Reno J, O’Leary ST, Lockhart S, et al. Assessment of a communication toolkit for healcare providers about adolescent HPV vaccination. Presented at: Pediatric Academic Societies Annual Meeting; 2015; Baltimore, MD.
57. www.motivationalinterviewing.org
58. Foxcroft DR, Coombes L, Wood S, et al. Motivational interviewing for the prevention of alcohol misuse in young adults. Cochrane Database Syst Rev 2016;(7):CD007025.
59. Lindson-Hawley N, Thompson TP, Begh R. Motivational interviewing for smoking cessation. Cochrane Database Syst Rev 2015(3):CD006936.
60. McCain J. To heal the body, get into the patient’s head: motivational interviewing: to improve adherence. Biotechnol Healthc 2012;9:10–2.
61. Boutin-Foster C, Scott E, Rodriguez A, et al. The trial using motivational interviewing and positive affect and self-affirmation in african-americans with hypertension (TRIUMPH): from theory to clinical trial implementation. Contemp Clin Trials 2013;35:8–14.
62. Gance-Cleveland B. Motivational interviewing for adolescent obesity. Am J Nurs 2013;113:11.
63. Hides L, Carroll S, Scott R, et al. Quik fix: a randomized controlled trial of an enhanced brief motivational interviewing intervention for alcohol/cannabis and psychological distress in young people. Psychother Psychosom 2013;82:122–4.
64. Rongkavilit C, Naar-King S, Wang B, et al. Motivational interviewing targeting risk behaviors for youth living with HIV in Thailand. AIDS Behav 2013;17:2063–74.
65. Leask J, Kinnersley P, Jackson C, et al. Communicating with parents about vaccination: a framework for health professionals. BMC Pediatr 2012;12:154.
66. Zimet GD, Perkins SM, Sturm LA, et al. Predictors of STI vaccine acceptability among parents and their adolescent children. J Adolesc Health 2005;37:179–86.
67. Perkins RB, Zisblatt L, Legler A, et al. Effectiveness of a provider-focused intervention to improve HPV vaccination rates in boys and girls. Vaccine 2015;33:1223–9.
68. MacDonald N, Finlay JC. Working with vaccine-hesitant parents. Paediatr Child Health 2013;18:265–7.
69. Dempsey A, Lockhart S, Pyrzanowski J, et al. Impact of motivational interviewing training on providers communication about adolescent HPV vaccination. Presented at: Pediatric Academic Societies Annual Meeting; 2015; Baltimore, MD.
70. Brackett A, Butler M, Chapman L. Using motivational interviewing in the community pharmacy to increase adult immunization readiness: A pilot evaluation. J Am Pharm Assoc (2003) 2015;55:182–6.
71. Holman DM, Benard V, Roland KB, et al. Barriers to human papillomavirus vaccination among US adolescents: a systematic review of the literature. JAMA Pediatrics 2014;168:76–82.
72. Rambout L, Tashkandi M, Hopkins L, Tricco AC. Self-reported barriers and facilitators to preventive human papillomavirus vaccination among adolescent girls and young women: a systematic review. Prev Med 2014;58:22–32.
73. McSherry LA, Dombrowski SU, Francis JJ, et al. ‘It’s a can of worms’: understanding primary care practitioners’ behaviours in relation to HPV using the Theoretical Domains Framework. Implement Sci 2012;7:73.
74. Palmer J, Carrico C, Coxtanzo C. Identifying and overcoming perceived barriers of providers towards HPV vaccination: A literature review. J Vaccines 2015:7.
75. Gowda C, Schaffer SE, Dombkowski KJ, Dempsey AF. Understanding attitudes toward adolescent vaccination and the decision-making dynamic among adolescents, parents and providers. BMC Public Health 2012;12:509.
76. Plantin L, Daneback K. Parenthood, information and support on the internet. A literature review of research on parents and professionals online. BMC Fam Pract 2009;10:34.
77. Irizarry T, DeVito Dabbs A, Curran CR. Patient portals and patient engagement: a state of the science review. J Med Internet Res 2015;17:e148.
78. Clark SJ, Costello LE, Gebremariam A, Dombkowski KJ. A national survey of parent perspectives on use of patient portals for their children’s health care. Appl Clin Inform 2015;6:110–9.
79. Noar SM, Benac CN, Harris MS. Does tailoring matter? Meta-analytic review of tailored print health behavior change interventions. Psychol Bull 2007;133:673–93.
80. Kreuter MW, Strecher VJ, Glassman B. One size does not fit all: the case for tailoring print materials. Ann Behav Med 1999;21:276–83.
81. Hawkins RP, Kreuter M, Resnicow K, et al. Understanding tailoring in communicating about health. Health Educ Res 2008;23:454–66.
82. Lustria ML, Noar SM, Cortese J, et al. A meta-analysis of web-delivered tailored health behavior change interventions. J Health Commun 2013;18:1039–69.
83. Paiva AL, Lipschitz JM, Fernandez AC, et al. Evaluation of the acceptability and feasibility of a computer-tailored intervention to increase human papillomavirus vaccination among young adult women. J Am College Health 2014;62:32–8.
84. Gerend MA, Shepherd MA, Lustria ML. Increasing human papillomavirus vaccine acceptability by tailoring messages to young adult women’s perceived barriers. Sex Transm Dis 2013;40:401–5.
85. Bennett AT, Patel DA, Carlos RC, et al. Human papillomavirus vaccine uptake after a tailored, online educational intervention for female university students: a randomized controlled trial. J Womens Health (Larchmt) 2015;24:950–7.
86. Maertens J, Zambrano-Jiminez A, Dempsey AF. Using community engagement to develop a web-based intervention for Latinas about the HPV vaccine. J Health Commun 2017. Forthcoming.
87. Reno J, Maertens J, Jimenez-Zambrano A, et al. Effectiveness of a tailored intervention on changing hpv vaccination intention among Hispanics. Presented at: Pediatric Academic Societies Meeting; 2016; Baltimore, MD.
88. Daley MF, Liddon N, Crane LA, et al. A national survey of pediatrician knowledge and attitudes regarding human papillomavirus vaccination. Pediatrics 2006;118:2280–9.
89. Sussman AL, Helitzer D, Sanders M,et al. HPV and cervical cancer prevention counseling with younger adolescents: implications for primary care. Ann Fam Med 2007;5:298–304.
90. Perkins RB, Chigurupati NL, Apte G, et al. Why don’t adolescents finish the HPV vaccine series? A qualitative study of parents and providers. Hum Vaccin Immunother 2016;12:1528–35.
91. Centers for Disease Control and Prevention. Immunization Education & Training. You are the key to HPV cancer prevention. Accessed at www.cdc.gov/vaccines/ed/hpv/index.html.
92. Malo TL, Gilkey MB, Hall ME, et al. Messages to motivate human papillomavirus vaccination: national studies of parents and physicians. Cancer Epidemiol Biomarkers Prev 2016;25:1383–91.
93. Chapman G. Increasing vaccination without changing beliefs. 2016. Accessed at http://catalyst.nejm.org/increasing-vaccination-without-changing-beliefs/.
94. Rossen I, Hurlstone MJ, Lawrence C. Going with the grain of cognition: applying insights from psychology to build support for childhood vaccination. Front Psychol 2016;7:1483.
95. Shah PD, Gilkey MB, Pepper JK, et al. Promising alternative settings for HPV vaccination of US adolescents. Exp Rev Vaccine 2014;13:235–46.
96. Webb TL, Sheeran P. Does changing behavioral intentions engender behavior change? A meta-analysis of the experimental evidence. Psychol Bull 2006;132:249–68.
97. Janczyk M, Dambacher M, Bieleke M, Gollwitzer PM. The benefit of no choice: goal-directed plans enhance perceptual processing. Psychol Res 2015;79:206–20.
98. Wieber F, Thurmer JL, Gollwitzer PM. Promoting the translation of intentions into action by implementation intentions: behavioral effects and physiological correlates. Front Hum Neurosci 2015;9:395.
99. Chapman J, Armitage CJ, Norman P. Comparing implementation intention interventions in relation to young adults’ intake of fruit and vegetables. Psychol Health 2009;24:317–32.
100. Martin J, Sheeran P, Slade P, et al. Implementation intention formation reduces consultations for emergency contraception and pregnancy testing among teenage women. Health Psychol 2009;28:762–9.
101. Chapman J, Armitage CJ. Do techniques that increase fruit intake also increase vegetable intake? Evidence from a comparison of two implementation intention interventions. Appetite 2012;58:28–33.
102. Armitage CJ, Arden MA. Enhancing the effectiveness of alcohol warning labels with a self-affirming implementation intention. Health Psychol 2016;35:1159–63.
103. Bradbury D, Upsher R, Chilcot J. A pilot randomised test of a self-affirmation implementation intention intervention to reduce dietary salt intake. J Health Psychol 2016 May 22.
104. Chen XJ, Liu LL, Cui JF, et al. The effect and mechanisms of implementation intention in improving prospective memory performance in schizophrenia patients. Psychiatry Res 2016;244:86–93.
105. Hagger MS, Luszczynska A, de Wit J, et al. Implementation intention and planning interventions in health psychology: recommendations from the Synergy Expert Group for research and practice. Psychol Health 2016;31:814–39.
106. Vet R, de Wit JB, Das E. The role of implementation intention formation in promoting hepatitis B vaccination uptake among men who have sex with men. Int J STD AIDS 2014;25:122–9.
107. Milkman KL, Beshears J, Choi JJ, et al. Using implementation intention prompts to enhance influenza vaccination rates. Proc Natl Acad Sci U S A 2011;108:10415–20.
108. McCaul KD, Johnson RJ, Rothman AJ. The effects of framing and action instructions on whether older adults obtain flu shots. Health Psychol 2002;21:624–8.
109. Centers for Disease Control and Prevention. You are the key: health care providers’ tip sheet. 2015. Accessed at www.cdc.gov/vaccines/who/teens/for-hcp-tipsheet-hpv.pdf.
110. American Academy of Pediatrics. HPV vaccine champion toolkit. 2015. Accessed at www.aap.org/en-us/advocacy-and-policy/aap-health-initiatives/Pages/HPV-Champion-Toolkit.aspx.
111. Nyhan B, Reifler J. Does correcting myths about the flu vaccine work? An experimental evaluation of the effects of corrective information. Vaccine 2015;33:459–64.
112. Betsch C, Sachse K. Debunking vaccination myths: strong risk negations can increase perceived vaccination risks. Health Psychol 2013;32:146–55.
113. Nyhan B, Reifler J, Richey S, Freed GL. Effective messages in vaccine promotion: a randomized trial. Pediatrics 2014;133:e835–842.
114. Schwartz N, Sanna LJ, Skurnik I, Yoon C. Metacognitive expriences and the intericacies of setting people straight: Implications for debiasing and public information campaigns. Adv Exper Social Psychol 2007;39:127–161.
115. Lord C, Ross L, Lepper MR. Biased assimilation and attitude polarization: the effects of prior theories on subsequently considered evidence. J Personality Soc Pscyhol 1979;37:2098–109.
116. Siegrist M, Cvetkovich G. Better negative than positive? Evidence of a bias for negative information about possible health dangers. Risk Analysis 2001;21:199–206.
117. Witte K, Allen M. A meta-analysis of fear appeals: implications for effective public health campaigns. Health Educ Behav 2000;27:591–615.
118. Gerend MA, Shepherd JE. Using message framing to promote acceptance of the human papillomavirus vaccine. Health Psychol 2007;26:745–52.
119. Ferguson E, Gallagher L. Message framing with respect to decisions about vaccination: the roles of frame valence, frame method and perceived risk. Br J Psychol (London:1953) 2007;98(Pt 4):667–80.
120. Jarrett C, Wilson R, O’Leary M, et al. Strategies for addressing vaccine hesitancy - A systematic review. Vaccine 2015;33:4180–90.
121. Laranjo L, Arguel A, Neves AL, et al. The influence of social networking sites on health behavior change: a systematic review and meta-analysis. J Am Med Inform Assoc 2015;22:243–56.
122. Maher CA, Lewis LK, Ferrar K, et al. Are health behavior change interventions that use online social networks effective? A systematic review. J Med Internet Res 2014;16:e40.
123. Betsch C, Brewer NT, Brocard P, et al. Opportunities and challenges of Web 2.0 for vaccination decisions. Vaccine 2012;30:3727–33.
124. Barrett Values Center. Values versus beliefs. 2016. Accessed 31 Oct 2016 at www.valuescentre.com/mapping-values/values/values-vs-beliefs.
125. Dore RA, Stone ER, Buchanan CM. A social values analysis of parental decision making. J Psychol 2014;148:477–504.
126. Cohen GL, Sherman DK. The psychology of change: self-affirmation and social psychological intervention. Ann Rev Psychol 2014;65:333–71.
127. Sweeney AM, Moyer A. Self-affirmation and responses to health messages: a meta-analysis on intentions and behavior. Health Psychol 2015;34:149–59.
128. Tiro JA, Lee SC, Marks EG, et al. Developing a tablet-based self-persuasion intervention promoting adolescent hpv vaccination: protocol for a three-stage mixed-methods study. JMIR Res Protoc 2016;5:e19.
129. Leask J, Macartney K. Parental decisions about vaccination: collective values are important. J Paediatr Child Health 2008;44:534–5.
130. Salmon DA, Omer SB. Individual freedoms versus collective responsibility: immunization decision-making in the face of occasionally competing values. Emerg Themes Epidemiol 2006;3:13.
131. Gidengil C, Lieu TA, Payne K, et al. Parental and societal values for the risks and benefits of childhood combination vaccines. Vaccine 2012;30:3445–52.
132. Attwell K, Freeman M. I immunise: an evaluation of a values-based campaign to change attitudes and beliefs. Vaccine 2015;33:6235–40.
133. Witteman HO. Addressing vaccine hesitancy with values. Pediatrics 2015;136:215–7.
134. Witteman HO, Chipenda Dansokho S, Exe N, et al. Risk Communication, values clarification, and vaccination decisions. Risk Anal 2015;35:1801–19.
135. Ohannessian R, Yaghobian S, Verger P, Vanhems P. A systematic review of serious video games used for vaccination. Vaccine 2016.
136. National Vaccine Advisory Committee. Assessing the state of vaccine confidence in the United States: recommendations from the National Vaccine Advisory Committee. Pub Health Rep 2015;130:573–95.
137. Dube E, Vivion M, MacDonald NE. Vaccine hesitancy, vaccine refusal and the anti-vaccine movement: influence, impact and implications. Exp Rev Vaccine 2015;14:99–117.
From the University of Colorado Denver, Aurora, CO.
Abstract
- Objective: To provide evidence-based guidance on strategies that are likely or unlikely to be successful in navigating HPV vaccine conversations with patients and parents.
- Methods: Nonsystematic review of the literature.
- Results: This review highlights some of the most recent innovations in provider HPV vaccine communication and describes provider communication strategies that have been found to improve adolescent vaccination rates in rigorous scientific studies. Promising strategies for which additional research is needed and strategies that probably do not work are also described.
- Conclusion: By understanding what works, what may work, and what not to do when it comes to communicating with families about HPV vaccines, providers can be better prepared for maximizing the impact they can have on adolescent HPV vaccination rates.
Key words: human papillomavirus; vaccine hesitancy; health communication; parents; immunization.
In the United States, more than 14 million people newly acquire genital human papillomavirus (HPV) annually, and 75 million Americans are infected at any given time [1]. As the most common sexually transmitted disease, more than 80% of sexually active U.S. adults are estimated to be infected with HPV by the age of 50 [1,2]. Although the majority of infections are “silent” and resolve without clinical sequelae, a proportion of infected individuals will go on to develop HPV-related diseases. In women, these include cervical cancer and pre-cancer (ie, abnormal Pap smears); cancers of the vagina, vulva, anus, and oropharynx; and genital warts [3]. Males also bear a high burden of HPV-related disease in the form of penile, anal, and oropharyngeal cancers, as well as genital warts [3]. While once thought of as primarily a “woman’s disease” [4], recent research demonstrates men are also significantly impacted by HPV—particularly in the form of oropharyngeal cancers, which are 2 to 3 times more common in men than in women [5]. In fact, it is estimated by the year 2020 more men will die of HPV-related oropharyngeal cancer than women will die of cervical cancer [6,7]. The combined cost of HPV-associated cancers and other conditions is estimated to be $8 billion per year in the United States [8–11].
HPV Vaccines
Effective HPV vaccines have been available for females aged 9 to 26 years since 2006 (bivalent and quadrivalent vaccines) and for males aged 9 to 26 since 2010 (quadrivalent vaccine only) [12]. These vaccines have been shown in clinical trials to be highly efficacious in preventing HPV infection, cervical pre-cancer, and anal, vaginal, penile, and vulvar cancers caused by the HPV types covered in the vaccine [2]. Although their effectiveness against head and neck cancer has not been studied in clinical trials, most experts believe that these vaccines will also provide protection against at least a proportion of these cancers [13,14]. In 2015 the U.S. Food and Drug Administration approved licensure of a 9-valent HPV vaccine that will soon replace the quadrivalent vaccine in the U.S. market [15]. The 9-valent vaccine is licensed for both males and females aged 9 to 26 and is expected to prevent an even higher proportion of HPV-related cancers than earlier HPV vaccines due to the protection against 5 additional oncogenic HPV types [15].
Despite the potential of HPV vaccines to drastically reduce the incidence of HPV-related cancers and other diseases, these vaccines are not being as widely used in the United States as was hoped. The most recent national data from 2015 demonstrates that only 41.9% of girls and 28.1% of boys have received all 3 doses recommended in the HPV vaccine series [16]. This level of vaccine utilization is significantly lower than the Healthy People 2020 goal of 80% coverage [17], and also significantly lower than that of other developed countries such as Australia and the United Kingdom, which have achieved vaccination levels of ~70% among their target adolescent populations [18,19]. In the future, these low vaccination levels will likely be mitigated somewhat by the recent approval from the FDA and recent recommendation from the Advisory Committee on Immunization Practices (ACIP) for only 2 doses of the 9-valent HPV vaccine (spaced 6 to 12 months apart) for adolescents less than 15 years of age [20,21]. Three doses are still recommended for those aged 15 to 26 years.
Provider Communication About HPV Vaccines
How providers communicate with parents and patients about HPV vaccines is a key influential factor driving current U.S. adolescent HPV vaccination levels [22,23]. Numerous studies demonstrate that a provider’s recommendation generally has the largest impact on whether or not an adolescent receives the vaccine, even above that of parent factors such as attitudes and beliefs about the vaccine and patient characteristics such as age and insurance status [23–31]. Moreover, parents consistently cite their adolescent’s provider as one of the most trusted and impactful resources for obtaining vaccine information [22,32].
Unfortunately, research also shows that providers often fail to adequately recommend the HPV vaccine for their patients, especially for 11 to 12 year olds for whom the vaccine is preferentially recommended [33,34]. For example, in a national study of parents done in 2013, not being recommended by a provider was one of the top 5 reasons parents of males and of females aged 11 to 17 gave for not getting their adolescent vaccinated against HPV [35]. Supporting this also is a 2014 study of 776 pediatricians and family medicine providers nationally, in which Gilkey and colleagues found that more than 1 out of 4 providers did not highly endorse the HPV vaccine for 11 to 12 year olds despite this having been the recommended practice from ACIP for the prior 8 years for girls and 4 years for boys. This is in comparison to the other adolescents vaccines that were reported in the same study as being endorsed highly by these providers > 95% of the time [36].
Recognizing that providers’ HPV vaccine recommendations are often suboptimal, researchers have begun to define what components comprise “high-quality” HPV vaccine recommendations. This has been operationalized by one research group as (1) timeliness—routinely recommending the vaccine starting when the patient is ≤ 12 years; (2) consistency—recommending the vaccine for all eligible adolescents as opposed to an approach based on providers’ perception of their patients’ risk for HPV infection; (3) urgency—recommending that the vaccine be given on the same day the vaccine is being discussed, rather than offering the option of getting it at a future visit; and (4) strength—using language that clearly conveys that the provider believes the vaccine is very important for the adolescent to receive. A national study of primary care providers done in 2014 examined how frequently these quality components were implemented [37]. The results were startling and discouraging. Nearly half of providers (49%) reported they usually recommended that 11 to 12 year olds get the vaccine at a later visit, 41% used a risk-based approach for deciding when to recommend the vaccine, 27% did not tell the parents the vaccine was “very or extremely important,” and a large proportion did not start routinely recommending the vaccine before the age of 13 (39% for male patients and 25% for females) [37].
Much research has now accumulated to explain the underlying reasons why providers may not give consistent and high-quality HPV vaccine recommendations to all eligible adolescents [22]. Issues such as providers’ own knowledge about HPV-related diseases, personal beliefs about the vaccine’s safety and necessity, concern that a discussion about the vaccine will necessitate a discussion about adolescent sexuality with the parent, belief that parents will not want their child vaccinated if asked, perceptions that a provider can adequately select those patients most “in need” of HPV vaccination, and concern that raising the vaccine discussion with vaccine-hesitant parents will result in prolonged discussions have been shown to impact whether and how providers communicate about HPV vaccination during clinical visits [22,36–45]. Now that these barriers have been defined and described, there is a great need to use this knowledge to develop and evaluate interventions that help to mitigate these barriers and improve providers’ vaccine communication abilities. Such interventions are needed not only for HPV, but for all vaccines [46,47].
Possible Strategies for Helping Providers Communicate About HPV Vaccines
Before discussing these interventions, it is worth noting that several of the passive and active strategies have been shown in clinical trials to improve adolescent HPV vaccination rates. Although these are beyond the scope of this article, inclusion of these strategies should certainly be considered by any practice as a mechanism to increase vaccination levels, especially given that the most successful interventions to improve vaccination levels consist of multiple components [48]. Also useful is a recently described “taxonomy of vaccine communication interventions” that provides additional perspective on the scope and complexity of interventions to improve vaccine delivery [49]. There are several well-written review articles that describe interventions that focus on passive and active strategies at the practice or community level [50–52].
Interpersonal Communication Strategies Shown to Increase HPV Vaccination
Presumptive Communication
One of the first studies to examine the specific “way” in which providers communicate about vaccines focused not on HPV but rather on young childhood vaccines. In 2013 Opel and colleagues performed a study in which they taped clinical encounters between a pediatrician and a parent of a child aged 1 to 19 months [53]. Of the 111 encounters recorded, 50% of parents were classified as vaccine hesitant. Parents were aware they were being taped but not aware that the overall purpose of the study was to examine providers’ communication related to vaccination. The researchers found that providers generally used one of 2 communication styles to introduce the vaccine discussion. The first, called the “presumptive” style, assumed that parents would agree to vaccination and presented the vaccines as routine (ie, “We have to do some shots today”). The second style, called “participatory,” was more parent-oriented and used language suggesting shared decision-making (ie, “So what do you want to do about shots today?”). The study showed that the odds of resisting the provider’s vaccine recommendations were significantly higher when providers used a participatory approach than a presumptive one, suggesting that even small changes in language can have a major impact on the likelihood of vaccination. However, given the study design, causality between providers’ recommendation style and parents vaccination decisions could not be delineated.
In 2015 Moss and colleagues performed a study that examined the use of these 2 communication styles with regard to HPV vaccination [54]. This study used data from the 2010 National Immunization Survey–Teen, a national survey on childhood vaccination that includes provider verification of vaccines given [16]. Researchers categorized provider vaccine communication styles into “provider-driven,” which was similar to the presumptive style described Opel, and “patient-driven,” which was similar to Opel’s permissive style. Parents who received a more provider-driven style of HPV vaccine recommendation were far more likely to have allowed their adolescent to be vaccinated than those receiving patient-driven recommendations [54]. Further supporting this communication approach are results from a qualitative study done by Hughes and colleagues in which triads of mothers, adolescents, and providers were interviewed after a preventive care visit to assess the communication that occurred regarding HPV vaccination [39]. Providers’ communication style was categorized into 1 of 3 groups: paternalistic (clinician makes the vaccination decision and communicates this to the family); informed (patient and family gathers information from the clinician and other sources to reach a vaccination decision); and shared (medical and personal information is exchanged between the provider and family and then a decision is reached jointly). Providers who typically adopted the paternalistic approach perceived that they had the highest success in convincing parents to vaccinate—a perception that was confirmed in quantitative assessments of vaccination status among adolescents in the study sample [39]. Our own research demonstrates that learning and implementing a presumptive/paternalistic HPV vaccine recommendation style is easy for primary care providers to do and is perceived as often shortening the time taken during clinical visits to discuss the vaccine [55,56]. Thus, providers should consider opening the HPV vaccine conversation using this approach, and then turning to some of the other communication techniques described below when met with parental resistance or questions.
Motivational Interviewing
A second communication technique that seems effective for promoting HPV vaccination, especially for vaccine hesitant parents, is motivational interviewing. Motivational interviewing describes a communication technique in which the provider leverages a parents’ or patients’ intrinsic motivation to engage in a preferred health behavior [57]. Motivational interviewing was originally developed to combat substance abuse [58,59] but has subsequently been successfully applied to a number of other health issues [60–64]. There is growing interest from public health and medical providers in using this technique for increasing vaccination [39,65–68]. Our research group performed a large, cluster-randomized controlled trial of 16 pediatric and family medicine clinics to examine the impact of a provider communication “toolkit” on adolescent HPV vaccine series initiation and completion [50,69]. The toolkit consisted of motivational interviewing training for providers related to HPV vaccination and training on 3 tangible resources providers could also use with parents—an HPV fact sheet, an HPV vaccine decision aid, and an educational website. Results from the study demonstrated that motivational interviewing was the toolkit component most widely utilized by providers and was also perceived as being the most useful. More importantly, HPV vaccine series initiation levels were significantly higher among adolescents in practices receiving the toolkit than in control practices. There was no impact on HPV vaccine series completion (unpublished results). The usefulness of motivational interviewing for vaccination is further supported by a small study in which community pharmacists receiving motivational interviewing training for adult vaccination reported significantly higher patient readiness to receive vaccines following their interaction with the pharmacist than those who did not receive the training [70]. Finally, Perkins et al performed a cluster randomized controlled trial that evaluated the impact of a provider-focused intervention on adolescent HPV vaccination rates. The intervention included frequent provider support meetings, education on HPV infection and vaccination, feedback on providers’ individual HPV vaccination rates, provider incentives, and “basic motivational interviewing principles with vaccine-hesitant parents.” HPV vaccination series initiation and completion rates were significantly higher in intervention practices than controls, and this effect was sustained for at least 6 months after the active intervention period was over [67]. However, it was unknown how much the motivational interviewing contributed to these results. Based on the above information, and the long history of success of motivational interviewing for improving patient compliance with other recommended health behaviors, this technique appears to have a reasonable evidence base and should be considered for communicating with families that express resistance to HPV vaccination.
Personalized Communication
Parents’ reasons for not having their adolescent vaccinated against HPV are often complex and multifactorial [71,72]. Personalized approaches are needed to account for each parent’s unique informational needs, beliefs, and prior experiences [65]. Unfortunately, given the short amount of time allotted for clinical visits, it is often difficult to provide adequate information to parents during these encounters [73–75]. Indeed, concern about prolonged HPV vaccine discussions has been identified as an important barrier for providers that cause some to forgo recommending the vaccine [36,75].
One potential solution to this issue is to leverage technology in the form of web-based interventions that use software to tailor materials to each individual’s unique informational needs. Feasibility for this idea comes from the knowledge that many parents already use the web to research health issues related to their children [76], and that doctors’ offices are increasingly using patient portals and other web-based resources to help parents prepare for upcoming visits, especially those focused on health maintenance [77,78]. Tailored messaging interventions have been shown across populations and health issues to generally result in superior adherence with health behaviors when compared to untailored controls [79–82]. Several researchers have thus begun exploring whether such a personalized communication strategy may be similarly effective for adolescent HPV vaccination [50,83–85]. As an example, Maertens and colleagues used community-based participatory research techniques to develop a web-based tailored messaging intervention for Latinos regarding HPV vaccination [86]. A subsequent randomized controlled trial of the intervention in over 1200 parents of adolescents and young adults demonstrated that the intervention improved participants’ intentions to vaccinate compared to usual care [87], and among adolescents, higher HPV vaccine series initiation levels (unpublished data). Although additional work is needed to understand the feasibility of implementing such an intervention more broadly, additional support for the usefulness of a tailored messaging approach comes from a study of female university students that demonstrated higher HPV vaccination intentions after exposure to tailored information compared to untailored information. However, the impact on actual HPV vaccine utilization was not measured in the study [84]. Contrasting results were found in a different study of university students where researchers failed to find an impact of message tailoring on HPV vaccination utilization. However, this study was limited by a low response rate (~50%) to the follow up survey where vaccination status was assessed, and also by overall low levels of HPV vaccine initiation among the entire study sample (8%) [85]. Given the low number of studies in this area, and some conflicting data, additional research is needed to better understand the impact of personalized communication on HPV vaccination levels. However, results from these studies suggest that a modest benefit may be achieved with this approach, especially if coupled with other, evidence-based, clinic-level interventions to promote vaccination (eg, vaccine reminders, extended office hours), as is suggested by the Task Force on Community Preventive Services [48].
Focusing Communication on Cancer Prevention
HPV vaccines are unique in that they are only 1 of 2 vaccines for cancer prevention (the other being hepatitis B). Provider and parent surveys suggest that while most providers do mention cancer prevention when discussing HPV vaccines [40,88,89], this may be more commonly done with female patients than males [22]. Focusing on cancer prevention rather than sexual transmissibility is a communication technique suggested by the Centers for Disease Control and Prevention (CDC) as many parents cite this aspect of the vaccine as one of the most compelling reasons for vaccinating [45,90]. CDC’s “You are the Key” program [91] uses cancer prevention as a central theme in their physician and patient communication materials, based on significant prior market research on the acceptability and impact of such messages among parents and providers. In 2016 Malo and colleagues tested the potential impact of brief messages related to HPV vaccination, including cancer prevention messages, among a national sample of 776 medical providers and 1504 parents of adolescents [92]. In addition to their potential to motivate parents to vaccination, associations between parental endorsement of each message and their adolescent’s vaccination status were also examined. The cancer prevention messages were among those most highly endorsed by both parents and providers as being motivating for parents to get their adolescent vaccinated. More importantly, among parents these endorsements were associated with a significantly higher likelihood of the adolescent having been vaccinated against HPV. Interestingly, one of the briefest messages in the study, “I [the physician] strongly believe in the importance of this cancer preventing vaccine for [child’s name],” was perceived as the most persuasive message by parents.
Further support for the positive impact of framing HPV vaccines primarily as cancer prevention comes from another national study of 1495 parents of 11 to 17 year olds that examined 3 measures of quality of their adolescent provider’s HPV vaccine recommendation, and the relationship between recommendation quality and likelihood of adolescent HPV vaccination [40]. The 3 quality indicators assessed included providing information about cancer prevention, encouraging the vaccine “strongly,” and recommending it be given on the same day as it was being discussed. While 49% of parents reported receiving no HPV vaccine recommendation from their adolescents’ provider, of those that did, 86% received a cancer prevention message. Parents who had been given high quality recommendations that included either 2 or 3 of the quality indicator measures had over 9 times the odds of vaccine series initiation and 3 times the odds of vaccine series follow through than those who had not received any recommendation, and also significantly higher odds of vaccination than parents who had received low quality recommendations (ie, included only 1 indicator). Taken together, these results suggest that focusing discussions about HPV vaccines on their ability to prevent cancer is likely to be persuasive for some parents.
Strategies That Are Promising But Not Thoroughly Tested
Helping Parents Create Vaccination Plans
A recent commentary suggested that instead of focusing on changing beliefs or “educating” parents and patients about the need for a given vaccine, perhaps a better way to craft interventions for increasing vaccination is to focus on structuring the environment to make vaccination “easy” [93,94]. Examples of this include strategies such as extended office hours and making the vaccine available in other locations such as schools and pharmacies, both of which have been shown in some populations and settings to improve vaccine utilization [48,95]. One aspect of structuring a vaccine-conducive environment that relates to provider communication is helping parents create “implementation intentions” for future vaccination visits. In its most obvious form, this would mean providers provide office resources that facilitate making an appointment for the next dose in the HPV vaccine series during a clinic visit where the first dose was provided. But such an approach could also potentially extend to parents who are on the fence about the vaccine—to make an appointment before the parent leaves the office with an unvaccinated child to either re-discuss the vaccine in the future or to actually start the vaccine series. Support for such a strategy comes primarily from the social sciences, which suggest that implementation intentions work by increasing attention to specific cues to action, making it more likely that that the cue will be acted upon [96–98]. Creating implementation intentions has been shown to be helpful for improving adherence with a variety of health behaviors [99–105], and there is a growing evidence base related to how implementation intentions may facilitate vaccination specifically. For example Vet and colleagues performed a randomized controlled trial among 616 men who have sex with men with either strong or weak intentions to receive the hepatitis B vaccine [106]. Half of the participants were asked to create an implementation intention plan where they described when, where and how they would obtain the vaccine. Those in the control arm were not given this prompt. Regardless of whether their initial vaccination intention was weak or strong, those who had been asked to create an implementation plan had more than double the likelihood of actually getting the vaccine than participants who did not receive the implementation plan prompt. Similarly, a study of influenza vaccination rates among corporate employees found that those who were asked to write down the day and time they planned to go to employee health to get the free vaccine were somewhat more likely (4% higher) to be vaccinated than those who did not receive this prompt [107]. In addition, a study of elderly individuals found that influenza vaccination rates were significantly higher among those who had received “action instructions” on how, when and where to get the vaccine than those who did not [108]. These studies suggest that helping parents craft a definitive follow-up plan regarding vaccination could have a significant impact on vaccination rates—particularly for vaccines like HPV that require multiple doses.
Treating all Adolescent Vaccines the Same
Prior research has demonstrated that providers often communicate differently about HPV vaccines than other adolescent vaccines such as the tetanus-diphtheria-pertussis (Tdap) and meningococcal (MCV) vaccines [22,36]. Providers often tend to discuss the HPV vaccine last among these 3 vaccines, provide weaker endorsements of the vaccine, and pre-emptively give much more detail about the HPV compared to the other vaccines, even in the absence of a parent’s request for additional information [36,39,41]. The CDC and the American Academy of Pediatrics now suggest putting HPV at the beginning or middle of the list of vaccines recommended to the adolescent (ie, “HPV, Tdap and MCV”), and treating all recommended vaccines equivalently in terms of the level of detail provided to parents in the absence of a parent’s request for more information [109,110]. Through these suggestions have face validity, their specific impact on HPV vaccination rates, and on patient and provider satisfaction with the visit have yet to be evaluated.
Strategies that Probably Don’t Work
Presenting Myths and Facts
Research related to promoting other vaccines provides insight into communication activities that probably would not work well for promoting HPV vaccination. A 2012 study by Nyhan and colleagues examined the impact of 2 different messages related to influenza vaccines on participants’ beliefs about the vaccine’s safety and intentions to get vaccinated [111]. One group received information to correct the commonly held belief that influenza vaccine can cause the flu while the other received information about the risks associated with contracting an influenza infection. While the correction of myths did improve participants’ perceptions of the vaccine’s safety, information about influenza dangers did not. Neither message impacted intentions to vaccinate in the study subjects overall. However, in sub-analyses the correction of myths actually decreased intentions to vaccinate among those with high baseline levels of concern about the vaccine’s side effects—that is, among those most concerned that the flu vaccine can give someone the flu, correcting this myth actually decreased the likelihood that they would receive the vaccine. Similar findings have been reported in other studies related to vaccination [112–114], and suggest that the “threat” generated by providing information opposing a person’s beliefs may actually entrench these beliefs further as part of the threat response—a phenomenon known as attitude polarization [115]. These results also are consistent with the concept of negativity bias, which posits that negative information influences people’s risk perceptions more than positive information, and that the more strongly a risk is attempted to be negated, the lower the effectiveness and perceived trust of the information [116].
Using Fear Appeals
One tactic that has been suggested by some as a way to promote vaccination is to provide graphic depictions of the possible sequelae of vaccine-preventable diseases. The thought behind this idea is that because vaccination is so successful, most parents will have never experienced significant impacts from vaccine preventable diseases that, in the past, had been a major motivator for parents to vaccinate. Thus, in order to counter beliefs about “controversial” issues like vaccination, highly emotionally compelling and engaging information may be especially useful. This is a common tactic used by anti-vaccination groups to spread their own messages [117]. However, several studies suggested that using “fear appeals” (aka scare tactics) such as this to promote vaccination can actually have a negative effect on vaccination intentions. For example, in a 2011 study of a nationally representative sample of parents of children < 18 years, 4 different message formats were tested for their impact on parental intentions to vaccinate a future child with the measles-mumps-rubella vaccine (MMR) [113]. Message formats included correcting the misinformation that MMR causes autism, presenting information on MMR-related disease risk, providing a dramatic narrative about a child endangered by measles, and showing pictures of infants affected by these diseases. Counter to the study’s hypotheses, the dramatic narrative message actually increased parents’ perceptions that MMR vaccines had serious side effects, and the pictures increased parents’ belief that the MMR vaccine could cause autism. These counter-intuitive results are consistent with other studies that have examined the impact of message framing on adults’ vaccination intentions for HPV and influenza [108,118,119]. Taken together, fear appeals seem unlikely to sway many hesitant parents towards HPV vaccination.
Looking Into the Future
Moving forward, additional interventions to improve providers’ ability to communicate with families about HPV vaccination will undoubtedly be developed. A major area of interest in this regard is leveraging the power of technology and the internet, including using social media, mobile technologies, and online interventions to augment the provider/parent interaction that occurs during the clinical visit [50,120]. Web-based approaches have the benefit of generally being low cost and easy to disseminate to large populations. Such interventions have already been developed for a number of other health issues, some of which have proven effective [121,122]. However, use of the internet to promote healthy behaviors in general, and vaccination specifically, is still in its infancy. There is still much to be learned about how to create effective web-based tools, how to engage patients with them, and how to assess their impact on health outcomes [123].
Another interesting area for future research is identifying psychological “levers” to motivate parents’ vaccination intentions [94]. One example is focusing on using parents’ values (ie, protecting my child from harm) as an intervention target rather than beliefs or attitudes. This is because values tend to be inherent and static over time, compared to beliefs and attitudes, which are subject to change depending on the context [124]. Prior research has shown that interventions that leverage values rather than facts can be an effective way to overcome beliefs that are highly emotional or controversial, and that individuals are more likely to trust sources and individuals with shared values than those without [125], suggesting that this may be a useful way to motivate parents toward vaccinating their children. Self-affirmation is another example of a psychological lever that has a significant evidence base from the social science literature as a helpful tool for moving patients towards a desired health behavior [126,127], but it has not been extensively applied to the field of vaccination. Researchers in the field of vaccine delivery are increasingly recognizing the potential value of these unique intervention approaches [101,128–134], and it may be fruitful in the future to more closely examine the efficacy of interventions that target things like values, self-affirmation or other psychological levers to change parents’ HPV vaccination behaviors.
A final notable area for intervention research related to HPV vaccination is the use of video games. Although not likely to be used directly during patient visits, this strategy could be conceptualized as a potential way to augment the information conveyed to a parent by a provider directly during a clinical encounter. A meta-analysis from 2016 identified 16 different “serious” video games that were used to train and educate users about specific vaccine preventable diseases (usually influenza, none for HPV) and the need for vaccination [135]. In many of them, the objective of the game was to protect a virtual community from a vaccine preventable disease and/or manage outbreaks. Only 2 of the games evaluated outcomes in the short term (ie, at the time the game was being played). None have evaluated longer-term impacts such as vaccination intention or utilization. In the era of “plugged in” parents and adolescents, video games represent a unique but understudied mechanism for helping providers “communicate,” albeit indirectly, with families about the need for vaccination. Imagine providing a prescription to an HPV-vaccine hesitant family to “go play Zombie Wars HPV!” One would expect the curiosity factor alone would result in significant engagement with this intervention tool.
Conclusion
With persistently lagging HPV vaccination rates among U.S. adolescents, there is a growing need for effective interventions to improve adolescent HPV vaccine utilization. How providers communicate with families is one of the most influential factors in parents’ vaccination decisions. Emerging research is beginning to delineate potentially effective communication techniques such as presumptive approaches to making the vaccine recommendation, framing the vaccine as cancer preventing, and using motivational interviewing and personalized messaging when met with parental vaccine resistance. Moving forward the list of evidence-based interventions to improve providers’ HPV vaccine communication is likely to grow, and to increasingly leverage technology based solutions. However, given the complexities of the vaccination decision [136] and the ever growing spread of vaccine hesitancy [137], it is unlikely that a single intervention approach will be effective for getting adolescent HPV vaccine levels up to the national goal of 80% coverage. As has been recognized in the past, the most effective interventions for HPV vaccination in the future are likely to be multicomponent, including not only provider communication strategies but also clinic-, community-, and parent-level interventions [48].
Corresponding author: Amanda Dempsey, MD, PhD, MPH, 13199 East Montview Blvd, Suite 300, Aurora, CO 80045, [email protected].
Financial disclosures: None reported.
1. Centers for Disease Control and Prevention. Genital HPV infection - CDC fact sheet. 2012. Accessed 26 Jun 2012 at www.cdc.gov/std/HPV/STDFact-HPV.htm.
2. Markowitz LE, Dunne EF, Saraiya M, et al. Quadrivalent human papillomavirus vaccine: Recommendations of the Advisory Committee on Immunization Practices (ACIP). MMWR Recomm Rep 2007;56(RR-2):1–24.
3. Viens LJ, Henley SJ, Watson M, et al. Human papillomavirus-associated cancers - United States, 2008-2012. MMWR Morb Mortal Wkly Rep 2016;65:661–6.
4. Daley EM, Vamos CA, Zimet GD, et al. The feminization of HPV: Reversing gender biases in US human papillomavirus vaccine policy. Am J Public Health 2016;106:983–4.
5. Rettig EM, D’Souza G. Epidemiology of head and neck cancer. Surg Oncol Clin North Am 2015;24:379–96.
6. Louie KS, Mehanna H, Sasieni P. Trends in head and neck cancers in England from 1995 to 2011 and projections up to 2025. Oral Oncol 2015;51:341–8.
7. Mehanna H, Beech T, Nicholson T, et al. Prevalence of human papillomavirus in oropharyngeal and nonoropharyngeal head and neck cancer--systematic review and meta-analysis of trends by time and region. Head Neck 2013;35:747–55.
8. Chesson HW, Markowitz LE, Hariri S, et al. The impact and cost-effectiveness of nonavalent HPV vaccination in the United States: Estimates from a simplified transmission model. Hum Vaccin Immunother 2016;12:1363–72.
9. Insinga RP, Glass AG, Rush BB, et al. The health care costs of cervical human papillomavirus-related disease. Am J Obstet Gynecol 2004;191:114–20.
10. Chesson HW, Blandford JM, Gift TL, et al. The estimated direct medical cost of sexually transmitted diseases among American youth, 2000. Perspect Sex Reprod Health 2004;36:11–9.
11. Chesson HW, Ekwueme DU, Saraiya M, et al. Estimates of the annual direct medical costs of the prevention and treatment of disease associated with human papillomavirus in the United States. Vaccine 2012;30:6016–9.
12. Food and Drug Administration. Product approval information - licensing action, package insert: Gardasil. 2010. Accessed at www.fda.gov/downloads/BiologicsBloodVaccines/Vaccines/ApprovedProducts/UCM111263.pdf.
13. Ward G, Mehta V, Moore M. Morbidity, mortality and cost from HPV-related oropharyngeal cancer: Impact of 2-, 4- and 9-valent vaccines. Hum Vaccin Immunother 2016;12:1343–7.
14. Guo T, Eisele DW, Fakhry C. The potential impact of prophylactic human papillomavirus vaccination on oropharyngeal cancer. Cancer 2016;122:2313–23.
15. Food and Drug Administration. Product approval information - licensing action, package insert: Gardasil 9. 2014. Accessed at www.fda.gov/BiologicsBloodVaccines/Vaccines/ApprovedProducts/ucm426445.htm.
16. Reagan-Steiner S, Yankey D, Jeyarajah J, et al. National, regional, state, and selected local area vaccination coverage among adolescents aged 13-17 Years - United States, 2015. MMWR Morb Mortal Wkly Rep 2016;65:850–8.
17. Healthy People 2020. Accessed at www.healthypeople.gov/2020/topics-objectives/national-snapshot/hpv-vaccine-adolescents-2008%E2%80%932012.
18. Garland SM. The Australian experience with the human papillomavirus vaccine. Clin Therapeut 2014;36:17–23.
19. Brabin L, Roberts SA, Stretch R, et al. Uptake of first two doses of human papillomavirus vaccine by adolescent schoolgirls in Manchester: prospective cohort study. BMJ 2008;336:1056–8.
20. Food and Drug Administration. Prescribing information [package insert]. Gardasil 9. 2016. Accessed at www.fda.gov/downloads/BiologicsBloodVaccines/Vaccines/ApprovedProducts/UCM426457.pdf
21. Meites E, Kempe A, Markowitz LE. Use of a 2-dose schedule for human papillomavirus vaccination - updated recommendations of the Advisory Committee on Immunization Practices. MMWR Morb Mortal Wkly Rep 2016;65:1405–8.
22. Gilkey MB, McRee AL. Provider communication about HPV vaccination: a systematic review. Hum Vaccin Immunother 2016;12:1454–68.
23. Clark SJ, Cowan AE, Filipp SL, et al. Parent perception of provider interactions influences hpv vaccination status of adolescent females. Clin Pediatr (Phila) 2016;55:701–6.
24. Ferrer HB, Trotter C, Hickman M, Audrey S. Barriers and facilitators to HPV vaccination of young women in high-income countries: a qualitative systematic review and evidence synthesis. BMC Public Health 2014;14:700.
25. Clark SJ, Cowan AE, Filipp SL, et al. Parent HPV vaccine perspectives and the likelihood of HPV vaccination of adolescent males. Hum Vaccin Immunother 2016;12:47–51.
26. Darden PM, Jacobson RM. Impact of a physician recommendation. Hum Vaccin Immunother 2014;10:2632–5.
27. Darden PM, Thompson DM, Roberts JR, et al. Reasons for not vaccinating adolescents: national immunization survey of teens, 2008-2010. Pediatrics 2013;131:645–51.
28. Gargano LM, Herbert NL, Painter JE, et al. Impact of a physician recommendation and parental immunization attitudes on receipt or intention to receive adolescent vaccines. Hum Vaccin Immunother 2013;9:2627–33.
29. Ylitalo KR, Lee H, Mehta NK. Health care provider recommendation, human papillomavirus vaccination, and race/ethnicity in the US National Immunization Survey. Am J Public Health 2013;103:164–9.
30. Brewer NT, Gottlieb SL, Reiter PL, et al. Longitudinal predictors of human papillomavirus vaccine initiation among adolescent girls in a high-risk geographic area. Sex Transm Dis 2011;38:197–204.
31. Reiter PL, McRee AL, Pepper JK, et al. Longitudinal predictors of human papillomavirus vaccination among a national sample of adolescent males. Am J Public Health 2013;103:1419–27.
32. Gottvall M, Grandahl M, Hoglund AT, et al. Trust versus concerns-how parents reason when they accept HPV vaccination for their young daughter. Ups J Med Sci 2013;118:263–70.
33. Vadaparampil ST, Malo TL, Kahn JA, et al. Physicians’ human papillomavirus vaccine recommendations, 2009 and 2011. Am J Prev Med 2014;46:80–4.
34. Vadaparampil ST, Malo TL, Sutton SK, et al. Missing the target for routine human papillomavirus vaccination: consistent and strong physician recommendations are lacking for 11- to 12-year-old males. Cancer Epidemiol Biomarkers Prev 2016;25:1435–46.
35. Stokley S, Jeyarajah J, Yankey D, et al. Human papillomavirus vaccination coverage among adolescents, 2007-2013, and postlicensure vaccine safety monitoring, 2006-2014 - United States. MMWR Morb Mortal Wkly Rep 2014;63:620–4.
36. Gilkey MB, Moss JL, Coyne-Beasley T, et al. Physician communication about adolescent vaccination: How is human papillomavirus vaccine different? Prev Med 2015;77:181–5.
37. Gilkey MB, Malo TL, Shah PD, et al. Quality of physician communication about human papillomavirus vaccine: findings from a national survey. Cancer Epidemiol Biomarkers Prev 2015;24:1673–9.
38. Herzog R, Alvarez-Pasquin MJ, Diaz C, et al. Are healthcare workers’ intentions to vaccinate related to their knowledge, beliefs and attitudes? A systematic review. BMC Pub Health 2013;13:154.
39. Hughes CC, Jones AL, Feemster KA, Fiks AG. HPV vaccine decision making in pediatric primary care: a semi-structured interview study. BMC Pediatr 2011;11:74.
40. Gilkey MB, Calo WA, Moss JL, et al. Provider communication and HPV vaccination: the impact of recommendation quality. Vaccine 2016;34:1187–92.
41. Malo TL, Ali KN, Sutton SK, et al. The content and context of physicians’ communication with males about human papillomavirus vaccination. Hum Vaccin Immunother 2016;12:1511–8.
42. Moss JL, Gilkey MB, Rimer BK, Brewer NT. Disparities in collaborative patient-provider communication about human papillomavirus (HPV) vaccination. Hum Vaccin Immunother 2016:0.
43. Suryadevara M, Handel A, Bonville CA, et al. Pediatric provider vaccine hesitancy: an under-recognized obstacle to immunizing children. Vaccine 2015;33:6629–34.
44. Mohammed KA, Geneus CJ, Osazuwa-Peters N, et al. Disparities in provider recommendation of human papillomavirus vaccination for U.S. adolescents. J Adolesc Health 2016;59:592–8.
45. Perkins RB, Clark JA. Providers’ perceptions of parental concerns about HPV vaccination. J Health Care Poor Underserved 2013;24:828–39.
46. Bloom BR, Marcuse E, Mnookin S. Addressing vaccine hesitancy. Science 2014;344:339.
47. Zimet GD. Health care professionals and adolescent vaccination. A call for intervention research. Hum Vaccin Immunother 2014;10:2629–30.
48. Task Force on Community Preventive Services. The guide to community preventive services: increasing appropriate vaccination. 2014. Accessed at www.thecommunityguide.org/vaccines/index.html.
49. Willis N, Hill S, Kaufman J, et al. “Communicate to vaccinate”: the development of a taxonomy of communication interventions to improve routine childhood vaccination. BMC Int Health Hum Rights 2013;13:23.
50. Dempsey AF, Zimet GD. Interventions to improve adolescent vaccination: what may work and what still needs to be tested. Vaccine 2015;33 Suppl 4:D106–113.
51. Walling EB, Benzoni N, Dornfeld J, et al. Interventions to improve HPV vaccine uptake: a systematic review. Pediatrics 2016;138(1).
52. Smulian EA, Mitchell KR, Stokley S. Interventions to increase HPV vaccination coverage: a systematic review. Hum Vaccin Immunother 2016;12:1566–88.
53. Opel DJ, Heritage J, Taylor JA, et al. The architecture of provider-parent vaccine discussions at health supervision visits. Pediatrics 2013;132:1037–46.
54. Moss JL, Reiter PL, Rimer BK, Brewer NT. Collaborative patient-provider communication and uptake of adolescent vaccines. Soc Sci Med 2016;159:100–7.
55. Lockhart S, Barnard J, O’Leary ST, et al. Exploring the feasibility of implementing a multifaceted toolkit to improve HPV vaccine provider communication in primary care settings. Presented at: Annual Meeting of the American Public Health Association; 2016; Denver, CO.
56. Reno J, O’Leary ST, Lockhart S, et al. Assessment of a communication toolkit for healcare providers about adolescent HPV vaccination. Presented at: Pediatric Academic Societies Annual Meeting; 2015; Baltimore, MD.
57. www.motivationalinterviewing.org
58. Foxcroft DR, Coombes L, Wood S, et al. Motivational interviewing for the prevention of alcohol misuse in young adults. Cochrane Database Syst Rev 2016;(7):CD007025.
59. Lindson-Hawley N, Thompson TP, Begh R. Motivational interviewing for smoking cessation. Cochrane Database Syst Rev 2015(3):CD006936.
60. McCain J. To heal the body, get into the patient’s head: motivational interviewing: to improve adherence. Biotechnol Healthc 2012;9:10–2.
61. Boutin-Foster C, Scott E, Rodriguez A, et al. The trial using motivational interviewing and positive affect and self-affirmation in african-americans with hypertension (TRIUMPH): from theory to clinical trial implementation. Contemp Clin Trials 2013;35:8–14.
62. Gance-Cleveland B. Motivational interviewing for adolescent obesity. Am J Nurs 2013;113:11.
63. Hides L, Carroll S, Scott R, et al. Quik fix: a randomized controlled trial of an enhanced brief motivational interviewing intervention for alcohol/cannabis and psychological distress in young people. Psychother Psychosom 2013;82:122–4.
64. Rongkavilit C, Naar-King S, Wang B, et al. Motivational interviewing targeting risk behaviors for youth living with HIV in Thailand. AIDS Behav 2013;17:2063–74.
65. Leask J, Kinnersley P, Jackson C, et al. Communicating with parents about vaccination: a framework for health professionals. BMC Pediatr 2012;12:154.
66. Zimet GD, Perkins SM, Sturm LA, et al. Predictors of STI vaccine acceptability among parents and their adolescent children. J Adolesc Health 2005;37:179–86.
67. Perkins RB, Zisblatt L, Legler A, et al. Effectiveness of a provider-focused intervention to improve HPV vaccination rates in boys and girls. Vaccine 2015;33:1223–9.
68. MacDonald N, Finlay JC. Working with vaccine-hesitant parents. Paediatr Child Health 2013;18:265–7.
69. Dempsey A, Lockhart S, Pyrzanowski J, et al. Impact of motivational interviewing training on providers communication about adolescent HPV vaccination. Presented at: Pediatric Academic Societies Annual Meeting; 2015; Baltimore, MD.
70. Brackett A, Butler M, Chapman L. Using motivational interviewing in the community pharmacy to increase adult immunization readiness: A pilot evaluation. J Am Pharm Assoc (2003) 2015;55:182–6.
71. Holman DM, Benard V, Roland KB, et al. Barriers to human papillomavirus vaccination among US adolescents: a systematic review of the literature. JAMA Pediatrics 2014;168:76–82.
72. Rambout L, Tashkandi M, Hopkins L, Tricco AC. Self-reported barriers and facilitators to preventive human papillomavirus vaccination among adolescent girls and young women: a systematic review. Prev Med 2014;58:22–32.
73. McSherry LA, Dombrowski SU, Francis JJ, et al. ‘It’s a can of worms’: understanding primary care practitioners’ behaviours in relation to HPV using the Theoretical Domains Framework. Implement Sci 2012;7:73.
74. Palmer J, Carrico C, Coxtanzo C. Identifying and overcoming perceived barriers of providers towards HPV vaccination: A literature review. J Vaccines 2015:7.
75. Gowda C, Schaffer SE, Dombkowski KJ, Dempsey AF. Understanding attitudes toward adolescent vaccination and the decision-making dynamic among adolescents, parents and providers. BMC Public Health 2012;12:509.
76. Plantin L, Daneback K. Parenthood, information and support on the internet. A literature review of research on parents and professionals online. BMC Fam Pract 2009;10:34.
77. Irizarry T, DeVito Dabbs A, Curran CR. Patient portals and patient engagement: a state of the science review. J Med Internet Res 2015;17:e148.
78. Clark SJ, Costello LE, Gebremariam A, Dombkowski KJ. A national survey of parent perspectives on use of patient portals for their children’s health care. Appl Clin Inform 2015;6:110–9.
79. Noar SM, Benac CN, Harris MS. Does tailoring matter? Meta-analytic review of tailored print health behavior change interventions. Psychol Bull 2007;133:673–93.
80. Kreuter MW, Strecher VJ, Glassman B. One size does not fit all: the case for tailoring print materials. Ann Behav Med 1999;21:276–83.
81. Hawkins RP, Kreuter M, Resnicow K, et al. Understanding tailoring in communicating about health. Health Educ Res 2008;23:454–66.
82. Lustria ML, Noar SM, Cortese J, et al. A meta-analysis of web-delivered tailored health behavior change interventions. J Health Commun 2013;18:1039–69.
83. Paiva AL, Lipschitz JM, Fernandez AC, et al. Evaluation of the acceptability and feasibility of a computer-tailored intervention to increase human papillomavirus vaccination among young adult women. J Am College Health 2014;62:32–8.
84. Gerend MA, Shepherd MA, Lustria ML. Increasing human papillomavirus vaccine acceptability by tailoring messages to young adult women’s perceived barriers. Sex Transm Dis 2013;40:401–5.
85. Bennett AT, Patel DA, Carlos RC, et al. Human papillomavirus vaccine uptake after a tailored, online educational intervention for female university students: a randomized controlled trial. J Womens Health (Larchmt) 2015;24:950–7.
86. Maertens J, Zambrano-Jiminez A, Dempsey AF. Using community engagement to develop a web-based intervention for Latinas about the HPV vaccine. J Health Commun 2017. Forthcoming.
87. Reno J, Maertens J, Jimenez-Zambrano A, et al. Effectiveness of a tailored intervention on changing hpv vaccination intention among Hispanics. Presented at: Pediatric Academic Societies Meeting; 2016; Baltimore, MD.
88. Daley MF, Liddon N, Crane LA, et al. A national survey of pediatrician knowledge and attitudes regarding human papillomavirus vaccination. Pediatrics 2006;118:2280–9.
89. Sussman AL, Helitzer D, Sanders M,et al. HPV and cervical cancer prevention counseling with younger adolescents: implications for primary care. Ann Fam Med 2007;5:298–304.
90. Perkins RB, Chigurupati NL, Apte G, et al. Why don’t adolescents finish the HPV vaccine series? A qualitative study of parents and providers. Hum Vaccin Immunother 2016;12:1528–35.
91. Centers for Disease Control and Prevention. Immunization Education & Training. You are the key to HPV cancer prevention. Accessed at www.cdc.gov/vaccines/ed/hpv/index.html.
92. Malo TL, Gilkey MB, Hall ME, et al. Messages to motivate human papillomavirus vaccination: national studies of parents and physicians. Cancer Epidemiol Biomarkers Prev 2016;25:1383–91.
93. Chapman G. Increasing vaccination without changing beliefs. 2016. Accessed at http://catalyst.nejm.org/increasing-vaccination-without-changing-beliefs/.
94. Rossen I, Hurlstone MJ, Lawrence C. Going with the grain of cognition: applying insights from psychology to build support for childhood vaccination. Front Psychol 2016;7:1483.
95. Shah PD, Gilkey MB, Pepper JK, et al. Promising alternative settings for HPV vaccination of US adolescents. Exp Rev Vaccine 2014;13:235–46.
96. Webb TL, Sheeran P. Does changing behavioral intentions engender behavior change? A meta-analysis of the experimental evidence. Psychol Bull 2006;132:249–68.
97. Janczyk M, Dambacher M, Bieleke M, Gollwitzer PM. The benefit of no choice: goal-directed plans enhance perceptual processing. Psychol Res 2015;79:206–20.
98. Wieber F, Thurmer JL, Gollwitzer PM. Promoting the translation of intentions into action by implementation intentions: behavioral effects and physiological correlates. Front Hum Neurosci 2015;9:395.
99. Chapman J, Armitage CJ, Norman P. Comparing implementation intention interventions in relation to young adults’ intake of fruit and vegetables. Psychol Health 2009;24:317–32.
100. Martin J, Sheeran P, Slade P, et al. Implementation intention formation reduces consultations for emergency contraception and pregnancy testing among teenage women. Health Psychol 2009;28:762–9.
101. Chapman J, Armitage CJ. Do techniques that increase fruit intake also increase vegetable intake? Evidence from a comparison of two implementation intention interventions. Appetite 2012;58:28–33.
102. Armitage CJ, Arden MA. Enhancing the effectiveness of alcohol warning labels with a self-affirming implementation intention. Health Psychol 2016;35:1159–63.
103. Bradbury D, Upsher R, Chilcot J. A pilot randomised test of a self-affirmation implementation intention intervention to reduce dietary salt intake. J Health Psychol 2016 May 22.
104. Chen XJ, Liu LL, Cui JF, et al. The effect and mechanisms of implementation intention in improving prospective memory performance in schizophrenia patients. Psychiatry Res 2016;244:86–93.
105. Hagger MS, Luszczynska A, de Wit J, et al. Implementation intention and planning interventions in health psychology: recommendations from the Synergy Expert Group for research and practice. Psychol Health 2016;31:814–39.
106. Vet R, de Wit JB, Das E. The role of implementation intention formation in promoting hepatitis B vaccination uptake among men who have sex with men. Int J STD AIDS 2014;25:122–9.
107. Milkman KL, Beshears J, Choi JJ, et al. Using implementation intention prompts to enhance influenza vaccination rates. Proc Natl Acad Sci U S A 2011;108:10415–20.
108. McCaul KD, Johnson RJ, Rothman AJ. The effects of framing and action instructions on whether older adults obtain flu shots. Health Psychol 2002;21:624–8.
109. Centers for Disease Control and Prevention. You are the key: health care providers’ tip sheet. 2015. Accessed at www.cdc.gov/vaccines/who/teens/for-hcp-tipsheet-hpv.pdf.
110. American Academy of Pediatrics. HPV vaccine champion toolkit. 2015. Accessed at www.aap.org/en-us/advocacy-and-policy/aap-health-initiatives/Pages/HPV-Champion-Toolkit.aspx.
111. Nyhan B, Reifler J. Does correcting myths about the flu vaccine work? An experimental evaluation of the effects of corrective information. Vaccine 2015;33:459–64.
112. Betsch C, Sachse K. Debunking vaccination myths: strong risk negations can increase perceived vaccination risks. Health Psychol 2013;32:146–55.
113. Nyhan B, Reifler J, Richey S, Freed GL. Effective messages in vaccine promotion: a randomized trial. Pediatrics 2014;133:e835–842.
114. Schwartz N, Sanna LJ, Skurnik I, Yoon C. Metacognitive expriences and the intericacies of setting people straight: Implications for debiasing and public information campaigns. Adv Exper Social Psychol 2007;39:127–161.
115. Lord C, Ross L, Lepper MR. Biased assimilation and attitude polarization: the effects of prior theories on subsequently considered evidence. J Personality Soc Pscyhol 1979;37:2098–109.
116. Siegrist M, Cvetkovich G. Better negative than positive? Evidence of a bias for negative information about possible health dangers. Risk Analysis 2001;21:199–206.
117. Witte K, Allen M. A meta-analysis of fear appeals: implications for effective public health campaigns. Health Educ Behav 2000;27:591–615.
118. Gerend MA, Shepherd JE. Using message framing to promote acceptance of the human papillomavirus vaccine. Health Psychol 2007;26:745–52.
119. Ferguson E, Gallagher L. Message framing with respect to decisions about vaccination: the roles of frame valence, frame method and perceived risk. Br J Psychol (London:1953) 2007;98(Pt 4):667–80.
120. Jarrett C, Wilson R, O’Leary M, et al. Strategies for addressing vaccine hesitancy - A systematic review. Vaccine 2015;33:4180–90.
121. Laranjo L, Arguel A, Neves AL, et al. The influence of social networking sites on health behavior change: a systematic review and meta-analysis. J Am Med Inform Assoc 2015;22:243–56.
122. Maher CA, Lewis LK, Ferrar K, et al. Are health behavior change interventions that use online social networks effective? A systematic review. J Med Internet Res 2014;16:e40.
123. Betsch C, Brewer NT, Brocard P, et al. Opportunities and challenges of Web 2.0 for vaccination decisions. Vaccine 2012;30:3727–33.
124. Barrett Values Center. Values versus beliefs. 2016. Accessed 31 Oct 2016 at www.valuescentre.com/mapping-values/values/values-vs-beliefs.
125. Dore RA, Stone ER, Buchanan CM. A social values analysis of parental decision making. J Psychol 2014;148:477–504.
126. Cohen GL, Sherman DK. The psychology of change: self-affirmation and social psychological intervention. Ann Rev Psychol 2014;65:333–71.
127. Sweeney AM, Moyer A. Self-affirmation and responses to health messages: a meta-analysis on intentions and behavior. Health Psychol 2015;34:149–59.
128. Tiro JA, Lee SC, Marks EG, et al. Developing a tablet-based self-persuasion intervention promoting adolescent hpv vaccination: protocol for a three-stage mixed-methods study. JMIR Res Protoc 2016;5:e19.
129. Leask J, Macartney K. Parental decisions about vaccination: collective values are important. J Paediatr Child Health 2008;44:534–5.
130. Salmon DA, Omer SB. Individual freedoms versus collective responsibility: immunization decision-making in the face of occasionally competing values. Emerg Themes Epidemiol 2006;3:13.
131. Gidengil C, Lieu TA, Payne K, et al. Parental and societal values for the risks and benefits of childhood combination vaccines. Vaccine 2012;30:3445–52.
132. Attwell K, Freeman M. I immunise: an evaluation of a values-based campaign to change attitudes and beliefs. Vaccine 2015;33:6235–40.
133. Witteman HO. Addressing vaccine hesitancy with values. Pediatrics 2015;136:215–7.
134. Witteman HO, Chipenda Dansokho S, Exe N, et al. Risk Communication, values clarification, and vaccination decisions. Risk Anal 2015;35:1801–19.
135. Ohannessian R, Yaghobian S, Verger P, Vanhems P. A systematic review of serious video games used for vaccination. Vaccine 2016.
136. National Vaccine Advisory Committee. Assessing the state of vaccine confidence in the United States: recommendations from the National Vaccine Advisory Committee. Pub Health Rep 2015;130:573–95.
137. Dube E, Vivion M, MacDonald NE. Vaccine hesitancy, vaccine refusal and the anti-vaccine movement: influence, impact and implications. Exp Rev Vaccine 2015;14:99–117.
The Diagnosis and Initial Treatment of Patellofemoral Disorders
Take-Home Points
- Patellofemoral disorders should be classified and diagnosed according to specific diagnostic categories (eg, lateral patellar compression syndrome) based on etiology rather than nondescriptive terminology (eg, internal derangement, patellofemoral pain syndrome).
- Patellofemoral dysplasia defines a spectrum of abnormalities ranging from the mild lateral patellar compression syndrome to the severe recurrent patellar dislocation.
- There is an inverse relationship between patient activity level and underlying patellofemoral dysplasia. This relationship determines threshold levels for each patient becoming symptomatic.
- Patients should be examined for 7 physical abnormalities, and if present, in what severity. These 7 are: vastus medialis obliquus deficiency, medial patellofemoral ligament laxity, lateral retinaculum tightness, increased quadriceps angle, hip abductor weakness, patella alta, and trochlear dysplasia.
- Advanced imaging is rarely, if ever, needed to make a diagnosis or to formulate an initial treatment plan for these common patellofemoral disorders.
To diagnose any disease or disorder implies an understanding of the condition’s cause(s), which should then lead to a logical treatment plan. For all too long, however, the diagnosis and treatment of patellofemoral disorders have been hampered by diagnoses that lack specific definitions based on etiology. A few of these are: internal derangement, chondromalacia patellae, patellar maltracking, and patellofemoral pain syndrome.
To simplify the diagnosis of patellofemoral disorders, we use a clinical classification based on etiology. This system’s defined diagnostic categories are useful in identifying probable cause(s), which can be appropriately evaluated and treated (Table).1 In simple terms, the philosophy of this approach is to try to find out what’s wrong, and try to fix it!
This clinical classification provides a framework for common patellofemoral conditions that are more easily diagnosed, yet is intentionally incomplete omitting rare conditions (eg, tumors, metabolic bone disease, neurologic conditions). 
Patellofemoral Dysplasia
Patellofemoral dysplasia (or extensor mechanism malfunction) is a cluster of physical abnormalities relating to the patellofemoral joint that vary from mild to severe and affect the normal function of that joint. As such, patellofemoral dysplasia itself should be considered on a continuum of mild to severe. To simplify the diagnosis, the clinician should systematically identify these factors and their severity. Armed with this information, the clinician can make the diagnosis and formulate a logical treatment plan for each individual patient.
This article focuses on 7 physical abnormalities that are most likely developmental and that can be identified through physical and radiologic examination. When and how each patient with patellofemoral dysplasia becomes symptomatic are determined by 2 key factors: patellofemoral dysplasia severity and activity level (sedentary to strenuous), in an inverse relationship (Figure 1).2
Seven Key Patellofemoral Physical Abnormalities
Of the 7 commonly identified physical abnormalities that affect the normal functioning of the patellofemoral joint, 5 are discovered by physical examination and 2 by radiography; CT and MRI are seldom needed in the initial evaluation. The most accurate and objective method should be used to assess the presence and severity of each abnormality.
The 7 abnormalities are vastus medialis obliquus (VMO) deficiency, medial patellofemoral ligament (MPFL) laxity, lateral retinaculum (LR) tightness, increased quadriceps (Q) angle, hip abductor weakness, patella alta, and trochlear dysplasia. We list these not in order of importance but in the order in which they are usually encountered during initial evaluation. We advocate for examining both knees including axial patellofemoral radiographs because patellofemoral disorders are frequently bilateral. It is helpful to use an abnormality checklist so none are forgotten. Also useful is a simple shorthand for findings: 0 = normal (no abnormality), 1 = mild abnormality, 2 = moderate abnormality, 3 = severe abnormality, with the right knee always recorded first (R/L). For example, severe left MPFL laxity is recorded as 0/3. Numerical values (eg, Q angles) can be directly recorded in this manner: 14°/23°.
1. Vastus Medialis Obliquus Deficiency
VMO deficiency is best seen as the sitting patient actively maintains the unsupported foot and leg at 30° knee flexion. Normally, the VMO inserts into the upper half or third of the medial edge of the patella; a deficient VMO inserts higher into the medial edge of the quadriceps tendon, or it is absent and leaves a characteristic hollow at the medial edge of the patella (Figure 2).4
2. Medial Patellofemoral Ligament Laxity
MPFL laxity is assessed with the lateral glide test. Again, the patient sits, but with quadriceps relaxed and foot and leg supported at 30° knee flexion. With the clinician mentally dividing the patella into vertical quadrants and pushing the patella laterally, the normal patella moves about 1 quadrant or 1 fingerbreadth. Severe MPFL laxity often elicits a positive apprehension response during the test. (Tip: Many patients are unable to relax the quadriceps while sitting; therefore, examine them supine and lift the knee into 30° flexion.) Such laxity usually means the MPFL was torn in a previous dislocation and remains elongated, leaving the patella vulnerable to repeated dislocations. The clinician should be alert to the possibility of hyperelastosis (Ehlers-Danlos syndrome) and a hyper-mobile patella. The opposite limb should be evaluated for asymmetric laxity.
3. Lateral Retinaculum Tightness
LR tightness is assessed with the medial glide test, again with the quadriceps relaxed and the knee supported at 30° flexion. With a normal LR, the patella can be pushed medially about 1 quadrant or 1 fingerbreadth. Some clinicians prefer the lateral tilt-up test, in which the lateral edge of the patella is lifted up, but this method is more difficult to quantify, is affected by the cross-sectional shape of the patella, and lacks consistency.
4. Increased Quadriceps Angle
The Q angle is one of the most important factors in the normal functioning of the patellofemoral joint. For more than a century,8 multiple operations have been used successfully to move the tibial tubercle (TT) and patellar ligament from a lateral position to a medial position thereby decreasing the Q angle. It is only logical to measure this angle at every knee examination to check for an abnormal increase, and the degree. The term quadriceps angle, or Q angle, was first used in 1964 by Brattström,7 who defined it as the “supplemental angle” to the valgus angle formed by the “quadriceps’ resultant” (line of force or vector) “+ patella + ligamentum patellae”. This might be called the dynamic Q angle. With there being no clinical method of measuring the “quadriceps line of force”, or quadriceps vector, clinicians used a line from the anterior superior iliac spine to the center of the patella, yet still called it the Q angle. By convention, this anatomical Q angle has been accepted as the Q angle.
Because the Q angle is the only clinical measurement of TT lateralization at initial evaluation, its measurement should be standardized, accurate, and simple to perform. Placing the patient supine with the lower limb in neutral rotation (patella anterior) and the knee in full extension standardizes the position. In full extension, the tibia reaches its maximum external rotation owing to the terminal “screw home” mechanism. The clinician should center the patella to the trochlear groove (TG) while measuring the Q angle, as it is the relationship of the TT to the trochlea, not to the patella, that is important. If LR tightness prevents the patella from centering, that fact should be recorded during the medial glide test for LR tightness. 
Despite the importance of measuring the Q angle, there has been no standard technique. Multiple authors have attempted to define the “normal” Q angle. In 1999, Post9 reviewed 7 articles on the topic and found no agreement. Mean normal Q angles varied widely, from 5° to 23° (SD range, 0.08°-5°). Grelsamer and colleagues,10 using a long-armed goniometer and standard technique, found a mean Q angle of 15.7° for women and 13.3° for men; the small, 2.4° difference between them disappeared when the measurements were corrected for height. Men and women of similar height have similar Q angles. These findings disproved the common misattribution of the differences to the wider female pelvis.
Given this confusion and the lack of accuracy in measuring the Q angle, many, if not most, surgeons turned to special CT and MRI scanning techniques to measure the distance of lateralization from TT to TG (TT-TG distance). This technique, by necessity, enforced a standardization not found in the earlier Q angles studies. Patients were positioned supine with the knee fully extended, and patellar position was ignored in favor of the TG. However, recent articles11-14have called into question the accuracy and usefulness of TT-TG distance as an assessment of TT lateralization. As such, standardized measurement of the Q angle remains a simple, inexpensive, and clinically relevant method of assessing TT lateralization.
The possible causes of an increased Q angle are valgus limb alignment, internal femoral torsion, external tibial torsion, combined internal femoral and external tibial torsion with foot pronation (the “miserable malalignment” of James and colleagues15), and a TT-lateralizing proximal tibial malformation.
5. Hip Abductor Weakness
The step-down test is easily performed in the office by having the patient stand on a short stool or stair and then slowly step down with the opposite limb to just touch the heel and slowly arise again. A positive test is indicated by the Trendelenburg sign, with the pelvis dropping down and away from the symptomatic supporting limb, the flexing knee collapsing into valgus, and the patient tending to wobble and lack stability (Figure 4).16
6. Patella Alta
Patella alta not only allows the patella to escape the confines of the trochlea earlier during active knee extension increasing the risk of patellar dislocation, but also decreases the contact footprint with the trochlea, increasing the patellofemoral joint reaction force and potentially causing patellofemoral pain and even secondary chondrosis. The simplest way to assess patellar height is with a lateral radiograph of the knee. The 3 popular methods (Insall-Salvati, Caton-Deschamps, Blackburn-Peel) all put the normal patellar height ratio at approximately 1:1, ± 20%. Berg and colleagues18 compared radiologic techniques for measuring patellar height ratio and found that Blackburn-Peel was the most accurate, reliable, and reproducible method.
7. Trochlear Dysplasia
Trochlear dysplasia, most simply a flattening of the TG, is perhaps the most important factor effecting normal patellofemoral function. However, it remains the most difficult to correctly address surgically. Senavongse and Amis19 conducted a cadaveric study demonstrating the prime importance of the TG. They found patellar stability was reduced 30% by releasing the VMO, 49% by cutting the MPFL in full knee extension, and 70% by flattening the trochlea. The most common, successful operations for correcting patellar instability depend on changing other factors that guide patellar excursion to compensate for this trochlear flattening.
The simplest way to assess trochlear dysplasia is to measure the sulcus angle on an accurate axial view radiograph of the knee at 45° flexion (Merchant view).20 Dejour and colleagues21 popularized a technique of assessing and classifying trochlear dysplasia from a true lateral radiograph of the knee, which has the advantage of showing the trochlear at its proximal extent. Davies and colleagues22 evaluated the Dejour technique, along with patellar tilt, patellar height, and sulcus angle, to identify a rapid and reproducible radiologic feature that would indicate the need for further analysis by other imaging studies (eg, CT, MRI). They found that, if the sulcus angle was normal, analysis of other radiologic features was unlikely to reveal additional useful information. They also showed a correlation of increasing sulcus angle and severity of those other dysplasia features. Merchant and colleagues20 found a mean normal sulcus angle of 138º (SD, 6º; range, 126º-150º), and Aglietti and colleagues23 confirmed those findings with nearly identical values (mean, 137º; SD, 6º; range, 116º-151º).
Diagnosis and Initial Treatment Plan
Patellofemoral disorders generally are divided into patellofemoral pain and instability, but these 2 diagnostic categories are too broad to be useful. Patellofemoral pain is a symptom. Patellofemoral pain syndrome should never be used as a diagnosis because there is no accepted definition for the cluster of findings that customarily defines a syndrome. At initial evaluation, after the easily diagnosed causes of anterior knee pain (eg, prepatellar bursitis, TT apophysitis, patellar and quadriceps tendinitis) have been ruled out, the clinician should consider types of patellofemoral dysplasia for a presumptive diagnosis, which will then lead to a logical treatment program for each identified disorder. With a presumptive diagnosis established, almost all patients suffering from chronic anterior knee pain without history of injury are treated initially with rest, ice, and nonsteroidal anti-inflammatory drugs to restore joint homeostasis.3
Lateral Patellar Compression Syndrome
In 1975, Ficat and colleagues24 described features of what they called syndrome d’hyperpression externe de la rotule. Two years later, Ficat and Hungerford25 defined the syndrome as one “in which the patella is well centered in the trochlear sulcus and stable, but in which there is a functional lateralization onto a physiologically and often anatomically predominant lateral facet.” Using the tools we have described here, the clinician usually finds the cause(s) of this “functional lateralization.” Four abnormalities—VMO deficiency, LR tightness, increased standardized Q angle, and hip abductor weakness—can cause functional lateralization either alone when severe or in combination when mild or moderate.
For a presumptive diagnosis of LPCS, initial treatment is nonoperative, and successful in about 90% of patients. It should be obvious that most patients with chronic anterior knee pain have quadriceps atrophy. Physical therapy should be specifically focused on quadriceps strengthening, with absolutely no stress placed on the patellofemoral joint in flexion initially, and on hip abductor strengthening. Progressive resistive isometric quadriceps exercises can be performed with a weight-bench technique (Figures 5A-5D).26

Chronic Subluxation of Patella
With the use of axial patellofemoral radiographs (Merchant views),20 the clinician can determine if the “patella is well centered in the trochlear sulcus and stable” (an important part of the definition of LPCS). If the patient has no symptoms of recurrent instability or patellar dislocation, and these radiographs show a laterally subluxed patella (one not well centered in the trochlea), the diagnosis is most likely CSP, a moderate form of patellofemoral dysplasia (section II of the Table). In addition to the 4 abnormalities used in the diagnosis of LPCS (mentioned earlier), trochlear dysplasia also comes into play in the diagnosis of CSP. Just as the other abnormalities can vary from mild to severe, trochlear dysplasia can vary from mild (slightly shallow sulcus angle) to severe (flat or even convex sulcus angle). As the sulcus becomes shallower, the patella slides more laterally, increasing the likelihood of patellar dislocation.
As the patient with CSP gives no history of episodic patellar instability, treatment for CSP is almost identical to that for LPCS, with the primary focus on isometric quadriceps strengthening (DeHaven isometric exercises)27 and hip abductor muscle strengthening. In the presence of CSP radiographically, it is important to use McConnell taping and/or patellar bracing during muscular strengthening. A patient who achieves 20-lb isometric quadriceps strength, demonstrates a normal step-down test, and is assumed to be asymptomatic can be allowed to return to sports activities with use of a patellar brace. The patient should be counseled that there is an increased risk for patellar dislocation because of this chronic subluxation and the shallower sulcus.
As in LPCS, CSP symptoms that persist after dynamic strength is regained may require surgical intervention. The severity of identified abnormal factors (tight LR, increased Q angle, trochlear dysplasia) guides the surgeon in selecting appropriate corrective technique(s).
Recurrent Dislocation of Patella
Admittedly, given the number and subtlety of abnormal factors, the diagnosis of LPCS as a cause of patellofemoral pain can be challenging. However, RDP is at the opposite end of the spectrum. A history of prior patellar dislocation(s) almost always makes the diagnosis of RDP easier. The patient occasionally complains of a recurrent symptom, the knee “going out” or “giving way,” indicating that the diagnosis might be RDP. By carefully asking what the patient was doing and what happened when the knee “went out”, the clinician may be able to determine if the injury stemmed from sudden patellar pain causing reflex inhibition of the quadriceps or was a true dislocation. Both may be described as “going out” or “giving way”.
Assessment for the same 7 abnormalities helps establish the diagnosis, a logical treatment plan, and a guide for indicated surgery. The diagnostic focus is MPFL laxity and trochlear dysplasia. Prior lateral dislocation of the patella almost always requires rupture of the normal MPFL. The infrequent exception is a patient with hyper-elasticity of the skin and multiple joints (Ehlers-Danlos syndrome). Trochlear dysplasia is a significant risk factor for patellar dislocation. If the trochlea is normal and there is no MPFL laxity, the diagnosis of RDP should be questioned.
If surgery is indicated, the surgeon uses a list of the patient’s abnormalities and their severity as a guide in selecting reconstructive techniques. The more abnormalities found and the greater the severity of each, the more techniques are needed to achieve success. Preoperative exercises help speed postoperative recovery by addressing quadriceps and hip abductor weakness. In addition, an active exercise program gives the surgeon insight into the patient’s desire for and commitment to recovery. Other physical abnormalities to be considered in preoperative planning include MPFL laxity, LR tightness, increased Q angle, patella alta, and trochlear dysplasia.
Surgical tips: 1. When releasing the LR, never cut the vastus lateralis tendon, as this has a high likelihood of causing iatrogenic medial patellar subluxation.29 2. When medializing the TT, consider compensating for a shallow trochlea by “over-correcting” the Q angle to 5° to 10° measured with a surgical goniometer intraoperatively.
Summary
Basing clinical classification of disorders on etiology is a simple and effective way to diagnose common patellofemoral conditions. Identifying and rating the severity of patellofemoral dysplasia, using 7 commonly found physical abnormalities, guide the physician to a proper diagnosis and down logical treatment pathways. These principles should be incorporated into the routine evaluation of patellofemoral disorders to optimize diagnosis, formulate a treatment plan, and improve patient outcomes. After all, this is what our patients are asking us to do: Try to find what’s wrong, and then try to fix it!
Am J Orthop. 2017;46(2):68-75. Copyright Frontline Medical Communications Inc. 2017. All rights reserved.
1. Merchant AC. Classification of patellofemoral disorders. Arthroscopy. 1988;4(4):235-240.
2. Merchant AC. Patellofemoral disorders: biomechanics, diagnosis, and nonoperative treatment. In: McGinty JB, Caspari RB, Jackson RW, Poehling GG, eds. Operative Arthroscopy. New York, NY: Raven Press; 1991:261-275.
3. Dye SF. The knee as a biologic transmission with an envelope of function: a theory. Clin Orthop Relat Res. 1996;(325):10-18.
4. Merchant AC. A philosophy of the patellofemoral joint: a logical clinical approach. In: Sanchis-Alfonso V, ed. Anterior Knee Pain and Patellar Instability. 2nd ed. London, England: Springer; 2011:519-530.
5. Jan MH, Lin DH, Lin JJ, Lin CH, Cheng CK, Lin YF. Differences in sonographic characteristics of the vastus medialis obliquus between patients with patellofemoral pain syndrome and healthy adults. Am J Sports Med. 2009;37(9):1743-1749.
6. Pattyn E, Verdonk P, Steyaert A, et al. Vastus medialis obliquus atrophy: does it exist in patellofemoral pain syndrome? Am J Sports Med. 2011;39(7):1450-1455.
7. Brattström H. Shape of the intercondylar groove normally and in recurrent dislocation of the patella. A clinical and x-ray anatomical investigation. Acta Orthop Scand Suppl. 1964;68:1-147.
8. Roux D. Luxation habituelle de la rotule: traitement operatoire. Rev Chir Orthop Reparatrice Appar Mot. 1888;8:682-689.
9. Post WR. Clinical evaluation of patients with patellofemoral disorders. Arthroscopy. 1999;15(8):841-851.
10. Grelsamer RP, Dubey A, Weinstein CH. Men and women have similar Q angles: a clinical and trigonometric evaluation. J Bone Joint Surg Br. 2005;87(11):1498-1501.
11. Skelley N, Friedman M, McGinnis M, Smith C, Hillen T, Matava M. Inter- and intraobserver reliability in the MRI measurement of the tibial tubercle-trochlear groove distance and trochlea dysplasia. Am J Sports Med. 2015;43(4):873-878.
12. Tensho K, Akaoka Y, Shimodaira H, et al. What components comprise the measurement of the tibial tuberosity-trochlear groove distance in a patellar dislocation population? J Bone Joint Surg Am. 2015;97(17):1441-1448.
13. Camp CL, Heidenreich MJ, Dahm DL, Stuart MJ, Levy BA, Krych AJ. Individualizing the tibial tubercle-trochlear groove distance: patellar instability ratios that predict recurrent instability. Am J Sports Med. 2016;44(2):393-399.
14. Ridley TJ, Hinckel BB, Kruckeberg BM, Agel J, Arendt EA. Anatomical patella instability risk factors on MRI show sensitivity without specificity in patients with patellofemoral instability: a systematic review. JISAKOS. 2016;1(3):141-152.
15. James SL, Bates BT, Osternig LR. Injuries to runners. Am J Sports Med. 1978;6(2):40-50.
16. Powers CM, Souza RB, Fulkerson JP. Patellofemoral joint. In: Magee DJ, Zachazewski JE, Quillen WS, eds. Pathology and Intervention in Musculoskeletal Rehabilitation. St. Louis, MO: Saunders Elsevier; 2008:601-636.
17. Khayambashi K, Mohammadkhani Z, Ghaznavi K, Lyle MA, Powers CM. The effects of isolated hip abductor and external rotator muscle strengthening on pain, health status, and strength in females with patellofemoral pain: a randomized controlled trial. J Orthop Sports Phys Ther. 2012;42(1):22-29.
18. Berg EE, Mason SL, Lucas MJ. Patellar height ratios. A comparison of four measurement methods. Am J Sports Med. 1996;24(2):218-221.
19. Senavongse W, Amis AA. The effects of articular, retinacular, or muscular deficiencies on patellofemoral joint stability: a biomechanical study in vitro. J Bone Joint Surg Br. 2005;87(4):577-582.
20. Merchant AC, Mercer RL, Jacobsen RH, Cool CR. Roentgenographic analysis of patellofemoral congruence. J Bone Joint Surg Am. 1974;56(7):1391-1396.
21. Dejour H, Neyret P, Walch G. Factors in patellar instability. In: Aichroth PM, Cannon WD Jr, Patel DV, eds. Knee Surgery: Current Practice. London, England: Martin Dunitz; 1992.
22. Davies AP, Costa ML, Shepstone L, Glasgow MM, Donell S. The sulcus angle and malalignment of the extensor mechanism of the knee. J Bone Joint Surg Br. 2000;82(8):1162-1166.
23. Aglietti P, Insall JN, Cerulli G. Patellar pain and incongruence. I: measurements of incongruence. Clin Orthop Relat Res. 1983;(176):217-224.
24. Ficat P, Ficat C, Bailieaux A. External hypertension syndrome of the patella. Its significance in the recognition of arthrosis [in French]. Rev Chir Orthop Reparatrice Appar Mot. 1975;61(1):39-59.
25. Ficat P, Hungerford DS. Disorders of the Patellofemoral Joint. Baltimore, MD: Williams & Wilkins; 1977.
26. Merchant AC. The lateral compression syndrome. In: Fox JM, Del Pizzo W, eds. The Patellofemoral Joint. New York, NY: McGraw-Hill; 1993:157-175.
27. DeHaven KE, Dolan WA, Mayer PJ. Chondromalacia patellae in athletes. Clinical presentation and conservative management. Am J Sports Med. 1979;7(1):5-11.
28. Merchant AC. Patellofemoral joint disorders. In: Chapman MW, ed. Operative Orthopedics. Vol 3. Philadelphia, PA: Lippincott; 1988:2321-2366.
29. Sanchis-Alfonso V, Merchant AC. Iatrogenic medial patellar instability: an avoidable injury. Arthroscopy. 2015;31(8):1628-1632.
Take-Home Points
- Patellofemoral disorders should be classified and diagnosed according to specific diagnostic categories (eg, lateral patellar compression syndrome) based on etiology rather than nondescriptive terminology (eg, internal derangement, patellofemoral pain syndrome).
- Patellofemoral dysplasia defines a spectrum of abnormalities ranging from the mild lateral patellar compression syndrome to the severe recurrent patellar dislocation.
- There is an inverse relationship between patient activity level and underlying patellofemoral dysplasia. This relationship determines threshold levels for each patient becoming symptomatic.
- Patients should be examined for 7 physical abnormalities, and if present, in what severity. These 7 are: vastus medialis obliquus deficiency, medial patellofemoral ligament laxity, lateral retinaculum tightness, increased quadriceps angle, hip abductor weakness, patella alta, and trochlear dysplasia.
- Advanced imaging is rarely, if ever, needed to make a diagnosis or to formulate an initial treatment plan for these common patellofemoral disorders.
To diagnose any disease or disorder implies an understanding of the condition’s cause(s), which should then lead to a logical treatment plan. For all too long, however, the diagnosis and treatment of patellofemoral disorders have been hampered by diagnoses that lack specific definitions based on etiology. A few of these are: internal derangement, chondromalacia patellae, patellar maltracking, and patellofemoral pain syndrome.
To simplify the diagnosis of patellofemoral disorders, we use a clinical classification based on etiology. This system’s defined diagnostic categories are useful in identifying probable cause(s), which can be appropriately evaluated and treated (Table).1 In simple terms, the philosophy of this approach is to try to find out what’s wrong, and try to fix it!
This clinical classification provides a framework for common patellofemoral conditions that are more easily diagnosed, yet is intentionally incomplete omitting rare conditions (eg, tumors, metabolic bone disease, neurologic conditions).
Patellofemoral Dysplasia
Patellofemoral dysplasia (or extensor mechanism malfunction) is a cluster of physical abnormalities relating to the patellofemoral joint that vary from mild to severe and affect the normal function of that joint. As such, patellofemoral dysplasia itself should be considered on a continuum of mild to severe. To simplify the diagnosis, the clinician should systematically identify these factors and their severity. Armed with this information, the clinician can make the diagnosis and formulate a logical treatment plan for each individual patient.
This article focuses on 7 physical abnormalities that are most likely developmental and that can be identified through physical and radiologic examination. When and how each patient with patellofemoral dysplasia becomes symptomatic are determined by 2 key factors: patellofemoral dysplasia severity and activity level (sedentary to strenuous), in an inverse relationship (Figure 1).2
Seven Key Patellofemoral Physical Abnormalities
Of the 7 commonly identified physical abnormalities that affect the normal functioning of the patellofemoral joint, 5 are discovered by physical examination and 2 by radiography; CT and MRI are seldom needed in the initial evaluation. The most accurate and objective method should be used to assess the presence and severity of each abnormality.
The 7 abnormalities are vastus medialis obliquus (VMO) deficiency, medial patellofemoral ligament (MPFL) laxity, lateral retinaculum (LR) tightness, increased quadriceps (Q) angle, hip abductor weakness, patella alta, and trochlear dysplasia. We list these not in order of importance but in the order in which they are usually encountered during initial evaluation. We advocate for examining both knees including axial patellofemoral radiographs because patellofemoral disorders are frequently bilateral. It is helpful to use an abnormality checklist so none are forgotten. Also useful is a simple shorthand for findings: 0 = normal (no abnormality), 1 = mild abnormality, 2 = moderate abnormality, 3 = severe abnormality, with the right knee always recorded first (R/L). For example, severe left MPFL laxity is recorded as 0/3. Numerical values (eg, Q angles) can be directly recorded in this manner: 14°/23°.
1. Vastus Medialis Obliquus Deficiency
VMO deficiency is best seen as the sitting patient actively maintains the unsupported foot and leg at 30° knee flexion. Normally, the VMO inserts into the upper half or third of the medial edge of the patella; a deficient VMO inserts higher into the medial edge of the quadriceps tendon, or it is absent and leaves a characteristic hollow at the medial edge of the patella (Figure 2).4
2. Medial Patellofemoral Ligament Laxity
MPFL laxity is assessed with the lateral glide test. Again, the patient sits, but with quadriceps relaxed and foot and leg supported at 30° knee flexion. With the clinician mentally dividing the patella into vertical quadrants and pushing the patella laterally, the normal patella moves about 1 quadrant or 1 fingerbreadth. Severe MPFL laxity often elicits a positive apprehension response during the test. (Tip: Many patients are unable to relax the quadriceps while sitting; therefore, examine them supine and lift the knee into 30° flexion.) Such laxity usually means the MPFL was torn in a previous dislocation and remains elongated, leaving the patella vulnerable to repeated dislocations. The clinician should be alert to the possibility of hyperelastosis (Ehlers-Danlos syndrome) and a hyper-mobile patella. The opposite limb should be evaluated for asymmetric laxity.
3. Lateral Retinaculum Tightness
LR tightness is assessed with the medial glide test, again with the quadriceps relaxed and the knee supported at 30° flexion. With a normal LR, the patella can be pushed medially about 1 quadrant or 1 fingerbreadth. Some clinicians prefer the lateral tilt-up test, in which the lateral edge of the patella is lifted up, but this method is more difficult to quantify, is affected by the cross-sectional shape of the patella, and lacks consistency.
4. Increased Quadriceps Angle
The Q angle is one of the most important factors in the normal functioning of the patellofemoral joint. For more than a century,8 multiple operations have been used successfully to move the tibial tubercle (TT) and patellar ligament from a lateral position to a medial position thereby decreasing the Q angle. It is only logical to measure this angle at every knee examination to check for an abnormal increase, and the degree. The term quadriceps angle, or Q angle, was first used in 1964 by Brattström,7 who defined it as the “supplemental angle” to the valgus angle formed by the “quadriceps’ resultant” (line of force or vector) “+ patella + ligamentum patellae”. This might be called the dynamic Q angle. With there being no clinical method of measuring the “quadriceps line of force”, or quadriceps vector, clinicians used a line from the anterior superior iliac spine to the center of the patella, yet still called it the Q angle. By convention, this anatomical Q angle has been accepted as the Q angle.
Because the Q angle is the only clinical measurement of TT lateralization at initial evaluation, its measurement should be standardized, accurate, and simple to perform. Placing the patient supine with the lower limb in neutral rotation (patella anterior) and the knee in full extension standardizes the position. In full extension, the tibia reaches its maximum external rotation owing to the terminal “screw home” mechanism. The clinician should center the patella to the trochlear groove (TG) while measuring the Q angle, as it is the relationship of the TT to the trochlea, not to the patella, that is important. If LR tightness prevents the patella from centering, that fact should be recorded during the medial glide test for LR tightness.
Despite the importance of measuring the Q angle, there has been no standard technique. Multiple authors have attempted to define the “normal” Q angle. In 1999, Post9 reviewed 7 articles on the topic and found no agreement. Mean normal Q angles varied widely, from 5° to 23° (SD range, 0.08°-5°). Grelsamer and colleagues,10 using a long-armed goniometer and standard technique, found a mean Q angle of 15.7° for women and 13.3° for men; the small, 2.4° difference between them disappeared when the measurements were corrected for height. Men and women of similar height have similar Q angles. These findings disproved the common misattribution of the differences to the wider female pelvis.
Given this confusion and the lack of accuracy in measuring the Q angle, many, if not most, surgeons turned to special CT and MRI scanning techniques to measure the distance of lateralization from TT to TG (TT-TG distance). This technique, by necessity, enforced a standardization not found in the earlier Q angles studies. Patients were positioned supine with the knee fully extended, and patellar position was ignored in favor of the TG. However, recent articles11-14have called into question the accuracy and usefulness of TT-TG distance as an assessment of TT lateralization. As such, standardized measurement of the Q angle remains a simple, inexpensive, and clinically relevant method of assessing TT lateralization.
The possible causes of an increased Q angle are valgus limb alignment, internal femoral torsion, external tibial torsion, combined internal femoral and external tibial torsion with foot pronation (the “miserable malalignment” of James and colleagues15), and a TT-lateralizing proximal tibial malformation.
5. Hip Abductor Weakness
The step-down test is easily performed in the office by having the patient stand on a short stool or stair and then slowly step down with the opposite limb to just touch the heel and slowly arise again. A positive test is indicated by the Trendelenburg sign, with the pelvis dropping down and away from the symptomatic supporting limb, the flexing knee collapsing into valgus, and the patient tending to wobble and lack stability (Figure 4).16
6. Patella Alta
Patella alta not only allows the patella to escape the confines of the trochlea earlier during active knee extension increasing the risk of patellar dislocation, but also decreases the contact footprint with the trochlea, increasing the patellofemoral joint reaction force and potentially causing patellofemoral pain and even secondary chondrosis. The simplest way to assess patellar height is with a lateral radiograph of the knee. The 3 popular methods (Insall-Salvati, Caton-Deschamps, Blackburn-Peel) all put the normal patellar height ratio at approximately 1:1, ± 20%. Berg and colleagues18 compared radiologic techniques for measuring patellar height ratio and found that Blackburn-Peel was the most accurate, reliable, and reproducible method.
7. Trochlear Dysplasia
Trochlear dysplasia, most simply a flattening of the TG, is perhaps the most important factor effecting normal patellofemoral function. However, it remains the most difficult to correctly address surgically. Senavongse and Amis19 conducted a cadaveric study demonstrating the prime importance of the TG. They found patellar stability was reduced 30% by releasing the VMO, 49% by cutting the MPFL in full knee extension, and 70% by flattening the trochlea. The most common, successful operations for correcting patellar instability depend on changing other factors that guide patellar excursion to compensate for this trochlear flattening.
The simplest way to assess trochlear dysplasia is to measure the sulcus angle on an accurate axial view radiograph of the knee at 45° flexion (Merchant view).20 Dejour and colleagues21 popularized a technique of assessing and classifying trochlear dysplasia from a true lateral radiograph of the knee, which has the advantage of showing the trochlear at its proximal extent. Davies and colleagues22 evaluated the Dejour technique, along with patellar tilt, patellar height, and sulcus angle, to identify a rapid and reproducible radiologic feature that would indicate the need for further analysis by other imaging studies (eg, CT, MRI). They found that, if the sulcus angle was normal, analysis of other radiologic features was unlikely to reveal additional useful information. They also showed a correlation of increasing sulcus angle and severity of those other dysplasia features. Merchant and colleagues20 found a mean normal sulcus angle of 138º (SD, 6º; range, 126º-150º), and Aglietti and colleagues23 confirmed those findings with nearly identical values (mean, 137º; SD, 6º; range, 116º-151º).
Diagnosis and Initial Treatment Plan
Patellofemoral disorders generally are divided into patellofemoral pain and instability, but these 2 diagnostic categories are too broad to be useful. Patellofemoral pain is a symptom. Patellofemoral pain syndrome should never be used as a diagnosis because there is no accepted definition for the cluster of findings that customarily defines a syndrome. At initial evaluation, after the easily diagnosed causes of anterior knee pain (eg, prepatellar bursitis, TT apophysitis, patellar and quadriceps tendinitis) have been ruled out, the clinician should consider types of patellofemoral dysplasia for a presumptive diagnosis, which will then lead to a logical treatment program for each identified disorder. With a presumptive diagnosis established, almost all patients suffering from chronic anterior knee pain without history of injury are treated initially with rest, ice, and nonsteroidal anti-inflammatory drugs to restore joint homeostasis.3
Lateral Patellar Compression Syndrome
In 1975, Ficat and colleagues24 described features of what they called syndrome d’hyperpression externe de la rotule. Two years later, Ficat and Hungerford25 defined the syndrome as one “in which the patella is well centered in the trochlear sulcus and stable, but in which there is a functional lateralization onto a physiologically and often anatomically predominant lateral facet.” Using the tools we have described here, the clinician usually finds the cause(s) of this “functional lateralization.” Four abnormalities—VMO deficiency, LR tightness, increased standardized Q angle, and hip abductor weakness—can cause functional lateralization either alone when severe or in combination when mild or moderate.
For a presumptive diagnosis of LPCS, initial treatment is nonoperative, and successful in about 90% of patients. It should be obvious that most patients with chronic anterior knee pain have quadriceps atrophy. Physical therapy should be specifically focused on quadriceps strengthening, with absolutely no stress placed on the patellofemoral joint in flexion initially, and on hip abductor strengthening. Progressive resistive isometric quadriceps exercises can be performed with a weight-bench technique (Figures 5A-5D).26
Chronic Subluxation of Patella
With the use of axial patellofemoral radiographs (Merchant views),20 the clinician can determine if the “patella is well centered in the trochlear sulcus and stable” (an important part of the definition of LPCS). If the patient has no symptoms of recurrent instability or patellar dislocation, and these radiographs show a laterally subluxed patella (one not well centered in the trochlea), the diagnosis is most likely CSP, a moderate form of patellofemoral dysplasia (section II of the Table). In addition to the 4 abnormalities used in the diagnosis of LPCS (mentioned earlier), trochlear dysplasia also comes into play in the diagnosis of CSP. Just as the other abnormalities can vary from mild to severe, trochlear dysplasia can vary from mild (slightly shallow sulcus angle) to severe (flat or even convex sulcus angle). As the sulcus becomes shallower, the patella slides more laterally, increasing the likelihood of patellar dislocation.
As the patient with CSP gives no history of episodic patellar instability, treatment for CSP is almost identical to that for LPCS, with the primary focus on isometric quadriceps strengthening (DeHaven isometric exercises)27 and hip abductor muscle strengthening. In the presence of CSP radiographically, it is important to use McConnell taping and/or patellar bracing during muscular strengthening. A patient who achieves 20-lb isometric quadriceps strength, demonstrates a normal step-down test, and is assumed to be asymptomatic can be allowed to return to sports activities with use of a patellar brace. The patient should be counseled that there is an increased risk for patellar dislocation because of this chronic subluxation and the shallower sulcus.
As in LPCS, CSP symptoms that persist after dynamic strength is regained may require surgical intervention. The severity of identified abnormal factors (tight LR, increased Q angle, trochlear dysplasia) guides the surgeon in selecting appropriate corrective technique(s).
Recurrent Dislocation of Patella
Admittedly, given the number and subtlety of abnormal factors, the diagnosis of LPCS as a cause of patellofemoral pain can be challenging. However, RDP is at the opposite end of the spectrum. A history of prior patellar dislocation(s) almost always makes the diagnosis of RDP easier. The patient occasionally complains of a recurrent symptom, the knee “going out” or “giving way,” indicating that the diagnosis might be RDP. By carefully asking what the patient was doing and what happened when the knee “went out”, the clinician may be able to determine if the injury stemmed from sudden patellar pain causing reflex inhibition of the quadriceps or was a true dislocation. Both may be described as “going out” or “giving way”.
Assessment for the same 7 abnormalities helps establish the diagnosis, a logical treatment plan, and a guide for indicated surgery. The diagnostic focus is MPFL laxity and trochlear dysplasia. Prior lateral dislocation of the patella almost always requires rupture of the normal MPFL. The infrequent exception is a patient with hyper-elasticity of the skin and multiple joints (Ehlers-Danlos syndrome). Trochlear dysplasia is a significant risk factor for patellar dislocation. If the trochlea is normal and there is no MPFL laxity, the diagnosis of RDP should be questioned.
If surgery is indicated, the surgeon uses a list of the patient’s abnormalities and their severity as a guide in selecting reconstructive techniques. The more abnormalities found and the greater the severity of each, the more techniques are needed to achieve success. Preoperative exercises help speed postoperative recovery by addressing quadriceps and hip abductor weakness. In addition, an active exercise program gives the surgeon insight into the patient’s desire for and commitment to recovery. Other physical abnormalities to be considered in preoperative planning include MPFL laxity, LR tightness, increased Q angle, patella alta, and trochlear dysplasia.
Surgical tips: 1. When releasing the LR, never cut the vastus lateralis tendon, as this has a high likelihood of causing iatrogenic medial patellar subluxation.29 2. When medializing the TT, consider compensating for a shallow trochlea by “over-correcting” the Q angle to 5° to 10° measured with a surgical goniometer intraoperatively.
Summary
Basing clinical classification of disorders on etiology is a simple and effective way to diagnose common patellofemoral conditions. Identifying and rating the severity of patellofemoral dysplasia, using 7 commonly found physical abnormalities, guide the physician to a proper diagnosis and down logical treatment pathways. These principles should be incorporated into the routine evaluation of patellofemoral disorders to optimize diagnosis, formulate a treatment plan, and improve patient outcomes. After all, this is what our patients are asking us to do: Try to find what’s wrong, and then try to fix it!
Am J Orthop. 2017;46(2):68-75. Copyright Frontline Medical Communications Inc. 2017. All rights reserved.
1. Merchant AC. Classification of patellofemoral disorders. Arthroscopy. 1988;4(4):235-240.
2. Merchant AC. Patellofemoral disorders: biomechanics, diagnosis, and nonoperative treatment. In: McGinty JB, Caspari RB, Jackson RW, Poehling GG, eds. Operative Arthroscopy. New York, NY: Raven Press; 1991:261-275.
3. Dye SF. The knee as a biologic transmission with an envelope of function: a theory. Clin Orthop Relat Res. 1996;(325):10-18.
4. Merchant AC. A philosophy of the patellofemoral joint: a logical clinical approach. In: Sanchis-Alfonso V, ed. Anterior Knee Pain and Patellar Instability. 2nd ed. London, England: Springer; 2011:519-530.
5. Jan MH, Lin DH, Lin JJ, Lin CH, Cheng CK, Lin YF. Differences in sonographic characteristics of the vastus medialis obliquus between patients with patellofemoral pain syndrome and healthy adults. Am J Sports Med. 2009;37(9):1743-1749.
6. Pattyn E, Verdonk P, Steyaert A, et al. Vastus medialis obliquus atrophy: does it exist in patellofemoral pain syndrome? Am J Sports Med. 2011;39(7):1450-1455.
7. Brattström H. Shape of the intercondylar groove normally and in recurrent dislocation of the patella. A clinical and x-ray anatomical investigation. Acta Orthop Scand Suppl. 1964;68:1-147.
8. Roux D. Luxation habituelle de la rotule: traitement operatoire. Rev Chir Orthop Reparatrice Appar Mot. 1888;8:682-689.
9. Post WR. Clinical evaluation of patients with patellofemoral disorders. Arthroscopy. 1999;15(8):841-851.
10. Grelsamer RP, Dubey A, Weinstein CH. Men and women have similar Q angles: a clinical and trigonometric evaluation. J Bone Joint Surg Br. 2005;87(11):1498-1501.
11. Skelley N, Friedman M, McGinnis M, Smith C, Hillen T, Matava M. Inter- and intraobserver reliability in the MRI measurement of the tibial tubercle-trochlear groove distance and trochlea dysplasia. Am J Sports Med. 2015;43(4):873-878.
12. Tensho K, Akaoka Y, Shimodaira H, et al. What components comprise the measurement of the tibial tuberosity-trochlear groove distance in a patellar dislocation population? J Bone Joint Surg Am. 2015;97(17):1441-1448.
13. Camp CL, Heidenreich MJ, Dahm DL, Stuart MJ, Levy BA, Krych AJ. Individualizing the tibial tubercle-trochlear groove distance: patellar instability ratios that predict recurrent instability. Am J Sports Med. 2016;44(2):393-399.
14. Ridley TJ, Hinckel BB, Kruckeberg BM, Agel J, Arendt EA. Anatomical patella instability risk factors on MRI show sensitivity without specificity in patients with patellofemoral instability: a systematic review. JISAKOS. 2016;1(3):141-152.
15. James SL, Bates BT, Osternig LR. Injuries to runners. Am J Sports Med. 1978;6(2):40-50.
16. Powers CM, Souza RB, Fulkerson JP. Patellofemoral joint. In: Magee DJ, Zachazewski JE, Quillen WS, eds. Pathology and Intervention in Musculoskeletal Rehabilitation. St. Louis, MO: Saunders Elsevier; 2008:601-636.
17. Khayambashi K, Mohammadkhani Z, Ghaznavi K, Lyle MA, Powers CM. The effects of isolated hip abductor and external rotator muscle strengthening on pain, health status, and strength in females with patellofemoral pain: a randomized controlled trial. J Orthop Sports Phys Ther. 2012;42(1):22-29.
18. Berg EE, Mason SL, Lucas MJ. Patellar height ratios. A comparison of four measurement methods. Am J Sports Med. 1996;24(2):218-221.
19. Senavongse W, Amis AA. The effects of articular, retinacular, or muscular deficiencies on patellofemoral joint stability: a biomechanical study in vitro. J Bone Joint Surg Br. 2005;87(4):577-582.
20. Merchant AC, Mercer RL, Jacobsen RH, Cool CR. Roentgenographic analysis of patellofemoral congruence. J Bone Joint Surg Am. 1974;56(7):1391-1396.
21. Dejour H, Neyret P, Walch G. Factors in patellar instability. In: Aichroth PM, Cannon WD Jr, Patel DV, eds. Knee Surgery: Current Practice. London, England: Martin Dunitz; 1992.
22. Davies AP, Costa ML, Shepstone L, Glasgow MM, Donell S. The sulcus angle and malalignment of the extensor mechanism of the knee. J Bone Joint Surg Br. 2000;82(8):1162-1166.
23. Aglietti P, Insall JN, Cerulli G. Patellar pain and incongruence. I: measurements of incongruence. Clin Orthop Relat Res. 1983;(176):217-224.
24. Ficat P, Ficat C, Bailieaux A. External hypertension syndrome of the patella. Its significance in the recognition of arthrosis [in French]. Rev Chir Orthop Reparatrice Appar Mot. 1975;61(1):39-59.
25. Ficat P, Hungerford DS. Disorders of the Patellofemoral Joint. Baltimore, MD: Williams & Wilkins; 1977.
26. Merchant AC. The lateral compression syndrome. In: Fox JM, Del Pizzo W, eds. The Patellofemoral Joint. New York, NY: McGraw-Hill; 1993:157-175.
27. DeHaven KE, Dolan WA, Mayer PJ. Chondromalacia patellae in athletes. Clinical presentation and conservative management. Am J Sports Med. 1979;7(1):5-11.
28. Merchant AC. Patellofemoral joint disorders. In: Chapman MW, ed. Operative Orthopedics. Vol 3. Philadelphia, PA: Lippincott; 1988:2321-2366.
29. Sanchis-Alfonso V, Merchant AC. Iatrogenic medial patellar instability: an avoidable injury. Arthroscopy. 2015;31(8):1628-1632.
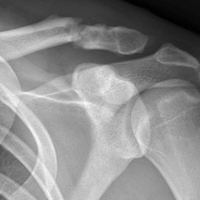
Correct Positioning of the Medial Patellofemoral Ligament: Troubleshooting in the Operating Room
Take-Home Points
- Use fluoroscopy, isometry, or both to double-check the femoral attachment point. Failure to do so can lead to an overtensioned or undertensioned graft caused by anisometric graft placement.
- To minimize the risk of fracture, avoid drilling transverse tunnels across the patella.
- Do not “pre-tension” the medial patellofemoral ligament graft. There should be little or no tension in the graft when the patella is centered in the groove, regardless of the angle of knee flexion.
- The angle of knee flexion during securing of the graft may be important for inaccurate femoral tunnel placement. Before final fixation of the graft, always range the knee fully to make sure full passive motion will be possible once the graft is secured.
- Understanding the anatomy of the MPFL is key before considering reconstructing: That is, fluoroscopy only suggests a “cloud” to begin assessment of the femoral attachment site and is secondary to anatomic references and check of length changes between the attachment point through range of motion. New studies demonstrate the patellar attachment is broad and extends proximally from the historical patellar attachment site to an equal distance along the distal quadriceps.
The medial patellofemoral ligament (MPFL), which is essential in preventing lateral patellar instability, becomes torn in almost 100% of dislocation events.1 Therefore, in cases of failed nonoperative management, this important constraint should be reconstructed. Reconstruction is technically challenging, precision is needed to avoid postoperative complications, and a thorough understanding of the native MPFL anatomy is paramount.
As a thickening of the medial patellar retinaculum, the MPFL connects the medial patella to the medial femur. The femoral insertion has been described a few ways. In a cadaveric study, LaPrade and colleagues2 noted that it inserts 1.9 mm anterior and 3.2 mm distal to the adductor tubercle. Radiographically, the attachment has been described by Schöttle and colleagues3 and Stephen and colleagues.4 These techniques are discussed in more detail later.
The MPFL is a static restraint to lateral patellar translation—it acts only as a checkrein. It functions mainly in 0° to 30° of knee flexion because once the patella engages the trochlear groove, the bony articulation guides the patella during the rest of knee flexion.5 Most authors agree that the native MPFL is mostly isometric, and the re-created ligament should replicate it.6,7 Using cadaveric specimens, Steensen and colleagues6 found that, from 0° to 90° of knee flexion, the distance from the inferior patellar attachment to the superior femoral attachment changed only 1.1 mm.
Biomechanical studies have shown that a MPFL graft with excessive tension predisposes to postoperative abnormal patellofemoral contact pressures, which cause anterior knee pain, loss of knee flexion, and patellofemoral chondrosis.8-10 Furthermore, an overtensioned graft can cause iatrogenic medial patellar subluxation, and an undertensioned graft may still allow for pathologic lateral patellar translation.
Anatomical Bony Insertions
Femoral Insertion
Precise localization of the proper anatomical femoral attachment of the MPFL is a crucial step in reconstruction.11 Small errors in femoral location have resulted in significant loss of graft isometry, increased patellofemoral contact pressures in cadaveric models,4,7 and increased rates of failure after both MPFL repair12 and reconstruction.13 Several methods for confirming proper femoral location during surgery have been described; these methods help obviate the need for large formal dissection of the medial knee.
In a cadaveric study, Schöttle and colleagues3 described a reproducible radiographic point that precisely identifies the appropriate femoral location for MPFL graft placement. The point is located on a standard true lateral radiograph of the distal femur. First, a line is drawn extending the posterior cortex of the femur distally. Next, 2 lines are drawn perpendicular to the first: one intersecting the posterior point of the Blumensaat line, the other intersecting the transition between the posterior femoral condyle and the posterior femoral cortex3 (Figure 1). 
Another radiographic method for intraoperatively identifying the anatomical MPFL femoral attachment was described by Stephen and colleagues.4 They used a cadaveric model to confirm radiographic findings and found that the femoral attachment point, taking the anterior-to-posterior medial femoral condyle distance to be 100%, was identified 40% from the posterior border of the medial femoral condyle, 50% from the distal border, and 60% from the anterior border. This simple “40%–50%–60%” normalizing rule for radiographically defining the femoral attachment point is another helpful intraoperative adjunct for templating the appropriate location for graft placement, but calculation in a sterile operative environment can be difficult.
Both of these techniques depend on a perfect lateral radiograph of the knee, as even minor variations in a radiograph can have a dramatic effect on the appearance of the starting point.
Palpation of bony landmarks is another method for preliminarily identifying the appropriate location for femoral pin placement. If done properly, palpation helps obviate the need for corrections when confirming location using isometry or radiography. The center of the femoral attachment of the MPFL can be located in a groove midway between the medial epicondyle and the adductor tubercle.4 Fujino and colleagues15 conducted a cadaveric study of 31 knees in an effort to relate osseous landmarks with the femoral attachment of the MPFL. In all knees, the adductor tubercle was a reliable osseous landmark. The anatomical MPFL attachment was 10.6 mm distal to the apex of the adductor tubercle and was consistent between knees.
Although all these options offer the best available and most reproducible methods for establishing an anatomical femoral graft insertion site, it is important to note that they are based on cadaveric specimens without recurrent patellar instability. Most knees with chronic patellar instability have associated anatomical abnormalities that are not present in nondysplastic cadaveric specimens, which may alter the relationship of osseous landmarks such as the medial epicondyle and adductor tubercle.16 In a recent study of 30 patients with chronic lateral patellar instability, Sanchis-Alfonso and colleagues16 used 3-dimensional computed tomography with these radiographic landmarks and simulated femoral graft attachment sites. They found that the methods of Schöttle and colleagues3 and Stephen and colleagues4 did not provide precise anatomical femoral placement. Ziegler and colleagues14 correlated the anatomical femoral location of the MPFL with the Schöttle point and found the radiographic site to be 4 mm, on average, off the anatomical location. The location of an appropriate anatomical femoral attachment should be confirmed using multiple methods, including palpation of known osseous landmarks, intraoperative fluoroscopy, and, most important, assessment of graft isometry through full range of motion (ROM).
Patellar Insertion
The patellar attachment of the MPFL has received considerably less attention than the femoral attachment.11 Anatomical studies have shown that the MPFL inserts on the superomedial half to third of the patella, in addition to a portion inserting on the undersurface of the vastus medialis.17


Troubleshooting
It is essential to check graft tension through full knee ROM and observe how the graft behaves in order to prevent iatrogenic complications11 (Figures 6A, 6B).
If the graft is secured in high degrees of knee flexion, and the femoral location is not anatomical, a different phenomenon occurs when the knee is brought back into extension. For proximal femoral tunnels, the graft loosens in knee extension and may lead to continued lateral patellar instability. On the other hand, a distal femoral tunnel may result in iatrogenic medial patellar subluxation as the graft becomes too tight in extension.
Correct Amount of Graft Tension
Overtightening the MPFL during fixation is an easy but avoidable mistake. Unlike the anterior cruciate ligament, the MPFL should not be secured while applying maximum tension. Stephen and colleagues7 and Beck and colleagues8 found that tension of only 2 N (~0.5 lb) is needed to accurately re-create the biomechanics of the native graft.
The amount of tension may inadvertently be increased by an interference screw, which tends to pull the graft into the femoral tunnel during insertion. Attention should be given to watching and palpating the graft as the screw is inserted, especially during the last few turns. Turning the screw half a turn backwards after full insertion can release this increased tension and help avoid overtensioning.
Correct Amount of Knee Flexion
This is probably the least studied aspect of MPFL reconstruction. Recommendations range from 0° to 90° of knee flexion during fixation.7,25-30 Most recommendations are surgeon preference, or are based on a sound rationale that lacks supporting research. Tensioning in full extension has been advocated for assessing for the appropriate amount of lateral patellar translation.27 Authors who endorse deeper knee flexion (60°-90°) think that, because the patella engages a deeper trochlear groove in increased flexion, the bony articulation can be used to establish graft length.30,31
Our cadaveric study showed that lower degrees of knee flexion are safest for minimizing the effect of a malpositioned femoral tunnel.26 If femoral tunnel location is not exactly anatomical, any errors are magnified (with even worse graft mechanics) the deeper in flexion the graft is fixed. Once the patella engages the trochlear groove, at about 30° of knee flexion, this can assist in establishing correct graft length. Therefore, we recommend fixation of the graft in 30° to 45° of knee flexion. Our study results also showed that, if femoral tunnel location is anatomical, the graft will be mostly isometric through knee ROM, and, therefore, amount of initial knee flexion does not affect graft behavior.
Regardless of knee flexion chosen, it is imperative to take the knee through full ROM after fixation to ensure the graft does not excessively loosen or tighten in flexion or extension.
Conclusion
MPFL reconstruction is fraught with errors and technical nuances that may be underappreciated. Accurately locating the femoral insertion is crucial to a biomechanically sound graft, and this location should be scrutinized during surgery with accurate radiographs or bony landmarks and verified with knee ROM. Although there is no clear gold standard for fixation and graft options, the graft should be secured while pulling very little tension (2 N) and with the knee in 30° to 45° of flexion to minimize the effect of any inaccuracies in femoral location. Overall, most patients do well after MPFL reconstruction, and attention to surgical technical detail helps maximize the chances of a satisfactory outcome.
Am J Orthop. 2017;46(2):76-81. Copyright Frontline Medical Communications Inc. 2017. All rights reserved.
1. Sallay PI, Poggi J, Speer KP, Garrett WE. Acute dislocation of the patella. A correlative pathoanatomic study. Am J Sports Med. 1996;24(1):52-60.
2. LaPrade RF, Engebretsen AH, Ly TV, Johansen S, Wentorf FA, Engebretsen L. The anatomy of the medial part of the knee. J Bone Joint Surg Am. 2007;89(9):2000-2010.
3. Schöttle PB, Schmeling A, Rosenstiel N, Weiler A. Radiographic landmarks for femoral tunnel placement in medial patellofemoral ligament reconstruction. Am J Sports Med. 2007;35(5):801-804.
4. Stephen JM, Lumpaopong P, Deehan DJ, Kader D, Amis AA. The medial patellofemoral ligament: location of femoral attachment and length change patterns resulting from anatomic and nonanatomic attachments. Am J Sports Med. 2012;40(8):1871-1879.
5. Amis AA, Firer P, Mountney J, Senavongse W, Thomas NP. Anatomy and biomechanics of the medial patellofemoral ligament. Knee. 2003;10(3):215-220.
6. Steensen RN, Dopirak RM, McDonald WG 3rd. The anatomy and isometry of the medial patellofemoral ligament: implications for reconstruction. Am J Sports Med. 2004;32(6):1509-1513.
7. Stephen JM, Kaider D, Lumpaopong P, Deehan DJ, Amis AA. The effect of femoral tunnel position and graft tension on patellar contact mechanics and kinematics after medial patellofemoral ligament reconstruction. Am J Sports Med. 2014;42(2):364-372.
8. Beck P, Brown NA, Greis PE, Burks RT. Patellofemoral contact pressures and lateral patellar translation after medial patellofemoral ligament reconstruction. Am J Sports Med. 2007;35(9):1557-1563.
9. Bollier M, Fulkerson J, Cosgarea A, Tanaka M. Technical failure of medial patellofemoral ligament reconstruction. Arthroscopy. 2011;27(8):1153-1159.
10. Elias JJ, Cosgarea AJ. Technical errors during medial patellofemoral ligament reconstruction could overload medial patellofemoral cartilage: a computational analysis. Am J Sports Med. 2006;34(9):1478-1485.
11. Sanchis-Alfonso V. Guidelines for medial patellofemoral ligament reconstruction in chronic lateral patellar instability. J Am Acad Orthop Surg. 2014;22(3):175-182.
12. Camp CL, Krych AJ, Dahm DL, Levy BA, Stuart MJ. Medial patellofemoral ligament repair for recurrent patellar dislocation. Am J Sports Med. 2010;38(11):2248-2254.
13. Hopper GP, Leach WJ, Rooney BP, Walker CR, Blyth MJ. Does degree of trochlear dysplasia and position of femoral tunnel influence outcome after medial patellofemoral ligament reconstruction? Am J Sports Med. 2014;42(3):716-722.
14. Ziegler CG, Fulkerson JP, Edgar C. Radiographic reference points are inaccurate with and without a true lateral radiograph: the importance of anatomy in medial patellofemoral ligament reconstruction. Am J Sports Med. 2016;44(1):133-142.
15. Fujino K, Tajima G, Yan J, et al. Morphology of the femoral insertion site of the medial patellofemoral ligament. Knee Surg Sports Traumatol Arthrosc. 2015;23(4):998-1003.
16. Sanchis-Alfonso V, Ramirez-Fuentes C, Montesinos-Berry E, Aparisi-Rodriguez F, Martí-Bonmatí L. Does radiographic location ensure precise anatomic location of the femoral fixation site in medial patellofemoral ligament surgery? Knee Surg Sports Traumatol Arthrosc. 2016;24(9):2838-2844.
17. Smirk C, Morris H. The anatomy and reconstruction of the medial patellofemoral ligament. Knee. 2003;10(3):221-227.
18. Tateishi T, Tsuchiya M, Motosugi N, et al. Graft length change and radiographic assessment of femoral drill hole position for medial patellofemoral ligament reconstruction. Knee Surg Sports Traumatol Arthrosc. 2011;19(3):400-407.
19. Mariani PP, Liguori L, Cerullo G, Iannella G, Floris L. Arthroscopic patellar reinsertion of the MPFL in acute patellar dislocations. Knee Surg Sports Traumatol Arthrosc. 2011;19(4):628-633.
20. Schöttle PB, Hensler D, Imhoff AB. Anatomical double-bundle MPFL reconstruction with an aperture fixation. Knee Surg Sports Traumatol Arthrosc. 2010;18(2):147-151.
21. Siebold R, Chikale S, Sartory N, Hariri N, Feil S, Pässler HH. Hamstring graft fixation in MPFL reconstruction at the patella using a transosseous suture technique. Knee Surg Sports Traumatol Arthrosc. 2010;18(11):1542-1544.
22. Song SY, Kim IS, Chang HG, Shin JH, Kim HJ, Seo YJ. Anatomic medial patellofemoral ligament reconstruction using patellar suture anchor fixation for recurrent patellar instability. Knee Surg Sports Traumatol Arthrosc. 2014;22(10):2431-2437.
23. Burrus MT, Werner BC, Conte EJ, Diduch DR. Troubleshooting the femoral attachment during medial patellofemoral ligament reconstruction: location, location, location. Orthop J Sports Med. 2015;3(1):2325967115569198.
24. Thaunat M, Erasmus PJ. Management of overtight medial patellofemoral ligament reconstruction. Knee Surg Sports Traumatol Arthrosc. 2009;17(5):480-483.
25. Arendt EA, Moeller A, Agel J. Clinical outcomes of medial patellofemoral ligament repair in recurrent (chronic) lateral patella dislocations. Knee Surg Sports Traumatol Arthrosc. 2011;19(11):1909-1914.
26. Burrus MT, Werner BC, Cancienne JM, Gwathmey FW, Diduch DR. MPFL graft fixation in low degrees of knee flexion minimizes errors made in the femoral location [published online April 16, 2016]. Knee Surg Sports Traumatol Arthrosc. doi:10.1007/s00167-016-4111-4.
27. Feller JA, Richmond AK, Wasiak J. Medial patellofemoral ligament reconstruction as an isolated or combined procedure for recurrent patellar instability. Knee Surg Sports Traumatol Arthrosc. 2014;22(10):2470-2476.
28. Lippacher S, Dreyhaupt J, Williams SR, Reichel H, Nelitz M. Reconstruction of the medial patellofemoral ligament: clinical outcomes and return to sports. Am J Sports Med. 2014;42(7):1661-1668.
29. Nelitz M, Dreyhaupt J, Reichel H, Woelfle J, Lippacher S. Anatomic reconstruction of the medial patellofemoral ligament in children and adolescents with open growth plates: surgical technique and clinical outcome. Am J Sports Med. 2013;41(1):58-63.
30. Nomura E, Horiuchi Y, Kihara M. A mid-term follow-up of medial patellofemoral ligament reconstruction using an artificial ligament for recurrent patellar dislocation. Knee. 2000;7(4):211-215.
31. Steiner TM, Torga-Spak R, Teitge RA. Medial patellofemoral ligament reconstruction in patients with lateral patellar instability and trochlear dysplasia. Am J Sports Med. 2006;34(8):1254-1261.
Take-Home Points
- Use fluoroscopy, isometry, or both to double-check the femoral attachment point. Failure to do so can lead to an overtensioned or undertensioned graft caused by anisometric graft placement.
- To minimize the risk of fracture, avoid drilling transverse tunnels across the patella.
- Do not “pre-tension” the medial patellofemoral ligament graft. There should be little or no tension in the graft when the patella is centered in the groove, regardless of the angle of knee flexion.
- The angle of knee flexion during securing of the graft may be important for inaccurate femoral tunnel placement. Before final fixation of the graft, always range the knee fully to make sure full passive motion will be possible once the graft is secured.
- Understanding the anatomy of the MPFL is key before considering reconstructing: That is, fluoroscopy only suggests a “cloud” to begin assessment of the femoral attachment site and is secondary to anatomic references and check of length changes between the attachment point through range of motion. New studies demonstrate the patellar attachment is broad and extends proximally from the historical patellar attachment site to an equal distance along the distal quadriceps.
The medial patellofemoral ligament (MPFL), which is essential in preventing lateral patellar instability, becomes torn in almost 100% of dislocation events.1 Therefore, in cases of failed nonoperative management, this important constraint should be reconstructed. Reconstruction is technically challenging, precision is needed to avoid postoperative complications, and a thorough understanding of the native MPFL anatomy is paramount.
As a thickening of the medial patellar retinaculum, the MPFL connects the medial patella to the medial femur. The femoral insertion has been described a few ways. In a cadaveric study, LaPrade and colleagues2 noted that it inserts 1.9 mm anterior and 3.2 mm distal to the adductor tubercle. Radiographically, the attachment has been described by Schöttle and colleagues3 and Stephen and colleagues.4 These techniques are discussed in more detail later.
The MPFL is a static restraint to lateral patellar translation—it acts only as a checkrein. It functions mainly in 0° to 30° of knee flexion because once the patella engages the trochlear groove, the bony articulation guides the patella during the rest of knee flexion.5 Most authors agree that the native MPFL is mostly isometric, and the re-created ligament should replicate it.6,7 Using cadaveric specimens, Steensen and colleagues6 found that, from 0° to 90° of knee flexion, the distance from the inferior patellar attachment to the superior femoral attachment changed only 1.1 mm.
Biomechanical studies have shown that a MPFL graft with excessive tension predisposes to postoperative abnormal patellofemoral contact pressures, which cause anterior knee pain, loss of knee flexion, and patellofemoral chondrosis.8-10 Furthermore, an overtensioned graft can cause iatrogenic medial patellar subluxation, and an undertensioned graft may still allow for pathologic lateral patellar translation.
Anatomical Bony Insertions
Femoral Insertion
Precise localization of the proper anatomical femoral attachment of the MPFL is a crucial step in reconstruction.11 Small errors in femoral location have resulted in significant loss of graft isometry, increased patellofemoral contact pressures in cadaveric models,4,7 and increased rates of failure after both MPFL repair12 and reconstruction.13 Several methods for confirming proper femoral location during surgery have been described; these methods help obviate the need for large formal dissection of the medial knee.
In a cadaveric study, Schöttle and colleagues3 described a reproducible radiographic point that precisely identifies the appropriate femoral location for MPFL graft placement. The point is located on a standard true lateral radiograph of the distal femur. First, a line is drawn extending the posterior cortex of the femur distally. Next, 2 lines are drawn perpendicular to the first: one intersecting the posterior point of the Blumensaat line, the other intersecting the transition between the posterior femoral condyle and the posterior femoral cortex3 (Figure 1).
Another radiographic method for intraoperatively identifying the anatomical MPFL femoral attachment was described by Stephen and colleagues.4 They used a cadaveric model to confirm radiographic findings and found that the femoral attachment point, taking the anterior-to-posterior medial femoral condyle distance to be 100%, was identified 40% from the posterior border of the medial femoral condyle, 50% from the distal border, and 60% from the anterior border. This simple “40%–50%–60%” normalizing rule for radiographically defining the femoral attachment point is another helpful intraoperative adjunct for templating the appropriate location for graft placement, but calculation in a sterile operative environment can be difficult.
Both of these techniques depend on a perfect lateral radiograph of the knee, as even minor variations in a radiograph can have a dramatic effect on the appearance of the starting point.
Palpation of bony landmarks is another method for preliminarily identifying the appropriate location for femoral pin placement. If done properly, palpation helps obviate the need for corrections when confirming location using isometry or radiography. The center of the femoral attachment of the MPFL can be located in a groove midway between the medial epicondyle and the adductor tubercle.4 Fujino and colleagues15 conducted a cadaveric study of 31 knees in an effort to relate osseous landmarks with the femoral attachment of the MPFL. In all knees, the adductor tubercle was a reliable osseous landmark. The anatomical MPFL attachment was 10.6 mm distal to the apex of the adductor tubercle and was consistent between knees.
Although all these options offer the best available and most reproducible methods for establishing an anatomical femoral graft insertion site, it is important to note that they are based on cadaveric specimens without recurrent patellar instability. Most knees with chronic patellar instability have associated anatomical abnormalities that are not present in nondysplastic cadaveric specimens, which may alter the relationship of osseous landmarks such as the medial epicondyle and adductor tubercle.16 In a recent study of 30 patients with chronic lateral patellar instability, Sanchis-Alfonso and colleagues16 used 3-dimensional computed tomography with these radiographic landmarks and simulated femoral graft attachment sites. They found that the methods of Schöttle and colleagues3 and Stephen and colleagues4 did not provide precise anatomical femoral placement. Ziegler and colleagues14 correlated the anatomical femoral location of the MPFL with the Schöttle point and found the radiographic site to be 4 mm, on average, off the anatomical location. The location of an appropriate anatomical femoral attachment should be confirmed using multiple methods, including palpation of known osseous landmarks, intraoperative fluoroscopy, and, most important, assessment of graft isometry through full range of motion (ROM).
Patellar Insertion
The patellar attachment of the MPFL has received considerably less attention than the femoral attachment.11 Anatomical studies have shown that the MPFL inserts on the superomedial half to third of the patella, in addition to a portion inserting on the undersurface of the vastus medialis.17
Troubleshooting
It is essential to check graft tension through full knee ROM and observe how the graft behaves in order to prevent iatrogenic complications11 (Figures 6A, 6B).
If the graft is secured in high degrees of knee flexion, and the femoral location is not anatomical, a different phenomenon occurs when the knee is brought back into extension. For proximal femoral tunnels, the graft loosens in knee extension and may lead to continued lateral patellar instability. On the other hand, a distal femoral tunnel may result in iatrogenic medial patellar subluxation as the graft becomes too tight in extension.
Correct Amount of Graft Tension
Overtightening the MPFL during fixation is an easy but avoidable mistake. Unlike the anterior cruciate ligament, the MPFL should not be secured while applying maximum tension. Stephen and colleagues7 and Beck and colleagues8 found that tension of only 2 N (~0.5 lb) is needed to accurately re-create the biomechanics of the native graft.
The amount of tension may inadvertently be increased by an interference screw, which tends to pull the graft into the femoral tunnel during insertion. Attention should be given to watching and palpating the graft as the screw is inserted, especially during the last few turns. Turning the screw half a turn backwards after full insertion can release this increased tension and help avoid overtensioning.
Correct Amount of Knee Flexion
This is probably the least studied aspect of MPFL reconstruction. Recommendations range from 0° to 90° of knee flexion during fixation.7,25-30 Most recommendations are surgeon preference, or are based on a sound rationale that lacks supporting research. Tensioning in full extension has been advocated for assessing for the appropriate amount of lateral patellar translation.27 Authors who endorse deeper knee flexion (60°-90°) think that, because the patella engages a deeper trochlear groove in increased flexion, the bony articulation can be used to establish graft length.30,31
Our cadaveric study showed that lower degrees of knee flexion are safest for minimizing the effect of a malpositioned femoral tunnel.26 If femoral tunnel location is not exactly anatomical, any errors are magnified (with even worse graft mechanics) the deeper in flexion the graft is fixed. Once the patella engages the trochlear groove, at about 30° of knee flexion, this can assist in establishing correct graft length. Therefore, we recommend fixation of the graft in 30° to 45° of knee flexion. Our study results also showed that, if femoral tunnel location is anatomical, the graft will be mostly isometric through knee ROM, and, therefore, amount of initial knee flexion does not affect graft behavior.
Regardless of knee flexion chosen, it is imperative to take the knee through full ROM after fixation to ensure the graft does not excessively loosen or tighten in flexion or extension.
Conclusion
MPFL reconstruction is fraught with errors and technical nuances that may be underappreciated. Accurately locating the femoral insertion is crucial to a biomechanically sound graft, and this location should be scrutinized during surgery with accurate radiographs or bony landmarks and verified with knee ROM. Although there is no clear gold standard for fixation and graft options, the graft should be secured while pulling very little tension (2 N) and with the knee in 30° to 45° of flexion to minimize the effect of any inaccuracies in femoral location. Overall, most patients do well after MPFL reconstruction, and attention to surgical technical detail helps maximize the chances of a satisfactory outcome.
Am J Orthop. 2017;46(2):76-81. Copyright Frontline Medical Communications Inc. 2017. All rights reserved.
1. Sallay PI, Poggi J, Speer KP, Garrett WE. Acute dislocation of the patella. A correlative pathoanatomic study. Am J Sports Med. 1996;24(1):52-60.
2. LaPrade RF, Engebretsen AH, Ly TV, Johansen S, Wentorf FA, Engebretsen L. The anatomy of the medial part of the knee. J Bone Joint Surg Am. 2007;89(9):2000-2010.
3. Schöttle PB, Schmeling A, Rosenstiel N, Weiler A. Radiographic landmarks for femoral tunnel placement in medial patellofemoral ligament reconstruction. Am J Sports Med. 2007;35(5):801-804.
4. Stephen JM, Lumpaopong P, Deehan DJ, Kader D, Amis AA. The medial patellofemoral ligament: location of femoral attachment and length change patterns resulting from anatomic and nonanatomic attachments. Am J Sports Med. 2012;40(8):1871-1879.
5. Amis AA, Firer P, Mountney J, Senavongse W, Thomas NP. Anatomy and biomechanics of the medial patellofemoral ligament. Knee. 2003;10(3):215-220.
6. Steensen RN, Dopirak RM, McDonald WG 3rd. The anatomy and isometry of the medial patellofemoral ligament: implications for reconstruction. Am J Sports Med. 2004;32(6):1509-1513.
7. Stephen JM, Kaider D, Lumpaopong P, Deehan DJ, Amis AA. The effect of femoral tunnel position and graft tension on patellar contact mechanics and kinematics after medial patellofemoral ligament reconstruction. Am J Sports Med. 2014;42(2):364-372.
8. Beck P, Brown NA, Greis PE, Burks RT. Patellofemoral contact pressures and lateral patellar translation after medial patellofemoral ligament reconstruction. Am J Sports Med. 2007;35(9):1557-1563.
9. Bollier M, Fulkerson J, Cosgarea A, Tanaka M. Technical failure of medial patellofemoral ligament reconstruction. Arthroscopy. 2011;27(8):1153-1159.
10. Elias JJ, Cosgarea AJ. Technical errors during medial patellofemoral ligament reconstruction could overload medial patellofemoral cartilage: a computational analysis. Am J Sports Med. 2006;34(9):1478-1485.
11. Sanchis-Alfonso V. Guidelines for medial patellofemoral ligament reconstruction in chronic lateral patellar instability. J Am Acad Orthop Surg. 2014;22(3):175-182.
12. Camp CL, Krych AJ, Dahm DL, Levy BA, Stuart MJ. Medial patellofemoral ligament repair for recurrent patellar dislocation. Am J Sports Med. 2010;38(11):2248-2254.
13. Hopper GP, Leach WJ, Rooney BP, Walker CR, Blyth MJ. Does degree of trochlear dysplasia and position of femoral tunnel influence outcome after medial patellofemoral ligament reconstruction? Am J Sports Med. 2014;42(3):716-722.
14. Ziegler CG, Fulkerson JP, Edgar C. Radiographic reference points are inaccurate with and without a true lateral radiograph: the importance of anatomy in medial patellofemoral ligament reconstruction. Am J Sports Med. 2016;44(1):133-142.
15. Fujino K, Tajima G, Yan J, et al. Morphology of the femoral insertion site of the medial patellofemoral ligament. Knee Surg Sports Traumatol Arthrosc. 2015;23(4):998-1003.
16. Sanchis-Alfonso V, Ramirez-Fuentes C, Montesinos-Berry E, Aparisi-Rodriguez F, Martí-Bonmatí L. Does radiographic location ensure precise anatomic location of the femoral fixation site in medial patellofemoral ligament surgery? Knee Surg Sports Traumatol Arthrosc. 2016;24(9):2838-2844.
17. Smirk C, Morris H. The anatomy and reconstruction of the medial patellofemoral ligament. Knee. 2003;10(3):221-227.
18. Tateishi T, Tsuchiya M, Motosugi N, et al. Graft length change and radiographic assessment of femoral drill hole position for medial patellofemoral ligament reconstruction. Knee Surg Sports Traumatol Arthrosc. 2011;19(3):400-407.
19. Mariani PP, Liguori L, Cerullo G, Iannella G, Floris L. Arthroscopic patellar reinsertion of the MPFL in acute patellar dislocations. Knee Surg Sports Traumatol Arthrosc. 2011;19(4):628-633.
20. Schöttle PB, Hensler D, Imhoff AB. Anatomical double-bundle MPFL reconstruction with an aperture fixation. Knee Surg Sports Traumatol Arthrosc. 2010;18(2):147-151.
21. Siebold R, Chikale S, Sartory N, Hariri N, Feil S, Pässler HH. Hamstring graft fixation in MPFL reconstruction at the patella using a transosseous suture technique. Knee Surg Sports Traumatol Arthrosc. 2010;18(11):1542-1544.
22. Song SY, Kim IS, Chang HG, Shin JH, Kim HJ, Seo YJ. Anatomic medial patellofemoral ligament reconstruction using patellar suture anchor fixation for recurrent patellar instability. Knee Surg Sports Traumatol Arthrosc. 2014;22(10):2431-2437.
23. Burrus MT, Werner BC, Conte EJ, Diduch DR. Troubleshooting the femoral attachment during medial patellofemoral ligament reconstruction: location, location, location. Orthop J Sports Med. 2015;3(1):2325967115569198.
24. Thaunat M, Erasmus PJ. Management of overtight medial patellofemoral ligament reconstruction. Knee Surg Sports Traumatol Arthrosc. 2009;17(5):480-483.
25. Arendt EA, Moeller A, Agel J. Clinical outcomes of medial patellofemoral ligament repair in recurrent (chronic) lateral patella dislocations. Knee Surg Sports Traumatol Arthrosc. 2011;19(11):1909-1914.
26. Burrus MT, Werner BC, Cancienne JM, Gwathmey FW, Diduch DR. MPFL graft fixation in low degrees of knee flexion minimizes errors made in the femoral location [published online April 16, 2016]. Knee Surg Sports Traumatol Arthrosc. doi:10.1007/s00167-016-4111-4.
27. Feller JA, Richmond AK, Wasiak J. Medial patellofemoral ligament reconstruction as an isolated or combined procedure for recurrent patellar instability. Knee Surg Sports Traumatol Arthrosc. 2014;22(10):2470-2476.
28. Lippacher S, Dreyhaupt J, Williams SR, Reichel H, Nelitz M. Reconstruction of the medial patellofemoral ligament: clinical outcomes and return to sports. Am J Sports Med. 2014;42(7):1661-1668.
29. Nelitz M, Dreyhaupt J, Reichel H, Woelfle J, Lippacher S. Anatomic reconstruction of the medial patellofemoral ligament in children and adolescents with open growth plates: surgical technique and clinical outcome. Am J Sports Med. 2013;41(1):58-63.
30. Nomura E, Horiuchi Y, Kihara M. A mid-term follow-up of medial patellofemoral ligament reconstruction using an artificial ligament for recurrent patellar dislocation. Knee. 2000;7(4):211-215.
31. Steiner TM, Torga-Spak R, Teitge RA. Medial patellofemoral ligament reconstruction in patients with lateral patellar instability and trochlear dysplasia. Am J Sports Med. 2006;34(8):1254-1261.