User login
Early-Stage Hodgkin Lymphoma
INTRODUCTION
Hodgkin lymphoma, previously known as Hodgkin’s disease, is a B-cell malignancy with unique pathological and epidemiological features for which highly effective therapies exist. The disease is characterized by the presence of mononuclear and multinucleate giant cells called Hodgkin and Reed-Sternberg (HRS) cells.1
Hodgkin lymphoma is unique compared to other B-cell lymphomas because of the scarcity of the malignant cells in the tumor tissue. The HRS cells usually account for only 0.1% to 10% of the cells in the affected tissues, and the HRS cells induce accumulation of nonmalignant lymphocytes, macrophages, granulocytes, eosinophils, plasma cells, and histiocytes, which constitute more than 90% of tumor cellularity.2 Although the disease was first described by Sir Thomas Hodgkin in 1832, in part because of this unique histopathology, not until 1991 was it conclusively demonstrated that HRS cells are in fact monoclonal germinal center–derived B-cells. This article reviews management and frontline treatment options for limited-stage classical Hodgkin lymphoma and nodular lymphocyte predominant Hodgkin lymphoma. Treatment of advanced stage and relapsed/refractory Hodgkin lymphoma will be discussed in a separate article.
EPIDEMIOLOGY
Hodgkin lymphoma accounts for 0.5% of all malignancies and 11.7% of all lymphomas among adults in the United States.3 The incidence of Hodgkin lymphoma has been steadily increasing over the past 4 decades and was estimated to be 8260 cases in the United States in 2017, with a slight male predominance. Hodgkin lymphoma is expected to cause 1070 deaths in 2017, accounting for 0.2% of all cancer deaths.3 First-degree relatives of patients with Hodgkin lymphoma have a 3- to 9-fold increased risk of having the disease compared to the general population,4 and monozygotic twin siblings of Hodgkin lymphoma patients have a greatly increased risk for developing the disease—up to 100-fold—compared to normal cohorts.5 The incidence is highest among Caucasians, African Americans, and Hispanics, and lower in Asians and American Indians.3 Hodgkin lymphoma incidence shows a bimodal peak distribution, with 1 peak between the ages of 15 and 44 years, and another peak after age 65 years.6
ETIOLOGY/PATHOGENESIS
The cause of Hodgkin lymphoma is unknown. Epstein-Barr virus (EBV) infection is present in up to 40% of Hodgkin lymphoma cases, suggesting a role of this virus in the pathogenesis of some cases. The risk of EBV-positive Hodgkin lymphoma was found to be higher following an episode of infectious mononucleosis, while the risk of EBV-negative Hodgkin lymphoma remained unchanged.7 The incidence of Hodgkin lymphoma is 5 to 14 times higher in HIV-infected patients than in noninfected patients.8 It is not considered an AIDS-defining illness, but has become more frequent with the growth and aging of the HIV-positive population.9,10 Hodgkin lymphoma patients with HIV typically have CD4 lymphocyte counts greater than 200 cells/μL,11 with the incidence of Hodgkin lymphoma actually declining with lower CD4 lymphocyte counts.12 HIV-related Hodgkin lymphoma tends to have an aggressive course, with high rates of EBV positivity.13 The incidence of Hodgkin lymphoma is 1.8 times higher among smokers, and the risk appears to increase with duration of smoking.14,15
The cell of origin of Hodgkin lymphoma, while long suspected to be the HRS cell, remained unproven until the 1990s when micro-dissection and single-cell polymerase chain reaction techniques allowed for confirmation that the HRS cell was in fact a monoclonal germinal center derived B cell.16,17 These HRS cells lack immunoglobulin due to defective transcription regulation and not due to crippling mutations.18,19 The cellular infiltrate in Hodgkin lymphoma appears to play a decisive role in allowing the HRS cells to survive by providing an environment that suppresses cytotoxic immune responses as well as by providing cellular interactions and cytokines that support their growth and survival. The extensive inflammatory infiltrate in classical Hodgkin lymphoma is comprised of T helper 2 (Th2) and regulatory T cells and lacks T helper 1 (Th1) cells, CD8 cytotoxic T cells, and natural killer cells.20 The HRS cells escape apoptosis by several mechanisms which include latent EBV infection and constitutive nuclear factor (NF)-kB pathways, as well as other deregulated signaling pathways that promote survival, such as EBV nuclear antigen 1 (EBNA1) protein, EBV latent infection membrane protein 1 (LMP1), and LMP2.21,22
Genetic alterations in the 9p24 locus which encodes PD-L1/PD-L2 are nearly universally present in classical Hodgkin lymphoma and are now considered a disease-defining feature.23
PATHOLOGIC CLASSIFICATION
According to the 2008 World Health Organization (WHO) classification, Hodgkin lymphoma has 2 clearly defined entities: classical Hodgkin lymphoma (cHL), which accounts for approximately 95% cases, and nodular lymphocyte predominant Hodgkin lymphoma (NLPHL), which accounts for the remaining cases.24 These 2 entities differ in their clinical, pathological, and biological features, which in turn affect prognosis and treatment options. Classical Hodgkin lymphoma is characterized by a paucity of HRS cells surrounded by a background of mixed inflammatory infiltrate comprised of histiocytes, small lymphocytes, eosinophils, neutrophils, plasma cells, fibroblasts, and collagen. Depending on the particular combinations of these elements and the specific features of the neoplastic cells, cases can be subclassified into several cHL subtypes: the nodular sclerosis, mixed cellularity, lymphocyte-rich, and lymphocyte-depleted types.25
The diagnosis of cHL is made based on a combination of morphology of HRS cells and the other cells infiltrating the tissue, combined with immunohistochemical staining. Because of the rare nature of the malignant (clonal) cell in Hodgkin lymphoma specimens, flow cytometry is generally of little value. The HRS cells in cHL are CD30-positive and CD45 negative in virtually all cases, and CD15-positive in 85% of cases.26 B-cell antigens are typically negative except for CD20, which is positive in about 20% cases.27
Nodular sclerosis Hodgkin lymphoma (NSHL) is the most common subtype of cHL, accounting for 65% to 75% of cases. It is common among young adults and tends to involve the mediastinal, supraclavicular, and cervical lymph nodes. NSHL is characterized by the presence of collagen bands that divide the lymphoid tissue into circumscribed nodules. This subtype usually presents as stage I or II disease, typically with neck and/or mediastinal disease, and evidence of EBV infection is present in approximately 10% to 40% of North American cases.7 Patients diagnosed with NSHL generally have a very good prognosis.
Mixed cellularity Hodgkin lymphoma (MCHL) constitutes about 20% to 25% of cHL cases. It affects a somewhat older population, with a median age at diagnosis of 38 years. The typical bimodal age distribution is not seen with MCHL. MCHL has a male predominance (70%), and is more frequent in HIV-infected patients (70% of whom also have EBV infection). Lymphoid tissues have classic HRS cells and significant inflammatory infiltrates. Approximately 50% of patients with MCHL present as stage III or IV with abdominal lymphadenopathy or splenic involvement, and B symptoms are frequent.24
Lymphocyte-rich Hodgkin lymphoma (LRHL) is uncommon, accounting for only 3% to 5% of cases of cHL.28 The disease usually presents at an older age and has a 2:1 male predominance. HRS cells are commonly seen and a large number of reactive lymphocytes are also present. Although on the basis of morphology and immunohistochemistry LRHL belongs to the cHL group, clinically it more closely resembles LPHL. Patients usually present at early stage and rarely have B symptoms. LRHL carries an excellent prognosis, with a greater than 90% PFS after 5 years.23,29
Lymphocyte-depleted Hodgkin lymphoma (LDHL) is the least common form of cHL, accounting for less than 5% of cases. Many cases previously placed in this category are now recognized as diffuse large B-cell lymphoma (DLBCL), anaplastic large-cell lymphoma (ALCL), or NSHL with lymphocyte depletion.30 HRS cells are frequently seen, but reactive inflammatory cells are relatively sparse. EBV infection is seen in up to 90% of cases, commonly associated with HIV-infected individuals. Advanced-stage and symptomatic disease are more common. Prognosis is slightly worse compared to other categories.
NLPHL accounts for approximately 5% of cases of Hodgkin lymphoma. It has a unimodal age distribution, with the peak incidence in the fourth decade, and male predilection of 3:1.28 NLPHL is characterized by large primary lymphoid follicles, with polytypic small B lymphocytes and extensive meshworks of follicular dendritic cells. The lymphocytic/histiocytic (L and H), or “popcorn,” cells scattered within the nodules differ from classic HRS cells, both in their morphology and in their biochemical profile, being frequently negative for CD15, CD30 and for the EBV genome, and usually positive for B-cell antigens such as CD20, suggesting that L and H cells may be immunoglobulin-synthesizing monoclonal B cells. CD45 is also typically positive in NLPHL, in distinction from cHL. NLPHL has an indolent course compared to cHL, and long-term survival is common.19,31 NLPHL commonly presents with limited-stage disease. NLPHL may eventually transform into a more aggressive lymphoma, such as diffuse large B-cell lymphoma (including centroblastic, immunoblastic, or T-cell/histiocyte–rich subtypes), at a rate of 4% to 12%. This can occur even 15 to 20 years after the initial diagnosis of NLPHL.32,33 In a recent large retrospective study of 222 patients with NLPHL, the rate of transformation to DLBCL was 7.6%, with a median time to transformation of 35 months. Overall survival was not adversely affected in patients undergoing transformation compared to those without transformation.34
PRESENTATION
Classical Hodgkin lymphoma usually presents with asymptomatic mediastinal or cervical lymphadenopathy. Half of patients present with stage I or stage II disease.35 A mediastinal mass is seen in most patients with NSHL, at times with bulky disease, with “bulky” defined as a mediastinal mass measuring one-third or more of the maximal thoracic diameter on chest x-ray, or 10 cm on computed tomography (CT) scan. Systemic symptoms, or "B" symptoms—fevers (> 38°C), drenching night sweats, and unexplained weight loss (> 10% of baseline body weight over the preceding 6 months or less)—are detected in approximately 25% of patients. Between 10% and 15% will have extranodal disease, most commonly involving lung, bone, and liver. NLPHL usually presents with limited-stage disease without B symptoms; it typically has a more indolent presentation and clinical course than cHL.
INITIAL EVALUATION AND STAGING
The initial workup includes a complete blood count (CBC), erythrocyte sedimentation rate (ESR), lactate dehydrogenase (LDH), and chemistry studies to evaluate renal function and liver function. Fine-needle aspiration will usually fail to identify the infrequent HRS cells, and instead only reveal the reactive background of inflammatory cells. Generous (large gauge) core needle biopsies may provide diagnosis effectively in some cases, but in general, an excisional lymph node biopsy is preferred to ensure an accurate diagnosis and avoid the need for repeated biopsy procedures. In cases where an excisional biopsy would be difficult or risky, a core needle biopsy procedure is a reasonable first step, with the understanding that a subsequent surgical procedure may still be necessary.
Baseline imaging includes CT scans of the neck, chest, abdomen, and pelvis. Use of positron emission tomography (PET) scanning is now standard in the initial evaluation and assessment of treatment response in Hodgkin lymphoma.36 Due to the increased sensitivity of PET or PET/CT scan, additional lesions may be identified that were not seen on conventional CT scans. This will alter the staging, and potentially the treatment plan, in up to 25% to 30% of patients.37,38 PET/CT scan performed during initial evaluation also facilitates optimal interpretation of post-therapy PET/CT scans and is therefore strongly encouraged as a part of the initial staging evaluation.39
Recent studies have shown that bone marrow biopsy is not routinely needed in the initial staging of cHL. A study of 454 patients concluded that bone marrow biopsy would not have altered the stage in any stage I or II patients. It was further concluded that overall treatment strategy would not have been altered for any of the patients.40 Based on this study and others, it is now clear that FDG-PET has a high sensitivity, and when PET scan is negative (in the bone marrow and skeleton), a bone marrow biopsy provides little additional value. For patients with significant cytopenias, a bone marrow biopsy is reasonable. Such patients may benefit from a bilateral biopsy, which increases the probability of demonstrating bone marrow involvement by 16% to 33%.41,42 Techniques such as staging laparotomy and lymphangiography are now considered obsolete.
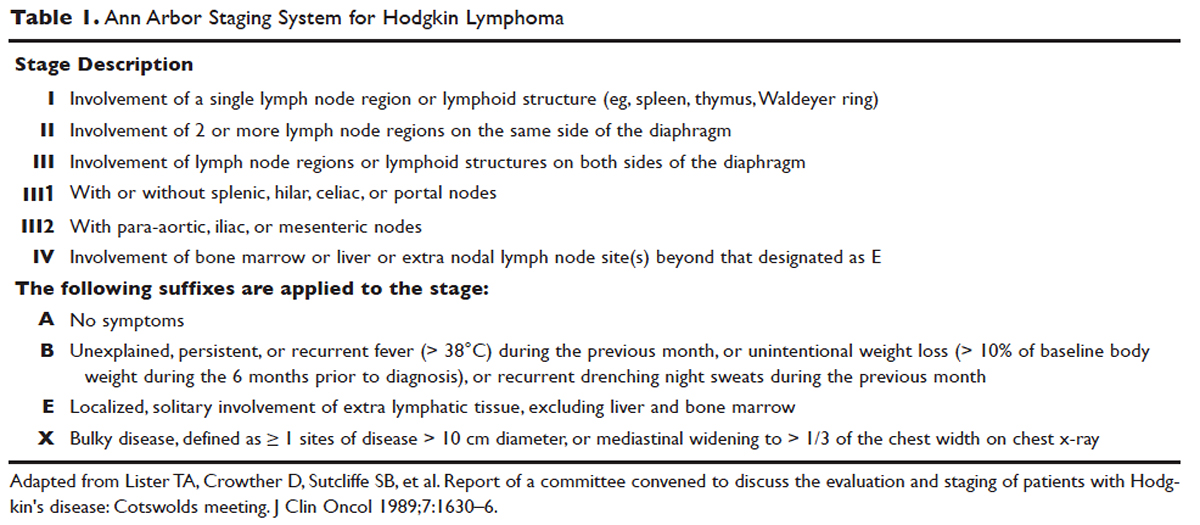
Hodgkin lymphoma is staged according to the Ann Arbor staging system (Table 1). The original Ann Arbor staging was published in 1971,43 and in 1989 the “Cotswold modifications” extended the definitions of stage IV disease and the suffix “X” was added to denote bulky disease.44 Both systems were developed for the staging of Hodgkin lymphoma, but are now used for staging non-Hodgkin lymphoma as well.
PROGNOSTIC FACTORS
For the purposes of prognosis and selection of treatment, Hodgkin lymphoma is commonly classified into early-stage favorable, early-stage unfavorable, and advanced stage. Early-stage Hodgkin lymphoma refers to patients with Ann Arbor stage I or stage II disease. With early-stage Hodgkin lymphoma, the prognosis varies significantly based on factors such as the presence of B symptoms, elevated erythrocyte sedimentation rate ([ESR] > 50 mm/hr), number of nodal sites involved, older age, and a large mediastinal mass. For this reason, most clinical trials to evaluate treatment strategies for early-stage Hodgkin lymphoma are based on various combinations of these risk factors. The definition of early-stage unfavorable Hodgkin lymphoma varies across different clinical trial study groups, and it is important to understand the definition in interpreting the results of these trials (Table 2).45,46
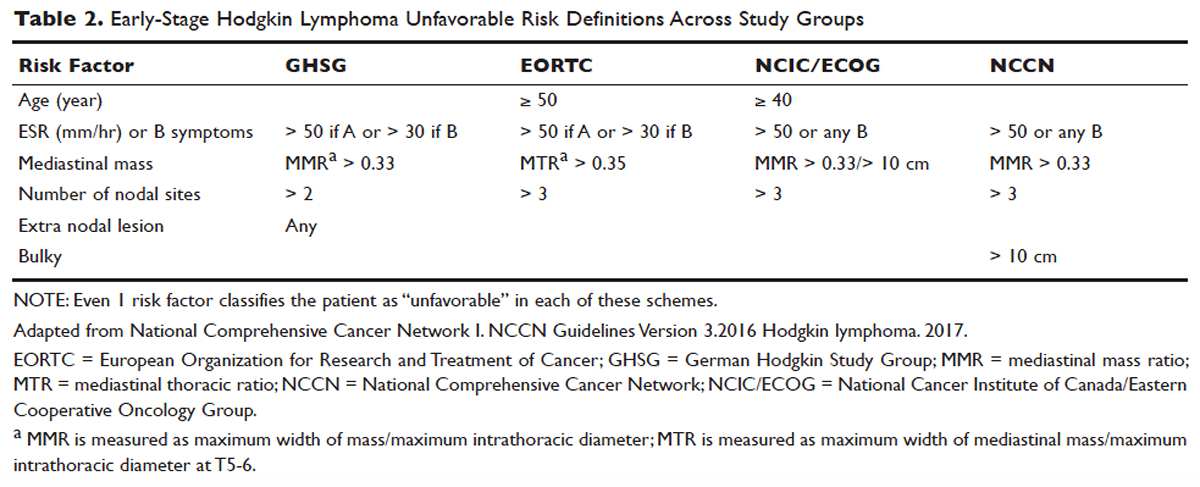
In the German Hodgkin Study Group (GHSG) trials, early-stage Hodgkin lymphoma is stratified into a high risk (“unfavorable”) group defined by any of the following: a large mediastinal mass (one third of maximum thoracic diameter), extra-nodal disease, 3 or more nodal areas, and an ESR of > 50 mm/hr in asymptomatic patients or > 30 mm/hr in patients with B symptoms. Low-risk (“favorable”) patients lack all of these factors.47 The European Organization for Research and Treatment of Cancer (EORTC) defines the unfavorable prognostic group as older than 50 years of age, large mediastinal adenopathy (maximum width on a chest radiograph of at least one third of the internal transverse diameter of the thorax at the level of T5 through T6 or any mass of ≥ 10 cm in the largest dimension), an ESR of 50 mm/hr and no B symptoms, or with an ESR of 30 mm/hr in those who have B symptoms, and/or 4 or more regions of involvement.48 The National Cancer Institute of Canada (NCIC) Clinical Trials Group and the Eastern Cooperative Oncology Group (ECOG) define high-risk groups as presence of B symptoms, bulky disease with a mediastinal mass width of at least one third of the maximum chest wall diameter, or any mass greater than 10 cm, and patients with intra-abdominal disease.49,50
Gene-expression profiling in Hodgkin lymphoma has identified a gene signature of tumor-associated macrophages that was able to identify patients with a higher risk for primary treatment failure. In an independent cohort of patients, an increased number of CD68-positive macrophages was correlated with inferior outcomes.51,52 Studies such as these underscore the importance of the tumor “microenvironment” (ie, the nonmalignant cells within a tumor) in determining the overall clinical behavior of a malignancy. While quantification of CD68-positive macrophages has potential to be applied to routine clinical practice, prospective data using CD68 as a tool for risk-adapted therapy is lacking.
Genetic alterations and amplifications in the 9p24.1 locus have recently been found to be a defining genetic feature of cHL. Amplification of 9p24.1 has been associated with unfavorable outcomes. Amplification of 9p24.1 (which includes the loci encoding the PD-L1 and PD-L2 genes) is more common in patients with advanced stage disease and is associated with shorter PFS.23
A recent study attempted to integrate several different prognostic factors in cHL patients who were treated with ABVD (adriamycin [doxorubicin], bleomycin, vinblastine, and dacarbazine) and underwent an interim PET (iPET) scan after 2 cycles of ABVD. Focusing on those with a negative iPET scan, it was found that expression of CD68 and PD-1 in microenvironment cells, and STAT1 negativity in HRS cells identified a subset of PET-2 negative patients with a 3-year PFS significantly lower than that of the remaining PET-2 negative population (64% versus 95%). The algorithm correctly predicted the response to treatment in more than half of the patients who had relapse or disease progression despite a negative PET-2 scan. It therefore appears feasible, using tissue biomarkers at diagnosis, to identify patients at increased risk for poor outcome, even if the iPET scan is negative.53
ROLE OF PET/CT IN ASSESSMENT OF RESPONSE TO THERAPY
PET/CT has been increasingly used for response assessment at various stages in lymphoma in recent years. Almost all types of lymphomas are fluorodeoxyglucose (FDG) avid; however, Hodgkin lymphoma is FDG avid in 97% to 100% of cases. In 2009, a 5-point scale was developed to score PET images with regard to treatment response, either partway through treatment (iPET) or at the end of therapy.54 It was recommended as the standard reporting tool at the First International Workshop on PET in Lymphoma in Deauville, France, in 2009, and is thus now referred to as the Deauville score. A score of 1 is given if there is no uptake, 2 if the uptake ≤ mediastinum, 3 if > mediastinum but ≤ liver, 4 if uptake moderately higher than liver, 5 if uptake is markedly higher than liver and/or new lesions. X designates new areas of uptake unlikely to be related to lymphoma. In most trials, a score of 1 or 2 is considered a complete response and a score of 4 or 5 is considered a treatment failure. A score of 3 is sometimes considered a complete response, depending on the study. The Deauville criteria have been widely used in newer clinical trials utilizing response-adapted treatment as defined by PET response. PET/CT is recommended for staging and restaging at the end of therapy, in clinical practice, and clinical trials. Interim PET/CT scan, while commonly performed in clinical practice, is only recommended if the results will alter therapy (eg, if that information will result in the clinician omitting radiation therapy [RT] or altering the chemotherapy plan).
Early studies of iPET showed that achieving PET negativity early in the course of treatment was strongly associated with PFS and overall survival.55 Subsequent studies confirmed the importance of achieving a negative iPET. As a result, considerable efforts have been put into designing response-adapted treatment approaches using iPET (see Treatment section), with some of these approaches now being listed in the National Comprehensive Cancer Network (NCCN) guidelines and being used in standard practice.
TREATMENT
EVOLUTION OF TREATMENT
The treatment of Hodgkin lymphoma has evolved over the past century, starting with the discovery of RT as effective treatment in the early 20th century. Long-term survival of patients with Hodgkin lymphoma treated with involved-field radiation therapy (IFRT) was first reported in the 1960s.56,57 Outcomes improved further with the introduction of combined modality treatment (CMT) using chemotherapy and RT, with the overall 5-year relative survival for patients with Hodgkin lymphoma (all stages) treated in 2006–2012 being 85.4% to 87.3%.3 Since the majority of patients are now cured with modern therapy, treatment-related complications have become an important competing cause of mortality. Recent studies have therefore focused on maintaining efficacy while reducing toxicities, and refining the process of selecting patients who might benefit from more aggressive therapy. While RT was the first treatment modality shown to be curative for Hodgkin lymphoma,56,57 multiple subsequent studies showed that CMT is superior to RT alone in terms of relapse-free survival.58–63 In the GHSG H8-F trial, the estimated 5-year event-free survival and overall survival rates were significantly higher after 3 cycles of MOPP-ABV (mechlorethamine, vincristine, procarbazine, and prednisone combined with doxorubicin, bleomycin, and vinblastine) plus IFRT than after subtotal nodal radiotherapy alone. The 10-year overall survival estimates were 97% and 92%, respectively (P = 0.001).64 As a result, CMT replaced RT alone as the standard of care for limited-stage Hodgkin lymphoma. However, for elderly or infirm patients, or those with other comorbidities making them poor chemotherapy candidates, RT alone may be a very reasonable option.65 More recently, an increasing body of evidence has accumulated to support the use of chemotherapy alone in early stage cHL. This literature has consistently shown that omission of RT is associated with a modest increase in relapse, without a clear compromise in long-term overall survival. For some patients, the trade-off in terms of avoiding radiation (and the associated late effects) may be worth the small increase in relapse risk, since long-term survival does not appear to be substantially worse with chemo-therapy alone. Table 3 and Table 4 provide a summary of recent key studies which have defined treatment options for early-stage cHL.48,66–71

EARLY-STAGE NLPHL
NLPHL usually presents with limited-stage disease without B symptoms and has an indolent course with a slightly better prognosis compared to cHL.72 Due to the rarity of the disease, treatment guidelines are mostly based on retrospective analyses from single or multi-institution studies or subgroup analyses, often with relatively short follow-up. These studies must be interpreted with caution because of the possibility of inaccuracies in the pathologic diagnosis, small sample sizes, and selection bias. Treatment options for limited-stage NLPHL include observation, single-agent rituximab, IFRT (or involved-site radiation therapy [ISRT]) alone, or CMT.46
Historically, patients with limited-stage NLPHL have been treated with RT alone, with 80% to 85% PFS and 85% to 95% overall survival rates.73–75 Patients who relapse or progress after RT in general can successfully undergo salvage therapy.74 In one study, rates of PFS and overall survival were similar among patients who had limited-field, regional-field, or extended-field RT,75 indicating that IFRT is preferred. Studies comparing RT alone and CMT are limited. The GHSG HD7 trial included a subset of NLPHL patients, with a trend towards improved freedom from treatment failure (96% versus 83%) favoring CMT. This, however, did not translate into improved overall survival.47 A retrospective analysis of the British Columbia Cancer Agency database compared patients with limited-stage NLPHL treated with RT alone to patients who received 2 cycles of ABVD followed by RT. A significant improvement in PFS (91% versus 65%) and overall survival (93% versus 84%) was seen, favoring CMT.76
Chemotherapy alone is not recommended for limited-stage NLPHL since studies evaluating chemotherapy alone are quite limited and indicate relatively high rates of treatment failure. Given that the malignant cells in NLPHL are CD20-positive, single-agent rituximab has also been studied in this disease, including a study as frontline therapy in limited-stage patients. In this phase 2 trial in newly diagnosed patients with stage IA disease, an overall response rate (ORR) of 100% was seen, with an 85% complete response (CR) rate.77 At 3 years, overall survival was 100% and PFS was 81%, indicating that the responses with single-agent rituximab are less durable than those with RT.
Advani et al evaluated rituximab followed by observation versus rituximab (R) followed by maintenance rituximab (MR) for 2 years in 39 new or previously treated patients. At 4 weeks the ORR was 100% (with CR in 67%, and partial response in 33%). At a median follow up of 9.8 years for R alone, and 5 years for R+MR, median PFS was 3 and 5.6 years, respectively (P = 0.26). Estimated 5-yr PFS and overall survival in patients treated with R versus R+MR were 39.1% and 95.7% versus 58.9% and 85.7%, with Pvalues of 0.26 (PFS) and 0.38 (overall), respectively. Maintenance rituximab therefore appears to prolong remission, although the results did not quite reach statistical significance.78 Even though rituximab does not appear to be curative in NLPHL, it is a reasonable option for patients with early-stage NLPHL who are not good candidates for definitive RT. Whether combining rituximab with RT or CMT might further improve outcomes in early-stage NLPHL has not yet been determined.
In children, surgery alone may lead to long-term remission or possibly cure of limited-stage NLPHL. In a European multicenter retrospective study, 58 patients underwent surgery for limited-stage NLPHL. Among the 51 patients who achieved complete remission following surgery, 67% remained progression-free and 100% were alive at a median follow up of 43 months.79 In adults, there is no data to support surgical treatment alone for NLPHL. Finally, observation may be a reasonable option in elderly or infirm patients for whom NLPHL is unlikely to affect life expectancy. For younger patients, given the excellent outcome with modern therapy and the long-term risk of transformation of NLPHL into an aggressive non-Hodgkin lymphoma, observation is generally not recommended.
The NCCN recommends RT (ISRT or IFRT, 30–36 Gy) as the preferred treatment for stage IA and IIA non-bulky NLPHL. In patients with stage IA disease with complete excision of solitary nodule, observation may be appropriate. A course of chemotherapy with ISRT with or without rituximab is recommended for patients with stage IB or IIB disease, or patients with stage IA or IIA bulky disease.
FIRST-LINE TREATMENT OF LIMITED-STAGE CHL
Early-Stage Favorable cHL
There is lack of consensus regarding the ideal treatment approach for patients with early-stage favorable cHL. However, there are several excellent options available, with overall survival rates exceeding 90%. Most of these regimens involve CMT, although some chemotherapy-alone approaches have been evaluated as well. Concurrent with the demonstration of excellent long-term remission rates with CMT, it became apparent that the long-term survival and quality of life of these patients is determined in large part by the risk of serious (and potentially fatal) treatment-related toxicities. Such toxicities consist primarily of secondary malignancies and cardiovascular events, and can continue to cause significant morbidity and mortality even 2 to 3 decades after treatment.80–82 As a result, treatment decisions for these patients are complicated and require balancing efficacy against risk of late complications.
In the United States, until recently, CMT was generally considered the standard of care, with robust long-term data regarding efficacy. The most commonly used regimen has been ABVD for 2 to 4 cycles followed by IFRT. In some German studies, escalated BEACOPP (bleomycin, etoposide, doxorubicin, cyclophosphamide, vincristine, procarbazine, prednisone) has been used, but this is not a general standard of care in the United States for early-stage patients.
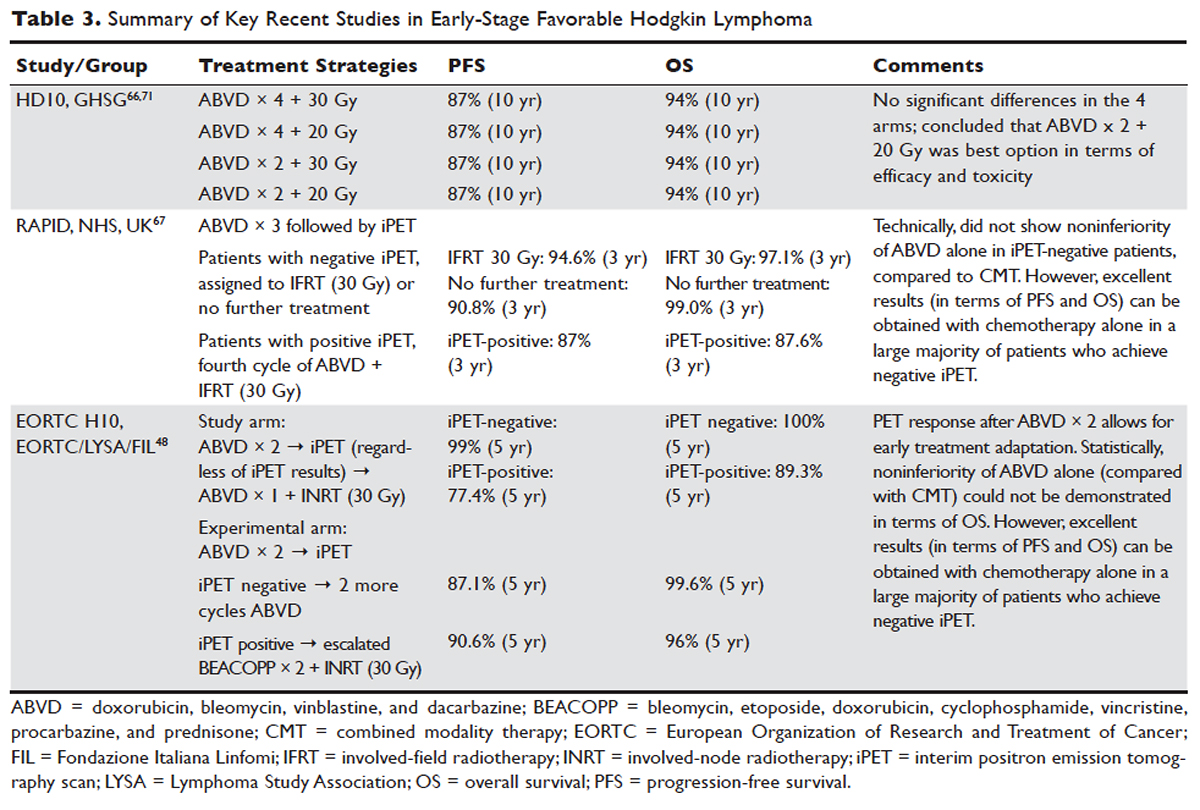
More recent data suggests that the rate of serious late complications in Hodgkin lymphoma patients is decreasing, likely due to less extensive radiation fields, lower radiation doses, and a movement away from the MOPP regimen to ABVD.83,84 For patients who meet the “favorable” criteria set forth in the GHSG HD10 trial (see Table 2), 2 cycles of ABVD followed by 20 Gy of IFRT is an attractive option, with efficacy preserved and a low anticipated rate of late effects.66 With this approach, and with long-term (10 years) follow up, all 4 arms had similar PFS (87%) and overall survival (94%), whether 2 or 4 cycles of ABVD were given. When the effects of 20-Gy and 30-Gy doses of RT were compared, there were also no significant differences in freedom from treatment failure or overall survival. Adverse events and acute toxic effects of treatment were most common in the patients who received 4 cycles of ABVD and 30 Gy of RT.66,71
In recent years, in an attempt to reduce late effects further, regimens consisting of chemotherapy alone have been investigated. In a study by Meyer et al, at 12 years the rate of overall survival was 94% among those receiving ABVD alone, as compared with 87% among those receiving subtotal nodal RT; the rates of freedom from disease progression were 87% and 92% in the 2 groups; and the rates of event-free survival were 85% and 80%, respectively.50 However, it is important to note that this study did not include a CMT arm for the early favorable patients, and did not utilize modern RT techniques. Nevertheless, this early study and others60 suggested that chemotherapy alone may be a reasonable option for some early-stage cHL patients, particularly for patients who are felt to be at increased risk for late toxicities from RT. As a result, additional studies have been conducted evaluating CMT versus chemotherapy alone for early-stage cHL. Many of these studies have incorporated interim PET/CT scan to develop a response-adapted approach to decide which patients are least likely to benefit from RT.
The HD-13 study was a follow-up study for HD-10, looking at deletion of bleomycin, dacarbazine, or both from the ABVD backbone. The ABD arm was closed early, because of an excess rate of treatment failure. Among the 1243 patents assigned to either the ABVD or AVD arm at 5 years of follow-up, there was 4.3% difference in PFS. This study was not able to demonstrate that 2 cycles of AVD was noninferior to 2 cycles of ABVD, each followed by 30 Gy IFRT, even though there was no difference in all 4 groups. It confirmed 2 cycles of ABVD as the preferred regimen in early favorable Hodgkin lymphoma, when CMT is the plan of care. However, for patients over age 60 to 65 years, or those with underlying cardiac or pulmonary comorbidities, bleomycin has significant risk of toxicity. In that setting, AVD is a safer option, with only a very modest decrease in 5-year PFS.
Based on the observation that iPET scan is highly predictive of outcome in Hodgkin lymphoma,55,85 several trials have employed the use of an iPET scan to guide therapy. It is hoped that such studies will lead to new PET-directed treatment algorithms in which patients who require more aggressive therapy (eg, with CMT, or escalated BEACOPP) can be identified, and the remaining patients can be safely treated less aggressively (eg, with chemotherapy alone).
In the EORTC H10 trial, performed to evaluate treatment adaptation on the basis of iPET scan results in stage I and II Hodgkin lymphoma, a control arm received standard combined modality treatment (3 or 4 cycles of ABVD with INRT) irrespective of PET scan results. In the experimental arm, patients with a negative PET scan after 2 cycles of ABVD continued with 1 or 2 cycles of ABVD and did not receive RT. The iPET-positive patients received either standard treatment with ABVD plus INRT or escalated BEACOPP plus INRT. The iPET-negative patients received either ABVD only or ABVD plus INRT. The final results of this study, published recently, showed that in the iPET-positive patients the 5-year PFS was improved from 77.4% with standard ABVD plus INRT to 90.6% with escalated BEACOPP plus INRT (P = 0.002). In iPET-negative patients, 5-year PFS in the favorable group was 99% versus 87.1% in favor of ABVD plus INRT. The H10 study suggested that PET results after 2 cycles of ABVD can be integrated into treatment planning, In iPET-negative patients, the study was technically not able to demonstrate the noninferiority of the ABVD only regimen, owing to a higher risk of relapse if INRT is omitted, particularly in the favorable group.48 However, this study does show that excellent outcomes can be obtained with omission of RT in patients with a negative iPET scan. This study provides a cautionary lesson though, in that the increase in relapse rate associated with omission of RT was more substantial (12%) for favorable versus unfavorable early-stage patients (2.5%), and this difference was only apparent after longer (5 years) follow-up. Despite this, chemotherapy alone is considered a reasonable treatment option, especially for patients felt to be at increased risk for late toxicities of RT or for patients who wish to avoid the risks of RT, with over 99% of patients alive at 5 years.
Similar results were shown in the RAPID trial, in which patients with limited-stage cHL underwent 3 cycles of ABVD followed by PET assessment.67 Patients with a negative PET (n = 426) were then randomized to RT (n = 209) versus no further therapy (n = 211). At a median of 60 months of follow-up, 3-year PFS was 94.6% in the RT group and 90.8% in the chemotherapy alone group. Similar to the H10 trial, it was concluded that chemotherapy alone was statistically inferior to CMT in terms of PFS. However, also similar to the H10 trial, the RAPID trial demonstrated that excellent results can be obtained in early-stage cHL patients with omission of RT, if iPET scan is negative after 3 cycles of ABVD, as there was no survival difference. These findings indicate that, when relapses occur as a result of omission of RT, such patients can be effectively treated later.
In the ongoing GHSG HD16 trial, patients with early-stage favorable cHL will be randomly assigned to a standard approach (ABVD × 2 cycles followed by 20-Gy IFRT) versus an experimental approach in which they receive ABVD for 2 cycles and then undergo PET scan. If the PET remains positive, they will receive 20-Gy IFRT. If the PET is negative, they will receive no further therapy. This trial could ultimately define ABVD for 2 cycles as a treatment option.
It is clear from these studies that omission of RT results in a somewhat higher rate of relapse but can be considered in selected patients. However, taking a less aggressive frontline approach may also be justified by the fact that, for those who do relapse, successful salvage therapies are available. Aggressive salvage therapy with autologous stem cell transplantation historically can cure approximately 50% of relapsed patients. With new and emerging therapies for relapsed disease, such as brentuximab vedotin and the PD-1 inhibitors (eg, nivolumab and pembrolizumab), the ability to cure relapsed patients may improve even more, further calling into question the practice of applying CMT uniformly for early-stage patients undergoing first-line therapy. Unfortunately, there is insufficient data from large randomized studies with long-term follow-up to fully address this issue currently, and there remains some controversy around this issue. NCCN recommends restaging PET/CT after 3 cycles of ABVD if a chemotherapy alone treatment modality is chosen. If the Deauville score is 1 or 2, either observation or 1 additional cycle of ABVD is recommended.46
Early-Stage Unfavorable cHL
In the United States, historically early-stage unfavorable Hodgkin lymphoma has been treated with CMT, most commonly 4 to 6 cycles of ABVD followed by consolidative RT. With this approach one can expect a 5-year PFS of approximately 80% to 85%.58,64,86 The GHSG HD8 trial showed that RT volume size reduction from extended-field to involved-field after COPP + ABVD chemotherapy for 2 cycles produced similar results and less toxicity in patients with early-stage unfavorable cHL.86 The GHSG trial HD11 established ABVD for 4 cycles plus 30-Gy IFRT as a standard for early unfavorable Hodgkin lymphoma. The freedom from treatment failure at 5 years was 85.0%, and overall survival was 94.5%.68
In the HD14 study by the GHSG, patients with early unfavorable cHL were treated with 2 cycles of escalated BEACOPP followed by 2 cycles of ABVD, versus 4 cycles of ABVD. All patients then received 30 Gy of consolidative IFRT. A 5-year PFS of 95% was seen in the experimental arm, compared with 89% in the standard (ABVD) arm. As expected, this regimen was associated with more acute hematologic toxicity, and there was no difference between the 2 regimens with respect to overall survival or fertility.69 Given the lack of improved survival and increased toxicity, ABVD has remained the standard chemotherapy regimen for early unfavorable cHL in the United States. NCCN recommends a restaging PET scan after 2 cycles of ABVD and to continue with 2 to 4 cycles of ABVD or escalated BEACOPP with or without ISRT based on Deauville scores.
Another viable treatment option is the Stanford V regimen, a condensed, 12-week regimen that includes mechlorethamine, doxorubicin, vinblastine, prednisone, vincristine, etoposide, and bleomycin, followed by IFRT.87 In a randomized phase 3 trial conducted by ECOG (E2496), patients with stage I/II Hodgkin lymphoma with bulky mediastinal disease or advanced-stage disease were randomized to ABVD × 6 to 8 cycles versus Stanford V. RT was given (36 Gy) for those with bulky mediastinal disease or to sites of disease greater than 5 cm in the Stanford V arm. In a subset analysis focusing only on those with stage I/II bulky mediastinal disease, the 5-year failure free survival was 85% versus 79% and the 5-year overall survival was 96% versus 92% for the ABVD versus Stanford V arms, respectively. These differences were not statistically significant.70 While the Stanford V regimen has the advantages of a 12-week treatment duration and a lower cumulative amount of bleomycin and doxorubicin, the Stanford V arm had higher rates of grade 3 lymphopenia and grade 3 to 4 peripheral neuropathies. In addition, Stanford V requires that most patients undergo RT (to original sites of disease measuring 5 cm or more plus contiguous areas). As a result, the investigators concluded that ABVD × 4 cycles plus IFRT remains the standard of care for patients with early unfavorable Hodgkin lymphoma with bulky mediastinal disease.
Other regimens have been studied in hopes of reducing toxicity, including the EVE regimen (epirubicin, vinblastine, and etoposide). This regimen was compared to ABVD in early unfavorable Hodgkin lymphoma patients, with all patients undergoing the same RT program. No differences were observed between the ABVD and EVE arms in terms of complete remission rate and overall survival. However, patients who received EVE had a significantly worse outcome than those who received ABVD in terms of relapse-free survival and failure-free survival.88 EBVP (epirubicin, bleomycin, vinblastine, and prednisone) followed by IFRT was less efficacious compared with MOPP/ABV–type therapy.58
An area of active investigation is whether RT can be safely omitted in patients with early- stage unfavorable cHL. The EORTC H10 study showed that, for patients with a negative iPET scan (after 2 cycles), the 5-year PFS rates were 92.1% versus 89.6% for ABVD plus INRT versus ABVD alone, respectively. While this technically did not meet criteria for noninferiority of ABVD alone, this study demonstrated that, for those with negative iPET, ABVD × 6 cycles (without radiation) can result in long-term remission in a high proportion (89%) of patients. For iPET-positive patients, 2 cycles of escalated BEACOPP were given followed by 30 Gy of IFRT on the experimental arm. This resulted in a 5-year PFS of 90.6% versus 77.4%, suggesting this may be a preferred approach for early-stage unfavorable patients with a positive iPET.48 Even though the noninferiority of ABVD alone could not be established based on the statistical design of the study, the current NCCN guidelines recommend restaging after 2 cycles of ABVD for stage I or II unfavorable cHL and using that iPET as a guide, based on Deauville scores. For scores 1–3, ABVD × 2 cycles (total 4 cycles) plus ISRT or AVD × 4 (total 6) with or without ISRT is recommended. For a Deauville score of 4, escalated BEACOPP × 2 cycles or ABVD × 2 cycles (total 4) followed by ISRT is recommended. If the Deauville score is 5, further treatment decisions should be made based on repeat biopsy results. A follow up PET/CT is recommended for Deauville scores of 4 and 5 to confirm complete response.46
LATE EFFECTS AND THE EVOLUTION OF RADIATION THERAPY
The RT given in Hodgkin lymphoma has evolved considerably over the years, from extended field or subtotal nodal fields developed in the 1960s, to the more focused involved-field or even involved-site radiation commonly given now. This approach reduces radiation volumes, and it already is becoming evident that the relative risk of breast cancer among young females receiving mediastinal RT for Hodgkin lymphoma is declining.89 Cardiac dose is reduced significantly with IFRT compared to older radiation techniques as well. The extent of radiation may be reduced even further with involved-nodal/involved site or intensity-modulated approaches.90
With new RT techniques allowing for more focused therapy and lower doses of radiation, models predict that the rate of long-term complications will decline further.91,92 Furthermore, response-adapted (ie, PET-directed) approaches, as discussed in detail earlier in the article, are expected to increasingly allow for identification of patients who can safely avoid radiation entirely, which will hopefully lead to an even lower rate of late complications of therapy.
MONITORING FOR RELAPSE
A number of recent studies have shown that, for patients who achieve complete remission with first-line therapy, performing repeated scheduled surveillance imaging does not improve outcomes. In fact, most relapses are detected by the patient (due to symptoms or recurrence of lymph node enlargement). It is rare that a relapse would be detected by surveillance imaging alone. Furthermore, surveillance that includes routine imaging has not been associated with improved survival.93 As a result, it is now recommended that patients undergo regular follow-up with symptom review, physical exam, and basic laboratory studies. Imaging studies should be obtained as needed for patients who develop signs, symptoms, exam findings, or laboratory values concerning for relapse.
More important than scheduled surveillance imaging for relapse is monitoring for late effects of therapy. These fall into several broad categories such as cardiovascular disease (coronary disease, congestive heart failure, valvular disease, carotid artery disease), pulmonary disease, hypothyroidism, and secondary malignancies. Aggressive surveillance for breast cancer is especially warranted in female patients who underwent chest radiation.46
CONCLUSION
Hodgkin lymphoma is characterized pathologically by the presence of HRS cells accompanied by a polymorphous cellular infiltrate. It is a disease with a bimodal age distribution, several pathologic subtypes, and numerous treatment options. Overall, the prognosis for patients with early-stage disease is excellent, and although a majority of patients can now be cured, further studies are needed to optimize treatment such that short- and long-term treatment-related toxicities are minimized, without compromising disease control and cure.
- Küppers R, Rajewsky K, Zhao M, et al. Hodgkin disease: Hodgkin and Reed-Sternberg cells picked from histological sections show clonal immunoglobulin gene rearrangements and appear to be derived from B cells at various stages of development. Proc Natl Acad Sci U S A 1994;91:10962–6.
- Küppers R. The biology of Hodgkin›s lymphoma. Nat Rev Cancer 2009;9:15–27.
- National Cancer Institute. SEER cancer statistics review, 1975–2014. 2017. http://seer.cancer.gov/csr/1975_2013/. Accessed April 27, 2017.
- Haim N, Cohen Y, Robinson E. Malignant lymphoma in first-degree blood relatives. Cancer 1982;49:2197–200.
- Mack TM, Cozen W, Shibata DK, et al. Concordance for Hodgkin’s disease in identical twins suggesting genetic susceptibility to the young-adult form of the disease. N Engl J Med 1995;332:413–8.
- Sant M, Allemani C, Tereanu C, et al. Incidence of hematologic malignancies in Europe by morphologic subtype: results of the HAEMACARE project. Blood 2010;116:3724–34.
- Hjalgrim H, Askling J, Rostgaard K, et al. Characteristics of Hodgkin’s lymphoma after infectious mononucleosis. N Engl J Med 2003;349:1324–32.
- Hessol NA, Katz MH, Liu JY, et al. Increased incidence of Hodgkin disease in homosexual men with HIV infection. Ann Intern Med 1992;117:309–11.
- Shiels MS, Pfeiffer RM, Gail MH, et al. Cancer burden in the HIV-infected population in the United States. J Natl Cancer Inst 2011;103:753–62.
- Powles T, Robinson D, Stebbing J, et al. Highly active antiretroviral therapy and the incidence of non-AIDS-defining cancers in people with HIV infection. J Clin Oncol 2009;27:884–90.
- Bedimo RJ, McGinnis KA, Dunlap M, et al. Incidence of non-AIDS-defining malignancies in HIV-infected versus noninfected patients in the HAART era: impact of immunosuppression. J Acquir Immune Defic Syndr 2009;52:203–8.
- Biggar RJ, Jaffe ES, Goedert JJ, et al. Hodgkin lymphoma and immunodeficiency in persons with HIV/AIDS. Blood 2006;108:3786–91.
- Thompson LD, Fisher SI, Chu WS, et al. HIV-associated Hodgkin lymphoma: a clinicopathologic and immunophenotypic study of 45 cases. Am J Clin Pathol 2004;121:727–38.
- Briggs NC, Hall HI, Brann EA, et al. Cigarette smoking and risk of Hodgkin’s disease: a population-based case-control study. Am J Epidemiol 2002;156:1011–20.
- Castillo JJ, Dalia S, Shum H. Meta-analysis of the association between cigarette smoking and incidence of Hodgkin’s Lymphoma. J Clin Oncol 2011;29:3900–6.
- Kanzler H, Kuppers R, Hansmann ML, Rajewsky K. Hodgkin and Reed-Sternberg cells in Hodgkin’s disease represent the outgrowth of a dominant tumor clone derived from (crippled) germinal center B cells. J Exp Med 1996;184:1495–505.
- Stein H, Hummel M. Cellular origin and clonality of classic Hodgkin’s lymphoma: immunophenotypic and molecular studies. Semin Hematol 1999;36:233-41.
- Marafioti T, Hummel M, Foss HD, et al. Hodgkin and reed-sternberg cells represent an expansion of a single clone originating from a germinal center B-cell with functional immunoglobulin gene rearrangements but defective immunoglobulin transcription. Blood 2000;95:1443–50.
- Marafioti T, Hummel M, Anagnostopoulos I, et al. Origin of nodular lymphocyte-predominant Hodgkin’s disease from a clonal expansion of highly mutated germinal-center B cells. N Engl J Med 1997;337:453–8.
- van den Berg A, Visser L, Poppema S. High expression of the CC chemokine TARC in Reed-Sternberg cells. A possible explanation for the characteristic T-cell infiltratein Hodgkin’s lymphoma. Am J Pathol 1999;154:1685–91.
- Bargou RC, Emmerich F, Krappmann D, et al. Constitutive nuclear factor-kappaB-RelA activation is required for proliferation and survival of Hodgkin’s disease tumor cells. J Clin Invest 1997;100:2961–9.
- Luftig M, Yasui T, Soni V, et al. Epstein-Barr virus latent infection membrane protein 1 TRAF-binding site induces NIK/IKK alpha-dependent noncanonical NF-kappaB activation. Proc Natl Acad Sci U S A 2004;101:141–6.
- Roemer MGM, Advani RH, Ligon AH, et al. PD-L1 and PD-L2 genetic alterations define classical Hodgkin lymphoma and predict outcome. J Clin Oncol 2016;34:2690–7.
- Swerdlow SH CE, Harris NL, et al. WHO classification of tumours of haematopoietic and lymphoid tissues. Lyon, France: IARC Press; 2008.
- Campo E, Swerdlow SH, Harris NL, et al. The 2008 WHO classification of lymphoid neoplasms and beyond: evolving concepts and practical applications. Blood 2011;117:5019–32.
- von Wasielewski R, Mengel M, Fischer R, et al. Classical Hodgkin’s disease. Clinical impact of the immunophenotype. Am J Pathol 1997;151:1123–30.
- Tzankov A, Krugmann J, Fend F, et al. Prognostic significance of CD20 expression in classical Hodgkin lymphoma: a clinicopathological study of 119 cases. Clin Cancer Res 2003;9:1381–6.
- Diehl V, Sextro M, Franklin J, et al. Clinical presentation, course, and prognostic factors in lymphocyte-predominant Hodgkin’s disease and lymphocyte-rich classical Hodgkin’s disease: report from the European Task Force on Lymphoma Project on Lymphocyte-Predominant Hodgkin’s Disease. J Clin Oncol 1999;17:776–83.
- Shimabukuro-Vornhagen A, Haverkamp H, Engert A, et al. Lymphocyte-rich classical Hodgkin’s lymphoma: clinical presentation and treatment outcome in 100 patients treated within German Hodgkin’s Study Group trials. J Clin Oncol 2005;23:5739–45.
- Slack GW, Ferry JA, Hasserjian RP, et al. Lymphocyte depleted Hodgkin lymphoma: an evaluation with immunophenotyping and genetic analysis. Leuk Lymphoma 2009;50:937–43.
- Mason DY, Banks PM, Chan J, et al. Nodular lymphocyte predominance Hodgkin’s disease. A distinct clinicopathological entity. Am J Surg Pathol 1994;18:526–30.
- Rudiger T, Gascoyne RD, Jaffe ES, et al. Workshop on the relationship between nodular lymphocyte predominant Hodgkin’s lymphoma and T cell/histiocyte-rich B cell lymphoma. Ann Oncol 2002;13 Suppl 1:44–51.
- Sundeen JT, Cossman J, Jaffe ES. Lymphocyte predominant Hodgkin’s disease nodular subtype with coexistent “large cell lymphoma”. Histological progression or composite malignancy? Am J Surg Pathol 1988;12:599–606.
- Kenderian SS, Habermann TM, Macon WR, et al. Large B-cell transformation in nodular lymphocyte-predominant Hodgkin lymphoma: 40-year experience from a single institution. Blood. 2016;127:1960–6.
- Mauch PM, Kalish LA, Kadin M, et al. Patterns of presentation of Hodgkin disease. Implications for etiology and pathogenesis. Cancer 1993;71:2062–71.
- Juweid ME, Cheson BD. Positron-emission tomography and assessment of cancer therapy. N J Engl Med 2006;354:496–507.
- Hutchings M, Loft A, Hansen M, et al. Position emission tomography with or without computed tomography in the primary staging of Hodgkin’s lymphoma. Haematologica 2006;91:482–9.
- Naumann R, Beuthien-Baumann B, Reiss A, et al. Substantial impact of FDG PET imaging on the therapy decision in patients with early-stage Hodgkin’s lymphoma. Br J Cancer 2004;90:620–5.
- Juweid ME, Stroobants S, Hoekstra OS, et al. Use of positron emission tomography for response assessment of lymphoma: consensus of the Imaging Subcommittee of International Harmonization Project in Lymphoma. J Clin Oncol 2007;25:571–8.
- El-Galaly TC, d’Amore F, Mylam KJ, et al. Routine bone marrow biopsy has little or no therapeutic consequence for positron emission tomography/computed tomography-staged treatment-naive patients with Hodgkin lymphoma. J Clin Oncol 2012;30:4508–14.
- Wang J, Weiss LM, Chang KL, et al. Diagnostic utility of bilateral bone marrow examination: significance of morphologic and ancillary technique study in malignancy. Cancer 2002;94:1522–31.
- Menon NC, Buchanan JG. Bilateral trephine bone marrow biopsies in Hodgkin’s and non-Hodgkin’s lymphoma. Pathology 1979;11:53–7.
- Carbone PP, Kaplan HS, Musshoff K, et al. Report of the Committee on Hodgkin’s Disease Staging Classification. Cancer Res 1971;31:1860–1.
- Lister TA, Crowther D, Sutcliffe SB, et al. Report of a committee convened to discuss the evaluation and staging of patients with Hodgkin’s disease: Cotswolds meeting. J Clin Oncol 1989;7:1630–6.
- Armitage JO. Early-stage Hodgkin’s lymphoma. N Engl J Med 2010;363:653–62.
- National Comprehensive Cancer Network I. NCCN Guidelines Version 3.2016 Hodgkin lymphoma. 2017.
- Engert A, Franklin J, Eich HT, et al. Two cycles of doxorubicin, bleomycin, vinblastine, and dacarbazine plus extended-field radiotherapy is superior to radiotherapy alone in early favorable Hodgkin's lymphoma: final results of the GHSG HD7 trial. J Clin Oncol 2007;25:3495–502.
- Andre MP, Girinsky T, Federico M, et al. Early positron emission tomography response-adapted treatment in stage I and II Hodgkin lymphoma: final results of the randomized EORTC/LYSA/FIL H10 trial. J Clin Oncol 2017:Jco2016686394.
- Meyer RM, Gospodarowicz MK, Connors JM, et al. Randomized comparison of ABVD chemotherapy with a strategy that includes radiation therapy in patients with limited-stage Hodgkin’s lymphoma: National Cancer Institute of Canada Clinical Trials Group and the Eastern Cooperative Oncology Group. J Clin Oncol 2005;23:4634–42.
- Meyer RM, Gospodarowicz MK, Connors JM, Pearcey RG, Wells WA, Winter JN, et al. ABVD alone versus radiation-based therapy in limited-stage Hodgkin’s lymphoma. N Engl J Med 2012;366:399–408.
- Steidl C, Lee T, Shah SP, et al. Tumor-associated macrophages and survival in classic Hodgkin’s lymphoma. N Engl J Med 2010;362:875–85.
- Kamper P, Bendix K, Hamilton-Dutoit S, et al. Tumor-infiltrating macrophages correlate with adverse prognosis and Epstein-Barr virus status in classical Hodgkin’s lymphoma. Haematologica 2011;96:269–76.
- Agostinelli C, Gallamini A, Stracqualursi L, et al. The combined role of biomarkers and interim PET scan in prediction of treatment outcome in classical Hodgkin’s lymphoma: a retrospective, European, multicentre cohort study. Lancet Haematol 2016;3:e467–e79.
- Meignan M, Gallamini A, Meignan M, et al. Report on the First International Workshop on Interim-PET-Scan in Lymphoma. Leuk Lymph 2009;50:1257–60.
- Gallamini A, Hutchings M, Rigacci L, et al. Early interim 2-[18F]fluoro-2-deoxy-D-glucose positron emission tomography is prognostically superior to international prognostic score in advanced-stage Hodgkin’s lymphoma: a report from a joint Italian-Danish study. J Clin Oncol 2007;25:3746–52.
- Easson EC, Russell MH. Cure of Hodgkin’s Disease. Br Med J 1963;1(5347):1704–7.
- Kaplan HS. The radical radiotherapy of regionally localized Hodgkin’s disease. Radiology 1962;78:553–61.
- Noordijk EM, Carde P, Dupouy N, et al. Combined-modality therapy for clinical stage I or II Hodgkin’s lymphoma: long-term results of the European Organisation for Research and Treatment of Cancer H7 randomized controlled trials. J Clin Oncol 2006;24:3128–35.
- Eghbali H, Raemaekers J, Carde P. The EORTC strategy in the treatment of Hodgkin’s lymphoma. Eur J Haematol Suppl 2005:135–40.
- Bloomfield CD PT, Glicksman AS, et al. Chemotherapy and combined modality therapy for Hodgkin’s disease: A progress report on cancer and leukemia group B studies. Cancer Treat Rep 1982;66:835–46.
- Pavlovsky S, Maschio M, Santarelli MT, et al. Randomized trial of chemotherapy versus chemotherapy plus radiotherapy for stage I-II Hodgkin’s disease. J Natl Cancer Inst 1988;80:1466–73.
- Aviles A, Delgado S. A prospective clinical trial comparing chemotherapy, radiotherapy and combined therapy in the treatment of early stage Hodgkin’s disease with bulky disease. Clin Lab Haematol 1998;20:95–9.
- Herbst C, Rehan FA, Brillant C, et al. Combined modality treatment improves tumor control and overall survival in patients with early stage Hodgkin’s lymphoma: a systematic review. Haematologica 2010;95:494–500.
- Ferme C, Eghbali H, Meerwaldt JH, et al. Chemotherapy plus involved-field radiation in early-stage Hodgkin’s disease. N Engl J Med 2007;357:1916–27.
- Landgren O, Axdorph U, Fears TR, et al. A population-based cohort study on early-stage Hodgkin lymphoma treated with radiotherapy alone: with special reference to older patients. Ann Oncol 2006;17:1290–5.
- Engert A, Plutschow A, Eich HT, et al. Reduced treatment intensity in patients with early-stage Hodgkin's lymphoma. N Engl J Med 2010;363:640–52.
- Radford J, Illidge T, Counsell N, et al. Results of a trial of PET-directed therapy for early-stage Hodgkin's lymphoma. N Eng J Med 2015;372:1598–607.
- Eich HT, Diehl V, Gorgen H, et al. Intensified chemotherapy and dose-reduced involved-field radiotherapy in patients with early unfavorable Hodgkin’s lymphoma: final analysis of the German Hodgkin Study Group HD11 trial. J Clin Oncol 2010;28:4199–206.
- von Tresckow B, Plutschow A, Fuchs M, et al. Dose-intensification in early unfavorable Hodgkin’s lymphoma: final analysis of the German Hodgkin Study Group HD14 trial. J Clin Oncol 2012;30:907–13.
- Advani RH, Hong F, Fisher RI, et al. Randomized phase III trial comparing ABVD plus radiotherapy with the Stanford V regimen in patients with stages I or II locally extensive, bulky mediastinal Hodgkin lymphoma: a subset analysis of the North American Intergroup E2496 Trial. J Clin Oncol 2015;33:1936–42.
- Sasse S, Brockelmann PJ, Georgen H, et al. Long-term follow-up of contemporary treatment in early-stage Hodgkin lymphoma: Updated analyses of the German Hodgkin Study Group HD7, HD8, HD10 and HD11 trials. J Clin Oncol 2017 Apr 18:JCO2016709410. doi: 10.1200/JCO.2016.70.9410. [Epub ahead of print]
- Nogova L, Reineke T, Brillant C, et al. Lymphocyte-predominant and classical Hodgkin’s lymphoma: a comprehensive analysis from the German Hodgkin Study Group. J Clin Oncol 2008;26:434–9.
- Wirth A, Yuen K, Barton M, et al. Long-term outcome after radiotherapy alone for lymphocyte-predominant Hodgkin lymphoma: a retrospective multicenter study of the Australasian Radiation Oncology Lymphoma Group. Cancer 2005;104:1221–9.
- Chera BS, Olivier K, Morris CG, et al. Clinical presentation and outcomes of lymphocyte-predominant Hodgkin disease at the University of Florida. Am J Clin Oncol 2007;30:601–6.
- Chen RC, Chin MS, Ng AK, et al. Early-stage, lymphocyte-predominant Hodgkin’s lymphoma: patient outcomes from a large, single-institution series with long follow-up. J Clin Oncol 2010;28:136–41.
- Savage KJ, Skinnider B, Al-Mansour M, et al. Treating limited-stage nodular lymphocyte predominant Hodgkin lymphoma similarly to classical Hodgkin lymphoma with ABVD may improve outcome. Blood 2011;118:4585–90.
- Eichenauer DA FM, Pluetschow A, et al. Phase 2 study of rituximab in newly diagnosed stage IA nodular lymphocytepredominant Hodgkin lymphoma: a report from the German Hodgkin Study Group. Blood 2011;118:4363–5.
- Advani RH, Horning SJ, Hoppe RT, et al. Mature results of a phase II study of rituximab therapy for nodular lymphocyte-predominant Hodgkin lymphoma. J Clin Oncol 2014;32:912–8.
- Mauz-Korholz C, Gorde-Grosjean S, Hasenclever D, et al. Resection alone in 58 children with limited stage, lymphocyte-predominant Hodgkin lymphoma-experience from the European network group on pediatric Hodgkin lymphoma. Cancer 2007;110:179–85.
- Ng AK. Review of the cardiac long-term effects of therapy for Hodgkin lymphoma. Br J Haematol 2011;154:23–31.
- Ng AK, LaCasce A, Travis LB. Long-term complications of lymphoma and its treatment. J Clin Oncol 2011;29:1885–92.
- Aleman BM, van den Belt-Dusebout AW, Klokman WJ, et al. Long-term cause-specific mortality of patients treated for Hodgkin’s disease. J Clin Oncol 2003;21:3431–9.
- Girinsky T, van der Maazen R, Specht L, et al. Involved-node radiotherapy (INRT) in patients with early Hodgkin lymphoma: concepts and guidelines. Radiother Oncol 2006;79:270–7.
- Campbell BA, Voss N, Pickles T, et al. Involved-nodal radiation therapy as a component of combination therapy for limited-stage Hodgkin’s lymphoma: a question of field size. J Clin Oncol 2008;26:5170–4.
- Advani R, Maeda L, Lavori P, et al. Impact of positive positron emission tomography on prediction of freedom from progression after Stanford V chemotherapy in Hodgkin’s disease. J Clin Oncol 2007;25:3902–7.
- Engert A, Schiller P, Josting A, et al. Involved-field radiotherapy is equally effective and less toxic compared with extended-field radiotherapy after four cycles of chemotherapy in patients with early-stage unfavorable Hodgkin’s lymphoma: results of the HD8 trial of the German Hodgkin’s Lymphoma Study Group. J Clin Oncol 2003;21:3601–8.
- Horning SJ, Hoppe RT, Breslin S, et al. Stanford V and radiotherapy for locally extensive and advanced Hodgkin’s disease: mature results of a prospective clinical trial. J Clin Oncol 2002;20:630–7.
- Pavone V, Ricardi U, Luminari S, et al. ABVD plus radiotherapy versus EVE plus radiotherapy in unfavorable stage IA and IIA Hodgkin’s lymphoma: results from an Intergruppo Italiano Linfomi randomized study. Ann Oncol 2008;19:763–8.
- De Bruin ML, Sparidans J, van’t Veer MB, et al. Breast cancer risk in female survivors of Hodgkin’s lymphoma: lower risk after smaller radiation volumes. J Clin Oncol 2009;27:4239–46.
- Hodgson DC. Late effects in the era of modern therapy for Hodgkin lymphoma. Hematology Am Soc Hematol Educ Program 2011;2011:323–9.
- Maraldo MV, Brodin NP, Vogelius IR, et al. Risk of developing cardiovascular disease after involved node radiotherapy versus mantle field for Hodgkin lymphoma. Int J Radiat Oncol Biol Phys 2012;83:1232–7.
- Campbell BA, Hornby C, Cunninghame J, et al. Minimising critical organ irradiation in limited stage Hodgkin lymphoma: a dosimetric study of the benefit of involved node radiotherapy. Ann Oncol 2012;23:1259–66.
- Pingali SR, Jewell SE, Havlat L, et al. Limited utility of routine surveillance imaging for classical Hodgkin lymphoma patients in first complete remission. Cancer 2014;120:2122–9.
INTRODUCTION
Hodgkin lymphoma, previously known as Hodgkin’s disease, is a B-cell malignancy with unique pathological and epidemiological features for which highly effective therapies exist. The disease is characterized by the presence of mononuclear and multinucleate giant cells called Hodgkin and Reed-Sternberg (HRS) cells.1
Hodgkin lymphoma is unique compared to other B-cell lymphomas because of the scarcity of the malignant cells in the tumor tissue. The HRS cells usually account for only 0.1% to 10% of the cells in the affected tissues, and the HRS cells induce accumulation of nonmalignant lymphocytes, macrophages, granulocytes, eosinophils, plasma cells, and histiocytes, which constitute more than 90% of tumor cellularity.2 Although the disease was first described by Sir Thomas Hodgkin in 1832, in part because of this unique histopathology, not until 1991 was it conclusively demonstrated that HRS cells are in fact monoclonal germinal center–derived B-cells. This article reviews management and frontline treatment options for limited-stage classical Hodgkin lymphoma and nodular lymphocyte predominant Hodgkin lymphoma. Treatment of advanced stage and relapsed/refractory Hodgkin lymphoma will be discussed in a separate article.
EPIDEMIOLOGY
Hodgkin lymphoma accounts for 0.5% of all malignancies and 11.7% of all lymphomas among adults in the United States.3 The incidence of Hodgkin lymphoma has been steadily increasing over the past 4 decades and was estimated to be 8260 cases in the United States in 2017, with a slight male predominance. Hodgkin lymphoma is expected to cause 1070 deaths in 2017, accounting for 0.2% of all cancer deaths.3 First-degree relatives of patients with Hodgkin lymphoma have a 3- to 9-fold increased risk of having the disease compared to the general population,4 and monozygotic twin siblings of Hodgkin lymphoma patients have a greatly increased risk for developing the disease—up to 100-fold—compared to normal cohorts.5 The incidence is highest among Caucasians, African Americans, and Hispanics, and lower in Asians and American Indians.3 Hodgkin lymphoma incidence shows a bimodal peak distribution, with 1 peak between the ages of 15 and 44 years, and another peak after age 65 years.6
ETIOLOGY/PATHOGENESIS
The cause of Hodgkin lymphoma is unknown. Epstein-Barr virus (EBV) infection is present in up to 40% of Hodgkin lymphoma cases, suggesting a role of this virus in the pathogenesis of some cases. The risk of EBV-positive Hodgkin lymphoma was found to be higher following an episode of infectious mononucleosis, while the risk of EBV-negative Hodgkin lymphoma remained unchanged.7 The incidence of Hodgkin lymphoma is 5 to 14 times higher in HIV-infected patients than in noninfected patients.8 It is not considered an AIDS-defining illness, but has become more frequent with the growth and aging of the HIV-positive population.9,10 Hodgkin lymphoma patients with HIV typically have CD4 lymphocyte counts greater than 200 cells/μL,11 with the incidence of Hodgkin lymphoma actually declining with lower CD4 lymphocyte counts.12 HIV-related Hodgkin lymphoma tends to have an aggressive course, with high rates of EBV positivity.13 The incidence of Hodgkin lymphoma is 1.8 times higher among smokers, and the risk appears to increase with duration of smoking.14,15
The cell of origin of Hodgkin lymphoma, while long suspected to be the HRS cell, remained unproven until the 1990s when micro-dissection and single-cell polymerase chain reaction techniques allowed for confirmation that the HRS cell was in fact a monoclonal germinal center derived B cell.16,17 These HRS cells lack immunoglobulin due to defective transcription regulation and not due to crippling mutations.18,19 The cellular infiltrate in Hodgkin lymphoma appears to play a decisive role in allowing the HRS cells to survive by providing an environment that suppresses cytotoxic immune responses as well as by providing cellular interactions and cytokines that support their growth and survival. The extensive inflammatory infiltrate in classical Hodgkin lymphoma is comprised of T helper 2 (Th2) and regulatory T cells and lacks T helper 1 (Th1) cells, CD8 cytotoxic T cells, and natural killer cells.20 The HRS cells escape apoptosis by several mechanisms which include latent EBV infection and constitutive nuclear factor (NF)-kB pathways, as well as other deregulated signaling pathways that promote survival, such as EBV nuclear antigen 1 (EBNA1) protein, EBV latent infection membrane protein 1 (LMP1), and LMP2.21,22
Genetic alterations in the 9p24 locus which encodes PD-L1/PD-L2 are nearly universally present in classical Hodgkin lymphoma and are now considered a disease-defining feature.23
PATHOLOGIC CLASSIFICATION
According to the 2008 World Health Organization (WHO) classification, Hodgkin lymphoma has 2 clearly defined entities: classical Hodgkin lymphoma (cHL), which accounts for approximately 95% cases, and nodular lymphocyte predominant Hodgkin lymphoma (NLPHL), which accounts for the remaining cases.24 These 2 entities differ in their clinical, pathological, and biological features, which in turn affect prognosis and treatment options. Classical Hodgkin lymphoma is characterized by a paucity of HRS cells surrounded by a background of mixed inflammatory infiltrate comprised of histiocytes, small lymphocytes, eosinophils, neutrophils, plasma cells, fibroblasts, and collagen. Depending on the particular combinations of these elements and the specific features of the neoplastic cells, cases can be subclassified into several cHL subtypes: the nodular sclerosis, mixed cellularity, lymphocyte-rich, and lymphocyte-depleted types.25
The diagnosis of cHL is made based on a combination of morphology of HRS cells and the other cells infiltrating the tissue, combined with immunohistochemical staining. Because of the rare nature of the malignant (clonal) cell in Hodgkin lymphoma specimens, flow cytometry is generally of little value. The HRS cells in cHL are CD30-positive and CD45 negative in virtually all cases, and CD15-positive in 85% of cases.26 B-cell antigens are typically negative except for CD20, which is positive in about 20% cases.27
Nodular sclerosis Hodgkin lymphoma (NSHL) is the most common subtype of cHL, accounting for 65% to 75% of cases. It is common among young adults and tends to involve the mediastinal, supraclavicular, and cervical lymph nodes. NSHL is characterized by the presence of collagen bands that divide the lymphoid tissue into circumscribed nodules. This subtype usually presents as stage I or II disease, typically with neck and/or mediastinal disease, and evidence of EBV infection is present in approximately 10% to 40% of North American cases.7 Patients diagnosed with NSHL generally have a very good prognosis.
Mixed cellularity Hodgkin lymphoma (MCHL) constitutes about 20% to 25% of cHL cases. It affects a somewhat older population, with a median age at diagnosis of 38 years. The typical bimodal age distribution is not seen with MCHL. MCHL has a male predominance (70%), and is more frequent in HIV-infected patients (70% of whom also have EBV infection). Lymphoid tissues have classic HRS cells and significant inflammatory infiltrates. Approximately 50% of patients with MCHL present as stage III or IV with abdominal lymphadenopathy or splenic involvement, and B symptoms are frequent.24
Lymphocyte-rich Hodgkin lymphoma (LRHL) is uncommon, accounting for only 3% to 5% of cases of cHL.28 The disease usually presents at an older age and has a 2:1 male predominance. HRS cells are commonly seen and a large number of reactive lymphocytes are also present. Although on the basis of morphology and immunohistochemistry LRHL belongs to the cHL group, clinically it more closely resembles LPHL. Patients usually present at early stage and rarely have B symptoms. LRHL carries an excellent prognosis, with a greater than 90% PFS after 5 years.23,29
Lymphocyte-depleted Hodgkin lymphoma (LDHL) is the least common form of cHL, accounting for less than 5% of cases. Many cases previously placed in this category are now recognized as diffuse large B-cell lymphoma (DLBCL), anaplastic large-cell lymphoma (ALCL), or NSHL with lymphocyte depletion.30 HRS cells are frequently seen, but reactive inflammatory cells are relatively sparse. EBV infection is seen in up to 90% of cases, commonly associated with HIV-infected individuals. Advanced-stage and symptomatic disease are more common. Prognosis is slightly worse compared to other categories.
NLPHL accounts for approximately 5% of cases of Hodgkin lymphoma. It has a unimodal age distribution, with the peak incidence in the fourth decade, and male predilection of 3:1.28 NLPHL is characterized by large primary lymphoid follicles, with polytypic small B lymphocytes and extensive meshworks of follicular dendritic cells. The lymphocytic/histiocytic (L and H), or “popcorn,” cells scattered within the nodules differ from classic HRS cells, both in their morphology and in their biochemical profile, being frequently negative for CD15, CD30 and for the EBV genome, and usually positive for B-cell antigens such as CD20, suggesting that L and H cells may be immunoglobulin-synthesizing monoclonal B cells. CD45 is also typically positive in NLPHL, in distinction from cHL. NLPHL has an indolent course compared to cHL, and long-term survival is common.19,31 NLPHL commonly presents with limited-stage disease. NLPHL may eventually transform into a more aggressive lymphoma, such as diffuse large B-cell lymphoma (including centroblastic, immunoblastic, or T-cell/histiocyte–rich subtypes), at a rate of 4% to 12%. This can occur even 15 to 20 years after the initial diagnosis of NLPHL.32,33 In a recent large retrospective study of 222 patients with NLPHL, the rate of transformation to DLBCL was 7.6%, with a median time to transformation of 35 months. Overall survival was not adversely affected in patients undergoing transformation compared to those without transformation.34
PRESENTATION
Classical Hodgkin lymphoma usually presents with asymptomatic mediastinal or cervical lymphadenopathy. Half of patients present with stage I or stage II disease.35 A mediastinal mass is seen in most patients with NSHL, at times with bulky disease, with “bulky” defined as a mediastinal mass measuring one-third or more of the maximal thoracic diameter on chest x-ray, or 10 cm on computed tomography (CT) scan. Systemic symptoms, or "B" symptoms—fevers (> 38°C), drenching night sweats, and unexplained weight loss (> 10% of baseline body weight over the preceding 6 months or less)—are detected in approximately 25% of patients. Between 10% and 15% will have extranodal disease, most commonly involving lung, bone, and liver. NLPHL usually presents with limited-stage disease without B symptoms; it typically has a more indolent presentation and clinical course than cHL.
INITIAL EVALUATION AND STAGING
The initial workup includes a complete blood count (CBC), erythrocyte sedimentation rate (ESR), lactate dehydrogenase (LDH), and chemistry studies to evaluate renal function and liver function. Fine-needle aspiration will usually fail to identify the infrequent HRS cells, and instead only reveal the reactive background of inflammatory cells. Generous (large gauge) core needle biopsies may provide diagnosis effectively in some cases, but in general, an excisional lymph node biopsy is preferred to ensure an accurate diagnosis and avoid the need for repeated biopsy procedures. In cases where an excisional biopsy would be difficult or risky, a core needle biopsy procedure is a reasonable first step, with the understanding that a subsequent surgical procedure may still be necessary.
Baseline imaging includes CT scans of the neck, chest, abdomen, and pelvis. Use of positron emission tomography (PET) scanning is now standard in the initial evaluation and assessment of treatment response in Hodgkin lymphoma.36 Due to the increased sensitivity of PET or PET/CT scan, additional lesions may be identified that were not seen on conventional CT scans. This will alter the staging, and potentially the treatment plan, in up to 25% to 30% of patients.37,38 PET/CT scan performed during initial evaluation also facilitates optimal interpretation of post-therapy PET/CT scans and is therefore strongly encouraged as a part of the initial staging evaluation.39
Recent studies have shown that bone marrow biopsy is not routinely needed in the initial staging of cHL. A study of 454 patients concluded that bone marrow biopsy would not have altered the stage in any stage I or II patients. It was further concluded that overall treatment strategy would not have been altered for any of the patients.40 Based on this study and others, it is now clear that FDG-PET has a high sensitivity, and when PET scan is negative (in the bone marrow and skeleton), a bone marrow biopsy provides little additional value. For patients with significant cytopenias, a bone marrow biopsy is reasonable. Such patients may benefit from a bilateral biopsy, which increases the probability of demonstrating bone marrow involvement by 16% to 33%.41,42 Techniques such as staging laparotomy and lymphangiography are now considered obsolete.
Hodgkin lymphoma is staged according to the Ann Arbor staging system (Table 1). The original Ann Arbor staging was published in 1971,43 and in 1989 the “Cotswold modifications” extended the definitions of stage IV disease and the suffix “X” was added to denote bulky disease.44 Both systems were developed for the staging of Hodgkin lymphoma, but are now used for staging non-Hodgkin lymphoma as well.
PROGNOSTIC FACTORS
For the purposes of prognosis and selection of treatment, Hodgkin lymphoma is commonly classified into early-stage favorable, early-stage unfavorable, and advanced stage. Early-stage Hodgkin lymphoma refers to patients with Ann Arbor stage I or stage II disease. With early-stage Hodgkin lymphoma, the prognosis varies significantly based on factors such as the presence of B symptoms, elevated erythrocyte sedimentation rate ([ESR] > 50 mm/hr), number of nodal sites involved, older age, and a large mediastinal mass. For this reason, most clinical trials to evaluate treatment strategies for early-stage Hodgkin lymphoma are based on various combinations of these risk factors. The definition of early-stage unfavorable Hodgkin lymphoma varies across different clinical trial study groups, and it is important to understand the definition in interpreting the results of these trials (Table 2).45,46
In the German Hodgkin Study Group (GHSG) trials, early-stage Hodgkin lymphoma is stratified into a high risk (“unfavorable”) group defined by any of the following: a large mediastinal mass (one third of maximum thoracic diameter), extra-nodal disease, 3 or more nodal areas, and an ESR of > 50 mm/hr in asymptomatic patients or > 30 mm/hr in patients with B symptoms. Low-risk (“favorable”) patients lack all of these factors.47 The European Organization for Research and Treatment of Cancer (EORTC) defines the unfavorable prognostic group as older than 50 years of age, large mediastinal adenopathy (maximum width on a chest radiograph of at least one third of the internal transverse diameter of the thorax at the level of T5 through T6 or any mass of ≥ 10 cm in the largest dimension), an ESR of 50 mm/hr and no B symptoms, or with an ESR of 30 mm/hr in those who have B symptoms, and/or 4 or more regions of involvement.48 The National Cancer Institute of Canada (NCIC) Clinical Trials Group and the Eastern Cooperative Oncology Group (ECOG) define high-risk groups as presence of B symptoms, bulky disease with a mediastinal mass width of at least one third of the maximum chest wall diameter, or any mass greater than 10 cm, and patients with intra-abdominal disease.49,50
Gene-expression profiling in Hodgkin lymphoma has identified a gene signature of tumor-associated macrophages that was able to identify patients with a higher risk for primary treatment failure. In an independent cohort of patients, an increased number of CD68-positive macrophages was correlated with inferior outcomes.51,52 Studies such as these underscore the importance of the tumor “microenvironment” (ie, the nonmalignant cells within a tumor) in determining the overall clinical behavior of a malignancy. While quantification of CD68-positive macrophages has potential to be applied to routine clinical practice, prospective data using CD68 as a tool for risk-adapted therapy is lacking.
Genetic alterations and amplifications in the 9p24.1 locus have recently been found to be a defining genetic feature of cHL. Amplification of 9p24.1 has been associated with unfavorable outcomes. Amplification of 9p24.1 (which includes the loci encoding the PD-L1 and PD-L2 genes) is more common in patients with advanced stage disease and is associated with shorter PFS.23
A recent study attempted to integrate several different prognostic factors in cHL patients who were treated with ABVD (adriamycin [doxorubicin], bleomycin, vinblastine, and dacarbazine) and underwent an interim PET (iPET) scan after 2 cycles of ABVD. Focusing on those with a negative iPET scan, it was found that expression of CD68 and PD-1 in microenvironment cells, and STAT1 negativity in HRS cells identified a subset of PET-2 negative patients with a 3-year PFS significantly lower than that of the remaining PET-2 negative population (64% versus 95%). The algorithm correctly predicted the response to treatment in more than half of the patients who had relapse or disease progression despite a negative PET-2 scan. It therefore appears feasible, using tissue biomarkers at diagnosis, to identify patients at increased risk for poor outcome, even if the iPET scan is negative.53
ROLE OF PET/CT IN ASSESSMENT OF RESPONSE TO THERAPY
PET/CT has been increasingly used for response assessment at various stages in lymphoma in recent years. Almost all types of lymphomas are fluorodeoxyglucose (FDG) avid; however, Hodgkin lymphoma is FDG avid in 97% to 100% of cases. In 2009, a 5-point scale was developed to score PET images with regard to treatment response, either partway through treatment (iPET) or at the end of therapy.54 It was recommended as the standard reporting tool at the First International Workshop on PET in Lymphoma in Deauville, France, in 2009, and is thus now referred to as the Deauville score. A score of 1 is given if there is no uptake, 2 if the uptake ≤ mediastinum, 3 if > mediastinum but ≤ liver, 4 if uptake moderately higher than liver, 5 if uptake is markedly higher than liver and/or new lesions. X designates new areas of uptake unlikely to be related to lymphoma. In most trials, a score of 1 or 2 is considered a complete response and a score of 4 or 5 is considered a treatment failure. A score of 3 is sometimes considered a complete response, depending on the study. The Deauville criteria have been widely used in newer clinical trials utilizing response-adapted treatment as defined by PET response. PET/CT is recommended for staging and restaging at the end of therapy, in clinical practice, and clinical trials. Interim PET/CT scan, while commonly performed in clinical practice, is only recommended if the results will alter therapy (eg, if that information will result in the clinician omitting radiation therapy [RT] or altering the chemotherapy plan).
Early studies of iPET showed that achieving PET negativity early in the course of treatment was strongly associated with PFS and overall survival.55 Subsequent studies confirmed the importance of achieving a negative iPET. As a result, considerable efforts have been put into designing response-adapted treatment approaches using iPET (see Treatment section), with some of these approaches now being listed in the National Comprehensive Cancer Network (NCCN) guidelines and being used in standard practice.
TREATMENT
EVOLUTION OF TREATMENT
The treatment of Hodgkin lymphoma has evolved over the past century, starting with the discovery of RT as effective treatment in the early 20th century. Long-term survival of patients with Hodgkin lymphoma treated with involved-field radiation therapy (IFRT) was first reported in the 1960s.56,57 Outcomes improved further with the introduction of combined modality treatment (CMT) using chemotherapy and RT, with the overall 5-year relative survival for patients with Hodgkin lymphoma (all stages) treated in 2006–2012 being 85.4% to 87.3%.3 Since the majority of patients are now cured with modern therapy, treatment-related complications have become an important competing cause of mortality. Recent studies have therefore focused on maintaining efficacy while reducing toxicities, and refining the process of selecting patients who might benefit from more aggressive therapy. While RT was the first treatment modality shown to be curative for Hodgkin lymphoma,56,57 multiple subsequent studies showed that CMT is superior to RT alone in terms of relapse-free survival.58–63 In the GHSG H8-F trial, the estimated 5-year event-free survival and overall survival rates were significantly higher after 3 cycles of MOPP-ABV (mechlorethamine, vincristine, procarbazine, and prednisone combined with doxorubicin, bleomycin, and vinblastine) plus IFRT than after subtotal nodal radiotherapy alone. The 10-year overall survival estimates were 97% and 92%, respectively (P = 0.001).64 As a result, CMT replaced RT alone as the standard of care for limited-stage Hodgkin lymphoma. However, for elderly or infirm patients, or those with other comorbidities making them poor chemotherapy candidates, RT alone may be a very reasonable option.65 More recently, an increasing body of evidence has accumulated to support the use of chemotherapy alone in early stage cHL. This literature has consistently shown that omission of RT is associated with a modest increase in relapse, without a clear compromise in long-term overall survival. For some patients, the trade-off in terms of avoiding radiation (and the associated late effects) may be worth the small increase in relapse risk, since long-term survival does not appear to be substantially worse with chemo-therapy alone. Table 3 and Table 4 provide a summary of recent key studies which have defined treatment options for early-stage cHL.48,66–71
EARLY-STAGE NLPHL
NLPHL usually presents with limited-stage disease without B symptoms and has an indolent course with a slightly better prognosis compared to cHL.72 Due to the rarity of the disease, treatment guidelines are mostly based on retrospective analyses from single or multi-institution studies or subgroup analyses, often with relatively short follow-up. These studies must be interpreted with caution because of the possibility of inaccuracies in the pathologic diagnosis, small sample sizes, and selection bias. Treatment options for limited-stage NLPHL include observation, single-agent rituximab, IFRT (or involved-site radiation therapy [ISRT]) alone, or CMT.46
Historically, patients with limited-stage NLPHL have been treated with RT alone, with 80% to 85% PFS and 85% to 95% overall survival rates.73–75 Patients who relapse or progress after RT in general can successfully undergo salvage therapy.74 In one study, rates of PFS and overall survival were similar among patients who had limited-field, regional-field, or extended-field RT,75 indicating that IFRT is preferred. Studies comparing RT alone and CMT are limited. The GHSG HD7 trial included a subset of NLPHL patients, with a trend towards improved freedom from treatment failure (96% versus 83%) favoring CMT. This, however, did not translate into improved overall survival.47 A retrospective analysis of the British Columbia Cancer Agency database compared patients with limited-stage NLPHL treated with RT alone to patients who received 2 cycles of ABVD followed by RT. A significant improvement in PFS (91% versus 65%) and overall survival (93% versus 84%) was seen, favoring CMT.76
Chemotherapy alone is not recommended for limited-stage NLPHL since studies evaluating chemotherapy alone are quite limited and indicate relatively high rates of treatment failure. Given that the malignant cells in NLPHL are CD20-positive, single-agent rituximab has also been studied in this disease, including a study as frontline therapy in limited-stage patients. In this phase 2 trial in newly diagnosed patients with stage IA disease, an overall response rate (ORR) of 100% was seen, with an 85% complete response (CR) rate.77 At 3 years, overall survival was 100% and PFS was 81%, indicating that the responses with single-agent rituximab are less durable than those with RT.
Advani et al evaluated rituximab followed by observation versus rituximab (R) followed by maintenance rituximab (MR) for 2 years in 39 new or previously treated patients. At 4 weeks the ORR was 100% (with CR in 67%, and partial response in 33%). At a median follow up of 9.8 years for R alone, and 5 years for R+MR, median PFS was 3 and 5.6 years, respectively (P = 0.26). Estimated 5-yr PFS and overall survival in patients treated with R versus R+MR were 39.1% and 95.7% versus 58.9% and 85.7%, with Pvalues of 0.26 (PFS) and 0.38 (overall), respectively. Maintenance rituximab therefore appears to prolong remission, although the results did not quite reach statistical significance.78 Even though rituximab does not appear to be curative in NLPHL, it is a reasonable option for patients with early-stage NLPHL who are not good candidates for definitive RT. Whether combining rituximab with RT or CMT might further improve outcomes in early-stage NLPHL has not yet been determined.
In children, surgery alone may lead to long-term remission or possibly cure of limited-stage NLPHL. In a European multicenter retrospective study, 58 patients underwent surgery for limited-stage NLPHL. Among the 51 patients who achieved complete remission following surgery, 67% remained progression-free and 100% were alive at a median follow up of 43 months.79 In adults, there is no data to support surgical treatment alone for NLPHL. Finally, observation may be a reasonable option in elderly or infirm patients for whom NLPHL is unlikely to affect life expectancy. For younger patients, given the excellent outcome with modern therapy and the long-term risk of transformation of NLPHL into an aggressive non-Hodgkin lymphoma, observation is generally not recommended.
The NCCN recommends RT (ISRT or IFRT, 30–36 Gy) as the preferred treatment for stage IA and IIA non-bulky NLPHL. In patients with stage IA disease with complete excision of solitary nodule, observation may be appropriate. A course of chemotherapy with ISRT with or without rituximab is recommended for patients with stage IB or IIB disease, or patients with stage IA or IIA bulky disease.
FIRST-LINE TREATMENT OF LIMITED-STAGE CHL
Early-Stage Favorable cHL
There is lack of consensus regarding the ideal treatment approach for patients with early-stage favorable cHL. However, there are several excellent options available, with overall survival rates exceeding 90%. Most of these regimens involve CMT, although some chemotherapy-alone approaches have been evaluated as well. Concurrent with the demonstration of excellent long-term remission rates with CMT, it became apparent that the long-term survival and quality of life of these patients is determined in large part by the risk of serious (and potentially fatal) treatment-related toxicities. Such toxicities consist primarily of secondary malignancies and cardiovascular events, and can continue to cause significant morbidity and mortality even 2 to 3 decades after treatment.80–82 As a result, treatment decisions for these patients are complicated and require balancing efficacy against risk of late complications.
In the United States, until recently, CMT was generally considered the standard of care, with robust long-term data regarding efficacy. The most commonly used regimen has been ABVD for 2 to 4 cycles followed by IFRT. In some German studies, escalated BEACOPP (bleomycin, etoposide, doxorubicin, cyclophosphamide, vincristine, procarbazine, prednisone) has been used, but this is not a general standard of care in the United States for early-stage patients.
More recent data suggests that the rate of serious late complications in Hodgkin lymphoma patients is decreasing, likely due to less extensive radiation fields, lower radiation doses, and a movement away from the MOPP regimen to ABVD.83,84 For patients who meet the “favorable” criteria set forth in the GHSG HD10 trial (see Table 2), 2 cycles of ABVD followed by 20 Gy of IFRT is an attractive option, with efficacy preserved and a low anticipated rate of late effects.66 With this approach, and with long-term (10 years) follow up, all 4 arms had similar PFS (87%) and overall survival (94%), whether 2 or 4 cycles of ABVD were given. When the effects of 20-Gy and 30-Gy doses of RT were compared, there were also no significant differences in freedom from treatment failure or overall survival. Adverse events and acute toxic effects of treatment were most common in the patients who received 4 cycles of ABVD and 30 Gy of RT.66,71
In recent years, in an attempt to reduce late effects further, regimens consisting of chemotherapy alone have been investigated. In a study by Meyer et al, at 12 years the rate of overall survival was 94% among those receiving ABVD alone, as compared with 87% among those receiving subtotal nodal RT; the rates of freedom from disease progression were 87% and 92% in the 2 groups; and the rates of event-free survival were 85% and 80%, respectively.50 However, it is important to note that this study did not include a CMT arm for the early favorable patients, and did not utilize modern RT techniques. Nevertheless, this early study and others60 suggested that chemotherapy alone may be a reasonable option for some early-stage cHL patients, particularly for patients who are felt to be at increased risk for late toxicities from RT. As a result, additional studies have been conducted evaluating CMT versus chemotherapy alone for early-stage cHL. Many of these studies have incorporated interim PET/CT scan to develop a response-adapted approach to decide which patients are least likely to benefit from RT.
The HD-13 study was a follow-up study for HD-10, looking at deletion of bleomycin, dacarbazine, or both from the ABVD backbone. The ABD arm was closed early, because of an excess rate of treatment failure. Among the 1243 patents assigned to either the ABVD or AVD arm at 5 years of follow-up, there was 4.3% difference in PFS. This study was not able to demonstrate that 2 cycles of AVD was noninferior to 2 cycles of ABVD, each followed by 30 Gy IFRT, even though there was no difference in all 4 groups. It confirmed 2 cycles of ABVD as the preferred regimen in early favorable Hodgkin lymphoma, when CMT is the plan of care. However, for patients over age 60 to 65 years, or those with underlying cardiac or pulmonary comorbidities, bleomycin has significant risk of toxicity. In that setting, AVD is a safer option, with only a very modest decrease in 5-year PFS.
Based on the observation that iPET scan is highly predictive of outcome in Hodgkin lymphoma,55,85 several trials have employed the use of an iPET scan to guide therapy. It is hoped that such studies will lead to new PET-directed treatment algorithms in which patients who require more aggressive therapy (eg, with CMT, or escalated BEACOPP) can be identified, and the remaining patients can be safely treated less aggressively (eg, with chemotherapy alone).
In the EORTC H10 trial, performed to evaluate treatment adaptation on the basis of iPET scan results in stage I and II Hodgkin lymphoma, a control arm received standard combined modality treatment (3 or 4 cycles of ABVD with INRT) irrespective of PET scan results. In the experimental arm, patients with a negative PET scan after 2 cycles of ABVD continued with 1 or 2 cycles of ABVD and did not receive RT. The iPET-positive patients received either standard treatment with ABVD plus INRT or escalated BEACOPP plus INRT. The iPET-negative patients received either ABVD only or ABVD plus INRT. The final results of this study, published recently, showed that in the iPET-positive patients the 5-year PFS was improved from 77.4% with standard ABVD plus INRT to 90.6% with escalated BEACOPP plus INRT (P = 0.002). In iPET-negative patients, 5-year PFS in the favorable group was 99% versus 87.1% in favor of ABVD plus INRT. The H10 study suggested that PET results after 2 cycles of ABVD can be integrated into treatment planning, In iPET-negative patients, the study was technically not able to demonstrate the noninferiority of the ABVD only regimen, owing to a higher risk of relapse if INRT is omitted, particularly in the favorable group.48 However, this study does show that excellent outcomes can be obtained with omission of RT in patients with a negative iPET scan. This study provides a cautionary lesson though, in that the increase in relapse rate associated with omission of RT was more substantial (12%) for favorable versus unfavorable early-stage patients (2.5%), and this difference was only apparent after longer (5 years) follow-up. Despite this, chemotherapy alone is considered a reasonable treatment option, especially for patients felt to be at increased risk for late toxicities of RT or for patients who wish to avoid the risks of RT, with over 99% of patients alive at 5 years.
Similar results were shown in the RAPID trial, in which patients with limited-stage cHL underwent 3 cycles of ABVD followed by PET assessment.67 Patients with a negative PET (n = 426) were then randomized to RT (n = 209) versus no further therapy (n = 211). At a median of 60 months of follow-up, 3-year PFS was 94.6% in the RT group and 90.8% in the chemotherapy alone group. Similar to the H10 trial, it was concluded that chemotherapy alone was statistically inferior to CMT in terms of PFS. However, also similar to the H10 trial, the RAPID trial demonstrated that excellent results can be obtained in early-stage cHL patients with omission of RT, if iPET scan is negative after 3 cycles of ABVD, as there was no survival difference. These findings indicate that, when relapses occur as a result of omission of RT, such patients can be effectively treated later.
In the ongoing GHSG HD16 trial, patients with early-stage favorable cHL will be randomly assigned to a standard approach (ABVD × 2 cycles followed by 20-Gy IFRT) versus an experimental approach in which they receive ABVD for 2 cycles and then undergo PET scan. If the PET remains positive, they will receive 20-Gy IFRT. If the PET is negative, they will receive no further therapy. This trial could ultimately define ABVD for 2 cycles as a treatment option.
It is clear from these studies that omission of RT results in a somewhat higher rate of relapse but can be considered in selected patients. However, taking a less aggressive frontline approach may also be justified by the fact that, for those who do relapse, successful salvage therapies are available. Aggressive salvage therapy with autologous stem cell transplantation historically can cure approximately 50% of relapsed patients. With new and emerging therapies for relapsed disease, such as brentuximab vedotin and the PD-1 inhibitors (eg, nivolumab and pembrolizumab), the ability to cure relapsed patients may improve even more, further calling into question the practice of applying CMT uniformly for early-stage patients undergoing first-line therapy. Unfortunately, there is insufficient data from large randomized studies with long-term follow-up to fully address this issue currently, and there remains some controversy around this issue. NCCN recommends restaging PET/CT after 3 cycles of ABVD if a chemotherapy alone treatment modality is chosen. If the Deauville score is 1 or 2, either observation or 1 additional cycle of ABVD is recommended.46
Early-Stage Unfavorable cHL
In the United States, historically early-stage unfavorable Hodgkin lymphoma has been treated with CMT, most commonly 4 to 6 cycles of ABVD followed by consolidative RT. With this approach one can expect a 5-year PFS of approximately 80% to 85%.58,64,86 The GHSG HD8 trial showed that RT volume size reduction from extended-field to involved-field after COPP + ABVD chemotherapy for 2 cycles produced similar results and less toxicity in patients with early-stage unfavorable cHL.86 The GHSG trial HD11 established ABVD for 4 cycles plus 30-Gy IFRT as a standard for early unfavorable Hodgkin lymphoma. The freedom from treatment failure at 5 years was 85.0%, and overall survival was 94.5%.68
In the HD14 study by the GHSG, patients with early unfavorable cHL were treated with 2 cycles of escalated BEACOPP followed by 2 cycles of ABVD, versus 4 cycles of ABVD. All patients then received 30 Gy of consolidative IFRT. A 5-year PFS of 95% was seen in the experimental arm, compared with 89% in the standard (ABVD) arm. As expected, this regimen was associated with more acute hematologic toxicity, and there was no difference between the 2 regimens with respect to overall survival or fertility.69 Given the lack of improved survival and increased toxicity, ABVD has remained the standard chemotherapy regimen for early unfavorable cHL in the United States. NCCN recommends a restaging PET scan after 2 cycles of ABVD and to continue with 2 to 4 cycles of ABVD or escalated BEACOPP with or without ISRT based on Deauville scores.
Another viable treatment option is the Stanford V regimen, a condensed, 12-week regimen that includes mechlorethamine, doxorubicin, vinblastine, prednisone, vincristine, etoposide, and bleomycin, followed by IFRT.87 In a randomized phase 3 trial conducted by ECOG (E2496), patients with stage I/II Hodgkin lymphoma with bulky mediastinal disease or advanced-stage disease were randomized to ABVD × 6 to 8 cycles versus Stanford V. RT was given (36 Gy) for those with bulky mediastinal disease or to sites of disease greater than 5 cm in the Stanford V arm. In a subset analysis focusing only on those with stage I/II bulky mediastinal disease, the 5-year failure free survival was 85% versus 79% and the 5-year overall survival was 96% versus 92% for the ABVD versus Stanford V arms, respectively. These differences were not statistically significant.70 While the Stanford V regimen has the advantages of a 12-week treatment duration and a lower cumulative amount of bleomycin and doxorubicin, the Stanford V arm had higher rates of grade 3 lymphopenia and grade 3 to 4 peripheral neuropathies. In addition, Stanford V requires that most patients undergo RT (to original sites of disease measuring 5 cm or more plus contiguous areas). As a result, the investigators concluded that ABVD × 4 cycles plus IFRT remains the standard of care for patients with early unfavorable Hodgkin lymphoma with bulky mediastinal disease.
Other regimens have been studied in hopes of reducing toxicity, including the EVE regimen (epirubicin, vinblastine, and etoposide). This regimen was compared to ABVD in early unfavorable Hodgkin lymphoma patients, with all patients undergoing the same RT program. No differences were observed between the ABVD and EVE arms in terms of complete remission rate and overall survival. However, patients who received EVE had a significantly worse outcome than those who received ABVD in terms of relapse-free survival and failure-free survival.88 EBVP (epirubicin, bleomycin, vinblastine, and prednisone) followed by IFRT was less efficacious compared with MOPP/ABV–type therapy.58
An area of active investigation is whether RT can be safely omitted in patients with early- stage unfavorable cHL. The EORTC H10 study showed that, for patients with a negative iPET scan (after 2 cycles), the 5-year PFS rates were 92.1% versus 89.6% for ABVD plus INRT versus ABVD alone, respectively. While this technically did not meet criteria for noninferiority of ABVD alone, this study demonstrated that, for those with negative iPET, ABVD × 6 cycles (without radiation) can result in long-term remission in a high proportion (89%) of patients. For iPET-positive patients, 2 cycles of escalated BEACOPP were given followed by 30 Gy of IFRT on the experimental arm. This resulted in a 5-year PFS of 90.6% versus 77.4%, suggesting this may be a preferred approach for early-stage unfavorable patients with a positive iPET.48 Even though the noninferiority of ABVD alone could not be established based on the statistical design of the study, the current NCCN guidelines recommend restaging after 2 cycles of ABVD for stage I or II unfavorable cHL and using that iPET as a guide, based on Deauville scores. For scores 1–3, ABVD × 2 cycles (total 4 cycles) plus ISRT or AVD × 4 (total 6) with or without ISRT is recommended. For a Deauville score of 4, escalated BEACOPP × 2 cycles or ABVD × 2 cycles (total 4) followed by ISRT is recommended. If the Deauville score is 5, further treatment decisions should be made based on repeat biopsy results. A follow up PET/CT is recommended for Deauville scores of 4 and 5 to confirm complete response.46
LATE EFFECTS AND THE EVOLUTION OF RADIATION THERAPY
The RT given in Hodgkin lymphoma has evolved considerably over the years, from extended field or subtotal nodal fields developed in the 1960s, to the more focused involved-field or even involved-site radiation commonly given now. This approach reduces radiation volumes, and it already is becoming evident that the relative risk of breast cancer among young females receiving mediastinal RT for Hodgkin lymphoma is declining.89 Cardiac dose is reduced significantly with IFRT compared to older radiation techniques as well. The extent of radiation may be reduced even further with involved-nodal/involved site or intensity-modulated approaches.90
With new RT techniques allowing for more focused therapy and lower doses of radiation, models predict that the rate of long-term complications will decline further.91,92 Furthermore, response-adapted (ie, PET-directed) approaches, as discussed in detail earlier in the article, are expected to increasingly allow for identification of patients who can safely avoid radiation entirely, which will hopefully lead to an even lower rate of late complications of therapy.
MONITORING FOR RELAPSE
A number of recent studies have shown that, for patients who achieve complete remission with first-line therapy, performing repeated scheduled surveillance imaging does not improve outcomes. In fact, most relapses are detected by the patient (due to symptoms or recurrence of lymph node enlargement). It is rare that a relapse would be detected by surveillance imaging alone. Furthermore, surveillance that includes routine imaging has not been associated with improved survival.93 As a result, it is now recommended that patients undergo regular follow-up with symptom review, physical exam, and basic laboratory studies. Imaging studies should be obtained as needed for patients who develop signs, symptoms, exam findings, or laboratory values concerning for relapse.
More important than scheduled surveillance imaging for relapse is monitoring for late effects of therapy. These fall into several broad categories such as cardiovascular disease (coronary disease, congestive heart failure, valvular disease, carotid artery disease), pulmonary disease, hypothyroidism, and secondary malignancies. Aggressive surveillance for breast cancer is especially warranted in female patients who underwent chest radiation.46
CONCLUSION
Hodgkin lymphoma is characterized pathologically by the presence of HRS cells accompanied by a polymorphous cellular infiltrate. It is a disease with a bimodal age distribution, several pathologic subtypes, and numerous treatment options. Overall, the prognosis for patients with early-stage disease is excellent, and although a majority of patients can now be cured, further studies are needed to optimize treatment such that short- and long-term treatment-related toxicities are minimized, without compromising disease control and cure.
- Küppers R, Rajewsky K, Zhao M, et al. Hodgkin disease: Hodgkin and Reed-Sternberg cells picked from histological sections show clonal immunoglobulin gene rearrangements and appear to be derived from B cells at various stages of development. Proc Natl Acad Sci U S A 1994;91:10962–6.
- Küppers R. The biology of Hodgkin›s lymphoma. Nat Rev Cancer 2009;9:15–27.
- National Cancer Institute. SEER cancer statistics review, 1975–2014. 2017. http://seer.cancer.gov/csr/1975_2013/. Accessed April 27, 2017.
- Haim N, Cohen Y, Robinson E. Malignant lymphoma in first-degree blood relatives. Cancer 1982;49:2197–200.
- Mack TM, Cozen W, Shibata DK, et al. Concordance for Hodgkin’s disease in identical twins suggesting genetic susceptibility to the young-adult form of the disease. N Engl J Med 1995;332:413–8.
- Sant M, Allemani C, Tereanu C, et al. Incidence of hematologic malignancies in Europe by morphologic subtype: results of the HAEMACARE project. Blood 2010;116:3724–34.
- Hjalgrim H, Askling J, Rostgaard K, et al. Characteristics of Hodgkin’s lymphoma after infectious mononucleosis. N Engl J Med 2003;349:1324–32.
- Hessol NA, Katz MH, Liu JY, et al. Increased incidence of Hodgkin disease in homosexual men with HIV infection. Ann Intern Med 1992;117:309–11.
- Shiels MS, Pfeiffer RM, Gail MH, et al. Cancer burden in the HIV-infected population in the United States. J Natl Cancer Inst 2011;103:753–62.
- Powles T, Robinson D, Stebbing J, et al. Highly active antiretroviral therapy and the incidence of non-AIDS-defining cancers in people with HIV infection. J Clin Oncol 2009;27:884–90.
- Bedimo RJ, McGinnis KA, Dunlap M, et al. Incidence of non-AIDS-defining malignancies in HIV-infected versus noninfected patients in the HAART era: impact of immunosuppression. J Acquir Immune Defic Syndr 2009;52:203–8.
- Biggar RJ, Jaffe ES, Goedert JJ, et al. Hodgkin lymphoma and immunodeficiency in persons with HIV/AIDS. Blood 2006;108:3786–91.
- Thompson LD, Fisher SI, Chu WS, et al. HIV-associated Hodgkin lymphoma: a clinicopathologic and immunophenotypic study of 45 cases. Am J Clin Pathol 2004;121:727–38.
- Briggs NC, Hall HI, Brann EA, et al. Cigarette smoking and risk of Hodgkin’s disease: a population-based case-control study. Am J Epidemiol 2002;156:1011–20.
- Castillo JJ, Dalia S, Shum H. Meta-analysis of the association between cigarette smoking and incidence of Hodgkin’s Lymphoma. J Clin Oncol 2011;29:3900–6.
- Kanzler H, Kuppers R, Hansmann ML, Rajewsky K. Hodgkin and Reed-Sternberg cells in Hodgkin’s disease represent the outgrowth of a dominant tumor clone derived from (crippled) germinal center B cells. J Exp Med 1996;184:1495–505.
- Stein H, Hummel M. Cellular origin and clonality of classic Hodgkin’s lymphoma: immunophenotypic and molecular studies. Semin Hematol 1999;36:233-41.
- Marafioti T, Hummel M, Foss HD, et al. Hodgkin and reed-sternberg cells represent an expansion of a single clone originating from a germinal center B-cell with functional immunoglobulin gene rearrangements but defective immunoglobulin transcription. Blood 2000;95:1443–50.
- Marafioti T, Hummel M, Anagnostopoulos I, et al. Origin of nodular lymphocyte-predominant Hodgkin’s disease from a clonal expansion of highly mutated germinal-center B cells. N Engl J Med 1997;337:453–8.
- van den Berg A, Visser L, Poppema S. High expression of the CC chemokine TARC in Reed-Sternberg cells. A possible explanation for the characteristic T-cell infiltratein Hodgkin’s lymphoma. Am J Pathol 1999;154:1685–91.
- Bargou RC, Emmerich F, Krappmann D, et al. Constitutive nuclear factor-kappaB-RelA activation is required for proliferation and survival of Hodgkin’s disease tumor cells. J Clin Invest 1997;100:2961–9.
- Luftig M, Yasui T, Soni V, et al. Epstein-Barr virus latent infection membrane protein 1 TRAF-binding site induces NIK/IKK alpha-dependent noncanonical NF-kappaB activation. Proc Natl Acad Sci U S A 2004;101:141–6.
- Roemer MGM, Advani RH, Ligon AH, et al. PD-L1 and PD-L2 genetic alterations define classical Hodgkin lymphoma and predict outcome. J Clin Oncol 2016;34:2690–7.
- Swerdlow SH CE, Harris NL, et al. WHO classification of tumours of haematopoietic and lymphoid tissues. Lyon, France: IARC Press; 2008.
- Campo E, Swerdlow SH, Harris NL, et al. The 2008 WHO classification of lymphoid neoplasms and beyond: evolving concepts and practical applications. Blood 2011;117:5019–32.
- von Wasielewski R, Mengel M, Fischer R, et al. Classical Hodgkin’s disease. Clinical impact of the immunophenotype. Am J Pathol 1997;151:1123–30.
- Tzankov A, Krugmann J, Fend F, et al. Prognostic significance of CD20 expression in classical Hodgkin lymphoma: a clinicopathological study of 119 cases. Clin Cancer Res 2003;9:1381–6.
- Diehl V, Sextro M, Franklin J, et al. Clinical presentation, course, and prognostic factors in lymphocyte-predominant Hodgkin’s disease and lymphocyte-rich classical Hodgkin’s disease: report from the European Task Force on Lymphoma Project on Lymphocyte-Predominant Hodgkin’s Disease. J Clin Oncol 1999;17:776–83.
- Shimabukuro-Vornhagen A, Haverkamp H, Engert A, et al. Lymphocyte-rich classical Hodgkin’s lymphoma: clinical presentation and treatment outcome in 100 patients treated within German Hodgkin’s Study Group trials. J Clin Oncol 2005;23:5739–45.
- Slack GW, Ferry JA, Hasserjian RP, et al. Lymphocyte depleted Hodgkin lymphoma: an evaluation with immunophenotyping and genetic analysis. Leuk Lymphoma 2009;50:937–43.
- Mason DY, Banks PM, Chan J, et al. Nodular lymphocyte predominance Hodgkin’s disease. A distinct clinicopathological entity. Am J Surg Pathol 1994;18:526–30.
- Rudiger T, Gascoyne RD, Jaffe ES, et al. Workshop on the relationship between nodular lymphocyte predominant Hodgkin’s lymphoma and T cell/histiocyte-rich B cell lymphoma. Ann Oncol 2002;13 Suppl 1:44–51.
- Sundeen JT, Cossman J, Jaffe ES. Lymphocyte predominant Hodgkin’s disease nodular subtype with coexistent “large cell lymphoma”. Histological progression or composite malignancy? Am J Surg Pathol 1988;12:599–606.
- Kenderian SS, Habermann TM, Macon WR, et al. Large B-cell transformation in nodular lymphocyte-predominant Hodgkin lymphoma: 40-year experience from a single institution. Blood. 2016;127:1960–6.
- Mauch PM, Kalish LA, Kadin M, et al. Patterns of presentation of Hodgkin disease. Implications for etiology and pathogenesis. Cancer 1993;71:2062–71.
- Juweid ME, Cheson BD. Positron-emission tomography and assessment of cancer therapy. N J Engl Med 2006;354:496–507.
- Hutchings M, Loft A, Hansen M, et al. Position emission tomography with or without computed tomography in the primary staging of Hodgkin’s lymphoma. Haematologica 2006;91:482–9.
- Naumann R, Beuthien-Baumann B, Reiss A, et al. Substantial impact of FDG PET imaging on the therapy decision in patients with early-stage Hodgkin’s lymphoma. Br J Cancer 2004;90:620–5.
- Juweid ME, Stroobants S, Hoekstra OS, et al. Use of positron emission tomography for response assessment of lymphoma: consensus of the Imaging Subcommittee of International Harmonization Project in Lymphoma. J Clin Oncol 2007;25:571–8.
- El-Galaly TC, d’Amore F, Mylam KJ, et al. Routine bone marrow biopsy has little or no therapeutic consequence for positron emission tomography/computed tomography-staged treatment-naive patients with Hodgkin lymphoma. J Clin Oncol 2012;30:4508–14.
- Wang J, Weiss LM, Chang KL, et al. Diagnostic utility of bilateral bone marrow examination: significance of morphologic and ancillary technique study in malignancy. Cancer 2002;94:1522–31.
- Menon NC, Buchanan JG. Bilateral trephine bone marrow biopsies in Hodgkin’s and non-Hodgkin’s lymphoma. Pathology 1979;11:53–7.
- Carbone PP, Kaplan HS, Musshoff K, et al. Report of the Committee on Hodgkin’s Disease Staging Classification. Cancer Res 1971;31:1860–1.
- Lister TA, Crowther D, Sutcliffe SB, et al. Report of a committee convened to discuss the evaluation and staging of patients with Hodgkin’s disease: Cotswolds meeting. J Clin Oncol 1989;7:1630–6.
- Armitage JO. Early-stage Hodgkin’s lymphoma. N Engl J Med 2010;363:653–62.
- National Comprehensive Cancer Network I. NCCN Guidelines Version 3.2016 Hodgkin lymphoma. 2017.
- Engert A, Franklin J, Eich HT, et al. Two cycles of doxorubicin, bleomycin, vinblastine, and dacarbazine plus extended-field radiotherapy is superior to radiotherapy alone in early favorable Hodgkin's lymphoma: final results of the GHSG HD7 trial. J Clin Oncol 2007;25:3495–502.
- Andre MP, Girinsky T, Federico M, et al. Early positron emission tomography response-adapted treatment in stage I and II Hodgkin lymphoma: final results of the randomized EORTC/LYSA/FIL H10 trial. J Clin Oncol 2017:Jco2016686394.
- Meyer RM, Gospodarowicz MK, Connors JM, et al. Randomized comparison of ABVD chemotherapy with a strategy that includes radiation therapy in patients with limited-stage Hodgkin’s lymphoma: National Cancer Institute of Canada Clinical Trials Group and the Eastern Cooperative Oncology Group. J Clin Oncol 2005;23:4634–42.
- Meyer RM, Gospodarowicz MK, Connors JM, Pearcey RG, Wells WA, Winter JN, et al. ABVD alone versus radiation-based therapy in limited-stage Hodgkin’s lymphoma. N Engl J Med 2012;366:399–408.
- Steidl C, Lee T, Shah SP, et al. Tumor-associated macrophages and survival in classic Hodgkin’s lymphoma. N Engl J Med 2010;362:875–85.
- Kamper P, Bendix K, Hamilton-Dutoit S, et al. Tumor-infiltrating macrophages correlate with adverse prognosis and Epstein-Barr virus status in classical Hodgkin’s lymphoma. Haematologica 2011;96:269–76.
- Agostinelli C, Gallamini A, Stracqualursi L, et al. The combined role of biomarkers and interim PET scan in prediction of treatment outcome in classical Hodgkin’s lymphoma: a retrospective, European, multicentre cohort study. Lancet Haematol 2016;3:e467–e79.
- Meignan M, Gallamini A, Meignan M, et al. Report on the First International Workshop on Interim-PET-Scan in Lymphoma. Leuk Lymph 2009;50:1257–60.
- Gallamini A, Hutchings M, Rigacci L, et al. Early interim 2-[18F]fluoro-2-deoxy-D-glucose positron emission tomography is prognostically superior to international prognostic score in advanced-stage Hodgkin’s lymphoma: a report from a joint Italian-Danish study. J Clin Oncol 2007;25:3746–52.
- Easson EC, Russell MH. Cure of Hodgkin’s Disease. Br Med J 1963;1(5347):1704–7.
- Kaplan HS. The radical radiotherapy of regionally localized Hodgkin’s disease. Radiology 1962;78:553–61.
- Noordijk EM, Carde P, Dupouy N, et al. Combined-modality therapy for clinical stage I or II Hodgkin’s lymphoma: long-term results of the European Organisation for Research and Treatment of Cancer H7 randomized controlled trials. J Clin Oncol 2006;24:3128–35.
- Eghbali H, Raemaekers J, Carde P. The EORTC strategy in the treatment of Hodgkin’s lymphoma. Eur J Haematol Suppl 2005:135–40.
- Bloomfield CD PT, Glicksman AS, et al. Chemotherapy and combined modality therapy for Hodgkin’s disease: A progress report on cancer and leukemia group B studies. Cancer Treat Rep 1982;66:835–46.
- Pavlovsky S, Maschio M, Santarelli MT, et al. Randomized trial of chemotherapy versus chemotherapy plus radiotherapy for stage I-II Hodgkin’s disease. J Natl Cancer Inst 1988;80:1466–73.
- Aviles A, Delgado S. A prospective clinical trial comparing chemotherapy, radiotherapy and combined therapy in the treatment of early stage Hodgkin’s disease with bulky disease. Clin Lab Haematol 1998;20:95–9.
- Herbst C, Rehan FA, Brillant C, et al. Combined modality treatment improves tumor control and overall survival in patients with early stage Hodgkin’s lymphoma: a systematic review. Haematologica 2010;95:494–500.
- Ferme C, Eghbali H, Meerwaldt JH, et al. Chemotherapy plus involved-field radiation in early-stage Hodgkin’s disease. N Engl J Med 2007;357:1916–27.
- Landgren O, Axdorph U, Fears TR, et al. A population-based cohort study on early-stage Hodgkin lymphoma treated with radiotherapy alone: with special reference to older patients. Ann Oncol 2006;17:1290–5.
- Engert A, Plutschow A, Eich HT, et al. Reduced treatment intensity in patients with early-stage Hodgkin's lymphoma. N Engl J Med 2010;363:640–52.
- Radford J, Illidge T, Counsell N, et al. Results of a trial of PET-directed therapy for early-stage Hodgkin's lymphoma. N Eng J Med 2015;372:1598–607.
- Eich HT, Diehl V, Gorgen H, et al. Intensified chemotherapy and dose-reduced involved-field radiotherapy in patients with early unfavorable Hodgkin’s lymphoma: final analysis of the German Hodgkin Study Group HD11 trial. J Clin Oncol 2010;28:4199–206.
- von Tresckow B, Plutschow A, Fuchs M, et al. Dose-intensification in early unfavorable Hodgkin’s lymphoma: final analysis of the German Hodgkin Study Group HD14 trial. J Clin Oncol 2012;30:907–13.
- Advani RH, Hong F, Fisher RI, et al. Randomized phase III trial comparing ABVD plus radiotherapy with the Stanford V regimen in patients with stages I or II locally extensive, bulky mediastinal Hodgkin lymphoma: a subset analysis of the North American Intergroup E2496 Trial. J Clin Oncol 2015;33:1936–42.
- Sasse S, Brockelmann PJ, Georgen H, et al. Long-term follow-up of contemporary treatment in early-stage Hodgkin lymphoma: Updated analyses of the German Hodgkin Study Group HD7, HD8, HD10 and HD11 trials. J Clin Oncol 2017 Apr 18:JCO2016709410. doi: 10.1200/JCO.2016.70.9410. [Epub ahead of print]
- Nogova L, Reineke T, Brillant C, et al. Lymphocyte-predominant and classical Hodgkin’s lymphoma: a comprehensive analysis from the German Hodgkin Study Group. J Clin Oncol 2008;26:434–9.
- Wirth A, Yuen K, Barton M, et al. Long-term outcome after radiotherapy alone for lymphocyte-predominant Hodgkin lymphoma: a retrospective multicenter study of the Australasian Radiation Oncology Lymphoma Group. Cancer 2005;104:1221–9.
- Chera BS, Olivier K, Morris CG, et al. Clinical presentation and outcomes of lymphocyte-predominant Hodgkin disease at the University of Florida. Am J Clin Oncol 2007;30:601–6.
- Chen RC, Chin MS, Ng AK, et al. Early-stage, lymphocyte-predominant Hodgkin’s lymphoma: patient outcomes from a large, single-institution series with long follow-up. J Clin Oncol 2010;28:136–41.
- Savage KJ, Skinnider B, Al-Mansour M, et al. Treating limited-stage nodular lymphocyte predominant Hodgkin lymphoma similarly to classical Hodgkin lymphoma with ABVD may improve outcome. Blood 2011;118:4585–90.
- Eichenauer DA FM, Pluetschow A, et al. Phase 2 study of rituximab in newly diagnosed stage IA nodular lymphocytepredominant Hodgkin lymphoma: a report from the German Hodgkin Study Group. Blood 2011;118:4363–5.
- Advani RH, Horning SJ, Hoppe RT, et al. Mature results of a phase II study of rituximab therapy for nodular lymphocyte-predominant Hodgkin lymphoma. J Clin Oncol 2014;32:912–8.
- Mauz-Korholz C, Gorde-Grosjean S, Hasenclever D, et al. Resection alone in 58 children with limited stage, lymphocyte-predominant Hodgkin lymphoma-experience from the European network group on pediatric Hodgkin lymphoma. Cancer 2007;110:179–85.
- Ng AK. Review of the cardiac long-term effects of therapy for Hodgkin lymphoma. Br J Haematol 2011;154:23–31.
- Ng AK, LaCasce A, Travis LB. Long-term complications of lymphoma and its treatment. J Clin Oncol 2011;29:1885–92.
- Aleman BM, van den Belt-Dusebout AW, Klokman WJ, et al. Long-term cause-specific mortality of patients treated for Hodgkin’s disease. J Clin Oncol 2003;21:3431–9.
- Girinsky T, van der Maazen R, Specht L, et al. Involved-node radiotherapy (INRT) in patients with early Hodgkin lymphoma: concepts and guidelines. Radiother Oncol 2006;79:270–7.
- Campbell BA, Voss N, Pickles T, et al. Involved-nodal radiation therapy as a component of combination therapy for limited-stage Hodgkin’s lymphoma: a question of field size. J Clin Oncol 2008;26:5170–4.
- Advani R, Maeda L, Lavori P, et al. Impact of positive positron emission tomography on prediction of freedom from progression after Stanford V chemotherapy in Hodgkin’s disease. J Clin Oncol 2007;25:3902–7.
- Engert A, Schiller P, Josting A, et al. Involved-field radiotherapy is equally effective and less toxic compared with extended-field radiotherapy after four cycles of chemotherapy in patients with early-stage unfavorable Hodgkin’s lymphoma: results of the HD8 trial of the German Hodgkin’s Lymphoma Study Group. J Clin Oncol 2003;21:3601–8.
- Horning SJ, Hoppe RT, Breslin S, et al. Stanford V and radiotherapy for locally extensive and advanced Hodgkin’s disease: mature results of a prospective clinical trial. J Clin Oncol 2002;20:630–7.
- Pavone V, Ricardi U, Luminari S, et al. ABVD plus radiotherapy versus EVE plus radiotherapy in unfavorable stage IA and IIA Hodgkin’s lymphoma: results from an Intergruppo Italiano Linfomi randomized study. Ann Oncol 2008;19:763–8.
- De Bruin ML, Sparidans J, van’t Veer MB, et al. Breast cancer risk in female survivors of Hodgkin’s lymphoma: lower risk after smaller radiation volumes. J Clin Oncol 2009;27:4239–46.
- Hodgson DC. Late effects in the era of modern therapy for Hodgkin lymphoma. Hematology Am Soc Hematol Educ Program 2011;2011:323–9.
- Maraldo MV, Brodin NP, Vogelius IR, et al. Risk of developing cardiovascular disease after involved node radiotherapy versus mantle field for Hodgkin lymphoma. Int J Radiat Oncol Biol Phys 2012;83:1232–7.
- Campbell BA, Hornby C, Cunninghame J, et al. Minimising critical organ irradiation in limited stage Hodgkin lymphoma: a dosimetric study of the benefit of involved node radiotherapy. Ann Oncol 2012;23:1259–66.
- Pingali SR, Jewell SE, Havlat L, et al. Limited utility of routine surveillance imaging for classical Hodgkin lymphoma patients in first complete remission. Cancer 2014;120:2122–9.
Prevention of Type 2 Diabetes: Evidence and Strategies
From the Maimonides Medical Center (Dr. Karam) and the SUNY Downstate Medical Center (Dr. Karam and Dr. McFarlane), Brooklyn, NY.
Abstract
- Objective. To discuss the epidemic of diabetes highlighting the natural history of the disease and the major clinical trials aimed at diabetes prevention in different prediabetic populations around the world.
- Results. Diabetes prevention studies have evaluated various interventions including lifestyle modifications, metformin, alpha-glucosidase inhibitors, thiazolidinediones, nateglinide, and xenical as well as the renin-angiotensin aldosterone system (RAS) inhibitors. Lifestyle modifications seem to be the safest, most effective, and most sustainable intervention to prevent diabetes. Except for metformin, the potential diabetes prevention benefits of the studied pharmacologic agents are limited by safety concerns or lack of durable efficacy or tolerability. RAS blockade and fibrates have a favorable glycemic effect, and, when indicated, are reasonable treatment options for hypertension and hyperlipidemia in prediabetic patients.
- Conclusion. As recommended by American Diabetes Association guidelines, patients with prediabetes should be referred to an intensive diet and physical activity behavioral counseling program; diet and activity goals include a loss of 7% of body weight and at least 150 minutes of moderate physical activity per week. Metformin therapy for diabetes prevention should be considered as well.
Key words: prediabetes; type 2 diabetes mellitus, diabetes prevention, lifestyle modifications.
Diabetes mellitus has reached pandemic proportions across the globe. The International Diabetes Federation (IDF) estimates that in 2015 around 415 million people, or 1 in 11 adults, had diabetes, compared to 285 million in 2010, with 5 million deaths, or 1 death every 6 seconds, occurring because of diabetes or diabetes complications [1]. In the United States, an estimated 29.1 million Americans, or 9.3% of the population, have diabetes, 27.8% of them undiagnosed [2]. The prevalence of diabetes increases significantly with age, affecting around 16.2% of American adults aged 45 to 64 years and 25.9% of adults aged 65 years or older [2]. The Centers for Disease Control and Prevention (CDC) estimates that, with current trends, as many as 1 in 3 American adults could have diabetes by 2050 [3].
Type 2 diabetes mellitus (T2DM) accounts for the majority of prevalent and newly diagnosed diabetes in the world, and is strongly linked to overweight and inactivity in adults [4]. T2DM is increasingly being diagnosed in pediatric patients, in whom type 1 diabetes has historically been predominant; it now accounts for approximately 30% of newly diagnosed diabetes in children aged 10 to 19 years, exceeding 50% in certain ethnicities such as non-Hispanic black and American Indian/Alaska Native children [2].
These alarming trends have spurred significant research and public efforts aimed at reducing the prevalence of diabetes by preventing T2DM. Indeed, insulin resistance and abnormal carbohydrate metabolism progress over many years prior to the diagnosis of diabetes and manifest with different clinical and biochemical features. Both the pathophysiology and the natural history of T2DM offer clinicians an opportunity to identify patients at risk for developing the disease and to implement prevention strategies. This article outlines the risk factors and diagnostic criteria for prediabetes, describes the studies that have explored diabetes prevention through lifestyle changes, pharmacotherapy, or surgery, and reviews recommendations for managing patients at risk.
Risk Factors and Screening for T2DM
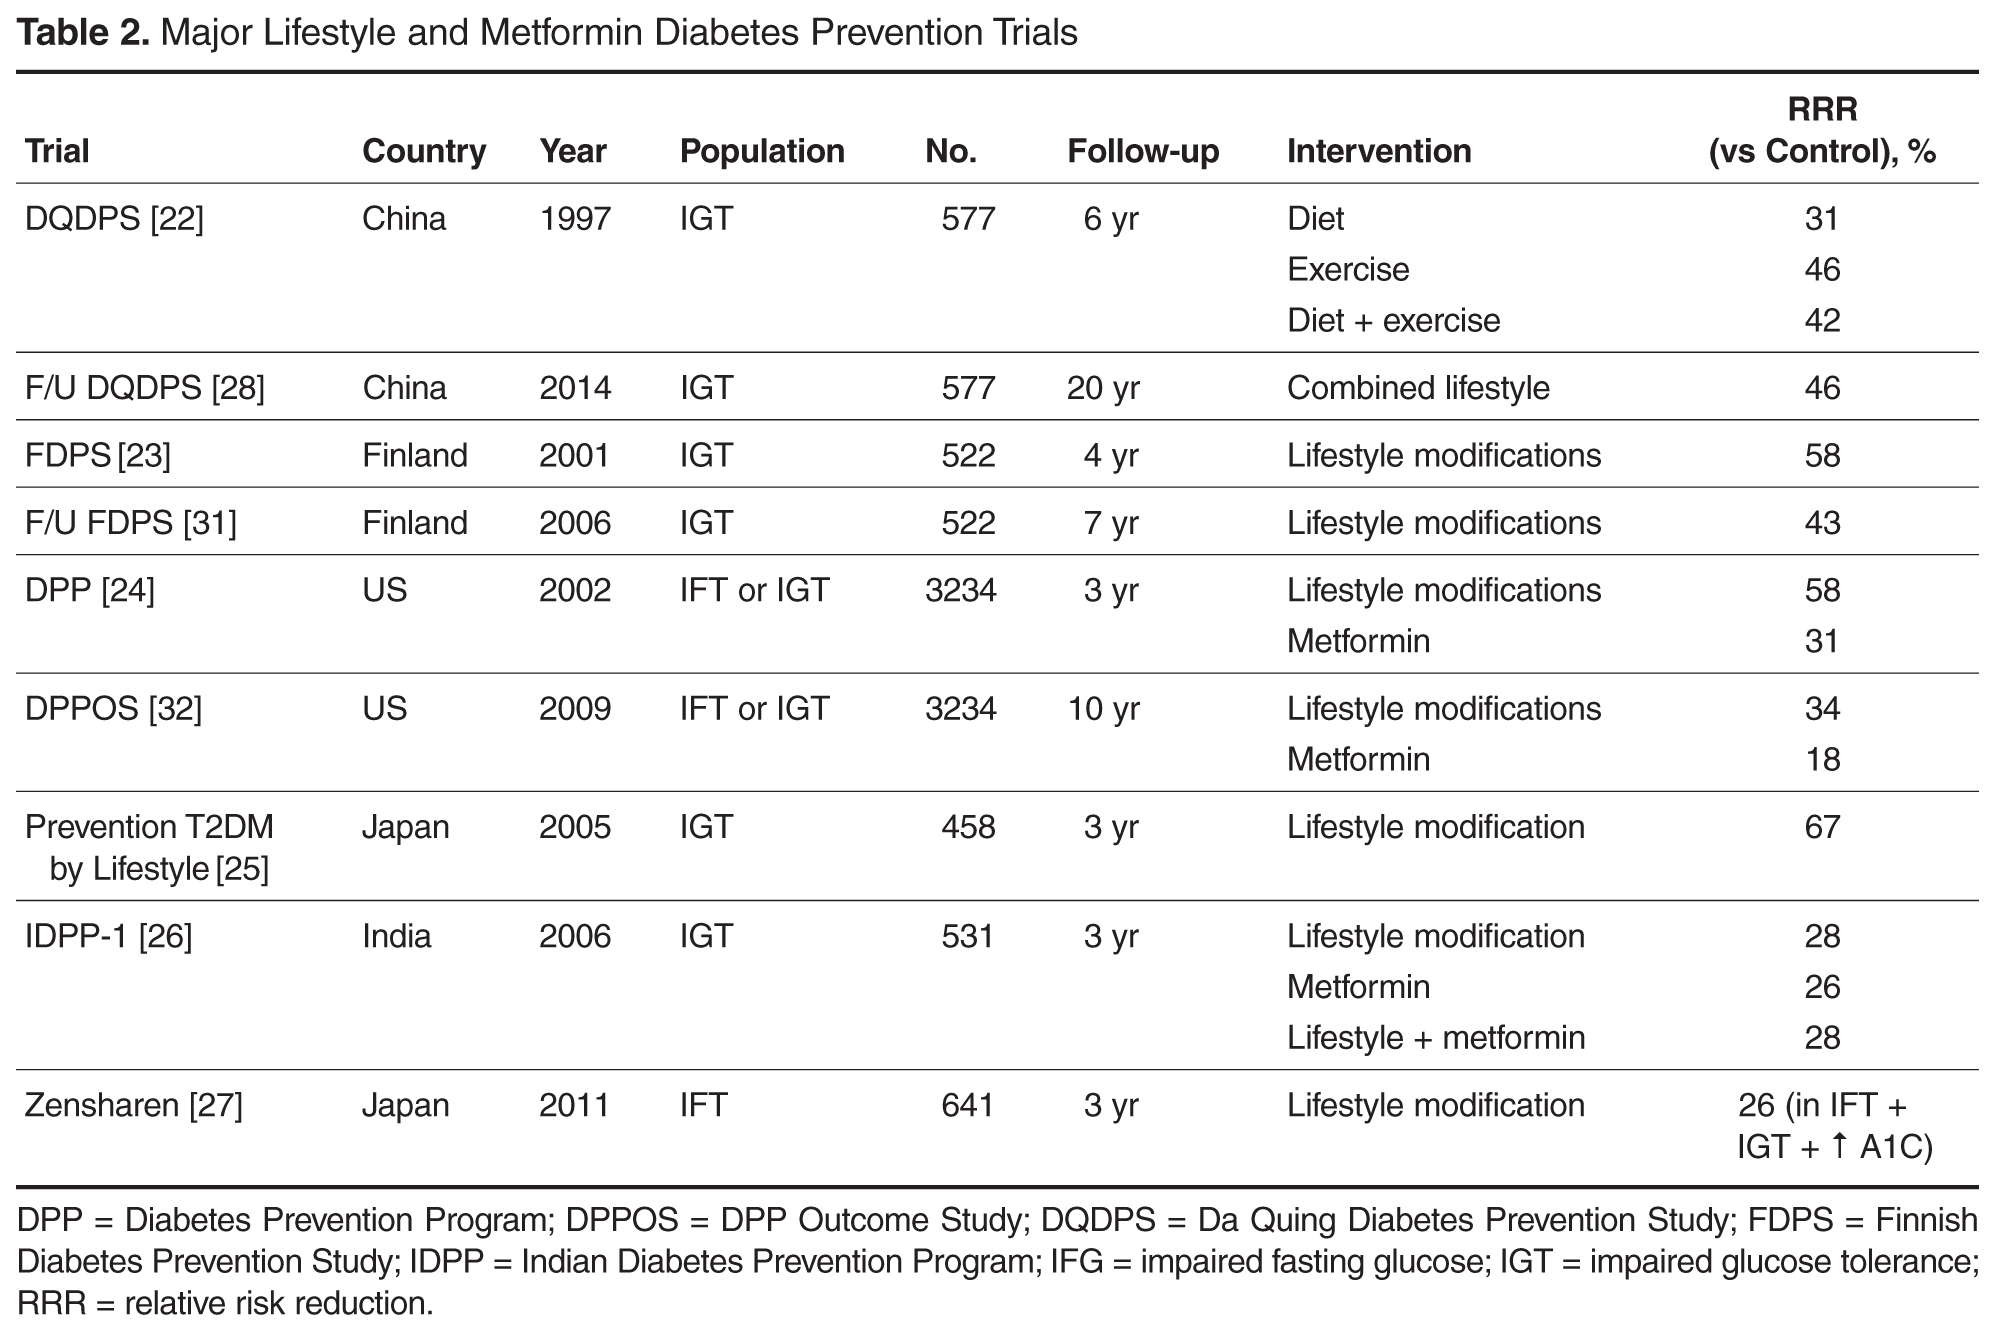
The American Diabetes Association (ADA) recommends screening all adults for prediabetes by assessing for diabetes risk factors [8]. Glucose testing is recommended in individuals aged 45 years or older, and should be considered in adults of any age who are overweight or obese (body mass index [BMI] ≥ 25 kg/m2 or ≥ 23 kg/m2 in Asian Americans) and have 1 or more additional risk factors for diabetes. Testing also should be considered in children and adolescents who are overweight or obese and who have 2 or more additional risk factors. If tests are normal, repeat testing carried out at a minimum of 3-year intervals is suggested [8].
Prediabetes
Abnormalities in glucose metabolism progress along a continuum through various stages before T2DM develops. Years before the development of overt diabetes, and especially in the presence of excessive visceral fat, cellular sensitivity to insulin gradually decreases, leading to a compensatory increased insulin secretion [9]. With time, and under continuous increased demand, pancreatic beta cell function declines and ultimately fails to overcome insulin resistance and maintain a normal glucose metabolism, resulting in prediabetes followed by the development of diabetes. This early beta cell dysfunction was illustrated by the decreased beta cell volume observed on autopsy of obese patients with IFG or T2DM, when compared to obese individuals with normal glucose tolerance [10]. It is estimated that around 40% to 70% of beta cell function is already lost by the time diabetes is clinically diagnosed. This relatively slow pathophysiologic process allows the identification of at-risk patients well before their blood glucose levels reach the diabetic diagnostic thresholds, and therefore presents an opportunity for prevention.
Diagnostic Criteria
The ADA guidelines released in 2003 define prediabetes as IFG (fasting blood glucose [FBG] levels of 100–125 mg/dL), IGT (glucose levels of 140–199 mg/dL at 2 hours during an oral glucose tolerance test [OGTT] following an oral load of 75 g of dextrose), or both. Additionally, hemoglobin A1C (A1C) was introduced as a diagnostic tool for prediabetes in 2010, with values between 5.7% and 6.4% indicating prediabetes [8]. Most of these thresholds were chosen due to their association with increased rates of complications, notably retinopathy and cardiovascular disease.
A combined report from the World Health Organization (WHO) and the IDF published in 2006 defined intermediate hyperglycemia as IFG, but with a higher cutoff for FBG (110–125 mg/dL) than the ADA’s definition, and/or IGT (2-hour OGTT glucose level of 140–199 mg/dL) [11]. The rationale for a higher cut-point for IFG is the concern about the increased prevalence of IFG and its impact on individuals and health systems and the more favorable cardiovascular risk profile and decreased risk of progression to diabetes in the group of patients with FBG of 100 to 110 mg/dL when compared to the group with FBG of 110 to 125 mg/dL. The report does not recommend the use of A1C in the diagnosis of diabetes or intermediate hyperglycemia because of a lack of global consistency and the potential for other factors that can be prevalent in some developing countries, such as hemoglobinopathies and anemia, to interfere with the assay.
Prevalence and Progression to Diabetes
According to CDC data from 2014, up to 86 million American adults, more than 1 in 3, have prediabetes, and 9 out of 10 of these individuals are undiagnosed [2]. It is estimated that approximately 25% of people diagnosed with either IFG or IGT progress to diabetes mellitus over a 3- to 5-year period [12]. If observed for longer periods, most prediabetic persons will probably develop diabetes. The highest rate of progression to diabetes is observed in patients with both IFG and IGT, older age, overweight, or other diabetic risk factors.
Complications
In addition to increasing the risk for progression to diabetes, prediabetes is independently associated with microvascular and macrovascular complications and increased risk of death, prior to the actual onset of diabetes. The DECODE study demonstrated significantly increased mortality in 2766 individuals with IGT after 7 years of follow-up, when compared to normoglycemic patients; this effect was more prominent in participants with IGT than in participants with IFG [13]. In the Australian Diabetes, Obesity and Lifestyle Study, IFG was found to be an independent predictor for cardiovascular mortality after adjustment for age, sex, and other traditional cardiovascular risk factors [14].
Similarly, a recent meta-analysis demonstrated that the presence of IFG was significantly associated with future risk for coronary heart disease (CHD), with the risk increase starting when fasting plasma glucose was as low as 100 mg/dL; however, this finding may have been confounded by the presence of undetected IGT or other cardiovascular risk factors [15]. Another recent systematic review of 53 prospective cohort studies with 1,611,339 participants showed that prediabetes (IFG or IGT) was associated with an increased risk of composite cardiovascular disease, CHD, stroke, and all-cause mortality [16].
The association between retinopathy and prediabetes has been described in multiple reports and this association has helped guide authors on selected thresholds for diagnosis of prediabetes. For example, in 1 study, the incidence of retinopathy in individuals with IGT was 12% among Pima Indians [17]. Similarly, in a follow-up study of the Diabetes Prevention Program, 8% of prediabetic participants who remained nondiabetics had evidence of retinopathy [18].
Neuropathy also has been observed in prediabetes. A noninvasive neurologic evaluation of individuals with IGT revealed subclinical neural dysfunction suggestive of cardiovascular autonomic neuropathy [19]. At the clinical level, a study that evaluated 100 patients with chronic idiopathic axonal neuropathy of unknown etiology found IFG in 36 and IGT in 38 patients, underscoring the role of abnormal glucose metabolism in these patients [20].
Nephropathy may also be more prevalent in those with prediabetes. In a 1999–2006 National Health and Nutrition Examination Survey analysis, the adjusted prevalence of chronic kidney disease, defined by estimated glomerular filtration rate (eGFR) of 15 to 59 mL/min per 1.73 m2 or albumin-creatinine ratio ≥ 30 mg/g, was 17.1% in individuals with IFG, compared to 11.8% in individuals with normal fasting glucose [21].
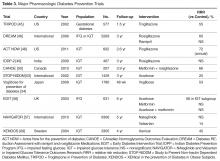
Lifestyle Modifications
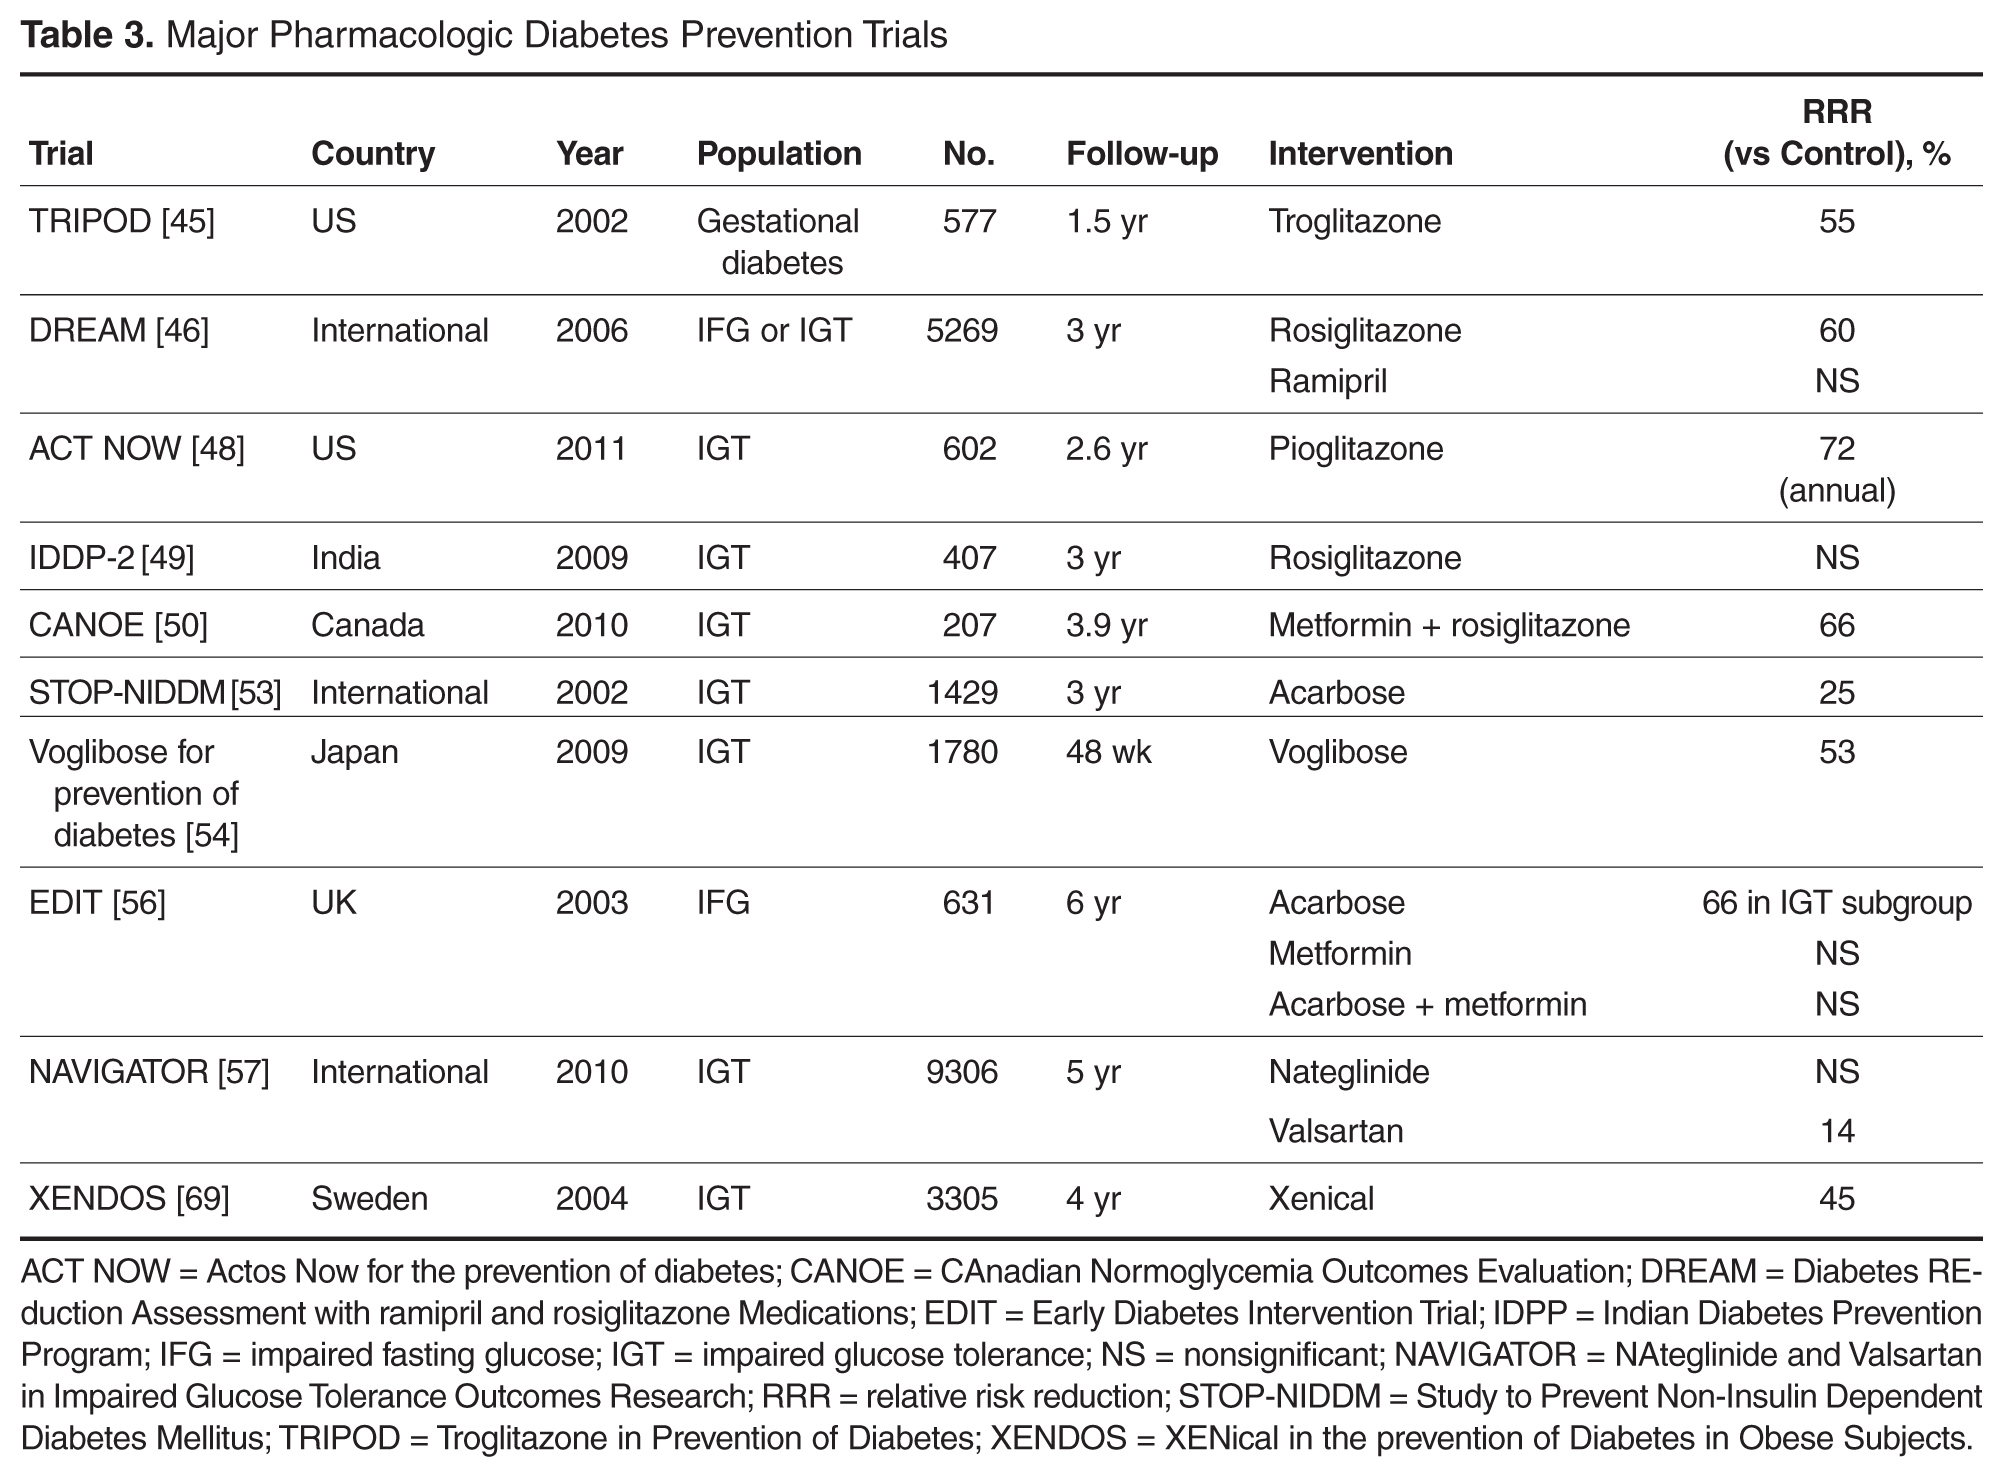
The alarming rapid increase in the prevalence of T2DM has been linked to a parallel rising epidemic of overweight, obesity, and lack of physical activity. Therefore, lifestyle changes aiming at weight reduction seemed to be a natural individual and public health strategy to prevent diabetes, and such strategies have been the focus of many randomized controlled trials around the world. As anticipated, weight loss, exercise, and diet have all been shown, separately or in combination, to be effective in decreasing the incidence of T2DM in high-risk patients [22–27]. Furthermore, and well beyond the benefit observed during the trials, follow-up studies revealed a sustained reduction of diabetes incidence in intervention groups several years after cessation of the intervention [28–32] (Table 2).
The Da Quing Diabetes Prevention Study (DQDPS), published in 1997, is one of the earliest prospective diabetes prevention trials [22]. This 6-year study conducted in 33 clinics in China from 1986 through 1992 included 577 participants with IGT who were randomly assigned to 1 of 4 groups: (1) diet (high vegetables, low sugar/alcohol) only, (2) exercise, (3) diet plus exercise, and (4) standard of care. At 6 years, diabetes incidence was significantly reduced by 46% in the exercise group, 31% in the diet group, and 42% in the diet plus exercise group compared to standard care. In 2006, 14 years after the end of the trial and 20 years after the initial enrollment, the cumulative incidence of diabetes was significantly lower in the intervention group at 80%, compared to 93% in the control group, and the annual incidence of diabetes was 7% and 11%, respectively, with a 43% lower incidence of diabetes over the 20-year period in the combination lifestyle changes group [28]. The preventive benefit of lifestyle changes persisted 2 decades after the initial randomization despite the standardization of treatment for all groups over the 14 years following the study, suggesting a strong and longitudinal preventive effect of the initial lifestyle modifications. In a follow-up study of the DQDPS conducted in 2009, at 23 years of follow-up, the cumulative incidences of cardiovascular mortality and all-cause mortality were significantly lower in the intervention group (11.9% versus 19.6%, and 28.1% versus 38.4%, respectively), highlighting the long-term clinical benefits of lifestyle intervention in patients with IGT [29].
Similarly, the Finnish Diabetes Prevention Study (FDPS), published in 2001, enrolled 522 middle-aged overweight participants with IGT [23]. The participants randomly assigned to the intervention group received individualized counseling designed to reduce weight, decrease total intake of fat and saturated fat, increase intake of fiber, and increase physical activity. The control group received standard therapy. At 4 years of follow-up, the cumulative incidence of diabetes was 11% in the intervention group and 23% in the control group, with a statistically significant 58% reduction in risk for progression to diabetes. A follow-up of the FDPS was published in 2006 [31]. Participants who did not progress to diabetes in the initial 4-year study were further followed for a median of 3 years. Interestingly, lifestyle changes were maintained by the intervention group participants despite the cessation of the individual counseling, leading to a 36% relative reduction in diabetes incidence during the post-intervention follow-up period alone (4.6 vs 7.2 per 100 person-years, P = 0.041) and a 43% cumulative diabetes incidence reduction over the 7-year follow-up, demonstrating, one more time, the sustained efficacy of lifestyle changes.
In the United States, the Diabetes Prevention Program (DPP) trial is a landmark NIH-sponsored multicenter randomized controlled trial published in 2002, and one of the largest diabetes prevention studies with lifestyle changes to date [24]. A total of 3234 participants with prediabetes, defined as an IFG or IGT, were randomly assigned to an intensive lifestyle modification program, metformin 850 mg twice daily, or matching placebo. Lifestyle changes included a low-fat (< 25% of caloric intake), 1200- to 1800-calorie diet and exercise for 150 minutes a week, with a 7% body weight reduction goal and a very well structured curriculum and professional support group. The study was discontinued early (at 3 years) as the data demonstrated the superiority of lifestyle changes, with a 58% reduction in diabetes incidence in the lifestyle intervention group and a 31% reduction in the metformin group when compared to placebo (cumulative incidence of diabetes at 3 years of 28.9%, 21.7 %, and 14.4% in the placebo, metformin, and lifestyle intervention groups, respectively). Lifestyle changes were significantly more effective than metformin and were consistently effective in men and women across age, BMI, and ethnic groups.
The DPPOS (DPP Outcome Study) was a 10-year follow-up of the DPP study published in 2009 where all participants were offered group-implemented lifestyle changes and were followed for an additional 5.7 years [32]. Unlike the Finnish follow-up study, diabetes incidence was similar in the 3 treatment groups in the follow-up period. However, the cumulative incidence of diabetes remained significantly the lowest in the original lifestyle group, with a 34% cumulative risk reduction in the lifestyle group and an 18% reduction in the metformin group at 10 years when compared to placebo. Interestingly, unlike most other studies of weight-reducing interventions, in the DPPOS, patients in the lifestyle changes and metformin groups maintained weight loss at 10 years’ follow-up.
In Japan, a diabetes prevention study assigned 458 male participants with IGT to a standard intervention group or an intensive intervention group receiving detailed lifestyle modification counseling every 3 to 4 months during hospital visits [25]. The cumulative 4-year incidence of diabetes was 9.3% in the control group versus 3.0% in the intervention group, and the reduction in diabetes risk was 67.4% (P < 0.001), with body weight reductions of 0.39 kg and 2.18 kg, respectively (P < 0.001). Of note, participants with higher FBG at baseline developed diabetes at a higher rate than those with lower values. This study suggested that lifestyle change counseling conducted in an outpatient clinic setting can be very effective in preventing diabetes.
Indian adults are thought to be more insulin resistant at a younger age and at a lower BMI than Caucasians. To assess whether the DPP findings can be replicated in an Indian population, the Indian Diabetes Prevention Program (IDPP) trial randomized a total of 531 participants with IGT to 4 groups: control, lifestyle modification, metformin, and lifestyle modifications with metformin [26]. The 3-year cumulative incidences of diabetes were 55.0%, 39.3%, 40.5%, and 39.5%, respectively, showing again a significant relative reduction in progression to diabetes of 28.5% with lifestyle changes, 26.4% with metformin, and 28.2% with both lifestyle changes and metformin, as compared with the control group.
In a Japanese unmasked, multicenter, randomized controlled trial published in 2011, 641 overweight adults with IFG were randomized to a frequent intervention group, receiving individual counseling and support for lifestyle modifications 9 times over 36 months, or a control group, receiving counseling 4 times over the same period. The 3-year cumulative incidence of T2DM was significantly lower in the frequent intervention group than in the control group (12.2% vs 16.6%) [27]. Interestingly, in a posthoc subgroup analysis, the protective effect was more prominent in patients with underlying associated IGT or elevated A1C, but was not observed in patients with isolated IFG, suggesting a possible prognostic value of an additional A1C or oral glucose tolerance test in individuals with IFG.
Diet
The diet followed in the major diabetes prevention trials discussed above has typically been a weight-reducing diet with decreased fat intake (eg, DPP, Finnish trial) and increased fiber intake (eg, Da Quing, DPP, Finnish trials). However, there has been more emphasis recently on the importance of the quality rather than the quantity of fats in preventing diabetes. For example, in a Spanish study, a non–calorie-restricted traditional Mediterranean diet, enriched with high-fat foods of vegetable origin (olive oil, nuts) decreased the incidence of diabetes by 52% in individuals at high cardiovascular risk after a median follow-up of 4.0 years, and in the absence of significant changes in body weight or physical activity among the groups [33]. These findings were reproduced by other studies. A recent meta-analysis examining the relation between intake of fruits and vegetables and the incidence of diabetes revealed that higher intake of fruit, especially berries, and green, leafy vegetables, yellow vegetables, cruciferous vegetables, or their fiber is associated with a lower risk of T2DM [34].
Exercise
Exercise is thought to improve insulin sensitivity and promote peripheral glucose uptake in normal individuals. Long-term moderate exercise, similar to the exercise recommended in DPP and FDPS, results in increased translocation of insulin-responsive glucose transporter (GLUT-4) from intracellular stores to the cell surface, facilitating glucose uptake [35]. A systematic review of 10 prospective cohort studies published in 2007 showed that, after adjustment for BMI, moderate-intensity physical activity was significantly associated with reduced diabetes incidence [36]. In the FDPS, participants who achieved at least 4 hours of exercise per week had a significant 80% decrease in incidence of diabetes, and this effect was observed even in the group that did not lose weight [23]. In the DQDPS, the greatest reduction in diabetes incidence was observed in the exercise group [22].
In a recent NIH-funded trial designed to examine the relative contribution of exercise alone to the overall beneficial effect of lifestyle changes in the DPP study, a total of 237 adults with IFG were randomly assigned to 4 different groups: low-amount moderate intensity exercise (similar to exercise followed in DPP), high-amount moderate intensity exercise, high-amount vigorous intensity exercise, and a combination of diet, weight loss, and low-amount moderate exercise. Only the diet and exercise group experienced a decrease in fasting glucose, whereas similar improvements in glucose tolerance were observed in both the diet and exercise group and the high-amount moderate-intensity exercise group, suggesting that such an exercise regimen may be as effective as a more intensive multicomponent approach involving diet, exercise, and weight loss for preventing diabetes [37].
Weight Loss
Weight reduction in prediabetic individuals has been consistently associated with reduced incidence of diabetes. Furthermore, the amount of weight loss needed to achieve this benefit seems to be relatively modest and a realistic goal to set for patients. Indeed, in the DPP trial, an average weight loss of only 5.6 kg was associated with a 58% lower incidence of diabetes [24]. Moreover, on further analysis of the DPP trial, and among weight, diet, and exercise, diabetes prevention correlated most strongly with weight loss, with an estimated 16% diabetes risk reduction for every single kilogram of weight reduction [38]. Similarly, within the same lifestyle intervention group in the FDPS, the participants who were able to achieve an initial body weight loss greater than 5% at 1 year had a nearly 70% relative risk reduction in progression to diabetes, when compared to their peers in the intervention group who had less or no weight loss [23].
In summary, numerous randomized controlled studies from various populations have proved that lifestyle modifications, including healthy diet, moderate weight loss, and moderate-intensity exercise, represent a very effective strategy to prevent diabetes in patients at risk, mostly patients with IGT, and this protective effect seems to be sustained over time.
Pharmacologic Interventions
Metformin
Metformin is an antidiabetic agent that works mostly at the liver site by suppressing hepatic glucose production and inhibiting production and oxidation of free fatty acids (FFA), thereby reducing FFA-induced insulin resistance and promoting peripheral glucose uptake [39]. This effect has the potential of preserving beta cell function by reducing the demand for insulin secretion.
In the DPP trial, metformin, although generally less effective than lifestyle changes, was associated with a significant 31% reduction in diabetes incidence (cumulative incidence of 22% in metformin group vs 29% in placebo group) and significant weight reduction (average of 2 kg) [24]. Further analysis of the DPP results showed that metformin efficacy, compared to placebo, was greater in patients who were younger, had higher BMI, and had higher FBG levels. In addition, a DPP substudy of 350 women with history of gestational diabetes and IGT revealed that this group of women, who had a higher risk of progression to diabetes (71% at 3 years) when compared to women with no history of gestational diabetes, despite similar baseline glucose levels, had similar diabetes risk reduction of 50% with both metformin and lifestyle changes [40].
In the IDPP study, both lifestyle changes and metformin reduced significantly and similarly the incidence of diabetes in adults with IGT, with no observed added benefit from combining both interventions [26]. It has not been clear, however, how much of this effect of metformin is a result of pharmacologic properties masking hyperglycemia or a true protective and preventive effect. In a washout study in which 1274 DPP participants who did not progress to diabetes underwent an OGTT after 1 to 2 weeks of discontinuing metformin or placebo, the incidence of diabetes was still reduced by 25% in the metformin group, after the washout period, compared to a 31% risk reduction in the primary DPP analysis, suggesting a partially sustained rather than temporary effect of metformin [41]. In the DPPOS long-term follow-up study, metformin (850 mg twice daily as tolerated) was continued in the group initially assigned to metformin in addition to lifestyle counseling [32]. Although the progression to diabetes was similar in all groups during the 5.7-year follow-up period, the cumulative incidence of diabetes at 10 years was still reduced in the metformin group by 18% when compared to control group. Furthermore, the weight loss associated with metformin was also interestingly sustained at 10 years. A meta-analysis echoed this beneficial effect of metformin observed in the DPP trial, reporting a relative risk reduction of new-onset diabetes of 40% with the use of metformin [42].
In summary, metformin has been shown to be effective in preventing diabetes in patients at risk, especially persons with younger age, higher BMI, and history of gestational diabetes and in native Asian Indians. The protective effect of metformin seems to be sustained over the long term in follow-up studies.
Thiazolidinediones
Thiazolidinediones (TZDs) are antidiabetic agents that have been evaluated in diabetes prevention trials. TZDs are peroxisome proliferator-activated gamma receptor (PPAR-γ) agonists that work by augmenting conversion of preadipocytes to adipocytes, which in turn increase adiponectin levels, promoting insulin sensitivity [43]. In addition to their antihyperglycemic properties, TZDs are thought to have a direct protective effect on beta cells, potentially translating into prevention and delay of diabetes [44].
The first study to demonstrate diabetes prevention with a TZD was the TRIPOD study (Troglitazone in Prevention of Diabetes), in which 266 Hispanic women with a history of gestational diabetes were randomly assigned to troglitazone or placebo [45]. Troglitazone use was significantly associated with reduction of progression to diabetes at 1.5-year follow-up when compared to placebo (relative risk reduction of 55%), with a decrease of endogenous insulin requirement at 3 months of therapy and sustained benefit after discontinuation of the TZD, suggesting an effect on beta cell preservation.
Moreover, troglitazone was an investigational drug in the DPP trial from 1996 to 1998, at which time it was discontinued because of associated fatal liver failure in a DPP participant. In the DPP trial, troglitazone was asso-ciated with a remarkable 75% decrease in progression to diabetes at 1 year. Troglitazone was withdrawn from the US market in 2000 because of its association with severe hepatotoxicity.
The international DREAM (Diabetes REduction Assessment with ramipril and rosiglitazone Medications) trial randomly assigned more than 5000 participants with IFG and/or IGT to rosiglitazone, ramipril, or placebo in a 2 × 2 factorial design [46]. In participants receiving rosiglitazone, the risk for progression to diabetes was reduced by 60% and the likelihood of regression to normoglycemia was increased by 71% when compared to placebo. However, the use of rosiglitazone was associated with an increased risk of new-onset congestive heart failure and a mean weight gain of 2.2 kg, thought to reflect increased subcutaneous gluteal fat deposition, with an observed decreased waist-to-hip ratio.
Interestingly, in a passive follow-up of the DREAM study conducted a median 1.6 years after the end of the trial and 4.3 years after randomization, participants treated with rosiglitazone had a 39% lower incidence of diabetes compared to placebo participants, and 17% more of them regressed from prediabetes to normoglycemia [47]. Nonetheless, there was no difference between the 2 groups when the analysis was restricted to the passive follow-up period, suggesting a time-limited exposure to rosiglitazone reduces the longer-term incidence of diabetes by likely delaying but not reversing the underlying disease process.
The third large trial assessing the efficacy of a TZD in preventing diabetes was the Actos Now for the prevention of diabetes (ACT NOW) trial, which was a randomized, double-blinded study that assigned 602 patients with IGT to pioglitazone 45 mg daily or placebo [48]. Over a median follow-up of 2.6 years, pioglitazone was associated with a 72% lower annual rate of progression to diabetes (2.1% compared to 7.6 % in placebo group), and a higher rate of conversion to normal glucose tolerance (48%). In addition, pioglitazone had favorable effects on fasting and 2-hour blood glucose, A1C level, diastolic blood pressure, carotid intima thickness, and HDL cholesterol. As in the DREAM trial, an increased incidence of edema and weight gain was observed with pioglitazone.
Unlike the strong evidence supporting TZDs as an approach to diabetes prevention in the US trials, the Indian Diabetes Prevention Program-2 (IDPP-2) trial, which randomized 497 participants with IGT to lifestyle modifications with pioglitazone versus lifestyle modifications with placebo, did not demonstrate a significant reduction in diabetes at 3 years’ follow-up, suggesting a possible ethnicity-related variation in the effect of the medication [49]. In 2011, the French and German medications regulatory agency withdrew pioglitazone from the market because of a potential increase in incidence of bladder cancer with the cumulative use of more than 28 g of pioglitazone. In the United States, the Food and Drug Administration is performing an extensive review of data and advises against the use of pioglitazone in patients with a history of bladder cancer.
In summary, TZDs demonstrated significant efficacy in preventing diabetes in many patients at risk, but their safety concerns, particularly the associated new onset of congestive heart failure and potential increased risk of bladder cancer, might outweigh this benefit.
Combination Metformin and Thiazolidinediones
As metformin and rosiglitazone both have preventive benefits in diabetes, and rosiglitazone is associated with numerous side effects at a higher dose, a combination of metformin and low-dose rosiglitazone was evaluated in in the CAnadian Normoglycemia Outcomes Evaluation (CANOE) trial [50]. A total of 207 patients with IGT were randomly assigned to receive combination metformin (500 mg twice daily) and rosiglitazone (2 mg daily) versus placebo for a median of 3.9 years. The combination therapy was associated with a 66% relative risk reduction of progression to diabetes.
Alpha-glucosidase Inhibitors
Alpha-glucosidase inhibitors are antidiabetic agents that slow oral carbohydrate intestinal absorption, subsequently improving postprandial hyperglycemia, which can eventually reduce glucose toxicity of pancreatic beta cells. In addition, they have been shown to improve insulin sensitivity in individuals with IGT [51] and have been found to exert a favorable protective effect in a prediabetic population [52]. In a multicenter placebo-controlled randomized trial, the Study to Prevent Non-Insulin Dependent Diabetes Mellitus (STOP-NIDDM), 1429 participants with IGT were randomly assigned to receive acarbose 100 mg 3 times a day or placebo for 3 years [53]. As expected, diabetes incidence was significantly decreased by 25% in the acarbose group (relative risk of 32.4% vs 41.5% in acarbose and placebo group, respectively), and acarbose significantly increased reversion to normal glucose tolerance (P < 0.0001). Furthermore, the use of acarbose was associated with a statistically significant 49% decrease in the rate of any cardiovascular event, highlighting the cardiovascular protective effect of improving postprandial hyperglycemia with acarbose. This study had many limitations: a high percentage of participants discontinued treatment (31% in the acarbose group and 19% in the placebo group), most likely related to increased gastrointestinal adverse effects of acarbose. In addition, the diabetes prevention effect does not seem to be sustained: during a 3-month wash-out period where all patients received placebo, incidence of diabetes in the initial intervention group was higher than in the initial placebo group.
In a Japanese multicenter randomized double-blind trial, 1780 patients with IGT were randomly assigned to receive the alpha-glucosidase inhibitor voglibose or placebo [54]. An interim analysis at 48 weeks revealed a significantly lower risk of progression to diabetes in the voglibose group.
Combination Metformin and Acarbose
In a 6-year multicenter British study, the Early Diabetes Intervention Trial (EDIT), 631 participants with IFG were randomly assigned, in a factorial design, to double-blind treatment with acarbose or placebo and simultaneously to metformin or placebo [55]. At 3 years, there was a nonsignificant risk reduction of 8% and 37% in progression to 2 successive fasting plasma glucose values of 140 mg/dL or more in the acarbose and metformin groups, respectively, but a significantly lower 2-hour OGTT glucose in the acarbose group and significantly lower FBG in the metformin group. Interestingly, at 6 years of follow-up, there was no significant difference in relative risk of progression to diabetes with acarbose, metformin, or combination therapy [56]. However, unlike metformin or combination therapy, acarbose was associated with a significant relative risk reduction of diabetes (0.66, P = 0.046) in the subgroup of patients with IGT at baseline, suggesting a possible differential protective effect of certain agents in patients with IGT or IFG.
Nateglinide
Nateglinide is a short-acting insulin secretagogue that is mostly used in the treatment of postprandial hyperglycemia in diabetic patients. The protective effect of nateglinide in a prediabetic population was examined in the NAVIGATOR study (the NAteglinide and Valsartan in Impaired Glucose Tolerance Outcomes Research), a large prospective multinational, randomized, double-blind, placebo-controlled trial. Nateglinide (30–60 mg 3 times daily) and valsartan (80–160 mg daily) versus placebo were used in a 2×2 factorial design in 9306 participants with IGT and increased risk of cardiovascular events [57]. At 5 years, nateglinide did not reduce the cumulative incidence of diabetes or cardiovascular outcomes, when compared to placebo, whereas risk of hypoglycemia was significantly increased in the intervention group.
Liraglutide
Liraglutide is an injectable glucagon-like peptide-1 (GLP-1) receptor agonist used to treat T2DM, and recently approved as a weight-reducing agent at the dose of 3 mg injected subcutaneously. GLP-1 receptor agonists work by stimulating insulin secretion in a glucose-dependent manner, suppressing glucagon secretion, inducing satiety, and slowing gastric emptying. In the international double-blind SCALE (Satiety and Clinical Adiposity-Liraglutide Evidence) trial, 3731 nondiabetic patients, among whom 61.2% had prediabetes, were randomly assigned to liraglutide 3 mg subcutaneous injection daily or placebo, in addition to diet and exercise [58]. Liraglutide was associated with lower glucose levels on OGTT and lower A1C values at the end of the study (56 weeks), with this decrease especially prominent in prediabetic patients. Significantly fewer participants in the liraglutide group (4/2219) compared to the placebo group (14/1225) developed diabetes at 56 weeks, nearly all of whom (except for 1 in the placebo group) had prediabetes at the beginning of the study. Of note, the liraglutide group had a mean 8.4-kg weight reduction by week 56, compared to 2.8 kg in the placebo group.
Insulin
Insulin has also been investigated as a possible diabetes prevention agent, given the assumed protective effect insulin could exert on beta cell reserve. In the landmark international Outcome Reduction with Initial Glargine Intervention (ORIGIN) trial, 12,537 participants (mean age 63.5 years) with cardiovascular risk factors plus IFG, IGT, or type 2 diabetes were randomly assigned to receive insulin glargine (with a target FBG ≤ 95 mg/dL) or standard care and were monitored for cardiovascular outcomes and other secondary endpoints including incidence of diabetes [59]. After a median follow-up of 6.2 years, and 3 months after discontinuation of therapy, among the 1456 participants without baseline diabetes, new diabetes was diagnosed in 30% of participants receiving glargine versus 35% of those receiving standard therapy. However, rates of severe hypoglycemia and modest weight gain were higher in the insulin group, calling in to question the benefit/risk balance with the use of basal insulin for diabetes prevention.
ACE Inhibitors and ARBs
A possible diabetes preventive effect was observed with renin-angiotensin system (RAS) blockade agents in secondary analysis of several hypertension trials, such as with ramipril in the Heart Outcomes Prevention Evaluation study, captopril (compared to diuretics and beta blockers) in the CAptopril Prevention Project, lisinopril (compared to amlodipine and chlorthalidone) in the Antihypertensive and Lipid-Lowering Treatment to Prevent Heart Attack Trial, losartan (compared to atenolol) in the Losartan Intervention For Endpoint reduction in hypertension study), and multiple other randomized controlled trials [60–64]. Therefore, 2 major trials were designed to examine, as a primary outcome, the effect of RAS inhibition on diabetes prevention in a population at risk. The DREAM trial randomly assigned, in a 2 × 2 factorial design, 5269 relatively healthy participants with IGT and/or IFG to rosiglitazone, ramipril, or placebo [65]. Although the use of ramipril at a dose of 15 mg daily for 3.5 years did not prevent diabetes significantly, it was associated with a 9%, nonsignificant decrease in new-onset of diabetes and a 16%, significant increase in regression of IFG and IGT to normoglycemia, as well as a significant decrease in OGTT 2-hour glucose level (135.1 vs 140.5 mg/dL) with no improvement in FBG.
Similarly, in the NAVIGATOR trial that examined the effect of nateglinide and valsartan on the prevention of diabetes in 9306 participants with IGT and increased risk of cardiovascular events, valsartan significantly but slightly reduced the incidence of diabetes at 5 years, by 14%, when compared to placebo (33% versus 37%, respectively), with no significant reduction in cardiovascular outcome [66]. Unlike in the DREAM study, the patients enrolled in the NAVIGATOR trial had established cardiovascular disease or cardiovascular risk factors and assumable elevated RAS activation level. This baseline population difference might explain the more significant effect of RAS inhibition in the NAVIGATOR trial.
Given the positive glycemic effect of ACE inhibitors and ARBs, their use should be encouraged in prediabetic patients when indicated for treatment of high blood pressure or cardiovascular disease. Different mechanisms could explain this favorable glycemic impact: inhibition of the post-receptor insulin signaling abnormalities, increased blood flow to the skeletal muscle facilitating insulin action, enhanced differentiation of pre-adipocytes into mature adipocytes, and increased pancreatic islet blood perfusion leading to appropriate insulin release and possible partial PPAR-γ activity [67].
Xenical
Xenical is a gastrointestinal lipase inhibitor approved for use for weight reduction and maintenance. A possible diabetes prevention benefit of xenical was initially suggested by a retrospective analysis of xenical treatment effects on obese patients with IGT [68]. This finding was subsequently confirmed by a multicenter randomized placebo-controlled study, XENical in the prevention of Diabetes in Obese Subjects (XENDOS), where 3305 obese subjects, with normal glucose tolerance or IGT were randomly assigned to either xenical 120 mg 3 times a day or placebo, in addition to lifestyle changes for all participants [69]. In the group of patients with IGT (694 subjects), xenical treatment was associated with a 45% risk reduction of progression to diabetes at 4 years (18.8% versus 28.8% in placebo), whereas participants with baseline normal glucose tolerance had no significant change in incidence of diabetes. On the other hand, weight reduction at 4 years was significantly greater in all patients who received xenical (5.8 kg in intervention group vs 3 kg in control group). The beneficial effect of xenical in diabetes prevention seems to be additive to the benefit of weight loss. As in many weight reduction trials, this study was limited by the high discontinuation rate in both groups (48% in xenical group and 66% in control group), probably related to insufficient clinical response.
Fibric Acid Derivatives (Bezafibrate)
Bezafibrate, a nonselective ligand/activator for PPAR-α, was found to reduce not only triglycerides, but also FPG, fructosamine, and A1C levels significantly in T2DM patients with hyperlipidemia [70]. Different mechanisms of glucose lowering have been suggested with bezafibrate: nonselective activation of PPAR-γ, improving insulin sensitivity, and enhancing glucose disposal in adipose tissue and skeletal muscles [71]. Furthermore, bezafibrate treatment was associated with decreased incidence of diabetes in patients with IFG and in obese non-diabetic patients with normal glycemic levels [72,73]. In a posthoc analysis of the Bezafibrate Infarction Prevention study, 303 patients with IFG received either 400 mg of bezafibrate daily or placebo [73]. Over a mean follow-up of 6.2 years, development of diabetes was less prevalent (54.4% vs 42.3%, relative risk reduction of 22%) and delayed (mean 10 months) in the bezafibrate group compared to placebo. Multivariate analysis identified bezafibrate as an independent predictor of decreased risk of new diabetes development, regardless of BMI and lipid profile.
Surgery
Over the past decade, bariatric surgery has become one of the most effective interventions for inducing and sustaining weight reduction in severely obese patients, leading to a significant benefit in diabetes prevention or remission. The Swedish Obese Subject Study is a large ongoing prospective nonrandomized cohort study that between 1987 and 2001 enrolled 4047 nondiabetic obese participants who underwent gastric surgery or were matched obese control, with diabetes incidence measured at 2, 10 and 15 years [74–76]. At 15 years, analysis of the available cohort of the initial group showed that T2DM developed in 392 of 1658 control participants and in 110 of 1771 bariatric-surgery participants, corresponding to incidence rates of 28.4 and 6.8 cases per 1000 person-years, respectively (P < 0.001). The treatment effects on the incidence of T2DM were at least as strong after 2 years and 10 years of follow-up as after 15 years. This effect was most prominent among the 591 patients who had IFG at baseline, with a number needed to treat as low as 1.3. The surgery group maintained an average 20-kg weight loss at 15 years.
In another study of the effects of bariatric surgery, 150 of 152 obese participants with IGT who underwent gastric bypass achieved and maintained a normal glycemic profile at 14 years of follow-up [77]. Similarly, in a follow-up of 136 obese participants with IGT, 109 of whom underwent bariatric surgery, 1 participant in the surgical group developed diabetes, as compared with 6 out of 27 in the control group [78]. In a meta-analysis including studies involving 22,094 patients who underwent bariatric surgery, 76.8% had complete resolution of their diabetes [79]. The rapid improvement of glycemic profile after bariatric surgery is thought to be due to oral intake restriction as well as acute hormonal changes related to the exclusion of the upper gastrointestinal tract (eg, incretin and ghrelin levels variations) [80].
Conclusions and Recommendations
The natural history of T2DM allows identification of patients at risk for diabetes and implementation of prevention strategies, which seems to be a public health need given the alarming increase in diabetes incidence. Indeed, the onset of T2DM is typically preceded by many years of beta cell dysfunction translating into carbohydrate metabolism abnormalities such as IFG and IGT, providing an excellent window of opportunity to identify persons at risk and prevent progression to diabetes. Numerous randomized controlled trials established lifestyle modifications, including dietary changes, moderate weight loss, and moderate intensity physical activity, as safe and effective interventions to prevent diabetes. This protective effect has been consistently shown to be sustained for more than 10 years after the initial intervention. Pharmacologic agents such as metformin, thiazolidinediones, alpha-glucosidase inhibitors, xenical, liraglutide, and insulin have also been associated with diabetes prevention in patients at risk. However, except for metformin, safety concerns or lack of durable efficacy or tolerability seem to outweigh their potential diabetes prevention benefit.
Given their favorable glycemic effect, RAS blockade and fibrates should be considered, when indicated, as reasonable treatment options for hypertension and hyperlipidemia in prediabetic patients. Bariatric surgery has been associated with a dramatic reduction in diabetes incidence in obese prediabetic patients and can be considered an alternative prevention measure in patients with severe obesity and prediabetes.
The recently updated ADA guidelines recommend referring patients with prediabetes to an intensive diet and physical activity behavioral counseling program; diet and activity goals should adhere to the tenets of the DPP, with a loss of 7% of body weight and at least 150 minutes of moderate physical activity (eg, brisk walking) per week [8]. Metformin therapy for diabetes prevention should be considered in patients with prediabetes, especially in those with BMI greater than 35 kg/m2, those younger than 60 years of age, women with history of gestational diabetes, and/or those with rapidly rising A1C despite lifestyle modifications. Monitoring for development of diabetes, at least annually, and screening for and treatment of modifiable cardiovascular risk factors are suggested in patients with prediabetes [8].
Many lessons have been learned through the studies of diabetes prevention interventions. The challenge that remains is how to apply these interventions, especially the lifestyle modifications, in real world medical practice, at both the individual and public health level.
Corresponding author: Jocelyne Karam, MD, 4802 10th Avenue, Brooklyn, NY 11219, [email protected].
Financial disclosures: None reported.
1. International Diabetes Federation. Diabetes facts and figures. www.idf.org/about-diabetes/facts-figures. Accessed on January 29, 2017.
2. Centers for Disease Control and Prevention. National diabetes statistics report, 2014. www.cdc.gov/diabetes/pubs/statsreport14/national-diabetes-report-web.pdf. Accessed on January 29, 2017.
3. Centers for Disease Control and Prevention. Number of Americans with diabetes projected to double or triple by 2050. www.cdc.gov/media/pressrel/2010/r101022.html. Accessed on January 29, 2017.
4. World Health Organization (WHO). Diabetes fact sheet. No. 312. November 2016. www.who.int/mediacentre/factsheets/fs312/en/. Accessed on January 29, 2017.
5. Karam JG, McFarlane SI. Update on the prevention of type 2 diabetes. Curr Diab Rep 2011;11:56–63.
6. Menke A, Rust KF, Fradkin J, et al. Associations between trends in race/ethnicity, aging, and body mass index with diabetes prevalence in the United States: a series of cross-sectional studies. Ann Intern Med 2014;161:328–85.
7. Ford ES, Li C, Sattar N . Metabolic syndrome and incident diabetes: current state of the evidence. Diabetes Care 2008;31:1898–904.
8. American Diabetes Association. Standards of medical care in diabetes—2017. Diabetes Care 2017;40(Suppl. 1).
9. Kruszynska YT, Olefsky JM. Cellular and molecular mechanisms of non-insulin dependent diabetes mellitus. J Investig Med 1996;44:413–28..
10. Butler AE, Janson J, Bonner-Weir S, et al. Beta-cell deficit and increased beta-cell apoptosis in humans with type 2 diabetes. Diabetes 2003;52:102–10.
11. Definition and diagnosis of diabetes mellitus and intermediate hyperglycemia. Report of a WHO and IDF Consultation. 2006. http://apps.who.int/iris/bitstream/10665/
43588/1/9241594934_eng.pdf. Accessed on February 1, 2017.
12. Mokdad AH, Ford ES, Bowman BA, et al. Prevalence of obesity, diabetes, and obesity-related health risk factors. 2001 JAMA 2003;289:76–9.
13. Glucose tolerance and mortality: comparison of WHO and American Diabetes Association diagnostic criteria. The DECODE study group. European Diabetes Epidemiology Group. Diabetes Epidemiology: Collaborative analysis Of Diagnostic criteria in Europe. Lancet 1999;354:617–21.
14. Barr EL, Zimmet PZ, Welborn TA, et al. Risk of cardiovascular and all-cause mortality in individuals with diabetes mellitus, impaired fasting glucose, and impaired glucose tolerance: the Australian Diabetes, Obesity, and Lifestyle Study (AusDiab). Circulation 2007;116:151–7.
15. Xu T, Liu W, Cai X, et al. Risk of coronary heart disease in different criterion of impaired fasting glucose: a meta-analysis. Medicine 2015;94:e1740.
16. Huang Y, Cai X, Mai W, et al. Association between prediabetes and risk of cardiovascular disease and all cause mortality: systematic review and meta-analysis. BMJ 2016;355:i5953.
17. Nagi DK, Pettitt DJ, Bennett PH, et al. Diabetic retinopathy assessed by fundus photography in Pima Indians with impaired glucose tolerance and NIDDM. Diabet Med 1997;14:449 –56.
18. Diabetes Prevention Program Research Group. The prevalence of retinopathy in impaired glucose tolerance and recent-onset diabetes in the Diabetes Prevention Program. Diabet Med 2007;24:137–44
19. Putz Z, Tabák AG, Tóth N, et al. Noninvasive evaluation of neural impairment in subjects with impaired glucose tolerance. Diabetes Care 2009;32:181–3.
20. Hoffman-Snyder C, Smith BE, Ross MA, et al. Value of the oral glucose tolerance test in the evaluation of chronic idiopathic axonal polyneuropathy. Arch Neurol 2006;63:1075–9.
21. Plantinga LC, Crews DC, Coresh J, et al; CDC CKD Surveillance Team. Prevalence of chronic kidney disease in US adults with undiagnosed diabetes or prediabetes. Clin J Am Soc Nephrol 2010;5:673–82.
22. Pan XR, Li GW, Hu YH, et al. Effects of diet and exercise in preventing NIDDM in people with impaired glucose tolerance. The Da Qing IGT and Diabetes Study. Diabetes Care 1997;20:537–44.
23. Tuomilehto J, Lindstrom J, Eriksson JG, et al. Prevention of type 2 diabetes mellitus by changes in lifestyle among subjects with impaired glucose tolerance. N Engl J Med 2001;344:1343–50.
24. Knowler WC, Barrett-Connor E, Fowler SE, et al. Reduction in the incidence of type 2 diabetes with lifestyle intervention or metformin. N Engl J Med 2002;346:393–403.
25. Kosaka K, Noda M, Kuzuya T. Prevention of type 2 diabetes by lifestyle intervention: a Japanese trial in IGT males. Diabetes Res Clin Pract 2005;67:152–62.
26. Ramachandran A, Snehalatha C, Mary S, et al; Indian Diabetes Prevention Programme (IDPP).The Indian Diabetes Prevention Programme shows that lifestyle modification and metformin prevent type 2 diabetes in Asian Indian subjects with impaired glucose tolerance (IDPP-1). Diabetologia 2006;49:289–97.
27. Saito T, Watanabe M, Nishida J, et al; Zensharen Study for Prevention of Lifestyle Diseases Group. Lifestyle modification and prevention of type 2 diabetes in overweight Japanese with impaired fasting glucose levels: a randomized controlled trial. Arch Intern Med 2011;171:1352–60.
28. Li G, Zhang P, Wang J, et al. The long-term effect of lifestyle interventions to prevent diabetes in the China Da Qing Diabetes Prevention Study: a 20-year follow-up study. Lancet 2008;371:1783–9.
29. Li G, Zhang P, Wang J, et al. Cardiovascular mortality, all-cause mortality, and diabetes incidence after lifestyle intervention for people with impaired glucose tolerance in the Da Qing Diabetes Prevention Study: a 23-year follow-up study. Lancet Diabetes Endocrinol 2014;2:474–80.
30. Li G, Zhang P, Wang J, et al. Cardiovascular mortality, all-cause mortality, and diabetes incidence after lifestyle intervention for people with impaired glucose tolerance in the Da Qing Diabetes Prevention Study: a 23-year follow-up study. Lancet Diabetes Endocrinol 2014;2:474–80.
31. Lindstrom J, Ilanne-Parikka P, Peltonen M, et al. Sustained reduction in the incidence of type 2 diabetes by lifestyle intervention: follow-up of the Finnish Diabetes Prevention Study. Lancet 2006;368:673–9.
32. Diabetes Prevention Research Group, Knowler WC, Fowler SE, et al. 10-year follow-up of diabetes incidence and weight loss in the Diabetes Prevention Program Outcomes Study. Lancet 2009;374:1677–86.
33. Salas-Salvadó J, Bulló M, Babio N, et al. Reduction in the incidence of type 2 diabetes with the Mediterranean diet: results of the PREDIMED-Reus nutrition intervention randomized trial. Diabetes Care 2011;34:14–19.
34. Wang P, Fang J, Gao Z, et al. Higher intake of fruits, vegetables or their fiber reduces the risk of type 2 diabetes: A meta‐analysis. J Diabetes Investig 2016;7:56–69.
35. Devlin JT. Effects of exercise on insulin sensitivity in humans. Diabetes Care 1992;15:1690–3.
36. Jeon CY, Lokken RP, Hu FB, van Dam RM. Physical activity of moderate intensity and risk of type 2 diabetes: a systematic review. Diabetes Care 2007;30:744–52.
37. Slentz C, Bateman L, Willis L, et al. Effects of exercise training alone vs a combined exercise and nutritional lifestyle intervention on glucose homeostasis in prediabetic individuals: a randomised controlled trial. Diabetologia 2016;59:2088–98.
38. Hamman RF, Wing RR, Edelstein SL, et al. Effect of weight loss with lifestyle intervention on risk of diabetes. Diabetes Care. 2006;29:2102–7.
39. Kirpichnikov D, McFarlane SI, Sowers JR. Metformin: an update. Ann Intern Med 2002;137:25–33.
40. Ratner RE, Christophi CA, Metzger BE, et al. Prevention of diabetes in women with a history of gestational diabetes: effects of metformin and lifestyle interventions. J Clin Endocrinol Metab 2008;93:4774–9.
41. Diabetes Prevention Program Research Group. Effects of withdrawal from metformin on the development of diabetes in the diabetes prevention program. Diabetes Care 2003;26:977–80.
42. Salpeter SR, Buckley NS, Kahn JA, Salpeter EE. Meta-analysis: metformin treatment in persons at risk for diabetes mellitus. Am J Med 2008;121:149–57.
43. El-Atat F, Nicasio J, Clarke L, et al. Beneficial cardiovascular effects of thiazolidinediones. Therapy 2005;2:113–19.
44. Buchanan TA, Xiang AH, Peters RK, et al. Preservation of pancreatic beta-cell function and prevention of type 2 diabetes by pharmacological treatment of insulin resistance in high-risk hispanic women. Diabetes 2002;51:2796–2803.
45. Azen SP, Peters RK, Berkowitz K. TRIPOD (Troglitazone In the Prevention Of Diabtes): a randomized placebo-controlled study of troglitazone in women with prior gestational diabetes mellitus. Control Clin Trials 1998;19:217–31.
46. Gerstein HC, Yusuf S, Bosch J, et al. Effect of rosiglitazone on the frequency of diabetes in patients with impaired glucose tolerance or impaired fasting glucose: a randomised controlled trial. Lancet 2006;368:1096–1105.
47. DREAM Investigators, Gerstein HC, Mohan V, Avezum A, et al. Long-term effect of rosiglitazone and/or ramipril on the incidence of diabetes. Diabetologia 2011;54:487–95.
48. DeFronzo RA, Tripathy D, Schwenke DC, et al. Pioglitazone for diabetes prevention in impaired glucose tolerance. N Engl J Med 2011;364:1104–15.
49. Ramachandran A, Snehalatha C, Mary S, et al. Pioglitazone does not enhance the effectiveness of lifestyle modification in preventing conversion of impaired glucose tolerance to diabetes in Asian Indians: results of the Indian Diabetes Prevention Programme-2 (IDPP-2). Diabetologia 2009;52:1019–26.
50 Zinman B, Harris SB, Neuman J, et al. Low-dose combination therapy with rosiglitazone and metformin to prevent type 2 diabetes mellitus (CANOE trial): a double-blind randomised controlled study. Lancet 2010;376:103–11.
51. Chiasson JL, Josse RG, Leiter LA, et al. The effect of acarbose on insulin sensitivity in subjects with impaired glucose tolerance. Diabetes Care 1996;19:1190–3.
52. Van de Laar FA, Lucassen PL, Akkermans RP, et al. Alpha-glucosidase inhibitors for people with impaired glucose tolerance or impaired fasting blood glucose. Cochrane Database Syst Rev 2006(4):CD005061.
53. Chiasson JL, Josse RG, Gomis R, et al. Acarbose for prevention of type 2 diabetes mellitus: the STOP-NIDDM randomised trial. Lancet 2002;359:2072–7.
54. Kawamori R, Tajima N, Iwamoto Y, et al. Voglibose for prevention of type 2 diabetes mellitus: a randomised, double-blind trial in Japanese individuals with impaired glucose tolerance. Lancet 2009;373:1607–14.
55. Holman RR, North BV, Tunbridge FK. Possible prevention of type 2 diabetes with acarbose or metformin. Diabetes 2000;49:Suppl 1:A111.
56. Holman RR, Blackwell L, Stratton IM et al. Six-year results from the Early Diabetes Intervention Trial. Diabet Med 2003;20(Suppl 2):15.
57. Holman RR, Haffner SM, McMurray JJ, et al. Effect of nateglinide on the incidence of diabetes and cardiovascular events. N Engl J Med 2010;362:1463–76.
58. Pi-Sunyer X, Astrup A, Fujioka K et al. A randomized, controlled trial of 3.0 mg of liraglutide in weight management. N Engl J Med 2015;373:11–22.
59. ORIGIN Trial Investigators, Gerstein HC, Bosch J, et al. Basal insulin and cardiovascular and other outcomes in dysglycemia. N Engl J Med 2012;367:319–28.
60. Yusuf S, Gerstein H, Hoogwerf B, et al. Ramipril and the development of diabetes. JAMA 2001;286:1882–5.
61. Hansson L, Lindholm LH, Niskanen L, et al. Effect of angiotensin-converting-enzyme inhibition compared with conventional therapy on cardiovascular morbidity and mortality in hypertension: the Captopril Prevention Project (CAPPP) randomised trial. Lancet 1999;353:611–6.
62. Major outcomes in high-risk hypertensive patients randomized to angiotensin-converting enzyme inhibitor or calcium channel blocker vs diuretic: The Antihypertensive and Lipid-Lowering Treatment to Prevent Heart Attack Trial (ALLHAT). JAMA 2002;288:2981–97.
63. Lindholm LH, Ibsen H, Dahlof B, et al. Cardiovascular morbidity and mortality in patients with diabetes in the Losartan Intervention For Endpoint reduction in hypertension study (LIFE): a randomised trial against atenolol. Lancet 2002;359:1004–10.
64. Gillespie EL, White CM, Kardas M, et al. The impact of ACE inhibitors or angiotensin II type 1 receptor blockers on the development of new-onset type 2 diabetes. Diabetes Care 2005;28:2261–6.
65. Bosch J, Yusuf S, Gerstein HC, et al. Effect of ramipril on the incidence of diabetes. N Engl J Med 2006;355:1551–62.
66. McMurray JJ, Holman RR, Haffner SM, et al. Effect of valsartan on the incidence of diabetes and cardiovascular events. N Engl J Med 2010;362:1477–90.
67. McFarlane SI, Kumar A, Sowers JR. Mechanisms by which angiotensin-converting enzyme inhibitors prevent diabetes and cardiovascular disease. Am J Cardiol 2003;91(12A):30H–37H.
68. Heymsfield SB, Segal KR, Hauptman J, et al. Effects of weight loss with orlistat on glucose tolerance and progression to type 2 diabetes in obese adults. Arch Intern Med 2000;160:1321–6.
69. Torgerson JS, Hauptman J, Boldrin MN, Sjostrom L. XENical in the prevention of diabetes in obese subjects (XENDOS) study: a randomized study of orlistat as an adjunct to lifestyle changes for the prevention of type 2 diabetes in obese patients. Diabetes Care 2004;27:155–61.
70. Rovellini A, Sommariva D, Branchi A, et al. Effects of slow release bezafibrate on the lipid pattern and on blood glucose of type 2 diabetic patients with hyperlipidaemia. Pharmacol Res 1992;25:237–45.
71. Tenenbaum A, Motro M, Fisman EZ. Dual and pan-peroxisome proliferator-activated receptors (PPAR) co-agonism: the bezafibrate lessons. Cardiovasc Diabetol 2005;4:14.
72. Tenenbaum A, Motro M, Fisman EZ, et al. Effect of bezafibrate on incidence of type 2 diabetes mellitus in obese patients. Eur Heart J 2005;26:2032–8.
73. Tenenbaum A, Motro M, Fisman EZ, et al. Peroxisome proliferator-activated receptor ligand bezafibrate for prevention of type 2 diabetes mellitus in patients with coronary artery disease. Circulation 2004;109:2197–202.
74. Sjostrom L, Lindroos AK, Peltonen M, et al. Lifestyle, diabetes, and cardiovascular risk factors 10 years after bariatric surgery. N Engl J Med 2004;351:2683–93.
75. Sjostrom CD. Surgery as an intervention for obesity. Results from the Swedish obese subjects study. Growth Horm IGF Res 2003;13 Suppl A:S22–26.
76. Carlsson LM, Peltonen M, Ahlin S, et al. Bariatric surgery and prevention of type 2 diabetes in Swedish obese subjects. N Engl J Med 2012;367:695–704.
77. Pories WJ, Swanson MS, MacDonald KG, et al. Who would have thought it? An operation proves to be the most effective therapy for adult-onset diabetes mellitus. Ann Surg 1995;222:339–50.
78. Long SD, O’Brien K, MacDonald KG Jr, et al. Weight loss in severely obese subjects prevents the progression of impaired glucose tolerance to type II diabetes. A longitudinal interventional study. Diabetes Care 1994;17:372–5.
79. Buchwald H, Avidor Y, Braunwald E, et al. Bariatric surgery: a systematic review and meta-analysis. JAMA 2004;292:1724–37.
80. Tejirian T, Jensen C, Dutson E. Bariatric surgery and type 2 diabetes mellitus: surgically induced remission. J Diabetes Sci Technol 2008;2:685–91.
From the Maimonides Medical Center (Dr. Karam) and the SUNY Downstate Medical Center (Dr. Karam and Dr. McFarlane), Brooklyn, NY.
Abstract
- Objective. To discuss the epidemic of diabetes highlighting the natural history of the disease and the major clinical trials aimed at diabetes prevention in different prediabetic populations around the world.
- Results. Diabetes prevention studies have evaluated various interventions including lifestyle modifications, metformin, alpha-glucosidase inhibitors, thiazolidinediones, nateglinide, and xenical as well as the renin-angiotensin aldosterone system (RAS) inhibitors. Lifestyle modifications seem to be the safest, most effective, and most sustainable intervention to prevent diabetes. Except for metformin, the potential diabetes prevention benefits of the studied pharmacologic agents are limited by safety concerns or lack of durable efficacy or tolerability. RAS blockade and fibrates have a favorable glycemic effect, and, when indicated, are reasonable treatment options for hypertension and hyperlipidemia in prediabetic patients.
- Conclusion. As recommended by American Diabetes Association guidelines, patients with prediabetes should be referred to an intensive diet and physical activity behavioral counseling program; diet and activity goals include a loss of 7% of body weight and at least 150 minutes of moderate physical activity per week. Metformin therapy for diabetes prevention should be considered as well.
Key words: prediabetes; type 2 diabetes mellitus, diabetes prevention, lifestyle modifications.
Diabetes mellitus has reached pandemic proportions across the globe. The International Diabetes Federation (IDF) estimates that in 2015 around 415 million people, or 1 in 11 adults, had diabetes, compared to 285 million in 2010, with 5 million deaths, or 1 death every 6 seconds, occurring because of diabetes or diabetes complications [1]. In the United States, an estimated 29.1 million Americans, or 9.3% of the population, have diabetes, 27.8% of them undiagnosed [2]. The prevalence of diabetes increases significantly with age, affecting around 16.2% of American adults aged 45 to 64 years and 25.9% of adults aged 65 years or older [2]. The Centers for Disease Control and Prevention (CDC) estimates that, with current trends, as many as 1 in 3 American adults could have diabetes by 2050 [3].
Type 2 diabetes mellitus (T2DM) accounts for the majority of prevalent and newly diagnosed diabetes in the world, and is strongly linked to overweight and inactivity in adults [4]. T2DM is increasingly being diagnosed in pediatric patients, in whom type 1 diabetes has historically been predominant; it now accounts for approximately 30% of newly diagnosed diabetes in children aged 10 to 19 years, exceeding 50% in certain ethnicities such as non-Hispanic black and American Indian/Alaska Native children [2].
These alarming trends have spurred significant research and public efforts aimed at reducing the prevalence of diabetes by preventing T2DM. Indeed, insulin resistance and abnormal carbohydrate metabolism progress over many years prior to the diagnosis of diabetes and manifest with different clinical and biochemical features. Both the pathophysiology and the natural history of T2DM offer clinicians an opportunity to identify patients at risk for developing the disease and to implement prevention strategies. This article outlines the risk factors and diagnostic criteria for prediabetes, describes the studies that have explored diabetes prevention through lifestyle changes, pharmacotherapy, or surgery, and reviews recommendations for managing patients at risk.
Risk Factors and Screening for T2DM
The American Diabetes Association (ADA) recommends screening all adults for prediabetes by assessing for diabetes risk factors [8]. Glucose testing is recommended in individuals aged 45 years or older, and should be considered in adults of any age who are overweight or obese (body mass index [BMI] ≥ 25 kg/m2 or ≥ 23 kg/m2 in Asian Americans) and have 1 or more additional risk factors for diabetes. Testing also should be considered in children and adolescents who are overweight or obese and who have 2 or more additional risk factors. If tests are normal, repeat testing carried out at a minimum of 3-year intervals is suggested [8].
Prediabetes
Abnormalities in glucose metabolism progress along a continuum through various stages before T2DM develops. Years before the development of overt diabetes, and especially in the presence of excessive visceral fat, cellular sensitivity to insulin gradually decreases, leading to a compensatory increased insulin secretion [9]. With time, and under continuous increased demand, pancreatic beta cell function declines and ultimately fails to overcome insulin resistance and maintain a normal glucose metabolism, resulting in prediabetes followed by the development of diabetes. This early beta cell dysfunction was illustrated by the decreased beta cell volume observed on autopsy of obese patients with IFG or T2DM, when compared to obese individuals with normal glucose tolerance [10]. It is estimated that around 40% to 70% of beta cell function is already lost by the time diabetes is clinically diagnosed. This relatively slow pathophysiologic process allows the identification of at-risk patients well before their blood glucose levels reach the diabetic diagnostic thresholds, and therefore presents an opportunity for prevention.
Diagnostic Criteria
The ADA guidelines released in 2003 define prediabetes as IFG (fasting blood glucose [FBG] levels of 100–125 mg/dL), IGT (glucose levels of 140–199 mg/dL at 2 hours during an oral glucose tolerance test [OGTT] following an oral load of 75 g of dextrose), or both. Additionally, hemoglobin A1C (A1C) was introduced as a diagnostic tool for prediabetes in 2010, with values between 5.7% and 6.4% indicating prediabetes [8]. Most of these thresholds were chosen due to their association with increased rates of complications, notably retinopathy and cardiovascular disease.
A combined report from the World Health Organization (WHO) and the IDF published in 2006 defined intermediate hyperglycemia as IFG, but with a higher cutoff for FBG (110–125 mg/dL) than the ADA’s definition, and/or IGT (2-hour OGTT glucose level of 140–199 mg/dL) [11]. The rationale for a higher cut-point for IFG is the concern about the increased prevalence of IFG and its impact on individuals and health systems and the more favorable cardiovascular risk profile and decreased risk of progression to diabetes in the group of patients with FBG of 100 to 110 mg/dL when compared to the group with FBG of 110 to 125 mg/dL. The report does not recommend the use of A1C in the diagnosis of diabetes or intermediate hyperglycemia because of a lack of global consistency and the potential for other factors that can be prevalent in some developing countries, such as hemoglobinopathies and anemia, to interfere with the assay.
Prevalence and Progression to Diabetes
According to CDC data from 2014, up to 86 million American adults, more than 1 in 3, have prediabetes, and 9 out of 10 of these individuals are undiagnosed [2]. It is estimated that approximately 25% of people diagnosed with either IFG or IGT progress to diabetes mellitus over a 3- to 5-year period [12]. If observed for longer periods, most prediabetic persons will probably develop diabetes. The highest rate of progression to diabetes is observed in patients with both IFG and IGT, older age, overweight, or other diabetic risk factors.
Complications
In addition to increasing the risk for progression to diabetes, prediabetes is independently associated with microvascular and macrovascular complications and increased risk of death, prior to the actual onset of diabetes. The DECODE study demonstrated significantly increased mortality in 2766 individuals with IGT after 7 years of follow-up, when compared to normoglycemic patients; this effect was more prominent in participants with IGT than in participants with IFG [13]. In the Australian Diabetes, Obesity and Lifestyle Study, IFG was found to be an independent predictor for cardiovascular mortality after adjustment for age, sex, and other traditional cardiovascular risk factors [14].
Similarly, a recent meta-analysis demonstrated that the presence of IFG was significantly associated with future risk for coronary heart disease (CHD), with the risk increase starting when fasting plasma glucose was as low as 100 mg/dL; however, this finding may have been confounded by the presence of undetected IGT or other cardiovascular risk factors [15]. Another recent systematic review of 53 prospective cohort studies with 1,611,339 participants showed that prediabetes (IFG or IGT) was associated with an increased risk of composite cardiovascular disease, CHD, stroke, and all-cause mortality [16].
The association between retinopathy and prediabetes has been described in multiple reports and this association has helped guide authors on selected thresholds for diagnosis of prediabetes. For example, in 1 study, the incidence of retinopathy in individuals with IGT was 12% among Pima Indians [17]. Similarly, in a follow-up study of the Diabetes Prevention Program, 8% of prediabetic participants who remained nondiabetics had evidence of retinopathy [18].
Neuropathy also has been observed in prediabetes. A noninvasive neurologic evaluation of individuals with IGT revealed subclinical neural dysfunction suggestive of cardiovascular autonomic neuropathy [19]. At the clinical level, a study that evaluated 100 patients with chronic idiopathic axonal neuropathy of unknown etiology found IFG in 36 and IGT in 38 patients, underscoring the role of abnormal glucose metabolism in these patients [20].
Nephropathy may also be more prevalent in those with prediabetes. In a 1999–2006 National Health and Nutrition Examination Survey analysis, the adjusted prevalence of chronic kidney disease, defined by estimated glomerular filtration rate (eGFR) of 15 to 59 mL/min per 1.73 m2 or albumin-creatinine ratio ≥ 30 mg/g, was 17.1% in individuals with IFG, compared to 11.8% in individuals with normal fasting glucose [21].
Lifestyle Modifications
The alarming rapid increase in the prevalence of T2DM has been linked to a parallel rising epidemic of overweight, obesity, and lack of physical activity. Therefore, lifestyle changes aiming at weight reduction seemed to be a natural individual and public health strategy to prevent diabetes, and such strategies have been the focus of many randomized controlled trials around the world. As anticipated, weight loss, exercise, and diet have all been shown, separately or in combination, to be effective in decreasing the incidence of T2DM in high-risk patients [22–27]. Furthermore, and well beyond the benefit observed during the trials, follow-up studies revealed a sustained reduction of diabetes incidence in intervention groups several years after cessation of the intervention [28–32] (Table 2).
The Da Quing Diabetes Prevention Study (DQDPS), published in 1997, is one of the earliest prospective diabetes prevention trials [22]. This 6-year study conducted in 33 clinics in China from 1986 through 1992 included 577 participants with IGT who were randomly assigned to 1 of 4 groups: (1) diet (high vegetables, low sugar/alcohol) only, (2) exercise, (3) diet plus exercise, and (4) standard of care. At 6 years, diabetes incidence was significantly reduced by 46% in the exercise group, 31% in the diet group, and 42% in the diet plus exercise group compared to standard care. In 2006, 14 years after the end of the trial and 20 years after the initial enrollment, the cumulative incidence of diabetes was significantly lower in the intervention group at 80%, compared to 93% in the control group, and the annual incidence of diabetes was 7% and 11%, respectively, with a 43% lower incidence of diabetes over the 20-year period in the combination lifestyle changes group [28]. The preventive benefit of lifestyle changes persisted 2 decades after the initial randomization despite the standardization of treatment for all groups over the 14 years following the study, suggesting a strong and longitudinal preventive effect of the initial lifestyle modifications. In a follow-up study of the DQDPS conducted in 2009, at 23 years of follow-up, the cumulative incidences of cardiovascular mortality and all-cause mortality were significantly lower in the intervention group (11.9% versus 19.6%, and 28.1% versus 38.4%, respectively), highlighting the long-term clinical benefits of lifestyle intervention in patients with IGT [29].
Similarly, the Finnish Diabetes Prevention Study (FDPS), published in 2001, enrolled 522 middle-aged overweight participants with IGT [23]. The participants randomly assigned to the intervention group received individualized counseling designed to reduce weight, decrease total intake of fat and saturated fat, increase intake of fiber, and increase physical activity. The control group received standard therapy. At 4 years of follow-up, the cumulative incidence of diabetes was 11% in the intervention group and 23% in the control group, with a statistically significant 58% reduction in risk for progression to diabetes. A follow-up of the FDPS was published in 2006 [31]. Participants who did not progress to diabetes in the initial 4-year study were further followed for a median of 3 years. Interestingly, lifestyle changes were maintained by the intervention group participants despite the cessation of the individual counseling, leading to a 36% relative reduction in diabetes incidence during the post-intervention follow-up period alone (4.6 vs 7.2 per 100 person-years, P = 0.041) and a 43% cumulative diabetes incidence reduction over the 7-year follow-up, demonstrating, one more time, the sustained efficacy of lifestyle changes.
In the United States, the Diabetes Prevention Program (DPP) trial is a landmark NIH-sponsored multicenter randomized controlled trial published in 2002, and one of the largest diabetes prevention studies with lifestyle changes to date [24]. A total of 3234 participants with prediabetes, defined as an IFG or IGT, were randomly assigned to an intensive lifestyle modification program, metformin 850 mg twice daily, or matching placebo. Lifestyle changes included a low-fat (< 25% of caloric intake), 1200- to 1800-calorie diet and exercise for 150 minutes a week, with a 7% body weight reduction goal and a very well structured curriculum and professional support group. The study was discontinued early (at 3 years) as the data demonstrated the superiority of lifestyle changes, with a 58% reduction in diabetes incidence in the lifestyle intervention group and a 31% reduction in the metformin group when compared to placebo (cumulative incidence of diabetes at 3 years of 28.9%, 21.7 %, and 14.4% in the placebo, metformin, and lifestyle intervention groups, respectively). Lifestyle changes were significantly more effective than metformin and were consistently effective in men and women across age, BMI, and ethnic groups.
The DPPOS (DPP Outcome Study) was a 10-year follow-up of the DPP study published in 2009 where all participants were offered group-implemented lifestyle changes and were followed for an additional 5.7 years [32]. Unlike the Finnish follow-up study, diabetes incidence was similar in the 3 treatment groups in the follow-up period. However, the cumulative incidence of diabetes remained significantly the lowest in the original lifestyle group, with a 34% cumulative risk reduction in the lifestyle group and an 18% reduction in the metformin group at 10 years when compared to placebo. Interestingly, unlike most other studies of weight-reducing interventions, in the DPPOS, patients in the lifestyle changes and metformin groups maintained weight loss at 10 years’ follow-up.
In Japan, a diabetes prevention study assigned 458 male participants with IGT to a standard intervention group or an intensive intervention group receiving detailed lifestyle modification counseling every 3 to 4 months during hospital visits [25]. The cumulative 4-year incidence of diabetes was 9.3% in the control group versus 3.0% in the intervention group, and the reduction in diabetes risk was 67.4% (P < 0.001), with body weight reductions of 0.39 kg and 2.18 kg, respectively (P < 0.001). Of note, participants with higher FBG at baseline developed diabetes at a higher rate than those with lower values. This study suggested that lifestyle change counseling conducted in an outpatient clinic setting can be very effective in preventing diabetes.
Indian adults are thought to be more insulin resistant at a younger age and at a lower BMI than Caucasians. To assess whether the DPP findings can be replicated in an Indian population, the Indian Diabetes Prevention Program (IDPP) trial randomized a total of 531 participants with IGT to 4 groups: control, lifestyle modification, metformin, and lifestyle modifications with metformin [26]. The 3-year cumulative incidences of diabetes were 55.0%, 39.3%, 40.5%, and 39.5%, respectively, showing again a significant relative reduction in progression to diabetes of 28.5% with lifestyle changes, 26.4% with metformin, and 28.2% with both lifestyle changes and metformin, as compared with the control group.
In a Japanese unmasked, multicenter, randomized controlled trial published in 2011, 641 overweight adults with IFG were randomized to a frequent intervention group, receiving individual counseling and support for lifestyle modifications 9 times over 36 months, or a control group, receiving counseling 4 times over the same period. The 3-year cumulative incidence of T2DM was significantly lower in the frequent intervention group than in the control group (12.2% vs 16.6%) [27]. Interestingly, in a posthoc subgroup analysis, the protective effect was more prominent in patients with underlying associated IGT or elevated A1C, but was not observed in patients with isolated IFG, suggesting a possible prognostic value of an additional A1C or oral glucose tolerance test in individuals with IFG.
Diet
The diet followed in the major diabetes prevention trials discussed above has typically been a weight-reducing diet with decreased fat intake (eg, DPP, Finnish trial) and increased fiber intake (eg, Da Quing, DPP, Finnish trials). However, there has been more emphasis recently on the importance of the quality rather than the quantity of fats in preventing diabetes. For example, in a Spanish study, a non–calorie-restricted traditional Mediterranean diet, enriched with high-fat foods of vegetable origin (olive oil, nuts) decreased the incidence of diabetes by 52% in individuals at high cardiovascular risk after a median follow-up of 4.0 years, and in the absence of significant changes in body weight or physical activity among the groups [33]. These findings were reproduced by other studies. A recent meta-analysis examining the relation between intake of fruits and vegetables and the incidence of diabetes revealed that higher intake of fruit, especially berries, and green, leafy vegetables, yellow vegetables, cruciferous vegetables, or their fiber is associated with a lower risk of T2DM [34].
Exercise
Exercise is thought to improve insulin sensitivity and promote peripheral glucose uptake in normal individuals. Long-term moderate exercise, similar to the exercise recommended in DPP and FDPS, results in increased translocation of insulin-responsive glucose transporter (GLUT-4) from intracellular stores to the cell surface, facilitating glucose uptake [35]. A systematic review of 10 prospective cohort studies published in 2007 showed that, after adjustment for BMI, moderate-intensity physical activity was significantly associated with reduced diabetes incidence [36]. In the FDPS, participants who achieved at least 4 hours of exercise per week had a significant 80% decrease in incidence of diabetes, and this effect was observed even in the group that did not lose weight [23]. In the DQDPS, the greatest reduction in diabetes incidence was observed in the exercise group [22].
In a recent NIH-funded trial designed to examine the relative contribution of exercise alone to the overall beneficial effect of lifestyle changes in the DPP study, a total of 237 adults with IFG were randomly assigned to 4 different groups: low-amount moderate intensity exercise (similar to exercise followed in DPP), high-amount moderate intensity exercise, high-amount vigorous intensity exercise, and a combination of diet, weight loss, and low-amount moderate exercise. Only the diet and exercise group experienced a decrease in fasting glucose, whereas similar improvements in glucose tolerance were observed in both the diet and exercise group and the high-amount moderate-intensity exercise group, suggesting that such an exercise regimen may be as effective as a more intensive multicomponent approach involving diet, exercise, and weight loss for preventing diabetes [37].
Weight Loss
Weight reduction in prediabetic individuals has been consistently associated with reduced incidence of diabetes. Furthermore, the amount of weight loss needed to achieve this benefit seems to be relatively modest and a realistic goal to set for patients. Indeed, in the DPP trial, an average weight loss of only 5.6 kg was associated with a 58% lower incidence of diabetes [24]. Moreover, on further analysis of the DPP trial, and among weight, diet, and exercise, diabetes prevention correlated most strongly with weight loss, with an estimated 16% diabetes risk reduction for every single kilogram of weight reduction [38]. Similarly, within the same lifestyle intervention group in the FDPS, the participants who were able to achieve an initial body weight loss greater than 5% at 1 year had a nearly 70% relative risk reduction in progression to diabetes, when compared to their peers in the intervention group who had less or no weight loss [23].
In summary, numerous randomized controlled studies from various populations have proved that lifestyle modifications, including healthy diet, moderate weight loss, and moderate-intensity exercise, represent a very effective strategy to prevent diabetes in patients at risk, mostly patients with IGT, and this protective effect seems to be sustained over time.
Pharmacologic Interventions
Metformin
Metformin is an antidiabetic agent that works mostly at the liver site by suppressing hepatic glucose production and inhibiting production and oxidation of free fatty acids (FFA), thereby reducing FFA-induced insulin resistance and promoting peripheral glucose uptake [39]. This effect has the potential of preserving beta cell function by reducing the demand for insulin secretion.
In the DPP trial, metformin, although generally less effective than lifestyle changes, was associated with a significant 31% reduction in diabetes incidence (cumulative incidence of 22% in metformin group vs 29% in placebo group) and significant weight reduction (average of 2 kg) [24]. Further analysis of the DPP results showed that metformin efficacy, compared to placebo, was greater in patients who were younger, had higher BMI, and had higher FBG levels. In addition, a DPP substudy of 350 women with history of gestational diabetes and IGT revealed that this group of women, who had a higher risk of progression to diabetes (71% at 3 years) when compared to women with no history of gestational diabetes, despite similar baseline glucose levels, had similar diabetes risk reduction of 50% with both metformin and lifestyle changes [40].
In the IDPP study, both lifestyle changes and metformin reduced significantly and similarly the incidence of diabetes in adults with IGT, with no observed added benefit from combining both interventions [26]. It has not been clear, however, how much of this effect of metformin is a result of pharmacologic properties masking hyperglycemia or a true protective and preventive effect. In a washout study in which 1274 DPP participants who did not progress to diabetes underwent an OGTT after 1 to 2 weeks of discontinuing metformin or placebo, the incidence of diabetes was still reduced by 25% in the metformin group, after the washout period, compared to a 31% risk reduction in the primary DPP analysis, suggesting a partially sustained rather than temporary effect of metformin [41]. In the DPPOS long-term follow-up study, metformin (850 mg twice daily as tolerated) was continued in the group initially assigned to metformin in addition to lifestyle counseling [32]. Although the progression to diabetes was similar in all groups during the 5.7-year follow-up period, the cumulative incidence of diabetes at 10 years was still reduced in the metformin group by 18% when compared to control group. Furthermore, the weight loss associated with metformin was also interestingly sustained at 10 years. A meta-analysis echoed this beneficial effect of metformin observed in the DPP trial, reporting a relative risk reduction of new-onset diabetes of 40% with the use of metformin [42].
In summary, metformin has been shown to be effective in preventing diabetes in patients at risk, especially persons with younger age, higher BMI, and history of gestational diabetes and in native Asian Indians. The protective effect of metformin seems to be sustained over the long term in follow-up studies.
Thiazolidinediones
Thiazolidinediones (TZDs) are antidiabetic agents that have been evaluated in diabetes prevention trials. TZDs are peroxisome proliferator-activated gamma receptor (PPAR-γ) agonists that work by augmenting conversion of preadipocytes to adipocytes, which in turn increase adiponectin levels, promoting insulin sensitivity [43]. In addition to their antihyperglycemic properties, TZDs are thought to have a direct protective effect on beta cells, potentially translating into prevention and delay of diabetes [44].
The first study to demonstrate diabetes prevention with a TZD was the TRIPOD study (Troglitazone in Prevention of Diabetes), in which 266 Hispanic women with a history of gestational diabetes were randomly assigned to troglitazone or placebo [45]. Troglitazone use was significantly associated with reduction of progression to diabetes at 1.5-year follow-up when compared to placebo (relative risk reduction of 55%), with a decrease of endogenous insulin requirement at 3 months of therapy and sustained benefit after discontinuation of the TZD, suggesting an effect on beta cell preservation.
Moreover, troglitazone was an investigational drug in the DPP trial from 1996 to 1998, at which time it was discontinued because of associated fatal liver failure in a DPP participant. In the DPP trial, troglitazone was asso-ciated with a remarkable 75% decrease in progression to diabetes at 1 year. Troglitazone was withdrawn from the US market in 2000 because of its association with severe hepatotoxicity.
The international DREAM (Diabetes REduction Assessment with ramipril and rosiglitazone Medications) trial randomly assigned more than 5000 participants with IFG and/or IGT to rosiglitazone, ramipril, or placebo in a 2 × 2 factorial design [46]. In participants receiving rosiglitazone, the risk for progression to diabetes was reduced by 60% and the likelihood of regression to normoglycemia was increased by 71% when compared to placebo. However, the use of rosiglitazone was associated with an increased risk of new-onset congestive heart failure and a mean weight gain of 2.2 kg, thought to reflect increased subcutaneous gluteal fat deposition, with an observed decreased waist-to-hip ratio.
Interestingly, in a passive follow-up of the DREAM study conducted a median 1.6 years after the end of the trial and 4.3 years after randomization, participants treated with rosiglitazone had a 39% lower incidence of diabetes compared to placebo participants, and 17% more of them regressed from prediabetes to normoglycemia [47]. Nonetheless, there was no difference between the 2 groups when the analysis was restricted to the passive follow-up period, suggesting a time-limited exposure to rosiglitazone reduces the longer-term incidence of diabetes by likely delaying but not reversing the underlying disease process.
The third large trial assessing the efficacy of a TZD in preventing diabetes was the Actos Now for the prevention of diabetes (ACT NOW) trial, which was a randomized, double-blinded study that assigned 602 patients with IGT to pioglitazone 45 mg daily or placebo [48]. Over a median follow-up of 2.6 years, pioglitazone was associated with a 72% lower annual rate of progression to diabetes (2.1% compared to 7.6 % in placebo group), and a higher rate of conversion to normal glucose tolerance (48%). In addition, pioglitazone had favorable effects on fasting and 2-hour blood glucose, A1C level, diastolic blood pressure, carotid intima thickness, and HDL cholesterol. As in the DREAM trial, an increased incidence of edema and weight gain was observed with pioglitazone.
Unlike the strong evidence supporting TZDs as an approach to diabetes prevention in the US trials, the Indian Diabetes Prevention Program-2 (IDPP-2) trial, which randomized 497 participants with IGT to lifestyle modifications with pioglitazone versus lifestyle modifications with placebo, did not demonstrate a significant reduction in diabetes at 3 years’ follow-up, suggesting a possible ethnicity-related variation in the effect of the medication [49]. In 2011, the French and German medications regulatory agency withdrew pioglitazone from the market because of a potential increase in incidence of bladder cancer with the cumulative use of more than 28 g of pioglitazone. In the United States, the Food and Drug Administration is performing an extensive review of data and advises against the use of pioglitazone in patients with a history of bladder cancer.
In summary, TZDs demonstrated significant efficacy in preventing diabetes in many patients at risk, but their safety concerns, particularly the associated new onset of congestive heart failure and potential increased risk of bladder cancer, might outweigh this benefit.
Combination Metformin and Thiazolidinediones
As metformin and rosiglitazone both have preventive benefits in diabetes, and rosiglitazone is associated with numerous side effects at a higher dose, a combination of metformin and low-dose rosiglitazone was evaluated in in the CAnadian Normoglycemia Outcomes Evaluation (CANOE) trial [50]. A total of 207 patients with IGT were randomly assigned to receive combination metformin (500 mg twice daily) and rosiglitazone (2 mg daily) versus placebo for a median of 3.9 years. The combination therapy was associated with a 66% relative risk reduction of progression to diabetes.
Alpha-glucosidase Inhibitors
Alpha-glucosidase inhibitors are antidiabetic agents that slow oral carbohydrate intestinal absorption, subsequently improving postprandial hyperglycemia, which can eventually reduce glucose toxicity of pancreatic beta cells. In addition, they have been shown to improve insulin sensitivity in individuals with IGT [51] and have been found to exert a favorable protective effect in a prediabetic population [52]. In a multicenter placebo-controlled randomized trial, the Study to Prevent Non-Insulin Dependent Diabetes Mellitus (STOP-NIDDM), 1429 participants with IGT were randomly assigned to receive acarbose 100 mg 3 times a day or placebo for 3 years [53]. As expected, diabetes incidence was significantly decreased by 25% in the acarbose group (relative risk of 32.4% vs 41.5% in acarbose and placebo group, respectively), and acarbose significantly increased reversion to normal glucose tolerance (P < 0.0001). Furthermore, the use of acarbose was associated with a statistically significant 49% decrease in the rate of any cardiovascular event, highlighting the cardiovascular protective effect of improving postprandial hyperglycemia with acarbose. This study had many limitations: a high percentage of participants discontinued treatment (31% in the acarbose group and 19% in the placebo group), most likely related to increased gastrointestinal adverse effects of acarbose. In addition, the diabetes prevention effect does not seem to be sustained: during a 3-month wash-out period where all patients received placebo, incidence of diabetes in the initial intervention group was higher than in the initial placebo group.
In a Japanese multicenter randomized double-blind trial, 1780 patients with IGT were randomly assigned to receive the alpha-glucosidase inhibitor voglibose or placebo [54]. An interim analysis at 48 weeks revealed a significantly lower risk of progression to diabetes in the voglibose group.
Combination Metformin and Acarbose
In a 6-year multicenter British study, the Early Diabetes Intervention Trial (EDIT), 631 participants with IFG were randomly assigned, in a factorial design, to double-blind treatment with acarbose or placebo and simultaneously to metformin or placebo [55]. At 3 years, there was a nonsignificant risk reduction of 8% and 37% in progression to 2 successive fasting plasma glucose values of 140 mg/dL or more in the acarbose and metformin groups, respectively, but a significantly lower 2-hour OGTT glucose in the acarbose group and significantly lower FBG in the metformin group. Interestingly, at 6 years of follow-up, there was no significant difference in relative risk of progression to diabetes with acarbose, metformin, or combination therapy [56]. However, unlike metformin or combination therapy, acarbose was associated with a significant relative risk reduction of diabetes (0.66, P = 0.046) in the subgroup of patients with IGT at baseline, suggesting a possible differential protective effect of certain agents in patients with IGT or IFG.
Nateglinide
Nateglinide is a short-acting insulin secretagogue that is mostly used in the treatment of postprandial hyperglycemia in diabetic patients. The protective effect of nateglinide in a prediabetic population was examined in the NAVIGATOR study (the NAteglinide and Valsartan in Impaired Glucose Tolerance Outcomes Research), a large prospective multinational, randomized, double-blind, placebo-controlled trial. Nateglinide (30–60 mg 3 times daily) and valsartan (80–160 mg daily) versus placebo were used in a 2×2 factorial design in 9306 participants with IGT and increased risk of cardiovascular events [57]. At 5 years, nateglinide did not reduce the cumulative incidence of diabetes or cardiovascular outcomes, when compared to placebo, whereas risk of hypoglycemia was significantly increased in the intervention group.
Liraglutide
Liraglutide is an injectable glucagon-like peptide-1 (GLP-1) receptor agonist used to treat T2DM, and recently approved as a weight-reducing agent at the dose of 3 mg injected subcutaneously. GLP-1 receptor agonists work by stimulating insulin secretion in a glucose-dependent manner, suppressing glucagon secretion, inducing satiety, and slowing gastric emptying. In the international double-blind SCALE (Satiety and Clinical Adiposity-Liraglutide Evidence) trial, 3731 nondiabetic patients, among whom 61.2% had prediabetes, were randomly assigned to liraglutide 3 mg subcutaneous injection daily or placebo, in addition to diet and exercise [58]. Liraglutide was associated with lower glucose levels on OGTT and lower A1C values at the end of the study (56 weeks), with this decrease especially prominent in prediabetic patients. Significantly fewer participants in the liraglutide group (4/2219) compared to the placebo group (14/1225) developed diabetes at 56 weeks, nearly all of whom (except for 1 in the placebo group) had prediabetes at the beginning of the study. Of note, the liraglutide group had a mean 8.4-kg weight reduction by week 56, compared to 2.8 kg in the placebo group.
Insulin
Insulin has also been investigated as a possible diabetes prevention agent, given the assumed protective effect insulin could exert on beta cell reserve. In the landmark international Outcome Reduction with Initial Glargine Intervention (ORIGIN) trial, 12,537 participants (mean age 63.5 years) with cardiovascular risk factors plus IFG, IGT, or type 2 diabetes were randomly assigned to receive insulin glargine (with a target FBG ≤ 95 mg/dL) or standard care and were monitored for cardiovascular outcomes and other secondary endpoints including incidence of diabetes [59]. After a median follow-up of 6.2 years, and 3 months after discontinuation of therapy, among the 1456 participants without baseline diabetes, new diabetes was diagnosed in 30% of participants receiving glargine versus 35% of those receiving standard therapy. However, rates of severe hypoglycemia and modest weight gain were higher in the insulin group, calling in to question the benefit/risk balance with the use of basal insulin for diabetes prevention.
ACE Inhibitors and ARBs
A possible diabetes preventive effect was observed with renin-angiotensin system (RAS) blockade agents in secondary analysis of several hypertension trials, such as with ramipril in the Heart Outcomes Prevention Evaluation study, captopril (compared to diuretics and beta blockers) in the CAptopril Prevention Project, lisinopril (compared to amlodipine and chlorthalidone) in the Antihypertensive and Lipid-Lowering Treatment to Prevent Heart Attack Trial, losartan (compared to atenolol) in the Losartan Intervention For Endpoint reduction in hypertension study), and multiple other randomized controlled trials [60–64]. Therefore, 2 major trials were designed to examine, as a primary outcome, the effect of RAS inhibition on diabetes prevention in a population at risk. The DREAM trial randomly assigned, in a 2 × 2 factorial design, 5269 relatively healthy participants with IGT and/or IFG to rosiglitazone, ramipril, or placebo [65]. Although the use of ramipril at a dose of 15 mg daily for 3.5 years did not prevent diabetes significantly, it was associated with a 9%, nonsignificant decrease in new-onset of diabetes and a 16%, significant increase in regression of IFG and IGT to normoglycemia, as well as a significant decrease in OGTT 2-hour glucose level (135.1 vs 140.5 mg/dL) with no improvement in FBG.
Similarly, in the NAVIGATOR trial that examined the effect of nateglinide and valsartan on the prevention of diabetes in 9306 participants with IGT and increased risk of cardiovascular events, valsartan significantly but slightly reduced the incidence of diabetes at 5 years, by 14%, when compared to placebo (33% versus 37%, respectively), with no significant reduction in cardiovascular outcome [66]. Unlike in the DREAM study, the patients enrolled in the NAVIGATOR trial had established cardiovascular disease or cardiovascular risk factors and assumable elevated RAS activation level. This baseline population difference might explain the more significant effect of RAS inhibition in the NAVIGATOR trial.
Given the positive glycemic effect of ACE inhibitors and ARBs, their use should be encouraged in prediabetic patients when indicated for treatment of high blood pressure or cardiovascular disease. Different mechanisms could explain this favorable glycemic impact: inhibition of the post-receptor insulin signaling abnormalities, increased blood flow to the skeletal muscle facilitating insulin action, enhanced differentiation of pre-adipocytes into mature adipocytes, and increased pancreatic islet blood perfusion leading to appropriate insulin release and possible partial PPAR-γ activity [67].
Xenical
Xenical is a gastrointestinal lipase inhibitor approved for use for weight reduction and maintenance. A possible diabetes prevention benefit of xenical was initially suggested by a retrospective analysis of xenical treatment effects on obese patients with IGT [68]. This finding was subsequently confirmed by a multicenter randomized placebo-controlled study, XENical in the prevention of Diabetes in Obese Subjects (XENDOS), where 3305 obese subjects, with normal glucose tolerance or IGT were randomly assigned to either xenical 120 mg 3 times a day or placebo, in addition to lifestyle changes for all participants [69]. In the group of patients with IGT (694 subjects), xenical treatment was associated with a 45% risk reduction of progression to diabetes at 4 years (18.8% versus 28.8% in placebo), whereas participants with baseline normal glucose tolerance had no significant change in incidence of diabetes. On the other hand, weight reduction at 4 years was significantly greater in all patients who received xenical (5.8 kg in intervention group vs 3 kg in control group). The beneficial effect of xenical in diabetes prevention seems to be additive to the benefit of weight loss. As in many weight reduction trials, this study was limited by the high discontinuation rate in both groups (48% in xenical group and 66% in control group), probably related to insufficient clinical response.
Fibric Acid Derivatives (Bezafibrate)
Bezafibrate, a nonselective ligand/activator for PPAR-α, was found to reduce not only triglycerides, but also FPG, fructosamine, and A1C levels significantly in T2DM patients with hyperlipidemia [70]. Different mechanisms of glucose lowering have been suggested with bezafibrate: nonselective activation of PPAR-γ, improving insulin sensitivity, and enhancing glucose disposal in adipose tissue and skeletal muscles [71]. Furthermore, bezafibrate treatment was associated with decreased incidence of diabetes in patients with IFG and in obese non-diabetic patients with normal glycemic levels [72,73]. In a posthoc analysis of the Bezafibrate Infarction Prevention study, 303 patients with IFG received either 400 mg of bezafibrate daily or placebo [73]. Over a mean follow-up of 6.2 years, development of diabetes was less prevalent (54.4% vs 42.3%, relative risk reduction of 22%) and delayed (mean 10 months) in the bezafibrate group compared to placebo. Multivariate analysis identified bezafibrate as an independent predictor of decreased risk of new diabetes development, regardless of BMI and lipid profile.
Surgery
Over the past decade, bariatric surgery has become one of the most effective interventions for inducing and sustaining weight reduction in severely obese patients, leading to a significant benefit in diabetes prevention or remission. The Swedish Obese Subject Study is a large ongoing prospective nonrandomized cohort study that between 1987 and 2001 enrolled 4047 nondiabetic obese participants who underwent gastric surgery or were matched obese control, with diabetes incidence measured at 2, 10 and 15 years [74–76]. At 15 years, analysis of the available cohort of the initial group showed that T2DM developed in 392 of 1658 control participants and in 110 of 1771 bariatric-surgery participants, corresponding to incidence rates of 28.4 and 6.8 cases per 1000 person-years, respectively (P < 0.001). The treatment effects on the incidence of T2DM were at least as strong after 2 years and 10 years of follow-up as after 15 years. This effect was most prominent among the 591 patients who had IFG at baseline, with a number needed to treat as low as 1.3. The surgery group maintained an average 20-kg weight loss at 15 years.
In another study of the effects of bariatric surgery, 150 of 152 obese participants with IGT who underwent gastric bypass achieved and maintained a normal glycemic profile at 14 years of follow-up [77]. Similarly, in a follow-up of 136 obese participants with IGT, 109 of whom underwent bariatric surgery, 1 participant in the surgical group developed diabetes, as compared with 6 out of 27 in the control group [78]. In a meta-analysis including studies involving 22,094 patients who underwent bariatric surgery, 76.8% had complete resolution of their diabetes [79]. The rapid improvement of glycemic profile after bariatric surgery is thought to be due to oral intake restriction as well as acute hormonal changes related to the exclusion of the upper gastrointestinal tract (eg, incretin and ghrelin levels variations) [80].
Conclusions and Recommendations
The natural history of T2DM allows identification of patients at risk for diabetes and implementation of prevention strategies, which seems to be a public health need given the alarming increase in diabetes incidence. Indeed, the onset of T2DM is typically preceded by many years of beta cell dysfunction translating into carbohydrate metabolism abnormalities such as IFG and IGT, providing an excellent window of opportunity to identify persons at risk and prevent progression to diabetes. Numerous randomized controlled trials established lifestyle modifications, including dietary changes, moderate weight loss, and moderate intensity physical activity, as safe and effective interventions to prevent diabetes. This protective effect has been consistently shown to be sustained for more than 10 years after the initial intervention. Pharmacologic agents such as metformin, thiazolidinediones, alpha-glucosidase inhibitors, xenical, liraglutide, and insulin have also been associated with diabetes prevention in patients at risk. However, except for metformin, safety concerns or lack of durable efficacy or tolerability seem to outweigh their potential diabetes prevention benefit.
Given their favorable glycemic effect, RAS blockade and fibrates should be considered, when indicated, as reasonable treatment options for hypertension and hyperlipidemia in prediabetic patients. Bariatric surgery has been associated with a dramatic reduction in diabetes incidence in obese prediabetic patients and can be considered an alternative prevention measure in patients with severe obesity and prediabetes.
The recently updated ADA guidelines recommend referring patients with prediabetes to an intensive diet and physical activity behavioral counseling program; diet and activity goals should adhere to the tenets of the DPP, with a loss of 7% of body weight and at least 150 minutes of moderate physical activity (eg, brisk walking) per week [8]. Metformin therapy for diabetes prevention should be considered in patients with prediabetes, especially in those with BMI greater than 35 kg/m2, those younger than 60 years of age, women with history of gestational diabetes, and/or those with rapidly rising A1C despite lifestyle modifications. Monitoring for development of diabetes, at least annually, and screening for and treatment of modifiable cardiovascular risk factors are suggested in patients with prediabetes [8].
Many lessons have been learned through the studies of diabetes prevention interventions. The challenge that remains is how to apply these interventions, especially the lifestyle modifications, in real world medical practice, at both the individual and public health level.
Corresponding author: Jocelyne Karam, MD, 4802 10th Avenue, Brooklyn, NY 11219, [email protected].
Financial disclosures: None reported.
1. International Diabetes Federation. Diabetes facts and figures. www.idf.org/about-diabetes/facts-figures. Accessed on January 29, 2017.
2. Centers for Disease Control and Prevention. National diabetes statistics report, 2014. www.cdc.gov/diabetes/pubs/statsreport14/national-diabetes-report-web.pdf. Accessed on January 29, 2017.
3. Centers for Disease Control and Prevention. Number of Americans with diabetes projected to double or triple by 2050. www.cdc.gov/media/pressrel/2010/r101022.html. Accessed on January 29, 2017.
4. World Health Organization (WHO). Diabetes fact sheet. No. 312. November 2016. www.who.int/mediacentre/factsheets/fs312/en/. Accessed on January 29, 2017.
5. Karam JG, McFarlane SI. Update on the prevention of type 2 diabetes. Curr Diab Rep 2011;11:56–63.
6. Menke A, Rust KF, Fradkin J, et al. Associations between trends in race/ethnicity, aging, and body mass index with diabetes prevalence in the United States: a series of cross-sectional studies. Ann Intern Med 2014;161:328–85.
7. Ford ES, Li C, Sattar N . Metabolic syndrome and incident diabetes: current state of the evidence. Diabetes Care 2008;31:1898–904.
8. American Diabetes Association. Standards of medical care in diabetes—2017. Diabetes Care 2017;40(Suppl. 1).
9. Kruszynska YT, Olefsky JM. Cellular and molecular mechanisms of non-insulin dependent diabetes mellitus. J Investig Med 1996;44:413–28..
10. Butler AE, Janson J, Bonner-Weir S, et al. Beta-cell deficit and increased beta-cell apoptosis in humans with type 2 diabetes. Diabetes 2003;52:102–10.
11. Definition and diagnosis of diabetes mellitus and intermediate hyperglycemia. Report of a WHO and IDF Consultation. 2006. http://apps.who.int/iris/bitstream/10665/
43588/1/9241594934_eng.pdf. Accessed on February 1, 2017.
12. Mokdad AH, Ford ES, Bowman BA, et al. Prevalence of obesity, diabetes, and obesity-related health risk factors. 2001 JAMA 2003;289:76–9.
13. Glucose tolerance and mortality: comparison of WHO and American Diabetes Association diagnostic criteria. The DECODE study group. European Diabetes Epidemiology Group. Diabetes Epidemiology: Collaborative analysis Of Diagnostic criteria in Europe. Lancet 1999;354:617–21.
14. Barr EL, Zimmet PZ, Welborn TA, et al. Risk of cardiovascular and all-cause mortality in individuals with diabetes mellitus, impaired fasting glucose, and impaired glucose tolerance: the Australian Diabetes, Obesity, and Lifestyle Study (AusDiab). Circulation 2007;116:151–7.
15. Xu T, Liu W, Cai X, et al. Risk of coronary heart disease in different criterion of impaired fasting glucose: a meta-analysis. Medicine 2015;94:e1740.
16. Huang Y, Cai X, Mai W, et al. Association between prediabetes and risk of cardiovascular disease and all cause mortality: systematic review and meta-analysis. BMJ 2016;355:i5953.
17. Nagi DK, Pettitt DJ, Bennett PH, et al. Diabetic retinopathy assessed by fundus photography in Pima Indians with impaired glucose tolerance and NIDDM. Diabet Med 1997;14:449 –56.
18. Diabetes Prevention Program Research Group. The prevalence of retinopathy in impaired glucose tolerance and recent-onset diabetes in the Diabetes Prevention Program. Diabet Med 2007;24:137–44
19. Putz Z, Tabák AG, Tóth N, et al. Noninvasive evaluation of neural impairment in subjects with impaired glucose tolerance. Diabetes Care 2009;32:181–3.
20. Hoffman-Snyder C, Smith BE, Ross MA, et al. Value of the oral glucose tolerance test in the evaluation of chronic idiopathic axonal polyneuropathy. Arch Neurol 2006;63:1075–9.
21. Plantinga LC, Crews DC, Coresh J, et al; CDC CKD Surveillance Team. Prevalence of chronic kidney disease in US adults with undiagnosed diabetes or prediabetes. Clin J Am Soc Nephrol 2010;5:673–82.
22. Pan XR, Li GW, Hu YH, et al. Effects of diet and exercise in preventing NIDDM in people with impaired glucose tolerance. The Da Qing IGT and Diabetes Study. Diabetes Care 1997;20:537–44.
23. Tuomilehto J, Lindstrom J, Eriksson JG, et al. Prevention of type 2 diabetes mellitus by changes in lifestyle among subjects with impaired glucose tolerance. N Engl J Med 2001;344:1343–50.
24. Knowler WC, Barrett-Connor E, Fowler SE, et al. Reduction in the incidence of type 2 diabetes with lifestyle intervention or metformin. N Engl J Med 2002;346:393–403.
25. Kosaka K, Noda M, Kuzuya T. Prevention of type 2 diabetes by lifestyle intervention: a Japanese trial in IGT males. Diabetes Res Clin Pract 2005;67:152–62.
26. Ramachandran A, Snehalatha C, Mary S, et al; Indian Diabetes Prevention Programme (IDPP).The Indian Diabetes Prevention Programme shows that lifestyle modification and metformin prevent type 2 diabetes in Asian Indian subjects with impaired glucose tolerance (IDPP-1). Diabetologia 2006;49:289–97.
27. Saito T, Watanabe M, Nishida J, et al; Zensharen Study for Prevention of Lifestyle Diseases Group. Lifestyle modification and prevention of type 2 diabetes in overweight Japanese with impaired fasting glucose levels: a randomized controlled trial. Arch Intern Med 2011;171:1352–60.
28. Li G, Zhang P, Wang J, et al. The long-term effect of lifestyle interventions to prevent diabetes in the China Da Qing Diabetes Prevention Study: a 20-year follow-up study. Lancet 2008;371:1783–9.
29. Li G, Zhang P, Wang J, et al. Cardiovascular mortality, all-cause mortality, and diabetes incidence after lifestyle intervention for people with impaired glucose tolerance in the Da Qing Diabetes Prevention Study: a 23-year follow-up study. Lancet Diabetes Endocrinol 2014;2:474–80.
30. Li G, Zhang P, Wang J, et al. Cardiovascular mortality, all-cause mortality, and diabetes incidence after lifestyle intervention for people with impaired glucose tolerance in the Da Qing Diabetes Prevention Study: a 23-year follow-up study. Lancet Diabetes Endocrinol 2014;2:474–80.
31. Lindstrom J, Ilanne-Parikka P, Peltonen M, et al. Sustained reduction in the incidence of type 2 diabetes by lifestyle intervention: follow-up of the Finnish Diabetes Prevention Study. Lancet 2006;368:673–9.
32. Diabetes Prevention Research Group, Knowler WC, Fowler SE, et al. 10-year follow-up of diabetes incidence and weight loss in the Diabetes Prevention Program Outcomes Study. Lancet 2009;374:1677–86.
33. Salas-Salvadó J, Bulló M, Babio N, et al. Reduction in the incidence of type 2 diabetes with the Mediterranean diet: results of the PREDIMED-Reus nutrition intervention randomized trial. Diabetes Care 2011;34:14–19.
34. Wang P, Fang J, Gao Z, et al. Higher intake of fruits, vegetables or their fiber reduces the risk of type 2 diabetes: A meta‐analysis. J Diabetes Investig 2016;7:56–69.
35. Devlin JT. Effects of exercise on insulin sensitivity in humans. Diabetes Care 1992;15:1690–3.
36. Jeon CY, Lokken RP, Hu FB, van Dam RM. Physical activity of moderate intensity and risk of type 2 diabetes: a systematic review. Diabetes Care 2007;30:744–52.
37. Slentz C, Bateman L, Willis L, et al. Effects of exercise training alone vs a combined exercise and nutritional lifestyle intervention on glucose homeostasis in prediabetic individuals: a randomised controlled trial. Diabetologia 2016;59:2088–98.
38. Hamman RF, Wing RR, Edelstein SL, et al. Effect of weight loss with lifestyle intervention on risk of diabetes. Diabetes Care. 2006;29:2102–7.
39. Kirpichnikov D, McFarlane SI, Sowers JR. Metformin: an update. Ann Intern Med 2002;137:25–33.
40. Ratner RE, Christophi CA, Metzger BE, et al. Prevention of diabetes in women with a history of gestational diabetes: effects of metformin and lifestyle interventions. J Clin Endocrinol Metab 2008;93:4774–9.
41. Diabetes Prevention Program Research Group. Effects of withdrawal from metformin on the development of diabetes in the diabetes prevention program. Diabetes Care 2003;26:977–80.
42. Salpeter SR, Buckley NS, Kahn JA, Salpeter EE. Meta-analysis: metformin treatment in persons at risk for diabetes mellitus. Am J Med 2008;121:149–57.
43. El-Atat F, Nicasio J, Clarke L, et al. Beneficial cardiovascular effects of thiazolidinediones. Therapy 2005;2:113–19.
44. Buchanan TA, Xiang AH, Peters RK, et al. Preservation of pancreatic beta-cell function and prevention of type 2 diabetes by pharmacological treatment of insulin resistance in high-risk hispanic women. Diabetes 2002;51:2796–2803.
45. Azen SP, Peters RK, Berkowitz K. TRIPOD (Troglitazone In the Prevention Of Diabtes): a randomized placebo-controlled study of troglitazone in women with prior gestational diabetes mellitus. Control Clin Trials 1998;19:217–31.
46. Gerstein HC, Yusuf S, Bosch J, et al. Effect of rosiglitazone on the frequency of diabetes in patients with impaired glucose tolerance or impaired fasting glucose: a randomised controlled trial. Lancet 2006;368:1096–1105.
47. DREAM Investigators, Gerstein HC, Mohan V, Avezum A, et al. Long-term effect of rosiglitazone and/or ramipril on the incidence of diabetes. Diabetologia 2011;54:487–95.
48. DeFronzo RA, Tripathy D, Schwenke DC, et al. Pioglitazone for diabetes prevention in impaired glucose tolerance. N Engl J Med 2011;364:1104–15.
49. Ramachandran A, Snehalatha C, Mary S, et al. Pioglitazone does not enhance the effectiveness of lifestyle modification in preventing conversion of impaired glucose tolerance to diabetes in Asian Indians: results of the Indian Diabetes Prevention Programme-2 (IDPP-2). Diabetologia 2009;52:1019–26.
50 Zinman B, Harris SB, Neuman J, et al. Low-dose combination therapy with rosiglitazone and metformin to prevent type 2 diabetes mellitus (CANOE trial): a double-blind randomised controlled study. Lancet 2010;376:103–11.
51. Chiasson JL, Josse RG, Leiter LA, et al. The effect of acarbose on insulin sensitivity in subjects with impaired glucose tolerance. Diabetes Care 1996;19:1190–3.
52. Van de Laar FA, Lucassen PL, Akkermans RP, et al. Alpha-glucosidase inhibitors for people with impaired glucose tolerance or impaired fasting blood glucose. Cochrane Database Syst Rev 2006(4):CD005061.
53. Chiasson JL, Josse RG, Gomis R, et al. Acarbose for prevention of type 2 diabetes mellitus: the STOP-NIDDM randomised trial. Lancet 2002;359:2072–7.
54. Kawamori R, Tajima N, Iwamoto Y, et al. Voglibose for prevention of type 2 diabetes mellitus: a randomised, double-blind trial in Japanese individuals with impaired glucose tolerance. Lancet 2009;373:1607–14.
55. Holman RR, North BV, Tunbridge FK. Possible prevention of type 2 diabetes with acarbose or metformin. Diabetes 2000;49:Suppl 1:A111.
56. Holman RR, Blackwell L, Stratton IM et al. Six-year results from the Early Diabetes Intervention Trial. Diabet Med 2003;20(Suppl 2):15.
57. Holman RR, Haffner SM, McMurray JJ, et al. Effect of nateglinide on the incidence of diabetes and cardiovascular events. N Engl J Med 2010;362:1463–76.
58. Pi-Sunyer X, Astrup A, Fujioka K et al. A randomized, controlled trial of 3.0 mg of liraglutide in weight management. N Engl J Med 2015;373:11–22.
59. ORIGIN Trial Investigators, Gerstein HC, Bosch J, et al. Basal insulin and cardiovascular and other outcomes in dysglycemia. N Engl J Med 2012;367:319–28.
60. Yusuf S, Gerstein H, Hoogwerf B, et al. Ramipril and the development of diabetes. JAMA 2001;286:1882–5.
61. Hansson L, Lindholm LH, Niskanen L, et al. Effect of angiotensin-converting-enzyme inhibition compared with conventional therapy on cardiovascular morbidity and mortality in hypertension: the Captopril Prevention Project (CAPPP) randomised trial. Lancet 1999;353:611–6.
62. Major outcomes in high-risk hypertensive patients randomized to angiotensin-converting enzyme inhibitor or calcium channel blocker vs diuretic: The Antihypertensive and Lipid-Lowering Treatment to Prevent Heart Attack Trial (ALLHAT). JAMA 2002;288:2981–97.
63. Lindholm LH, Ibsen H, Dahlof B, et al. Cardiovascular morbidity and mortality in patients with diabetes in the Losartan Intervention For Endpoint reduction in hypertension study (LIFE): a randomised trial against atenolol. Lancet 2002;359:1004–10.
64. Gillespie EL, White CM, Kardas M, et al. The impact of ACE inhibitors or angiotensin II type 1 receptor blockers on the development of new-onset type 2 diabetes. Diabetes Care 2005;28:2261–6.
65. Bosch J, Yusuf S, Gerstein HC, et al. Effect of ramipril on the incidence of diabetes. N Engl J Med 2006;355:1551–62.
66. McMurray JJ, Holman RR, Haffner SM, et al. Effect of valsartan on the incidence of diabetes and cardiovascular events. N Engl J Med 2010;362:1477–90.
67. McFarlane SI, Kumar A, Sowers JR. Mechanisms by which angiotensin-converting enzyme inhibitors prevent diabetes and cardiovascular disease. Am J Cardiol 2003;91(12A):30H–37H.
68. Heymsfield SB, Segal KR, Hauptman J, et al. Effects of weight loss with orlistat on glucose tolerance and progression to type 2 diabetes in obese adults. Arch Intern Med 2000;160:1321–6.
69. Torgerson JS, Hauptman J, Boldrin MN, Sjostrom L. XENical in the prevention of diabetes in obese subjects (XENDOS) study: a randomized study of orlistat as an adjunct to lifestyle changes for the prevention of type 2 diabetes in obese patients. Diabetes Care 2004;27:155–61.
70. Rovellini A, Sommariva D, Branchi A, et al. Effects of slow release bezafibrate on the lipid pattern and on blood glucose of type 2 diabetic patients with hyperlipidaemia. Pharmacol Res 1992;25:237–45.
71. Tenenbaum A, Motro M, Fisman EZ. Dual and pan-peroxisome proliferator-activated receptors (PPAR) co-agonism: the bezafibrate lessons. Cardiovasc Diabetol 2005;4:14.
72. Tenenbaum A, Motro M, Fisman EZ, et al. Effect of bezafibrate on incidence of type 2 diabetes mellitus in obese patients. Eur Heart J 2005;26:2032–8.
73. Tenenbaum A, Motro M, Fisman EZ, et al. Peroxisome proliferator-activated receptor ligand bezafibrate for prevention of type 2 diabetes mellitus in patients with coronary artery disease. Circulation 2004;109:2197–202.
74. Sjostrom L, Lindroos AK, Peltonen M, et al. Lifestyle, diabetes, and cardiovascular risk factors 10 years after bariatric surgery. N Engl J Med 2004;351:2683–93.
75. Sjostrom CD. Surgery as an intervention for obesity. Results from the Swedish obese subjects study. Growth Horm IGF Res 2003;13 Suppl A:S22–26.
76. Carlsson LM, Peltonen M, Ahlin S, et al. Bariatric surgery and prevention of type 2 diabetes in Swedish obese subjects. N Engl J Med 2012;367:695–704.
77. Pories WJ, Swanson MS, MacDonald KG, et al. Who would have thought it? An operation proves to be the most effective therapy for adult-onset diabetes mellitus. Ann Surg 1995;222:339–50.
78. Long SD, O’Brien K, MacDonald KG Jr, et al. Weight loss in severely obese subjects prevents the progression of impaired glucose tolerance to type II diabetes. A longitudinal interventional study. Diabetes Care 1994;17:372–5.
79. Buchwald H, Avidor Y, Braunwald E, et al. Bariatric surgery: a systematic review and meta-analysis. JAMA 2004;292:1724–37.
80. Tejirian T, Jensen C, Dutson E. Bariatric surgery and type 2 diabetes mellitus: surgically induced remission. J Diabetes Sci Technol 2008;2:685–91.
Chronic Obstructive Pulmonary Disease: Epidemiology, Clinical Presentation, and Evaluation
From the Department of Preventive Medicine and Environmental Health, University of Kentucky College of Public Health, Lexington, KY.
Abstract
- Objective: To review the classification, epidemiology, clinical presentation, and evaluation of patients with chronic obstructive pulmonary disease (COPD).
- Methods: Review of the literature.
- Results: While smoking remains the most important risk factor for COPD in much of the developed world, other risk factors, including genetic factors and occupational or environmental exposures, remain important. COPD is the third leading cause of death in the United States. In 2011, 13.7 million adults aged ≥ 25 years were diagnosed with COPD in the United States, and as many as 12 million adults may have COPD that is undiagnosed. In 2010, COPD was responsible for an estimated 10.3 million physician office visits and 1.5 million emergency room visits and was estimated to be the second leading cause of disability-adjusted life years lost among the US population. COPD has primary, secondary, and tertiary prevention strategies. The treatment of COPD has improved in recent years, with new therapies improving patient quality of life.
- Conclusion: COPD remains a serious public health problem that is often underdiagnosed, particularly in its early stages.
Key words: Chronic obstructive pulmonary disease; epidemiology; mortality; smoking; evaluation.
Chronic obstructive pulmonary disease (COPD) is characterized by fixed airflow obstruction with breathing-related symptoms, such as chronic cough, exertional dyspnea, expectoration, and wheeze [1]. These symptoms may occur in conjunction with airway hyperresponsiveness and overlap with other chronic diseases such as asthma. Although COPD is a nonspecific term referring to a set of conditions that develop progressively as a result of a number of different disease processes, it most commonly refers to chronic bronchitis and emphysema. These conditions can be present with or without significant physical impairment. Despite being a very common disease and the third leading cause of death in the United States [2], COPD often is a silent and unrecognized disease, particularly in its early phases [3], and may go untreated.
In this article, we review the classification, epidemiology, clinical presentation, and assessment of patients with COPD.
Definition and Classification
Several different definitions have existed for COPD [4–8]. The Global Initiative for Chronic Obstructive Lung Disease (GOLD), an international collaboration of leading experts in COPD launched in the late 90s with a goal to develop evidence-based recommendations for diagnosis and management of COPD [4], currently defines COPD as “a common, preventable and treatable disease that is characterized by persistent respiratory symptoms and airflow limitation that is due to airway and/or alveolar abnormalities usually caused by significant exposure to noxious particles or gases” [4].
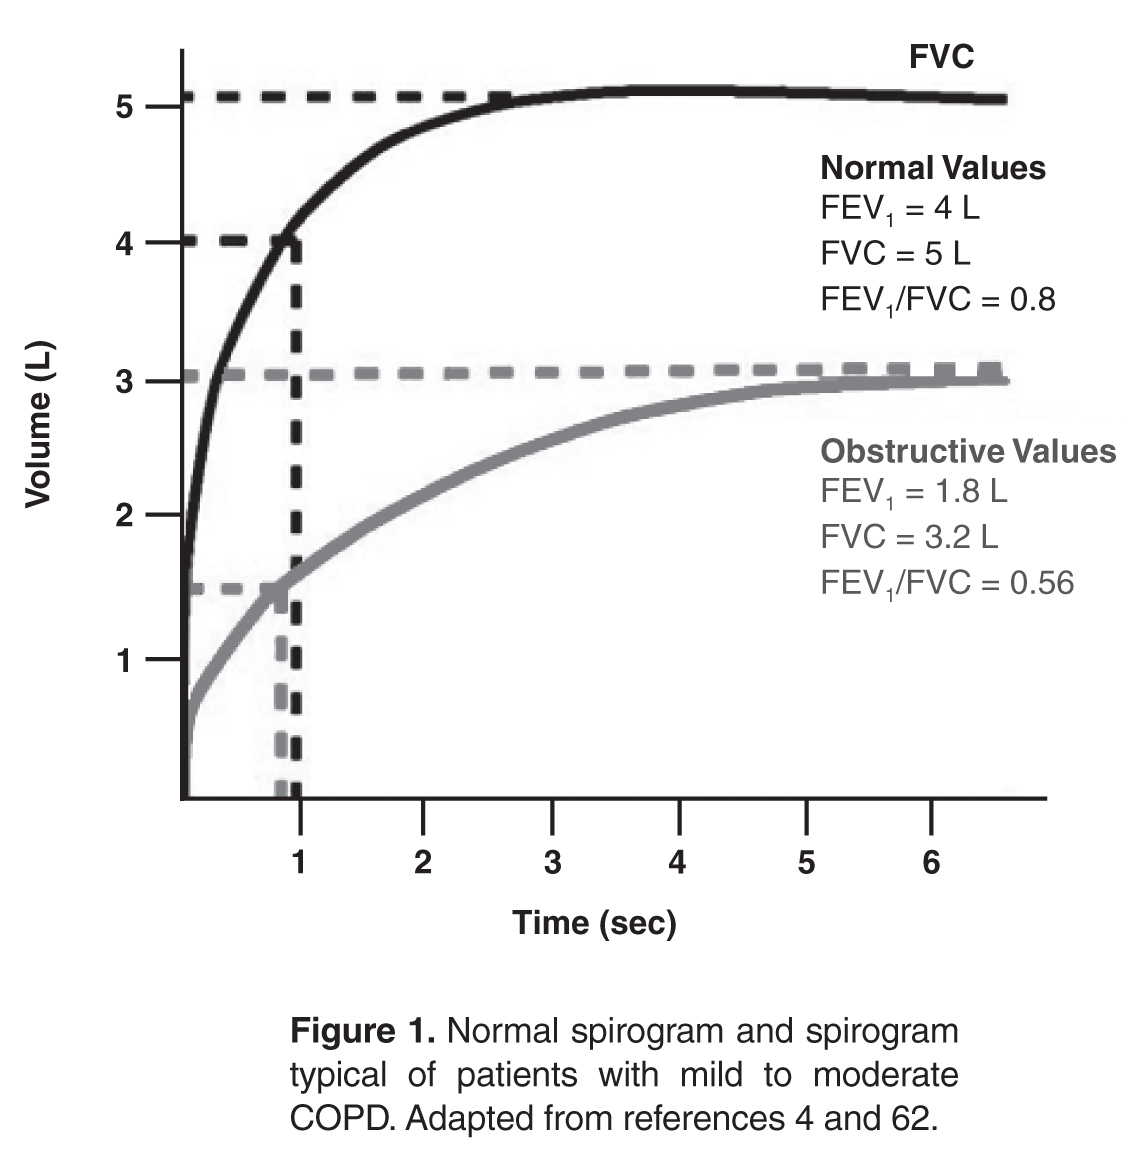
Severity of COPD has typically been determined using the degree of lung function impairment, although the wisdom of this approach has been questioned, 
Previous definitions of COPD differentiated between chronic bronchitis, asthma, and emphysema, acknowledging that there is frequently overlap between these disease entities [12,13]. The GOLD definition of COPD does not differentiate between chronic bronchitis and emphysema but does note that although asthma and COPD can coexist [4], the largely reversible airflow limitation in asthma merits different therapeutic approaches than the largely irreversible airflow limitation of COPD. The overlap of asthma and COPD in a significant proportion of patients has been the focus of recent work [14].
Epidemiology
Prevalence of COPD
The Behavioral Risk Factor Surveillance System (BRFSS) is an ongoing national random-digit-dialed telephone survey of landline and cellphone households designed to measure behavioral risk factors for the noninstitutionalized adult population of the US [15]. An affirmative response to the following question was defined as physician-diagnosed COPD: “Have you ever been told by a doctor or other health professional that you have chronic obstructive pulmonary disease (COPD), emphysema, or bronchitis?”[16]. Based on 2011 BRFSS survey, 13.7 million adults aged ≥ 25 years were estimated to have a self-reported physician diagnosis of COPD in the United States. The greatest age-adjusted prevalence was found to be clustered along the Ohio River Valley and the southern states [16].
The National Health Interview Survey (NHIS) is an annually conducted, nationally representative survey of the civilian noninstitutionalized population aged 18 years and older. A positive response to one or both of the following questions was used to define COPD: “Have you ever been told by a doctor or other health professional that you had emphysema?” and “During the past 12 months, have you been told by a doctor or other health professional that you had chronic bronchitis?” Age-adjusted COPD prevalence estimates showed significant interyear variation during 1999–2011 period, and were higher in women than in men with the highest prevalence noted in 2001 for both genders [16].
The NHIS estimates for COPD have 2 important limitations. First, these estimates depend on the proper recognition and diagnosis of COPD by both the study participants and their health care providers. This would tend to bias the estimates toward counting fewer cases than actually exist. A bias in the opposite direction, however, is that the term chronic bronchitis in this survey is not precisely defined and could be interpreted as recurrent episodes of acute bronchitis. The finding that “chronic bronchitis” has been reported in 3% to 4% of children supports the presence of this potential bias. The second limitation is that this survey is not able to validate, through physiologic evaluation, whether airway obstruction is present or absent.
These limitations were addressed, in part, by separate nationally representative US surveys that include an examination component, such as the National Health and Nutrition Examination Surveys (NHANES) [17]. An analysis of these data from 1988–1994 and 2007–2012 [18] demonstrated that over 70% of people with evidence of obstruction (based on an FEV1/FVC < 70%) did not have a diagnosis of lung disease (COPD or asthma). In addition, people with evidence of obstruction had a higher risk of mortality whether or not they had diagnosed lung disease [18].
Evaluation of “reversibility” of the airway obstruction requires the administration of bronchodilator, which is not a part of most population-based studies. A subset of participants in the NHANES 2007–2012 survey received a bronchodilator, with a decrease in the estimated prevalence of obstruction from 20.9% to 14.0% [19]. However, a closer look at similar data from a study where all people got a bronchodilator reveal that only a small proportion of people with “reversibility” actually had a significant response to the bronchodilator [20]. In a clinic-based study of subjects with COPD who were aged 69 years and older, 31% demonstrated reversibility, defined as a 15% improvement (from baseline) in FVC and FEV1 following administration of an inhaled bronchodilator [21]. In this study, subjects with more severe obstruction were more likely to have reversibility but would also be more likely to continue to have diminished lung function after maximum improvement was obtained, thus being classified as having “partial reversibility.”
The presence of significant reversibility or partial reversibility in patients with COPD [15] and nonreversible airflow obstruction in asthma patients [22] demonstrates that these diseases can coexist or, alternatively, that there is overlap and imprecision in the ways that these diseases are clinically diagnosed.
Morbidity and Mortality
COPD is a leading cause of disease morbidity and mortality in the United States. The National Center for Health Statistics (NCHS) conducts ongoing surveillance of several health indicators nationally. The NCHS collects physician office visit data using the National Ambulatory Medical Care Survey [23], emergency department visit data and hospital outpatient data using the National Hospital Ambulatory Medical Care Survey [24], hospitalization data using the National Hospital Discharge Survey [25], and death data using the mortality component of the National Vital Statistics System [26]. The following data include the number and rate of COPD events in adults in the United States (using International Classification of Diseases, 9th Revision, Clinical Modification [ICD-9-CM], codes 490, 491, 492 and 496) in these data sets for the most recent years available.
In 2010, COPD was responsible for an estimated 10.3 million physician office visits, with a resulting age-adjusted rate of 494.8 per 10,000 US civilian population [16]. COPD was also responsible for an estimated 1.5 million emergency room visits, with a resulting age-adjusted rate of 72 visits per 10,000 population [16].
COPD is a leading cause of hospitalization in US adults, particularly in older populations. In 2010, almost 699,000 hospitalizations, were attributed to COPD. The age-adjusted rate of COPD hospitalizations (as the primary cause of hospitalization) was 32.2 per 10,000 population in 2010 [16].
Deaths due to or associated with COPD have not significantly changed since 1999. While the age-adjusted death rate among men declined during 1999–2010 (P = 0.001), the rate among women has not changed significantly (P = 0.127). In 2010, 63, 778 men and 69, 797 women aged ≥ 25 years died of COPD [26]. One of the limitations of using the mortality component of the National Vital Statistics System is that it is based on the underlying cause of death as reported on the death certificate; however, many decedents with COPD listed on the death certificate have their death attributed to another cause [27]. The significance of COPD as a contributor to death is undefined when it is present with diseases more likely to be attributed as the underlying cause of death, such as myocardial infarction or lung cancer [28].
COPD is a very costly disease, with estimated direct medical costs in 2004 of $20.9 billion. The estimated indirect costs related to morbidity (loss of work time and productivity) and premature mortality is an additional $16.3 billion, for a total of $37.2 billion [29]. Because COPD may be present but not listed as the underlying cause of death or the primary reason for hospitalization, these cited estimates may underestimate the true cost of COPD. For example, in another analysis of COPD costs in the US, the total for 2010 was estimated at $32.1 billion [30], but could be up to $100 billion [31] depending on the assumptions surrounding comorbid disease.
Another manifestation of the importance of COPD is its effect on the burden of disease in a population determined using disability-adjusted life-years (DALYs). DALYs for a disease or condition are calculated as the sum of the years of life lost due to premature mortality in the population and the years of life lost due to disability [32]. In 2010, COPD was estimated to be the second leading cause of DALYs lost among the North American population [33]. Worldwide, COPD is expected to move up from being the twelfth leading cause of DALYs lost in 1990 to the fifth leading cause in 2020 [34].
Gender Differences
Smoking-related diseases such as COPD and lung cancer are continuing to increase among women in the United States [35,36], while they have plateaued or are decreasing among men [27,37]. Some evidence has emerged that compared with men at a similar level of tobacco smoking, women may be more likely to develop COPD [38] or that the severity of COPD in women may be increased [39–41].
In the Lung Health Study, which evaluated patients with mild COPD, more women than men demonstrated increased airway responsiveness, although this difference was thought to be related to airway caliber rather than gender [42]. Adult women are more likely to both develop and die of asthma than are men [43–45]. In NHANES III, whereas women reported more physician-diagnosed COPD and asthma than men, men and women had similar rates of decreased lung function, and a similar proportion of both men and women with low lung function had undiagnosed lung disease [3]. The current evidence is inadequate to determine whether women who smoke are more likely to develop COPD or have more severe COPD than men, although this question is being studied by various groups.
Risk Factors and Etiology
Smoking is the dominant risk factor for the development and progression of COPD; however, not all smokers develop COPD, and COPD does occur in persons who have never smoked [1], suggesting that other factors are important in the etiology of COPD. Alpha1-antitrypsin deficiency is an important cause of COPD in a very small percentage of cases [46]. Other undefined genetic factors certainly play an important role in COPD development [38]. The role of infections in both the development and progression of COPD is receiving increased attention, including the role of adenoviral infections in emphysema [47–49].
Occupational and environmental exposures to various pollutants (eg, particulate matter, agricultural dusts) are also important factors in the development of COPD [50,51]. Exposure to indoor air pollutants such as smoke from solid biomass fuels is a major risk factor for COPD especially among women and children in low- and middle-income countries [52,53]. Occupational exposure to fumes and dusts remains an important cause for COPD globally [53,54]. Exposure to outdoor air pollution is associated with a risk of development of COPD as well as exacerbation of the existing disease [53,55].
Clinical Presentation
COPD is heterogeneous in its presentation. Based on data from NHANES III, 44% of patients with severe airflow limitation (FEV1 < 50% of predicted) may not report symptoms [3]. Among patients with severe airflow limitation who do report symptoms, the symptoms reported most frequently include wheezing (64%) and shortness of breath (65%).
In recent years, COPD has been increasingly recognized as a systemic illness, with effects on nutritional status, muscle wasting, and depression [56–58]. A large proportion of patients probably have components of chronic bronchitis, asthma, and emphysema occurring together. Although some of this overlap may be related to misdiagnosis, some of it may be a measure of the presence of airflow limitation reversibility, as described above. Better defining individuals in these groups may ultimately help tailor better interventions.
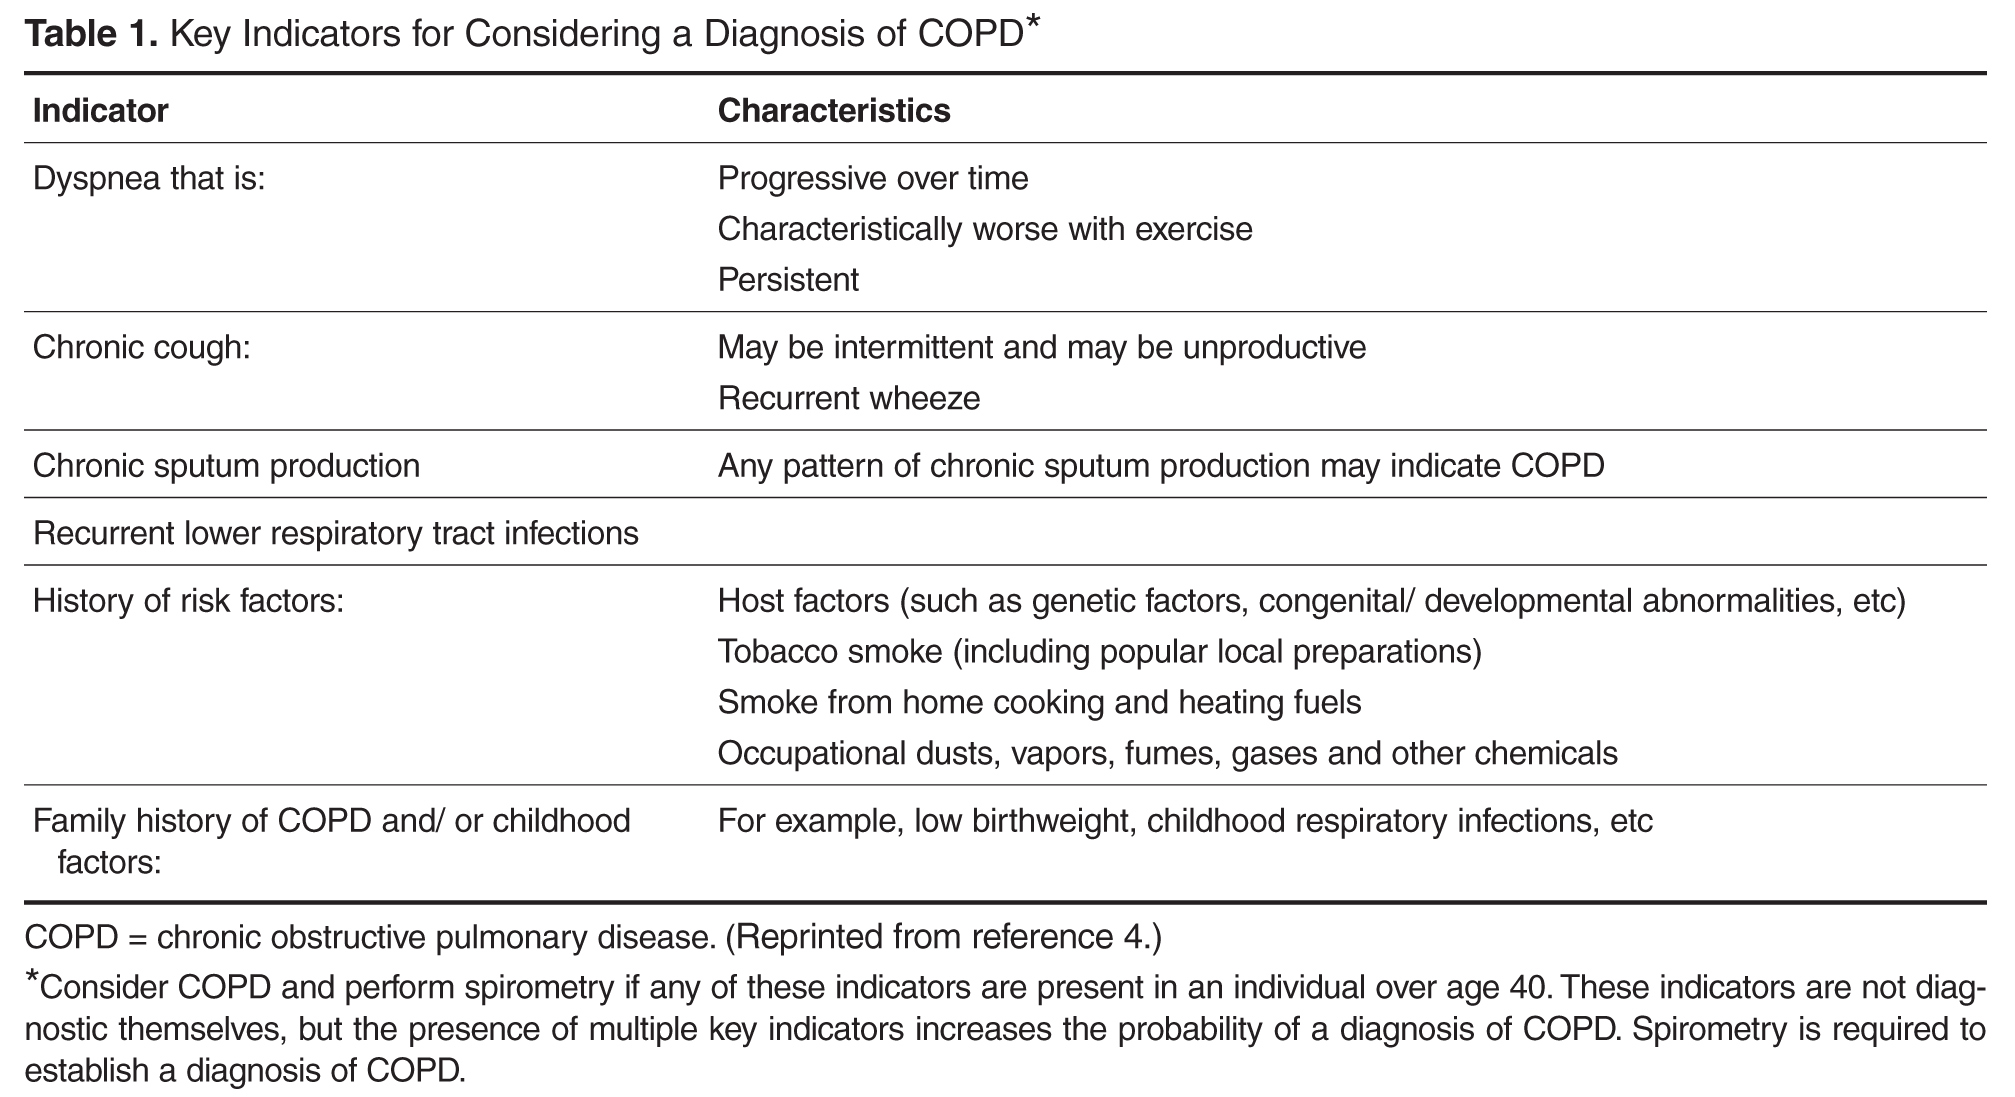
Some of the barriers to COPD diagnosis and subsequent treatment often include insufficient knowledge and awareness about COPD especially among primary care physicians, misdiagnosis of COPD as other respiratory diseases such asthma, as well as patient-related barriers involving lack of awareness of early symptoms of COPD and considering them to be related to aging or smoking [59].
Evaluation
The evaluation of a patient with suspected COPD is oriented toward establishing the correct diagnosis and, once this has occurred, determining the extent of the impairment such that therapy can be appropriately targeted.
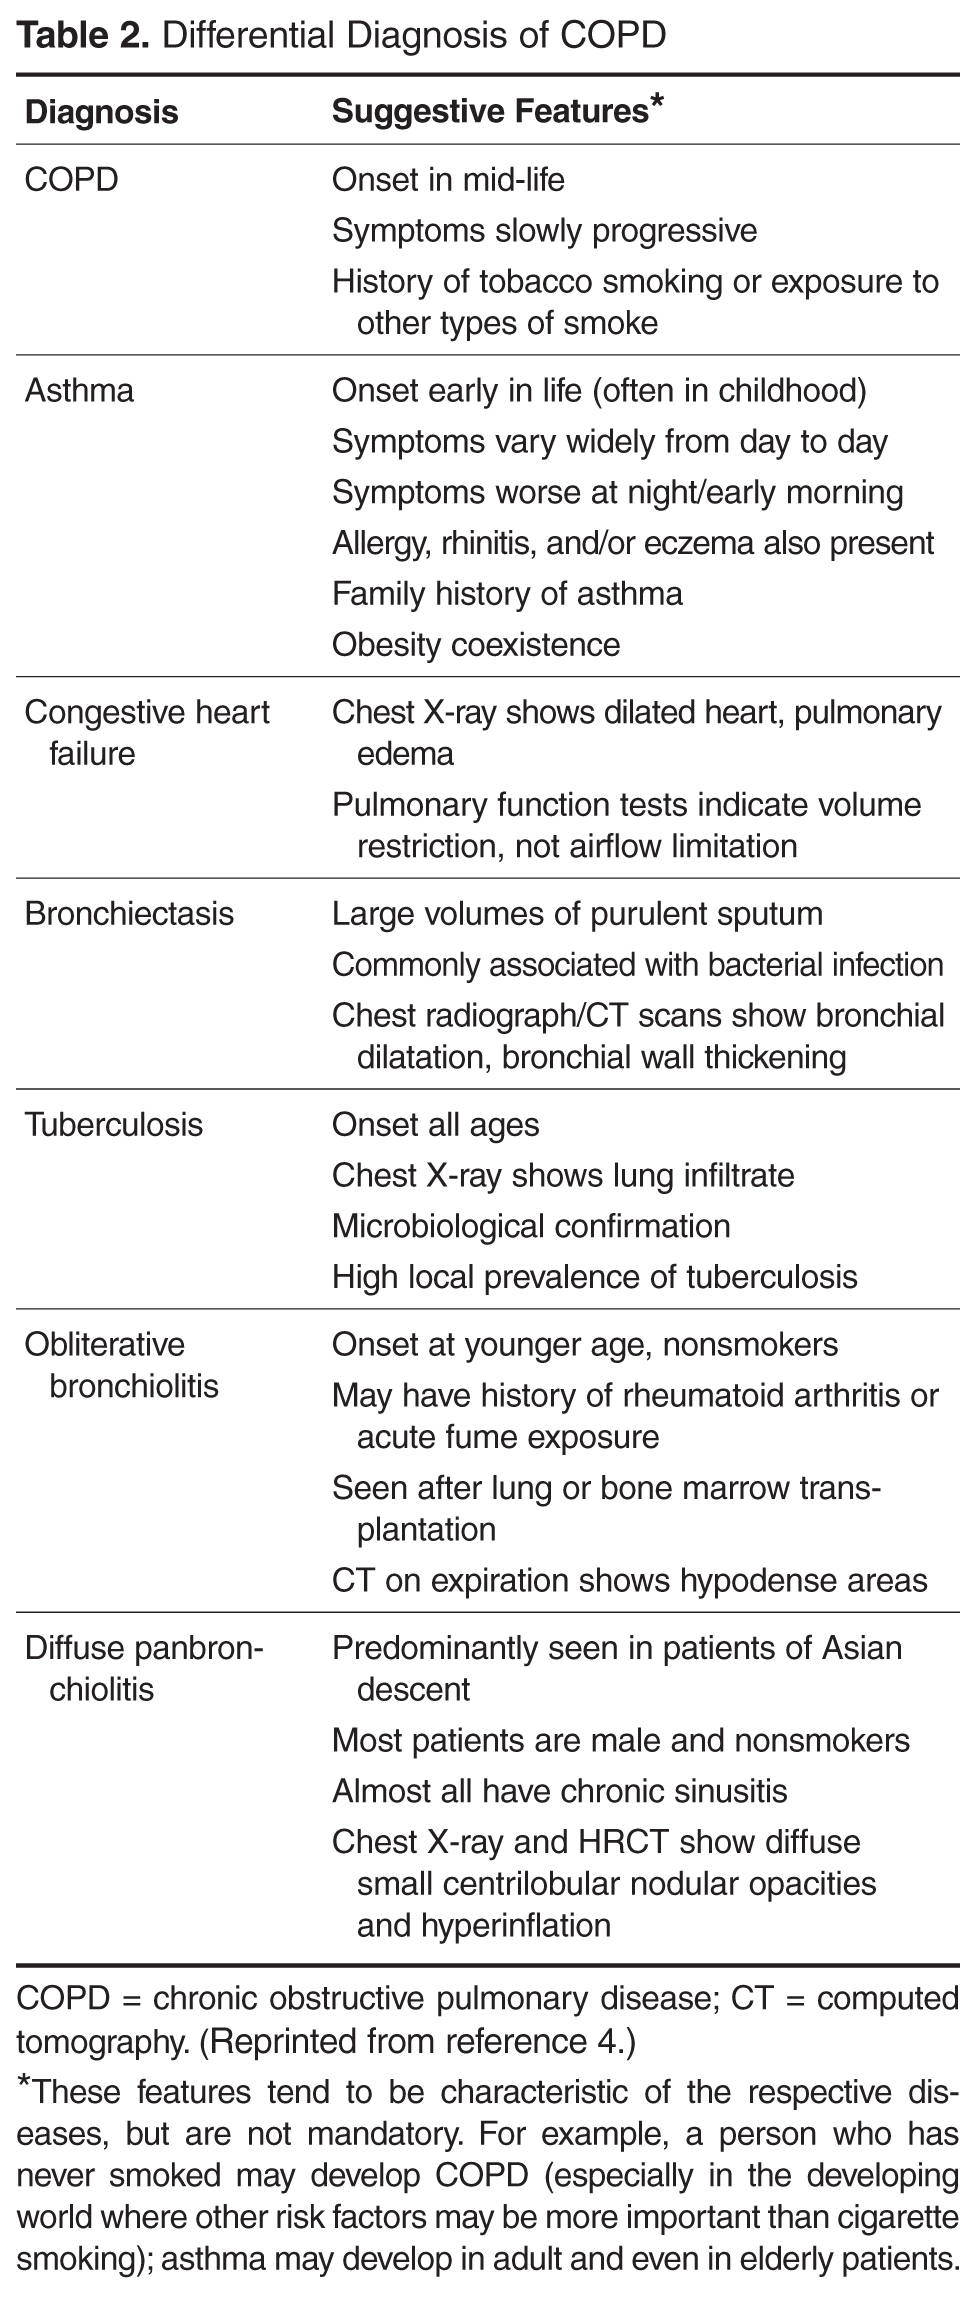
Components in the evaluation of COPD are listed in Table 3. Every patient with suspected COPD should undergo a thorough history and physical examination. The history should pay particular attention to the following: exposure to risk factors; past history of asthma or allergic disease; family history of COPD; presence of comorbid diseases; effect of disease on the patient’s life, including ability to work and mental health status; and possibilities for reducing risk factors, especially smoking cessation [4]. The physical examination is rarely diagnostic in COPD because most physical abnormalities do not occur until the advanced stages of the disease. Physical examination findings in 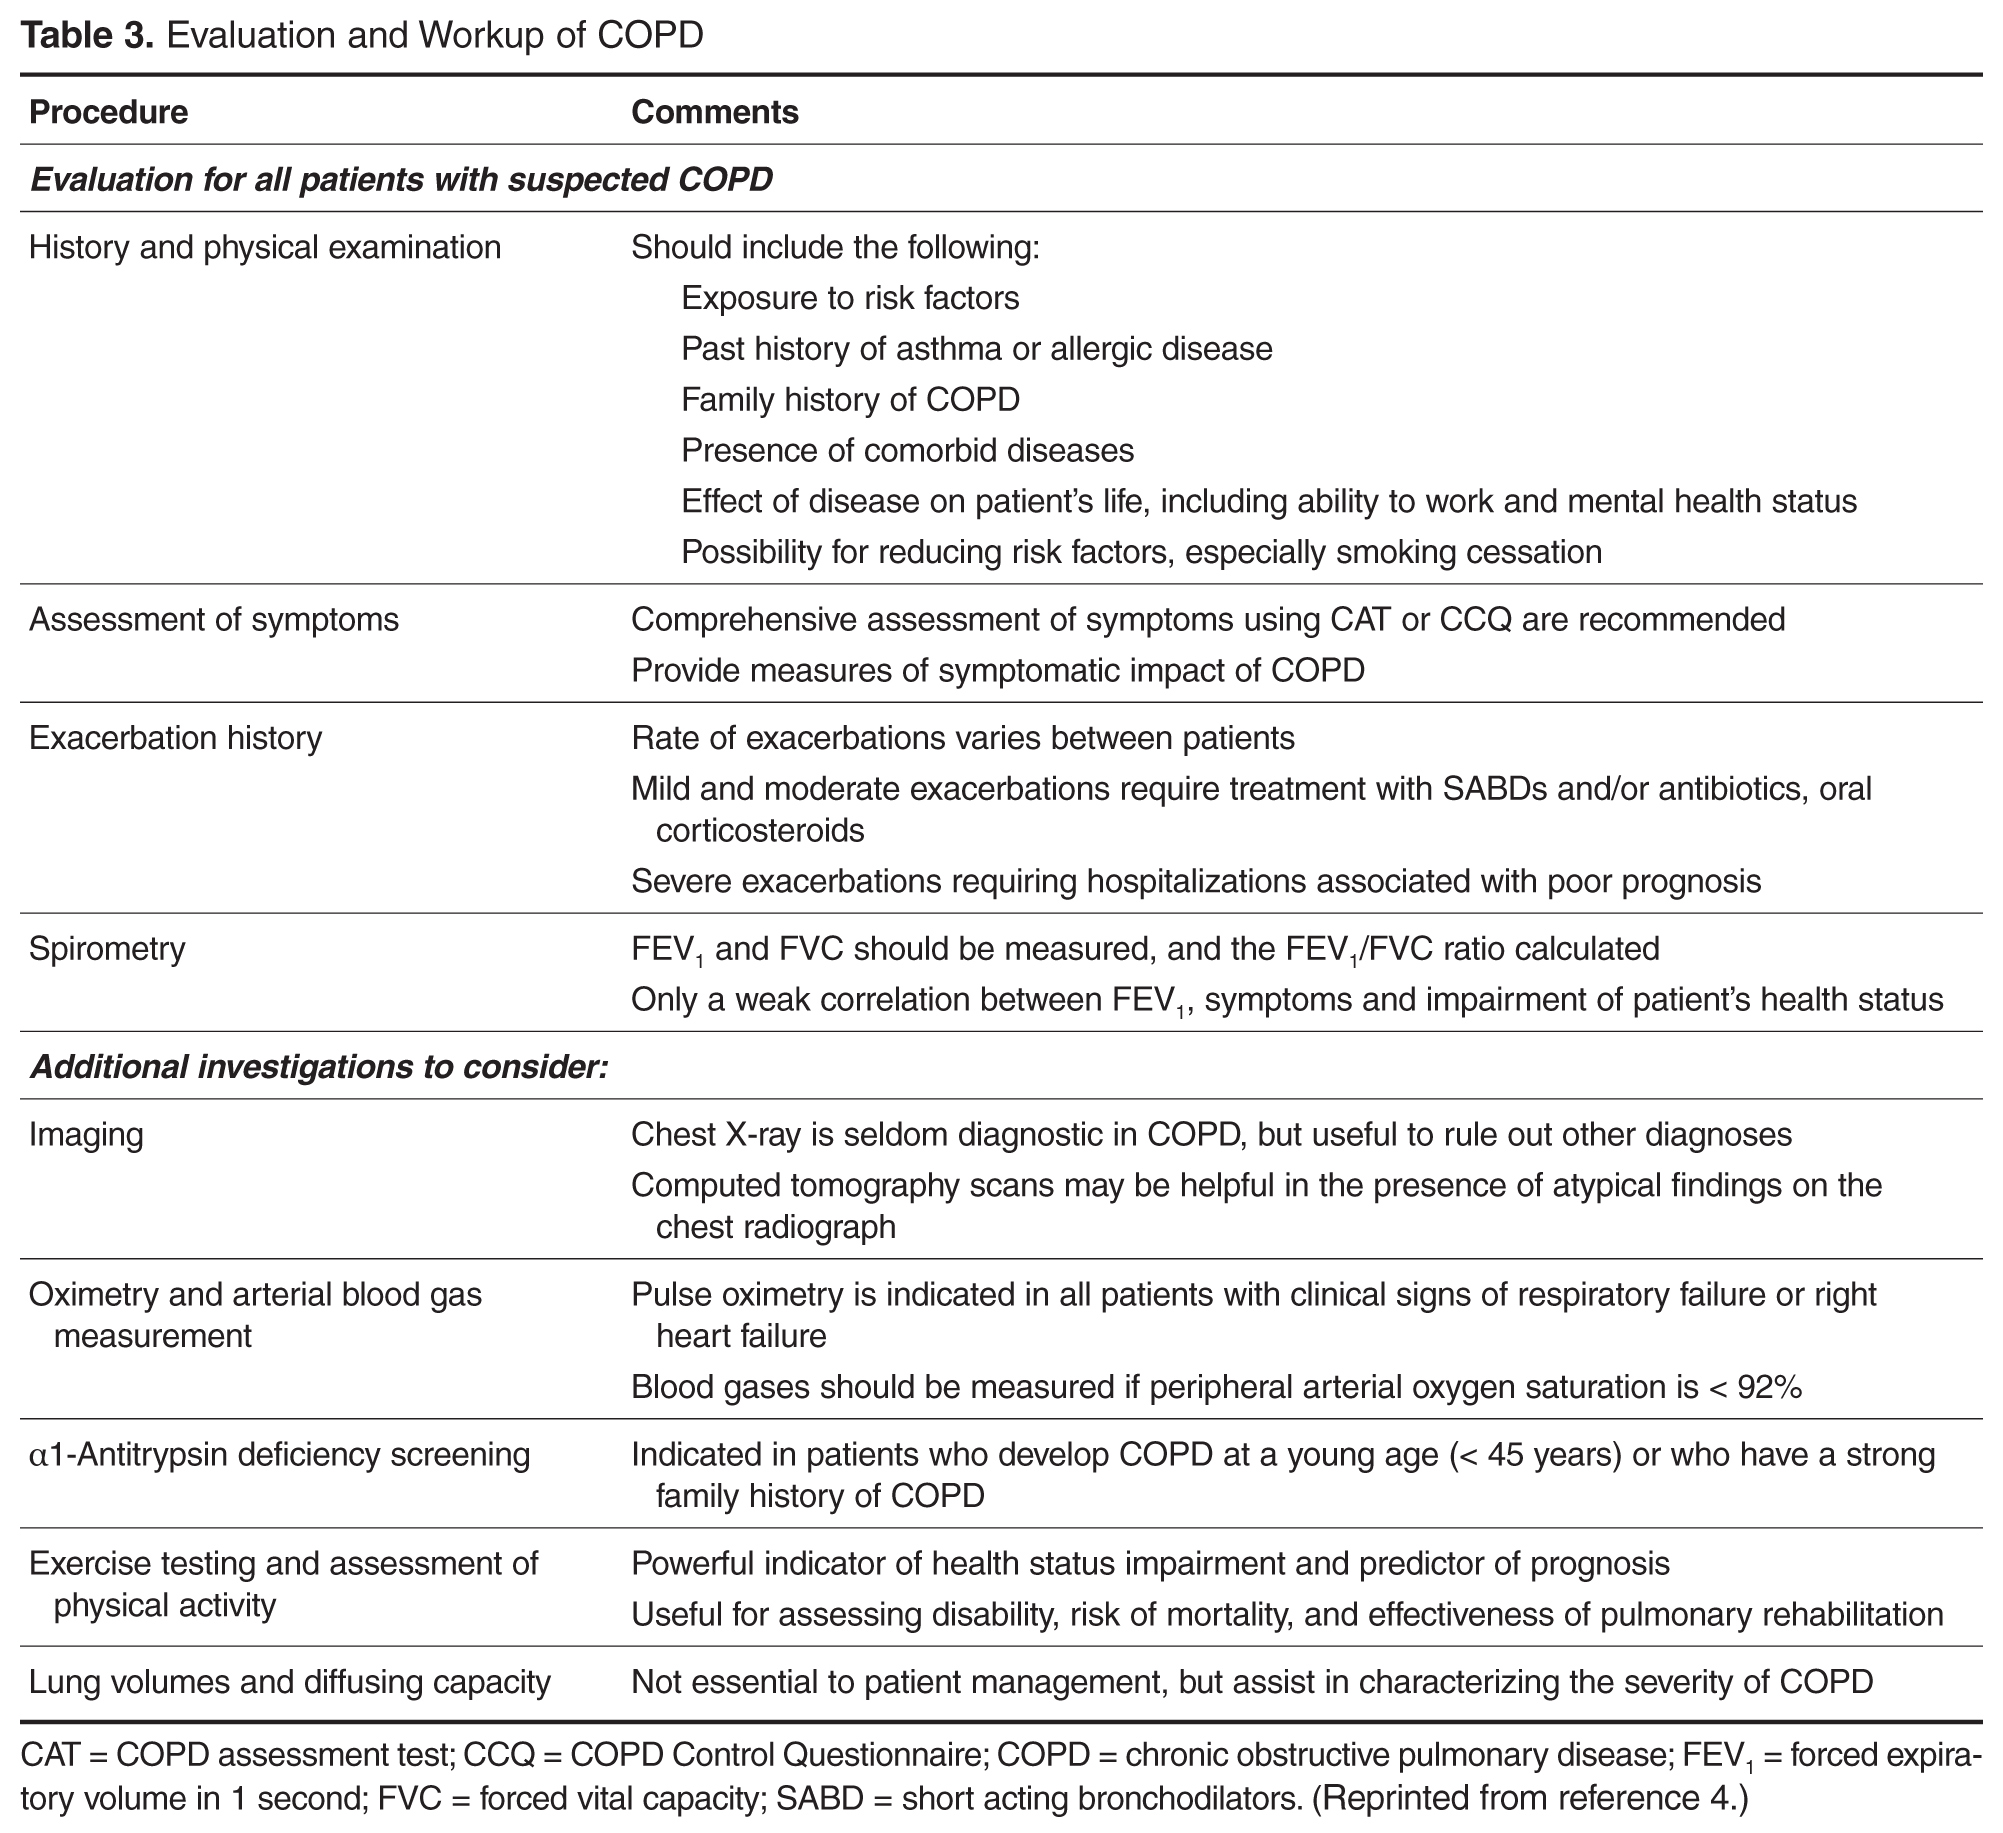
Pulmonary function testing is a critical part of the evaluation of suspected COPD. Whereas most patients with COPD can be managed by a primary care physician, patients with moderate or severe COPD should be evaluated by a specialist [4].
Once the diagnosis of moderate or severe COPD has been established, further testing, including chest radiograph, arterial blood gas determination, screening for α1-antitrypsin deficiency, 6-minute walk testing or exercise oxymetry may be indicated based on the patient’s history and/or clinical findings. Data from computed tomography scans are useful in some advanced cases.
Prognosis of COPD is often influenced by presence of various comorbidities including extrapulmonary, such as osteoporosis, metabolic syndrome, and depression that may be seen as parts of multimorbidity associated with aging [60,61]. Therefore, it is advised to look for comorbidities in COPD patients with any severity of airflow obstruction and treat them accordingly [4].
Therapy for COPD targets reducing risk factors, improving symptoms, and decreasing the risk of exacerbations [10]. Interventions include smoking cessation, vaccinations, decreasing exposures to occupational and environmental pollutants, pulmonary rehabilitation, bronchodilators, and corticosteroids. Select patients with advanced COPD may benefit from other interventions, such as surgical reduction of lung size, lung transplant, the phosphodiesterase inhibitor roflumilast and chronic treatment with antibiotics such as macrolides.
Conclusion
COPD is a common disease that is a leading cause of morbidity and mortality, both in the United States and worldwide. Most cases of COPD are attributable to smoking. Although its incidence among men has plateaued, it continues to increase among women. COPD, particularly in its early stages, is under-diagnosed in the United States. An increased awareness among physicians of the prevalence of mild COPD and the importance of spirometry in diagnosing the disease is important in combating the disease.
Corresponding author: David M. Mannino, MD, Department of Preventive Medicine and Environmental Health, University of Kentucky College of Public Health, 111 Washington Avenue, Lexington, KY 40536, [email protected].
Financial disclosures: Dr. Mannino has received fees from GlaxoSmithKline, Novartis, AstraZeneca, Sunovion, and Boehringer Ingelheim for advisory board services.
1. Rennard SI. COPD: overview of definitions, epidemiology, and factors influencing its development. Chest 1998;113(4 Suppl):235S–41S.
2. National Center for Health Statistics. Health, United States, 2015: with special feature on racial and ethnic health disparities. Hyattsville, MD; 2016.
3. Mannino DM, Gagnon RC, Petty TL, Lydick E. Obstructive lung disease and low lung function in adults in the United States: data from the National Health and Nutrition Examination Survey, 1988-1994. Arch Intern Med 2000;160:1683–9.
4. From the Global Strategy for the Diagnosis, Management and Prevention of COPD, Global Initiative for Chronic Obstructive Lung Disease (GOLD) 2017. Available at http://goldcopd.org.
5. Vestbo J, Hurd SS, Rodriguez-Roisin R. The 2011 revision of the global strategy for the diagnosis, management and prevention of COPD (GOLD) – why and what? Clin Respir J 2012;6:208–14.
6. Standards for the diagnosis and care of patients with chronic obstructive pulmonary disease. American Thoracic Society. Am J Respir Crit Care Med 1995;152(5 Pt 2):S77–121.
7. Siafakas N, Vermeire P, Pride Na, et al. Optimal assessment and management of chronic obstructive pulmonary disease (COPD). Eur Respir J 1995;8:1398–420.
8. Celli BR, MacNee W, Agusti A, et al. Standards for the diagnosis and treatment of patients with COPD: a summary of the ATS/ERS position paper. Eur Respir J 2004;23:932–46.
9. Swanney MP, Ruppel G, Enright PL, et al. Using the lower limit of normal for the FEV1/FVC ratio reduces the misclassification of airway obstruction. Thorax 2008;63:1046–51.
10. Bestall J, Paul E, Garrod R, et al. Usefulness of the Medical Research Council (MRC) dyspnoea scale as a measure of disability in patients with chronic obstructive pulmonary disease. Thorax 1999;54:581–6.
11. Vestbo J, Hurd SS, Agusti AG, et al. Global strategy for the diagnosis, management, and prevention of chronic obstructive pulmonary disease: GOLD executive summary. Am J Respir Crit Care Med 2013;187:347–65.
12. Pauwels RA, Buist AS, Calverley PM, et al. Global strategy for the diagnosis, management, and prevention of chronic obstructive pulmonary disease. Am J Respir Crit Care Med 2001;163:1256–76.
13. Dirksen A, Christensen H, Evald T, et al. Bronchodilator and corticosteroid reversibility in ambulatory patients with airways obstruction. Danish Med Bull 1991;38:486–9.
14. Sin DD, Miravitlles M, Mannino DM, et al. What is asthma-COPD overlap syndrome? Towards a consensus definition from a round table discussion. Eur Respir J 2016;48:664–73.
15. Hansen EF, Phanareth K, Laursen LC, et al. Reversible and irreversible airflow obstruction as predictor of overall mortality in asthma and chronic obstructive pulmonary disease. Am J Respir Crit Care Med 1999;159(4 Pt 1):1267–71.
16. Ford ES, Croft JB, Mannino DM, et al. COPD surveillance—United States, 1999-2011. Chest 2013;144:284–305.
17. Plan and operation of the Third National Health and Nutrition Examination Survey, 1988-94. Series 1: programs and collection procedures. Vital and health statistics Ser 1, Programs and collection procedures. 1994:1–407.
18. Martinez CH, Mannino DM, Jaimes FA, et al. Undiagnosed Obstructive lung disease in the United States. Associated factors and long-term mortality. Ann Am Thorac Soc 2015;12:1788–95.
19. Tilert T, Dillon C, Paulose-Ram R, et al. Estimating the U.S. prevalence of chronic obstructive pulmonary disease using pre- and post-bronchodilator spirometry: the National Health and Nutrition Examination Survey (NHANES) 2007-2010. Respir Res 2013;14:103.
20. Prentice HA, Mannino DM, Caldwell GG, Bush HM. Significant bronchodilator responsiveness and “reversibility” in a population sample. COPD 2010;7:323–30.
21. Chang JT, Moran MB, Cugell DW, Webster JR. COPD in the elderly: a reversible cause of functional impairment. Chest 1995;108:736–40.
22. Ulrik C, Backer V. Nonreversible airflow obstruction in life-long nonsmokers with moderate to severe asthma. Eur Respir J 1999;14:892–6.
23. Hing E, Hall MJ, Ashman JJ, Xu J. National hospital ambulatory medical care survey: 2007 outpatient department summary. Natl Health Stat Report 2010;28:1–32.
24. Niska R, Bhuiya F, Xu J. National hospital ambulatory medical care survey: 2007 emergency department summary. Natl Health Stat Report 2010;26:1–31.
25. Kozak LJ, DeFrances CJ, Hall MJ. National hospital discharge survey: 2004 annual summary with detailed diagnosis and procedure data. Vital and health statistics Series 13, Data from the National Health Survey. 2006(162):1–209.
26. Murphy SL, Xu J, Kochanek KD. Deaths: final data for 2010. National vital statistics reports: from the Centers for Disease Control and Prevention, National Center for Health Statistics, National Vital Statistics System. 2013;61:1–117.
27. Mannino DM, Brown C, Giovino GA. Obstructive lung disease deaths in the United States from 1979 through 1993. An analysis using multiple-cause mortality data. Am J Respir Crit Care Med 1997;156(3 Pt 1):814–8.
28. Camilli AE, Robbins DR, Lebowitz MD. Death certificate reporting of confirmed airways obstructive disease. Am J Epidemiol 1991;133:795–800.
29. Miller JD, Foster T, Boulanger L, et al. Direct Costs of COPD in the U.S.: An Analysis of Medical Expenditure Panel Survey (MEPS) Data. COPD 2005;2:311–8.
30. Ford ES, Murphy LB, Khavjou O, et al. Total and state-specific medical and absenteeism costs of COPD among adults aged >/= 18 years in the United States for 2010 and projections through 2020. Chest 2015;147:31–45.
31. Mannino DM. Counting costs in COPD: what do the numbers mean? Chest 2015;147:3–5.
32. Murray CJ, Vos T, Lozano R, et al. Disability-adjusted life years (DALYs) for 291 diseases and injuries in 21 regions, 1990-2010: a systematic analysis for the Global Burden of Disease Study 2010. Lancet 2012;380:2197–223.
33. Murray CJ, Abraham J, Ali MK, et al. The state of US health, 1990-2010: burden of diseases, injuries, and risk factors. JAMA 2013;310:591–606.
34. Lopez AD, Murray CC. The global burden of disease 1990–2020. Nat Med 1998;4:1241–3.
35. Cohen SB-Z, Paré PD, Man SFP, Sin DD. The growing burden of chronic obstructive pulmonary disease and lung cancer in women. Am J Respir Crit Care Med 2007;176:113–20.
36. Han MK, Postma D, Mannino DM, et al. Gender and chronic obstructive pulmonary disease: why it matters. Am J Respir Crit Care Med. 2007;176:1179–84.
37. Tanoue LT. Cigarette smoking and women’s respiratory health. Clin Chest Med 2000;21:47–65, viii.
38. Silverman EK, Weiss ST, Drazen JM, et al. Gender-related differences in severe, early-onset chronic obstructive pulmonary disease. Am J Respir Crit Care Med 2000;162:2152–8.
39. Carter R, Nicotra B, Huber G. Differing effects of airway obstruction on physical work capacity and ventilation in men and women with COPD. Chest 1994;106:1730–9.
40. Foreman MG, Zhang L, Murphy J, et al. Early-onset chronic obstructive pulmonary disease is associated with female sex, maternal factors, and African American race in the COPDGene Study. Am J Respir Crit Care Med 2011;184:414–20.
41. Sørheim I-C, Johannessen A, Gulsvik A, et al. Gender differences in COPD: are women more susceptible to smoking effects than men? Thorax 2010;65:480–5.
42. Kanner RE, Connett JE, Altose MD, Buist AS, Lee WW, Tashkin DP, et al. Gender difference in airway hyperresponsiveness in smokers with mild COPD. The Lung Health Study. Am J Respir Crit Care Med 1994;150:956–61.
43. De Marco R, Locatelli F, Sunyer J, Burney P. Differences in incidence of reported asthma related to age in men and women: a retrospective analysis of the data of the European Respiratory Health Survey. Am J Respir Crit Care Med 2000;162:68–74.
44. Moorman JE, Moorman J, Mannino DM. Increasing US asthma mortality rates: who is really dying? J Asthma 2001;38:65–71.
45. Mannino DM, Homa DM, Pertowski CA, et al. Surveillance for asthma—United States, 1960–1995. MMWR CDC Surveill Summ 1998;47:1–27.
46. Snider GL. Molecular epidemiology: a key to better understanding of chronic obstructive lung disease. Monaldi Arch Chest Dis 1995;50:3–6.
47. Hogg JC. Chronic bronchitis: the role of viruses. Semin Respir Infect 2000;15:32–40.
48. Kraft M, Cassell GH, Henson JE, et al. Detection of Mycoplasma pneumoniae in the airways of adults with chronic asthma. Am J Respir Crit Care Med 1998;158:998–1001.
49. Hegele RG, Hayashi S, Hogg JC, Paré PD. Mechanisms of airway narrowing and hyperresponsiveness in viral respiratory trad infections. Am J Respir Crit Care Med 1995;151:1659–65.
50. Blanc PD, Iribarren C, Trupin L, et al. Occupational exposures and the risk of COPD: dusty trades revisited. Thorax 2009;64:6–12.
51. Becklake MR. Occupational exposures: evidence for a causal association with chronic obstructive pulmonary disease. Am Rev Respi Dis 1989;140(3 Pt 2):S85–S91.
52. Po JYT, FitzGerald JM, Carlsten C. Respiratory disease associated with solid biomass fuel exposure in rural women and children: systematic review and meta-analysis. Thorax 2011;66:232–9.
53. Mannino DM, Buist AS. Global burden of COPD: risk factors, prevalence, and future trends. Lancet 2007;370:765–73.
54. Trupin L, Earnest G, San Pedro M, et al. The occupational burden of chronic obstructive pulmonary disease. Eur Respir J 2003;22:462–9.
55. Andersen ZJ, Hvidberg M, Jensen SS, et al. Chronic obstructive pulmonary disease and long-term exposure to traffic-related air pollution. Am J Respir Crit Care Med 2011;183:455–61.
56. Agusti À, Soriano JB. COPD as a systemic disease. COPD 2008;5:133–8.
57. Eisner MD, Blanc PD, Yelin EH, et al. COPD as a systemic disease: impact on physical functional limitations. Am J Med 2008;121:789–96.
58. Cekerevac I, Lazic Z, Petrovic M, Novkovic L. COPD and depression. Eur Respir J 2012;40(Suppl 56).
59. Fromer L. Diagnosing and treating COPD: understanding the challenges and finding solutions. Int J Gen Med 2011;4:729–39.
60. Cavaillès A, Brinchault-Rabin G, Dixmier A, et al. Comorbidities of COPD. Eur Respir Rev 2013;22:454–75.
61. Barnes PJ. Gold 2017: A new report. Chest 2017;151:245–6.
62. Choo C. Combination therapy options in Stable COPD. US Pharm 2010;35:31–7.
From the Department of Preventive Medicine and Environmental Health, University of Kentucky College of Public Health, Lexington, KY.
Abstract
- Objective: To review the classification, epidemiology, clinical presentation, and evaluation of patients with chronic obstructive pulmonary disease (COPD).
- Methods: Review of the literature.
- Results: While smoking remains the most important risk factor for COPD in much of the developed world, other risk factors, including genetic factors and occupational or environmental exposures, remain important. COPD is the third leading cause of death in the United States. In 2011, 13.7 million adults aged ≥ 25 years were diagnosed with COPD in the United States, and as many as 12 million adults may have COPD that is undiagnosed. In 2010, COPD was responsible for an estimated 10.3 million physician office visits and 1.5 million emergency room visits and was estimated to be the second leading cause of disability-adjusted life years lost among the US population. COPD has primary, secondary, and tertiary prevention strategies. The treatment of COPD has improved in recent years, with new therapies improving patient quality of life.
- Conclusion: COPD remains a serious public health problem that is often underdiagnosed, particularly in its early stages.
Key words: Chronic obstructive pulmonary disease; epidemiology; mortality; smoking; evaluation.
Chronic obstructive pulmonary disease (COPD) is characterized by fixed airflow obstruction with breathing-related symptoms, such as chronic cough, exertional dyspnea, expectoration, and wheeze [1]. These symptoms may occur in conjunction with airway hyperresponsiveness and overlap with other chronic diseases such as asthma. Although COPD is a nonspecific term referring to a set of conditions that develop progressively as a result of a number of different disease processes, it most commonly refers to chronic bronchitis and emphysema. These conditions can be present with or without significant physical impairment. Despite being a very common disease and the third leading cause of death in the United States [2], COPD often is a silent and unrecognized disease, particularly in its early phases [3], and may go untreated.
In this article, we review the classification, epidemiology, clinical presentation, and assessment of patients with COPD.
Definition and Classification
Several different definitions have existed for COPD [4–8]. The Global Initiative for Chronic Obstructive Lung Disease (GOLD), an international collaboration of leading experts in COPD launched in the late 90s with a goal to develop evidence-based recommendations for diagnosis and management of COPD [4], currently defines COPD as “a common, preventable and treatable disease that is characterized by persistent respiratory symptoms and airflow limitation that is due to airway and/or alveolar abnormalities usually caused by significant exposure to noxious particles or gases” [4].
Severity of COPD has typically been determined using the degree of lung function impairment, although the wisdom of this approach has been questioned,
Previous definitions of COPD differentiated between chronic bronchitis, asthma, and emphysema, acknowledging that there is frequently overlap between these disease entities [12,13]. The GOLD definition of COPD does not differentiate between chronic bronchitis and emphysema but does note that although asthma and COPD can coexist [4], the largely reversible airflow limitation in asthma merits different therapeutic approaches than the largely irreversible airflow limitation of COPD. The overlap of asthma and COPD in a significant proportion of patients has been the focus of recent work [14].
Epidemiology
Prevalence of COPD
The Behavioral Risk Factor Surveillance System (BRFSS) is an ongoing national random-digit-dialed telephone survey of landline and cellphone households designed to measure behavioral risk factors for the noninstitutionalized adult population of the US [15]. An affirmative response to the following question was defined as physician-diagnosed COPD: “Have you ever been told by a doctor or other health professional that you have chronic obstructive pulmonary disease (COPD), emphysema, or bronchitis?”[16]. Based on 2011 BRFSS survey, 13.7 million adults aged ≥ 25 years were estimated to have a self-reported physician diagnosis of COPD in the United States. The greatest age-adjusted prevalence was found to be clustered along the Ohio River Valley and the southern states [16].
The National Health Interview Survey (NHIS) is an annually conducted, nationally representative survey of the civilian noninstitutionalized population aged 18 years and older. A positive response to one or both of the following questions was used to define COPD: “Have you ever been told by a doctor or other health professional that you had emphysema?” and “During the past 12 months, have you been told by a doctor or other health professional that you had chronic bronchitis?” Age-adjusted COPD prevalence estimates showed significant interyear variation during 1999–2011 period, and were higher in women than in men with the highest prevalence noted in 2001 for both genders [16].
The NHIS estimates for COPD have 2 important limitations. First, these estimates depend on the proper recognition and diagnosis of COPD by both the study participants and their health care providers. This would tend to bias the estimates toward counting fewer cases than actually exist. A bias in the opposite direction, however, is that the term chronic bronchitis in this survey is not precisely defined and could be interpreted as recurrent episodes of acute bronchitis. The finding that “chronic bronchitis” has been reported in 3% to 4% of children supports the presence of this potential bias. The second limitation is that this survey is not able to validate, through physiologic evaluation, whether airway obstruction is present or absent.
These limitations were addressed, in part, by separate nationally representative US surveys that include an examination component, such as the National Health and Nutrition Examination Surveys (NHANES) [17]. An analysis of these data from 1988–1994 and 2007–2012 [18] demonstrated that over 70% of people with evidence of obstruction (based on an FEV1/FVC < 70%) did not have a diagnosis of lung disease (COPD or asthma). In addition, people with evidence of obstruction had a higher risk of mortality whether or not they had diagnosed lung disease [18].
Evaluation of “reversibility” of the airway obstruction requires the administration of bronchodilator, which is not a part of most population-based studies. A subset of participants in the NHANES 2007–2012 survey received a bronchodilator, with a decrease in the estimated prevalence of obstruction from 20.9% to 14.0% [19]. However, a closer look at similar data from a study where all people got a bronchodilator reveal that only a small proportion of people with “reversibility” actually had a significant response to the bronchodilator [20]. In a clinic-based study of subjects with COPD who were aged 69 years and older, 31% demonstrated reversibility, defined as a 15% improvement (from baseline) in FVC and FEV1 following administration of an inhaled bronchodilator [21]. In this study, subjects with more severe obstruction were more likely to have reversibility but would also be more likely to continue to have diminished lung function after maximum improvement was obtained, thus being classified as having “partial reversibility.”
The presence of significant reversibility or partial reversibility in patients with COPD [15] and nonreversible airflow obstruction in asthma patients [22] demonstrates that these diseases can coexist or, alternatively, that there is overlap and imprecision in the ways that these diseases are clinically diagnosed.
Morbidity and Mortality
COPD is a leading cause of disease morbidity and mortality in the United States. The National Center for Health Statistics (NCHS) conducts ongoing surveillance of several health indicators nationally. The NCHS collects physician office visit data using the National Ambulatory Medical Care Survey [23], emergency department visit data and hospital outpatient data using the National Hospital Ambulatory Medical Care Survey [24], hospitalization data using the National Hospital Discharge Survey [25], and death data using the mortality component of the National Vital Statistics System [26]. The following data include the number and rate of COPD events in adults in the United States (using International Classification of Diseases, 9th Revision, Clinical Modification [ICD-9-CM], codes 490, 491, 492 and 496) in these data sets for the most recent years available.
In 2010, COPD was responsible for an estimated 10.3 million physician office visits, with a resulting age-adjusted rate of 494.8 per 10,000 US civilian population [16]. COPD was also responsible for an estimated 1.5 million emergency room visits, with a resulting age-adjusted rate of 72 visits per 10,000 population [16].
COPD is a leading cause of hospitalization in US adults, particularly in older populations. In 2010, almost 699,000 hospitalizations, were attributed to COPD. The age-adjusted rate of COPD hospitalizations (as the primary cause of hospitalization) was 32.2 per 10,000 population in 2010 [16].
Deaths due to or associated with COPD have not significantly changed since 1999. While the age-adjusted death rate among men declined during 1999–2010 (P = 0.001), the rate among women has not changed significantly (P = 0.127). In 2010, 63, 778 men and 69, 797 women aged ≥ 25 years died of COPD [26]. One of the limitations of using the mortality component of the National Vital Statistics System is that it is based on the underlying cause of death as reported on the death certificate; however, many decedents with COPD listed on the death certificate have their death attributed to another cause [27]. The significance of COPD as a contributor to death is undefined when it is present with diseases more likely to be attributed as the underlying cause of death, such as myocardial infarction or lung cancer [28].
COPD is a very costly disease, with estimated direct medical costs in 2004 of $20.9 billion. The estimated indirect costs related to morbidity (loss of work time and productivity) and premature mortality is an additional $16.3 billion, for a total of $37.2 billion [29]. Because COPD may be present but not listed as the underlying cause of death or the primary reason for hospitalization, these cited estimates may underestimate the true cost of COPD. For example, in another analysis of COPD costs in the US, the total for 2010 was estimated at $32.1 billion [30], but could be up to $100 billion [31] depending on the assumptions surrounding comorbid disease.
Another manifestation of the importance of COPD is its effect on the burden of disease in a population determined using disability-adjusted life-years (DALYs). DALYs for a disease or condition are calculated as the sum of the years of life lost due to premature mortality in the population and the years of life lost due to disability [32]. In 2010, COPD was estimated to be the second leading cause of DALYs lost among the North American population [33]. Worldwide, COPD is expected to move up from being the twelfth leading cause of DALYs lost in 1990 to the fifth leading cause in 2020 [34].
Gender Differences
Smoking-related diseases such as COPD and lung cancer are continuing to increase among women in the United States [35,36], while they have plateaued or are decreasing among men [27,37]. Some evidence has emerged that compared with men at a similar level of tobacco smoking, women may be more likely to develop COPD [38] or that the severity of COPD in women may be increased [39–41].
In the Lung Health Study, which evaluated patients with mild COPD, more women than men demonstrated increased airway responsiveness, although this difference was thought to be related to airway caliber rather than gender [42]. Adult women are more likely to both develop and die of asthma than are men [43–45]. In NHANES III, whereas women reported more physician-diagnosed COPD and asthma than men, men and women had similar rates of decreased lung function, and a similar proportion of both men and women with low lung function had undiagnosed lung disease [3]. The current evidence is inadequate to determine whether women who smoke are more likely to develop COPD or have more severe COPD than men, although this question is being studied by various groups.
Risk Factors and Etiology
Smoking is the dominant risk factor for the development and progression of COPD; however, not all smokers develop COPD, and COPD does occur in persons who have never smoked [1], suggesting that other factors are important in the etiology of COPD. Alpha1-antitrypsin deficiency is an important cause of COPD in a very small percentage of cases [46]. Other undefined genetic factors certainly play an important role in COPD development [38]. The role of infections in both the development and progression of COPD is receiving increased attention, including the role of adenoviral infections in emphysema [47–49].
Occupational and environmental exposures to various pollutants (eg, particulate matter, agricultural dusts) are also important factors in the development of COPD [50,51]. Exposure to indoor air pollutants such as smoke from solid biomass fuels is a major risk factor for COPD especially among women and children in low- and middle-income countries [52,53]. Occupational exposure to fumes and dusts remains an important cause for COPD globally [53,54]. Exposure to outdoor air pollution is associated with a risk of development of COPD as well as exacerbation of the existing disease [53,55].
Clinical Presentation
COPD is heterogeneous in its presentation. Based on data from NHANES III, 44% of patients with severe airflow limitation (FEV1 < 50% of predicted) may not report symptoms [3]. Among patients with severe airflow limitation who do report symptoms, the symptoms reported most frequently include wheezing (64%) and shortness of breath (65%).
In recent years, COPD has been increasingly recognized as a systemic illness, with effects on nutritional status, muscle wasting, and depression [56–58]. A large proportion of patients probably have components of chronic bronchitis, asthma, and emphysema occurring together. Although some of this overlap may be related to misdiagnosis, some of it may be a measure of the presence of airflow limitation reversibility, as described above. Better defining individuals in these groups may ultimately help tailor better interventions.
Some of the barriers to COPD diagnosis and subsequent treatment often include insufficient knowledge and awareness about COPD especially among primary care physicians, misdiagnosis of COPD as other respiratory diseases such asthma, as well as patient-related barriers involving lack of awareness of early symptoms of COPD and considering them to be related to aging or smoking [59].
Evaluation
The evaluation of a patient with suspected COPD is oriented toward establishing the correct diagnosis and, once this has occurred, determining the extent of the impairment such that therapy can be appropriately targeted.
Components in the evaluation of COPD are listed in Table 3. Every patient with suspected COPD should undergo a thorough history and physical examination. The history should pay particular attention to the following: exposure to risk factors; past history of asthma or allergic disease; family history of COPD; presence of comorbid diseases; effect of disease on the patient’s life, including ability to work and mental health status; and possibilities for reducing risk factors, especially smoking cessation [4]. The physical examination is rarely diagnostic in COPD because most physical abnormalities do not occur until the advanced stages of the disease. Physical examination findings in
Pulmonary function testing is a critical part of the evaluation of suspected COPD. Whereas most patients with COPD can be managed by a primary care physician, patients with moderate or severe COPD should be evaluated by a specialist [4].
Once the diagnosis of moderate or severe COPD has been established, further testing, including chest radiograph, arterial blood gas determination, screening for α1-antitrypsin deficiency, 6-minute walk testing or exercise oxymetry may be indicated based on the patient’s history and/or clinical findings. Data from computed tomography scans are useful in some advanced cases.
Prognosis of COPD is often influenced by presence of various comorbidities including extrapulmonary, such as osteoporosis, metabolic syndrome, and depression that may be seen as parts of multimorbidity associated with aging [60,61]. Therefore, it is advised to look for comorbidities in COPD patients with any severity of airflow obstruction and treat them accordingly [4].
Therapy for COPD targets reducing risk factors, improving symptoms, and decreasing the risk of exacerbations [10]. Interventions include smoking cessation, vaccinations, decreasing exposures to occupational and environmental pollutants, pulmonary rehabilitation, bronchodilators, and corticosteroids. Select patients with advanced COPD may benefit from other interventions, such as surgical reduction of lung size, lung transplant, the phosphodiesterase inhibitor roflumilast and chronic treatment with antibiotics such as macrolides.
Conclusion
COPD is a common disease that is a leading cause of morbidity and mortality, both in the United States and worldwide. Most cases of COPD are attributable to smoking. Although its incidence among men has plateaued, it continues to increase among women. COPD, particularly in its early stages, is under-diagnosed in the United States. An increased awareness among physicians of the prevalence of mild COPD and the importance of spirometry in diagnosing the disease is important in combating the disease.
Corresponding author: David M. Mannino, MD, Department of Preventive Medicine and Environmental Health, University of Kentucky College of Public Health, 111 Washington Avenue, Lexington, KY 40536, [email protected].
Financial disclosures: Dr. Mannino has received fees from GlaxoSmithKline, Novartis, AstraZeneca, Sunovion, and Boehringer Ingelheim for advisory board services.
1. Rennard SI. COPD: overview of definitions, epidemiology, and factors influencing its development. Chest 1998;113(4 Suppl):235S–41S.
2. National Center for Health Statistics. Health, United States, 2015: with special feature on racial and ethnic health disparities. Hyattsville, MD; 2016.
3. Mannino DM, Gagnon RC, Petty TL, Lydick E. Obstructive lung disease and low lung function in adults in the United States: data from the National Health and Nutrition Examination Survey, 1988-1994. Arch Intern Med 2000;160:1683–9.
4. From the Global Strategy for the Diagnosis, Management and Prevention of COPD, Global Initiative for Chronic Obstructive Lung Disease (GOLD) 2017. Available at http://goldcopd.org.
5. Vestbo J, Hurd SS, Rodriguez-Roisin R. The 2011 revision of the global strategy for the diagnosis, management and prevention of COPD (GOLD) – why and what? Clin Respir J 2012;6:208–14.
6. Standards for the diagnosis and care of patients with chronic obstructive pulmonary disease. American Thoracic Society. Am J Respir Crit Care Med 1995;152(5 Pt 2):S77–121.
7. Siafakas N, Vermeire P, Pride Na, et al. Optimal assessment and management of chronic obstructive pulmonary disease (COPD). Eur Respir J 1995;8:1398–420.
8. Celli BR, MacNee W, Agusti A, et al. Standards for the diagnosis and treatment of patients with COPD: a summary of the ATS/ERS position paper. Eur Respir J 2004;23:932–46.
9. Swanney MP, Ruppel G, Enright PL, et al. Using the lower limit of normal for the FEV1/FVC ratio reduces the misclassification of airway obstruction. Thorax 2008;63:1046–51.
10. Bestall J, Paul E, Garrod R, et al. Usefulness of the Medical Research Council (MRC) dyspnoea scale as a measure of disability in patients with chronic obstructive pulmonary disease. Thorax 1999;54:581–6.
11. Vestbo J, Hurd SS, Agusti AG, et al. Global strategy for the diagnosis, management, and prevention of chronic obstructive pulmonary disease: GOLD executive summary. Am J Respir Crit Care Med 2013;187:347–65.
12. Pauwels RA, Buist AS, Calverley PM, et al. Global strategy for the diagnosis, management, and prevention of chronic obstructive pulmonary disease. Am J Respir Crit Care Med 2001;163:1256–76.
13. Dirksen A, Christensen H, Evald T, et al. Bronchodilator and corticosteroid reversibility in ambulatory patients with airways obstruction. Danish Med Bull 1991;38:486–9.
14. Sin DD, Miravitlles M, Mannino DM, et al. What is asthma-COPD overlap syndrome? Towards a consensus definition from a round table discussion. Eur Respir J 2016;48:664–73.
15. Hansen EF, Phanareth K, Laursen LC, et al. Reversible and irreversible airflow obstruction as predictor of overall mortality in asthma and chronic obstructive pulmonary disease. Am J Respir Crit Care Med 1999;159(4 Pt 1):1267–71.
16. Ford ES, Croft JB, Mannino DM, et al. COPD surveillance—United States, 1999-2011. Chest 2013;144:284–305.
17. Plan and operation of the Third National Health and Nutrition Examination Survey, 1988-94. Series 1: programs and collection procedures. Vital and health statistics Ser 1, Programs and collection procedures. 1994:1–407.
18. Martinez CH, Mannino DM, Jaimes FA, et al. Undiagnosed Obstructive lung disease in the United States. Associated factors and long-term mortality. Ann Am Thorac Soc 2015;12:1788–95.
19. Tilert T, Dillon C, Paulose-Ram R, et al. Estimating the U.S. prevalence of chronic obstructive pulmonary disease using pre- and post-bronchodilator spirometry: the National Health and Nutrition Examination Survey (NHANES) 2007-2010. Respir Res 2013;14:103.
20. Prentice HA, Mannino DM, Caldwell GG, Bush HM. Significant bronchodilator responsiveness and “reversibility” in a population sample. COPD 2010;7:323–30.
21. Chang JT, Moran MB, Cugell DW, Webster JR. COPD in the elderly: a reversible cause of functional impairment. Chest 1995;108:736–40.
22. Ulrik C, Backer V. Nonreversible airflow obstruction in life-long nonsmokers with moderate to severe asthma. Eur Respir J 1999;14:892–6.
23. Hing E, Hall MJ, Ashman JJ, Xu J. National hospital ambulatory medical care survey: 2007 outpatient department summary. Natl Health Stat Report 2010;28:1–32.
24. Niska R, Bhuiya F, Xu J. National hospital ambulatory medical care survey: 2007 emergency department summary. Natl Health Stat Report 2010;26:1–31.
25. Kozak LJ, DeFrances CJ, Hall MJ. National hospital discharge survey: 2004 annual summary with detailed diagnosis and procedure data. Vital and health statistics Series 13, Data from the National Health Survey. 2006(162):1–209.
26. Murphy SL, Xu J, Kochanek KD. Deaths: final data for 2010. National vital statistics reports: from the Centers for Disease Control and Prevention, National Center for Health Statistics, National Vital Statistics System. 2013;61:1–117.
27. Mannino DM, Brown C, Giovino GA. Obstructive lung disease deaths in the United States from 1979 through 1993. An analysis using multiple-cause mortality data. Am J Respir Crit Care Med 1997;156(3 Pt 1):814–8.
28. Camilli AE, Robbins DR, Lebowitz MD. Death certificate reporting of confirmed airways obstructive disease. Am J Epidemiol 1991;133:795–800.
29. Miller JD, Foster T, Boulanger L, et al. Direct Costs of COPD in the U.S.: An Analysis of Medical Expenditure Panel Survey (MEPS) Data. COPD 2005;2:311–8.
30. Ford ES, Murphy LB, Khavjou O, et al. Total and state-specific medical and absenteeism costs of COPD among adults aged >/= 18 years in the United States for 2010 and projections through 2020. Chest 2015;147:31–45.
31. Mannino DM. Counting costs in COPD: what do the numbers mean? Chest 2015;147:3–5.
32. Murray CJ, Vos T, Lozano R, et al. Disability-adjusted life years (DALYs) for 291 diseases and injuries in 21 regions, 1990-2010: a systematic analysis for the Global Burden of Disease Study 2010. Lancet 2012;380:2197–223.
33. Murray CJ, Abraham J, Ali MK, et al. The state of US health, 1990-2010: burden of diseases, injuries, and risk factors. JAMA 2013;310:591–606.
34. Lopez AD, Murray CC. The global burden of disease 1990–2020. Nat Med 1998;4:1241–3.
35. Cohen SB-Z, Paré PD, Man SFP, Sin DD. The growing burden of chronic obstructive pulmonary disease and lung cancer in women. Am J Respir Crit Care Med 2007;176:113–20.
36. Han MK, Postma D, Mannino DM, et al. Gender and chronic obstructive pulmonary disease: why it matters. Am J Respir Crit Care Med. 2007;176:1179–84.
37. Tanoue LT. Cigarette smoking and women’s respiratory health. Clin Chest Med 2000;21:47–65, viii.
38. Silverman EK, Weiss ST, Drazen JM, et al. Gender-related differences in severe, early-onset chronic obstructive pulmonary disease. Am J Respir Crit Care Med 2000;162:2152–8.
39. Carter R, Nicotra B, Huber G. Differing effects of airway obstruction on physical work capacity and ventilation in men and women with COPD. Chest 1994;106:1730–9.
40. Foreman MG, Zhang L, Murphy J, et al. Early-onset chronic obstructive pulmonary disease is associated with female sex, maternal factors, and African American race in the COPDGene Study. Am J Respir Crit Care Med 2011;184:414–20.
41. Sørheim I-C, Johannessen A, Gulsvik A, et al. Gender differences in COPD: are women more susceptible to smoking effects than men? Thorax 2010;65:480–5.
42. Kanner RE, Connett JE, Altose MD, Buist AS, Lee WW, Tashkin DP, et al. Gender difference in airway hyperresponsiveness in smokers with mild COPD. The Lung Health Study. Am J Respir Crit Care Med 1994;150:956–61.
43. De Marco R, Locatelli F, Sunyer J, Burney P. Differences in incidence of reported asthma related to age in men and women: a retrospective analysis of the data of the European Respiratory Health Survey. Am J Respir Crit Care Med 2000;162:68–74.
44. Moorman JE, Moorman J, Mannino DM. Increasing US asthma mortality rates: who is really dying? J Asthma 2001;38:65–71.
45. Mannino DM, Homa DM, Pertowski CA, et al. Surveillance for asthma—United States, 1960–1995. MMWR CDC Surveill Summ 1998;47:1–27.
46. Snider GL. Molecular epidemiology: a key to better understanding of chronic obstructive lung disease. Monaldi Arch Chest Dis 1995;50:3–6.
47. Hogg JC. Chronic bronchitis: the role of viruses. Semin Respir Infect 2000;15:32–40.
48. Kraft M, Cassell GH, Henson JE, et al. Detection of Mycoplasma pneumoniae in the airways of adults with chronic asthma. Am J Respir Crit Care Med 1998;158:998–1001.
49. Hegele RG, Hayashi S, Hogg JC, Paré PD. Mechanisms of airway narrowing and hyperresponsiveness in viral respiratory trad infections. Am J Respir Crit Care Med 1995;151:1659–65.
50. Blanc PD, Iribarren C, Trupin L, et al. Occupational exposures and the risk of COPD: dusty trades revisited. Thorax 2009;64:6–12.
51. Becklake MR. Occupational exposures: evidence for a causal association with chronic obstructive pulmonary disease. Am Rev Respi Dis 1989;140(3 Pt 2):S85–S91.
52. Po JYT, FitzGerald JM, Carlsten C. Respiratory disease associated with solid biomass fuel exposure in rural women and children: systematic review and meta-analysis. Thorax 2011;66:232–9.
53. Mannino DM, Buist AS. Global burden of COPD: risk factors, prevalence, and future trends. Lancet 2007;370:765–73.
54. Trupin L, Earnest G, San Pedro M, et al. The occupational burden of chronic obstructive pulmonary disease. Eur Respir J 2003;22:462–9.
55. Andersen ZJ, Hvidberg M, Jensen SS, et al. Chronic obstructive pulmonary disease and long-term exposure to traffic-related air pollution. Am J Respir Crit Care Med 2011;183:455–61.
56. Agusti À, Soriano JB. COPD as a systemic disease. COPD 2008;5:133–8.
57. Eisner MD, Blanc PD, Yelin EH, et al. COPD as a systemic disease: impact on physical functional limitations. Am J Med 2008;121:789–96.
58. Cekerevac I, Lazic Z, Petrovic M, Novkovic L. COPD and depression. Eur Respir J 2012;40(Suppl 56).
59. Fromer L. Diagnosing and treating COPD: understanding the challenges and finding solutions. Int J Gen Med 2011;4:729–39.
60. Cavaillès A, Brinchault-Rabin G, Dixmier A, et al. Comorbidities of COPD. Eur Respir Rev 2013;22:454–75.
61. Barnes PJ. Gold 2017: A new report. Chest 2017;151:245–6.
62. Choo C. Combination therapy options in Stable COPD. US Pharm 2010;35:31–7.
Suicide Risk in Older Adults: The Role and Responsibility of Primary Care
From the Primary Care Institute, Gainesville, FL.
Abstract
- Objective: To provide primary care practitioners with the knowledge required to identify and address older adult suicide risk in their practice.
- Methods: Review of the literature and good clinical practices.
- Results: Primary care practitioners play an important role in older adult suicide prevention and must have knowledge about older adult suicide risk, including risk factors and warning signs in this age-group. Practitioners also must appropriately screen for and manage suicide risk. Older adults, particularly older men, are at high risk for suicide, though they may be less likely to report suicide ideation. Additionally, older adults frequently see primary care practitioners within a month prior to death by suicide. A number of older adult–specific risk factors are reviewed, and appropriate screening and intervention for the primary care setting are discussed.
- Conclusion: Primary care practitioners are uniquely qualified to address a broad range of potential risk factors and should be prepared to identify risk factors and warning signs for older adult suicide, ask appropriate questions to screen for suicide risk, and intervene to prevent suicide.
Key words: suicide; older adults; risk factors; screening; safety planning.
Primary care practitioners play an important role in older adult suicide prevention and have a responsibility to identify and address suicide risk among older adults. To do so, practitioners must understand the problem of older adult suicide, recognize risk factors for suicide in older adults, screen for suicide risk, and appropriately assess and manage suicide risk. Primary care practitioners may face challenges in completing these tasks; the goal of this article is to assist practitioners in addressing these challenges.
Suicide in Older Adults
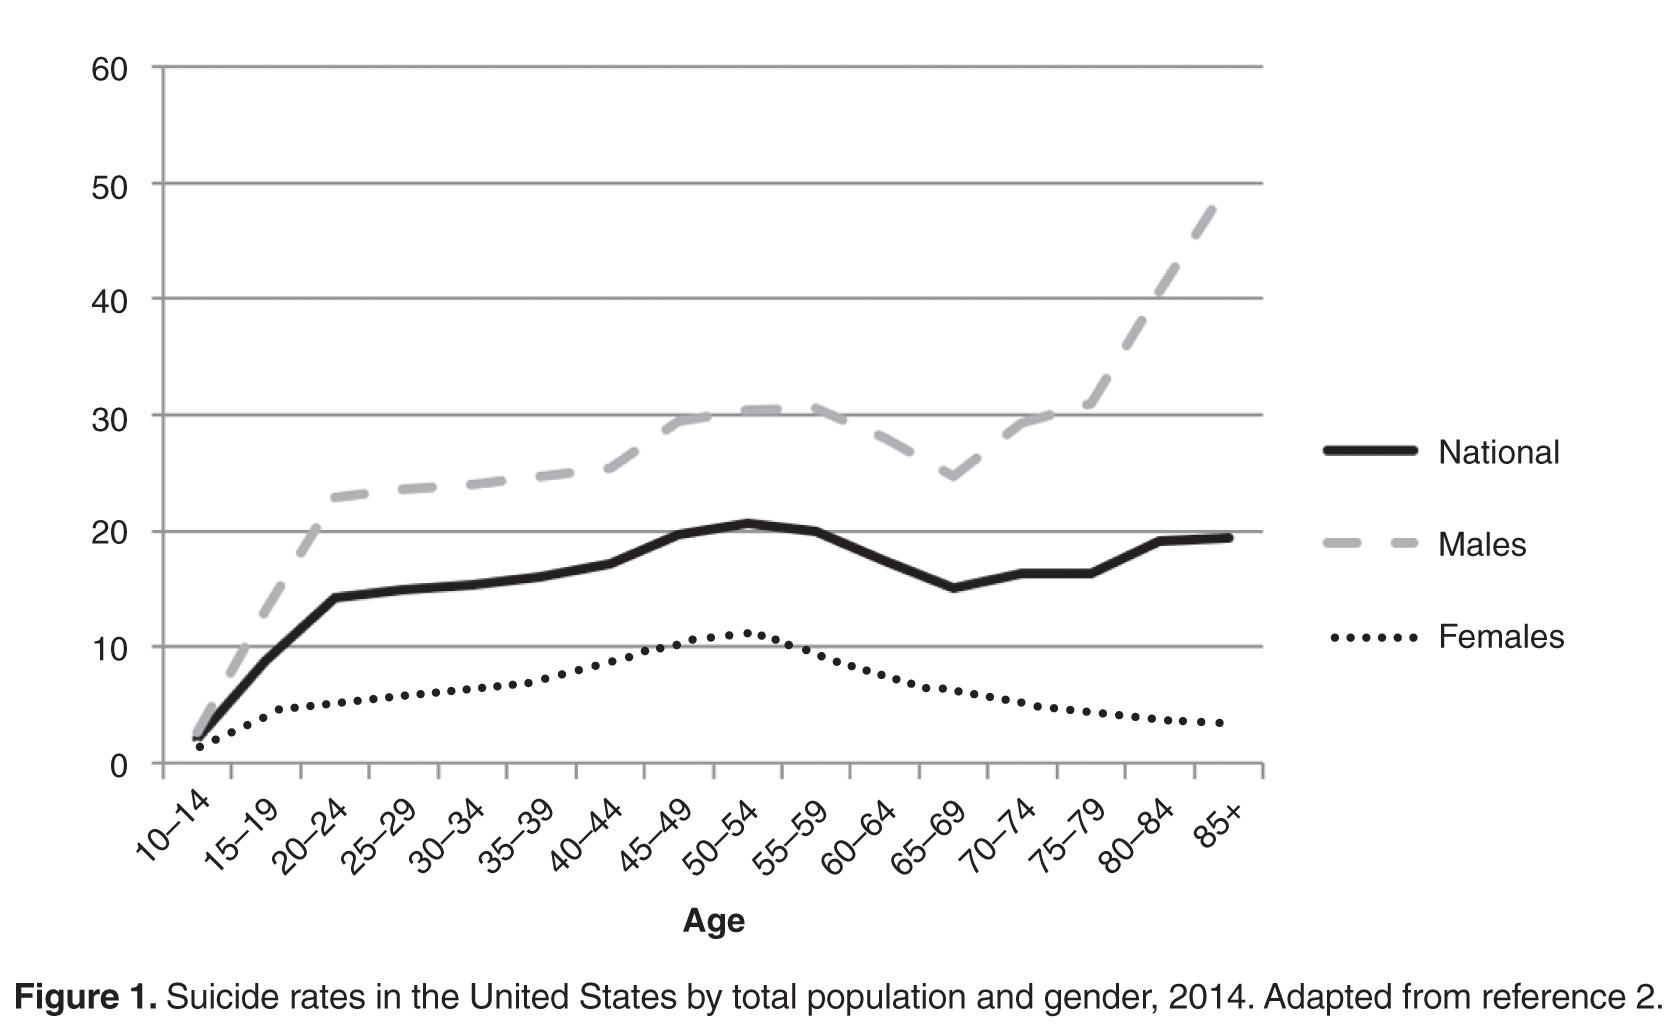
The United States has recently seen increases in suicide rates across the lifespan; from 1999 to 2014, the suicide rate rose by 24% across all ages [3]. Among both men and women aged 65 to 74, the suicide rate increased in this time period [3]. The high suicide rate among older adults is particularly important to address given the increasing numbers of older adults in the United States. By 2050, the older adult population in the United States is expected to reach 88.5 million, more than double the older adult population in 2010 [4]. Additionally, the generation that is currently aging into older adulthood has historically had higher rates of suicide across their lifespan [5]. Given that suicide rates also increase in older adulthood for men, the coming decades may evidence even higher rates of suicide among older adults than previously and it is critical that older adult suicide prevention becomes a public health priority.
It is also essential to discuss other suicide-related outcomes among older adults, including suicide attempts and suicide ideation. This is critical particularly because the ratio of suicide attempts to deaths by suicide in this age-group is 4 to 1 [1]. This is in contrast to the ratio of attempts to deaths across all ages, which is 25 suicide attempts per death by suicide [1]. This means that suicide prevention must occur before a first suicide attempt is made; suicide attempts cannot be used a marker of elevated suicide risk in older adults or an indication that intervention is needed. Intervention is required prior to suicide risk becoming elevated to the point of a suicide attempt.
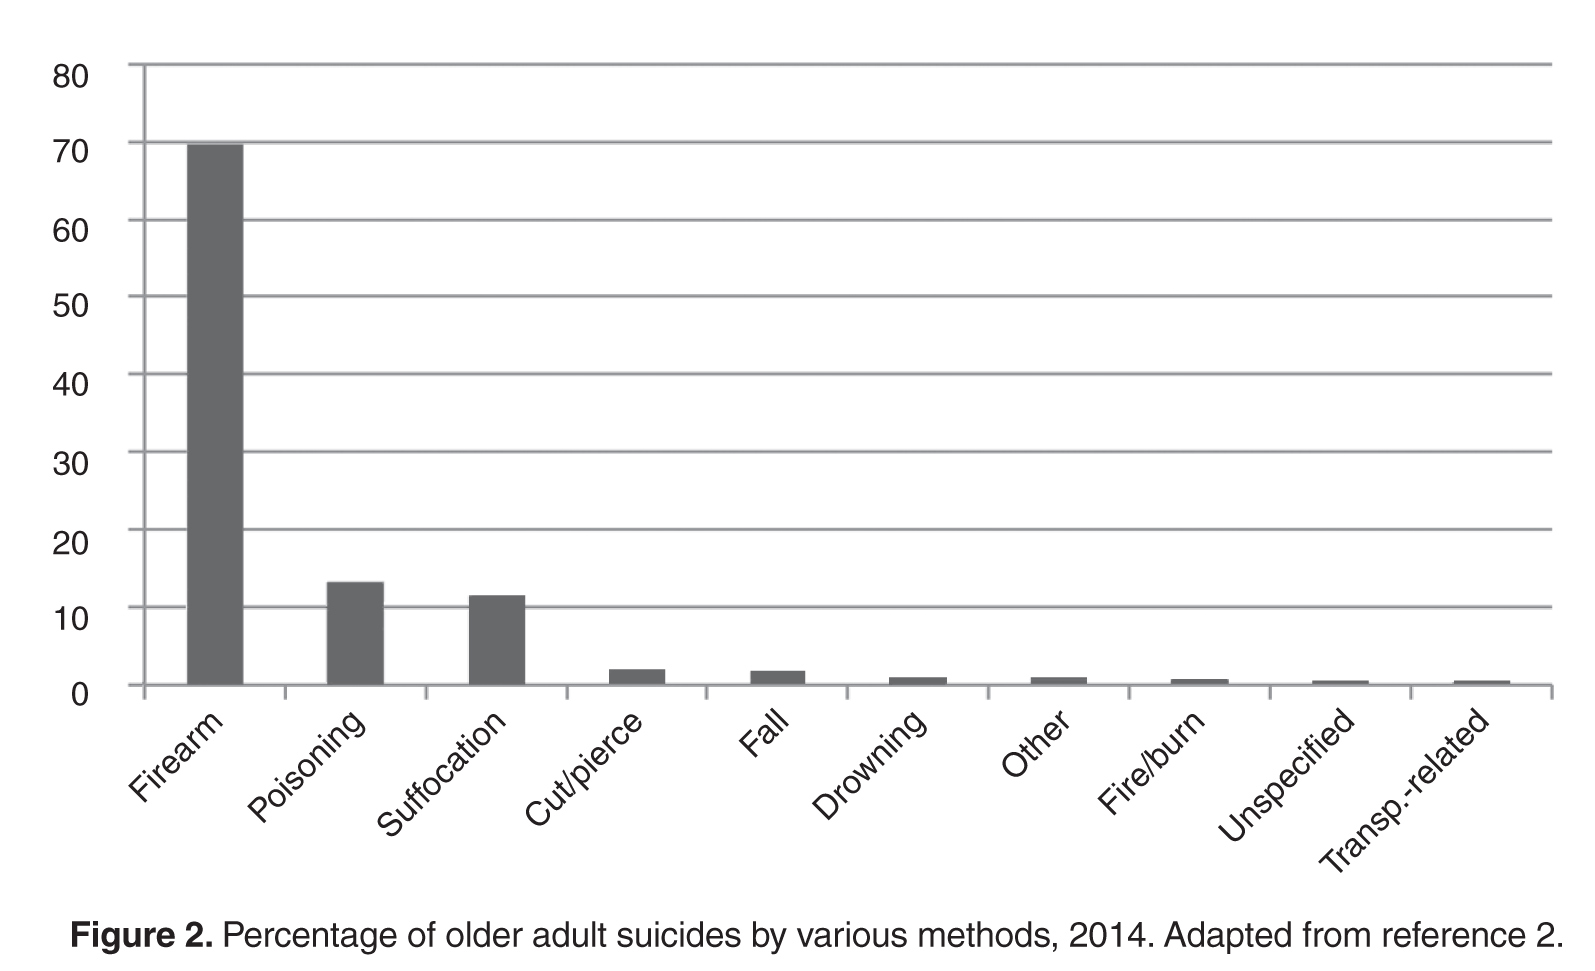
It is also critical to recognize that despite the fact that suicide rates rise with age, reports of suicide ideation decrease with age [7,8]. Across all ages, 3.9% of Americans report past-year suicide ideation; however, only 2.7% of older adults report thoughts of suicide [9]. The discrepancy with the increasing rates of death by suicide with age suggest that suicide risk, and thereby opportunities for intervention, may be missed in this age-group [10].
However, older adults may be more willing to report death ideation, as research has found that over 15% of older adults endorse death ideation [11–13]. Death ideation is a desire for death without a specific desire to end one’s own life, and is an important suicide-related outcome, as older adults with death ideation appear the same as those with suicide ideation in terms of depression, hopelessness, and history of suicidal behavior [14]. Additionally, older adults with death ideation had more hospitalizations, more outpatient visits, and more medical issues than older adults with suicide ideation [15]. Therefore, death ideation should be taken as seriously as suicide ideation in older adults [14]. In sum, the high rates of death by suicide, the likelihood of death on a first or early suicide attempt, and the discrepancy between decreasing reports of suicide ideation and increasing rates of death by suicide among older adults indicate that older adult suicide is an important public health problem.
Suicide Prevention Strategies
Many suicide prevention strategies to date have focused on indicated prevention, which concentrates on individuals already identified at high risk (eg, those with suicide ideation or who have made a suicide attempt) [16]. However, because older adults may not report suicide ideation or survive a first suicide attempt, indicated prevention is likely not enough to be effective in older adult suicide prevention. A multilevel suicide prevention strategy [17] is required to prevent older adult suicide [18]. Older adult suicide prevention must include indicated prevention but must also include selective and universal prevention [16]. Selective prevention focuses on groups who may be at risk for suicide (eg, individuals with depression, older adults) and universal prevention focuses on the entire population (eg, interventions to reduce mental health stigma) [16]. To prevent older adult suicide, crisis intervention is critical, but suicide prevention efforts upstream of the development of a suicidal crisis are also essential.
The Importance of Primary Care
Research indicates that primary care is one of the best settings in which to engage in older adult suicide prevention [18]. Older adults are significantly less likely to receive specialty mental health care than younger adults, even when they have depressive symptoms [19]. Additionally, among older adults who died by suicide, 58% had contact with a primary care provider within a month of their deaths, compared to only 11% who had contact with a mental health specialist [20]. Among older adults who died by suicide, 67% saw any provider in the 4 weeks prior to their death [21]. Approximately 10% of older adults saw an outpatient mental health provider, 11% saw a primary care physician for a mental health issue, and 40% saw a primary care physician for a non-mental health issue [21]. Therefore, because older adults are less likely to receive specialty mental health treatment and so often seen a primary care practitioner prior to death by suicide, primary care may be the ideal place for older adult suicide risk to be detected and addressed, especially as many older adults visit primary care without a mental health presenting concern prior to their death by suicide.
Additionally, older adults may be more likely to disclose suicide ideation to primary care practitioners, with whom they are more familiar, than physicians in other settings (eg, emergency departments). Research has shown that familiarity with a primary care physician significantly increases the likelihood of patient disclosure of psychosocial issues to the physician [22]. Primary care providers also have a critical role as care coordinators; many older adults also see specialty physicians and use the emergency department. In fact, older adults are more likely to use the emergency department than younger adults, but emergency departments are not equipped to navigate the complex care needs of this population [23]. Primary care practitioners are important in ensuring that health issues of older adults are addressed by coordinating with specialists, hospitals (eg, inpatient stays, emergency department visits, surgery) and other health services (eg, home health care, physical therapy). Approximately 35% of older adults in the United States experience a lack of care coordination [24], which can negatively impact their health and leave issues such as suicide ideation unaddressed. Primary care practitioners may be critical in screening for mental health issues and suicide risk during even routine visits because of their familiarity with patients, and also play an important role in coordinating care for older adults to improve well-being and to ensure that critical issues, such as suicide ideation, are appropriately addressed.
Primary care practitioners can also be key in upstream prevention. Primary care practitioners are in a unique role to address risk factors for suicide prior to the development of a suicidal crisis. Because older adults frequently see primary care practitioners, such practitioners may have more opportunities to identify risk factors (eg, chronic pain, depression). Primary care practitioners are also trained to treat a broad range of conditions, providing the skills to address many different risk factors.
Finally, primary care is a setting in which screening for depression and suicide ideation among older adults is recommended. The US Preventive Services Task Force recommends screening for depression in all adults and older adults and provides recommended screening instruments, some of which include questions about self-harm or suicide risk [25]. However, this same group has concluded that there is insufficient evidence to support a recommendation for suicide risk screening [26]. Despite this, the Joint Commission recently released an alert that recommends screening for suicide risk in all settings, including primary care [27]. The Joint Commission requirement for ambulatory care that is relevant to suicide is PC.04.01.01: The organization has a process that addresses the patient’s need for continuing care, treatment, or services after discharge or transfer; behavioral health settings have additional suicide-specific requirements. The recommendations, though, go far beyond this requirement for primary care. The Joint Commission specifically notes that primary care clinicians play an important role in detecting suicide ideation and recommends that primary care practitioners review each patient’s history for suicide risk factors, screen all patients for suicide risk, review screenings before patients leave appointments, and take appropriate actions to address suicide risk when needed [27]. Further details are available in the Joint Commission’s Sentinel Event Alert titled, “Detecting and treating suicide ideation in all settings” [27]. Given these recommendations, primary care is an important setting in which to identify and address suicide risk.
Risk Factors for Older Adult Suicide
Numerous reviews exist that cover many risk factors for suicide in older adults [18,28]. This article will focus briefly on risk factors that are likely to be recognized and potentially addressed by primary care practitioners. Risk factors that apply across the lifespan can be recalled through a mnemonic: IS PATH WARM [29]. These risk factors include suicide Ideation, Substance abuse, Purposelessness, Anxiety (including agitation and poor sleep), feeling Trapped, Hopelessness, social Withdrawal, Anger or rage, Recklessness (ie, engaging in risky activities), and Mood changes. The National Suicide Prevention Lifeline also includes being in unbearable physical pain, perceiving one’s self as a burden to others, and seeking revenge on others as risk factors [30]. More specific to older adults, Conwell notes 5 categories or domains of risk factors with strong research support: psychiatric symptoms, somatic illness, functional impairment, social integration, and personality traits and coping [18,31].
Affective or mood disorders, particularly depression and depressive symptoms, are some of the most well-studied and strongest risk factors for older adult suicide [31]; 71% to 97% of all older adults who die by suicide have psychiatric illnesses [28]. Mood disorders, including major depressive episodes, are most consistently linked to older adult suicide risk; there is evidence as well for anxiety disorders and substance abuse disorders as risk factors, though it is somewhat mixed [28]. Therefore, screening for depression, anxiety, and substance abuse may be key to recognizing potential suicide risk. However, depression and anxiety do not present similarly in younger and older adults [32,33]. Depressive symptoms in older adults may be more somatic (eg, agitation, gastrointestinal symptoms) [32] and may reflect more anhedonia than mood changes [33]. Anxiety in older adults tends to be reported as stress or tension, whereas younger adults report feeling anxious or worried [33]. Additionally, substance abuse is often underrecognized, underdiagnosed, and undertreated in older adults [34]. Proactive screening for substance abuse is important as it may not interfere with work or other obligations in older adults, and therefore substance abuse may not be identified by older adults or others in their lives.
Physical illness may also be a risk factor for suicide [28,31]. Numerous diagnoses have been linked to suicide risk, including cancers, neurodegenerative diseases (eg, amyotrophic lateral sclerosis, Huntington disease), spinal cord injury, cardiovascular disease, and pulmonary disease [28,35]. However, overall illness burden (ie, number of chronic illnesses) [28] and self-perceived health [36] appear to be stronger risk factors than any specific illness. Additionally, authors have suggested that illness itself may not be a particularly strong risk factor, but the effect of illness on depressive symptoms [35], functioning, pain, or hopelessness due to the potential for decline over time [28] may increase suicide risk in older adults. Pain itself has been identified as a risk factor for suicide, as have perceptions of burden to others, hopelessness, and functional impairment [28].
In terms of functional impairment, research has shown that impairment in completing instrumental activities of daily living is associated with higher risk for death by suicide, and cognitive impairment may also be associated with elevated suicide risk [28]. However, there are some discrepant findings regarding the role of dementia in suicide risk, which may reflect medical and psychiatric comorbidities, as well as different stages of dementia or levels of cognitive impairment (eg, hopelessness about cognitive decline may increase suicide risk shortly after diagnosis, whereas lack of insight may decrease risk later in the course of the illness) [37]. Related to functional or cognitive impairment is perceived burdensomeness (ie, the perception that one is a liability or burden to others, to the point that others would be better off if one was gone) [38], which may also be associated with suicide risk in older adults [39,40]. Researchers have found that the interaction between perceived burdensomeness and thwarted belongingness (ie, a belief that one lacks reciprocal caring relationships and does not belong) identified older adults who were likely experiencing suicide ideation but did not report it [41]. These findings indicate that perceived burdensomeness and thwarted belongingness may be key in identifying older adults at risk for suicide.
Thwarted belongingness has also been linked to suicide ideation in older adults [41]. In fact, studies suggest that social integration is especially important for reducing suicide risk in this population [28,31,42]. A larger social network, living with others, and being active in the community are each protective against suicide [28]. Bereavement, which can reduce social connectedness and acts as a significant life stressor, is also an important risk factor [31]. Retirement may also reduce social connectedness, and employment changes have been identified as a suicide risk factor for older adults [28]. Retirement has been linked to risk for death by suicide in this population [43], and may not only serve to reduce social connectedness, but for some older adults may also be a significant role loss or loss of sense of purpose that can influence suicide risk.
Finally, rigid personality traits or coping styles are a risk factor for suicide among older adults [28,31]. As older adults face potential losses, health changes, and functional decline, effective positive coping strategies and flexibility are key to maintaining well-being. If older adults are unable to flexibly cope with these challenges, their risk for suicide increases [28].
In addition to risk factors, which confer suicide risk but do not necessarily suggest that an older adult is thinking about suicide, warning signs exist that indicate that suicide risk is imminent. These include suicidal communication (ie, talking or writing about suicide), seeking access to means, and making preparations for suicide (eg, ensuring a will is in place, giving away prized possessions). One important note is that discussing and preparing for death may be developmentally appropriate for older adults, particularly those with chronic illnesses; however, such appropriate preparation is critically different from talking about suicide or a desire for death.
Additionally, a lack of planning for the future may be a warning sign. For example, older adults who decline to schedule medical follow-up or do not wish to refill needed prescriptions may be exhibiting warning signs that should be addressed. Similarly, not following needed medical regimens (eg, an older adult with diabetes no longer taking insulin) is also a warning sign. Other, potentially more subtle warning signs may include significant changes in mood, sleep, or social interactions. Older adults may become agitated and sleep less when they are considering suicide, or may feel more at ease after they have made the decision to die by suicide and their sleep or mood may improve. Withdrawing from valued others may also be a warning sign. Finally, recent major changes (eg, loss of a spouse, moving to an assisted living facility) may be triggers for suicide risk and can serve as warning signs themselves.
Specific Screening Strategies
Given the numerous risk factors and warning signs for older adult suicide, as well as the time limitations that primary care practitioners face [44,45], it would be impractical to comprehensively assess each older adult who presents at a primary care practice. Therefore, more specific screening is necessary. Most importantly, every older adult should be screened for suicide ideation and death ideation at every visit. Screening at every visit is critical because suicide ideation may develop at any point. Previous research has included screening of over 29,000 older adults in 11 primary care settings for suicide ideation, risk of alcohol misuse, and mental health disorders [15], suggesting that suicide risk screening is feasible. Other studies have also successfully used widespread screening for depression and suicide ideation among older adults in primary care [46–48]. Additionally, in an emergency department setting, universal suicide risk screening has been associated with significantly improved risk detection [49], indicating that improved screening may be beneficial in identifying suicide risk. Importantly, asking about suicide does not cause thoughts of suicide [50]. Additionally, it is a myth that those who talk about suicide ideation will not act on these thoughts [51].
When primary care practitioners inquire about suicide ideation, they should also ask about death ideation; though some may believe that death ideation is not as significant in terms of suicide risk as suicide ideation, recall that research has not found differences in previous suicide attempts or current hopelessness among older adults with death ideation versus suicide ideation [14]. Therefore, screening for death ideation should be completed as part of every suicide risk screening.
Screening can take many forms. Screening may be oral; asking an older adult if he or she is having thoughts of suicide or is experiencing a desire to die is a brief, 2-question screening that may provide valuable information (eg, “Are you having thoughts about your own death or wanting to die?”, “Are you having thoughts of killing yourself or thinking about suicide?”). This screening may be conducted by medical assistants, nurses, care managers, or physicians, with the patient’s responses documented. Importantly, a standard procedure should be implemented to ensure older adults are consistently asked about suicide risk at each visit, but do not feel inundated by such questions from numerous staff.
If verbal questions are asked, they must be asked appropriately. Euphemisms or indirect language should not be used during a screening; older adults should be directly asked about thoughts of death and suicide, not simply asked questions such as, “Have you ever had thoughts of harming or hurting yourself?” A question like this does not adequately assess current suicide risk, as it does not assess current thoughts, nor does it specifically inquire about suicide ideation (ie, killing one’s self). It is also important to phrase questions in a manner that invites honest responses and conveys an openness to listening. For example, asking, “You’re not thinking about suicide, are you?” suggests that the practitioner wants the older adult to say no and is not comfortable with the older adult endorsing suicide ideation. Open questions that allow endorsement or denial (eg, “Are you having thoughts of killing yourself?”) imply that the practitioner is receptive to either an endorsement or denial of suicide ideation.
Alternatively, a written screening can be used; older adults may complete a questionnaire prior to their appointment or while waiting to see their practitioner. Such an assessment may be a brief screening (eg, using similar yes/no questions to an oral screening), or may be a standardized measure. For example, the Geriatric Suicide Ideation Scale [52] is a 31-item self-report measure that provides scores for suicide ideation, death ideation, loss of personal and social worth, and perceived meaning in life. Though there are not standard cutoffs that suggest high versus low suicide risk, responses can be reviewed to identify whether older adults are reporting suicide ideation or death ideation, and can also be compared to norms (ie, average scores) from other older adults [52]. This measure also has the benefit of 2 subscales that do not specifically require reporting thoughts of suicide or death (ie, loss of personal and social worth, perceived meaning in life), which may give practitioners an indication of an older adult’s suicide risk even if the older adult is not comfortable disclosing suicide ideation, as has been shown in previous research [7,8].
Similarly, the Geriatric Depression Scale, which has a validated 15-item version [53], does not directly ask about suicide ideation but has a 5-item subscale that has been found to be highly correlated with reported suicide ideation [54]. When administered to older adult primary care patients, this subscale was an effective measure of suicide ideation; a score of ≥ 1 was the best cutoff for determining whether an older adult reported suicide ideation [55].
Additionally, as noted previously, the interaction between perceived burdensomeness and thwarted belongingness may identify older adults who are potentially experiencing, but not reporting, suicide ideation [41]. The Interpersonal Needs Questionnaire [56] is the validated assessment for both perceived burdensomeness and thwarted belongingness. Perceived burdensomeness is assessed via 6 self-report items, and thwarted belongingness is assessed via 9 self-report items on this measure [56]. There are not specific cutoffs that determine high versus low perceived burdensomeness or thwarted belongingness, but older adults’ responses can provide information about their experiences of these constructs. Administration of the Interpersonal Needs Questionnaire can provide information about potential risk for suicide among older adults who may otherwise deny thoughts of suicide or death.
If the screening for suicide ideation or death ideation is positive (ie, the older adult endorses thoughts of suicide or death), the treating primary care practitioner must then follow up with additional questions to determine current level of suicide risk. To make this determination, at a minimum, follow-up questions should focus on whether the older adult has any intent to die by suicide (eg, “Do you have any intent to act on your thoughts of suicide?”), as well as whether he or she has a plan to die by suicide (eg, “Have you begun formulating a plan to die by suicide?”). When asking about a plan, it is important to determine how specific the plan is. For example, an older adult with a specific method identified and date selected to implement the plan is at much higher risk than an older adult with a relatively vague idea. It is also critical to assess for the older adult’s access to means for suicide. If an older adult has a specific plan and has the capability to carry out the plan (eg, plans to overdose on prescription medication and has large quantities of medication or high-lethality medication at home), he or she is more likely to die by suicide than an older adult who does not have access to means (eg, only has small quantities of low-lethality medication available). A general assessment of risk factors and previous suicidal behavior (ie, any previous suicide attempts) also informs decisions about level of risk and interventions.
After a screening or assessment is completed, a risk determination must be made and documented. Acute suicide risk can be categorized as low, moderate, or high. It is not appropriate to say that there is “no” suicide risk present. Low risk occurs when there is no current suicide ideation, no plan to die by suicide, and no intent to act on suicidal thoughts, especially when the patient has no history of suicidal behavior and few risk factors [57]. Moderate risk is evident when there is current suicide ideation, but no specific plan to die by suicide or intent to act on suicidal thoughts. There are likely warning signs or risk factors, which may include previous suicidal behaviors, present in moderate suicide risk [57]. High risk is indicated by current suicide ideation with plan to die by suicide and suicidal intent. There are significant warning signs and risk factors present; there may also be a recent suicide attempt, though this is not a requirement for a high risk determination [57]. Undetermined suicide risk occurs when a practitioner cannot accurately assess risk, but concern regarding suicide is present; this is primarily used when a patient refuses to answer questions about suicide. Undetermined risk should be treated as at least moderate risk. Because research shows that death ideation has similar outcomes to suicide ideation in older adults [14], death ideation should also be factored into determinations of suicide risk; reports of death ideation may indicate low or moderate risk in older adults, dependent upon other risk factors, suicidal intent, and plan.
After a risk determination is made, it must be documented in the medical record. The level of risk and rationale for that determination must be included [58]. Stating only the level of risk without a rationale (ie, the older adult’s responses to questions) is not adequate, and documenting only the older adult’s responses without a determination of risk is also not sufficient. Finally, it is critical to document the intervention that occurred or steps taken after the level of risk was determined.
Critically, stating only that there was no indication of suicide risk is inadequate. For example, documenting “No evidence of suicide risk” is not appropriate. This documentation does not indicate that the older adult was specifically asked about suicide ideation, death ideation, suicidal intent, or plan to die by suicide. It also does not indicate a level of suicide risk. Examples of appropriate documentation include:
Patient was asked about suicide risk. She denied current suicide ideation but reported death ideation. She denied any current suicidal intent or plan. She also denied any previous suicide attempts. Therefore, acute suicide risk was deemed to be low. Provided patient with wallet card about the National Suicide Prevention Lifeline. Also called the Friendship Line while in the room with the patient to connect her with services. Finally, provided a brief list of local mental health professionals to patient; the patient reported she would like to see Dr. Smith. Called and left a message for Dr. Smith with referral information with patient during appointment.
Patient was asked about suicide risk. He reported both death ideation and suicide ideation. He also reported a nonspecific plan (ie, causing a single-vehicle motor vehicle accident, with no specific plan for the motor vehicle accident or timeframe) and denied any intent to act on his thoughts of suicide. He reported one previous suicide attempt, at age 22, by overdose on over-the-counter medication. He reported that this attempt did not require medical attention. Therefore, acute suicide risk was determined to be moderate. Patient was introduced to the behavioral health specialist, who met with the patient during the appointment to conduct further assessment and intervention.
Specific Intervention Strategies
Despite the fact that the pace of the primary care setting often does not allow for time-intensive intervention, there are ways to address suicide risk in this setting. Importantly, no-suicide contracts should not be used at any time [59,60]. No-suicide contracts are documents that patients who are experiencing suicide ideation are required to sign that state that they will not die by suicide while under the care of the practitioner. These contracts have no evidence of effectiveness, and some researchers argue that they may in fact damage the relationship with patients and serve the practitioner’s needs more than the patient’s needs [59].
One of the best options for older adults at low acute suicide risk is to provide resources and referrals. The National Suicide Prevention Lifeline can be reached at 1-800-273-TALK (8255); trained counselors are available to speak to patients at all times. Wallet cards with information about the National Suicide Prevention Lifeline are available at no charge from the US Substance Abuse and Mental Health Services Administration online store. The Friendship Line is another service available free to adults ages 60 and older, 24 hours per day, 7 days per week; this line can be reached at 1-800-971-0016. The Friendship Line, which is managed by the Institute on Aging, also provides outreach calls to older adults who may be isolated or lonely, increasing connectedness and potentially reducing suicide risk.
Having a ready list of local mental health professionals with expertise in geriatrics and suicide risk to provide to the patient is also beneficial. Recall, though, that older adults are less likely to seek out and receive mental health services [19]; therefore, connecting the patient with resources or referrals during the appointment is critical. If the practitioner does not have time to do this, having a medical assistant or other staff member that the patient knows engage in this step may be appropriate. For example, the patient can call the Friendship Line or National Suicide Prevention Lifeline while in the room with the practitioner, which may reduce anxiety or stigma about doing so and connect the patient with services. Similarly, calling a local mental health professional to make a referral during the appointment may increase the likelihood that the older adult will follow up on the referral.
The most ideal method of intervention for moderate or high acute suicide risk is a warm handoff to a behavioral or mental health specialist. As primary care and behavioral health become more integrated and financially viable as reimbursement through the Centers for Medicare and Medicaid Services improves [61], it is becoming increasingly likely that such a specialist will be on-site and available. Research has found that collaborative care in primary care reduces suicide risk in older adults [46–48,62]. Mental health specialists can conduct more comprehensive assessments and spend more time intervening to reduce suicide risk among older adults with death or suicide ideation. If an on-site behavioral health specialist is not available, older adults at high suicide risk may need to be referred to an emergency department for further evaluation and follow-up. Each state has its own laws and procedures regarding this process, which should be incorporated into a practice’s procedures for addressing high suicide risk. The procedure often involves ensuring that the older adult is accompanied at all times (ie, not left alone in a room), alerting emergency services (usually via phone call to an emergency line, such as 911), and completion of paperwork by a practitioner asserting that the patient is a danger to self. Police or other emergency personnel are then responsible for transporting the patient for further evaluation and determination of whether hospitalization is required.
If more time is available, either via the treating primary care practitioner or other patient care staff in the office, other brief interventions may be beneficial. First, means safety discussions are critical, particularly for older adults with plans for suicide or access to highly lethal means. In such discussions, patients are encouraged to restrict access to the methods that they may use to die by suicide. Plans for restricting access are developed, and when possible, a support person is enlisted to ensure that the plans are carried out. For example, if an older adult has access to firearms (eg, keeps a loaded weapon in his or her nightstand), he or she is encouraged to restrict his or her access to it. Ideally, this is through removing the weapon from the home, either permanently or until suicide risk reduces (eg, giving it to a friend, turning it over to police), but more safe storage may also be an option if the older adult is not willing to remove the weapon from the home. This may mean using a gun lock or storing the weapon in a gun safe, storing ammunition separately from an unloaded weapon, removing the firing pin, or otherwise disassembling the weapon. Means safety counseling has been shown to be effective in reducing suicide rates [63] and is acceptable to patients [64]. Studies indicate that over 90% of individuals who make a suicide attempt and survive do not go on to die by suicide [65]; therefore, reducing access to highly lethal means during a suicidal crisis may be key in reducing suicide rates. Though an in-depth review of means safety counseling is outside the scope of this article, readers are directed to Bryan, Stone, and Rudd’s article for a practical overview of means safety discussions [66].
Second, safety planning is a brief intervention that may be beneficial in the primary care setting [67,68]. The goal of a safety plan is to create an individualized plan to remain safe during a suicidal crisis. Means safety discussion is the last of 6 steps in the safety plan [68]. The first 5 steps include identifying warning signs, using internal coping strategies, social connectedness as distraction, social support for the crisis, and professionals that can be used as resources. When patients can identify specific, individualized warning signs that occur prior to a crisis, they can then use strategies to cope and prevent the crisis from worsening. Coping strategies that are encouraged are first internal (ie, those that can be done without relying on anyone else), such as exercise or journaling. If those do not improve the patient’s mood, then he or she is encouraged to use people or social settings as a distraction (eg, people watching at the mall, calling an acquaintance to chat), and if he or she is still feeling bad, encouraged to get social support for the crisis (eg, calling a family member to discuss the crisis and get support). Finally, if all of these steps are not effective, the older adult is encouraged to reach out to professional supports, such as a mental health provider, the National Suicide Prevention Lifeline, or 911 (or go to an emergency room). Readers are encouraged to review Stanley and Brown’s articles for comprehensive details about safety planning as an intervention [67,68]. Additionally, an article with specific adaptations for safety planning with older adults is forthcoming [69].
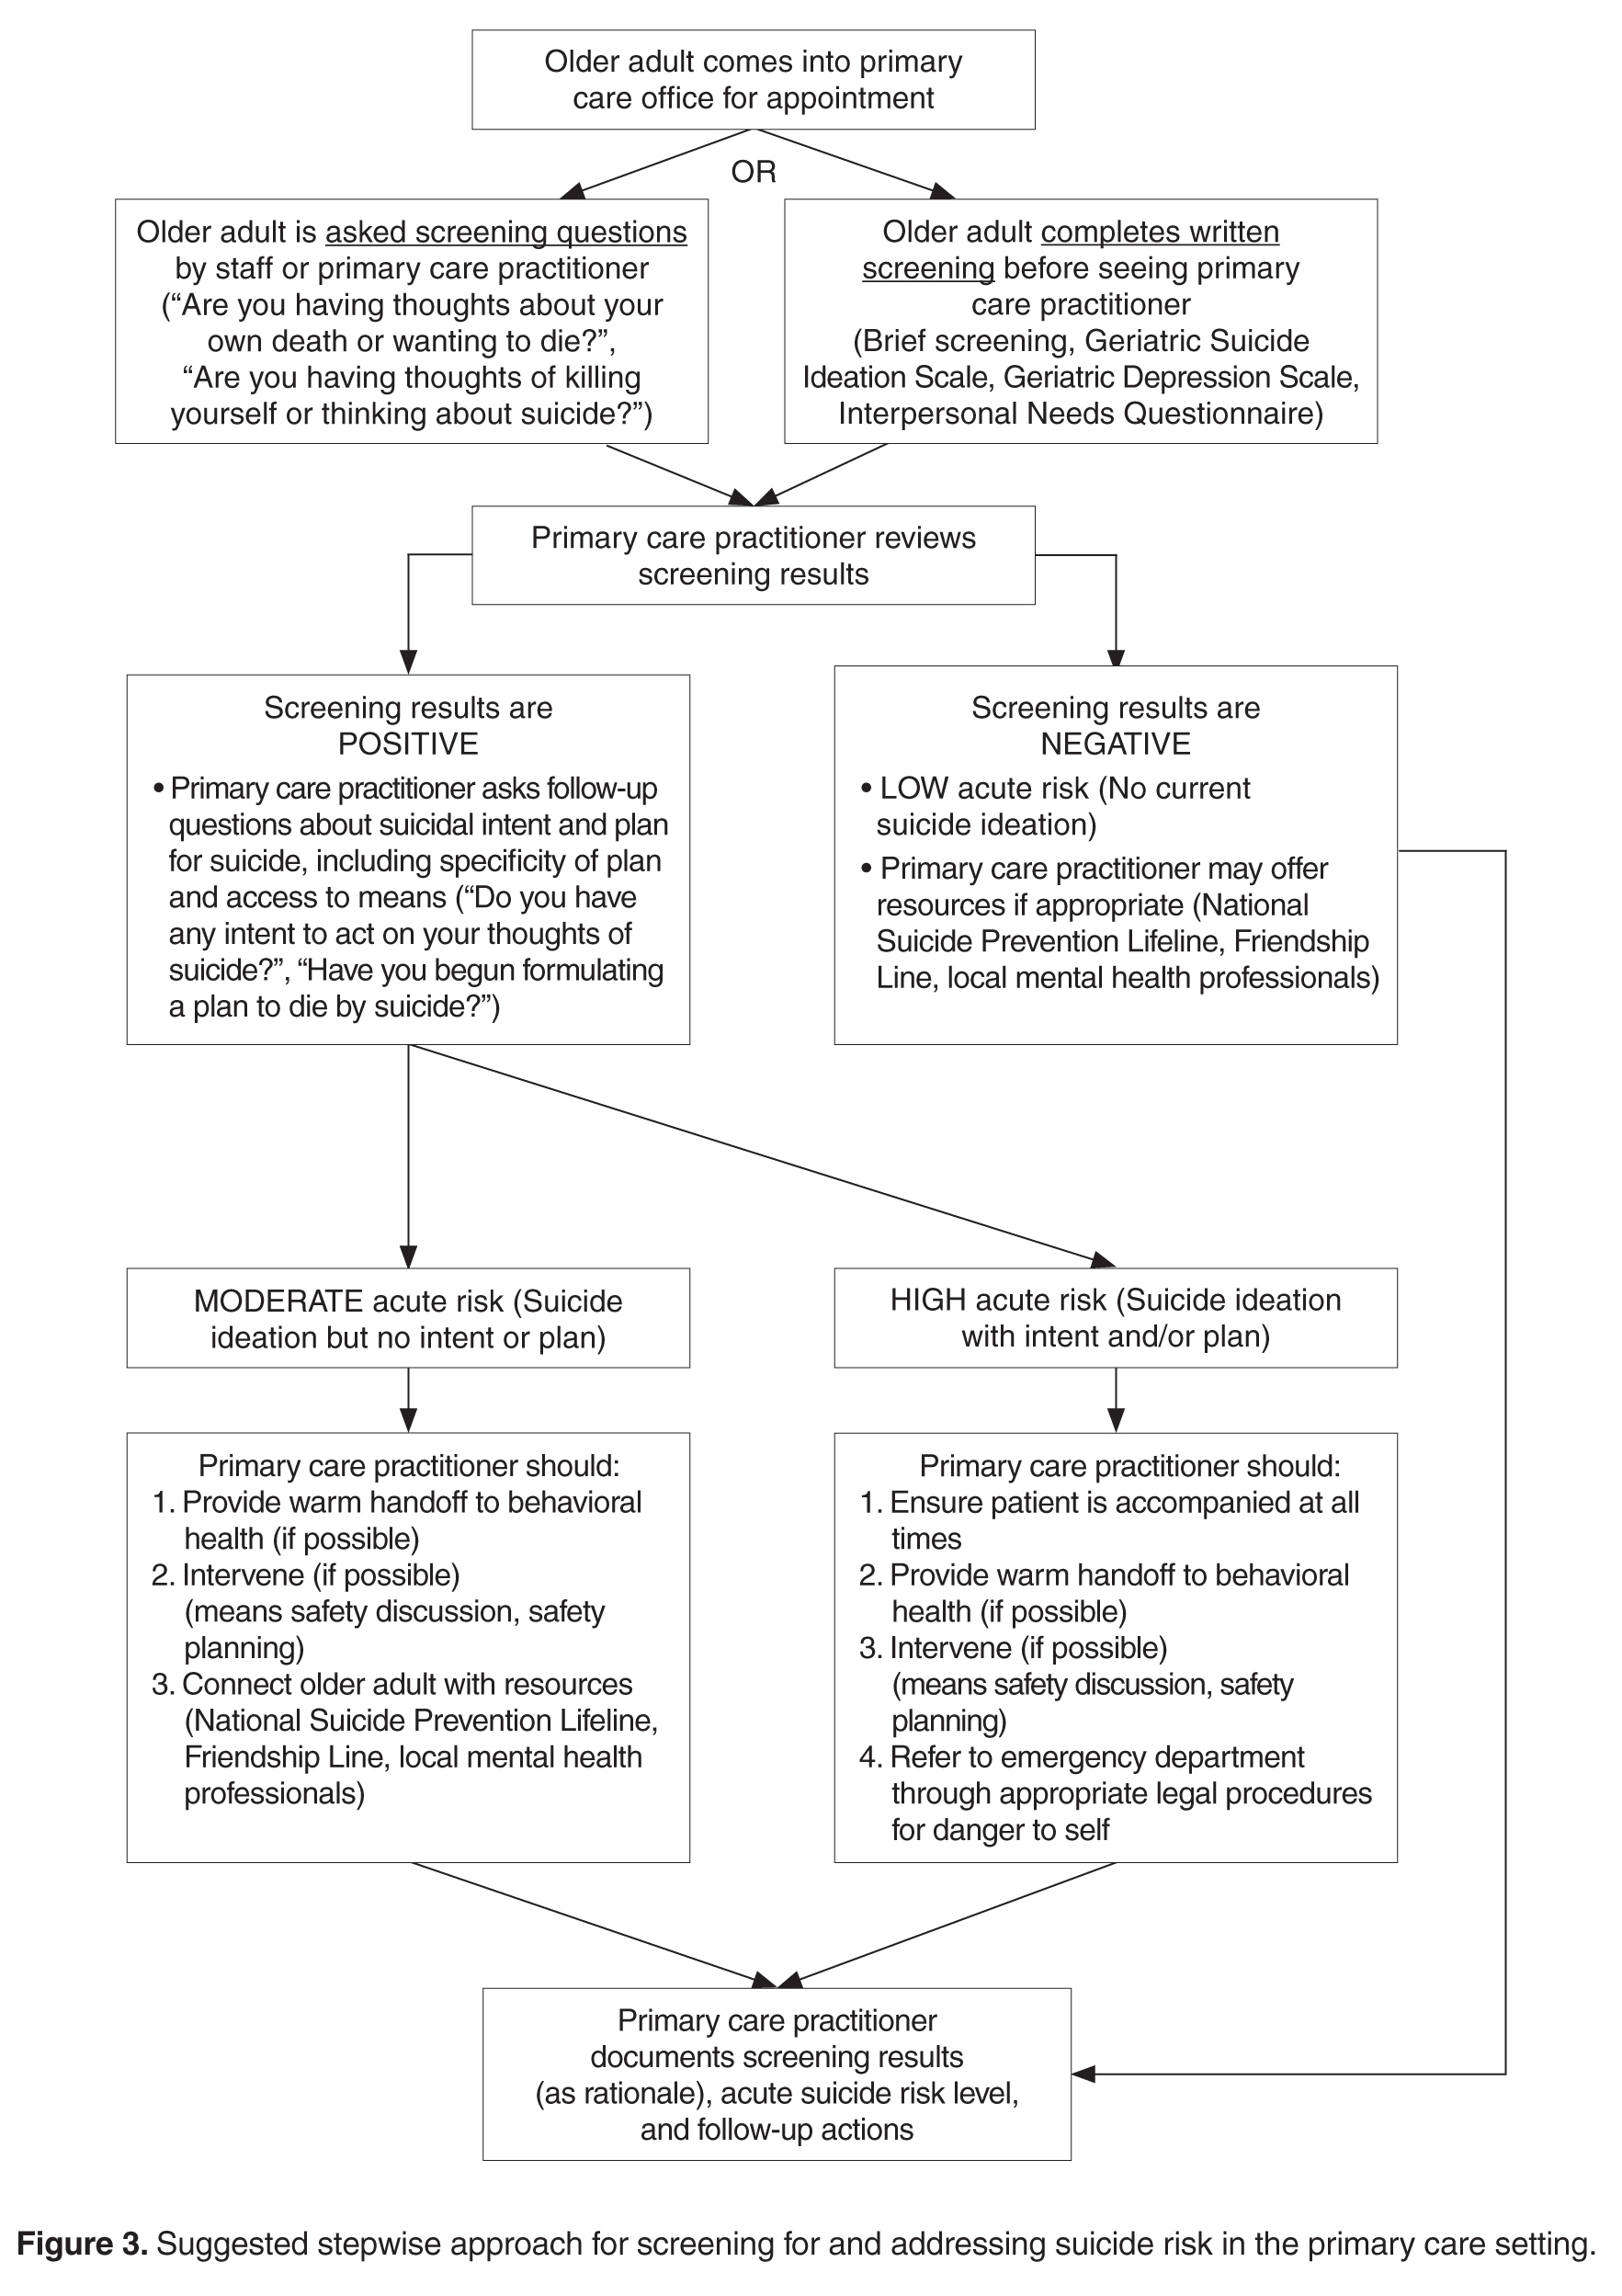
Conclusion
Older adults, particularly older men, are at high risk for suicide [1,2], and primary care practitioners are a critical component of older adult suicide prevention. Older adults frequently see primary care practitioners within a month prior to death by suicide [20,21]; primary care practitioners are uniquely qualified to address a broad range of potential risk factors, and may have more interactions and familiarity with older adults at risk for suicide than other medical professionals [20–22]. Primary care practitioners should be prepared to identify risk factors and warning signs for older adult suicide, ask appropriate questions to screen for suicide risk, and intervene to prevent suicide. Screening can consist of standardized written questionnaires or oral questioning, and interventions may include providing resources and referrals, discussions about means safety, safety planning, and handoff to a mental health specialist. Interventions for suicide risk are likely feasible and acceptable in primary care [46–48]. Primary care practitioners have an important role to play in older adult suicide prevention, and must be prepared to interact with older adults who may be at risk for suicide.
Corresponding author: Danielle R. Jahn, PhD, Primary Care Institute, 605 NE 1st St, Gainesville, FL 32605, [email protected].
Financial disclosures: None reported.
1. American Association of Suicidology. U.S.A. suicide: 2014official final data. 2016. Accessed at www.suicidology.org/Portals/14/docs/Resources/FactSheets/2014/2014datapgsv1b.pdf.
2. Centers for Disease Control and Prevention. Leading causes of death reports, national and regional, 1999-2015. 2016. Accessed at https://webappa.cdc.gov/sasweb/ncipc/leadcaus10_us.html.
3. Curtin SC, Warner M, Hedegaard H. Increase in suicide in the United States, 1999-2014. NCHS Data Brief, No 241. Hyattsville, MD: National Center for Health Statistics; 2016.
4. US Census Bureau. The next four decades. The older population in the United States: 2010 to 2050. 2010. Accessed at www.census.gov/prod/2010pubs/p25-1138.pdf.
5. Phillips JA, Robin AV, Nugent CN, Idler EL. Understanding recent changes in suicide rates among the middle-aged: period or cohort effects? Public Health Rep 2010;125:680–8.
6. Substance Abuse and Mental Health Services Administration. Issue brief 4: preventing suicide in older adults. 2012. Accessed at https://aoa.acl.gov/AoA_Programs/HPW/Behavioral/docs2/Issue%20Brief%204%20Preventing%20Suicide.pdf.
7. Duberstein PR, Conwell Y, Seidlitz L, et al. Age and suicidal ideation in older depressed inpatients. Am J Geriatr Psychiatry 1999;7:289–96.
8. Lynch TR, Johnson CS, Mendelson T, et al. Correlates of suicidal ideation among an elderly depressed sample. J Affect Disord 1999;56:9–15.
9. Centers for Disease Control and Prevention. Suicide: facts at a glance 2015. 2015. Accessed at www.cdc.gov/violenceprevention/pdf/suicide-datasheet-a.pdf.
10. Cukrowicz KC, Duberstein PR, Vannoy SD, et al. What factors determine disclosure of suicide ideation in adults 60 and older to a treatment provider? Suicide Life Threat Behav 2014;44:331–7.
11. Kim YA, Bogner HR, Brown GK, Gallo JJ. Chronic medical conditions and wishes to die among older primary care patients. Int J Psychiatry Med 2006;36:183–98.
12. Scocco P, Fantoni G, Rapattoni M, et al. Death ideas, suicidal thoughts, and plans among nursing home residents. J Geriatr Psychiatry Neurol 2009;22:141–8.
13. Scocco P, Meneghel G, Caon F, et al. Death ideation and its correlates: survey of an over-65-year-old population. J Nerv Ment Dis 2001;189:210–8.
14. Szanto K, Reynolds III CF, Frank E, et al. Suicide in elderly patients: is active vs. passive suicidal ideation a clinically valid distinction? Am J Geriatr Psychiatry, 2002;4:197–207.
15. Bartels SJ, Coakley E, Oxman TE, et al. Suicidal and death ideation in older primary care patients with depression, anxiety, and at-risk alcohol use. Am J Geriatr Psychiatry 2002;10:417–27.
16. Yip PSF. A public health approach to suicide prevention. Hong Kong J Psychiatry 2005;15:29–31.
17. van der Feltz-Cornelis CM, Sarchiapone M, Postuvan V, et al. Best practice elements of multilevel suicide prevention strategies: a review of systematic reviews. Crisis 2011;32:319–33.
18. Conwell Y. Suicide and suicide prevention in later life. Focus 2013;11:39–47.
19. Crabb R, Hunsley J. Utilization of mental health services among older adults with depression. J Clin Psychol 2006;62:299–312.
20. Luoma JB, Martin CE, Pearson JL. Contact with mental health and primary care providers before suicide: a review of the evidence. Am J Psychiatry 2002;159:909–16.
21. Ahmedani BK, Simon GE, Stewart C, et al. Health care contacts in the year before suicide death. J Gen Intern Med 2014;29:870–7.
22. Robinson JW, Roter DL. Psychosocial problem disclosure by primary care patients. Soc Sci Med 1999;48:1353–62.
23. Aminzadeh F, Dalziel WB. Older adults in the emergency department: a systematic review of patterns of use, adverse outcomes, and effectiveness of interventions. Ann Emerg Med 2002;39:238–47.
24. Osborn R, Moulds D, Squires D, et al. International survey of older adults finds shortcomings in access, coordination, and patient-centered care. Health Aff 2014;33:2247–55.
25. Siu AL, US Preventive Services Task Force. Screening for depression in adults: US Preventive Services Task Force recommendation statement. JAMA 2016;315:380–7.
26. LeFevre ML, U.S. Preventive Services Task Force. Screening for suicide risk in adolescents, adults, and older adults in primary care: U.S. Preventive Services Task Force recommendation statement. Ann Intern Med 2014;160:719–26.
27. The Joint Commission. Detecting and treating suicide risk in all settings. Sentinel Event Alert 2016;56:1–7.
28. Conwell Y, Van Orden K, Caine ED. Suicide in older adults. Psychiatr Clin North Am 2011;34:451–68.
29. American Association of Suicidology. Know the warning signs of suicide. 2016. Accessed at www.suicidology.org/resources/warning-signs.
30. National Suicide Prevention Lifeline. Suicide warning signs. 2011. Accessed at www.suicidepreventionlifeline.org/App_Files/Media/PDF/NSPL_WalletCard.pdf.
31. Conwell Y. Suicide later in life: challenges and priorities for prevention. Am J Prev Med 2014;47:S244–50.
32. Hegeman JM, Kok RM, van der Mast RC, Giltay EJ. Phenomenology of depression in older compared with younger adults: meta-analysis. Br J Psychiatry 2012;200:275–81.
33. Wuthrich VM, Johnco CJ, Wetherell JL. Differences in anxiety and depression symptoms: comparison between older and younger clinical samples. Int Psychogeriatr 2015;27:1523–32.
34. Substance Abuse and Mental Health Services Administration. Substance abuse among older adults. Treatment Improvement Protocol (TIP) Series, No. 26. HHS Publication No. (SMA) 12-3918. Rockville, MD: Substance Abuse and Mental Health Services Administration; 1998.
35. Fiske A, O’Riley AA, Widoe RK. Physical health and suicide in late life: an evaluative review. Clin Gerontologist 2008;31:31–50.
36. Duberstein PR, Conwell Y, Conner KR, et al. Suicide at 50 years of age and older: perceived physical illness, family discord, and financial strain. Psychol Med 2004;34:137–46.
37. Draper B, Peisah C, Snowdon J, Brodaty H. Early dementia diagnosis and the risk of suicide and euthanasia. Alzheimers Dement 2010;6:75–82.
38. Joiner T. Why people die by suicide. Cambridge: Harvard University Press; 2005.
39. Jahn DR, Cukrowicz KC. The impact of the nature of relationships on perceived burdensomeness and suicide ideation in a community sample of older adults. Suicide Life Threat Behav 2011;41:635–49.
40. Jahn DR, Cukrowicz KC, Linton K, Prabhu F. The mediating effect of perceived burdensomeness on the relation between depressive symptoms and suicide ideation in a community sample of older adults. Aging Ment Health 2011;15:214–20.
41. Cukrowicz KC, Jahn DR, Graham RD, et al. Suicide risk in older adults: evaluating models of risk and predicting excess zeros in a primary care sample. J Abnorm Psychol 2013;122:1021–30.
42. Fassberg MM, Van Orden KA, Duberstein, P, et al. A systematic review of social factors and suicidal behavior in older adulthood. Int J Environ Res Public Health 2012;9:722–45.
43. Pompili M, Innamorati M, Masotti V, et al. Suicide in the elderly: a psychological autopsy study in a north Italy area (1994-2004). Am J Geriatr Psychiatry 2008;16:727–35.
44. Konrad TR, Link CL, Shackelton RJ, et al. It’s about time: physicians’ perceptions of time constraints in primary medical practice in three national healthcare systems. Med Care 2010;48:95–100.
45. Tai-Seale M, McGuire TG, Zhang W. Time allocation in primary care office visits. Health Serv Res 2006;42:1871–94.
46. Bruce ML, Ten Have TR, Reynolds III CF, et al. Reducing suicidal ideation and depressive symptoms in depressed older primary care patients: a randomized controlled trial. J Am Med Assoc 2004;291:1081–91.
47. Alexopoulos GS, Reynolds CF III, Bruce ML, et al. Reducing suicidal ideation and depression in older primary care patients: 24-month outcomes of the PROSPECT study. Am J Psychiatry 2009;166:882–90.
48. Unutzer J, Tang L, Oishi S, et al. Reducing suicidal ideation in depressed older primary care patients. J Am Geriatr Soc 2006;54:1550–6.
49. Boudreaux ED, Camargo Jr CA, Arias SA, et al. Improving suicide risk screening and detection in the emergency department. Am J Prev Med 2016;50:445–53.
50. Mathias CW, Furr RM, Sheftall AH, et al. What’s the harm in asking about suicidal ideation? Suicide Life Threat Behav 2012;42:341–51.
51. Joiner T. Myths about suicide. Cambridge: Harvard University Press; 2011.
52. Heisel MJ, Flett GL. The development and initial validation of the Geriatric Suicide Ideation Scale. Am J Geriatr Psychiatry 2006;14:742–51.
53. Sheikh JL, Yesavage JA. Geriatric Depression Scale: recent evidence and development of a shorter version. In: Brink TL, editor. Clinical gerontology: a guide to assessment and intervention. New York: Howarth Press; 1986: 165–73.
54. Heisel MJ, Flett GL, Duberstein PR, Lyness JM. Does the Geriatric Depression Scale (GDS) distinguish between older adults with high versus low levels of suicidal ideation? Am J Geriatr Psychiatry 2005;13:876–83.
55. Heisel MJ, Duberstein PR, Lyness JM, Feldman MD. Screening for suicide ideation among older primary care patients. J Am Board Fam Med 2010;23:260–9.
56. Van Orden KA, Cukrowicz KC, Witte TK, Joiner Jr TE. Thwarted belongingness and perceived burdensomeness: construct validity and psychometric properties of the Interpersonal Needs Questionnaire. Psychol Assess 2012;24;197–215.
57. Department of Veterans Affairs, Department of Defense. VA/DoD clinical practice guideline for assessment and management of patients at risk for suicide. 2013. Accessed at www.healthquality.va.gov/guidelines/MH/srb/VADODCP_SuicideRisk_Full.pdf.
58. Freedenthal S. Documentation: do it well, for the client’s sake and yours. 2013. Accessed at www.speakingofsuicide.com/2013/05/25/documentation/.
59. McMyler C, Pryjmachuk S. Do ‘no-suicide’ contracts work? J Psychiatr Ment Hlt 2008;15:512–22.
60. Rudd MD, Mandrusiak M, Joiner Jr TE. The case against no-suicide contracts: the commitment to treatment statement as a practice alternative. J Clin Psychol 2006;62:243–51.
61. National Institute of Mental Health. Adding better mental health care to primary care: a new era of behavioral health integration. 2016. Accessed at www.nimh.nih.gov/news/science-news/2016/adding-better-mental-health-care-to-primary-care.shtml.
62. Lapierre S, Erlangsen A, Waern M, et al. A systematic review of elderly suicide prevention programs. Crisis 2011;32;88–98.
63. Hawton K. Restricting access to methods of suicide: rationale and evaluation of this approach to suicide prevention. Crisis 2007;28:4–9.
64. Walters H, Kulkarni M, Forman J, et al. Feasibility and acceptability of interventions to delay gun access in VA mental health settings. Gen Hosp Psychiatry 2012;34:692–8.
65. Owens D, Horrocks J, House A. Fatal and non-fatal repetition of self-harm: systematic review. Brit J Psychiatry 2002;181:193–9.
66. Bryan CJ, Stone SL, Rudd MD. A practical, evidence-based approach for means-restriction counseling with suicidal patients. Prof Psychol Res Pr 2011;42:339–46.
67. Stanley B, Brown GK. Safety plan treatment manual to reduce suicide risk: veteran version. 2008. Accessed at www.mentalhealth.va.gov/docs/va_safety_planning_manual.pdf.
68. Stanley B, Brown GK. Safety planning intervention: a brief intervention to mitigate suicide risk. Cogn Behav Pract 2012;19:256–64.
69. Jahn DR, Conti EC, Simons KV, et al. Evidence and considerations for safety planning as a suicide prevention strategy for older adults. 2017. Manuscript in preparation.
70. Knox KL, Stanley B, Currier GW, et al. An emergency department-based brief intervention for veterans at risk for suicide (SAFE VET). Am J Public Health 2012;102:S33–7.
From the Primary Care Institute, Gainesville, FL.
Abstract
- Objective: To provide primary care practitioners with the knowledge required to identify and address older adult suicide risk in their practice.
- Methods: Review of the literature and good clinical practices.
- Results: Primary care practitioners play an important role in older adult suicide prevention and must have knowledge about older adult suicide risk, including risk factors and warning signs in this age-group. Practitioners also must appropriately screen for and manage suicide risk. Older adults, particularly older men, are at high risk for suicide, though they may be less likely to report suicide ideation. Additionally, older adults frequently see primary care practitioners within a month prior to death by suicide. A number of older adult–specific risk factors are reviewed, and appropriate screening and intervention for the primary care setting are discussed.
- Conclusion: Primary care practitioners are uniquely qualified to address a broad range of potential risk factors and should be prepared to identify risk factors and warning signs for older adult suicide, ask appropriate questions to screen for suicide risk, and intervene to prevent suicide.
Key words: suicide; older adults; risk factors; screening; safety planning.
Primary care practitioners play an important role in older adult suicide prevention and have a responsibility to identify and address suicide risk among older adults. To do so, practitioners must understand the problem of older adult suicide, recognize risk factors for suicide in older adults, screen for suicide risk, and appropriately assess and manage suicide risk. Primary care practitioners may face challenges in completing these tasks; the goal of this article is to assist practitioners in addressing these challenges.
Suicide in Older Adults
The United States has recently seen increases in suicide rates across the lifespan; from 1999 to 2014, the suicide rate rose by 24% across all ages [3]. Among both men and women aged 65 to 74, the suicide rate increased in this time period [3]. The high suicide rate among older adults is particularly important to address given the increasing numbers of older adults in the United States. By 2050, the older adult population in the United States is expected to reach 88.5 million, more than double the older adult population in 2010 [4]. Additionally, the generation that is currently aging into older adulthood has historically had higher rates of suicide across their lifespan [5]. Given that suicide rates also increase in older adulthood for men, the coming decades may evidence even higher rates of suicide among older adults than previously and it is critical that older adult suicide prevention becomes a public health priority.
It is also essential to discuss other suicide-related outcomes among older adults, including suicide attempts and suicide ideation. This is critical particularly because the ratio of suicide attempts to deaths by suicide in this age-group is 4 to 1 [1]. This is in contrast to the ratio of attempts to deaths across all ages, which is 25 suicide attempts per death by suicide [1]. This means that suicide prevention must occur before a first suicide attempt is made; suicide attempts cannot be used a marker of elevated suicide risk in older adults or an indication that intervention is needed. Intervention is required prior to suicide risk becoming elevated to the point of a suicide attempt.
It is also critical to recognize that despite the fact that suicide rates rise with age, reports of suicide ideation decrease with age [7,8]. Across all ages, 3.9% of Americans report past-year suicide ideation; however, only 2.7% of older adults report thoughts of suicide [9]. The discrepancy with the increasing rates of death by suicide with age suggest that suicide risk, and thereby opportunities for intervention, may be missed in this age-group [10].
However, older adults may be more willing to report death ideation, as research has found that over 15% of older adults endorse death ideation [11–13]. Death ideation is a desire for death without a specific desire to end one’s own life, and is an important suicide-related outcome, as older adults with death ideation appear the same as those with suicide ideation in terms of depression, hopelessness, and history of suicidal behavior [14]. Additionally, older adults with death ideation had more hospitalizations, more outpatient visits, and more medical issues than older adults with suicide ideation [15]. Therefore, death ideation should be taken as seriously as suicide ideation in older adults [14]. In sum, the high rates of death by suicide, the likelihood of death on a first or early suicide attempt, and the discrepancy between decreasing reports of suicide ideation and increasing rates of death by suicide among older adults indicate that older adult suicide is an important public health problem.
Suicide Prevention Strategies
Many suicide prevention strategies to date have focused on indicated prevention, which concentrates on individuals already identified at high risk (eg, those with suicide ideation or who have made a suicide attempt) [16]. However, because older adults may not report suicide ideation or survive a first suicide attempt, indicated prevention is likely not enough to be effective in older adult suicide prevention. A multilevel suicide prevention strategy [17] is required to prevent older adult suicide [18]. Older adult suicide prevention must include indicated prevention but must also include selective and universal prevention [16]. Selective prevention focuses on groups who may be at risk for suicide (eg, individuals with depression, older adults) and universal prevention focuses on the entire population (eg, interventions to reduce mental health stigma) [16]. To prevent older adult suicide, crisis intervention is critical, but suicide prevention efforts upstream of the development of a suicidal crisis are also essential.
The Importance of Primary Care
Research indicates that primary care is one of the best settings in which to engage in older adult suicide prevention [18]. Older adults are significantly less likely to receive specialty mental health care than younger adults, even when they have depressive symptoms [19]. Additionally, among older adults who died by suicide, 58% had contact with a primary care provider within a month of their deaths, compared to only 11% who had contact with a mental health specialist [20]. Among older adults who died by suicide, 67% saw any provider in the 4 weeks prior to their death [21]. Approximately 10% of older adults saw an outpatient mental health provider, 11% saw a primary care physician for a mental health issue, and 40% saw a primary care physician for a non-mental health issue [21]. Therefore, because older adults are less likely to receive specialty mental health treatment and so often seen a primary care practitioner prior to death by suicide, primary care may be the ideal place for older adult suicide risk to be detected and addressed, especially as many older adults visit primary care without a mental health presenting concern prior to their death by suicide.
Additionally, older adults may be more likely to disclose suicide ideation to primary care practitioners, with whom they are more familiar, than physicians in other settings (eg, emergency departments). Research has shown that familiarity with a primary care physician significantly increases the likelihood of patient disclosure of psychosocial issues to the physician [22]. Primary care providers also have a critical role as care coordinators; many older adults also see specialty physicians and use the emergency department. In fact, older adults are more likely to use the emergency department than younger adults, but emergency departments are not equipped to navigate the complex care needs of this population [23]. Primary care practitioners are important in ensuring that health issues of older adults are addressed by coordinating with specialists, hospitals (eg, inpatient stays, emergency department visits, surgery) and other health services (eg, home health care, physical therapy). Approximately 35% of older adults in the United States experience a lack of care coordination [24], which can negatively impact their health and leave issues such as suicide ideation unaddressed. Primary care practitioners may be critical in screening for mental health issues and suicide risk during even routine visits because of their familiarity with patients, and also play an important role in coordinating care for older adults to improve well-being and to ensure that critical issues, such as suicide ideation, are appropriately addressed.
Primary care practitioners can also be key in upstream prevention. Primary care practitioners are in a unique role to address risk factors for suicide prior to the development of a suicidal crisis. Because older adults frequently see primary care practitioners, such practitioners may have more opportunities to identify risk factors (eg, chronic pain, depression). Primary care practitioners are also trained to treat a broad range of conditions, providing the skills to address many different risk factors.
Finally, primary care is a setting in which screening for depression and suicide ideation among older adults is recommended. The US Preventive Services Task Force recommends screening for depression in all adults and older adults and provides recommended screening instruments, some of which include questions about self-harm or suicide risk [25]. However, this same group has concluded that there is insufficient evidence to support a recommendation for suicide risk screening [26]. Despite this, the Joint Commission recently released an alert that recommends screening for suicide risk in all settings, including primary care [27]. The Joint Commission requirement for ambulatory care that is relevant to suicide is PC.04.01.01: The organization has a process that addresses the patient’s need for continuing care, treatment, or services after discharge or transfer; behavioral health settings have additional suicide-specific requirements. The recommendations, though, go far beyond this requirement for primary care. The Joint Commission specifically notes that primary care clinicians play an important role in detecting suicide ideation and recommends that primary care practitioners review each patient’s history for suicide risk factors, screen all patients for suicide risk, review screenings before patients leave appointments, and take appropriate actions to address suicide risk when needed [27]. Further details are available in the Joint Commission’s Sentinel Event Alert titled, “Detecting and treating suicide ideation in all settings” [27]. Given these recommendations, primary care is an important setting in which to identify and address suicide risk.
Risk Factors for Older Adult Suicide
Numerous reviews exist that cover many risk factors for suicide in older adults [18,28]. This article will focus briefly on risk factors that are likely to be recognized and potentially addressed by primary care practitioners. Risk factors that apply across the lifespan can be recalled through a mnemonic: IS PATH WARM [29]. These risk factors include suicide Ideation, Substance abuse, Purposelessness, Anxiety (including agitation and poor sleep), feeling Trapped, Hopelessness, social Withdrawal, Anger or rage, Recklessness (ie, engaging in risky activities), and Mood changes. The National Suicide Prevention Lifeline also includes being in unbearable physical pain, perceiving one’s self as a burden to others, and seeking revenge on others as risk factors [30]. More specific to older adults, Conwell notes 5 categories or domains of risk factors with strong research support: psychiatric symptoms, somatic illness, functional impairment, social integration, and personality traits and coping [18,31].
Affective or mood disorders, particularly depression and depressive symptoms, are some of the most well-studied and strongest risk factors for older adult suicide [31]; 71% to 97% of all older adults who die by suicide have psychiatric illnesses [28]. Mood disorders, including major depressive episodes, are most consistently linked to older adult suicide risk; there is evidence as well for anxiety disorders and substance abuse disorders as risk factors, though it is somewhat mixed [28]. Therefore, screening for depression, anxiety, and substance abuse may be key to recognizing potential suicide risk. However, depression and anxiety do not present similarly in younger and older adults [32,33]. Depressive symptoms in older adults may be more somatic (eg, agitation, gastrointestinal symptoms) [32] and may reflect more anhedonia than mood changes [33]. Anxiety in older adults tends to be reported as stress or tension, whereas younger adults report feeling anxious or worried [33]. Additionally, substance abuse is often underrecognized, underdiagnosed, and undertreated in older adults [34]. Proactive screening for substance abuse is important as it may not interfere with work or other obligations in older adults, and therefore substance abuse may not be identified by older adults or others in their lives.
Physical illness may also be a risk factor for suicide [28,31]. Numerous diagnoses have been linked to suicide risk, including cancers, neurodegenerative diseases (eg, amyotrophic lateral sclerosis, Huntington disease), spinal cord injury, cardiovascular disease, and pulmonary disease [28,35]. However, overall illness burden (ie, number of chronic illnesses) [28] and self-perceived health [36] appear to be stronger risk factors than any specific illness. Additionally, authors have suggested that illness itself may not be a particularly strong risk factor, but the effect of illness on depressive symptoms [35], functioning, pain, or hopelessness due to the potential for decline over time [28] may increase suicide risk in older adults. Pain itself has been identified as a risk factor for suicide, as have perceptions of burden to others, hopelessness, and functional impairment [28].
In terms of functional impairment, research has shown that impairment in completing instrumental activities of daily living is associated with higher risk for death by suicide, and cognitive impairment may also be associated with elevated suicide risk [28]. However, there are some discrepant findings regarding the role of dementia in suicide risk, which may reflect medical and psychiatric comorbidities, as well as different stages of dementia or levels of cognitive impairment (eg, hopelessness about cognitive decline may increase suicide risk shortly after diagnosis, whereas lack of insight may decrease risk later in the course of the illness) [37]. Related to functional or cognitive impairment is perceived burdensomeness (ie, the perception that one is a liability or burden to others, to the point that others would be better off if one was gone) [38], which may also be associated with suicide risk in older adults [39,40]. Researchers have found that the interaction between perceived burdensomeness and thwarted belongingness (ie, a belief that one lacks reciprocal caring relationships and does not belong) identified older adults who were likely experiencing suicide ideation but did not report it [41]. These findings indicate that perceived burdensomeness and thwarted belongingness may be key in identifying older adults at risk for suicide.
Thwarted belongingness has also been linked to suicide ideation in older adults [41]. In fact, studies suggest that social integration is especially important for reducing suicide risk in this population [28,31,42]. A larger social network, living with others, and being active in the community are each protective against suicide [28]. Bereavement, which can reduce social connectedness and acts as a significant life stressor, is also an important risk factor [31]. Retirement may also reduce social connectedness, and employment changes have been identified as a suicide risk factor for older adults [28]. Retirement has been linked to risk for death by suicide in this population [43], and may not only serve to reduce social connectedness, but for some older adults may also be a significant role loss or loss of sense of purpose that can influence suicide risk.
Finally, rigid personality traits or coping styles are a risk factor for suicide among older adults [28,31]. As older adults face potential losses, health changes, and functional decline, effective positive coping strategies and flexibility are key to maintaining well-being. If older adults are unable to flexibly cope with these challenges, their risk for suicide increases [28].
In addition to risk factors, which confer suicide risk but do not necessarily suggest that an older adult is thinking about suicide, warning signs exist that indicate that suicide risk is imminent. These include suicidal communication (ie, talking or writing about suicide), seeking access to means, and making preparations for suicide (eg, ensuring a will is in place, giving away prized possessions). One important note is that discussing and preparing for death may be developmentally appropriate for older adults, particularly those with chronic illnesses; however, such appropriate preparation is critically different from talking about suicide or a desire for death.
Additionally, a lack of planning for the future may be a warning sign. For example, older adults who decline to schedule medical follow-up or do not wish to refill needed prescriptions may be exhibiting warning signs that should be addressed. Similarly, not following needed medical regimens (eg, an older adult with diabetes no longer taking insulin) is also a warning sign. Other, potentially more subtle warning signs may include significant changes in mood, sleep, or social interactions. Older adults may become agitated and sleep less when they are considering suicide, or may feel more at ease after they have made the decision to die by suicide and their sleep or mood may improve. Withdrawing from valued others may also be a warning sign. Finally, recent major changes (eg, loss of a spouse, moving to an assisted living facility) may be triggers for suicide risk and can serve as warning signs themselves.
Specific Screening Strategies
Given the numerous risk factors and warning signs for older adult suicide, as well as the time limitations that primary care practitioners face [44,45], it would be impractical to comprehensively assess each older adult who presents at a primary care practice. Therefore, more specific screening is necessary. Most importantly, every older adult should be screened for suicide ideation and death ideation at every visit. Screening at every visit is critical because suicide ideation may develop at any point. Previous research has included screening of over 29,000 older adults in 11 primary care settings for suicide ideation, risk of alcohol misuse, and mental health disorders [15], suggesting that suicide risk screening is feasible. Other studies have also successfully used widespread screening for depression and suicide ideation among older adults in primary care [46–48]. Additionally, in an emergency department setting, universal suicide risk screening has been associated with significantly improved risk detection [49], indicating that improved screening may be beneficial in identifying suicide risk. Importantly, asking about suicide does not cause thoughts of suicide [50]. Additionally, it is a myth that those who talk about suicide ideation will not act on these thoughts [51].
When primary care practitioners inquire about suicide ideation, they should also ask about death ideation; though some may believe that death ideation is not as significant in terms of suicide risk as suicide ideation, recall that research has not found differences in previous suicide attempts or current hopelessness among older adults with death ideation versus suicide ideation [14]. Therefore, screening for death ideation should be completed as part of every suicide risk screening.
Screening can take many forms. Screening may be oral; asking an older adult if he or she is having thoughts of suicide or is experiencing a desire to die is a brief, 2-question screening that may provide valuable information (eg, “Are you having thoughts about your own death or wanting to die?”, “Are you having thoughts of killing yourself or thinking about suicide?”). This screening may be conducted by medical assistants, nurses, care managers, or physicians, with the patient’s responses documented. Importantly, a standard procedure should be implemented to ensure older adults are consistently asked about suicide risk at each visit, but do not feel inundated by such questions from numerous staff.
If verbal questions are asked, they must be asked appropriately. Euphemisms or indirect language should not be used during a screening; older adults should be directly asked about thoughts of death and suicide, not simply asked questions such as, “Have you ever had thoughts of harming or hurting yourself?” A question like this does not adequately assess current suicide risk, as it does not assess current thoughts, nor does it specifically inquire about suicide ideation (ie, killing one’s self). It is also important to phrase questions in a manner that invites honest responses and conveys an openness to listening. For example, asking, “You’re not thinking about suicide, are you?” suggests that the practitioner wants the older adult to say no and is not comfortable with the older adult endorsing suicide ideation. Open questions that allow endorsement or denial (eg, “Are you having thoughts of killing yourself?”) imply that the practitioner is receptive to either an endorsement or denial of suicide ideation.
Alternatively, a written screening can be used; older adults may complete a questionnaire prior to their appointment or while waiting to see their practitioner. Such an assessment may be a brief screening (eg, using similar yes/no questions to an oral screening), or may be a standardized measure. For example, the Geriatric Suicide Ideation Scale [52] is a 31-item self-report measure that provides scores for suicide ideation, death ideation, loss of personal and social worth, and perceived meaning in life. Though there are not standard cutoffs that suggest high versus low suicide risk, responses can be reviewed to identify whether older adults are reporting suicide ideation or death ideation, and can also be compared to norms (ie, average scores) from other older adults [52]. This measure also has the benefit of 2 subscales that do not specifically require reporting thoughts of suicide or death (ie, loss of personal and social worth, perceived meaning in life), which may give practitioners an indication of an older adult’s suicide risk even if the older adult is not comfortable disclosing suicide ideation, as has been shown in previous research [7,8].
Similarly, the Geriatric Depression Scale, which has a validated 15-item version [53], does not directly ask about suicide ideation but has a 5-item subscale that has been found to be highly correlated with reported suicide ideation [54]. When administered to older adult primary care patients, this subscale was an effective measure of suicide ideation; a score of ≥ 1 was the best cutoff for determining whether an older adult reported suicide ideation [55].
Additionally, as noted previously, the interaction between perceived burdensomeness and thwarted belongingness may identify older adults who are potentially experiencing, but not reporting, suicide ideation [41]. The Interpersonal Needs Questionnaire [56] is the validated assessment for both perceived burdensomeness and thwarted belongingness. Perceived burdensomeness is assessed via 6 self-report items, and thwarted belongingness is assessed via 9 self-report items on this measure [56]. There are not specific cutoffs that determine high versus low perceived burdensomeness or thwarted belongingness, but older adults’ responses can provide information about their experiences of these constructs. Administration of the Interpersonal Needs Questionnaire can provide information about potential risk for suicide among older adults who may otherwise deny thoughts of suicide or death.
If the screening for suicide ideation or death ideation is positive (ie, the older adult endorses thoughts of suicide or death), the treating primary care practitioner must then follow up with additional questions to determine current level of suicide risk. To make this determination, at a minimum, follow-up questions should focus on whether the older adult has any intent to die by suicide (eg, “Do you have any intent to act on your thoughts of suicide?”), as well as whether he or she has a plan to die by suicide (eg, “Have you begun formulating a plan to die by suicide?”). When asking about a plan, it is important to determine how specific the plan is. For example, an older adult with a specific method identified and date selected to implement the plan is at much higher risk than an older adult with a relatively vague idea. It is also critical to assess for the older adult’s access to means for suicide. If an older adult has a specific plan and has the capability to carry out the plan (eg, plans to overdose on prescription medication and has large quantities of medication or high-lethality medication at home), he or she is more likely to die by suicide than an older adult who does not have access to means (eg, only has small quantities of low-lethality medication available). A general assessment of risk factors and previous suicidal behavior (ie, any previous suicide attempts) also informs decisions about level of risk and interventions.
After a screening or assessment is completed, a risk determination must be made and documented. Acute suicide risk can be categorized as low, moderate, or high. It is not appropriate to say that there is “no” suicide risk present. Low risk occurs when there is no current suicide ideation, no plan to die by suicide, and no intent to act on suicidal thoughts, especially when the patient has no history of suicidal behavior and few risk factors [57]. Moderate risk is evident when there is current suicide ideation, but no specific plan to die by suicide or intent to act on suicidal thoughts. There are likely warning signs or risk factors, which may include previous suicidal behaviors, present in moderate suicide risk [57]. High risk is indicated by current suicide ideation with plan to die by suicide and suicidal intent. There are significant warning signs and risk factors present; there may also be a recent suicide attempt, though this is not a requirement for a high risk determination [57]. Undetermined suicide risk occurs when a practitioner cannot accurately assess risk, but concern regarding suicide is present; this is primarily used when a patient refuses to answer questions about suicide. Undetermined risk should be treated as at least moderate risk. Because research shows that death ideation has similar outcomes to suicide ideation in older adults [14], death ideation should also be factored into determinations of suicide risk; reports of death ideation may indicate low or moderate risk in older adults, dependent upon other risk factors, suicidal intent, and plan.
After a risk determination is made, it must be documented in the medical record. The level of risk and rationale for that determination must be included [58]. Stating only the level of risk without a rationale (ie, the older adult’s responses to questions) is not adequate, and documenting only the older adult’s responses without a determination of risk is also not sufficient. Finally, it is critical to document the intervention that occurred or steps taken after the level of risk was determined.
Critically, stating only that there was no indication of suicide risk is inadequate. For example, documenting “No evidence of suicide risk” is not appropriate. This documentation does not indicate that the older adult was specifically asked about suicide ideation, death ideation, suicidal intent, or plan to die by suicide. It also does not indicate a level of suicide risk. Examples of appropriate documentation include:
Patient was asked about suicide risk. She denied current suicide ideation but reported death ideation. She denied any current suicidal intent or plan. She also denied any previous suicide attempts. Therefore, acute suicide risk was deemed to be low. Provided patient with wallet card about the National Suicide Prevention Lifeline. Also called the Friendship Line while in the room with the patient to connect her with services. Finally, provided a brief list of local mental health professionals to patient; the patient reported she would like to see Dr. Smith. Called and left a message for Dr. Smith with referral information with patient during appointment.
Patient was asked about suicide risk. He reported both death ideation and suicide ideation. He also reported a nonspecific plan (ie, causing a single-vehicle motor vehicle accident, with no specific plan for the motor vehicle accident or timeframe) and denied any intent to act on his thoughts of suicide. He reported one previous suicide attempt, at age 22, by overdose on over-the-counter medication. He reported that this attempt did not require medical attention. Therefore, acute suicide risk was determined to be moderate. Patient was introduced to the behavioral health specialist, who met with the patient during the appointment to conduct further assessment and intervention.
Specific Intervention Strategies
Despite the fact that the pace of the primary care setting often does not allow for time-intensive intervention, there are ways to address suicide risk in this setting. Importantly, no-suicide contracts should not be used at any time [59,60]. No-suicide contracts are documents that patients who are experiencing suicide ideation are required to sign that state that they will not die by suicide while under the care of the practitioner. These contracts have no evidence of effectiveness, and some researchers argue that they may in fact damage the relationship with patients and serve the practitioner’s needs more than the patient’s needs [59].
One of the best options for older adults at low acute suicide risk is to provide resources and referrals. The National Suicide Prevention Lifeline can be reached at 1-800-273-TALK (8255); trained counselors are available to speak to patients at all times. Wallet cards with information about the National Suicide Prevention Lifeline are available at no charge from the US Substance Abuse and Mental Health Services Administration online store. The Friendship Line is another service available free to adults ages 60 and older, 24 hours per day, 7 days per week; this line can be reached at 1-800-971-0016. The Friendship Line, which is managed by the Institute on Aging, also provides outreach calls to older adults who may be isolated or lonely, increasing connectedness and potentially reducing suicide risk.
Having a ready list of local mental health professionals with expertise in geriatrics and suicide risk to provide to the patient is also beneficial. Recall, though, that older adults are less likely to seek out and receive mental health services [19]; therefore, connecting the patient with resources or referrals during the appointment is critical. If the practitioner does not have time to do this, having a medical assistant or other staff member that the patient knows engage in this step may be appropriate. For example, the patient can call the Friendship Line or National Suicide Prevention Lifeline while in the room with the practitioner, which may reduce anxiety or stigma about doing so and connect the patient with services. Similarly, calling a local mental health professional to make a referral during the appointment may increase the likelihood that the older adult will follow up on the referral.
The most ideal method of intervention for moderate or high acute suicide risk is a warm handoff to a behavioral or mental health specialist. As primary care and behavioral health become more integrated and financially viable as reimbursement through the Centers for Medicare and Medicaid Services improves [61], it is becoming increasingly likely that such a specialist will be on-site and available. Research has found that collaborative care in primary care reduces suicide risk in older adults [46–48,62]. Mental health specialists can conduct more comprehensive assessments and spend more time intervening to reduce suicide risk among older adults with death or suicide ideation. If an on-site behavioral health specialist is not available, older adults at high suicide risk may need to be referred to an emergency department for further evaluation and follow-up. Each state has its own laws and procedures regarding this process, which should be incorporated into a practice’s procedures for addressing high suicide risk. The procedure often involves ensuring that the older adult is accompanied at all times (ie, not left alone in a room), alerting emergency services (usually via phone call to an emergency line, such as 911), and completion of paperwork by a practitioner asserting that the patient is a danger to self. Police or other emergency personnel are then responsible for transporting the patient for further evaluation and determination of whether hospitalization is required.
If more time is available, either via the treating primary care practitioner or other patient care staff in the office, other brief interventions may be beneficial. First, means safety discussions are critical, particularly for older adults with plans for suicide or access to highly lethal means. In such discussions, patients are encouraged to restrict access to the methods that they may use to die by suicide. Plans for restricting access are developed, and when possible, a support person is enlisted to ensure that the plans are carried out. For example, if an older adult has access to firearms (eg, keeps a loaded weapon in his or her nightstand), he or she is encouraged to restrict his or her access to it. Ideally, this is through removing the weapon from the home, either permanently or until suicide risk reduces (eg, giving it to a friend, turning it over to police), but more safe storage may also be an option if the older adult is not willing to remove the weapon from the home. This may mean using a gun lock or storing the weapon in a gun safe, storing ammunition separately from an unloaded weapon, removing the firing pin, or otherwise disassembling the weapon. Means safety counseling has been shown to be effective in reducing suicide rates [63] and is acceptable to patients [64]. Studies indicate that over 90% of individuals who make a suicide attempt and survive do not go on to die by suicide [65]; therefore, reducing access to highly lethal means during a suicidal crisis may be key in reducing suicide rates. Though an in-depth review of means safety counseling is outside the scope of this article, readers are directed to Bryan, Stone, and Rudd’s article for a practical overview of means safety discussions [66].
Second, safety planning is a brief intervention that may be beneficial in the primary care setting [67,68]. The goal of a safety plan is to create an individualized plan to remain safe during a suicidal crisis. Means safety discussion is the last of 6 steps in the safety plan [68]. The first 5 steps include identifying warning signs, using internal coping strategies, social connectedness as distraction, social support for the crisis, and professionals that can be used as resources. When patients can identify specific, individualized warning signs that occur prior to a crisis, they can then use strategies to cope and prevent the crisis from worsening. Coping strategies that are encouraged are first internal (ie, those that can be done without relying on anyone else), such as exercise or journaling. If those do not improve the patient’s mood, then he or she is encouraged to use people or social settings as a distraction (eg, people watching at the mall, calling an acquaintance to chat), and if he or she is still feeling bad, encouraged to get social support for the crisis (eg, calling a family member to discuss the crisis and get support). Finally, if all of these steps are not effective, the older adult is encouraged to reach out to professional supports, such as a mental health provider, the National Suicide Prevention Lifeline, or 911 (or go to an emergency room). Readers are encouraged to review Stanley and Brown’s articles for comprehensive details about safety planning as an intervention [67,68]. Additionally, an article with specific adaptations for safety planning with older adults is forthcoming [69].
Conclusion
Older adults, particularly older men, are at high risk for suicide [1,2], and primary care practitioners are a critical component of older adult suicide prevention. Older adults frequently see primary care practitioners within a month prior to death by suicide [20,21]; primary care practitioners are uniquely qualified to address a broad range of potential risk factors, and may have more interactions and familiarity with older adults at risk for suicide than other medical professionals [20–22]. Primary care practitioners should be prepared to identify risk factors and warning signs for older adult suicide, ask appropriate questions to screen for suicide risk, and intervene to prevent suicide. Screening can consist of standardized written questionnaires or oral questioning, and interventions may include providing resources and referrals, discussions about means safety, safety planning, and handoff to a mental health specialist. Interventions for suicide risk are likely feasible and acceptable in primary care [46–48]. Primary care practitioners have an important role to play in older adult suicide prevention, and must be prepared to interact with older adults who may be at risk for suicide.
Corresponding author: Danielle R. Jahn, PhD, Primary Care Institute, 605 NE 1st St, Gainesville, FL 32605, [email protected].
Financial disclosures: None reported.
1. American Association of Suicidology. U.S.A. suicide: 2014official final data. 2016. Accessed at www.suicidology.org/Portals/14/docs/Resources/FactSheets/2014/2014datapgsv1b.pdf.
2. Centers for Disease Control and Prevention. Leading causes of death reports, national and regional, 1999-2015. 2016. Accessed at https://webappa.cdc.gov/sasweb/ncipc/leadcaus10_us.html.
3. Curtin SC, Warner M, Hedegaard H. Increase in suicide in the United States, 1999-2014. NCHS Data Brief, No 241. Hyattsville, MD: National Center for Health Statistics; 2016.
4. US Census Bureau. The next four decades. The older population in the United States: 2010 to 2050. 2010. Accessed at www.census.gov/prod/2010pubs/p25-1138.pdf.
5. Phillips JA, Robin AV, Nugent CN, Idler EL. Understanding recent changes in suicide rates among the middle-aged: period or cohort effects? Public Health Rep 2010;125:680–8.
6. Substance Abuse and Mental Health Services Administration. Issue brief 4: preventing suicide in older adults. 2012. Accessed at https://aoa.acl.gov/AoA_Programs/HPW/Behavioral/docs2/Issue%20Brief%204%20Preventing%20Suicide.pdf.
7. Duberstein PR, Conwell Y, Seidlitz L, et al. Age and suicidal ideation in older depressed inpatients. Am J Geriatr Psychiatry 1999;7:289–96.
8. Lynch TR, Johnson CS, Mendelson T, et al. Correlates of suicidal ideation among an elderly depressed sample. J Affect Disord 1999;56:9–15.
9. Centers for Disease Control and Prevention. Suicide: facts at a glance 2015. 2015. Accessed at www.cdc.gov/violenceprevention/pdf/suicide-datasheet-a.pdf.
10. Cukrowicz KC, Duberstein PR, Vannoy SD, et al. What factors determine disclosure of suicide ideation in adults 60 and older to a treatment provider? Suicide Life Threat Behav 2014;44:331–7.
11. Kim YA, Bogner HR, Brown GK, Gallo JJ. Chronic medical conditions and wishes to die among older primary care patients. Int J Psychiatry Med 2006;36:183–98.
12. Scocco P, Fantoni G, Rapattoni M, et al. Death ideas, suicidal thoughts, and plans among nursing home residents. J Geriatr Psychiatry Neurol 2009;22:141–8.
13. Scocco P, Meneghel G, Caon F, et al. Death ideation and its correlates: survey of an over-65-year-old population. J Nerv Ment Dis 2001;189:210–8.
14. Szanto K, Reynolds III CF, Frank E, et al. Suicide in elderly patients: is active vs. passive suicidal ideation a clinically valid distinction? Am J Geriatr Psychiatry, 2002;4:197–207.
15. Bartels SJ, Coakley E, Oxman TE, et al. Suicidal and death ideation in older primary care patients with depression, anxiety, and at-risk alcohol use. Am J Geriatr Psychiatry 2002;10:417–27.
16. Yip PSF. A public health approach to suicide prevention. Hong Kong J Psychiatry 2005;15:29–31.
17. van der Feltz-Cornelis CM, Sarchiapone M, Postuvan V, et al. Best practice elements of multilevel suicide prevention strategies: a review of systematic reviews. Crisis 2011;32:319–33.
18. Conwell Y. Suicide and suicide prevention in later life. Focus 2013;11:39–47.
19. Crabb R, Hunsley J. Utilization of mental health services among older adults with depression. J Clin Psychol 2006;62:299–312.
20. Luoma JB, Martin CE, Pearson JL. Contact with mental health and primary care providers before suicide: a review of the evidence. Am J Psychiatry 2002;159:909–16.
21. Ahmedani BK, Simon GE, Stewart C, et al. Health care contacts in the year before suicide death. J Gen Intern Med 2014;29:870–7.
22. Robinson JW, Roter DL. Psychosocial problem disclosure by primary care patients. Soc Sci Med 1999;48:1353–62.
23. Aminzadeh F, Dalziel WB. Older adults in the emergency department: a systematic review of patterns of use, adverse outcomes, and effectiveness of interventions. Ann Emerg Med 2002;39:238–47.
24. Osborn R, Moulds D, Squires D, et al. International survey of older adults finds shortcomings in access, coordination, and patient-centered care. Health Aff 2014;33:2247–55.
25. Siu AL, US Preventive Services Task Force. Screening for depression in adults: US Preventive Services Task Force recommendation statement. JAMA 2016;315:380–7.
26. LeFevre ML, U.S. Preventive Services Task Force. Screening for suicide risk in adolescents, adults, and older adults in primary care: U.S. Preventive Services Task Force recommendation statement. Ann Intern Med 2014;160:719–26.
27. The Joint Commission. Detecting and treating suicide risk in all settings. Sentinel Event Alert 2016;56:1–7.
28. Conwell Y, Van Orden K, Caine ED. Suicide in older adults. Psychiatr Clin North Am 2011;34:451–68.
29. American Association of Suicidology. Know the warning signs of suicide. 2016. Accessed at www.suicidology.org/resources/warning-signs.
30. National Suicide Prevention Lifeline. Suicide warning signs. 2011. Accessed at www.suicidepreventionlifeline.org/App_Files/Media/PDF/NSPL_WalletCard.pdf.
31. Conwell Y. Suicide later in life: challenges and priorities for prevention. Am J Prev Med 2014;47:S244–50.
32. Hegeman JM, Kok RM, van der Mast RC, Giltay EJ. Phenomenology of depression in older compared with younger adults: meta-analysis. Br J Psychiatry 2012;200:275–81.
33. Wuthrich VM, Johnco CJ, Wetherell JL. Differences in anxiety and depression symptoms: comparison between older and younger clinical samples. Int Psychogeriatr 2015;27:1523–32.
34. Substance Abuse and Mental Health Services Administration. Substance abuse among older adults. Treatment Improvement Protocol (TIP) Series, No. 26. HHS Publication No. (SMA) 12-3918. Rockville, MD: Substance Abuse and Mental Health Services Administration; 1998.
35. Fiske A, O’Riley AA, Widoe RK. Physical health and suicide in late life: an evaluative review. Clin Gerontologist 2008;31:31–50.
36. Duberstein PR, Conwell Y, Conner KR, et al. Suicide at 50 years of age and older: perceived physical illness, family discord, and financial strain. Psychol Med 2004;34:137–46.
37. Draper B, Peisah C, Snowdon J, Brodaty H. Early dementia diagnosis and the risk of suicide and euthanasia. Alzheimers Dement 2010;6:75–82.
38. Joiner T. Why people die by suicide. Cambridge: Harvard University Press; 2005.
39. Jahn DR, Cukrowicz KC. The impact of the nature of relationships on perceived burdensomeness and suicide ideation in a community sample of older adults. Suicide Life Threat Behav 2011;41:635–49.
40. Jahn DR, Cukrowicz KC, Linton K, Prabhu F. The mediating effect of perceived burdensomeness on the relation between depressive symptoms and suicide ideation in a community sample of older adults. Aging Ment Health 2011;15:214–20.
41. Cukrowicz KC, Jahn DR, Graham RD, et al. Suicide risk in older adults: evaluating models of risk and predicting excess zeros in a primary care sample. J Abnorm Psychol 2013;122:1021–30.
42. Fassberg MM, Van Orden KA, Duberstein, P, et al. A systematic review of social factors and suicidal behavior in older adulthood. Int J Environ Res Public Health 2012;9:722–45.
43. Pompili M, Innamorati M, Masotti V, et al. Suicide in the elderly: a psychological autopsy study in a north Italy area (1994-2004). Am J Geriatr Psychiatry 2008;16:727–35.
44. Konrad TR, Link CL, Shackelton RJ, et al. It’s about time: physicians’ perceptions of time constraints in primary medical practice in three national healthcare systems. Med Care 2010;48:95–100.
45. Tai-Seale M, McGuire TG, Zhang W. Time allocation in primary care office visits. Health Serv Res 2006;42:1871–94.
46. Bruce ML, Ten Have TR, Reynolds III CF, et al. Reducing suicidal ideation and depressive symptoms in depressed older primary care patients: a randomized controlled trial. J Am Med Assoc 2004;291:1081–91.
47. Alexopoulos GS, Reynolds CF III, Bruce ML, et al. Reducing suicidal ideation and depression in older primary care patients: 24-month outcomes of the PROSPECT study. Am J Psychiatry 2009;166:882–90.
48. Unutzer J, Tang L, Oishi S, et al. Reducing suicidal ideation in depressed older primary care patients. J Am Geriatr Soc 2006;54:1550–6.
49. Boudreaux ED, Camargo Jr CA, Arias SA, et al. Improving suicide risk screening and detection in the emergency department. Am J Prev Med 2016;50:445–53.
50. Mathias CW, Furr RM, Sheftall AH, et al. What’s the harm in asking about suicidal ideation? Suicide Life Threat Behav 2012;42:341–51.
51. Joiner T. Myths about suicide. Cambridge: Harvard University Press; 2011.
52. Heisel MJ, Flett GL. The development and initial validation of the Geriatric Suicide Ideation Scale. Am J Geriatr Psychiatry 2006;14:742–51.
53. Sheikh JL, Yesavage JA. Geriatric Depression Scale: recent evidence and development of a shorter version. In: Brink TL, editor. Clinical gerontology: a guide to assessment and intervention. New York: Howarth Press; 1986: 165–73.
54. Heisel MJ, Flett GL, Duberstein PR, Lyness JM. Does the Geriatric Depression Scale (GDS) distinguish between older adults with high versus low levels of suicidal ideation? Am J Geriatr Psychiatry 2005;13:876–83.
55. Heisel MJ, Duberstein PR, Lyness JM, Feldman MD. Screening for suicide ideation among older primary care patients. J Am Board Fam Med 2010;23:260–9.
56. Van Orden KA, Cukrowicz KC, Witte TK, Joiner Jr TE. Thwarted belongingness and perceived burdensomeness: construct validity and psychometric properties of the Interpersonal Needs Questionnaire. Psychol Assess 2012;24;197–215.
57. Department of Veterans Affairs, Department of Defense. VA/DoD clinical practice guideline for assessment and management of patients at risk for suicide. 2013. Accessed at www.healthquality.va.gov/guidelines/MH/srb/VADODCP_SuicideRisk_Full.pdf.
58. Freedenthal S. Documentation: do it well, for the client’s sake and yours. 2013. Accessed at www.speakingofsuicide.com/2013/05/25/documentation/.
59. McMyler C, Pryjmachuk S. Do ‘no-suicide’ contracts work? J Psychiatr Ment Hlt 2008;15:512–22.
60. Rudd MD, Mandrusiak M, Joiner Jr TE. The case against no-suicide contracts: the commitment to treatment statement as a practice alternative. J Clin Psychol 2006;62:243–51.
61. National Institute of Mental Health. Adding better mental health care to primary care: a new era of behavioral health integration. 2016. Accessed at www.nimh.nih.gov/news/science-news/2016/adding-better-mental-health-care-to-primary-care.shtml.
62. Lapierre S, Erlangsen A, Waern M, et al. A systematic review of elderly suicide prevention programs. Crisis 2011;32;88–98.
63. Hawton K. Restricting access to methods of suicide: rationale and evaluation of this approach to suicide prevention. Crisis 2007;28:4–9.
64. Walters H, Kulkarni M, Forman J, et al. Feasibility and acceptability of interventions to delay gun access in VA mental health settings. Gen Hosp Psychiatry 2012;34:692–8.
65. Owens D, Horrocks J, House A. Fatal and non-fatal repetition of self-harm: systematic review. Brit J Psychiatry 2002;181:193–9.
66. Bryan CJ, Stone SL, Rudd MD. A practical, evidence-based approach for means-restriction counseling with suicidal patients. Prof Psychol Res Pr 2011;42:339–46.
67. Stanley B, Brown GK. Safety plan treatment manual to reduce suicide risk: veteran version. 2008. Accessed at www.mentalhealth.va.gov/docs/va_safety_planning_manual.pdf.
68. Stanley B, Brown GK. Safety planning intervention: a brief intervention to mitigate suicide risk. Cogn Behav Pract 2012;19:256–64.
69. Jahn DR, Conti EC, Simons KV, et al. Evidence and considerations for safety planning as a suicide prevention strategy for older adults. 2017. Manuscript in preparation.
70. Knox KL, Stanley B, Currier GW, et al. An emergency department-based brief intervention for veterans at risk for suicide (SAFE VET). Am J Public Health 2012;102:S33–7.
First EDition: Mobile Stroke Units Becoming More Common, more
MITCHEL L. ZOLER
FRONTLINE MEDICAL NEWS
Mobile stroke units—specially equipped ambulances that bring a diagnostic computed tomography (CT) scanner and therapeutic thrombolysis directly to patients in the field—have begun to proliferate across the United States, although they remain investigational, with no clear proof of their incremental clinical value or cost-effectiveness.
The first US mobile stroke unit (MSU) launched in Houston, Texas in early 2014 (following the world’s first in Berlin, Germany, which began running in early 2011), and by early 2017, at least eight other US MSUs were in operation, most of them put into service during the prior 15 months. United States MSU locations now include Cleveland, Ohio; Denver, Colorado; Memphis, Tennessee; New York, New York; Toledo, Ohio; Trenton, New Jersey; and Northwestern Medicine and Rush University Medical Center in the western Chicago, Illinois region. A tenth MSU is slated to start operation at the University of California, Los Angeles later this year.
Early data collected at some of these sites show that initiating care of an acute ischemic stroke patient in an MSU shaves precious minutes off the time it takes to initiate thrombolytic therapy with tissue plasminogen activator (tPA), and findings from preliminary analyses suggest better functional outcomes for patients treated this way. However, leaders in the nascent field readily admit that the data needed to clearly prove the benefit patients receive from operating MSUs are still a few years off. This uncertainty about the added benefit to patients from MSUs couples with one clear fact: MSUs are expensive to start up, with a price tag of roughly $1 million to get an MSU on the road for the first time; they are also expensive to operate, with one estimate for the annual cost of keeping an MSU on the street at about $500,000 per year for staffing, supplies, and other expenses.
“Every US MSU I know of started with philanthropic gifts, but you need a business model” to keep the program running long-term, James C. Grotta, MD, said during a session focused on MSUs at the International Stroke Conference sponsored by the American Heart Association. “You can’t sustain an MSU with philanthropy,” said Dr Grotta, professor of neurology at the University of Texas Health Science Center in Houston, director and founder of the Houston MSU, and acknowledged “godfather” of all US MSUs.
“We believe that MSUs are very worthwhile and that the clinical and economic benefits of earlier stroke treatment [made possible with MSUs] could offset the costs, but we need to show this,” admitted May Nour, MD, a vascular and interventional neurologist at the University of California, Los Angeles (UCLA), and director of the soon-to-launch Los Angeles MSU.
The concept behind MSUs is simple: Each one carries a CT scanner on board so that once the vehicle’s staff identifies a patient with clinical signs of a significant-acute ischemic stroke in the field and confirms that the timing of the stroke onset suggests eligibility for tPA treatment, a CT scan can immediately be run on-site to finalize tPA eligibility. The MSU staff can then begin infusing the drug in the ambulance as it speeds the patient to an appropriate hospital.
In addition, many MSUs now carry a scanner that can perform a CT angiogram (CTA) to locate the occluding clot. If a large vessel occlusion is found, the crew can bring the patient directly to a comprehensive stroke center for a thrombectomy. If thrombectomy is not appropriate, the MSU crew may take the patient to a primary stroke center where thrombectomy is not available.
Another advantage to MSUs, in addition to quicker initiation of thrombolysis, is “getting patients to where they need to go faster and more directly,” said Dr Nour.
“Instead of bringing patients first to a hospital that’s unable to do thrombectomy and where treatment gets slowed down, with an MSU you can give tPA on the street and go straight to a thrombectomy center,” agreed Jeffrey L. Saver, MD, professor of neurology and director of the stroke unit at UCLA. “The MSU offers the tantalizing possibility that you can give tPA with no time hit because you can give it on the way directly to a comprehensive stroke center,” Dr Saver said during a session at the meeting.
Early Data on Effectiveness
Dr Nour reported some of the best evidence for the incremental clinical benefit of MSUs based on the reduced time for starting a tPA infusion. She used data the Berlin group published in September 2016 that compared the treatment courses and outcomes of patients managed with an MSU to similar patients managed by conventional ambulance transport for whom CT scan assessment and the start of tPA treatment did not begin until the patient reached a hospital. The German analysis showed that, in the observational Pre-hospital Acute Neurological Therapy and Optimization of Medical Care in Stroke Patients–Study (PHANTOM-S), among 353 patients treated by conventional transport, the median time from stroke onset to thrombolysis was 112 minutes, compared with a median of 73 minutes among 305 patients managed with an MSU, a statistically significant difference.1 However, the study found no significant difference for its primary endpoint: the percentage of patients with a modified Rankin Scale score of 1 or lower when measured 90 days after their respective strokes. This outcome occurred in 47% of the control patients managed conventionally and in 53% of those managed by an MSU, a difference that fell short of statistical significance
Dr Nour attributed the lack of statistical significance for this primary endpoint to the relatively small number of patients enrolled in PHANTOM-S. “The study was underpowered,” she said.
Dr Nour presented an analysis at the meeting that extrapolated the results out to 1,000 hypothetical patients and tallied the benefits that a larger number of patients could expect to receive if their outcomes paralleled those seen in the published results. It showed that among 1,000 stroke patients treated with an MSU, 58 were expected to be free from disability 90 days later, and an additional 124 patients would have some improvement in their 90-day clinical outcome based on their modified Rankin Scale scores when compared with patients undergoing conventional hospitalization.
“If this finding was confirmed in a larger, controlled study, it would suggest that MSU-based thrombolysis has substantial clinical benefit,” she concluded.
Another recent report looked at the first 100 stroke patients treated by the Cleveland MSU during 2014. Researchers at the Cleveland Clinic and Case Western Reserve University said that 16 of those 100 patients received tPA, and the median time from their emergency call to thrombolytic treatment was 38.5 minutes faster than for 53 stroke patients treated during the same period at EDs operated by the Cleveland Clinic, a statistically significant difference.2 However, this report included no data on clinical outcomes.
Running the Financial Numbers
Nailing down the incremental clinical benefit from MSUs is clearly a very important part of determining the value of this strategy, but another very practical concern is how much the service costs and whether it is financially sustainable.
“We did a cost-effectiveness analysis based on the PHANTOM-S data, and we were conservative by only looking at the benefit from early tPA treatment,” Heinrich J. Audebert, MD, professor of neurology at Charité Hospital in Berlin and head of the team running Berlin’s MSU, said during the MSU session at the meeting. “We did not take into account saving money by avoiding long-term stroke disability and just considered the cost of [immediate] care and the quality-adjusted life years. We calculated a cost of $35,000 per quality-adjusted life year, which is absolutely acceptable.”
He cautioned that this analysis was not based on actual outcomes but on the numbers needed to treat calculated from the PHANTOM-S results. “We need to now show this in controlled trials,” he admitted.
During his talk at the same session, Dr Grotta ran through the numbers for the Houston program. They spent $1.1 million to put their MSU into service in early 2014, and, based on the expenses accrued since then, he estimated an annual staffing cost of about $400,000 and an annual operating cost of about $100,000, for a total estimated 5-year cost of about $3.6 million. Staffing of the Houston MSU started with a registered nurse, CT technician, paramedic, and vascular neurologist, although, like most other US MSUs, the onboard neurologist has since been replaced by a second paramedic, and the neurological diagnostic consult is done via a telemedicine link.
Income from transport reimbursement, currently $500 per trip, and reimbursements of $17,000 above costs for administering tPA and of roughly $40,000 above costs for performing thrombectomy, are balancing these costs. Based on an estimated additional one thrombolysis case per month and one additional thrombectomy case per month, the MSU yields a potential incremental income to the hospital running the MSU of about $3.8 million over 5 years—enough to balance the operating cost, Dr Grotta said.
A key part of controlling costs is having the neurological consult done via a telemedicine link rather than by neurologist at the MSU. “Telemedicine reduces operational costs and improves efficiency,” noted M. Shazam Hussain, MD, interim director of the Cerebrovascular Center at the Cleveland Clinic. “Cost-effectiveness is a very important part of the concept” of MSUs, he said at the session.
The Houston group reported results from a study that directly compared the diagnostic performance of an onboard neurologist with that of a telemedicine neurologist linked-in remotely during MSU deployments for 174 patients. For these cases, the two neurologists each made an independent diagnosis that the researchers then compared. The two diagnoses concurred for 88% of the cases, Tzu-Ching Wu, MD, reported at the meeting. This rate of agreement matched the incidence of concordance between two neurologists who independently assessed the same patients at the hospital,3 said Dr Wu, a vascular neurologist and director of the telemedicine program at the University of Texas Health Science Center in Houston.
“The results support using telemedicine as the primary means of assessment on the MSU,” said Dr Wu. “This may enhance MSU efficiency and reduce costs.” His group’s next study of MSU telemedicine will compare the time needed to make a diagnostic decision using the two approaches, which Dr Wu reported was something not formally examined in the study.
However, telemedicine assessment of CT results gathered in an MSU has one major limitation: the time needed to transmit the huge amount of information from a CTA.
The MSU used by clinicians at the University of Tennessee, Memphis, incorporates an extremely powerful battery that enables “full CT scanner capability with a moving gantry,” said Andrei V. Alexandrov, MD, professor and chairman of neurology at the university. With this set up “we can do in-the-field multiphasic CT angiography from the aortic arch up within 4 minutes. The challenge of doing this is simple. It’s 1.7 gigabytes of data,” which would take a prohibitively long time to transmit from a remote site, he explained. As a result, the complete set of images from the field CTA is delivered on a memory stick to the attending hospital neurologist once the MSU returns.
Waiting for More Data
Despite these advances and the steady recent growth of MSUs, significant skepticism remains. “While mobile stroke units seem like a good idea and there is genuine hope that they will improve outcomes for selected stroke patients, there is not yet any evidence that this is the case,” wrote Bryan Bledsoe, DO, in a January 2017 editorial in the Journal of Emergency Medical Services. “They are expensive and financially nonsustainable. Without widespread deployment, they stand to benefit few, if any, patients. The money spent on these devices would be better spent on improving the current EMS system, including paramedic education, the availability of stroke centers, and on the early recognition of ELVO [emergent large vessel occlusion] strokes,” wrote Dr Bledsoe, professor of emergency medicine at the University of Nevada in Las Vegas.
Two other experts voiced concerns about MSUs in an editorial that accompanied a Cleveland Clinic report in March.4 “Even if MSUs meet an acceptable societal threshold for cost-effectiveness, cost-efficiency may prove a taller order to achieve return on investment for individual health systems and communities,” wrote Andrew M. Southerland, MD, and Ethan S. Brandler, MD. They cited the Cleveland report, which noted that the group’s first 100 MSU-treated patients came from a total of 317 MSU deployments and included 217 trips that were canceled prior to the MSU’s arrival at the patient’s location. In Berlin’s initial experience, more than 2,000 MSU deployments led to 200 tPA treatments and 349 cancellations before arrival, noted Dr Southerland, a neurologist at the University of Virginia in Charlottesville, and Dr Brandler, an emergency medicine physician at Stony Brook (NY) University.
“Hope remains that future trials may demonstrate the ultimate potential of mobile stroke units to improve long-term outcomes for more patients by treating them more quickly and effectively. In the meantime, ongoing efforts are needed to streamline MSU cost and efficiency,” they wrote.
Proponents of MSUs agree that what’s needed now are more data to prove efficacy and cost-effectiveness, as well as better integration into EMS programs. The first opportunity for documenting the clinical impact of MSUs on larger numbers of US patients may be from the BEnefits of Stroke Treatment Delivered using a Mobile Stroke Unit Compared to Standard Management by Emergency Medical Services (BEST-MSU) Study, funded by the Patient-Centered Outcomes Research Institute. This study is collecting data from the MSU programs in Denver, Houston, and Memphis. Although currently designed to enroll 697 patients, Dr Grotta said he hopes to bring the number up to 1,000 patients.
“We are following the health care use and its cost for every enrolled MSU and conventional patient for 1 year,” Dr Grotta explained in an interview. He hopes these results will provide the data needed to move MSUs from investigational status to routine and reimbursable care.
References
1. Kunz A, Ebinger M, Geisler F, et al. Functional outcomes of pre-hospital thrombolysis in a mobile stroke treatment unit compared with conventional care: an observational registry study. Lancet Neurol. 2016;15(10):1035-1043. doi:10.1016/S1474-4422(16)30129-6.
2. Taqui A, Cerejo R, Itrat A, et al; Cleveland Pre-Hospital Acute Stroke Treatment (PHAST) Group. Reduction in time to treatment in prehospital telemedicine evaluation and thrombolysis. Neurology. 2017 March 8. [Epub ahead of print]. doi:10.1212/WNL.0000000000003786.
3. Ramadan AR, Denny MC, Vahidy F, et al. Agreement among stroke faculty and fellows in treating ischemic stroke patients with tissue-type plasminogen activator and thrombectomy. Stroke. 2017;48(1):222-224. doi:10.1161/STROKEAHA.116.015214.
4. Southerland AM, Brandler ES. The cost-efficiency of mobile stroke units: Where the rubber meets the road. Neurology. 2017 Mar 8. [Epub ahead of print]. doi:10.1212/WNL.0000000000003833.
Pulmonary Embolism Common in Patients With Acute Exacerbations of COPD
JIM KLING
FRONTLINE MEDICAL NEWS
About 16% of patients with unexplained acute exacerbations of chronic obstructive pulmonary disease (AECOPD) had an accompanying pulmonary embolism (PE), usually in regions that could be targeted with anticoagulants, according to a new systematic review and meta-analysis.
Approximately 70% of AECOPD cases develop in response to an infection, but about 30% of the time, an AE has no clear cause, the authors said in a report on their research. There is a known biological link between inflammation and coagulation, which suggests that patients experiencing AECOPD may be at increased risk of PE.
The researchers reviewed and analyzed seven studies, comprising 880 patients. Among the authors’ reasons for conducting this research was to update the pooled prevalence of PE in AECOPD from a previous systematic review published in Chest in 2009.
The meta-analysis revealed that 16.1% of patients with AECOPD were also diagnosed with PE (95% confidence interval [CI], 8.3%-25.8%). There was a wide range of variation between individual studies (prevalence 3.3%-29.1%). In six studies that reported on deep vein thrombosis (DVT), the pooled prevalence of DVT was 10.5% (95% CI, 4.3%-19.0%).
Five of the studies identified the PE location. An analysis of those studies showed that 35% were in the main pulmonary artery, and 31.7% were in the lobar and interlobar arteries. Such findings “[suggest] that the majority of these embolisms have important clinical consequences,” the authors wrote.
The researchers also looked at clinical markers that accompanied AECOPD and found a potential signal with respect to pleuritic chest pain. One study found a strong association between pleuritic chest pain and AECOPD patients with PE (81% vs 40% in those without PE). A second study showed a similar association (24% in PE vs 11.5% in non-PE patients), and a third study found no significant difference.
The presence of PE was also linked to hypotension, syncope, and acute right failure on ultrasonography, suggesting that PE may be associated with heart failure.
Patients with PE were less likely to have symptoms consistent with a respiratory tract infection. They also tended to have higher mortality rates and longer hospitalization rates compared with those without PE.
The meta-analysis had some limitations, including the heterogeneity of findings in the included studies, as well as the potential for publication bias, since reports showing unusually low or high rates may be more likely to be published, the researchers noted. There was also a high proportion of male subjects in the included studies.
Overall, the researchers concluded that PE is more likely in patients with pleuritic chest pain and signs of heart failure, and less likely in patients with signs of a respiratory infection. That information “might add to the clinical decision-making in patients with an AECOPD, because it would be undesirable to perform [CT pulmonary angiography] in every patient with an AECOPD,” the researchers wrote.
Aleva FE, Voets LW, Simons SO, de Mast Q, van der Ven AJ, Heijdra YF. Prevalence and localization of pulmonary embolism in unexplained acute exacerbations of COPD: A systematic review and meta-analysis. Chest. 2017;151(3):544-554. doi:10.1016/j.chest.2016.07.034.
Norepinephrine Shortage Linked to Mortality in Patients With Septic Shock
AMY KARON
FRONTLINE MEDICAL NEWS
A national shortage of norepinephrine in the United States was associated with higher rates of mortality among patients hospitalized with septic shock, investigators reported.
Rates of in-hospital mortality in 2011 were 40% during quarters when hospitals were facing shortages and 36% when they were not, Emily Vail, MD, and her associates said at the International Symposium on Intensive Care and Emergency Medicine. The report was published simultaneously in JAMA.
The link between norepinephrine shortage and death from septic shock persisted even after the researchers accounted for numerous clinical and demographic factors (adjusted odds ratio, 1.2; 95% CI, 1.01 to 1.30; P = .03), wrote Dr Vail of Columbia University, New York.
Drug shortages are common in the United States, but few studies have explored their effects on patient outcomes. Investigators compared mortality rates among affected patients during 3-month intervals when hospitals were and were not using at least 20% less norepinephrine than baseline. The researchers used Premier Healthcare Database, which includes both standard claims and detailed, dated logs of all services billed to patients or insurance, with minimal missing data.
A total of 77% patients admitted with septic shock received norepinephrine before the shortage. During the lowest point of the shortage, 56% of patients received it, the researchers reported. Clinicians most often used phenylephrine instead, prescribing it to up to 54% of patients during the worst time of the shortage. The absolute increase in mortality during the quarters of shortage was 3.7% (95% CI, 1.5%-6.0%).
Several factors might explain the link between norepinephrine shortage and mortality, the investigators said. The vasopressors chosen to replace norepinephrine might result directly in worse outcomes, but a decrease in norepinephrine use also might be a proxy for relevant variables such as delayed use of vasopressors, lack of knowledge of how to optimally dose vasopressors besides norepinephrine, or the absence of a pharmacist dedicated to helping optimize the use of limited supplies.
The study did not uncover a dose-response association between greater decreases in norepinephrine use and increased mortality, the researchers noted. “This may be due to a threshold effect of vasopressor shortage on mortality, or lack of power due to relatively few hospital quarters at the extreme levels of vasopressor shortage,” they wrote.
Because the deaths captured included only those that occurred in-hospital, “the results may have underestimated mortality, particularly for hospitals that tend to transfer patients early to other skilled care facilities,” the researchers noted.
The cohort of patients was limited to those who received vasopressors for 2 or more days and excluded patients who died on the first day of vasopressor treatment, the researchers said.
Vail E, Gershengorn HB, Hua M, Walkey AJ, Rubenfeld G, Wunsch H. Association between US norepinephrine shortage and mortality among patients with septic shock. JAMA. 21 March 2017. [Epub ahead of print]. doi:10.1001/jama.2017.2841.

Subscapularis Tenotomy Versus Lesser Tuberosity Osteotomy for Total Shoulder Arthroplasty: A Systematic Review
Take-Home Points
- According to the orthopedic literature, ST and LTO for a TSA produce excellent clinical outcomes, and technique selection should be based on surgeon discretion and expertise.
- Compared with the LTO approach, the ST approach produced significantly more forward elevation improvement and trended toward more external rotation and abduction and fewer revisions.
- ST and LTO approaches for a TSA result in similar Constant scores, pain scores, radiographic outcomes, and complication rates.
During total shoulder arthroplasty (TSA) exposure, the subscapularis muscle must be mobilized; its repair is crucial to the stability of the arthroplasty. The subscapularis is the largest rotator cuff muscle and has a contractile force equal to that of the other 3 muscles combined.1,2 Traditionally it is mobilized with a tenotomy just medial to the tendon’s insertion onto the lesser tuberosity. Over the past 15 years, however, numerous authors have reported dysfunction after subscapularis tenotomy (ST). In 2003, Miller and colleagues3 reported that, at 2-year follow-up, almost 70% of patients had abnormal belly-press and liftoff tests, surrogate markers of subscapularis function. Other authors have found increased rates of anterior instability after subscapularis rupture.4,5
In 2005, Gerber and colleagues6 introduced a technique for circumventing surgical division of the subscapularis. They described a lesser tuberosity osteotomy (LTO), in which the subscapularis tendon is detached with a bone fragment 5 mm to 10 mm in thickness and 3 cm to 4 cm in length. This approach was based on the premise that bone-to-bone healing is more reliable than tendon-to-tendon healing. Initial studies reported successful osteotomy healing, improved clinical outcome scores, and fewer abnormalities with belly-press and liftoff tests.2,6 More recent literature, however, has questioned the necessity of LTO.2,4,7-9We performed a systematic review to evaluate the literature, describe ST and LTO, and summarize the radiographic and clinical outcomes of both techniques. We hypothesized there would be no significant clinical differences between these approaches.
Methods
Search Strategy and Study Selection
Using PRISMA (Preferred Reporting Items for Systematic Reviews and Meta-Analyses) guidelines, we systematically reviewed the literature.10 Searches were completed in September 2014 using the PubMed Medline database and the Cochrane Central Register of Clinical Trials. Two reviewers (Dr. Louie, Dr. Levy) independently performed the search and assessed eligibility of all relevant studies based on predetermined inclusion criteria. Disagreements between reviewers were resolved by discussion. Key word selection was designed to capture all English-language studies with clinical and/or radiographic outcomes and level I to IV evidence. We used an electronic search algorithm with key words and a series of NOT phrases to match certain exclusion criteria:
(((((((((((((((((((((((((((((((((((((total[Text Word]) AND shoulder[Title]) AND arthroplasty[Title] AND (English[lang]))) NOT reverse[Title/Abstract]) NOT hemiarthroplasty[Title]) NOT nonoperative[Title]) NOT nonsurgical[Title] AND (English[lang]))) NOT rheumatoid[Title/Abstract]) NOT inflammatory[Title/Abstract]) NOT elbow[Title/Abstract]) NOT wrist[Title/Abstract]) NOT hip[Title/Abstract]) NOT knee[Title/Abstract]) NOT ankle[Title/Abstract] AND (English[lang]))) NOT biomechanic[Title/Abstract]) NOT biomechanics[Title/Abstract]) NOT biomechanical [Title/Abstract]) NOT cadaveric[Title/Abstract]) NOT revision[Title]) NOT resurfacing[Title/Abstract]) NOT surface[Title/Abstract]) NOT interphalangeal[Title/Abstract] AND (English[lang]))) NOT radiostereometric[Title/Abstract] AND (English[lang]))) NOT cmc[Title/Abstract]) NOT carpometacarpal[Title/Abstract]) NOT cervical[Title/Abstract]) NOT histology[Title/Abstract]) NOT histological[Title/Abstract]) NOT collagen[Title/Abstract] AND (English[lang]))) NOT kinematic[Title/Abstract]) NOT kinematics[Title/Abstract] AND (English[lang]))) NOT vitro[Title/Abstract] AND (English[lang]))) NOT inverted[Title/Abstract]) NOT grammont[Title/Abstract]) NOT arthrodesis[Title/Abstract]) NOT fusion[Title/Abstract]) NOT reverse[Title/Abstract] AND (English[lang]))
Study exclusion criteria consisted of cadaveric, biomechanical, histologic, and kinematic results as well as analyses of nonoperative management, hemiarthroplasty, or reverse TSA. Studies were excluded if they did not report clinical and/or radiographic data. Minimum mean follow-up was 2 years. To discount the effect of other TSA technical innovations, we evaluated the same period for the 2 surgical approaches. The first study with clinical outcomes after LTO was published in early 2005,6 so all studies published before 2005 were excluded.
We reviewed all references within the studies included by the initial search algorithm: randomized control trials, retrospective and prospective cohort designs, case series, and treatment studies. Technical notes, review papers, letters to the editor, and level V evidence reviews were excluded. To avoid counting patients twice, we compared each study’s authors and data collection period with those of the other studies. If there was overlap in authorship, period, and place, only the study with the longer follow-up or more comprehensive data was included. All trials comparing ST and LTO were included. If the authors of a TSA study did not describe the approach used, that study was excluded from our review.
Data Extraction
We collected details of study design, sample size, and patient demographics (sex, age, hand dominance, primary diagnosis). We also abstracted surgical factors about the glenoid component (cemented vs uncemented; pegged vs keeled; all-polyethylene vs metal-backed) and the humeral component (cemented vs press-fit; stemmed vs stemless). Clinical outcomes included pain scores, functional scores, number of revisions, range of motion (ROM), and subscapularis-specific tests (eg, belly-press, liftoff). As pain scales varied between studies, all values were converted to a 10-point scoring scale (0 = no pain; 10 = maximum pain) for comparisons. Numerous functional outcome scores were reported, but the Constant score was the only one consistently used across studies, making it a good choice for comparisons. One study used Penn Shoulder Scores (PSSs) and directly compared ST and LTO groups, so its data were included. In addition, radiographic data were compiled: radiolucencies around the humeral stem and glenoid component, humeral head subluxation/migration, and osteotomy healing. The only consistent radiographic parameter available for comparisons between groups was the presence of radiolucencies.
The Modified Coleman Methodology Score (MCMS), described by Cowan and colleagues,11 was used to evaluate the methodologic quality of each study. The MCMS is a 15-item instrument that has been used to assess both randomized and nonrandomized trials.12,13 It has a scaled score ranging from 0 to 100 (85-100, excellent; 70-84, good; 55-69, fair; <55, poor). Study quality was not factored into the data synthesis analysis.
Statistical Analysis
Data are reported as weighted means and standard deviations. A mean was calculated for each study reporting on a respective data point and was then weighed according to the study sample size. The result was that the nonweighted means from studies with smaller samples did not carry as much weight as those from studies with larger samples. Student t tests and 2-way analysis of variance were used to compare the ST and LTO groups and assess differences over time (SPSS Version 18; IBM). An α of 0.05 was set as statistically significant.
Results
Twenty studies (1420 shoulders, 1392 patients) were included in the final dataset (Figure).2,6,8,14-30 
The youngest patients in the ST and LTO groups were 22 years and 19 years of age, respectively. 
Table 2 lists the details regarding the surgical components. For glenoid components, the ST and LTO groups’ fixation types and material used were not significantly different. 
Table 3 lists the clinical and radiographic outcomes most consistently reported in the literature. Physical examination data were reported in 18 ST populations8,14-16,21-30 and 11 LTO populations.2,6,14-20
Constant scores were reported in 4 ST studies14,22,24,27 and 3 LTO studies14,17,18 (Table 3). There was no significant difference (P = .37) in post-TSA Constant score improvement between the 2 groups. In the one study that performed direct comparisons, PSS improved on average from 29 to 81 in the ST group and from 29 to 92 in the LTO group.15 Several ST studies reported improved scores on various indices: WOOS (Western Ontario Osteoarthritis of the Shoulder), ASES (American Shoulder and Elbow Surgeons), SST (Simple Shoulder Test), DASH (Disabilities of the Arm, Shoulder, and Hand), SF-12 (Short Form 12-Item Health Survey), MACTAR (McMaster Toronto Arthritis Patient Preference Disability Questionnaire), and Neer shoulder impingement test.8,14,15,21,23-25,27-30 However, these outcomes were not reported in LTO cohorts for comparison. Similarly, 2 LTO cohorts reported improvements in SSV (subjective shoulder value) scores, but this measure was not used in the ST cohorts.6,17 Five ST studies recorded patients’ subjective satisfaction: 58% of patients indicated an excellent outcome, 35% a satisfactory outcome, and 7% a less than satisfactory outcome.21,23,25,26,29 Only 1 LTO study reported patient satisfaction: 69% excellent, 31% satisfactory, 0% dissatisfied.17
Complications were reported in 16 ST studies8,15,21-30 and 6 LTO studies.15,17-19 There were 117 complications (17.8%) and 58 revisions (10.0%) in the ST group and 52 complications (17.2%) and 49 revisions (16.2%) in the LTO group. In the ST group, aseptic loosening (6.2%) was the most common complication, followed by subscapularis tear or attenuation (5.2%), dislocation (2.1%), and deep infection (0.5%). In the LTO group, aseptic loosening was again the most common (9.0%), followed by dislocation (4.0%), subscapularis tear or attenuation (2.2%), and deep infection (0.7%). There were no significant differences in the incidence of individual complications between groups. The difference in revision rates was not statistically significant (P = .31).
Radiolucency data were reported in 12 ST studies19,21-26,28,30 and 2 LTO studies.17,18 There were no discussions of humeral component radiolucencies in the LTO studies. At final follow-up, radiolucencies of the glenoid component were detected in 42.3% of patients in the ST group and 40.7% of patients in the LTO group (P = .76).
Discussion
Our goal in this systematic review was to analyze outcomes associated with ST and LTO in a heterogenous TSA population. We hypothesized TSA with ST or LTO would produce similar clinical and radiographic outcomes. There were no significant differences in Constant scores, pain scores, radiolucencies, or complications between the 2 groups. The ST group showed trends toward wider ROM improvements and fewer revisions, but only the change in forward elevation was significant. The components used in the 2 groups were similar with the exception of a lack of keeled glenoids and cemented humeral stems in the LTO group; data stratification controlling for these differences revealed no change in outcomes.
The optimal method of subscapularis mobilization for TSA remains a source of debate. Jackson and colleagues23 found significant improvements in Neer and DASH scores after ST. However, 7 of 15 patients ruptured the subscapularis after 6 months and had significantly lower DASH scores. In 2005, Gerber and colleagues6 first described the LTO technique as an alternative to ST. After a mean of 39 months, 89% of their patients had a negative belly-press test, and 75% had a normal liftoff test. Radiographic evaluation revealed that the osteotomized fragment had healed in an anatomical position in all shoulders. In a large case series, Small and colleagues20 used radiographs and computed tomography to further investigate LTO healing rates and found that 89% of patients had bony union by 6 months and that smoking was a significant risk factor for nonunion.
Biomechanical studies comparing ST and LTO approaches have shown mixed results. Ponce and colleagues2 found decreased cyclic displacement and increased maximum load to failure with LTO, but Giuseffi and colleagues32 showed less cyclic displacement with ST and no difference in load to failure. Others authors have found no significant differences in stiffness or maximum load to failure.33 Van den Berghe and colleagues7 reported a higher failure rate in bone-to-bone repairs compared with tendon-to-tendon constructs. Moreover, they found that suture cut-out through bone tunnels is the primary mode of LTO failure, so many LTO surgeons now pass sutures around the humeral stem instead.
Three TSA studies directly compared ST and LTO approaches. Buckley and colleagues14 analyzed 60 TSAs and found no significant differences in WOOS, DASH, or Constant scores between groups. The authors described an ST subgroup with subscapularis attenuation on ultrasound but did not report the group as having any inferior functional outcome. Scalise and colleagues15 showed improved strength and PSSs in both groups after 2 years. However, the LTO group had a lower rate of subscapularis tears and significantly higher PSSs. Finally, Jandhyala and colleagues16 reported more favorable outcomes with LTO, which trended toward wider ROM and significantly higher belly-press test grades. Lapner and colleagues34 conducted a randomized, controlled trial (often referenced) and found no significant differences between the 2 groups in terms of strength or functional outcome at 2-year follow-up. Their study, however, included hemiarthroplasties and did not substratify the TSA population, so we did not include it in our review.
Our systematic review found significantly more forward elevation improvement for the ST group than the LTO group, which may suggest improved ROM with a soft-tissue approach than a bony approach. At the same time, the ST group trended toward better passive external rotation relative to the LTO group. This trend indicates fewer constraints to external rotation in the ST group, possibly attributable to a more attenuated subscapularis after tenotomy. Subscapularis tear or attenuation was more commonly reported in the ST group than in the LTO group, though not significantly so. This may indicate that more ST studies than LTO studies specially emphasized postoperative subscapularis function, but these data also highlight some authors’ concerns regarding subscapularis dysfunction after tenotomy.6,15,16The study populations’ complication rates were similar, just over 17%. The LTO group trended toward a higher revision rate, but it was not statistically significant. The LTO group also had significantly fewer patients with osteoarthritis and more patients with posttraumatic arthritis, so this group may have had more complex patients predisposed to a higher likelihood of revision surgery. Revisions were most commonly performed for aseptic loosening; theoretically, if osteotomies heal less effectively than tenotomies, the LTO approach could produce component instability and aseptic loosening. However, no prior studies or other clinical findings from this review suggest LTO predisposes to aseptic loosening. Overall, the uneven revision rates represent a clinical concern that should be monitored as larger samples of patients undergo ST and LTO procedures.
Glenoid radiolucencies were the only radiographic parameter consistently reported in the included studies. Twelve ST studies had radiolucency data—compared with only 2 LTO studies. Thus, our ability to compare radiographic outcomes was limited. Our data revealed similar rates of glenoid radiolucencies between the 2 approaches. The clinical relevance of radiolucencies is questioned by some authors, and, indeed, Razmjou and colleagues25 found no correlation of radiolucencies with patient satisfaction. Nevertheless, early presence of radiolucencies may raise concerns about progressive loss of fixation,35,36 so this should be monitored.
Limitations of this systematic review reflect the studies analyzed. We minimized selection bias by including level I to IV evidence, but most studies were level IV, and only 1 was level I. As such, there was a relative paucity of consistent clinical and radiographic data. For instance, although many ST studies reported patient satisfaction as an outcomes measure, only 1 LTO study commented on it. Perhaps the relative novelty of the LTO approach has prompted some authors to focus more on technical details and less on reporting a variety of outcome measures. As mentioned earlier, the significance of radiolucency data is controversial, and determination of their presence or absence depends on the observer. A radiolucency found in one study may not qualify as one in a study that uses different criteria. However, lucency data were the most frequently and reliably reported radiographic parameter, so we deemed it the most appropriate method for comparing radiographic outcomes. Finally, the baseline differences in diagnosis between the ST and LTO groups complicated comparisons. We stratified the groups by component design because use of keeled or pegged implants or humeral cemented or press-fit stems was usually a uniform feature of each study—enabling removal of certain studies for data stratification. However, we were unable to stratify by original diagnosis because these groups were not stratified within the individual studies.
Conclusion
Our systematic review found similar Constant scores, pain scores, radiographic outcomes, and complication rates for the ST and LTO approaches. Compared with the LTO approach, the ST approach produced significantly more forward elevation improvement and trended toward more external rotation and abduction and fewer revisions. Although not definitive, these data suggest the ST approach may provide more stability over the long term, but additional comprehensive studies are needed to increase the sample size and the power of the trends elucidated in this review. According to the orthopedic literature, both techniques produce excellent clinical outcomes, and technique selection should be based on surgeon discretion and expertise.
Am J Orthop. 2017;46(2):E131-E138. Copyright Frontline Medical Communications Inc. 2017. All rights reserved.
1. Keating JF, Waterworth P, Shaw-Dunn J, Crossan J. The relative strengths of the rotator cuff muscles. A cadaver study. J Bone Joint Surg Br. 1993;75(1):137-140.
2. Ponce BA, Ahluwalia RS, Mazzocca AD, Gobezie RG, Warner JJ, Millett PJ. Biomechanical and clinical evaluation of a novel lesser tuberosity repair technique in total shoulder arthroplasty. J Bone Joint Surg Am. 2005;87(suppl 2):1-8.
3. Miller SL, Hazrati Y, Klepps S, Chiang A, Flatow EL. Loss of subscapularis function after total shoulder replacement: a seldom recognized problem. J Shoulder Elbow Surg. 2003;12(1):29-34.
4. Gerber A, Ghalambor N, Warner JJ. Instability of shoulder arthroplasty: balancing mobility and stability. Orthop Clin North Am. 2001;32(4):661-670, ix.
5. Moeckel BH, Altchek DW, Warren RF, Wickiewicz TL, Dines DM. Instability of the shoulder after arthroplasty. J Bone Joint Surg Am. 1993;75(4):492-497.
6. Gerber C, Yian EH, Pfirrmann CA, Zumstein MA, Werner CM. Subscapularis muscle function and structure after total shoulder replacement with lesser tuberosity osteotomy and repair. J Bone Joint Surg Am. 2005;87(8):1739-1745.
7. Van den Berghe GR, Nguyen B, Patil S, et al. A biomechanical evaluation of three surgical techniques for subscapularis repair. J Shoulder Elbow Surg. 2008;17(1):156-161.
8. Caplan JL, Whitfield B, Neviaser RJ. Subscapularis function after primary tendon to tendon repair in patients after replacement arthroplasty of the shoulder. J Shoulder Elbow Surg. 2009;18(2):193-196.
9. Armstrong A, Lashgari C, Teefey S, Menendez J, Yamaguchi K, Galatz LM. Ultrasound evaluation and clinical correlation of subscapularis repair after total shoulder arthroplasty. J Shoulder Elbow Surg. 2006;15(5):541-548.
10. Moher D, Liberati A, Tetzlaff J, Altman DG; PRISMA Group. Preferred Reporting Items for Systematic Reviews and Meta-Analyses: the PRISMA statement. Int J Surg. 2010;8(5):336-341.
11. Cowan J, Lozano-Calderón S, Ring D. Quality of prospective controlled randomized trials. Analysis of trials of treatment for lateral epicondylitis as an example. J Bone Joint Surg Am. 2007;89(8):1693-1699.
12. Harris JD, Siston RA, Pan X, Flanigan DC. Autologous chondrocyte implantation: a systematic review. J Bone Joint Surg Am. 2010;92(12):2220-2233.
13. Harris JD, Siston RA, Brophy RH, Lattermann C, Carey JL, Flanigan DC. Failures, re-operations, and complications after autologous chondrocyte implantation—a systematic review. Osteoarthritis Cartilage. 2011;19(7):779-791.
14. Buckley T, Miller R, Nicandri G, Lewis R, Voloshin I. Analysis of subscapularis integrity and function after lesser tuberosity osteotomy versus subscapularis tenotomy in total shoulder arthroplasty using ultrasound and validated clinical outcome measures. J Shoulder Elbow Surg. 2014;23(9):1309-1317.
15. Scalise JJ, Ciccone J, Iannotti JP. Clinical, radiographic, and ultrasonographic comparison of subscapularis tenotomy and lesser tuberosity osteotomy for total shoulder arthroplasty. J Bone Joint Surg Am. 2010;92(7):1627-1634.
16. Jandhyala S, Unnithan A, Hughes S, Hong T. Subscapularis tenotomy versus lesser tuberosity osteotomy during total shoulder replacement: a comparison of patient outcomes. J Shoulder Elbow Surg. 2011;20(7):1102-1107.
17. Fucentese SF, Costouros JG, Kühnel SP, Gerber C. Total shoulder arthroplasty with an uncemented soft-metal-backed glenoid component. J Shoulder Elbow Surg. 2010;19(4):624-631.
18. Clement ND, Duckworth AD, Colling RC, Stirrat AN. An uncemented metal-backed glenoid component in total shoulder arthroplasty for osteoarthritis: factors affecting survival and outcome. J Orthop Sci. 2013;18(1):22-28.
19. Rosenberg N, Neumann L, Modi A, Mersich IJ, Wallace AW. Improvements in survival of the uncemented Nottingham Total Shoulder prosthesis: a prospective comparative study. BMC Musculoskelet Disord. 2007;8(1):76.
20. Small KM, Siegel EJ, Miller LR, Higgins LD. Imaging characteristics of lesser tuberosity osteotomy after total shoulder replacement: a study of 220 patients. J Shoulder Elbow Surg. 2014;23(9):1318-1326.
21. Mileti J, Sperling JW, Cofield RH, Harrington JR, Hoskin TL. Monoblock and modular total shoulder arthroplasty for osteoarthritis. J Bone Joint Surg Br. 2005;87(4):496-500.
22. Merolla G, Paladini P, Campi F, Porcellini G. Efficacy of anatomical prostheses in primary glenohumeral osteoarthritis. Chir Organi Mov. 2008;91(2):109-115.
23. Jackson JD, Cil A, Smith J, Steinmann SP. Integrity and function of the subscapularis after total shoulder arthroplasty. J Shoulder Elbow Surg. 2010;19(7):1085-1090.
24. Jost PW, Dines JS, Griffith MH, Angel M, Altchek DW, Dines DM. Total shoulder arthroplasty utilizing mini-stem humeral components: technique and short-term results. HSS J. 2011;7(3):213-217.
25. Razmjou H, Holtby R, Christakis M, Axelrod T, Richards R. Impact of prosthetic design on clinical and radiologic outcomes of total shoulder arthroplasty: a prospective study. J Shoulder Elbow Surg. 2013;22(2):206-214.
26. Raiss P, Schmitt M, Bruckner T, et al. Results of cemented total shoulder replacement with a minimum follow-up of ten years. J Bone Joint Surg Am. 2012;94(23):e1711-1710.
27. Litchfied RB, McKee MD, Balyk R, et al. Cemented versus uncemented fixation of humeral components in total shoulder arthroplasty for osteoarthritis of the shoulder: a prospective, randomized, double-blind clinical trial—a JOINTs Canada Project. J Shoulder Elbow Surg. 2011;20(4):529-536.
28. Martin SD, Zurakowski D, Thornhill TS. Uncemented glenoid component in total shoulder arthroplasty. Survivorship and outcomes. J Bone Joint Surg Am. 2005;87(6):1284-1292.
29. Taunton MJ, McIntosh AL, Sperling JW, Cofield RH. Total shoulder arthroplasty with a metal-backed, bone-ingrowth glenoid component. Medium to long-term results. J Bone Joint Surg Am. 2008;90(10):2180-2188.
30. Budge MD, Nolan EM, Heisey MH, Baker K, Wiater JM. Results of total shoulder arthroplasty with a monoblock porous tantalum glenoid component: a prospective minimum 2-year follow-up study. J Shoulder Elbow Surg. 2013;22(4):535-541.
31. Gerber C, Costouros JG, Sukthankar A, Fucentese SF. Static posterior humeral head subluxation and total shoulder arthroplasty. J Shoulder Elbow Surg. 2009;18(4):505-510.
32. Giuseffi SA, Wongtriratanachai P, Omae H, et al. Biomechanical comparison of lesser tuberosity osteotomy versus subscapularis tenotomy in total shoulder arthroplasty. J Shoulder Elbow Surg. 2012;21(8):1087-1095.
33. Van Thiel GS, Wang VM, Wang FC, et al. Biomechanical similarities among subscapularis repairs after shoulder arthroplasty. J Shoulder Elbow Surg. 2010;19(5):657-663.
34. Lapner PL, Sabri E, Rakhra K, Bell K, Athwal GS. Comparison of lesser tuberosity osteotomy to subscapularis peel in shoulder arthroplasty: a randomized controlled trial. J Bone Joint Surg Am. 2012;94(24):2239-2246.
35. Cofield RH. Total shoulder arthroplasty with the Neer prosthesis. J Bone Joint Surg Am. 1984;66(6):899-906.
36. Torchia ME, Cofield RH, Settergren CR. Total shoulder arthroplasty with the Neer prosthesis: long-term results. J Shoulder Elbow Surg. 1997;6(6):495-505.
Take-Home Points
- According to the orthopedic literature, ST and LTO for a TSA produce excellent clinical outcomes, and technique selection should be based on surgeon discretion and expertise.
- Compared with the LTO approach, the ST approach produced significantly more forward elevation improvement and trended toward more external rotation and abduction and fewer revisions.
- ST and LTO approaches for a TSA result in similar Constant scores, pain scores, radiographic outcomes, and complication rates.
During total shoulder arthroplasty (TSA) exposure, the subscapularis muscle must be mobilized; its repair is crucial to the stability of the arthroplasty. The subscapularis is the largest rotator cuff muscle and has a contractile force equal to that of the other 3 muscles combined.1,2 Traditionally it is mobilized with a tenotomy just medial to the tendon’s insertion onto the lesser tuberosity. Over the past 15 years, however, numerous authors have reported dysfunction after subscapularis tenotomy (ST). In 2003, Miller and colleagues3 reported that, at 2-year follow-up, almost 70% of patients had abnormal belly-press and liftoff tests, surrogate markers of subscapularis function. Other authors have found increased rates of anterior instability after subscapularis rupture.4,5
In 2005, Gerber and colleagues6 introduced a technique for circumventing surgical division of the subscapularis. They described a lesser tuberosity osteotomy (LTO), in which the subscapularis tendon is detached with a bone fragment 5 mm to 10 mm in thickness and 3 cm to 4 cm in length. This approach was based on the premise that bone-to-bone healing is more reliable than tendon-to-tendon healing. Initial studies reported successful osteotomy healing, improved clinical outcome scores, and fewer abnormalities with belly-press and liftoff tests.2,6 More recent literature, however, has questioned the necessity of LTO.2,4,7-9We performed a systematic review to evaluate the literature, describe ST and LTO, and summarize the radiographic and clinical outcomes of both techniques. We hypothesized there would be no significant clinical differences between these approaches.
Methods
Search Strategy and Study Selection
Using PRISMA (Preferred Reporting Items for Systematic Reviews and Meta-Analyses) guidelines, we systematically reviewed the literature.10 Searches were completed in September 2014 using the PubMed Medline database and the Cochrane Central Register of Clinical Trials. Two reviewers (Dr. Louie, Dr. Levy) independently performed the search and assessed eligibility of all relevant studies based on predetermined inclusion criteria. Disagreements between reviewers were resolved by discussion. Key word selection was designed to capture all English-language studies with clinical and/or radiographic outcomes and level I to IV evidence. We used an electronic search algorithm with key words and a series of NOT phrases to match certain exclusion criteria:
(((((((((((((((((((((((((((((((((((((total[Text Word]) AND shoulder[Title]) AND arthroplasty[Title] AND (English[lang]))) NOT reverse[Title/Abstract]) NOT hemiarthroplasty[Title]) NOT nonoperative[Title]) NOT nonsurgical[Title] AND (English[lang]))) NOT rheumatoid[Title/Abstract]) NOT inflammatory[Title/Abstract]) NOT elbow[Title/Abstract]) NOT wrist[Title/Abstract]) NOT hip[Title/Abstract]) NOT knee[Title/Abstract]) NOT ankle[Title/Abstract] AND (English[lang]))) NOT biomechanic[Title/Abstract]) NOT biomechanics[Title/Abstract]) NOT biomechanical [Title/Abstract]) NOT cadaveric[Title/Abstract]) NOT revision[Title]) NOT resurfacing[Title/Abstract]) NOT surface[Title/Abstract]) NOT interphalangeal[Title/Abstract] AND (English[lang]))) NOT radiostereometric[Title/Abstract] AND (English[lang]))) NOT cmc[Title/Abstract]) NOT carpometacarpal[Title/Abstract]) NOT cervical[Title/Abstract]) NOT histology[Title/Abstract]) NOT histological[Title/Abstract]) NOT collagen[Title/Abstract] AND (English[lang]))) NOT kinematic[Title/Abstract]) NOT kinematics[Title/Abstract] AND (English[lang]))) NOT vitro[Title/Abstract] AND (English[lang]))) NOT inverted[Title/Abstract]) NOT grammont[Title/Abstract]) NOT arthrodesis[Title/Abstract]) NOT fusion[Title/Abstract]) NOT reverse[Title/Abstract] AND (English[lang]))
Study exclusion criteria consisted of cadaveric, biomechanical, histologic, and kinematic results as well as analyses of nonoperative management, hemiarthroplasty, or reverse TSA. Studies were excluded if they did not report clinical and/or radiographic data. Minimum mean follow-up was 2 years. To discount the effect of other TSA technical innovations, we evaluated the same period for the 2 surgical approaches. The first study with clinical outcomes after LTO was published in early 2005,6 so all studies published before 2005 were excluded.
We reviewed all references within the studies included by the initial search algorithm: randomized control trials, retrospective and prospective cohort designs, case series, and treatment studies. Technical notes, review papers, letters to the editor, and level V evidence reviews were excluded. To avoid counting patients twice, we compared each study’s authors and data collection period with those of the other studies. If there was overlap in authorship, period, and place, only the study with the longer follow-up or more comprehensive data was included. All trials comparing ST and LTO were included. If the authors of a TSA study did not describe the approach used, that study was excluded from our review.
Data Extraction
We collected details of study design, sample size, and patient demographics (sex, age, hand dominance, primary diagnosis). We also abstracted surgical factors about the glenoid component (cemented vs uncemented; pegged vs keeled; all-polyethylene vs metal-backed) and the humeral component (cemented vs press-fit; stemmed vs stemless). Clinical outcomes included pain scores, functional scores, number of revisions, range of motion (ROM), and subscapularis-specific tests (eg, belly-press, liftoff). As pain scales varied between studies, all values were converted to a 10-point scoring scale (0 = no pain; 10 = maximum pain) for comparisons. Numerous functional outcome scores were reported, but the Constant score was the only one consistently used across studies, making it a good choice for comparisons. One study used Penn Shoulder Scores (PSSs) and directly compared ST and LTO groups, so its data were included. In addition, radiographic data were compiled: radiolucencies around the humeral stem and glenoid component, humeral head subluxation/migration, and osteotomy healing. The only consistent radiographic parameter available for comparisons between groups was the presence of radiolucencies.
The Modified Coleman Methodology Score (MCMS), described by Cowan and colleagues,11 was used to evaluate the methodologic quality of each study. The MCMS is a 15-item instrument that has been used to assess both randomized and nonrandomized trials.12,13 It has a scaled score ranging from 0 to 100 (85-100, excellent; 70-84, good; 55-69, fair; <55, poor). Study quality was not factored into the data synthesis analysis.
Statistical Analysis
Data are reported as weighted means and standard deviations. A mean was calculated for each study reporting on a respective data point and was then weighed according to the study sample size. The result was that the nonweighted means from studies with smaller samples did not carry as much weight as those from studies with larger samples. Student t tests and 2-way analysis of variance were used to compare the ST and LTO groups and assess differences over time (SPSS Version 18; IBM). An α of 0.05 was set as statistically significant.
Results
Twenty studies (1420 shoulders, 1392 patients) were included in the final dataset (Figure).2,6,8,14-30
The youngest patients in the ST and LTO groups were 22 years and 19 years of age, respectively.
Table 2 lists the details regarding the surgical components. For glenoid components, the ST and LTO groups’ fixation types and material used were not significantly different.
Table 3 lists the clinical and radiographic outcomes most consistently reported in the literature. Physical examination data were reported in 18 ST populations8,14-16,21-30 and 11 LTO populations.2,6,14-20
Constant scores were reported in 4 ST studies14,22,24,27 and 3 LTO studies14,17,18 (Table 3). There was no significant difference (P = .37) in post-TSA Constant score improvement between the 2 groups. In the one study that performed direct comparisons, PSS improved on average from 29 to 81 in the ST group and from 29 to 92 in the LTO group.15 Several ST studies reported improved scores on various indices: WOOS (Western Ontario Osteoarthritis of the Shoulder), ASES (American Shoulder and Elbow Surgeons), SST (Simple Shoulder Test), DASH (Disabilities of the Arm, Shoulder, and Hand), SF-12 (Short Form 12-Item Health Survey), MACTAR (McMaster Toronto Arthritis Patient Preference Disability Questionnaire), and Neer shoulder impingement test.8,14,15,21,23-25,27-30 However, these outcomes were not reported in LTO cohorts for comparison. Similarly, 2 LTO cohorts reported improvements in SSV (subjective shoulder value) scores, but this measure was not used in the ST cohorts.6,17 Five ST studies recorded patients’ subjective satisfaction: 58% of patients indicated an excellent outcome, 35% a satisfactory outcome, and 7% a less than satisfactory outcome.21,23,25,26,29 Only 1 LTO study reported patient satisfaction: 69% excellent, 31% satisfactory, 0% dissatisfied.17
Complications were reported in 16 ST studies8,15,21-30 and 6 LTO studies.15,17-19 There were 117 complications (17.8%) and 58 revisions (10.0%) in the ST group and 52 complications (17.2%) and 49 revisions (16.2%) in the LTO group. In the ST group, aseptic loosening (6.2%) was the most common complication, followed by subscapularis tear or attenuation (5.2%), dislocation (2.1%), and deep infection (0.5%). In the LTO group, aseptic loosening was again the most common (9.0%), followed by dislocation (4.0%), subscapularis tear or attenuation (2.2%), and deep infection (0.7%). There were no significant differences in the incidence of individual complications between groups. The difference in revision rates was not statistically significant (P = .31).
Radiolucency data were reported in 12 ST studies19,21-26,28,30 and 2 LTO studies.17,18 There were no discussions of humeral component radiolucencies in the LTO studies. At final follow-up, radiolucencies of the glenoid component were detected in 42.3% of patients in the ST group and 40.7% of patients in the LTO group (P = .76).
Discussion
Our goal in this systematic review was to analyze outcomes associated with ST and LTO in a heterogenous TSA population. We hypothesized TSA with ST or LTO would produce similar clinical and radiographic outcomes. There were no significant differences in Constant scores, pain scores, radiolucencies, or complications between the 2 groups. The ST group showed trends toward wider ROM improvements and fewer revisions, but only the change in forward elevation was significant. The components used in the 2 groups were similar with the exception of a lack of keeled glenoids and cemented humeral stems in the LTO group; data stratification controlling for these differences revealed no change in outcomes.
The optimal method of subscapularis mobilization for TSA remains a source of debate. Jackson and colleagues23 found significant improvements in Neer and DASH scores after ST. However, 7 of 15 patients ruptured the subscapularis after 6 months and had significantly lower DASH scores. In 2005, Gerber and colleagues6 first described the LTO technique as an alternative to ST. After a mean of 39 months, 89% of their patients had a negative belly-press test, and 75% had a normal liftoff test. Radiographic evaluation revealed that the osteotomized fragment had healed in an anatomical position in all shoulders. In a large case series, Small and colleagues20 used radiographs and computed tomography to further investigate LTO healing rates and found that 89% of patients had bony union by 6 months and that smoking was a significant risk factor for nonunion.
Biomechanical studies comparing ST and LTO approaches have shown mixed results. Ponce and colleagues2 found decreased cyclic displacement and increased maximum load to failure with LTO, but Giuseffi and colleagues32 showed less cyclic displacement with ST and no difference in load to failure. Others authors have found no significant differences in stiffness or maximum load to failure.33 Van den Berghe and colleagues7 reported a higher failure rate in bone-to-bone repairs compared with tendon-to-tendon constructs. Moreover, they found that suture cut-out through bone tunnels is the primary mode of LTO failure, so many LTO surgeons now pass sutures around the humeral stem instead.
Three TSA studies directly compared ST and LTO approaches. Buckley and colleagues14 analyzed 60 TSAs and found no significant differences in WOOS, DASH, or Constant scores between groups. The authors described an ST subgroup with subscapularis attenuation on ultrasound but did not report the group as having any inferior functional outcome. Scalise and colleagues15 showed improved strength and PSSs in both groups after 2 years. However, the LTO group had a lower rate of subscapularis tears and significantly higher PSSs. Finally, Jandhyala and colleagues16 reported more favorable outcomes with LTO, which trended toward wider ROM and significantly higher belly-press test grades. Lapner and colleagues34 conducted a randomized, controlled trial (often referenced) and found no significant differences between the 2 groups in terms of strength or functional outcome at 2-year follow-up. Their study, however, included hemiarthroplasties and did not substratify the TSA population, so we did not include it in our review.
Our systematic review found significantly more forward elevation improvement for the ST group than the LTO group, which may suggest improved ROM with a soft-tissue approach than a bony approach. At the same time, the ST group trended toward better passive external rotation relative to the LTO group. This trend indicates fewer constraints to external rotation in the ST group, possibly attributable to a more attenuated subscapularis after tenotomy. Subscapularis tear or attenuation was more commonly reported in the ST group than in the LTO group, though not significantly so. This may indicate that more ST studies than LTO studies specially emphasized postoperative subscapularis function, but these data also highlight some authors’ concerns regarding subscapularis dysfunction after tenotomy.6,15,16The study populations’ complication rates were similar, just over 17%. The LTO group trended toward a higher revision rate, but it was not statistically significant. The LTO group also had significantly fewer patients with osteoarthritis and more patients with posttraumatic arthritis, so this group may have had more complex patients predisposed to a higher likelihood of revision surgery. Revisions were most commonly performed for aseptic loosening; theoretically, if osteotomies heal less effectively than tenotomies, the LTO approach could produce component instability and aseptic loosening. However, no prior studies or other clinical findings from this review suggest LTO predisposes to aseptic loosening. Overall, the uneven revision rates represent a clinical concern that should be monitored as larger samples of patients undergo ST and LTO procedures.
Glenoid radiolucencies were the only radiographic parameter consistently reported in the included studies. Twelve ST studies had radiolucency data—compared with only 2 LTO studies. Thus, our ability to compare radiographic outcomes was limited. Our data revealed similar rates of glenoid radiolucencies between the 2 approaches. The clinical relevance of radiolucencies is questioned by some authors, and, indeed, Razmjou and colleagues25 found no correlation of radiolucencies with patient satisfaction. Nevertheless, early presence of radiolucencies may raise concerns about progressive loss of fixation,35,36 so this should be monitored.
Limitations of this systematic review reflect the studies analyzed. We minimized selection bias by including level I to IV evidence, but most studies were level IV, and only 1 was level I. As such, there was a relative paucity of consistent clinical and radiographic data. For instance, although many ST studies reported patient satisfaction as an outcomes measure, only 1 LTO study commented on it. Perhaps the relative novelty of the LTO approach has prompted some authors to focus more on technical details and less on reporting a variety of outcome measures. As mentioned earlier, the significance of radiolucency data is controversial, and determination of their presence or absence depends on the observer. A radiolucency found in one study may not qualify as one in a study that uses different criteria. However, lucency data were the most frequently and reliably reported radiographic parameter, so we deemed it the most appropriate method for comparing radiographic outcomes. Finally, the baseline differences in diagnosis between the ST and LTO groups complicated comparisons. We stratified the groups by component design because use of keeled or pegged implants or humeral cemented or press-fit stems was usually a uniform feature of each study—enabling removal of certain studies for data stratification. However, we were unable to stratify by original diagnosis because these groups were not stratified within the individual studies.
Conclusion
Our systematic review found similar Constant scores, pain scores, radiographic outcomes, and complication rates for the ST and LTO approaches. Compared with the LTO approach, the ST approach produced significantly more forward elevation improvement and trended toward more external rotation and abduction and fewer revisions. Although not definitive, these data suggest the ST approach may provide more stability over the long term, but additional comprehensive studies are needed to increase the sample size and the power of the trends elucidated in this review. According to the orthopedic literature, both techniques produce excellent clinical outcomes, and technique selection should be based on surgeon discretion and expertise.
Am J Orthop. 2017;46(2):E131-E138. Copyright Frontline Medical Communications Inc. 2017. All rights reserved.
1. Keating JF, Waterworth P, Shaw-Dunn J, Crossan J. The relative strengths of the rotator cuff muscles. A cadaver study. J Bone Joint Surg Br. 1993;75(1):137-140.
2. Ponce BA, Ahluwalia RS, Mazzocca AD, Gobezie RG, Warner JJ, Millett PJ. Biomechanical and clinical evaluation of a novel lesser tuberosity repair technique in total shoulder arthroplasty. J Bone Joint Surg Am. 2005;87(suppl 2):1-8.
3. Miller SL, Hazrati Y, Klepps S, Chiang A, Flatow EL. Loss of subscapularis function after total shoulder replacement: a seldom recognized problem. J Shoulder Elbow Surg. 2003;12(1):29-34.
4. Gerber A, Ghalambor N, Warner JJ. Instability of shoulder arthroplasty: balancing mobility and stability. Orthop Clin North Am. 2001;32(4):661-670, ix.
5. Moeckel BH, Altchek DW, Warren RF, Wickiewicz TL, Dines DM. Instability of the shoulder after arthroplasty. J Bone Joint Surg Am. 1993;75(4):492-497.
6. Gerber C, Yian EH, Pfirrmann CA, Zumstein MA, Werner CM. Subscapularis muscle function and structure after total shoulder replacement with lesser tuberosity osteotomy and repair. J Bone Joint Surg Am. 2005;87(8):1739-1745.
7. Van den Berghe GR, Nguyen B, Patil S, et al. A biomechanical evaluation of three surgical techniques for subscapularis repair. J Shoulder Elbow Surg. 2008;17(1):156-161.
8. Caplan JL, Whitfield B, Neviaser RJ. Subscapularis function after primary tendon to tendon repair in patients after replacement arthroplasty of the shoulder. J Shoulder Elbow Surg. 2009;18(2):193-196.
9. Armstrong A, Lashgari C, Teefey S, Menendez J, Yamaguchi K, Galatz LM. Ultrasound evaluation and clinical correlation of subscapularis repair after total shoulder arthroplasty. J Shoulder Elbow Surg. 2006;15(5):541-548.
10. Moher D, Liberati A, Tetzlaff J, Altman DG; PRISMA Group. Preferred Reporting Items for Systematic Reviews and Meta-Analyses: the PRISMA statement. Int J Surg. 2010;8(5):336-341.
11. Cowan J, Lozano-Calderón S, Ring D. Quality of prospective controlled randomized trials. Analysis of trials of treatment for lateral epicondylitis as an example. J Bone Joint Surg Am. 2007;89(8):1693-1699.
12. Harris JD, Siston RA, Pan X, Flanigan DC. Autologous chondrocyte implantation: a systematic review. J Bone Joint Surg Am. 2010;92(12):2220-2233.
13. Harris JD, Siston RA, Brophy RH, Lattermann C, Carey JL, Flanigan DC. Failures, re-operations, and complications after autologous chondrocyte implantation—a systematic review. Osteoarthritis Cartilage. 2011;19(7):779-791.
14. Buckley T, Miller R, Nicandri G, Lewis R, Voloshin I. Analysis of subscapularis integrity and function after lesser tuberosity osteotomy versus subscapularis tenotomy in total shoulder arthroplasty using ultrasound and validated clinical outcome measures. J Shoulder Elbow Surg. 2014;23(9):1309-1317.
15. Scalise JJ, Ciccone J, Iannotti JP. Clinical, radiographic, and ultrasonographic comparison of subscapularis tenotomy and lesser tuberosity osteotomy for total shoulder arthroplasty. J Bone Joint Surg Am. 2010;92(7):1627-1634.
16. Jandhyala S, Unnithan A, Hughes S, Hong T. Subscapularis tenotomy versus lesser tuberosity osteotomy during total shoulder replacement: a comparison of patient outcomes. J Shoulder Elbow Surg. 2011;20(7):1102-1107.
17. Fucentese SF, Costouros JG, Kühnel SP, Gerber C. Total shoulder arthroplasty with an uncemented soft-metal-backed glenoid component. J Shoulder Elbow Surg. 2010;19(4):624-631.
18. Clement ND, Duckworth AD, Colling RC, Stirrat AN. An uncemented metal-backed glenoid component in total shoulder arthroplasty for osteoarthritis: factors affecting survival and outcome. J Orthop Sci. 2013;18(1):22-28.
19. Rosenberg N, Neumann L, Modi A, Mersich IJ, Wallace AW. Improvements in survival of the uncemented Nottingham Total Shoulder prosthesis: a prospective comparative study. BMC Musculoskelet Disord. 2007;8(1):76.
20. Small KM, Siegel EJ, Miller LR, Higgins LD. Imaging characteristics of lesser tuberosity osteotomy after total shoulder replacement: a study of 220 patients. J Shoulder Elbow Surg. 2014;23(9):1318-1326.
21. Mileti J, Sperling JW, Cofield RH, Harrington JR, Hoskin TL. Monoblock and modular total shoulder arthroplasty for osteoarthritis. J Bone Joint Surg Br. 2005;87(4):496-500.
22. Merolla G, Paladini P, Campi F, Porcellini G. Efficacy of anatomical prostheses in primary glenohumeral osteoarthritis. Chir Organi Mov. 2008;91(2):109-115.
23. Jackson JD, Cil A, Smith J, Steinmann SP. Integrity and function of the subscapularis after total shoulder arthroplasty. J Shoulder Elbow Surg. 2010;19(7):1085-1090.
24. Jost PW, Dines JS, Griffith MH, Angel M, Altchek DW, Dines DM. Total shoulder arthroplasty utilizing mini-stem humeral components: technique and short-term results. HSS J. 2011;7(3):213-217.
25. Razmjou H, Holtby R, Christakis M, Axelrod T, Richards R. Impact of prosthetic design on clinical and radiologic outcomes of total shoulder arthroplasty: a prospective study. J Shoulder Elbow Surg. 2013;22(2):206-214.
26. Raiss P, Schmitt M, Bruckner T, et al. Results of cemented total shoulder replacement with a minimum follow-up of ten years. J Bone Joint Surg Am. 2012;94(23):e1711-1710.
27. Litchfied RB, McKee MD, Balyk R, et al. Cemented versus uncemented fixation of humeral components in total shoulder arthroplasty for osteoarthritis of the shoulder: a prospective, randomized, double-blind clinical trial—a JOINTs Canada Project. J Shoulder Elbow Surg. 2011;20(4):529-536.
28. Martin SD, Zurakowski D, Thornhill TS. Uncemented glenoid component in total shoulder arthroplasty. Survivorship and outcomes. J Bone Joint Surg Am. 2005;87(6):1284-1292.
29. Taunton MJ, McIntosh AL, Sperling JW, Cofield RH. Total shoulder arthroplasty with a metal-backed, bone-ingrowth glenoid component. Medium to long-term results. J Bone Joint Surg Am. 2008;90(10):2180-2188.
30. Budge MD, Nolan EM, Heisey MH, Baker K, Wiater JM. Results of total shoulder arthroplasty with a monoblock porous tantalum glenoid component: a prospective minimum 2-year follow-up study. J Shoulder Elbow Surg. 2013;22(4):535-541.
31. Gerber C, Costouros JG, Sukthankar A, Fucentese SF. Static posterior humeral head subluxation and total shoulder arthroplasty. J Shoulder Elbow Surg. 2009;18(4):505-510.
32. Giuseffi SA, Wongtriratanachai P, Omae H, et al. Biomechanical comparison of lesser tuberosity osteotomy versus subscapularis tenotomy in total shoulder arthroplasty. J Shoulder Elbow Surg. 2012;21(8):1087-1095.
33. Van Thiel GS, Wang VM, Wang FC, et al. Biomechanical similarities among subscapularis repairs after shoulder arthroplasty. J Shoulder Elbow Surg. 2010;19(5):657-663.
34. Lapner PL, Sabri E, Rakhra K, Bell K, Athwal GS. Comparison of lesser tuberosity osteotomy to subscapularis peel in shoulder arthroplasty: a randomized controlled trial. J Bone Joint Surg Am. 2012;94(24):2239-2246.
35. Cofield RH. Total shoulder arthroplasty with the Neer prosthesis. J Bone Joint Surg Am. 1984;66(6):899-906.
36. Torchia ME, Cofield RH, Settergren CR. Total shoulder arthroplasty with the Neer prosthesis: long-term results. J Shoulder Elbow Surg. 1997;6(6):495-505.
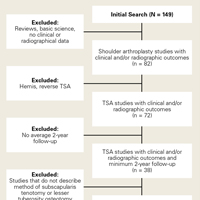
2017 Update on abnormal uterine bleeding
Two issues of emerging importance are being addressed in the literature: caring for patients with obesity and the concept of delivering value-based care. Value-based care does not mean providing the cheapest care; “value” places importance on quality as well as cost. In this Update, we present 3 practices that the evidence says will deliver value:
- endometrial biopsy in all obese women. Although performing more endometrial biopsies in younger women with a body mass index (BMI) in the obese range will not be less expensive initially, the procedure’s value likely will be in early diagnosis, which hopefully will translate to eventual health care system savings.
- use of the levonorgestrel-releasing intrauterine device (LNG-IUD) in obese patients experiencing abnormal uterine bleeding (AUB). This practice appears to add value in the context of AUB.
- performance of routine diagnostic hysteroscopy in the office setting. We should reconsider our current habits and traditions of performing routine diagnostic hysteroscopy in the operating room (OR) as we move toward providing value-based care.
Read about obesity as a risk factor for endometrial hyperplasia
Endometrial sampling and obesity: Forget the "age 45" rule
Wise MR, Gill P, Lensen S, Thompson JM, Farquhar CM. Body mass index trumps age in decision for endometrial biopsy: cohort study of symptomatic premenopausal women. Am J Obstet Gynecol. 2016;215(5):598.e1-e8.
How do we bring more value to our patients with AUB? We are well aware that heavy menstrual bleeding places a burden on many women; AUB affects 30% of those of reproductive age. The condition often results in lost workdays and diminished quality of life. It also is associated with significant cost expenditures for hygiene products. It is important not only to bring value to women with heavy menstrual bleeding but also to consider our increasingly expensive health care system.
Obesity is a significant problem that likely will increase the number of women presenting with AUB to ObGyns. Recent studies from New Zealand--which has 33% of its population classified as obese--have provided valuable information.1

Obesity is a risk factor for endometrial hyperplasia
In a large retrospective cohort study, Wise and colleagues analyzed data from 916 premenopausal women referred for AUB who had an endometrial biopsy from 2008 to 2014. The setting was a single large urban secondary women's health service in New Zealand. This study challenges the concept of age-related biopsy guidelines.
Of the 916 women, half were obese. Almost 5% of the women had complex endometrial hyperplasia with atypia or cancer. This incidence had risen from 3% in the years 1995 to 1997, likely due to the rising incidence of obesity. Women with a BMI ≥30 kg/m2 were 4 times more likely to develop complex hyperplasia or cancer than normal-weight women.
Other factors associated with an increased risk for complex hyperplasia or cancer were nulliparity (odds ratio [OR], 2.51; 95% confidence interval [CI], 1.25-5.05), anemia (OR, 2.38; 95% CI, 1.25-4.56), and a thickened endometrium on ultrasonography (defined as >12 mm; OR, 4.04; 95% CI, 1.69-9.65). Age was not a significant risk factor in this group.
Read about using LNG-IUD to treat AUB in obese women
Small study shows LNG-IUD is effective for treating heavy menstrual bleeding in obese patients
Shaw V, Vandal AC, Coomarasamy C, Ekeroma AJ. The effectiveness of the levonorgestrel intrauterine system in obese women with heavy menstrual bleeding. Aust N Z J Obstet Gynaecol. 2016;56(6):619-623.
In another recent study from New Zealand, researchers set out to assess the efficacy of the LNG-IUD for the treatment of heavy menstrual bleeding in obese women. This study is important because there are very few studies of the LNG-IUD in the obese population, and none that have studied quality-of-life measures.
Shaw and colleagues conducted the prospective observational study at a tertiary teaching hospital. Twenty obese (BMI >30 kg/m2) women with heavy menstrual bleeding agreed to treatment with an LNG-IUD, and 14 completed the study (2 had a device expulsion, 1 had a device removed for pain, and 1 had a device removed for infection; 2 were lost to follow-up). The women were aged 27 to 52 years (median, 40.5 years), and their BMI ranged from 30 to 68 kg/m2 (median, 40.6 kg/m2). At recruitment, 6 months, and 12 months, participants completed the Menstrual Impact Questionnaire and the Pictorial Bleeding Assessment Chart--2 validated tools.

Compared with baseline Pictorial Bleeding Assessment scores, the authors found the LNG-IUD to be effective in 73.2% (95% CI, 55.3%-83.9%) of women at 6 months and in 92.8% (95% CI, 80.0%-97.4%) of women at 12 months. Taking into consideration device failures, including removed and expelled LNG-IUDs (which occurred in 4 women, or 20%, in the intent-to-treat analysis), the actual efficacy rate was 67%. Similarly, there was significant improvement at 6 and 12 months in Menstrual Impact Questionnaire scores for social activities, work performance, tiredness, productivity, hygiene, and depression.
Read about doing more diagnostic hysteroscopy in the office
Is it time to abandon diagnostic hysteroscopy in the OR?
Leung S, Leyland N, Murji A. Decreasing diagnostic hysteroscopy performed in the operating room: a quality improvement initiative. J Obstet Gynaecol Can. 2016;38(4):351-356.
Diagnostic hysteroscopy: Are we stuck in the 1990s? Why are we still performing so many diagnostic hysteroscopies in the OR, thus subjecting our patients to general anesthesia and using our precious OR time? That is the question asked by a group of researchers in Canada.
According to data from the Ontario Ministry of Health and Long Term Care, diagnostic hysteroscopy was performed 10,027 times in the 2013-2014 fiscal year. Ontario researchers designed and implemented a quality improvement initiative at their institution and successfully decreased the number of diagnostic hysteroscopies performed in their hospital by 70% from their baseline 12-month period. The improvements resulted in a savings of 78 hours of case costing, or $126,984. When these data are extrapolated to the Ontario population (in which more than 10,000 diagnostic hysteroscopies were performed), potentially 7,000 women could avoid the risk of general anesthesia and the health care system could save $11 million.
Re-education protocol was key to reducing OR procedures
How did the researchers accomplish their results? The multifaceted intervention had 3 key components:
Staff education and review. Many surgeons were performing diagnostic hysteroscopy in the OR because that is how they were trained, and they were unaware of less invasive options. An awareness campaign was conducted by e-mail, during staff meetings, and at rounds.
Accessible sonohysterography. This diagnostic modality was made more accessible to referring physicians in a timely manner.
Initiation of an operative hysteroscopy education program. To allow more surgeons greater comfort with office hysteroscopy, the authors instituted didactic sessions, dry and wet lab simulations, and mentorship.
Share your thoughts! Send your Letter to the Editor to [email protected]. Please include your name and the city and state in which you practice.
- The Organization for Economic Co-operation and Development (OECD). OECD obesity update 2014. http://www.oecd.org/health/Obesity-Update-2014.pdf. Published June 2014. Accessed March 10, 2017.

Dr. Sharp is Professor and Vice Chair for Clinical Activities, Department of Obstetrics and Gynecology, University of Utah Health Sciences Center, Salt Lake City.

Dr. Adelman is Assistant Professor, Department of Obstetrics and Gynecology, University of Utah Health Sciences Center.
The authors report no financial relationships relevant to this article.
Dr. Sharp is Professor and Vice Chair for Clinical Activities, Department of Obstetrics and Gynecology, University of Utah Health Sciences Center, Salt Lake City.
Dr. Adelman is Assistant Professor, Department of Obstetrics and Gynecology, University of Utah Health Sciences Center.
The authors report no financial relationships relevant to this article.
Two issues of emerging importance are being addressed in the literature: caring for patients with obesity and the concept of delivering value-based care. Value-based care does not mean providing the cheapest care; “value” places importance on quality as well as cost. In this Update, we present 3 practices that the evidence says will deliver value:
- endometrial biopsy in all obese women. Although performing more endometrial biopsies in younger women with a body mass index (BMI) in the obese range will not be less expensive initially, the procedure’s value likely will be in early diagnosis, which hopefully will translate to eventual health care system savings.
- use of the levonorgestrel-releasing intrauterine device (LNG-IUD) in obese patients experiencing abnormal uterine bleeding (AUB). This practice appears to add value in the context of AUB.
- performance of routine diagnostic hysteroscopy in the office setting. We should reconsider our current habits and traditions of performing routine diagnostic hysteroscopy in the operating room (OR) as we move toward providing value-based care.
Read about obesity as a risk factor for endometrial hyperplasia
Endometrial sampling and obesity: Forget the "age 45" rule
Wise MR, Gill P, Lensen S, Thompson JM, Farquhar CM. Body mass index trumps age in decision for endometrial biopsy: cohort study of symptomatic premenopausal women. Am J Obstet Gynecol. 2016;215(5):598.e1-e8.
How do we bring more value to our patients with AUB? We are well aware that heavy menstrual bleeding places a burden on many women; AUB affects 30% of those of reproductive age. The condition often results in lost workdays and diminished quality of life. It also is associated with significant cost expenditures for hygiene products. It is important not only to bring value to women with heavy menstrual bleeding but also to consider our increasingly expensive health care system.
Obesity is a significant problem that likely will increase the number of women presenting with AUB to ObGyns. Recent studies from New Zealand--which has 33% of its population classified as obese--have provided valuable information.1
Obesity is a risk factor for endometrial hyperplasia
In a large retrospective cohort study, Wise and colleagues analyzed data from 916 premenopausal women referred for AUB who had an endometrial biopsy from 2008 to 2014. The setting was a single large urban secondary women's health service in New Zealand. This study challenges the concept of age-related biopsy guidelines.
Of the 916 women, half were obese. Almost 5% of the women had complex endometrial hyperplasia with atypia or cancer. This incidence had risen from 3% in the years 1995 to 1997, likely due to the rising incidence of obesity. Women with a BMI ≥30 kg/m2 were 4 times more likely to develop complex hyperplasia or cancer than normal-weight women.
Other factors associated with an increased risk for complex hyperplasia or cancer were nulliparity (odds ratio [OR], 2.51; 95% confidence interval [CI], 1.25-5.05), anemia (OR, 2.38; 95% CI, 1.25-4.56), and a thickened endometrium on ultrasonography (defined as >12 mm; OR, 4.04; 95% CI, 1.69-9.65). Age was not a significant risk factor in this group.
Read about using LNG-IUD to treat AUB in obese women
Small study shows LNG-IUD is effective for treating heavy menstrual bleeding in obese patients
Shaw V, Vandal AC, Coomarasamy C, Ekeroma AJ. The effectiveness of the levonorgestrel intrauterine system in obese women with heavy menstrual bleeding. Aust N Z J Obstet Gynaecol. 2016;56(6):619-623.
In another recent study from New Zealand, researchers set out to assess the efficacy of the LNG-IUD for the treatment of heavy menstrual bleeding in obese women. This study is important because there are very few studies of the LNG-IUD in the obese population, and none that have studied quality-of-life measures.
Shaw and colleagues conducted the prospective observational study at a tertiary teaching hospital. Twenty obese (BMI >30 kg/m2) women with heavy menstrual bleeding agreed to treatment with an LNG-IUD, and 14 completed the study (2 had a device expulsion, 1 had a device removed for pain, and 1 had a device removed for infection; 2 were lost to follow-up). The women were aged 27 to 52 years (median, 40.5 years), and their BMI ranged from 30 to 68 kg/m2 (median, 40.6 kg/m2). At recruitment, 6 months, and 12 months, participants completed the Menstrual Impact Questionnaire and the Pictorial Bleeding Assessment Chart--2 validated tools.
Compared with baseline Pictorial Bleeding Assessment scores, the authors found the LNG-IUD to be effective in 73.2% (95% CI, 55.3%-83.9%) of women at 6 months and in 92.8% (95% CI, 80.0%-97.4%) of women at 12 months. Taking into consideration device failures, including removed and expelled LNG-IUDs (which occurred in 4 women, or 20%, in the intent-to-treat analysis), the actual efficacy rate was 67%. Similarly, there was significant improvement at 6 and 12 months in Menstrual Impact Questionnaire scores for social activities, work performance, tiredness, productivity, hygiene, and depression.
Read about doing more diagnostic hysteroscopy in the office
Is it time to abandon diagnostic hysteroscopy in the OR?
Leung S, Leyland N, Murji A. Decreasing diagnostic hysteroscopy performed in the operating room: a quality improvement initiative. J Obstet Gynaecol Can. 2016;38(4):351-356.
Diagnostic hysteroscopy: Are we stuck in the 1990s? Why are we still performing so many diagnostic hysteroscopies in the OR, thus subjecting our patients to general anesthesia and using our precious OR time? That is the question asked by a group of researchers in Canada.
According to data from the Ontario Ministry of Health and Long Term Care, diagnostic hysteroscopy was performed 10,027 times in the 2013-2014 fiscal year. Ontario researchers designed and implemented a quality improvement initiative at their institution and successfully decreased the number of diagnostic hysteroscopies performed in their hospital by 70% from their baseline 12-month period. The improvements resulted in a savings of 78 hours of case costing, or $126,984. When these data are extrapolated to the Ontario population (in which more than 10,000 diagnostic hysteroscopies were performed), potentially 7,000 women could avoid the risk of general anesthesia and the health care system could save $11 million.
Re-education protocol was key to reducing OR procedures
How did the researchers accomplish their results? The multifaceted intervention had 3 key components:
Staff education and review. Many surgeons were performing diagnostic hysteroscopy in the OR because that is how they were trained, and they were unaware of less invasive options. An awareness campaign was conducted by e-mail, during staff meetings, and at rounds.
Accessible sonohysterography. This diagnostic modality was made more accessible to referring physicians in a timely manner.
Initiation of an operative hysteroscopy education program. To allow more surgeons greater comfort with office hysteroscopy, the authors instituted didactic sessions, dry and wet lab simulations, and mentorship.
Share your thoughts! Send your Letter to the Editor to [email protected]. Please include your name and the city and state in which you practice.
- The Organization for Economic Co-operation and Development (OECD). OECD obesity update 2014. http://www.oecd.org/health/Obesity-Update-2014.pdf. Published June 2014. Accessed March 10, 2017.
- The Organization for Economic Co-operation and Development (OECD). OECD obesity update 2014. http://www.oecd.org/health/Obesity-Update-2014.pdf. Published June 2014. Accessed March 10, 2017.

The Impact of Obesity on Simvastatin for Lowering LDL-C Among Veterans
More than one-third of Americans and > 20% of veterans have obesity with a body mass index (BMI) ≥ 30 kg/m2.1,2 It is well documented that patients with obesity have altered lipid metabolism, drug distribution, and drug clearance.3-5 As many as 8.2 million Americans may receive statin (3-hydroxymethylglutaryl coenzyme A reductase inhibitors) prescriptions if the American College of Cardiology/American Heart Association 2013 Cholesterol Guidelines are followed; therefore, it is important to examine how the efficacy of these drugs is altered in patients with obesity.6
Multiple studies have examined the benefits of statin therapy through lowering low-density lipoprotein cholesterol (LDL-C); however, few have examined the impact of obesity on statin efficacy. For example, only 18% of subjects in the Long-Term Intervention with Pravastatin in Ischaemic Disease (LIPID) trial were classified as having obesity, and subjects in the Scandinavian Simvastatin Survival Study (4S) trial had a mean BMI of only 26 kg/m2.7,8 Though statins decreased mortality in both of these studies, it is unknown whether the lipid-lowering effects were the same for participants with and without obesity. The Primary prevention of cardiovascular disease with atorvastatin in type 2 diabetes in the Collaborative Atorvastatin Diabetes Study (CARDS) demonstrated a decrease in major cardiovascular events and all-cause mortality with atorvastatin 10 mg daily therapy in a sample where more than one-third of subjects had obesity.9 However, the mean baseline BMI of subjects in both study groups was only 28 kg/m2, and outcomes for those with and without obesity were not compared.9
Studies that have examined statin efficacy in those with and without obesity include the Heart Protection Study (HPS), a post hoc analysis of the West of Scotland Coronary Prevention Study (WOSCOPS), and a meta-analysis by Blassetto and colleagues. The HPS examined the event rate of vascular events with simvastatin 40 mg daily in patients with diabetes mellitus (DM).10 Though these subgroups were compared in HPS, no statistical difference was demonstrated between these groups for the rate of vascular events among those with and without DM.10 However, the obesity subgroup’s event rate ratios were consistently higher than were those for the nonobese group.10
A post hoc analysis of WOSCOPS examined obesity as a factor for change in LDL-C with pravastatin 40 mg therapy.11 Though the authors found that no significant difference was present between those with and those without obesity, the data supporting this claim were not disclosed, which makes drawing clinical conclusions from this analysis difficult.11 A meta-analysis by Blassetto and colleagues examined the association between rosuvastatin’s efficacy in lowering LDL-C among the subgroups of hypertension, atherosclerosis, type 2 DM, and obesity.12 Though these subgroups were not compared statistically, the obesity subgroup had the lowest mean percent change in lowering LDL-C. Moreover, patients without obesity were not examined as a subgroup.12
With the expected increase in statin therapy and a significant portion of the U.S. population having obesity, it is necessary to determine if obesity alters the efficacy of statins. This study was conducted to determine the effect of obesity on the percent change in LDL-C with statin therapy within a veteran population.
Methods
This study was a retrospective review examining follow-up data from January 1, 2009 to July 1, 2014 from the VA Midsouth Healthcare Network. This network services more than 350,000 patients each year in Tennessee, Kentucky, and West Virgin
Patients were excluded if they had received treatment for hyperlipidemia (niacin, colestyramine, colestipol, colesevelam, other statins, gemfibrozil, fenofibrate, omega-3 ethyl esters, ezetimibe) during the 6 weeks prior to the initial fill date of the statin prescription. Patients whose simvastatin therapy did not span the follow-up period from the time of filling to the follow-up lipid panel were excluded, as were those who had not filled a simvastatin prescription within 30 days of their baseline lipid panel. Also excluded were patients who were newly established at the VA, pregnant, or receiving concomitant antihyperlipidemia agents, dialysis, or interacting medications (tacrolimus, cyclosporine, atazanavir, darunavir, nelfinavir, saquinavir, ritonavir, indinavir, lopinavir, tipranavir, fosamprenavir, fluconazole, voriconazole, itraconazole, voriconazole, posaconazole, amiodarone, or colchicine). Patients with a BMI < 18 kg/m2, hepatic failure as measured by an aspartate transaminase/alanine transaminase (AST/ALT) ratio > 3 times the upper limit of normal, hepatitis, a history of alcoholism, any change in statin dose prior to follow-up cholesterol values, or no follow-up LDL-C values also were excluded.
The baseline data collected included age, sex, weight, height, BMI, hemoglobin A1c, LDL-C, ALT/AST, and serum creatinine (SCr). All other laboratory results were required to be within 270 days of the time the lipid panel was obtained. The index date was set as the date the initial prescription was filled between February 1, 2009 and April 1, 2014. Follow-up levels for LDL-C were obtained 40 to 95 days after the index date. Direct LDL-C values were preferred unless only calculated values were available. Calculated LDL-C values were determined by using the Friedewald equation. An audit of 150 patient charts was conducted to ensure the integrity of data pulled from the database.
The percent changes in LDL-C were calculated for those with and without obesity for both simvastatin 20 mg daily and simvastatin 40 mg daily. The primary outcome was the percent change in LDL-C from baseline. All laboratory values were compared using independent 2-tailed t tests with α set to .05. To have an 80% chance of detecting a 5% difference in percent change in LDL-C between the experimental and control groups, 129 patients were required. To determine whether an association was present, a correlation between BMI and percent change in LDL-C was conducted. All statistics were conducted using SAS software (Cary, North Carolina).
Results
From January 2009 through July 2014, 35,216 patients were initially screened. The majority of patients did not have a baseline LDL-C value and were excluded. A total of 1,183 patients with simvastatin 20 mg daily (BMI < 30 = 661; BMI ≥ 30 = 1,122) and 478 patients with simvastatin 40 mg daily (BMI < 30 = 259; BMI ≥ 30 = 219) met the inclusion criteria.
Baseline characteristics were similar between groups except for a slightly higher age in both groups without obesity (Table). Hepatic and renal serum markers indicated a baseline of adequate organ function for drug clearance for all groups. The mean baseline BMI of those without obesity was about 26 kg/m2, which is considered overweight. Baseline LDL-C values were clinically similar for those with and without obesity, though statistically different (145 mg/dL for the nonobese group and 141 mg/dL for the obese group, P < .05). The percent change in LDL-C was not statistically significant for those with and without obesity for simvastatin 20 mg daily (P = .293) or simvastatin 40 mg daily (P = .2773) (Figure). No correlation was found between the continuous percent change in LDL-C and continuous BMI for either simvastatin dosage (r2 = 0.0016 and 0.0028, respectively).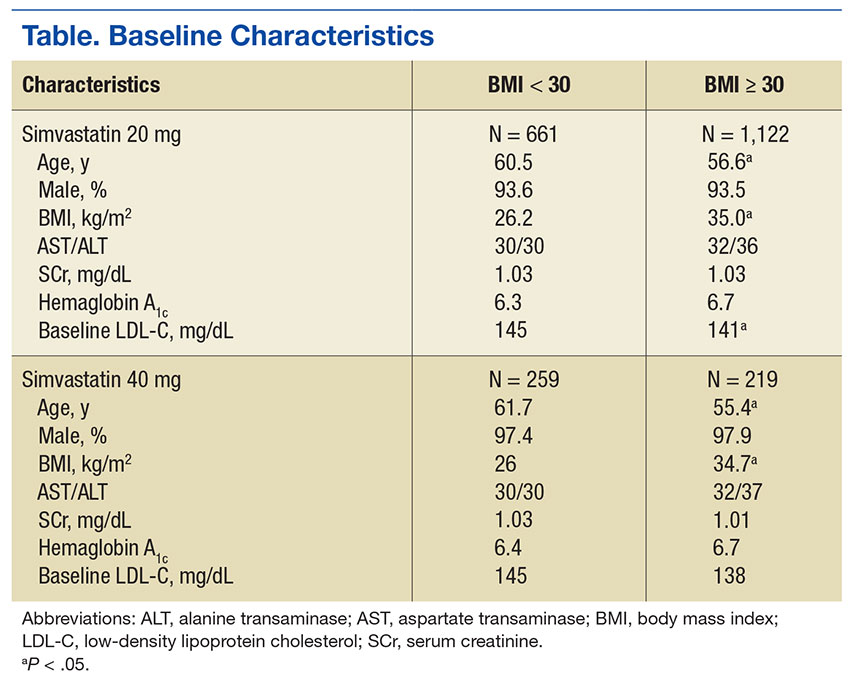
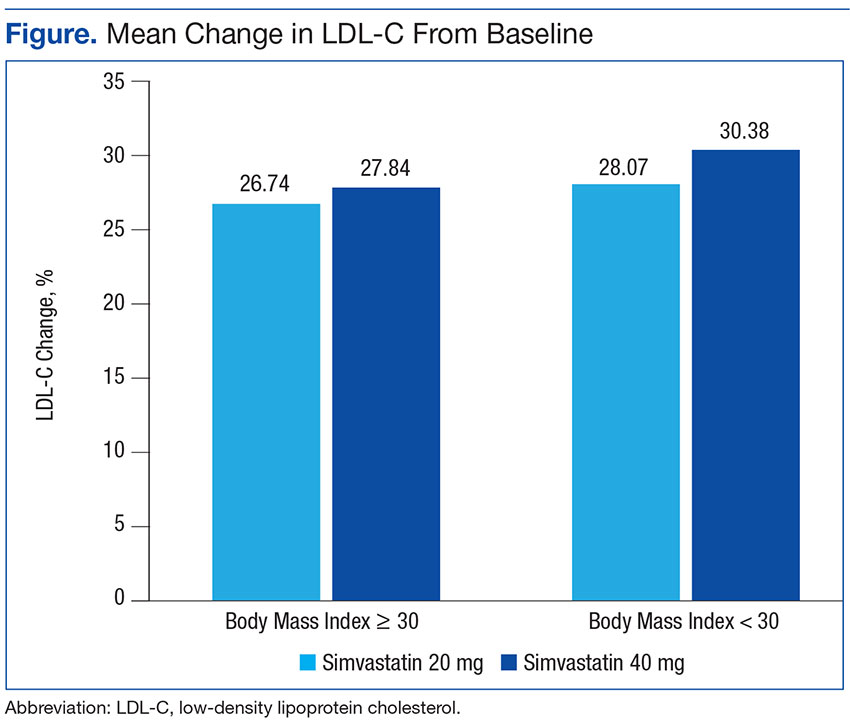
Discussion
In this retrospective chart review, it was determined that obesity did not affect the percent change in LDL-C from baseline with statin therapy. The HPS found similar results as a secondary endpoint, although that study was underpowered.10 In this study, all groups met power, and there was still no difference between those with and without obesity.
Nicholls and colleagues examined REVERSAL study data to determine whether BMI greater than the median BMI impacted inflammatory markers or lipid levels with atorvastatin 80 mg daily or pravastatin 40 mg daily. The REVERSAL study authors found no difference in percent change LDL-C between those above the median BMI compared with those below the median BMI for patients on pravastatin therapy. However, the authors did find a difference in percent change LDL-C with atorvastatin therapy.13 No difference in percent change LDL-C was present with simvastatin therapy in this study. As simvastatin is more lipophilic than is atorvastatin, lipophilicity remains an area for further study for statin therapy in patients with obesity.
The surrogate marker of percent change in LDL-C was used for the primary outcome in this study. The ACC/AHA 2013 guidelines and the National Lipid Association 2014 guidelines recommend an alternative goal of 30% to 50% change in LDL-C from baseline.14,15 Using this clinically relevant marker compensated for differences in baseline LDL-C and limited the effect of these differences on the primary outcome of this study.
Limitations
This study did not include patients who were underweight (BMI < 18 kg/m2), as these patients have previously demonstrated decreased outcomes with statin therapy.16 However, this limits these data to only those patients that have a BMI of at least 18 kg/m2. Limitations of this study also included the inability to consider adherence and lifestyle changes. These limitations were unavoidable due to the nature of a retrospective chart review.
Conclusion
The prevalence of obesity is increasing, and it is a disease that alters pharmacokinetics and lipid metabolism. Though this study did not find a difference between the LDL-C-lowering efficacy of simvastatin in those with and without obesity, continued study of the effect of obesity on the efficacy of medications is vital.
Acknowledgments
This material is the result of work supported with resources and the use of facilities at the James H. Qullen VAMC in Mountain Home, Tennessee.
1. Ogden CL, Carroll MD, Kit BK, Flegal KM. Prevalence of childhood and adult obesity in the United States, 2011-2012. JAMA. 2014;311(8):806-814.
2. Shen Y, Sambamoorthi U, Rajan M, Miller D, Banerjea R, Pogach L. Obesity and expenditures among elderly Veterans Health Administration users with diabetes. Popul Health Manag. 2009;12(5):255-264.
3. Chan DC, Watts GF, Wang J, Hegele RA, van Bockxmeer FM, Barrett PH. Variation in Niemann-Pick C1-like 1 gene as a determinant of apolipoprotein B-100 kinetics and response to statin therapy in centrally obese men. Clin Endocrinol (Oxf). 2008;69(1):45-51.
4. Cheymol G. Effects of obesity on pharmacokinetics implications for drug therapy. Clin Pharmacokinet. 2000;39(3):215-231.
5. Hanley MJ, Abernethy DR, Greenblatt DJ. Effect of obesity on the pharmacokinetics of drugs in humans. Clin Pharmacokinet. 2010;49(2):71-87
6. Pencina MJ, Navar-Boggan AM, D’Agostino RB Sr, et al. Application of new cholesterol guidelines to a population-based sample. N Engl J Med. 2014;370(15):1422-1431.
7. Prevention of cardiovascular events and death with pravastatin in patients with coronary heart disease and a broad range of initial cholesterol levels. The Long-Term Intervention with Pravastatin in Ischaemic Disease (LIPID) Study Group. N Engl J Med. 1998;339(19):1349-1357.
8. Pedersen TR, Kjekshus J, Berg K, et al; Scandinavian Simvastatin Survival Study Group. Randomised trial of cholesterol lowering in 4444 patients with coronary heart disease: the Scandinavian Simvastatin Survival Study (4S). 1994. Atheroscler Suppl. 2004;5(3):81-87.
9. Colhoun HM, Betteridge DJ, Durrington PN, et al; CARDS investigators. Primary prevention of cardiovascular disease with atorvastatin in type 2 diabetes in the Collaborative Atorvastatin Diabetes Study (CARDS): multicentre randomised placebo-controlled trial. Lancet. 2004;364(9435):685-696.
10. Collins R, Armitage J, Parish S, Sleigh P, Peto R; Heart Protection Study Collaborative Group. MRC/BHF Heart Protection Study of cholesterol-lowering with simvastatin in 5963 people with diabetes: a randomised placebo-controlled trial. Lancet. 2003;361(9374):2005-2016.
11. Streja L, Packard CJ, Shepherd J, Cobbe S, Ford I; WOSCOPS Group. Factors affecting low-density lipoprotein and high-density lipoprotein cholesterol response to pravastatin in the West Of Scotland Coronary Prevention Study (WOSCOPS). Am J Cardiol. 2002;90(7):731-736.
12. Blasetto JW, Stein EA, Brown WV, Chitra R, Raza A. Efficacy of rosuvastatin compared with other statins at selected starting doses in hypercholesterolemic patients and in special population groups. Am J Cardiol. 2003;91(5A):3C-10C; discussion 10C.
13. Nicholls SJ. Tuzcu EM, Sipahi I, et al. Effect of obesity on lipid-lowering, anti-inflammatory, and antiatherosclerotic benefits of atorvastatin or pravastatin in patients with coronary artery disease (from the REVERSAL Study). Am J Cardiol. 2006;97(11):1553-1557.
14. Stone NJ, Robinson JG, Lichtenstein AH, et al; American College of Cardiology/American Heart Association Task Force on Practice Guidelines. 2013 ACC/AHA Guideline on the treatment of blood cholesterol to reduce atherosclerotic cardiovascular risk on adults: a report of the American College of Cardiology/American Heart Association Task Force on Practice Guidelines. J Am Coll Cardiol. 2014;63(25, pt B):2889-2934.
15. Jacobson T, Ito M, Maki K, et al. National Lipid Association recommendation for patient-centered management of dyslipidemia: part 1-full report. J Clin Lipidol. 2015;9(2):129-169.
16. Nylén ES, Faselis C, Kheirbek R, Myers J, Panagiotakos D, Kokkinos P. Statins modulate the mortality risk associated with obesity and cardiorespiratory fitness in diabetics. J Clin Endocrinol Metab. 2013;98(8):33940-3401.
More than one-third of Americans and > 20% of veterans have obesity with a body mass index (BMI) ≥ 30 kg/m2.1,2 It is well documented that patients with obesity have altered lipid metabolism, drug distribution, and drug clearance.3-5 As many as 8.2 million Americans may receive statin (3-hydroxymethylglutaryl coenzyme A reductase inhibitors) prescriptions if the American College of Cardiology/American Heart Association 2013 Cholesterol Guidelines are followed; therefore, it is important to examine how the efficacy of these drugs is altered in patients with obesity.6
Multiple studies have examined the benefits of statin therapy through lowering low-density lipoprotein cholesterol (LDL-C); however, few have examined the impact of obesity on statin efficacy. For example, only 18% of subjects in the Long-Term Intervention with Pravastatin in Ischaemic Disease (LIPID) trial were classified as having obesity, and subjects in the Scandinavian Simvastatin Survival Study (4S) trial had a mean BMI of only 26 kg/m2.7,8 Though statins decreased mortality in both of these studies, it is unknown whether the lipid-lowering effects were the same for participants with and without obesity. The Primary prevention of cardiovascular disease with atorvastatin in type 2 diabetes in the Collaborative Atorvastatin Diabetes Study (CARDS) demonstrated a decrease in major cardiovascular events and all-cause mortality with atorvastatin 10 mg daily therapy in a sample where more than one-third of subjects had obesity.9 However, the mean baseline BMI of subjects in both study groups was only 28 kg/m2, and outcomes for those with and without obesity were not compared.9
Studies that have examined statin efficacy in those with and without obesity include the Heart Protection Study (HPS), a post hoc analysis of the West of Scotland Coronary Prevention Study (WOSCOPS), and a meta-analysis by Blassetto and colleagues. The HPS examined the event rate of vascular events with simvastatin 40 mg daily in patients with diabetes mellitus (DM).10 Though these subgroups were compared in HPS, no statistical difference was demonstrated between these groups for the rate of vascular events among those with and without DM.10 However, the obesity subgroup’s event rate ratios were consistently higher than were those for the nonobese group.10
A post hoc analysis of WOSCOPS examined obesity as a factor for change in LDL-C with pravastatin 40 mg therapy.11 Though the authors found that no significant difference was present between those with and those without obesity, the data supporting this claim were not disclosed, which makes drawing clinical conclusions from this analysis difficult.11 A meta-analysis by Blassetto and colleagues examined the association between rosuvastatin’s efficacy in lowering LDL-C among the subgroups of hypertension, atherosclerosis, type 2 DM, and obesity.12 Though these subgroups were not compared statistically, the obesity subgroup had the lowest mean percent change in lowering LDL-C. Moreover, patients without obesity were not examined as a subgroup.12
With the expected increase in statin therapy and a significant portion of the U.S. population having obesity, it is necessary to determine if obesity alters the efficacy of statins. This study was conducted to determine the effect of obesity on the percent change in LDL-C with statin therapy within a veteran population.
Methods
This study was a retrospective review examining follow-up data from January 1, 2009 to July 1, 2014 from the VA Midsouth Healthcare Network. This network services more than 350,000 patients each year in Tennessee, Kentucky, and West Virgin
Patients were excluded if they had received treatment for hyperlipidemia (niacin, colestyramine, colestipol, colesevelam, other statins, gemfibrozil, fenofibrate, omega-3 ethyl esters, ezetimibe) during the 6 weeks prior to the initial fill date of the statin prescription. Patients whose simvastatin therapy did not span the follow-up period from the time of filling to the follow-up lipid panel were excluded, as were those who had not filled a simvastatin prescription within 30 days of their baseline lipid panel. Also excluded were patients who were newly established at the VA, pregnant, or receiving concomitant antihyperlipidemia agents, dialysis, or interacting medications (tacrolimus, cyclosporine, atazanavir, darunavir, nelfinavir, saquinavir, ritonavir, indinavir, lopinavir, tipranavir, fosamprenavir, fluconazole, voriconazole, itraconazole, voriconazole, posaconazole, amiodarone, or colchicine). Patients with a BMI < 18 kg/m2, hepatic failure as measured by an aspartate transaminase/alanine transaminase (AST/ALT) ratio > 3 times the upper limit of normal, hepatitis, a history of alcoholism, any change in statin dose prior to follow-up cholesterol values, or no follow-up LDL-C values also were excluded.
The baseline data collected included age, sex, weight, height, BMI, hemoglobin A1c, LDL-C, ALT/AST, and serum creatinine (SCr). All other laboratory results were required to be within 270 days of the time the lipid panel was obtained. The index date was set as the date the initial prescription was filled between February 1, 2009 and April 1, 2014. Follow-up levels for LDL-C were obtained 40 to 95 days after the index date. Direct LDL-C values were preferred unless only calculated values were available. Calculated LDL-C values were determined by using the Friedewald equation. An audit of 150 patient charts was conducted to ensure the integrity of data pulled from the database.
The percent changes in LDL-C were calculated for those with and without obesity for both simvastatin 20 mg daily and simvastatin 40 mg daily. The primary outcome was the percent change in LDL-C from baseline. All laboratory values were compared using independent 2-tailed t tests with α set to .05. To have an 80% chance of detecting a 5% difference in percent change in LDL-C between the experimental and control groups, 129 patients were required. To determine whether an association was present, a correlation between BMI and percent change in LDL-C was conducted. All statistics were conducted using SAS software (Cary, North Carolina).
Results
From January 2009 through July 2014, 35,216 patients were initially screened. The majority of patients did not have a baseline LDL-C value and were excluded. A total of 1,183 patients with simvastatin 20 mg daily (BMI < 30 = 661; BMI ≥ 30 = 1,122) and 478 patients with simvastatin 40 mg daily (BMI < 30 = 259; BMI ≥ 30 = 219) met the inclusion criteria.
Baseline characteristics were similar between groups except for a slightly higher age in both groups without obesity (Table). Hepatic and renal serum markers indicated a baseline of adequate organ function for drug clearance for all groups. The mean baseline BMI of those without obesity was about 26 kg/m2, which is considered overweight. Baseline LDL-C values were clinically similar for those with and without obesity, though statistically different (145 mg/dL for the nonobese group and 141 mg/dL for the obese group, P < .05). The percent change in LDL-C was not statistically significant for those with and without obesity for simvastatin 20 mg daily (P = .293) or simvastatin 40 mg daily (P = .2773) (Figure). No correlation was found between the continuous percent change in LDL-C and continuous BMI for either simvastatin dosage (r2 = 0.0016 and 0.0028, respectively).
Discussion
In this retrospective chart review, it was determined that obesity did not affect the percent change in LDL-C from baseline with statin therapy. The HPS found similar results as a secondary endpoint, although that study was underpowered.10 In this study, all groups met power, and there was still no difference between those with and without obesity.
Nicholls and colleagues examined REVERSAL study data to determine whether BMI greater than the median BMI impacted inflammatory markers or lipid levels with atorvastatin 80 mg daily or pravastatin 40 mg daily. The REVERSAL study authors found no difference in percent change LDL-C between those above the median BMI compared with those below the median BMI for patients on pravastatin therapy. However, the authors did find a difference in percent change LDL-C with atorvastatin therapy.13 No difference in percent change LDL-C was present with simvastatin therapy in this study. As simvastatin is more lipophilic than is atorvastatin, lipophilicity remains an area for further study for statin therapy in patients with obesity.
The surrogate marker of percent change in LDL-C was used for the primary outcome in this study. The ACC/AHA 2013 guidelines and the National Lipid Association 2014 guidelines recommend an alternative goal of 30% to 50% change in LDL-C from baseline.14,15 Using this clinically relevant marker compensated for differences in baseline LDL-C and limited the effect of these differences on the primary outcome of this study.
Limitations
This study did not include patients who were underweight (BMI < 18 kg/m2), as these patients have previously demonstrated decreased outcomes with statin therapy.16 However, this limits these data to only those patients that have a BMI of at least 18 kg/m2. Limitations of this study also included the inability to consider adherence and lifestyle changes. These limitations were unavoidable due to the nature of a retrospective chart review.
Conclusion
The prevalence of obesity is increasing, and it is a disease that alters pharmacokinetics and lipid metabolism. Though this study did not find a difference between the LDL-C-lowering efficacy of simvastatin in those with and without obesity, continued study of the effect of obesity on the efficacy of medications is vital.
Acknowledgments
This material is the result of work supported with resources and the use of facilities at the James H. Qullen VAMC in Mountain Home, Tennessee.
1. Ogden CL, Carroll MD, Kit BK, Flegal KM. Prevalence of childhood and adult obesity in the United States, 2011-2012. JAMA. 2014;311(8):806-814.
2. Shen Y, Sambamoorthi U, Rajan M, Miller D, Banerjea R, Pogach L. Obesity and expenditures among elderly Veterans Health Administration users with diabetes. Popul Health Manag. 2009;12(5):255-264.
3. Chan DC, Watts GF, Wang J, Hegele RA, van Bockxmeer FM, Barrett PH. Variation in Niemann-Pick C1-like 1 gene as a determinant of apolipoprotein B-100 kinetics and response to statin therapy in centrally obese men. Clin Endocrinol (Oxf). 2008;69(1):45-51.
4. Cheymol G. Effects of obesity on pharmacokinetics implications for drug therapy. Clin Pharmacokinet. 2000;39(3):215-231.
5. Hanley MJ, Abernethy DR, Greenblatt DJ. Effect of obesity on the pharmacokinetics of drugs in humans. Clin Pharmacokinet. 2010;49(2):71-87
6. Pencina MJ, Navar-Boggan AM, D’Agostino RB Sr, et al. Application of new cholesterol guidelines to a population-based sample. N Engl J Med. 2014;370(15):1422-1431.
7. Prevention of cardiovascular events and death with pravastatin in patients with coronary heart disease and a broad range of initial cholesterol levels. The Long-Term Intervention with Pravastatin in Ischaemic Disease (LIPID) Study Group. N Engl J Med. 1998;339(19):1349-1357.
8. Pedersen TR, Kjekshus J, Berg K, et al; Scandinavian Simvastatin Survival Study Group. Randomised trial of cholesterol lowering in 4444 patients with coronary heart disease: the Scandinavian Simvastatin Survival Study (4S). 1994. Atheroscler Suppl. 2004;5(3):81-87.
9. Colhoun HM, Betteridge DJ, Durrington PN, et al; CARDS investigators. Primary prevention of cardiovascular disease with atorvastatin in type 2 diabetes in the Collaborative Atorvastatin Diabetes Study (CARDS): multicentre randomised placebo-controlled trial. Lancet. 2004;364(9435):685-696.
10. Collins R, Armitage J, Parish S, Sleigh P, Peto R; Heart Protection Study Collaborative Group. MRC/BHF Heart Protection Study of cholesterol-lowering with simvastatin in 5963 people with diabetes: a randomised placebo-controlled trial. Lancet. 2003;361(9374):2005-2016.
11. Streja L, Packard CJ, Shepherd J, Cobbe S, Ford I; WOSCOPS Group. Factors affecting low-density lipoprotein and high-density lipoprotein cholesterol response to pravastatin in the West Of Scotland Coronary Prevention Study (WOSCOPS). Am J Cardiol. 2002;90(7):731-736.
12. Blasetto JW, Stein EA, Brown WV, Chitra R, Raza A. Efficacy of rosuvastatin compared with other statins at selected starting doses in hypercholesterolemic patients and in special population groups. Am J Cardiol. 2003;91(5A):3C-10C; discussion 10C.
13. Nicholls SJ. Tuzcu EM, Sipahi I, et al. Effect of obesity on lipid-lowering, anti-inflammatory, and antiatherosclerotic benefits of atorvastatin or pravastatin in patients with coronary artery disease (from the REVERSAL Study). Am J Cardiol. 2006;97(11):1553-1557.
14. Stone NJ, Robinson JG, Lichtenstein AH, et al; American College of Cardiology/American Heart Association Task Force on Practice Guidelines. 2013 ACC/AHA Guideline on the treatment of blood cholesterol to reduce atherosclerotic cardiovascular risk on adults: a report of the American College of Cardiology/American Heart Association Task Force on Practice Guidelines. J Am Coll Cardiol. 2014;63(25, pt B):2889-2934.
15. Jacobson T, Ito M, Maki K, et al. National Lipid Association recommendation for patient-centered management of dyslipidemia: part 1-full report. J Clin Lipidol. 2015;9(2):129-169.
16. Nylén ES, Faselis C, Kheirbek R, Myers J, Panagiotakos D, Kokkinos P. Statins modulate the mortality risk associated with obesity and cardiorespiratory fitness in diabetics. J Clin Endocrinol Metab. 2013;98(8):33940-3401.