User login
The Dilemma of the Racist Patient
Medicine is not immune from the pervasive grasp of racism. It spills from other dimensions into the realm of healing and poses challenges to those charged with care of the patient. The literature widely documents racist experiences of patients, and differential treatment and health care disparities based on race.1,2 As a field, medicine is overshadowed by infamous experiments, such as the Tuskegee and Guatemala experiments, and routine studies that demonstrate poor treatment of minority patients.3-5 Although much-needed discussion and research is being done on the unfair treatment of patients, little is written about racist patients and their subsequent effect on health care providers and institutions. Such interactions can cause significant distress to providers, damage the therapeutic physician–patient relationship, and threaten the collegial and structural framework of an institution.6 The silent acquiescence to patients’ racist demands in recent times has become a legal, ethical, and medical dilemma that deserves attention.
No specific example of patient-generated racism is needed because most minority physicians have experienced an overtly racist interaction with a patient. The true incidence of these interactions is unknown because of underreporting secondary to the tendency of physicians to disregard this behavior in the name of “professionalism,” and because reporting of these incidents can sometimes expose how poorly a provider has dealt with the issue and draw admonishment.7 In addition to the overt interactions, numerous examples of subtle racism may exist. Manifestations of such subtleties include failure to cooperate with a history and physical examination, use of hostile language, and aggressive body language. The New York Times gives the example of an Asian female physician tending to a burly, unreceptive, swastika-tattooed patient.8 Such racist interactions are concerning, especially as diversity among newly practicing physicians increases.9
Medical Training
In medical school, students are educated to embody compassion and caring. Their care of patients should rise above the fray of poverty, interpersonal conflict, and prejudice.10 To further this point, medical school curricula have recently introduced standardized patients to teach empathy and simulate difficult encounters in order to help students learn to navigate interactions with aggressive, racist patients. In these scenarios, the patient quickly relinquishes his/her views after an overly understanding student engages the patient in conversation and addresses the source of their angst. Rarely do real-life scenarios play out in such an idealistic manner. The expectation remains, however, that the physician model extreme patience and understanding and honor the patient’s autonomy.
The American Medical Association (AMA), a guiding force in medical education, outlines the patient–physician relationship.10 Such a relationship is a mutually trusting undertaking in which the provider is the patient’s advocate and holds the well-being of the patient supreme. The goal is to alleviate suffering, and it should be done without regard to self-interest.10 The AMA also offers clear instruction to the physician in its code of medical ethics that the physician may not discriminate based on race, color, religion, national origin, sexual orientation, gender identity, or any other basis that would constitute invidious discrimination. With regard to the discriminatory practices of patients, the AMA instructs that “patients who use derogatory language or otherwise act in a prejudicial manner toward physicians, other health care professionals, or others in the health care setting, seriously undermine the integrity of the patient–physician relationship. Such behavior, if unmodified, may constitute sufficient justification for the physician to arrange for the transfer of care.”10 The AMA has also recently launched an online ethics journal, AMA Journal of Ethics, which explores difficult patient interactions and continues to reiterate the supreme role of the physician. When dealing with patients, the anti-discrimination policy is clearly set forth for physicians.
The Dilemma
Anti-discrimination policies for patients are not as clear. Patients are allowed to pick their own provider, and most institutions allow selection based on gender. Most institutions have no guidelines prohibiting provider-selection based on race, and no published hospital policies explicitly restrict racist demands. Although a culture of respect is encouraged through many hospitals’ published slogans and on websites, at the authors’ institution, no published guidelines exist about the behavior of the patient. When no such policies exist, differential treatment of patients’ racist requests ensues and frustration results. Legally, Title VII of the Civil Rights Act of 1964 bars all employers from discriminating with respect to employment conditions or terms on the basis of race, color, religion, sex, or national origin.11 Honoring a patient’s racist demands that results in discrimination of employees is a violation of that law. Reports of hospitals acceding to racist requests have often resulted in upset staff and lawsuits.12-14 Legal language, however, may be foreign in cases of life and death, or scenarios involving significant illness. Physicians in such cases often grant racist requests; for example, a Korean patient underwent life-saving measures only after he was given a non-Japanese provider, and a surgeon granted the wish of a patient’s husband to prohibit African American providers and staff members from entering the operating suite when his wife was undergoing an operation.15 Some would argue that granting a patient’s bigoted request is akin to institutionalized racism.16
The doctor–patient relationship is a powerful cornerstone for medicine. Confidence in the physician results in higher satisfaction for both parties and adherence to the treatment regimen on the part of the patient. Prejudiced interactions threaten the therapeutic alliance between patient and provider. Research has investigated how race plays a role in the doctor–patient relationship. When permitted, patients more often pick a provider of their own race.17 One of 5 African American patients wishes to have an African American provider, and such a desire is often based on a previous negative racist encounter.18 A patient’s perceptions of discrimination in general correlate with preference for same-race providers, highlighting that a patient’s overall experience with discrimination leads them to prefer a same-race physician. Race-concordant relationships (ie, one in which the provider and patient are of the same race) not only show increased satisfaction, but patients also perceive that their interactions with a racially similar physician are more participatory.19-22 In non–English speaking groups, preferences for racially similar physicians are largely based on language similarity, but Latinos feel that Latino physicians are more empathetic to their complaints.23 Such views are felt not only by patients, but also by providers. One of 3 physicians feels that patients receiving care from a physician that is of the patient’s own race is superior to that provided by a race-discordant physician.24 Superior outcomes from race-concordant doctor–patient relationships have led some to argue in favor of granting a patient’s wishes for a provider of similar race because doing so can confer additional health benefits.25
Possible Solutions
The solution to such a complex and uncomfortable issue begins with addressing the problem. Patients who make racist remarks and racist demands should be courteously informed that their behavior is inappropriate and hurtful. Failure to voice such a concern results in passive, tacit approval of racist remarks and can be distressing to other patients and staff members in the vicinity.26 It is unfair for a physician, as the leader of the care team, to ignore such behavior because it places staff members, who spend much more time with the patient, in a potentially abusive situation and leaves them feeling helpless.27 Toward this end, appropriate training, beginning in medical school and continuing in residency, in confronting racist patients is needed to ease the too often felt sense of discomfort among providers.7,26
Medical school, although rightly placing patient comfort at the center of dialogue, too often drowns out the personality of the student in the name of professionalism, which becomes a problem as a young physician struggles to reconcile his or her personality with the newly ingrained teaching to remain professional. This internal conflict can lead to frustration. A necessary prerequisite to beginning dialogue is that the physician recognizes his or her own emotional baggage from prior racially charged events and continues to remain professional. Airing the issue can help establish dialogue that can identify underlying causes of the patient’s misplaced anger. An illness and its subsequent hospitalization can make a patient feel vulnerable and helpless, and in those with poor coping mechanisms, misdirection of emotion is not uncommon.
In more difficult scenarios where attempts at dialogue reach an impasse, an ethics team should be consulted. Most institutions have such help available. Their expertise and experience can help in addressing the needs of the patient judiciously. Some institutions have dedicated multidisciplinary teams to help providers deal with dangerous and difficult patients. The implementation of the teams has reduced confrontation and litigation.28 If the impasse remains despite intervention, the physician should step aside after the patient’s care is transitioned to a provider that satisfies the needs of the patient.
In clinically emergent scenarios, ethics consultation or prolonged discussion may not be feasible. In such cases, the patient’s wishes should be honored and attempts should be made to receive permission for life-saving or limb-saving intervention. At large tertiary care centers, the wishes of the patient can be more easily granted than at an outlying facility or rural clinic. If the patient’s wishes cannot be respected in a life-or-death scenario and the patient continues to refuse care, the principle of patient autonomy dictates that no care can be provided. Much in the same way Jehovah’s Witnesses can refuse transfusion of blood products based upon their belief system, any patient can and should be allowed to freely refuse care from a provider.
Racism is a societal disease that is complex and multilayered, and it can be deeply entrenched in the minds of those afflicted and, thus, difficult to eradicate. The manifestations of bigotry in medical settings are only one example of a mindset that likely exists in multiple aspects of life. Hospitals and clinics can become a place to establish dialogue between racially intolerant patients and their providers, but they are not the venue where firmly held racist views can be expected to be wholly reversed. Having the objective to reverse prejudiced beliefs prior to providing care is discordant to the practice of medicine and can harm a patient if an unnecessary delay ensues. Although hospitals should try to avoid offending staff members, there should be an understanding that appropriate and timely patient care is the primary goal in medicine.29 As we move to a more multicultural society, it is the hope of the authors that these already infrequent racist encounters will continue to diminish, and that medical schools and residency programs will train physicians who are highly understanding and culturally competent.
1. Dimick J, Ruhter J, Sarrazin MV, Birkmeyer JD. Black patients more likely than whites to undergo surgery at low-quality hospitals in segregated regions. Health Aff (Millwood). 2013;32(6):1046-1053.
2. Kelaher MA, Ferdinand AS, Paradies Y. Experiencing racism in health care: the mental health impacts for Victorian Aboriginal communities. Med J Aust. 2014;201(1):44-47.
3. Johnson RL, Roter D, Powe NR, Cooper LA. Patient race/ethnicity and quality of patient-physician communication during medical visits. Am J Public Health. 2004;94(12):2084-2090.
4. US Public Health Service Syphilis Study at Tuskegee. Centers for Disease Control and Prevention website. http://www.cdc.gov/tuskegee. Updated December 30, 2013. Accessed October 27, 2015.
5. Fact Sheet on the 1946-1948 US Public Health Service Sexually Transmitted Diseases (STD) Inoculation Study. US Department of Health and Human Services website. http://www.hhs.gov/1946inoculationstudy/factsheet.html. Accessed October 27, 2015.
6. Inoue M, Tsukano K, Muraoka M, Kaneko F, Okamura H. Psychological impact of verbal abuse and violence by patients on nurses working in psychiatric departments. Psychiatry Clin Neurosci. 2006;60(1):29-36.
7. Jain SH. The racist patient. Ann Intern Med. 2013;158(8):632.
8. Chen PW. When the patient is racist. New York Times. July 25, 2013. http://well.blogs.nytimes.com/2013/07/25/when-the-patient-is-racist/?_php=true&_type=blogs&_php=true&_type=blogs&_r=1. Accessed October 27, 2015.
9. Castillo-Page L. Diversity in Medical Education: Facts & Figures 2012. Washington, DC: Association of American Medical Colleges; 2012:26-32. https://members.aamc.org/eweb/upload/Diversity%20in%20Medical%20Education_Facts%20and%20Figures%202012.pdf. Accessed October 27, 2015.
10. The patient-physician relationship. Opinion 10.015. Code of Medical Ethics. American Medical Association website. http://www.ama-assn.org/ama/pub/physician-resources/medical-ethics/code-medical-ethics/opinion10015.page?. Issued December 2001. Accessed October 27, 2015.
11. Civil Rights Act of 1964, 42 US Code § 2000e (1964). US Government Printing Office website. http://www.gpo.gov/fdsys/pkg/USCODE-2011-title42/html/USCODE-2011-title42-chap21.htm. Accessed October 27, 2015.
12. Some hospitals grant patients’ racist requests. Houston Chronicle. February 23, 2013. http://www.chron.com/life/healthzone/article/Some-hospitals-grant-patients-racist-requests-4302145.php. Accessed October 27, 2015.
13. Prichard O. Three workers sue Abington Hospital over racist incident; supervisors obliged a 2003 demand for only white staff in a delivery. The suits follow a federal ruling. Philadelphia Inquirer. September 16, 2005. http://articles.philly.com/2005-09-16/news/25429798_1_nursing-racial-slur-obstetrical-resident. Accessed October 27, 2015.
14. Nurses told not to touch white patient. WNEM website. http://www.wnem.com/story/22911660/nurses-told-not-to-touch-white-patient. Published July 23, 2013. Updated August 20, 2013. Accessed October 27, 2015.
15. Kipnis K. Quality care and the wounds of diversity. In: Mappes T DD, ed. Biomedical Ethics. 6th ed. Boston, MA: McGraw-Hill; 2006.
16. Moghal N. Allowing patients to choose the ethnicity of attending doctors is institutional racism. BMJ. 2014;348:g265.
17. Saha S, Taggart SH, Komaromy M, Bindman AB. Do patients choose physicians of their own race? Health Aff (Millwood). 2000;19(4):76-83.
18. Malat J, van Ryn M. African-American preference for same-race healthcare providers: the role of healthcare discrimination. Ethnicity Dis. 2005;15(4):740-747.
19. LaVeist TA, Carroll T. Race of physician and satisfaction with care among African-American patients. J Natl Med Assoc. 2002;94(11):937-943.
20. Saha S, Komaromy M, Koepsell TD, Bindman AB. Patient-physician racial concordance and the perceived quality and use of health care. Arch Intern Med. 1999;159(9):997-1004.
21. Cooper-Patrick L, Gallo JJ, Gonzales JJ, et al. Race, gender, and partnership in the patient-physician relationship. JAMA. 1999;282(6):583-589.
22. Cooper LA, Roter DL, Johnson RL, Ford DE, Steinwachs DM, Powe NR. Patient-centered communication, ratings of care, and concordance of patient and physician race. Ann Intern Med. 2003;139(11):907-915.
23. Garcia JA, Paterniti DA, Romano PS, Kravitz RL. Patient p for physician characteristics in university-based primary care clinics. Ethnicity Dis. 2003;13(2):259-267.
24. Padela AI, Schneider SM, He H, Ali Z, Richardson TM. Patient choice of provider type in the emergency department: perceptions and factors relating to accommodation of requests for care providers. Emerg Med J. 2010;27(6):465-469.
25. Paul-Emile K. Patients’ racial p and the medical culture of accommodation. UCLA Law Rev. 2012;60(2):462-504.
26. Selby M. Ethical dilemma: dealing with racist patients. BMJ. 1999;318(7191):1129.
27. Warshafsky RJ. Lack of support for staff to combat racism. BMJ. 2014;348:g1716.
28. Carlson MJ, Baker LH. Difficult, dangerous, and drug seeking: the 3D way to better patient care. Am J Public Health. 1998;88(8):1250-1252.
29. Lane-Fall M. A piece of my mind. Accommodating bigotry. JAMA. 2014;311(2):139-140
Medicine is not immune from the pervasive grasp of racism. It spills from other dimensions into the realm of healing and poses challenges to those charged with care of the patient. The literature widely documents racist experiences of patients, and differential treatment and health care disparities based on race.1,2 As a field, medicine is overshadowed by infamous experiments, such as the Tuskegee and Guatemala experiments, and routine studies that demonstrate poor treatment of minority patients.3-5 Although much-needed discussion and research is being done on the unfair treatment of patients, little is written about racist patients and their subsequent effect on health care providers and institutions. Such interactions can cause significant distress to providers, damage the therapeutic physician–patient relationship, and threaten the collegial and structural framework of an institution.6 The silent acquiescence to patients’ racist demands in recent times has become a legal, ethical, and medical dilemma that deserves attention.
No specific example of patient-generated racism is needed because most minority physicians have experienced an overtly racist interaction with a patient. The true incidence of these interactions is unknown because of underreporting secondary to the tendency of physicians to disregard this behavior in the name of “professionalism,” and because reporting of these incidents can sometimes expose how poorly a provider has dealt with the issue and draw admonishment.7 In addition to the overt interactions, numerous examples of subtle racism may exist. Manifestations of such subtleties include failure to cooperate with a history and physical examination, use of hostile language, and aggressive body language. The New York Times gives the example of an Asian female physician tending to a burly, unreceptive, swastika-tattooed patient.8 Such racist interactions are concerning, especially as diversity among newly practicing physicians increases.9
Medical Training
In medical school, students are educated to embody compassion and caring. Their care of patients should rise above the fray of poverty, interpersonal conflict, and prejudice.10 To further this point, medical school curricula have recently introduced standardized patients to teach empathy and simulate difficult encounters in order to help students learn to navigate interactions with aggressive, racist patients. In these scenarios, the patient quickly relinquishes his/her views after an overly understanding student engages the patient in conversation and addresses the source of their angst. Rarely do real-life scenarios play out in such an idealistic manner. The expectation remains, however, that the physician model extreme patience and understanding and honor the patient’s autonomy.
The American Medical Association (AMA), a guiding force in medical education, outlines the patient–physician relationship.10 Such a relationship is a mutually trusting undertaking in which the provider is the patient’s advocate and holds the well-being of the patient supreme. The goal is to alleviate suffering, and it should be done without regard to self-interest.10 The AMA also offers clear instruction to the physician in its code of medical ethics that the physician may not discriminate based on race, color, religion, national origin, sexual orientation, gender identity, or any other basis that would constitute invidious discrimination. With regard to the discriminatory practices of patients, the AMA instructs that “patients who use derogatory language or otherwise act in a prejudicial manner toward physicians, other health care professionals, or others in the health care setting, seriously undermine the integrity of the patient–physician relationship. Such behavior, if unmodified, may constitute sufficient justification for the physician to arrange for the transfer of care.”10 The AMA has also recently launched an online ethics journal, AMA Journal of Ethics, which explores difficult patient interactions and continues to reiterate the supreme role of the physician. When dealing with patients, the anti-discrimination policy is clearly set forth for physicians.
The Dilemma
Anti-discrimination policies for patients are not as clear. Patients are allowed to pick their own provider, and most institutions allow selection based on gender. Most institutions have no guidelines prohibiting provider-selection based on race, and no published hospital policies explicitly restrict racist demands. Although a culture of respect is encouraged through many hospitals’ published slogans and on websites, at the authors’ institution, no published guidelines exist about the behavior of the patient. When no such policies exist, differential treatment of patients’ racist requests ensues and frustration results. Legally, Title VII of the Civil Rights Act of 1964 bars all employers from discriminating with respect to employment conditions or terms on the basis of race, color, religion, sex, or national origin.11 Honoring a patient’s racist demands that results in discrimination of employees is a violation of that law. Reports of hospitals acceding to racist requests have often resulted in upset staff and lawsuits.12-14 Legal language, however, may be foreign in cases of life and death, or scenarios involving significant illness. Physicians in such cases often grant racist requests; for example, a Korean patient underwent life-saving measures only after he was given a non-Japanese provider, and a surgeon granted the wish of a patient’s husband to prohibit African American providers and staff members from entering the operating suite when his wife was undergoing an operation.15 Some would argue that granting a patient’s bigoted request is akin to institutionalized racism.16
The doctor–patient relationship is a powerful cornerstone for medicine. Confidence in the physician results in higher satisfaction for both parties and adherence to the treatment regimen on the part of the patient. Prejudiced interactions threaten the therapeutic alliance between patient and provider. Research has investigated how race plays a role in the doctor–patient relationship. When permitted, patients more often pick a provider of their own race.17 One of 5 African American patients wishes to have an African American provider, and such a desire is often based on a previous negative racist encounter.18 A patient’s perceptions of discrimination in general correlate with preference for same-race providers, highlighting that a patient’s overall experience with discrimination leads them to prefer a same-race physician. Race-concordant relationships (ie, one in which the provider and patient are of the same race) not only show increased satisfaction, but patients also perceive that their interactions with a racially similar physician are more participatory.19-22 In non–English speaking groups, preferences for racially similar physicians are largely based on language similarity, but Latinos feel that Latino physicians are more empathetic to their complaints.23 Such views are felt not only by patients, but also by providers. One of 3 physicians feels that patients receiving care from a physician that is of the patient’s own race is superior to that provided by a race-discordant physician.24 Superior outcomes from race-concordant doctor–patient relationships have led some to argue in favor of granting a patient’s wishes for a provider of similar race because doing so can confer additional health benefits.25
Possible Solutions
The solution to such a complex and uncomfortable issue begins with addressing the problem. Patients who make racist remarks and racist demands should be courteously informed that their behavior is inappropriate and hurtful. Failure to voice such a concern results in passive, tacit approval of racist remarks and can be distressing to other patients and staff members in the vicinity.26 It is unfair for a physician, as the leader of the care team, to ignore such behavior because it places staff members, who spend much more time with the patient, in a potentially abusive situation and leaves them feeling helpless.27 Toward this end, appropriate training, beginning in medical school and continuing in residency, in confronting racist patients is needed to ease the too often felt sense of discomfort among providers.7,26
Medical school, although rightly placing patient comfort at the center of dialogue, too often drowns out the personality of the student in the name of professionalism, which becomes a problem as a young physician struggles to reconcile his or her personality with the newly ingrained teaching to remain professional. This internal conflict can lead to frustration. A necessary prerequisite to beginning dialogue is that the physician recognizes his or her own emotional baggage from prior racially charged events and continues to remain professional. Airing the issue can help establish dialogue that can identify underlying causes of the patient’s misplaced anger. An illness and its subsequent hospitalization can make a patient feel vulnerable and helpless, and in those with poor coping mechanisms, misdirection of emotion is not uncommon.
In more difficult scenarios where attempts at dialogue reach an impasse, an ethics team should be consulted. Most institutions have such help available. Their expertise and experience can help in addressing the needs of the patient judiciously. Some institutions have dedicated multidisciplinary teams to help providers deal with dangerous and difficult patients. The implementation of the teams has reduced confrontation and litigation.28 If the impasse remains despite intervention, the physician should step aside after the patient’s care is transitioned to a provider that satisfies the needs of the patient.
In clinically emergent scenarios, ethics consultation or prolonged discussion may not be feasible. In such cases, the patient’s wishes should be honored and attempts should be made to receive permission for life-saving or limb-saving intervention. At large tertiary care centers, the wishes of the patient can be more easily granted than at an outlying facility or rural clinic. If the patient’s wishes cannot be respected in a life-or-death scenario and the patient continues to refuse care, the principle of patient autonomy dictates that no care can be provided. Much in the same way Jehovah’s Witnesses can refuse transfusion of blood products based upon their belief system, any patient can and should be allowed to freely refuse care from a provider.
Racism is a societal disease that is complex and multilayered, and it can be deeply entrenched in the minds of those afflicted and, thus, difficult to eradicate. The manifestations of bigotry in medical settings are only one example of a mindset that likely exists in multiple aspects of life. Hospitals and clinics can become a place to establish dialogue between racially intolerant patients and their providers, but they are not the venue where firmly held racist views can be expected to be wholly reversed. Having the objective to reverse prejudiced beliefs prior to providing care is discordant to the practice of medicine and can harm a patient if an unnecessary delay ensues. Although hospitals should try to avoid offending staff members, there should be an understanding that appropriate and timely patient care is the primary goal in medicine.29 As we move to a more multicultural society, it is the hope of the authors that these already infrequent racist encounters will continue to diminish, and that medical schools and residency programs will train physicians who are highly understanding and culturally competent.
1. Dimick J, Ruhter J, Sarrazin MV, Birkmeyer JD. Black patients more likely than whites to undergo surgery at low-quality hospitals in segregated regions. Health Aff (Millwood). 2013;32(6):1046-1053.
2. Kelaher MA, Ferdinand AS, Paradies Y. Experiencing racism in health care: the mental health impacts for Victorian Aboriginal communities. Med J Aust. 2014;201(1):44-47.
3. Johnson RL, Roter D, Powe NR, Cooper LA. Patient race/ethnicity and quality of patient-physician communication during medical visits. Am J Public Health. 2004;94(12):2084-2090.
4. US Public Health Service Syphilis Study at Tuskegee. Centers for Disease Control and Prevention website. http://www.cdc.gov/tuskegee. Updated December 30, 2013. Accessed October 27, 2015.
5. Fact Sheet on the 1946-1948 US Public Health Service Sexually Transmitted Diseases (STD) Inoculation Study. US Department of Health and Human Services website. http://www.hhs.gov/1946inoculationstudy/factsheet.html. Accessed October 27, 2015.
6. Inoue M, Tsukano K, Muraoka M, Kaneko F, Okamura H. Psychological impact of verbal abuse and violence by patients on nurses working in psychiatric departments. Psychiatry Clin Neurosci. 2006;60(1):29-36.
7. Jain SH. The racist patient. Ann Intern Med. 2013;158(8):632.
8. Chen PW. When the patient is racist. New York Times. July 25, 2013. http://well.blogs.nytimes.com/2013/07/25/when-the-patient-is-racist/?_php=true&_type=blogs&_php=true&_type=blogs&_r=1. Accessed October 27, 2015.
9. Castillo-Page L. Diversity in Medical Education: Facts & Figures 2012. Washington, DC: Association of American Medical Colleges; 2012:26-32. https://members.aamc.org/eweb/upload/Diversity%20in%20Medical%20Education_Facts%20and%20Figures%202012.pdf. Accessed October 27, 2015.
10. The patient-physician relationship. Opinion 10.015. Code of Medical Ethics. American Medical Association website. http://www.ama-assn.org/ama/pub/physician-resources/medical-ethics/code-medical-ethics/opinion10015.page?. Issued December 2001. Accessed October 27, 2015.
11. Civil Rights Act of 1964, 42 US Code § 2000e (1964). US Government Printing Office website. http://www.gpo.gov/fdsys/pkg/USCODE-2011-title42/html/USCODE-2011-title42-chap21.htm. Accessed October 27, 2015.
12. Some hospitals grant patients’ racist requests. Houston Chronicle. February 23, 2013. http://www.chron.com/life/healthzone/article/Some-hospitals-grant-patients-racist-requests-4302145.php. Accessed October 27, 2015.
13. Prichard O. Three workers sue Abington Hospital over racist incident; supervisors obliged a 2003 demand for only white staff in a delivery. The suits follow a federal ruling. Philadelphia Inquirer. September 16, 2005. http://articles.philly.com/2005-09-16/news/25429798_1_nursing-racial-slur-obstetrical-resident. Accessed October 27, 2015.
14. Nurses told not to touch white patient. WNEM website. http://www.wnem.com/story/22911660/nurses-told-not-to-touch-white-patient. Published July 23, 2013. Updated August 20, 2013. Accessed October 27, 2015.
15. Kipnis K. Quality care and the wounds of diversity. In: Mappes T DD, ed. Biomedical Ethics. 6th ed. Boston, MA: McGraw-Hill; 2006.
16. Moghal N. Allowing patients to choose the ethnicity of attending doctors is institutional racism. BMJ. 2014;348:g265.
17. Saha S, Taggart SH, Komaromy M, Bindman AB. Do patients choose physicians of their own race? Health Aff (Millwood). 2000;19(4):76-83.
18. Malat J, van Ryn M. African-American preference for same-race healthcare providers: the role of healthcare discrimination. Ethnicity Dis. 2005;15(4):740-747.
19. LaVeist TA, Carroll T. Race of physician and satisfaction with care among African-American patients. J Natl Med Assoc. 2002;94(11):937-943.
20. Saha S, Komaromy M, Koepsell TD, Bindman AB. Patient-physician racial concordance and the perceived quality and use of health care. Arch Intern Med. 1999;159(9):997-1004.
21. Cooper-Patrick L, Gallo JJ, Gonzales JJ, et al. Race, gender, and partnership in the patient-physician relationship. JAMA. 1999;282(6):583-589.
22. Cooper LA, Roter DL, Johnson RL, Ford DE, Steinwachs DM, Powe NR. Patient-centered communication, ratings of care, and concordance of patient and physician race. Ann Intern Med. 2003;139(11):907-915.
23. Garcia JA, Paterniti DA, Romano PS, Kravitz RL. Patient p for physician characteristics in university-based primary care clinics. Ethnicity Dis. 2003;13(2):259-267.
24. Padela AI, Schneider SM, He H, Ali Z, Richardson TM. Patient choice of provider type in the emergency department: perceptions and factors relating to accommodation of requests for care providers. Emerg Med J. 2010;27(6):465-469.
25. Paul-Emile K. Patients’ racial p and the medical culture of accommodation. UCLA Law Rev. 2012;60(2):462-504.
26. Selby M. Ethical dilemma: dealing with racist patients. BMJ. 1999;318(7191):1129.
27. Warshafsky RJ. Lack of support for staff to combat racism. BMJ. 2014;348:g1716.
28. Carlson MJ, Baker LH. Difficult, dangerous, and drug seeking: the 3D way to better patient care. Am J Public Health. 1998;88(8):1250-1252.
29. Lane-Fall M. A piece of my mind. Accommodating bigotry. JAMA. 2014;311(2):139-140
Partnering With Patients to Optimize Diabetes Therapy
IN THIS ARTICLE
• Fasting versus postprandial glucose contribution to A1C
• General glycemic targets for individuals with T2DM
• Sonja's blood glucose log
• Glycemic impact of noninsulin agents available for T2DM
• Considerations when determining glycemic targets
“… Our ability to help others is a source of pride and satisfaction; however, if we listen, really listen to our patients, we may discover that they are also experts, problem-solvers, and teachers. If we allow our patients to also be our teachers, we may someday realize that although we began with knowledge, we ended up with wisdom.” — 1,000 Years of Diabetes Wisdom
(Marrero DG et al, eds)
The pharmacotherapeutic options available for the treatment of type 2 diabetes mellitus (T2DM) have expanded exponentially in the past 15 years. Although this is great news, having so many therapeutic options has led to confusion for both patients and health care providers (HCPs) as they consider which agent or combination of agents is most appropriate for glucose management, while also considering efficacy, safety, adverse effects, patient preferences, and cost.
Current expert recommendations and guidelines provide algorithms that assist the HCP with selecting medications based on safety (avoiding hypoglycemia), adverse-effect profile (eg, weight gain), and efficacy (predicted A1C reduction). These same guidelines also recommend that the choice of antihyperglycemic agent(s) be individualized according to the patient’s health status and personal preferences.
True success in diabetes management requires not only the knowledge and expertise of the clinician, but also the active involvement of the patient as a partner in health care decision making.
Continue for patient presentation/history >>
PATIENT PRESENTATION/HISTORY
We will explore a combined glucose-centric/patient-focused approach with our patient, Sonja.
Sonja is a 38-year-old Latina woman who was diagnosed with T2DM one week ago. She was being closely monitored for diabetes due to a strong family history for T2DM (father, two sisters, and several aunts/uncles affected), high-risk ethnicity, and history of gestational diabetes. Two years ago, when she was told she had prediabetes, she attempted to make appropriate therapeutic lifestyle changes.
Sonja is significantly overweight, with a BMI (29) bordering on obesity. She is inconsistent in her approach to exercise, and her long working hours as a dentist have contributed to a sedentary lifestyle. However, she made a concerted effort to change her diet and successfully lost 18 lb in the past year. Unfortunately, she then experienced considerable stress in her personal life and regained the weight, plus an additional 6 lb.
She presents today to review recent laboratory test results, which include a fasting glucose of 133 mg/dL; serum creatinine (SCr), 1.0 mg/dL; estimated glomerular filtration rate (eGFR), 103 mL/min; A1C, 7.2%; and aspartate transaminase/alanine transaminase (AST/ALT), normal. Sonja says she feels “defeated, frustrated, and helpless” in her attempt to control her weight and thus her inability to avoid T2DM. Fortunately, she wants to change and is determined to do whatever is necessary.
Continue for treatment/management >>
TREATMENT/MANAGEMENT
Current guidelines from the American Diabetes Association/European Association for the Study of Diabetes (ADA/EASD) and the American Association of Clinical Endocrinologists (AACE) advise that in addition to a therapeutic lifestyle (adequate physical activity, healthy diet, and weight control), metformin is the drug of choice and is recommended as firstline therapy.1,2
The many available pharmacologic options can make the choice of agents after metformin use an overwhelming task, especially if the HCP has limited experience with them. The 2015 ADA/EASD and AACE algorithms help guide decision making by prioritizing the medications according to efficacy, safety, and adverse-effect profiles.1,2
Emphasis is placed on choosing medications that have low potential for hypoglycemia and, if possible, avoiding medications that may cause weight gain. Additionally, HCPs must take into account patient concerns about adverse effects, convenience/ease of use, mode of administration, and cost. Engaging patients about what is important to them and addressing their beliefs, desires, and fears are key components of individualizing therapy and are essential for successful treatment outcomes.
While Sonja’s current labs suggest that she would be an appropriate candidate for metformin, the drug’s known potential for gastrointestinal (GI) adverse effects is concerning because of Sonja’s underlying history of diarrhea-dominant irritable bowel syndrome (IBS). She remarks that while her IBS is currently controlled, she is wary of developing problems. You respond that extended-release metformin is generally better tolerated than the immediate-release preparations, but it may cost more. She considers this and is willing to try the extended-release option; you instruct her to increase her dose by one 500-mg tablet every week, as tolerated, to reduce the risk for intolerance.
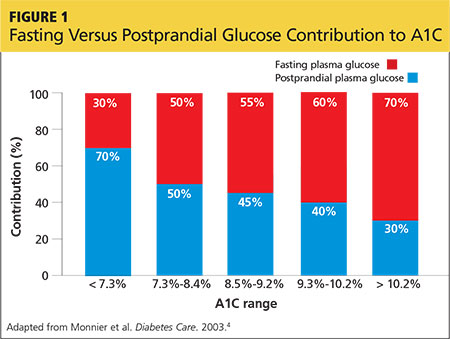
You also discuss blood-glucose testing with her. While she is not taking a medication that will cause hypoglycemia, you explain that structured self-monitoring of blood glucose (SMBG) will provide her immediate feedback about the effects of her lifestyle changes, as well as the effect of the medication, on her blood sugar control.3 Her A1C of 7.2% suggests postprandial glucose (PPG) as a significant contributing factor; thus, it would be beneficial to measure this value regularly (see Figure 14).
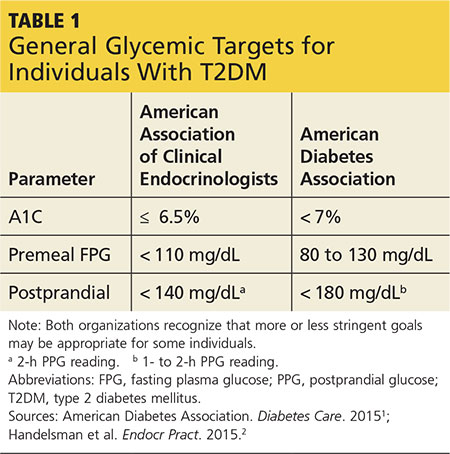
You show Sonja the AACE and ADA therapeutic blood glucose parameters required for optimal glucose control so she can see the impact of her efforts (see Table 11,2). She is willing to test her blood sugar twice daily and agrees to test before and then two hours after a different meal each day (this is known as paired testing).5
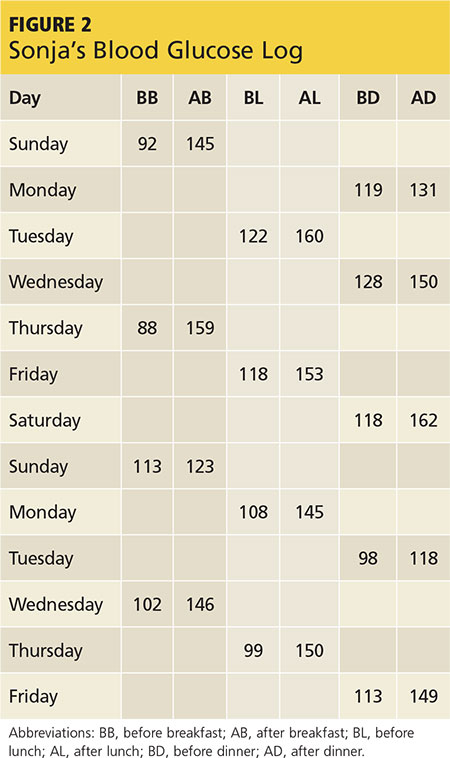
Sonja returns two weeks later with her blood glucose log for review (see Figure 2). She is pleased with her improved glucose values but has been unable to exceed 1,000 mg/d due to frequent daytime diarrhea that interferes with work. She requests a change of medication.
Continue for therapeutic considerations >>
THERAPEUTIC CONSIDERATIONS
Glucose-centric
Sonja’s glucose log demonstrates that her blood glucose values are at target with her current dose of extended-release metformin. Based on her glucose patterns and A1C, an agent of choice would be one that best directs its action on postprandial hyperglycemia. Fortunately, at this point in Sonja’s disease state, she should be able to achieve an A1C of < 7% with any of the noninsulin options.
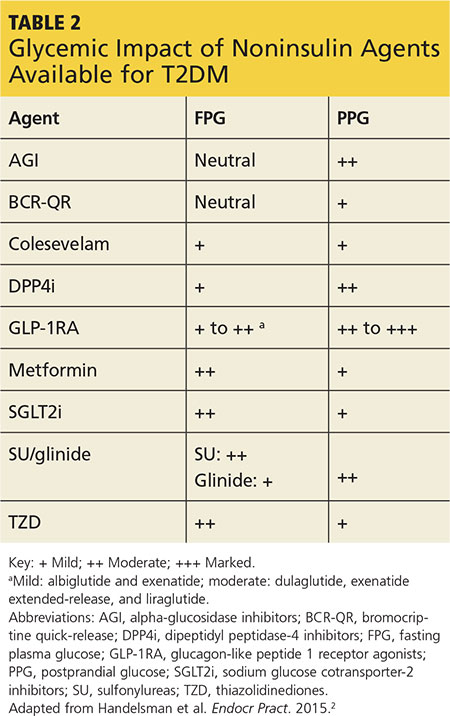
However, when applying the glucose-centric approach, the proper course should be to use an agent that best addresses postprandial hyperglycemia. These agents include glucagon-like peptide 1 receptor agonists (GLP-1RA), dipeptidyl peptidase-4 inhibitors (DPP4i), sulfonylureas (SU), glinide, and α-glucosidase inhibitors (AGI) (see Table 2). Other agents would be less effective in addressing PPG.
Patient-focused
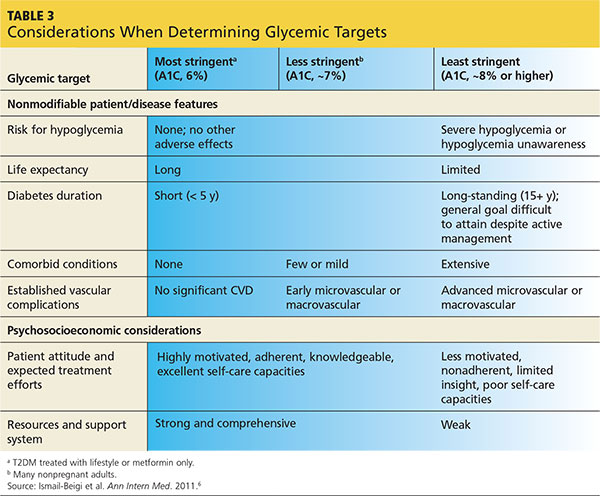
Since Sonja is young, has new-onset T2DM, is otherwise healthy, and has no overt complications from diabetes, her A1C goal should be < 6.5% and perhaps even < 6%, while minimizing the risk for hypoglycemia (see Table 3). However, she continues to be concerned with taking medications associated with any GI-related adverse effects.
The following are discussion points for Sonja regarding the agents approved as monotherapy or as monotherapy when metformin is contraindicated or not tolerated. Although all these classes have potential adverse effects, only GI intolerance and possibility for weight gain are covered here, since these directly pertain to Sonja’s choice of agent.
GLP-1RA (exenatide, liraglutide, exenatide extended-release, albiglutide, dulaglutide).7 This class, along with DPP4i, is also referred to as the incretins. The GLP-1RAs predominately target postprandial hyperglycemia and, to a lesser degree, fasting hyperglycemia—especially when used with the daily options of exenatide and/or liraglutide. The once-weekly options (exenatide extended-release, albiglutide, dulaglutide) have beneficial effects on both fasting and postprandial hyperglycemia.
Though GLP-1RAs are typically well tolerated, the most common associated adverse effects are nausea, which usually resolves in several weeks, and vomiting, which occurs infrequently. The GLP-1RAs are also one of two classes of diabetes medications associated with modest weight loss (the other is sodium glucose cotransporter-2 inhibitors [SGLT2i], to be discussed shortly). An additional benefit of GLP-1RA agents is that they are not associated with hypoglycemia, since they exert their effect in a glucose-dependent manner (ie, only when blood sugar is increased).
While Sonja is not averse to using an injectable agent, she is extremely hesitant to use any agent that may cause GI upset.
DPP4i (sitagliptin, saxagliptin, linagliptin, alogliptin).7 As previously stated, these are in the incretin class along with the GLP-1RAs. They help maintain physiologic levels of endogenous GLP-1, compared with the nearly eightfold pharmacologic level of GLP-1 from the injectable GLP-1RA. DPP4i agents are a physiologically appropriate choice for Sonja, because their effect is primarily on postprandial hyperglycemia. Since these medications also function in a glucose-dependent manner, they are not associated with hypoglycemia.
You explain to Sonja that while the DPP4i agents have a very low GI adverse-effect profile (compared with GLP-1RAs), they are not associated with weight loss but are considered weight neutral.
SU (glyburide, glipizide, glimepiride) and glinides (nateglinide, repaglinide).7 The SU class has a much longer half-life than the glinides and as a result affects both fasting glucose and PPG. The quicker-acting glinides improve PPG extremely well. However, because of the short duration of action, they must be dosed before each meal and sometimes before snacks as well. Since both of these classes stimulate insulin production, they carry a risk for hypoglycemia, but less than for the glinides.8
These agents are generally well tolerated, have a low GI adverse-effect profile, and can be associated with modest weight gain. But the risk for hypoglycemia means they may not be the optimal choice for Sonja.
SGLT2i (canagliflozin, dapagliflozin, empagliflozin).7 The mechanism of action for this class is rather unique in that it reduces re-absorption of glucose by the kidneys, resulting in increased urinary glucose output (glycosuria). This class has been shown to demonstrate modest weight loss. Since increased insulin secretion is not an effect of this class, it carries a very low risk for hypoglycemia.
While SGLT2i medications have a low GI adverse-effect profile, Sonja should be alerted to the associated increased urination, as it may impact her busy work schedule caring for patients.
TZD (rosiglitazone, pioglitazone).7 This is the most effective class for addressing insulin resistance, the key physiologic defect in T2DM. TZD is the only class that has demonstrated long-term A1C reductions (> 5 y).9 The drugs in this class are not associated with hypoglycemia and have a low GI adverse-effect profile. The most common adverse effects are weight gain and fluid retention, which are even more commonly observed in patients also taking insulin. Additionally, there is concern about increased risk for atypical fractures in women, particularly postmenopausal women.
Sonja should be made aware of this potential risk during her postmenopausal years, should she use one of these agents long-term. Currently, however, this would still be a viable option for her since she is early in the course of her disease and likely still has fairly good β-cell function.
AGI (acarbose, miglitol).7 This class is a good choice for directing therapy at postprandial elevations without hypoglycemia and is weight-neutral. Unfortunately, use of these agents has fallen out of favor since they are associated with significant GI adverse effects (ie, bloating, flatulence) and require multiple daily doses, with specific timing before each meal.
Insulin. Insulin is always an option for patients with diabetes, and it is the most effective and natural agent available. However, Sonja’s A1C and glucose pattern—consisting of mild postprandial elevations and near-target fasting glucose—suggest that she does not yet require this medication. Additionally, the risks for hypoglycemia and weight gain make this choice less desirable when other effective therapies are available.
After you have spent time discussing feasible options with Sonja, she decides that she would like to try a DPP4i. You agree and support her decision.
In your discussion, you also reiterate that T2DM is a progressive disease and that Sonja will likely need to use additional agents, possibly even insulin, in the years to come. You encourage her to strive for ongoing good dietary habits, exercise, and weight loss/maintenance, as these measures can lengthen the time before additional diabetes agents are needed.
To assist her with achieving these goals, you refer Sonja to a certified diabetes educator (CDE). The CDE, an integral member of the diabetes management team, will partner with Sonja to develop a plan to successfully implement these necessary lifestyle modifications.
Continue for the conclusion >>
CONCLUSION
Metformin is safe, efficacious, and recommended as a firstline therapy. However, even the best and most effective medication is no good if not taken. Adverse effects, convenience, fears—as perceived by the patient—will ultimately determine treatment success. Therefore, it is often necessary and appropriate to consider other agents in order to meet both the glycemic challenges and the personal choice of patients.
HCPs must incorporate a glucose-centric approach when initiating and advancing noninsulin therapies in order to maximize efficacy, safety, tolerability, and adherence. We must engage patients and involve them as partners in shared decision making. Merging the science of the medications along with realistic preferences of patients solidifies a better provider-patient relationship that will increase the likelihood of meeting glycemic goals and preventing diabetes-related complications and burdens.
REFERENCES
1. American Diabetes Association. Standards of medical care in diabetes—2015. Diabetes Care. 2015:38(suppl 1):1-99.
2. Handelsman Y, Bloomgarden ZT, Grunberger G, et al. American Association of Clinical Endocrinologists and American College of Endocrinology: clinical practice guidelines for developing a diabetes mellitus comprehensive care plan—2015. Endocr Pract. 2015;21(suppl 1):1-87.
3. International Diabetes Federation. Guideline: self-monitoring of blood glucose in non–insulin treated type 2 diabetes (2009). www.idf.org/guidelines/self-monitoring. Accessed November 24, 2015.
4. Monnier L, Lapinski H, Colette C. Contributions of fasting and postprandial plasma glucose increments to the overall diurnal hyperglycemia of type 2 diabetic patients: variations with increasing levels of HbA(1c). Diabetes Care. 2003;26(3):881-885.
5. Parkin CG, Hinnen D, Campbell RK, et al. Effective use of paired testing in type 2 diabetes: practical applications in clinical practice. Diabetes Educ. 2009;35(6):915-927.
6. Ismail-Beigi F, Moghissi E, Tiktin M, et al. Individualizing glycemic targets in type 2 diabetes mellitus: implications of recent clinical trials. Ann Intern Med. 2011;154(8):554-559.
7. FDA. Drugs@FDA: FDA approved drug products. www.accessdata.fda.gov/scripts/cder/drugsatfda/index.cfm. Accessed November 20, 2015.
8. Gerich J, Raskin P, Jean-Louis L, et al. PRESERVE-beta: two-year efficacy and safety of initial combination therapy with nateglinide or glyburide plus metformin. Diabetes Care. 2005;28(9):2093-2099.
9. Kahn SE, Haffner SM, Heise MA, et al; ADOPT Study Group. Glycemic durability of rosiglitazone, metformin, or glyburide monotherapy [erratum in N Engl J Med. 2007 Mar 29;356(13):1387-1388]. N Engl J Med. 2006; 355(23):2427-2443.
IN THIS ARTICLE
• Fasting versus postprandial glucose contribution to A1C
• General glycemic targets for individuals with T2DM
• Sonja's blood glucose log
• Glycemic impact of noninsulin agents available for T2DM
• Considerations when determining glycemic targets
“… Our ability to help others is a source of pride and satisfaction; however, if we listen, really listen to our patients, we may discover that they are also experts, problem-solvers, and teachers. If we allow our patients to also be our teachers, we may someday realize that although we began with knowledge, we ended up with wisdom.” — 1,000 Years of Diabetes Wisdom
(Marrero DG et al, eds)
The pharmacotherapeutic options available for the treatment of type 2 diabetes mellitus (T2DM) have expanded exponentially in the past 15 years. Although this is great news, having so many therapeutic options has led to confusion for both patients and health care providers (HCPs) as they consider which agent or combination of agents is most appropriate for glucose management, while also considering efficacy, safety, adverse effects, patient preferences, and cost.
Current expert recommendations and guidelines provide algorithms that assist the HCP with selecting medications based on safety (avoiding hypoglycemia), adverse-effect profile (eg, weight gain), and efficacy (predicted A1C reduction). These same guidelines also recommend that the choice of antihyperglycemic agent(s) be individualized according to the patient’s health status and personal preferences.
True success in diabetes management requires not only the knowledge and expertise of the clinician, but also the active involvement of the patient as a partner in health care decision making.
Continue for patient presentation/history >>
PATIENT PRESENTATION/HISTORY
We will explore a combined glucose-centric/patient-focused approach with our patient, Sonja.
Sonja is a 38-year-old Latina woman who was diagnosed with T2DM one week ago. She was being closely monitored for diabetes due to a strong family history for T2DM (father, two sisters, and several aunts/uncles affected), high-risk ethnicity, and history of gestational diabetes. Two years ago, when she was told she had prediabetes, she attempted to make appropriate therapeutic lifestyle changes.
Sonja is significantly overweight, with a BMI (29) bordering on obesity. She is inconsistent in her approach to exercise, and her long working hours as a dentist have contributed to a sedentary lifestyle. However, she made a concerted effort to change her diet and successfully lost 18 lb in the past year. Unfortunately, she then experienced considerable stress in her personal life and regained the weight, plus an additional 6 lb.
She presents today to review recent laboratory test results, which include a fasting glucose of 133 mg/dL; serum creatinine (SCr), 1.0 mg/dL; estimated glomerular filtration rate (eGFR), 103 mL/min; A1C, 7.2%; and aspartate transaminase/alanine transaminase (AST/ALT), normal. Sonja says she feels “defeated, frustrated, and helpless” in her attempt to control her weight and thus her inability to avoid T2DM. Fortunately, she wants to change and is determined to do whatever is necessary.
Continue for treatment/management >>
TREATMENT/MANAGEMENT
Current guidelines from the American Diabetes Association/European Association for the Study of Diabetes (ADA/EASD) and the American Association of Clinical Endocrinologists (AACE) advise that in addition to a therapeutic lifestyle (adequate physical activity, healthy diet, and weight control), metformin is the drug of choice and is recommended as firstline therapy.1,2
The many available pharmacologic options can make the choice of agents after metformin use an overwhelming task, especially if the HCP has limited experience with them. The 2015 ADA/EASD and AACE algorithms help guide decision making by prioritizing the medications according to efficacy, safety, and adverse-effect profiles.1,2
Emphasis is placed on choosing medications that have low potential for hypoglycemia and, if possible, avoiding medications that may cause weight gain. Additionally, HCPs must take into account patient concerns about adverse effects, convenience/ease of use, mode of administration, and cost. Engaging patients about what is important to them and addressing their beliefs, desires, and fears are key components of individualizing therapy and are essential for successful treatment outcomes.
While Sonja’s current labs suggest that she would be an appropriate candidate for metformin, the drug’s known potential for gastrointestinal (GI) adverse effects is concerning because of Sonja’s underlying history of diarrhea-dominant irritable bowel syndrome (IBS). She remarks that while her IBS is currently controlled, she is wary of developing problems. You respond that extended-release metformin is generally better tolerated than the immediate-release preparations, but it may cost more. She considers this and is willing to try the extended-release option; you instruct her to increase her dose by one 500-mg tablet every week, as tolerated, to reduce the risk for intolerance.
You also discuss blood-glucose testing with her. While she is not taking a medication that will cause hypoglycemia, you explain that structured self-monitoring of blood glucose (SMBG) will provide her immediate feedback about the effects of her lifestyle changes, as well as the effect of the medication, on her blood sugar control.3 Her A1C of 7.2% suggests postprandial glucose (PPG) as a significant contributing factor; thus, it would be beneficial to measure this value regularly (see Figure 14).
You show Sonja the AACE and ADA therapeutic blood glucose parameters required for optimal glucose control so she can see the impact of her efforts (see Table 11,2). She is willing to test her blood sugar twice daily and agrees to test before and then two hours after a different meal each day (this is known as paired testing).5
Sonja returns two weeks later with her blood glucose log for review (see Figure 2). She is pleased with her improved glucose values but has been unable to exceed 1,000 mg/d due to frequent daytime diarrhea that interferes with work. She requests a change of medication.
Continue for therapeutic considerations >>
THERAPEUTIC CONSIDERATIONS
Glucose-centric
Sonja’s glucose log demonstrates that her blood glucose values are at target with her current dose of extended-release metformin. Based on her glucose patterns and A1C, an agent of choice would be one that best directs its action on postprandial hyperglycemia. Fortunately, at this point in Sonja’s disease state, she should be able to achieve an A1C of < 7% with any of the noninsulin options.
However, when applying the glucose-centric approach, the proper course should be to use an agent that best addresses postprandial hyperglycemia. These agents include glucagon-like peptide 1 receptor agonists (GLP-1RA), dipeptidyl peptidase-4 inhibitors (DPP4i), sulfonylureas (SU), glinide, and α-glucosidase inhibitors (AGI) (see Table 2). Other agents would be less effective in addressing PPG.
Patient-focused
Since Sonja is young, has new-onset T2DM, is otherwise healthy, and has no overt complications from diabetes, her A1C goal should be < 6.5% and perhaps even < 6%, while minimizing the risk for hypoglycemia (see Table 3). However, she continues to be concerned with taking medications associated with any GI-related adverse effects.
The following are discussion points for Sonja regarding the agents approved as monotherapy or as monotherapy when metformin is contraindicated or not tolerated. Although all these classes have potential adverse effects, only GI intolerance and possibility for weight gain are covered here, since these directly pertain to Sonja’s choice of agent.
GLP-1RA (exenatide, liraglutide, exenatide extended-release, albiglutide, dulaglutide).7 This class, along with DPP4i, is also referred to as the incretins. The GLP-1RAs predominately target postprandial hyperglycemia and, to a lesser degree, fasting hyperglycemia—especially when used with the daily options of exenatide and/or liraglutide. The once-weekly options (exenatide extended-release, albiglutide, dulaglutide) have beneficial effects on both fasting and postprandial hyperglycemia.
Though GLP-1RAs are typically well tolerated, the most common associated adverse effects are nausea, which usually resolves in several weeks, and vomiting, which occurs infrequently. The GLP-1RAs are also one of two classes of diabetes medications associated with modest weight loss (the other is sodium glucose cotransporter-2 inhibitors [SGLT2i], to be discussed shortly). An additional benefit of GLP-1RA agents is that they are not associated with hypoglycemia, since they exert their effect in a glucose-dependent manner (ie, only when blood sugar is increased).
While Sonja is not averse to using an injectable agent, she is extremely hesitant to use any agent that may cause GI upset.
DPP4i (sitagliptin, saxagliptin, linagliptin, alogliptin).7 As previously stated, these are in the incretin class along with the GLP-1RAs. They help maintain physiologic levels of endogenous GLP-1, compared with the nearly eightfold pharmacologic level of GLP-1 from the injectable GLP-1RA. DPP4i agents are a physiologically appropriate choice for Sonja, because their effect is primarily on postprandial hyperglycemia. Since these medications also function in a glucose-dependent manner, they are not associated with hypoglycemia.
You explain to Sonja that while the DPP4i agents have a very low GI adverse-effect profile (compared with GLP-1RAs), they are not associated with weight loss but are considered weight neutral.
SU (glyburide, glipizide, glimepiride) and glinides (nateglinide, repaglinide).7 The SU class has a much longer half-life than the glinides and as a result affects both fasting glucose and PPG. The quicker-acting glinides improve PPG extremely well. However, because of the short duration of action, they must be dosed before each meal and sometimes before snacks as well. Since both of these classes stimulate insulin production, they carry a risk for hypoglycemia, but less than for the glinides.8
These agents are generally well tolerated, have a low GI adverse-effect profile, and can be associated with modest weight gain. But the risk for hypoglycemia means they may not be the optimal choice for Sonja.
SGLT2i (canagliflozin, dapagliflozin, empagliflozin).7 The mechanism of action for this class is rather unique in that it reduces re-absorption of glucose by the kidneys, resulting in increased urinary glucose output (glycosuria). This class has been shown to demonstrate modest weight loss. Since increased insulin secretion is not an effect of this class, it carries a very low risk for hypoglycemia.
While SGLT2i medications have a low GI adverse-effect profile, Sonja should be alerted to the associated increased urination, as it may impact her busy work schedule caring for patients.
TZD (rosiglitazone, pioglitazone).7 This is the most effective class for addressing insulin resistance, the key physiologic defect in T2DM. TZD is the only class that has demonstrated long-term A1C reductions (> 5 y).9 The drugs in this class are not associated with hypoglycemia and have a low GI adverse-effect profile. The most common adverse effects are weight gain and fluid retention, which are even more commonly observed in patients also taking insulin. Additionally, there is concern about increased risk for atypical fractures in women, particularly postmenopausal women.
Sonja should be made aware of this potential risk during her postmenopausal years, should she use one of these agents long-term. Currently, however, this would still be a viable option for her since she is early in the course of her disease and likely still has fairly good β-cell function.
AGI (acarbose, miglitol).7 This class is a good choice for directing therapy at postprandial elevations without hypoglycemia and is weight-neutral. Unfortunately, use of these agents has fallen out of favor since they are associated with significant GI adverse effects (ie, bloating, flatulence) and require multiple daily doses, with specific timing before each meal.
Insulin. Insulin is always an option for patients with diabetes, and it is the most effective and natural agent available. However, Sonja’s A1C and glucose pattern—consisting of mild postprandial elevations and near-target fasting glucose—suggest that she does not yet require this medication. Additionally, the risks for hypoglycemia and weight gain make this choice less desirable when other effective therapies are available.
After you have spent time discussing feasible options with Sonja, she decides that she would like to try a DPP4i. You agree and support her decision.
In your discussion, you also reiterate that T2DM is a progressive disease and that Sonja will likely need to use additional agents, possibly even insulin, in the years to come. You encourage her to strive for ongoing good dietary habits, exercise, and weight loss/maintenance, as these measures can lengthen the time before additional diabetes agents are needed.
To assist her with achieving these goals, you refer Sonja to a certified diabetes educator (CDE). The CDE, an integral member of the diabetes management team, will partner with Sonja to develop a plan to successfully implement these necessary lifestyle modifications.
Continue for the conclusion >>
CONCLUSION
Metformin is safe, efficacious, and recommended as a firstline therapy. However, even the best and most effective medication is no good if not taken. Adverse effects, convenience, fears—as perceived by the patient—will ultimately determine treatment success. Therefore, it is often necessary and appropriate to consider other agents in order to meet both the glycemic challenges and the personal choice of patients.
HCPs must incorporate a glucose-centric approach when initiating and advancing noninsulin therapies in order to maximize efficacy, safety, tolerability, and adherence. We must engage patients and involve them as partners in shared decision making. Merging the science of the medications along with realistic preferences of patients solidifies a better provider-patient relationship that will increase the likelihood of meeting glycemic goals and preventing diabetes-related complications and burdens.
REFERENCES
1. American Diabetes Association. Standards of medical care in diabetes—2015. Diabetes Care. 2015:38(suppl 1):1-99.
2. Handelsman Y, Bloomgarden ZT, Grunberger G, et al. American Association of Clinical Endocrinologists and American College of Endocrinology: clinical practice guidelines for developing a diabetes mellitus comprehensive care plan—2015. Endocr Pract. 2015;21(suppl 1):1-87.
3. International Diabetes Federation. Guideline: self-monitoring of blood glucose in non–insulin treated type 2 diabetes (2009). www.idf.org/guidelines/self-monitoring. Accessed November 24, 2015.
4. Monnier L, Lapinski H, Colette C. Contributions of fasting and postprandial plasma glucose increments to the overall diurnal hyperglycemia of type 2 diabetic patients: variations with increasing levels of HbA(1c). Diabetes Care. 2003;26(3):881-885.
5. Parkin CG, Hinnen D, Campbell RK, et al. Effective use of paired testing in type 2 diabetes: practical applications in clinical practice. Diabetes Educ. 2009;35(6):915-927.
6. Ismail-Beigi F, Moghissi E, Tiktin M, et al. Individualizing glycemic targets in type 2 diabetes mellitus: implications of recent clinical trials. Ann Intern Med. 2011;154(8):554-559.
7. FDA. Drugs@FDA: FDA approved drug products. www.accessdata.fda.gov/scripts/cder/drugsatfda/index.cfm. Accessed November 20, 2015.
8. Gerich J, Raskin P, Jean-Louis L, et al. PRESERVE-beta: two-year efficacy and safety of initial combination therapy with nateglinide or glyburide plus metformin. Diabetes Care. 2005;28(9):2093-2099.
9. Kahn SE, Haffner SM, Heise MA, et al; ADOPT Study Group. Glycemic durability of rosiglitazone, metformin, or glyburide monotherapy [erratum in N Engl J Med. 2007 Mar 29;356(13):1387-1388]. N Engl J Med. 2006; 355(23):2427-2443.
Orthopedics in US Health Care
In the United States, the landscape of health care is changing. Health care reform and fluctuating political and economic climates have affected and will continue to affect the practice of orthopedic surgery. Demand for musculoskeletal care and the costs of providing this care are exceeding available resources—which has led to an evolution in how we practice as individuals and in the institutions where we provide care. Patient safety, quality, and value have become the outcomes of importance. Orthopedic surgeons, as experts in musculoskeletal care, must be a part of these changes. In this review, we offer perspective on the changing face of orthopedic surgery in the modern US health care system.
1. Meeting the demand
Musculoskeletal conditions represent one of the most common and costly health issues in the United States, affecting individuals medically and economically and compromising their quality of life.1,2 In 2008, more than 110 million US adults (1 in 2) reported having a musculoskeletal condition for more than 3 months, and almost 7% reported that a chronic musculoskeletal condition made routine activities of daily living significantly difficult.1 Overall, in the United States, some of the most common chronic conditions are musculoskeletal in origin. These conditions include osteoarthritis and back pain.
Osteoarthritis is the leading cause of chronic pain and disability. Physician-diagnosed arthritis is expected to affect 25% of US adults by 2030,3 and in more than one-third of these patients arthritis limits work or other activity.4 Back pain is another of the most common debilitating conditions in the United States.3,5 St Sauver and colleagues6 found that back pain is the third most common condition (23.9%) that prompts patients to seek health care—following skin-related problems (42.7%) and osteoarthritis/joint pain (33.6%).
As life expectancy increases, so do expectations of enjoying higher levels of activity into the later years. Patients expect to be as active in their geriatric years as they were in middle age, and many are able to do so. Amid the growing obesity epidemic and increased incidence of chronic comorbidities, however, the aging population not only is at substantial risk for developing a chronic musculoskeletal disorder but may face new challenges in accessing care.
Although orthopedic surgeons specialize in treating musculoskeletal conditions, up to 90% of common nonsurgical musculoskeletal complaints are thought to be manageable in the primary care setting.7 With a disproportionate increase in musculoskeletal demand against a relatively constant number of orthopedic providers,8 it is becoming increasingly important for nonorthopedists to adequately manage musculoskeletal conditions. Physiatrists, rheumatologists, internists, family practitioners, and the expanding field of sports medicine specialists provide primary care of musculoskeletal conditions. To meet the growing demand and to ensure that patients receive quality, sustainable, effective, and efficient care, orthopedic surgeons should be actively involved in training these providers. As high as the cost of managing musculoskeletal conditions can be, it is far less than the cost resulting from inadequate or improper management. There is already justification for formal development of a specialization in nonoperative management of musculoskeletal care. Establishing this specialization requires a multidisciplinary approach, with orthopedic surgery taking a lead role.
2. The cost equation
As the prevalence of orthopedic conditions increases, so does the cost of delivering musculoskeletal care. The economic implications of meeting this growing demand are an important area of concern for our health care system. Steadily increasing hospital expenses for personnel and services, rising costs of pharmaceuticals and laboratory tests, constant evolution of costly technology, and insurance/reimbursement rates that do not keep pace with rising costs all contribute to the rapid escalation of the “cost of care.”
Health care expenditures accounted for 17.2% of the US gross domestic product (GDP) in 2012 and are expected to represent 19.3% by 2023.9 For musculoskeletal disease, direct costs alone are expected to approach $510 billion, equaling 5% of GDP and representing almost 30% of all health care expenditures. In Medicare patients, osteoarthritis is the most expensive condition to treat overall, and 3 other musculoskeletal problems rank highly as well: femoral neck fractures (3rd), back pain (10th), and fractures of all types (16th).10 Clearly, musculoskeletal care is one of the most prevalent and expensive health conditions in the United States.
Part of the direct costs of care that consistently increase each year are the steadily increasing costs of technology, which is often considered synonymous with orthopedic care. Promotion of new and more costly implants is common in the absence of evidence supporting their use. However, use of new implants and technology is being scrutinized in an effort to strike the proper cost–benefit balance.
To change the slope of the cost curve, orthopedic surgeons should utilize technological advances that are proven to be clinically significant and economically feasible and should avoid modest improvements with limited clinical benefit and higher price tags. Unfortunately, this approach is not being taken. Minor modifications of implant designs are often marketed as “new and improved” to justify increased costs, and these implants often gain widespread use. A few may prove to be clinically better, but most will be only comparable to older, less expensive designs, and some may end up being clinical failures, discovered at great cost to patients and the health care system.11,12
Orthopedic surgeons have an important role in this decision-making. We should strive for the best, most cost-effective outcomes for our patients. We should reject new technology that does not clearly improve outcomes. At the least, we should use the technology in a manufacturer-supported clinical trial to determine its superiority. Whether the improvement is in technique, implant design, or workflow efficiency, orthopedic surgeons must be actively involved in researching and developing the latest innovations and must help determine their prospective value by considering not only their potential clinical benefits but also their economic implications.
As the political and economic environment becomes more directed at the cost-containment and sustainability of care, there has been a clear shift in focus to quality and value rather than volume, giving rise to the “value-based care” approach. The “value equation,” in which value equals quality divided by cost, requires a clear measure of outcomes and an equally clear understanding of costs. Delivering high-quality care in a cost-conscious environment is an approach that every orthopedic surgeon should adopt. Widespread adoption of the value-based strategy by hospital systems and insurance companies is resulting in a paradigm shift away from more traditional volume-based metrics and in favor of value-based metrics, including quality measures, patient-reported outcomes, Hospital Consumer Assessment of Healthcare Providers and Systems, and physician-specific outcome measures.
The new paradigm has brought the bundled payment initiative (BPI), a strategy included in the Patient Protection and Affordable Care Act. The philosophy behind the BPI model is for hospital systems and physicians to control costs while maintaining and improving the quality of care. Measured by patient metrics (eg, clinical outcomes, patient satisfaction) and hospital metrics (eg, readmission rates, cost of care), bundled payments reimburse hospitals on the basis of cost of an entire episode of care rather than on the basis of individual procedures and services. This approach provides incentives for both physicians and hospitals to promote value-based care while emphasizing coordination of care among all members of the health care team.
Providing the best possible care for our patients while holding our practice to the highest standards is a central tenet of the practice of orthopedic surgery and should be independent of reimbursement strategies. Thus, to increase the value of care, we must establish practice models and strategies to optimize cost-efficiency while improving outcomes. As explained by Porter and Teisberg,13 it is important to be conscientious about cost, but above all we must not allow quality of health care delivery to be compromised when trying to improve the “value” of care. Through evidence-based management and a clear understanding of costs, we must develop cost-efficient practice models that sustainably deliver the highest value of care.
3. Evolving practice models
As the health care landscape continues to change, physician practice models evolve accordingly. Although the private practice model once dominated the physician workforce, this is no longer true, as there has been a significant shift to employer-based practice models. The multiple factors at work relate to changing patterns of reimbursement, increasing government regulations, and a general change in recent residency graduates’ expectations regarding work–life balance. Other catalysts are the shift from volume- to value-based care and the recognition that cost-effective health care is more easily achieved when physicians and their institutions are in alignment. Ultimately, physician–institution alignment is crucial in improving care and outcomes.
Physician–institution alignment requires further discussion. Ideally, it should strike the proper balance between physician autonomy and institutional priorities to ensure the highest quality care. Physicians and their institutions should align their interests in terms of patient safety, quality, and economics to create a work environment conducive to both patient/physician satisfaction and institutional success.14 As identified by Page and colleagues,15 the primary drivers of physician–institution alignment, specific to orthopedic surgery, are economic, regulatory, and cultural. In economics, implant selection and ancillary services are the important issues; in the regulatory area, cooperative efforts to address expanding state and federal requirements are needed; last, the primary cultural driver is delivery of care to an expanding, diverse patient population.
Physician–institution alignment brings opportunities for “gainsharing,” which can directly benefit individual physicians, physician groups, and departments. Gainsharing is classically defined as “arrangements in which a hospital gives physicians a percentage share of any reduction in the hospital’s costs for patient care attributable in part to the physicians’ efforts.”16 Modern gainsharing programs can be used by institutions to align the economic interests of physicians and hospitals, with the ultimate goal being to achieve a sustainable increase in the value and quality of care delivered to patients.13 Examples include efforts to reduce the cost of orthopedic implants, which is a major cost driver in orthopedic surgery. Our institution realized significant savings when surgeons were directly involved in the implant contracting process with strategic sourcing personnel. These savings were shared with the department to enhance research and education programs. BPI, a risk-sharing program in which Medicare and hospitals participate, incorporates gainsharing opportunities in which each participating physician can receive up to 50% of his or her previous Medicare billings when specific targets are achieved. BPI included 27 musculoskeletal diagnosis–related groups that could be developed into a bundled payment proposal. Our institution participated in a 90-day episode, for primary hip and knee arthroplasty and non–cervical spine fusion, that had very promising results.
Gainsharing offers physicians incentives to meet institution goals of improved outcomes and increased patient satisfaction while increasing oversight and accountability. When physician-specific outcomes do not meet the established goals in key areas (readmissions, thromboembolic complications, infections), it is only logical that steps will be taken to improve outcomes. Although physicians may not be used to this increased scrutiny, the goal of improving outcomes, even if it necessitates a change in an established approach to care, should be welcomed.
Physicians should be rewarded for good outcomes but not suboptimal outcomes. When outcomes are suboptimal, physicians should take a constructive approach to improve them. On the other hand, not being rewarded for unachieved goals can be perceived as being penalized. Additional monitoring may paradoxically lead physicians to avoid more “complex” cases, such as those of patients at higher risk for complications and poorer outcomes. An example is found in patient selection for surgery, in which issues like obesity, diabetes, and heart disease are known to negatively affect outcomes. In these models, “cherry-picking” is a well-recognized risk17,18 that can compromise our ethical obligation to provide equal access for all patients. To offset this tendency, we should use a risk-stratification model in which all patients are not considered equal in the risks they present. A risk-adjustment approach benefits both patients and providers by identifying modifiable risk factors that can be addressed to positively affect outcomes. This risk-stratification approach further incentivizes the orthopedist to closely work with other health care providers to address the medical comorbidities that may negatively affect surgical outcomes.
4. Patient and physician expectations
Living in a technology-driven society in the age of information has had a major impact on patients’ attitudes and expectations about their care—and therefore on physicians’ practice methods. It is uncommon to evaluate a patient who has not already consulted the Internet about a problem. Patients now have much more information they can use to make decisions about their treatment, and, though many question the accuracy of Internet information, there is no argument that being more informed is beneficial. In this time of shared decision-making, it is absolutely essential that patients keep themselves informed.
It is crucial to align the expectations of both physicians and patients in order to achieve the best outcomes. Gaining a clear understanding of treatment goals, management, and potential complications consistently leads to improved patient satisfaction, more favorable clinical outcomes, and reduced risk of litigation.19-22 Addressing patient concerns and expectations is significantly enhanced by a strong patient–physician relationship through clinical models focused on patient-centered care.
Now considered a standard of care, the patient-centered model has changed the way we practice. The foundation of the patient-centered approach is to strengthen the patient–physician relationship by empowering patients to become active decision-makers in the management of their own health. The role of orthopedists in this model is to provide patients with information and insight into their conditions in order to facilitate shared decision-making. Our role should be to guide patients to make educated and informed decisions. Doing so enhances communication, thereby strengthening the patient–physician relationship, and places both patient and physician expectations in perspective. Patient-reported outcomes, satisfaction rates, symptomatic burdens, and costs of care are all positively correlated with strong communication and realistic expectations achieved through a patient-centered approach.21,23
The evolution of clinical practice has been influenced by factors ranging from external forces (eg, changing political and economic climates) to social trends (use of social media and the Internet). Technology has been a driving force in our rapidly changing clinical environment, significantly altering the way we practice. Although we must be careful in how we use it, new technology can certainly work to our advantage. We have a plethora of medical information at our fingertips, and, with physician-directed guidance, our patients can become more informed than ever before. This is the principle of patient-centered medicine and shared decision-making, and its utility will only increase in importance.
5. The role of advocacy
The central tenet of orthopedic practice has always been a focus on patients. We continually strive to improve patient outcomes, reduce costs, and work efficiently in our practices and facilities. Although we can focus on our individual practices, we cannot ignore the influence and impact of the political system on our performance. Federal and state regulations give physicians and insurance companies an uneven playing field. This imbalance requires that physicians be more active in health care policymaking and advocacy. Although we are more involved than ever before, our influence is far less than what we would like it to be, perhaps partly because of the nature of the political process but perhaps also because of physicians’ resistance to becoming involved.
As experts in the treatment of musculoskeletal conditions, we should be at the forefront of health care policy development—a position we have not been able to attain. Although many factors contribute to our lack of a “seat at the table,” we must recognize our reluctance as a group to support advocacy, either financially or through personal time commitment. The American Association of Orthopaedic Surgeons (AAOS) Orthopaedic Political Action Committee has never been able to obtain donations from more than 30% of AAOS members. Although this committee historically has been successful, we could be much more so if we had financial support from 90% of members. There are many ways to be actively involved in advocacy. One way is to join local and state orthopedic societies and support their advocacy efforts. State orthopedic societies work closely with the AAOS Office of Government Relations to coordinate advocacy and direct efforts and resources to areas of greatest need. Knowing local congressional representatives and communicating with them about issues we face in our practices make our issues “real.” Some of our colleagues have even successfully run for office in Congress, and they certainly deserve our support. Advocacy will absolutely play an increasingly important role as federal and state governments expand their involvement in health care. Our role should be to get involved, at least to some degree. We need to recognize that our strength is in our numbers, as the few cannot accomplish nearly as much as the many.
Summary
Orthopedic surgeons are practicing in the midst of almost constant change—evolving patient care, shifts in employment models, advances in technology, modern patient expectations, and an increasingly complex regulatory environment. Even in this context, however, our goal remains unchanged: to give our patients the highest-quality care possible. Our core values as orthopedic surgeons and physicians are dedication, commitment, and service to patients and to our profession. As US health care continues to evolve, we must evolve as well, with an emphasis on expanding our role in the health care policy debate.
1. US Bone and Joint Initiative. Burden of Musculoskeletal Diseases in the United States: Prevalence, Societal, and Economic Cost. Rosemont, IL: US Bone and Joint Initiative; 2008. http://www.boneandjointburden.org. Accessed October 26, 2015.
2. US Bone and Joint Initiative. Burden of Musculoskeletal Diseases in the United States: Prevalence, Societal, and Economic Cost. 2nd ed. Rosemont, IL: US Bone and Joint Initiative; 2011. http://www.boneandjointburden.org. Accessed October 26, 2015.
3. Ma VY, Chan L, Carruthers KJ. Incidence, prevalence, costs, and impact on disability of common conditions requiring rehabilitation in the United States: stroke, spinal cord injury, traumatic brain injury, multiple sclerosis, osteoarthritis, rheumatoid arthritis, limb loss, and back pain. Arch Phys Med Rehabil. 2014;95(5):986-995.e1.
4. Hootman JM, Helmick CG. Projections of US prevalence of arthritis and associated activity limitations. Arthritis Rheum. 2006;54(1):226-229.
5. Freburger JK, Holmes GM, Agans RP, et al. The rising prevalence of chronic low back pain. Arch Intern Med. 2009;169(3):251-258.
6. St Sauver JL, Warner DO, Yawn BP, et al. Why patients visit their doctors: assessing the most prevalent conditions in a defined American population. Mayo Clin Proc. 2013;88(1):56-67.
7. Anderson BC. Office Orthopedics for Primary Care: Diagnosis and Treatment. 2nd ed. Philadelphia, PA: Saunders; 1999.
8. American Academy of Orthopaedic Surgeons, Department of Research and Scientific Affairs. Orthopaedic Practice in the U.S. 2012 [2012 Orthopaedic Surgeon Census Report]. Rosemont, IL: American Academy of Orthopaedic Surgeons; January 2013.
9. US Department of Health and Human Services, Centers for Medicare & Medicaid Services, Office of the Actuary, National Health Statistics Group. NHE [National Health Expenditure] Fact Sheet, 2014. Centers for Medicare & Medicaid Services website. http://www.cms.gov/Research-Statistics-Data-and-Systems/Statistics-Trends-and-Reports/NationalHealthExpendData/NHE-Fact-Sheet.html. Updated July 28, 2015. Accessed October 26, 2015.
10. Cutler DM, Ghosh K. The potential for cost savings through bundled episode payments. N Engl J Med. 2012;366(12):1075-1077.
11. Langton DJ, Jameson SS, Joyce TJ, Hallab NJ, Natu S, Nargol AV. Early failure of metal-on-metal bearings in hip resurfacing and large-diameter total hip replacement: a consequence of excess wear. J Bone Joint Surg Br. 2010;92(1):38-46.
12. Dahlstrand H, Stark A, Anissian L, Hailer NP. Elevated serum concentrations of cobalt, chromium, nickel, and manganese after metal-on-metal alloarthroplasty of the hip: a prospective randomized study. J Arthroplasty. 2009;24(6):837-845.
13. Porter ME, Teisberg EO. Redefining Health Care: Creating Value-Based Competition on Results. Boston, MA: Harvard Business School Press; 2006.
14. American Association of Orthopaedic Surgeons. Alignment of physician and facility payment and incentives. Position statement 1171. American Association of Orthopaedic Surgeons website. http://www.aaos.org/about/papers/position/1171.asp. Published September 2006. Revised February 2009. Accessed October 26, 2015.
15. Page AE, Butler CA, Bozic KJ. Factors driving physician–hospital alignment in orthopaedic surgery. Clin Orthop Relat Res. 2013;471(6):1809-1817.
16. US Department of Health and Human Services, Office of Inspector General. Gainsharing arrangements and CMPs for hospital payments to physicians to reduce or limit services to beneficiaries [special advisory bulletin]. Office of Inspector General website. http://oig.hhs.gov/fraud/docs/alertsandbulletins/gainsh.htm. Published July 1999. Accessed October 26, 2015.
17. Bronson WH, Fewer M, Godlewski K, et al. The ethics of patient risk modification prior to elective joint replacement surgery. J Bone Joint Surg Am. 2014;96(13):e113.
18. Bosco J. To cherry pick or not: the unintended ethical consequences of pay for performance. Presented at: New York University Colloquium on Medical Ethics; New York, NY; November 2014.
19. Hageman MG, Briët JP, Bossen JK, Blok RD, Ring DC, Vranceanu AM. Do previsit expectations correlate with satisfaction of new patients presenting for evaluation with an orthopaedic surgical practice? Clin Orthop Relat Res. 2015;473(2):716-721.
20. Jourdan C, Poiraudeau S, Descamps S, et al. Comparison of patient and surgeon expectations of total hip arthroplasty. PLoS One. 2012;7(1):e30195.
21. McMillan S, Kendall E, Sav A, et al. Patient-centered approaches to health care: a systematic review of randomized controlled trials. Med Care Res Rev. 2013;70(6):567-596.
22. Forster HP, Schwartz J, DeRenzo E. Reducing legal risk by practicing patient-centered medicine. Arch Intern Med. 2002;162(11):1217-1219.
23. Van Citters AD, Fahlman C, Goldmann DA, et al. Developing a pathway for high-value, patient-centered total joint arthroplasty. Clin Orthop Relat Res. 2014;472(5):1619-1635.
In the United States, the landscape of health care is changing. Health care reform and fluctuating political and economic climates have affected and will continue to affect the practice of orthopedic surgery. Demand for musculoskeletal care and the costs of providing this care are exceeding available resources—which has led to an evolution in how we practice as individuals and in the institutions where we provide care. Patient safety, quality, and value have become the outcomes of importance. Orthopedic surgeons, as experts in musculoskeletal care, must be a part of these changes. In this review, we offer perspective on the changing face of orthopedic surgery in the modern US health care system.
1. Meeting the demand
Musculoskeletal conditions represent one of the most common and costly health issues in the United States, affecting individuals medically and economically and compromising their quality of life.1,2 In 2008, more than 110 million US adults (1 in 2) reported having a musculoskeletal condition for more than 3 months, and almost 7% reported that a chronic musculoskeletal condition made routine activities of daily living significantly difficult.1 Overall, in the United States, some of the most common chronic conditions are musculoskeletal in origin. These conditions include osteoarthritis and back pain.
Osteoarthritis is the leading cause of chronic pain and disability. Physician-diagnosed arthritis is expected to affect 25% of US adults by 2030,3 and in more than one-third of these patients arthritis limits work or other activity.4 Back pain is another of the most common debilitating conditions in the United States.3,5 St Sauver and colleagues6 found that back pain is the third most common condition (23.9%) that prompts patients to seek health care—following skin-related problems (42.7%) and osteoarthritis/joint pain (33.6%).
As life expectancy increases, so do expectations of enjoying higher levels of activity into the later years. Patients expect to be as active in their geriatric years as they were in middle age, and many are able to do so. Amid the growing obesity epidemic and increased incidence of chronic comorbidities, however, the aging population not only is at substantial risk for developing a chronic musculoskeletal disorder but may face new challenges in accessing care.
Although orthopedic surgeons specialize in treating musculoskeletal conditions, up to 90% of common nonsurgical musculoskeletal complaints are thought to be manageable in the primary care setting.7 With a disproportionate increase in musculoskeletal demand against a relatively constant number of orthopedic providers,8 it is becoming increasingly important for nonorthopedists to adequately manage musculoskeletal conditions. Physiatrists, rheumatologists, internists, family practitioners, and the expanding field of sports medicine specialists provide primary care of musculoskeletal conditions. To meet the growing demand and to ensure that patients receive quality, sustainable, effective, and efficient care, orthopedic surgeons should be actively involved in training these providers. As high as the cost of managing musculoskeletal conditions can be, it is far less than the cost resulting from inadequate or improper management. There is already justification for formal development of a specialization in nonoperative management of musculoskeletal care. Establishing this specialization requires a multidisciplinary approach, with orthopedic surgery taking a lead role.
2. The cost equation
As the prevalence of orthopedic conditions increases, so does the cost of delivering musculoskeletal care. The economic implications of meeting this growing demand are an important area of concern for our health care system. Steadily increasing hospital expenses for personnel and services, rising costs of pharmaceuticals and laboratory tests, constant evolution of costly technology, and insurance/reimbursement rates that do not keep pace with rising costs all contribute to the rapid escalation of the “cost of care.”
Health care expenditures accounted for 17.2% of the US gross domestic product (GDP) in 2012 and are expected to represent 19.3% by 2023.9 For musculoskeletal disease, direct costs alone are expected to approach $510 billion, equaling 5% of GDP and representing almost 30% of all health care expenditures. In Medicare patients, osteoarthritis is the most expensive condition to treat overall, and 3 other musculoskeletal problems rank highly as well: femoral neck fractures (3rd), back pain (10th), and fractures of all types (16th).10 Clearly, musculoskeletal care is one of the most prevalent and expensive health conditions in the United States.
Part of the direct costs of care that consistently increase each year are the steadily increasing costs of technology, which is often considered synonymous with orthopedic care. Promotion of new and more costly implants is common in the absence of evidence supporting their use. However, use of new implants and technology is being scrutinized in an effort to strike the proper cost–benefit balance.
To change the slope of the cost curve, orthopedic surgeons should utilize technological advances that are proven to be clinically significant and economically feasible and should avoid modest improvements with limited clinical benefit and higher price tags. Unfortunately, this approach is not being taken. Minor modifications of implant designs are often marketed as “new and improved” to justify increased costs, and these implants often gain widespread use. A few may prove to be clinically better, but most will be only comparable to older, less expensive designs, and some may end up being clinical failures, discovered at great cost to patients and the health care system.11,12
Orthopedic surgeons have an important role in this decision-making. We should strive for the best, most cost-effective outcomes for our patients. We should reject new technology that does not clearly improve outcomes. At the least, we should use the technology in a manufacturer-supported clinical trial to determine its superiority. Whether the improvement is in technique, implant design, or workflow efficiency, orthopedic surgeons must be actively involved in researching and developing the latest innovations and must help determine their prospective value by considering not only their potential clinical benefits but also their economic implications.
As the political and economic environment becomes more directed at the cost-containment and sustainability of care, there has been a clear shift in focus to quality and value rather than volume, giving rise to the “value-based care” approach. The “value equation,” in which value equals quality divided by cost, requires a clear measure of outcomes and an equally clear understanding of costs. Delivering high-quality care in a cost-conscious environment is an approach that every orthopedic surgeon should adopt. Widespread adoption of the value-based strategy by hospital systems and insurance companies is resulting in a paradigm shift away from more traditional volume-based metrics and in favor of value-based metrics, including quality measures, patient-reported outcomes, Hospital Consumer Assessment of Healthcare Providers and Systems, and physician-specific outcome measures.
The new paradigm has brought the bundled payment initiative (BPI), a strategy included in the Patient Protection and Affordable Care Act. The philosophy behind the BPI model is for hospital systems and physicians to control costs while maintaining and improving the quality of care. Measured by patient metrics (eg, clinical outcomes, patient satisfaction) and hospital metrics (eg, readmission rates, cost of care), bundled payments reimburse hospitals on the basis of cost of an entire episode of care rather than on the basis of individual procedures and services. This approach provides incentives for both physicians and hospitals to promote value-based care while emphasizing coordination of care among all members of the health care team.
Providing the best possible care for our patients while holding our practice to the highest standards is a central tenet of the practice of orthopedic surgery and should be independent of reimbursement strategies. Thus, to increase the value of care, we must establish practice models and strategies to optimize cost-efficiency while improving outcomes. As explained by Porter and Teisberg,13 it is important to be conscientious about cost, but above all we must not allow quality of health care delivery to be compromised when trying to improve the “value” of care. Through evidence-based management and a clear understanding of costs, we must develop cost-efficient practice models that sustainably deliver the highest value of care.
3. Evolving practice models
As the health care landscape continues to change, physician practice models evolve accordingly. Although the private practice model once dominated the physician workforce, this is no longer true, as there has been a significant shift to employer-based practice models. The multiple factors at work relate to changing patterns of reimbursement, increasing government regulations, and a general change in recent residency graduates’ expectations regarding work–life balance. Other catalysts are the shift from volume- to value-based care and the recognition that cost-effective health care is more easily achieved when physicians and their institutions are in alignment. Ultimately, physician–institution alignment is crucial in improving care and outcomes.
Physician–institution alignment requires further discussion. Ideally, it should strike the proper balance between physician autonomy and institutional priorities to ensure the highest quality care. Physicians and their institutions should align their interests in terms of patient safety, quality, and economics to create a work environment conducive to both patient/physician satisfaction and institutional success.14 As identified by Page and colleagues,15 the primary drivers of physician–institution alignment, specific to orthopedic surgery, are economic, regulatory, and cultural. In economics, implant selection and ancillary services are the important issues; in the regulatory area, cooperative efforts to address expanding state and federal requirements are needed; last, the primary cultural driver is delivery of care to an expanding, diverse patient population.
Physician–institution alignment brings opportunities for “gainsharing,” which can directly benefit individual physicians, physician groups, and departments. Gainsharing is classically defined as “arrangements in which a hospital gives physicians a percentage share of any reduction in the hospital’s costs for patient care attributable in part to the physicians’ efforts.”16 Modern gainsharing programs can be used by institutions to align the economic interests of physicians and hospitals, with the ultimate goal being to achieve a sustainable increase in the value and quality of care delivered to patients.13 Examples include efforts to reduce the cost of orthopedic implants, which is a major cost driver in orthopedic surgery. Our institution realized significant savings when surgeons were directly involved in the implant contracting process with strategic sourcing personnel. These savings were shared with the department to enhance research and education programs. BPI, a risk-sharing program in which Medicare and hospitals participate, incorporates gainsharing opportunities in which each participating physician can receive up to 50% of his or her previous Medicare billings when specific targets are achieved. BPI included 27 musculoskeletal diagnosis–related groups that could be developed into a bundled payment proposal. Our institution participated in a 90-day episode, for primary hip and knee arthroplasty and non–cervical spine fusion, that had very promising results.
Gainsharing offers physicians incentives to meet institution goals of improved outcomes and increased patient satisfaction while increasing oversight and accountability. When physician-specific outcomes do not meet the established goals in key areas (readmissions, thromboembolic complications, infections), it is only logical that steps will be taken to improve outcomes. Although physicians may not be used to this increased scrutiny, the goal of improving outcomes, even if it necessitates a change in an established approach to care, should be welcomed.
Physicians should be rewarded for good outcomes but not suboptimal outcomes. When outcomes are suboptimal, physicians should take a constructive approach to improve them. On the other hand, not being rewarded for unachieved goals can be perceived as being penalized. Additional monitoring may paradoxically lead physicians to avoid more “complex” cases, such as those of patients at higher risk for complications and poorer outcomes. An example is found in patient selection for surgery, in which issues like obesity, diabetes, and heart disease are known to negatively affect outcomes. In these models, “cherry-picking” is a well-recognized risk17,18 that can compromise our ethical obligation to provide equal access for all patients. To offset this tendency, we should use a risk-stratification model in which all patients are not considered equal in the risks they present. A risk-adjustment approach benefits both patients and providers by identifying modifiable risk factors that can be addressed to positively affect outcomes. This risk-stratification approach further incentivizes the orthopedist to closely work with other health care providers to address the medical comorbidities that may negatively affect surgical outcomes.
4. Patient and physician expectations
Living in a technology-driven society in the age of information has had a major impact on patients’ attitudes and expectations about their care—and therefore on physicians’ practice methods. It is uncommon to evaluate a patient who has not already consulted the Internet about a problem. Patients now have much more information they can use to make decisions about their treatment, and, though many question the accuracy of Internet information, there is no argument that being more informed is beneficial. In this time of shared decision-making, it is absolutely essential that patients keep themselves informed.
It is crucial to align the expectations of both physicians and patients in order to achieve the best outcomes. Gaining a clear understanding of treatment goals, management, and potential complications consistently leads to improved patient satisfaction, more favorable clinical outcomes, and reduced risk of litigation.19-22 Addressing patient concerns and expectations is significantly enhanced by a strong patient–physician relationship through clinical models focused on patient-centered care.
Now considered a standard of care, the patient-centered model has changed the way we practice. The foundation of the patient-centered approach is to strengthen the patient–physician relationship by empowering patients to become active decision-makers in the management of their own health. The role of orthopedists in this model is to provide patients with information and insight into their conditions in order to facilitate shared decision-making. Our role should be to guide patients to make educated and informed decisions. Doing so enhances communication, thereby strengthening the patient–physician relationship, and places both patient and physician expectations in perspective. Patient-reported outcomes, satisfaction rates, symptomatic burdens, and costs of care are all positively correlated with strong communication and realistic expectations achieved through a patient-centered approach.21,23
The evolution of clinical practice has been influenced by factors ranging from external forces (eg, changing political and economic climates) to social trends (use of social media and the Internet). Technology has been a driving force in our rapidly changing clinical environment, significantly altering the way we practice. Although we must be careful in how we use it, new technology can certainly work to our advantage. We have a plethora of medical information at our fingertips, and, with physician-directed guidance, our patients can become more informed than ever before. This is the principle of patient-centered medicine and shared decision-making, and its utility will only increase in importance.
5. The role of advocacy
The central tenet of orthopedic practice has always been a focus on patients. We continually strive to improve patient outcomes, reduce costs, and work efficiently in our practices and facilities. Although we can focus on our individual practices, we cannot ignore the influence and impact of the political system on our performance. Federal and state regulations give physicians and insurance companies an uneven playing field. This imbalance requires that physicians be more active in health care policymaking and advocacy. Although we are more involved than ever before, our influence is far less than what we would like it to be, perhaps partly because of the nature of the political process but perhaps also because of physicians’ resistance to becoming involved.
As experts in the treatment of musculoskeletal conditions, we should be at the forefront of health care policy development—a position we have not been able to attain. Although many factors contribute to our lack of a “seat at the table,” we must recognize our reluctance as a group to support advocacy, either financially or through personal time commitment. The American Association of Orthopaedic Surgeons (AAOS) Orthopaedic Political Action Committee has never been able to obtain donations from more than 30% of AAOS members. Although this committee historically has been successful, we could be much more so if we had financial support from 90% of members. There are many ways to be actively involved in advocacy. One way is to join local and state orthopedic societies and support their advocacy efforts. State orthopedic societies work closely with the AAOS Office of Government Relations to coordinate advocacy and direct efforts and resources to areas of greatest need. Knowing local congressional representatives and communicating with them about issues we face in our practices make our issues “real.” Some of our colleagues have even successfully run for office in Congress, and they certainly deserve our support. Advocacy will absolutely play an increasingly important role as federal and state governments expand their involvement in health care. Our role should be to get involved, at least to some degree. We need to recognize that our strength is in our numbers, as the few cannot accomplish nearly as much as the many.
Summary
Orthopedic surgeons are practicing in the midst of almost constant change—evolving patient care, shifts in employment models, advances in technology, modern patient expectations, and an increasingly complex regulatory environment. Even in this context, however, our goal remains unchanged: to give our patients the highest-quality care possible. Our core values as orthopedic surgeons and physicians are dedication, commitment, and service to patients and to our profession. As US health care continues to evolve, we must evolve as well, with an emphasis on expanding our role in the health care policy debate.
1. US Bone and Joint Initiative. Burden of Musculoskeletal Diseases in the United States: Prevalence, Societal, and Economic Cost. Rosemont, IL: US Bone and Joint Initiative; 2008. http://www.boneandjointburden.org. Accessed October 26, 2015.
2. US Bone and Joint Initiative. Burden of Musculoskeletal Diseases in the United States: Prevalence, Societal, and Economic Cost. 2nd ed. Rosemont, IL: US Bone and Joint Initiative; 2011. http://www.boneandjointburden.org. Accessed October 26, 2015.
3. Ma VY, Chan L, Carruthers KJ. Incidence, prevalence, costs, and impact on disability of common conditions requiring rehabilitation in the United States: stroke, spinal cord injury, traumatic brain injury, multiple sclerosis, osteoarthritis, rheumatoid arthritis, limb loss, and back pain. Arch Phys Med Rehabil. 2014;95(5):986-995.e1.
4. Hootman JM, Helmick CG. Projections of US prevalence of arthritis and associated activity limitations. Arthritis Rheum. 2006;54(1):226-229.
5. Freburger JK, Holmes GM, Agans RP, et al. The rising prevalence of chronic low back pain. Arch Intern Med. 2009;169(3):251-258.
6. St Sauver JL, Warner DO, Yawn BP, et al. Why patients visit their doctors: assessing the most prevalent conditions in a defined American population. Mayo Clin Proc. 2013;88(1):56-67.
7. Anderson BC. Office Orthopedics for Primary Care: Diagnosis and Treatment. 2nd ed. Philadelphia, PA: Saunders; 1999.
8. American Academy of Orthopaedic Surgeons, Department of Research and Scientific Affairs. Orthopaedic Practice in the U.S. 2012 [2012 Orthopaedic Surgeon Census Report]. Rosemont, IL: American Academy of Orthopaedic Surgeons; January 2013.
9. US Department of Health and Human Services, Centers for Medicare & Medicaid Services, Office of the Actuary, National Health Statistics Group. NHE [National Health Expenditure] Fact Sheet, 2014. Centers for Medicare & Medicaid Services website. http://www.cms.gov/Research-Statistics-Data-and-Systems/Statistics-Trends-and-Reports/NationalHealthExpendData/NHE-Fact-Sheet.html. Updated July 28, 2015. Accessed October 26, 2015.
10. Cutler DM, Ghosh K. The potential for cost savings through bundled episode payments. N Engl J Med. 2012;366(12):1075-1077.
11. Langton DJ, Jameson SS, Joyce TJ, Hallab NJ, Natu S, Nargol AV. Early failure of metal-on-metal bearings in hip resurfacing and large-diameter total hip replacement: a consequence of excess wear. J Bone Joint Surg Br. 2010;92(1):38-46.
12. Dahlstrand H, Stark A, Anissian L, Hailer NP. Elevated serum concentrations of cobalt, chromium, nickel, and manganese after metal-on-metal alloarthroplasty of the hip: a prospective randomized study. J Arthroplasty. 2009;24(6):837-845.
13. Porter ME, Teisberg EO. Redefining Health Care: Creating Value-Based Competition on Results. Boston, MA: Harvard Business School Press; 2006.
14. American Association of Orthopaedic Surgeons. Alignment of physician and facility payment and incentives. Position statement 1171. American Association of Orthopaedic Surgeons website. http://www.aaos.org/about/papers/position/1171.asp. Published September 2006. Revised February 2009. Accessed October 26, 2015.
15. Page AE, Butler CA, Bozic KJ. Factors driving physician–hospital alignment in orthopaedic surgery. Clin Orthop Relat Res. 2013;471(6):1809-1817.
16. US Department of Health and Human Services, Office of Inspector General. Gainsharing arrangements and CMPs for hospital payments to physicians to reduce or limit services to beneficiaries [special advisory bulletin]. Office of Inspector General website. http://oig.hhs.gov/fraud/docs/alertsandbulletins/gainsh.htm. Published July 1999. Accessed October 26, 2015.
17. Bronson WH, Fewer M, Godlewski K, et al. The ethics of patient risk modification prior to elective joint replacement surgery. J Bone Joint Surg Am. 2014;96(13):e113.
18. Bosco J. To cherry pick or not: the unintended ethical consequences of pay for performance. Presented at: New York University Colloquium on Medical Ethics; New York, NY; November 2014.
19. Hageman MG, Briët JP, Bossen JK, Blok RD, Ring DC, Vranceanu AM. Do previsit expectations correlate with satisfaction of new patients presenting for evaluation with an orthopaedic surgical practice? Clin Orthop Relat Res. 2015;473(2):716-721.
20. Jourdan C, Poiraudeau S, Descamps S, et al. Comparison of patient and surgeon expectations of total hip arthroplasty. PLoS One. 2012;7(1):e30195.
21. McMillan S, Kendall E, Sav A, et al. Patient-centered approaches to health care: a systematic review of randomized controlled trials. Med Care Res Rev. 2013;70(6):567-596.
22. Forster HP, Schwartz J, DeRenzo E. Reducing legal risk by practicing patient-centered medicine. Arch Intern Med. 2002;162(11):1217-1219.
23. Van Citters AD, Fahlman C, Goldmann DA, et al. Developing a pathway for high-value, patient-centered total joint arthroplasty. Clin Orthop Relat Res. 2014;472(5):1619-1635.

Osteosarcoma: A Meta-Analysis and Review of the Literature
Osteosarcoma, a primary malignant tumor of the skeleton, is characterized by direct formation of immature bone or osteoid tissue by tumor cells. The World Health Organization histologic classification of bone tumors divides osteosarcoma into central and surface tumors and recognizes a number of subtypes within each group.1 The present review refers only to the classic central high-grade primary osteosarcoma of bone, which represents about 90% of all osteosarcoma cases. Classic osteosarcoma represents about 15% of all biopsy-analyzed primary bone tumors.1 It is the third most common type of neoplasia, preceded by leukemia and lymphoma among older children and adolescents aged 12 to 18 years.2 High-grade primary osteosarcoma is the most common primary skeletal tumor of childhood and adolescence, with an overall annual incidence of 5.6 cases per million children under age 15 years.3-5 Peak incidence is in the second decade of life, and males are affected slightly more often than females.2,6 The period of highest incidence coincides with the growth spurt of the long bones. Osteosarcoma preferentially affects the metaphysis of long bones, the 3 main sites being distal femur, tibia, and proximal humerus.2
Historical Perspective
For most of the 20th century, the 5-year survival rate for classic primary osteosarcoma was under 20%.7 In the 1970s, the first revolution in osteosarcoma treatment arrived with the introduction of adjuvant chemotherapy, which increased survival rates to 50%.8-10 During this expansion of research, several chemotherapeutics (eg, vincristine, bleomycin, dactinomycin) were discarded for poor effectiveness, and others (eg, cisplatin, ifosfamide) were added to doxorubicin and methotrexate, improving 5-year disease-free survival to about 70% in patients with nonmetastatic osteosarcoma. In another significant advance, adjuvant chemotherapy was supplemented with intensive preoperative chemotherapy, resulting in 5-year tumor-free survival that has ranged from 50% to 75% for high-grade osteosarcoma.5,11,12 Adding neoadjuvant chemotherapy and histologic response has allowed for evaluation of surgical margins and early treatment of microscopic disease. Thus, effective limb-sparing procedures can be performed, and the incidence of amputation has decreased from 90% to between 10% and 20%.13,14 However, statistical improvements in survival associated with neoadjuvant treatment may simply delay time of recurrence and metastasis.15 In addition, though chemotherapy has improved survival in osteogenic sarcoma, many have written that this improvement appears to reflect mainly the increase in the intensity of the chemotherapy used, which also leads to a higher propensity for side effects.16
Despite research and advances in chemotherapy regimens, the prognosis of patients with osteosarcoma remains highly variable and often dismal. Mirabello and colleagues17 examined osteosarcoma incidence and survival rates between 1973 and 2004 and found that, with the introduction of neoadjuvant chemotherapy, survival rates improved significantly between 1973 and 1983 and between 1984 and 1993, but there was little improvement between 1993 and 2004.
The long-term outcome for patients with metastatic disease is poor. Investigators have found that 11% to 20% of patients have pulmonary metastasis at initial diagnosis. About half of patients without pulmonary metastases develop them later in the disease course.18 Survival rates for patients with metastasis at initial presentation have ranged from 10% to 40%.19 Recurrent disease still occurs in 30% to 40% of patients, and more than 70% of them die of the tumor.15 The survivors of osteosarcoma are then at increased risk for chronic medical conditions and adverse health status because of the osteosarcoma-related treatments.20
Prognostic Factors
It is important to understand and exploit the influences of different prognostic factors in treating patients with osteosarcoma.7 These factors are important in establishing the best treatment for the individual. Thus, more aggressive treatments can be started in patients with prognostic factors that pose a higher risk of relapse.21 A number of clinical and pathologic features (eg, tumor site, size, subtype; patient sex and age; high alkaline phosphatase or high lactate dehydrogenase [LDH] values; multidrug resistance; genetic variations) have prognostic significance but often with contradictory results because of lack of uniformity in patient analyses and methods.15
Survival for patients with primary osteosarcoma has been analyzed with respect to tumor size and location.7 Studies have found higher survival rates for patients with smaller tumors (<10 cm) and more distal tumor locations.7 These superior survival rates may be the result of earlier detection of tumors and more options for surgical resection of smaller, distal tumors.
Serum LDH levels have helped in risk stratification of patients. High LDH often occurred at time of relapse, and relapse with high LDH correlated with poor prognosis. Meyers and colleagues22 found that 5-year disease-free survival was 72% for patients with normal LDH at presentation and 54% for patients with elevated LDH at presentation.
Several studies have shown that percentage of tumor necrosis on histology is strongly correlated with good prognosis.21 Most groups now define a good histologic response as less than 10% viable tumor cells at time of surgery, and a poor response as more than 10%.23 Results of the Pediatric Oncology Group (POG) protocol for localized osteosarcoma (POG 9351), or Children’s Cancer Group (CCG) 7921, found 45% of patients had favorable responses (>90% necrosis) after preoperative chemotherapy.24 However, several clinicians have recently questioned this finding.
Overall, the prognosis for classic osteosarcoma of the extremity remains highly variable, and there has been little improvement over the past 20 years. The prognosis for younger patients, patients with spinal disease, and patients with metastatic disease remains poor. Although some prognostic factors have been identified and shown to predict a good outcome, it seems few patients have these positive factors. In this article, we describe the literature review and meta-analysis we performed to better define recent survival trends for patients with primary osteosarcoma.
Methods
The MEDLINE, PubMed, and Cochrane databases were searched for eligible studies published in English between 2000 and 2011—a decade of recently reported research. We applied the search strategy [“osteosarcoma” OR “osteogenic sarcoma”] AND [“prognosis” OR “treatment” OR “survival”] and selected reports that specifically addressed factors predicting survival in patients with osteosarcoma—reports that were limited to primary osteosarcoma of the pelvis or extremity and provided 5-year overall survival (OS) data. Abstracts of the selected articles were independently reviewed, and the inclusion and exclusion criteria were applied. We excluded basic science studies and those without pediatric patients, those without primary osteosarcoma, those with periosteal or parosteal osteosarcoma, and those that did not report 5-year OS data.
Statistical Analysis
Number or proportion of patients (whichever was reported) with 5-year OS and number or proportion of patients with 90% necrosis were extracted from each study. For each trial, proportion of patients with 5-year OS and 95% confidence intervals (CIs) and proportion of patients achieving 90% necrosis and 95% CIs were determined. We also calculated proportion of patients with 5-year OS and proportion of patients with 90% necrosis with corresponding 95% CIs of studies that included patients with nonmetastatic disease.
We assessed statistical heterogeneity among trials included in the meta-analysis using the Cochran Q test. Inconsistency was quantified with the I2 statistic, which estimates percentage of total across-studies variation caused by heterogeneity rather than chance.25 We considered I2 higher than 50% as indicating substantial heterogeneity. When substantial heterogeneity was not found, the pooled estimate calculated on the basis of the fixed-effects model was reported using the inverse variance method. When substantial heterogeneity was found, the pooled estimate calculated on the basis of a random-effects model was reported using the DerSimonian and Laird26 method, which takes both within- and between-study variations into account.
Publication bias was assessed through funnel plots and with Begg and Egger tests.27,28 Two-tailed P < .05 was considered statistically significant. All statistical analyses were performed with Stata/SE Version 11.0 (StataCorp).
Results
Our literature search yielded 597 articles. We cross-referenced these articles with the MEDLINE, PubMed, and Cochrane search results using the same keywords and discarded the duplicates. The abstracts of these articles were then reviewed in detail. The 40 articles4,6,11,12,14,15,17-19,21,29-58 that met our study inclusion criteria reported on studies that included patients with metastatic and nonmetastatic osteosarcoma. Because of the significant difference in OS of patients with metastatic disease, we also analyzed articles that included only patients with nonmetastatic disease. Sixteen articles6,14,15,29,32-35,39,47,48,51,53,54,55,57 were included in the analysis of patients with nonmetastatic disease.
Figure 1 shows 5-year OS for each of the 40 studies. For studies that compared survival of different groups of patients, the survival of each group is shown separately. For example, Bacci and colleagues39 divided patients into adolescent and preadolescent groups and reported 5-year OS for each. In our analysis, we treated each group independently and reported their 5-year OS separately. For each study, 5-year OS, weight of study, and CI are included. Five-year OS ranged from 19% to 94%. Analysis was performed to determine 5-year OS for all studies based on weight given to each study. The random-effects model used for this analysis (heterogeneity test, Q = 656.23; P < .001; I2 = 93.4%) showed 5-year OS of 63% (95% CI, 60%-66%) for studies that included patients with metastatic and nonmetastatic osteosarcoma.

Figure 2 shows 5-year OS (range, 53%-94%) for each of the 16 studies that included only patients with nonmetastatic disease. The random-effects model used for this analysis (heterogeneity test, Q = 142.08; P < .001; I2 = 89.4%) showed 5-year OS of 71% (95% CI, 67%-76%) for studies that included only patients with nonmetastatic disease.

We then examined percentage of patients achieving 90% necrosis on histology in each study. Several studies included in the OS analysis did not report percentage necrosis, leaving 29 studies for the necrosis analysis. Of these 29 studies, all 29 included patients with metastatic and nonmetastatic disease,4,6,11,14,15,18,19,21,29,31-36,37,39,40,43-47,49,50,54-57,59 and 13 included only patients with nonmetastatic disease.6,14,15,29,32-35,40,47,54,55,57 Again, because of the known difference in prognosis between patients with metastatic disease and patients with nonmetastatic disease, we performed separate analyses, one for the combined dataset of all 29 studies (Figure 3) and the other for the 13 nonmetastatic studies (Figure 4). Random-effects models showed 90% necrosis for 50% of patients in both analyses: studies that included patients with metastatic and nonmetastatic disease (95% CI, 45%-54%; heterogeneity test, Q = 692.88; P < .001; I2 = 95.5%) and nonmetastatic studies (95% CI, 41%-59%; heterogeneity test, Q = 385.42; P < .001; I2 = 96.9%).
We also performed a meta-regression analysis that included necrosis as a continuous variable for both the overall dataset and the nonmetastatic dataset. Five-year OS was plotted against percentage of patients achieving 90% tumor necrosis for each study. The results are plotted in Figure 5 (combined dataset).

No evidence of publication bias was detected for 5-year OS or percentage necrosis for the analyses of the combined datasets by either Egger test or Begg test. For 5-year OS, Ps were .21 (Egger) and .19 (Begg); for percentage necrosis, Ps were .10 (Egger) and .62 (Begg). In addition, no evidence of publication bias was detected for the analyses of the nonmetastatic studies by either test. For 5-year OS, Ps were .55 (Egger) and .41 (Begg); for percentage necrosis, Ps were .42 (Egger) and .95 (Begg).
Discussion
Five-year OS was 63% (95% CI, 60%-66%) for studies that included patients with metastatic and nonmetastatic osteosarcoma and 71% (95% CI, 67%-76%) for studies that included only patients with nonmetastatic osteosarcoma. These percentages fall within the range found in the literature. Mankin and colleagues37 reviewed 648 cases of patients with osteosarcoma treated at Massachusetts General Hospital in 2004; OS was 68%. In 2011, Sampo and colleagues60 reported 10-year OS of 63% for patients with metastatic and nonmetastatic disease and 73% for patients with local disease at presentation. Five-year OS rates in the literature are consistently about 70%. Ferrari and colleagues61 reported 5-year OS of 73% and 74% for 230 patients treated with 2 different neoadjuvant chemotherapy regimens between 2001 and 2006. The consistency in 5-year OS suggests OS of pediatric patients with osteosarcoma has plateaued, and there has been no significant improvement in survival of patients with osteosarcoma over the past 30 years.
Histologic response to preoperative chemotherapy is strongly associated with survival in pediatric osteosarcoma. Bielack and colleagues31 reported 5-year OS of 75% to 80% for patients who responded well to preoperative chemotherapy (>90% tumor necrosis) and 45% to 55% for patients who responded poorly (<10% necrosis). In our meta-analysis of studies that included patients with nonmetastatic osteosarcoma, 50% achieved necrosis of more than 90%. Percentage of patients achieving necrosis of more than 90% has been about 45%, according to past reports. In 2012, Ferrari and colleagues61 reported that 45% of 230 patients treated with neoadjuvant chemotherapy achieved more than 90% tumor necrosis. Therefore, 5-year OS and percentage of patients achieving 90% necrosis are consistent with previous reports, though this also suggests these numbers have remained constant over the past several decades.
Despite its expansive scale, our study has several important limitations. Data were extracted from published studies, and individual patient data were not available, so we were not able to assess the effects of risk factors (eg, tumor size, location) on 5-year OS. We could not correlate the proportion of patients with 90% necrosis to 5-year OS, as studies did not report OS by necrosis strata. Also, because our numbers were derived from published studies, they may not accurately represent outcomes in the community as a whole. In addition, several successive studies may contain duplicate patient cases. We limited our search to studies published since 2000 to include patients recently diagnosed and treated for osteosarcoma; however, several studies published after 2000 also included patients diagnosed and treated before 2000. Several of these studies are from countries outside the United States and may have a significantly different incidence of osteosarcoma as well as treatment methods and survival rates.
Although this meta-analysis suggests 5-year OS remains about 70% for patients with primary nonmetastatic osteosarcoma, we cannot settle on this conclusion because of the many differences between the studies we included. Therefore, more studies of patients diagnosed and treated within the past 10 years are needed to confirm our beliefs about patient survival.
1. Widhe B, Widhe T. Initial symptoms and clinical features in osteosarcoma and Ewing sarcoma. J Bone Joint Surg Am. 2000;82(5):667-674.
2. Cho WH, Song WS, Jeon DG, et al. Differential presentations, clinical courses, and survivals of osteosarcomas of the proximal humerus over other extremity locations. Ann Surg Oncol. 2010;17(3):702-708.
3. Abate ME, Longhi A, Galletti S, Ferrari S, Bacci G. Non-metastatic osteosarcoma of the extremities in children aged 5 years or younger. Pediatr Blood Cancer. 2010;55(4):652-654.
4. Kager L, Zoubek A, Potschger U, et al. Primary metastatic osteosarcoma: presentation and outcome of patients treated on neoadjuvant Cooperative Osteosarcoma Study Group protocols. J Clin Oncol. 2003;21(10):2011-2018.
5. Pakos EE, Nearchou AD, Grimer RJ, et al. Prognostic factors and outcomes for osteosarcoma: an international collaboration. Eur J Cancer. 2009;45(13):2367-2375.
6. Kaste SC, Liu T, Billups CA, Daw NC, Pratt CB, Meyer WH. Tumor size as a predictor of outcome in pediatric non-metastatic osteosarcoma of the extremity. Pediatr Blood Cancer. 2004;43(7):723-728.
7. Brostrom LA, Strander H, Nilsonne U. Survival in osteosarcoma in relation to tumor size and location. Clin Orthop Relat Res. 1982;167:250-254.
8. Harvei S, Solheim O. The prognosis in osteosarcoma: Norwegian national data. Cancer. 1981;48(8):1719-1723.
9. Sutow WW, Sullivan MP, Fernbach DJ, Cangir A, George SL. Adjuvant chemotherapy in primary treatment of osteogenic sarcoma. A Southwest Oncology Group study. Cancer. 1975;36(5):1598-1602.
10. Eilber F, Giuliano A, Eckardt J, Patterson K, Moseley S, Goodnight J. Adjuvant chemotherapy for osteosarcoma: a randomized prospective trial. J Clin Oncol. 1987;5(1):21-26.
11. Hsieh MY, Hung GY, Yen HJ, Chen WM, Chen TH. Osteosarcoma in preadolescent patients: experience in a single institute in Taiwan. J Chin Med Assoc. 2009;72(9):455-461.
12. Longhi A, Pasini E, Bertoni F, Pignotti E, Ferrari C, Bacci G. Twenty-year follow-up of osteosarcoma of the extremity treated with adjuvant chemotherapy. J Chemother. 2004;16(6):582-588.
13. Bacci G, Ferrari S, Lari S, et al. Osteosarcoma of the limb. Amputation or limb salvage in patients treated by neoadjuvant chemotherapy. J Bone Joint Surg Br. 2002;84(1):88-92.
14. Bacci G, Ferrari S, Bertoni F, et al. Long-term outcome for patients with nonmetastatic osteosarcoma of the extremity treated at the Istituto Ortopedico Rizzoli according to the Istituto Ortopedico Rizzoli/Osteosarcoma-2 protocol: an updated report. J Clin Oncol. 2000;18(24):4016-4027.
15. Bacci G, Longhi A, Versari M, Mercuri M, Briccoli A, Picci P. Prognostic factors for osteosarcoma of the extremity treated with neoadjuvant chemotherapy: 15-year experience in 789 patients treated at a single institution. Cancer. 2006;106(5):1154-1161.
16. Cohen IJ, Kaplinsky C, Katz K, et al. Improved results in osteogenic sarcoma 1973–79 vs. 1980–86: analysis of results from a single center. Isr J Med Sci. 1993;29(1):27-29.
17. Mirabello L, Troisi RJ, Savage SA. Osteosarcoma incidence and survival rates from 1973 to 2004: data from the Surveillance, Epidemiology, and End Results program. Cancer. 2009;115(7):1531-1543.
18. Kager L, Zoubek A, Dominkus M, et al. Osteosarcoma in very young children: experience of the Cooperative Osteosarcoma Study Group. Cancer. 2010;116(22):5316-5324.
19. Szendroi M, Papai Z, Koos R, Illes T. Limb-saving surgery, survival, and prognostic factors for osteosarcoma: the Hungarian experience. J Surg Oncol. 2000;73(2):87-94.
20. Nagarajan R, Kamruzzaman A, Ness KK, et al. Twenty years of follow-up of survivors of childhood osteosarcoma: a report from the Childhood Cancer Survivor Study. Cancer. 2011;117(3):625-634.
21. Bacci G, Longhi A, Ferrari S, et al. Prognostic significance of serum lactate dehydrogenase in osteosarcoma of the extremity: experience at Rizzoli on 1421 patients treated over the last 30 years. Tumori. 2004;90(5):478-484.
22. Meyers PA, Heller G, Healey J, et al. Chemotherapy for nonmetastatic osteogenic sarcoma: the Memorial Sloan-Kettering experience. J Clin Oncol. 1992;10(1):5-15.
23. Marina N, Gebhardt M, Teot L, Gorlick R. Biology and therapeutic advances for pediatric osteosarcoma. Oncologist. 2004;9(4):422-441.
24. Hendershot E, Pappo A, Malkin D, Sung L. Tumor necrosis in pediatric osteosarcoma: impact of modern therapies. J Pediatr Oncol Nurs. 2006;23(4):176-181.
25. Higgins JP, Thompson SG, Deeks JJ, Altman DG. Measuring inconsistency in meta-analyses. BMJ. 2003;327(7414):557-560.
26. DerSimonian R, Laird N. Meta-analysis in clinical trials. Control Clin Trials. 1986;7(3):177-188.
27. Begg CB, Mazumdar M. Operating characteristics of a rank correlation test for publication bias. Biometrics. 1994;50(4):1088-1101.
28. Egger M, Davey Smith G, Schneider M, Minder C. Bias in meta-analysis detected by a simple, graphical test. BMJ. 1997;315(7109):629-634.
29. Bacci G, Ferrari S, Longhi A, Mellano D, Giacomini S, Forni C. Delay in diagnosis of high-grade osteosarcoma of the extremities. Has it any effect on the stage of disease? Tumori. 2000;86(3):204-206.
30. Bacci G, Ferrari S, Longhi A, et al. Neoadjuvant chemotherapy for high grade osteosarcoma of the extremities: long-term results for patients treated according to the Rizzoli IOR/OS-3b protocol. J Chemother. 2001;13(1):93-99.
31. Bielack SS, Kempf-Bielack B, Delling G, et al. Prognostic factors in high-grade osteosarcoma of the extremities or trunk: an analysis of 1,702 patients treated on neoadjuvant cooperative osteosarcoma study group protocols. J Clin Oncol. 2002;20(3):776-790.
32. Hauben EI, Weeden S, Pringle J, Van Marck EA, Hogendoorn PC. Does the histological subtype of high-grade central osteosarcoma influence the response to treatment with chemotherapy and does it affect overall survival? A study on 570 patients of two consecutive trials of the European Osteosarcoma Intergroup. Eur J Cancer. 2002;38(9):1218-1225.
33. Scully SP, Ghert MA, Zurakowski D, Thompson RC, Gebhardt MC. Pathologic fracture in osteosarcoma: prognostic importance and treatment implications. J Bone Joint Surg Am. 2002;84(1):49-57.
34. Wilkins RM, Cullen JW, Odom L, et al. Superior survival in treatment of primary nonmetastatic pediatric osteosarcoma of the extremity. Ann Surg Oncol. 2003;10(5):498-507.
35. Smeland S, Muller C, Alvegard TA, et al. Scandinavian Sarcoma Group Osteosarcoma Study SSG VIII: prognostic factors for outcome and the role of replacement salvage chemotherapy for poor histological responders. Eur J Cancer. 2003;39(4):488-494.
36. Ozaki T, Flege S, Kevric M, et al. Osteosarcoma of the pelvis: experience of the Cooperative Osteosarcoma Study Group. J Clin Oncol. 2003;21(2):334-341.
37. Mankin HJ, Hornicek FJ, Rosenberg AE, Harmon DC, Gebhardt MC. Survival data for 648 patients with osteosarcoma treated at one institution. Clin Orthop Relat Res. 2004;429:286-291.
38. Donati D, Giacomini S, Gozzi E, et al. Osteosarcoma of the pelvis. Eur J Surg Oncol. 2004;30(3):332-340.
39. Bacci G, Longhi A, Bertoni F, et al. Primary high-grade osteosarcoma: comparison between preadolescent and older patients. J Pediatr Hematol Oncol. 2005;27(3):129-134.
40. Bacci G, Longhi A, Fagioli F, Briccoli A, Versari M, Picci P. Adjuvant and neoadjuvant chemotherapy for osteosarcoma of the extremities: 27 year experience at Rizzoli Institute, Italy. Eur J Cancer. 2005;41(18):2836-2845.
41. Matsuo T, Sugita T, Sato K, et al. Clinical outcomes of 54 pelvic osteosarcomas registered by Japanese musculoskeletal oncology group. Oncology. 2005;68(4-6):375-381.
42. Kuhelj D, Jereb B. Pediatric osteosarcoma: a 35-year experience in Slovenia. Pediatr Hematol Oncol. 2005;22(4):335-343.
43. Mialou V, Philip T, Kalifa C, et al. Metastatic osteosarcoma at diagnosis: prognostic factors and long-term outcome—the French pediatric experience. Cancer. 2005;104(5):1100-1109.
44. Daecke W, Bielack S, Martini AK, et al. Osteosarcoma of the hand and forearm: experience of the Cooperative Osteosarcoma Study Group. Ann Surg Oncol. 2005;12(4):322-331.
45. Cho WH, Lee SY, Song WS, Park JH. Osteosarcoma in pre-adolescent patients. J Int Med Res. 2006;34(6):676-681.
46. Petrilli AS, de Camargo B, Filho VO, et al. Results of the Brazilian Osteosarcoma Treatment Group studies III and IV: prognostic factors and impact on survival. J Clin Oncol. 2006;24(7):1161-1168.
47. Kim MS, Lee SY, Cho WH, et al. Growth patterns of osteosarcoma predict patient survival. Arch Orthop Trauma Surg. 2009;129(9):1189-1196.
48. Lee JA, Kim MS, Kim DH, et al. Osteosarcoma developed in the period of maximal growth rate have inferior prognosis. J Pediatr Hematol Oncol. 2008;30(6):419-424.
49. Wu PK, Chen WM, Chen CF, Lee OK, Haung CK, Chen TH. Primary osteogenic sarcoma with pulmonary metastasis: clinical results and prognostic factors in 91 patients. Jpn J Clin Oncol. 2009;39(8):514-522.
50. Ayan I, Kebudi R, Ozger H. Childhood osteosarcoma: multimodal therapy in a single-institution Turkish series. Cancer Treat Res. 2009;152:319-338.
51. Bruland OS, Bauer H, Alvegaard T, Smeland S. Treatment of osteosarcoma. The Scandinavian Sarcoma Group experience. Cancer Treat Res. 2009;152:309-318.
52. Bielack S, Jurgens H, Jundt G, et al. Osteosarcoma: the COSS experience. Cancer Treat Res. 2009;152:289-308.
53. Bispo Júnior RZ, Camargo OP. Prognostic factors in the survival of patients diagnosed with primary non-metastatic osteosarcoma with a poor response to neoadjuvant chemotherapy. Clinics (Sao Paulo). 2009;64(12):1177-1186.
54. Gonzalez-Billalabeitia E, Hitt R, Fernandez J, et al. Pre-treatment serum lactate dehydrogenase level is an important prognostic factor in high-grade extremity osteosarcoma. Clin Transl Oncol. 2009;11(7):479-483.
55. Kong CB, Kim MS, Lee SY, et al. Prognostic effect of diaphyseal location in osteosarcoma: a cohort case–control study at a single institute. Ann Surg Oncol. 2009;16(11):3094-3100.
56. Kim MS, Lee SY, Cho WH, et al. Prognostic effects of doctor-associated diagnostic delays in osteosarcoma. Arch Orthop Trauma Surg. 2009;129(10):1421-1425.
57. Lee JA, Kim MS, Kim DH, et al. Risk stratification based on the clinical factors at diagnosis is closely related to the survival of localized osteosarcoma. Pediatr Blood Cancer. 2009;52(3):340-345.
58. Worch J, Matthay KK, Neuhaus J, Goldsby R, DuBois SG. Osteosarcoma in children 5 years of age or younger at initial diagnosis. Pediatr Blood Cancer. 2010;55(2):285-289.
59. Munajat I, Zulmi W, Norazman MZ, Wan Faisham WI. Tumour volume and lung metastasis in patients with osteosarcoma. J Orthop Surg (Hong Kong). 2008;16(2):182-185.
60. Sampo M, Koivikko M, Taskinen M, et al. Incidence, epidemiology and treatment results of osteosarcoma in Finland - a nationwide population-based study. Acta Oncol. 2011;50(8):1206-1214.
61. Ferrari S, Ruggieri P, Cefalo G, et al. Neoadjuvant chemotherapy with methotrexate, cisplatin, and doxorubicin with or without ifosfamide in nonmetastatic osteosarcoma of the extremity: an Italian Sarcoma Group trial ISG/OS-1. J Clin Oncol. 2012;30(17):2112-2118.
Osteosarcoma, a primary malignant tumor of the skeleton, is characterized by direct formation of immature bone or osteoid tissue by tumor cells. The World Health Organization histologic classification of bone tumors divides osteosarcoma into central and surface tumors and recognizes a number of subtypes within each group.1 The present review refers only to the classic central high-grade primary osteosarcoma of bone, which represents about 90% of all osteosarcoma cases. Classic osteosarcoma represents about 15% of all biopsy-analyzed primary bone tumors.1 It is the third most common type of neoplasia, preceded by leukemia and lymphoma among older children and adolescents aged 12 to 18 years.2 High-grade primary osteosarcoma is the most common primary skeletal tumor of childhood and adolescence, with an overall annual incidence of 5.6 cases per million children under age 15 years.3-5 Peak incidence is in the second decade of life, and males are affected slightly more often than females.2,6 The period of highest incidence coincides with the growth spurt of the long bones. Osteosarcoma preferentially affects the metaphysis of long bones, the 3 main sites being distal femur, tibia, and proximal humerus.2
Historical Perspective
For most of the 20th century, the 5-year survival rate for classic primary osteosarcoma was under 20%.7 In the 1970s, the first revolution in osteosarcoma treatment arrived with the introduction of adjuvant chemotherapy, which increased survival rates to 50%.8-10 During this expansion of research, several chemotherapeutics (eg, vincristine, bleomycin, dactinomycin) were discarded for poor effectiveness, and others (eg, cisplatin, ifosfamide) were added to doxorubicin and methotrexate, improving 5-year disease-free survival to about 70% in patients with nonmetastatic osteosarcoma. In another significant advance, adjuvant chemotherapy was supplemented with intensive preoperative chemotherapy, resulting in 5-year tumor-free survival that has ranged from 50% to 75% for high-grade osteosarcoma.5,11,12 Adding neoadjuvant chemotherapy and histologic response has allowed for evaluation of surgical margins and early treatment of microscopic disease. Thus, effective limb-sparing procedures can be performed, and the incidence of amputation has decreased from 90% to between 10% and 20%.13,14 However, statistical improvements in survival associated with neoadjuvant treatment may simply delay time of recurrence and metastasis.15 In addition, though chemotherapy has improved survival in osteogenic sarcoma, many have written that this improvement appears to reflect mainly the increase in the intensity of the chemotherapy used, which also leads to a higher propensity for side effects.16
Despite research and advances in chemotherapy regimens, the prognosis of patients with osteosarcoma remains highly variable and often dismal. Mirabello and colleagues17 examined osteosarcoma incidence and survival rates between 1973 and 2004 and found that, with the introduction of neoadjuvant chemotherapy, survival rates improved significantly between 1973 and 1983 and between 1984 and 1993, but there was little improvement between 1993 and 2004.
The long-term outcome for patients with metastatic disease is poor. Investigators have found that 11% to 20% of patients have pulmonary metastasis at initial diagnosis. About half of patients without pulmonary metastases develop them later in the disease course.18 Survival rates for patients with metastasis at initial presentation have ranged from 10% to 40%.19 Recurrent disease still occurs in 30% to 40% of patients, and more than 70% of them die of the tumor.15 The survivors of osteosarcoma are then at increased risk for chronic medical conditions and adverse health status because of the osteosarcoma-related treatments.20
Prognostic Factors
It is important to understand and exploit the influences of different prognostic factors in treating patients with osteosarcoma.7 These factors are important in establishing the best treatment for the individual. Thus, more aggressive treatments can be started in patients with prognostic factors that pose a higher risk of relapse.21 A number of clinical and pathologic features (eg, tumor site, size, subtype; patient sex and age; high alkaline phosphatase or high lactate dehydrogenase [LDH] values; multidrug resistance; genetic variations) have prognostic significance but often with contradictory results because of lack of uniformity in patient analyses and methods.15
Survival for patients with primary osteosarcoma has been analyzed with respect to tumor size and location.7 Studies have found higher survival rates for patients with smaller tumors (<10 cm) and more distal tumor locations.7 These superior survival rates may be the result of earlier detection of tumors and more options for surgical resection of smaller, distal tumors.
Serum LDH levels have helped in risk stratification of patients. High LDH often occurred at time of relapse, and relapse with high LDH correlated with poor prognosis. Meyers and colleagues22 found that 5-year disease-free survival was 72% for patients with normal LDH at presentation and 54% for patients with elevated LDH at presentation.
Several studies have shown that percentage of tumor necrosis on histology is strongly correlated with good prognosis.21 Most groups now define a good histologic response as less than 10% viable tumor cells at time of surgery, and a poor response as more than 10%.23 Results of the Pediatric Oncology Group (POG) protocol for localized osteosarcoma (POG 9351), or Children’s Cancer Group (CCG) 7921, found 45% of patients had favorable responses (>90% necrosis) after preoperative chemotherapy.24 However, several clinicians have recently questioned this finding.
Overall, the prognosis for classic osteosarcoma of the extremity remains highly variable, and there has been little improvement over the past 20 years. The prognosis for younger patients, patients with spinal disease, and patients with metastatic disease remains poor. Although some prognostic factors have been identified and shown to predict a good outcome, it seems few patients have these positive factors. In this article, we describe the literature review and meta-analysis we performed to better define recent survival trends for patients with primary osteosarcoma.
Methods
The MEDLINE, PubMed, and Cochrane databases were searched for eligible studies published in English between 2000 and 2011—a decade of recently reported research. We applied the search strategy [“osteosarcoma” OR “osteogenic sarcoma”] AND [“prognosis” OR “treatment” OR “survival”] and selected reports that specifically addressed factors predicting survival in patients with osteosarcoma—reports that were limited to primary osteosarcoma of the pelvis or extremity and provided 5-year overall survival (OS) data. Abstracts of the selected articles were independently reviewed, and the inclusion and exclusion criteria were applied. We excluded basic science studies and those without pediatric patients, those without primary osteosarcoma, those with periosteal or parosteal osteosarcoma, and those that did not report 5-year OS data.
Statistical Analysis
Number or proportion of patients (whichever was reported) with 5-year OS and number or proportion of patients with 90% necrosis were extracted from each study. For each trial, proportion of patients with 5-year OS and 95% confidence intervals (CIs) and proportion of patients achieving 90% necrosis and 95% CIs were determined. We also calculated proportion of patients with 5-year OS and proportion of patients with 90% necrosis with corresponding 95% CIs of studies that included patients with nonmetastatic disease.
We assessed statistical heterogeneity among trials included in the meta-analysis using the Cochran Q test. Inconsistency was quantified with the I2 statistic, which estimates percentage of total across-studies variation caused by heterogeneity rather than chance.25 We considered I2 higher than 50% as indicating substantial heterogeneity. When substantial heterogeneity was not found, the pooled estimate calculated on the basis of the fixed-effects model was reported using the inverse variance method. When substantial heterogeneity was found, the pooled estimate calculated on the basis of a random-effects model was reported using the DerSimonian and Laird26 method, which takes both within- and between-study variations into account.
Publication bias was assessed through funnel plots and with Begg and Egger tests.27,28 Two-tailed P < .05 was considered statistically significant. All statistical analyses were performed with Stata/SE Version 11.0 (StataCorp).
Results
Our literature search yielded 597 articles. We cross-referenced these articles with the MEDLINE, PubMed, and Cochrane search results using the same keywords and discarded the duplicates. The abstracts of these articles were then reviewed in detail. The 40 articles4,6,11,12,14,15,17-19,21,29-58 that met our study inclusion criteria reported on studies that included patients with metastatic and nonmetastatic osteosarcoma. Because of the significant difference in OS of patients with metastatic disease, we also analyzed articles that included only patients with nonmetastatic disease. Sixteen articles6,14,15,29,32-35,39,47,48,51,53,54,55,57 were included in the analysis of patients with nonmetastatic disease.
Figure 1 shows 5-year OS for each of the 40 studies. For studies that compared survival of different groups of patients, the survival of each group is shown separately. For example, Bacci and colleagues39 divided patients into adolescent and preadolescent groups and reported 5-year OS for each. In our analysis, we treated each group independently and reported their 5-year OS separately. For each study, 5-year OS, weight of study, and CI are included. Five-year OS ranged from 19% to 94%. Analysis was performed to determine 5-year OS for all studies based on weight given to each study. The random-effects model used for this analysis (heterogeneity test, Q = 656.23; P < .001; I2 = 93.4%) showed 5-year OS of 63% (95% CI, 60%-66%) for studies that included patients with metastatic and nonmetastatic osteosarcoma.
Figure 2 shows 5-year OS (range, 53%-94%) for each of the 16 studies that included only patients with nonmetastatic disease. The random-effects model used for this analysis (heterogeneity test, Q = 142.08; P < .001; I2 = 89.4%) showed 5-year OS of 71% (95% CI, 67%-76%) for studies that included only patients with nonmetastatic disease.
We then examined percentage of patients achieving 90% necrosis on histology in each study. Several studies included in the OS analysis did not report percentage necrosis, leaving 29 studies for the necrosis analysis. Of these 29 studies, all 29 included patients with metastatic and nonmetastatic disease,4,6,11,14,15,18,19,21,29,31-36,37,39,40,43-47,49,50,54-57,59 and 13 included only patients with nonmetastatic disease.6,14,15,29,32-35,40,47,54,55,57 Again, because of the known difference in prognosis between patients with metastatic disease and patients with nonmetastatic disease, we performed separate analyses, one for the combined dataset of all 29 studies (Figure 3) and the other for the 13 nonmetastatic studies (Figure 4). Random-effects models showed 90% necrosis for 50% of patients in both analyses: studies that included patients with metastatic and nonmetastatic disease (95% CI, 45%-54%; heterogeneity test, Q = 692.88; P < .001; I2 = 95.5%) and nonmetastatic studies (95% CI, 41%-59%; heterogeneity test, Q = 385.42; P < .001; I2 = 96.9%).
We also performed a meta-regression analysis that included necrosis as a continuous variable for both the overall dataset and the nonmetastatic dataset. Five-year OS was plotted against percentage of patients achieving 90% tumor necrosis for each study. The results are plotted in Figure 5 (combined dataset).
No evidence of publication bias was detected for 5-year OS or percentage necrosis for the analyses of the combined datasets by either Egger test or Begg test. For 5-year OS, Ps were .21 (Egger) and .19 (Begg); for percentage necrosis, Ps were .10 (Egger) and .62 (Begg). In addition, no evidence of publication bias was detected for the analyses of the nonmetastatic studies by either test. For 5-year OS, Ps were .55 (Egger) and .41 (Begg); for percentage necrosis, Ps were .42 (Egger) and .95 (Begg).
Discussion
Five-year OS was 63% (95% CI, 60%-66%) for studies that included patients with metastatic and nonmetastatic osteosarcoma and 71% (95% CI, 67%-76%) for studies that included only patients with nonmetastatic osteosarcoma. These percentages fall within the range found in the literature. Mankin and colleagues37 reviewed 648 cases of patients with osteosarcoma treated at Massachusetts General Hospital in 2004; OS was 68%. In 2011, Sampo and colleagues60 reported 10-year OS of 63% for patients with metastatic and nonmetastatic disease and 73% for patients with local disease at presentation. Five-year OS rates in the literature are consistently about 70%. Ferrari and colleagues61 reported 5-year OS of 73% and 74% for 230 patients treated with 2 different neoadjuvant chemotherapy regimens between 2001 and 2006. The consistency in 5-year OS suggests OS of pediatric patients with osteosarcoma has plateaued, and there has been no significant improvement in survival of patients with osteosarcoma over the past 30 years.
Histologic response to preoperative chemotherapy is strongly associated with survival in pediatric osteosarcoma. Bielack and colleagues31 reported 5-year OS of 75% to 80% for patients who responded well to preoperative chemotherapy (>90% tumor necrosis) and 45% to 55% for patients who responded poorly (<10% necrosis). In our meta-analysis of studies that included patients with nonmetastatic osteosarcoma, 50% achieved necrosis of more than 90%. Percentage of patients achieving necrosis of more than 90% has been about 45%, according to past reports. In 2012, Ferrari and colleagues61 reported that 45% of 230 patients treated with neoadjuvant chemotherapy achieved more than 90% tumor necrosis. Therefore, 5-year OS and percentage of patients achieving 90% necrosis are consistent with previous reports, though this also suggests these numbers have remained constant over the past several decades.
Despite its expansive scale, our study has several important limitations. Data were extracted from published studies, and individual patient data were not available, so we were not able to assess the effects of risk factors (eg, tumor size, location) on 5-year OS. We could not correlate the proportion of patients with 90% necrosis to 5-year OS, as studies did not report OS by necrosis strata. Also, because our numbers were derived from published studies, they may not accurately represent outcomes in the community as a whole. In addition, several successive studies may contain duplicate patient cases. We limited our search to studies published since 2000 to include patients recently diagnosed and treated for osteosarcoma; however, several studies published after 2000 also included patients diagnosed and treated before 2000. Several of these studies are from countries outside the United States and may have a significantly different incidence of osteosarcoma as well as treatment methods and survival rates.
Although this meta-analysis suggests 5-year OS remains about 70% for patients with primary nonmetastatic osteosarcoma, we cannot settle on this conclusion because of the many differences between the studies we included. Therefore, more studies of patients diagnosed and treated within the past 10 years are needed to confirm our beliefs about patient survival.
1. Widhe B, Widhe T. Initial symptoms and clinical features in osteosarcoma and Ewing sarcoma. J Bone Joint Surg Am. 2000;82(5):667-674.
2. Cho WH, Song WS, Jeon DG, et al. Differential presentations, clinical courses, and survivals of osteosarcomas of the proximal humerus over other extremity locations. Ann Surg Oncol. 2010;17(3):702-708.
3. Abate ME, Longhi A, Galletti S, Ferrari S, Bacci G. Non-metastatic osteosarcoma of the extremities in children aged 5 years or younger. Pediatr Blood Cancer. 2010;55(4):652-654.
4. Kager L, Zoubek A, Potschger U, et al. Primary metastatic osteosarcoma: presentation and outcome of patients treated on neoadjuvant Cooperative Osteosarcoma Study Group protocols. J Clin Oncol. 2003;21(10):2011-2018.
5. Pakos EE, Nearchou AD, Grimer RJ, et al. Prognostic factors and outcomes for osteosarcoma: an international collaboration. Eur J Cancer. 2009;45(13):2367-2375.
6. Kaste SC, Liu T, Billups CA, Daw NC, Pratt CB, Meyer WH. Tumor size as a predictor of outcome in pediatric non-metastatic osteosarcoma of the extremity. Pediatr Blood Cancer. 2004;43(7):723-728.
7. Brostrom LA, Strander H, Nilsonne U. Survival in osteosarcoma in relation to tumor size and location. Clin Orthop Relat Res. 1982;167:250-254.
8. Harvei S, Solheim O. The prognosis in osteosarcoma: Norwegian national data. Cancer. 1981;48(8):1719-1723.
9. Sutow WW, Sullivan MP, Fernbach DJ, Cangir A, George SL. Adjuvant chemotherapy in primary treatment of osteogenic sarcoma. A Southwest Oncology Group study. Cancer. 1975;36(5):1598-1602.
10. Eilber F, Giuliano A, Eckardt J, Patterson K, Moseley S, Goodnight J. Adjuvant chemotherapy for osteosarcoma: a randomized prospective trial. J Clin Oncol. 1987;5(1):21-26.
11. Hsieh MY, Hung GY, Yen HJ, Chen WM, Chen TH. Osteosarcoma in preadolescent patients: experience in a single institute in Taiwan. J Chin Med Assoc. 2009;72(9):455-461.
12. Longhi A, Pasini E, Bertoni F, Pignotti E, Ferrari C, Bacci G. Twenty-year follow-up of osteosarcoma of the extremity treated with adjuvant chemotherapy. J Chemother. 2004;16(6):582-588.
13. Bacci G, Ferrari S, Lari S, et al. Osteosarcoma of the limb. Amputation or limb salvage in patients treated by neoadjuvant chemotherapy. J Bone Joint Surg Br. 2002;84(1):88-92.
14. Bacci G, Ferrari S, Bertoni F, et al. Long-term outcome for patients with nonmetastatic osteosarcoma of the extremity treated at the Istituto Ortopedico Rizzoli according to the Istituto Ortopedico Rizzoli/Osteosarcoma-2 protocol: an updated report. J Clin Oncol. 2000;18(24):4016-4027.
15. Bacci G, Longhi A, Versari M, Mercuri M, Briccoli A, Picci P. Prognostic factors for osteosarcoma of the extremity treated with neoadjuvant chemotherapy: 15-year experience in 789 patients treated at a single institution. Cancer. 2006;106(5):1154-1161.
16. Cohen IJ, Kaplinsky C, Katz K, et al. Improved results in osteogenic sarcoma 1973–79 vs. 1980–86: analysis of results from a single center. Isr J Med Sci. 1993;29(1):27-29.
17. Mirabello L, Troisi RJ, Savage SA. Osteosarcoma incidence and survival rates from 1973 to 2004: data from the Surveillance, Epidemiology, and End Results program. Cancer. 2009;115(7):1531-1543.
18. Kager L, Zoubek A, Dominkus M, et al. Osteosarcoma in very young children: experience of the Cooperative Osteosarcoma Study Group. Cancer. 2010;116(22):5316-5324.
19. Szendroi M, Papai Z, Koos R, Illes T. Limb-saving surgery, survival, and prognostic factors for osteosarcoma: the Hungarian experience. J Surg Oncol. 2000;73(2):87-94.
20. Nagarajan R, Kamruzzaman A, Ness KK, et al. Twenty years of follow-up of survivors of childhood osteosarcoma: a report from the Childhood Cancer Survivor Study. Cancer. 2011;117(3):625-634.
21. Bacci G, Longhi A, Ferrari S, et al. Prognostic significance of serum lactate dehydrogenase in osteosarcoma of the extremity: experience at Rizzoli on 1421 patients treated over the last 30 years. Tumori. 2004;90(5):478-484.
22. Meyers PA, Heller G, Healey J, et al. Chemotherapy for nonmetastatic osteogenic sarcoma: the Memorial Sloan-Kettering experience. J Clin Oncol. 1992;10(1):5-15.
23. Marina N, Gebhardt M, Teot L, Gorlick R. Biology and therapeutic advances for pediatric osteosarcoma. Oncologist. 2004;9(4):422-441.
24. Hendershot E, Pappo A, Malkin D, Sung L. Tumor necrosis in pediatric osteosarcoma: impact of modern therapies. J Pediatr Oncol Nurs. 2006;23(4):176-181.
25. Higgins JP, Thompson SG, Deeks JJ, Altman DG. Measuring inconsistency in meta-analyses. BMJ. 2003;327(7414):557-560.
26. DerSimonian R, Laird N. Meta-analysis in clinical trials. Control Clin Trials. 1986;7(3):177-188.
27. Begg CB, Mazumdar M. Operating characteristics of a rank correlation test for publication bias. Biometrics. 1994;50(4):1088-1101.
28. Egger M, Davey Smith G, Schneider M, Minder C. Bias in meta-analysis detected by a simple, graphical test. BMJ. 1997;315(7109):629-634.
29. Bacci G, Ferrari S, Longhi A, Mellano D, Giacomini S, Forni C. Delay in diagnosis of high-grade osteosarcoma of the extremities. Has it any effect on the stage of disease? Tumori. 2000;86(3):204-206.
30. Bacci G, Ferrari S, Longhi A, et al. Neoadjuvant chemotherapy for high grade osteosarcoma of the extremities: long-term results for patients treated according to the Rizzoli IOR/OS-3b protocol. J Chemother. 2001;13(1):93-99.
31. Bielack SS, Kempf-Bielack B, Delling G, et al. Prognostic factors in high-grade osteosarcoma of the extremities or trunk: an analysis of 1,702 patients treated on neoadjuvant cooperative osteosarcoma study group protocols. J Clin Oncol. 2002;20(3):776-790.
32. Hauben EI, Weeden S, Pringle J, Van Marck EA, Hogendoorn PC. Does the histological subtype of high-grade central osteosarcoma influence the response to treatment with chemotherapy and does it affect overall survival? A study on 570 patients of two consecutive trials of the European Osteosarcoma Intergroup. Eur J Cancer. 2002;38(9):1218-1225.
33. Scully SP, Ghert MA, Zurakowski D, Thompson RC, Gebhardt MC. Pathologic fracture in osteosarcoma: prognostic importance and treatment implications. J Bone Joint Surg Am. 2002;84(1):49-57.
34. Wilkins RM, Cullen JW, Odom L, et al. Superior survival in treatment of primary nonmetastatic pediatric osteosarcoma of the extremity. Ann Surg Oncol. 2003;10(5):498-507.
35. Smeland S, Muller C, Alvegard TA, et al. Scandinavian Sarcoma Group Osteosarcoma Study SSG VIII: prognostic factors for outcome and the role of replacement salvage chemotherapy for poor histological responders. Eur J Cancer. 2003;39(4):488-494.
36. Ozaki T, Flege S, Kevric M, et al. Osteosarcoma of the pelvis: experience of the Cooperative Osteosarcoma Study Group. J Clin Oncol. 2003;21(2):334-341.
37. Mankin HJ, Hornicek FJ, Rosenberg AE, Harmon DC, Gebhardt MC. Survival data for 648 patients with osteosarcoma treated at one institution. Clin Orthop Relat Res. 2004;429:286-291.
38. Donati D, Giacomini S, Gozzi E, et al. Osteosarcoma of the pelvis. Eur J Surg Oncol. 2004;30(3):332-340.
39. Bacci G, Longhi A, Bertoni F, et al. Primary high-grade osteosarcoma: comparison between preadolescent and older patients. J Pediatr Hematol Oncol. 2005;27(3):129-134.
40. Bacci G, Longhi A, Fagioli F, Briccoli A, Versari M, Picci P. Adjuvant and neoadjuvant chemotherapy for osteosarcoma of the extremities: 27 year experience at Rizzoli Institute, Italy. Eur J Cancer. 2005;41(18):2836-2845.
41. Matsuo T, Sugita T, Sato K, et al. Clinical outcomes of 54 pelvic osteosarcomas registered by Japanese musculoskeletal oncology group. Oncology. 2005;68(4-6):375-381.
42. Kuhelj D, Jereb B. Pediatric osteosarcoma: a 35-year experience in Slovenia. Pediatr Hematol Oncol. 2005;22(4):335-343.
43. Mialou V, Philip T, Kalifa C, et al. Metastatic osteosarcoma at diagnosis: prognostic factors and long-term outcome—the French pediatric experience. Cancer. 2005;104(5):1100-1109.
44. Daecke W, Bielack S, Martini AK, et al. Osteosarcoma of the hand and forearm: experience of the Cooperative Osteosarcoma Study Group. Ann Surg Oncol. 2005;12(4):322-331.
45. Cho WH, Lee SY, Song WS, Park JH. Osteosarcoma in pre-adolescent patients. J Int Med Res. 2006;34(6):676-681.
46. Petrilli AS, de Camargo B, Filho VO, et al. Results of the Brazilian Osteosarcoma Treatment Group studies III and IV: prognostic factors and impact on survival. J Clin Oncol. 2006;24(7):1161-1168.
47. Kim MS, Lee SY, Cho WH, et al. Growth patterns of osteosarcoma predict patient survival. Arch Orthop Trauma Surg. 2009;129(9):1189-1196.
48. Lee JA, Kim MS, Kim DH, et al. Osteosarcoma developed in the period of maximal growth rate have inferior prognosis. J Pediatr Hematol Oncol. 2008;30(6):419-424.
49. Wu PK, Chen WM, Chen CF, Lee OK, Haung CK, Chen TH. Primary osteogenic sarcoma with pulmonary metastasis: clinical results and prognostic factors in 91 patients. Jpn J Clin Oncol. 2009;39(8):514-522.
50. Ayan I, Kebudi R, Ozger H. Childhood osteosarcoma: multimodal therapy in a single-institution Turkish series. Cancer Treat Res. 2009;152:319-338.
51. Bruland OS, Bauer H, Alvegaard T, Smeland S. Treatment of osteosarcoma. The Scandinavian Sarcoma Group experience. Cancer Treat Res. 2009;152:309-318.
52. Bielack S, Jurgens H, Jundt G, et al. Osteosarcoma: the COSS experience. Cancer Treat Res. 2009;152:289-308.
53. Bispo Júnior RZ, Camargo OP. Prognostic factors in the survival of patients diagnosed with primary non-metastatic osteosarcoma with a poor response to neoadjuvant chemotherapy. Clinics (Sao Paulo). 2009;64(12):1177-1186.
54. Gonzalez-Billalabeitia E, Hitt R, Fernandez J, et al. Pre-treatment serum lactate dehydrogenase level is an important prognostic factor in high-grade extremity osteosarcoma. Clin Transl Oncol. 2009;11(7):479-483.
55. Kong CB, Kim MS, Lee SY, et al. Prognostic effect of diaphyseal location in osteosarcoma: a cohort case–control study at a single institute. Ann Surg Oncol. 2009;16(11):3094-3100.
56. Kim MS, Lee SY, Cho WH, et al. Prognostic effects of doctor-associated diagnostic delays in osteosarcoma. Arch Orthop Trauma Surg. 2009;129(10):1421-1425.
57. Lee JA, Kim MS, Kim DH, et al. Risk stratification based on the clinical factors at diagnosis is closely related to the survival of localized osteosarcoma. Pediatr Blood Cancer. 2009;52(3):340-345.
58. Worch J, Matthay KK, Neuhaus J, Goldsby R, DuBois SG. Osteosarcoma in children 5 years of age or younger at initial diagnosis. Pediatr Blood Cancer. 2010;55(2):285-289.
59. Munajat I, Zulmi W, Norazman MZ, Wan Faisham WI. Tumour volume and lung metastasis in patients with osteosarcoma. J Orthop Surg (Hong Kong). 2008;16(2):182-185.
60. Sampo M, Koivikko M, Taskinen M, et al. Incidence, epidemiology and treatment results of osteosarcoma in Finland - a nationwide population-based study. Acta Oncol. 2011;50(8):1206-1214.
61. Ferrari S, Ruggieri P, Cefalo G, et al. Neoadjuvant chemotherapy with methotrexate, cisplatin, and doxorubicin with or without ifosfamide in nonmetastatic osteosarcoma of the extremity: an Italian Sarcoma Group trial ISG/OS-1. J Clin Oncol. 2012;30(17):2112-2118.
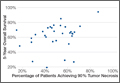
2015 Update on osteoporosis
More than 9 million American women are estimated to have osteoporosis, making it the most common bone disease and an especially prevalent health problem in postmenopausal women.1
Osteoporosis causes 2 million fractures every year, leading to major medical consequences for patients.2 These fractures are associated with significant morbidity and mortality, often requiring the extended use of long-term care facilities and causing severe disability.
With a rapidly increasing elderly population, the cost of care for osteoporosis is estimated to rise to $25.3 billion by 2025.3 The medical and financial impacts of osteoporosis underscore the need for timely screening and diagnosis and the implementation of effective prevention and treatment strategies. As women’s health care providers, we are the first line of screening and diagnosis and implementation of effective treatment strategies.
In this “Update on Osteoporosis,” I discuss:
- 2 studies that explore the use of zoledronic acid or denosumab in women with breast cancer undergoing adjuvant therapy with an aromatase inhibitor
- a report of a task force of the American Society for Bone and Mineral Research on the long-term use of bisphosphonate therapy
- a look at the trabecular bone score as a tool to characterize bone strength and overall fracture risk
- the relationship of sarcopenia and body composition with osteoporosis.
Can zoledronic acid or denosumab counter bone loss associated with aromatase inhibitors?
Majithia N, Atherton PJ, Lafky JM, et al. Zoledronic acid for treatment of osteopenia and osteoporosis in women with primary breast cancer undergoing adjuvant aromatase inhibitor therapy: a 5-year follow-up [published online ahead of print August 23, 2015]. Support Care Cancer. doi:10.1007/s00520-015-2915-2.
Gnant M, Pfeiler G, Dubsky PC, et al. Adjuvant denosumab in breast cancer (ABCSG-18): a multicenter, randomized, double-blind, placebo-controlled trial. Lancet. 2015;386(9992):433–443.
Every gynecologist and women’s health care provider knows that breast cancer is a prevalent disease. It is also likely to be the most feared entity among our patients.
Aromatase inhibitors (AIs) have been shown consistently to provide benefit for patients with hormone-positive breast cancer and frequently are incorporated into treatment in both the adjuvant and metastatic settings. By inactivating the enzyme responsible for converting androgens to estrogens, AIs reduce plasma estrogen levels. This effect is helpful in the treatment of breast cancer, but it also has consequences for bone mineral density (BMD).
Estrogen promotes the inactivation of osteoclasts, thereby minimizing bone mineral resorption. When plasma levels of estrogen are suppressed, women are susceptible to loss of BMD and development of osteoporosis. This adverse effect has been observed in several clinical trials.4,5
Study focused on women with low bone mass
Majithia and colleagues set out to explore whether zoledronic acid would prevent loss of BMD in postmenopausal women with preexisting osteopenia or osteoporosis who were initiating adjuvant therapy with the AI letrozole for primary breast cancer.
Sixty postmenopausal women with estrogen-receptor–positive breast cancer and a BMD T-score of –2.0 or less were enrolled. Participants received letrozole 2.5 mg and vitamin D 400 IU daily, calcium 500 mg twice daily, and IV zoledronic acid 4 mg every 6 months for a maximum of 5 years or until disease progression. BMD at the lumbar spine and femoral neck was recorded at the start of the study and annually for 5 years. Patients were evaluated for fractures every 6 months for the duration of the trial.
Findings of Majithia and colleagues. After 5 years of therapy, mean BMD increased by 11.6% (P = .01) at the lumbar spine and by 8.8% (P = .01) at combined sites. Femoral neck BMD increased by 4.2%, although this increase was not significant (P = .23). At the end of the trial, BMDs were consistent with osteoporosis in 7% and osteopenia in 36% of patients. A total of 6 fractures were reported after 417 individual assessments.
Investigators concluded that zoledronic acid appears to prevent further bone loss in postmenopausal breast cancer patients with osteopenia or osteoporosis starting treatment with letrozole. These findings support concurrent initiation of bisphosphonate and AI therapy in this high-risk population.
Denosumab significantly delayed time to first clinical fracture
Gnant and colleagues performed a prospective, double-blind, placebo-controlled, phase 3 trial in which postmenopausal patients with early hormone-receptor– positive breast cancer undergoing treatment with an AI were randomly assigned, in a 1:1 ratio, to denosumab 60 mg or placebo administered subcutaneously every 6 months. The endpoint was time from randomization to first clinical fracture. A total of 3,420 patients were enrolled and studied over 7 years.
Findings of Gnant and colleagues. Patients given denosumab had a significantly delayed time to their first clinical fracture (hazard ratio [HR], 0.50; 95% confidence interval [CI], 0.39–0.65), compared with those in the placebo group.
The overall lower number of fractures in the denosumab group (92 vs 176) was similar in all patient subgroups, including patients with a BMD T-score of –1 or higher at baseline (n = 1,872; HR, 0.44; 95% CI, 0.31–0.64; P<.0001) and those with a BMD T-score greater than –1 at baseline (n = 1,548; HR, 0.57; 95% CI, 0.40–0.82; P = .002).
The incidence of adverse events in the safety analysis set (all patients who received at least one dose of the study drug) did not differ between the denosumab (1,366 events, or 80%) and placebo groups (1,344 events, or 79%); nor did the numbers of serious adverse events (521 vs 511, or 30% in each group). The main adverse events were arthralgia and other AI-related symptoms; no additional toxicity from the study drug was reported. Despite proactive adjudication of every potential case of osteonecrosis of the jaw by an international expert panel, no cases were reported.
Differences between the 2 studies
The study with zoledronic acid looked at BMD in a small number of patients with low bone mass over a 1-year time frame. The denosumab study was extremely large and looked at clinical fractures in women with normal as well as low bone mass.
We all have patients with breast cancer, many of them being treated with an AI. Even those who begin AI therapy with normal bone mass appear to benefit from concomitant therapy with denosumab given subcutaneously every 6 months.
How long should bisphosphonate therapy be continued?
Adler RA, Fuleihan GE, Bauer DC, et al. Managing osteoporosis in patients on long-term bisphosphonate treatment. Report of a task force of the American Society for Bone and Mineral Research [published online ahead of print September 9, 2015]. J Bone Miner Res. doi:10.1002/jbmr.2708.
An osteoporotic fracture occurs every 3 seconds worldwide, and 1 in 3 women will experience a fragility fracture after age 50.6,7 Solid evidence from randomized, placebo-controlled trials of 3 to 4 years’ duration supports the efficacy of bisphosphonates in decreasing the risk of vertebral fracture (by 40%–70%), hip fracture (by 20%–50%), and nonvertebral fracture (by 15%–39%), depending on the drug, skeletal site, and individual risk profile.8 As a result, these drugs have dominated the landscape of osteoporosis therapies for the past 2 decades.
Extension trials have suggested that prolonged bisphosphonate therapy is effective in maintaining BMD as long as 10 years with alendronate, 7 years with risedronate, and 6 years with zoledronic acid, but evidence regarding fracture risk reduction with prolonged therapy is less convincing.9–11
This report from the American Society for Bone and Mineral Research (ASBMR) examines fracture reduction—not simply BMD efficacy—in 2 trials that explored long-term use of bisphosphonates.
What 2 long-term studies reveal about fracture risk
In the Fracture Intervention Trial Long-Term Extension (FLEX), postmenopausal women who received alendronate for 10 years had fewer clinical vertebral fractures than those who switched to placebo after 5 years.
In the Health Outcomes and Reduced Incidence with Zoledronic Acid Once Yearly (HORIZON) study extension, women who received 6 annual infusions of zoledronic acid had fewer morphometric vertebral fractures than those who switched to placebo after 3 years.
A hip T-score between –2 and –2.5 in FLEX and below –2.5 in the HORIZON extension predicted a beneficial response to continued therapy. Therefore, the ASBMR task force suggests that after 5 years of oral bisphosphonate or 3 years of intravenous therapy, risk reassessment should be considered.
In women at high risk for fracture (such as those who are older, have a low hip T-score or high fracture risk score, have a history of major osteoporotic fracture, or have experienced a fracture during therapy), continuation of treatment for as long as 10 years (oral) or 6 years (intravenous), with periodic evaluation, should be considered.
The ASBMR task force also found that the risk of atypical femoral fracture—but not osteonecrosis of the jaw—clearly increases with the duration of bisphosphonate therapy. However, such rare events are outweighed by vertebral fracture risk reduction in high-risk patients. For women who do not have a high fracture risk after 3 to 5 years of bisphosphonate therapy, a drug holiday of 2 to 3 years can be considered.
The ASBMR task force acknowledged that its suggested approach for long-term bisphosphonate use is based on limited evidence and was studied only for vertebral fracture reduction in a population that was mostly white and postmenopausal. This approach does not replace the need for clinical judgment. The task force also points out that future trials are unlikely to provide data for the formulation of definitive recommendations.
What this EVIDENCE means for practice
Patients who begin oral bisphosphonate therapy should continue it for 5 years, and those who start intravenous therapy should continue it for 3 years. After that time, the decision concerning continued therapy versus a “drug holiday” requires clinical judgment that takes into account the patient’s level of risk. Notable risk factors include a continued low T-score, older age, and any previous fracture, especially if that fracture occurred during therapy.
In the pipeline: The trabecular bone score may help us refine fracture risk prediction
Silva BC, Broy SB, Boutroy S, Schousboe JT, Shepherd JA, Leslie WD. Fracture risk prediction by non-BMD DXA measures: the 2015 ISCD official positions. Part 2: Trabecular bone score. J Clin Densitom. 2015;18(3):309–330.
As measured by dual-energy x-ray absorptiometry (DXA), BMD is a major determinant of bone strength and fracture risk. Although DXA BMD is considered the gold standard for the diagnosis of osteoporosis, most individuals who experience a fragility fracture will have BMD values in the osteopenic or even normal range. This observation implies that the risk of fracture depends on factors other than BMD.
A number of skeletal features other than BMD, such as bone geometry, microarchitecture, mineralization, bone remodeling, and microdamage, contribute to bone strength and overall fracture risk (FIGURE). These features and characteristics of the skeleton that influence bone’s ability to resist fracture are known as bone quality.
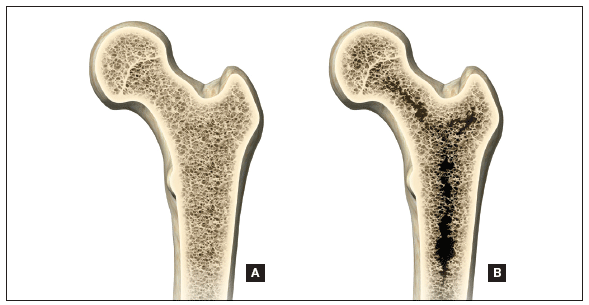
Important aspects of bone quality—namely, bone microarchitecture and bone remodeling—can be assessed in bone biopsies by histomorphometry and microcomputed tomography. However, iliac crest bone biopsy is an invasive, not widely available procedure, now used primarily as a research tool.
Alternatively, a number of noninvasive imaging modalities, including quantitative computed tomography (QCT) and high-resolution magnetic resonance imaging, can measure bone geometry, microarchitecture, and bone strength and distinguish between individuals with and without fragility fracture. However, compared with standard DXA, these technologies have higher cost, a greater dose of ionizing radiation (QCT), and limited accessibility.
A major challenge, therefore, has been to incorporate into clinical practice a readily available, noninvasive technology that permits improvement in fracture risk prediction beyond that provided by the combination of standard DXA measurements and clinical risk factors. To this end, the trabecular bone score (TBS), a gray-level textural index derived from the lumbar spine DXA image, has been investigated.
How TBS assessment works
The report by Silva and colleagues comes from a task force of the International Society for Clinical Densitometry. TBS is a textual index that evaluates pixel gray-level variations in the lumbar spine DXA image, providing an indirect index of trabecular architecture.
A dense trabecular structure produces a 2-dimensional image with a large number of pixel-value variations of small amplitude and, consequently, a high TBS value. Conversely, a 2-dimensional projection of deteriorated bone architecture produces an image with a low number of pixel-value variations of high amplitude and, therefore, a low TBS.
TBS is measured in the same region of interest as the lumbar spine BMD measurement by dedicated software (TBS iNsight; Medimaps, Plan-les-Ouates, Switzerland). TBS can be obtained from lumbar spine DXA images acquired using the latest generations of GE Lunar (Madison, Wisconsin) or Hologic (Bedford, Massachusetts) densitometers, such as Prodigy and iDXA or Delphi, Horizon, QDR 4500, and Discovery.
The TBS result (which is unitless) is given for each vertebra and for the total lumbar spine (L1–L4). Abnormal vertebrae, including fractured vertebrae and vertebrae with osteoarthritic changes, can be excluded from the TBS analysis, as is done for the BMD measurement.
Silva and colleagues conclude that the ability of TBS to predict fracture risk is partially independent of central DXA BMD, clinical risk factors, and fracture probability estimated by FRAX. Based on these findings, TBS may be used to assess fracture risk in clinical practice and can be used in association with FRAX and BMD to adjust FRAX probability of fracture, guiding treatment decisions.
TBS should not be used alone to determine treatment recommendations, and it is not useful for monitoring bisphosphonate treatment in postmenopausal women with osteoporosis.
Although TBS is not readily available to most women’s health care clinicians, it is a promising noninvasive software addition to existing DXA equipment. We need to continue to monitor studies of its efficacy and potential to further enhance our understanding of which women should be treated for osteoporosis and which should not.
- Wright NC, Looker AC, Saag KG, et al. The recent prevalence of osteoporosis and low bone mass in the United States based on bone mineral density at the femoral neck or lumbar spine. J Bone Miner Res. 2014;29(11):2520–2526.
- Management of osteoporosis in postmenopausal women: 2010 position statement of the North American Menopause Society. Menopause. 2010;17(1):25–54.
- Burge R, Dawson-Hughes B, Solomon DH, Wong JB, King AB, Tosterson A. Incidence and economic burden of osteoporosis-related fractures in the United States. 2007;22(3):465–475.
- Goss PE, Ingle JN, Martino S, et al. A randomized trial of letrozole in postmenopausal women after five years of tamoxifen therapy for early-stage breast cancer. N Engl J Med. 2003;349(19):1793–1802.
- Coombes RC, Hall E, Gibson LJ, et al. A randomized trial of exemestane after two to three years of tamoxifen therapy in postmenopausal women with primary breast cancer. N Engl J Med. 2004;350(11):1081–1092.
- Johnell O, Kanis JA. An estimate of the worldwide prevalence and disability associated with osteoporotic fractures. Osteoporos Int. 2006;17(12):1726–1733.
- Eisman JA, Bogoch ER, Dell R, et al; ASBMR Task Force on secondary fracture prevention. Making the first fracture the last fracture: ASBMR task force report on secondary fracture prevention. J Bone Miner Res. 2012;27(10):2039–2046.
- Adler RA, Fuleihan GE, Bauer DC, Camacho PM, Clarke BL, Clines GA. Managing osteoporosis in patients on long-term bisphosphonate treatment: Report of a task force on the American Society for Bone and Mineral Research [published online ahead of print September 9, 2015]. J Bone Miner Res. doi:10.1002/jbmr.2708.
- Black DM, Schwartz AV, Ensrud KE, et al; FLEX Research Group. Effects of continuing or stopping alendronate after five years of treatment. The Fracture Intervention Trial Long-Term Extension (FLEX): a randomized trial. JAMA. 2006;296(24):2927–2938.
- Mellström DD, Sörensen OH, Goemaere S, Roux C, Johnson TD, Chines AA. Seven years of treatment with risedronate in women with postmenopausal osteoporosis. Calcif Tissue Int. 2004;75(6):462–468.
- Black DM, Reid IR, Boonen S, et al. The effect of three versus six years of zoledronic acid treatment of osteoporosis: a randomized extension to the HORIZON-Pivotal Fracture Trial (PFT). J Bone Miner Res. 2012;7(2):243–254.
- Von Haehling S, Morley JE, Anker SD. An overview of sarcopenia: facts and numbers on prevalence and clinical impact. J Cachex Sarcopenia Muscle. 2010;1(2):129–133.
- Coin A, Perissinotto E, Enzi G, et al. Predictors of low bone mineral density in the elderly: the role of dietary intake, nutritional status and sarcopenia. Eur J Clin Nutr. 2008;62(6):802–809.
- Taaffe DR, Cauley JA, Danielson M, et al. Race and sex effects on the association between muscle strength, soft tissue, and bone mineral density in healthy elders: the Health, Aging, and Body Composition Study. J Bone Miner Res. 2001;16(7):1343–1352.
- Fielding RA, Vellas B, Evans WJ, et al. Sarcopenia: an undiagnosed condition in older adults. Current consensus definition: prevalence, etiology, and consequences. International Working Group on Sarcopenia. J Am Med Dir Assoc. 2011;12(4):249–256.
- Kanis JA, McCloskey EV, Johansson H, Oden A, Melton LJ 3rd, Khaltaev N. A reference standard for the description of osteoporosis. Bone. 2008;42(3):467–475.
- Cheng Q, Zhu X, Zhang X, et al. A cross-sectional study of loss of muscle mass corresponding to sarcopenia in healthy Chinese men and women: reference values, prevalence, and association with bone mass. J Bone Miner Metab. 2013;32(1):78–88.

|
Steven R. Goldstein, MD, CCD, NCMP
Dr. Goldstein is Professor of Obstetrics and Gynecology at New York University School of Medicine and Director of Gynecologic Ultrasound and Co-Director of Bone Densitometry and Body Composition at New York University Medical Center in New York City. He serves on the OBG Management Board of Editors.
Dr. Goldstein reports that he serves on the gynecology advisory boards of Amgen and Pfizer.
|
|
Steven R. Goldstein, MD, CCD, NCMP
Dr. Goldstein is Professor of Obstetrics and Gynecology at New York University School of Medicine and Director of Gynecologic Ultrasound and Co-Director of Bone Densitometry and Body Composition at New York University Medical Center in New York City. He serves on the OBG Management Board of Editors.
Dr. Goldstein reports that he serves on the gynecology advisory boards of Amgen and Pfizer.
More than 9 million American women are estimated to have osteoporosis, making it the most common bone disease and an especially prevalent health problem in postmenopausal women.1
Osteoporosis causes 2 million fractures every year, leading to major medical consequences for patients.2 These fractures are associated with significant morbidity and mortality, often requiring the extended use of long-term care facilities and causing severe disability.
With a rapidly increasing elderly population, the cost of care for osteoporosis is estimated to rise to $25.3 billion by 2025.3 The medical and financial impacts of osteoporosis underscore the need for timely screening and diagnosis and the implementation of effective prevention and treatment strategies. As women’s health care providers, we are the first line of screening and diagnosis and implementation of effective treatment strategies.
In this “Update on Osteoporosis,” I discuss:
- 2 studies that explore the use of zoledronic acid or denosumab in women with breast cancer undergoing adjuvant therapy with an aromatase inhibitor
- a report of a task force of the American Society for Bone and Mineral Research on the long-term use of bisphosphonate therapy
- a look at the trabecular bone score as a tool to characterize bone strength and overall fracture risk
- the relationship of sarcopenia and body composition with osteoporosis.
Can zoledronic acid or denosumab counter bone loss associated with aromatase inhibitors?
Majithia N, Atherton PJ, Lafky JM, et al. Zoledronic acid for treatment of osteopenia and osteoporosis in women with primary breast cancer undergoing adjuvant aromatase inhibitor therapy: a 5-year follow-up [published online ahead of print August 23, 2015]. Support Care Cancer. doi:10.1007/s00520-015-2915-2.
Gnant M, Pfeiler G, Dubsky PC, et al. Adjuvant denosumab in breast cancer (ABCSG-18): a multicenter, randomized, double-blind, placebo-controlled trial. Lancet. 2015;386(9992):433–443.
Every gynecologist and women’s health care provider knows that breast cancer is a prevalent disease. It is also likely to be the most feared entity among our patients.
Aromatase inhibitors (AIs) have been shown consistently to provide benefit for patients with hormone-positive breast cancer and frequently are incorporated into treatment in both the adjuvant and metastatic settings. By inactivating the enzyme responsible for converting androgens to estrogens, AIs reduce plasma estrogen levels. This effect is helpful in the treatment of breast cancer, but it also has consequences for bone mineral density (BMD).
Estrogen promotes the inactivation of osteoclasts, thereby minimizing bone mineral resorption. When plasma levels of estrogen are suppressed, women are susceptible to loss of BMD and development of osteoporosis. This adverse effect has been observed in several clinical trials.4,5
Study focused on women with low bone mass
Majithia and colleagues set out to explore whether zoledronic acid would prevent loss of BMD in postmenopausal women with preexisting osteopenia or osteoporosis who were initiating adjuvant therapy with the AI letrozole for primary breast cancer.
Sixty postmenopausal women with estrogen-receptor–positive breast cancer and a BMD T-score of –2.0 or less were enrolled. Participants received letrozole 2.5 mg and vitamin D 400 IU daily, calcium 500 mg twice daily, and IV zoledronic acid 4 mg every 6 months for a maximum of 5 years or until disease progression. BMD at the lumbar spine and femoral neck was recorded at the start of the study and annually for 5 years. Patients were evaluated for fractures every 6 months for the duration of the trial.
Findings of Majithia and colleagues. After 5 years of therapy, mean BMD increased by 11.6% (P = .01) at the lumbar spine and by 8.8% (P = .01) at combined sites. Femoral neck BMD increased by 4.2%, although this increase was not significant (P = .23). At the end of the trial, BMDs were consistent with osteoporosis in 7% and osteopenia in 36% of patients. A total of 6 fractures were reported after 417 individual assessments.
Investigators concluded that zoledronic acid appears to prevent further bone loss in postmenopausal breast cancer patients with osteopenia or osteoporosis starting treatment with letrozole. These findings support concurrent initiation of bisphosphonate and AI therapy in this high-risk population.
Denosumab significantly delayed time to first clinical fracture
Gnant and colleagues performed a prospective, double-blind, placebo-controlled, phase 3 trial in which postmenopausal patients with early hormone-receptor– positive breast cancer undergoing treatment with an AI were randomly assigned, in a 1:1 ratio, to denosumab 60 mg or placebo administered subcutaneously every 6 months. The endpoint was time from randomization to first clinical fracture. A total of 3,420 patients were enrolled and studied over 7 years.
Findings of Gnant and colleagues. Patients given denosumab had a significantly delayed time to their first clinical fracture (hazard ratio [HR], 0.50; 95% confidence interval [CI], 0.39–0.65), compared with those in the placebo group.
The overall lower number of fractures in the denosumab group (92 vs 176) was similar in all patient subgroups, including patients with a BMD T-score of –1 or higher at baseline (n = 1,872; HR, 0.44; 95% CI, 0.31–0.64; P<.0001) and those with a BMD T-score greater than –1 at baseline (n = 1,548; HR, 0.57; 95% CI, 0.40–0.82; P = .002).
The incidence of adverse events in the safety analysis set (all patients who received at least one dose of the study drug) did not differ between the denosumab (1,366 events, or 80%) and placebo groups (1,344 events, or 79%); nor did the numbers of serious adverse events (521 vs 511, or 30% in each group). The main adverse events were arthralgia and other AI-related symptoms; no additional toxicity from the study drug was reported. Despite proactive adjudication of every potential case of osteonecrosis of the jaw by an international expert panel, no cases were reported.
Differences between the 2 studies
The study with zoledronic acid looked at BMD in a small number of patients with low bone mass over a 1-year time frame. The denosumab study was extremely large and looked at clinical fractures in women with normal as well as low bone mass.
We all have patients with breast cancer, many of them being treated with an AI. Even those who begin AI therapy with normal bone mass appear to benefit from concomitant therapy with denosumab given subcutaneously every 6 months.
How long should bisphosphonate therapy be continued?
Adler RA, Fuleihan GE, Bauer DC, et al. Managing osteoporosis in patients on long-term bisphosphonate treatment. Report of a task force of the American Society for Bone and Mineral Research [published online ahead of print September 9, 2015]. J Bone Miner Res. doi:10.1002/jbmr.2708.
An osteoporotic fracture occurs every 3 seconds worldwide, and 1 in 3 women will experience a fragility fracture after age 50.6,7 Solid evidence from randomized, placebo-controlled trials of 3 to 4 years’ duration supports the efficacy of bisphosphonates in decreasing the risk of vertebral fracture (by 40%–70%), hip fracture (by 20%–50%), and nonvertebral fracture (by 15%–39%), depending on the drug, skeletal site, and individual risk profile.8 As a result, these drugs have dominated the landscape of osteoporosis therapies for the past 2 decades.
Extension trials have suggested that prolonged bisphosphonate therapy is effective in maintaining BMD as long as 10 years with alendronate, 7 years with risedronate, and 6 years with zoledronic acid, but evidence regarding fracture risk reduction with prolonged therapy is less convincing.9–11
This report from the American Society for Bone and Mineral Research (ASBMR) examines fracture reduction—not simply BMD efficacy—in 2 trials that explored long-term use of bisphosphonates.
What 2 long-term studies reveal about fracture risk
In the Fracture Intervention Trial Long-Term Extension (FLEX), postmenopausal women who received alendronate for 10 years had fewer clinical vertebral fractures than those who switched to placebo after 5 years.
In the Health Outcomes and Reduced Incidence with Zoledronic Acid Once Yearly (HORIZON) study extension, women who received 6 annual infusions of zoledronic acid had fewer morphometric vertebral fractures than those who switched to placebo after 3 years.
A hip T-score between –2 and –2.5 in FLEX and below –2.5 in the HORIZON extension predicted a beneficial response to continued therapy. Therefore, the ASBMR task force suggests that after 5 years of oral bisphosphonate or 3 years of intravenous therapy, risk reassessment should be considered.
In women at high risk for fracture (such as those who are older, have a low hip T-score or high fracture risk score, have a history of major osteoporotic fracture, or have experienced a fracture during therapy), continuation of treatment for as long as 10 years (oral) or 6 years (intravenous), with periodic evaluation, should be considered.
The ASBMR task force also found that the risk of atypical femoral fracture—but not osteonecrosis of the jaw—clearly increases with the duration of bisphosphonate therapy. However, such rare events are outweighed by vertebral fracture risk reduction in high-risk patients. For women who do not have a high fracture risk after 3 to 5 years of bisphosphonate therapy, a drug holiday of 2 to 3 years can be considered.
The ASBMR task force acknowledged that its suggested approach for long-term bisphosphonate use is based on limited evidence and was studied only for vertebral fracture reduction in a population that was mostly white and postmenopausal. This approach does not replace the need for clinical judgment. The task force also points out that future trials are unlikely to provide data for the formulation of definitive recommendations.
What this EVIDENCE means for practice
Patients who begin oral bisphosphonate therapy should continue it for 5 years, and those who start intravenous therapy should continue it for 3 years. After that time, the decision concerning continued therapy versus a “drug holiday” requires clinical judgment that takes into account the patient’s level of risk. Notable risk factors include a continued low T-score, older age, and any previous fracture, especially if that fracture occurred during therapy.
In the pipeline: The trabecular bone score may help us refine fracture risk prediction
Silva BC, Broy SB, Boutroy S, Schousboe JT, Shepherd JA, Leslie WD. Fracture risk prediction by non-BMD DXA measures: the 2015 ISCD official positions. Part 2: Trabecular bone score. J Clin Densitom. 2015;18(3):309–330.
As measured by dual-energy x-ray absorptiometry (DXA), BMD is a major determinant of bone strength and fracture risk. Although DXA BMD is considered the gold standard for the diagnosis of osteoporosis, most individuals who experience a fragility fracture will have BMD values in the osteopenic or even normal range. This observation implies that the risk of fracture depends on factors other than BMD.
A number of skeletal features other than BMD, such as bone geometry, microarchitecture, mineralization, bone remodeling, and microdamage, contribute to bone strength and overall fracture risk (FIGURE). These features and characteristics of the skeleton that influence bone’s ability to resist fracture are known as bone quality.
Important aspects of bone quality—namely, bone microarchitecture and bone remodeling—can be assessed in bone biopsies by histomorphometry and microcomputed tomography. However, iliac crest bone biopsy is an invasive, not widely available procedure, now used primarily as a research tool.
Alternatively, a number of noninvasive imaging modalities, including quantitative computed tomography (QCT) and high-resolution magnetic resonance imaging, can measure bone geometry, microarchitecture, and bone strength and distinguish between individuals with and without fragility fracture. However, compared with standard DXA, these technologies have higher cost, a greater dose of ionizing radiation (QCT), and limited accessibility.
A major challenge, therefore, has been to incorporate into clinical practice a readily available, noninvasive technology that permits improvement in fracture risk prediction beyond that provided by the combination of standard DXA measurements and clinical risk factors. To this end, the trabecular bone score (TBS), a gray-level textural index derived from the lumbar spine DXA image, has been investigated.
How TBS assessment works
The report by Silva and colleagues comes from a task force of the International Society for Clinical Densitometry. TBS is a textual index that evaluates pixel gray-level variations in the lumbar spine DXA image, providing an indirect index of trabecular architecture.
A dense trabecular structure produces a 2-dimensional image with a large number of pixel-value variations of small amplitude and, consequently, a high TBS value. Conversely, a 2-dimensional projection of deteriorated bone architecture produces an image with a low number of pixel-value variations of high amplitude and, therefore, a low TBS.
TBS is measured in the same region of interest as the lumbar spine BMD measurement by dedicated software (TBS iNsight; Medimaps, Plan-les-Ouates, Switzerland). TBS can be obtained from lumbar spine DXA images acquired using the latest generations of GE Lunar (Madison, Wisconsin) or Hologic (Bedford, Massachusetts) densitometers, such as Prodigy and iDXA or Delphi, Horizon, QDR 4500, and Discovery.
The TBS result (which is unitless) is given for each vertebra and for the total lumbar spine (L1–L4). Abnormal vertebrae, including fractured vertebrae and vertebrae with osteoarthritic changes, can be excluded from the TBS analysis, as is done for the BMD measurement.
Silva and colleagues conclude that the ability of TBS to predict fracture risk is partially independent of central DXA BMD, clinical risk factors, and fracture probability estimated by FRAX. Based on these findings, TBS may be used to assess fracture risk in clinical practice and can be used in association with FRAX and BMD to adjust FRAX probability of fracture, guiding treatment decisions.
TBS should not be used alone to determine treatment recommendations, and it is not useful for monitoring bisphosphonate treatment in postmenopausal women with osteoporosis.
Although TBS is not readily available to most women’s health care clinicians, it is a promising noninvasive software addition to existing DXA equipment. We need to continue to monitor studies of its efficacy and potential to further enhance our understanding of which women should be treated for osteoporosis and which should not.
- Wright NC, Looker AC, Saag KG, et al. The recent prevalence of osteoporosis and low bone mass in the United States based on bone mineral density at the femoral neck or lumbar spine. J Bone Miner Res. 2014;29(11):2520–2526.
- Management of osteoporosis in postmenopausal women: 2010 position statement of the North American Menopause Society. Menopause. 2010;17(1):25–54.
- Burge R, Dawson-Hughes B, Solomon DH, Wong JB, King AB, Tosterson A. Incidence and economic burden of osteoporosis-related fractures in the United States. 2007;22(3):465–475.
- Goss PE, Ingle JN, Martino S, et al. A randomized trial of letrozole in postmenopausal women after five years of tamoxifen therapy for early-stage breast cancer. N Engl J Med. 2003;349(19):1793–1802.
- Coombes RC, Hall E, Gibson LJ, et al. A randomized trial of exemestane after two to three years of tamoxifen therapy in postmenopausal women with primary breast cancer. N Engl J Med. 2004;350(11):1081–1092.
- Johnell O, Kanis JA. An estimate of the worldwide prevalence and disability associated with osteoporotic fractures. Osteoporos Int. 2006;17(12):1726–1733.
- Eisman JA, Bogoch ER, Dell R, et al; ASBMR Task Force on secondary fracture prevention. Making the first fracture the last fracture: ASBMR task force report on secondary fracture prevention. J Bone Miner Res. 2012;27(10):2039–2046.
- Adler RA, Fuleihan GE, Bauer DC, Camacho PM, Clarke BL, Clines GA. Managing osteoporosis in patients on long-term bisphosphonate treatment: Report of a task force on the American Society for Bone and Mineral Research [published online ahead of print September 9, 2015]. J Bone Miner Res. doi:10.1002/jbmr.2708.
- Black DM, Schwartz AV, Ensrud KE, et al; FLEX Research Group. Effects of continuing or stopping alendronate after five years of treatment. The Fracture Intervention Trial Long-Term Extension (FLEX): a randomized trial. JAMA. 2006;296(24):2927–2938.
- Mellström DD, Sörensen OH, Goemaere S, Roux C, Johnson TD, Chines AA. Seven years of treatment with risedronate in women with postmenopausal osteoporosis. Calcif Tissue Int. 2004;75(6):462–468.
- Black DM, Reid IR, Boonen S, et al. The effect of three versus six years of zoledronic acid treatment of osteoporosis: a randomized extension to the HORIZON-Pivotal Fracture Trial (PFT). J Bone Miner Res. 2012;7(2):243–254.
- Von Haehling S, Morley JE, Anker SD. An overview of sarcopenia: facts and numbers on prevalence and clinical impact. J Cachex Sarcopenia Muscle. 2010;1(2):129–133.
- Coin A, Perissinotto E, Enzi G, et al. Predictors of low bone mineral density in the elderly: the role of dietary intake, nutritional status and sarcopenia. Eur J Clin Nutr. 2008;62(6):802–809.
- Taaffe DR, Cauley JA, Danielson M, et al. Race and sex effects on the association between muscle strength, soft tissue, and bone mineral density in healthy elders: the Health, Aging, and Body Composition Study. J Bone Miner Res. 2001;16(7):1343–1352.
- Fielding RA, Vellas B, Evans WJ, et al. Sarcopenia: an undiagnosed condition in older adults. Current consensus definition: prevalence, etiology, and consequences. International Working Group on Sarcopenia. J Am Med Dir Assoc. 2011;12(4):249–256.
- Kanis JA, McCloskey EV, Johansson H, Oden A, Melton LJ 3rd, Khaltaev N. A reference standard for the description of osteoporosis. Bone. 2008;42(3):467–475.
- Cheng Q, Zhu X, Zhang X, et al. A cross-sectional study of loss of muscle mass corresponding to sarcopenia in healthy Chinese men and women: reference values, prevalence, and association with bone mass. J Bone Miner Metab. 2013;32(1):78–88.
In this Article
- Optimal duration of bisphosphonate therapy?
- How a new bone score may help us refine fracture risk prediction
- Is sarcopenia an important piece of the bone health equation?
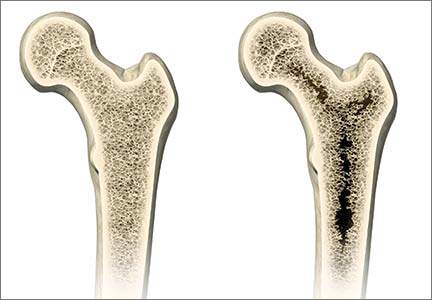
Current Management of Acute Bronchiolitis: An Evidence-Based Approach
Case
An 8-week-old male infant was brought to the ED by his parents after an episode in which it appeared the baby had stopped breathing. The parents stated that while lying on his mother’s lap at home, the patient stopped breathing for approximately 10 to 15 seconds, during which time his face exhibited a bluish color. They further noted that the patient began breathing again after gentle stimulation and had been acting normally since.
The patient was born at 39 weeks gestation via normal vaginal delivery and without any complications. His parents further stated that prior to the cessation of breathing incident, his symptoms of nasal congestion, decreased energy level, and fast breathing had gradually worsened over the past 2 days. The parents also noted that the infant had not been feeding as well over the past 2 days.
Upon arrival, the patient’s vital signs were: heart rate, 140 beats/minute; respiratory rate (RR), 72 beats/minute; and temperature 101.3°F. Oxygen saturation was 92% on room air. On physical examination, the infant had significant rhinorrhea, moderate intercostal and supraclavicular retractions, ausculatory wheezes, and transmitted upper airway noises throughout.
Overview
Bronchiolitis, a disorder caused by a viral lower respiratory tract infection, is the most common lower respiratory infection in children younger than age 2 years.1 In 2014, the American Academy of Pediatrics (AAP) characterized bronchiolitis as “rhinitis, cough, tachypnea, wheezing, rales, use of accessory muscles, and/or nasal flaring in children under 24 months of age.”2 This condition is the most common cause of hospitalization in the first 12 months of life. It is responsible for over 100,000 admissions annually at an estimated cost to the healthcare system of $1.73 billion.3
Etiology and Pathophysiology
Respiratory syncytial virus (RSV) is the most common cause of bronchiolitis. In the United States, the highest incidence of infection occurs during the months of December through March, with some degree of regional variability.4 A number of other viruses that can cause bronchiolitis include human metapneumovirus, parainfluenza virus, and influenza virus.1 Infection with RSV does not grant permanent immunity, and reinfection is common throughout life.2
Pathophysiologically, bronchiolitis is characterized by an invasion of bronchial epithelial cells that lead to to cell death and sloughing into the bronchial lumen. This, coupled with increased mucous production and submucosal edema, leads to a narrowing of the bronchial lumen and obstruction of airflow.5
Clinical Manifestations
Bronchiolitis represents a constellation of signs and symptoms beginning with those of an upper respiratory tract infection, including nasal congestion and rhinorrhea with mild cough. On days 3 to 5, the following symptoms develop: tachypnea, wheezing, rales, and signs of respiratory distress (eg, grunting, nasal flaring, inter-/subcostal retractions). Approximately two-thirds of patients will develop a fever.2 Recovery tends to begin around days 5 to 7, with the median duration of illness being 12 days.1 It should be noted that bronchiolitis represents a highly variable and dynamic disease state. Transient episodes of improvement and worsening are common, emphasizing the importance of serial examinations and assessments. Though rare, progression to respiratory failure and death do occur.2
History and Risk Stratification
The focus of the initial history by the clinician should serve two primary purposes. First, it is important to differentiate infants with probable bronchiolitis from those with other disease states having similar clinical manifestations. One of the most challenging diseases to differentiate from bronchiolitis is that of reactive airway disease (RAD). Eliciting a history of allergic rhinitis, eczema, or a family history of asthma may be helpful in determining the precise etiology of the patient’s symptoms. Although no longer recommended for children with bronchiolitis (as will be later discussed), a trial of a bronchodilation may be beneficial in the setting of familial atopy.
The second—and perhaps most important—aspect of patient history is to determine the presence of risk factors for both apnea and the development of severe bronchiolitis. Regarding the risk factors for apnea, Willwerth et al6 developed a set of criteria to identify patients at high risk for apnea in the inpatient setting. Patients were considered high risk if they were born at full term and were younger than 1 month of age; if they were born preterm (<37 weeks gestation) and were younger than 48 weeks postconception; and/or if the infant’s parents or a clinician had already witnessed an episode of apnea during the patient’s illness. In this study, all patients who developed apnea were correctly identified by the risk criteria.6 Risk factors for severe bronchiolitis include the following: patient age younger than 12 weeks; patient prematurity younger than 37 weeks gestation; and an underlying hemodynamically significant congenital heart disease, chronic lung disease/bronchopulmonary dysplasia, or an immunocompromised state.1
Diagnosis
In 2014, the AAP updated its guidelines on the diagnosis, management, and prevention of bronchiolitis. One of the strongest statements in these guidelines emphasize that the diagnosis of bronchiolitis should be based almost exclusively on the history and physical examination.2 In children younger than age 2 years, historical features such as a viral prodrome, followed by progressively worsening increased respiratory effort and signs and symptoms of lower respiratory-tract disease (eg, wheezing), should guide clinicians to the diagnosis of bronchiolitis. Although nonspecific, physical examination findings such as rhinorrhea, cough, tachypnea, wheezing, rales, and increased respiratory effort—when coupled with a good history—can be beneficial in the diagnosis of bronchiolitis.
Pulse Oximetry
Pulse oximetry has become a standard part of the clinical assessment of patients with bronchiolitis. This is based on data suggesting that pulse oximetry detects hypoxia in cases where it was not suspected on physical examination alone.7 However, the effectiveness of pulse oximetry in predicting clinical outcomes is limited. Pulse oximetry should not be used as a proxy for respiratory distress, as studies have shown poor correlation between respiratory distress and oxygen saturations in infants with lower respiratory tract infection.8
Radiographic Evaluation
Regarding the diagnosis of bronchiolitis, the AAP notes, “radiographic and laboratory studies should not be obtained routinely.”2 While many children with bronchiolitis may have abnormalities on radiographs, there is insufficient data to suggest that chest radiographs correlate with disease severity. In addition, several studies, including a prospective cohort study by Schuh et al,9 have shown that infants with suspected lower respiratory tract infections who undergo radiography are more likely to receive antibiotics without any difference in outcomes.
Laboratory Studies
As stated in the AAP guidelines, routine laboratory testing, particularly virologic studies for RSV, have little role in the diagnosis of bronchiolitis. Since numerous viruses can cause bronchiolitis and have similar clinical presentations, the absence of identification of a particular virologic agent does not exclude the diagnosis of bronchiolitis and is moreover unlikely to alter management.
Although routine laboratory evaluation is not recommended in infants with bronchiolitis, one subgroup in which it may be beneficial is in the assessment of serious bacterial infections (SBIs) in febrile infants with bronchiolitis who are younger than 60 days old. Levine et al10 conducted a large, multicenter, prospective, cross-sectional study of young, febrile infants to determine the risk of SBI in those with RSV bronchiolitis versus those without RSV bronchiolitis. They found that overall febrile infants younger than age 60 days with RSV bronchiolitis have a lower rate of SBI than those without RSV (7% v 12.5%, respectively).10 In infants between age 28 and 60 days with RSV bronchiolitis, the origin of all SBIs in the study were urinary tract infections. In patients younger than 28 days of age, the risk of developing an SBI was found to be no different between the RSV-positive and RSV-negative groups.10
Based on the findings in this study, it is recommended that, at the very least, urinalysis for bacterial infection be performed in all infants with RSV bronchiolitis who are younger than age 60 days. Furthermore, since there was no difference in the rates of SBI in patients younger than age 28 days, infants in this age range should undergo a full septic work-up (blood, urine, and cerebrospinal fluid)—regardless of RSV infection status. For infants between ages 28 and 60 days, there is not enough evidence to recommend for or against further laboratory evaluation other than urinalysis.
Treatment


Nasal Suctioning
Nasal suctioning has become the first-line treatment for infants with bronchiolitis. It is used to clear secretions from the nasal passages to aid in respiration, which is particularly important in younger infants—who are obligate nose breathers. Current recommendations are to perform suctioning with increasing respiratory effort, before feeding and before laying the infant down to sleep.1
Bronchodilators
In the past, bronchodilators such as the β-agonist albuterol have been used to treat bronchiolitis with the idea that bronchial smooth muscle relaxation would improve clinical symptoms. In its 2006 guidelines, the AAP had recommended a trial of albuterol and continuation only if there was a documented objective response. In the 2014 updated guidelines, however, the AAP no longer recommends the use of albuterol in any capacity.
Although several meta-analyses and systematic reviews have demonstrated that bronchodilators may improve clinical symptoms scores, they did not affect disease resolution, need for hospitalization, or length of hospital stay.2 In addition, a recent Cochrane systematic review noted no benefit in the clinical course of infants with bronchiolitis treated with bronchodilators, and cited the potential adverse events (tachycardia and tremors) as outweighing any potential benefit.11 In addition to albuterol, the AAP no longer recommends the use of nebulized epinephrine in the treatment of bronchiolitis.2
Hypertonic Saline
Although hypertonic saline (HTS) has been increasingly studied for the treatment of bronchiolitis, the AAP does not recommend its use in the ED. Despite evidence that HTS may reduce hospital length of stay after 24 hours of use in settings where the typical duration of hospitalization exceeds 3 days, it has not been shown to reduce the rate of hospitalization when used in an emergency setting.2
Corticosteroids
While there is good evidence that corticosteroids are beneficial in treating some respiratory diseases, such as asthma and croup, numerous studies have repeatedly failed to show a benefit in treating bronchiolitis. One of the largest studies, a multicenter, randomized, controlled trial of dexamethasone for bronchiolitis by the Pediatric Emergency Care Applied Research Network, did not show any alteration in admission rates, respiratory status after 4 hours of observation, or length of hospital stay.12 Accordingly, the AAP strongly recommends against the administration of corticosteroids for bronchiolitis in any setting.2
Oxygen Therapy
Oxygen therapy is often necessary in patients with bronchiolitis who demonstrate hypoxia. The definition of hypoxia in this patient population has remained variable. The AAP has established a threshold of oxyhemoglobin saturation (SpO2) of less than 90% to define hypoxia and has empowered clinicians to not administer oxygen if the SpO2 exceeds 90%. Based on the oxyhemoglobin dissociation curve, the authors of the AAP guidelines note that when the SpO2 is less than 90%, small decreases in the arterial partial pressure of oxygen (PaO2) result in large decreases in the SpO2. When SpO2 is greater than 90%, however, large increases in PaO2 are associated with only small increased in SpO2. The AAP guidelines note, “In infants and children with bronchiolitis, no data exist to suggest that such increases [in PaO2 and SpO2] result in any clinically significant differences in physiologic function, patient symptoms, or clinical outcomes.”2
A relatively new method of administration of oxygen to infants with bronchiolitis is via a humidified, heated, high-flow nasal cannula (HHHFNC). This therapy has been shown to generate continuous positive airway pressure, which improves respiratory effort, reduces the work of breathing, and may decrease the need for intubation.2
Patient Disposition
One of the most challenging tasks for emergency physicians (EPs) is determining the appropriate disposition of infants with bronchiolitis. The variable presentation and dynamic nature of the disease make this particularly difficult. Patients at high risk for apnea should be admitted to the hospital for observation and further care as needed. Admission also should be strongly considered for those with significantly increased work of breathing and tachypnea that does not improve with suctioning—especially when these interfere with feeding. Infants with poor feeding or evidence of dehydration should be admitted to the hospital for intravenous (IV) fluid hydration or nasogastric feedings. Patients with hypoxia (SpO2 saturations <90%) should also be admitted for supplemental oxygen therapy. It should be noted, however, the AAP recommends “spot-checks” over continuous pulse oximetry in patients who do not require oxygen therapy.2
Another important factor affecting patient disposition is the ability of the caregiver to provide basic patient care and ensure close outpatient follow-up. Prior to discharge, caregivers should be educated on the highly dynamic nature of bronchiolitis and the signs and symptoms that would require prompt return to the ED—especially if the infant has risk factors for the development of severe disease.
Case Conclusion
Based on the patient’s symptoms, history (most notably, the recent incident of sleep apnea at home), and physical examination, the EP quickly identified this infant was at a high risk for both severe bronchiolitis and apnea and required aggressive management. Nasal suctioning was immediately performed to help clear the patient’s secretions; this, however, only slightly improved his RR and work of breathing. Although the infant’s SpO2 was greater than 90% on room air, the EP administered oxygen via HHHFNC at 6 L per minute, which produced a significant improvement in both RR and effort.
Given the patient’s age and the presence of a fever, a urinalysis was also obtained, the results of which showed no evidence of infection. Since the patient was only able to bottle-feed for a few minutes at a time, the EP initiated IV fluid hydration and contacted the hospitalist team for inpatient admission.
The infant was gradually weaned from HHHFNC on hospital day 2 but remained with suboptimal oral intake for another 24 hours. By hospital day 4, his work of breathing had improved significantly, and he was feeding well with through the assistance of pre-feeding nasal syringe suctioning. The patient was discharged home in the care of his parents later that same day with only mild tachypnea over baseline. At discharge, the EP emphasized the importance of providing close follow-up with their son’s pediatrician. The infant continued to gradually improve as an outpatient, with resolution of nasal congestion by day 12 of his illness; he returned to his baseline breathing and feeding pattern on day 14.
Dr Schneider is a pediatric emergency medicine fellow, Eastern Virginia Medical School, Children’s Hospital of The King’s Daughters, Norfolk. Dr Clingenpeel is a fellowship director of pediatric emergency medicine, and an associate professor of pediatrics, Eastern Virginia Medical School, Norfolk.
- Joseph M. Evidence-based assessment and management of acute bronchiolitis in the emergency department. Pediatr Emerg Med Pract. 2011;8(3):1-20.
- Ralston SL, Lieberthal AS, Meissner HC, et al; American Academy of Pediatrics. Clinical practice guidelines: the diagnosis, management, and prevention of bronchiolitis [Published correction appears in Pediatrics. 2014;134(5):e1474-e1502]. Pediatrics. 2014;134:5 e1474-e1502.
- Hasegawa K, Tsugawa Y, Brown DF, Mansbach JM, Camargo CA Jr. Trends in bronchiolitis hospitalizations in the United States, 2000-20009. Pediatrics. 2013;32(1):28-36.
- Centers for Disease Control and Prevention (CDC). Respiratory syncytial virus activity—United States, July 2011-January 2013. MMWR Morb Mortal Wkly Rep. 2013;62(8):141-144.
- Harper MB, Fleisher GR. Infectious emergencies. In: Fleisher GR, Ludwig S, eds. Textbook of Pediatric Emergency Medicine. 6th ed. Philadelphia, PA: Lippincott Williams & Wilkins;2010:916-917.
- Willwerth BM, Harper MB, Greenes DS. Identifying hospitalized infants who have bronchiolitis and are at high risk for apnea. Ann Emerg Med. 2006;48(4):441-447.
- Shaw KN, Bell LM, Sherman NH. Outpatient assessment of infants with bronchiolitis. Am J Dis Child. 1991;145(2):151-155.
- Wang EE, Milner RA, Navas L, Maj H. Observer agreement for respiratory signs and oximetry in infants hospitalized with lower respiratory infections. Am Rev Respir Dis. 1992;145(1):106-109.
- Schuh S, Lalani A, Allen U, et al. Evaluation of the utility of radiography in acute bronchiolitis. J Pediatr. 2007;150(4):429-433.
- Levine DA, Platt SL, Dayan PS, et al; Multicenter RSV-SBI Study Group of the Pediatric Emergency Medicine Collaborative Research Committee of the American Academy of Pediatrics. Risk of serious bacterial infection in young febrile infants with respiratory syncytial virus infection. Pediatrics. 2004;113(6):1728-1734.
- Gadomski AM, Scribani MB. Bronchodilators for bronchiolitis. Cochrane Database Syst Rev. 2014;(6):CD001266.
- Corneli HM, Zorc JJ, Majahan P, et al; Bronchiolitis Study Group of the Pediatric Emergency Care Applied Research Network (PECARN). A multicenter, randomized, controlled trial of dexamethasone for bronchiolitis. N Engl J Med. 2007;357(4):331-339.
Case
An 8-week-old male infant was brought to the ED by his parents after an episode in which it appeared the baby had stopped breathing. The parents stated that while lying on his mother’s lap at home, the patient stopped breathing for approximately 10 to 15 seconds, during which time his face exhibited a bluish color. They further noted that the patient began breathing again after gentle stimulation and had been acting normally since.
The patient was born at 39 weeks gestation via normal vaginal delivery and without any complications. His parents further stated that prior to the cessation of breathing incident, his symptoms of nasal congestion, decreased energy level, and fast breathing had gradually worsened over the past 2 days. The parents also noted that the infant had not been feeding as well over the past 2 days.
Upon arrival, the patient’s vital signs were: heart rate, 140 beats/minute; respiratory rate (RR), 72 beats/minute; and temperature 101.3°F. Oxygen saturation was 92% on room air. On physical examination, the infant had significant rhinorrhea, moderate intercostal and supraclavicular retractions, ausculatory wheezes, and transmitted upper airway noises throughout.
Overview
Bronchiolitis, a disorder caused by a viral lower respiratory tract infection, is the most common lower respiratory infection in children younger than age 2 years.1 In 2014, the American Academy of Pediatrics (AAP) characterized bronchiolitis as “rhinitis, cough, tachypnea, wheezing, rales, use of accessory muscles, and/or nasal flaring in children under 24 months of age.”2 This condition is the most common cause of hospitalization in the first 12 months of life. It is responsible for over 100,000 admissions annually at an estimated cost to the healthcare system of $1.73 billion.3
Etiology and Pathophysiology
Respiratory syncytial virus (RSV) is the most common cause of bronchiolitis. In the United States, the highest incidence of infection occurs during the months of December through March, with some degree of regional variability.4 A number of other viruses that can cause bronchiolitis include human metapneumovirus, parainfluenza virus, and influenza virus.1 Infection with RSV does not grant permanent immunity, and reinfection is common throughout life.2
Pathophysiologically, bronchiolitis is characterized by an invasion of bronchial epithelial cells that lead to to cell death and sloughing into the bronchial lumen. This, coupled with increased mucous production and submucosal edema, leads to a narrowing of the bronchial lumen and obstruction of airflow.5
Clinical Manifestations
Bronchiolitis represents a constellation of signs and symptoms beginning with those of an upper respiratory tract infection, including nasal congestion and rhinorrhea with mild cough. On days 3 to 5, the following symptoms develop: tachypnea, wheezing, rales, and signs of respiratory distress (eg, grunting, nasal flaring, inter-/subcostal retractions). Approximately two-thirds of patients will develop a fever.2 Recovery tends to begin around days 5 to 7, with the median duration of illness being 12 days.1 It should be noted that bronchiolitis represents a highly variable and dynamic disease state. Transient episodes of improvement and worsening are common, emphasizing the importance of serial examinations and assessments. Though rare, progression to respiratory failure and death do occur.2
History and Risk Stratification
The focus of the initial history by the clinician should serve two primary purposes. First, it is important to differentiate infants with probable bronchiolitis from those with other disease states having similar clinical manifestations. One of the most challenging diseases to differentiate from bronchiolitis is that of reactive airway disease (RAD). Eliciting a history of allergic rhinitis, eczema, or a family history of asthma may be helpful in determining the precise etiology of the patient’s symptoms. Although no longer recommended for children with bronchiolitis (as will be later discussed), a trial of a bronchodilation may be beneficial in the setting of familial atopy.
The second—and perhaps most important—aspect of patient history is to determine the presence of risk factors for both apnea and the development of severe bronchiolitis. Regarding the risk factors for apnea, Willwerth et al6 developed a set of criteria to identify patients at high risk for apnea in the inpatient setting. Patients were considered high risk if they were born at full term and were younger than 1 month of age; if they were born preterm (<37 weeks gestation) and were younger than 48 weeks postconception; and/or if the infant’s parents or a clinician had already witnessed an episode of apnea during the patient’s illness. In this study, all patients who developed apnea were correctly identified by the risk criteria.6 Risk factors for severe bronchiolitis include the following: patient age younger than 12 weeks; patient prematurity younger than 37 weeks gestation; and an underlying hemodynamically significant congenital heart disease, chronic lung disease/bronchopulmonary dysplasia, or an immunocompromised state.1
Diagnosis
In 2014, the AAP updated its guidelines on the diagnosis, management, and prevention of bronchiolitis. One of the strongest statements in these guidelines emphasize that the diagnosis of bronchiolitis should be based almost exclusively on the history and physical examination.2 In children younger than age 2 years, historical features such as a viral prodrome, followed by progressively worsening increased respiratory effort and signs and symptoms of lower respiratory-tract disease (eg, wheezing), should guide clinicians to the diagnosis of bronchiolitis. Although nonspecific, physical examination findings such as rhinorrhea, cough, tachypnea, wheezing, rales, and increased respiratory effort—when coupled with a good history—can be beneficial in the diagnosis of bronchiolitis.
Pulse Oximetry
Pulse oximetry has become a standard part of the clinical assessment of patients with bronchiolitis. This is based on data suggesting that pulse oximetry detects hypoxia in cases where it was not suspected on physical examination alone.7 However, the effectiveness of pulse oximetry in predicting clinical outcomes is limited. Pulse oximetry should not be used as a proxy for respiratory distress, as studies have shown poor correlation between respiratory distress and oxygen saturations in infants with lower respiratory tract infection.8
Radiographic Evaluation
Regarding the diagnosis of bronchiolitis, the AAP notes, “radiographic and laboratory studies should not be obtained routinely.”2 While many children with bronchiolitis may have abnormalities on radiographs, there is insufficient data to suggest that chest radiographs correlate with disease severity. In addition, several studies, including a prospective cohort study by Schuh et al,9 have shown that infants with suspected lower respiratory tract infections who undergo radiography are more likely to receive antibiotics without any difference in outcomes.
Laboratory Studies
As stated in the AAP guidelines, routine laboratory testing, particularly virologic studies for RSV, have little role in the diagnosis of bronchiolitis. Since numerous viruses can cause bronchiolitis and have similar clinical presentations, the absence of identification of a particular virologic agent does not exclude the diagnosis of bronchiolitis and is moreover unlikely to alter management.
Although routine laboratory evaluation is not recommended in infants with bronchiolitis, one subgroup in which it may be beneficial is in the assessment of serious bacterial infections (SBIs) in febrile infants with bronchiolitis who are younger than 60 days old. Levine et al10 conducted a large, multicenter, prospective, cross-sectional study of young, febrile infants to determine the risk of SBI in those with RSV bronchiolitis versus those without RSV bronchiolitis. They found that overall febrile infants younger than age 60 days with RSV bronchiolitis have a lower rate of SBI than those without RSV (7% v 12.5%, respectively).10 In infants between age 28 and 60 days with RSV bronchiolitis, the origin of all SBIs in the study were urinary tract infections. In patients younger than 28 days of age, the risk of developing an SBI was found to be no different between the RSV-positive and RSV-negative groups.10
Based on the findings in this study, it is recommended that, at the very least, urinalysis for bacterial infection be performed in all infants with RSV bronchiolitis who are younger than age 60 days. Furthermore, since there was no difference in the rates of SBI in patients younger than age 28 days, infants in this age range should undergo a full septic work-up (blood, urine, and cerebrospinal fluid)—regardless of RSV infection status. For infants between ages 28 and 60 days, there is not enough evidence to recommend for or against further laboratory evaluation other than urinalysis.
Treatment
Nasal Suctioning
Nasal suctioning has become the first-line treatment for infants with bronchiolitis. It is used to clear secretions from the nasal passages to aid in respiration, which is particularly important in younger infants—who are obligate nose breathers. Current recommendations are to perform suctioning with increasing respiratory effort, before feeding and before laying the infant down to sleep.1
Bronchodilators
In the past, bronchodilators such as the β-agonist albuterol have been used to treat bronchiolitis with the idea that bronchial smooth muscle relaxation would improve clinical symptoms. In its 2006 guidelines, the AAP had recommended a trial of albuterol and continuation only if there was a documented objective response. In the 2014 updated guidelines, however, the AAP no longer recommends the use of albuterol in any capacity.
Although several meta-analyses and systematic reviews have demonstrated that bronchodilators may improve clinical symptoms scores, they did not affect disease resolution, need for hospitalization, or length of hospital stay.2 In addition, a recent Cochrane systematic review noted no benefit in the clinical course of infants with bronchiolitis treated with bronchodilators, and cited the potential adverse events (tachycardia and tremors) as outweighing any potential benefit.11 In addition to albuterol, the AAP no longer recommends the use of nebulized epinephrine in the treatment of bronchiolitis.2
Hypertonic Saline
Although hypertonic saline (HTS) has been increasingly studied for the treatment of bronchiolitis, the AAP does not recommend its use in the ED. Despite evidence that HTS may reduce hospital length of stay after 24 hours of use in settings where the typical duration of hospitalization exceeds 3 days, it has not been shown to reduce the rate of hospitalization when used in an emergency setting.2
Corticosteroids
While there is good evidence that corticosteroids are beneficial in treating some respiratory diseases, such as asthma and croup, numerous studies have repeatedly failed to show a benefit in treating bronchiolitis. One of the largest studies, a multicenter, randomized, controlled trial of dexamethasone for bronchiolitis by the Pediatric Emergency Care Applied Research Network, did not show any alteration in admission rates, respiratory status after 4 hours of observation, or length of hospital stay.12 Accordingly, the AAP strongly recommends against the administration of corticosteroids for bronchiolitis in any setting.2
Oxygen Therapy
Oxygen therapy is often necessary in patients with bronchiolitis who demonstrate hypoxia. The definition of hypoxia in this patient population has remained variable. The AAP has established a threshold of oxyhemoglobin saturation (SpO2) of less than 90% to define hypoxia and has empowered clinicians to not administer oxygen if the SpO2 exceeds 90%. Based on the oxyhemoglobin dissociation curve, the authors of the AAP guidelines note that when the SpO2 is less than 90%, small decreases in the arterial partial pressure of oxygen (PaO2) result in large decreases in the SpO2. When SpO2 is greater than 90%, however, large increases in PaO2 are associated with only small increased in SpO2. The AAP guidelines note, “In infants and children with bronchiolitis, no data exist to suggest that such increases [in PaO2 and SpO2] result in any clinically significant differences in physiologic function, patient symptoms, or clinical outcomes.”2
A relatively new method of administration of oxygen to infants with bronchiolitis is via a humidified, heated, high-flow nasal cannula (HHHFNC). This therapy has been shown to generate continuous positive airway pressure, which improves respiratory effort, reduces the work of breathing, and may decrease the need for intubation.2
Patient Disposition
One of the most challenging tasks for emergency physicians (EPs) is determining the appropriate disposition of infants with bronchiolitis. The variable presentation and dynamic nature of the disease make this particularly difficult. Patients at high risk for apnea should be admitted to the hospital for observation and further care as needed. Admission also should be strongly considered for those with significantly increased work of breathing and tachypnea that does not improve with suctioning—especially when these interfere with feeding. Infants with poor feeding or evidence of dehydration should be admitted to the hospital for intravenous (IV) fluid hydration or nasogastric feedings. Patients with hypoxia (SpO2 saturations <90%) should also be admitted for supplemental oxygen therapy. It should be noted, however, the AAP recommends “spot-checks” over continuous pulse oximetry in patients who do not require oxygen therapy.2
Another important factor affecting patient disposition is the ability of the caregiver to provide basic patient care and ensure close outpatient follow-up. Prior to discharge, caregivers should be educated on the highly dynamic nature of bronchiolitis and the signs and symptoms that would require prompt return to the ED—especially if the infant has risk factors for the development of severe disease.
Case Conclusion
Based on the patient’s symptoms, history (most notably, the recent incident of sleep apnea at home), and physical examination, the EP quickly identified this infant was at a high risk for both severe bronchiolitis and apnea and required aggressive management. Nasal suctioning was immediately performed to help clear the patient’s secretions; this, however, only slightly improved his RR and work of breathing. Although the infant’s SpO2 was greater than 90% on room air, the EP administered oxygen via HHHFNC at 6 L per minute, which produced a significant improvement in both RR and effort.
Given the patient’s age and the presence of a fever, a urinalysis was also obtained, the results of which showed no evidence of infection. Since the patient was only able to bottle-feed for a few minutes at a time, the EP initiated IV fluid hydration and contacted the hospitalist team for inpatient admission.
The infant was gradually weaned from HHHFNC on hospital day 2 but remained with suboptimal oral intake for another 24 hours. By hospital day 4, his work of breathing had improved significantly, and he was feeding well with through the assistance of pre-feeding nasal syringe suctioning. The patient was discharged home in the care of his parents later that same day with only mild tachypnea over baseline. At discharge, the EP emphasized the importance of providing close follow-up with their son’s pediatrician. The infant continued to gradually improve as an outpatient, with resolution of nasal congestion by day 12 of his illness; he returned to his baseline breathing and feeding pattern on day 14.
Dr Schneider is a pediatric emergency medicine fellow, Eastern Virginia Medical School, Children’s Hospital of The King’s Daughters, Norfolk. Dr Clingenpeel is a fellowship director of pediatric emergency medicine, and an associate professor of pediatrics, Eastern Virginia Medical School, Norfolk.
- Joseph M. Evidence-based assessment and management of acute bronchiolitis in the emergency department. Pediatr Emerg Med Pract. 2011;8(3):1-20.
- Ralston SL, Lieberthal AS, Meissner HC, et al; American Academy of Pediatrics. Clinical practice guidelines: the diagnosis, management, and prevention of bronchiolitis [Published correction appears in Pediatrics. 2014;134(5):e1474-e1502]. Pediatrics. 2014;134:5 e1474-e1502.
- Hasegawa K, Tsugawa Y, Brown DF, Mansbach JM, Camargo CA Jr. Trends in bronchiolitis hospitalizations in the United States, 2000-20009. Pediatrics. 2013;32(1):28-36.
- Centers for Disease Control and Prevention (CDC). Respiratory syncytial virus activity—United States, July 2011-January 2013. MMWR Morb Mortal Wkly Rep. 2013;62(8):141-144.
- Harper MB, Fleisher GR. Infectious emergencies. In: Fleisher GR, Ludwig S, eds. Textbook of Pediatric Emergency Medicine. 6th ed. Philadelphia, PA: Lippincott Williams & Wilkins;2010:916-917.
- Willwerth BM, Harper MB, Greenes DS. Identifying hospitalized infants who have bronchiolitis and are at high risk for apnea. Ann Emerg Med. 2006;48(4):441-447.
- Shaw KN, Bell LM, Sherman NH. Outpatient assessment of infants with bronchiolitis. Am J Dis Child. 1991;145(2):151-155.
- Wang EE, Milner RA, Navas L, Maj H. Observer agreement for respiratory signs and oximetry in infants hospitalized with lower respiratory infections. Am Rev Respir Dis. 1992;145(1):106-109.
- Schuh S, Lalani A, Allen U, et al. Evaluation of the utility of radiography in acute bronchiolitis. J Pediatr. 2007;150(4):429-433.
- Levine DA, Platt SL, Dayan PS, et al; Multicenter RSV-SBI Study Group of the Pediatric Emergency Medicine Collaborative Research Committee of the American Academy of Pediatrics. Risk of serious bacterial infection in young febrile infants with respiratory syncytial virus infection. Pediatrics. 2004;113(6):1728-1734.
- Gadomski AM, Scribani MB. Bronchodilators for bronchiolitis. Cochrane Database Syst Rev. 2014;(6):CD001266.
- Corneli HM, Zorc JJ, Majahan P, et al; Bronchiolitis Study Group of the Pediatric Emergency Care Applied Research Network (PECARN). A multicenter, randomized, controlled trial of dexamethasone for bronchiolitis. N Engl J Med. 2007;357(4):331-339.

Case Report: An Unusual Case of Morel-Lavallée Lesion of the Upper Extremity
Case
A 32-year-old previously healthy woman presented to the ED with right upper arm pain and swelling of 6 days duration. According to the patient, the swelling began 2 days after she sustained a work-related injury at a coin-manufacturing factory. She stated that her right arm had gotten caught inside of a rolling press while she was cleaning it. The roller had stopped over her upper arm, trapping it between the roller and the platform for several minutes before it was extricated. She was brought to the ED by emergency medical services for evaluation immediately following this incident. At this first visit to the ED, the patient complained of mild pain in her right arm. Physical examination at that time revealed mild diffuse swelling extending from her hand to her distal humerus, with mild pain on passive flexion, and extension without associated numbness or tingling. Plain films of her right upper extremity were ordered, the results of which were relatively unremarkable. She was evaluated by an orthopedist, who ruled out compartment syndrome based on her benign physical examination and soft compartments. She was ultimately discharged and told to follow up with her primary care provider.
Over the course of 48 hours from the first ED visit, the patient developed large bullae on the dorsal and volar aspect of her forearm, elbow, and upper arm with associated pain. In addition to dark discolorations of the skin over her affected arm, she noticed that the bullae had become numerous and discolored. These symptoms continued to grow progressively worse, prompting her second presentation to the ED.
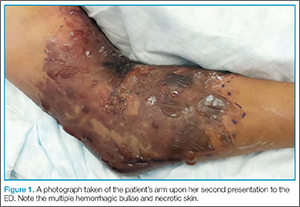
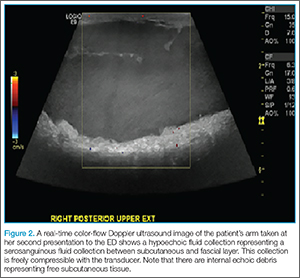
The patient was taken to the operating room and underwent debridement and resection of the circumferential necrotic skin and subcutaneous tissue in her right arm, and the placement of a skin graft with overlying wound vacuum-assisted closure. During the procedure, a large amount of serosanguinous fluid was drained and cultured, and was found to be sterile. Due to the size of her injury, she underwent two additional episodes of debridement and graft placement over the course of the next 2 weeks.
Discussion
First described in the 1850s by the French physician Maurice Morel-Lavallée, Morel-Lavallée lesion is a rare, traumatic, soft-tissue injury.1 It is an internal degloving injury wherein the skin and subcutaneous tissue have been forcibly separated from the underlying fascia as a result of shear stress. The lymphatic and blood vessels between the layers are also disrupted in this process, resulting in the accumulation of blood and lymphatic fluid as well as subcutaneous debris in the potential space that forms. Excess accumulation over time can compromise blood supply to the overlying skin and cause necrosis.2 Morel-Lavallée lesion is missed on initial evaluation in up to one-third of the cases and may have a delay in presentation ranging from hours to months after the inciting injury.3
Morel-Lavallée lesions typically involve the flank, hips, thigh, and prepatellar regions as a result of shear injuries sustained from bicycle falls and motor vehicle accidents.4 These lesions are often associated with concomitant acetabular and pelvic fractures.5 Involvement of the upper extremities is unusual. Typically, presentation consists of a fluctuant and painful mass underneath the skin which increases over time. The overlying skin may show the mechanism of the original injury, for example, as abrasions after a crush injury. The excessive skin necrosis and hemorrhagic bullae seen in this particular case is a very rare presentation.
Differential Diagnosis
The differential diagnosis includes compartment syndrome, coma blisters, a missed fracture, bullous pemphigoid, bullous drug reactions, and linear immunoglobulin A disease. Most of these conditions were easily ruled out in this case as the patient was previously healthy and not on any medications. The lesions in this case could have been confused with coma blisters, which are similar in appearance, self-limiting, and can develop on the extremities. However, coma blisters are classically associated with toxicity from various central nervous system depressants, as well as reduced consciousness from other causes—all of which were readily ruled-out based on the patient’s history. Moreover, the Morel-Lavallée lesion is a degloving injury of the subcutaneous tissue from the fascia underneath, whereas the pathology of coma blisters includes subepidermal bullae formation as well as immunoglobulin and complement deposition.6
Diagnostic Imaging
Morel-Lavallée lesion can often be confirmed via several imaging modalities, including ultrasound, CT, 3D CT, or magnetic resonance imaging (MRI).3,7 Ultrasound will usually show a well-circumscribed hypoechoic fluid collection with hyperechoic fat globules from the subcutaneous tissue, whereas CT tends to show an encapsulated mass with fluid collection underneath. In MRI, Morel-Lavallée lesion often appears as a hypointense T1-sequence and hyperintense T2-sequence similar to most other fluid collections. There may be variable T1- and T2-intensities with subcutaneous tissues in the fluid collection.2
Management
Despite recognition of this disease entity, controversies still exist regarding management. Case reports have demonstrated a relatively high rate of infected fluid collections depending on the chronicity of the injury.8 A recent algorithm to management described by Nickerson et al4 proposes that for patients with viable skin, percutaneous aspiration of more than 50 cc of fluid from these lesions should be treated with more extensive operative intervention based on the increased likelihood of recurrence. Patients without viable skin require formal debridement with possible skin grafting.
Other treatment options include conservative management, surgical drainage, sclerodesis, and extensive open surgery.8-10 Management is always case-based and dependent upon the size of the lesion and associated injuries.
Conclusion
This case represents an example of Morel-Lavallée lesions in their most severe and atypical form. It also serves as a reminder that vigilance and knowledge of this disease process is important in helping to diagnose this rare but potentially devastating condition. The key to recognizing this injury lies in keeping this disease process in the differential diagnosis of traumatic injuries with suspicious mechanism involving significant shear forces. Significant physical examination findings may not be present initially and evolve over a time period of hours to days. Once this injury is identified, management hinges on the size of the lesion and affected body part. Despite timely interventions, Morel-Lavallée lesions may result in significant morbidity and functional disability.
Dr Ye is an emergency medicine resident at the Brown Alpert Medical School in Providence, Rhode Island. Dr Rosenberg is a clinical assistant professor at Brown Alpert Medical School, and an emergency medicine attending physican at Rhode Island Hospital and The Miriam Hospital, Providence, Rhode Island.
- Morel-Lavallée M. Epanchements traumatique de serosite. Arc Générales Méd. 1853;691-731.
- Chokshi F, Jose J, Clifford P. Morel Lavallée Lesion. Am J Orthop (Belle Mead NJ). 2010;39(5): 252-253.
- Bonilla-Yoon I, Masih S, Patel DB, et al. The Morel-Lavallée lesion: pathophysiology, clinical presentation, imaging features, and treatment options. Emerg Radiol. 2014;21(1):35-43.
- Nickerson T, Zielinski M, Jenkins D, Schiller HJ. The Mayo Clinic experience with Morel-Lavallée lesions: establishment of a practice management guideline. J Trauma Acute Care Surg. 2014:76(2);493-497.
- Powers ML, Hatem SF, Sundaram M. Morel-Lavallee lesion. Orthopedics. 2007;30(4):322-323.
- Agarwal A, Bansal M, Conner K. Coma blisters with hypoxemic respiratory failure. Dermatol Online Journal. 2012:18(3);10.
- Reddix RN, Carrol E, Webb LX. Early diagnosis of a Morel-Lavallee lesion using three-dimensional computed tomography reconstructions: a case report. J Trauma. 2009;67(2):e57-e59.
- Lin HL, Lee WC, Kuo LC, Chen CW. Closed internal degloving injury with conservative treatment. Am J Emerg Med. 2008:26(2);254.e5-e6.
- Luria S, Applbaum Y,Weil Y, Liebergall M, Peyser A. Talc sclerodhesis of persistent Morel-Lavallée lesions (posttraumatic pseudocysts): case report of 4 patients. J Orthop Trauma. 2006;20(6):435-438.
- Penaud A, Quignon R, Danin A, Bahé L, Zakine G. Alcohol sclerodhesis: an innovative treatment for chronic Morel-Lavallée lesions. J Plast Reconstr Aesthet Surg. 2011;64(10): e262-264.
Case
A 32-year-old previously healthy woman presented to the ED with right upper arm pain and swelling of 6 days duration. According to the patient, the swelling began 2 days after she sustained a work-related injury at a coin-manufacturing factory. She stated that her right arm had gotten caught inside of a rolling press while she was cleaning it. The roller had stopped over her upper arm, trapping it between the roller and the platform for several minutes before it was extricated. She was brought to the ED by emergency medical services for evaluation immediately following this incident. At this first visit to the ED, the patient complained of mild pain in her right arm. Physical examination at that time revealed mild diffuse swelling extending from her hand to her distal humerus, with mild pain on passive flexion, and extension without associated numbness or tingling. Plain films of her right upper extremity were ordered, the results of which were relatively unremarkable. She was evaluated by an orthopedist, who ruled out compartment syndrome based on her benign physical examination and soft compartments. She was ultimately discharged and told to follow up with her primary care provider.
Over the course of 48 hours from the first ED visit, the patient developed large bullae on the dorsal and volar aspect of her forearm, elbow, and upper arm with associated pain. In addition to dark discolorations of the skin over her affected arm, she noticed that the bullae had become numerous and discolored. These symptoms continued to grow progressively worse, prompting her second presentation to the ED.
The patient was taken to the operating room and underwent debridement and resection of the circumferential necrotic skin and subcutaneous tissue in her right arm, and the placement of a skin graft with overlying wound vacuum-assisted closure. During the procedure, a large amount of serosanguinous fluid was drained and cultured, and was found to be sterile. Due to the size of her injury, she underwent two additional episodes of debridement and graft placement over the course of the next 2 weeks.
Discussion
First described in the 1850s by the French physician Maurice Morel-Lavallée, Morel-Lavallée lesion is a rare, traumatic, soft-tissue injury.1 It is an internal degloving injury wherein the skin and subcutaneous tissue have been forcibly separated from the underlying fascia as a result of shear stress. The lymphatic and blood vessels between the layers are also disrupted in this process, resulting in the accumulation of blood and lymphatic fluid as well as subcutaneous debris in the potential space that forms. Excess accumulation over time can compromise blood supply to the overlying skin and cause necrosis.2 Morel-Lavallée lesion is missed on initial evaluation in up to one-third of the cases and may have a delay in presentation ranging from hours to months after the inciting injury.3
Morel-Lavallée lesions typically involve the flank, hips, thigh, and prepatellar regions as a result of shear injuries sustained from bicycle falls and motor vehicle accidents.4 These lesions are often associated with concomitant acetabular and pelvic fractures.5 Involvement of the upper extremities is unusual. Typically, presentation consists of a fluctuant and painful mass underneath the skin which increases over time. The overlying skin may show the mechanism of the original injury, for example, as abrasions after a crush injury. The excessive skin necrosis and hemorrhagic bullae seen in this particular case is a very rare presentation.
Differential Diagnosis
The differential diagnosis includes compartment syndrome, coma blisters, a missed fracture, bullous pemphigoid, bullous drug reactions, and linear immunoglobulin A disease. Most of these conditions were easily ruled out in this case as the patient was previously healthy and not on any medications. The lesions in this case could have been confused with coma blisters, which are similar in appearance, self-limiting, and can develop on the extremities. However, coma blisters are classically associated with toxicity from various central nervous system depressants, as well as reduced consciousness from other causes—all of which were readily ruled-out based on the patient’s history. Moreover, the Morel-Lavallée lesion is a degloving injury of the subcutaneous tissue from the fascia underneath, whereas the pathology of coma blisters includes subepidermal bullae formation as well as immunoglobulin and complement deposition.6
Diagnostic Imaging
Morel-Lavallée lesion can often be confirmed via several imaging modalities, including ultrasound, CT, 3D CT, or magnetic resonance imaging (MRI).3,7 Ultrasound will usually show a well-circumscribed hypoechoic fluid collection with hyperechoic fat globules from the subcutaneous tissue, whereas CT tends to show an encapsulated mass with fluid collection underneath. In MRI, Morel-Lavallée lesion often appears as a hypointense T1-sequence and hyperintense T2-sequence similar to most other fluid collections. There may be variable T1- and T2-intensities with subcutaneous tissues in the fluid collection.2
Management
Despite recognition of this disease entity, controversies still exist regarding management. Case reports have demonstrated a relatively high rate of infected fluid collections depending on the chronicity of the injury.8 A recent algorithm to management described by Nickerson et al4 proposes that for patients with viable skin, percutaneous aspiration of more than 50 cc of fluid from these lesions should be treated with more extensive operative intervention based on the increased likelihood of recurrence. Patients without viable skin require formal debridement with possible skin grafting.
Other treatment options include conservative management, surgical drainage, sclerodesis, and extensive open surgery.8-10 Management is always case-based and dependent upon the size of the lesion and associated injuries.
Conclusion
This case represents an example of Morel-Lavallée lesions in their most severe and atypical form. It also serves as a reminder that vigilance and knowledge of this disease process is important in helping to diagnose this rare but potentially devastating condition. The key to recognizing this injury lies in keeping this disease process in the differential diagnosis of traumatic injuries with suspicious mechanism involving significant shear forces. Significant physical examination findings may not be present initially and evolve over a time period of hours to days. Once this injury is identified, management hinges on the size of the lesion and affected body part. Despite timely interventions, Morel-Lavallée lesions may result in significant morbidity and functional disability.
Dr Ye is an emergency medicine resident at the Brown Alpert Medical School in Providence, Rhode Island. Dr Rosenberg is a clinical assistant professor at Brown Alpert Medical School, and an emergency medicine attending physican at Rhode Island Hospital and The Miriam Hospital, Providence, Rhode Island.
- Morel-Lavallée M. Epanchements traumatique de serosite. Arc Générales Méd. 1853;691-731.
- Chokshi F, Jose J, Clifford P. Morel Lavallée Lesion. Am J Orthop (Belle Mead NJ). 2010;39(5): 252-253.
- Bonilla-Yoon I, Masih S, Patel DB, et al. The Morel-Lavallée lesion: pathophysiology, clinical presentation, imaging features, and treatment options. Emerg Radiol. 2014;21(1):35-43.
- Nickerson T, Zielinski M, Jenkins D, Schiller HJ. The Mayo Clinic experience with Morel-Lavallée lesions: establishment of a practice management guideline. J Trauma Acute Care Surg. 2014:76(2);493-497.
- Powers ML, Hatem SF, Sundaram M. Morel-Lavallee lesion. Orthopedics. 2007;30(4):322-323.
- Agarwal A, Bansal M, Conner K. Coma blisters with hypoxemic respiratory failure. Dermatol Online Journal. 2012:18(3);10.
- Reddix RN, Carrol E, Webb LX. Early diagnosis of a Morel-Lavallee lesion using three-dimensional computed tomography reconstructions: a case report. J Trauma. 2009;67(2):e57-e59.
- Lin HL, Lee WC, Kuo LC, Chen CW. Closed internal degloving injury with conservative treatment. Am J Emerg Med. 2008:26(2);254.e5-e6.
- Luria S, Applbaum Y,Weil Y, Liebergall M, Peyser A. Talc sclerodhesis of persistent Morel-Lavallée lesions (posttraumatic pseudocysts): case report of 4 patients. J Orthop Trauma. 2006;20(6):435-438.
- Penaud A, Quignon R, Danin A, Bahé L, Zakine G. Alcohol sclerodhesis: an innovative treatment for chronic Morel-Lavallée lesions. J Plast Reconstr Aesthet Surg. 2011;64(10): e262-264.

HIV: Still Epidemic After 30 Years
December 1st is World AIDS Day. This article, from June 2012, was inspired by a conversation I had with a friend who was pursuing her Masters in Public Health. For a group project in epidemiology, she had tested a survey mechanism among college undergrads—a disturbing number of whom responded that they did not understand what “HIV” meant. We began ruminating on how “young people” (not substantially younger than ourselves) could be so clueless about a disease that had had such a devastating impact within recent memory. My question: Would this lack of awareness eventually result in a resurgence of a disease that, in truth, has never really gone away? —AMH
In the 30 years since the first cases of HIV were diagnosed in the United States, almost 620,000 people have died of AIDS in this country. In a very short period in the early 1980s, HIV morphed from completely unknown to epidemic in its scope; at one point, an estimated 130,000 new infections occurred each year in the US.
Today, that number has decreased substantially, to about 50,000 new infections per year. (Data from 2000 indicated the annual rate of new infections was 56,300, while CDC surveillance data from 46 reporting states in 2010 put the number at around 47,000.) In addition, the development and use of highly effective antiretroviral therapy has meant that people with HIV can live longer, healthier lives—provided, of course, that they have access to and comply with treatment.
Despite these improvements, however, is it acceptable that 1.2 million people in the US are living with HIV (20% of whom don’t even know it)? “No, that number is certainly not satisfactory,” says Folusho E. Ogunfiditimi, MPH, PA-C, Director of Advanced Practice Providers at Henry Ford Health System in Detroit and a member of the American Academy of Physician Assistants Clinical and Health Affairs Commission. “We cannot take our foot off the pedal regarding education, prevention, looking at outcomes, and also looking at the impact of disparities and trying to eliminate those disparities.”
Continue for what HIV is >>
OMG, WHAT'S HIV?
It is possible that American success at reducing (though hardly eliminating) the spread of HIV has actually undermined awareness. It sometimes seems to be a national characteristic that if we don’t see people dying in droves before our very eyes, we don’t think there’s a problem. A Kaiser Family Foundation survey conducted in 2009 revealed that just 6% of Americans considered HIV/AIDS to be “the most urgent health problem facing the nation,” down from a high of 44% in 1995.
In the 1980s and early 1990s, HIV and AIDS were hot topics in the news; it was impossible not to hear tales of horror or fear on a daily basis. While the reduction in misinformation dissemination is probably a positive, the Kaiser survey indicated that only 45% of Americans reported hearing, seeing, or reading “a lot” or “some” about the domestic problem of HIV/AIDS in the previous year. This might not be deeply concerning—there are, after all, plenty of other issues to discuss—until you realize that 62% of Americans consider the media to be their prime source of information about HIV/AIDS (compared with just 13% who say their health care provider is).
While awareness is an issue across demographic groups, the most potentially concerning is younger adults. This is a generation who most likely cannot tell you who Ryan White was and whose members were not alive during (or were far too young to remember) the major crisis of the HIV/AIDS epidemic.
“Sexually, they’ve grown up in an era where we have really good treatments,” says Susan LeLacheur, DrPH, PA-C, Associate Professor of Physician Assistant Studies at the George Washington University in Washington, DC, and a national lecturer on infectious disease and HIV infection. “When they meet people with HIV, those people are healthy.”
“Because we have, for lack of a better term, taken our foot off the pedal regarding HIV/AIDS awareness,” says Ogunfiditimi, “we run the risk of having people coming out of high school and into college not being as aware as we might have been in that age-group in the ’80s and early ’90s.”
In the Kaiser survey, 45% of respondents ages 18 to 29 indicated they had never been tested for HIV. Of those, 70% gave as a reason “you don’t think you’re at risk” and 33%, “your doctor never recommended it.”
In 2008, the CDC estimated that 25% of new HIV infections occur among adolescents and young adults (ie, those ages 13 to 29). This is part of the reason Ogunfiditimi says a renewed focus on education is essential; he also thinks PAs and NPs are well suited to provide that information, given their reputation as patient educators and their frequent work at the community level.
“We need to take this message back to those [age-]groups, back to those communities and schools,” he says, “and conduct health education seminars and HIV/AIDS awareness programs in the schools so that we can start to educate our younger ones.”
Continue for targeted or universal screening? >>
TARGETED OR UNIVERSAL SCREENING?
Under the direction of President Obama, who has said the US “is at a crossroads” in terms of HIV/AIDS, facing “a domestic epidemic that demands a renewed commitment, increased public attention, and leadership,” the White House Office of National AIDS Policy (ONAP) has set ambitious goals for HIV prevention. Outlined in the National HIV/AIDS Strategy for the United States, those goals—with a deadline of 2015—include:
• Decrease the annual new HIV infection rate by 25%.
• Decrease the HIV transmission rate (currently 5 persons infected per year per 100 people living with HIV) by 30%.
• Increase the number of people living with HIV who know of their infection from 79% to 90%.
• Increase the number of people with newly diagnosed HIV who have regular health care within three months from 65% to 85%.
The strategy (available at www.whitehouse.gov/sites/default/files/uploads/NHAS.pdf) was commissioned and developed in response to concern that without bold action, “we face a new era of rising infections, greater challenges in serving people living with HIV, and higher health care costs,” as stated in the executive summary of the report.
It may not help the cause that health care providers receive seemingly mixed messages about how to approach HIV screening. Since 2006, the CDC has recommended routine screening for HIV, stating that “HIV screening is recommended for patients in all health-care settings after the patient is notified that testing will be performed unless the patient declines (opt-out screening).” The CDC expressly recommended that separate written consent and prevention counseling should not be required, in part as an acknowledgement that busy practicing clinicians who have to screen for a multitude of conditions and often provide acute care during an office visit are under time constraints.
“That doesn’t mean you don’t do any counseling at all,” says Julie G. Stewart, DNP, MPH, MSN, FNP, Assistant Professor and Coordinator of the FNP Program at Sacred Heart University and an HIV NP at Southwest Community Health Center in Bridgeport, Connecticut, “but having discussions with your patients about their life and their health and their risk factors in every facet should include HIV testing.”
At the same time, both the CDC and ONAP emphasize that certain populations are at higher risk for HIV infection and therefore need to be targeted. These include:
• Gay, bisexual, and other men who have sex with men: 2% of the US population but 61% of new infections (2009 data)
• Black men and women: 14% of the population but 44% of new HIV infections
• Hispanic and Latino persons: 16% of the population but 20% of new HIV infections
• Injection-drug users: 9% of new HIV infections
The CDC also reports that heterosexual persons account for 27% of new HIV infections.
In a tough economic climate, when the US investment in response to the domestic HIV epidemic has risen to more than $19 billion per year, it makes sense to strategize how to most effectively utilize available resources to reduce disease burden. But do we run the risk of missing cases because we make too many assumptions about who is or is not likely to have this infection?
“The information that has been pushed out there has really tried to focus on these high-risk groups—and yes, we understand that those groups need to be identified,” says Ogunfiditimi. “But when you’re trying to increase the amount of testing, then the message needs to be more general so that practitioners who have natural biases won’t implement those biases into their decision as to whether to test someone.”
“What worries me is that the recommendation has been to test everyone at least once, and then again as indicated,” says LeLacheur. “‘As indicated’ means you have to ask. In parts of the country where HIV is not as prevalent as it is in DC, I can understand how it falls off the radar. But there are still a few [cases]—maybe not one in 20, maybe more like one or two in a clinician’s lifetime—and there is just no telling from the outside.”
“Perception of risk is huge,” adds Stewart. Her state was one of the first to mandate prenatal HIV testing, and she recalls instances in which a woman tested positive and the clinician was shocked because, Stewart says, “the perception was that ‘She is not at any risk at all,’ based on where she lives and her background. But the clinician didn’t really know.”
LeLacheur also points out that assumptions work both ways: “Oh, he’s a nice boy” and “Oh, he’s not a nice boy.” In one of her classes, a gay male student shared his experience seeking a diagnosis for what turned out to be Crohn’s disease. “The minute he told his clinician he was gay, all of a sudden he had AIDS and the clinician wouldn’t look anywhere else,” LeLacheur reports. “And that just wasn’t an issue; this was a kid who had been raised in an era of safer sex and had been very careful.”
Advocates say that implementing universal screening, per the CDC’s recommendation, would not only capture more cases but would also reduce the stigma associated with targeted screening.
Continue for truths and consequences >>
TRUTHS AND CONSEQUENCES
So perceptions and assumptions play important roles in how the US addresses HIV testing—both the perceptions of some patients that they are not at risk or that having HIV isn’t a big deal anymore, and the assumptions by health care providers that they don’t need to screen all patients for HIV. That faulty logic can have dire consequences, even if HIV is no longer an automatic death sentence.
“I think there’s a lot of passive testing, a lot of disease-induced or behavior-induced testing,” Ogunfiditimi says. “A patient comes in with complaints of what sounds like a sexually transmitted infection and that may spur a provider to initiate the discussion around HIV and subsequently do testing to back that up. But I don’t get the sense that HIV testing is promoted significantly.”
“They get sick” is how Stewart says many people learn their HIV status. “That is still frequently the way people become aware of their illness—they are sick in the hospital with an opportunistic infection…. If we can identify people who are HIV-infected earlier, we can capture them at higher CD4 counts, and then they have an improved life expectancy. We can start treatment, and that also impacts transmission.”
Echoing Stewart’s comments, LeLacheur also notes that the major pneumonia or other infection that leads to hospitalization and diagnosis of HIV can cause permanent damage. “I have a couple of patients who appear to be poststroke because of a viral infection in their brains that people get very late in HIV,” she says. “Now, their viral loads are undetectable and their CD4s are very high. Their immune systems are in good shape, and in every other way they’re healthy. But they can’t walk.”
For those misguided patients who think HIV isn’t such a big deal these days, LeLacheur has some hard facts clinicians can share. “You don’t realize until after you have HIV and someone explains it to you that the minute you get it, it essentially knocks out the entire immune system in your intestinal tract—which is more than half of your immune system—and that’s never coming back,” she says. “That infection in the gut is never going away; the medicines don’t touch it. So your digestion will never be right. There are things we can’t fix about HIV.”
And heaven help the patient who tries to rationalize that “you just take one pill a day.” First of all, that one pill ties up your liver, as LeLacheur points out, and second of all, HIV medications cost about $16,000 a year. Not many people can afford that on their own, and some states have 700-person-long waiting lists for assistance programs.
The consensus among clinicians who treat HIV-infected patients is that, yes, the US is much better off than it was at the height of the crisis. But there is still enough disease, still enough devastation, to warrant continued vigilance. And that starts with talking to all patients about HIV.
Ask the questions, they advise, do the test, and be prepared to refer patients to a specialist who can help them manage their illness. But don’t drop the ball on those patients even when they have specialty care; study up on drug interactions and know what you are prescribing to patients taking antiretroviral therapy.
“As PAs and NPs, we absolutely have to be the ones carrying that banner up front,” Ogunfiditimi says. “We’re the ones who have that opportunity to spend time with those patients and make sure we walk them through the urgency and the importance of being aware that this disease is still very rampant in our communities. I don’t want to say that we have taken it for granted, but we have definitely not paid as much attention as we used to in the ’80s and the ’90s, and we need to get back to that.”
“We can never forget,” Stewart concludes. “We spend a lot of time learning about and testing for breast cancer, prostate cancer, diabetes, and hypertension, all in an effort to take care of our patients the best we can. Screening for HIV should be in that same category.”
Reprinted from Clinician Reviews. 2012;22(6):cover, 11-14, 33-35.
Endometriosis and Pain: Expert Answers to 6 Questions Targeting Your Management Options
IN THIS ARTICLE
• When is laparoscopy indicated?
• Excision versus ablation
• How to reduce the risk for postoperative recurrence
Endometriosis has always posed a treatment challenge. In the early 19th century, before the widespread advent of surgery, the disease was managed by applying leeches to the cervix. In fact, as Nezhat and colleagues note in their comprehensive survey of the 4,000-year history of endometriosis, “leeches were considered a mainstay in treating any condition associated with menstruation.”1
In the 21st century, the picture is clearer, though still not crystal clear. The optimal approach to endometriosis depends on many factors, foremost the patient’s chief complaint: pain or infertility (or both).
This article focuses on medical and surgical management of pain. Six experts address such questions as: When is laparoscopy indicated? Is excision or ablation of lesions preferred? What is the role of hysterectomy in eliminating pain? And what can be done about the problem of recurrence?
1. WHAT ARE THE OPTIONS FOR EMPIRIC THERAPY?
One reason for the diagnostic delay with endometriosis, which still averages about six years, is that definitive diagnosis is achieved only through laparoscopic investigation and histologic confirmation. For many women who experience pain thought to be associated with endometriosis, however, clinicians begin empiric treatment with medical agents as a way to avert the need for surgery, if at all possible.
“There is no cure for endometriosis,” says John R. Lue, MD, MPH, “but there are many ways that endometriosis can be treated” and the impact of the disease reduced in a patient’s life. (Editor’s Note: See below for biographical information on each clinician interviewed in this article.)
Medical and hormonal options include
• NSAIDs, often used with combined oral contraceptives (OCs). NSAIDs are not a long-term treatment option because of their effect on cyclo-oxygenase (COX) 1 and 2 enzymes, says Dr. Lue. COX-1 protects the gastrointestinal (GI) system, and prolonged use of NSAIDs can cause adverse GI effects.
• Cyclic combined OCs “are recommended as firstline therapy in the absence of contraindications,” says Dr. Lue, and are often used in combination with NSAIDs. However, the failure rate may be as high as 20% to 25%.2 “If pain persists after a trial of three to six months of cyclic OCs, consider switching to continuous low-dose combined OCs for an additional six months,” Dr. Lue adds. When combined OCs were compared with placebo in the treatment of dysmenorrhea, they reduced baseline pain scores by 45% to 52%, compared with 14% to 17% for placebo (P < .001).2 They also reduced the volume of endometriomas by 48%, compared with 32% for placebo (P = .04). According to Linda C. Giudice, MD, PhD, “In women with severe dysmenorrhea who have been treated with cyclic combined OCs, a switch to continuous combined OCs reduced pain scores by 58% within six months and by 75% at two years” (P < .001).2
• Depot medroxyprogesterone acetate (DMPA) or the levonorgestrel-releasing intrauterine system (LNG-IUS). These agents suppress the hypothalamic-pituitary-ovarian (HPO) axis to different degrees. DMPA suppresses the HPO completely, preventing ovulation. The LNG-IUS does not fully suppress the HPO but acts directly on endometrial tissue, with antiproliferative effects on eutopic and endometriotic implants, says Dr. Lue. The LNG-IUS also is effective at suppressing disease after surgical treatment, says Dr. Giudice.2
• Gonadotropin-releasing hormone (GnRH) agonist therapy, with estrogen and/or progestin add-back therapy to temper the associated loss in bone mineral density, “may be effective—if only temporarily—as it inhibits the HPO axis and blocks ovarian function, thereby greatly reducing systemic estrogen levels and inducing artificial menopause,” says Dr. Lue.
• Norethindrone acetate, a synthetic progestational agent, is occasionally used as empiric therapy for endometriosis because of its ability to inhibit ovulation. It has antiandrogenic and antiestrogenic effects.
• Aromatase inhibitors. Dr. Lue points to considerable evidence that endometriotic implants are an autocrine source of estrogen.3 “This locally produced estrogen results from overexpression of the enzyme P450 aromatase by endometriotic tissue,” he says. Consequently, in postmenopausal women, “aromatase inhibitors may be used orally in a daily pill form to curtail endometriotic implant production of estrogen and subsequent implant growth.”4 In women of reproductive age, aromatase inhibitors are combined with an HPO-suppressive therapy, such as norethindrone acetate. These strategies represent off-label use of aromatase inhibitors.
• Danazol, a synthetic androgen, has been used in the past to treat dysmenorrhea and dyspareunia. Because of its severe androgenic effects, however, it is not widely used today.

“For those using medical approaches, endometriosis-related pain may be reduced by using hormonal treatments to modify reproductive tract events, thereby decreasing local peritoneal inflammation and cytokine production,” says Pamela Stratton, MD. Because endometriosis is a “central sensitivity syndrome,” multidisciplinary approaches, such as physical therapy, may be beneficial to treat myofascial dysfunction and sensitization. “Chronic pain conditions that overlap with endometriosis-associated pain—such as migraines, irritable bowel syndrome, or painful bladder syndrome—should be identified and treated. Mood changes of depression and anxiety common to women with endometriosis-associated pain also warrant treatment,” she says.
Continue on to find out when laparoscopy is indicated >>
2. WHEN IS LAPAROSCOPY INDICATED?
When medical and hormonal treatments fail to control a patient’s pain, laparoscopy is indicated to confirm the diagnosis of endometriosis. During that procedure, it is also advisable to treat any endometriosis that is present, provided the surgeon is highly experienced in such treatment.
Proper treatment is preferable—even if it requires expert consultation. “No treatment and referral to a more experienced surgeon are better than incomplete treatment by an inexperienced surgeon,” says Ceana Nezhat, MD. “Not all GYN surgeons have the expertise to treat advanced endometriosis.”
Dr. Stratton agrees about the importance of thorough treatment of endometriosis at the time of diagnostic laparoscopy: “At the laparoscopy, the patient benefits if all potential sources of pain are investigated and addressed.” At surgery, the surgeon should look for and treat any lesions suspicious for endometriosis, as well as any other finding that might contribute to pain, she says. “For example, routinely inspecting the appendix for endometriosis or other lesions, and removing affected appendices is reasonable; also, lysis and, where possible, excision of adhesions is an important strategy.”
If a medical approach fails for a patient, “then surgery is indicated to confirm the diagnosis and treat the disease,” agrees Tommaso Falcone, MD.
“Surgery is very effective in treating the pain associated with endometriosis,” Dr. Falcone adds. “Randomized clinical trials have shown that up to 90% of patients who obtain pain relief from surgery will have an effect lasting one year.6 If patients do not get relief, then the association of the pain with endometriosis should be questioned and other causes sought.”
The most common anatomic sites of implants
“The most common accepted theory for pathogenesis of endometriosis suggests that implants develop when debris from retrograde menstruation attaches to the pelvic peritoneum,” says Dr. Stratton.7 “Thus, the vast majority of lesions occur in the dependent portions of the pelvis, which include the ovarian fossae (posterior broad ligament under the ovaries), cul de sac, and the uterosacral ligaments.8 The bladder peritoneum, ovarian surface, uterine peritoneal surface, fallopian tube, and pelvic sidewall are also frequent sites. The colon and appendix are less common sites, and small bowel lesions are rare.”
“However, pain location does not correlate with lesion location,” Dr. Stratton notes. “For this reason, the goal at surgery is to treat all lesions, even ones that are not in sites of pain.”
Continue to find out how disease should be staged >>
3. HOW SHOULD DISEASE BE STAGED?
Most surgeons with expertise in treating endometriosis attempt to stage the disease at the time of initial laparoscopy, even though a patient’s pain does not always correlate with the stage of disease.
“The staging system for endometriosis is a means to systematically catalogue where lesions are located,” says Dr. Stratton. The most commonly used classification system was developed by the American Society for Reproductive Medicine (ASRM). It takes into account such characteristics as how deep an implant lies, the extent to which it obliterates the posterior cul de sac, and the presence and extent of adhesions. Although the classification system is broken down into four stages ranging from minimal to severe disease, it is fairly complex. For example, it assigns a score for each lesion as well as the size and location of that lesion, notes Dr. Stratton. The presence of an endometrioma automatically renders the disease as stage III or IV, and an obliterated cul de sac means the endometriosis is graded as stage IV.
“This system enables us to communicate with each other about patients and may guide future surgeries for assessment of lesion recurrence or the planning of treatment for lesions the surgeon was unable to treat at an initial surgery,” says Dr. Stratton.
“Women with uterosacral nodularity, fixed pelvic organs, or severe pain with endometriomas may have deep infiltrating lesions. These lesions, in particular, are not captured well with the current staging system,” says Dr. Stratton. Because they appear to be innervated, “the greatest benefit to the patient is achieved by completely excising these lesions.” Preoperative imaging may help confirm the existence, location, and extent of these deep lesions and help the surgeon plan her approach “based on clinical and imaging findings.”
“Severity of pain or duration of surgical effect does not correlate with stage or extent of disease,” Dr. Stratton says.9 “In fact, patients with the least amount of disease noted at surgery experience pain sooner, suggesting that the central nervous system may have been remodeled prior to surgery or that the pain is in part due to some other cause.10 This observation underscores the principle that, while endometriosis may initiate pain, the pain experience is determined by engagement of the central nervous system.”
For more information on the ASRM revised classification of endometriosis, visit www.fertstert.org/article/S0015-0282(97)81391-X/pdf.
Continue to learn whether excision or ablation is preferable >>
4. WHICH IS PREFERABLE: EXCISION OR ABLATION?
In a prospective, randomized, double-blind study, Healey and colleagues compared pain levels following laparoscopic treatment of endometriosis with either excision or ablation. Preoperatively, women in the study completed a questionnaire rating various types of pain using visual analogue scales. They then were randomly assigned to treatment of endometriosis via excision or ablation. Postoperatively, they again completed a questionnaire about pain levels at three, six, nine, and 12 months. Investigators found no significant difference in pain scores at 12 months.11
Five-year follow-up of the same population yielded slightly different findings, however. Although there was a reduction in all pain scores at five years in both the excision and ablation groups, a significantly greater reduction in dyspareunia was observed in the excision group at five years.12
In an accompanying editorial, Dr. Falcone and a coauthor called excision versus ablation of ovarian, bowel, and peritoneal endometriosis one of the “great debates” in the surgical management of endometriosis.13 “When there is deep involvement of adjacent organs, there is general consensus that excision is best for optimal surgical outcome,” they write. “However, for disease involving the peritoneum alone, there are proponents for either option.”13
“This is a very controversial issue,” says Dr. Falcone, “and the debate can sometimes be somewhat inflammatory…. It is hard to understand how a comparative trial could even be accomplished between excision and ablation. In my experience, deep disease typically occurs on the pelvic sidewall over the ureter or in the cul de sac on the bowel or infiltrating the bladder peritoneum. Therefore, ablation would increase the risk of damaging any of these structures. With superficial disease away from critical structures, it should be fine to ablate. Everywhere else and with deep disease, you need to excise or leave disease behind.”
“Endometriomas are a special situation,” Dr. Falcone adds. “Excision of the cyst has been shown in randomized controlled trials (RCTs) to be associated with less risk for recurrence.14 Therefore, it should be the treatment of choice. However, in patients interested in future fertility, we must take into consideration the potential damage to ovarian reserve associated with excision.”
Endometriosis of the ovaries has unique manifestations. “My approach to ovarian cysts depends on their classification,” says Dr. Nezhat.15 In general, primary endometriomas (type 1) are small, superficial cysts that contain dark “chocolate” fluid. They tend to be firmly adherent to the ovarian tissue and difficult to remove surgically.
Secondary endometriomas (type 2) are follicular or luteal cysts that have been involved or invaded by cortical endometriotic implants or by primary endometrioma. Secondary endometriomas are further classified by the relationship between cortical endometriosis and the cyst wall. Type 2A endometriomas are usually large, with a capsule that is easily separated from ovarian tissue. Type 2B endometriomas have some features of functional cysts but show deep involvement with surface endometriosis. Type 2C endometriomas are similar, showing extensive surface endometrial implants but with deep penetration of the endometriosis into the cyst wall.15
“For type 1 endometriomas, I biopsy the cyst to ensure the lesion is benign, then vaporize the endometrioma,” Dr. Nezhat says. “In cases of type 2A and 2B endometriomas, the cyst capsule is easily enucleated and removed. Type 2C endometriomas are biopsied as well, and then I proceed with vaporizing the fibrotic area with a low-power energy source, such as neutral argon plasma, avoiding excessive coagulation and thermal injury.” Recent literature supports the idea of evaluation and biopsy of fibrotic endometriomas to confirm benign conditions, followed by ablation without compromising ovarian function.16
“Excision and ablation both have indications,” Dr. Nezhat asserts. “It depends on the location and depth of penetration of implants, as well as the patient’s ultimate goal. For example, if the patient desires future fertility and has endometriosis on the ovary, removal by excision could damage ovarian function. The same holds true for endometriosis on the fallopian tubes. It’s better in such cases to ablate.”
“Ablation is different from coagulation, which is not recommended,” Dr. Nezhat explains. “Ablation vaporizes the diseased area layer by layer, like peeling an onion, until the disease is eradicated. It is similar to dermatologic skin resurfacing. Vaporization is preferable for endometriosis on the tubes and ovaries in patients who desire pregnancy. The choice between excision and ablation depends on the location, depth of penetration, and the patient’s desire for fertility.”
Either way—and regardless of the primary indication for surgery (pain versus infertility)—a minimally invasive gynecologic surgeon is expected to have the ability to perform both techniques, Dr. Nezhat says.
Continue to find out if hysterectomy is definitive treatment >>
5. IS HYSTERECTOMY DEFINITIVE TREATMENT?
“Not necessarily,” says Dr. Nezhat. “Hysterectomy by itself doesn’t take care of endometriosis unless the patient has adenomyosis. If a patient has endometriosis, the first step is complete treatment of the disease to restore the anatomy. Then the next step might be hysterectomy to give a better long-term result, especially in cases of adenomyosis. Removal of the ovaries at the time of hysterectomy has to be individualized.”
“The implication that hysterectomy ‘cures’ endometriosis is false yet is stated in some textbooks,” says Dr. Nezhat. “Even at the time of hysterectomy, the first step should be complete treatment of endometriosis and restoration of anatomy, followed by the hysterectomy. Leaving endometriosis behind, believing it will go away by itself or not cause future issues, is a gross misperception.”
Removal of the ovaries at hysterectomy?
“There are few comparative studies on the long-term follow-up of patients who have undergone hysterectomy with or without removal of both ovaries,” says Dr. Falcone. “The conventional dogma has been that, in women undergoing definitive surgery for endometriosis, both ovaries should be removed, even if they are normal. I personally believe that this was because hysterectomy was often performed without excision of the endometriosis. So the uterus was removed and disease was left behind. In these cases, recurrent symptoms were due to persistent disease.”
“We reported our experience at the Cleveland Clinic with a seven-year follow-up,” Dr. Falcone continues. “Hysterectomy was performed with excision of all visible disease. Ovaries were conserved if normal and removed if not. We looked at the reoperation-free frequency over time. In women undergoing hysterectomy with excision of visible disease but ovarian preservation, the reoperation-free percentages at two, five, and seven years were 95%, 86%, and 77%, respectively, versus 96%, 91%, and 91% in those without ovarian preservation. So, overall, there was an advantage over time for removal of the ovaries. However, in the subset of women between ages 30 and 39, there was no difference in the long-term recurrence rate if the ovaries were left in. For this reason, in women younger than 40, we recommend keeping normal ovaries if all disease is removed.”17
Continue on to find out if the risk for postoperative recurrence can be reduced >>
6. CAN THE RISK FOR POSTOPERATIVE RECURRENCE BE REDUCED?
“The main problem with surgery is the recurrence rate,” Dr. Falcone says. “Studies have shown that the recurrence rate of pain at seven years may be as high as 50%.”17 Furthermore, “the recurrence of pain may not be associated with visualized endometriosis at laparoscopy.”
“Incomplete removal of lesions may be associated with an increase in pain after surgery,” says Dr. Stratton.18 “Incomplete removal of lesions may occur because of varying technical skill or specific lesion characteristics. The lesions may be difficult to remove because of their location. Lesions may not be recognized because their appearance can vary from subtle (red or clear or white) to classic (blue-black). The depth of the lesion may not be appreciated until surgery is under way, and a surgeon may not be adequately prepared to treat deep lesions when they are identified.”
Adenomyosis is another reason pain may persist or recur after surgery.19 “Adenomyosis appears as either diffuse or focal thickening of the junctional zone between the endometrium and myometrium of the uterus on T2-weighted MRI,” says Dr. Stratton. “After excision of endometriosis, chronic pelvic pain is significantly more likely to persist in women who have a junctional zone thickness of more than 11 mm on MRI.”
The frequent recurrence of pain after surgery makes the disease a long-term challenge.
“Pelvic pain caused by endometriosis is a chronic problem that requires a multiyear management plan, involving both surgery and hormonal therapy,” says Robert L. Barbieri, MD. “To reduce the number of surgical procedures in the lifetime of a woman with endometriosis and pain, I suggest hormonal medical therapy following conservative surgery for endometriosis.”
“Definitive surgery, such as hysterectomy or hysterectomy plus bilateral salpingo-oophorectomy (BSO), typically results in prolonged symptom relief,” Dr. Barbieri says. “Following hysterectomy, hormonal therapy may not be needed. Following BSO, low-dose hormonal therapy is often needed to reduce the severity of menopausal symptoms.”
After surgical treatment of endometriosis associated with pain, Dr. Barbieri presents the patient with the following menu of hormonal options:
• No hormonal therapy
• Estrogen-progestin contraceptives, either cyclic or continuous
• The LNG-IUS
• Norethindrone acetate (5 mg/d)
• DMPA (150 mg every three months)
• Leuprolide acetate depot (3.75 mg IM monthly)
• Nafarelin nasal spray (200 µg bid)
• Danazol (200 mg bid).
“I explain the common adverse effects with each approach and have the patient select what she determines to be her best option,” says Dr. Barbieri. “In my experience, conservative surgery followed by hormonal therapy is effective in more than 75% of women.”
“The evidence to support postoperative hormonal therapy is modest,” Dr. Barbieri notes. “The best evidence is available for use of the LNG-IUS, estrogen-progestin contraceptives, and GnRH agonists.”20-22
In addition, he notes, “major professional societies have highlighted the option of postoperative hormonal therapy to reduce the risk for recurrent pain and repetitive surgical procedures in the future.”23,24
When pain recurs after surgery for endometriosis, it pays to consider what type of pain it is, says Dr. Barbieri.
“There are two major types of pain—nociceptive and neuropathic,” he says. “Nociceptive pain is caused by an injury, acute or chronic. Neuropathic pain is caused by ‘activation’ of neural circuits, sometimes in the absence of an ongoing injury. Many women with endometriosis and chronic pain have both nociceptive and neuropathic pain. Consequently, it is important to consider the use of a multidisciplinary pain practice in the management of chronic pain syndromes. Multidisciplinary pain practices have special expertise in the management of neuropathic pain. Standard conservative surgical intervention is unlikely to improve pain caused by neuropathic mechanisms. Likewise, opioid analgesics are not recommended for the treatment of neuropathic pain.”
REFERENCES
1. Nezhat C, Nezhat F, Nezhat C. Endometriosis: ancient disease, ancient treatments. Fertil Steril. 2012;98(6S):S1-S62.
2. Giudice LC. Clinical practice. Endometriosis. N Engl J Med. 2010;362(25):2389-2398.
3. Pavone ME, Bulun SE. Aromatase inhibitors for the treatment of endometriosis: a review. Fertil Steril. 2012;98(6):1370-1379.
4. Nothnick WB. The emerging use of aromatase inhibitors for endometriosis treatment. Reprod Biol Endocrinol. 2011;9:87.
5. Chwalisz K, Garg R, Brenner RM, et al. Selective progesterone receptor modulators (SPRMs): a novel therapeutic concept in endometriosis. Ann N Y Acad Sci. 2002;955:373-393, 396-406.
6. Duffy JM, Arambage K, Correa FJ, et al. Laparoscopic surgery for endometriosis. Cochrane Database Syst Rev. 2014;(4):CD011031.
7. Bulun SE. Endometriosis. N Engl J Med. 2009;360(3):268-279.
8. Stegmann BJ, Sinaii N, Liu S, et al. Using location, color, size, and depth to characterize and identify endometriosis lesions in a cohort of 133 women. Fertil Steril. 2008;89(6):1632-1636.
9. Hsu AL, Sinaii N, Segars J, et al. Relating pelvic pain location to surgical findings of endometriosis. Obstet Gynecol. 2011;118(2 pt 1):223-230.
10. Stratton P, Berkley KJ. Chronic pelvic pain and endometriosis: translational evidence of the relationship and implications. Hum Reprod Update. 2011;17(3):327-346.
11. Healey M, Ang WC, Cheng C. Surgical treatment of endometriosis: a prospective randomized double-blinded trial comparing excision and ablation. Fertil Steril. 2010;94(7):2536-2540.
12. Healey M, Chang C, Kaur H. To excise or ablate endometriosis? A prospective randomized double blinded trial after 5-year follow-up. JMIG. 2014;21(6):999-1004.
13. Falcone T, Wilson JR. Surgical management of endometriosis: excision or ablation. JMIG. 2014;21(6):969.
14. Hart RJ, Hickey M, Maouris P, Buckett W. Excisional surgery versus ablative surgery for ovarian endometriomata. Cochrane Database Syst Rev. 2008;(2):CD004992.
15. Nezhat C, Nezhat F, Nezhat CH, Seidman D. Classification of endometriosis: improving the classification of endometriotic ovarian cysts. Hum Reprod. 1994;9(12):2212-2216.
16. Roman H, Auber M, Mokdad C, et al. Ovarian endometrioma ablation using plasma energy versus cystectomy: a step toward better preservation of the ovarian parenchyma in women wishing to conceive. Fertil Steril. 2011;96(6):1396-1400.
17. Shakiba K, Bena JF, McGill KM, et al. Surgical treatment of endometriosis: a 7-year follow-up on the requirement for further surgery. Obstet Gynecol. 2008;111(6):1285-1292.
18. McAllister SL, McGinty KA, Resuehr D, Berkley KJ. Endometriosis-induced vaginal hyperalgesia in the rat: role of the ectopic growths and their innervation. Pain. 2009;147(1-3):255-264.
19. Parker JD, Leondires M, Sinaii N, et al. Persistence of dysmenorrhea and nonmenstrual pain after optimal endometriosis surgery may indicate adenomyosis. Fertil Steril. 2006;86(3):711-715.
20. Abou-Setta AM, Al-Inany HG, Farquar CM. Levonorgestrel-releasing intrauterine device for symptomatic endometriosis following surgery. Cochrane Database Syst Rev. 2006;(1):CD005072.
21. Seracchioli R, Mabrouk M, Manuzzi L, et al. Postoperative use of oral contraceptive pills for prevention of anatomic relapse or symptom recurrence following surgery. Hum Reprod. 2009;24(11):2729-2735.
22. Hornstein MD, Hemmings R, Yuzpe AA, Heinrichs WL. Use of nafarelin versus placebo after reductive laparoscopic surgery for endometriosis. Fertil Steril. 1997;68(5):860-864.
23. Practice Committee of the American Society for Reproductive Medicine. Treatment of pain associated with endometriosis: a committee opinion. Fertil Steril. 2014;101(4):927-935.
24. Dunselman GA, Vermeulen N, Becker C, et al. ESHRE guideline: management of women with endometriosis. Hum Reprod. 2014;29(3):400-412.
IN THIS ARTICLE
• When is laparoscopy indicated?
• Excision versus ablation
• How to reduce the risk for postoperative recurrence
Endometriosis has always posed a treatment challenge. In the early 19th century, before the widespread advent of surgery, the disease was managed by applying leeches to the cervix. In fact, as Nezhat and colleagues note in their comprehensive survey of the 4,000-year history of endometriosis, “leeches were considered a mainstay in treating any condition associated with menstruation.”1
In the 21st century, the picture is clearer, though still not crystal clear. The optimal approach to endometriosis depends on many factors, foremost the patient’s chief complaint: pain or infertility (or both).
This article focuses on medical and surgical management of pain. Six experts address such questions as: When is laparoscopy indicated? Is excision or ablation of lesions preferred? What is the role of hysterectomy in eliminating pain? And what can be done about the problem of recurrence?
1. WHAT ARE THE OPTIONS FOR EMPIRIC THERAPY?
One reason for the diagnostic delay with endometriosis, which still averages about six years, is that definitive diagnosis is achieved only through laparoscopic investigation and histologic confirmation. For many women who experience pain thought to be associated with endometriosis, however, clinicians begin empiric treatment with medical agents as a way to avert the need for surgery, if at all possible.
“There is no cure for endometriosis,” says John R. Lue, MD, MPH, “but there are many ways that endometriosis can be treated” and the impact of the disease reduced in a patient’s life. (Editor’s Note: See below for biographical information on each clinician interviewed in this article.)
Medical and hormonal options include
• NSAIDs, often used with combined oral contraceptives (OCs). NSAIDs are not a long-term treatment option because of their effect on cyclo-oxygenase (COX) 1 and 2 enzymes, says Dr. Lue. COX-1 protects the gastrointestinal (GI) system, and prolonged use of NSAIDs can cause adverse GI effects.
• Cyclic combined OCs “are recommended as firstline therapy in the absence of contraindications,” says Dr. Lue, and are often used in combination with NSAIDs. However, the failure rate may be as high as 20% to 25%.2 “If pain persists after a trial of three to six months of cyclic OCs, consider switching to continuous low-dose combined OCs for an additional six months,” Dr. Lue adds. When combined OCs were compared with placebo in the treatment of dysmenorrhea, they reduced baseline pain scores by 45% to 52%, compared with 14% to 17% for placebo (P < .001).2 They also reduced the volume of endometriomas by 48%, compared with 32% for placebo (P = .04). According to Linda C. Giudice, MD, PhD, “In women with severe dysmenorrhea who have been treated with cyclic combined OCs, a switch to continuous combined OCs reduced pain scores by 58% within six months and by 75% at two years” (P < .001).2
• Depot medroxyprogesterone acetate (DMPA) or the levonorgestrel-releasing intrauterine system (LNG-IUS). These agents suppress the hypothalamic-pituitary-ovarian (HPO) axis to different degrees. DMPA suppresses the HPO completely, preventing ovulation. The LNG-IUS does not fully suppress the HPO but acts directly on endometrial tissue, with antiproliferative effects on eutopic and endometriotic implants, says Dr. Lue. The LNG-IUS also is effective at suppressing disease after surgical treatment, says Dr. Giudice.2
• Gonadotropin-releasing hormone (GnRH) agonist therapy, with estrogen and/or progestin add-back therapy to temper the associated loss in bone mineral density, “may be effective—if only temporarily—as it inhibits the HPO axis and blocks ovarian function, thereby greatly reducing systemic estrogen levels and inducing artificial menopause,” says Dr. Lue.
• Norethindrone acetate, a synthetic progestational agent, is occasionally used as empiric therapy for endometriosis because of its ability to inhibit ovulation. It has antiandrogenic and antiestrogenic effects.
• Aromatase inhibitors. Dr. Lue points to considerable evidence that endometriotic implants are an autocrine source of estrogen.3 “This locally produced estrogen results from overexpression of the enzyme P450 aromatase by endometriotic tissue,” he says. Consequently, in postmenopausal women, “aromatase inhibitors may be used orally in a daily pill form to curtail endometriotic implant production of estrogen and subsequent implant growth.”4 In women of reproductive age, aromatase inhibitors are combined with an HPO-suppressive therapy, such as norethindrone acetate. These strategies represent off-label use of aromatase inhibitors.
• Danazol, a synthetic androgen, has been used in the past to treat dysmenorrhea and dyspareunia. Because of its severe androgenic effects, however, it is not widely used today.
“For those using medical approaches, endometriosis-related pain may be reduced by using hormonal treatments to modify reproductive tract events, thereby decreasing local peritoneal inflammation and cytokine production,” says Pamela Stratton, MD. Because endometriosis is a “central sensitivity syndrome,” multidisciplinary approaches, such as physical therapy, may be beneficial to treat myofascial dysfunction and sensitization. “Chronic pain conditions that overlap with endometriosis-associated pain—such as migraines, irritable bowel syndrome, or painful bladder syndrome—should be identified and treated. Mood changes of depression and anxiety common to women with endometriosis-associated pain also warrant treatment,” she says.
Continue on to find out when laparoscopy is indicated >>
2. WHEN IS LAPAROSCOPY INDICATED?
When medical and hormonal treatments fail to control a patient’s pain, laparoscopy is indicated to confirm the diagnosis of endometriosis. During that procedure, it is also advisable to treat any endometriosis that is present, provided the surgeon is highly experienced in such treatment.
Proper treatment is preferable—even if it requires expert consultation. “No treatment and referral to a more experienced surgeon are better than incomplete treatment by an inexperienced surgeon,” says Ceana Nezhat, MD. “Not all GYN surgeons have the expertise to treat advanced endometriosis.”
Dr. Stratton agrees about the importance of thorough treatment of endometriosis at the time of diagnostic laparoscopy: “At the laparoscopy, the patient benefits if all potential sources of pain are investigated and addressed.” At surgery, the surgeon should look for and treat any lesions suspicious for endometriosis, as well as any other finding that might contribute to pain, she says. “For example, routinely inspecting the appendix for endometriosis or other lesions, and removing affected appendices is reasonable; also, lysis and, where possible, excision of adhesions is an important strategy.”
If a medical approach fails for a patient, “then surgery is indicated to confirm the diagnosis and treat the disease,” agrees Tommaso Falcone, MD.
“Surgery is very effective in treating the pain associated with endometriosis,” Dr. Falcone adds. “Randomized clinical trials have shown that up to 90% of patients who obtain pain relief from surgery will have an effect lasting one year.6 If patients do not get relief, then the association of the pain with endometriosis should be questioned and other causes sought.”
The most common anatomic sites of implants
“The most common accepted theory for pathogenesis of endometriosis suggests that implants develop when debris from retrograde menstruation attaches to the pelvic peritoneum,” says Dr. Stratton.7 “Thus, the vast majority of lesions occur in the dependent portions of the pelvis, which include the ovarian fossae (posterior broad ligament under the ovaries), cul de sac, and the uterosacral ligaments.8 The bladder peritoneum, ovarian surface, uterine peritoneal surface, fallopian tube, and pelvic sidewall are also frequent sites. The colon and appendix are less common sites, and small bowel lesions are rare.”
“However, pain location does not correlate with lesion location,” Dr. Stratton notes. “For this reason, the goal at surgery is to treat all lesions, even ones that are not in sites of pain.”
Continue to find out how disease should be staged >>
3. HOW SHOULD DISEASE BE STAGED?
Most surgeons with expertise in treating endometriosis attempt to stage the disease at the time of initial laparoscopy, even though a patient’s pain does not always correlate with the stage of disease.
“The staging system for endometriosis is a means to systematically catalogue where lesions are located,” says Dr. Stratton. The most commonly used classification system was developed by the American Society for Reproductive Medicine (ASRM). It takes into account such characteristics as how deep an implant lies, the extent to which it obliterates the posterior cul de sac, and the presence and extent of adhesions. Although the classification system is broken down into four stages ranging from minimal to severe disease, it is fairly complex. For example, it assigns a score for each lesion as well as the size and location of that lesion, notes Dr. Stratton. The presence of an endometrioma automatically renders the disease as stage III or IV, and an obliterated cul de sac means the endometriosis is graded as stage IV.
“This system enables us to communicate with each other about patients and may guide future surgeries for assessment of lesion recurrence or the planning of treatment for lesions the surgeon was unable to treat at an initial surgery,” says Dr. Stratton.
“Women with uterosacral nodularity, fixed pelvic organs, or severe pain with endometriomas may have deep infiltrating lesions. These lesions, in particular, are not captured well with the current staging system,” says Dr. Stratton. Because they appear to be innervated, “the greatest benefit to the patient is achieved by completely excising these lesions.” Preoperative imaging may help confirm the existence, location, and extent of these deep lesions and help the surgeon plan her approach “based on clinical and imaging findings.”
“Severity of pain or duration of surgical effect does not correlate with stage or extent of disease,” Dr. Stratton says.9 “In fact, patients with the least amount of disease noted at surgery experience pain sooner, suggesting that the central nervous system may have been remodeled prior to surgery or that the pain is in part due to some other cause.10 This observation underscores the principle that, while endometriosis may initiate pain, the pain experience is determined by engagement of the central nervous system.”
For more information on the ASRM revised classification of endometriosis, visit www.fertstert.org/article/S0015-0282(97)81391-X/pdf.
Continue to learn whether excision or ablation is preferable >>
4. WHICH IS PREFERABLE: EXCISION OR ABLATION?
In a prospective, randomized, double-blind study, Healey and colleagues compared pain levels following laparoscopic treatment of endometriosis with either excision or ablation. Preoperatively, women in the study completed a questionnaire rating various types of pain using visual analogue scales. They then were randomly assigned to treatment of endometriosis via excision or ablation. Postoperatively, they again completed a questionnaire about pain levels at three, six, nine, and 12 months. Investigators found no significant difference in pain scores at 12 months.11
Five-year follow-up of the same population yielded slightly different findings, however. Although there was a reduction in all pain scores at five years in both the excision and ablation groups, a significantly greater reduction in dyspareunia was observed in the excision group at five years.12
In an accompanying editorial, Dr. Falcone and a coauthor called excision versus ablation of ovarian, bowel, and peritoneal endometriosis one of the “great debates” in the surgical management of endometriosis.13 “When there is deep involvement of adjacent organs, there is general consensus that excision is best for optimal surgical outcome,” they write. “However, for disease involving the peritoneum alone, there are proponents for either option.”13
“This is a very controversial issue,” says Dr. Falcone, “and the debate can sometimes be somewhat inflammatory…. It is hard to understand how a comparative trial could even be accomplished between excision and ablation. In my experience, deep disease typically occurs on the pelvic sidewall over the ureter or in the cul de sac on the bowel or infiltrating the bladder peritoneum. Therefore, ablation would increase the risk of damaging any of these structures. With superficial disease away from critical structures, it should be fine to ablate. Everywhere else and with deep disease, you need to excise or leave disease behind.”
“Endometriomas are a special situation,” Dr. Falcone adds. “Excision of the cyst has been shown in randomized controlled trials (RCTs) to be associated with less risk for recurrence.14 Therefore, it should be the treatment of choice. However, in patients interested in future fertility, we must take into consideration the potential damage to ovarian reserve associated with excision.”
Endometriosis of the ovaries has unique manifestations. “My approach to ovarian cysts depends on their classification,” says Dr. Nezhat.15 In general, primary endometriomas (type 1) are small, superficial cysts that contain dark “chocolate” fluid. They tend to be firmly adherent to the ovarian tissue and difficult to remove surgically.
Secondary endometriomas (type 2) are follicular or luteal cysts that have been involved or invaded by cortical endometriotic implants or by primary endometrioma. Secondary endometriomas are further classified by the relationship between cortical endometriosis and the cyst wall. Type 2A endometriomas are usually large, with a capsule that is easily separated from ovarian tissue. Type 2B endometriomas have some features of functional cysts but show deep involvement with surface endometriosis. Type 2C endometriomas are similar, showing extensive surface endometrial implants but with deep penetration of the endometriosis into the cyst wall.15
“For type 1 endometriomas, I biopsy the cyst to ensure the lesion is benign, then vaporize the endometrioma,” Dr. Nezhat says. “In cases of type 2A and 2B endometriomas, the cyst capsule is easily enucleated and removed. Type 2C endometriomas are biopsied as well, and then I proceed with vaporizing the fibrotic area with a low-power energy source, such as neutral argon plasma, avoiding excessive coagulation and thermal injury.” Recent literature supports the idea of evaluation and biopsy of fibrotic endometriomas to confirm benign conditions, followed by ablation without compromising ovarian function.16
“Excision and ablation both have indications,” Dr. Nezhat asserts. “It depends on the location and depth of penetration of implants, as well as the patient’s ultimate goal. For example, if the patient desires future fertility and has endometriosis on the ovary, removal by excision could damage ovarian function. The same holds true for endometriosis on the fallopian tubes. It’s better in such cases to ablate.”
“Ablation is different from coagulation, which is not recommended,” Dr. Nezhat explains. “Ablation vaporizes the diseased area layer by layer, like peeling an onion, until the disease is eradicated. It is similar to dermatologic skin resurfacing. Vaporization is preferable for endometriosis on the tubes and ovaries in patients who desire pregnancy. The choice between excision and ablation depends on the location, depth of penetration, and the patient’s desire for fertility.”
Either way—and regardless of the primary indication for surgery (pain versus infertility)—a minimally invasive gynecologic surgeon is expected to have the ability to perform both techniques, Dr. Nezhat says.
Continue to find out if hysterectomy is definitive treatment >>
5. IS HYSTERECTOMY DEFINITIVE TREATMENT?
“Not necessarily,” says Dr. Nezhat. “Hysterectomy by itself doesn’t take care of endometriosis unless the patient has adenomyosis. If a patient has endometriosis, the first step is complete treatment of the disease to restore the anatomy. Then the next step might be hysterectomy to give a better long-term result, especially in cases of adenomyosis. Removal of the ovaries at the time of hysterectomy has to be individualized.”
“The implication that hysterectomy ‘cures’ endometriosis is false yet is stated in some textbooks,” says Dr. Nezhat. “Even at the time of hysterectomy, the first step should be complete treatment of endometriosis and restoration of anatomy, followed by the hysterectomy. Leaving endometriosis behind, believing it will go away by itself or not cause future issues, is a gross misperception.”
Removal of the ovaries at hysterectomy?
“There are few comparative studies on the long-term follow-up of patients who have undergone hysterectomy with or without removal of both ovaries,” says Dr. Falcone. “The conventional dogma has been that, in women undergoing definitive surgery for endometriosis, both ovaries should be removed, even if they are normal. I personally believe that this was because hysterectomy was often performed without excision of the endometriosis. So the uterus was removed and disease was left behind. In these cases, recurrent symptoms were due to persistent disease.”
“We reported our experience at the Cleveland Clinic with a seven-year follow-up,” Dr. Falcone continues. “Hysterectomy was performed with excision of all visible disease. Ovaries were conserved if normal and removed if not. We looked at the reoperation-free frequency over time. In women undergoing hysterectomy with excision of visible disease but ovarian preservation, the reoperation-free percentages at two, five, and seven years were 95%, 86%, and 77%, respectively, versus 96%, 91%, and 91% in those without ovarian preservation. So, overall, there was an advantage over time for removal of the ovaries. However, in the subset of women between ages 30 and 39, there was no difference in the long-term recurrence rate if the ovaries were left in. For this reason, in women younger than 40, we recommend keeping normal ovaries if all disease is removed.”17
Continue on to find out if the risk for postoperative recurrence can be reduced >>
6. CAN THE RISK FOR POSTOPERATIVE RECURRENCE BE REDUCED?
“The main problem with surgery is the recurrence rate,” Dr. Falcone says. “Studies have shown that the recurrence rate of pain at seven years may be as high as 50%.”17 Furthermore, “the recurrence of pain may not be associated with visualized endometriosis at laparoscopy.”
“Incomplete removal of lesions may be associated with an increase in pain after surgery,” says Dr. Stratton.18 “Incomplete removal of lesions may occur because of varying technical skill or specific lesion characteristics. The lesions may be difficult to remove because of their location. Lesions may not be recognized because their appearance can vary from subtle (red or clear or white) to classic (blue-black). The depth of the lesion may not be appreciated until surgery is under way, and a surgeon may not be adequately prepared to treat deep lesions when they are identified.”
Adenomyosis is another reason pain may persist or recur after surgery.19 “Adenomyosis appears as either diffuse or focal thickening of the junctional zone between the endometrium and myometrium of the uterus on T2-weighted MRI,” says Dr. Stratton. “After excision of endometriosis, chronic pelvic pain is significantly more likely to persist in women who have a junctional zone thickness of more than 11 mm on MRI.”
The frequent recurrence of pain after surgery makes the disease a long-term challenge.
“Pelvic pain caused by endometriosis is a chronic problem that requires a multiyear management plan, involving both surgery and hormonal therapy,” says Robert L. Barbieri, MD. “To reduce the number of surgical procedures in the lifetime of a woman with endometriosis and pain, I suggest hormonal medical therapy following conservative surgery for endometriosis.”
“Definitive surgery, such as hysterectomy or hysterectomy plus bilateral salpingo-oophorectomy (BSO), typically results in prolonged symptom relief,” Dr. Barbieri says. “Following hysterectomy, hormonal therapy may not be needed. Following BSO, low-dose hormonal therapy is often needed to reduce the severity of menopausal symptoms.”
After surgical treatment of endometriosis associated with pain, Dr. Barbieri presents the patient with the following menu of hormonal options:
• No hormonal therapy
• Estrogen-progestin contraceptives, either cyclic or continuous
• The LNG-IUS
• Norethindrone acetate (5 mg/d)
• DMPA (150 mg every three months)
• Leuprolide acetate depot (3.75 mg IM monthly)
• Nafarelin nasal spray (200 µg bid)
• Danazol (200 mg bid).
“I explain the common adverse effects with each approach and have the patient select what she determines to be her best option,” says Dr. Barbieri. “In my experience, conservative surgery followed by hormonal therapy is effective in more than 75% of women.”
“The evidence to support postoperative hormonal therapy is modest,” Dr. Barbieri notes. “The best evidence is available for use of the LNG-IUS, estrogen-progestin contraceptives, and GnRH agonists.”20-22
In addition, he notes, “major professional societies have highlighted the option of postoperative hormonal therapy to reduce the risk for recurrent pain and repetitive surgical procedures in the future.”23,24
When pain recurs after surgery for endometriosis, it pays to consider what type of pain it is, says Dr. Barbieri.
“There are two major types of pain—nociceptive and neuropathic,” he says. “Nociceptive pain is caused by an injury, acute or chronic. Neuropathic pain is caused by ‘activation’ of neural circuits, sometimes in the absence of an ongoing injury. Many women with endometriosis and chronic pain have both nociceptive and neuropathic pain. Consequently, it is important to consider the use of a multidisciplinary pain practice in the management of chronic pain syndromes. Multidisciplinary pain practices have special expertise in the management of neuropathic pain. Standard conservative surgical intervention is unlikely to improve pain caused by neuropathic mechanisms. Likewise, opioid analgesics are not recommended for the treatment of neuropathic pain.”
REFERENCES
1. Nezhat C, Nezhat F, Nezhat C. Endometriosis: ancient disease, ancient treatments. Fertil Steril. 2012;98(6S):S1-S62.
2. Giudice LC. Clinical practice. Endometriosis. N Engl J Med. 2010;362(25):2389-2398.
3. Pavone ME, Bulun SE. Aromatase inhibitors for the treatment of endometriosis: a review. Fertil Steril. 2012;98(6):1370-1379.
4. Nothnick WB. The emerging use of aromatase inhibitors for endometriosis treatment. Reprod Biol Endocrinol. 2011;9:87.
5. Chwalisz K, Garg R, Brenner RM, et al. Selective progesterone receptor modulators (SPRMs): a novel therapeutic concept in endometriosis. Ann N Y Acad Sci. 2002;955:373-393, 396-406.
6. Duffy JM, Arambage K, Correa FJ, et al. Laparoscopic surgery for endometriosis. Cochrane Database Syst Rev. 2014;(4):CD011031.
7. Bulun SE. Endometriosis. N Engl J Med. 2009;360(3):268-279.
8. Stegmann BJ, Sinaii N, Liu S, et al. Using location, color, size, and depth to characterize and identify endometriosis lesions in a cohort of 133 women. Fertil Steril. 2008;89(6):1632-1636.
9. Hsu AL, Sinaii N, Segars J, et al. Relating pelvic pain location to surgical findings of endometriosis. Obstet Gynecol. 2011;118(2 pt 1):223-230.
10. Stratton P, Berkley KJ. Chronic pelvic pain and endometriosis: translational evidence of the relationship and implications. Hum Reprod Update. 2011;17(3):327-346.
11. Healey M, Ang WC, Cheng C. Surgical treatment of endometriosis: a prospective randomized double-blinded trial comparing excision and ablation. Fertil Steril. 2010;94(7):2536-2540.
12. Healey M, Chang C, Kaur H. To excise or ablate endometriosis? A prospective randomized double blinded trial after 5-year follow-up. JMIG. 2014;21(6):999-1004.
13. Falcone T, Wilson JR. Surgical management of endometriosis: excision or ablation. JMIG. 2014;21(6):969.
14. Hart RJ, Hickey M, Maouris P, Buckett W. Excisional surgery versus ablative surgery for ovarian endometriomata. Cochrane Database Syst Rev. 2008;(2):CD004992.
15. Nezhat C, Nezhat F, Nezhat CH, Seidman D. Classification of endometriosis: improving the classification of endometriotic ovarian cysts. Hum Reprod. 1994;9(12):2212-2216.
16. Roman H, Auber M, Mokdad C, et al. Ovarian endometrioma ablation using plasma energy versus cystectomy: a step toward better preservation of the ovarian parenchyma in women wishing to conceive. Fertil Steril. 2011;96(6):1396-1400.
17. Shakiba K, Bena JF, McGill KM, et al. Surgical treatment of endometriosis: a 7-year follow-up on the requirement for further surgery. Obstet Gynecol. 2008;111(6):1285-1292.
18. McAllister SL, McGinty KA, Resuehr D, Berkley KJ. Endometriosis-induced vaginal hyperalgesia in the rat: role of the ectopic growths and their innervation. Pain. 2009;147(1-3):255-264.
19. Parker JD, Leondires M, Sinaii N, et al. Persistence of dysmenorrhea and nonmenstrual pain after optimal endometriosis surgery may indicate adenomyosis. Fertil Steril. 2006;86(3):711-715.
20. Abou-Setta AM, Al-Inany HG, Farquar CM. Levonorgestrel-releasing intrauterine device for symptomatic endometriosis following surgery. Cochrane Database Syst Rev. 2006;(1):CD005072.
21. Seracchioli R, Mabrouk M, Manuzzi L, et al. Postoperative use of oral contraceptive pills for prevention of anatomic relapse or symptom recurrence following surgery. Hum Reprod. 2009;24(11):2729-2735.
22. Hornstein MD, Hemmings R, Yuzpe AA, Heinrichs WL. Use of nafarelin versus placebo after reductive laparoscopic surgery for endometriosis. Fertil Steril. 1997;68(5):860-864.
23. Practice Committee of the American Society for Reproductive Medicine. Treatment of pain associated with endometriosis: a committee opinion. Fertil Steril. 2014;101(4):927-935.
24. Dunselman GA, Vermeulen N, Becker C, et al. ESHRE guideline: management of women with endometriosis. Hum Reprod. 2014;29(3):400-412.
Evaluation of Clonidine and Prazosin for the Treatment of Nighttime Posttraumatic Stress Disorder Symptoms
Posttraumatic stress disorder (PTSD) remains a significant health concern in veterans and military personnel. Whereas the lifetime incidence of PTSD in the U.S. general population is about 7% to 8%, the estimated prevalence of PTSD in deployed U.S. military personnel is higher than the national average, ranging from 11% to 17%.1,2 These numbers may be even higher, depending on the branch of service, responsibilities within the military, and specific conflict in which the veteran served. For example, one study found that 31% of Vietnam veterans have PTSD, and another recent study has reported PTSD in 28.7% of veterans returning from military service in Iraq and Afghanistan.3,4
Posttraumatic stress disorder treatment guidelines from both the American Psychiatric Association and the VA and DoD recommend the use of selective serotonin reuptake inhibitors (SSRIs) or serotonin-norepinephrine reuptake inhibitors (SNRIs) as first-line pharmacotherapy for PTSD.5,6 However, SSRIs and SNRIs seem to be largely ineffective for the management of nighttime PTSD symptoms, such as insomnia and nightmares.7,8
Related: PTSD Increases Chance of Heart Failure
Researchers hypothesize that the sympathetic nervous system plays a significant role in the hyperarousal component of nighttime PTSD. The heightened responsiveness and disruption in restorative sleep seen in PTSD have been attributed to increased activity of norepinephrine in the central nervous system.9 Mechanistically, therapies that attenuate the increased noradrenergic signaling might be effective in the management of nighttime PTSD symptoms.
The body of evidence for the use of adrenergic agents for nighttime PTSD symptoms is growing. Prazosin, a peripherally acting α1-adrenergic receptor antagonist, has recently been demonstrated to be effective for nighttime PTSD symptoms in veterans in a series of small, randomized controlled trials.10-12 Data to support the use of clonidine, a centrally acting α2-adrenergic receptor agonist, are generally limited, with the most compelling data coming from a population of civilian Cambodian refugees.13,14 A 2007 article by Boehnlein and Kinzie includes a thorough review of the preclinical research, case reports, and early clinical studies that have led to the widespread use of these agents for PTSD despite the lack of FDA approval for this indication.13A previous retrospective review by Byers and colleagues compared the effectiveness and tolerability of prazosin and quetiapine for nighttime PTSD symptoms in veterans.15 The results of that review suggest that α1-adrenergic agents may be equally effective and better tolerated than alternative medication options (ie, atypical antipsychotics) for this purpose. The present study was adapted from this design to report concurrently on the real-world use of clonidine and prazosin for the treatment of nighttime PTSD symptoms.
Study Objectives
The primary objective of this retrospective chart review was to describe the experience of patients prescribed clonidine or prazosin for the treatment of nighttime PTSD symptoms, including initial effectiveness. The primary endpoint of initial drug effectiveness was documented improvement of nighttime PTSD symptoms in the patient’s chart within 6 months of the date of first prescription. Clonidine or prazosin was categorized as initially effective if a statement such as “frequency of nightmares decreased” or “patient’s nighttime PTSD symptoms have improved” was made within 6 months after initial prescription of the drug.
The secondary objectives of this study were to evaluate the long-term effectiveness and tolerability of prazosin. The endpoints used to assess these outcomes were the 2-year continuation rates of clonidine and prazosin (as a surrogate marker for long-term effectiveness) and the documented reasons for discontinuation of clonidine and prazosin for the treatment of nighttime PTSD symptoms (in order to assess tolerability).
Methods
An electronic database search was conducted to identify the VA Portland Health Care System (VAPHCS) patients with a diagnosis of PTSD who received a first prescription for clonidine or prazosin for nighttime PTSD symptoms from a VAPHCS mental health provider or primary care provider (PCP) from January 1, 2009, to December 31, 2011. Patients were excluded if they had any history of prior use of the drug being initiated, were co-initiated on both clonidine and prazosin (defined as starting the drugs within 30 days of each other), or had a concomitant diagnosis of schizophrenia, bipolar disorder, psychotic disorder, or cognitive disorder as defined in the Diagnostic and Statistical Manual of Mental Disorders, 5th Edition. Patients with traumatic brain injury (TBI) were excluded only if it could be determined that the event had resulted in lasting cognitive impairment.
Study Population
All patients with a diagnosis of PTSD who received a first prescription for clonidine during the period specified were screened for inclusion; patients with PTSD who were first prescribed prazosin during the same period were randomly sampled to equalize patient populations. This was done to maximize the data set while examining groups of roughly equal size for each drug, as prazosin is used much more commonly than clonidine for nighttime PTSD symptoms at VAPHCS. The patients in each resulting group were screened to determine whether they met inclusion and exclusion criteria. All subjects included were followed for 2 years from the date of the initial prescription.
Study Design
Initial effectiveness of each agent was determined by reviewing subjects’ progress notes after the initial prescription of clonidine or prazosin for documentation of improvement in symptoms within 6 months of the prescription start date. A decrease in frequency or intensity of nighttime PTSD symptoms, nightmares, or insomnia, as documented in the patient chart, was interpreted as improvement of symptoms.
Long-term continuation was assessed by reviewing subjects’ prescription records, to determine whether prescription(s) for clonidine or prazosin continued for 2 years after the date of the initial prescription.
Any gap between medication fills that resulted in an anticipated period without medication of ≥ 6 months (eg, 9 months after receiving a 90-day supply) was considered discontinuation of therapy. Prescription refill history was also reviewed, and medication possession ratio (MPR) was calculated to assess whether patients were adherent to the study drug as prescribed. Adherence was defined as an MPR of ≥ 80%. Patients who left the VAPHCS service area but continued to receive care at another VA were assessed for continuation of therapy, but refill data and/or MPR were not assessed.
Tolerability was assessed by reviewing subjects’ medical records to determine whether therapy with clonidine or prazosin was discontinued due to documented adverse effects (AEs). The occurrence of AEs was determined by reviewing progress notes and other chart documentation surrounding the date of discontinuation. If the drug was discontinued but the reason was not explicitly documented or if the prescription expired without a documented reason for nonrenewing, the reason for discontinuation was coded as “not specified.” Discontinuation due to treatment failure, change in symptoms, nonadherence, or other causes was also recorded. If multiple reasons for discontinuation were cited for a single patient, all were included in the data. This project was approved by the institutional review board at the VAPHCS.
Related:Depression and Substance Abuse Intensify Suicide Risk
Statistical Considerations
Based on clinical experience, it was presumed that many of the patients who were prescribed clonidine would be receiving it as a second-line therapy after failing prazosin. Therefore, statistical analysis of the relative effectiveness and tolerability of clonidine and prazosin could not be performed. Neither power nor sample size needed to demonstrate any difference in effectiveness or tolerability between the groups was calculated. All results are expressed using descriptive statistics.
Results
An initial database search for patients with PTSD who received a first prescription for clonidine between January 1, 2009, and December 31, 2011, from a VAPHCS provider yielded a list of 149 patients. The same search criteria applied for prazosin yielded 1,116 patients, 149 of whom were randomly selected for screening. After screening, 42 patients on clonidine and 60 patients on prazosin were included in this analysis (Figure).

Patient Demographics
The average age of the clonidine patients was 38.5 years (range 21-65 years) (Table 1). The clonidine group was primarily male (90%) and white (83%). Eighteen of the 42 patients in the clonidine group had a baseline PTSD Checklist-Civilian version (PCL-C) score available within the 90 days before the first prescription of clonidine; the average baseline PCL-C score in this subgroup was 62 ± 12.0 (median 65.5, range 31-82). Most of the clonidine patients (71%) had a concomitant diagnosis of a depressive disorder. About one-quarter of the group (24%) had previously tried prazosin per prescription records. In 24 patients (57%), the first prescription for clonidine was written by a psychiatrist or psychiatric nurse practitioner; 18 patients (43%) were started on clonidine by PCPs.
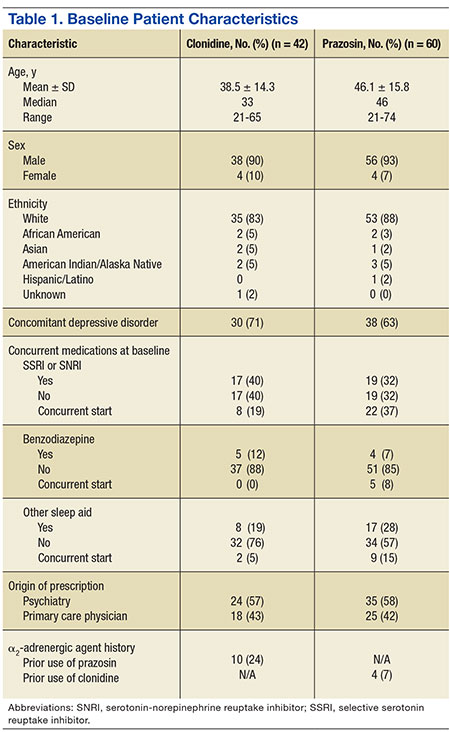
The average age of the prazosin patients was 46.1 years (range 21-74 years). The prazosin group was also primarily male (93%) and white (88%). Twenty of the 60 patients in the prazosin group had a baseline PCL-C score available within the 90 days before the first prescription of prazosin; the average baseline PCL-C score in this subgroup was 55 ± 16.1 (median 64, range 30-72). Most of the prazosin patients (63%) had a concomitant diagnosis of a depressive disorder. Four patients (7%) had previously tried clonidine per prescription records. In 35 patients (58%), the first prescription for prazosin was written by a psychiatrist or psychiatric nurse practitioner; 25 patients (42%) were started on prazosin by PCPs.
Data pertaining to initial and long-term effectiveness, tolerability, and MPR for both clonidine and prazosin are presented in Table 2.
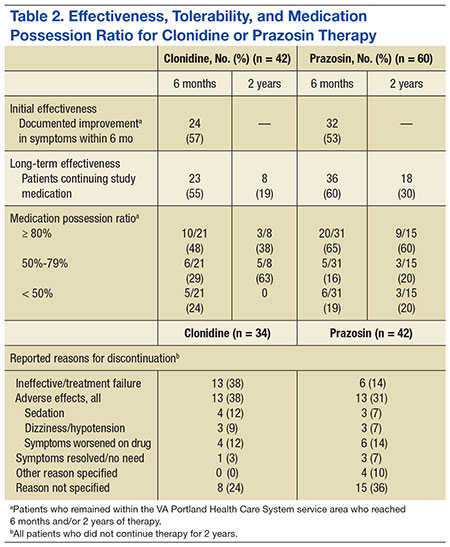
Clonidine
Of the 42 clonidine patients assessed, 24 (57%) had a positive response to the medication for nighttime PTSD symptoms documented in the Computerized Patient Record System (CPRS) within 6 months of starting therapy. Six months after starting clonidine, 23 patients (55%) continued to take clonidine. Two years after starting therapy, 8 of the original 42 patients continued on clonidine for an overall 2-year continuation rate of 19%.
Tolerability
Of the 34 patients who discontinued clonidine within 2 years, 13 patients (38%) cited ineffectiveness of therapy as a reason for discontinuation. Another 13 patients (38%) reported discontinuing therapy due to AEs. Sedation (4 patients, 12%), dizziness/hypotension (3 patients, 9%), and paradoxical worsening of PTSD symptoms (4 patients, 12%) were the most common AEs leading to discontinuation. Other AEs cited as reasons for discontinuation were syncope (2 patients), erectile dysfunction (1 patient), rash (1 patient), myoclonus (1 patient), increased depression (1 patient), and fatigue (1 patient). One patient reported that he had discontinued clonidine due to symptom resolution/lack of need for treatment. In 8 of the 34 patients, no reason for discontinuation was found in chart documentation.
Medication Possession Ratio
Among the 21 evaluable patients who continued to receive clonidine 6 months after initiation, 10 (48%) were determined to be highly adherent to therapy, with an MPR of ≥ 80%. Six of the 21 patients (29%) had an MPR between 50% and 79%, and 5 patients (24%) had an MPR < 50%.
Of the 8 patients who continued on clonidine at the 2-year mark, 3 (38%) were adherent to therapy, with an MPR of ≥ 80%. Three more patients (38%) had a 2-year MPR between 50% and 80%, and 2 patients (25%) had an MPR < 50%.
Prazosin
Of the 60 prazosin patients assessed, 32 (53%) had a positive response to the medication for nighttime PTSD symptoms documented in the CPRS within 6 months of starting therapy. Six months after starting prazosin, 36 patients (60%) continued to take prazosin. Two years after starting therapy, 18 of the original 60 patients continued on prazosin for an overall 2-year continuation rate of 30%.
Tolerability
Of the 42 patients who discontinued prazosin within 2 years, six patients (14%) cited ineffectiveness of therapy as a reason for discontinuation. Thirteen patients (31%) reported discontinuing therapy due to AEs. Sedation (3 patients, 7%), dizziness/hypotension (3 patients, 7%), and paradoxical worsening of PTSD symptoms (6 patients, 14%) were the most common AEs leading to discontinuation. Other AEs cited as reasons for discontinuation were headache (2 patients), altered mental status (1 patient), and fatigue (1 patient). Three patients reported that they had discontinued clonidine due to symptom resolution/lack of need for treatment. Other reasons for discontinuation not related to AEs included flight rules (1 patient), changes to antihypertensive regimen (1 patient), refill issues (1 patient), and cost (1 patient). In 15 of the 42 patients, no reason for discontinuation was found in chart documentation.
Medication Possession Ratio
Among the 31 evaluable patients who continued to receive prazosin 6 months after initiation, 20 (65%) were determined to be highly adherent to therapy, with an MPR of ≥ 80%. Five of the 31 patients (16%) had an MPR between 50% and 80%, and 6 patients (19%) had an MPR < 50%.
Of the 15 evaluable patients who continued on prazosin at the 2-year mark, 9 (60%) were adherent to therapy, with an MPR of ≥ 80%. Three patients (20%) had a 2-year MPR between 50% and 80%, and 3 patients (20%) had an MPR < 50%.
Discussion
Although prazosin has been shown to be effective for nighttime PTSD symptoms in both prospective and retrospective evaluations in veterans, this study provides the first evidence to support the use of clonidine in a veteran population.10-12,15
Interestingly, 42% of the patients assessed received their first prescription of an α2-adrenergic agent for nighttime PTSD symptoms from a PCP. Even with the recent increased focus on integrating mental health into primary care within the VA, this was a surprising finding. Primary care providers at VAPHCS may have a greater role in the outpatient management of PTSD than previously suspected. The information presented here may prove useful and applicable in both psychiatric and primary care treatment settings.
The study results indicated that a majority of subjects initially reported effectiveness with either clonidine or prazosin (53% and 57%, respectively). The initial effectiveness rate for prazosin is similar to those described in previous studies.10-13,15 The data also support a viable role for clonidine in the treatment of nighttime PTSD symptoms.
Regardless of initial improvement, the study results also suggest that the therapeutic benefit may not persist in the long term, as evidenced by a significant percentage of discontinuations attributed to ineffectiveness (38% for clonidine and 14% for prazosin) and a very low rate of long-term continuation (19% for clonidine and 30% for prazosin at 2 years). This latter observation contrasts with findings from previous studies; Byers and colleagues reported a 2-year prazosin continuation rate of 48.4% in a similar analysis, and Boehnlein and colleagues reported a sustained benefit of clonidine in responders over a 10-year period.14,15 The wide variety of reasons for discontinuation reported here may help providers who are considering clonidine or prazosin for their patients to anticipate barriers to long-term success.
Part of the discrepancy between these results and previously reported successes with clonidine and prazosin may be attributable to the classic issue of efficacy vs effectiveness. Many of the studies that have informed us on the efficacy and tolerability of prazosin for nighttime PTSD symptoms described outcomes of prospective clinical research. Furthermore, these prospective trials were limited to < 6 months in duration. To date, neither clonidine nor prazosin has been evaluated for long-term efficacy and effectiveness in well-designed, prospective trials. This retrospective analysis may help provide a realistic estimate of the long-term effectiveness of these therapies, especially within the veteran population.
Limitations
This was a single-center, retrospective study conducted primarily in white male patients. Although likely applicable to the U.S. veteran population at large, these data may be poorly generalizable to patient populations outside the VA health care system.
Aside from external validity, this study has several significant limitations. The primary limitation of this project is that it was not designed to allow for statistical comparison of clonidine and prazosin. Such an analysis would have better defined the role of clonidine in PTSD treatment, either by establishing similar effectiveness of clonidine and prazosin for nighttime symptoms or by providing evidence of the superiority of one over the other. In designing the project, investigators suspected based on experience that the majority of patients prescribed clonidine would receive the drug after having already failed first-line therapy with prazosin. Had this been the case, a direct comparison may have been biased in favor of prazosin. In retrospect, however, only 24% of the clonidine group had previously been prescribed prazosin, and only 7% of the prazosin group had been prescribed clonidine. This suggests that clonidine may be used first line more often than the investigators anticipated and that a future direct comparison would be worthwhile.
Second, the subjective data collected for this project required investigators to read and interpret chart notes, although the review of all records by a single investigator helped limit variability in interpretation. At times, information in the CPRS was incomplete in terms of determining continuation of therapy or cause for discontinuation.
Third, although it is implied that a significant number of veterans have combat-related PTSD, the nature of the traumatic event(s) leading to PTSD was not recorded in this study, and no subgroup analysis was done to compare the effect of α2-adrenergic agents between combat- and noncombat-related PTSD. Owing to their exclusion by design, it is also difficult to apply these results to veterans who have lasting cognitive impairment as a result of TBI, who are presumably among those most likely to have experienced traumas that could provoke PTSD.
The design of this project also did not include a subgroup analysis based on antidepressant type, and it is unclear whether the potential pharmacodynamic interaction between noradrenergic antidepressants (ie, SNRIs) and anti– α2-adrenergic agents had any impact on clinical outcomes. The use of complementary nonpharmacologic treatment modalities (ie, psychotherapy, eye movement desensitization and reprocessing) was also not evaluated.
Related: Female Service Members in the Long War
Finally, the primary outcome of patient-reported improvement in symptoms does not provide information on the magnitude or specific nature of benefits derived. Given the retrospective nature, data used in prospectively designed studies (eg, rating scales pertinent to PTSD), which might have helped to quantify the benefit of treatment, was not consistently available. Even a baseline PCL-C score, collected in order to describe the patient population, was available only in 37% of the patients assessed. Furthermore, nighttime PTSD symptoms vary among individuals, but the primary outcome of this study pools any benefits seen in areas such as nightmares, awakenings, night sweats, or sleep quality into a single outcome of symptom improvement.
Conclusions
This study indicates that both clonidine and prazosin may be effective for the treatment of nighttime PTSD symptoms in the veteran population but that their long-term utility may be limited by waning effectiveness, tolerability, and adherence issues. At this time, it is unclear whether either agent has an advantage over the other in terms of effectiveness or tolerability; further studies are needed to address that question.
Despite its limitations, the authors anticipate that this study will provide information regarding the effectiveness and tolerability of clonidine and prazosin to treat nighttime PTSD symptoms. Findings from this study may help clinicians to anticipate the needs and challenges of patients using β2-adrenergic agents for nighttime symptoms of PTSD.
Acknowledgements
The authors wish to acknowledge Brian Wilcox, PharmD, for his assistance in generating patient data reports, and Ronald Brown, RPh, MS, for his guidance regarding data analysis.
Author disclosures
The authors report no actual or potential conflicts of interest with regard to this article.
Disclaimer
The opinions expressed herein are those of the authors and do not necessarily reflect those of Federal Practitioner, Frontline Medical Communications Inc., the U.S. Government, or any of its agencies. This article may discuss unlabeled or investigational use of certain drugs. Please review the complete prescribing information for specific drugs or drug combinations—including indications, contraindications, warnings, and adverse effects—before administering pharmacologic therapy to patients.
1. Hoge CW, Castro CA, Messer SC, McGurk D, Cotting DI, Koffman RL. Combat duty in Iraq and Afghanistan, mental problems, and barriers to care. N Engl J Med. 2004;351(1):13-22.
2. Gates MA, Holowka DW, Vasterling JJ, Keane TM, Marx BP, Rosen RC. Posttraumatic stress disorder in veterans and military personnel: epidemiology, screening, and case recognition. Psychol Serv. 2012;9(4):361-382.
3. Kulka R, Schlenger WE, Fairbanks J, et al. Trauma and the Vietnam War Generation: Report of Findings From the National Vietnam Veterans Readjustment Study. New York, NY: Brunnel/Mazel; 1990.
4. Barrera TL, Graham DP, Dunn NJ, Teng EJ. Influence of trauma history on panic and posttraumatic stress disorder in returning veterans. Psychol Serv. 2013;10(2):168-176.
5. American Psychiatric Association. Practice Guideline for the Treatment of Patients With Acute Stress Disorder and Posttraumatic Stress Disorder. Arlington, VA: American Psychiatric Association; 2004.
6. U.S. Department of Veterans Affairs, Department of Defense. VA/DoD clinical practice guideline for management of post-traumatic stress. Version 2.0. U.S. Department of Veterans Affairs Website. http://www.healthquality.va.gov/guidelines/MH/ptsd/cpgPTSDFULL201011612c.pdf. Published October 2010. Accessed October 5, 2015.
7. Berger W, Mendlowicz MV, Marques-Portella C, et al. Pharmacologic alternatives to antidepressants in posttraumatic stress disorder: a systematic review. Prog Neuropsychopharmacol Biol Psychiatry. 2009;33(2):169-180.
8. Ravindran LN, Stein MB. Pharmacotherapy of post-traumatic stress disorder. In: Stein MB, Steckler T, eds. Behavioral Neurobiology of Anxiety and Its Treatment. Vol 2. Heidelberg, Germany: Springer; 2010:505-525.
9. Spoormaker VI, Montgomery P. Disturbed sleep in post-traumatic stress disorder: secondary symptom or core feature? Sleep Med Rev. 2008;12(3):169-184.
10. Raskind MA, Peskind ER, Kanter ED, et al. Reduction of nightmares and other PTSD symptoms in combat veterans by prazosin: a placebo controlled study. Am J Psychiatry. 2003;160(2):371-373.
11. Raskind MA, Peskind ER, Hoff DJ, et al. A parallel group placebo controlled study of prazosin for trauma nightmares and sleep disturbance in combat veterans with post-traumatic stress disorder. Biol Psychiatry. 2007;61(8):928-934.
12. Raskind MA, Peterson K, Williams T, et al. A trial of prazosin for combat trauma PTSD with nightmares in active-duty soldiers returned from Iraq and Afghanistan. Am J Psychiatry. 2013;170:1003-1010.
13. Boehnlein JK, Kinzie JD. Pharmacologic reduction of CNS noradrenergic activity in PTSD: the case for clonidine and prazosin. J Psychiatr Pract. 2007;13(2):72-78.
14. Boehnlein JK, Kinzie JD, Sekiya U, Riley C, Pou K, Rosborough B. A ten-year treatment outcome study of traumatized Cambodian refugees. J Nerve Ment Dis. 2004;192(10):658-663.
15. Byers MG, Allison KM, Wendel CS, Lee JK. Prazosin versus quetiapine for nighttime posttraumatic stress disorder symptoms in veterans: an assessment of long-term comparative effectiveness and safety. J Clin Psychopharmacol. 2010;30(3):225-229.
Posttraumatic stress disorder (PTSD) remains a significant health concern in veterans and military personnel. Whereas the lifetime incidence of PTSD in the U.S. general population is about 7% to 8%, the estimated prevalence of PTSD in deployed U.S. military personnel is higher than the national average, ranging from 11% to 17%.1,2 These numbers may be even higher, depending on the branch of service, responsibilities within the military, and specific conflict in which the veteran served. For example, one study found that 31% of Vietnam veterans have PTSD, and another recent study has reported PTSD in 28.7% of veterans returning from military service in Iraq and Afghanistan.3,4
Posttraumatic stress disorder treatment guidelines from both the American Psychiatric Association and the VA and DoD recommend the use of selective serotonin reuptake inhibitors (SSRIs) or serotonin-norepinephrine reuptake inhibitors (SNRIs) as first-line pharmacotherapy for PTSD.5,6 However, SSRIs and SNRIs seem to be largely ineffective for the management of nighttime PTSD symptoms, such as insomnia and nightmares.7,8
Related: PTSD Increases Chance of Heart Failure
Researchers hypothesize that the sympathetic nervous system plays a significant role in the hyperarousal component of nighttime PTSD. The heightened responsiveness and disruption in restorative sleep seen in PTSD have been attributed to increased activity of norepinephrine in the central nervous system.9 Mechanistically, therapies that attenuate the increased noradrenergic signaling might be effective in the management of nighttime PTSD symptoms.
The body of evidence for the use of adrenergic agents for nighttime PTSD symptoms is growing. Prazosin, a peripherally acting α1-adrenergic receptor antagonist, has recently been demonstrated to be effective for nighttime PTSD symptoms in veterans in a series of small, randomized controlled trials.10-12 Data to support the use of clonidine, a centrally acting α2-adrenergic receptor agonist, are generally limited, with the most compelling data coming from a population of civilian Cambodian refugees.13,14 A 2007 article by Boehnlein and Kinzie includes a thorough review of the preclinical research, case reports, and early clinical studies that have led to the widespread use of these agents for PTSD despite the lack of FDA approval for this indication.13A previous retrospective review by Byers and colleagues compared the effectiveness and tolerability of prazosin and quetiapine for nighttime PTSD symptoms in veterans.15 The results of that review suggest that α1-adrenergic agents may be equally effective and better tolerated than alternative medication options (ie, atypical antipsychotics) for this purpose. The present study was adapted from this design to report concurrently on the real-world use of clonidine and prazosin for the treatment of nighttime PTSD symptoms.
Study Objectives
The primary objective of this retrospective chart review was to describe the experience of patients prescribed clonidine or prazosin for the treatment of nighttime PTSD symptoms, including initial effectiveness. The primary endpoint of initial drug effectiveness was documented improvement of nighttime PTSD symptoms in the patient’s chart within 6 months of the date of first prescription. Clonidine or prazosin was categorized as initially effective if a statement such as “frequency of nightmares decreased” or “patient’s nighttime PTSD symptoms have improved” was made within 6 months after initial prescription of the drug.
The secondary objectives of this study were to evaluate the long-term effectiveness and tolerability of prazosin. The endpoints used to assess these outcomes were the 2-year continuation rates of clonidine and prazosin (as a surrogate marker for long-term effectiveness) and the documented reasons for discontinuation of clonidine and prazosin for the treatment of nighttime PTSD symptoms (in order to assess tolerability).
Methods
An electronic database search was conducted to identify the VA Portland Health Care System (VAPHCS) patients with a diagnosis of PTSD who received a first prescription for clonidine or prazosin for nighttime PTSD symptoms from a VAPHCS mental health provider or primary care provider (PCP) from January 1, 2009, to December 31, 2011. Patients were excluded if they had any history of prior use of the drug being initiated, were co-initiated on both clonidine and prazosin (defined as starting the drugs within 30 days of each other), or had a concomitant diagnosis of schizophrenia, bipolar disorder, psychotic disorder, or cognitive disorder as defined in the Diagnostic and Statistical Manual of Mental Disorders, 5th Edition. Patients with traumatic brain injury (TBI) were excluded only if it could be determined that the event had resulted in lasting cognitive impairment.
Study Population
All patients with a diagnosis of PTSD who received a first prescription for clonidine during the period specified were screened for inclusion; patients with PTSD who were first prescribed prazosin during the same period were randomly sampled to equalize patient populations. This was done to maximize the data set while examining groups of roughly equal size for each drug, as prazosin is used much more commonly than clonidine for nighttime PTSD symptoms at VAPHCS. The patients in each resulting group were screened to determine whether they met inclusion and exclusion criteria. All subjects included were followed for 2 years from the date of the initial prescription.
Study Design
Initial effectiveness of each agent was determined by reviewing subjects’ progress notes after the initial prescription of clonidine or prazosin for documentation of improvement in symptoms within 6 months of the prescription start date. A decrease in frequency or intensity of nighttime PTSD symptoms, nightmares, or insomnia, as documented in the patient chart, was interpreted as improvement of symptoms.
Long-term continuation was assessed by reviewing subjects’ prescription records, to determine whether prescription(s) for clonidine or prazosin continued for 2 years after the date of the initial prescription.
Any gap between medication fills that resulted in an anticipated period without medication of ≥ 6 months (eg, 9 months after receiving a 90-day supply) was considered discontinuation of therapy. Prescription refill history was also reviewed, and medication possession ratio (MPR) was calculated to assess whether patients were adherent to the study drug as prescribed. Adherence was defined as an MPR of ≥ 80%. Patients who left the VAPHCS service area but continued to receive care at another VA were assessed for continuation of therapy, but refill data and/or MPR were not assessed.
Tolerability was assessed by reviewing subjects’ medical records to determine whether therapy with clonidine or prazosin was discontinued due to documented adverse effects (AEs). The occurrence of AEs was determined by reviewing progress notes and other chart documentation surrounding the date of discontinuation. If the drug was discontinued but the reason was not explicitly documented or if the prescription expired without a documented reason for nonrenewing, the reason for discontinuation was coded as “not specified.” Discontinuation due to treatment failure, change in symptoms, nonadherence, or other causes was also recorded. If multiple reasons for discontinuation were cited for a single patient, all were included in the data. This project was approved by the institutional review board at the VAPHCS.
Related:Depression and Substance Abuse Intensify Suicide Risk
Statistical Considerations
Based on clinical experience, it was presumed that many of the patients who were prescribed clonidine would be receiving it as a second-line therapy after failing prazosin. Therefore, statistical analysis of the relative effectiveness and tolerability of clonidine and prazosin could not be performed. Neither power nor sample size needed to demonstrate any difference in effectiveness or tolerability between the groups was calculated. All results are expressed using descriptive statistics.
Results
An initial database search for patients with PTSD who received a first prescription for clonidine between January 1, 2009, and December 31, 2011, from a VAPHCS provider yielded a list of 149 patients. The same search criteria applied for prazosin yielded 1,116 patients, 149 of whom were randomly selected for screening. After screening, 42 patients on clonidine and 60 patients on prazosin were included in this analysis (Figure).
Patient Demographics
The average age of the clonidine patients was 38.5 years (range 21-65 years) (Table 1). The clonidine group was primarily male (90%) and white (83%). Eighteen of the 42 patients in the clonidine group had a baseline PTSD Checklist-Civilian version (PCL-C) score available within the 90 days before the first prescription of clonidine; the average baseline PCL-C score in this subgroup was 62 ± 12.0 (median 65.5, range 31-82). Most of the clonidine patients (71%) had a concomitant diagnosis of a depressive disorder. About one-quarter of the group (24%) had previously tried prazosin per prescription records. In 24 patients (57%), the first prescription for clonidine was written by a psychiatrist or psychiatric nurse practitioner; 18 patients (43%) were started on clonidine by PCPs.
The average age of the prazosin patients was 46.1 years (range 21-74 years). The prazosin group was also primarily male (93%) and white (88%). Twenty of the 60 patients in the prazosin group had a baseline PCL-C score available within the 90 days before the first prescription of prazosin; the average baseline PCL-C score in this subgroup was 55 ± 16.1 (median 64, range 30-72). Most of the prazosin patients (63%) had a concomitant diagnosis of a depressive disorder. Four patients (7%) had previously tried clonidine per prescription records. In 35 patients (58%), the first prescription for prazosin was written by a psychiatrist or psychiatric nurse practitioner; 25 patients (42%) were started on prazosin by PCPs.
Data pertaining to initial and long-term effectiveness, tolerability, and MPR for both clonidine and prazosin are presented in Table 2.
Clonidine
Of the 42 clonidine patients assessed, 24 (57%) had a positive response to the medication for nighttime PTSD symptoms documented in the Computerized Patient Record System (CPRS) within 6 months of starting therapy. Six months after starting clonidine, 23 patients (55%) continued to take clonidine. Two years after starting therapy, 8 of the original 42 patients continued on clonidine for an overall 2-year continuation rate of 19%.
Tolerability
Of the 34 patients who discontinued clonidine within 2 years, 13 patients (38%) cited ineffectiveness of therapy as a reason for discontinuation. Another 13 patients (38%) reported discontinuing therapy due to AEs. Sedation (4 patients, 12%), dizziness/hypotension (3 patients, 9%), and paradoxical worsening of PTSD symptoms (4 patients, 12%) were the most common AEs leading to discontinuation. Other AEs cited as reasons for discontinuation were syncope (2 patients), erectile dysfunction (1 patient), rash (1 patient), myoclonus (1 patient), increased depression (1 patient), and fatigue (1 patient). One patient reported that he had discontinued clonidine due to symptom resolution/lack of need for treatment. In 8 of the 34 patients, no reason for discontinuation was found in chart documentation.
Medication Possession Ratio
Among the 21 evaluable patients who continued to receive clonidine 6 months after initiation, 10 (48%) were determined to be highly adherent to therapy, with an MPR of ≥ 80%. Six of the 21 patients (29%) had an MPR between 50% and 79%, and 5 patients (24%) had an MPR < 50%.
Of the 8 patients who continued on clonidine at the 2-year mark, 3 (38%) were adherent to therapy, with an MPR of ≥ 80%. Three more patients (38%) had a 2-year MPR between 50% and 80%, and 2 patients (25%) had an MPR < 50%.
Prazosin
Of the 60 prazosin patients assessed, 32 (53%) had a positive response to the medication for nighttime PTSD symptoms documented in the CPRS within 6 months of starting therapy. Six months after starting prazosin, 36 patients (60%) continued to take prazosin. Two years after starting therapy, 18 of the original 60 patients continued on prazosin for an overall 2-year continuation rate of 30%.
Tolerability
Of the 42 patients who discontinued prazosin within 2 years, six patients (14%) cited ineffectiveness of therapy as a reason for discontinuation. Thirteen patients (31%) reported discontinuing therapy due to AEs. Sedation (3 patients, 7%), dizziness/hypotension (3 patients, 7%), and paradoxical worsening of PTSD symptoms (6 patients, 14%) were the most common AEs leading to discontinuation. Other AEs cited as reasons for discontinuation were headache (2 patients), altered mental status (1 patient), and fatigue (1 patient). Three patients reported that they had discontinued clonidine due to symptom resolution/lack of need for treatment. Other reasons for discontinuation not related to AEs included flight rules (1 patient), changes to antihypertensive regimen (1 patient), refill issues (1 patient), and cost (1 patient). In 15 of the 42 patients, no reason for discontinuation was found in chart documentation.
Medication Possession Ratio
Among the 31 evaluable patients who continued to receive prazosin 6 months after initiation, 20 (65%) were determined to be highly adherent to therapy, with an MPR of ≥ 80%. Five of the 31 patients (16%) had an MPR between 50% and 80%, and 6 patients (19%) had an MPR < 50%.
Of the 15 evaluable patients who continued on prazosin at the 2-year mark, 9 (60%) were adherent to therapy, with an MPR of ≥ 80%. Three patients (20%) had a 2-year MPR between 50% and 80%, and 3 patients (20%) had an MPR < 50%.
Discussion
Although prazosin has been shown to be effective for nighttime PTSD symptoms in both prospective and retrospective evaluations in veterans, this study provides the first evidence to support the use of clonidine in a veteran population.10-12,15
Interestingly, 42% of the patients assessed received their first prescription of an α2-adrenergic agent for nighttime PTSD symptoms from a PCP. Even with the recent increased focus on integrating mental health into primary care within the VA, this was a surprising finding. Primary care providers at VAPHCS may have a greater role in the outpatient management of PTSD than previously suspected. The information presented here may prove useful and applicable in both psychiatric and primary care treatment settings.
The study results indicated that a majority of subjects initially reported effectiveness with either clonidine or prazosin (53% and 57%, respectively). The initial effectiveness rate for prazosin is similar to those described in previous studies.10-13,15 The data also support a viable role for clonidine in the treatment of nighttime PTSD symptoms.
Regardless of initial improvement, the study results also suggest that the therapeutic benefit may not persist in the long term, as evidenced by a significant percentage of discontinuations attributed to ineffectiveness (38% for clonidine and 14% for prazosin) and a very low rate of long-term continuation (19% for clonidine and 30% for prazosin at 2 years). This latter observation contrasts with findings from previous studies; Byers and colleagues reported a 2-year prazosin continuation rate of 48.4% in a similar analysis, and Boehnlein and colleagues reported a sustained benefit of clonidine in responders over a 10-year period.14,15 The wide variety of reasons for discontinuation reported here may help providers who are considering clonidine or prazosin for their patients to anticipate barriers to long-term success.
Part of the discrepancy between these results and previously reported successes with clonidine and prazosin may be attributable to the classic issue of efficacy vs effectiveness. Many of the studies that have informed us on the efficacy and tolerability of prazosin for nighttime PTSD symptoms described outcomes of prospective clinical research. Furthermore, these prospective trials were limited to < 6 months in duration. To date, neither clonidine nor prazosin has been evaluated for long-term efficacy and effectiveness in well-designed, prospective trials. This retrospective analysis may help provide a realistic estimate of the long-term effectiveness of these therapies, especially within the veteran population.
Limitations
This was a single-center, retrospective study conducted primarily in white male patients. Although likely applicable to the U.S. veteran population at large, these data may be poorly generalizable to patient populations outside the VA health care system.
Aside from external validity, this study has several significant limitations. The primary limitation of this project is that it was not designed to allow for statistical comparison of clonidine and prazosin. Such an analysis would have better defined the role of clonidine in PTSD treatment, either by establishing similar effectiveness of clonidine and prazosin for nighttime symptoms or by providing evidence of the superiority of one over the other. In designing the project, investigators suspected based on experience that the majority of patients prescribed clonidine would receive the drug after having already failed first-line therapy with prazosin. Had this been the case, a direct comparison may have been biased in favor of prazosin. In retrospect, however, only 24% of the clonidine group had previously been prescribed prazosin, and only 7% of the prazosin group had been prescribed clonidine. This suggests that clonidine may be used first line more often than the investigators anticipated and that a future direct comparison would be worthwhile.
Second, the subjective data collected for this project required investigators to read and interpret chart notes, although the review of all records by a single investigator helped limit variability in interpretation. At times, information in the CPRS was incomplete in terms of determining continuation of therapy or cause for discontinuation.
Third, although it is implied that a significant number of veterans have combat-related PTSD, the nature of the traumatic event(s) leading to PTSD was not recorded in this study, and no subgroup analysis was done to compare the effect of α2-adrenergic agents between combat- and noncombat-related PTSD. Owing to their exclusion by design, it is also difficult to apply these results to veterans who have lasting cognitive impairment as a result of TBI, who are presumably among those most likely to have experienced traumas that could provoke PTSD.
The design of this project also did not include a subgroup analysis based on antidepressant type, and it is unclear whether the potential pharmacodynamic interaction between noradrenergic antidepressants (ie, SNRIs) and anti– α2-adrenergic agents had any impact on clinical outcomes. The use of complementary nonpharmacologic treatment modalities (ie, psychotherapy, eye movement desensitization and reprocessing) was also not evaluated.
Related: Female Service Members in the Long War
Finally, the primary outcome of patient-reported improvement in symptoms does not provide information on the magnitude or specific nature of benefits derived. Given the retrospective nature, data used in prospectively designed studies (eg, rating scales pertinent to PTSD), which might have helped to quantify the benefit of treatment, was not consistently available. Even a baseline PCL-C score, collected in order to describe the patient population, was available only in 37% of the patients assessed. Furthermore, nighttime PTSD symptoms vary among individuals, but the primary outcome of this study pools any benefits seen in areas such as nightmares, awakenings, night sweats, or sleep quality into a single outcome of symptom improvement.
Conclusions
This study indicates that both clonidine and prazosin may be effective for the treatment of nighttime PTSD symptoms in the veteran population but that their long-term utility may be limited by waning effectiveness, tolerability, and adherence issues. At this time, it is unclear whether either agent has an advantage over the other in terms of effectiveness or tolerability; further studies are needed to address that question.
Despite its limitations, the authors anticipate that this study will provide information regarding the effectiveness and tolerability of clonidine and prazosin to treat nighttime PTSD symptoms. Findings from this study may help clinicians to anticipate the needs and challenges of patients using β2-adrenergic agents for nighttime symptoms of PTSD.
Acknowledgements
The authors wish to acknowledge Brian Wilcox, PharmD, for his assistance in generating patient data reports, and Ronald Brown, RPh, MS, for his guidance regarding data analysis.
Author disclosures
The authors report no actual or potential conflicts of interest with regard to this article.
Disclaimer
The opinions expressed herein are those of the authors and do not necessarily reflect those of Federal Practitioner, Frontline Medical Communications Inc., the U.S. Government, or any of its agencies. This article may discuss unlabeled or investigational use of certain drugs. Please review the complete prescribing information for specific drugs or drug combinations—including indications, contraindications, warnings, and adverse effects—before administering pharmacologic therapy to patients.
1. Hoge CW, Castro CA, Messer SC, McGurk D, Cotting DI, Koffman RL. Combat duty in Iraq and Afghanistan, mental problems, and barriers to care. N Engl J Med. 2004;351(1):13-22.
2. Gates MA, Holowka DW, Vasterling JJ, Keane TM, Marx BP, Rosen RC. Posttraumatic stress disorder in veterans and military personnel: epidemiology, screening, and case recognition. Psychol Serv. 2012;9(4):361-382.
3. Kulka R, Schlenger WE, Fairbanks J, et al. Trauma and the Vietnam War Generation: Report of Findings From the National Vietnam Veterans Readjustment Study. New York, NY: Brunnel/Mazel; 1990.
4. Barrera TL, Graham DP, Dunn NJ, Teng EJ. Influence of trauma history on panic and posttraumatic stress disorder in returning veterans. Psychol Serv. 2013;10(2):168-176.
5. American Psychiatric Association. Practice Guideline for the Treatment of Patients With Acute Stress Disorder and Posttraumatic Stress Disorder. Arlington, VA: American Psychiatric Association; 2004.
6. U.S. Department of Veterans Affairs, Department of Defense. VA/DoD clinical practice guideline for management of post-traumatic stress. Version 2.0. U.S. Department of Veterans Affairs Website. http://www.healthquality.va.gov/guidelines/MH/ptsd/cpgPTSDFULL201011612c.pdf. Published October 2010. Accessed October 5, 2015.
7. Berger W, Mendlowicz MV, Marques-Portella C, et al. Pharmacologic alternatives to antidepressants in posttraumatic stress disorder: a systematic review. Prog Neuropsychopharmacol Biol Psychiatry. 2009;33(2):169-180.
8. Ravindran LN, Stein MB. Pharmacotherapy of post-traumatic stress disorder. In: Stein MB, Steckler T, eds. Behavioral Neurobiology of Anxiety and Its Treatment. Vol 2. Heidelberg, Germany: Springer; 2010:505-525.
9. Spoormaker VI, Montgomery P. Disturbed sleep in post-traumatic stress disorder: secondary symptom or core feature? Sleep Med Rev. 2008;12(3):169-184.
10. Raskind MA, Peskind ER, Kanter ED, et al. Reduction of nightmares and other PTSD symptoms in combat veterans by prazosin: a placebo controlled study. Am J Psychiatry. 2003;160(2):371-373.
11. Raskind MA, Peskind ER, Hoff DJ, et al. A parallel group placebo controlled study of prazosin for trauma nightmares and sleep disturbance in combat veterans with post-traumatic stress disorder. Biol Psychiatry. 2007;61(8):928-934.
12. Raskind MA, Peterson K, Williams T, et al. A trial of prazosin for combat trauma PTSD with nightmares in active-duty soldiers returned from Iraq and Afghanistan. Am J Psychiatry. 2013;170:1003-1010.
13. Boehnlein JK, Kinzie JD. Pharmacologic reduction of CNS noradrenergic activity in PTSD: the case for clonidine and prazosin. J Psychiatr Pract. 2007;13(2):72-78.
14. Boehnlein JK, Kinzie JD, Sekiya U, Riley C, Pou K, Rosborough B. A ten-year treatment outcome study of traumatized Cambodian refugees. J Nerve Ment Dis. 2004;192(10):658-663.
15. Byers MG, Allison KM, Wendel CS, Lee JK. Prazosin versus quetiapine for nighttime posttraumatic stress disorder symptoms in veterans: an assessment of long-term comparative effectiveness and safety. J Clin Psychopharmacol. 2010;30(3):225-229.