User login
Can a Total Knee Arthroplasty Perioperative Surgical Home Close the Gap Between Primary and Revision TKA Outcomes?
Total knee arthroplasty (TKA) is an efficacious procedure for end-stage knee arthritis. Although TKA is cost-effective and has a high rate of success,1-6 TKAs fail and may require revision surgery. Failure mechanisms include periprosthetic fracture, aseptic loosening, wear, osteolysis, instability, and infection.7-9 In these cases, revision arthroplasty may be needed in order to restore function.
There has been a steady increase in the number of primary and revision TKAs performed in the United States.8,10,11 Revision rates are 4% at 5 years after index TKA and 8.9% at 9 years.12 However, surgical techniques and improved implants have led to improved outcomes after primary TKA, as evidenced by the reduction in revisions performed for polyethylene wear and osteolysis.13 Given the continuing need for revision TKAs (despite technical improvements13), evidence-based standard protocols that improve outcomes after revision TKA are necessary.
The Total Joint Replacement Perioperative Surgical Home (TJR-PSH) implemented and used by surgeons and anesthesiologists at our institution has shown that an evidence-based perioperative protocol can provide consistent and improved outcomes in primary TKA.14-16

Garson and colleagues14 and Chaurasia and colleagues15 found that patients who underwent primary TKA in a TJA-PSH had a predicted short length of stay (LOS): <3 days. About half were discharged to a location other than home, and 1.1% were readmitted within the first 30 days after surgery. There were no major complications and no mortalities. Conversely, as shown in different nationwide database analysis,17,18 mean LOS after primary unilateral TKA was 5.3 days, 8.2% of patients had procedure-related complications, 30-day readmission rate was 4.2%, and the in-hospital mortality rate was 0.3%. As with TJA-PSH, about half the patients were discharged to a place other than home.
We conducted a study to test the effect of the TJA-PSH clinical pathway on revision TKA patients. Early perioperative outcomes, such as LOS, readmission rate, and reoperation rate, are invaluable tools in measuring TKA outcomes and correlate with the dedicated orthopedic complication grading system proposed by the Knee Society.14,15,17,19 We hypothesized that the TJR-PSH clinical pathway would close the perioperative morbidity gap between primary and revision TKAs and yield equivalent perioperative outcomes.
Materials and Methods
In this study, which received Institutional Review Board approval, we performed a prospective cross-sectional analysis comparing the perioperative outcomes of patients who underwent primary TKA with those of patients who underwent revision TKA. Medical records and our institution’s data registry were queried for LOS, discharge disposition, readmission rates, and reoperation rates.
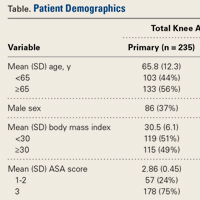
The study included all primary and revision TKAs performed at our institution since the inception of TJA-PSH. Unicompartmental knee arthroplasties and exchanges of a single component (patella, tibia, or femur) were excluded. We identified a total of 285 consecutive primary or revision TKAs, all performed by a single surgeon. Three cases lacked complete data and were excluded, leaving 282 cases: 235 primary and 50 revision TKAs (no simultaneous bilateral TKAs). The demographic data we collected included age, sex, body mass index (BMI), American Society of Anesthesiologists (ASA) score, calculated Charlson Comorbidity Index (CCI), LOS, and discharge disposition.
The same established perioperative surgical home clinical pathway was used to care for all patients, whether they underwent primary or revision TKA. The primary outcomes studied were LOS, discharge disposition (subacute nursing facility or home), 30-day orthopedic readmission, and return to operating room. All reoperations on the same knee were analyzed.
Statistical Analysis
Primary and revision TKAs were compared on LOS (with an independent-sample t test) and discharge disposition, 30-day readmissions, and reoperations (χ2 Fisher exact test). Multivariate regression analysis was performed with each primary outcome, using age, sex, BMI, ASA score, and CCI as covariates. Statistical significance was set at P ≤ .05. All analyses were performed with SPSS Version 16.0 (SPSS Inc.) and Microsoft Excel 2011 (Microsoft).
Results
Mean (SD) age was 66 (13.2) years for primary TKA patients and 62 (12.8) years for revision TKA patients. The cohort had more women (62.5%) than men (37.5%). There was no statistical difference in patient demographics with respect to age (P = .169) or BMI (P = .701) between the 2 groups. There was an even age distribution within each group and between the groups (Table). 
There was no statistically significant difference in LOS between the groups. Mean (SD) LOS was 2.55 (1.25) days for primary TKA and 2.92 (1.24) days for revision TKA (P = .061; 95% confidence interval [CI], 0.017-0.749). Regression analysis showed a correlation between ASA score and LOS for primary TKAs but not revision TKAs. For every unit increase in ASA score, there was a 0.39-day increase in LOS for primary TKA (P = .46; 95% CI, 0.006-0.781). There was no correlation between ASA score and LOS for revision TKA when controlling for covariates (P = .124). Eighty (34%) of the 235 primary TKA patients and 21 (41%) of the 50 revision TKA patients were discharged to a subacute nursing facility; the difference was not significant (P = .123). No patient was discharged to an acute inpatient rehabilitation unit. In addition, there was no significant difference in 30-day readmission rates between primary and revision TKA (P = .081). One primary TKA patient (0.4%) and 2 revision TKA patients (4%) were readmitted within 30 days after surgery (P = .081). The primary TKA readmission was for severe spasticity and a history of cerebral palsy leading to a quadriceps avulsion fracture from the superior pole of the patella. One revision TKA readmission was for acute periprosthetic joint infection, and the other for periprosthetic fracture around a press-fit distal femoral replacement stem. There was no significant difference in number of 30-day reoperations between the groups (P = .993). None of the primary TKAs and 2 (4%) of the revision TKAs underwent reoperation. Of the revision TKA patients who returned to the operating room within 30 days after surgery, one was treated for an acute periprosthetic joint infection, the other for a femoral periprosthetic fracture.
Discussion
Advances in multidisciplinary co-management of TKA patients and their clinical effects are highlighted in the TJR-PSH.14 TJR-PSH allows the health team and the patient to prepare for surgery with an understanding of probable outcomes and to optimize the patient’s medical and educational standing to better meet expectations and increase satisfaction.
Previous studies have focused on the etiologies of revision TKA7,8 and on understanding the factors that may predict increased risk for a poor outcome after primary TKA and indicate a possible need for revision.8,12 The present study focused on practical clinical processes that could potentially constitute a standardized perioperative protocol for revision TKA. An organized TJR-PSH may allow the health team to educate patients that LOS, rehabilitation and acute recovery, risk of acute (30-day) complications, and risk of readmission and return to the operating room within the first 30 days after surgery are similar for revision and primary TKAs, as long as proper preoperative optimization and education occur within the TJR-PSH.
Studies have found correlations between revision TKA and significantly increased LOS and postoperative complications.20,21 In contrast, we found no significant difference in LOS between our primary and revision TKA groups. LOS was 2.6 days for primary TKA and 2.9 days for revision TKA—a significant improvement in care and cost for revision TKA patients. That the reduced mean LOS for revision TKA is similar to the mean LOS for primary TKA also implies a reduction in the higher cost of care in revision TKA.20 In addition to obtaining similar LOS for primary and revision TKA, TJR-PSH achieved an overall reduction in LOS.17,22Our results also showed no difference in discharge disposition between primary and revision TKA in our protocol. Discharge disposition also did not correlate with age, sex, BMI, ASA score, or CCI. In TJR-PSH, discharge planning starts before admission and is patient-oriented for optimal recovery. About 66% of primary TKA patients and 58% of revision TKA patients in our cohort were discharged home—implying we are able to send a majority of our postoperative patients home after a shorter hospital stay, while obtaining the same good outcomes. Discharging fewer revision TKA patients to extended-care facilities also indicates a possible reduction in the cost of postoperative care, bringing it in line with the cost in primary TKA. Early individualized discharge planning in TJA-PSH accounts for the similar outcomes in primary and revision TKAs.
There was no significant difference in 30-day readmission rates between our primary and revision TKA patients. An important component of the TJR-PSH pathway is the individualized postdischarge recovery plan, which helps with optimal recovery and reduces readmission rates. Our cohort’s 30-day readmission rate was 0.4% for primary TKA and 4% for revision TKA (P = .081). Thirty-day readmission is a good indicator of postoperative complications and recovery from surgery. We have previously reported on primary TKA outcomes.14,15,,18,22,23 In a study using an NSQIP (National Surgical Quality Improvement Program) database, 11,814 primary TKAs had a 30-day readmission rate of 4.2%.18 In an outcomes study of 17,994 patients who underwent primary TKA in a single fiscal year, the 30-day readmission rate was 5.9%.9 In addition, in a single-institution cohort study of 1032 primary TKA patients, Schairer and colleagues23 found a 30-day unplanned readmission rate of 3.4%. Compared with primary TKA, revision TKA traditionally has had a higher postoperative complication rate.20,21 There is also concern that shorter hospital stays may indicate that significant complications of revision TKAs are being missed. In this study, however, we established that the equal outcomes obtained in the perioperative period carry over to the 30-day postoperative period in our revision TKA group. Good postoperative follow-up and planning are important factors in readmission reduction. Readmissions also have significant overall cost implications.24There was no statistical difference in 30-day reoperation rates between our primary and revision TKA patients. The primary TKA patients had no 30-day reoperations. Previous studies have found reoperation rates ranging from 1.8% to 4.7%.25,26 Revision TKA patients are up to 6 times more likely than primary TKA patients to require reoperation.20 Our study found no significant difference in outcomes between primary and revision TKAs.
Comparison of the outcomes of primary TKA and revision TKA in TJR-PSH showed no difference in acute recovery from surgery. LOS and discharge disposition, 30-day readmission rate, and 30-day return to the operating room were the same for primary and revision TKAs. The morbidity gap between primary and revision TKA patients has been closed in our research cohort. This outcome is important, as indications for primary TKA continue to expand and more primary TKAs are performed in younger patients.18,23 The implication is that, in the future, more knees will need to be revised as patients outlive their prostheses.
Our study had some limitations. First, it involved a small sample of patients, operated on by a single surgeon in a well-organized TJR-PSH at a large academic center. This population might not represent the US patient population, but that should not have adversely affected data analysis, because patients were compared with a similar population. Second, the data might be incomplete because some patients with complications might have sought care at other medical facilities, and we might not have been aware of these cases. Third, we focused on objective clinical outcomes in order to measure the success of TKAs. We did not include any subjective, patient-reported data, such as rehabilitation advances and functioning levels. Fourth, multiple parameters can be used to address complication outcomes, but we used LOS, discharge disposition, 30-day readmission rate, and 30-day reoperation rate because current payers and institutions often consider these variables when assessing quality of care. These parameters can be influenced by factors such as inpatient physical therapy goals, facility discharge practices, individual social support structure, and hospital pay-for-performance model. The implication is that different facilities have different outcomes in terms of LOS, discharge disposition, readmissions, and reoperations. However, we expect proportionate similarities in these parameters as patient perioperative outcomes become more complicated. Nevertheless, a multicenter study would be able to answer questions raised by this limitation. Fifth, our statistical analysis might have been affected by decreased power of some of the outcome variables.
TJR-PSH has succeeded in closing the perioperative morbidity and outcomes gap between primary and revision TKAs. Outcome parameters used to measure the success of TJR-PSH are standard measures of the immediate postoperative recovery and short-term outcomes of TKA patients. These measures are linked to complication rates and overall outcomes in many TKA studies.14,15,17,19 Also important is that hospital costs can be drastically cut by reducing LOS, readmissions, and reoperations. Presence of any complication of primary or revision TKA raises the cost up to 34%. This increase can go as high as 64% in the 90 days after surgery.27
Conclusion
The major challenge of the changing medical landscape is to integrate quality care and a continually improving healthcare system with the goal of cost-effective delivery of healthcare. Surgical care costs can be significantly increased by evitable hospital stays, complications that lead to readmissions, and unplanned returns to the operating room after index surgery. The new perioperative surgical home created for TJA has helped drastically reduce LOS, discharge disposition, 30-day readmission rate, and 30-day reoperation rate in revision TKA. This study demonstrates similar outcomes in our revision TKA patients relative to their primary TKA counterparts.
Am J Orthop. 2016;45(7):E458-E464. Copyright Frontline Medical Communications Inc. 2016. All rights reserved.
1. Berger RA, Rosenberg AG, Barden RM, Sheinkop MB, Jacobs JJ, Galante JO. Long-term followup of the Miller-Galante total knee replacement. Clin Orthop Relat Res. 2001;(388):58-67.
2. Rissanen P, Aro S, Slatis P, Sintonen H, Paavolainen P. Health and quality of life before and after hip or knee arthroplasty. J Arthroplasty. 1995;10(2):169-175.
3. March LM, Cross MJ, Lapsley H, et al. Outcomes after hip or knee replacement surgery for osteoarthritis. A prospective cohort study comparing patients’ quality of life before and after surgery with age-related population norms. Med J Aust. 1999;171(5):235-238.
4. Quintana JM, Arostegui I, Escobar A, Azkarate J, Goenaga JI, Lafuente I. Prevalence of knee and hip osteoarthritis and the appropriateness of joint replacement in an older population. Arch Intern Med. 2008;168(14):1576-1584.
5. Jones CA, Voaklander DC, Johnston DW, Suarez-Almazor ME. Health related quality of life outcomes after total hip and knee arthroplasties in a community based population. J Rheumatol. 2000;27(7):1745-1752.
6. Ethgen O, Bruyere O, Richy F, Dardennes C, Reginster JY. Health-related quality of life in total hip and total knee arthroplasty. A qualitative and systematic review of the literature. J Bone Joint Surg Am. 2004;86(5):963-974.
7. Mulhall KJ, Ghomrawi HM, Scully S, Callaghan JJ, Saleh KJ. Current etiologies and modes of failure in total knee arthroplasty revision. Clin Orthop Relat Res. 2006;(446):45-50.
8. Sharkey PF, Hozack WJ, Rothman RH, Shastri S, Jacoby SM. Insall Award paper. Why are total knee arthroplasties failing today? Clin Orthop Relat Res. 2002;(404):7-13.
9. Kurtz S, Mowat F, Ong K, Chan N, Lau E, Halpern M. Prevalence of primary and revision total hip and knee arthroplasty in the United States from 1990 through 2002. J Bone Joint Surg Am. 2005;87(7):1487-1497.
10. Kurtz SM, Ong KL, Schmier J, Zhao K, Mowat F, Lau E. Primary and revision arthroplasty surgery caseloads in the United States from 1990 to 2004. J Arthroplasty. 2009;24(2):195-203.
11 Maloney WJ. National joint replacement registries: has the time come? J Bone Joint Surg Am. 2001;83(10):1582-1585.
12. Dy CJ, Marx RG, Bozic KJ, Pan TJ, Padgett DE, Lyman S. Risk factors for revision within 10 years of total knee arthroplasty. Clin Orthop Relat Res. 2014;472(4):1198-1207.
13. Dalury DF, Pomeroy DL, Gorab RS, Adams MJ. Why are total knee arthroplasties being revised? J Arthroplasty. 2013;28(8 suppl):120-121.
14. Garson L, Schwarzkopf R, Vakharia S, et al. Implementation of a total joint replacement-focused perioperative surgical home: a management case report. Anesth Analg. 2014;118(5):1081-1089.
15. Chaurasia A, Garson L, Kain ZL, Schwarzkopf R. Outcomes of a joint replacement surgical home model clinical pathway. Biomed Res Int. 2014;2014:296302.
16. Kain ZN, Vakharia S, Garson L, et al. The perioperative surgical home as a future perioperative practice model. Anesth Analg. 2014;118(5):1126-1130.
17. Memtsoudis SG, González Della Valle A, Besculides MC, Gaber L, Sculco TP. In-hospital complications and mortality of unilateral, bilateral, and revision TKA: based on an estimate of 4,159,661 discharges. Clin Orthop Relat Res. 2008;466(11):2617-2627.
18. Pugely AJ, Callaghan JJ, Martin CT, Cram P, Gao Y. Incidence of and risk factors for 30-day readmission following elective primary total joint arthroplasty: analysis from the ACS-NSQIP. J Arthroplasty. 2013;28(9):1499-1504.
19. Harris DY, McAngus JK, Kuo YF, Lindsey RW. Correlations between a dedicated orthopaedic complications grading system and early adverse outcomes in joint arthroplasty. Clin Orthop Relat Res. 2015;473(4):1524-1531.
20. Ong KL, Lau E, Suggs J, Kurtz SM, Manley MT. Risk of subsequent revision after primary and revision total joint arthroplasty. Clin Orthop Relat Res. 2010;468(11):3070-3076.
21. Bozic KJ, Katz P, Cisternas M, Ono L, Ries MD, Showstack J. Hospital resource utilization for primary and revision total hip arthroplasty. J Bone Joint Surg Am. 2005;87(3):570-576.
22. Singh JA, Kwoh CK, Richardson D, Chen W, Ibrahim SA. Sex and surgical outcomes and mortality after primary total knee arthroplasty: a risk-adjusted analysis. Arthritis Care Res. 2013;65(7):1095-1102.
23. Schairer WW, Vail TP, Bozic KJ. What are the rates and causes of hospital readmission after total knee arthroplasty? Clin Orthop Relat Res. 2014;472(1):181-187.
24. Bosco JA 3rd, Karkenny AJ, Hutzler LH, Slover JD, Iorio R Cost burden of 30-day readmissions following Medicare total hip and knee arthroplasty. J Arthroplasty. 2014;29(5):903-905.
25. Zmistowski B, Restrepo C, Kahl LK, Parvizi J, Sharkey PF. Incidence and reasons for nonrevision reoperation after total knee arthroplasty. Clin Orthop Relat Res 2011;469(1):138-145.26. Bottle A, Aylin P, Loeffler M. Return to theatre for elective hip and knee replacements: what is the relative importance of patient factors, surgeon and hospital? Bone Joint J Br. 2014;96(12):1663-1668.
27. Maradit Kremers H, Visscher SL, Moriarty JP, et al. Determinants of direct medical costs in primary and revision total knee arthroplasty. Clin Orthop Relat Res. 2013;471(1):206-214.
Total knee arthroplasty (TKA) is an efficacious procedure for end-stage knee arthritis. Although TKA is cost-effective and has a high rate of success,1-6 TKAs fail and may require revision surgery. Failure mechanisms include periprosthetic fracture, aseptic loosening, wear, osteolysis, instability, and infection.7-9 In these cases, revision arthroplasty may be needed in order to restore function.
There has been a steady increase in the number of primary and revision TKAs performed in the United States.8,10,11 Revision rates are 4% at 5 years after index TKA and 8.9% at 9 years.12 However, surgical techniques and improved implants have led to improved outcomes after primary TKA, as evidenced by the reduction in revisions performed for polyethylene wear and osteolysis.13 Given the continuing need for revision TKAs (despite technical improvements13), evidence-based standard protocols that improve outcomes after revision TKA are necessary.
The Total Joint Replacement Perioperative Surgical Home (TJR-PSH) implemented and used by surgeons and anesthesiologists at our institution has shown that an evidence-based perioperative protocol can provide consistent and improved outcomes in primary TKA.14-16
Garson and colleagues14 and Chaurasia and colleagues15 found that patients who underwent primary TKA in a TJA-PSH had a predicted short length of stay (LOS): <3 days. About half were discharged to a location other than home, and 1.1% were readmitted within the first 30 days after surgery. There were no major complications and no mortalities. Conversely, as shown in different nationwide database analysis,17,18 mean LOS after primary unilateral TKA was 5.3 days, 8.2% of patients had procedure-related complications, 30-day readmission rate was 4.2%, and the in-hospital mortality rate was 0.3%. As with TJA-PSH, about half the patients were discharged to a place other than home.
We conducted a study to test the effect of the TJA-PSH clinical pathway on revision TKA patients. Early perioperative outcomes, such as LOS, readmission rate, and reoperation rate, are invaluable tools in measuring TKA outcomes and correlate with the dedicated orthopedic complication grading system proposed by the Knee Society.14,15,17,19 We hypothesized that the TJR-PSH clinical pathway would close the perioperative morbidity gap between primary and revision TKAs and yield equivalent perioperative outcomes.
Materials and Methods
In this study, which received Institutional Review Board approval, we performed a prospective cross-sectional analysis comparing the perioperative outcomes of patients who underwent primary TKA with those of patients who underwent revision TKA. Medical records and our institution’s data registry were queried for LOS, discharge disposition, readmission rates, and reoperation rates.
The study included all primary and revision TKAs performed at our institution since the inception of TJA-PSH. Unicompartmental knee arthroplasties and exchanges of a single component (patella, tibia, or femur) were excluded. We identified a total of 285 consecutive primary or revision TKAs, all performed by a single surgeon. Three cases lacked complete data and were excluded, leaving 282 cases: 235 primary and 50 revision TKAs (no simultaneous bilateral TKAs). The demographic data we collected included age, sex, body mass index (BMI), American Society of Anesthesiologists (ASA) score, calculated Charlson Comorbidity Index (CCI), LOS, and discharge disposition.
The same established perioperative surgical home clinical pathway was used to care for all patients, whether they underwent primary or revision TKA. The primary outcomes studied were LOS, discharge disposition (subacute nursing facility or home), 30-day orthopedic readmission, and return to operating room. All reoperations on the same knee were analyzed.
Statistical Analysis
Primary and revision TKAs were compared on LOS (with an independent-sample t test) and discharge disposition, 30-day readmissions, and reoperations (χ2 Fisher exact test). Multivariate regression analysis was performed with each primary outcome, using age, sex, BMI, ASA score, and CCI as covariates. Statistical significance was set at P ≤ .05. All analyses were performed with SPSS Version 16.0 (SPSS Inc.) and Microsoft Excel 2011 (Microsoft).
Results
Mean (SD) age was 66 (13.2) years for primary TKA patients and 62 (12.8) years for revision TKA patients. The cohort had more women (62.5%) than men (37.5%). There was no statistical difference in patient demographics with respect to age (P = .169) or BMI (P = .701) between the 2 groups. There was an even age distribution within each group and between the groups (Table).
There was no statistically significant difference in LOS between the groups. Mean (SD) LOS was 2.55 (1.25) days for primary TKA and 2.92 (1.24) days for revision TKA (P = .061; 95% confidence interval [CI], 0.017-0.749). Regression analysis showed a correlation between ASA score and LOS for primary TKAs but not revision TKAs. For every unit increase in ASA score, there was a 0.39-day increase in LOS for primary TKA (P = .46; 95% CI, 0.006-0.781). There was no correlation between ASA score and LOS for revision TKA when controlling for covariates (P = .124). Eighty (34%) of the 235 primary TKA patients and 21 (41%) of the 50 revision TKA patients were discharged to a subacute nursing facility; the difference was not significant (P = .123). No patient was discharged to an acute inpatient rehabilitation unit. In addition, there was no significant difference in 30-day readmission rates between primary and revision TKA (P = .081). One primary TKA patient (0.4%) and 2 revision TKA patients (4%) were readmitted within 30 days after surgery (P = .081). The primary TKA readmission was for severe spasticity and a history of cerebral palsy leading to a quadriceps avulsion fracture from the superior pole of the patella. One revision TKA readmission was for acute periprosthetic joint infection, and the other for periprosthetic fracture around a press-fit distal femoral replacement stem. There was no significant difference in number of 30-day reoperations between the groups (P = .993). None of the primary TKAs and 2 (4%) of the revision TKAs underwent reoperation. Of the revision TKA patients who returned to the operating room within 30 days after surgery, one was treated for an acute periprosthetic joint infection, the other for a femoral periprosthetic fracture.
Discussion
Advances in multidisciplinary co-management of TKA patients and their clinical effects are highlighted in the TJR-PSH.14 TJR-PSH allows the health team and the patient to prepare for surgery with an understanding of probable outcomes and to optimize the patient’s medical and educational standing to better meet expectations and increase satisfaction.
Previous studies have focused on the etiologies of revision TKA7,8 and on understanding the factors that may predict increased risk for a poor outcome after primary TKA and indicate a possible need for revision.8,12 The present study focused on practical clinical processes that could potentially constitute a standardized perioperative protocol for revision TKA. An organized TJR-PSH may allow the health team to educate patients that LOS, rehabilitation and acute recovery, risk of acute (30-day) complications, and risk of readmission and return to the operating room within the first 30 days after surgery are similar for revision and primary TKAs, as long as proper preoperative optimization and education occur within the TJR-PSH.
Studies have found correlations between revision TKA and significantly increased LOS and postoperative complications.20,21 In contrast, we found no significant difference in LOS between our primary and revision TKA groups. LOS was 2.6 days for primary TKA and 2.9 days for revision TKA—a significant improvement in care and cost for revision TKA patients. That the reduced mean LOS for revision TKA is similar to the mean LOS for primary TKA also implies a reduction in the higher cost of care in revision TKA.20 In addition to obtaining similar LOS for primary and revision TKA, TJR-PSH achieved an overall reduction in LOS.17,22Our results also showed no difference in discharge disposition between primary and revision TKA in our protocol. Discharge disposition also did not correlate with age, sex, BMI, ASA score, or CCI. In TJR-PSH, discharge planning starts before admission and is patient-oriented for optimal recovery. About 66% of primary TKA patients and 58% of revision TKA patients in our cohort were discharged home—implying we are able to send a majority of our postoperative patients home after a shorter hospital stay, while obtaining the same good outcomes. Discharging fewer revision TKA patients to extended-care facilities also indicates a possible reduction in the cost of postoperative care, bringing it in line with the cost in primary TKA. Early individualized discharge planning in TJA-PSH accounts for the similar outcomes in primary and revision TKAs.
There was no significant difference in 30-day readmission rates between our primary and revision TKA patients. An important component of the TJR-PSH pathway is the individualized postdischarge recovery plan, which helps with optimal recovery and reduces readmission rates. Our cohort’s 30-day readmission rate was 0.4% for primary TKA and 4% for revision TKA (P = .081). Thirty-day readmission is a good indicator of postoperative complications and recovery from surgery. We have previously reported on primary TKA outcomes.14,15,,18,22,23 In a study using an NSQIP (National Surgical Quality Improvement Program) database, 11,814 primary TKAs had a 30-day readmission rate of 4.2%.18 In an outcomes study of 17,994 patients who underwent primary TKA in a single fiscal year, the 30-day readmission rate was 5.9%.9 In addition, in a single-institution cohort study of 1032 primary TKA patients, Schairer and colleagues23 found a 30-day unplanned readmission rate of 3.4%. Compared with primary TKA, revision TKA traditionally has had a higher postoperative complication rate.20,21 There is also concern that shorter hospital stays may indicate that significant complications of revision TKAs are being missed. In this study, however, we established that the equal outcomes obtained in the perioperative period carry over to the 30-day postoperative period in our revision TKA group. Good postoperative follow-up and planning are important factors in readmission reduction. Readmissions also have significant overall cost implications.24There was no statistical difference in 30-day reoperation rates between our primary and revision TKA patients. The primary TKA patients had no 30-day reoperations. Previous studies have found reoperation rates ranging from 1.8% to 4.7%.25,26 Revision TKA patients are up to 6 times more likely than primary TKA patients to require reoperation.20 Our study found no significant difference in outcomes between primary and revision TKAs.
Comparison of the outcomes of primary TKA and revision TKA in TJR-PSH showed no difference in acute recovery from surgery. LOS and discharge disposition, 30-day readmission rate, and 30-day return to the operating room were the same for primary and revision TKAs. The morbidity gap between primary and revision TKA patients has been closed in our research cohort. This outcome is important, as indications for primary TKA continue to expand and more primary TKAs are performed in younger patients.18,23 The implication is that, in the future, more knees will need to be revised as patients outlive their prostheses.
Our study had some limitations. First, it involved a small sample of patients, operated on by a single surgeon in a well-organized TJR-PSH at a large academic center. This population might not represent the US patient population, but that should not have adversely affected data analysis, because patients were compared with a similar population. Second, the data might be incomplete because some patients with complications might have sought care at other medical facilities, and we might not have been aware of these cases. Third, we focused on objective clinical outcomes in order to measure the success of TKAs. We did not include any subjective, patient-reported data, such as rehabilitation advances and functioning levels. Fourth, multiple parameters can be used to address complication outcomes, but we used LOS, discharge disposition, 30-day readmission rate, and 30-day reoperation rate because current payers and institutions often consider these variables when assessing quality of care. These parameters can be influenced by factors such as inpatient physical therapy goals, facility discharge practices, individual social support structure, and hospital pay-for-performance model. The implication is that different facilities have different outcomes in terms of LOS, discharge disposition, readmissions, and reoperations. However, we expect proportionate similarities in these parameters as patient perioperative outcomes become more complicated. Nevertheless, a multicenter study would be able to answer questions raised by this limitation. Fifth, our statistical analysis might have been affected by decreased power of some of the outcome variables.
TJR-PSH has succeeded in closing the perioperative morbidity and outcomes gap between primary and revision TKAs. Outcome parameters used to measure the success of TJR-PSH are standard measures of the immediate postoperative recovery and short-term outcomes of TKA patients. These measures are linked to complication rates and overall outcomes in many TKA studies.14,15,17,19 Also important is that hospital costs can be drastically cut by reducing LOS, readmissions, and reoperations. Presence of any complication of primary or revision TKA raises the cost up to 34%. This increase can go as high as 64% in the 90 days after surgery.27
Conclusion
The major challenge of the changing medical landscape is to integrate quality care and a continually improving healthcare system with the goal of cost-effective delivery of healthcare. Surgical care costs can be significantly increased by evitable hospital stays, complications that lead to readmissions, and unplanned returns to the operating room after index surgery. The new perioperative surgical home created for TJA has helped drastically reduce LOS, discharge disposition, 30-day readmission rate, and 30-day reoperation rate in revision TKA. This study demonstrates similar outcomes in our revision TKA patients relative to their primary TKA counterparts.
Am J Orthop. 2016;45(7):E458-E464. Copyright Frontline Medical Communications Inc. 2016. All rights reserved.
1. Berger RA, Rosenberg AG, Barden RM, Sheinkop MB, Jacobs JJ, Galante JO. Long-term followup of the Miller-Galante total knee replacement. Clin Orthop Relat Res. 2001;(388):58-67.
2. Rissanen P, Aro S, Slatis P, Sintonen H, Paavolainen P. Health and quality of life before and after hip or knee arthroplasty. J Arthroplasty. 1995;10(2):169-175.
3. March LM, Cross MJ, Lapsley H, et al. Outcomes after hip or knee replacement surgery for osteoarthritis. A prospective cohort study comparing patients’ quality of life before and after surgery with age-related population norms. Med J Aust. 1999;171(5):235-238.
4. Quintana JM, Arostegui I, Escobar A, Azkarate J, Goenaga JI, Lafuente I. Prevalence of knee and hip osteoarthritis and the appropriateness of joint replacement in an older population. Arch Intern Med. 2008;168(14):1576-1584.
5. Jones CA, Voaklander DC, Johnston DW, Suarez-Almazor ME. Health related quality of life outcomes after total hip and knee arthroplasties in a community based population. J Rheumatol. 2000;27(7):1745-1752.
6. Ethgen O, Bruyere O, Richy F, Dardennes C, Reginster JY. Health-related quality of life in total hip and total knee arthroplasty. A qualitative and systematic review of the literature. J Bone Joint Surg Am. 2004;86(5):963-974.
7. Mulhall KJ, Ghomrawi HM, Scully S, Callaghan JJ, Saleh KJ. Current etiologies and modes of failure in total knee arthroplasty revision. Clin Orthop Relat Res. 2006;(446):45-50.
8. Sharkey PF, Hozack WJ, Rothman RH, Shastri S, Jacoby SM. Insall Award paper. Why are total knee arthroplasties failing today? Clin Orthop Relat Res. 2002;(404):7-13.
9. Kurtz S, Mowat F, Ong K, Chan N, Lau E, Halpern M. Prevalence of primary and revision total hip and knee arthroplasty in the United States from 1990 through 2002. J Bone Joint Surg Am. 2005;87(7):1487-1497.
10. Kurtz SM, Ong KL, Schmier J, Zhao K, Mowat F, Lau E. Primary and revision arthroplasty surgery caseloads in the United States from 1990 to 2004. J Arthroplasty. 2009;24(2):195-203.
11 Maloney WJ. National joint replacement registries: has the time come? J Bone Joint Surg Am. 2001;83(10):1582-1585.
12. Dy CJ, Marx RG, Bozic KJ, Pan TJ, Padgett DE, Lyman S. Risk factors for revision within 10 years of total knee arthroplasty. Clin Orthop Relat Res. 2014;472(4):1198-1207.
13. Dalury DF, Pomeroy DL, Gorab RS, Adams MJ. Why are total knee arthroplasties being revised? J Arthroplasty. 2013;28(8 suppl):120-121.
14. Garson L, Schwarzkopf R, Vakharia S, et al. Implementation of a total joint replacement-focused perioperative surgical home: a management case report. Anesth Analg. 2014;118(5):1081-1089.
15. Chaurasia A, Garson L, Kain ZL, Schwarzkopf R. Outcomes of a joint replacement surgical home model clinical pathway. Biomed Res Int. 2014;2014:296302.
16. Kain ZN, Vakharia S, Garson L, et al. The perioperative surgical home as a future perioperative practice model. Anesth Analg. 2014;118(5):1126-1130.
17. Memtsoudis SG, González Della Valle A, Besculides MC, Gaber L, Sculco TP. In-hospital complications and mortality of unilateral, bilateral, and revision TKA: based on an estimate of 4,159,661 discharges. Clin Orthop Relat Res. 2008;466(11):2617-2627.
18. Pugely AJ, Callaghan JJ, Martin CT, Cram P, Gao Y. Incidence of and risk factors for 30-day readmission following elective primary total joint arthroplasty: analysis from the ACS-NSQIP. J Arthroplasty. 2013;28(9):1499-1504.
19. Harris DY, McAngus JK, Kuo YF, Lindsey RW. Correlations between a dedicated orthopaedic complications grading system and early adverse outcomes in joint arthroplasty. Clin Orthop Relat Res. 2015;473(4):1524-1531.
20. Ong KL, Lau E, Suggs J, Kurtz SM, Manley MT. Risk of subsequent revision after primary and revision total joint arthroplasty. Clin Orthop Relat Res. 2010;468(11):3070-3076.
21. Bozic KJ, Katz P, Cisternas M, Ono L, Ries MD, Showstack J. Hospital resource utilization for primary and revision total hip arthroplasty. J Bone Joint Surg Am. 2005;87(3):570-576.
22. Singh JA, Kwoh CK, Richardson D, Chen W, Ibrahim SA. Sex and surgical outcomes and mortality after primary total knee arthroplasty: a risk-adjusted analysis. Arthritis Care Res. 2013;65(7):1095-1102.
23. Schairer WW, Vail TP, Bozic KJ. What are the rates and causes of hospital readmission after total knee arthroplasty? Clin Orthop Relat Res. 2014;472(1):181-187.
24. Bosco JA 3rd, Karkenny AJ, Hutzler LH, Slover JD, Iorio R Cost burden of 30-day readmissions following Medicare total hip and knee arthroplasty. J Arthroplasty. 2014;29(5):903-905.
25. Zmistowski B, Restrepo C, Kahl LK, Parvizi J, Sharkey PF. Incidence and reasons for nonrevision reoperation after total knee arthroplasty. Clin Orthop Relat Res 2011;469(1):138-145.26. Bottle A, Aylin P, Loeffler M. Return to theatre for elective hip and knee replacements: what is the relative importance of patient factors, surgeon and hospital? Bone Joint J Br. 2014;96(12):1663-1668.
27. Maradit Kremers H, Visscher SL, Moriarty JP, et al. Determinants of direct medical costs in primary and revision total knee arthroplasty. Clin Orthop Relat Res. 2013;471(1):206-214.
A look at the burden of opioid management in primary care
ABSTRACT
Purpose Pain management with opioids in primary care is challenging. The objective of this study was to identify the number of opioid-related tasks in our clinics and determine whether opioid-related tasks occur more often in a residency setting.
Methods This was a retrospective observational review of an electronic health record (EHR) system to evaluate tasks related to the use of opioids and other controlled substances. Tasks are created in the EHR when patients call the clinic; the task-box system is a means of communication within the EHR. The study setting was 2 university-based family medicine clinics. Clinic 1 has faculty and resident providers in an urban area. Clinic 2 has only faculty providers in a suburban area. We reviewed all tasks recorded in November 2010.
Results A total of 3193 patients were seen at the clinics. In addition, 1028 call-related tasks were created, 220 of which (21.4%) were opioid-related. More than half of the tasks were about chronic (ongoing) patient issues. More than one‑third of the tasks required follow-up phone calls. Multiple logistic regression analysis showed more opioid-related tasks in the residency setting (Clinic 1) compared with the nonresidency setting (Clinic 2), (23.1% vs 16.7%; P<.001). However, multiple logistic regression analysis did not show any correlations between opioid-related tasks and who addressed the tasks or the day tasks were created.
Conclusions Primary care physicians prescribe significant amounts of opioids. Due to the nature of opioid use and abuse, a well-planned protocol customized to the practice or institution is required to streamline this process and decrease the number of unnecessary phone calls and follow-ups.
Pain management with opioids in primary care is challenging,1,2 and many physicians find it unsatisfying and burdensome.3 More than 60 million patient visits for chronic pain occur annually in the United States, consuming large amounts of time and resources.4 Contributing to the challenge is the need to ensure patient safety and satisfaction, as well as staff satisfaction with pain management.5-8 Opioid-related death is a major cause of iatrogenic mortality in the United States:9,10 From 1999 to 2006, fatal opioid-involved intoxications more than tripled from 4000 to 13,800.7
At issue for many providers, as well as patients and staff, is dissatisfaction with current systems in place for managing chronic non-cancer pain with opioids.2,3,8,11 In developing this study, we decided to focus on the systems aspect of care with 2 primary outcome measures in mind. Specifically, we sought to identify the tasks related to managing opioids and other controlled substances in 2 primary care clinics in a university-based family medicine program and to determine what proportion of all routine tasks in these 2 clinics could be attributed to opioid-related issues. With our secondary outcome measures, we sought to compare the number of opioid-related tasks in the residency setting with those in a nonresidency setting, and to identify factors that might be associated with an increase in the number of opioid-related tasks.
METHODS
Setting and design
We conducted a retrospective observational pilot study reviewing our electronic health record (EHR) system (Allscripts TouchWorks) at 2 of our outpatient family medicine clinics at the University of Colorado. When patients call the clinics, or when patient-care-related concerns need to be addressed, an electronic task message is created and sent to the appropriate task box for staff or provider response. The task box system is how staff and providers communicate within the EHR. Each provider has a personal task box, and there are other task boxes in the system (eg, triage, medication refill) for urgent and non-urgent patient care issues.
For example, when a patient calls to request a refill, a medical assistant (MA), care team assistant (CTA), or nurse will create a task for the medication refill box. If the task is urgent, it is marked with a red asterisk and a triage provider will address the task that same day. Non-urgent triage tasks will be addressed by the patient’s primary care provider within 2 to 3 days. Depending on the issue at hand, the task may or may not require phone calls to the patient, pharmacy, or insurance company.
Clinic 1, in urban Denver, has 13 physicians (many of them part-time clinical faculty), one nurse practitioner (NP), one physician assistant (PA), and 18 family medicine residents. Clinic 2, in a suburb of Denver, has 5 physicians (only one is part-time) and one nurse practitioner. Clinic 1 is divided into 3 pods, and each has the same number of attending physicians, residents, and MAs, and either a PA or NP.
We reviewed, one by one, all tasks created from November 1 to 30, 2010. One of the study’s investigators categorized each task according to the following descriptors: who created the task, who addressed the task, what day of the week the task was created, urgency of the task, whether the task required a follow-up phone call, and whether the task was related to opioid/controlled-substance issues. The task was categorized as acute if the issue was related to a condition that had been present for fewer than 3 weeks. Chronic tasks were created for conditions present for ≥3 weeks. At the time the study was completed, our EHR had no portal through which we could communicate with patients.
ANALYSIS
We conducted statistical analyses with the IBM SPSS, version 22.0 (SPSS, Inc, Chicago, Illinois). We used descriptive statistics to examine the frequency and percentage for all variables. We used a chi-squared (χ2) test to assess the differences between the 2 clinics, and used a binary multiple logistic regression model to determine possible factors related to opioid-related tasks. P values <.05 were considered statistically significant. The Colorado Multiple Institutional Review Board approved this study.
RESULTS
Clinics 1 and 2, respectively, saw 2007 and 1186 patients during the study period (TABLE 1). The additional 1028 tasks generated by phone calls were almost equally distributed among the 3 pods of Clinic 1 (290, 202, and 260) and Clinic 2 (276). For data analysis, we compared Clinic 1 with Clinic 2 and also compared the 3 pods of Clinic 1 individually with Clinic 2. Both approaches produced similar results.
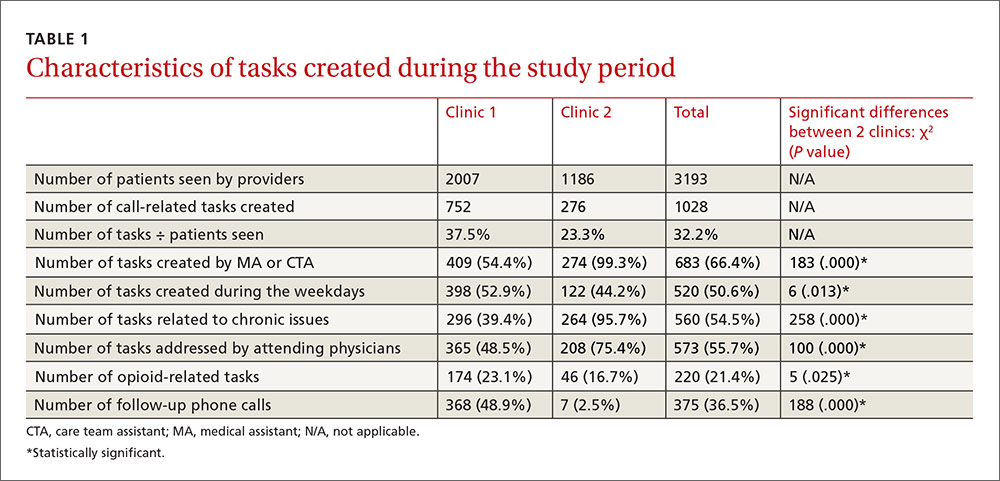
Most tasks (54% for Clinic 1 and 99% for Clinic 2) were created by MAs and CTAs. At Clinic 1, tasks were also created by residents (17%), PA/NPs (8%), attending physicians (7%), and others/clinical nurses (14%). Tasks at Clinic 1 were addressed by attending physicians (49%), residents (25%), PA/NPs (25%), and others (1%). At Clinic 2, tasks were addressed by attending physicians (75%) and PA/NPs (25%). Approximately half of the tasks (51%) in both clinics were created during weekdays, compared with the day after weekends/holidays (28%), the day before weekends/holidays (17%), and during weekends/holidays (4%). Chronic patient issues, acute patient issues, and other issues accounted for 54%, 29%, and 17% of tasks, respectively. Follow-up phone calls to patients, pharmacies, or others occurred in 37% of tasks. Two hundred twenty tasks (21%) in the clinics combined were related to opioids and controlled substances.
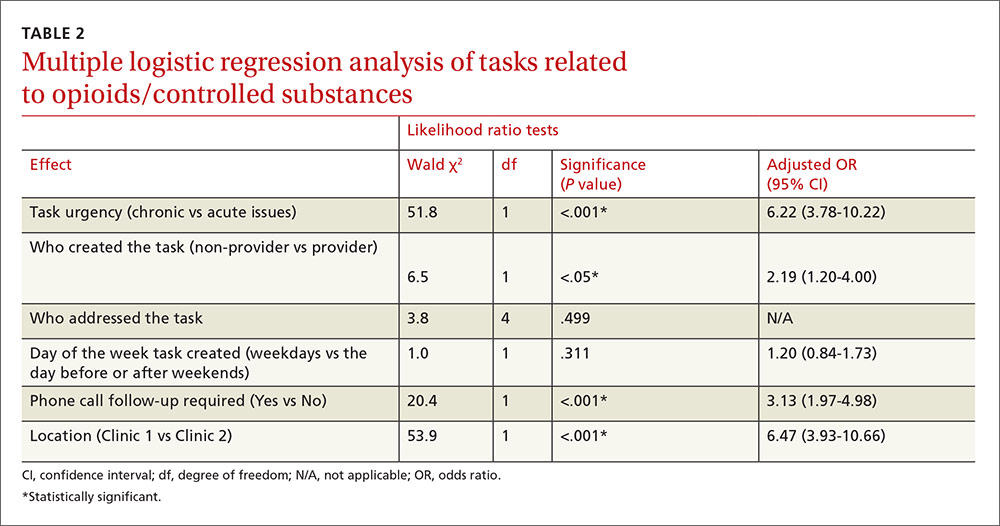
Multiple logistic regression analysis of data from both clinics (TABLE 2) showed more opioid-related tasks in Clinic 1 compared with Clinic 2 (P<.001), and that these tasks were more often related to chronic issues than to acute issues (P<.001). Tasks created by MAs, CTAs, clinical nurses, and others were more likely to be opioid-related compared with the tasks created by attending physicians, residents, NPs, or a PA (25% vs 15%; P<.05). Compared with non-opioid-related tasks, opioid-related tasks required more follow-up phone calls (P<.001). Follow-up phone calls to pharmacies occurred more often with opioid-related tasks than with non-opioid tasks (11% vs 5%), while follow-up phone calls to patients occurred more often for non-opioid related tasks than opioid-related tasks (28% vs 18%). No correlations with task creation were found for who addressed the opioid-related task or the day the task was created.
DISCUSSION
This study demonstrated that our process of handling patient issues related to opioids accounts for a large proportion of all tasks. Dealing with tasks is time consuming, not only for attending physicians and residents but also for clinic nurses and staff. Almost a quarter of clinic tasks were opioid related. As has been shown in previous studies,5-8 chronic pain management with opioids is an unsatisfying task for staff and care providers at our clinics. We also found that tasks created by non-providers were more likely to be opioid-related than were tasks created by providers. This is most likely due to the fact that non-providers cannot write prescriptions and they have to ask providers for further reviews.
Khalid et al found that, compared with attending physicians, residents had more patients on chronic opioids who displayed concerning behaviors, including early refills and refills from multiple providers.13 The higher number of part-time providers at Clinic 1 in our study may have also caused insufficient continuity of care at that site. Nevertheless, this model of practice is used in many academic primary care institutions.4 Another possible reason for the difference could be a lack of resident training on current guidelines for managing opiates for chronic pain.3,13,14 Again, this was a pilot study and we drew no solid conclusion about the reasons for differences between these 2 clinics.
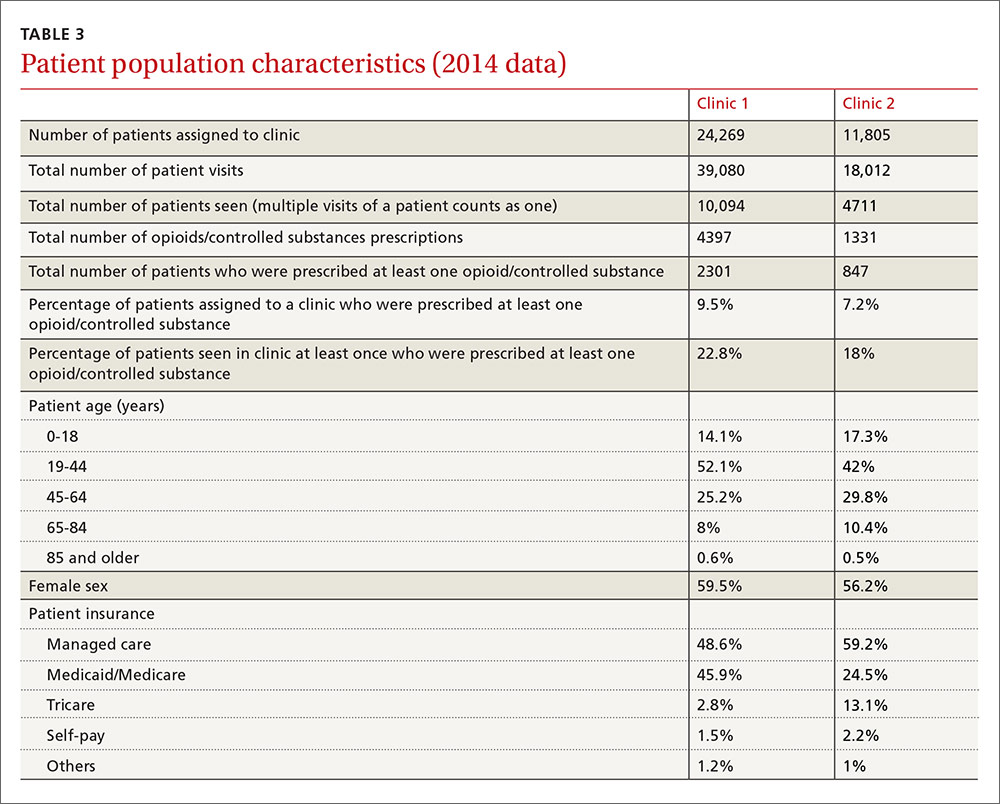
It is obvious, however, that we spend a significant amount of time and resources dealing with chronic pain management. Our institution created an opioid/controlled-substance patient registry about 3 years ago. The data for 2014 showed that 22.8% and 18% of patients seen at least once at Clinic 1 and Clinic 2, respectively, were prescribed opioids/controlled substances (TABLE 3).
Possible solutions to reduce tasks related to opioid management. For both small and large practices, one way to reduce the number of tasks related to opioid management and, therefore, the time allocated to completing those tasks, would be to have a clear protocol to follow.3,4,8,11,14,15 The protocol may include the creation of an opioid/controlled-substance registry and the development and implementation of clinical decision support programs.
We also recommend the dissemination of tools for clinical management at the point of care. These can include a controlled-substance risk assessment tool for aberrant behaviors, a controlled-substance informed consent form, a functional and quality-of-life assessment, electronic clinical-note templates in the EHR, urine drug screening, and routine use of existing state pharmacy prescription drug monitoring programs. Also essential would be the provision of routine educational programs for clinicians regarding chronic pain management based on existing evidence and guidelines. (See “Opioids for chronic pain: The CDC’s 12 recommendations.”) It has been demonstrated that an EHR opioid dashboard or an EHR-based protocol improved adherence to guidelines for prescribing opiates.16
This study has several limitations. First, this was a small pilot study completed over a short period of time, although we believe the findings are likely representative of the prescribing practices in the 2 clinics we evaluated. Second, it was a retrospective study, which was appropriate for evaluating our questions. Third, we were unable to account for other factors that could potentially confound the results, including, but not limited to, the amount of time allocated to each task, and the total number of patients at each clinic who were on opioids for management of chronic pain during the study period. However, due to our recent addition of an opioid/controlled-substance patient registry, we were able to add information for the year 2014 (TABLE 3). Multi-center large scale studies are required to evaluate this further.
ACKNOWLEDGEMENTS
We thank Dr. Corey Lyon for his editorial assistance.
CORRESPONDENCE
Morteza Khodaee, MD, AFW Family Medicine Clinic, 3055 Roslyn Street, Denver, CO 80238; [email protected].
1. Smith BH, Torrance N. Management of chronic pain in primary care. Curr Opin Support Palliat Care. 2011;5:137-142.
2. Zgierska A, Miller M, Rabago D. Patient satisfaction, prescription drug abuse, and potential unintended consequences. JAMA. 2012;307:1377-1378.
3. Leverence RR, Williams RL, Potter M, et al; PRIME Net Clinicians. Chronic non-cancer pain: a siren for primary care—a report from the PRImary Care MultiEthnic Network (PRIME Net). J Am Board Fam Med. 2011;24:551-561.
4. Watkins A, Wasmann S, Dodson L, et al. An evaluation of the care provided to patients prescribed controlled substances for chronic nonmalignant pain at an academic family medicine center. Fam Med. 2004;36:487-489.
5. Brown J, Setnik B, Lee K, et al. Assessment, stratification, and monitoring of the risk for prescription opioid misuse and abuse in the primary care setting. J Opioid Manag. 2011;7:467-483.
6. Duensing L, Eksterowicz N, Macario A, et al. Patient and physician perceptions of treatment of moderate-to-severe chronic pain with oral opioids. Curr Med Res Opin. 2010;26:1579-1585.
7. Webster LR, Cochella S, Dasgupta N, et al. An analysis of the root causes for opioid-related overdose deaths in the United States. Pain Med. 2011;12:S26-S35.
8. Wenghofer EF, Wilson L, Kahan M, et al. Survey of Ontario primary care physicians’ experiences with opioid prescribing. Can Fam Physician. 2011;57:324-332.
9. Chou R, Fanciullo GJ, Fine PG, et al; American Pain Society-American Academy of Pain Medicine Opioids Guidelines Panel. Clinical guidelines for the use of chronic opioid therapy in chronic noncancer pain. J Pain. 2009;10:113-130.
10. Hartrick CT, Gatchel RJ, Conroy S. Identification and management of pain medication abuse and misuse: current state and future directions. Expert Rev Neurother. 2012;12:601-610.
11. Wiedemer NL, Harden PS, Arndt IO, et al. The opioid renewal clinic: a primary care, managed approach to opioid therapy in chronic pain patients at risk for substance abuse. Pain Med. 2007;8:573-584.
12. Colburn JL, Jasinski DR, Rastegar DA. Long-term opioid therapy, aberrant behaviors, and substance misuse: comparison of patients treated by resident and attending physicians in a general medical clinic. J Opioid Manag. 2012;8:153-160.
13. Khalid L, Liebschutz JM, Xuan Z, et al. Adherence to prescription opioid monitoring guidelines among residents and attending physicians in the primary care setting. Pain Med. 2015;16:480-487.
14. Canada RE, DiRocco D, Day S. A better approach to opioid prescribing in primary care. J Fam Pract. 2014;63:E1-E8.
15. Clark LG, Upshur CC. Family medicine physicians’ views of how to improve chronic pain management. J Am Board Fam Med. 2007;20:479-482.
16. Anderson D, Zlateva I, Khatri K, et al. Using health information technology to improve adherence to opioid prescribing guidelines in primary care. Clin J Pain. 2015;31:573-579.
ABSTRACT
Purpose Pain management with opioids in primary care is challenging. The objective of this study was to identify the number of opioid-related tasks in our clinics and determine whether opioid-related tasks occur more often in a residency setting.
Methods This was a retrospective observational review of an electronic health record (EHR) system to evaluate tasks related to the use of opioids and other controlled substances. Tasks are created in the EHR when patients call the clinic; the task-box system is a means of communication within the EHR. The study setting was 2 university-based family medicine clinics. Clinic 1 has faculty and resident providers in an urban area. Clinic 2 has only faculty providers in a suburban area. We reviewed all tasks recorded in November 2010.
Results A total of 3193 patients were seen at the clinics. In addition, 1028 call-related tasks were created, 220 of which (21.4%) were opioid-related. More than half of the tasks were about chronic (ongoing) patient issues. More than one‑third of the tasks required follow-up phone calls. Multiple logistic regression analysis showed more opioid-related tasks in the residency setting (Clinic 1) compared with the nonresidency setting (Clinic 2), (23.1% vs 16.7%; P<.001). However, multiple logistic regression analysis did not show any correlations between opioid-related tasks and who addressed the tasks or the day tasks were created.
Conclusions Primary care physicians prescribe significant amounts of opioids. Due to the nature of opioid use and abuse, a well-planned protocol customized to the practice or institution is required to streamline this process and decrease the number of unnecessary phone calls and follow-ups.
Pain management with opioids in primary care is challenging,1,2 and many physicians find it unsatisfying and burdensome.3 More than 60 million patient visits for chronic pain occur annually in the United States, consuming large amounts of time and resources.4 Contributing to the challenge is the need to ensure patient safety and satisfaction, as well as staff satisfaction with pain management.5-8 Opioid-related death is a major cause of iatrogenic mortality in the United States:9,10 From 1999 to 2006, fatal opioid-involved intoxications more than tripled from 4000 to 13,800.7
At issue for many providers, as well as patients and staff, is dissatisfaction with current systems in place for managing chronic non-cancer pain with opioids.2,3,8,11 In developing this study, we decided to focus on the systems aspect of care with 2 primary outcome measures in mind. Specifically, we sought to identify the tasks related to managing opioids and other controlled substances in 2 primary care clinics in a university-based family medicine program and to determine what proportion of all routine tasks in these 2 clinics could be attributed to opioid-related issues. With our secondary outcome measures, we sought to compare the number of opioid-related tasks in the residency setting with those in a nonresidency setting, and to identify factors that might be associated with an increase in the number of opioid-related tasks.
METHODS
Setting and design
We conducted a retrospective observational pilot study reviewing our electronic health record (EHR) system (Allscripts TouchWorks) at 2 of our outpatient family medicine clinics at the University of Colorado. When patients call the clinics, or when patient-care-related concerns need to be addressed, an electronic task message is created and sent to the appropriate task box for staff or provider response. The task box system is how staff and providers communicate within the EHR. Each provider has a personal task box, and there are other task boxes in the system (eg, triage, medication refill) for urgent and non-urgent patient care issues.
For example, when a patient calls to request a refill, a medical assistant (MA), care team assistant (CTA), or nurse will create a task for the medication refill box. If the task is urgent, it is marked with a red asterisk and a triage provider will address the task that same day. Non-urgent triage tasks will be addressed by the patient’s primary care provider within 2 to 3 days. Depending on the issue at hand, the task may or may not require phone calls to the patient, pharmacy, or insurance company.
Clinic 1, in urban Denver, has 13 physicians (many of them part-time clinical faculty), one nurse practitioner (NP), one physician assistant (PA), and 18 family medicine residents. Clinic 2, in a suburb of Denver, has 5 physicians (only one is part-time) and one nurse practitioner. Clinic 1 is divided into 3 pods, and each has the same number of attending physicians, residents, and MAs, and either a PA or NP.
We reviewed, one by one, all tasks created from November 1 to 30, 2010. One of the study’s investigators categorized each task according to the following descriptors: who created the task, who addressed the task, what day of the week the task was created, urgency of the task, whether the task required a follow-up phone call, and whether the task was related to opioid/controlled-substance issues. The task was categorized as acute if the issue was related to a condition that had been present for fewer than 3 weeks. Chronic tasks were created for conditions present for ≥3 weeks. At the time the study was completed, our EHR had no portal through which we could communicate with patients.
ANALYSIS
We conducted statistical analyses with the IBM SPSS, version 22.0 (SPSS, Inc, Chicago, Illinois). We used descriptive statistics to examine the frequency and percentage for all variables. We used a chi-squared (χ2) test to assess the differences between the 2 clinics, and used a binary multiple logistic regression model to determine possible factors related to opioid-related tasks. P values <.05 were considered statistically significant. The Colorado Multiple Institutional Review Board approved this study.
RESULTS
Clinics 1 and 2, respectively, saw 2007 and 1186 patients during the study period (TABLE 1). The additional 1028 tasks generated by phone calls were almost equally distributed among the 3 pods of Clinic 1 (290, 202, and 260) and Clinic 2 (276). For data analysis, we compared Clinic 1 with Clinic 2 and also compared the 3 pods of Clinic 1 individually with Clinic 2. Both approaches produced similar results.
Most tasks (54% for Clinic 1 and 99% for Clinic 2) were created by MAs and CTAs. At Clinic 1, tasks were also created by residents (17%), PA/NPs (8%), attending physicians (7%), and others/clinical nurses (14%). Tasks at Clinic 1 were addressed by attending physicians (49%), residents (25%), PA/NPs (25%), and others (1%). At Clinic 2, tasks were addressed by attending physicians (75%) and PA/NPs (25%). Approximately half of the tasks (51%) in both clinics were created during weekdays, compared with the day after weekends/holidays (28%), the day before weekends/holidays (17%), and during weekends/holidays (4%). Chronic patient issues, acute patient issues, and other issues accounted for 54%, 29%, and 17% of tasks, respectively. Follow-up phone calls to patients, pharmacies, or others occurred in 37% of tasks. Two hundred twenty tasks (21%) in the clinics combined were related to opioids and controlled substances.
Multiple logistic regression analysis of data from both clinics (TABLE 2) showed more opioid-related tasks in Clinic 1 compared with Clinic 2 (P<.001), and that these tasks were more often related to chronic issues than to acute issues (P<.001). Tasks created by MAs, CTAs, clinical nurses, and others were more likely to be opioid-related compared with the tasks created by attending physicians, residents, NPs, or a PA (25% vs 15%; P<.05). Compared with non-opioid-related tasks, opioid-related tasks required more follow-up phone calls (P<.001). Follow-up phone calls to pharmacies occurred more often with opioid-related tasks than with non-opioid tasks (11% vs 5%), while follow-up phone calls to patients occurred more often for non-opioid related tasks than opioid-related tasks (28% vs 18%). No correlations with task creation were found for who addressed the opioid-related task or the day the task was created.
DISCUSSION
This study demonstrated that our process of handling patient issues related to opioids accounts for a large proportion of all tasks. Dealing with tasks is time consuming, not only for attending physicians and residents but also for clinic nurses and staff. Almost a quarter of clinic tasks were opioid related. As has been shown in previous studies,5-8 chronic pain management with opioids is an unsatisfying task for staff and care providers at our clinics. We also found that tasks created by non-providers were more likely to be opioid-related than were tasks created by providers. This is most likely due to the fact that non-providers cannot write prescriptions and they have to ask providers for further reviews.
Khalid et al found that, compared with attending physicians, residents had more patients on chronic opioids who displayed concerning behaviors, including early refills and refills from multiple providers.13 The higher number of part-time providers at Clinic 1 in our study may have also caused insufficient continuity of care at that site. Nevertheless, this model of practice is used in many academic primary care institutions.4 Another possible reason for the difference could be a lack of resident training on current guidelines for managing opiates for chronic pain.3,13,14 Again, this was a pilot study and we drew no solid conclusion about the reasons for differences between these 2 clinics.
It is obvious, however, that we spend a significant amount of time and resources dealing with chronic pain management. Our institution created an opioid/controlled-substance patient registry about 3 years ago. The data for 2014 showed that 22.8% and 18% of patients seen at least once at Clinic 1 and Clinic 2, respectively, were prescribed opioids/controlled substances (TABLE 3).
Possible solutions to reduce tasks related to opioid management. For both small and large practices, one way to reduce the number of tasks related to opioid management and, therefore, the time allocated to completing those tasks, would be to have a clear protocol to follow.3,4,8,11,14,15 The protocol may include the creation of an opioid/controlled-substance registry and the development and implementation of clinical decision support programs.
We also recommend the dissemination of tools for clinical management at the point of care. These can include a controlled-substance risk assessment tool for aberrant behaviors, a controlled-substance informed consent form, a functional and quality-of-life assessment, electronic clinical-note templates in the EHR, urine drug screening, and routine use of existing state pharmacy prescription drug monitoring programs. Also essential would be the provision of routine educational programs for clinicians regarding chronic pain management based on existing evidence and guidelines. (See “Opioids for chronic pain: The CDC’s 12 recommendations.”) It has been demonstrated that an EHR opioid dashboard or an EHR-based protocol improved adherence to guidelines for prescribing opiates.16
This study has several limitations. First, this was a small pilot study completed over a short period of time, although we believe the findings are likely representative of the prescribing practices in the 2 clinics we evaluated. Second, it was a retrospective study, which was appropriate for evaluating our questions. Third, we were unable to account for other factors that could potentially confound the results, including, but not limited to, the amount of time allocated to each task, and the total number of patients at each clinic who were on opioids for management of chronic pain during the study period. However, due to our recent addition of an opioid/controlled-substance patient registry, we were able to add information for the year 2014 (TABLE 3). Multi-center large scale studies are required to evaluate this further.
ACKNOWLEDGEMENTS
We thank Dr. Corey Lyon for his editorial assistance.
CORRESPONDENCE
Morteza Khodaee, MD, AFW Family Medicine Clinic, 3055 Roslyn Street, Denver, CO 80238; [email protected].
1. Smith BH, Torrance N. Management of chronic pain in primary care. Curr Opin Support Palliat Care. 2011;5:137-142.
2. Zgierska A, Miller M, Rabago D. Patient satisfaction, prescription drug abuse, and potential unintended consequences. JAMA. 2012;307:1377-1378.
3. Leverence RR, Williams RL, Potter M, et al; PRIME Net Clinicians. Chronic non-cancer pain: a siren for primary care—a report from the PRImary Care MultiEthnic Network (PRIME Net). J Am Board Fam Med. 2011;24:551-561.
4. Watkins A, Wasmann S, Dodson L, et al. An evaluation of the care provided to patients prescribed controlled substances for chronic nonmalignant pain at an academic family medicine center. Fam Med. 2004;36:487-489.
5. Brown J, Setnik B, Lee K, et al. Assessment, stratification, and monitoring of the risk for prescription opioid misuse and abuse in the primary care setting. J Opioid Manag. 2011;7:467-483.
6. Duensing L, Eksterowicz N, Macario A, et al. Patient and physician perceptions of treatment of moderate-to-severe chronic pain with oral opioids. Curr Med Res Opin. 2010;26:1579-1585.
7. Webster LR, Cochella S, Dasgupta N, et al. An analysis of the root causes for opioid-related overdose deaths in the United States. Pain Med. 2011;12:S26-S35.
8. Wenghofer EF, Wilson L, Kahan M, et al. Survey of Ontario primary care physicians’ experiences with opioid prescribing. Can Fam Physician. 2011;57:324-332.
9. Chou R, Fanciullo GJ, Fine PG, et al; American Pain Society-American Academy of Pain Medicine Opioids Guidelines Panel. Clinical guidelines for the use of chronic opioid therapy in chronic noncancer pain. J Pain. 2009;10:113-130.
10. Hartrick CT, Gatchel RJ, Conroy S. Identification and management of pain medication abuse and misuse: current state and future directions. Expert Rev Neurother. 2012;12:601-610.
11. Wiedemer NL, Harden PS, Arndt IO, et al. The opioid renewal clinic: a primary care, managed approach to opioid therapy in chronic pain patients at risk for substance abuse. Pain Med. 2007;8:573-584.
12. Colburn JL, Jasinski DR, Rastegar DA. Long-term opioid therapy, aberrant behaviors, and substance misuse: comparison of patients treated by resident and attending physicians in a general medical clinic. J Opioid Manag. 2012;8:153-160.
13. Khalid L, Liebschutz JM, Xuan Z, et al. Adherence to prescription opioid monitoring guidelines among residents and attending physicians in the primary care setting. Pain Med. 2015;16:480-487.
14. Canada RE, DiRocco D, Day S. A better approach to opioid prescribing in primary care. J Fam Pract. 2014;63:E1-E8.
15. Clark LG, Upshur CC. Family medicine physicians’ views of how to improve chronic pain management. J Am Board Fam Med. 2007;20:479-482.
16. Anderson D, Zlateva I, Khatri K, et al. Using health information technology to improve adherence to opioid prescribing guidelines in primary care. Clin J Pain. 2015;31:573-579.

Vitiligo Patients Experience Barriers in Accessing Care
Vitiligo is a disorder typified by loss of pigmentation. Worldwide estimates of disease demonstrate 0.4% to 2% prevalence.1 Vitiligo generally is felt to be an autoimmune disorder with a complex multifactorial inheritance.2 Therapeutic options for vitiligo are largely off label and include topical corticosteroids, topical calcineurin inhibitors, narrowband UVB (NB-UVB) light phototherapy, and excimer (308 nm) laser therapy.3,4 Therapies for vitiligo are time consuming, as most topical therapies require twice-daily application. Additionally, many patients require 2 or more topical therapies due to involvement of both the head and neck as well as other body sites.3,4 Generalized disease often is treated with NB-UVB therapy 3 times weekly in-office visits, while excimer laser therapy is used for limited disease resistant to topical agents.3,4
Many barriers to good outcomes and care exist for patients with vitiligo.5 Patients may experience reduced quality of life and/or sexual dysfunction because of vitiligo lesions. The purpose of this pilot study was to identify barriers to access of care in vitiligo patients.
Methods
A survey was designed and then reviewed for unclear wording by members of the local vitiligo support group at Mount Sinai St. Luke’s-Roosevelt Hospital and Beth Israel Medical Centers (New York, New York). Linguistic revision and clarifications were added to the survey to correct identified communication problems. The survey was then posted using an Internet-based survey software. Links to the survey were sent via email to 107 individuals in a LISTSERV comprising Vitiligo Support International members who participated in a New York City support group (led by C.G. and N.B.S.). Only 1 email was used per household and only individuals 18 years or older could participate. These individuals were asked to complete a deidentified, 82-question, institutional review board–reviewed and exempted survey addressing issues affecting delivery and receipt of medical care for vitiligo.
Data were analyzed using the χ2 test, analysis of variance, or Student t test depending on the type of variable (categorical vs continuous). Fisher exact or Wilcoxon-Mann-Whitney tests were used when distributional assumptions were not met. A type I error rate (α=.05) was used to determine statistical significance. All analyses were performed using SAS 9.3 software.
Results
Respondents
The survey was completed by 81% (n=87) of individuals. The mean (SD) age of the treated patients about whom the respondents communicated was 33 (16) years and 71% (n=62) were women. The majority of respondents (64 [74%]) reported their race as white, followed by African American/black (12 [14%]), Hispanic (7 [8%]), and Asian (4 [5%]). Twenty-nine percent (22/76) of respondents reported a family income of less than $50,000 per year, 34% (26/76) reported an income of $50,000 to $100,000, and 37% (28/76) reported an income greater than $100,000, while 11 respondents did not report income.
Number of Physicians Seen
Respondents had reportedly seen an average (SD) number of 2 (1) physicians in the past/present before being offered any therapy for vitiligo and only 37% (32/87) of respondents reported being offered therapy by the first physician they saw. The number of physicians seen did not have a statistical relationship with years with vitiligo (ie, disease duration), sex, race, age of onset, income level, or number of sites affected.
Number of Sites Affected
The survey identified the following 23 sites affected by vitiligo: scalp, forehead, eyelids, lips, nose, cheeks, chin, neck, chest, stomach, back, upper arms, forearms, hands, wrists, fingers, genitalia, buttocks, thighs, calves/shins, ankles, feet, and toes. The average (SD) number of sites affected was 12 (6). The number of sites affected was correlated to the recommendation for phototherapy, while the recommendation for excimer laser therapy was inversely associated with the number of sites affected. The median number of sites affected for those who were not prescribed phototherapy was 10 (interquartile range [IQR]=9; P=.05); the median number of sites affected for those who were prescribed phototherapy was 15 (IQR=11). The association between the number of sites affected and whether the patient proceeded with phototherapy was not statistically significant. The need for phototherapy was not related to years with vitiligo (ie, disease duration), sex, or race.
Excimer laser therapy was prescribed more often to patients with fewer sites affected (median of 9 [IQR=3] vs median of 15 [IQR=9]; P=.04). Respondents who had fewer sites affected were on average more likely to proceed with excimer laser therapy (median of 8 [IQR=4] vs median of 11 [IQR=5]). The association between the number of sites affected and whether the patient proceeded with excimer laser therapy was not statistically significant.
Access to Topical Medications
Forty-one percent (36/87) of respondents reported difficulty accessing 1 or more topical therapies. Of 52 respondents who were prescribed a topical corticosteroid, 12 (23%) reported difficulty accessing therapy. Of 67 respondents who were prescribed a topical calcineurin inhibitor, 27 (40%) reported difficulty accessing medication (tacrolimus, n=17; pimecrolimus, n=10). Calcipotriene prescription coverage was not specifically addressed in this survey, as it usually is a second-line or adjunctive medication. Difficulty getting topical tacrolimus but not topical corticosteroids was associated with female sex (P=.03) but was not associated with race, income level, or level of education. Difficulty obtaining medication was not related to race, sex, level of education, or income level.
Consequences of Phototherapy
Twenty-three of 34 respondents (68%) who were told they required phototherapy actually received phototherapy and reported paying $38 weekly (IQR=$75). The majority of patients who proceeded with phototherapy lived (17/23 [74%]) or worked (16/23 [70%]) within 20 minutes of the therapy center. Self-reported response to phototherapy was good to very good in 65% (15/23) of respondents and no response in 30% (7/23); only 1 respondent reported worsening vitiligo. Sixty percent (15/25) of respondents said they were not satisfied with phototherapy. Respondents who were satisfied with the outcome of phototherapy had on average fewer sites affected by vitiligo (mean [SD], 10 [8]; P=.05). The association with other demographic and economic parameters (eg, sex, race, level of education, income level) was not statistically significant. Proceeding with phototherapy was not related to race, sex, level of education, or income level.
When questioned how many aspects of daily life (eg, work, home, school) were affected by phototherapy, 40% (35/87) of respondents reported that more than one life parameter was disturbed. Thirty-five percent (8/23) of respondents who received phototherapy reported that it affected their daily life “quite a bit” or “severely.” More respondents were likely to report that the therapy interfered with their life “somewhat,” “quite a bit,” or “severely” (76% [19/25]; 95% confidence interval, 55%-92%; P=.01) rather than “not at all” or “a little.”
Excimer Laser
Nine of 17 respondents (53%) who were recommended to undergo excimer laser therapy actually received therapy and reported paying $100 weekly (IQR=$60).
There was a trend toward significance of excimer usage being associated with lower age quartile (0–20 years)(P=.0553) and income more than $100,000 (P=.0788), neither of which reached statistical significance.
Insurance Coverage
Respondents were offered 7 answer options regarding the reason for noncoverage of topical calcineurin inhibitors. They were allowed to pick more than one reason where appropriate. For individuals who were prescribed topical tacrolimus but did not receive drug (n=17), the following reasons were cited: “no insurance coverage for the medication” (59% [10/17]), “your deductible was too high” (24% [4/17]), “prior authorization failed to produce coverage of the medication” (24% [4/17]), “your copay was prohibitively expensive” (24% [4/17]), “you were uncomfortable with the medication’s side effects” (18% [3/17]), “the tube was too small to cover your skin affected areas” (12% [2/17]), and “other” (29% [5/17]). Three patients selected 3 or more reasons, 8 patients selected 2 reasons, and 5 patients selected one reason.
Comment
It has been reported that patients with vitiligo may have difficulty related to treatment compliance for a variety of reasons.5 We identified notable barriers that arise for some, if not all, patients with vitiligo in the United States at some point in their care, including interference with other aspects of daily life, lack of coverage by current health insurance provider, and high out-of-pocket expenses, in addition to the negative effects of vitiligo on quality of life that have already been reported.6,7 These barriers are not a function of race/ethnicity, income level, or age of onset, but they may be impacted, as in the case of tacrolimus, by female sex. It is clear that, based on this study’s numbers, many patients will be unable to receive and/or comply with recommended treatment plans.
A limitation of this analysis is the study population, a select group of patients who had not been prescribed all the therapies in question. The sample size may not be large enough to demonstrate differences between level of education, race, or income level; however, even with a sample size of 87 respondents, the barriers to access of care are prominent. Larger population-based surveys would potentially tease out patterns of barriers not apparent with a smaller sample. No data were generated specific to calcipotriene, and this medication was not specified as a write-in agent on open question by any respondents; therefore, access to topical calcipotriene cannot be projected from this study. Phototherapy was queried as a nonspecific term and the breakdown of NB-UVB versus psoralen plus UVA was not available for this survey. Data suggesting a burden of socioeconomic barriers have been reported for atopic dermatitis8 and psoriasis,9 which corroborate the need for greater research in the field of access to care in dermatology.
Despite some advancement in the care of vitiligo, patients often are unable to access preferred or recommended treatment modalities. Standard recommendations for care are initial usage of calcineurin inhibitors for facial involvement and topical high-potency corticosteroids for involvement of the body.3,4 Based on this survey, it would seem that many patients are not able to receive the standard of care. Similarly, NB-UVB phototherapy and excimer laser therapy are recommended for widespread vitiligo and lesions unresponsive to topical care. It would seem that almost half of our respondents did not have access to one or more of the recommended therapies. Barriers to care may have substantial clinical and psychological outcomes, which were not evaluated in this study but merit future research.
- Krüger C, Schallreuter KU. A review of the worldwide prevalence of vitiligo in children/adolescents and adults. Int J Dermatol. 2012;51:1206-1212.
- Jin Y, Birlea SA, Fain PR, et al. Genome-wide association analyses identify 13 new susceptibility loci for generalized vitiligo. Nat Genet. 2012;44:676-680.
- Silverberg NB. Pediatric vitiligo. Pediatr Clin North Am. 2014;61:347-366.
- Taieb A, Alomar A, Böhm M, et al, Vitiligo European Task Force (VETF); European Academy of Dermatology and Venereology (EADV); Union Europénne des Médecins Spécialistes (UEMS). Guidelines for the management of vitiligo: the European Dermatology Forum consensus. Br J Dermatol. 2013;168:5-19.
- Abraham S, Raghavan P. Myths and facts about vitiligo: an epidemiological study. Indian J Pharm Sci. 2015;77:8-13.
- Silverberg JI, Silverberg NB. Quality of life impairment in children and adolescents with vitiligo. Pediatr Dermatol. 2014;31:309-318.
- Silverberg JI, Silverberg NB. Association between vitiligo extent and distribution and quality-of-life impairment. JAMA Dermatol. 2013;149:159-164.
- Silverberg JI, Hanifin JM. Adult eczema prevalence and associations with asthma and other health and demographic factors: a US population-based study. J Allergy Clin Immunol. 2013;132:1132-1138.
- Hamilton MP, Ntais D, Griffiths CE, et al. Psoriasis treatment and management—a systematic review of full economic evaluations. Br J Dermatol. 2015;172:574-583.
Vitiligo is a disorder typified by loss of pigmentation. Worldwide estimates of disease demonstrate 0.4% to 2% prevalence.1 Vitiligo generally is felt to be an autoimmune disorder with a complex multifactorial inheritance.2 Therapeutic options for vitiligo are largely off label and include topical corticosteroids, topical calcineurin inhibitors, narrowband UVB (NB-UVB) light phototherapy, and excimer (308 nm) laser therapy.3,4 Therapies for vitiligo are time consuming, as most topical therapies require twice-daily application. Additionally, many patients require 2 or more topical therapies due to involvement of both the head and neck as well as other body sites.3,4 Generalized disease often is treated with NB-UVB therapy 3 times weekly in-office visits, while excimer laser therapy is used for limited disease resistant to topical agents.3,4
Many barriers to good outcomes and care exist for patients with vitiligo.5 Patients may experience reduced quality of life and/or sexual dysfunction because of vitiligo lesions. The purpose of this pilot study was to identify barriers to access of care in vitiligo patients.
Methods
A survey was designed and then reviewed for unclear wording by members of the local vitiligo support group at Mount Sinai St. Luke’s-Roosevelt Hospital and Beth Israel Medical Centers (New York, New York). Linguistic revision and clarifications were added to the survey to correct identified communication problems. The survey was then posted using an Internet-based survey software. Links to the survey were sent via email to 107 individuals in a LISTSERV comprising Vitiligo Support International members who participated in a New York City support group (led by C.G. and N.B.S.). Only 1 email was used per household and only individuals 18 years or older could participate. These individuals were asked to complete a deidentified, 82-question, institutional review board–reviewed and exempted survey addressing issues affecting delivery and receipt of medical care for vitiligo.
Data were analyzed using the χ2 test, analysis of variance, or Student t test depending on the type of variable (categorical vs continuous). Fisher exact or Wilcoxon-Mann-Whitney tests were used when distributional assumptions were not met. A type I error rate (α=.05) was used to determine statistical significance. All analyses were performed using SAS 9.3 software.
Results
Respondents
The survey was completed by 81% (n=87) of individuals. The mean (SD) age of the treated patients about whom the respondents communicated was 33 (16) years and 71% (n=62) were women. The majority of respondents (64 [74%]) reported their race as white, followed by African American/black (12 [14%]), Hispanic (7 [8%]), and Asian (4 [5%]). Twenty-nine percent (22/76) of respondents reported a family income of less than $50,000 per year, 34% (26/76) reported an income of $50,000 to $100,000, and 37% (28/76) reported an income greater than $100,000, while 11 respondents did not report income.
Number of Physicians Seen
Respondents had reportedly seen an average (SD) number of 2 (1) physicians in the past/present before being offered any therapy for vitiligo and only 37% (32/87) of respondents reported being offered therapy by the first physician they saw. The number of physicians seen did not have a statistical relationship with years with vitiligo (ie, disease duration), sex, race, age of onset, income level, or number of sites affected.
Number of Sites Affected
The survey identified the following 23 sites affected by vitiligo: scalp, forehead, eyelids, lips, nose, cheeks, chin, neck, chest, stomach, back, upper arms, forearms, hands, wrists, fingers, genitalia, buttocks, thighs, calves/shins, ankles, feet, and toes. The average (SD) number of sites affected was 12 (6). The number of sites affected was correlated to the recommendation for phototherapy, while the recommendation for excimer laser therapy was inversely associated with the number of sites affected. The median number of sites affected for those who were not prescribed phototherapy was 10 (interquartile range [IQR]=9; P=.05); the median number of sites affected for those who were prescribed phototherapy was 15 (IQR=11). The association between the number of sites affected and whether the patient proceeded with phototherapy was not statistically significant. The need for phototherapy was not related to years with vitiligo (ie, disease duration), sex, or race.
Excimer laser therapy was prescribed more often to patients with fewer sites affected (median of 9 [IQR=3] vs median of 15 [IQR=9]; P=.04). Respondents who had fewer sites affected were on average more likely to proceed with excimer laser therapy (median of 8 [IQR=4] vs median of 11 [IQR=5]). The association between the number of sites affected and whether the patient proceeded with excimer laser therapy was not statistically significant.
Access to Topical Medications
Forty-one percent (36/87) of respondents reported difficulty accessing 1 or more topical therapies. Of 52 respondents who were prescribed a topical corticosteroid, 12 (23%) reported difficulty accessing therapy. Of 67 respondents who were prescribed a topical calcineurin inhibitor, 27 (40%) reported difficulty accessing medication (tacrolimus, n=17; pimecrolimus, n=10). Calcipotriene prescription coverage was not specifically addressed in this survey, as it usually is a second-line or adjunctive medication. Difficulty getting topical tacrolimus but not topical corticosteroids was associated with female sex (P=.03) but was not associated with race, income level, or level of education. Difficulty obtaining medication was not related to race, sex, level of education, or income level.
Consequences of Phototherapy
Twenty-three of 34 respondents (68%) who were told they required phototherapy actually received phototherapy and reported paying $38 weekly (IQR=$75). The majority of patients who proceeded with phototherapy lived (17/23 [74%]) or worked (16/23 [70%]) within 20 minutes of the therapy center. Self-reported response to phototherapy was good to very good in 65% (15/23) of respondents and no response in 30% (7/23); only 1 respondent reported worsening vitiligo. Sixty percent (15/25) of respondents said they were not satisfied with phototherapy. Respondents who were satisfied with the outcome of phototherapy had on average fewer sites affected by vitiligo (mean [SD], 10 [8]; P=.05). The association with other demographic and economic parameters (eg, sex, race, level of education, income level) was not statistically significant. Proceeding with phototherapy was not related to race, sex, level of education, or income level.
When questioned how many aspects of daily life (eg, work, home, school) were affected by phototherapy, 40% (35/87) of respondents reported that more than one life parameter was disturbed. Thirty-five percent (8/23) of respondents who received phototherapy reported that it affected their daily life “quite a bit” or “severely.” More respondents were likely to report that the therapy interfered with their life “somewhat,” “quite a bit,” or “severely” (76% [19/25]; 95% confidence interval, 55%-92%; P=.01) rather than “not at all” or “a little.”
Excimer Laser
Nine of 17 respondents (53%) who were recommended to undergo excimer laser therapy actually received therapy and reported paying $100 weekly (IQR=$60).
There was a trend toward significance of excimer usage being associated with lower age quartile (0–20 years)(P=.0553) and income more than $100,000 (P=.0788), neither of which reached statistical significance.
Insurance Coverage
Respondents were offered 7 answer options regarding the reason for noncoverage of topical calcineurin inhibitors. They were allowed to pick more than one reason where appropriate. For individuals who were prescribed topical tacrolimus but did not receive drug (n=17), the following reasons were cited: “no insurance coverage for the medication” (59% [10/17]), “your deductible was too high” (24% [4/17]), “prior authorization failed to produce coverage of the medication” (24% [4/17]), “your copay was prohibitively expensive” (24% [4/17]), “you were uncomfortable with the medication’s side effects” (18% [3/17]), “the tube was too small to cover your skin affected areas” (12% [2/17]), and “other” (29% [5/17]). Three patients selected 3 or more reasons, 8 patients selected 2 reasons, and 5 patients selected one reason.
Comment
It has been reported that patients with vitiligo may have difficulty related to treatment compliance for a variety of reasons.5 We identified notable barriers that arise for some, if not all, patients with vitiligo in the United States at some point in their care, including interference with other aspects of daily life, lack of coverage by current health insurance provider, and high out-of-pocket expenses, in addition to the negative effects of vitiligo on quality of life that have already been reported.6,7 These barriers are not a function of race/ethnicity, income level, or age of onset, but they may be impacted, as in the case of tacrolimus, by female sex. It is clear that, based on this study’s numbers, many patients will be unable to receive and/or comply with recommended treatment plans.
A limitation of this analysis is the study population, a select group of patients who had not been prescribed all the therapies in question. The sample size may not be large enough to demonstrate differences between level of education, race, or income level; however, even with a sample size of 87 respondents, the barriers to access of care are prominent. Larger population-based surveys would potentially tease out patterns of barriers not apparent with a smaller sample. No data were generated specific to calcipotriene, and this medication was not specified as a write-in agent on open question by any respondents; therefore, access to topical calcipotriene cannot be projected from this study. Phototherapy was queried as a nonspecific term and the breakdown of NB-UVB versus psoralen plus UVA was not available for this survey. Data suggesting a burden of socioeconomic barriers have been reported for atopic dermatitis8 and psoriasis,9 which corroborate the need for greater research in the field of access to care in dermatology.
Despite some advancement in the care of vitiligo, patients often are unable to access preferred or recommended treatment modalities. Standard recommendations for care are initial usage of calcineurin inhibitors for facial involvement and topical high-potency corticosteroids for involvement of the body.3,4 Based on this survey, it would seem that many patients are not able to receive the standard of care. Similarly, NB-UVB phototherapy and excimer laser therapy are recommended for widespread vitiligo and lesions unresponsive to topical care. It would seem that almost half of our respondents did not have access to one or more of the recommended therapies. Barriers to care may have substantial clinical and psychological outcomes, which were not evaluated in this study but merit future research.
- Krüger C, Schallreuter KU. A review of the worldwide prevalence of vitiligo in children/adolescents and adults. Int J Dermatol. 2012;51:1206-1212.
- Jin Y, Birlea SA, Fain PR, et al. Genome-wide association analyses identify 13 new susceptibility loci for generalized vitiligo. Nat Genet. 2012;44:676-680.
- Silverberg NB. Pediatric vitiligo. Pediatr Clin North Am. 2014;61:347-366.
- Taieb A, Alomar A, Böhm M, et al, Vitiligo European Task Force (VETF); European Academy of Dermatology and Venereology (EADV); Union Europénne des Médecins Spécialistes (UEMS). Guidelines for the management of vitiligo: the European Dermatology Forum consensus. Br J Dermatol. 2013;168:5-19.
- Abraham S, Raghavan P. Myths and facts about vitiligo: an epidemiological study. Indian J Pharm Sci. 2015;77:8-13.
- Silverberg JI, Silverberg NB. Quality of life impairment in children and adolescents with vitiligo. Pediatr Dermatol. 2014;31:309-318.
- Silverberg JI, Silverberg NB. Association between vitiligo extent and distribution and quality-of-life impairment. JAMA Dermatol. 2013;149:159-164.
- Silverberg JI, Hanifin JM. Adult eczema prevalence and associations with asthma and other health and demographic factors: a US population-based study. J Allergy Clin Immunol. 2013;132:1132-1138.
- Hamilton MP, Ntais D, Griffiths CE, et al. Psoriasis treatment and management—a systematic review of full economic evaluations. Br J Dermatol. 2015;172:574-583.
Practice Points
- Patients with vitiligo may experience difficulty receiving the care prescribed to them.
- It is best to identify barriers such as work schedule or distance before recommending a treatment plan.

Proton Pump Inhibitor-Associated Hypomagnesemia: A Retrospective Case-Control Study
In the U.S., proton pump inhibitors (PPIs) are one of the best-selling drug classes—more than $9 billion were spent on PPIs in 2012.1 These medications, available both by prescription and over-the-counter (OTC), are used to treat a variety of gastrointestinal conditions, including heartburn, gastroesophageal reflux disease, and peptic ulcer disease.1
Proton pump inhibitors are generally recognized as safe and effective. In 2011, however, the FDA reviewed Adverse Event Reporting System (AERS) reports, medical literature, and periodic safety updates and issued a safety communication outlining the risk for hypomagnesemia with prolonged PPI use.2 The FDA focused on 53 cases: 30 AERS cases, 15 in the literature, and 8 reported both through AERS and in the literature. The majority involved PPI use that continued for 1 year or longer, but in some cases hypomagnesemia developed after only 3 months. Labeling for prescription PPIs was updated with information about the hypomagnesemia risk, but labeling for the OTC drugs was not affected, as the FDA stated there is little risk with OTC use, and the label already indicated that use should be limited to 14 days at a time and up to 3 courses within 1 year.
Magnesium is an important intracellular cation that plays a role in multiple cellular activities. Low levels of magnesium can lead to a wide variety of adverse events (AEs), including vomiting, diarrhea, cramps, convulsions, bradycardia, and even death.3,4 The mechanism of PPI-associated hypomagnesemia is yet to be established but could be related to, as has been proposed, altered intestinal absorption of magnesium with long-term PPI use.4
Results from investigations of PPI-associated hypomagnesemia have been inconclusive. In a study of PPI-associated AEs reported to the FDA, Luk and colleagues estimated that 1% of patients who experienced an AE reported hypomagnesemia and concluded that all PPIs are associated with hypomagnesemia, but the risk varies. Of the 6 PPIs that have been FDA approved, esomeprazole was associated with the lowest risk, pantoprazole with the most. Results also suggested that the risk was higher for elderly and male patients.
In another study of prior PPI use and its effects on magnesium levels among 11,490 intensive care unit admissions, Danziger and colleagues found that the association of PPI use and hypomagnesemia was limited to patients who concomitantly received a diuretic, and use of a histamine 2 receptor antagonist was not associated with hypomagnesemia.3 A third cross-sectional study of 402 adults with hypomagnesemia on hospital admission found no association between outpatient PPI regimens and hypomagnesemia.5 Other studies designed to investigate PPI-associated hypomagnesemia were limited by short-term PPI use, small samples, concurrent diseases, and confounding variables (eg, history of alcoholism).6,7
Need for Present Study
The evidence needed to establish the incidence of PPI-associated hypomagnesemia is limited. Hypomagnesemia can lead to serious AEs, as just outlined, and is a common indication for hospitalization.8 The hypomagnesemia rate is about 12% in hospitalized patients and sharply higher (60%-65%) in those who are critically ill. Proton pump inhibitor-associated hypomagnesemia is preventable, and monitoring parameters can be recommended to patients undergoing long-term therapy.
Ajumobi and colleagues found that 13,713 (23.4%) of 58,605 patients treated at a VA center over a 12-month period were receiving a PPI.9 Gawron and colleagues found that many veterans had been prescribed a PPI and were receiving high total daily doses for the treatment of gastroesophageal reflux disease.10 The majority of patients received a 90-day or longer supply and showed minimal evidence of step-down therapy or cessation of PPI therapy.
In the present study, the authors investigated the rate of PPI-associated hypomagnesemia in a veteran population at a facility where the majority of PPIs were by prescription, not OTC. The Captain James A. Lovell Federal Health Care Center (FHCC) is a combined DoD and VA facility where veterans and active military members and their dependents receive medical care and prescription drugs.
This study’s primary objective was to determine the rate of PPI-induced hypomagnesemia. The secondary objective was to identify any clinical factors (eg, PPI dose and therapy duration, concomitant use of a diuretic) that might further increase the risk of hypomagnesemia.
Methods
After the study protocol was approved by the Lovell FHCC institutional review board, the authors retrospectively compared patients with a low magnesium level (case group) with patients with a normal magnesium level (control group). In each group, the authors identified patients who underwent PPI therapy and those who did not (Figure).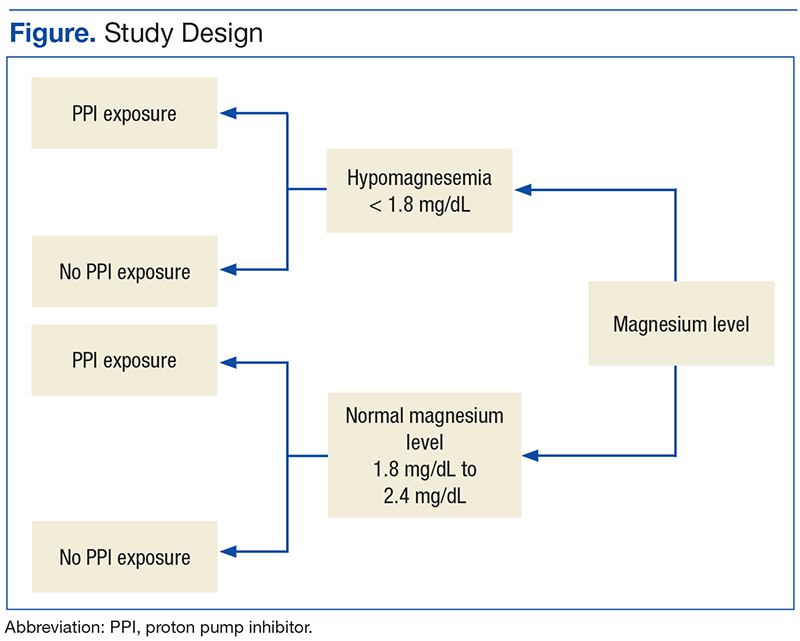
Study inclusion criteria were low magnesium level (< 1.8 mg/dL) within the past 5 years for veterans in the case group and normal magnesium level (1.8-2.4 mg/dL) within the past 5 years for veterans in the control group. Exclusion criteria were nonveterans and no prior magnesium level for a veteran.
Patients were assigned in a ratio of 1 (case group) to 4 (control group) and were added only after confirmation that multiple magnesium levels had been recorded (January 2008-January 2013).
Patients who met the inclusion criteria were enrolled in the study. Patient’s Computerized Patient Record System charts were reviewed for demographics (sex, age, race); magnesium level; active order for PPI during same period magnesium level was drawn; PPI name, dose, and therapy duration; and concomitant use of a diuretic (yes or no) and, if yes, type of diuretic.
To assess a significance criterion (α) of 0.05 and a power of 80% 1,375 patients in a 1:4 ratio (275 cases, 1,100 controls) were required in order to detect a difference in rates of hypomagnesemia between patients who received a PPI and those who did not. Primary outcome data are reported as percentages and calculated odds ratios (ORs). Significance of ORs was determined with 95% confidence intervals (CIs). Secondary outcomes were PPI dose and therapy duration and concomitant use of a diuretic. Descriptive statistics were used for secondary outcomes.
Results
Five hundred thirty charts (106 cases, 424 controls) were included and reviewed. Table 1 lists the baseline demographics. There were no statistically significant differences in age, sex, or race between the case and control groups. Mean (SD) magnesium level was 1.6 (0.15) 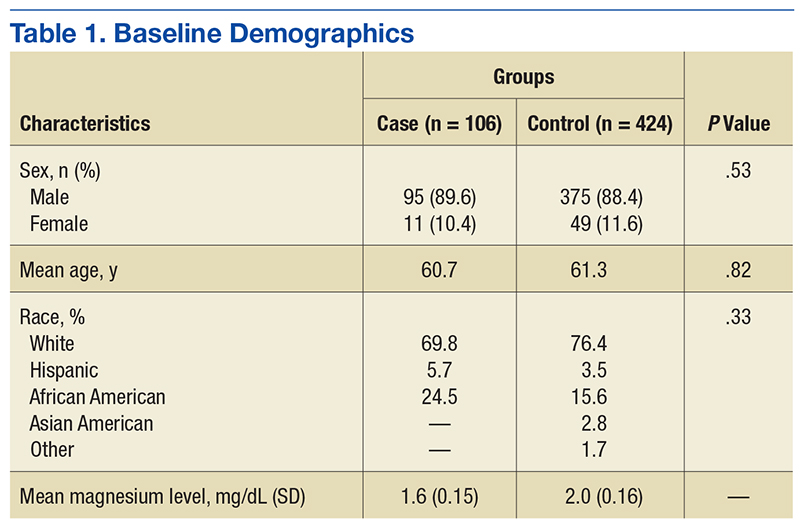
The authors assessed for other clinical factors that might concurrently or 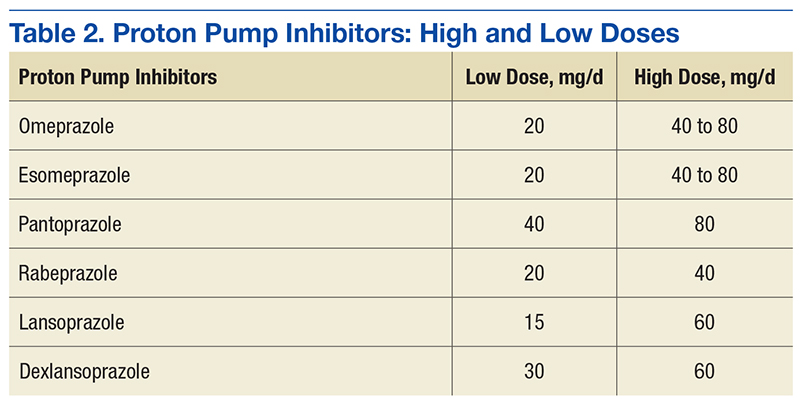
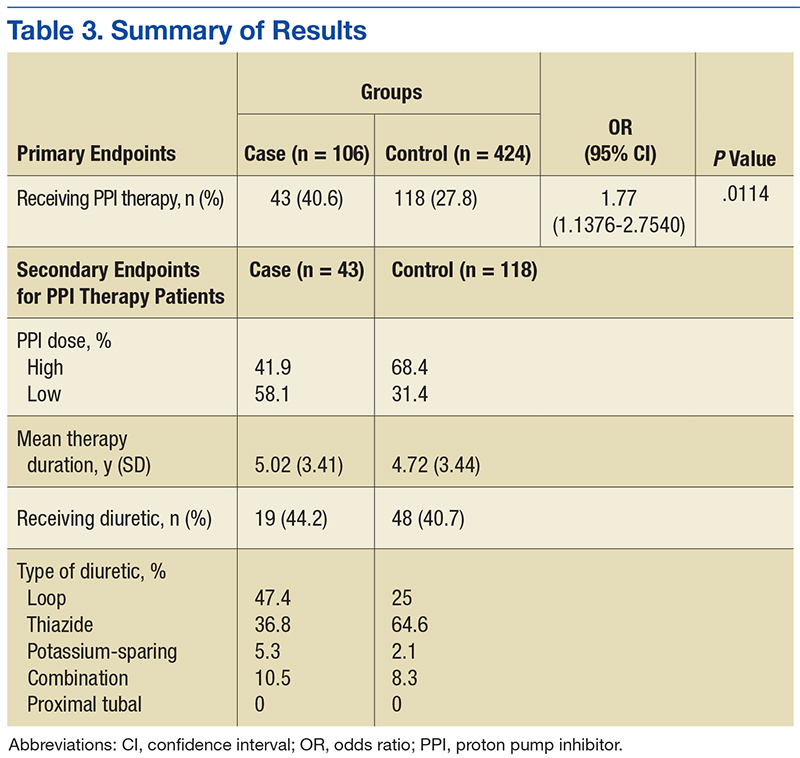
Discussion
One of the most widely prescribed classes of medications, PPIs are often regarded as safe and effective and therefore continued as long-term therapy. Results of this study showed an association of PPI use and hypomagnesemia—thereby adding to the literature. Results for the secondary objective suggest that the association does not necessarily depend on PPI dose, but, given that a statistical analysis of the difference between the case and control groups was not conducted, the statistical significance is unknown.
Although the hypomagnesemia rate remains undetermined, the results of this NNH study suggest a rate higher than previously proposed. Other investigators have estimated the rate of PPI-associated hypomagnesemia at 1%, which does not correlate well with the NNH often calculated in this study. For 2 possible reasons, the poor correlation may be attributable to underreporting of hypomagnesemia: Magnesium levels are not commonly checked with a basic metabolic panel, and many patients who are mildly hypomagnesemic remain asymptomatic.
Future research directions include determining whether the risk for hypomagnesemia is related to patient status (eg, inpatient vs outpatient) and performing statistical analyses on the secondary objective to determine the clinical significance of potential risk factors. Other research directions might involve assessing PPI discontinuation rates in a hypomagnesemic population and assessing outcomes such as hospitalizations and AEs (eg, seizure, tetany, arrhythmia).
Limitations
This study had several limitations. First was the overall design. Study results described only a potential association of PPI use and hypomagnesemia, not definitive cause and effect. Results also depended on an assumed, previously reported rate of PPI-associated hypomagnesemia and a rate of exposure to PPIs, as these data were taken into account in the overall study design. In addition, patient adherence to prescribed therapy and accuracy of medication history were assumed from the medication and dispensing history, as not all medications obtained outside the Lovell FHCC were accurately documented. There also was an external validity limitation in that older men make up the typical FHCC patient population. Last, as inherent to all studies that use objective measures, there was the potential for laboratory magnesium level reporting errors.
Conclusion
The study results identified an association of PPI use and hypomagnesemia in a VA patient population of older men. More studies need to be conducted with non-VA patient populations to further assess the incidence of PPI-associated hypomagnesemia.
1. Consumers Union. Consumer Reports Best Buy Drugs: Using the proton pump inhibitors to treat heartburn and stomach acid reflux, comparing effectiveness, safety, and price. http://www.consumer reports.org/health/resources/pdf/best-buy-drugs/PPIsUpdate-FINAL.pdf. Updated July 2013. Accessed November 4, 2016.
2. U.S. Food and Drug Administration. FDA drug safety communication: low magnesium levels can be associated with long-term use of proton pump inhibitor drugs (PPIs). http://www.fda.gov/Drugs /DrugSafety/ucm245011.htm. Updated April 7, 2016. Accessed November 4, 2016.
3. Danziger J, William JH, Scott DJ, et al. Proton-pump inhibitor use is associated with low serum magnesium concentrations. Kidney Int. 2013;83(4):692-699.
4. Luk CP, Parsons R, Lee YP, Hughes JD. Proton pump inhibitor-associated hypomagnesemia: what do FDA data tell us? Ann Pharmacother. 2013;47(6):773-780.
5. Koulouridis I, Alfayez M, Tighiouart H, et al. Out-of-hospital use of proton pump inhibitors and hypomagnesemia at hospital admission: a nested case-control study. Am J Kidney Dis. 2013;62(4):730-737.
6. Mackay JD, Bladon PT. Hypomagnesaemia due to proton-pump inhibitor therapy: a clinical case series. QJM. 2010;103(6):387-395.
7. Faulhaber GA, Ascoli BA, Lubina A, et al. Serum magnesium and proton-pump inhibitors use: a cross-sectional study. Rev Assoc Med Bras (1992). 2013;59(3):276-279.
8. Yu ASL. Causes of hypomagnesemia. UpToDate. http://www.uptodate.com/contents/causes-of-hypomagnesemia. Updated February 4, 2016. Accessed November 4, 2016.
9. Ajumobi AB, Vuong R, Ahaneku H. Analysis of nonformulary use of PPIs and excess drug cost in a Veterans Affairs population. J Manag Care Pharm. 2012;18(1):63-67.
10. Gawron AJ, Pandolfino JE, Miskevics S, Lavela SL. Proton pump inhibitor prescriptions and subsequent use in US veterans diagnosed with gastroesophageal reflux disease. J Gen Intern Med. 2013;28(7):930-937.
In the U.S., proton pump inhibitors (PPIs) are one of the best-selling drug classes—more than $9 billion were spent on PPIs in 2012.1 These medications, available both by prescription and over-the-counter (OTC), are used to treat a variety of gastrointestinal conditions, including heartburn, gastroesophageal reflux disease, and peptic ulcer disease.1
Proton pump inhibitors are generally recognized as safe and effective. In 2011, however, the FDA reviewed Adverse Event Reporting System (AERS) reports, medical literature, and periodic safety updates and issued a safety communication outlining the risk for hypomagnesemia with prolonged PPI use.2 The FDA focused on 53 cases: 30 AERS cases, 15 in the literature, and 8 reported both through AERS and in the literature. The majority involved PPI use that continued for 1 year or longer, but in some cases hypomagnesemia developed after only 3 months. Labeling for prescription PPIs was updated with information about the hypomagnesemia risk, but labeling for the OTC drugs was not affected, as the FDA stated there is little risk with OTC use, and the label already indicated that use should be limited to 14 days at a time and up to 3 courses within 1 year.
Magnesium is an important intracellular cation that plays a role in multiple cellular activities. Low levels of magnesium can lead to a wide variety of adverse events (AEs), including vomiting, diarrhea, cramps, convulsions, bradycardia, and even death.3,4 The mechanism of PPI-associated hypomagnesemia is yet to be established but could be related to, as has been proposed, altered intestinal absorption of magnesium with long-term PPI use.4
Results from investigations of PPI-associated hypomagnesemia have been inconclusive. In a study of PPI-associated AEs reported to the FDA, Luk and colleagues estimated that 1% of patients who experienced an AE reported hypomagnesemia and concluded that all PPIs are associated with hypomagnesemia, but the risk varies. Of the 6 PPIs that have been FDA approved, esomeprazole was associated with the lowest risk, pantoprazole with the most. Results also suggested that the risk was higher for elderly and male patients.
In another study of prior PPI use and its effects on magnesium levels among 11,490 intensive care unit admissions, Danziger and colleagues found that the association of PPI use and hypomagnesemia was limited to patients who concomitantly received a diuretic, and use of a histamine 2 receptor antagonist was not associated with hypomagnesemia.3 A third cross-sectional study of 402 adults with hypomagnesemia on hospital admission found no association between outpatient PPI regimens and hypomagnesemia.5 Other studies designed to investigate PPI-associated hypomagnesemia were limited by short-term PPI use, small samples, concurrent diseases, and confounding variables (eg, history of alcoholism).6,7
Need for Present Study
The evidence needed to establish the incidence of PPI-associated hypomagnesemia is limited. Hypomagnesemia can lead to serious AEs, as just outlined, and is a common indication for hospitalization.8 The hypomagnesemia rate is about 12% in hospitalized patients and sharply higher (60%-65%) in those who are critically ill. Proton pump inhibitor-associated hypomagnesemia is preventable, and monitoring parameters can be recommended to patients undergoing long-term therapy.
Ajumobi and colleagues found that 13,713 (23.4%) of 58,605 patients treated at a VA center over a 12-month period were receiving a PPI.9 Gawron and colleagues found that many veterans had been prescribed a PPI and were receiving high total daily doses for the treatment of gastroesophageal reflux disease.10 The majority of patients received a 90-day or longer supply and showed minimal evidence of step-down therapy or cessation of PPI therapy.
In the present study, the authors investigated the rate of PPI-associated hypomagnesemia in a veteran population at a facility where the majority of PPIs were by prescription, not OTC. The Captain James A. Lovell Federal Health Care Center (FHCC) is a combined DoD and VA facility where veterans and active military members and their dependents receive medical care and prescription drugs.
This study’s primary objective was to determine the rate of PPI-induced hypomagnesemia. The secondary objective was to identify any clinical factors (eg, PPI dose and therapy duration, concomitant use of a diuretic) that might further increase the risk of hypomagnesemia.
Methods
After the study protocol was approved by the Lovell FHCC institutional review board, the authors retrospectively compared patients with a low magnesium level (case group) with patients with a normal magnesium level (control group). In each group, the authors identified patients who underwent PPI therapy and those who did not (Figure).
Study inclusion criteria were low magnesium level (< 1.8 mg/dL) within the past 5 years for veterans in the case group and normal magnesium level (1.8-2.4 mg/dL) within the past 5 years for veterans in the control group. Exclusion criteria were nonveterans and no prior magnesium level for a veteran.
Patients were assigned in a ratio of 1 (case group) to 4 (control group) and were added only after confirmation that multiple magnesium levels had been recorded (January 2008-January 2013).
Patients who met the inclusion criteria were enrolled in the study. Patient’s Computerized Patient Record System charts were reviewed for demographics (sex, age, race); magnesium level; active order for PPI during same period magnesium level was drawn; PPI name, dose, and therapy duration; and concomitant use of a diuretic (yes or no) and, if yes, type of diuretic.
To assess a significance criterion (α) of 0.05 and a power of 80% 1,375 patients in a 1:4 ratio (275 cases, 1,100 controls) were required in order to detect a difference in rates of hypomagnesemia between patients who received a PPI and those who did not. Primary outcome data are reported as percentages and calculated odds ratios (ORs). Significance of ORs was determined with 95% confidence intervals (CIs). Secondary outcomes were PPI dose and therapy duration and concomitant use of a diuretic. Descriptive statistics were used for secondary outcomes.
Results
Five hundred thirty charts (106 cases, 424 controls) were included and reviewed. Table 1 lists the baseline demographics. There were no statistically significant differences in age, sex, or race between the case and control groups. Mean (SD) magnesium level was 1.6 (0.15)
The authors assessed for other clinical factors that might concurrently or
Discussion
One of the most widely prescribed classes of medications, PPIs are often regarded as safe and effective and therefore continued as long-term therapy. Results of this study showed an association of PPI use and hypomagnesemia—thereby adding to the literature. Results for the secondary objective suggest that the association does not necessarily depend on PPI dose, but, given that a statistical analysis of the difference between the case and control groups was not conducted, the statistical significance is unknown.
Although the hypomagnesemia rate remains undetermined, the results of this NNH study suggest a rate higher than previously proposed. Other investigators have estimated the rate of PPI-associated hypomagnesemia at 1%, which does not correlate well with the NNH often calculated in this study. For 2 possible reasons, the poor correlation may be attributable to underreporting of hypomagnesemia: Magnesium levels are not commonly checked with a basic metabolic panel, and many patients who are mildly hypomagnesemic remain asymptomatic.
Future research directions include determining whether the risk for hypomagnesemia is related to patient status (eg, inpatient vs outpatient) and performing statistical analyses on the secondary objective to determine the clinical significance of potential risk factors. Other research directions might involve assessing PPI discontinuation rates in a hypomagnesemic population and assessing outcomes such as hospitalizations and AEs (eg, seizure, tetany, arrhythmia).
Limitations
This study had several limitations. First was the overall design. Study results described only a potential association of PPI use and hypomagnesemia, not definitive cause and effect. Results also depended on an assumed, previously reported rate of PPI-associated hypomagnesemia and a rate of exposure to PPIs, as these data were taken into account in the overall study design. In addition, patient adherence to prescribed therapy and accuracy of medication history were assumed from the medication and dispensing history, as not all medications obtained outside the Lovell FHCC were accurately documented. There also was an external validity limitation in that older men make up the typical FHCC patient population. Last, as inherent to all studies that use objective measures, there was the potential for laboratory magnesium level reporting errors.
Conclusion
The study results identified an association of PPI use and hypomagnesemia in a VA patient population of older men. More studies need to be conducted with non-VA patient populations to further assess the incidence of PPI-associated hypomagnesemia.
1. Consumers Union. Consumer Reports Best Buy Drugs: Using the proton pump inhibitors to treat heartburn and stomach acid reflux, comparing effectiveness, safety, and price. http://www.consumer reports.org/health/resources/pdf/best-buy-drugs/PPIsUpdate-FINAL.pdf. Updated July 2013. Accessed November 4, 2016.
2. U.S. Food and Drug Administration. FDA drug safety communication: low magnesium levels can be associated with long-term use of proton pump inhibitor drugs (PPIs). http://www.fda.gov/Drugs /DrugSafety/ucm245011.htm. Updated April 7, 2016. Accessed November 4, 2016.
3. Danziger J, William JH, Scott DJ, et al. Proton-pump inhibitor use is associated with low serum magnesium concentrations. Kidney Int. 2013;83(4):692-699.
4. Luk CP, Parsons R, Lee YP, Hughes JD. Proton pump inhibitor-associated hypomagnesemia: what do FDA data tell us? Ann Pharmacother. 2013;47(6):773-780.
5. Koulouridis I, Alfayez M, Tighiouart H, et al. Out-of-hospital use of proton pump inhibitors and hypomagnesemia at hospital admission: a nested case-control study. Am J Kidney Dis. 2013;62(4):730-737.
6. Mackay JD, Bladon PT. Hypomagnesaemia due to proton-pump inhibitor therapy: a clinical case series. QJM. 2010;103(6):387-395.
7. Faulhaber GA, Ascoli BA, Lubina A, et al. Serum magnesium and proton-pump inhibitors use: a cross-sectional study. Rev Assoc Med Bras (1992). 2013;59(3):276-279.
8. Yu ASL. Causes of hypomagnesemia. UpToDate. http://www.uptodate.com/contents/causes-of-hypomagnesemia. Updated February 4, 2016. Accessed November 4, 2016.
9. Ajumobi AB, Vuong R, Ahaneku H. Analysis of nonformulary use of PPIs and excess drug cost in a Veterans Affairs population. J Manag Care Pharm. 2012;18(1):63-67.
10. Gawron AJ, Pandolfino JE, Miskevics S, Lavela SL. Proton pump inhibitor prescriptions and subsequent use in US veterans diagnosed with gastroesophageal reflux disease. J Gen Intern Med. 2013;28(7):930-937.
A Noninvasive Mechanical Treatment to Reduce the Visible Appearance of Cellulite
Cellulite is a cosmetic problem, not a disease process. It affects 85% to 90% of all women worldwide and was described nearly 100 years ago.1 Causes may be genetic, hormonal, or vascular in nature and may be related to the septa configuration in the subdermal tissue. Fibrosis at the dermal-subcutaneous junction as well as decreased vascular and lymphatic circulation also may be causative factors.
Cellulite has a multifactorial etiology. Khan et al2 noted that there are specific classic patterns of cellulite that affect women exclusively. White women tend to have somewhat higher rates of cellulite than Asian women. The authors also stated that lifestyle factors such as high carbohydrate diets may lead to an increase in total body fat content, which enhances the appearance of cellulite.2
The subdermal anatomy affects the appearance of cellulite. Utilizing in vivo magnetic resonance imaging, Querleux et al3 showed that women with visible cellulite have dermal septa that are thinner and generally more perpendicular to the skin’s surface than women without cellulite. In women without cellulite, the orientation of the septa is more angled into a crisscross pattern. In women with a high percentage of perpendicular septa, the perpendicular septa allow for fat herniation with dimpling of the skin compared to the crisscross septa pattern.2 Other investigators have discussed the reduction of blood flow in specific areas of the body in women, particularly in cellulite-prone areas such as the buttocks and thighs, as another causative factor.2,4,5 Rossi and Vergnanini6 showed that the blood flow was 35% lower in affected cellulite regions than in nonaffected regions without cellulite, which can cause congestion of blood and lymphatic flow and increased subdermal pressure, thus increasing the appearance of cellulite.
Although there is some controversy regarding the effects of weight loss on the appearance of cellulite,2,7 it appears that the subdermal septa and morphology have more of an effect on the appearance of cellulite.2,3,8
Rossi and Vergnanini6 proposed a 4-grade system for evaluating the appearance of cellulite (grade I, no cellulite; grade II, skin that is smooth and without any pronounced dimpling upon standing or lying down but may show some dimpling upon pinching and strong muscle contraction; grade III, cellulite is present in upright positions but not when the patient is in a supine position; grade IV, cellulite can be seen when the patient is standing and in a supine position). Both grades III and IV can be exacerbated by maximal voluntary contraction and strong pinching of the skin because these actions cause the subcutaneous fat to move toward the surface of the skin between the septa. This grading system aligns with categories I through III described by Mirrashed et al.9
There are many cellulite treatments available but few actually create a reduction in the visible appearance of cellulite. A number of these treatments were reviewed by Khan et al,10 including massage; a noninvasive suction-assisted massage technique; and topical agents such as xanthine, retinols, and other botanicals.4,11-14 Liposuction has not been shown to be effective in the treatment of cellulite and in fact may increase the appearance of cellulite.9,15 Mesotherapy, a modality that entails injecting substances into the subcutaneous fat layer, is another treatment of cellulite. Two of the most common agents purported to dissolve fat include phosphatidylcholine and sodium deoxycholate. The efficacy and safety of mesotherapy remains controversial and unproven. A July 2008 position statement from the American Society of Plastic Surgeons stated that “low levels of validity and quality of the literature does not allow [American Society of Plastic Surgeons] to support a recommendation for the use of mesotherapy/injection lipolysis for fat reduction.”16 Other modalities such as noninvasive dual-wavelength laser/suction devices; low-energy diode laser, contact cooling, suction, and massage devices; and infrared, bipolar radiofrequency, and suction with mechanical massage devices are available and show some small improvements in the visible appearance of cellulite, but no rating scales were used in any of these studies.17,18 DiBernardo19 utilized a 1440-nm pulsed laser to treat cellulite. It is an invasive treatment that works by breaking down some of the connective tissue septa responsible for the majority and greater severity of the dermal dimpling seen in cellulite, increasing the thickness of the dermis as well as its elasticity, reducing subcutaneous fat, and improving circulation and reducing general lymphatic congestion.19 The system showed promise but was an invasive treatment, and one session could cost $5000 to $7000 for bilateral areas and another $2500 for each additional area.20 Burns21 expressed that the short-term results showed promise in reducing the appearance of cellulite. Noninvasive ultrasound22,23 as well as extracorporeal shock wave therapy24,25 also has shown some improvement in the firmness of collagen but generally not in the appearance of cellulite.
We sought to evaluate the efficacy and safety of a noninvasive mechanical treatment of cellulite.
Methods
This study was conducted in accordance with the guidelines set forth by the US Department of Health and Human Services’ Policy for Protection of Human Research Subjects and the World Medical Association’s Declaration of Helsinki. Participants were recruited through local area medical facilities in southeastern Michigan. Written informed consent was obtained from all participants prior to beginning the study.
Patients with grades II to IV cellulite, according to the Rossi and Vergnanini6 grading system, were allowed to participate. All participants in the study were asked not to make lifestyle changes (eg, exercise habits, diet) or use any other treatments for cellulite that might be available to them during the study period. Exclusion criteria included history of deep vein thrombosis, cancer diagnosed within the last year, pregnancy, hemophilia, severe lymphedema, presence of a pacemaker, epilepsy, seizure disorder, or current use of anticoagulants. History of partial or total joint replacements, acute hernia, nonunited fractures, advanced arthritis, or detached retina also excluded participation in the study.
Participants completed an 8-week, twice-weekly treatment protocol with a noninvasive mechanical device performed in clinic. The device consisted of a 10.16-cm belt with a layer of nonslip material wrapped around the belt. The belt was attached to a mechanical oscillator. We adjusted the stroke length to approximately 2 cm and moved the dermis at that length at approximately 1000 strokes per minute.
Each participant was treated for a total treatment time of 18 to 24 minutes. The total treatment area included the top of the iliac crest to just above the top of the popliteal space. The width of the belt (10.16 cm) was equal to 1 individual treatment area. Each individual treatment area was treated for 2 minutes. First the buttocks and bilateral thighs were treated, followed by the right lateral thigh and the left lateral thigh. The belt was moved progressively down the total treatment area until all individual treatment areas were addressed. The average participant had 3 to 4 bilateral thigh and buttocks treatment areas and 3 to 4 lateral treatment areas on both the left and right sides of the body.
Digital photographs were taken with standardized lighting for all participants. Photographs were taken before the first treatment on the lateral and posterior aspects of the participant and were taken again at the end of the treatment program immediately before the last treatment. Participants were asked to contract the gluteal musculature for all photographs.
Two board-certified plastic surgeons were asked to rate the before/after photographs in a blinded manner. They graded each photograph on a rating scale of 0 to 10 (0=no cellulite; 10=worst possible cellulite). These data were analyzed using a Wilcoxon signed rank test. These data were compared to the participants self-evaluation of the appearance of cellulite in the photographs from the initial and final treatments using a rating scale of 0 to 10 (0=no cellulite; 10=worst possible cellulite).
The circumference of the widest part of the gluteal area was measured before and after treatment (+/–0.5 cm). The data were analyzed using a paired t test.
Results
The study included 43 participants (age range, 21–67 years; mean age, 37.6 years; weight range, 51–97 kg; mean weight, 64.95 kg) who resided in the Midwestern United States, were interested in reducing their cellulite, and were willing to commit to treatment 2 times weekly for the duration of the 8-week study. Fourteen percent (6/43) of participants were smokers. Participant self-assessments were divided into 3 categories based on the Rossi and Vergnanini6 grading system: category II, n=7; category III, n=12; and category IV, n=24. Although all the categories in our analysis showed statistically significant improvements, we found that there was more improvement in category II participants versus category III, and then again more improvement in category III versus category IV. The data for each treatment were analyzed separately using a paired t test, as we were not interested in comparing categories, only the effect of the treatment. We were testing to see if the difference was greater than 0, and the paired t values were statistically significant in all cases (category II, P=.003; category III, P=.001; category IV, P=.002)(Figure 1).
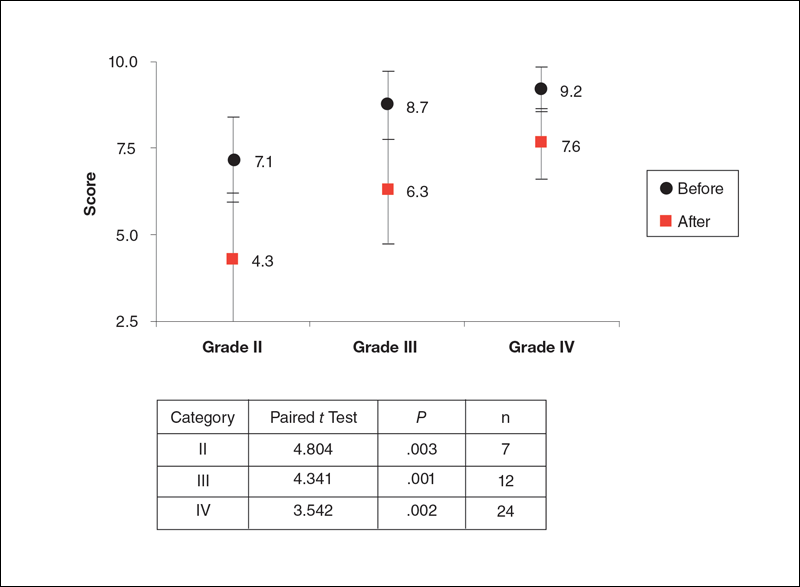
Using a correlation analysis, we found that age, body weight, or body mass index were not significantly correlated with the difference between the before and after physician rating. The difference between before and after treatment also was independent of whether or not the participant exercised or had an adverse reaction to the belt. Adverse reactions to the belt were characterized by redness and/or minor raising of the skin immediately following the treatment. These reactions all dissipated within 12 hours. It also appeared that the rating scales correlated well with the participants self-perception of their cellulite and the improvements seen in the photographs (Figures 2 and 3).
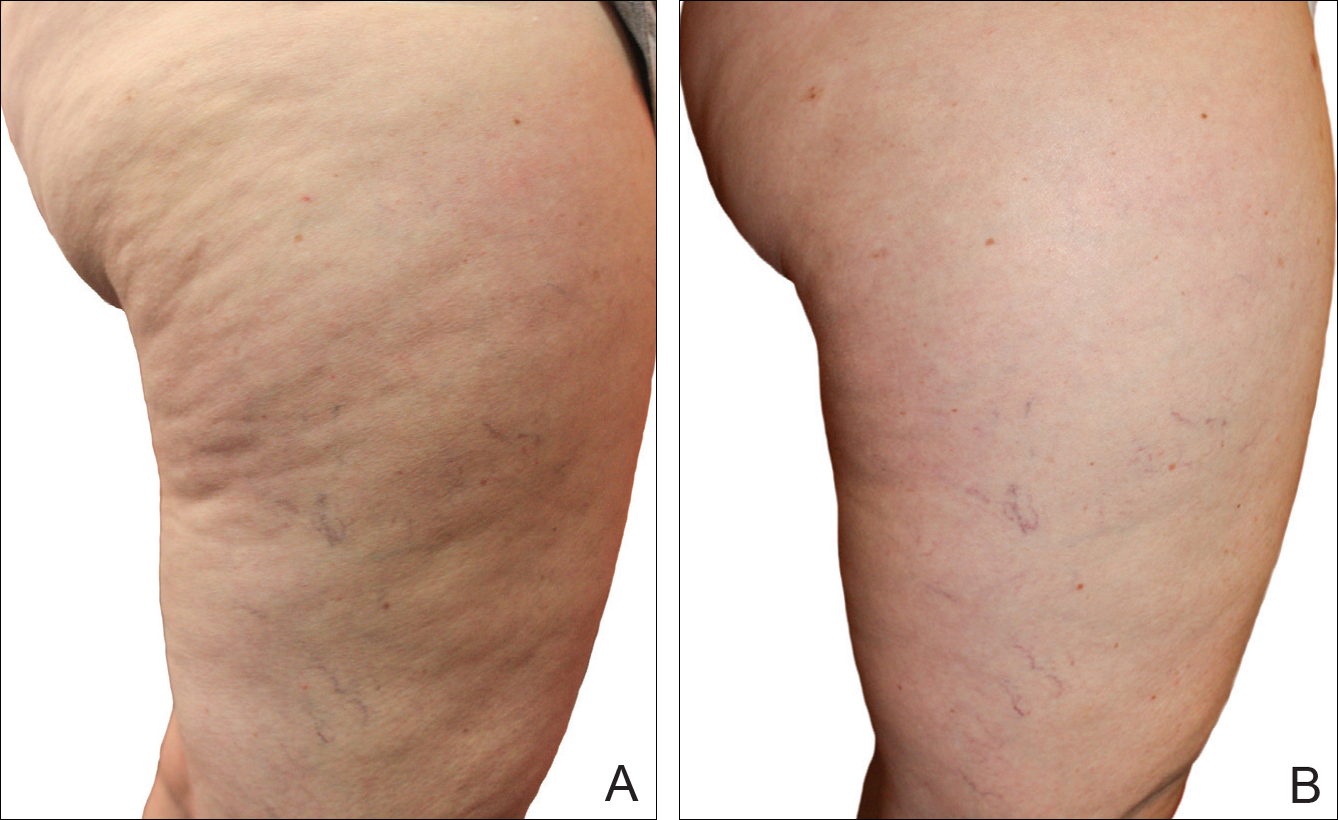
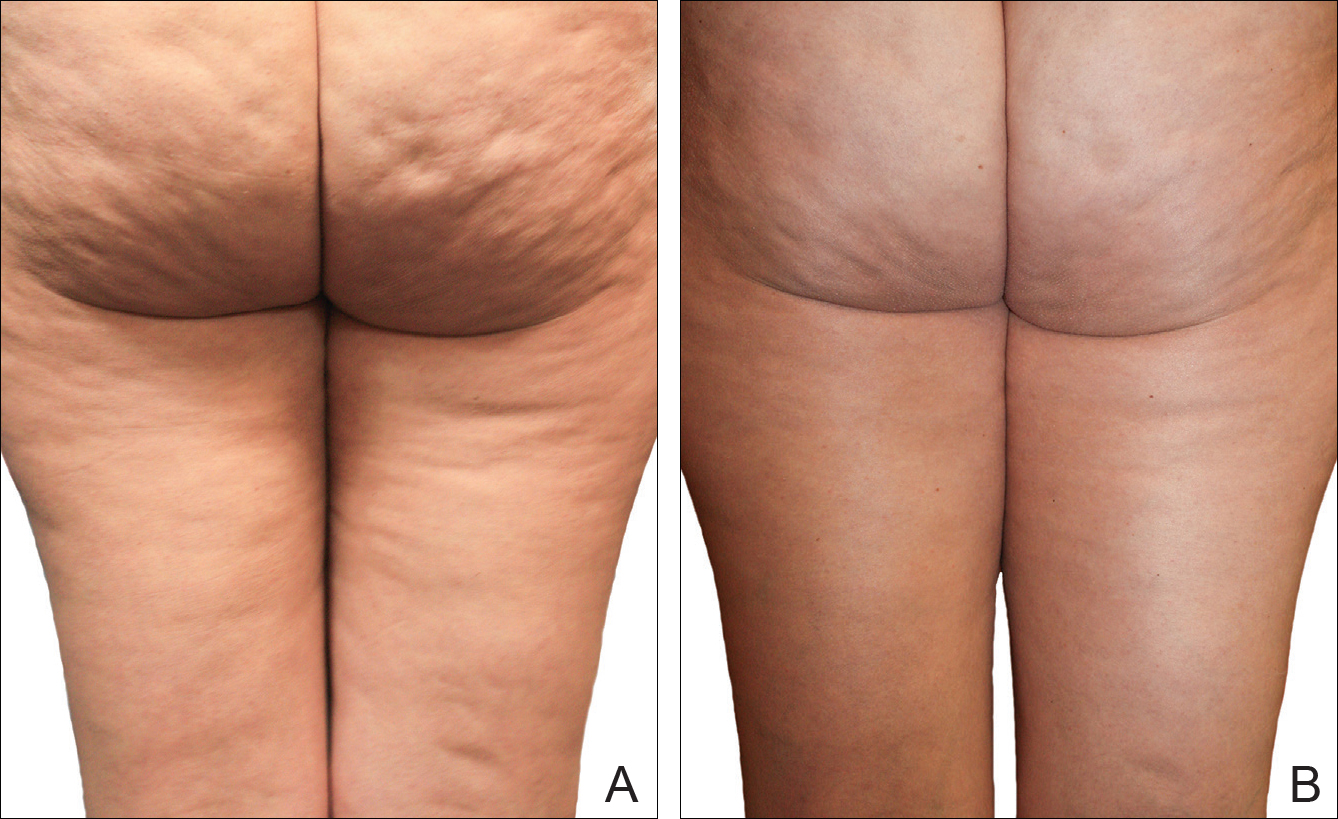
The mean circumference of the widest part of the gluteal area before treatment was 100.2 cm and the standard deviation was 8.14 cm. The mean circumference after treatment was 98.3 cm and the standard deviation was 8.02 (t=–2.81; P<.05). Many of the women commented that they felt more “toned,” which probably accounted for the slight difference in circumference rather than weight loss.
Of the 2 blinded board-certified plastic surgeons, one physician rated all participants in category III as significantly improved (P<.05) and rated the other categories as marginally insignificantly improved; the second physician rated all categories as marginally insignificantly improved.
Comment
Although there are a large number of treatment protocols that have been introduced and studied for the reduction of the appearance of cellulite,4,9,11-18 many have not shown promising long-term results. Some treatments have shown improvement in the firmness of collagen and the dermis but not in the appearance of cellulite.22-25 One of the only treatments that has shown some promise is an expensive invasive treatment.20
The system used in this study was shown to be safe in all study participants. No significant adverse reactions were noted, and each participant successfully completed the protocol. Figures 2 and 3 show the strong correlation between the treatment and the reduction in the visible appearance of cellulite in this study population, which was supported by statistical analysis, particularly the participant self-reported ratings. The participants and the blinded physicians were not in agreement on the improvement of cellulite. Although the participants knew the changes that occurred to their bodies, the physicians only had photographs from which to make their decisions. The participants clearly observed noticeable differences to their bodies, while the physicians either saw no change or some improvement.
The physicians were asked to evaluate only the cellulite, but the process we employed changed more than the cellulite. The first step in the process was a toning of the legs and buttocks, which was readily observable by the patients but was outside the scope of the physicians’ assessment. After the body toning, the cellulite began to improve. It is possible that the participants were responding to the entire process, which clearly was positive, while the physicians were responding only to the cellulite end point.
Our treatment regimen accomplished reduction of the visible appearance of cellulite by breaking down connective tissue septa as well as increasing the thickness of the dermis and its elasticity. It also helped reduce subcutaneous fat, improve circulation, and reduce general lymphatic congestion. The parallel motions of the unit could be adjusted, but we kept them at a mid-level range of motion. The motion at this frequency would have a tendency to not only heat the epidermis and dermal layer that we were attempting to affect but would also help accomplish breaking down the septa and improving the elasticity of the dermis. Also, the rapid motion over a period of time of pulling the dermis parallel to the subdermal tissue and fascia most likely helped improve the circulation and lymphatic flow in treated areas as well as possibly broke down the subcutaneous fat. All of these factors appear to have led to an improvement in the appearance of cellulite in our study participants.
A maintenance-type program, if continued, would likely demonstrate improved results by further breaking down the septa and improving the other factors that reduce the appearance of cellulite. We believe that the participants would eventually be able to discontinue the use of the unit or reduce its use substantially once the desired results were obtained.
When utilizing the device, the participants were in a standing posture and leaning into the belt with a moderate force, which seemed to secondarily improve the tone of the gluteal and thigh musculature that was being treated. It may be that the oscillatory motion and the standing posture caused the muscles to isometrically co-contract, adding a secondary exerciselike effect.26-29
Proving our suggested mechanisms of action would require tissue biopsies and/or magnetic resonance imaging studies that were beyond the scope of this study. However, regardless of the mechanism of action, we do believe that this treatment has been shown to be effective, convenient, and most importantly safe.
Conclusion
The unique device that was utilized in our study is a safe and cost-effective method of reducing the appearance of cellulite for home use and would allow for a noninvasive, low-risk procedure.
- Scherwitz C, Braun-Falco O. So-called cellulite. J Dermatol Surg Oncol. 1978;4:230-234.
- Khan MH, Victor F, Rao B, et al. Treatment of cellulite: part I. pathophysiology. J Am Acad Dermatol. 2010;62:361-370, quiz 371-372.
- Querleux B, Cornillon C, Jolivet O, et al. Anatomy and physiology of subcutaneous adipose tissue by in vivo magnetic resonance imaging and spectroscopy: relationships with sex and presence of cellulite. Skin Res Technol. 2002;8:118-124.
- Rawlings A. Cellulite and its treatment. Int J Cos Sci. 2006;28:175-190.
- Rosenbaum M, Prieto V, Hellmer J, et al. An exploratory investigation of the morphology and biochemistry of cellulite. Plast Reconstr Surg. 1998;101:1934-1939.
- Rossi AB, Vergnanini AL. Cellulite: a review. J Eur Acad Dermatol Venereol. 2000;14:251-262.
- Smalls LK, Hicks M, Passeretti D, et al. Effect of weight loss on cellulite: gynoid lypodystrophy. Plast Reconstr Surg. 2006;118:510-516.
- Nürnberger F, Müller G. So-called cellulite: an invented disease. J Dermatol Surg Oncol. 1978;4:221-229.
- Mirrashed F, Sharp JC, Krause V, et al. Pilot study of dermal and subcutaneous fat structures by MRI in individuals who differ in gender, BMI, and cellulite grading. Skin Res Technol. 2004;10:161-168.
- Khan M, Victor F, Rao B, et al. Treatment of cellulite, part II. advances and controversies. J Am Acad Dermatol. 2010;62:373-384.
- Collis N, Elliot L, Sharp C, et al. Cellulite treatment: a myth or reality: a prospective randomized, controlled trial of two therapies, endermologie and aminophylline cream. Plast Reconstr Surg. 1999;104:1110-1114.
- Adcock D, Paulsen S, Jabour K, et al. Analysis of the effects of deep mechanical massage in the porcine model. Plast Reconstr Surg. 2000;108:233-240.
- Güleç AT. Treatment of cellulite with LPG endermologie. Int J Dermatol. 2009;48:265-270.
- Piérard-Franchimont C, Piérard GE, Henry F, et al. A randomized, placebo-controlled trial of tropical retinol in the treatment of cellulite. Am J Clin Dermatol. 2000;1:369-374.
- Coleman WP. Liposuction. In: Coleman WP, Hanke CW, Alt TH, eds. Cosmetic Surgery of the Skin: Principles and Practice. Philadelphia, PA: BC Decker; 1991:213-238.
- ASPS guiding principles for mesotherapy/injection lipolysis. American Society of Plastic Surgeons website. http://www.plasticsurgery.org/Documents/medical-professionals/health-policy/guiding-principles/ASPS-Guiding-Principles-for-Mesotherapy-Injection-Lipolysis-7-08.pdf. Published July 2008. Accessed February 17, 2016.
- Kulick MI. Evaluation of a noninvasive, dual-wavelength laser-suction and massage device for the regional treatment of cellulite. Plast Reconstr Surg. 2010;125:1788-1796.
- Nootheti PK, Magpantay A, Yosowitz G, et al. A single center, randomized, comparative, prospective clinical study to determine the efficacy of the VelaSmooth system versus the TriActive system for the treatment of cellulite. Lasers Surg Med. 2006;38:908-912.
- DiBernardo BE. Treatment of cellulite using a 1440-nm pulsed laser with one-year follow up. Aesthet Surg J. 2011;31:328-341.
- Johannes L. New laser aims to zap cellulite at the source. Wall Street Journal. July 3, 2012. http://www.wsj.com/articles/SB10001424052702303649504577496981754619546. Accessed November 21, 2016.
- Burns AJ. Commentary on: treatment of cellulite using a 1440-nm pulsed laser with one-year follow up: preliminary report. Aesthet Surg J. 2011;31:342-343.
- Teitelbaum SA, Burns JL, Kubota J, et al. Noninvasive body contouring by focused ultrasound: safety efficacy of the contour I device in a multicenter, controlled, clinical study. Plast Reconstr Surg. 2007;120:779-789.
- Brown SA, Greenbaum L, Shtukmaster S, et al. Characterization of nonthermal focused ultrasound for noninvasive selective fat cell disruption (lysis): technical and preclinical assessment. Plast Reconstr Surg. 2009;124:92-101.
- Angehrn F, Kuhn C, Voss A. Can cellulite be treated with low energy extracorporeal shock wave therapy? Clin Interv Aging. 2007;2:623-630.
- Christ C, Brenke R, Sattler G, et al. Improvement in skin elasticity in the treatment of cellulite and connective tissue weakness by means of extracorporeal pulse activation therapy. Aesthet Surg J. 2008;28:538-544.
- Bosco C, Colli R, Introini E, et al. Adaptive responses of human skeletal muscle to vibration exposure. Clin Physiol. 1999;19:183-187.
- Luo J, McNamara B, Moran K. The use of vibration training to enhance muscle strength and power. Sports Med. 2005;35:23-41.
- Annino G, Padua E, Castagna C, et al. Effect of whole body vibration training on lower limb performance in selected high-level ballet students. J Strength Cond Res. 2007;21:1072-1076.
- Verschueren SM, Roelants M, Delecluse C, et al. Effect of 6-month whole body vibration training on hip density, muscle strength, and postural control in postmenopausal women: a randomized controlled pilot study [published online December 22, 2003]. J Bone Miner Res. 2004;19:352-359.
Cellulite is a cosmetic problem, not a disease process. It affects 85% to 90% of all women worldwide and was described nearly 100 years ago.1 Causes may be genetic, hormonal, or vascular in nature and may be related to the septa configuration in the subdermal tissue. Fibrosis at the dermal-subcutaneous junction as well as decreased vascular and lymphatic circulation also may be causative factors.
Cellulite has a multifactorial etiology. Khan et al2 noted that there are specific classic patterns of cellulite that affect women exclusively. White women tend to have somewhat higher rates of cellulite than Asian women. The authors also stated that lifestyle factors such as high carbohydrate diets may lead to an increase in total body fat content, which enhances the appearance of cellulite.2
The subdermal anatomy affects the appearance of cellulite. Utilizing in vivo magnetic resonance imaging, Querleux et al3 showed that women with visible cellulite have dermal septa that are thinner and generally more perpendicular to the skin’s surface than women without cellulite. In women without cellulite, the orientation of the septa is more angled into a crisscross pattern. In women with a high percentage of perpendicular septa, the perpendicular septa allow for fat herniation with dimpling of the skin compared to the crisscross septa pattern.2 Other investigators have discussed the reduction of blood flow in specific areas of the body in women, particularly in cellulite-prone areas such as the buttocks and thighs, as another causative factor.2,4,5 Rossi and Vergnanini6 showed that the blood flow was 35% lower in affected cellulite regions than in nonaffected regions without cellulite, which can cause congestion of blood and lymphatic flow and increased subdermal pressure, thus increasing the appearance of cellulite.
Although there is some controversy regarding the effects of weight loss on the appearance of cellulite,2,7 it appears that the subdermal septa and morphology have more of an effect on the appearance of cellulite.2,3,8
Rossi and Vergnanini6 proposed a 4-grade system for evaluating the appearance of cellulite (grade I, no cellulite; grade II, skin that is smooth and without any pronounced dimpling upon standing or lying down but may show some dimpling upon pinching and strong muscle contraction; grade III, cellulite is present in upright positions but not when the patient is in a supine position; grade IV, cellulite can be seen when the patient is standing and in a supine position). Both grades III and IV can be exacerbated by maximal voluntary contraction and strong pinching of the skin because these actions cause the subcutaneous fat to move toward the surface of the skin between the septa. This grading system aligns with categories I through III described by Mirrashed et al.9
There are many cellulite treatments available but few actually create a reduction in the visible appearance of cellulite. A number of these treatments were reviewed by Khan et al,10 including massage; a noninvasive suction-assisted massage technique; and topical agents such as xanthine, retinols, and other botanicals.4,11-14 Liposuction has not been shown to be effective in the treatment of cellulite and in fact may increase the appearance of cellulite.9,15 Mesotherapy, a modality that entails injecting substances into the subcutaneous fat layer, is another treatment of cellulite. Two of the most common agents purported to dissolve fat include phosphatidylcholine and sodium deoxycholate. The efficacy and safety of mesotherapy remains controversial and unproven. A July 2008 position statement from the American Society of Plastic Surgeons stated that “low levels of validity and quality of the literature does not allow [American Society of Plastic Surgeons] to support a recommendation for the use of mesotherapy/injection lipolysis for fat reduction.”16 Other modalities such as noninvasive dual-wavelength laser/suction devices; low-energy diode laser, contact cooling, suction, and massage devices; and infrared, bipolar radiofrequency, and suction with mechanical massage devices are available and show some small improvements in the visible appearance of cellulite, but no rating scales were used in any of these studies.17,18 DiBernardo19 utilized a 1440-nm pulsed laser to treat cellulite. It is an invasive treatment that works by breaking down some of the connective tissue septa responsible for the majority and greater severity of the dermal dimpling seen in cellulite, increasing the thickness of the dermis as well as its elasticity, reducing subcutaneous fat, and improving circulation and reducing general lymphatic congestion.19 The system showed promise but was an invasive treatment, and one session could cost $5000 to $7000 for bilateral areas and another $2500 for each additional area.20 Burns21 expressed that the short-term results showed promise in reducing the appearance of cellulite. Noninvasive ultrasound22,23 as well as extracorporeal shock wave therapy24,25 also has shown some improvement in the firmness of collagen but generally not in the appearance of cellulite.
We sought to evaluate the efficacy and safety of a noninvasive mechanical treatment of cellulite.
Methods
This study was conducted in accordance with the guidelines set forth by the US Department of Health and Human Services’ Policy for Protection of Human Research Subjects and the World Medical Association’s Declaration of Helsinki. Participants were recruited through local area medical facilities in southeastern Michigan. Written informed consent was obtained from all participants prior to beginning the study.
Patients with grades II to IV cellulite, according to the Rossi and Vergnanini6 grading system, were allowed to participate. All participants in the study were asked not to make lifestyle changes (eg, exercise habits, diet) or use any other treatments for cellulite that might be available to them during the study period. Exclusion criteria included history of deep vein thrombosis, cancer diagnosed within the last year, pregnancy, hemophilia, severe lymphedema, presence of a pacemaker, epilepsy, seizure disorder, or current use of anticoagulants. History of partial or total joint replacements, acute hernia, nonunited fractures, advanced arthritis, or detached retina also excluded participation in the study.
Participants completed an 8-week, twice-weekly treatment protocol with a noninvasive mechanical device performed in clinic. The device consisted of a 10.16-cm belt with a layer of nonslip material wrapped around the belt. The belt was attached to a mechanical oscillator. We adjusted the stroke length to approximately 2 cm and moved the dermis at that length at approximately 1000 strokes per minute.
Each participant was treated for a total treatment time of 18 to 24 minutes. The total treatment area included the top of the iliac crest to just above the top of the popliteal space. The width of the belt (10.16 cm) was equal to 1 individual treatment area. Each individual treatment area was treated for 2 minutes. First the buttocks and bilateral thighs were treated, followed by the right lateral thigh and the left lateral thigh. The belt was moved progressively down the total treatment area until all individual treatment areas were addressed. The average participant had 3 to 4 bilateral thigh and buttocks treatment areas and 3 to 4 lateral treatment areas on both the left and right sides of the body.
Digital photographs were taken with standardized lighting for all participants. Photographs were taken before the first treatment on the lateral and posterior aspects of the participant and were taken again at the end of the treatment program immediately before the last treatment. Participants were asked to contract the gluteal musculature for all photographs.
Two board-certified plastic surgeons were asked to rate the before/after photographs in a blinded manner. They graded each photograph on a rating scale of 0 to 10 (0=no cellulite; 10=worst possible cellulite). These data were analyzed using a Wilcoxon signed rank test. These data were compared to the participants self-evaluation of the appearance of cellulite in the photographs from the initial and final treatments using a rating scale of 0 to 10 (0=no cellulite; 10=worst possible cellulite).
The circumference of the widest part of the gluteal area was measured before and after treatment (+/–0.5 cm). The data were analyzed using a paired t test.
Results
The study included 43 participants (age range, 21–67 years; mean age, 37.6 years; weight range, 51–97 kg; mean weight, 64.95 kg) who resided in the Midwestern United States, were interested in reducing their cellulite, and were willing to commit to treatment 2 times weekly for the duration of the 8-week study. Fourteen percent (6/43) of participants were smokers. Participant self-assessments were divided into 3 categories based on the Rossi and Vergnanini6 grading system: category II, n=7; category III, n=12; and category IV, n=24. Although all the categories in our analysis showed statistically significant improvements, we found that there was more improvement in category II participants versus category III, and then again more improvement in category III versus category IV. The data for each treatment were analyzed separately using a paired t test, as we were not interested in comparing categories, only the effect of the treatment. We were testing to see if the difference was greater than 0, and the paired t values were statistically significant in all cases (category II, P=.003; category III, P=.001; category IV, P=.002)(Figure 1).
Using a correlation analysis, we found that age, body weight, or body mass index were not significantly correlated with the difference between the before and after physician rating. The difference between before and after treatment also was independent of whether or not the participant exercised or had an adverse reaction to the belt. Adverse reactions to the belt were characterized by redness and/or minor raising of the skin immediately following the treatment. These reactions all dissipated within 12 hours. It also appeared that the rating scales correlated well with the participants self-perception of their cellulite and the improvements seen in the photographs (Figures 2 and 3).
The mean circumference of the widest part of the gluteal area before treatment was 100.2 cm and the standard deviation was 8.14 cm. The mean circumference after treatment was 98.3 cm and the standard deviation was 8.02 (t=–2.81; P<.05). Many of the women commented that they felt more “toned,” which probably accounted for the slight difference in circumference rather than weight loss.
Of the 2 blinded board-certified plastic surgeons, one physician rated all participants in category III as significantly improved (P<.05) and rated the other categories as marginally insignificantly improved; the second physician rated all categories as marginally insignificantly improved.
Comment
Although there are a large number of treatment protocols that have been introduced and studied for the reduction of the appearance of cellulite,4,9,11-18 many have not shown promising long-term results. Some treatments have shown improvement in the firmness of collagen and the dermis but not in the appearance of cellulite.22-25 One of the only treatments that has shown some promise is an expensive invasive treatment.20
The system used in this study was shown to be safe in all study participants. No significant adverse reactions were noted, and each participant successfully completed the protocol. Figures 2 and 3 show the strong correlation between the treatment and the reduction in the visible appearance of cellulite in this study population, which was supported by statistical analysis, particularly the participant self-reported ratings. The participants and the blinded physicians were not in agreement on the improvement of cellulite. Although the participants knew the changes that occurred to their bodies, the physicians only had photographs from which to make their decisions. The participants clearly observed noticeable differences to their bodies, while the physicians either saw no change or some improvement.
The physicians were asked to evaluate only the cellulite, but the process we employed changed more than the cellulite. The first step in the process was a toning of the legs and buttocks, which was readily observable by the patients but was outside the scope of the physicians’ assessment. After the body toning, the cellulite began to improve. It is possible that the participants were responding to the entire process, which clearly was positive, while the physicians were responding only to the cellulite end point.
Our treatment regimen accomplished reduction of the visible appearance of cellulite by breaking down connective tissue septa as well as increasing the thickness of the dermis and its elasticity. It also helped reduce subcutaneous fat, improve circulation, and reduce general lymphatic congestion. The parallel motions of the unit could be adjusted, but we kept them at a mid-level range of motion. The motion at this frequency would have a tendency to not only heat the epidermis and dermal layer that we were attempting to affect but would also help accomplish breaking down the septa and improving the elasticity of the dermis. Also, the rapid motion over a period of time of pulling the dermis parallel to the subdermal tissue and fascia most likely helped improve the circulation and lymphatic flow in treated areas as well as possibly broke down the subcutaneous fat. All of these factors appear to have led to an improvement in the appearance of cellulite in our study participants.
A maintenance-type program, if continued, would likely demonstrate improved results by further breaking down the septa and improving the other factors that reduce the appearance of cellulite. We believe that the participants would eventually be able to discontinue the use of the unit or reduce its use substantially once the desired results were obtained.
When utilizing the device, the participants were in a standing posture and leaning into the belt with a moderate force, which seemed to secondarily improve the tone of the gluteal and thigh musculature that was being treated. It may be that the oscillatory motion and the standing posture caused the muscles to isometrically co-contract, adding a secondary exerciselike effect.26-29
Proving our suggested mechanisms of action would require tissue biopsies and/or magnetic resonance imaging studies that were beyond the scope of this study. However, regardless of the mechanism of action, we do believe that this treatment has been shown to be effective, convenient, and most importantly safe.
Conclusion
The unique device that was utilized in our study is a safe and cost-effective method of reducing the appearance of cellulite for home use and would allow for a noninvasive, low-risk procedure.
- Scherwitz C, Braun-Falco O. So-called cellulite. J Dermatol Surg Oncol. 1978;4:230-234.
- Khan MH, Victor F, Rao B, et al. Treatment of cellulite: part I. pathophysiology. J Am Acad Dermatol. 2010;62:361-370, quiz 371-372.
- Querleux B, Cornillon C, Jolivet O, et al. Anatomy and physiology of subcutaneous adipose tissue by in vivo magnetic resonance imaging and spectroscopy: relationships with sex and presence of cellulite. Skin Res Technol. 2002;8:118-124.
- Rawlings A. Cellulite and its treatment. Int J Cos Sci. 2006;28:175-190.
- Rosenbaum M, Prieto V, Hellmer J, et al. An exploratory investigation of the morphology and biochemistry of cellulite. Plast Reconstr Surg. 1998;101:1934-1939.
- Rossi AB, Vergnanini AL. Cellulite: a review. J Eur Acad Dermatol Venereol. 2000;14:251-262.
- Smalls LK, Hicks M, Passeretti D, et al. Effect of weight loss on cellulite: gynoid lypodystrophy. Plast Reconstr Surg. 2006;118:510-516.
- Nürnberger F, Müller G. So-called cellulite: an invented disease. J Dermatol Surg Oncol. 1978;4:221-229.
- Mirrashed F, Sharp JC, Krause V, et al. Pilot study of dermal and subcutaneous fat structures by MRI in individuals who differ in gender, BMI, and cellulite grading. Skin Res Technol. 2004;10:161-168.
- Khan M, Victor F, Rao B, et al. Treatment of cellulite, part II. advances and controversies. J Am Acad Dermatol. 2010;62:373-384.
- Collis N, Elliot L, Sharp C, et al. Cellulite treatment: a myth or reality: a prospective randomized, controlled trial of two therapies, endermologie and aminophylline cream. Plast Reconstr Surg. 1999;104:1110-1114.
- Adcock D, Paulsen S, Jabour K, et al. Analysis of the effects of deep mechanical massage in the porcine model. Plast Reconstr Surg. 2000;108:233-240.
- Güleç AT. Treatment of cellulite with LPG endermologie. Int J Dermatol. 2009;48:265-270.
- Piérard-Franchimont C, Piérard GE, Henry F, et al. A randomized, placebo-controlled trial of tropical retinol in the treatment of cellulite. Am J Clin Dermatol. 2000;1:369-374.
- Coleman WP. Liposuction. In: Coleman WP, Hanke CW, Alt TH, eds. Cosmetic Surgery of the Skin: Principles and Practice. Philadelphia, PA: BC Decker; 1991:213-238.
- ASPS guiding principles for mesotherapy/injection lipolysis. American Society of Plastic Surgeons website. http://www.plasticsurgery.org/Documents/medical-professionals/health-policy/guiding-principles/ASPS-Guiding-Principles-for-Mesotherapy-Injection-Lipolysis-7-08.pdf. Published July 2008. Accessed February 17, 2016.
- Kulick MI. Evaluation of a noninvasive, dual-wavelength laser-suction and massage device for the regional treatment of cellulite. Plast Reconstr Surg. 2010;125:1788-1796.
- Nootheti PK, Magpantay A, Yosowitz G, et al. A single center, randomized, comparative, prospective clinical study to determine the efficacy of the VelaSmooth system versus the TriActive system for the treatment of cellulite. Lasers Surg Med. 2006;38:908-912.
- DiBernardo BE. Treatment of cellulite using a 1440-nm pulsed laser with one-year follow up. Aesthet Surg J. 2011;31:328-341.
- Johannes L. New laser aims to zap cellulite at the source. Wall Street Journal. July 3, 2012. http://www.wsj.com/articles/SB10001424052702303649504577496981754619546. Accessed November 21, 2016.
- Burns AJ. Commentary on: treatment of cellulite using a 1440-nm pulsed laser with one-year follow up: preliminary report. Aesthet Surg J. 2011;31:342-343.
- Teitelbaum SA, Burns JL, Kubota J, et al. Noninvasive body contouring by focused ultrasound: safety efficacy of the contour I device in a multicenter, controlled, clinical study. Plast Reconstr Surg. 2007;120:779-789.
- Brown SA, Greenbaum L, Shtukmaster S, et al. Characterization of nonthermal focused ultrasound for noninvasive selective fat cell disruption (lysis): technical and preclinical assessment. Plast Reconstr Surg. 2009;124:92-101.
- Angehrn F, Kuhn C, Voss A. Can cellulite be treated with low energy extracorporeal shock wave therapy? Clin Interv Aging. 2007;2:623-630.
- Christ C, Brenke R, Sattler G, et al. Improvement in skin elasticity in the treatment of cellulite and connective tissue weakness by means of extracorporeal pulse activation therapy. Aesthet Surg J. 2008;28:538-544.
- Bosco C, Colli R, Introini E, et al. Adaptive responses of human skeletal muscle to vibration exposure. Clin Physiol. 1999;19:183-187.
- Luo J, McNamara B, Moran K. The use of vibration training to enhance muscle strength and power. Sports Med. 2005;35:23-41.
- Annino G, Padua E, Castagna C, et al. Effect of whole body vibration training on lower limb performance in selected high-level ballet students. J Strength Cond Res. 2007;21:1072-1076.
- Verschueren SM, Roelants M, Delecluse C, et al. Effect of 6-month whole body vibration training on hip density, muscle strength, and postural control in postmenopausal women: a randomized controlled pilot study [published online December 22, 2003]. J Bone Miner Res. 2004;19:352-359.
Practice Points
- Several cellulite treatments have shown improvement in the firmness of collagen and the dermis but not in the appearance of cellulite.
- The noninvasive mechanical treatment for women with cellulite evaluated in this study showed a strong correlation between the treatment and the reduction in the visible appearance of cellulite in this study population.
Comparing Cost, Efficacy, and Safety of Intravenous and Topical Tranexamic Acid in Total Hip and Knee Arthroplasty
Total hip arthroplasty (THA) and total knee arthroplasty (TKA) can be associated with significant blood loss that in some cases requires transfusion. The incidence of transfusion ranges from 16% to 37% in patients who undergo THA and from 11% to 21% in patients who undergo TKA.1-3 Allogeneic blood transfusions have been associated with several risks (transfusion-related acute lung injury, hemolytic reactions, immunologic reactions, fluid overload, renal failure, infections), increased cost, and longer hospital length of stay (LOS).4-7 With improved patient outcomes the ultimate goal, blood-conserving strategies designed to decrease blood loss and transfusions have been adopted as a standard in successful joint replacement programs.
Tranexamic acid (TXA), an antifibrinolytic agent, has become a major component of blood conservation management after THA and TKA. TXA stabilizes clots at the surgical site by inhibiting plasminogen activation and thereby blocking fibrinolysis.8 The literature supports intravenous (IV) TXA as effective in significantly reducing blood loss and transfusion rates in elective THA and TKA.9,10 However, data on increased risk of thrombotic events with IV TXA in both THA and TKA are conflicting.11,12 Topical TXA is thought to have an advantage over IV TXA in that it provides a higher concentration of drug at the surgical site and is associated with little systemic absorption.2,13Recent prospective randomized studies have compared the efficacy and safety of IV and topical TXA in THA and TKA.9,14 However, controversy remains because relatively few studies have compared these 2 routes of administration. In addition, healthcare–associated costs have come under increased scrutiny, and the cost of these treatments should be considered. More research is needed to determine which application is most efficacious and cost-conscious and poses the least risk to patients. Therefore, we conducted a study to compare the cost, efficacy, and safety of IV and topical TXA in primary THA and TKA.
Materials and Methods
Our Institutional Review Board approved this study. Patients who were age 18 years or older, underwent primary THA or TKA, and received IV or topical TXA between August 2013 and September 2014 were considered eligible for the study. For both groups, exclusion criteria were trauma service admission, TXA hypersensitivity, pregnancy, and concomitant use of IV and topical TXA.
We collected demographic data (age, sex, weight, height, body mass index), noted all transfusions of packed red blood cells, and recorded preoperative and postoperative hemoglobin (Hgb) levels and surgical drain outputs. We also recorded any complications that occurred within 90 days after surgery: deep vein thrombosis (DVT), pulmonary embolism (PE), cardiac events, cerebrovascular events, and wound drainage. Wound drainage was defined as readmission to hospital or return to operating room for wound drainage caused by infection or hematoma. Postoperative care (disposition, LOS, follow-up) was documented. Average cost of both IV and topical TXA administration was calculated using average wholesale price.
Use of IV TXA and use of topical TXA were compared in both THA and TKA. Patients in the IV TXA group received TXA in two 10-mg/kg doses with a maximum of 1 g per dose. The first IV dose was given before the incision, and the second was given 3 hours after the first. Patients in the topical TXA group underwent direct irrigation with 3 g of TXA in 100 mL of normal saline at the surgical site after closure of the deep fascia in THA and after closure of the knee arthrotomy in TKA. The drain remained occluded for 30 minutes after surgery. The wound was irrigated with topical TXA before wound closure in the THA group and before tourniquet release in the TKA group. TXA dosing was based on institutional formulary dosing restrictions and was consistent with best practices and current literature.3,9,14,15Primary outcomes measured for each cohort and treatment arm were Hgb levels (difference between preoperative levels and lowest postoperative levels 24 hours after surgery), blood loss, transfusion rates, and cost. Secondary outcomes were LOS and complications that occurred within 90 days after surgery (DVT, PE, cardiac events, cerebrovascular events, wound drainage).
Calculated blood loss was determined with equations described by Konig and colleagues,3 Good and colleagues,16 and Nadler and colleagues.17 Total calculated blood loss was based on the difference in Hgb levels before surgery and the lowest Hgb levels 24 hours after surgery:
Blood loss (mL) = 100 mL/dL × Hgbloss/Hgbi
Hgbloss = BV × (Hgbi – Hgbe) × 10 dL/L + Hgbt
= 0.3669 × Height3 (m) + 0.03219 × Weight (kg) + 0.6041 (for men)
= 0.3561 × Height3 (m) + 0.03308 × Weight (kg) + 0.1833 (for women)
where Hgbi is the Hgb concentration (g/dL) before surgery, Hgbe is the lowest Hgb concentration (g/dL) 24 hours after surgery, Hgbt is the total amount (g) of allogeneic Hgb transfused, and BV is the estimated total body blood volume (L).17 As Hgb concentrations after blood transfusions were compared in this study, the Hgbt variable was removed from the equation. Based on Hgb decrease data in a study that compared IV and topical TXA in TKA,14 we determined that a sample size of least 140 patients (70 in each cohort) was needed in order to have 80% power to detect a difference in Hgb decrease of 0.36 g/dL in IV and topical TXA.
All data were reported with descriptive statistics. Frequencies and percentages were reported for categorical variables. Means and standard deviations were reported for continuous variables. The groups of continuous data were compared with unpaired Student t tests and 1-way analysis of variance. Comparisons among groups of categorical data were analyzed with Fisher exact tests. Statistical significance was set at P < .05.
Results
Data were collected on 291 patients (156 THA, 135 TKA). There was a significant (P = .044) sex difference in the THA group: more men in the topical TXA subgroup and more women in the IV TXA subgroup. Other patient demographics were similarly matched with respect to age, height, weight, and body mass index (Table 1). 

The secondary outcomes (differences in complications and LOS) are listed in Table 3. 
Discussion
TXA, an analog of the amino acid lysine, is an antifibrinolytic agent that has been used for many years to inhibit fibrin degradation.3,18 TXA works by competitively inhibiting tissue plasminogen activation, which is elevated by the trauma of surgery, and blocking plasmin binding to fibrin.3,19 The mechanism of action is not procoagulant, as TXA prevents fibrin breakdown and supports coagulation that is underway rather than increasing clot formation. These characteristics make the drug attractive for orthopedic joint surgery—TXA reduces postoperative blood loss in patients who need fibrinolysis suppressed in order to maintain homeostasis without increasing the risk of venous thromboembolism. IV TXA has been well studied, which supports its efficacy profile for reducing blood loss and transfusions; there are no reports of increased risk of thromboembolic events.20-22 Despite these studies, the risk of adverse events is still a major concern, especially in patients with medical conditions that predispose them to venothrombotic events. Topical TXA has become a viable option, especially in high-risk patients, as studies have shown 70% lower systemic absorption relative to IV TXA plasma concentration.23 Still, too few studies have compared the efficacy, safety, and cost of IV and topical TXA in both THA and TKA.
Topical TXA costs an average of $2100 per case, primarily because standard dosing is 3 g per case. Despite repeat dosing for IV TXA (first dose at incision, second dose 3 hours after first), IV TXA costs were much lower on average: $939 less for THA and $829 less for TKA. As numerous studies have outlined results similar to ours, cost-effectiveness should be considered in decisions about treatment options.
Patel and colleagues14 reported that the efficacy of topical TXA was similar to that of IV TXA and that there were no significant differences in Hgb decrease, wound drainage, or need for transfusions after TKA. Their report conflicts with our finding significant differences favoring topical TXA for Hgb change (P = .015) and reduced calculated blood loss (P = .019) in TKA. A potential reason for these differing results is that the topical TXA doses were different (2 g in the study by Patel and colleagues,14 3 g in our study). Martin and colleagues24 compared the effects of topical TXA and placebo and found a nonsignificant difference in reduced blood loss and postoperative transfusions when the drug was dosed at 2 g. Konig and colleagues3 found that topical TXA dosed at 3 g (vs placebo) could reduce blood loss and transfusions after THA and TKA. These studies support our 3-g dose protocol for topical TXA rather than the 2-g protocol used in the study by Patel and colleagues.14 Our results are congruent with those of Seo and colleagues,25 who found topical TXA superior in decreasing blood loss in TKA. Furthermore, our study is unique in that it compared costs and found topical TXA to be more expensive by almost $1000 on average.
Wei and Wei9 concluded that IV TXA 3 g and topical TXA 3 g were equally effective in reducing total blood loss, change in hematocrit, and need for transfusion after THA. In contrast, we found a significant (P = .031) difference favoring topical TXA for Hgb change. The 2 studies differed in their dosing protocols: Wei and Wei9 infused a 3-g dose, whereas we gave a maximum of two 1-g IV doses. The higher IV dose used by Wei and Wei9 could explain why they found no difference between IV and topical TXA, whereas we did find a difference. Our study was unique in that it measured Hgb change, blood loss, and cost.
Our study included an in-depth analysis of blood loss: estimated blood loss, drain outputs, calculated blood loss, and Hgb change. The equation we used for calculated blood loss is well established and has been used in multiple studies.3,16,17 To thoroughly assess the safety of TXA, we reviewed and documented complications that occurred within 90 days after surgery and that could be attributed to TXA. This study was adequately powered and exceeded the required sample size to detect a difference in one primary outcome measure, perioperative Hgb change, as calculated by the prestudy statistical power analysis.
Our study had several limitations. First, it was a retrospective chart review; documentation could have been incomplete or missing. Second, the study was not randomized and thus subject to drug selection bias. Third, patients were selected for topical TXA on the basis of perceived risk factors, such as prior or family history of DVT, PE, cardiac events, or cerebrovascular events. It was thought that, given the decrease in systemic absorption with topical TXA, these high-risk patients would be less likely to have a thromboembolic event. Their complex past medical histories may explain why the topical TXA group had more cardiac events. Furthermore, 1 orthopedic surgeon used topical TXA exclusively, and the other 3 used it selectively, according to risk factors. In addition, unlike TKA patients, not all THA patients received drains. This study was powered to measure a difference in perioperative Hgb change but may not have been powered to detect the statistically significant difference favoring topical TXA for calculated blood loss in TKA. In the THA group, a statistically significant difference was found for reduced Hgb decrease but not for estimated or calculated blood loss. This finding reinforces some of the disparities in measurements of the effects of blood conservation strategies. The study also lacked a placebo or control group. However, several other studies have found that both IV TXA and topical TXA are superior to placebo in decreasing blood loss, Hgb change, and transfusion requirements.10,12,20,22 In addition, the effects of TXA are based on estimates of blood conservation and are not without their disparities.
Conclusion
The present study found that both IV TXA and topical TXA were effective in decreasing blood loss, Hgb levels, and need for transfusion after THA and TKA. Topical TXA appears to be more effective than IV TXA in preventing Hgb decrease during THA and TKA and calculated blood loss during TKA. This increased efficacy comes with a higher cost. Thromboembolic complications were similar between groups. More studies are needed to compare the efficacy and safety profiles of topical TXA against the routine standard of IV TXA, especially in patients with perceived contraindications to IV TXA.
Am J Orthop. 2016;45(7):E439-E443. Copyright Frontline Medical Communications Inc. 2016. All rights reserved.
1. Bierbaum BE, Callaghan JJ, Galante JO, Rubash HE, Tooms RE, Welch RB. An analysis of blood management in patients having a total hip or knee arthroplasty. J Bone Joint Surg Am. 1999;81(1):2-10.
2. Yue C, Kang P, Yang P, Xie J, Pei F. Topical application of tranexamic acid in primary total hip arthroplasty: a randomized double-blind controlled trial. J Arthroplasty. 2014;29(12):2452-2456.
3. Konig G, Hamlin BR, Waters JH. Topical tranexamic acid reduces blood loss and transfusion rates in total hip and total knee arthroplasty. J Arthroplasty. 2013;28(9):1473-1476.
4. Stokes ME, Ye X, Shah M, et al. Impact of bleeding-related complications and/or blood product transfusions on hospital costs in inpatient surgical patients. BMC Health Serv Res. 2011;11:135.
5. Lemos MJ, Healy WL. Blood transfusion in orthopaedic operations. J Bone Joint Surg Am. 1996;78(8):1260-1270.
6. Vamvakas EC, Blajchman MA. Transfusion-related mortality: the ongoing risks of allogeneic blood transfusion and the available strategies for their prevention. Blood. 2009;113(15):3406-3417.
7. Kumar A. Perioperative management of anemia: limits of blood transfusion and alternatives to it. Cleve Clin J Med. 2009;76(suppl 4):S112-S118.
8. Hoylaerts M, Lijnen HR, Collen D. Studies on the mechanism of the antifibrinolytic action of tranexamic acid. Biochim Biophys Acta. 1981;673(1):75-85.
9. Wei W, Wei B. Comparison of topical and intravenous tranexamic acid on blood loss and transfusion rates in total hip arthroplasty. J Arthroplasty. 2014;29(11):2113-2116.
10. Zhang H, Chen J, Chen F, Que W. The effect of tranexamic acid on blood loss and use of blood products in total knee arthroplasty: a meta-analysis. Knee Surg Sports Traumatol Arthrosc. 2012;20(9):1742-1752.
11. Ido K, Neo M, Asada Y, et al. Reduction of blood loss using tranexamic acid in total knee and hip arthroplasties. Arch Orthop Trauma Surg. 2000;120(9):518-520.
12. Yang ZG, Chen WP, Wu LD. Effectiveness and safety of tranexamic acid in reducing blood loss in total knee arthroplasty: a meta-analysis. J Bone Joint Surg Am. 2012;94(13):1153-1159.
13. Alshryda S, Mason J, Sarda P, et al. Topical (intra-articular) tranexamic acid reduces blood loss and transfusion rates following total hip replacement: a randomized controlled trial (TRANX-H). J Bone Joint Surg Am. 2013;95(21):1969-1974.
14. Patel JN, Spanyer JM, Smith LS, Huang J, Yakkanti MR, Malkani AL. Comparison of intravenous versus topical tranexamic acid in total knee arthroplasty: a prospective randomized study. J Arthroplasty. 2014;29(8):1528-1531.
15. Alshryda S, Sarda P, Sukeik M, Nargol A, Blenkinsopp J, Mason JM. Tranexamic in total knee replacement: a systematic review and meta-analysis. J Bone Joint Surg Br. 2011;93(12):1577-1585.
16. Good L, Peterson E, Lisander B. Tranexamic acid decreases external blood loss but not hidden blood loss in total knee replacement. Br J Anaesth. 2003;90(5):596-599.
17. Nadler SB, Hidalgo JH, Bloch T. Prediction of blood volume in normal human adults. Surgery. 1962;51(2):224-232.
18. Eubanks JD. Antifibrinolytics in major orthopaedic surgery. J Am Acad Orthop Surg. 2010;18(3):132-138.
19. Mannucci PM. Homostatic drugs. N Engl J Med. 1998;339(4):245-253.
20. Wind TC, Barfield WR, Moskal JT. The effect of tranexamic acid on transfusion rate in primary total hip arthroplasty. J Arthroplasty. 2014;29(2):387-389.
21. Dahuja A, Dahuja G, Jaswal V, Sandhu K. A prospective study on role of tranexamic acid in reducing postoperative blood loss in total knee arthroplasty and its effect on coagulation profile. J Arthroplasty. 2014;29(4):733-735.
22. Tan J, Chen H, Liu Q, Chen C, Huang W. A meta-analysis of the effectiveness and safety of using tranexamic acid in primary unilateral total knee arthroplasty. J Surg Res. 2013;184(2):880-887.
23. Wong J, Abrishami A, El Beheiry H, et al. Topical application of tranexamic acid reduces postoperative blood loss in total knee arthroplasty: a randomized, controlled trial. J Bone Joint Surg Am. 2010;92(15):2503-2513.
24. Martin JG, Cassatt KB, Kincaid-Cinnamon KA, Westendorf DS, Garton AS, Lemke JH. Topical administration of tranexamic acid in primary total hip and total knee arthroplasty. J Arthroplasty. 2014;29(5):889-894.
25. Seo JG, Moon YW, Park SH, Kim SM, Ko KR. The comparative efficacies of intra-articular and IV tranexamic acid for reducing blood loss during total knee arthroplasty. Knee Surg Sports Traumatol Arthrosc. 2013;21(8):1869-1874.
Total hip arthroplasty (THA) and total knee arthroplasty (TKA) can be associated with significant blood loss that in some cases requires transfusion. The incidence of transfusion ranges from 16% to 37% in patients who undergo THA and from 11% to 21% in patients who undergo TKA.1-3 Allogeneic blood transfusions have been associated with several risks (transfusion-related acute lung injury, hemolytic reactions, immunologic reactions, fluid overload, renal failure, infections), increased cost, and longer hospital length of stay (LOS).4-7 With improved patient outcomes the ultimate goal, blood-conserving strategies designed to decrease blood loss and transfusions have been adopted as a standard in successful joint replacement programs.
Tranexamic acid (TXA), an antifibrinolytic agent, has become a major component of blood conservation management after THA and TKA. TXA stabilizes clots at the surgical site by inhibiting plasminogen activation and thereby blocking fibrinolysis.8 The literature supports intravenous (IV) TXA as effective in significantly reducing blood loss and transfusion rates in elective THA and TKA.9,10 However, data on increased risk of thrombotic events with IV TXA in both THA and TKA are conflicting.11,12 Topical TXA is thought to have an advantage over IV TXA in that it provides a higher concentration of drug at the surgical site and is associated with little systemic absorption.2,13Recent prospective randomized studies have compared the efficacy and safety of IV and topical TXA in THA and TKA.9,14 However, controversy remains because relatively few studies have compared these 2 routes of administration. In addition, healthcare–associated costs have come under increased scrutiny, and the cost of these treatments should be considered. More research is needed to determine which application is most efficacious and cost-conscious and poses the least risk to patients. Therefore, we conducted a study to compare the cost, efficacy, and safety of IV and topical TXA in primary THA and TKA.
Materials and Methods
Our Institutional Review Board approved this study. Patients who were age 18 years or older, underwent primary THA or TKA, and received IV or topical TXA between August 2013 and September 2014 were considered eligible for the study. For both groups, exclusion criteria were trauma service admission, TXA hypersensitivity, pregnancy, and concomitant use of IV and topical TXA.
We collected demographic data (age, sex, weight, height, body mass index), noted all transfusions of packed red blood cells, and recorded preoperative and postoperative hemoglobin (Hgb) levels and surgical drain outputs. We also recorded any complications that occurred within 90 days after surgery: deep vein thrombosis (DVT), pulmonary embolism (PE), cardiac events, cerebrovascular events, and wound drainage. Wound drainage was defined as readmission to hospital or return to operating room for wound drainage caused by infection or hematoma. Postoperative care (disposition, LOS, follow-up) was documented. Average cost of both IV and topical TXA administration was calculated using average wholesale price.
Use of IV TXA and use of topical TXA were compared in both THA and TKA. Patients in the IV TXA group received TXA in two 10-mg/kg doses with a maximum of 1 g per dose. The first IV dose was given before the incision, and the second was given 3 hours after the first. Patients in the topical TXA group underwent direct irrigation with 3 g of TXA in 100 mL of normal saline at the surgical site after closure of the deep fascia in THA and after closure of the knee arthrotomy in TKA. The drain remained occluded for 30 minutes after surgery. The wound was irrigated with topical TXA before wound closure in the THA group and before tourniquet release in the TKA group. TXA dosing was based on institutional formulary dosing restrictions and was consistent with best practices and current literature.3,9,14,15Primary outcomes measured for each cohort and treatment arm were Hgb levels (difference between preoperative levels and lowest postoperative levels 24 hours after surgery), blood loss, transfusion rates, and cost. Secondary outcomes were LOS and complications that occurred within 90 days after surgery (DVT, PE, cardiac events, cerebrovascular events, wound drainage).
Calculated blood loss was determined with equations described by Konig and colleagues,3 Good and colleagues,16 and Nadler and colleagues.17 Total calculated blood loss was based on the difference in Hgb levels before surgery and the lowest Hgb levels 24 hours after surgery:
Blood loss (mL) = 100 mL/dL × Hgbloss/Hgbi
Hgbloss = BV × (Hgbi – Hgbe) × 10 dL/L + Hgbt
= 0.3669 × Height3 (m) + 0.03219 × Weight (kg) + 0.6041 (for men)
= 0.3561 × Height3 (m) + 0.03308 × Weight (kg) + 0.1833 (for women)
where Hgbi is the Hgb concentration (g/dL) before surgery, Hgbe is the lowest Hgb concentration (g/dL) 24 hours after surgery, Hgbt is the total amount (g) of allogeneic Hgb transfused, and BV is the estimated total body blood volume (L).17 As Hgb concentrations after blood transfusions were compared in this study, the Hgbt variable was removed from the equation. Based on Hgb decrease data in a study that compared IV and topical TXA in TKA,14 we determined that a sample size of least 140 patients (70 in each cohort) was needed in order to have 80% power to detect a difference in Hgb decrease of 0.36 g/dL in IV and topical TXA.
All data were reported with descriptive statistics. Frequencies and percentages were reported for categorical variables. Means and standard deviations were reported for continuous variables. The groups of continuous data were compared with unpaired Student t tests and 1-way analysis of variance. Comparisons among groups of categorical data were analyzed with Fisher exact tests. Statistical significance was set at P < .05.
Results
Data were collected on 291 patients (156 THA, 135 TKA). There was a significant (P = .044) sex difference in the THA group: more men in the topical TXA subgroup and more women in the IV TXA subgroup. Other patient demographics were similarly matched with respect to age, height, weight, and body mass index (Table 1).
The secondary outcomes (differences in complications and LOS) are listed in Table 3.
Discussion
TXA, an analog of the amino acid lysine, is an antifibrinolytic agent that has been used for many years to inhibit fibrin degradation.3,18 TXA works by competitively inhibiting tissue plasminogen activation, which is elevated by the trauma of surgery, and blocking plasmin binding to fibrin.3,19 The mechanism of action is not procoagulant, as TXA prevents fibrin breakdown and supports coagulation that is underway rather than increasing clot formation. These characteristics make the drug attractive for orthopedic joint surgery—TXA reduces postoperative blood loss in patients who need fibrinolysis suppressed in order to maintain homeostasis without increasing the risk of venous thromboembolism. IV TXA has been well studied, which supports its efficacy profile for reducing blood loss and transfusions; there are no reports of increased risk of thromboembolic events.20-22 Despite these studies, the risk of adverse events is still a major concern, especially in patients with medical conditions that predispose them to venothrombotic events. Topical TXA has become a viable option, especially in high-risk patients, as studies have shown 70% lower systemic absorption relative to IV TXA plasma concentration.23 Still, too few studies have compared the efficacy, safety, and cost of IV and topical TXA in both THA and TKA.
Topical TXA costs an average of $2100 per case, primarily because standard dosing is 3 g per case. Despite repeat dosing for IV TXA (first dose at incision, second dose 3 hours after first), IV TXA costs were much lower on average: $939 less for THA and $829 less for TKA. As numerous studies have outlined results similar to ours, cost-effectiveness should be considered in decisions about treatment options.
Patel and colleagues14 reported that the efficacy of topical TXA was similar to that of IV TXA and that there were no significant differences in Hgb decrease, wound drainage, or need for transfusions after TKA. Their report conflicts with our finding significant differences favoring topical TXA for Hgb change (P = .015) and reduced calculated blood loss (P = .019) in TKA. A potential reason for these differing results is that the topical TXA doses were different (2 g in the study by Patel and colleagues,14 3 g in our study). Martin and colleagues24 compared the effects of topical TXA and placebo and found a nonsignificant difference in reduced blood loss and postoperative transfusions when the drug was dosed at 2 g. Konig and colleagues3 found that topical TXA dosed at 3 g (vs placebo) could reduce blood loss and transfusions after THA and TKA. These studies support our 3-g dose protocol for topical TXA rather than the 2-g protocol used in the study by Patel and colleagues.14 Our results are congruent with those of Seo and colleagues,25 who found topical TXA superior in decreasing blood loss in TKA. Furthermore, our study is unique in that it compared costs and found topical TXA to be more expensive by almost $1000 on average.
Wei and Wei9 concluded that IV TXA 3 g and topical TXA 3 g were equally effective in reducing total blood loss, change in hematocrit, and need for transfusion after THA. In contrast, we found a significant (P = .031) difference favoring topical TXA for Hgb change. The 2 studies differed in their dosing protocols: Wei and Wei9 infused a 3-g dose, whereas we gave a maximum of two 1-g IV doses. The higher IV dose used by Wei and Wei9 could explain why they found no difference between IV and topical TXA, whereas we did find a difference. Our study was unique in that it measured Hgb change, blood loss, and cost.
Our study included an in-depth analysis of blood loss: estimated blood loss, drain outputs, calculated blood loss, and Hgb change. The equation we used for calculated blood loss is well established and has been used in multiple studies.3,16,17 To thoroughly assess the safety of TXA, we reviewed and documented complications that occurred within 90 days after surgery and that could be attributed to TXA. This study was adequately powered and exceeded the required sample size to detect a difference in one primary outcome measure, perioperative Hgb change, as calculated by the prestudy statistical power analysis.
Our study had several limitations. First, it was a retrospective chart review; documentation could have been incomplete or missing. Second, the study was not randomized and thus subject to drug selection bias. Third, patients were selected for topical TXA on the basis of perceived risk factors, such as prior or family history of DVT, PE, cardiac events, or cerebrovascular events. It was thought that, given the decrease in systemic absorption with topical TXA, these high-risk patients would be less likely to have a thromboembolic event. Their complex past medical histories may explain why the topical TXA group had more cardiac events. Furthermore, 1 orthopedic surgeon used topical TXA exclusively, and the other 3 used it selectively, according to risk factors. In addition, unlike TKA patients, not all THA patients received drains. This study was powered to measure a difference in perioperative Hgb change but may not have been powered to detect the statistically significant difference favoring topical TXA for calculated blood loss in TKA. In the THA group, a statistically significant difference was found for reduced Hgb decrease but not for estimated or calculated blood loss. This finding reinforces some of the disparities in measurements of the effects of blood conservation strategies. The study also lacked a placebo or control group. However, several other studies have found that both IV TXA and topical TXA are superior to placebo in decreasing blood loss, Hgb change, and transfusion requirements.10,12,20,22 In addition, the effects of TXA are based on estimates of blood conservation and are not without their disparities.
Conclusion
The present study found that both IV TXA and topical TXA were effective in decreasing blood loss, Hgb levels, and need for transfusion after THA and TKA. Topical TXA appears to be more effective than IV TXA in preventing Hgb decrease during THA and TKA and calculated blood loss during TKA. This increased efficacy comes with a higher cost. Thromboembolic complications were similar between groups. More studies are needed to compare the efficacy and safety profiles of topical TXA against the routine standard of IV TXA, especially in patients with perceived contraindications to IV TXA.
Am J Orthop. 2016;45(7):E439-E443. Copyright Frontline Medical Communications Inc. 2016. All rights reserved.
1. Bierbaum BE, Callaghan JJ, Galante JO, Rubash HE, Tooms RE, Welch RB. An analysis of blood management in patients having a total hip or knee arthroplasty. J Bone Joint Surg Am. 1999;81(1):2-10.
2. Yue C, Kang P, Yang P, Xie J, Pei F. Topical application of tranexamic acid in primary total hip arthroplasty: a randomized double-blind controlled trial. J Arthroplasty. 2014;29(12):2452-2456.
3. Konig G, Hamlin BR, Waters JH. Topical tranexamic acid reduces blood loss and transfusion rates in total hip and total knee arthroplasty. J Arthroplasty. 2013;28(9):1473-1476.
4. Stokes ME, Ye X, Shah M, et al. Impact of bleeding-related complications and/or blood product transfusions on hospital costs in inpatient surgical patients. BMC Health Serv Res. 2011;11:135.
5. Lemos MJ, Healy WL. Blood transfusion in orthopaedic operations. J Bone Joint Surg Am. 1996;78(8):1260-1270.
6. Vamvakas EC, Blajchman MA. Transfusion-related mortality: the ongoing risks of allogeneic blood transfusion and the available strategies for their prevention. Blood. 2009;113(15):3406-3417.
7. Kumar A. Perioperative management of anemia: limits of blood transfusion and alternatives to it. Cleve Clin J Med. 2009;76(suppl 4):S112-S118.
8. Hoylaerts M, Lijnen HR, Collen D. Studies on the mechanism of the antifibrinolytic action of tranexamic acid. Biochim Biophys Acta. 1981;673(1):75-85.
9. Wei W, Wei B. Comparison of topical and intravenous tranexamic acid on blood loss and transfusion rates in total hip arthroplasty. J Arthroplasty. 2014;29(11):2113-2116.
10. Zhang H, Chen J, Chen F, Que W. The effect of tranexamic acid on blood loss and use of blood products in total knee arthroplasty: a meta-analysis. Knee Surg Sports Traumatol Arthrosc. 2012;20(9):1742-1752.
11. Ido K, Neo M, Asada Y, et al. Reduction of blood loss using tranexamic acid in total knee and hip arthroplasties. Arch Orthop Trauma Surg. 2000;120(9):518-520.
12. Yang ZG, Chen WP, Wu LD. Effectiveness and safety of tranexamic acid in reducing blood loss in total knee arthroplasty: a meta-analysis. J Bone Joint Surg Am. 2012;94(13):1153-1159.
13. Alshryda S, Mason J, Sarda P, et al. Topical (intra-articular) tranexamic acid reduces blood loss and transfusion rates following total hip replacement: a randomized controlled trial (TRANX-H). J Bone Joint Surg Am. 2013;95(21):1969-1974.
14. Patel JN, Spanyer JM, Smith LS, Huang J, Yakkanti MR, Malkani AL. Comparison of intravenous versus topical tranexamic acid in total knee arthroplasty: a prospective randomized study. J Arthroplasty. 2014;29(8):1528-1531.
15. Alshryda S, Sarda P, Sukeik M, Nargol A, Blenkinsopp J, Mason JM. Tranexamic in total knee replacement: a systematic review and meta-analysis. J Bone Joint Surg Br. 2011;93(12):1577-1585.
16. Good L, Peterson E, Lisander B. Tranexamic acid decreases external blood loss but not hidden blood loss in total knee replacement. Br J Anaesth. 2003;90(5):596-599.
17. Nadler SB, Hidalgo JH, Bloch T. Prediction of blood volume in normal human adults. Surgery. 1962;51(2):224-232.
18. Eubanks JD. Antifibrinolytics in major orthopaedic surgery. J Am Acad Orthop Surg. 2010;18(3):132-138.
19. Mannucci PM. Homostatic drugs. N Engl J Med. 1998;339(4):245-253.
20. Wind TC, Barfield WR, Moskal JT. The effect of tranexamic acid on transfusion rate in primary total hip arthroplasty. J Arthroplasty. 2014;29(2):387-389.
21. Dahuja A, Dahuja G, Jaswal V, Sandhu K. A prospective study on role of tranexamic acid in reducing postoperative blood loss in total knee arthroplasty and its effect on coagulation profile. J Arthroplasty. 2014;29(4):733-735.
22. Tan J, Chen H, Liu Q, Chen C, Huang W. A meta-analysis of the effectiveness and safety of using tranexamic acid in primary unilateral total knee arthroplasty. J Surg Res. 2013;184(2):880-887.
23. Wong J, Abrishami A, El Beheiry H, et al. Topical application of tranexamic acid reduces postoperative blood loss in total knee arthroplasty: a randomized, controlled trial. J Bone Joint Surg Am. 2010;92(15):2503-2513.
24. Martin JG, Cassatt KB, Kincaid-Cinnamon KA, Westendorf DS, Garton AS, Lemke JH. Topical administration of tranexamic acid in primary total hip and total knee arthroplasty. J Arthroplasty. 2014;29(5):889-894.
25. Seo JG, Moon YW, Park SH, Kim SM, Ko KR. The comparative efficacies of intra-articular and IV tranexamic acid for reducing blood loss during total knee arthroplasty. Knee Surg Sports Traumatol Arthrosc. 2013;21(8):1869-1874.
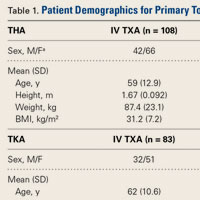
Robotic Technology Produces More Conservative Tibial Resection Than Conventional Techniques in UKA
Unicompartmental knee arthroplasty (UKA) is considered a less invasive approach for the treatment of unicompartmental knee arthritis when compared with total knee arthroplasty (TKA), with optimal preservation of kinematics.1 Despite excellent functional outcomes, conversion to TKA may be necessary if the UKA fails, or in patients with progressive knee arthritis. Some studies have found UKA conversion to TKA to be comparable with primary TKA,2,3 whereas others have found that conversion often requires bone graft, augments, and stemmed components and has increased complications and inferior results compared to primary TKA.4-7 While some studies report that <10% of UKA conversions to TKA require augments,2 others have found that as many as 76% require augments.4-8
Schwarzkopf and colleagues9 recently demonstrated that UKA conversion to TKA is comparable with primary TKA when a conservative tibial resection is performed during the index procedure. However, they reported increased complexity when greater tibial resection was performed and thicker polyethylene inserts were used at the time of the index UKA. The odds ratio of needing an augment or stem during the conversion to TKA was 26.8 (95% confidence interval, 3.71-194) when an aggressive tibial resection was performed during the UKA.9 Tibial resection thickness may thus be predictive of anticipated complexity of UKA revision to TKA and may aid in preoperative planning.
Robotic assistance has been shown to enhance the accuracy of bone preparation, implant component alignment, and soft tissue balance in UKA.10-15 It has yet to be determined whether this improved accuracy translates to improved clinical performance or longevity of the UKA implant. However, the enhanced accuracy of robotic technology may result in more conservative tibial resection when compared to conventional UKA and may be advantageous if conversion to TKA becomes necessary.
The purpose of this study was to compare the distribution of polyethylene insert sizes implanted during conventional and robotic-assisted UKA. We hypothesized that robotic assistance would demonstrate more conservative tibial resection compared to conventional methods of bone preparation.
Methods
We retrospectively compared the distribution of polyethylene insert sizes implanted during consecutive conventional and robotic-assisted UKA procedures. Several manufacturers were queried to provide a listing of the polyethylene insert sizes utilized, ranging from 8 mm to 14 mm. The analysis included 8421 robotic-assisted UKA cases and 27,989 conventional UKA cases. Data were provided by Zimmer Biomet and Smith & Nephew regarding conventional cases, as well as Blue Belt Technologies (now part of Smith & Nephew) and MAKO Surgical (now part of Stryker) regarding robotic-assisted cases. (Dr. Lonner has an ongoing relationship as a consultant with Blue Belt Technologies, whose data was utilized in this study.) Using tibial insert thickness as a surrogate measure of the extent of tibial resection, an insert size of ≥10 mm was defined as aggressive while <10 mm was considered conservative. This cutoff was established based on its corresponding resection level with primary TKA and the anticipated need for augments. Statistical analysis was performed using a Mann-Whitney-Wilcoxon test. Significance was set at P < .05.
Results
Tibial resection thickness was found to be most commonly conservative in nature, with sizes 8-mm and 9-mm polyethylene inserts utilized in the majority of both robotic-assisted and conventional UKA cases. However, statistically more 8-mm and 9-mm polyethylene inserts were used in the robotic group (93.6%) than in the conventional group (84.5%) (P < .0001; Figure). Aggressive tibial resection, requiring tibial inserts ≥10 mm, was performed in 6.4% of robotic-assisted cases and 15.5% of conventional cases. 
Discussion
Robotic assistance enhances the accuracy of bone preparation, implant component alignment, and soft tissue balance in UKA.10-15 It has yet to be determined whether this improved accuracy translates to improved clinical performance or longevity of the UKA implant. However, we demonstrate that the enhanced accuracy of robotic technology results in more conservative tibial resection when compared to conventional techniques with a potential benefit suggested in the literature upon conversion to TKA.
The findings of this study have important implications for patients undergoing conversion of UKA to TKA, potentially optimizing the ease of revision and clinical outcomes. The outcomes of UKA conversion to TKA are often considered inferior to those of primary TKA, compromised by bone loss, need for augmentation, and challenges of restoring the joint line and rotation.9,16-22 Barrett and Scott18 reported only 66% of patients had good or excellent results at an average of 4.6 years of follow-up after UKA conversion to TKA. Over 50% required stemmed implants and bone graft or bone cement augmentation to address osseous insufficiency. The authors suggested that the primary determinant of the complexity of the conversion to TKA was the surgical technique used in the index procedure. They concluded that UKA conversion to TKA can be as successful as a primary TKA and primary TKA implants can be used without bone augmentation or stems during the revision procedure if minimal tibial bone is resected at the time of the index UKA.18 Schwarzkopf and colleagues9 supported this conclusion when they found that aggressive tibial resection during UKA resulted in the need for bone graft, stem, wedge, or augment in 70% of cases when converted to TKA. Similarly, Khan and colleagues23 found that 26% of patients required bone grafting and 26% required some form of augmentation, and Springer and colleagues3 reported that 68% required a graft, augment, or stem.3,22 Using data from the New Zealand Joint Registry, Pearse and colleagues5 reported that revision TKA components were necessary in 28% of patients and concluded that converting a UKA to TKA gives a less reliable result than primary TKA, and with functional results that are not significantly better than a revision from a TKA.
Conservative tibial resection during UKA minimizes the complexity and concerns of bone loss upon conversion to TKA. Schwarzkopf and colleagues9 found 96.6% of patients with conservative tibial resection received a primary TKA implant, without augments or stems. Furthermore, patients with a primary TKA implant showed improved tibial survivorship, with revision as an end point, compared with patients who received a TKA implant that required stems and augments or bone graft for support.9 Also emphasizing the importance of minimal tibial resection, O’Donnell and colleagues8 compared a cohort of patients undergoing conversion of a minimal resection resurfacing onlay-type UKA to TKA with a cohort of patients undergoing primary TKA. They found that 40% of patients required bone grafting for contained defects, 3.6% required metal augments, and 1.8% required stems.8 There was no significant difference between the groups in terms of range of motion, functional outcome, or radiologic outcomes. The authors concluded that revision of minimal resection resurfacing implants to TKA is associated with similar results to primary TKA and is superior to revision of UKA with greater bone loss. Prior studies have shown that one of the advantages of robotic-assisted UKA is the accuracy and precision of bone resection. The present study supports this premise by showing that tibial resection is significantly more conservative using robotic-assisted techniques when using tibial component thickness as a surrogate for extent of bone resection. While our study did not address implant durability or the impact of conservative resection on conversion to TKA, studies referenced above suggest that the conservative nature of bone preparation would have a relevant impact on the revision of the implant to TKA.
Our study is a retrospective case series that reports tibial component thickness as a surrogate for volume of tibial resection during UKA. While the implication is that more conservative tibial resection may optimize durability and ease of conversion to TKA, future study will be needed to compare robotic-assisted and conventional cases of UKA upon conversion to TKA in order to ascertain whether the more conventional resections of robotic-assisted UKA in fact lead to revision that is comparable with primary TKA in terms of bone loss at the time of revision, components utilized, the need for bone graft, augments, or stems, and clinical outcomes. Given the method of data collection in this study, we could not control for clinical deformity, selection bias, surgeon experience, or medial vs lateral knee compartments. These potential confounders represent weaknesses of this study.
In conclusion, conversion of UKA to TKA may be associated with significant osseous insufficiency, which may compromise patient outcomes in comparison to primary TKA. Studies have shown that UKA conversion to TKA is comparable to primary TKA when minimal tibial resection is performed during the UKA, and the need for augmentation, grafting or stems is increased with more aggressive tibial resection. This study has shown that when robotic assistance is utilized, tibial resection is more precise, less variable, and more conservative compared to conventional techniques.
Am J Orthop. 2016;45(7):E465-E468. Copyright Frontline Medical Communications Inc. 2016. All rights reserved.
1. Patil S, Colwell CW Jr, Ezzet KA, D’Lima DD. Can normal knee kinematics be restored with unicompartmental knee replacement? J Bone Joint Surg Am. 2005;87(2):332-338.
2. Johnson S, Jones P, Newman JH. The survivorship and results of total knee replacements converted from unicompartmental knee replacements. Knee. 2007;14(2):154-157.
3. Springer BD, Scott RD, Thornhill TS. Conversion of failed unicompartmental knee arthroplasty to TKA. Clin Orthop Relat Res. 2006;446:214-220.
4. Järvenpää J, Kettunen J, Miettinen H, Kröger H. The clinical outcome of revision knee replacement after unicompartmental knee arthroplasty versus primary total knee arthroplasty: 8-17 years follow-up study of 49 patients. Int Orthop. 2010;34(5):649-653.
5. Pearse AJ, Hooper GJ, Rothwell AG, Frampton C. Osteotomy and unicompartmental knee arthroplasty converted to total knee arthroplasty: data from the New Zealand Joint Registry. J Arthroplasty. 2012;27(10):1827-1831.
6. Rancourt MF, Kemp KA, Plamondon SM, Kim PR, Dervin GF. Unicompartmental knee arthroplasties revised to total knee arthroplasties compared with primary total knee arthroplasties. J Arthroplasty. 2012;27(8 Suppl):106-110.
7. Sierra RJ, Kassel CA, Wetters NG, Berend KR, Della Valle CJ, Lombardi AV. Revision of unicompartmental arthroplasty to total knee arthroplasty: not always a slam dunk! J Arthroplasty. 2013;28(8 Suppl):128-132.
8. O’Donnell TM, Abouazza O, Neil MJ. Revision of minimal resection resurfacing unicondylar knee arthroplasty to total knee arthroplasty: results compared with primary total knee arthroplasty. J Arthroplasty. 2013;28(1):33-39.
9. Schwarzkopf R, Mikhael B, Li L, Josephs L, Scott RD. Effect of initial tibial resection thickness on outcomes of revision UKA. Orthopedics. 2013;36(4):e409-e414.
10. Conditt MA, Roche MW. Minimally invasive robotic-arm-guided unicompartmental knee arthroplasty. J Bone Joint Surg Am. 2009;91 Suppl 1:63-68.
11. Dunbar NJ, Roche MW, Park BH, Branch SH, Conditt MA, Banks SA. Accuracy of dynamic tactile-guided unicompartmental knee arthroplasty. J Arthroplasty. 2012;27(5):803-808.e1.
12. Karia M, Masjedi M, Andrews B, Jaffry Z, Cobb J. Robotic assistance enables inexperienced surgeons to perform unicompartmental knee arthroplasties on dry bone models with accuracy superior to conventional methods. Adv Orthop. 2013;2013:481039.
13. Lonner JH, John TK, Conditt MA. Robotic arm-assisted UKA improves tibial component alignment: a pilot study. Clin Orthop Relat Res. 2010;468(1):141-146.
14. Lonner JH, Smith JR, Picard F, Hamlin B, Rowe PJ, Riches PE. High degree of accuracy of a novel image-free handheld robot for unicondylar knee arthroplasty in a cadaveric study. Clin Orthop Relat Res. 2015;473(1):206-212.
15. Smith JR, Picard F, Rowe PJ, Deakin A, Riches PE. The accuracy of a robotically-controlled freehand sculpting tool for unicondylar knee arthroplasty. Bone Joint J. 2013;95-B(suppl 28):68.
16. Chakrabarty G, Newman JH, Ackroyd CE. Revision of unicompartmental arthroplasty of the knee. Clinical and technical considerations. J Arthroplasty. 1998;13(2):191-196.
17. Levine WN, Ozuna RM, Scott RD, Thornhill TS. Conversion of failed modern unicompartmental arthroplasty to total knee arthroplasty. J Arthroplasty. 1996;11(7):797-801.
18. Barrett WP, Scott RD. Revision of failed unicondylar unicompartmental knee arthroplasty. J Bone Joint Surg Am. 1987;69(9):1328-1335.
19. Padgett DE, Stern SH, Insall JN. Revision total knee arthroplasty for failed unicompartmental replacement. J Bone Joint Surg Am. 1991;73(2):186-190.
20. Aleto TJ, Berend ME, Ritter MA, Faris PM, Meneghini RM. Early failure of unicompartmental knee arthroplasty leading to revision. J Arthroplasty. 2008;23(2):159-163.
21. McAuley JP, Engh GA, Ammeen DJ. Revision of failed unicompartmental knee arthroplasty. Clin Orthop Relat Res. 2001;(392):279-282.22. Böhm I, Landsiedl F. Revision surgery after failed unicompartmental knee arthroplasty: a study of 35 cases. J Arthroplasty. 2000;15(8):982-989.
23. Khan Z, Nawaz SZ, Kahane S, Ester C, Chatterji U. Conversion of unicompartmental knee arthroplasty to total knee arthroplasty: the challenges and need for augments. Acta Orthop Belg. 2013;79(6):699-705.
Unicompartmental knee arthroplasty (UKA) is considered a less invasive approach for the treatment of unicompartmental knee arthritis when compared with total knee arthroplasty (TKA), with optimal preservation of kinematics.1 Despite excellent functional outcomes, conversion to TKA may be necessary if the UKA fails, or in patients with progressive knee arthritis. Some studies have found UKA conversion to TKA to be comparable with primary TKA,2,3 whereas others have found that conversion often requires bone graft, augments, and stemmed components and has increased complications and inferior results compared to primary TKA.4-7 While some studies report that <10% of UKA conversions to TKA require augments,2 others have found that as many as 76% require augments.4-8
Schwarzkopf and colleagues9 recently demonstrated that UKA conversion to TKA is comparable with primary TKA when a conservative tibial resection is performed during the index procedure. However, they reported increased complexity when greater tibial resection was performed and thicker polyethylene inserts were used at the time of the index UKA. The odds ratio of needing an augment or stem during the conversion to TKA was 26.8 (95% confidence interval, 3.71-194) when an aggressive tibial resection was performed during the UKA.9 Tibial resection thickness may thus be predictive of anticipated complexity of UKA revision to TKA and may aid in preoperative planning.
Robotic assistance has been shown to enhance the accuracy of bone preparation, implant component alignment, and soft tissue balance in UKA.10-15 It has yet to be determined whether this improved accuracy translates to improved clinical performance or longevity of the UKA implant. However, the enhanced accuracy of robotic technology may result in more conservative tibial resection when compared to conventional UKA and may be advantageous if conversion to TKA becomes necessary.
The purpose of this study was to compare the distribution of polyethylene insert sizes implanted during conventional and robotic-assisted UKA. We hypothesized that robotic assistance would demonstrate more conservative tibial resection compared to conventional methods of bone preparation.
Methods
We retrospectively compared the distribution of polyethylene insert sizes implanted during consecutive conventional and robotic-assisted UKA procedures. Several manufacturers were queried to provide a listing of the polyethylene insert sizes utilized, ranging from 8 mm to 14 mm. The analysis included 8421 robotic-assisted UKA cases and 27,989 conventional UKA cases. Data were provided by Zimmer Biomet and Smith & Nephew regarding conventional cases, as well as Blue Belt Technologies (now part of Smith & Nephew) and MAKO Surgical (now part of Stryker) regarding robotic-assisted cases. (Dr. Lonner has an ongoing relationship as a consultant with Blue Belt Technologies, whose data was utilized in this study.) Using tibial insert thickness as a surrogate measure of the extent of tibial resection, an insert size of ≥10 mm was defined as aggressive while <10 mm was considered conservative. This cutoff was established based on its corresponding resection level with primary TKA and the anticipated need for augments. Statistical analysis was performed using a Mann-Whitney-Wilcoxon test. Significance was set at P < .05.
Results
Tibial resection thickness was found to be most commonly conservative in nature, with sizes 8-mm and 9-mm polyethylene inserts utilized in the majority of both robotic-assisted and conventional UKA cases. However, statistically more 8-mm and 9-mm polyethylene inserts were used in the robotic group (93.6%) than in the conventional group (84.5%) (P < .0001; Figure). Aggressive tibial resection, requiring tibial inserts ≥10 mm, was performed in 6.4% of robotic-assisted cases and 15.5% of conventional cases.
Discussion
Robotic assistance enhances the accuracy of bone preparation, implant component alignment, and soft tissue balance in UKA.10-15 It has yet to be determined whether this improved accuracy translates to improved clinical performance or longevity of the UKA implant. However, we demonstrate that the enhanced accuracy of robotic technology results in more conservative tibial resection when compared to conventional techniques with a potential benefit suggested in the literature upon conversion to TKA.
The findings of this study have important implications for patients undergoing conversion of UKA to TKA, potentially optimizing the ease of revision and clinical outcomes. The outcomes of UKA conversion to TKA are often considered inferior to those of primary TKA, compromised by bone loss, need for augmentation, and challenges of restoring the joint line and rotation.9,16-22 Barrett and Scott18 reported only 66% of patients had good or excellent results at an average of 4.6 years of follow-up after UKA conversion to TKA. Over 50% required stemmed implants and bone graft or bone cement augmentation to address osseous insufficiency. The authors suggested that the primary determinant of the complexity of the conversion to TKA was the surgical technique used in the index procedure. They concluded that UKA conversion to TKA can be as successful as a primary TKA and primary TKA implants can be used without bone augmentation or stems during the revision procedure if minimal tibial bone is resected at the time of the index UKA.18 Schwarzkopf and colleagues9 supported this conclusion when they found that aggressive tibial resection during UKA resulted in the need for bone graft, stem, wedge, or augment in 70% of cases when converted to TKA. Similarly, Khan and colleagues23 found that 26% of patients required bone grafting and 26% required some form of augmentation, and Springer and colleagues3 reported that 68% required a graft, augment, or stem.3,22 Using data from the New Zealand Joint Registry, Pearse and colleagues5 reported that revision TKA components were necessary in 28% of patients and concluded that converting a UKA to TKA gives a less reliable result than primary TKA, and with functional results that are not significantly better than a revision from a TKA.
Conservative tibial resection during UKA minimizes the complexity and concerns of bone loss upon conversion to TKA. Schwarzkopf and colleagues9 found 96.6% of patients with conservative tibial resection received a primary TKA implant, without augments or stems. Furthermore, patients with a primary TKA implant showed improved tibial survivorship, with revision as an end point, compared with patients who received a TKA implant that required stems and augments or bone graft for support.9 Also emphasizing the importance of minimal tibial resection, O’Donnell and colleagues8 compared a cohort of patients undergoing conversion of a minimal resection resurfacing onlay-type UKA to TKA with a cohort of patients undergoing primary TKA. They found that 40% of patients required bone grafting for contained defects, 3.6% required metal augments, and 1.8% required stems.8 There was no significant difference between the groups in terms of range of motion, functional outcome, or radiologic outcomes. The authors concluded that revision of minimal resection resurfacing implants to TKA is associated with similar results to primary TKA and is superior to revision of UKA with greater bone loss. Prior studies have shown that one of the advantages of robotic-assisted UKA is the accuracy and precision of bone resection. The present study supports this premise by showing that tibial resection is significantly more conservative using robotic-assisted techniques when using tibial component thickness as a surrogate for extent of bone resection. While our study did not address implant durability or the impact of conservative resection on conversion to TKA, studies referenced above suggest that the conservative nature of bone preparation would have a relevant impact on the revision of the implant to TKA.
Our study is a retrospective case series that reports tibial component thickness as a surrogate for volume of tibial resection during UKA. While the implication is that more conservative tibial resection may optimize durability and ease of conversion to TKA, future study will be needed to compare robotic-assisted and conventional cases of UKA upon conversion to TKA in order to ascertain whether the more conventional resections of robotic-assisted UKA in fact lead to revision that is comparable with primary TKA in terms of bone loss at the time of revision, components utilized, the need for bone graft, augments, or stems, and clinical outcomes. Given the method of data collection in this study, we could not control for clinical deformity, selection bias, surgeon experience, or medial vs lateral knee compartments. These potential confounders represent weaknesses of this study.
In conclusion, conversion of UKA to TKA may be associated with significant osseous insufficiency, which may compromise patient outcomes in comparison to primary TKA. Studies have shown that UKA conversion to TKA is comparable to primary TKA when minimal tibial resection is performed during the UKA, and the need for augmentation, grafting or stems is increased with more aggressive tibial resection. This study has shown that when robotic assistance is utilized, tibial resection is more precise, less variable, and more conservative compared to conventional techniques.
Am J Orthop. 2016;45(7):E465-E468. Copyright Frontline Medical Communications Inc. 2016. All rights reserved.
1. Patil S, Colwell CW Jr, Ezzet KA, D’Lima DD. Can normal knee kinematics be restored with unicompartmental knee replacement? J Bone Joint Surg Am. 2005;87(2):332-338.
2. Johnson S, Jones P, Newman JH. The survivorship and results of total knee replacements converted from unicompartmental knee replacements. Knee. 2007;14(2):154-157.
3. Springer BD, Scott RD, Thornhill TS. Conversion of failed unicompartmental knee arthroplasty to TKA. Clin Orthop Relat Res. 2006;446:214-220.
4. Järvenpää J, Kettunen J, Miettinen H, Kröger H. The clinical outcome of revision knee replacement after unicompartmental knee arthroplasty versus primary total knee arthroplasty: 8-17 years follow-up study of 49 patients. Int Orthop. 2010;34(5):649-653.
5. Pearse AJ, Hooper GJ, Rothwell AG, Frampton C. Osteotomy and unicompartmental knee arthroplasty converted to total knee arthroplasty: data from the New Zealand Joint Registry. J Arthroplasty. 2012;27(10):1827-1831.
6. Rancourt MF, Kemp KA, Plamondon SM, Kim PR, Dervin GF. Unicompartmental knee arthroplasties revised to total knee arthroplasties compared with primary total knee arthroplasties. J Arthroplasty. 2012;27(8 Suppl):106-110.
7. Sierra RJ, Kassel CA, Wetters NG, Berend KR, Della Valle CJ, Lombardi AV. Revision of unicompartmental arthroplasty to total knee arthroplasty: not always a slam dunk! J Arthroplasty. 2013;28(8 Suppl):128-132.
8. O’Donnell TM, Abouazza O, Neil MJ. Revision of minimal resection resurfacing unicondylar knee arthroplasty to total knee arthroplasty: results compared with primary total knee arthroplasty. J Arthroplasty. 2013;28(1):33-39.
9. Schwarzkopf R, Mikhael B, Li L, Josephs L, Scott RD. Effect of initial tibial resection thickness on outcomes of revision UKA. Orthopedics. 2013;36(4):e409-e414.
10. Conditt MA, Roche MW. Minimally invasive robotic-arm-guided unicompartmental knee arthroplasty. J Bone Joint Surg Am. 2009;91 Suppl 1:63-68.
11. Dunbar NJ, Roche MW, Park BH, Branch SH, Conditt MA, Banks SA. Accuracy of dynamic tactile-guided unicompartmental knee arthroplasty. J Arthroplasty. 2012;27(5):803-808.e1.
12. Karia M, Masjedi M, Andrews B, Jaffry Z, Cobb J. Robotic assistance enables inexperienced surgeons to perform unicompartmental knee arthroplasties on dry bone models with accuracy superior to conventional methods. Adv Orthop. 2013;2013:481039.
13. Lonner JH, John TK, Conditt MA. Robotic arm-assisted UKA improves tibial component alignment: a pilot study. Clin Orthop Relat Res. 2010;468(1):141-146.
14. Lonner JH, Smith JR, Picard F, Hamlin B, Rowe PJ, Riches PE. High degree of accuracy of a novel image-free handheld robot for unicondylar knee arthroplasty in a cadaveric study. Clin Orthop Relat Res. 2015;473(1):206-212.
15. Smith JR, Picard F, Rowe PJ, Deakin A, Riches PE. The accuracy of a robotically-controlled freehand sculpting tool for unicondylar knee arthroplasty. Bone Joint J. 2013;95-B(suppl 28):68.
16. Chakrabarty G, Newman JH, Ackroyd CE. Revision of unicompartmental arthroplasty of the knee. Clinical and technical considerations. J Arthroplasty. 1998;13(2):191-196.
17. Levine WN, Ozuna RM, Scott RD, Thornhill TS. Conversion of failed modern unicompartmental arthroplasty to total knee arthroplasty. J Arthroplasty. 1996;11(7):797-801.
18. Barrett WP, Scott RD. Revision of failed unicondylar unicompartmental knee arthroplasty. J Bone Joint Surg Am. 1987;69(9):1328-1335.
19. Padgett DE, Stern SH, Insall JN. Revision total knee arthroplasty for failed unicompartmental replacement. J Bone Joint Surg Am. 1991;73(2):186-190.
20. Aleto TJ, Berend ME, Ritter MA, Faris PM, Meneghini RM. Early failure of unicompartmental knee arthroplasty leading to revision. J Arthroplasty. 2008;23(2):159-163.
21. McAuley JP, Engh GA, Ammeen DJ. Revision of failed unicompartmental knee arthroplasty. Clin Orthop Relat Res. 2001;(392):279-282.22. Böhm I, Landsiedl F. Revision surgery after failed unicompartmental knee arthroplasty: a study of 35 cases. J Arthroplasty. 2000;15(8):982-989.
23. Khan Z, Nawaz SZ, Kahane S, Ester C, Chatterji U. Conversion of unicompartmental knee arthroplasty to total knee arthroplasty: the challenges and need for augments. Acta Orthop Belg. 2013;79(6):699-705.
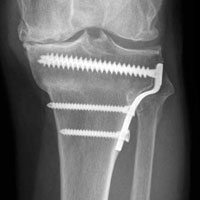
Perceived Leg-Length Discrepancy After Primary Total Knee Arthroplasty: Does Knee Alignment Play a Role?
Leg-length discrepancy (LLD) is common in the general population1 and particularly in patients with degenerative joint diseases of the hip and knee.2 Common complications of LLD include femoral, sciatic, and peroneal nerve palsy; lower back pain; gait abnormalities3; and general dissatisfaction. LLD is a concern for orthopedic surgeons who perform total knee arthroplasty (TKA) because limb lengthening is common after this procedure.4,5 Surgeons are aware of the limb lengthening that occurs during TKA,4,5 and studies have confirmed that LLD usually decreases after TKA.4,5
Despite surgeons’ best efforts, some patients still perceive LLD after surgery, though the incidence of perceived LLD in patients who have had TKA has not been well documented. Aside from actual, objectively measured LLD, there may be other factors that lead patients to perceive LLD. Study results have suggested that preoperative varus–valgus alignment of the knee joint may correlate with how much an operative leg is lengthened after TKA4,5; however, the outcome investigated was objective LLD measurements, not perceived LLD. Understanding the factors that may influence patients’ ability to perceive LLD would allow surgeons to preoperatively identify patients who are at higher risk for postoperative perceived LLD. This information, along with expected time to resolution of postoperative perceived LLD, would allow surgeons to educate their patients accordingly.
We conducted a study to determine the incidence of perceived LLD before and after primary TKA in patients with unilateral osteoarthritis and to determine the correlation between mechanical axis of the knee and perceived LLD before and after surgery. Given that surgery may correct mechanical axis misalignment, we investigated the correlation between this correction and its ability to change patients’ preoperative and postoperative perceived LLD. We hypothesized that a large correction of mechanical axis would lead patients to perceive LLD after surgery. The relationship of body mass index (BMI) and age to patients’ perceived LLD was also assessed. The incidence and time frame of resolution of postoperative perceived LLD were determined.
Methods
Approval for this study was received from the Institutional Review Board at our institution, Rush University Medical Center in Chicago, Illinois. Seventy-three patients undergoing primary TKA performed by 3 surgeons at 2 institutions between February 2010 and January 2013 were prospectively enrolled. Inclusion criteria were age 18 years to 90 years and primary TKA for unilateral osteoarthritis; exclusion criteria were allergy or intolerance to the study materials, operative treatment of affected joint or its underlying etiology within prior month, previous surgeries (other than arthroscopy) on affected joint, previous surgeries (on unaffected lower extremity) that may influence preoperative and postoperative leg lengths, and any substance abuse or dependence within the past 6 months. Patients provided written informed consent for total knee arthroplasty.
All surgeries were performed by Dr. Levine, Dr. Della Valle, and Dr. Sporer using the medial parapatellar or midvastus approach with tourniquet. Similar standard postoperative rehabilitation protocols with early mobilization were used in all cases.
During clinical evaluation, patient demographic data were collected and LLD surveys administered. Patients were asked, before surgery and 3 to 6 weeks, 3 months, 6 months, and 1 year after surgery, if they perceived LLD. A patient who no longer perceived LLD after surgery was no longer followed for this study.
At the preoperative clinic visit and at the 3-month or 6-week postoperative visit, standing mechanical axis radiographs were viewed by 2 of the authors (not the primary surgeons) using PACS (picture archiving and communication system software). The mechanical axis of the operative leg was measured with ImageJ software by taking the angle from the center of the femur to the middle of the ankle joint, with the vertex assigned to the middle of the knee joint.
We used a 2-tailed unpaired t test to determine the relationship of preoperative mechanical axis to perceived LLD (or lack thereof) before surgery. The data were analyzed for separate varus and valgus deformities. Then we determined the relationship of postoperative mechanical axis to perceived LLD (or lack thereof) after surgery. The McNemar test was used to determine the effect of surgery on patients’ LLD perceptions.
To determine the relationship between preoperative-to-postoperative change in mechanical axis and change in LLD perceptions, we divided patients into 4 groups. Group 1 had both preoperative and postoperative perceived LLD, group 2 had no preoperative or postoperative perceived LLD, group 3 had preoperative perceived LLD but no postoperative perceived LLD, and group 4 had postoperative perceived LLD but no preoperative perceived LLD. The absolute value of the difference between preoperative and postoperative mechanical axis was then determined, relative to 180°, to account for changes in varus to valgus deformity before and after surgery and vice versa. Analysis of variance (ANOVA) was used to detect differences between groups. This analysis was then stratified based on BMI and age.
Results
Of the 73 enrolled patients, 2 were excluded from results analysis because of inadequate data—one did not complete the postoperative LLD survey, and the other did not have postoperative standing mechanical axis radiographs—leaving 71 patients (27 men, 44 women) with adequate data. Mean (SD) age of all patients was 65 (8.4) years (range, 47-89 years). Mean (SD) BMI was 35.1 (9.9; range, 20.2-74.8).
Of the 71 patients with adequate data, 18 had preoperative perceived LLD and 53 did not; in addition, 7 had postoperative perceived LLD and 64 did not. All 7 patients with postoperative perceived LLD noted resolution of LLD, at a mean of 8.5 weeks (range, 3 weeks-3 months). There was a significant difference between the 18 patients with preoperative perceived LLD and the 7 with postoperative perceived LLD (P = .035, analyzed with the McNemar test).
Table 1 lists the mean preoperative mechanical axis measurements for patients with and without preoperative perceived LLD. 
Table 2 lists the mean postoperative mechanical axis measurements for patients with and without postoperative perceived LLD. 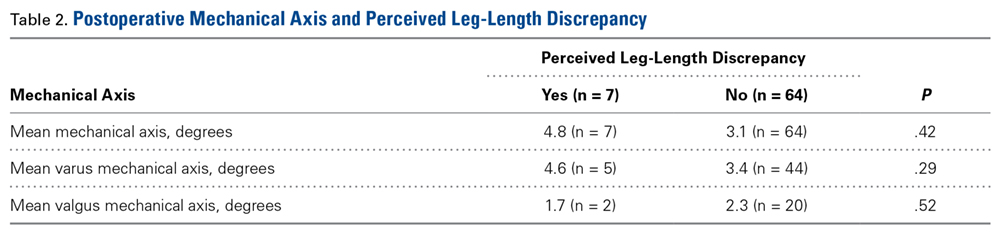
Table 3 lists the mean absolute values of mechanical axis correction (preoperative to postoperative) for the 4 patient groups described in the Methods section. 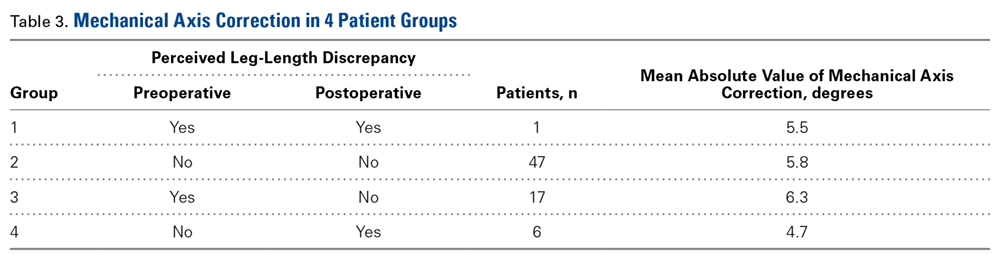
Discussion
In this study, 18 patients (25%) had preoperative perceived LLD, proving that perceived LLD is common in patients who undergo TKA for unilateral osteoarthritis. Surgeons should give their patients a preoperative survey on perceived LLD, as survey responses may inform and influence surgical decisions and strategies.
Of the 18 patients with preoperative perceived LLD, only 1 had postoperative perceived LLD. That perceived LLD decreased after surgery makes sense given the widely accepted notion that actual LLD is common before primary TKA but in most cases is corrected during surgery.4,5 As LLD correction during surgery is so successful, surgeons should tell their patients with preoperative perceived LLD that in most cases it will be fixed after TKA.
Although the incidence of perceived LLD decreased after TKA (as mentioned earlier), the decrease seemed to be restricted mostly to patients with preoperative perceived LLD, and the underlying LLD was most probably corrected by the surgery. However, surgery introduced perceived LLD in 6 cases, supporting the notion that it is crucial to understand which patients are at higher risk for postoperative perceived LLD and what if any time frame can be expected for resolution in these cases. In our study, all cases of perceived LLD had resolved by a mean follow-up of 8.5 weeks (range, 3 weeks-3 months). This phenomenon of resolution may be attributed to some of the physical, objective LLD corrections that naturally occur throughout the postoperative course,4 though psychological factors may also be involved. Our study results suggest patients should be counseled that, though about 10% of patients perceive LLD after primary TKA, the vast majority of perceived LLD cases resolve within 3 months.
One study goal was to determine the relationship between the mechanical axis of the knee and perceived LLD both before and after surgery. There were no significant relationships. This was also true when cases of varus and valgus deformity were analyzed separately.
Another study goal was to determine if a surgical change in the mechanical alignment of the knee would influence preoperative-to-postoperative LLD perceptions. In our analysis, patients were divided into 4 groups based on their preoperative and postoperative LLD perceptions (see Methods section). ANOVA revealed no significant differences in absolute values of mechanical axis correction among the 4 groups. Likewise, there were no correlations between BMI and age and mechanical axis correction among the groups, suggesting LLD perception is unrelated to any of these variables. Ideally, if a relationship between a threshold knee alignment value and perceived LLD existed, surgeons would be able to counsel patients at higher risk for perceived LLD about how their knee alignment may contribute to their perception. Unfortunately, our study results did not show any significant statistical relationships in this regard.
The problem of LLD in patients undergoing TKA is not new, and much research is needed to determine the correlation between perceived versus actual discrepancies, and why they occur. Our study results confirmed that TKA corrects most cases of preoperative perceived LLD but introduces perceived LLD in other cases. Whether preoperative or postoperative LLD is merely perceived or is in fact an actual discrepancy remains to be seen.
One limitation of this study was its lack of leg-length measurements. Although we studied knee alignment specifically, it would have been useful to compare perceived LLD with measured leg lengths, either clinically or radiographically, especially since leg lengths obviously play a role in any perceived LLD. We used mechanical alignment as a surrogate for actual LLD because we hypothesized that alignment may contribute to patients’ perceived discrepancies.
Another limitation was the relatively small sample. Only 24 cases of perceived LLD were analyzed. Given our low rates of perceived LLD (25% before surgery, 10% after surgery), it is difficult to study a large enough TKA group to establish a statistically significant number of cases. Nevertheless, investigators may use larger groups to establish more meaningful relationships.
A third limitation was that alignment was measured on the operative side but not the contralateral side. As we were focusing on perceived discrepancy, contralateral knee alignment may play an important role. Our study involved patients with unilateral osteoarthritis, so it would be reasonable to assume the nonoperative knee was almost neutral in alignment in most cases. However, given that varus/valgus misalignment is a known risk factor for osteoarthritis,6 many of our patients with unilateral disease may very well have had preexisting misalignment of both knees. The undetermined alignment of the nonoperative side may be a confounding variable in the relationship between operative knee alignment and perceived LLD.
Fourth, not all patients were surveyed 3 weeks after surgery. Some were first surveyed at 6 weeks, and it is possible there were cases of transient postoperative LLD that resolved before that point. Therefore, our reported incidence of postoperative LLD could have missed some cases. In addition, our mean 8.5-week period for LLD resolution may not have accounted for these resolved cases of transient perceived LLD.
Am J Orthop. 2016;45(7):E429-E433. Copyright Frontline Medical Communications Inc. 2016. All rights reserved.
1. O’Brien S, Kernohan G, Fitzpatrick C, Hill J, Beverland D. Perception of imposed leg length inequality in normal subjects. Hip Int. 2010;20(4):505-511.
2. Noll DR. Leg length discrepancy and osteoarthritic knee pain in the elderly: an observational study. J Am Osteopath Assoc. 2013;113(9):670-678.
3. Clark CR, Huddleston HD, Schoch EP 3rd, Thomas BJ. Leg-length discrepancy after total hip arthroplasty. J Am Acad Orthop Surg. 2006;14(1):38-45.
4. Chang MJ, Kang YG, Chang CB, Seong SC, Kim TK. The patterns of limb length, height, weight and body mass index changes after total knee arthroplasty. J Arthroplasty. 2013;28(10):1856-1861.
5. Lang JE, Scott RD, Lonner JH, Bono JV, Hunter DJ, Li L. Magnitude of limb lengthening after primary total knee arthroplasty. J Arthroplasty. 2012;27(3):341-346.
6. Sharma L, Song J, Dunlop D, et al. Varus and valgus alignment and incident and progressive knee osteoarthritis. Ann Rheum Dis. 2010;69(11):1940-1945.
Leg-length discrepancy (LLD) is common in the general population1 and particularly in patients with degenerative joint diseases of the hip and knee.2 Common complications of LLD include femoral, sciatic, and peroneal nerve palsy; lower back pain; gait abnormalities3; and general dissatisfaction. LLD is a concern for orthopedic surgeons who perform total knee arthroplasty (TKA) because limb lengthening is common after this procedure.4,5 Surgeons are aware of the limb lengthening that occurs during TKA,4,5 and studies have confirmed that LLD usually decreases after TKA.4,5
Despite surgeons’ best efforts, some patients still perceive LLD after surgery, though the incidence of perceived LLD in patients who have had TKA has not been well documented. Aside from actual, objectively measured LLD, there may be other factors that lead patients to perceive LLD. Study results have suggested that preoperative varus–valgus alignment of the knee joint may correlate with how much an operative leg is lengthened after TKA4,5; however, the outcome investigated was objective LLD measurements, not perceived LLD. Understanding the factors that may influence patients’ ability to perceive LLD would allow surgeons to preoperatively identify patients who are at higher risk for postoperative perceived LLD. This information, along with expected time to resolution of postoperative perceived LLD, would allow surgeons to educate their patients accordingly.
We conducted a study to determine the incidence of perceived LLD before and after primary TKA in patients with unilateral osteoarthritis and to determine the correlation between mechanical axis of the knee and perceived LLD before and after surgery. Given that surgery may correct mechanical axis misalignment, we investigated the correlation between this correction and its ability to change patients’ preoperative and postoperative perceived LLD. We hypothesized that a large correction of mechanical axis would lead patients to perceive LLD after surgery. The relationship of body mass index (BMI) and age to patients’ perceived LLD was also assessed. The incidence and time frame of resolution of postoperative perceived LLD were determined.
Methods
Approval for this study was received from the Institutional Review Board at our institution, Rush University Medical Center in Chicago, Illinois. Seventy-three patients undergoing primary TKA performed by 3 surgeons at 2 institutions between February 2010 and January 2013 were prospectively enrolled. Inclusion criteria were age 18 years to 90 years and primary TKA for unilateral osteoarthritis; exclusion criteria were allergy or intolerance to the study materials, operative treatment of affected joint or its underlying etiology within prior month, previous surgeries (other than arthroscopy) on affected joint, previous surgeries (on unaffected lower extremity) that may influence preoperative and postoperative leg lengths, and any substance abuse or dependence within the past 6 months. Patients provided written informed consent for total knee arthroplasty.
All surgeries were performed by Dr. Levine, Dr. Della Valle, and Dr. Sporer using the medial parapatellar or midvastus approach with tourniquet. Similar standard postoperative rehabilitation protocols with early mobilization were used in all cases.
During clinical evaluation, patient demographic data were collected and LLD surveys administered. Patients were asked, before surgery and 3 to 6 weeks, 3 months, 6 months, and 1 year after surgery, if they perceived LLD. A patient who no longer perceived LLD after surgery was no longer followed for this study.
At the preoperative clinic visit and at the 3-month or 6-week postoperative visit, standing mechanical axis radiographs were viewed by 2 of the authors (not the primary surgeons) using PACS (picture archiving and communication system software). The mechanical axis of the operative leg was measured with ImageJ software by taking the angle from the center of the femur to the middle of the ankle joint, with the vertex assigned to the middle of the knee joint.
We used a 2-tailed unpaired t test to determine the relationship of preoperative mechanical axis to perceived LLD (or lack thereof) before surgery. The data were analyzed for separate varus and valgus deformities. Then we determined the relationship of postoperative mechanical axis to perceived LLD (or lack thereof) after surgery. The McNemar test was used to determine the effect of surgery on patients’ LLD perceptions.
To determine the relationship between preoperative-to-postoperative change in mechanical axis and change in LLD perceptions, we divided patients into 4 groups. Group 1 had both preoperative and postoperative perceived LLD, group 2 had no preoperative or postoperative perceived LLD, group 3 had preoperative perceived LLD but no postoperative perceived LLD, and group 4 had postoperative perceived LLD but no preoperative perceived LLD. The absolute value of the difference between preoperative and postoperative mechanical axis was then determined, relative to 180°, to account for changes in varus to valgus deformity before and after surgery and vice versa. Analysis of variance (ANOVA) was used to detect differences between groups. This analysis was then stratified based on BMI and age.
Results
Of the 73 enrolled patients, 2 were excluded from results analysis because of inadequate data—one did not complete the postoperative LLD survey, and the other did not have postoperative standing mechanical axis radiographs—leaving 71 patients (27 men, 44 women) with adequate data. Mean (SD) age of all patients was 65 (8.4) years (range, 47-89 years). Mean (SD) BMI was 35.1 (9.9; range, 20.2-74.8).
Of the 71 patients with adequate data, 18 had preoperative perceived LLD and 53 did not; in addition, 7 had postoperative perceived LLD and 64 did not. All 7 patients with postoperative perceived LLD noted resolution of LLD, at a mean of 8.5 weeks (range, 3 weeks-3 months). There was a significant difference between the 18 patients with preoperative perceived LLD and the 7 with postoperative perceived LLD (P = .035, analyzed with the McNemar test).
Table 1 lists the mean preoperative mechanical axis measurements for patients with and without preoperative perceived LLD.
Table 2 lists the mean postoperative mechanical axis measurements for patients with and without postoperative perceived LLD.
Table 3 lists the mean absolute values of mechanical axis correction (preoperative to postoperative) for the 4 patient groups described in the Methods section.
Discussion
In this study, 18 patients (25%) had preoperative perceived LLD, proving that perceived LLD is common in patients who undergo TKA for unilateral osteoarthritis. Surgeons should give their patients a preoperative survey on perceived LLD, as survey responses may inform and influence surgical decisions and strategies.
Of the 18 patients with preoperative perceived LLD, only 1 had postoperative perceived LLD. That perceived LLD decreased after surgery makes sense given the widely accepted notion that actual LLD is common before primary TKA but in most cases is corrected during surgery.4,5 As LLD correction during surgery is so successful, surgeons should tell their patients with preoperative perceived LLD that in most cases it will be fixed after TKA.
Although the incidence of perceived LLD decreased after TKA (as mentioned earlier), the decrease seemed to be restricted mostly to patients with preoperative perceived LLD, and the underlying LLD was most probably corrected by the surgery. However, surgery introduced perceived LLD in 6 cases, supporting the notion that it is crucial to understand which patients are at higher risk for postoperative perceived LLD and what if any time frame can be expected for resolution in these cases. In our study, all cases of perceived LLD had resolved by a mean follow-up of 8.5 weeks (range, 3 weeks-3 months). This phenomenon of resolution may be attributed to some of the physical, objective LLD corrections that naturally occur throughout the postoperative course,4 though psychological factors may also be involved. Our study results suggest patients should be counseled that, though about 10% of patients perceive LLD after primary TKA, the vast majority of perceived LLD cases resolve within 3 months.
One study goal was to determine the relationship between the mechanical axis of the knee and perceived LLD both before and after surgery. There were no significant relationships. This was also true when cases of varus and valgus deformity were analyzed separately.
Another study goal was to determine if a surgical change in the mechanical alignment of the knee would influence preoperative-to-postoperative LLD perceptions. In our analysis, patients were divided into 4 groups based on their preoperative and postoperative LLD perceptions (see Methods section). ANOVA revealed no significant differences in absolute values of mechanical axis correction among the 4 groups. Likewise, there were no correlations between BMI and age and mechanical axis correction among the groups, suggesting LLD perception is unrelated to any of these variables. Ideally, if a relationship between a threshold knee alignment value and perceived LLD existed, surgeons would be able to counsel patients at higher risk for perceived LLD about how their knee alignment may contribute to their perception. Unfortunately, our study results did not show any significant statistical relationships in this regard.
The problem of LLD in patients undergoing TKA is not new, and much research is needed to determine the correlation between perceived versus actual discrepancies, and why they occur. Our study results confirmed that TKA corrects most cases of preoperative perceived LLD but introduces perceived LLD in other cases. Whether preoperative or postoperative LLD is merely perceived or is in fact an actual discrepancy remains to be seen.
One limitation of this study was its lack of leg-length measurements. Although we studied knee alignment specifically, it would have been useful to compare perceived LLD with measured leg lengths, either clinically or radiographically, especially since leg lengths obviously play a role in any perceived LLD. We used mechanical alignment as a surrogate for actual LLD because we hypothesized that alignment may contribute to patients’ perceived discrepancies.
Another limitation was the relatively small sample. Only 24 cases of perceived LLD were analyzed. Given our low rates of perceived LLD (25% before surgery, 10% after surgery), it is difficult to study a large enough TKA group to establish a statistically significant number of cases. Nevertheless, investigators may use larger groups to establish more meaningful relationships.
A third limitation was that alignment was measured on the operative side but not the contralateral side. As we were focusing on perceived discrepancy, contralateral knee alignment may play an important role. Our study involved patients with unilateral osteoarthritis, so it would be reasonable to assume the nonoperative knee was almost neutral in alignment in most cases. However, given that varus/valgus misalignment is a known risk factor for osteoarthritis,6 many of our patients with unilateral disease may very well have had preexisting misalignment of both knees. The undetermined alignment of the nonoperative side may be a confounding variable in the relationship between operative knee alignment and perceived LLD.
Fourth, not all patients were surveyed 3 weeks after surgery. Some were first surveyed at 6 weeks, and it is possible there were cases of transient postoperative LLD that resolved before that point. Therefore, our reported incidence of postoperative LLD could have missed some cases. In addition, our mean 8.5-week period for LLD resolution may not have accounted for these resolved cases of transient perceived LLD.
Am J Orthop. 2016;45(7):E429-E433. Copyright Frontline Medical Communications Inc. 2016. All rights reserved.
1. O’Brien S, Kernohan G, Fitzpatrick C, Hill J, Beverland D. Perception of imposed leg length inequality in normal subjects. Hip Int. 2010;20(4):505-511.
2. Noll DR. Leg length discrepancy and osteoarthritic knee pain in the elderly: an observational study. J Am Osteopath Assoc. 2013;113(9):670-678.
3. Clark CR, Huddleston HD, Schoch EP 3rd, Thomas BJ. Leg-length discrepancy after total hip arthroplasty. J Am Acad Orthop Surg. 2006;14(1):38-45.
4. Chang MJ, Kang YG, Chang CB, Seong SC, Kim TK. The patterns of limb length, height, weight and body mass index changes after total knee arthroplasty. J Arthroplasty. 2013;28(10):1856-1861.
5. Lang JE, Scott RD, Lonner JH, Bono JV, Hunter DJ, Li L. Magnitude of limb lengthening after primary total knee arthroplasty. J Arthroplasty. 2012;27(3):341-346.
6. Sharma L, Song J, Dunlop D, et al. Varus and valgus alignment and incident and progressive knee osteoarthritis. Ann Rheum Dis. 2010;69(11):1940-1945.
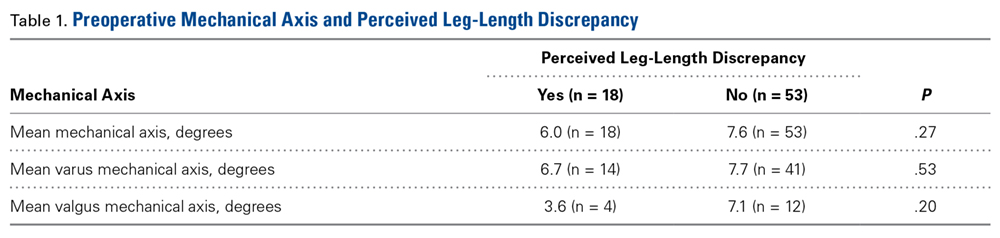
Posttraumatic Stress Disorder, Depression, and Other Comorbidities: Clinical and Systems Approaches to Diagnostic Uncertainties
Over the past decade, nationwide attention has focused on mental health conditions associated with military service. Recent legal mandates have led to changes in the DoD, VA, and HHS health systems aimed at increasing access to care, decreasing barriers to care, and expanding research on mental health conditions commonly seen in service members and veterans. On August 31, 2012, President Barack Obama signed the Improving Access to Mental Health Services for Veterans, Service Members, and Military Families executive order, establishing an interagency task force from the VA, DoD, and HHS.1 The task force was charged with addressing quality of care and provider training in the management of commonly comorbid conditions, including (among other conditions) posttraumatic stress disorder (PTSD) and depression.
Depression and PTSD present major health burdens in both military and veteran cohorts. Overlap in clinical presentation and significant rates of comorbidity complicate effective management of these conditions. This article offers a brief review of the diagnostic and epidemiologic complexities associated with PTSD and depression, a summary of research relevant to these issues, and a description of recent system-level developments within the Military Health System (MHS) designed to improve care through better approaches in identification, management, and research of these conditions.
Diagnostic Uncertainty
Both PTSD and major depressive disorder (MDD) have been recognized as mental health disorders since the American Psychiatric Association’s Diagnostic and Statistical Manual (DSM) discarded its previous etiologically based approach to diagnostic classification in 1980 in favor of a system in which diagnosis is based on observable symptoms.2,3 With the release of DSM-5 in 2013, the diagnostic criteria for PTSD underwent a substantial transformation.4 Previously, PTSD was described as an anxiety disorder, and some of its manifestations overlapped descriptively (and in many cases, etiologically) with anxiety and depressive illnesses.5
Clinicians also often described shorter-lived, developmental, formes fruste, or otherwise subsyndromal manifestations of trauma associated with PTSD. In DSM-5, PTSD was removed from the anxiety disorders section and placed in a new category of disorders labeled Trauma and Stressor-Related Disorders. This new category also included reactive attachment disorder (in children), acute stress disorder, adjustment disorders, and unspecified or other trauma and stressor-related disorders. Other major changes to the PTSD diagnostic criteria included modification to the DSM-IV-TR (text revision) trauma definition (making the construct more specific), removal of the requirement for explicit subjective emotional reaction to a traumatic event, and greater emphasis on negative cognitions and mood. Debate surrounds the updated symptom criteria with critics questioning whether there is any improvement in the clinical utility of the diagnosis, especially in light of the substantial policy and practice implications the change engenders.6
Recently, Hoge and colleagues examined the psychometric implications of the diagnostic changes (between DSM-IV-TR and DSM-5) in the PTSD definition.6 The authors found that although the 2 definitions showed nearly identical association with other psychiatric disorders (including depression) and functional impairment, 30% of soldiers who met DSM-IV-TR criteria for PTSD failed to meet criteria in DSM-5, and another 20% met only DSM-5 criteria. Recognizing discordance in PTSD and associated diagnoses, the U.S. Army Medical Command mandated that its clinicians familiarize themselves with the controversies surrounding the discordant diagnoses and coding of subthreshold PTSD.7
Adding to the problem of diagnostic uncertainty, the clinical presentation of MDD includes significant overlap with that of PTSD. Specifically, symptoms of guilt, diminished interests, problems with concentration, and sleep disturbances are descriptive of both disorders. Furthermore, the criteria set for several subthreshold forms of MDD evidence considerable overlap with PTSD symptoms. For example, diagnostic criteria for disruptive mood dysregulation disorder include behavioral outbursts and irritability, and diagnostic criteria for dysthymia include sleep disturbances and concentration problems.
Adjustment disorders are categorized as trauma and stressor-related disorders in DSM-5 and hold many emotional and behavioral symptoms in common with PTSD. The “acute” and “chronic” adjustment disorder specifiers contribute to problems in diagnostic certainty for PTSD. In general, issues pertaining to diagnostic uncertainty and overlap likely reflect the limits of using a diagnostic classification system that relies exclusively on observational and subjective reports of psychological symptoms.8,9
In a treatment environment where a veteran or active-duty patient has presented for care, in the face of these shared symptom sets, clinicians frequently offer initial diagnoses. These diagnoses are often based on perceived etiologic factors derived from patients’ descriptions of stressors encountered during military service. This tendency likely contributes to considerable inconsistencies and potential inaccuracies in diagnoses, and much of the variance can be attributed to the clinicians’ degree of familiarity with military exposures, perceptions of what constitutes trauma, and outside pressure to assign or avoid specific diagnoses.
Importantly, the phenomenologic differences between PTSD and depressive disorders increase the likelihood of poorly aligned and inconsistent treatment plans, and this lack of clarity may, in turn, compromise effective patient care. To address some of these diagnostic challenges, the VA and DoD incorporate military culture training into clinicians’ curriculum to increase provider familiarity with the common stressors and challenges of military life, mandate the use of validated measures to support diagnostic decision making, and regularly review policies that influence diagnostic practices.
Epidemiology
The prevalence rates for PTSD are increasing in the military, possibly stemming from the demands on service members engaged in years’ long wars. Despite the increased attention on this phenomenon, research has demonstrated that the majority of service members who deploy do not develop PTSD or significant trauma-related functional impairment.10 Furthermore, many cases of PTSD diagnosed in the MHS stem from traumatic experiences other than combat exposure, including childhood abuse and neglect, sexual and other assaults, accidents and health care exposures, domestic abuse, and bullying. Depression arguably has received less attention despite comparable prevalence rates in military populations, high co-occurrence of PTSD and depression, and depression being associated with a greater odds ratio for mortality that includes death by suicide in military service members.11
Estimates of the prevalence of PTSD from the U.S. Army suggest that it exists in 3% to 6% of military members who have not deployed and in 6% to 25% of service members with combat deployment histories. The frequency and intensity of combat are strong predictors of risk.7 A recent epidemiologic study using inpatient and outpatient encounter records showed that the prevalence of PTSD in the active military component was 2.0% in the middle of calendar year (CY) 2010; a two-thirds increase from 1.2% in CY 2007.12 The incidence of PTSD 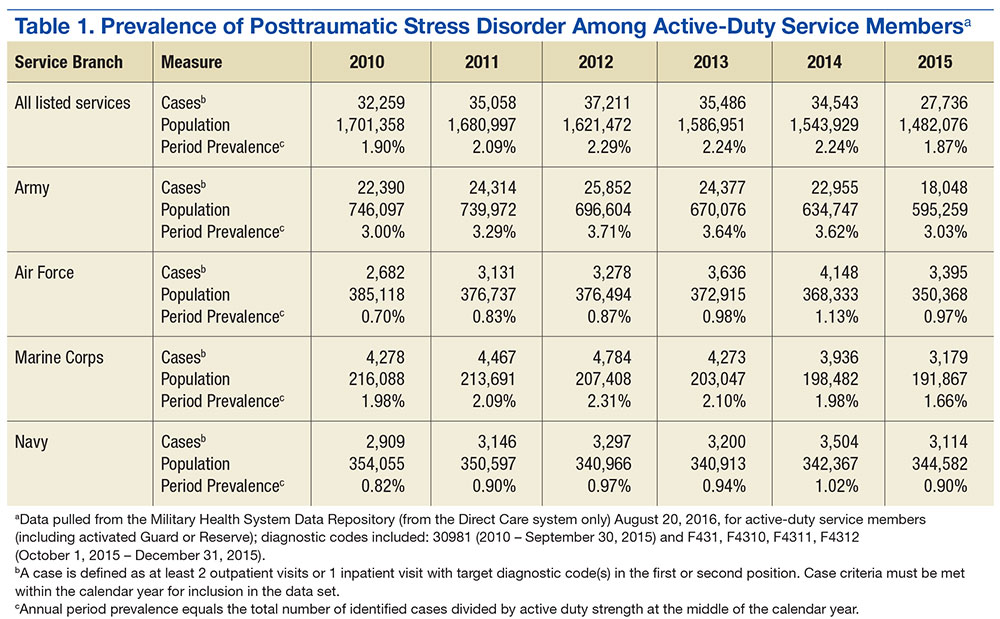
Epidemiologic studies and prevalence/incidence rates derived from administrative data rely on strict case definitions. Consequently, such administrative investigations include data only from service members 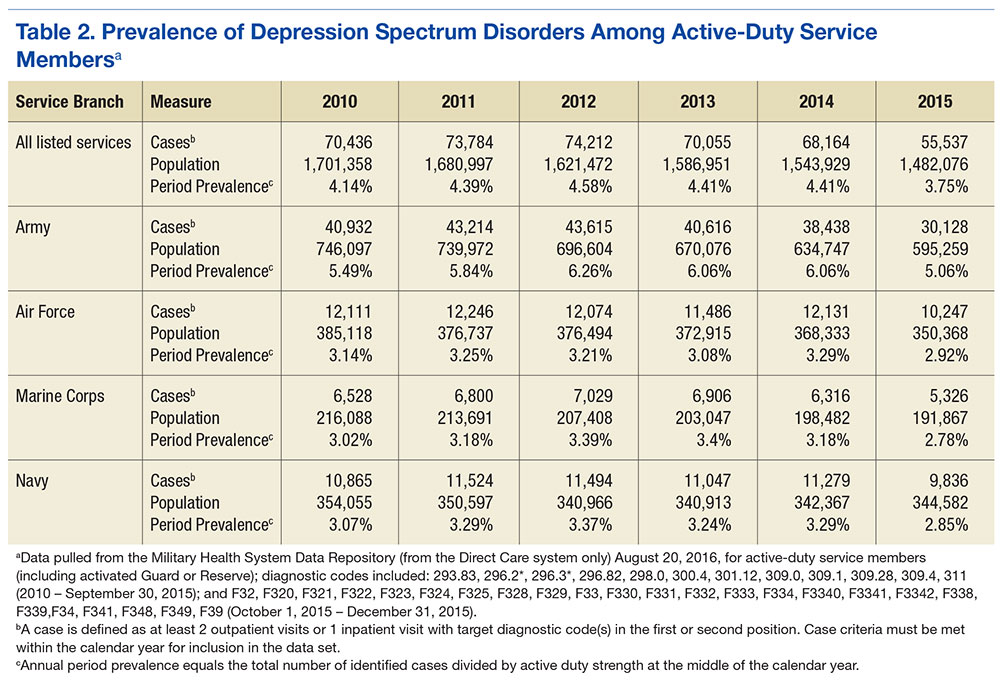
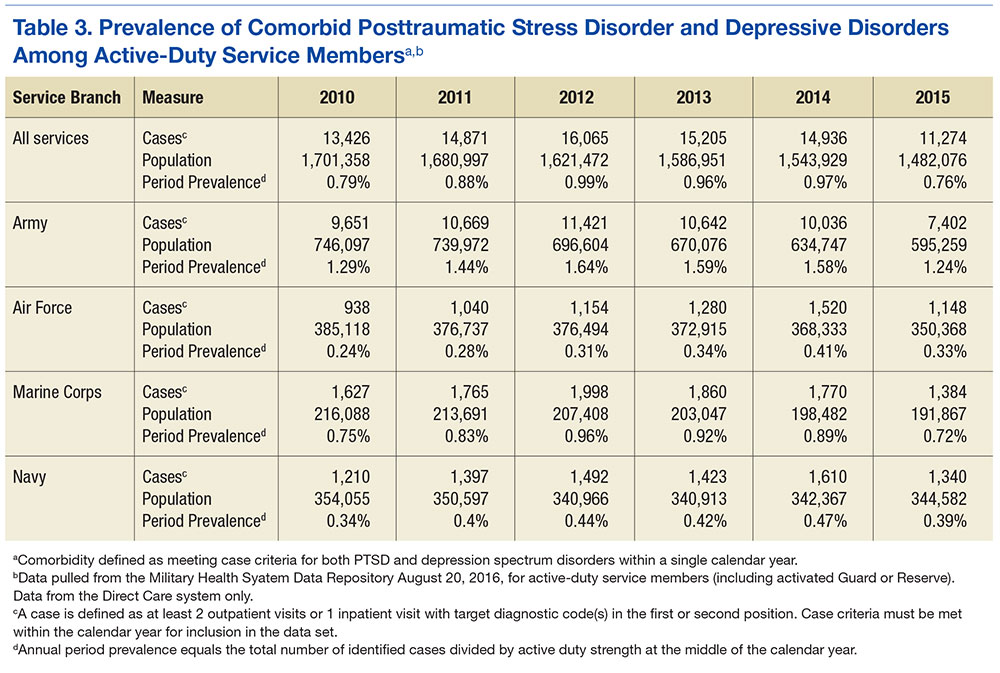
PTSD and Depression Treatment
Despite the high rates of PTSD and MDD comorbidity, few treatments have been developed for and tested on an exclusively comorbid sample of patients.13 However, psychopharmacologic agents targeting depression have been applied to the treatment of PTSD, and PTSD psychotherapy trials typically include depression response as a secondary outcome. The generalizability of findings to a truly comorbid population may be limited based on study sampling frames and the unique characteristics of patients with comorbid PTSD and depression.14-16 Several psychopharmacologic treatments for depression have been evaluated as frontline treatments for PTSD. The 3 pharmacologic treatments that demonstrate efficacy in treating PTSD include fluoxetine, paroxetine, and venlafaxine.17
Although these pharmacologic agents represent good candidate treatments for comorbid patients, the effect size of pharmacologic treatments are generally smaller than those of psychotherapeutic treatments for PTSD.17,18 This observation, however, is based on indirect comparisons, and a recent systematic review concluded that the evidence was insufficient to determine the comparative effectiveness between psychotherapy and pharmacotherapy for PTSD.19 Evidence indicates that trauma-focused cognitive behavioral therapies consistently demonstrate efficacy and effectiveness in treating PTSD.19,20 These treatments also have been shown to significantly reduce depressive symptoms among PTSD samples.21
Based on strong bodies of evidence, these pharmacologic and psychological treatments have received the highest level of recommendation in the VA and DoD.22,23 Accordingly, both agencies have invested considerable resources in large-scale efforts to improve patient access to these particular treatments. Despite these impressive implementation efforts, however, the limitations of relying exclusively on these treatments as frontline approaches within large health care systems have become evident.24-26
Penetration of Therapies
Penetration of these evidence-based treatments (EBTs) within the DoD and VHA remains limited. For instance, one study showed that VA clinicians in mental health specialty care clinics may provide only about 4 hours of EBT per week.27
Other reports suggest that only about 60% of treatment-seeking patients in PTSD clinics receive any type of evidence-based therapy and that within-session care quality is questionable based on a systematic review of chart notes.28,29 Attrition in trauma-focused therapy is a recognized limitation, with 1 out of 3 treatment-seeking patients not completing a full dose of evidence-based treatment.30-33 Large-scale analyses of VHA and DoD utilization data suggest that the majority of PTSD patients do not receive a sufficient number of sessions to be characterized as an adequate dose of EBT, with a majority of dropouts occur- ring after just a few sessions.34-37
Hoge and colleagues found that < 50% of soldiers meeting criteria for PTSD received any mental health care within the prior 6 months with one-quarter of those patients dropping out of care prematurely.38 Among a large cohort of soldiers engaged in care for the treatment of PTSD, only about 40% received a number of EBT treatment sessions that could qualify as an adequate dose.38 Thus, although major advancements in the development and implementation of effective treatments for PTSD and depression have occurred, the penetration of these treatments is limited, and the majority of patients in need of treatment potentially receive inadequate care.39
System level approaches that integrate behavioral health services into the primary care system have been proposed to address these care gaps for service members and veterans.40-42 Fundamentally, system-level approaches seek to improve the reach and effectiveness of care through large-scale screening efforts, a greater emphasis on the quality of patient care, and enhanced care continuity across episodes of treatment.
Primary Care
With the primary care setting considered the de facto mental health system, integrated approaches enhance the reach of care by incorporating uniform mental health screening and referral for patients coming through primary care. Specific evidence-based treatments can be integrated into this approach within a stepped-care framework that aims to match patients strategically to the right type of care and leverage specialty care resources as needed. Integrated care approaches for the treatment of PTSD and depression have been developed and evaluated inside and outside of the MHS. Findings indicate that integrated treatment approaches can improve care access, care continuity, patient satisfaction, quality of care,and in several trials, PTSD and depression outcomes.43-47
Recently, an integrated care approach targeting U.S. Army soldiers who screened positive for PTSD or depression in primary care was evaluated in a multisite effectiveness trial.48 Patients randomized to the treatment approach experienced significant improvements in both PTSD and depression symptoms relative to patients in usual care.43 In addition, patients treated in this care model received significantly more mental health services; the patterns of care indicated that patients with comorbid PTSD and depression were more likely to be triaged to specialty care, whereas patients with a single diagnosis were more likely to be managed in primary care.49 This trial suggests that integrated care models feasibly can be implemented in the U.S. Army care system, yielding increased uptake of mental health care, more efficiently matched care based on patient comorbidities, and improved PTSD and depression outcomes.
Treatment Research
The MHS supports a large portfolio of research in PTSD and depression through DoD/VA research consortia (eg, the Congressionally Directed Medical Research Program, the Consortium to Alleviate PTSD, the Injury and Traumatic Stress Clinical Consortium). The U.S. Army Medical Research and Materiel Command (USAMRMC) executes and manages the portfolio of research, relying on a joint program committee of DoD and non-DoD experts to make funding recommendations based on identified research priorities, policy guidance, and knowledge translation needs.
Health systems research on PTSD and MDD in federal health care settings is expanding. For example, the RAND Corporation recently evaluated a candidate set of quality measures for PTSD and MDD, using an operational definition of an episode of care.37 This work is intended to inform efforts to measure and improve the quality of care for PTSD and depression across the enterprise.
The DoD Defense Centers of Excellence for Psychological Health and Traumatic Brain Injury is simultaneously completing an inferential assessment of adjunctive mental health care services, many focused on PTSD and depression, throughout the health care enterprise. Along with the substantial resources devoted to research on PTSD and depression, the MHS is implementing strategies to improve the system of care for service members with mental health conditions.
Army Care System Innovations
The U.S. Army is engaged in a variety of strategies to improve the identification of patients with mental health conditions, increase access to mental health services, and enhance the quality of care that soldiers receive for PTSD and depression. To improve the coordination of mental health care, the U.S. Army Medical Command implemented a wide-scale innovative transformation of its mental health care system through the establishment of the Behavioral Health Service Line program management office.
This move eliminated separate departments of psychiatry, psychology, and social work in favor of integrated behavioral health departments that are now responsible for all mental health care delivered to soldiers, including inpatient, outpatient, partial hospitalization, residential, embedded care in garrison, and primary care settings. This transformation ensured coordination of care for soldiers, eliminating potential miscommunication with patients, commands, and other clinicians while clearly defining performance indicators in process (eg, productivity, scheduling, access to care, and patient satisfaction) and outcome measures.49 In conjunction with the development of its service line, the U.S. Army created a Behavioral Health Data Portal (BHDP), an electronic and standardized means to assess clinical outcomes for common conditions.
To promote higher quality mental health care, the Office of the Surgeon General of the U.S. Army provided direct guidance on the treatment of PTSD and depression. U.S. Army policy mandates that providers treating mental health conditions adhere to the VA/DoD clinical practice guidelines (CPGs) and that soldiers with PTSD and depression be offered treatments with the highest level of scientific support and that outcome measures be routinely administered. In line with the CPGs, U.S. Army policy also recommends the use of both integrated and embedded mental health care approaches to address PTSD, depression, and other common physical and psychological health conditions.
To reduce stigma and improve mental health care access, the U.S. Army began implementing integrated care approaches in 2007 with its Re-Engineering Systems of Primary Care Treatment in the Military (RESPECT-Mil) program, an evidence-based collaborative care model.51-55 This approach included structured screening and diagnostic procedures, predictable follow-up schedules for patients, and the coordination of the divisions of responsibility among and between primary care providers, paraprofessionals, and behavioral health care providers. From 2007 to 2013, this collaborative care model was rolled out across 96 clinics worldwide and provided PTSD and depression screening to more than 1 million encounters per year.52,53
More recently, the U.S. Army led DoD in integrating behavioral health personnel in patient centered medical homes (PCMH) in compliance with DoD Instruction 6490.15.56 This hybrid integrated care model combines collaborative care elements developed in the RESPECT-Mil program with elements of the U.S. Air Force Behavioral Health Optimization project colocating behavioral health providers in primary care settings to provide brief consultative services.
MHS Care Enhancements
Many of the innovations deployed throughout the U.S. Army system of behavioral health care have driven changes across the MHS as a whole. The DoD and the VA have made substantive systemwide policy and practice changes to improve care for beneficiaries with PTSD, depression, and comorbid PTSD and depression. In particular, significant implementation efforts have addressed population screening strategies, outcome monitoring to support measurement-based care, increased access to effective care, and revision of the disability evaluation system.
To improve the identification and referral of soldiers with deployment-related mental health concerns, the DoD implemented a comprehensive program that screens service members prior to deployment, immediately on redeployment, and then again 6 months after returning from deployment. Additionally, annual primary care- based screening requirements have been instituted as part of the DoD PCMH initiative. Both deployment-related and primary care-based screenings include an instrumentation to detect symptoms of PTSD and depression and extend the reach of mental health screening to the entire MHS population.
Building on the success of BHDP, former Assistant Secretary of Defense for Health Affairs Jonathan Woodson mandated BHDP use across the MHS for all patients in DoD behavioral health clinics and the use of outcome measures for the treatment of PTSD, anxiety, depression, and alcohol use disorders.57 A DoD-wide requirement to use the PTSD checklist and patient health questionnaire to monitor PTSD and depression symptoms at mental health intakes and regularly at follow-up visits is being implemented. The Defense Centers of Excellence for Psychological Health and Traumatic Brain Injury, through its Practice-Based Implementation Network (underwritten by a Joint Incentive Fund managed between DoD and VA), has worked across the MHS and the VA to facilitate the implementation, uptake, and adoption of this initiative.
The DoD established the Center for Deployment Psychology (CDP) in 2006 to promote clinician training in EBTs with the aim of increasing service members’ access to effective psychological treatments. Since its inception, the CDP has provided EBT training to more than 40,000 behavioral health providers. Although the impact of these and other efforts on improving the quality of care that patients receive is unknown, a recent study documented widespread self-reported usage of EBT components in U.S. Army clinics and that providers formally trained in EBTs were more likely to deliver EBTs.58
Finally, systemwide changes to the VA Schedule of Ratings for Disability (VASRD) and integration of DoD and VA disability evaluation systems have led to shifts in diagnosis toward PTSD that usually merit a minimum 50% disability rating. Mandates in law require military clinicians to evaluate patients who have deployed for PTSD and TBI prior to taking any actions associated with administrative separation. The practice of attributing PTSD symptoms to character pathology or personality disorders, even when these symptoms did not clearly manifest or worsen with military service, has likely been eliminated from practice in military and veteran populations.
Robust policy changes to limit personality disorder discharges started in fiscal year 2007, when there were 4,127 personality disorder separations across DoD. This number was reduced to 300 within 5 years. Policy changes regarding separation not only seem to have affected discharges, but also may have shaped diagnostic practice. The incidence rate of personality disorder diagnoses declined from 513 per 100,000 person-years in 2007 to 284 per 100,000 person-years by 2011.59 The VASRD recognizes chronic adjustment disorder as a disability, and the National Defense Authorization Act of 2008 mandated that DoD follow disability guidelines promulgated by VA.
As stated in the memorandum Clinical Policy Guidance for Assessment and Treatment of Post-Traumatic Stress Disorders (August 24, 2012), DoD recognizes chronic adjustment disorder as an unfitting condition that merits referral to its disability evaluation system.60 Acute adjustment disorders may still lead to administrative separations, as many service members manifest emotional symptoms stemming from the failure to adjust to the routine vicissitudes of military life. Finally, many court jurisdictions, including veteran’s courts, military courts, and commanders empowered to adjudicate nonjudicial infractions under the Uniform Code of Military Justice, have recognized PTSD as grounds for the mitigation of penalties associated with a wide array of criminal and administrative infractions.
Conclusion
In response to the increased mental health burden following a decade of war and the associated pressures stemming from federal mandates, the MHS has invested unprecedented resources into improving care for military service members. The U.S. Army has played a prominent role in this endeavor by investing in clinical research efforts to accelerate discovery on the causes and cures for these conditions, enacting policies that mandate best practices, and implementing evidence-based care approaches across the system of care. Despite this progress, however, understanding and effectively treating the most prevalent mental health conditions remain a challenge across the DoD and VHA health care systems. Many service members and veterans still do not receive timely, high-quality care for PTSD, depression, and other common comorbidities associated with military experience, and controversies in diagnostic clarification abound.
In short, great strides have been made, yet there is still a large distance to go. The vision of an effective, efficient, comprehensive care system for mental health conditions will continue to be pursued and achieved through collaborations across key agencies and the scientific community, implementation of health system approaches that support population care, and the sustained efforts of dedicated clinicians, staff, and clinic leaders who deliver the care to our service members and veterans.
1. The White House, Office of the Press Secretary. Executive Order 13625: Improving Access to Mental Health Services for Veterans, Service Members, and Military Families. https://www.whitehouse.gov/the-press-office/2012/08/31/executive-order-improving-access-mental-health-services-veterans-service. Published August 31, 2012. Accessed September 20, 2016.
2. American Psychiatric Association. Diagnostic and Statistical Manual of Mental Disorders. 3rd ed. Arlington, VA: American Psychiatric Association Press; 1980.
3. Mayes R, Horwitz AV. DSM-III and the revolution in the classification of mental illness. J Hist Behav Sci. 2005;41(3):249-267.
4. American Psychiatric Association. Diagnostic and Statistical Manual of Mental Disorders. 5th ed. Arlington, VA: American Psychiatric Association Press; 2013.
5. American Psychiatric Association. Diagnostic and Statistical Manual of Mental Disorders. 4th ed., text rev. Arlington, VA: American Psychiatric Association Press; 2000.
6. Hoge CW, Riviere LA, Wilk JE, Herrell RK, Weathers FW. The prevalence of post-traumatic stress disorder (PTSD) in US combat soldiers: a head-to-head comparison of DSM-5 versus DSM-IV-TR symptom criteria with the PTSD checklist. Lancet Psychiatry. 2014;1(4):269-277.
7. OTSG-MEDCOM. Policy Memo 14-094: Policy Guidance on the Assessment and Treatment of Posttraumatic Stress Disorder (PTSD). Published December 18, 2014.
8. Insel T, Cuthbert B, Garvey M, et al. Research domain criteria (RDoC): toward a new classification framework for research on mental disorders. Am J Psychiatry, 2010;167(7):748-751.
9. National Institute of Mental Health. NIMH strategic plan for research. http://www.nimh.nih.gov/about/strategic-planning-reports/index.shtml. Revised 2015. Accessed September 20, 2016.
10. Colston M, Hocter W. Forensic aspects of posttraumatic stress disorder. In: Ritchie EC, ed. Forensic and Ethical Issues in Military Behavioral Health. Washington, DC: U.S. Department of the Army; 2015:97-110.
11. Defense Centers of Excellence for Psychological Health and Traumatic Brain Injury. National Center for Telehealth and Technology. Department of Defense suicide event report: calendar year 2013 annual report. http://t2health.dcoe.mil/programs/dodser. Published January 13, 2015. Accessed September 20, 2016.
12. Otto JL, O’Donnell FL, Ford SA, Ritschard HV. Selected mental health disorders among active component members, US Armed Forces, 2007-2010. MSMR. 2010;17(11):2-5.
13. Gutner CA, Galovski T, Bovin MJ, Schnurr PP. Emergence of transdiagnostic treatments for PTSD and posttraumatic distress. Curr Psychiatry Rep. 2016;18(10):95-101.
14. Campbell DG, Felker BL, Liu CF, et al. Prevalence of depression-PTSD comorbidity: implications for clinical practice guidelines and primary care-based interventions. J Gen Intern Med. 2007;22(6):711-718.
15. Chan D, Cheadle AD, Reiber G, Unützer J, Chaney EF. Health care utilization and its costs for depressed veterans with and without comorbid PTSD symptoms. Psychiatr Serv. 2009;60(12):1612-1617.
16. Maguen S, Cohen B, Cohen G, Madden E, Bertenthal D, Seal K. Gender differences in health service utilization among Iraq and Afghanistan veterans with posttraumatic stress disorder. J Womens Health (Larchmt). 2012;21(6):666-673.
17. Hoskins M, Pearce J, Bethell A, et al. Pharmacotherapy for post-traumatic stress disorder: systematic review and meta-analysis. Br J Psychiatry. 2015;206(2):93-100.
18. Puetz TW, Youngstedt SD, Herring MP. Effects of pharmacotherapy on combat-related PTSD, anxiety, and depression: a systematic review and meta-regression analysis. PLoS One. 2015;10(5):e0126529.
19. Jonas DE, Cusack K, Forneris CA, et al. Psychological and pharmacological treatments for adults with posttraumatic stress disorder (PTSD). Comparative effectiveness review no. 92. https://effectivehealthcare.ahrq.gov/ehc/products/347/1435/PTSD-adult-treatment-report-130403.pdf. Published April 3, 2013. Accessed September 20, 2016.
20. Haagen JFG, Smid GE, Knipscheer JW, Kleber RJ. The efficacy of recommended treatments for veterans with PTSD: a metaregression analysis. Clin Psychol Rev. 2015;40:184-194.
21. Tran K, Moulton K, Santesso N, Rabb D. Cognitive processing therapy for post-traumatic stress disorder: a systematic review and meta-analysis. https://www.cadth.ca/cognitive-processing-therapy-post-traumatic-stress-disorder-systematic-review-and-meta-analysis. Published August 11, 2015. Accessed September 20, 2016.
22. VA/DoD Management of Post-Traumatic Stress Working Group. VA/DoD Clinical Practice Guideline for Management of Post-Traumatic Stress. Version 2. http://www.healthquality.va.gov/guidelines/MH/ptsd/. Published October, 2010. Accessed September 20, 2016.
23. VA/DoD Management of Major Depressive Disorder Working Group. VA/DoD Clinical Practice Guideline for the Management of Major Depressive Disorder. Version 3. http://www.healthquality.va.gov/guidelines/mh/mdd/index.asp. Published April 2016. Accessed September 20, 2016.
24. Zatzick DF, Galea S. An epidemiologic approach to the development of early trauma focused intervention. J Trauma Stress. 2007;20(4):401-412.
25. Zatzick DF, Koepsell T, Rivara FP. Using target population specification, effect size, and reach to estimate and compare the population impact of two PTSD preventive interventions. Psychiatry. 2009;72(4):346-359.
26. Glasgow RE, Nelson CC, Strycker LA, King DK. Using RE-AIM metrics to evaluate diabetes self-management support interventions. Am J Prev Med. 2006;30(1):67-73.
27. Finley EP, Garcia HA, Ketchum NS, et al. Utilization of evidence-based psychotherapies in Veterans Affairs posttraumatic stress disorder outpatient clinics. Psychol Serv. 2015;12(1):73-82.
28. Mott JM, Mondragon S, Hundt NE, Beason-Smith M, Grady RH, Teng EJ. Characteristics of U.S. veterans who begin and complete prolonged exposure and cognitive processing therapy for PTSD. J Trauma Stress. 2014;27(3):265-273.
29. Shiner B, D’Avolio LW, Nguyen TM, et al. Measuring use of evidence based psychotherapy for PTSD. Adm Policy Ment Health. 2013;40(4):311-318.
30. Schnurr PP, Friedman MJ, Engel CC, et al. Cognitive behavioral therapy for posttraumatic stress disorder in women: a randomized controlled trial. JAMA. 2007;297(8):820-830.
31. Tuerk PW, Yoder M, Grubaugh A, Myrick H, Hamner M, Acierno R. Prolonged exposure therapy for combat-related posttraumatic stress disorder: an examination of treatment effectiveness for veterans of the wars in Afghanistan and Iraq. J Anxiety Disord. 2011;25(3):397-403.
32. Chard KM, Schumm JA, Owens GP, Cottingham SM. A comparison of OEF and OIF veterans and Vietnam veterans receiving cognitive processing therapy. J Trauma Stress. 2010;23(1):25-32.
33. Monson CM, Schnurr PP, Resick PA, Friedman MJ, Young-Xu Y, Stevens SP. Cognitive processing therapy for veterans with military-related posttraumatic stress disorder. J Consult Clin Psychol. 2006;74(5):898-907.
34. Mott JM, Hundt NE, Sansgiry S, Mignogna J, Cully JA. Changes in psychotherapy utilization among veterans with depression, anxiety, and PTSD. Psychiatr Serv. 2014;65(1):106-112.
35. Seal KH, Maguen S, Cohen B, et al. VA mental health services utilization in Iraq and Afghanistan veterans in the first year of receiving new mental health diagnoses. J Trauma Stress. 2010;23(1):5-16.
36. Russell M, Silver SM. Training needs for the treatment of combat-related posttraumatic stress disorder: a survey of Department of Defense clinicians. Traumatology. 2007;13(3):4-10.
37. Schell TL, Marshall GN. Survey of individuals previously deployed for OEF/OIF. In: Tanielian T, Jaycox LH, eds. Invisible Wounds of War: Psychological and Cognitive Injuries, Their Consequences, and Services to Assist Recovery. Santa Monica, CA: RAND Corporation; 2008:87-118.
38. Hoge CW, Grossman SH, Auchterlonie JL, Riviere LA, Milliken CS, >Wilk JE. PTSD treatment for soldiers after combat deployment: low utilization of mental health care and reasons for dropout. Psychiatr Serv. 2014;65(8):997-1004.
39. Committee on the Assessment of Ongoing Efforts in the Treatment of Posttraumatic Stress Disorder, Board on the Health of Select Populations, Institute of Medicine. Treatment for Posttraumatic Stress Disorder in Military and Veteran Populations: Final Assessment. Washington, DC: National Academies Press; 2014.
40. Schnurr PP. Extending collaborative care for posttraumatic mental health. JAMA Intern Med. 2016;176(7):956-957.
41. Hoge CW. Interventions for war-related posttraumatic stress disorder: meeting veterans where they are. JAMA. 2011;306(5):549-551.
42. Engel CC. Improving primary care for military personnel and veterans with posttraumatic stress disorder: the road ahead. Gen Hosp Psychiatry. 2005;27(3):158-160.
43. Engel CC, Jaycox LH, Freed MC, et al. Centrally assisted collaborative telecare management for posttraumatic stress disorder and depression in military primary care: a randomized controlled trial. JAMA Intern Med. 2016;176(7):948-956.
44. Fortney JC, Pyne JM, Kimbrell TA, et al. Telemedicine-based collaborative care for posttraumatic stress disorder: a randomized clinical trial. JAMA Psychiatry. 2015;72(1):58-67.
45. Schnurr PP, Friedman MJ, Oxman TE, et al. RESPECT-PTSD: re-engineering systems for the primary care treatment of PTSD, a randomized controlled trial. J Gen Intern Med. 2013;28(1):32-40.
46. Zatzick D, Roy-Byrne P, Russo J, et al. A randomized effectiveness trial of stepped collaborative care for acutely injured trauma survivors. Arch Gen Psychiatry. 2004;61(5):498-506.
47. Zatzick D, O’Connor SS, Russo J, et al. Technology-enhanced stepped collaborative care targeting posttraumatic stress disorder and comorbidity after injury: a randomized controlled trial. J Trauma Stress. 2015;28(5):391-400.
48. Engel CC, Bray RM, Jaycox LH, et al. Implementing collaborative primary care for depression and posttraumatic stress disorder: design and sample for a randomized trial in the U.S. Military Health System. Contemp Clin Trials. 2014;39(2):310-319.
49. Belsher BE, Jaycox LH, Freed MC, et al. Mental health utilization patterns during a stepped, collaborative care effectiveness trial for PTSD and depression in the military health system. Med Care. 2016;54(7):706-713.
50. Hepner KA, Roth CP, Farris C, et al. Measuring the Quality of Care for Psychological Health Conditions in the Military Health System: Candidate Quality Measures for Posttraumatic Stress Disorder and Major Depressive Disorder. Santa Monica, CA: RAND Corporation; 2015.
51. Engel C, Oxman T, Yamamoto C, et al. RESPECT-Mil: feasibility of a systems-level collaborative care approach to depression and post-traumatic stress disorder in military primary care. Mil Med. 2008;173(10):935-940.
52. Belsher BE, Curry J, McCutchan P, et al. Implementation of a collaborative care initiative for PTSD and depression in the Army primary care system. Soc Work Ment Health. 2014;12(5-6):500-522.
53. Wong EC, Jaycox LH, Ayer L, et al. Evaluating the Implementation of the Re-Engineering Systems of Primary Care Treatment in the Military (RESPECT-Mil). Santa Monica, CA: RAND Corporation; 2015.
54. Archer J, Bower P, Gilbody S, et al. Collaborative care for depression and anxiety problems. Cochrane Database Syst Rev. 2012;10:CD006525.
55. Woltmann E, Grogan-Kaylor A, Perron B, Georges H, Kilbourne AM, Bauer MS. Comparative effectiveness of collaborative chronic care models for mental health conditions across primary, specialty, and behavioral health care settings: systematic review and meta-analysis. Am J Psychiatry. 2012;169(8):790-804.
56. Wright JL. DoD Directive 6490.15. www.dtic.mil/whs/directives/corres/pdf/649015p.pdf.Revised November 20, 2014. Accessed October 3, 2016. 57. Woodson J. Military treatment facility mental health clinical outcomes guidance. http://dcoe.mil/Libraries/Documents/MentalHealthClinicalOutcomesGuidance_Woodson.pdf. Published September 9, 2013. Accessed October 4, 2016.
58. Wilk JE, West JC, Duffy FF, Herrell RK, Rae DS, Hoge CW. Use of evidence-based treatment for posttraumatic stress disorder in Army behavioral healthcare. Psychiatry. 2013;76(4):336-348.
59. Stockton PN, Olsen ET, Hayford S, et al. Security from within: independent review of the Washington Navy Yard shooting. http://archive.defense.gov/pubs/Independent-Review-of-the-WNY-Shooting-14-Nov-2013.pdf. Published November, 2013. Accessed September 20, 2016.
60. Woodson J. ASD(HA) Memorandum: Clinical Policy Guidance for Assessment and Treatment of Posttraumatic Stress Disorder. August 24, 2012.
Over the past decade, nationwide attention has focused on mental health conditions associated with military service. Recent legal mandates have led to changes in the DoD, VA, and HHS health systems aimed at increasing access to care, decreasing barriers to care, and expanding research on mental health conditions commonly seen in service members and veterans. On August 31, 2012, President Barack Obama signed the Improving Access to Mental Health Services for Veterans, Service Members, and Military Families executive order, establishing an interagency task force from the VA, DoD, and HHS.1 The task force was charged with addressing quality of care and provider training in the management of commonly comorbid conditions, including (among other conditions) posttraumatic stress disorder (PTSD) and depression.
Depression and PTSD present major health burdens in both military and veteran cohorts. Overlap in clinical presentation and significant rates of comorbidity complicate effective management of these conditions. This article offers a brief review of the diagnostic and epidemiologic complexities associated with PTSD and depression, a summary of research relevant to these issues, and a description of recent system-level developments within the Military Health System (MHS) designed to improve care through better approaches in identification, management, and research of these conditions.
Diagnostic Uncertainty
Both PTSD and major depressive disorder (MDD) have been recognized as mental health disorders since the American Psychiatric Association’s Diagnostic and Statistical Manual (DSM) discarded its previous etiologically based approach to diagnostic classification in 1980 in favor of a system in which diagnosis is based on observable symptoms.2,3 With the release of DSM-5 in 2013, the diagnostic criteria for PTSD underwent a substantial transformation.4 Previously, PTSD was described as an anxiety disorder, and some of its manifestations overlapped descriptively (and in many cases, etiologically) with anxiety and depressive illnesses.5
Clinicians also often described shorter-lived, developmental, formes fruste, or otherwise subsyndromal manifestations of trauma associated with PTSD. In DSM-5, PTSD was removed from the anxiety disorders section and placed in a new category of disorders labeled Trauma and Stressor-Related Disorders. This new category also included reactive attachment disorder (in children), acute stress disorder, adjustment disorders, and unspecified or other trauma and stressor-related disorders. Other major changes to the PTSD diagnostic criteria included modification to the DSM-IV-TR (text revision) trauma definition (making the construct more specific), removal of the requirement for explicit subjective emotional reaction to a traumatic event, and greater emphasis on negative cognitions and mood. Debate surrounds the updated symptom criteria with critics questioning whether there is any improvement in the clinical utility of the diagnosis, especially in light of the substantial policy and practice implications the change engenders.6
Recently, Hoge and colleagues examined the psychometric implications of the diagnostic changes (between DSM-IV-TR and DSM-5) in the PTSD definition.6 The authors found that although the 2 definitions showed nearly identical association with other psychiatric disorders (including depression) and functional impairment, 30% of soldiers who met DSM-IV-TR criteria for PTSD failed to meet criteria in DSM-5, and another 20% met only DSM-5 criteria. Recognizing discordance in PTSD and associated diagnoses, the U.S. Army Medical Command mandated that its clinicians familiarize themselves with the controversies surrounding the discordant diagnoses and coding of subthreshold PTSD.7
Adding to the problem of diagnostic uncertainty, the clinical presentation of MDD includes significant overlap with that of PTSD. Specifically, symptoms of guilt, diminished interests, problems with concentration, and sleep disturbances are descriptive of both disorders. Furthermore, the criteria set for several subthreshold forms of MDD evidence considerable overlap with PTSD symptoms. For example, diagnostic criteria for disruptive mood dysregulation disorder include behavioral outbursts and irritability, and diagnostic criteria for dysthymia include sleep disturbances and concentration problems.
Adjustment disorders are categorized as trauma and stressor-related disorders in DSM-5 and hold many emotional and behavioral symptoms in common with PTSD. The “acute” and “chronic” adjustment disorder specifiers contribute to problems in diagnostic certainty for PTSD. In general, issues pertaining to diagnostic uncertainty and overlap likely reflect the limits of using a diagnostic classification system that relies exclusively on observational and subjective reports of psychological symptoms.8,9
In a treatment environment where a veteran or active-duty patient has presented for care, in the face of these shared symptom sets, clinicians frequently offer initial diagnoses. These diagnoses are often based on perceived etiologic factors derived from patients’ descriptions of stressors encountered during military service. This tendency likely contributes to considerable inconsistencies and potential inaccuracies in diagnoses, and much of the variance can be attributed to the clinicians’ degree of familiarity with military exposures, perceptions of what constitutes trauma, and outside pressure to assign or avoid specific diagnoses.
Importantly, the phenomenologic differences between PTSD and depressive disorders increase the likelihood of poorly aligned and inconsistent treatment plans, and this lack of clarity may, in turn, compromise effective patient care. To address some of these diagnostic challenges, the VA and DoD incorporate military culture training into clinicians’ curriculum to increase provider familiarity with the common stressors and challenges of military life, mandate the use of validated measures to support diagnostic decision making, and regularly review policies that influence diagnostic practices.
Epidemiology
The prevalence rates for PTSD are increasing in the military, possibly stemming from the demands on service members engaged in years’ long wars. Despite the increased attention on this phenomenon, research has demonstrated that the majority of service members who deploy do not develop PTSD or significant trauma-related functional impairment.10 Furthermore, many cases of PTSD diagnosed in the MHS stem from traumatic experiences other than combat exposure, including childhood abuse and neglect, sexual and other assaults, accidents and health care exposures, domestic abuse, and bullying. Depression arguably has received less attention despite comparable prevalence rates in military populations, high co-occurrence of PTSD and depression, and depression being associated with a greater odds ratio for mortality that includes death by suicide in military service members.11
Estimates of the prevalence of PTSD from the U.S. Army suggest that it exists in 3% to 6% of military members who have not deployed and in 6% to 25% of service members with combat deployment histories. The frequency and intensity of combat are strong predictors of risk.7 A recent epidemiologic study using inpatient and outpatient encounter records showed that the prevalence of PTSD in the active military component was 2.0% in the middle of calendar year (CY) 2010; a two-thirds increase from 1.2% in CY 2007.12 The incidence of PTSD
Epidemiologic studies and prevalence/incidence rates derived from administrative data rely on strict case definitions. Consequently, such administrative investigations include data only from service members
PTSD and Depression Treatment
Despite the high rates of PTSD and MDD comorbidity, few treatments have been developed for and tested on an exclusively comorbid sample of patients.13 However, psychopharmacologic agents targeting depression have been applied to the treatment of PTSD, and PTSD psychotherapy trials typically include depression response as a secondary outcome. The generalizability of findings to a truly comorbid population may be limited based on study sampling frames and the unique characteristics of patients with comorbid PTSD and depression.14-16 Several psychopharmacologic treatments for depression have been evaluated as frontline treatments for PTSD. The 3 pharmacologic treatments that demonstrate efficacy in treating PTSD include fluoxetine, paroxetine, and venlafaxine.17
Although these pharmacologic agents represent good candidate treatments for comorbid patients, the effect size of pharmacologic treatments are generally smaller than those of psychotherapeutic treatments for PTSD.17,18 This observation, however, is based on indirect comparisons, and a recent systematic review concluded that the evidence was insufficient to determine the comparative effectiveness between psychotherapy and pharmacotherapy for PTSD.19 Evidence indicates that trauma-focused cognitive behavioral therapies consistently demonstrate efficacy and effectiveness in treating PTSD.19,20 These treatments also have been shown to significantly reduce depressive symptoms among PTSD samples.21
Based on strong bodies of evidence, these pharmacologic and psychological treatments have received the highest level of recommendation in the VA and DoD.22,23 Accordingly, both agencies have invested considerable resources in large-scale efforts to improve patient access to these particular treatments. Despite these impressive implementation efforts, however, the limitations of relying exclusively on these treatments as frontline approaches within large health care systems have become evident.24-26
Penetration of Therapies
Penetration of these evidence-based treatments (EBTs) within the DoD and VHA remains limited. For instance, one study showed that VA clinicians in mental health specialty care clinics may provide only about 4 hours of EBT per week.27
Other reports suggest that only about 60% of treatment-seeking patients in PTSD clinics receive any type of evidence-based therapy and that within-session care quality is questionable based on a systematic review of chart notes.28,29 Attrition in trauma-focused therapy is a recognized limitation, with 1 out of 3 treatment-seeking patients not completing a full dose of evidence-based treatment.30-33 Large-scale analyses of VHA and DoD utilization data suggest that the majority of PTSD patients do not receive a sufficient number of sessions to be characterized as an adequate dose of EBT, with a majority of dropouts occur- ring after just a few sessions.34-37
Hoge and colleagues found that < 50% of soldiers meeting criteria for PTSD received any mental health care within the prior 6 months with one-quarter of those patients dropping out of care prematurely.38 Among a large cohort of soldiers engaged in care for the treatment of PTSD, only about 40% received a number of EBT treatment sessions that could qualify as an adequate dose.38 Thus, although major advancements in the development and implementation of effective treatments for PTSD and depression have occurred, the penetration of these treatments is limited, and the majority of patients in need of treatment potentially receive inadequate care.39
System level approaches that integrate behavioral health services into the primary care system have been proposed to address these care gaps for service members and veterans.40-42 Fundamentally, system-level approaches seek to improve the reach and effectiveness of care through large-scale screening efforts, a greater emphasis on the quality of patient care, and enhanced care continuity across episodes of treatment.
Primary Care
With the primary care setting considered the de facto mental health system, integrated approaches enhance the reach of care by incorporating uniform mental health screening and referral for patients coming through primary care. Specific evidence-based treatments can be integrated into this approach within a stepped-care framework that aims to match patients strategically to the right type of care and leverage specialty care resources as needed. Integrated care approaches for the treatment of PTSD and depression have been developed and evaluated inside and outside of the MHS. Findings indicate that integrated treatment approaches can improve care access, care continuity, patient satisfaction, quality of care,and in several trials, PTSD and depression outcomes.43-47
Recently, an integrated care approach targeting U.S. Army soldiers who screened positive for PTSD or depression in primary care was evaluated in a multisite effectiveness trial.48 Patients randomized to the treatment approach experienced significant improvements in both PTSD and depression symptoms relative to patients in usual care.43 In addition, patients treated in this care model received significantly more mental health services; the patterns of care indicated that patients with comorbid PTSD and depression were more likely to be triaged to specialty care, whereas patients with a single diagnosis were more likely to be managed in primary care.49 This trial suggests that integrated care models feasibly can be implemented in the U.S. Army care system, yielding increased uptake of mental health care, more efficiently matched care based on patient comorbidities, and improved PTSD and depression outcomes.
Treatment Research
The MHS supports a large portfolio of research in PTSD and depression through DoD/VA research consortia (eg, the Congressionally Directed Medical Research Program, the Consortium to Alleviate PTSD, the Injury and Traumatic Stress Clinical Consortium). The U.S. Army Medical Research and Materiel Command (USAMRMC) executes and manages the portfolio of research, relying on a joint program committee of DoD and non-DoD experts to make funding recommendations based on identified research priorities, policy guidance, and knowledge translation needs.
Health systems research on PTSD and MDD in federal health care settings is expanding. For example, the RAND Corporation recently evaluated a candidate set of quality measures for PTSD and MDD, using an operational definition of an episode of care.37 This work is intended to inform efforts to measure and improve the quality of care for PTSD and depression across the enterprise.
The DoD Defense Centers of Excellence for Psychological Health and Traumatic Brain Injury is simultaneously completing an inferential assessment of adjunctive mental health care services, many focused on PTSD and depression, throughout the health care enterprise. Along with the substantial resources devoted to research on PTSD and depression, the MHS is implementing strategies to improve the system of care for service members with mental health conditions.
Army Care System Innovations
The U.S. Army is engaged in a variety of strategies to improve the identification of patients with mental health conditions, increase access to mental health services, and enhance the quality of care that soldiers receive for PTSD and depression. To improve the coordination of mental health care, the U.S. Army Medical Command implemented a wide-scale innovative transformation of its mental health care system through the establishment of the Behavioral Health Service Line program management office.
This move eliminated separate departments of psychiatry, psychology, and social work in favor of integrated behavioral health departments that are now responsible for all mental health care delivered to soldiers, including inpatient, outpatient, partial hospitalization, residential, embedded care in garrison, and primary care settings. This transformation ensured coordination of care for soldiers, eliminating potential miscommunication with patients, commands, and other clinicians while clearly defining performance indicators in process (eg, productivity, scheduling, access to care, and patient satisfaction) and outcome measures.49 In conjunction with the development of its service line, the U.S. Army created a Behavioral Health Data Portal (BHDP), an electronic and standardized means to assess clinical outcomes for common conditions.
To promote higher quality mental health care, the Office of the Surgeon General of the U.S. Army provided direct guidance on the treatment of PTSD and depression. U.S. Army policy mandates that providers treating mental health conditions adhere to the VA/DoD clinical practice guidelines (CPGs) and that soldiers with PTSD and depression be offered treatments with the highest level of scientific support and that outcome measures be routinely administered. In line with the CPGs, U.S. Army policy also recommends the use of both integrated and embedded mental health care approaches to address PTSD, depression, and other common physical and psychological health conditions.
To reduce stigma and improve mental health care access, the U.S. Army began implementing integrated care approaches in 2007 with its Re-Engineering Systems of Primary Care Treatment in the Military (RESPECT-Mil) program, an evidence-based collaborative care model.51-55 This approach included structured screening and diagnostic procedures, predictable follow-up schedules for patients, and the coordination of the divisions of responsibility among and between primary care providers, paraprofessionals, and behavioral health care providers. From 2007 to 2013, this collaborative care model was rolled out across 96 clinics worldwide and provided PTSD and depression screening to more than 1 million encounters per year.52,53
More recently, the U.S. Army led DoD in integrating behavioral health personnel in patient centered medical homes (PCMH) in compliance with DoD Instruction 6490.15.56 This hybrid integrated care model combines collaborative care elements developed in the RESPECT-Mil program with elements of the U.S. Air Force Behavioral Health Optimization project colocating behavioral health providers in primary care settings to provide brief consultative services.
MHS Care Enhancements
Many of the innovations deployed throughout the U.S. Army system of behavioral health care have driven changes across the MHS as a whole. The DoD and the VA have made substantive systemwide policy and practice changes to improve care for beneficiaries with PTSD, depression, and comorbid PTSD and depression. In particular, significant implementation efforts have addressed population screening strategies, outcome monitoring to support measurement-based care, increased access to effective care, and revision of the disability evaluation system.
To improve the identification and referral of soldiers with deployment-related mental health concerns, the DoD implemented a comprehensive program that screens service members prior to deployment, immediately on redeployment, and then again 6 months after returning from deployment. Additionally, annual primary care- based screening requirements have been instituted as part of the DoD PCMH initiative. Both deployment-related and primary care-based screenings include an instrumentation to detect symptoms of PTSD and depression and extend the reach of mental health screening to the entire MHS population.
Building on the success of BHDP, former Assistant Secretary of Defense for Health Affairs Jonathan Woodson mandated BHDP use across the MHS for all patients in DoD behavioral health clinics and the use of outcome measures for the treatment of PTSD, anxiety, depression, and alcohol use disorders.57 A DoD-wide requirement to use the PTSD checklist and patient health questionnaire to monitor PTSD and depression symptoms at mental health intakes and regularly at follow-up visits is being implemented. The Defense Centers of Excellence for Psychological Health and Traumatic Brain Injury, through its Practice-Based Implementation Network (underwritten by a Joint Incentive Fund managed between DoD and VA), has worked across the MHS and the VA to facilitate the implementation, uptake, and adoption of this initiative.
The DoD established the Center for Deployment Psychology (CDP) in 2006 to promote clinician training in EBTs with the aim of increasing service members’ access to effective psychological treatments. Since its inception, the CDP has provided EBT training to more than 40,000 behavioral health providers. Although the impact of these and other efforts on improving the quality of care that patients receive is unknown, a recent study documented widespread self-reported usage of EBT components in U.S. Army clinics and that providers formally trained in EBTs were more likely to deliver EBTs.58
Finally, systemwide changes to the VA Schedule of Ratings for Disability (VASRD) and integration of DoD and VA disability evaluation systems have led to shifts in diagnosis toward PTSD that usually merit a minimum 50% disability rating. Mandates in law require military clinicians to evaluate patients who have deployed for PTSD and TBI prior to taking any actions associated with administrative separation. The practice of attributing PTSD symptoms to character pathology or personality disorders, even when these symptoms did not clearly manifest or worsen with military service, has likely been eliminated from practice in military and veteran populations.
Robust policy changes to limit personality disorder discharges started in fiscal year 2007, when there were 4,127 personality disorder separations across DoD. This number was reduced to 300 within 5 years. Policy changes regarding separation not only seem to have affected discharges, but also may have shaped diagnostic practice. The incidence rate of personality disorder diagnoses declined from 513 per 100,000 person-years in 2007 to 284 per 100,000 person-years by 2011.59 The VASRD recognizes chronic adjustment disorder as a disability, and the National Defense Authorization Act of 2008 mandated that DoD follow disability guidelines promulgated by VA.
As stated in the memorandum Clinical Policy Guidance for Assessment and Treatment of Post-Traumatic Stress Disorders (August 24, 2012), DoD recognizes chronic adjustment disorder as an unfitting condition that merits referral to its disability evaluation system.60 Acute adjustment disorders may still lead to administrative separations, as many service members manifest emotional symptoms stemming from the failure to adjust to the routine vicissitudes of military life. Finally, many court jurisdictions, including veteran’s courts, military courts, and commanders empowered to adjudicate nonjudicial infractions under the Uniform Code of Military Justice, have recognized PTSD as grounds for the mitigation of penalties associated with a wide array of criminal and administrative infractions.
Conclusion
In response to the increased mental health burden following a decade of war and the associated pressures stemming from federal mandates, the MHS has invested unprecedented resources into improving care for military service members. The U.S. Army has played a prominent role in this endeavor by investing in clinical research efforts to accelerate discovery on the causes and cures for these conditions, enacting policies that mandate best practices, and implementing evidence-based care approaches across the system of care. Despite this progress, however, understanding and effectively treating the most prevalent mental health conditions remain a challenge across the DoD and VHA health care systems. Many service members and veterans still do not receive timely, high-quality care for PTSD, depression, and other common comorbidities associated with military experience, and controversies in diagnostic clarification abound.
In short, great strides have been made, yet there is still a large distance to go. The vision of an effective, efficient, comprehensive care system for mental health conditions will continue to be pursued and achieved through collaborations across key agencies and the scientific community, implementation of health system approaches that support population care, and the sustained efforts of dedicated clinicians, staff, and clinic leaders who deliver the care to our service members and veterans.
1. The White House, Office of the Press Secretary. Executive Order 13625: Improving Access to Mental Health Services for Veterans, Service Members, and Military Families. https://www.whitehouse.gov/the-press-office/2012/08/31/executive-order-improving-access-mental-health-services-veterans-service. Published August 31, 2012. Accessed September 20, 2016.
2. American Psychiatric Association. Diagnostic and Statistical Manual of Mental Disorders. 3rd ed. Arlington, VA: American Psychiatric Association Press; 1980.
3. Mayes R, Horwitz AV. DSM-III and the revolution in the classification of mental illness. J Hist Behav Sci. 2005;41(3):249-267.
4. American Psychiatric Association. Diagnostic and Statistical Manual of Mental Disorders. 5th ed. Arlington, VA: American Psychiatric Association Press; 2013.
5. American Psychiatric Association. Diagnostic and Statistical Manual of Mental Disorders. 4th ed., text rev. Arlington, VA: American Psychiatric Association Press; 2000.
6. Hoge CW, Riviere LA, Wilk JE, Herrell RK, Weathers FW. The prevalence of post-traumatic stress disorder (PTSD) in US combat soldiers: a head-to-head comparison of DSM-5 versus DSM-IV-TR symptom criteria with the PTSD checklist. Lancet Psychiatry. 2014;1(4):269-277.
7. OTSG-MEDCOM. Policy Memo 14-094: Policy Guidance on the Assessment and Treatment of Posttraumatic Stress Disorder (PTSD). Published December 18, 2014.
8. Insel T, Cuthbert B, Garvey M, et al. Research domain criteria (RDoC): toward a new classification framework for research on mental disorders. Am J Psychiatry, 2010;167(7):748-751.
9. National Institute of Mental Health. NIMH strategic plan for research. http://www.nimh.nih.gov/about/strategic-planning-reports/index.shtml. Revised 2015. Accessed September 20, 2016.
10. Colston M, Hocter W. Forensic aspects of posttraumatic stress disorder. In: Ritchie EC, ed. Forensic and Ethical Issues in Military Behavioral Health. Washington, DC: U.S. Department of the Army; 2015:97-110.
11. Defense Centers of Excellence for Psychological Health and Traumatic Brain Injury. National Center for Telehealth and Technology. Department of Defense suicide event report: calendar year 2013 annual report. http://t2health.dcoe.mil/programs/dodser. Published January 13, 2015. Accessed September 20, 2016.
12. Otto JL, O’Donnell FL, Ford SA, Ritschard HV. Selected mental health disorders among active component members, US Armed Forces, 2007-2010. MSMR. 2010;17(11):2-5.
13. Gutner CA, Galovski T, Bovin MJ, Schnurr PP. Emergence of transdiagnostic treatments for PTSD and posttraumatic distress. Curr Psychiatry Rep. 2016;18(10):95-101.
14. Campbell DG, Felker BL, Liu CF, et al. Prevalence of depression-PTSD comorbidity: implications for clinical practice guidelines and primary care-based interventions. J Gen Intern Med. 2007;22(6):711-718.
15. Chan D, Cheadle AD, Reiber G, Unützer J, Chaney EF. Health care utilization and its costs for depressed veterans with and without comorbid PTSD symptoms. Psychiatr Serv. 2009;60(12):1612-1617.
16. Maguen S, Cohen B, Cohen G, Madden E, Bertenthal D, Seal K. Gender differences in health service utilization among Iraq and Afghanistan veterans with posttraumatic stress disorder. J Womens Health (Larchmt). 2012;21(6):666-673.
17. Hoskins M, Pearce J, Bethell A, et al. Pharmacotherapy for post-traumatic stress disorder: systematic review and meta-analysis. Br J Psychiatry. 2015;206(2):93-100.
18. Puetz TW, Youngstedt SD, Herring MP. Effects of pharmacotherapy on combat-related PTSD, anxiety, and depression: a systematic review and meta-regression analysis. PLoS One. 2015;10(5):e0126529.
19. Jonas DE, Cusack K, Forneris CA, et al. Psychological and pharmacological treatments for adults with posttraumatic stress disorder (PTSD). Comparative effectiveness review no. 92. https://effectivehealthcare.ahrq.gov/ehc/products/347/1435/PTSD-adult-treatment-report-130403.pdf. Published April 3, 2013. Accessed September 20, 2016.
20. Haagen JFG, Smid GE, Knipscheer JW, Kleber RJ. The efficacy of recommended treatments for veterans with PTSD: a metaregression analysis. Clin Psychol Rev. 2015;40:184-194.
21. Tran K, Moulton K, Santesso N, Rabb D. Cognitive processing therapy for post-traumatic stress disorder: a systematic review and meta-analysis. https://www.cadth.ca/cognitive-processing-therapy-post-traumatic-stress-disorder-systematic-review-and-meta-analysis. Published August 11, 2015. Accessed September 20, 2016.
22. VA/DoD Management of Post-Traumatic Stress Working Group. VA/DoD Clinical Practice Guideline for Management of Post-Traumatic Stress. Version 2. http://www.healthquality.va.gov/guidelines/MH/ptsd/. Published October, 2010. Accessed September 20, 2016.
23. VA/DoD Management of Major Depressive Disorder Working Group. VA/DoD Clinical Practice Guideline for the Management of Major Depressive Disorder. Version 3. http://www.healthquality.va.gov/guidelines/mh/mdd/index.asp. Published April 2016. Accessed September 20, 2016.
24. Zatzick DF, Galea S. An epidemiologic approach to the development of early trauma focused intervention. J Trauma Stress. 2007;20(4):401-412.
25. Zatzick DF, Koepsell T, Rivara FP. Using target population specification, effect size, and reach to estimate and compare the population impact of two PTSD preventive interventions. Psychiatry. 2009;72(4):346-359.
26. Glasgow RE, Nelson CC, Strycker LA, King DK. Using RE-AIM metrics to evaluate diabetes self-management support interventions. Am J Prev Med. 2006;30(1):67-73.
27. Finley EP, Garcia HA, Ketchum NS, et al. Utilization of evidence-based psychotherapies in Veterans Affairs posttraumatic stress disorder outpatient clinics. Psychol Serv. 2015;12(1):73-82.
28. Mott JM, Mondragon S, Hundt NE, Beason-Smith M, Grady RH, Teng EJ. Characteristics of U.S. veterans who begin and complete prolonged exposure and cognitive processing therapy for PTSD. J Trauma Stress. 2014;27(3):265-273.
29. Shiner B, D’Avolio LW, Nguyen TM, et al. Measuring use of evidence based psychotherapy for PTSD. Adm Policy Ment Health. 2013;40(4):311-318.
30. Schnurr PP, Friedman MJ, Engel CC, et al. Cognitive behavioral therapy for posttraumatic stress disorder in women: a randomized controlled trial. JAMA. 2007;297(8):820-830.
31. Tuerk PW, Yoder M, Grubaugh A, Myrick H, Hamner M, Acierno R. Prolonged exposure therapy for combat-related posttraumatic stress disorder: an examination of treatment effectiveness for veterans of the wars in Afghanistan and Iraq. J Anxiety Disord. 2011;25(3):397-403.
32. Chard KM, Schumm JA, Owens GP, Cottingham SM. A comparison of OEF and OIF veterans and Vietnam veterans receiving cognitive processing therapy. J Trauma Stress. 2010;23(1):25-32.
33. Monson CM, Schnurr PP, Resick PA, Friedman MJ, Young-Xu Y, Stevens SP. Cognitive processing therapy for veterans with military-related posttraumatic stress disorder. J Consult Clin Psychol. 2006;74(5):898-907.
34. Mott JM, Hundt NE, Sansgiry S, Mignogna J, Cully JA. Changes in psychotherapy utilization among veterans with depression, anxiety, and PTSD. Psychiatr Serv. 2014;65(1):106-112.
35. Seal KH, Maguen S, Cohen B, et al. VA mental health services utilization in Iraq and Afghanistan veterans in the first year of receiving new mental health diagnoses. J Trauma Stress. 2010;23(1):5-16.
36. Russell M, Silver SM. Training needs for the treatment of combat-related posttraumatic stress disorder: a survey of Department of Defense clinicians. Traumatology. 2007;13(3):4-10.
37. Schell TL, Marshall GN. Survey of individuals previously deployed for OEF/OIF. In: Tanielian T, Jaycox LH, eds. Invisible Wounds of War: Psychological and Cognitive Injuries, Their Consequences, and Services to Assist Recovery. Santa Monica, CA: RAND Corporation; 2008:87-118.
38. Hoge CW, Grossman SH, Auchterlonie JL, Riviere LA, Milliken CS, >Wilk JE. PTSD treatment for soldiers after combat deployment: low utilization of mental health care and reasons for dropout. Psychiatr Serv. 2014;65(8):997-1004.
39. Committee on the Assessment of Ongoing Efforts in the Treatment of Posttraumatic Stress Disorder, Board on the Health of Select Populations, Institute of Medicine. Treatment for Posttraumatic Stress Disorder in Military and Veteran Populations: Final Assessment. Washington, DC: National Academies Press; 2014.
40. Schnurr PP. Extending collaborative care for posttraumatic mental health. JAMA Intern Med. 2016;176(7):956-957.
41. Hoge CW. Interventions for war-related posttraumatic stress disorder: meeting veterans where they are. JAMA. 2011;306(5):549-551.
42. Engel CC. Improving primary care for military personnel and veterans with posttraumatic stress disorder: the road ahead. Gen Hosp Psychiatry. 2005;27(3):158-160.
43. Engel CC, Jaycox LH, Freed MC, et al. Centrally assisted collaborative telecare management for posttraumatic stress disorder and depression in military primary care: a randomized controlled trial. JAMA Intern Med. 2016;176(7):948-956.
44. Fortney JC, Pyne JM, Kimbrell TA, et al. Telemedicine-based collaborative care for posttraumatic stress disorder: a randomized clinical trial. JAMA Psychiatry. 2015;72(1):58-67.
45. Schnurr PP, Friedman MJ, Oxman TE, et al. RESPECT-PTSD: re-engineering systems for the primary care treatment of PTSD, a randomized controlled trial. J Gen Intern Med. 2013;28(1):32-40.
46. Zatzick D, Roy-Byrne P, Russo J, et al. A randomized effectiveness trial of stepped collaborative care for acutely injured trauma survivors. Arch Gen Psychiatry. 2004;61(5):498-506.
47. Zatzick D, O’Connor SS, Russo J, et al. Technology-enhanced stepped collaborative care targeting posttraumatic stress disorder and comorbidity after injury: a randomized controlled trial. J Trauma Stress. 2015;28(5):391-400.
48. Engel CC, Bray RM, Jaycox LH, et al. Implementing collaborative primary care for depression and posttraumatic stress disorder: design and sample for a randomized trial in the U.S. Military Health System. Contemp Clin Trials. 2014;39(2):310-319.
49. Belsher BE, Jaycox LH, Freed MC, et al. Mental health utilization patterns during a stepped, collaborative care effectiveness trial for PTSD and depression in the military health system. Med Care. 2016;54(7):706-713.
50. Hepner KA, Roth CP, Farris C, et al. Measuring the Quality of Care for Psychological Health Conditions in the Military Health System: Candidate Quality Measures for Posttraumatic Stress Disorder and Major Depressive Disorder. Santa Monica, CA: RAND Corporation; 2015.
51. Engel C, Oxman T, Yamamoto C, et al. RESPECT-Mil: feasibility of a systems-level collaborative care approach to depression and post-traumatic stress disorder in military primary care. Mil Med. 2008;173(10):935-940.
52. Belsher BE, Curry J, McCutchan P, et al. Implementation of a collaborative care initiative for PTSD and depression in the Army primary care system. Soc Work Ment Health. 2014;12(5-6):500-522.
53. Wong EC, Jaycox LH, Ayer L, et al. Evaluating the Implementation of the Re-Engineering Systems of Primary Care Treatment in the Military (RESPECT-Mil). Santa Monica, CA: RAND Corporation; 2015.
54. Archer J, Bower P, Gilbody S, et al. Collaborative care for depression and anxiety problems. Cochrane Database Syst Rev. 2012;10:CD006525.
55. Woltmann E, Grogan-Kaylor A, Perron B, Georges H, Kilbourne AM, Bauer MS. Comparative effectiveness of collaborative chronic care models for mental health conditions across primary, specialty, and behavioral health care settings: systematic review and meta-analysis. Am J Psychiatry. 2012;169(8):790-804.
56. Wright JL. DoD Directive 6490.15. www.dtic.mil/whs/directives/corres/pdf/649015p.pdf.Revised November 20, 2014. Accessed October 3, 2016. 57. Woodson J. Military treatment facility mental health clinical outcomes guidance. http://dcoe.mil/Libraries/Documents/MentalHealthClinicalOutcomesGuidance_Woodson.pdf. Published September 9, 2013. Accessed October 4, 2016.
58. Wilk JE, West JC, Duffy FF, Herrell RK, Rae DS, Hoge CW. Use of evidence-based treatment for posttraumatic stress disorder in Army behavioral healthcare. Psychiatry. 2013;76(4):336-348.
59. Stockton PN, Olsen ET, Hayford S, et al. Security from within: independent review of the Washington Navy Yard shooting. http://archive.defense.gov/pubs/Independent-Review-of-the-WNY-Shooting-14-Nov-2013.pdf. Published November, 2013. Accessed September 20, 2016.
60. Woodson J. ASD(HA) Memorandum: Clinical Policy Guidance for Assessment and Treatment of Posttraumatic Stress Disorder. August 24, 2012.