User login
Basal Cell Carcinoma Arising in Outdoor Workers Versus Indoor Workers: A Retrospective Study
Basal cell carcinoma (BCC) is the most prevalent malignancy in white individuals and its incidence is rapidly increasing. Despite its low mortality rate, BCC can cause severe morbidity and remains a serious health problem with a high economic burden for health care systems. The incidence of BCC is higher in individuals who have red or blonde hair, light eye color, and/or Fitzpatrick skin types I and II. The risk for developing BCC also increases with age, and men are more frequently affected than women.1,2 Although several factors have been implicated in the etiology of this condition, such as exposure to ionizing radiation, trauma, chemical carcinogenesis, immunosuppression, predisposing syndromes, and host factors (eg, traits that affect susceptibility to disease),3-5 exposure to UV radiation is considered to be a major risk factor, with most BCCs presenting in sun-exposed areas of the body (eg, face, neck). Prolongate suberythrodermal UV doses, which do not burn the skin but cause erythema in the histological level, can lead to formation of pyrimidine dimers in the dermal and epidermal tissues and cause DNA mutation with potential carcinogenic effects. Due to a large number of outdoor occupations, it is likely that outdoor workers (OWs) with a history of UV exposure may develop BCCs with different features than those seen in indoor workers (IWs). However, there has been debate about the relevance of occupational UV exposure as a risk factor for BCC development.6,7 The aim of this study was to compare the clinical and histological features of BCCs in OWs versus IWs at a referral hospital in southern Spain.
Methods
Using the electronic pathology records at a referral hospital in southern Spain, we identified medical records between May 1, 2010, and May 1, 2011, of specimens containing the term skin in the specimen box and basal cell carcinoma in the diagnosis box. We excluded patients with a history of or concomitant squamous cell carcinoma. Reexcision of incompletely excised lesions; punch, shave or incisional biopsies; and palliative excisions also were excluded. The specimens were reviewed and classified according to the differentiation pattern of BCC (ie, nodular, superficial, morpheic, micronodular). Basal cell carcinomas with mixed features were classified according to the most predominant subtype.
We also gathered information regarding the patients’ work history (ie, any job held during their lifetime with a minimum duration of 6 months). Patients were asked about the type of work and start/end dates. In patients who performed OW, we evaluated hours per day and months as well as the type of clothing worn (eg, head covering, socks/stockings during work in the summer months).
Each patient was classified as an OW or IW based on his/her stated occupation. The OWs included those who performed all or most of their work (≥6 hours per day for at least 6 months) outdoors in direct sunlight. Most patients in this group included farmers and fishermen. Indoor workers were those who performed most of their work in an indoor environment (eg, shop, factory, office, hospital, library, bank, school, laboratory). Most patients in this group included mechanics and shop assistants. A small group of individuals could not be classified as OWs or IWs and therefore were excluded from the study. Individuals with a history of exposure to ionizing radiation, chemical carcinogenesis, immunosuppression, or predisposing syndromes also were excluded.
We included variables that could be considered independent risk factors for BCC, including age, sex, eye color, natural hair color, Fitzpatrick skin type, history of sunburns, and family history. All data were collected via a personal interview performed by a single dermatologist (H.H-E.) during the follow-up with the patients conducted after obtaining all medical records and contacting eligible patients; none of the patients were lost on follow-up.
The study was approved by the hospital’s ethics committee and written consent was obtained from all recruited patients for analyzing the data acquired and accessing the relevant diagnostic documents (eg, pathology reports).
The cohorts were compared by a χ2 test and Student t test, which were performed using the SPSS software version 15. Statistical significance was determined using α=.05, and all tests were 2-sided.
Results
A total of 308 patients were included in the study, comprising 178 (58%) OWs and 130 (42%) IWs. Table 1 summarizes the characteristics of each cohort with the statistical outcomes.
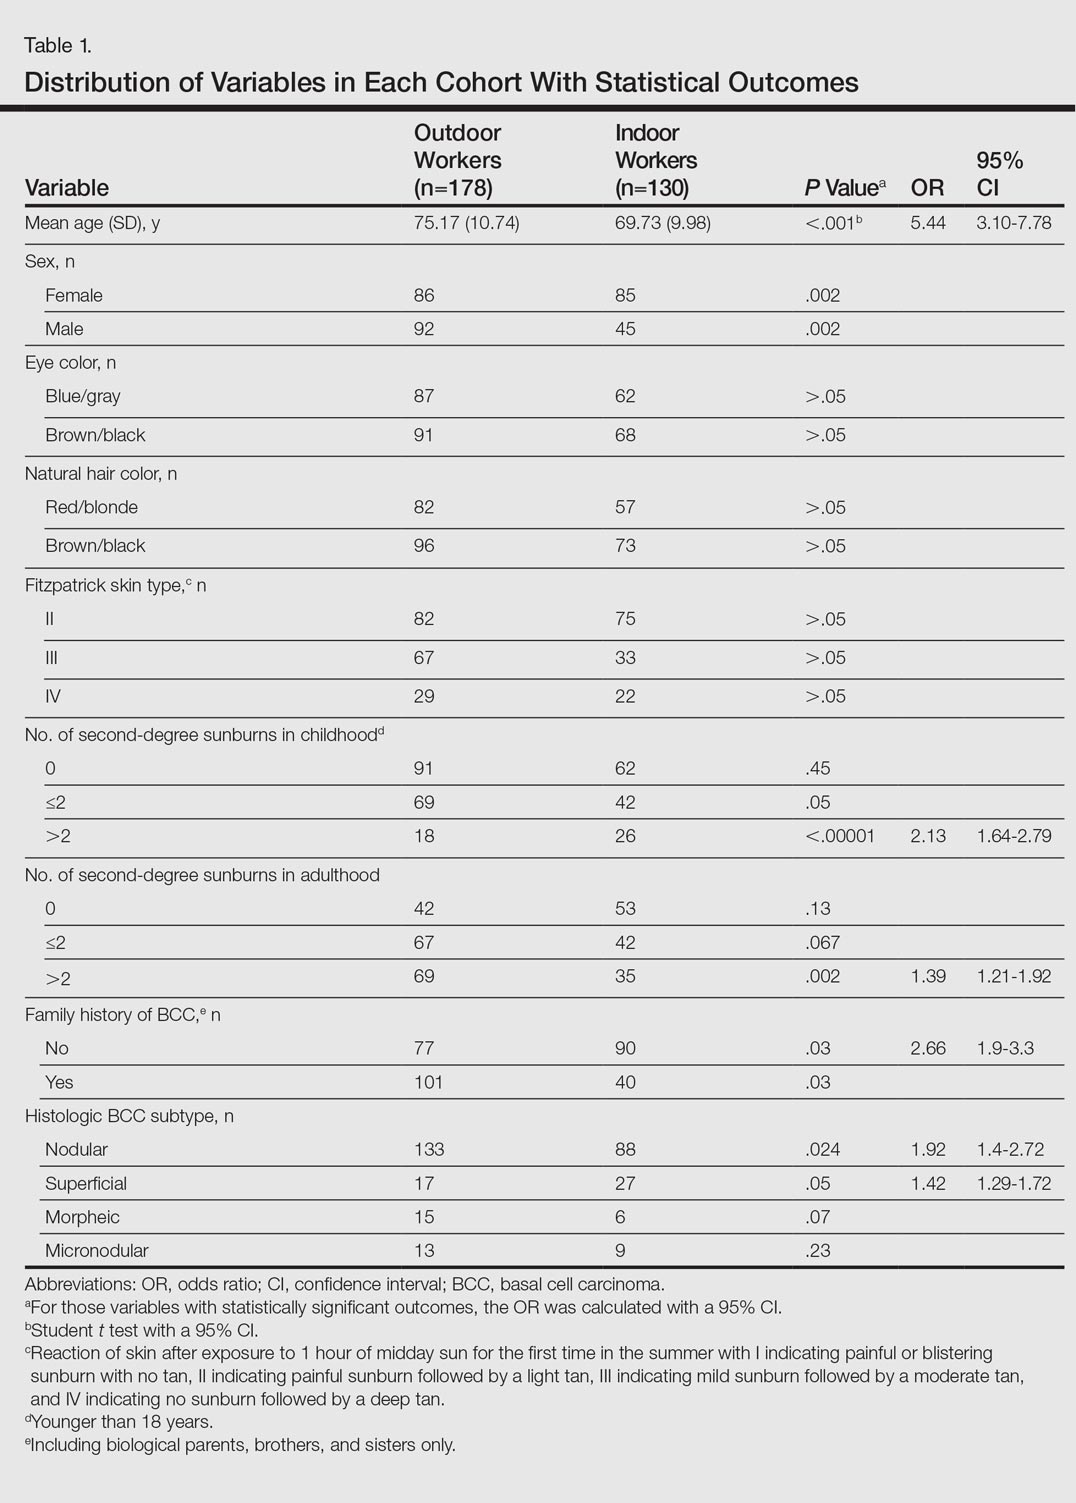
The mean age (SD) of the OWs was significantly higher than the IWs (75.17 [10.74] vs 69.73 [9.98] years; P<.001). The sex distribution among the 2 cohorts was significantly different (P=.002); the OW group featured a slightly higher proportion of men than women (92 [52%] vs 86 [48%]), whereas women were clearly more prevalent in the IW group than men (85 [65%] vs 45 [35%]).
No significant differences regarding eye color (blue/gray vs brown/black) between the 2 cohorts were found (P>.05). In the same way, the 2 cohorts did not show differences in the natural hair color (red/blonde vs brown/black)(P>.05).
Fitzpatrick skin type II was the most common between both cohorts (82 [46%] OWs and 75 [58%] IWs), but no statistical differences regarding the proportions of each skin type were found (P>.05).
History of sunburns (>2 episodes) was significantly different between the 2 cohorts. The incidence of second-degree sunburns in childhood was higher in IWs (P<.00001), while the incidence of second-degree sunburns in adulthood was higher in OWs (P=.002).
Most OWs had a positive family history of BCC (101 [57%]), while the majority of IWs had a negative family history of BCC (90 [69%]). This difference was statistically significant (P=.03).
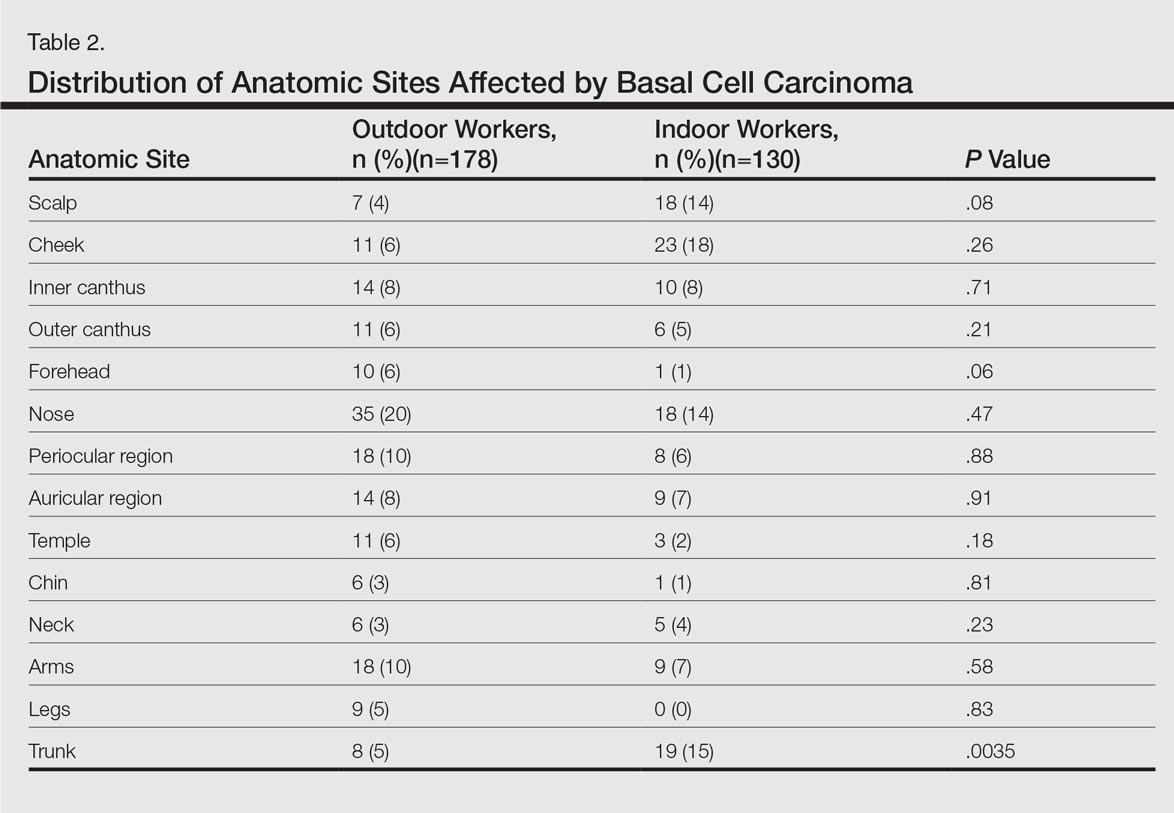
Table 2 shows the distribution of anatomic sites of BCCs in OWs and IWs. The nose was the most frequently affected area in OWs (35 cases [20%]), while the cheek was the most common location (23 [18%]) in IWs. Comparison of the frequency of BCC incidence for each anatomic location revealed that only the rate for truncal BCC was significantly different; IWs had a higher incidence of truncal BCCs than OWs (P=.0035). Although the differences between groups were not statistically significant, there was a trend toward a higher incidence of BCCs on the forehead in OW (P=.06).
In both cohorts, the most prevalent histologic subtype was nodular BCC (133 [75%] OWs and 88 [68%] IWs), followed by superficial BCC (17 [10%] OWs and 27 [21%] IWs). The incidence rate of nodular BCCs was statistically different between the 2 cohorts, with OWs showing a higher incidence compared to IWs (P=.024). Regarding the superficial subtype, the opposite was observed: IWs had significantly increased risk compared to OWs (P=.05). There was a trend toward a higher incidence of morpheic BCCs in OWs than IWs, but the difference was not statistically significant (P=.07).
Comment
Skin cancer due to occupational UV exposure is more common than is generally recognized,6,7 but occupational UV exposure as a risk factor for BCC is still an ongoing debate. In this study, we analyzed the different clinical and histological features of BCC in OWs versus IWs.
The geographic area where this study was performed is characterized by a subtropical Mediterranean climate with irregular rainfall; a short, cool to mild winter; and long, dry, hot summers. Summer temperatures usually are hot and regularly exceed 35°C (95°F). UV index (UVI) is a measure of the amount of skin-damaging UV radiation expected to reach the earth’s surface when the sun is highest in the sky (around midday) and ranges from 1 (low risk) to 10 (maximum risk). In southern Spain, the mean UVI is approximately 6 and can reach up to 9 or sometimes 10 in the summer months. Although Fitzpatrick skin types II and III are most common, the elevated UVI indicates that the general population in southern Spain is at a high risk for developing skin cancer.
In our study the mean age of IWs was lower than OWs, which suggests that IWs may develop BCC at a younger age than OWs. This finding is consistent with studies showing that cumulative occupational UV exposure has been associated with development of BCCs in older age groups, while acute intermittent recreational sun exposure, particularly sustained in childhood and adolescence, is linked with BCC in younger patients.6
The role of sex as a risk factor for BCC remains unclear. Some reports show that BCC is more common in men than in women.8-10 In our study, sex distribution was statistically significant (P=.002); there were more women in the IW cohort and more men in the OW cohort. These differences may be explained by cultural and lifestyle patterns, as women who are IWs tend to have office jobs in urban settings and wear modern fashion clothes at work and for recreation. In rural settings, women have agricultural jobs and tend to wear more traditional clothes that offer sun protection.
Positive family history has been suggested to be a constitutional risk factor for BCC development.8,11,12 In our study, we observed that positive family history was more common in OWs, while most IWs had a negative family history. These differences were significant (P=.03), and OWs had a 2.6-fold increased likelihood of having a positive family history of BCC compared to IWs. Cultural and lifestyle patterns may partially explain this finding. In rural settings, workers tend to have the same job as their parents as a traditional way of life and therefore have similar patterns of UV exposure; in urban settings, individuals may have different jobs than their parents and therefore the pattern of UV exposure may be different. However, a genetic predisposition for developing BCC cannot be excluded. In addition, we have to consider that the information on family history of BCC in the patients was self-reported and not validated, which may limit the results.
The difference in history of second-degree sunburn in childhood was significantly higher in IWs than in OWs (P<.00001). The OW group had a significant rate of sunburns in adulthood (P=.002). The relationship between UV radiation and BCC is complex, and the patterns of sun exposure and their occurrence in different periods of lifetime (ie, childhood vs adulthood) remain controversial.13 The overall history of severe sunburns seems to be more important than simply the tendency to burn or tan,14,15 and a history of sunburns in childhood and adolescence has been associated with early-onset BCC.6 Our findings were consistent in that the age of onset of BCCs was lower in IWs who had a history of sunburns in childhood. Basal cell carcinomas developed at older ages in OWs who had a higher incidence of sunburns in adulthood. However, we have to consider that the retrospective nature of the data collection on sunburns in childhood and adulthood was potentially limited, as the information was based on the patients’ memory. Additionally, other non-UV risk factors for BCC, such as ionizing radiation exposure, were not analyzed.
The majority of BCCs developed in sun-exposed areas of the head and neck in both cohorts, and only 35 (20%) and 28 (22%) BCCs were located on the trunk, arms, or legs in OWs and IWs, respectively. In our study, the rate of BCCs on the trunk was significantly lower in OWs than in IWs (P=.0035). Basal cell carcinomas on the trunk have been suggested to be linked to genetic susceptibility16,17 and reduced DNA repair capacity18 rather than sun exposure. Our findings support this hypothesis and suggest that occupational sun exposure has no direct relation with truncal BCC. This outcome is consistent with the result of a case-control study conducted by Pelucchi et al19 (N=1040). The authors concluded that occupational UV exposure was not associated with truncal BCC development but with head/neck BCC, indicating that there may be different etiological mechanisms between truncal and head/neck BCC.19 In the largest BCC case series published in the literature with 13,457 specimens, the authors stated that tumors on the trunk may represent a particular variant of BCC, in which the theory of chronic versus intermittent UV exposure cannot be simply extrapolated as it is for the rest of BCC sites. Other factors such as genetic predisposition could be involved in the development of truncal BCC.20 Similarly, Ramos et al21 suggested that nonmelanoma skin cancers in sun-protected anatomic sites may occur in individuals with impairment in the DNA repair process.
The classification of histological subtypes of BCC helps to predict tumor behavior,22 which can impact the prognosis. In our study, nodular BCC was the most common subtype in both cohorts, followed by superficial BCC. The nodular subtype was increased in OWs compared to IWs, while the superficial subtype was most common in IWs. Bastiaens et al23 and McCormack et al24 have suggested that the most frequent subtypes of BCC (nodular and superficial) may represent different tumors with distinct causal factors. According to these authors, nodular subtypes are associated with cumulative UV exposure, while superficial subtypes are associated with more intense and intermittent UV exposure. The results of the current study support this hypothesis, as the OW cohort with cumulative UV exposure showed more incidence of nodular BCC than IWs, while the patients with intense and intermittent sun exposure (the IWs) showed more risk of superficial BCC.
The importance of occupational UV exposure in OWs as a risk factor for BCC is still an ongoing discussion. Our data show that occupational UV exposure may be considered an etiological factor for BCC according to histological subtype and anatomic site. Our study is limited by the retrospective nature of the data collection regarding occupation and childhood sunburns, which were based on the patients’ memory and therefore potentially biased. Data regarding family history of BCC also was self-reported and not validated. Another limiting factor was that other non-UV risk factors for BCC, such as ionizing radiation exposure, were not considered. The limited sample size also may have impacted the study results. Among the strengths of the study are the complete response rate, the similar catchment area of OWs and IWs, the common hospital setting of the 2 cohorts, and the similar attention to medical history. All patients were obtained from the practice of a single referral dermatologist and are felt to be representative of our working area. The use of a single dermatologist reduces provider-associated variability.
Conclusion
According to the results of this study, OWs are more likely to develop nodular BCCs with no increased risk for superficial BCCs. The age of onset in OWs is older than in IWs. Some anatomical sites such as the trunk are more commonly affected in IWs. Truncal BCCs may have etiological factors other than UV exposure, such as a genetic predisposition. This study is useful to occupational safety representatives and physicians to stimulate the implementation of prevention strategies for this easily preventable malignancy and may encourage further research.
- de Vries E, van de Poll-Franse LV, Louwman WJ, et al. Predictions of skin cancer incidence in the Netherlands up to 2015. Br J Dermatol. 2005;152:481-488.
- Miller DL, Weinstock MA. Nonmelanoma skin cancer in the United States: incidence. J Am Acad Dermatol. 1994;30:774-778.
- Diepgen TL, Mahler V. The epidemiology of skin cancer. Br J Dermatol. 2002;146(suppl 61):1-6.
- Netscher DT, Spira M. Basal cell carcinoma: an overview of tumor biology and treatment. Plast Reconstr Surg. 2004;113:e74-e94.
- Miller SJ. Etiology and pathogenesis of basal cell carcinoma. Clin Dermatol. 1995;13:527-536.
- Dessinioti C, Tzannis K, Sypsa V, et al. Epidemiologic risk factors of basal cell carcinoma development and age at onset in a Southern European population from Greece. Exp Dermatol. 2011;20:622-626.
- Bauer A, Diepgen TL, Schmitt J. Is occupational solar UV-irradiation a relevant risk factor for basal cell carcinoma? a systematic review and meta-analysis of the epidemiologic literature. Br J Dermatol. 2011;165:612-625.
- Tran H, Chen K, Shumack S. Epidemiology and aetiology of basal cell carcinoma. Br J Dermatol. 2003;149(suppl 66):50-52.
- Armstrong BK, Kricker A. The epidemiology of UV induced skin cancer. J Photochem Photobiol B. 2001;63:8-18.
- Stern RS. The mysteries of geographic variability in nonmelanoma skin cancer incidence. Arch Dermatol. 1999;135:843-844.
- Chinem VP, Miot HA. Epidemiology of basal cell carcinoma. An Bras Dermatol. 2011;86:292-305.
- Wong CS, Strange RC, Lear JT. Basal cell carcinoma. Br Med J. 2003;327:794-798.
- Dessinioti C, Antoniou C, Katsambas AD, et al. Basal cell carcinoma: what’s new under the sun. Photochem Photobiol. 2010;86:481-491.
- Van Dam RM, Huang Z, Rimm EB, et al. Risk factors for basal cell carcinoma of the skin in men: results from the health professionals follow-up study. Am J Epidemiol. 1999;150:459-468.
- Hunter DJ, Colditz GA, Stampfer MJ, et al. Risk factors for basal cell carcinoma in a prospective cohort of women. Ann Epidemiol. 1990;1:13-23.
- Ramachandran S, Fryer AA, Smith A, et al. Cutaneous basal cell carcinomas: distinct host factors are associated with the development of tumors on the trunk and on the head and neck. Cancer. 2001;92:354-358.
- Ramachandran S, Lear JT, Ramsay H, et al. Presentation with multiple cutaneous basal cell carcinomas: association of glutathione S-transferase and cytochrome P450 genotypes with clinical phenotype. Cancer Epidemiol Biomarkers Prev. 1999;8:61-67.
- Wei Q, Matanoski GM, Farmer ER, et al. DNA repair and aging in basal cell carcinoma: a molecular epidemiology study. Proc Natl Acad Sci USA. 1993;90:1614-1618.
- Pelucchi C, Di Landro A, Naldi L, et al. Risk factors for histological types and anatomic sites of cutaneous basal-cell carcinoma: an Italian case-control study [published online ahead of print Oct 19, 2006]. J Invest Dermatol. 2007;127:935-944.
- Scrivener Y, Grosshans E, Cribier B. Variations of basal cell carcinomas according to gender, age, location and histopathological subtype. Br J Dermatol. 2002;147:41-47.
- Ramos J, Villa J, Ruiz A, et al. UV dose determines key characteristics of nonmelanoma skin cancer. Cancer Epidemiol Biomarkers Prev. 2004;13:2006-2011.
- Rippey JJ. Why classify basal cell carcinomas? Histopathology. 1998;32:393-398.
- Bastiaens MT, Hoefnagel JJ, Bruijn JA, et al. Differences in age, site distribution and sex between nodular and superficial basal cell carcinomas indicate different type of tumors. J Invest Dermatol. 1998;110:880-884.
- McCormack CJ, Kelly JW, Dorevitch AP. Differences in age and body site distribution of histological subtypes of basal cell carcinoma. a possible indicator of different causes. Arch Dermatol. 1997;133:593-596.
Basal cell carcinoma (BCC) is the most prevalent malignancy in white individuals and its incidence is rapidly increasing. Despite its low mortality rate, BCC can cause severe morbidity and remains a serious health problem with a high economic burden for health care systems. The incidence of BCC is higher in individuals who have red or blonde hair, light eye color, and/or Fitzpatrick skin types I and II. The risk for developing BCC also increases with age, and men are more frequently affected than women.1,2 Although several factors have been implicated in the etiology of this condition, such as exposure to ionizing radiation, trauma, chemical carcinogenesis, immunosuppression, predisposing syndromes, and host factors (eg, traits that affect susceptibility to disease),3-5 exposure to UV radiation is considered to be a major risk factor, with most BCCs presenting in sun-exposed areas of the body (eg, face, neck). Prolongate suberythrodermal UV doses, which do not burn the skin but cause erythema in the histological level, can lead to formation of pyrimidine dimers in the dermal and epidermal tissues and cause DNA mutation with potential carcinogenic effects. Due to a large number of outdoor occupations, it is likely that outdoor workers (OWs) with a history of UV exposure may develop BCCs with different features than those seen in indoor workers (IWs). However, there has been debate about the relevance of occupational UV exposure as a risk factor for BCC development.6,7 The aim of this study was to compare the clinical and histological features of BCCs in OWs versus IWs at a referral hospital in southern Spain.
Methods
Using the electronic pathology records at a referral hospital in southern Spain, we identified medical records between May 1, 2010, and May 1, 2011, of specimens containing the term skin in the specimen box and basal cell carcinoma in the diagnosis box. We excluded patients with a history of or concomitant squamous cell carcinoma. Reexcision of incompletely excised lesions; punch, shave or incisional biopsies; and palliative excisions also were excluded. The specimens were reviewed and classified according to the differentiation pattern of BCC (ie, nodular, superficial, morpheic, micronodular). Basal cell carcinomas with mixed features were classified according to the most predominant subtype.
We also gathered information regarding the patients’ work history (ie, any job held during their lifetime with a minimum duration of 6 months). Patients were asked about the type of work and start/end dates. In patients who performed OW, we evaluated hours per day and months as well as the type of clothing worn (eg, head covering, socks/stockings during work in the summer months).
Each patient was classified as an OW or IW based on his/her stated occupation. The OWs included those who performed all or most of their work (≥6 hours per day for at least 6 months) outdoors in direct sunlight. Most patients in this group included farmers and fishermen. Indoor workers were those who performed most of their work in an indoor environment (eg, shop, factory, office, hospital, library, bank, school, laboratory). Most patients in this group included mechanics and shop assistants. A small group of individuals could not be classified as OWs or IWs and therefore were excluded from the study. Individuals with a history of exposure to ionizing radiation, chemical carcinogenesis, immunosuppression, or predisposing syndromes also were excluded.
We included variables that could be considered independent risk factors for BCC, including age, sex, eye color, natural hair color, Fitzpatrick skin type, history of sunburns, and family history. All data were collected via a personal interview performed by a single dermatologist (H.H-E.) during the follow-up with the patients conducted after obtaining all medical records and contacting eligible patients; none of the patients were lost on follow-up.
The study was approved by the hospital’s ethics committee and written consent was obtained from all recruited patients for analyzing the data acquired and accessing the relevant diagnostic documents (eg, pathology reports).
The cohorts were compared by a χ2 test and Student t test, which were performed using the SPSS software version 15. Statistical significance was determined using α=.05, and all tests were 2-sided.
Results
A total of 308 patients were included in the study, comprising 178 (58%) OWs and 130 (42%) IWs. Table 1 summarizes the characteristics of each cohort with the statistical outcomes.
The mean age (SD) of the OWs was significantly higher than the IWs (75.17 [10.74] vs 69.73 [9.98] years; P<.001). The sex distribution among the 2 cohorts was significantly different (P=.002); the OW group featured a slightly higher proportion of men than women (92 [52%] vs 86 [48%]), whereas women were clearly more prevalent in the IW group than men (85 [65%] vs 45 [35%]).
No significant differences regarding eye color (blue/gray vs brown/black) between the 2 cohorts were found (P>.05). In the same way, the 2 cohorts did not show differences in the natural hair color (red/blonde vs brown/black)(P>.05).
Fitzpatrick skin type II was the most common between both cohorts (82 [46%] OWs and 75 [58%] IWs), but no statistical differences regarding the proportions of each skin type were found (P>.05).
History of sunburns (>2 episodes) was significantly different between the 2 cohorts. The incidence of second-degree sunburns in childhood was higher in IWs (P<.00001), while the incidence of second-degree sunburns in adulthood was higher in OWs (P=.002).
Most OWs had a positive family history of BCC (101 [57%]), while the majority of IWs had a negative family history of BCC (90 [69%]). This difference was statistically significant (P=.03).
Table 2 shows the distribution of anatomic sites of BCCs in OWs and IWs. The nose was the most frequently affected area in OWs (35 cases [20%]), while the cheek was the most common location (23 [18%]) in IWs. Comparison of the frequency of BCC incidence for each anatomic location revealed that only the rate for truncal BCC was significantly different; IWs had a higher incidence of truncal BCCs than OWs (P=.0035). Although the differences between groups were not statistically significant, there was a trend toward a higher incidence of BCCs on the forehead in OW (P=.06).
In both cohorts, the most prevalent histologic subtype was nodular BCC (133 [75%] OWs and 88 [68%] IWs), followed by superficial BCC (17 [10%] OWs and 27 [21%] IWs). The incidence rate of nodular BCCs was statistically different between the 2 cohorts, with OWs showing a higher incidence compared to IWs (P=.024). Regarding the superficial subtype, the opposite was observed: IWs had significantly increased risk compared to OWs (P=.05). There was a trend toward a higher incidence of morpheic BCCs in OWs than IWs, but the difference was not statistically significant (P=.07).
Comment
Skin cancer due to occupational UV exposure is more common than is generally recognized,6,7 but occupational UV exposure as a risk factor for BCC is still an ongoing debate. In this study, we analyzed the different clinical and histological features of BCC in OWs versus IWs.
The geographic area where this study was performed is characterized by a subtropical Mediterranean climate with irregular rainfall; a short, cool to mild winter; and long, dry, hot summers. Summer temperatures usually are hot and regularly exceed 35°C (95°F). UV index (UVI) is a measure of the amount of skin-damaging UV radiation expected to reach the earth’s surface when the sun is highest in the sky (around midday) and ranges from 1 (low risk) to 10 (maximum risk). In southern Spain, the mean UVI is approximately 6 and can reach up to 9 or sometimes 10 in the summer months. Although Fitzpatrick skin types II and III are most common, the elevated UVI indicates that the general population in southern Spain is at a high risk for developing skin cancer.
In our study the mean age of IWs was lower than OWs, which suggests that IWs may develop BCC at a younger age than OWs. This finding is consistent with studies showing that cumulative occupational UV exposure has been associated with development of BCCs in older age groups, while acute intermittent recreational sun exposure, particularly sustained in childhood and adolescence, is linked with BCC in younger patients.6
The role of sex as a risk factor for BCC remains unclear. Some reports show that BCC is more common in men than in women.8-10 In our study, sex distribution was statistically significant (P=.002); there were more women in the IW cohort and more men in the OW cohort. These differences may be explained by cultural and lifestyle patterns, as women who are IWs tend to have office jobs in urban settings and wear modern fashion clothes at work and for recreation. In rural settings, women have agricultural jobs and tend to wear more traditional clothes that offer sun protection.
Positive family history has been suggested to be a constitutional risk factor for BCC development.8,11,12 In our study, we observed that positive family history was more common in OWs, while most IWs had a negative family history. These differences were significant (P=.03), and OWs had a 2.6-fold increased likelihood of having a positive family history of BCC compared to IWs. Cultural and lifestyle patterns may partially explain this finding. In rural settings, workers tend to have the same job as their parents as a traditional way of life and therefore have similar patterns of UV exposure; in urban settings, individuals may have different jobs than their parents and therefore the pattern of UV exposure may be different. However, a genetic predisposition for developing BCC cannot be excluded. In addition, we have to consider that the information on family history of BCC in the patients was self-reported and not validated, which may limit the results.
The difference in history of second-degree sunburn in childhood was significantly higher in IWs than in OWs (P<.00001). The OW group had a significant rate of sunburns in adulthood (P=.002). The relationship between UV radiation and BCC is complex, and the patterns of sun exposure and their occurrence in different periods of lifetime (ie, childhood vs adulthood) remain controversial.13 The overall history of severe sunburns seems to be more important than simply the tendency to burn or tan,14,15 and a history of sunburns in childhood and adolescence has been associated with early-onset BCC.6 Our findings were consistent in that the age of onset of BCCs was lower in IWs who had a history of sunburns in childhood. Basal cell carcinomas developed at older ages in OWs who had a higher incidence of sunburns in adulthood. However, we have to consider that the retrospective nature of the data collection on sunburns in childhood and adulthood was potentially limited, as the information was based on the patients’ memory. Additionally, other non-UV risk factors for BCC, such as ionizing radiation exposure, were not analyzed.
The majority of BCCs developed in sun-exposed areas of the head and neck in both cohorts, and only 35 (20%) and 28 (22%) BCCs were located on the trunk, arms, or legs in OWs and IWs, respectively. In our study, the rate of BCCs on the trunk was significantly lower in OWs than in IWs (P=.0035). Basal cell carcinomas on the trunk have been suggested to be linked to genetic susceptibility16,17 and reduced DNA repair capacity18 rather than sun exposure. Our findings support this hypothesis and suggest that occupational sun exposure has no direct relation with truncal BCC. This outcome is consistent with the result of a case-control study conducted by Pelucchi et al19 (N=1040). The authors concluded that occupational UV exposure was not associated with truncal BCC development but with head/neck BCC, indicating that there may be different etiological mechanisms between truncal and head/neck BCC.19 In the largest BCC case series published in the literature with 13,457 specimens, the authors stated that tumors on the trunk may represent a particular variant of BCC, in which the theory of chronic versus intermittent UV exposure cannot be simply extrapolated as it is for the rest of BCC sites. Other factors such as genetic predisposition could be involved in the development of truncal BCC.20 Similarly, Ramos et al21 suggested that nonmelanoma skin cancers in sun-protected anatomic sites may occur in individuals with impairment in the DNA repair process.
The classification of histological subtypes of BCC helps to predict tumor behavior,22 which can impact the prognosis. In our study, nodular BCC was the most common subtype in both cohorts, followed by superficial BCC. The nodular subtype was increased in OWs compared to IWs, while the superficial subtype was most common in IWs. Bastiaens et al23 and McCormack et al24 have suggested that the most frequent subtypes of BCC (nodular and superficial) may represent different tumors with distinct causal factors. According to these authors, nodular subtypes are associated with cumulative UV exposure, while superficial subtypes are associated with more intense and intermittent UV exposure. The results of the current study support this hypothesis, as the OW cohort with cumulative UV exposure showed more incidence of nodular BCC than IWs, while the patients with intense and intermittent sun exposure (the IWs) showed more risk of superficial BCC.
The importance of occupational UV exposure in OWs as a risk factor for BCC is still an ongoing discussion. Our data show that occupational UV exposure may be considered an etiological factor for BCC according to histological subtype and anatomic site. Our study is limited by the retrospective nature of the data collection regarding occupation and childhood sunburns, which were based on the patients’ memory and therefore potentially biased. Data regarding family history of BCC also was self-reported and not validated. Another limiting factor was that other non-UV risk factors for BCC, such as ionizing radiation exposure, were not considered. The limited sample size also may have impacted the study results. Among the strengths of the study are the complete response rate, the similar catchment area of OWs and IWs, the common hospital setting of the 2 cohorts, and the similar attention to medical history. All patients were obtained from the practice of a single referral dermatologist and are felt to be representative of our working area. The use of a single dermatologist reduces provider-associated variability.
Conclusion
According to the results of this study, OWs are more likely to develop nodular BCCs with no increased risk for superficial BCCs. The age of onset in OWs is older than in IWs. Some anatomical sites such as the trunk are more commonly affected in IWs. Truncal BCCs may have etiological factors other than UV exposure, such as a genetic predisposition. This study is useful to occupational safety representatives and physicians to stimulate the implementation of prevention strategies for this easily preventable malignancy and may encourage further research.
- de Vries E, van de Poll-Franse LV, Louwman WJ, et al. Predictions of skin cancer incidence in the Netherlands up to 2015. Br J Dermatol. 2005;152:481-488.
- Miller DL, Weinstock MA. Nonmelanoma skin cancer in the United States: incidence. J Am Acad Dermatol. 1994;30:774-778.
- Diepgen TL, Mahler V. The epidemiology of skin cancer. Br J Dermatol. 2002;146(suppl 61):1-6.
- Netscher DT, Spira M. Basal cell carcinoma: an overview of tumor biology and treatment. Plast Reconstr Surg. 2004;113:e74-e94.
- Miller SJ. Etiology and pathogenesis of basal cell carcinoma. Clin Dermatol. 1995;13:527-536.
- Dessinioti C, Tzannis K, Sypsa V, et al. Epidemiologic risk factors of basal cell carcinoma development and age at onset in a Southern European population from Greece. Exp Dermatol. 2011;20:622-626.
- Bauer A, Diepgen TL, Schmitt J. Is occupational solar UV-irradiation a relevant risk factor for basal cell carcinoma? a systematic review and meta-analysis of the epidemiologic literature. Br J Dermatol. 2011;165:612-625.
- Tran H, Chen K, Shumack S. Epidemiology and aetiology of basal cell carcinoma. Br J Dermatol. 2003;149(suppl 66):50-52.
- Armstrong BK, Kricker A. The epidemiology of UV induced skin cancer. J Photochem Photobiol B. 2001;63:8-18.
- Stern RS. The mysteries of geographic variability in nonmelanoma skin cancer incidence. Arch Dermatol. 1999;135:843-844.
- Chinem VP, Miot HA. Epidemiology of basal cell carcinoma. An Bras Dermatol. 2011;86:292-305.
- Wong CS, Strange RC, Lear JT. Basal cell carcinoma. Br Med J. 2003;327:794-798.
- Dessinioti C, Antoniou C, Katsambas AD, et al. Basal cell carcinoma: what’s new under the sun. Photochem Photobiol. 2010;86:481-491.
- Van Dam RM, Huang Z, Rimm EB, et al. Risk factors for basal cell carcinoma of the skin in men: results from the health professionals follow-up study. Am J Epidemiol. 1999;150:459-468.
- Hunter DJ, Colditz GA, Stampfer MJ, et al. Risk factors for basal cell carcinoma in a prospective cohort of women. Ann Epidemiol. 1990;1:13-23.
- Ramachandran S, Fryer AA, Smith A, et al. Cutaneous basal cell carcinomas: distinct host factors are associated with the development of tumors on the trunk and on the head and neck. Cancer. 2001;92:354-358.
- Ramachandran S, Lear JT, Ramsay H, et al. Presentation with multiple cutaneous basal cell carcinomas: association of glutathione S-transferase and cytochrome P450 genotypes with clinical phenotype. Cancer Epidemiol Biomarkers Prev. 1999;8:61-67.
- Wei Q, Matanoski GM, Farmer ER, et al. DNA repair and aging in basal cell carcinoma: a molecular epidemiology study. Proc Natl Acad Sci USA. 1993;90:1614-1618.
- Pelucchi C, Di Landro A, Naldi L, et al. Risk factors for histological types and anatomic sites of cutaneous basal-cell carcinoma: an Italian case-control study [published online ahead of print Oct 19, 2006]. J Invest Dermatol. 2007;127:935-944.
- Scrivener Y, Grosshans E, Cribier B. Variations of basal cell carcinomas according to gender, age, location and histopathological subtype. Br J Dermatol. 2002;147:41-47.
- Ramos J, Villa J, Ruiz A, et al. UV dose determines key characteristics of nonmelanoma skin cancer. Cancer Epidemiol Biomarkers Prev. 2004;13:2006-2011.
- Rippey JJ. Why classify basal cell carcinomas? Histopathology. 1998;32:393-398.
- Bastiaens MT, Hoefnagel JJ, Bruijn JA, et al. Differences in age, site distribution and sex between nodular and superficial basal cell carcinomas indicate different type of tumors. J Invest Dermatol. 1998;110:880-884.
- McCormack CJ, Kelly JW, Dorevitch AP. Differences in age and body site distribution of histological subtypes of basal cell carcinoma. a possible indicator of different causes. Arch Dermatol. 1997;133:593-596.
Practice Points
- Basal cell carcinoma (BCC) is the most common cancer in white individuals with rapidly increasing incidence rates and a high economic burden.
- Despite a large number of epidemiologic studies and the known importance of UV exposure in BCC carcinogenesis, there are no clear conclusions regarding the role of chronic and acute sun exposure related to BCC subtypes.
- It is reasonable to assume that outdoor workers with a history of UV exposure may develop BCCs with different features than those observed in indoor workers.
How in-office and ambulatory BP monitoring compare: A systematic review and meta-analysis
ABSTRACT
Purpose We performed a literature review and meta-analysis to ascertain the validity of office blood pressure (BP) measurement in a primary care setting, using ambulatory blood pressure measurement (ABPM) as a benchmark in the monitoring of hypertensive patients receiving treatment.
Methods We conducted a literature search for studies published up to December 2013 that included hypertensive patients receiving treatment in a primary care setting. We compared the mean office BP with readings obtained by ABPM. We summarized the diagnostic accuracy of office BP with respect to ABPM in terms of sensitivity, specificity, and positive and negative likelihood ratios (LR), with a 95% confidence interval (CI).
Results Only 12 studies met the inclusion criteria and contained data to calculate the differences between the means of office and ambulatory BP measurements. Five were suitable for calculating sensitivity, specificity, and likelihood ratios, and 4 contained sufficient extractable data for meta-analysis. Compared with ABPM (thresholds of 140/90 mm Hg for office BP; 130/80 mmHg for ABPM) in diagnosing uncontrolled BP, office BP measurement had a sensitivity of 81.9% (95% CI, 74.8%-87%) and specificity of 41.1% (95% CI, 35.1%-48.4%). Positive LR was 1.35 (95% CI, 1.32-1.38), and the negative LR was 0.44 (95% CI, 0.37-0.53).
Conclusion Likelihood ratios show that isolated BP measurement in the office does not confirm or rule out the presence of poor BP control. Likelihood of underestimating or overestimating BP control is high when relying on in-office BP measurement alone.
A growing body of evidence supports more frequent use of ambulatory blood pressure monitoring (ABPM) to confirm a diagnosis of hypertension1 and to monitor blood pressure (BP) response to treatment.2 The Joint National Committee on Prevention, Detection, Evaluation, and Treatment of High Blood Pressure has long accepted ABPM for diagnosis of hypertension,3 and many clinicians consider ABPM the reference standard for diagnosing true hypertension and for accurately assessing associated cardiovascular risk in adults, regardless of office BP readings.4 The US Preventive Services Task Force (USPSTF) recommends obtaining BP measurements outside the clinical setting to confirm a diagnosis of hypertension before starting treatment.5 The USPSTF also asserts that elevated 24-hour ambulatory systolic BP is consistently and significantly associated with stroke and other cardiovascular events independent of office BP readings and has greater predictive value than office monitoring.5 The USPSTF concludes that ABPM, because of its large evidence base, is the best confirmatory test for hypertension.6 The recommendation of the American Academy of Family Physicians is similar to that of the USPSTF.7
The challenge. Despite the considerable support for ABPM, this method of BP measurement is still not sufficiently integrated into primary care. And some guidelines, such as those of
But ABPM’s advantages are numerous. Ambulatory monitors, which can record BP for 24 hours, are typically programmed to take readings every 15 to 30 minutes, providing estimates of mean daytime and nighttime BP and revealing an individual’s circadian pattern of BP.8-10 Ambulatory BP values usually considered the uppermost limit of normal are 135/85 mm Hg (day), 120/70 mm Hg (night), and 130/80 mm Hg (24 hour).8
Office BP monitoring, usually performed manually by medical staff, has 2 main drawbacks: the well-known white-coat effect experienced by many patients, and the relatively small number of possible measurements. A more reliable in-office BP estimation of BP would require repeated measurements at each of several visits.
By comparing ABPM and office measurements, 4 clinical findings are possible: isolated clinic or office (white-coat) hypertension (ICH); isolated ambulatory (masked) hypertension (IAH); consistent normotension; or sustained hypertension. With ICH, BP is high in the office and normal with ABPM. With IAH, BP is normal in the office and high with ABPM. With consistent normotension and sustained hypertension, BP readings with both types of measurement agree.8,9
In patients being treated for hypertension, ICH leads to an overestimation of uncontrolled BP and may result in overtreatment. The cardiovascular risk, although controversial, is usually lower than in patients diagnosed with sustained hypertension.11 IAH leads to an underestimation of uncontrolled BP and may result in undertreatment; its associated cardiovascular risk is similar to that of sustained hypertension.12
Our research objective. We recently published a study conducted with 137 hypertensive patients in a primary care center.13 Our conclusion was that in-office measurement of BP had insufficient clinical validity to be recommended as a sole method of monitoring BP control. In accurately classifying BP as controlled or uncontrolled, clinic measurement agreed with 24h-ABPM in just 64.2% of cases.13
In our present study, we performed a literature review and meta-analysis to ascertain the validity of office BP measurement in a primary care setting, using ABPM as a benchmark in the monitoring of hypertensive patients receiving treatment.
METHODS
Most published studies comparing conventional office BP measurement with ABPM have been conducted with patients not taking antihypertensive medication. We excluded these studies and conducted a literature search for studies published up to December 2013 that included hypertensive patients receiving treatment in a primary care setting.
We searched Medline (from 1950 onward) and the Cochrane Database of Systematic Reviews. For the Medline search, we combined keywords for office BP, hypertension, and ambulatory BP with keywords for outpatient setting and primary care, using the following syntax: (((“clinic blood pressure” OR “office blood pressure” OR “casual blood pressure”))) AND (“hypertension” AND ((((“24-h ambulatory blood pressure”) OR “24 h ambulatory blood pressure”) OR “24 hour ambulatory blood pressure”) OR “blood pressure monitoring, ambulatory”[Mesh]) AND ((((((“outpatient setting”) OR “primary care”) OR “family care”) OR “family physician”) OR “family practice”) OR “general practice”)). We chose studies published in English and reviewed the titles and abstracts of identified articles.
With the aim of identifying additional candidate studies, we reviewed the reference lists of eligible primary studies, narrative reviews, and systematic reviews. The studies were generally of good quality and used appropriate statistical methods. Only primary studies qualified for meta-analysis.
Inclusion and exclusion criteria
Acceptable studies had to be conducted in a primary care setting with patients being treated for hypertension, and had to provide data comparing office BP measurement with ABPM. We excluded studies in which participants were treated in the hospital, were untreated, or had not been diagnosed with hypertension.
The quality of the studies included in the meta-analysis was judged by 2 independent observers according to the following criteria: the clear classification and initial comparison of both measurements; explicit and defined diagnostic criteria; compliance with the inclusion/exclusion criteria; and clear and precise definition of outcome variables.
Data extraction
We extracted the following data from each included study: study population, number of patients included, age, gender distribution, number of measurements (ambulatory and office BP), equipment validation, mean office and ambulatory BP, and the period of ambulatory BP measurement. We included adult patients of all ages, and we compared the mean office BP with those obtained by ABPM in hypertensive patients.
STATISTICAL ANALYSIS
For each study, we summarized the diagnostic accuracy of office BP with respect to ABPM in terms of sensitivity, specificity, and positive and negative likelihood ratios (LRs), with the 95% confidence interval (CI), if available. If these rates were not directly reported in the original papers, we used the published data to calculate them.
We used the R v2.15.1 software with the “mada” package for meta-analysis.14 Although a bivariate approach is preferred for the meta-analysis of diagnostic accuracy, it cannot be recommended if the number of primary studies to pool is too small,14 as happened in our case. Therefore, we used a univariate approach and pooled summary statistics for positive LR, negative LR, and the diagnostic odds ratio (DOR) with their 95% confidence intervals. We used the DerSimonian-Laird method to perform a random-effect meta-analysis. To explore heterogeneity between the studies, we used the Cochran’s Q heterogeneity test, I2 index, and Galbraith and L’Abbé plots.
RESULTS
Our search identified 237 studies, only 12 of which met the inclusion criteria and contained data to calculate the differences between the means of office and ambulatory BP measurements (TABLES 1 AND 2).15-26 Of these 12 studies, 5 were suitable for calculating sensitivity, specificity, and LR (TABLE 3),16,18,22,24,26 and 4 contained sufficient extractable data for meta-analysis. The study by Little et al18 was not included in the meta-analysis, as the number of true-positive, true-negative, false-positive, and false-negative results could not be deduced from published data.
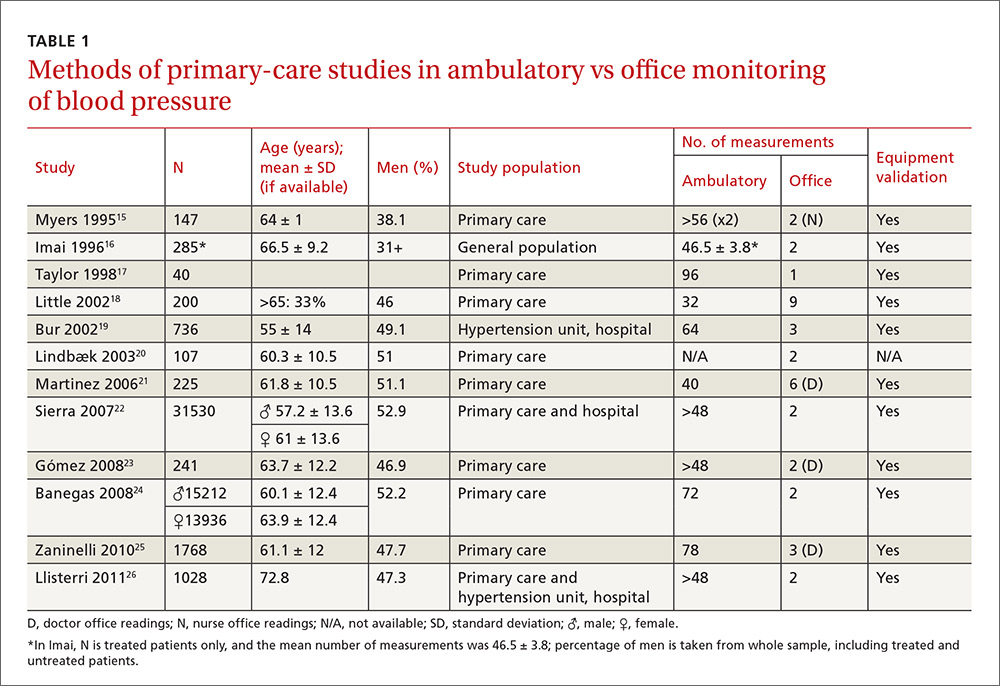
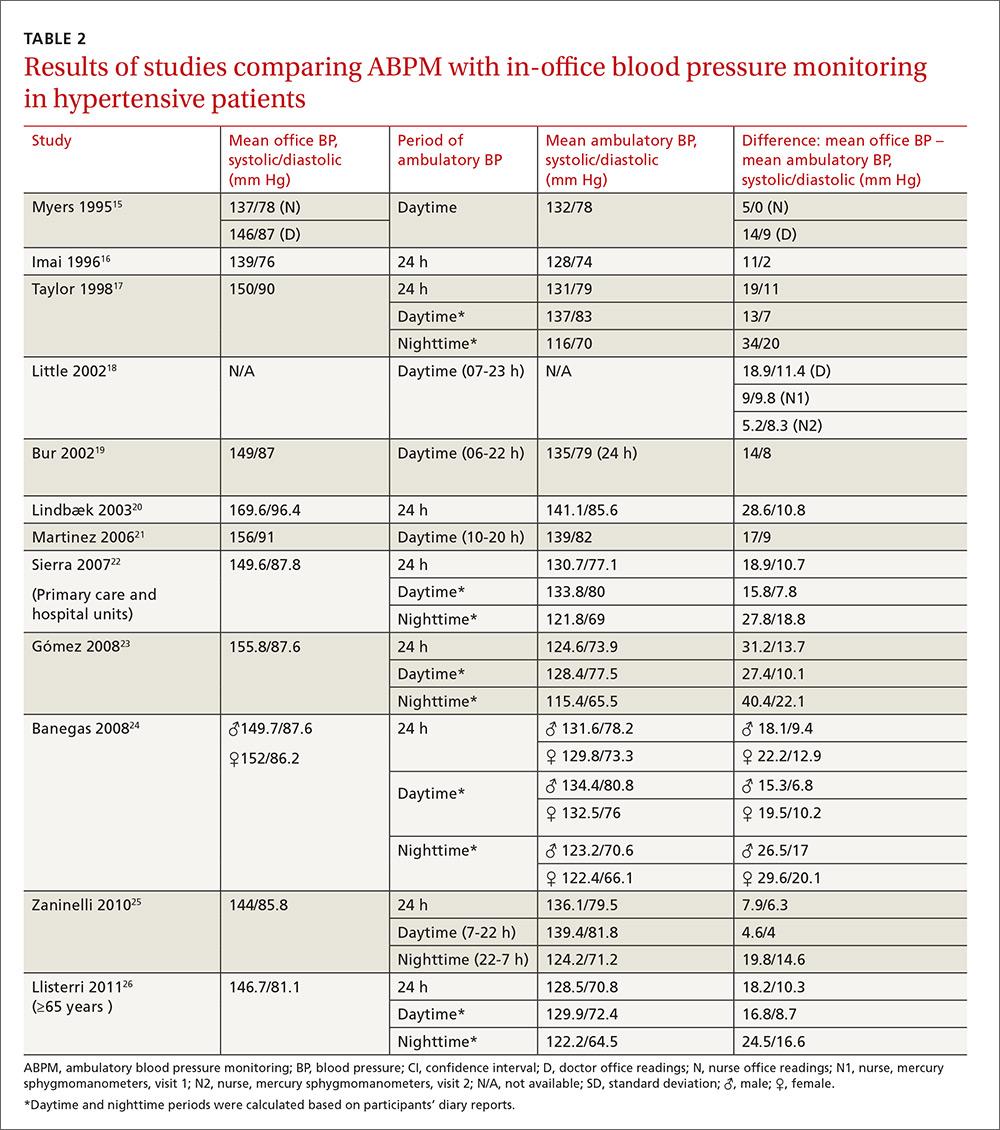
The studies differed in sample size (40-31,530), patient ages (mean, 55-72.8 years), sex (percentage of men, 31%-52.9%), and number of measurements for office BP (1-9) and ABPM (32-96) (TABLE 1),15-26 as well as in daytime and nighttime periods for ABPM and BP thresholds, and in differences between the mean office and ambulatory BPs (TABLE 2).15-26
In general, the mean office BP measurements were higher than those obtained with ABPM in any period—from 5/0 mm Hg to 27.4/10.1 mm Hg in the day, and from 7.9/6.3 mm Hg to 31.2/13.7 mm Hg over 24 hours (TABLE 2).15-26
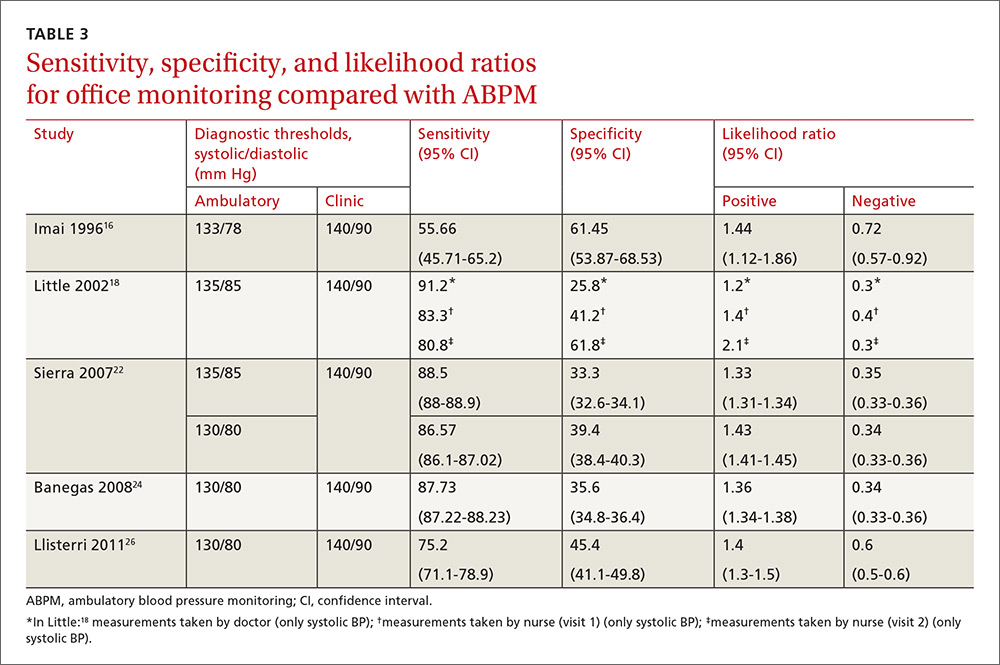
Compared with ABPM in diagnosing uncontrolled BP, office BP measurement had a sensitivity of 55.7% to 91.2% and a specificity of 25.8% to 61.8% (depending on whether the measure was carried out by the doctor or nurse18); positive LR ranged from 1.2 to 1.4, and negative LR from 0.3 to 0.72 (TABLE 3).16,18,22,24,26
For meta-analysis, we pooled studies with the same thresholds (140/90 mm Hg for office BP; 130/80 mm Hg for ABPM), with diagnostic accuracy of office BP expressed as pooled positive and negative LR, and as pooled DOR. The meta-analysis revealed that the pooled positive LR was 1.35 (95% CI, 1.32-1.38), and the pooled negative LR was 0.44 (95% CI, 0.37-0.53). The pooled DOR was 3.47 (95% CI, 3.02-3.98). Sensitivity was 81.9% (95% CI, 74.8%-87%) and specificity was 41.1% (95% CI, 35.1%-48.4%).
One study16 had a slightly different ambulatory diagnostic threshold (133/78 mm Hg), so we excluded it from a second meta-analysis. Results after the exclusion did not change significantly: positive LR was 1.39 (95% CI, 1.34-1.45); negative LR was 0.38 (95% CI, 0.33-0.44); and DOR was 3.77 (95% CI, 3.31-4.43).
In conclusion, the use of office-based BP readings in the outpatient clinic does not correlate well with ABPM. Therefore, caution must be used when making management decisions based solely on in-office readings of BP.
DISCUSSION
The European Society of Hypertension still regards office BP measurement as the gold standard in screening for, diagnosing, and managing hypertension. As previously mentioned, though, office measurements are usually handled by medical staff and can be compromised by the white-coat effect and a small number of measurements. The USPSTF now considers ABPM the reference standard in primary care to diagnose hypertension in adults, to corroborate or contradict office-based determinations of elevated BP (whether based on single or repeated-interval measurements), and to avoid overtreatment of individuals displaying elevated office BP yet proven normotensive by ABPM.4,7 The recommendation of the American Academy of Family Physicians is similar to that of the USPSTF.7 Therefore, evidence supports ABPM as the reference standard for confirming elevated office BP screening results to avoid misdiagnosis and overtreatment of individuals with isolated clinic hypertension.7
How office measurements stack up against ABPM
Checking the validity of decisions in clinical practice is extremely important for patient management. One of the tools used for decision-making is an estimate of the LR. We used the LR to assess the value of office BP measurement in determining controlled or uncontrolled BP. A high LR (eg, >10) indicates that the office BP can be used to rule in the disease (uncontrolled BP) with a high probability, while a low LR (eg, <0.1) could rule it out. An LR of around one indicates that the office BP measurement cannot rule the diagnosis of uncontrolled BP in or out.27 In our meta-analysis, the positive LR is 1.35 and negative LR is 0.44. Therefore, in treated hypertensive patients, an indication of uncontrolled BP as measured in the clinic does not confirm a diagnosis of uncontrolled BP (as judged by the reference standard of ABPM). On the other hand, the negative LR means that normal office BP does not rule out uncontrolled BP, which may be detected with ABPM. Consequently, the measurement of BP in the office does not change the degree of (un)certainty of adequate control of BP. This knowledge is important, to avoid overtreatment of white coat hypertension and undertreatment of masked cases.
As previously mentioned, we reported similar results in a study designed to determine the validity of office BP measurement in a primary care setting compared with ABPM.13 In that paper, the level of agreement between both methods was poor, indicating that clinic measurements could not be recommended as a single method of BP control in hypertensive patients.
The use of ABPM in diagnosing hypertension is likely to increase as a consequence of some guideline updates.2 Our study emphasizes the importance of their use in the control of hypertensive patients.
Another published meta-analysis1 investigated the validity of office BP for the diagnosis of hypertension in untreated patients, with diagnostic thresholds for arterial hypertension set at 140/90 mm Hg for office measurement, and 135/85 mm Hg for ABPM. In that paper, the sensitivity of office BP was 74.6% (95% CI, 60.7-84.8) and the specificity was 74.6% (95% CI, 47.9-90.4).
In our present study carried out with hypertensive patients receiving treatment, we obtained a slightly higher sensitivity value of 81.9% (within the CI of this meta-analysis) and a lower specificity of 41.1%. Therefore, the discordance between office BP and ABPM seems to be similar for the diagnosis of hypertension and the classification of hypertension as being well or poorly controlled. This confirms the low validity of the office BP, both for diagnosis and monitoring of hypertensive patients.
Strengths of our study. The study focused on (treated) hypertensive patients in a primary care setting, where hypertension is most often managed. It confirms that ABPM is indispensable to a good clinical practice.
Limitations of our study are those inherent to meta-analyses. The main weakness of our study is the paucity of data available regarding the utility of ABPM for monitoring BP control with treatment in a primary care setting. Other limitations are the variability in BP thresholds used, the number of measurements performed, and the ambulatory BP devices used. These differences could contribute to the observed heterogeneity.
Application of our results must take into account that we included only those studies performed in a primary care setting with treated hypertensive patients.
Moreover, this study was not designed to evaluate the consequences of over- and undertreatment of blood pressure, nor to address the accuracy of automated blood pressure machines or newer health and fitness devices.
Implications for practice, policy, or future research. Alternative monitoring methods are home BP self-measurement and automated 30-minute clinic BP measurement.28 However, ABPM provides us with unique information about the BP pattern (dipping or non-dipping), BP variability, and mean nighttime BP. This paper establishes that the measurement of BP in the office is not an accurate method to monitor BP control. ABPM should be incorporated in usual clinical practice in primary care. Although the consequences of ambulatory monitoring are not the focus of this study, we acknowledge that the decision to incorporate ABPM in clinical practice depends on the availability of ambulatory devices, proper training of health care workers, and a cost-effectiveness analysis of its use.
CORRESPONDENCE
Sergio Reino-González, MD, PhD, Adormideras Primary Health Center, Poligono de Adormideras s/n. 15002 A Coruña, Spain; [email protected].
1. Hodgkinson J, Mant J, Martin U, et al. Relative effectiveness of clinic and home blood pressure monitoring compared with ambulatory blood pressure monitoring in diagnosis of hypertension: systematic review. BMJ. 2011;342:d3621.
2. National Institute for Health and Clinical Excellence. Hypertension in adults: diagnosis and management. Available at: http://www.nice.org.uk/guidance/CG127. Accessed November 15, 2016.
3. Chobanian AV, Bakris GL, Black HR, et al. Seventh report of the Joint National Committee on Prevention, Detection, Evaluation, and Treatment of High Blood Pressure. Hypertension. 2003;42:1206-1252.
4. Hermida RC, Smolensky MH, Ayala DE, et al. Ambulatory Blood Pressure Monitoring (ABPM) as the reference standard for diagnosis of hypertension and assessment of vascular risk in adults. Chronobiol Int. 2015;32:1329-1342.
5. Siu AL; U.S. Preventive Services Task Force. Screening for high blood pressure in adults: U.S. Preventive Services Task Force recommendation statement. Ann Intern Med. 2015;163:778-786.
6. Piper MA, Evans CV
7. American Academy of Family Physicians. Hypertension. Available at: www.aafp.org/patient-care/clinical-recommendations/all/hypertension.html. Accessed February 10, 2016.
8. Mancia G, Fagard R, Narkiewicz K, et al. 2013 ESH/ESC Practice Guidelines for the Management of Arterial Hypertension. Blood Press. 2013;23:3-16.
9. Marin R, de la Sierra A, Armario P, et al. 2005 Spanish guidelines in diagnosis and treatment of arterial hypertension. Medicina Clínica. 2005;125:24-34.
10. Fagard RH, Celis H, Thijs L, et al. Daytime and nighttime blood pressure as predictors of death and cause-specific cardiovascular events in hypertension. Hypertension. 2008;51:55-61.
11. Sega R, Trocino G, Lanzarotti A, et al. Alterations of cardiac structure in patients with isolated office, ambulatory, or home hypertension: Data from the general population (Pressione Arteriose Monitorate E Loro Associazioni [PAMELA] Study). Circulation. 2001;104:1385-1392.
12. Verberk WJ, Kessels AG, de Leeuw PW. Prevalence, causes, and consequences of masked hypertension: a meta-analysis. Am J Hypertens. 2008;21:969-975.
13. Reino-González S, Pita-Fernández S, Cibiriain-Sola M, et al. Validity of clinic blood pressure compared to ambulatory monitoring in hypertensive patients in a primary care setting. Blood Press. 2015;24:111-118.
14. Doebler P, Holling H. Meta-analysis of diagnostic accuracy with mada. Available at: https://cran.r-project.org/web/packages/mada/vignettes/mada.pdf. Accessed October 5, 2015.
15. Myers MG, Oh PI, Reeves RA, et al. Prevalence of white coat effect in treated hypertensive patients in the community. Am J Hypertens. 1995;8:591-597.
16. Imai Y, Tsuji I, Nagai K, et al. Ambulatory blood pressure monitoring in evaluating the prevalence of hypertension in adults in Ohasama, a rural Japanese community. Hypertens Res. 1996;19:207-212.
17. Taylor RS, Stockman J, Kernick D, et al. Ambulatory blood pressure monitoring for hypertension in general practice. J R Soc Med. 1998;91:301-304.
18. Little P, Barnett J, Barnsley L, et al. Comparison of agreement between different measures of blood pressure in primary care and daytime ambulatory blood pressure. BMJ. 2002;325:254.
19. Bur A, Herkner H, Vlcek M, et al. Classification of blood pressure levels by ambulatory blood pressure in hypertension. Hypertension. 2002;40:817-822.
20. Lindbaek M, Sandvik E, Liodden K, et al. Predictors for the white coat effect in general practice patients with suspected and treated hypertension. Br J Gen Pract. 2003;53:790-793.
21. Martínez MA, Sancho T, García P, et al. Home blood pressure in poorly controlled hypertension: relationship with ambulatory blood pressure and organ damage. Blood Press Monit. 2006;11:207-213.
22. Sierra BC, de la Sierra IA, Sobrino J, et al. Monitorización ambulatoria de la presión arterial (MAPA): características clínicas de 31.530 pacientes. Medicina Clínica. 2007;129:1-5.
23. Gómez MA, García L, Sánchez Á, et al. Agreement and disagreement between different methods of measuring blood pressure. Hipertensión (Madr). 2008;25:231-239.
24. Banegas JR, Segura J, De la Sierra A, et al. Gender differences in office and ambulatory control of hypertension. Am J Med. 2008;121:1078-1084.
25. Zaninelli A, Parati G, Cricelli C, et al. Office and 24-h ambulatory blood pressure control by treatment in general practice: the ‘Monitoraggio della pressione ARteriosa nella medicina TErritoriale’ study. J Hypertens. 2010;28:910-917.
26. Llisterri JL, Morillas P, Pallarés V, et al. Differences in the degree of control of arterial hypertension according to the measurement procedure of blood pressure in patients ≥ 65 years. FAPRES study. Rev Clin Esp. 2011;211:76-84.
27. Straus SE, Richardson WS, Glasziou P, et al. Evidence-Based Medicine: How to practice and teach it. 4th ed. Edinburgh, Scotland: Churchill Livingstone; 2010.
28. Van der Wel MC, Buunk IE, van Weel C, et al. A novel approach to office blood pressure measurement: 30-minute office blood pressure vs daytime ambulatory blood pressure. Ann Fam Med. 2011;9:128-135.
ABSTRACT
Purpose We performed a literature review and meta-analysis to ascertain the validity of office blood pressure (BP) measurement in a primary care setting, using ambulatory blood pressure measurement (ABPM) as a benchmark in the monitoring of hypertensive patients receiving treatment.
Methods We conducted a literature search for studies published up to December 2013 that included hypertensive patients receiving treatment in a primary care setting. We compared the mean office BP with readings obtained by ABPM. We summarized the diagnostic accuracy of office BP with respect to ABPM in terms of sensitivity, specificity, and positive and negative likelihood ratios (LR), with a 95% confidence interval (CI).
Results Only 12 studies met the inclusion criteria and contained data to calculate the differences between the means of office and ambulatory BP measurements. Five were suitable for calculating sensitivity, specificity, and likelihood ratios, and 4 contained sufficient extractable data for meta-analysis. Compared with ABPM (thresholds of 140/90 mm Hg for office BP; 130/80 mmHg for ABPM) in diagnosing uncontrolled BP, office BP measurement had a sensitivity of 81.9% (95% CI, 74.8%-87%) and specificity of 41.1% (95% CI, 35.1%-48.4%). Positive LR was 1.35 (95% CI, 1.32-1.38), and the negative LR was 0.44 (95% CI, 0.37-0.53).
Conclusion Likelihood ratios show that isolated BP measurement in the office does not confirm or rule out the presence of poor BP control. Likelihood of underestimating or overestimating BP control is high when relying on in-office BP measurement alone.
A growing body of evidence supports more frequent use of ambulatory blood pressure monitoring (ABPM) to confirm a diagnosis of hypertension1 and to monitor blood pressure (BP) response to treatment.2 The Joint National Committee on Prevention, Detection, Evaluation, and Treatment of High Blood Pressure has long accepted ABPM for diagnosis of hypertension,3 and many clinicians consider ABPM the reference standard for diagnosing true hypertension and for accurately assessing associated cardiovascular risk in adults, regardless of office BP readings.4 The US Preventive Services Task Force (USPSTF) recommends obtaining BP measurements outside the clinical setting to confirm a diagnosis of hypertension before starting treatment.5 The USPSTF also asserts that elevated 24-hour ambulatory systolic BP is consistently and significantly associated with stroke and other cardiovascular events independent of office BP readings and has greater predictive value than office monitoring.5 The USPSTF concludes that ABPM, because of its large evidence base, is the best confirmatory test for hypertension.6 The recommendation of the American Academy of Family Physicians is similar to that of the USPSTF.7
The challenge. Despite the considerable support for ABPM, this method of BP measurement is still not sufficiently integrated into primary care. And some guidelines, such as those of
But ABPM’s advantages are numerous. Ambulatory monitors, which can record BP for 24 hours, are typically programmed to take readings every 15 to 30 minutes, providing estimates of mean daytime and nighttime BP and revealing an individual’s circadian pattern of BP.8-10 Ambulatory BP values usually considered the uppermost limit of normal are 135/85 mm Hg (day), 120/70 mm Hg (night), and 130/80 mm Hg (24 hour).8
Office BP monitoring, usually performed manually by medical staff, has 2 main drawbacks: the well-known white-coat effect experienced by many patients, and the relatively small number of possible measurements. A more reliable in-office BP estimation of BP would require repeated measurements at each of several visits.
By comparing ABPM and office measurements, 4 clinical findings are possible: isolated clinic or office (white-coat) hypertension (ICH); isolated ambulatory (masked) hypertension (IAH); consistent normotension; or sustained hypertension. With ICH, BP is high in the office and normal with ABPM. With IAH, BP is normal in the office and high with ABPM. With consistent normotension and sustained hypertension, BP readings with both types of measurement agree.8,9
In patients being treated for hypertension, ICH leads to an overestimation of uncontrolled BP and may result in overtreatment. The cardiovascular risk, although controversial, is usually lower than in patients diagnosed with sustained hypertension.11 IAH leads to an underestimation of uncontrolled BP and may result in undertreatment; its associated cardiovascular risk is similar to that of sustained hypertension.12
Our research objective. We recently published a study conducted with 137 hypertensive patients in a primary care center.13 Our conclusion was that in-office measurement of BP had insufficient clinical validity to be recommended as a sole method of monitoring BP control. In accurately classifying BP as controlled or uncontrolled, clinic measurement agreed with 24h-ABPM in just 64.2% of cases.13
In our present study, we performed a literature review and meta-analysis to ascertain the validity of office BP measurement in a primary care setting, using ABPM as a benchmark in the monitoring of hypertensive patients receiving treatment.
METHODS
Most published studies comparing conventional office BP measurement with ABPM have been conducted with patients not taking antihypertensive medication. We excluded these studies and conducted a literature search for studies published up to December 2013 that included hypertensive patients receiving treatment in a primary care setting.
We searched Medline (from 1950 onward) and the Cochrane Database of Systematic Reviews. For the Medline search, we combined keywords for office BP, hypertension, and ambulatory BP with keywords for outpatient setting and primary care, using the following syntax: (((“clinic blood pressure” OR “office blood pressure” OR “casual blood pressure”))) AND (“hypertension” AND ((((“24-h ambulatory blood pressure”) OR “24 h ambulatory blood pressure”) OR “24 hour ambulatory blood pressure”) OR “blood pressure monitoring, ambulatory”[Mesh]) AND ((((((“outpatient setting”) OR “primary care”) OR “family care”) OR “family physician”) OR “family practice”) OR “general practice”)). We chose studies published in English and reviewed the titles and abstracts of identified articles.
With the aim of identifying additional candidate studies, we reviewed the reference lists of eligible primary studies, narrative reviews, and systematic reviews. The studies were generally of good quality and used appropriate statistical methods. Only primary studies qualified for meta-analysis.
Inclusion and exclusion criteria
Acceptable studies had to be conducted in a primary care setting with patients being treated for hypertension, and had to provide data comparing office BP measurement with ABPM. We excluded studies in which participants were treated in the hospital, were untreated, or had not been diagnosed with hypertension.
The quality of the studies included in the meta-analysis was judged by 2 independent observers according to the following criteria: the clear classification and initial comparison of both measurements; explicit and defined diagnostic criteria; compliance with the inclusion/exclusion criteria; and clear and precise definition of outcome variables.
Data extraction
We extracted the following data from each included study: study population, number of patients included, age, gender distribution, number of measurements (ambulatory and office BP), equipment validation, mean office and ambulatory BP, and the period of ambulatory BP measurement. We included adult patients of all ages, and we compared the mean office BP with those obtained by ABPM in hypertensive patients.
STATISTICAL ANALYSIS
For each study, we summarized the diagnostic accuracy of office BP with respect to ABPM in terms of sensitivity, specificity, and positive and negative likelihood ratios (LRs), with the 95% confidence interval (CI), if available. If these rates were not directly reported in the original papers, we used the published data to calculate them.
We used the R v2.15.1 software with the “mada” package for meta-analysis.14 Although a bivariate approach is preferred for the meta-analysis of diagnostic accuracy, it cannot be recommended if the number of primary studies to pool is too small,14 as happened in our case. Therefore, we used a univariate approach and pooled summary statistics for positive LR, negative LR, and the diagnostic odds ratio (DOR) with their 95% confidence intervals. We used the DerSimonian-Laird method to perform a random-effect meta-analysis. To explore heterogeneity between the studies, we used the Cochran’s Q heterogeneity test, I2 index, and Galbraith and L’Abbé plots.
RESULTS
Our search identified 237 studies, only 12 of which met the inclusion criteria and contained data to calculate the differences between the means of office and ambulatory BP measurements (TABLES 1 AND 2).15-26 Of these 12 studies, 5 were suitable for calculating sensitivity, specificity, and LR (TABLE 3),16,18,22,24,26 and 4 contained sufficient extractable data for meta-analysis. The study by Little et al18 was not included in the meta-analysis, as the number of true-positive, true-negative, false-positive, and false-negative results could not be deduced from published data.
The studies differed in sample size (40-31,530), patient ages (mean, 55-72.8 years), sex (percentage of men, 31%-52.9%), and number of measurements for office BP (1-9) and ABPM (32-96) (TABLE 1),15-26 as well as in daytime and nighttime periods for ABPM and BP thresholds, and in differences between the mean office and ambulatory BPs (TABLE 2).15-26
In general, the mean office BP measurements were higher than those obtained with ABPM in any period—from 5/0 mm Hg to 27.4/10.1 mm Hg in the day, and from 7.9/6.3 mm Hg to 31.2/13.7 mm Hg over 24 hours (TABLE 2).15-26
Compared with ABPM in diagnosing uncontrolled BP, office BP measurement had a sensitivity of 55.7% to 91.2% and a specificity of 25.8% to 61.8% (depending on whether the measure was carried out by the doctor or nurse18); positive LR ranged from 1.2 to 1.4, and negative LR from 0.3 to 0.72 (TABLE 3).16,18,22,24,26
For meta-analysis, we pooled studies with the same thresholds (140/90 mm Hg for office BP; 130/80 mm Hg for ABPM), with diagnostic accuracy of office BP expressed as pooled positive and negative LR, and as pooled DOR. The meta-analysis revealed that the pooled positive LR was 1.35 (95% CI, 1.32-1.38), and the pooled negative LR was 0.44 (95% CI, 0.37-0.53). The pooled DOR was 3.47 (95% CI, 3.02-3.98). Sensitivity was 81.9% (95% CI, 74.8%-87%) and specificity was 41.1% (95% CI, 35.1%-48.4%).
One study16 had a slightly different ambulatory diagnostic threshold (133/78 mm Hg), so we excluded it from a second meta-analysis. Results after the exclusion did not change significantly: positive LR was 1.39 (95% CI, 1.34-1.45); negative LR was 0.38 (95% CI, 0.33-0.44); and DOR was 3.77 (95% CI, 3.31-4.43).
In conclusion, the use of office-based BP readings in the outpatient clinic does not correlate well with ABPM. Therefore, caution must be used when making management decisions based solely on in-office readings of BP.
DISCUSSION
The European Society of Hypertension still regards office BP measurement as the gold standard in screening for, diagnosing, and managing hypertension. As previously mentioned, though, office measurements are usually handled by medical staff and can be compromised by the white-coat effect and a small number of measurements. The USPSTF now considers ABPM the reference standard in primary care to diagnose hypertension in adults, to corroborate or contradict office-based determinations of elevated BP (whether based on single or repeated-interval measurements), and to avoid overtreatment of individuals displaying elevated office BP yet proven normotensive by ABPM.4,7 The recommendation of the American Academy of Family Physicians is similar to that of the USPSTF.7 Therefore, evidence supports ABPM as the reference standard for confirming elevated office BP screening results to avoid misdiagnosis and overtreatment of individuals with isolated clinic hypertension.7
How office measurements stack up against ABPM
Checking the validity of decisions in clinical practice is extremely important for patient management. One of the tools used for decision-making is an estimate of the LR. We used the LR to assess the value of office BP measurement in determining controlled or uncontrolled BP. A high LR (eg, >10) indicates that the office BP can be used to rule in the disease (uncontrolled BP) with a high probability, while a low LR (eg, <0.1) could rule it out. An LR of around one indicates that the office BP measurement cannot rule the diagnosis of uncontrolled BP in or out.27 In our meta-analysis, the positive LR is 1.35 and negative LR is 0.44. Therefore, in treated hypertensive patients, an indication of uncontrolled BP as measured in the clinic does not confirm a diagnosis of uncontrolled BP (as judged by the reference standard of ABPM). On the other hand, the negative LR means that normal office BP does not rule out uncontrolled BP, which may be detected with ABPM. Consequently, the measurement of BP in the office does not change the degree of (un)certainty of adequate control of BP. This knowledge is important, to avoid overtreatment of white coat hypertension and undertreatment of masked cases.
As previously mentioned, we reported similar results in a study designed to determine the validity of office BP measurement in a primary care setting compared with ABPM.13 In that paper, the level of agreement between both methods was poor, indicating that clinic measurements could not be recommended as a single method of BP control in hypertensive patients.
The use of ABPM in diagnosing hypertension is likely to increase as a consequence of some guideline updates.2 Our study emphasizes the importance of their use in the control of hypertensive patients.
Another published meta-analysis1 investigated the validity of office BP for the diagnosis of hypertension in untreated patients, with diagnostic thresholds for arterial hypertension set at 140/90 mm Hg for office measurement, and 135/85 mm Hg for ABPM. In that paper, the sensitivity of office BP was 74.6% (95% CI, 60.7-84.8) and the specificity was 74.6% (95% CI, 47.9-90.4).
In our present study carried out with hypertensive patients receiving treatment, we obtained a slightly higher sensitivity value of 81.9% (within the CI of this meta-analysis) and a lower specificity of 41.1%. Therefore, the discordance between office BP and ABPM seems to be similar for the diagnosis of hypertension and the classification of hypertension as being well or poorly controlled. This confirms the low validity of the office BP, both for diagnosis and monitoring of hypertensive patients.
Strengths of our study. The study focused on (treated) hypertensive patients in a primary care setting, where hypertension is most often managed. It confirms that ABPM is indispensable to a good clinical practice.
Limitations of our study are those inherent to meta-analyses. The main weakness of our study is the paucity of data available regarding the utility of ABPM for monitoring BP control with treatment in a primary care setting. Other limitations are the variability in BP thresholds used, the number of measurements performed, and the ambulatory BP devices used. These differences could contribute to the observed heterogeneity.
Application of our results must take into account that we included only those studies performed in a primary care setting with treated hypertensive patients.
Moreover, this study was not designed to evaluate the consequences of over- and undertreatment of blood pressure, nor to address the accuracy of automated blood pressure machines or newer health and fitness devices.
Implications for practice, policy, or future research. Alternative monitoring methods are home BP self-measurement and automated 30-minute clinic BP measurement.28 However, ABPM provides us with unique information about the BP pattern (dipping or non-dipping), BP variability, and mean nighttime BP. This paper establishes that the measurement of BP in the office is not an accurate method to monitor BP control. ABPM should be incorporated in usual clinical practice in primary care. Although the consequences of ambulatory monitoring are not the focus of this study, we acknowledge that the decision to incorporate ABPM in clinical practice depends on the availability of ambulatory devices, proper training of health care workers, and a cost-effectiveness analysis of its use.
CORRESPONDENCE
Sergio Reino-González, MD, PhD, Adormideras Primary Health Center, Poligono de Adormideras s/n. 15002 A Coruña, Spain; [email protected].
1. Hodgkinson J, Mant J, Martin U, et al. Relative effectiveness of clinic and home blood pressure monitoring compared with ambulatory blood pressure monitoring in diagnosis of hypertension: systematic review. BMJ. 2011;342:d3621.
2. National Institute for Health and Clinical Excellence. Hypertension in adults: diagnosis and management. Available at: http://www.nice.org.uk/guidance/CG127. Accessed November 15, 2016.
3. Chobanian AV, Bakris GL, Black HR, et al. Seventh report of the Joint National Committee on Prevention, Detection, Evaluation, and Treatment of High Blood Pressure. Hypertension. 2003;42:1206-1252.
4. Hermida RC, Smolensky MH, Ayala DE, et al. Ambulatory Blood Pressure Monitoring (ABPM) as the reference standard for diagnosis of hypertension and assessment of vascular risk in adults. Chronobiol Int. 2015;32:1329-1342.
5. Siu AL; U.S. Preventive Services Task Force. Screening for high blood pressure in adults: U.S. Preventive Services Task Force recommendation statement. Ann Intern Med. 2015;163:778-786.
6. Piper MA, Evans CV
7. American Academy of Family Physicians. Hypertension. Available at: www.aafp.org/patient-care/clinical-recommendations/all/hypertension.html. Accessed February 10, 2016.
8. Mancia G, Fagard R, Narkiewicz K, et al. 2013 ESH/ESC Practice Guidelines for the Management of Arterial Hypertension. Blood Press. 2013;23:3-16.
9. Marin R, de la Sierra A, Armario P, et al. 2005 Spanish guidelines in diagnosis and treatment of arterial hypertension. Medicina Clínica. 2005;125:24-34.
10. Fagard RH, Celis H, Thijs L, et al. Daytime and nighttime blood pressure as predictors of death and cause-specific cardiovascular events in hypertension. Hypertension. 2008;51:55-61.
11. Sega R, Trocino G, Lanzarotti A, et al. Alterations of cardiac structure in patients with isolated office, ambulatory, or home hypertension: Data from the general population (Pressione Arteriose Monitorate E Loro Associazioni [PAMELA] Study). Circulation. 2001;104:1385-1392.
12. Verberk WJ, Kessels AG, de Leeuw PW. Prevalence, causes, and consequences of masked hypertension: a meta-analysis. Am J Hypertens. 2008;21:969-975.
13. Reino-González S, Pita-Fernández S, Cibiriain-Sola M, et al. Validity of clinic blood pressure compared to ambulatory monitoring in hypertensive patients in a primary care setting. Blood Press. 2015;24:111-118.
14. Doebler P, Holling H. Meta-analysis of diagnostic accuracy with mada. Available at: https://cran.r-project.org/web/packages/mada/vignettes/mada.pdf. Accessed October 5, 2015.
15. Myers MG, Oh PI, Reeves RA, et al. Prevalence of white coat effect in treated hypertensive patients in the community. Am J Hypertens. 1995;8:591-597.
16. Imai Y, Tsuji I, Nagai K, et al. Ambulatory blood pressure monitoring in evaluating the prevalence of hypertension in adults in Ohasama, a rural Japanese community. Hypertens Res. 1996;19:207-212.
17. Taylor RS, Stockman J, Kernick D, et al. Ambulatory blood pressure monitoring for hypertension in general practice. J R Soc Med. 1998;91:301-304.
18. Little P, Barnett J, Barnsley L, et al. Comparison of agreement between different measures of blood pressure in primary care and daytime ambulatory blood pressure. BMJ. 2002;325:254.
19. Bur A, Herkner H, Vlcek M, et al. Classification of blood pressure levels by ambulatory blood pressure in hypertension. Hypertension. 2002;40:817-822.
20. Lindbaek M, Sandvik E, Liodden K, et al. Predictors for the white coat effect in general practice patients with suspected and treated hypertension. Br J Gen Pract. 2003;53:790-793.
21. Martínez MA, Sancho T, García P, et al. Home blood pressure in poorly controlled hypertension: relationship with ambulatory blood pressure and organ damage. Blood Press Monit. 2006;11:207-213.
22. Sierra BC, de la Sierra IA, Sobrino J, et al. Monitorización ambulatoria de la presión arterial (MAPA): características clínicas de 31.530 pacientes. Medicina Clínica. 2007;129:1-5.
23. Gómez MA, García L, Sánchez Á, et al. Agreement and disagreement between different methods of measuring blood pressure. Hipertensión (Madr). 2008;25:231-239.
24. Banegas JR, Segura J, De la Sierra A, et al. Gender differences in office and ambulatory control of hypertension. Am J Med. 2008;121:1078-1084.
25. Zaninelli A, Parati G, Cricelli C, et al. Office and 24-h ambulatory blood pressure control by treatment in general practice: the ‘Monitoraggio della pressione ARteriosa nella medicina TErritoriale’ study. J Hypertens. 2010;28:910-917.
26. Llisterri JL, Morillas P, Pallarés V, et al. Differences in the degree of control of arterial hypertension according to the measurement procedure of blood pressure in patients ≥ 65 years. FAPRES study. Rev Clin Esp. 2011;211:76-84.
27. Straus SE, Richardson WS, Glasziou P, et al. Evidence-Based Medicine: How to practice and teach it. 4th ed. Edinburgh, Scotland: Churchill Livingstone; 2010.
28. Van der Wel MC, Buunk IE, van Weel C, et al. A novel approach to office blood pressure measurement: 30-minute office blood pressure vs daytime ambulatory blood pressure. Ann Fam Med. 2011;9:128-135.
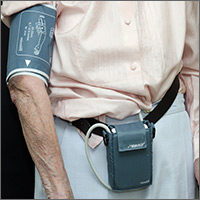
Biomechanics of Polyhydroxyalkanoate Mesh–Augmented Single-Row Rotator Cuff Repairs
Healing after rotator cuff repair (RCR) can be challenging, especially in cases of large and massive tears, revision repairs, and tendons with poor tissue quality.1-3 Poor tissue quality is associated with increased risk for recurrent tears, independent of age and tear size.3 Various techniques have been used to improve tendon fixation strength in these difficult situations, including augmented suture configurations (eg, massive cuff stitches, rip-stop stitches) and tissue grafts (eg, acellular dermal matrix).4-9 Clinical studies have found improved healing rates for larger tears and revision repairs using acellular dermal matrix grafts.6,10 Synthetic patches are another option for RCR augmentation, but limited clinical data and biomechanical evidence support use of synthetic grafts as an augment for RCRs.11-13
Polyhydroxyalkanoates (PHAs) are a class of biodegradable polymers that have been used as orthopedic devices, tissue scaffolds, patches, and other applications with increasing frequency over the past decade.14 In the laboratory, these implanted materials have been shown to support cell migration and growth.15 The PHA family of polymers typically degrades by hydrolytic and bacterial depolymerase mechanisms over 52-plus weeks in vivo.14PHA grafts have been studied in the setting of RCR. An expanded polytetrafluoroethylene scaffold was shown to improve repair mechanics when used as a bursal side graft in an in vitro ovine model.11 The graft increased tendon footprint contact pressure and failure loads by almost 180 N. In clinical studies, poly-L-lactic acid augmentations have been used to reinforce massive RCRs. Lenart and colleagues16 found that 38% of 16 patients with such tears had an intact rotator cuff at 1.2-year follow-up, and improvement in clinical scores. Proctor13 reported on use of a poly-L-lactic acid retrograde patch for reinforcement of massive tears with both single- and double-row repairs in 18 patients. The cohort had more favorable rates of intact cuffs at 12 months (83%) and 42 months (78%), and ASES (American Shoulder and Elbow Surgeons) scores improved from 25 before surgery to 82 at latest follow-up after surgery.
RCR augmentation traditionally has been performed with an open or mini-open technique.6 Recently, several authors have reported on arthroscopic techniques for augmentation with either acellular dermal matrix or synthetic grafts.13,17,18 Most techniques have involved “bridging” with a graft or patch used to stress-shield a single-row repair.8,9,13 This bridging typically involves placing several sutures medial to where the anchor repair stitches pass through the tendon. An alternative is to pass the repair stitches through both the tendon and the graft.17-19 The overall volume of tissue incorporated into the repair stitches (rotator cuff plus graft) is increased with the augmented technique relative to the bridging technique. Both can be technically challenging, but the augmented technique may be easier to perform arthroscopically.9,19 Regardless, these techniques are complicated and require a higher level of arthroscopic skills compared with those required in arthroscopic RCR without a graft. Simplifying arthroscopic graft augmentation likely will increase its utility because, even for skilled surgeons, adding a graft can increase operative time by 20 to 30 minutes. Simplification will also extend use of the technique to surgeons with less experience and proficiency with arthroscopic repair.
We developed a simple method for augmenting single-row RCR with a strip of bioresorbable soft-tissue scaffold. We also conducted a study to evaluate the initial biomechanical properties of single-row RCR in cadaveric shoulder specimens augmented with PHA mesh (BioFiber; Tornier) graft as compared with single-row RCR without augmentation. Both cyclic gap formation and ultimate failure loads and displacement were quantified. We hypothesized that the augmented RCRs would have decreased gap formation and increased ultimate failure loads compared with nonaugmented RCRs. This study was exempt from having to obtain Institutional Review B
Methods
Eight pairs of fresh-frozen cadaver humeri (6 male, 2 female; mean [SD] age, 61 [9] years) were dissected of all soft tissue (except rotator cuff) by Dr. Tashjian, a board-certified, fellowship-trained orthopedic surgeon. There were no qualitative differences in tendon condition between tendons within a pair. The supraspinatus muscle and tendon were separated from the other rotator cuff muscles. The infraspinatus, subscapularis, and teres minor were removed from the humerus. Last, the supraspinatus was resected at its insertion. Humeral pairs were then randomized into augmented and nonaugmented RCRs within each pair.
In the nonaugmented group, the supraspinatus was reattached to its insertion in a single-row RCR with 2 triple-loaded suture anchors (5.5-mm Insite FT Ti, No. 2 Force Fiber suture; Tornier) and 6 simple stitches (Figure 1A). Anchors were placed midway between the articular margin and the lateral edge of the greater tuberosity at about 45° to the bone surface. 
In the contralateral shoulders, augmented RCRs were performed. Specimens were prepared exactly as they were for the nonaugmented RCRs, including anchor placement and suture passage. Before knot tying, RCRs were augmented with 2 strips of 13-mm × 23-mm PHA mesh (BioFiber) (Figure 1B). One strip was used to augment the 3 sutures of each anchor, overlying the residual tendon, to reinforce the tendon–knot interface. After each suture was passed through the supraspinatus tendon from the intra-articular surface, the stitch was passed through the strip of PHA mesh. Stitches were separated by 5 mm in each mesh strip. All 6 sutures were then tied with a Revo knot between the free end of each suture leg and the leg that passed through the tendon and mesh.
Each humerus was transected at the midshaft and potted and mounted in an Instron 1331 load frame with Model 8800 controller (Instron). A cryoclamp was used to grasp the supraspinatus muscle belly above the musculotendinous junction (Figure 2). 
Three rows of 2-mm fiducial markers were affixed to the bone, tendon, and muscle belly with cyanoacrylate for tracking with a digital video system (DMAS Version 6.5; Spicatek) (Figure 3).21 
A 0.1-MPa pre-stress (applied force/tendon cross-sectional area) was applied to each construct to determine the starting position for the deformation profile. Each repair underwent 1000 cycles of uniaxial load-controlled displacement between 0.1 and 1.0 MPa of effective stress at 1 Hz. Effective stress was determined as the ratio of applied force to cross-sectional area of the tendon at harvest to normalize the applied loads between tendons of varying size. During cyclic testing, gapping of more than 5 mm was defined as construct failure.22 After cyclic loading, each construct was loaded to failure at 1.0 mm/s. Ultimate failure load was defined as the highest load achieved at the maximum displacement before rapid decline in load supported by the construct.
Statistical Analysis
Paired t tests were used to compare the matched pairs of constructs. For all tests, significance was set at P ≤ .05. Post hoc power was calculated for significant results using G*Power Version 3.1.6.23 All data are presented as means (SDs).
Results
After 1000 cycles of displacement, mean (SD) gapping was 3.8 (0.9) mm for the nonaugmented repairs and 3.9 (1.1) mm for the PHA mesh–augmented repairs (P = .879) (Figure 4). 
For the nonaugmented repairs, mean (SD) failure displacement was 6.3 (1.7) mm, and mean (SD) ultimate failure load was 472.1 (120.3) N. For the PHA-augmented repairs, failure displacement was 5.5 (1.9) mm, and ultimate failure load was 571.2 (173.0) N. There was no difference in failure displacement (P = .393), but there was a difference in ultimate failure load (P = .042; power = 0.57). During failure testing, mean (SD) tissue deformation was higher (P = .012; power = 0.83) for the PHA-augmented repairs, 1.2 (0.7) mm, than for the nonaugmented repairs, 0.8 (0.5) mm. Failures, which were consistent within pairs, were caused by tissue failure, with sutures pulling through the tissue (4 pairs) or single anchor pullout before ultimate tissue failure (4 pairs). Of the 4 failures with anchor pullout, 3 had anterior anchor pullout, and 1 had posterior anchor pullout. In all specimens with anchor pullout, the second anchor remained stable, and ultimate failure occurred with tissue tearing at the suture interface. There were no significant differences in any metrics between specimens that failed with intact anchors and specimens with single anchor pullout (P ≥ .122). Therefore, both groups were pooled for the failure analysis.
Discussion
RCR augmentation with a synthetic graft is a viable option for improving fixation strength of supraspinatus repairs, as shown in otherwise healthy tendon in the present study. Our hypothesis that there would be decreased gap formation with graft augmentation was not supported, whereas the hypothesis of increased failure loads with graft augmentation was supported. These findings may also be applicable in cases of large tears, revisions, and tendons with poor tissue quality. Simplification of graft application techniques will allow quick and easy arthroscopic augmentation.
Studies of RCRs for large or massive tears have reported retear rates of 25% to 79%.24-26 Latissimus dorsi tendon transfers also show promise in posterosuperior RCRs, with failure rates near 10%.27,28 Although use of PHA patches in RCR augmentation is relatively new, short-term and midterm failure rates are in the range of 20% to 60% in the few small cohorts currently being studied.13,16 It is possible that these rates may improve as indications, surgical experience, and techniques for use of PHA patches are further refined. Regardless, with PHA currently being used in practice, it is important to quantify the biomechanics of the augmentation as a baseline for its performance in reinforcing the tendon–suture interface.
We determined that the initial fixation strength of single-row repairs was higher with the addition of PHA synthetic grafts using a very simple technique. Single-row triple-loaded anchor repairs already provide high initial mechanical strength, and our results are similar to those of another study of this technique.29 Despite the already high mechanical strength of a triple-loaded anchor repair, PHA mesh increased ultimate strength by about 100 N (~25%). Of note, tissue elongation during failure was higher (P = .012; power = 0.83) in the PHA-augmented group (1.2 mm) than in the nonaugmented group (0.8 mm). This was not surprising—failure loads were almost 100 N higher in the PHA-augmented group than in the nonaugmented group. Consequently, much higher forces were placed on the muscle belly, likely resulting in additional elongation of the intact tissue medial to the repair construct.
The ultimate failure loads in our study compare favorably with the biomechanical strength of augmented repairs reported by others.8,9,18 Barber and colleagues18 evaluated an augmented single-row repair with 2 double-loaded suture anchors and an acellular dermal matrix graft. The ultimate failure load of the augmented repairs was 325 N. In contrast, Omae and colleagues8 tested a bridging single-row repair using 2 double-loaded suture anchors and an acellular dermal matrix graft. Ultimate failure load of the augmented repairs was 560 N, similar to our finding. Last, Shea and colleagues9 evaluated a bridging single-row repair using 2 double-loaded suture anchors and an acellular dermal matrix graft, with ultimate failure load of 429 N. The techniques in all 3 studies can be performed arthroscopically but are challenging and require multiple extra sutures and anchors that need management and tying. Our technique provides similar initial fixation strength, has no requirement for extra sutures or anchors, and is very simple to perform.
The supraspinatus tendon is estimated to fail between 800 N and 1000 N.30,31 Biomechanical shoulder simulators use supraspinatus forces in the range of 20 N to 200 N for scapular plane abduction.32-36 Therefore, the single-row repair failures in our study fell between functional and full-thickness failure loads. Studies on the mechanics of degenerated human supraspinatus tendon are limited, but there is evidence the mechanical properties of these tissues are inferior to those of healthy tendon.37 A 100-N increase in failure loads with PHA augmentation may prove highly significant in reinforcing the suture–tendon interface in degenerated tendons.
Adding the mesh did not have any effect on gapping at the repair site after cyclic loading. This finding suggests that construct gapping under cyclic loading is not a function of a reinforced knot–tendon interface but is instead caused by microtearing and cinching of the suture constructs in relation to the underlying bone. Tissue elongation likely was not a strong contributor to overall cyclic gapping, as elongation did not differ between the nonaugmented and augmented repairs (0.5 mm vs 0.7 mm; P = .276) and was small relative to the nearly 4 mm of construct gapping. Gapping may be affected by healing and integration of the mesh into the repaired tendon over time, but this effect could not be captured in the present study. Patients are initially immobilized and passive shoulder motion gradually introduced, in stark contrast to the immediate loading protocol in the present study. Regardless, the 25% increase in overall strength may be clinically important, especially in cases of difficult repair or poor tissue quality.
Our technique simplifies arthroscopic augmentation—stitches are passed through the rotator cuff in simple fashion. Before being tied, the limbs that were passed through the rotator cuff are removed through a cannula and then passed through the synthetic graft. 
Study Limitations
This study had several limitations. First, it was a cadaveric biomechanical study that evaluated only time-zero biomechanical properties. Loads were normalized to tendon size, specimens were randomized between sides, and paired specimens were used to minimize the effects of tendon and bone quality on outcome metrics. In addition, donor tendons were representative of otherwise healthy tissue. Chronic tears and associated resorption/atrophy could have affected the magnitude of forces and gapping detected in this study. Theoretically, over time the tendon tissue will adhere to and grow into the mesh, which could minimize potential differences. Studies are needed to determine the effects of healing on long-term repair strength in affected patients. Last, all constructs were performed in open fashion to improve repeatability of construct placement and provide accessibility for Instron testing. Our technique did not directly replicate the arthroscopic approach, but, unlike other augmentation techniques, it is so simple that transition to all-arthroscopic augmentation is realistic.
Patch augmentation increases the cost of materials and operative time and should be considered a limitation of its utility. We do not recommend augmentation in all RCRs, as it likely is cost-ineffective. Instead, we recommend augmentation in cases of poor tissue quality, which could lead to healing failure, revision surgery, and higher overall patient costs beyond the cost of adding augmentation. Similarly, we recommend augmentation for revision cases in which tendon healing has failed and tissue quality is poor. The goal is to prevent another failure.
Conclusion
PHA graft augmentation of single-row triple-loaded anchor repairs of the supraspinatus tendon improves the overall ultimate load to failure by 25%. There was no difference in gap formation after cyclic loading between augmented and nonaugmented repairs. This technique for arthroscopic augmentation can be used to improve initial biomechanical repair strength in tears at risk for failure.
Am J Orthop. 2016;45(7):E527-E533. Copyright Frontline Medical Communications Inc. 2016. All rights reserved.
1. Galatz LM, Ball CM, Teefey SA, Middleton WD, Yamaguchi K. The outcome and repair integrity of completely arthroscopically repaired large and massive rotator cuff tears. J Bone Joint Surg Am. 2004;86(2):219-224.
2. Keener JD, Wei AS, Kim HM, et al. Revision arthroscopic rotator cuff repair: repair integrity and clinical outcome. J Bone Joint Surg Am. 2010;92(3):590-598.
3. Nho SJ, Brown BS, Lyman S, Adler RS, Altchek DW, MacGillivray JD. Prospective analysis of arthroscopic rotator cuff repair: prognostic factors affecting clinical and ultrasound outcome. J Shoulder Elbow Surg. 2009;18(1):13-20.
4. Barber FA, Herbert MA, Schroeder FA, Aziz-Jacobo J, Mays MM, Rapley JH. Biomechanical advantages of triple-loaded suture anchors compared with double-row rotator cuff repairs. Arthroscopy. 2010;26(3):316-323.
5. Burkhart SS, Denard PJ, Konicek J, Hanypsiak BT. Biomechanical validation of load-sharing rip-stop fixation for the repair of tissue-deficient rotator cuff tears. Am J Sports Med. 2014;42(2):457-462.
6. Gupta AK, Hug K, Boggess B, Gavigan M, Toth AP. Massive or 2-tendon rotator cuff tears in active patients with minimal glenohumeral arthritis: clinical and radiographic outcomes of reconstruction using dermal tissue matrix xenograft. Am J Sports Med. 2013;41(4):872-879.
7. Ma CB, MacGillivray JD, Clabeaux J, Lee S, Otis JC. Biomechanical evaluation of arthroscopic rotator cuff stitches. J Bone Joint Surg Am. 2004;86(6):1211-1216.
8. Omae H, Steinmann SP, Zhao C, et al. Biomechanical effect of rotator cuff augmentation with an acellular dermal matrix graft: a cadaver study. Clin Biomech. 2012;27(8):789-792.
9. Shea KP, Obopilwe E, Sperling JW, Iannotti JP. A biomechanical analysis of gap formation and failure mechanics of a xenograft-reinforced rotator cuff repair in a cadaveric model. J Shoulder Elbow Surg. 2012;21(8):1072-1079.
10. Agrawal V. Healing rates for challenging rotator cuff tears utilizing an acellular human dermal reinforcement graft. Int J Shoulder Surg. 2012;6(2):36-44.
11. Beimers L, Lam PH, Murrell GA. The biomechanical effects of polytetrafluoroethylene suture augmentations in lateral-row rotator cuff repairs in an ovine model. J Shoulder Elbow Surg. 2014;23(10):1545-1552.
12. McCarron JA, Milks RA, Chen X, Iannotti JP, Derwin KA. Improved time-zero biomechanical properties using poly-L-lactic acid graft augmentation in a cadaveric rotator cuff repair model. J Shoulder Elbow Surg. 2010;19(5):688-696.
13. Proctor CS. Long-term successful arthroscopic repair of large and massive rotator cuff tears with a functional and degradable reinforcement device. J Shoulder Elbow Surg. 2014;23(10):1508-1513.
14. Misra SK, Valappil SP, Roy I, Boccaccini AR. Polyhydroxyalkanoate (PHA)/inorganic phase composites for tissue engineering applications. Biomacromolecules. 2006;7(8):2249-2258.
15. Ellis G, Cano P, Jadraque M, et al. Laser microperforated biodegradable microbial polyhydroxyalkanoate substrates for tissue repair strategies: an infrared microspectroscopy study. Anal Bioanal Chem. 2011;399(7):2379-2388.
16. Lenart BA, Martens KA, Kearns KA, Gillespie RJ, Zoga AC, Williams GR. Treatment of massive and recurrent rotator cuff tears augmented with a poly-l-lactide graft, a preliminary study. J Shoulder Elbow Surg. 2015;24(6):915-921.
17. Barber FA, Burns JP, Deutsch A, Labbé MR, Litchfield RB. A prospective, randomized evaluation of acellular human dermal matrix augmentation for arthroscopic rotator cuff repair. Arthroscopy. 2012;28(1):8-15.
18. Barber FA, Herbert MA, Boothby MH. Ultimate tensile failure loads of a human dermal allograft rotator cuff augmentation. Arthroscopy. 2008;24(1):20-24.
19. Gilot GJ, Attia AK, Alvarez AM. Arthroscopic repair of rotator cuff tears using extracellular matrix graft. Arthrosc Tech. 2014;3(4):e487-e489.
20. Barber FA, Coons DA, Ruiz-Suarez M. Cyclic load testing of biodegradable suture anchors containing 2 high-strength sutures. Arthroscopy. 2007;23(4):355-360.
21. Kullar RS, Reagan JM, Kolz CW, Burks RT, Henninger HB. Suture placement near the musculotendinous junction in the supraspinatus: implications for rotator cuff repair. Am J Sports Med. 2015;43(1):57-62.
22. Burkhart SS, Diaz Pagàn JL, Wirth MA, Athanasiou KA. Cyclic loading of anchor-based rotator cuff repairs: confirmation of the tension overload phenomenon and comparison of suture anchor fixation with transosseous fixation. Arthroscopy. 1997;13(6):720-724.
23. Faul F, Erdfelder E, Lang AG, Buchner A. G*Power 3: a flexible statistical power analysis program for the social, behavioral, and biomedical sciences. Behav Res Methods. 2007;39(2):175-191.
24. Greenspoon JA, Petri M, Warth RJ, Millett PJ. Massive rotator cuff tears: pathomechanics, current treatment options, and clinical outcomes. J Shoulder Elbow Surg. 2015;24(9):1493-1505.
25. Hein J, Reilly JM, Chae J, Maerz T, Anderson K. Retear rates after arthroscopic single-row, double-row, and suture bridge rotator cuff repair at a minimum of 1 year of imaging follow-up: a systematic review. Arthroscopy. 2015;31(11):2274-2281.
26. Henry P, Wasserstein D, Park S, et al. Arthroscopic repair for chronic massive rotator cuff tears: a systematic review. Arthroscopy. 2015;31(12):2472-2480.
27. El-Azab HM, Rott O, Irlenbusch U. Long-term follow-up after latissimus dorsi transfer for irreparable posterosuperior rotator cuff tears. J Bone Joint Surg Am. 2015;97(6):462-469.
28. Gerber C, Rahm SA, Catanzaro S, Farshad M, Moor BK. Latissimus dorsi tendon transfer for treatment of irreparable posterosuperior rotator cuff tears: long-term results at a minimum follow-up of ten years. J Bone Joint Surg Am. 2013;95(21):1920-1926.
29. Coons DA, Barber FA, Herbert MA. Triple-loaded single-anchor stitch configurations: an analysis of cyclically loaded suture–tendon interface security. Arthroscopy. 2006;22(11):1154-1158.
30. Itoi E, Berglund LJ, Grabowski JJ, et al. Tensile properties of the supraspinatus tendon. J Orthop Res. 1995;13(4):578-584.
31. Matsuhashi T, Hooke AW, Zhao KD, et al. Tensile properties of a morphologically split supraspinatus tendon. Clin Anat. 2014;27(5):702-706.
32. Apreleva M, Parsons IM 4th, Warner JJ, Fu FH, Woo SL. Experimental investigation of reaction forces at the glenohumeral joint during active abduction. J Shoulder Elbow Surg. 2000;9(5):409-417.
33. Giles JW, Ferreira LM, Athwal GS, Johnson JA. Development and performance evaluation of a multi-PID muscle loading driven in vitro active-motion shoulder simulator and application to assessing reverse total shoulder arthroplasty. J Biomech Eng. 2014;136(12):121007.
34. Hansen ML, Otis JC, Johnson JS, Cordasco FA, Craig EV, Warren RF. Biomechanics of massive rotator cuff tears: implications for treatment. J Bone Joint Surg Am. 2008;90(2):316-325.
35. Henninger HB, Barg A, Anderson AE, Bachus KN, Tashjian RZ, Burks RT. Effect of deltoid tension and humeral version in reverse total shoulder arthroplasty: a biomechanical study. J Shoulder Elbow Surg. 2012;21(4):483-490.
36. Mihata T, Gates J, McGarry MH, Lee J, Kinoshita M, Lee TQ. Effect of rotator cuff muscle imbalance on forceful internal impingement and peel-back of the superior labrum: a cadaveric study. Am J Sports Med. 2009;37(11):2222-2227.
37. Sano H, Ishii H, Yeadon A, Backman DS, Brunet JA, Uhthoff HK. Degeneration at the insertion weakens the tensile strength of the supraspinatus tendon: a comparative mechanical and histologic study of the bone–tendon complex. J Orthop Res. 1997;15(5):719-726.
Healing after rotator cuff repair (RCR) can be challenging, especially in cases of large and massive tears, revision repairs, and tendons with poor tissue quality.1-3 Poor tissue quality is associated with increased risk for recurrent tears, independent of age and tear size.3 Various techniques have been used to improve tendon fixation strength in these difficult situations, including augmented suture configurations (eg, massive cuff stitches, rip-stop stitches) and tissue grafts (eg, acellular dermal matrix).4-9 Clinical studies have found improved healing rates for larger tears and revision repairs using acellular dermal matrix grafts.6,10 Synthetic patches are another option for RCR augmentation, but limited clinical data and biomechanical evidence support use of synthetic grafts as an augment for RCRs.11-13
Polyhydroxyalkanoates (PHAs) are a class of biodegradable polymers that have been used as orthopedic devices, tissue scaffolds, patches, and other applications with increasing frequency over the past decade.14 In the laboratory, these implanted materials have been shown to support cell migration and growth.15 The PHA family of polymers typically degrades by hydrolytic and bacterial depolymerase mechanisms over 52-plus weeks in vivo.14PHA grafts have been studied in the setting of RCR. An expanded polytetrafluoroethylene scaffold was shown to improve repair mechanics when used as a bursal side graft in an in vitro ovine model.11 The graft increased tendon footprint contact pressure and failure loads by almost 180 N. In clinical studies, poly-L-lactic acid augmentations have been used to reinforce massive RCRs. Lenart and colleagues16 found that 38% of 16 patients with such tears had an intact rotator cuff at 1.2-year follow-up, and improvement in clinical scores. Proctor13 reported on use of a poly-L-lactic acid retrograde patch for reinforcement of massive tears with both single- and double-row repairs in 18 patients. The cohort had more favorable rates of intact cuffs at 12 months (83%) and 42 months (78%), and ASES (American Shoulder and Elbow Surgeons) scores improved from 25 before surgery to 82 at latest follow-up after surgery.
RCR augmentation traditionally has been performed with an open or mini-open technique.6 Recently, several authors have reported on arthroscopic techniques for augmentation with either acellular dermal matrix or synthetic grafts.13,17,18 Most techniques have involved “bridging” with a graft or patch used to stress-shield a single-row repair.8,9,13 This bridging typically involves placing several sutures medial to where the anchor repair stitches pass through the tendon. An alternative is to pass the repair stitches through both the tendon and the graft.17-19 The overall volume of tissue incorporated into the repair stitches (rotator cuff plus graft) is increased with the augmented technique relative to the bridging technique. Both can be technically challenging, but the augmented technique may be easier to perform arthroscopically.9,19 Regardless, these techniques are complicated and require a higher level of arthroscopic skills compared with those required in arthroscopic RCR without a graft. Simplifying arthroscopic graft augmentation likely will increase its utility because, even for skilled surgeons, adding a graft can increase operative time by 20 to 30 minutes. Simplification will also extend use of the technique to surgeons with less experience and proficiency with arthroscopic repair.
We developed a simple method for augmenting single-row RCR with a strip of bioresorbable soft-tissue scaffold. We also conducted a study to evaluate the initial biomechanical properties of single-row RCR in cadaveric shoulder specimens augmented with PHA mesh (BioFiber; Tornier) graft as compared with single-row RCR without augmentation. Both cyclic gap formation and ultimate failure loads and displacement were quantified. We hypothesized that the augmented RCRs would have decreased gap formation and increased ultimate failure loads compared with nonaugmented RCRs. This study was exempt from having to obtain Institutional Review B
Methods
Eight pairs of fresh-frozen cadaver humeri (6 male, 2 female; mean [SD] age, 61 [9] years) were dissected of all soft tissue (except rotator cuff) by Dr. Tashjian, a board-certified, fellowship-trained orthopedic surgeon. There were no qualitative differences in tendon condition between tendons within a pair. The supraspinatus muscle and tendon were separated from the other rotator cuff muscles. The infraspinatus, subscapularis, and teres minor were removed from the humerus. Last, the supraspinatus was resected at its insertion. Humeral pairs were then randomized into augmented and nonaugmented RCRs within each pair.
In the nonaugmented group, the supraspinatus was reattached to its insertion in a single-row RCR with 2 triple-loaded suture anchors (5.5-mm Insite FT Ti, No. 2 Force Fiber suture; Tornier) and 6 simple stitches (Figure 1A). Anchors were placed midway between the articular margin and the lateral edge of the greater tuberosity at about 45° to the bone surface.
In the contralateral shoulders, augmented RCRs were performed. Specimens were prepared exactly as they were for the nonaugmented RCRs, including anchor placement and suture passage. Before knot tying, RCRs were augmented with 2 strips of 13-mm × 23-mm PHA mesh (BioFiber) (Figure 1B). One strip was used to augment the 3 sutures of each anchor, overlying the residual tendon, to reinforce the tendon–knot interface. After each suture was passed through the supraspinatus tendon from the intra-articular surface, the stitch was passed through the strip of PHA mesh. Stitches were separated by 5 mm in each mesh strip. All 6 sutures were then tied with a Revo knot between the free end of each suture leg and the leg that passed through the tendon and mesh.
Each humerus was transected at the midshaft and potted and mounted in an Instron 1331 load frame with Model 8800 controller (Instron). A cryoclamp was used to grasp the supraspinatus muscle belly above the musculotendinous junction (Figure 2).
Three rows of 2-mm fiducial markers were affixed to the bone, tendon, and muscle belly with cyanoacrylate for tracking with a digital video system (DMAS Version 6.5; Spicatek) (Figure 3).21
A 0.1-MPa pre-stress (applied force/tendon cross-sectional area) was applied to each construct to determine the starting position for the deformation profile. Each repair underwent 1000 cycles of uniaxial load-controlled displacement between 0.1 and 1.0 MPa of effective stress at 1 Hz. Effective stress was determined as the ratio of applied force to cross-sectional area of the tendon at harvest to normalize the applied loads between tendons of varying size. During cyclic testing, gapping of more than 5 mm was defined as construct failure.22 After cyclic loading, each construct was loaded to failure at 1.0 mm/s. Ultimate failure load was defined as the highest load achieved at the maximum displacement before rapid decline in load supported by the construct.
Statistical Analysis
Paired t tests were used to compare the matched pairs of constructs. For all tests, significance was set at P ≤ .05. Post hoc power was calculated for significant results using G*Power Version 3.1.6.23 All data are presented as means (SDs).
Results
After 1000 cycles of displacement, mean (SD) gapping was 3.8 (0.9) mm for the nonaugmented repairs and 3.9 (1.1) mm for the PHA mesh–augmented repairs (P = .879) (Figure 4).
For the nonaugmented repairs, mean (SD) failure displacement was 6.3 (1.7) mm, and mean (SD) ultimate failure load was 472.1 (120.3) N. For the PHA-augmented repairs, failure displacement was 5.5 (1.9) mm, and ultimate failure load was 571.2 (173.0) N. There was no difference in failure displacement (P = .393), but there was a difference in ultimate failure load (P = .042; power = 0.57). During failure testing, mean (SD) tissue deformation was higher (P = .012; power = 0.83) for the PHA-augmented repairs, 1.2 (0.7) mm, than for the nonaugmented repairs, 0.8 (0.5) mm. Failures, which were consistent within pairs, were caused by tissue failure, with sutures pulling through the tissue (4 pairs) or single anchor pullout before ultimate tissue failure (4 pairs). Of the 4 failures with anchor pullout, 3 had anterior anchor pullout, and 1 had posterior anchor pullout. In all specimens with anchor pullout, the second anchor remained stable, and ultimate failure occurred with tissue tearing at the suture interface. There were no significant differences in any metrics between specimens that failed with intact anchors and specimens with single anchor pullout (P ≥ .122). Therefore, both groups were pooled for the failure analysis.
Discussion
RCR augmentation with a synthetic graft is a viable option for improving fixation strength of supraspinatus repairs, as shown in otherwise healthy tendon in the present study. Our hypothesis that there would be decreased gap formation with graft augmentation was not supported, whereas the hypothesis of increased failure loads with graft augmentation was supported. These findings may also be applicable in cases of large tears, revisions, and tendons with poor tissue quality. Simplification of graft application techniques will allow quick and easy arthroscopic augmentation.
Studies of RCRs for large or massive tears have reported retear rates of 25% to 79%.24-26 Latissimus dorsi tendon transfers also show promise in posterosuperior RCRs, with failure rates near 10%.27,28 Although use of PHA patches in RCR augmentation is relatively new, short-term and midterm failure rates are in the range of 20% to 60% in the few small cohorts currently being studied.13,16 It is possible that these rates may improve as indications, surgical experience, and techniques for use of PHA patches are further refined. Regardless, with PHA currently being used in practice, it is important to quantify the biomechanics of the augmentation as a baseline for its performance in reinforcing the tendon–suture interface.
We determined that the initial fixation strength of single-row repairs was higher with the addition of PHA synthetic grafts using a very simple technique. Single-row triple-loaded anchor repairs already provide high initial mechanical strength, and our results are similar to those of another study of this technique.29 Despite the already high mechanical strength of a triple-loaded anchor repair, PHA mesh increased ultimate strength by about 100 N (~25%). Of note, tissue elongation during failure was higher (P = .012; power = 0.83) in the PHA-augmented group (1.2 mm) than in the nonaugmented group (0.8 mm). This was not surprising—failure loads were almost 100 N higher in the PHA-augmented group than in the nonaugmented group. Consequently, much higher forces were placed on the muscle belly, likely resulting in additional elongation of the intact tissue medial to the repair construct.
The ultimate failure loads in our study compare favorably with the biomechanical strength of augmented repairs reported by others.8,9,18 Barber and colleagues18 evaluated an augmented single-row repair with 2 double-loaded suture anchors and an acellular dermal matrix graft. The ultimate failure load of the augmented repairs was 325 N. In contrast, Omae and colleagues8 tested a bridging single-row repair using 2 double-loaded suture anchors and an acellular dermal matrix graft. Ultimate failure load of the augmented repairs was 560 N, similar to our finding. Last, Shea and colleagues9 evaluated a bridging single-row repair using 2 double-loaded suture anchors and an acellular dermal matrix graft, with ultimate failure load of 429 N. The techniques in all 3 studies can be performed arthroscopically but are challenging and require multiple extra sutures and anchors that need management and tying. Our technique provides similar initial fixation strength, has no requirement for extra sutures or anchors, and is very simple to perform.
The supraspinatus tendon is estimated to fail between 800 N and 1000 N.30,31 Biomechanical shoulder simulators use supraspinatus forces in the range of 20 N to 200 N for scapular plane abduction.32-36 Therefore, the single-row repair failures in our study fell between functional and full-thickness failure loads. Studies on the mechanics of degenerated human supraspinatus tendon are limited, but there is evidence the mechanical properties of these tissues are inferior to those of healthy tendon.37 A 100-N increase in failure loads with PHA augmentation may prove highly significant in reinforcing the suture–tendon interface in degenerated tendons.
Adding the mesh did not have any effect on gapping at the repair site after cyclic loading. This finding suggests that construct gapping under cyclic loading is not a function of a reinforced knot–tendon interface but is instead caused by microtearing and cinching of the suture constructs in relation to the underlying bone. Tissue elongation likely was not a strong contributor to overall cyclic gapping, as elongation did not differ between the nonaugmented and augmented repairs (0.5 mm vs 0.7 mm; P = .276) and was small relative to the nearly 4 mm of construct gapping. Gapping may be affected by healing and integration of the mesh into the repaired tendon over time, but this effect could not be captured in the present study. Patients are initially immobilized and passive shoulder motion gradually introduced, in stark contrast to the immediate loading protocol in the present study. Regardless, the 25% increase in overall strength may be clinically important, especially in cases of difficult repair or poor tissue quality.
Our technique simplifies arthroscopic augmentation—stitches are passed through the rotator cuff in simple fashion. Before being tied, the limbs that were passed through the rotator cuff are removed through a cannula and then passed through the synthetic graft.
Study Limitations
This study had several limitations. First, it was a cadaveric biomechanical study that evaluated only time-zero biomechanical properties. Loads were normalized to tendon size, specimens were randomized between sides, and paired specimens were used to minimize the effects of tendon and bone quality on outcome metrics. In addition, donor tendons were representative of otherwise healthy tissue. Chronic tears and associated resorption/atrophy could have affected the magnitude of forces and gapping detected in this study. Theoretically, over time the tendon tissue will adhere to and grow into the mesh, which could minimize potential differences. Studies are needed to determine the effects of healing on long-term repair strength in affected patients. Last, all constructs were performed in open fashion to improve repeatability of construct placement and provide accessibility for Instron testing. Our technique did not directly replicate the arthroscopic approach, but, unlike other augmentation techniques, it is so simple that transition to all-arthroscopic augmentation is realistic.
Patch augmentation increases the cost of materials and operative time and should be considered a limitation of its utility. We do not recommend augmentation in all RCRs, as it likely is cost-ineffective. Instead, we recommend augmentation in cases of poor tissue quality, which could lead to healing failure, revision surgery, and higher overall patient costs beyond the cost of adding augmentation. Similarly, we recommend augmentation for revision cases in which tendon healing has failed and tissue quality is poor. The goal is to prevent another failure.
Conclusion
PHA graft augmentation of single-row triple-loaded anchor repairs of the supraspinatus tendon improves the overall ultimate load to failure by 25%. There was no difference in gap formation after cyclic loading between augmented and nonaugmented repairs. This technique for arthroscopic augmentation can be used to improve initial biomechanical repair strength in tears at risk for failure.
Am J Orthop. 2016;45(7):E527-E533. Copyright Frontline Medical Communications Inc. 2016. All rights reserved.
1. Galatz LM, Ball CM, Teefey SA, Middleton WD, Yamaguchi K. The outcome and repair integrity of completely arthroscopically repaired large and massive rotator cuff tears. J Bone Joint Surg Am. 2004;86(2):219-224.
2. Keener JD, Wei AS, Kim HM, et al. Revision arthroscopic rotator cuff repair: repair integrity and clinical outcome. J Bone Joint Surg Am. 2010;92(3):590-598.
3. Nho SJ, Brown BS, Lyman S, Adler RS, Altchek DW, MacGillivray JD. Prospective analysis of arthroscopic rotator cuff repair: prognostic factors affecting clinical and ultrasound outcome. J Shoulder Elbow Surg. 2009;18(1):13-20.
4. Barber FA, Herbert MA, Schroeder FA, Aziz-Jacobo J, Mays MM, Rapley JH. Biomechanical advantages of triple-loaded suture anchors compared with double-row rotator cuff repairs. Arthroscopy. 2010;26(3):316-323.
5. Burkhart SS, Denard PJ, Konicek J, Hanypsiak BT. Biomechanical validation of load-sharing rip-stop fixation for the repair of tissue-deficient rotator cuff tears. Am J Sports Med. 2014;42(2):457-462.
6. Gupta AK, Hug K, Boggess B, Gavigan M, Toth AP. Massive or 2-tendon rotator cuff tears in active patients with minimal glenohumeral arthritis: clinical and radiographic outcomes of reconstruction using dermal tissue matrix xenograft. Am J Sports Med. 2013;41(4):872-879.
7. Ma CB, MacGillivray JD, Clabeaux J, Lee S, Otis JC. Biomechanical evaluation of arthroscopic rotator cuff stitches. J Bone Joint Surg Am. 2004;86(6):1211-1216.
8. Omae H, Steinmann SP, Zhao C, et al. Biomechanical effect of rotator cuff augmentation with an acellular dermal matrix graft: a cadaver study. Clin Biomech. 2012;27(8):789-792.
9. Shea KP, Obopilwe E, Sperling JW, Iannotti JP. A biomechanical analysis of gap formation and failure mechanics of a xenograft-reinforced rotator cuff repair in a cadaveric model. J Shoulder Elbow Surg. 2012;21(8):1072-1079.
10. Agrawal V. Healing rates for challenging rotator cuff tears utilizing an acellular human dermal reinforcement graft. Int J Shoulder Surg. 2012;6(2):36-44.
11. Beimers L, Lam PH, Murrell GA. The biomechanical effects of polytetrafluoroethylene suture augmentations in lateral-row rotator cuff repairs in an ovine model. J Shoulder Elbow Surg. 2014;23(10):1545-1552.
12. McCarron JA, Milks RA, Chen X, Iannotti JP, Derwin KA. Improved time-zero biomechanical properties using poly-L-lactic acid graft augmentation in a cadaveric rotator cuff repair model. J Shoulder Elbow Surg. 2010;19(5):688-696.
13. Proctor CS. Long-term successful arthroscopic repair of large and massive rotator cuff tears with a functional and degradable reinforcement device. J Shoulder Elbow Surg. 2014;23(10):1508-1513.
14. Misra SK, Valappil SP, Roy I, Boccaccini AR. Polyhydroxyalkanoate (PHA)/inorganic phase composites for tissue engineering applications. Biomacromolecules. 2006;7(8):2249-2258.
15. Ellis G, Cano P, Jadraque M, et al. Laser microperforated biodegradable microbial polyhydroxyalkanoate substrates for tissue repair strategies: an infrared microspectroscopy study. Anal Bioanal Chem. 2011;399(7):2379-2388.
16. Lenart BA, Martens KA, Kearns KA, Gillespie RJ, Zoga AC, Williams GR. Treatment of massive and recurrent rotator cuff tears augmented with a poly-l-lactide graft, a preliminary study. J Shoulder Elbow Surg. 2015;24(6):915-921.
17. Barber FA, Burns JP, Deutsch A, Labbé MR, Litchfield RB. A prospective, randomized evaluation of acellular human dermal matrix augmentation for arthroscopic rotator cuff repair. Arthroscopy. 2012;28(1):8-15.
18. Barber FA, Herbert MA, Boothby MH. Ultimate tensile failure loads of a human dermal allograft rotator cuff augmentation. Arthroscopy. 2008;24(1):20-24.
19. Gilot GJ, Attia AK, Alvarez AM. Arthroscopic repair of rotator cuff tears using extracellular matrix graft. Arthrosc Tech. 2014;3(4):e487-e489.
20. Barber FA, Coons DA, Ruiz-Suarez M. Cyclic load testing of biodegradable suture anchors containing 2 high-strength sutures. Arthroscopy. 2007;23(4):355-360.
21. Kullar RS, Reagan JM, Kolz CW, Burks RT, Henninger HB. Suture placement near the musculotendinous junction in the supraspinatus: implications for rotator cuff repair. Am J Sports Med. 2015;43(1):57-62.
22. Burkhart SS, Diaz Pagàn JL, Wirth MA, Athanasiou KA. Cyclic loading of anchor-based rotator cuff repairs: confirmation of the tension overload phenomenon and comparison of suture anchor fixation with transosseous fixation. Arthroscopy. 1997;13(6):720-724.
23. Faul F, Erdfelder E, Lang AG, Buchner A. G*Power 3: a flexible statistical power analysis program for the social, behavioral, and biomedical sciences. Behav Res Methods. 2007;39(2):175-191.
24. Greenspoon JA, Petri M, Warth RJ, Millett PJ. Massive rotator cuff tears: pathomechanics, current treatment options, and clinical outcomes. J Shoulder Elbow Surg. 2015;24(9):1493-1505.
25. Hein J, Reilly JM, Chae J, Maerz T, Anderson K. Retear rates after arthroscopic single-row, double-row, and suture bridge rotator cuff repair at a minimum of 1 year of imaging follow-up: a systematic review. Arthroscopy. 2015;31(11):2274-2281.
26. Henry P, Wasserstein D, Park S, et al. Arthroscopic repair for chronic massive rotator cuff tears: a systematic review. Arthroscopy. 2015;31(12):2472-2480.
27. El-Azab HM, Rott O, Irlenbusch U. Long-term follow-up after latissimus dorsi transfer for irreparable posterosuperior rotator cuff tears. J Bone Joint Surg Am. 2015;97(6):462-469.
28. Gerber C, Rahm SA, Catanzaro S, Farshad M, Moor BK. Latissimus dorsi tendon transfer for treatment of irreparable posterosuperior rotator cuff tears: long-term results at a minimum follow-up of ten years. J Bone Joint Surg Am. 2013;95(21):1920-1926.
29. Coons DA, Barber FA, Herbert MA. Triple-loaded single-anchor stitch configurations: an analysis of cyclically loaded suture–tendon interface security. Arthroscopy. 2006;22(11):1154-1158.
30. Itoi E, Berglund LJ, Grabowski JJ, et al. Tensile properties of the supraspinatus tendon. J Orthop Res. 1995;13(4):578-584.
31. Matsuhashi T, Hooke AW, Zhao KD, et al. Tensile properties of a morphologically split supraspinatus tendon. Clin Anat. 2014;27(5):702-706.
32. Apreleva M, Parsons IM 4th, Warner JJ, Fu FH, Woo SL. Experimental investigation of reaction forces at the glenohumeral joint during active abduction. J Shoulder Elbow Surg. 2000;9(5):409-417.
33. Giles JW, Ferreira LM, Athwal GS, Johnson JA. Development and performance evaluation of a multi-PID muscle loading driven in vitro active-motion shoulder simulator and application to assessing reverse total shoulder arthroplasty. J Biomech Eng. 2014;136(12):121007.
34. Hansen ML, Otis JC, Johnson JS, Cordasco FA, Craig EV, Warren RF. Biomechanics of massive rotator cuff tears: implications for treatment. J Bone Joint Surg Am. 2008;90(2):316-325.
35. Henninger HB, Barg A, Anderson AE, Bachus KN, Tashjian RZ, Burks RT. Effect of deltoid tension and humeral version in reverse total shoulder arthroplasty: a biomechanical study. J Shoulder Elbow Surg. 2012;21(4):483-490.
36. Mihata T, Gates J, McGarry MH, Lee J, Kinoshita M, Lee TQ. Effect of rotator cuff muscle imbalance on forceful internal impingement and peel-back of the superior labrum: a cadaveric study. Am J Sports Med. 2009;37(11):2222-2227.
37. Sano H, Ishii H, Yeadon A, Backman DS, Brunet JA, Uhthoff HK. Degeneration at the insertion weakens the tensile strength of the supraspinatus tendon: a comparative mechanical and histologic study of the bone–tendon complex. J Orthop Res. 1997;15(5):719-726.
An Update on Management of Syndesmosis Injury: A National US Database Study
Acute ankle injuries are common problems treated by orthopedic surgeons. In the United States, nearly 2 million ankle sprains occur each year,1 and ankle fractures account for 9% to 18% of all fractures treated in emergency departments.2,3 Ankle injuries that involve the syndesmotic ligaments may result in instability and require specific treatment beyond fixation of the malleolar fractures.
The usual mechanism of syndesmotic injury is external rotation of the ankle with hyperdorsiflexion of a pronated or supinated foot.4,5 Syndesmotic injuries are estimated to occur in up to 10% of ankle sprains6 and up to 23% of all ankle fractures.7 Overall US incidence of syndesmotic injury is estimated at 6445 injuries per year.8 Syndesmotic injury occurs in 39% to 45% of supination-external rotation IV ankle fractures.9,10 Pronation-external rotation ankle fractures have the highest rate of syndesmotic injury. Syndesmotic injury may be less common in other types of malleolar fracture, but the exact incidence has not been reliably reported.
Traditionally, isolated nondisplaced syndesmotic injuries are treated nonoperatively, and syndesmotic injuries with concomitant malleolar fractures are treated surgically. Various options are available for syndesmotic fixation. The gold standard is syndesmotic screw placement from the lateral aspect of the fibula through the tibia. Fixation may be achieved with screws in a variety of configurations and formats. However, fixation with two 4.5-mm screws is stronger.11,12 Functional outcomes are similar, regardless of screw material,13-16 number of cortices,17 or number of screws.18 Disadvantages specific to screw fixation include altered ankle biomechanics,19,20 potential for screw breakage,21 and need for implant removal.3Alternatively, suture button fixation is said to be equally as effective as screw fixation in achieving syndesmotic reduction, and their functional outcomes are similar.22,23 The initial cost of suture button fixation is higher than that of screw fixation, but the difference may be offset by potential elimination of a second surgery for syndesmotic screw removal.24 Soft-tissue irritation caused by the suture material and local osteolysis are reported complications of suture button fixation.25-27
Regardless of fixation method used, achieving anatomical reduction of the syndesmosis is considered the most important factor in optimizing functional outcomes.28-31 However, achieving and verifying anatomical reduction of the syndesmosis during surgery can be quite challenging.30,32-34 Various methods of lowering the malreduction risk, including direct visualization of the tibiofibular joint during reduction30,35 and intraoperative 3-dimensional imaging,33,36 have been proposed.
In the study reported here, we used a US insurance database to determine the incidence and rate of syndesmotic stabilization within various ankle injuries and fracture patterns.
Materials and Methods
All data for this study were obtained from a publicly available for-fee healthcare database, the PearlDiver Patient Records Database, which includes procedural volumes and demographic information for patients with International Classification of Diseases, Ninth Revision (ICD-9) diagnoses and procedures or Current Procedural Terminology (CPT) codes. Data for the study were derived from 2 databases within PearlDiver: a private-payer database, which has its largest contribution (>30 million individual patient records for 2007-2011) from United HealthCare, and a Medicare database (>50 million patient records for 2007-2011). Access to the database was granted by PearlDiver Technologies for the purpose of academic research. The database was stored on a password-protected server maintained by PearlDiver.
We searched the database for cases of ankle fracture fixation, including fixation of isolated lateral malleolus (CPT 27792), bimalleolar (CPT 27814), and trimalleolar (CPTs 27822 and 27823) fractures. CPT 27829 was used to search for syndesmotic fixation, and CPT 20680 for implant removal. These codes were used individually and in combination.
Overall procedural volume data are reported as number of patients with the given CPT(s) in the database output and as incidence, calculated as number of patients with the CPT of interest normalized to total number of patients in the database for that particular subgroup. Results of age group and sex analyses are reported as number of patients reported in the database output and as percentage of patients who had the CPT procedure of interest that year. As United HealthCare is the largest contributor to the private-payer portion of the database and is represented most prominently in the southern region, data for the regional analysis are presented only as incidence. This incidence was calculated as number of patients in a particular region and year normalized to total number of patients in the database for that region or year. The regions were Midwest (IA, IL, IN, KS, MI, MN, MO, ND, NE, OH, SD, WI), Northeast (CT, MA, ME, NH, NJ, NY, PA, RI, VT), South (AL, AR, DC, DE, FL, GA, KY, LA, MD, MI, NC, OK, SC, TN, TX, VA, WV), and West (AK, AZ, CA, CO, HI, ID, MT, NM, NV, OR, UT, WA, WY).
Chi-square linear-by-linear association analysis was used to determine the statistical significance of time trends in procedural volume, sex, age group, and region. For all statistical comparisons, P < .05 was considered significant.
Results
Number of open reduction and internal fixation (ORIF) procedures increased for all ankle fracture types over the period 2007 to 2011 (Table 1). 

ORIF was performed for an ankle injury in 54,767 patients during the period 2007 to 2011, resulting in a cumulative incidence of 64.2 per 1000 patients (Table 2). 
More ankle ORIF procedures were performed in females (33,565) than in males (21,202); incidence of ankle ORIF procedures was higher in females (68.6/1000 patients) than in males (58.4/1000 patients) (Table 2); percentages of bimalleolar and trimalleolar fractures were higher in females (bi, 40.6%; tri, 27.8%) than in males (bi, 34.6%; tri, 15.2%); and percentage of lateral malleolus fractures was higher in males (50.2%) than in females (31.6%).
Incidence of ankle ORIF procedures was similar in the South (69.6/1000 patients), Midwest (69.4/100 patients), and West (65.1/1000 patients) but lower in the Northeast (43.3/1000 patients) (Table 2). Lateral malleolus fractures were the most common ankle fractures in the Midwest (40.7%) and West (41.3%), followed by bimalleolar fractures (Midwest, 36.3%; West 36.0%) and trimalleolar fractures (Midwest, 23.0%; West, 22.7%). Bimalleolar fractures were most common in the Northeast (40.2%) and South (39.8%), followed by lateral malleolus fractures (Northeast, 34.4%; South, 38.0%) and trimalleolar fractures (Northeast, 25.4%; South, 22.3%).
Discussion
The present study found no significant change in number of lateral malleolus, bimalleolar, and trimalleolar ankle fracture ORIF procedures performed over the period 2007 to 2011. However, over the same period, incidence of syndesmosis fixation increased significantly in patients with isolated syndesmotic injuries and in patients with concomitant ankle fracture and syndesmotic injury. The largest percentage change was found in the bimalleolar ORIF group, which showed nearly a doubling of syndesmotic fixation over the 4-year study period, followed by a 38.1% increase in syndesmotic fixation in the trimalleolar ORIF group. Both groups had a syndesmotic fixation percentage change about twice that seen in the isolated lateral malleolus group.
There are several explanations for these trends. First, bimalleolar and trimalleolar fractures are more severe ankle fractures that tend to result from a more forceful mechanism, allowing for a higher rate of syndesmotic injury. Second, these trends likely do not reflect a true increase in the rate of syndesmosis injury but, rather, increased recognition of syndesmotic injury. Third, the data likely reflect a well-established approach to ankle fracture fixation and an increase in thinking that syndesmotic injuries should be stabilized in the setting of ankle fixation.
Incidence of syndesmotic injury as indicated by stabilization procedures can be compared with the data of Vosseller and colleagues,8 who reported an incidence of 6445 syndesmotic injuries per year in the United States. Our data showed fewer syndesmotic injuries, which may be related to use of CPT codes rather than ICD-9 codes for database searches, such that only operative syndesmotic injuries are represented in our data. Population differences between the 2 studies could also account for some of the differences in syndesmotic injury incidence.
We also found a significant change in the rate of hardware removal after syndesmosis ORIF. Across all treatment groups, incidence of screw removal decreased—a trend likely reflecting a change in attitude about the need for routine screw removal. Studies have shown that patients have favorable outcomes in the setting of syndesmotic screw loosening and screw breakage.37 Some authors have suggested that screw breakage or removal could be advantageous, as it allows the syndesmosis to settle into a more anatomical position after imperfect reduction.38 In addition, the trend of decreased syndesmotic screw removal could also have resulted from increased suture button fixation, which may less frequently require implant removal. Regardless, the overall trend is that routine syndesmotic implant removal has become less common.
This study had several limitations. First are the many limitations inherent to all studies that use large administrative databases, such as PearlDiver. The power of analysis depends on data quality; potential sources of error include accuracy of billing codes and physicians’ miscoding or noncoding. Although we tried to accurately represent a large population of interest through use of this database, we cannot be sure that the database represents a true cross-section of the United States. In addition, as we could not determine the method of syndesmotic fixation—the same CPT code is used for both suture button fixation and screw fixation—we could not establish trends for the rate of each method. More research is needed to establish these trends, and this research likely will require analysis of data from a large trauma center or from multiple centers.
Potential regional differences are another limitation. In the PearlDiver database, the South and Midwest are highly represented, the Northeast and West much less so. The South, Midwest, and West (but not the Northeast) had similar overall incidence and subgroup incidence of ankle ORIF. However, any regional differences in the rate of syndesmotic fixation could have skewed our data.
Ankle fractures and associated syndesmotic injuries remain a common problem. Although the prevalence of ankle fracture fixation has been relatively constant, the rate of syndesmosis stabilization has increased significantly. Young adults have the highest incidence of ankle fracture and associated syndesmotic fixation, but more ankle fractures occur in the large and growing elderly population. Increased awareness of syndesmotic injury likely has contributed to the recent rise in syndesmosis fixation seen in the present study. Given this trend, we recommend further analysis of outcome data and to establish treatment guidelines.
Am J Orthop. 2016;45(7):E472-E477. Copyright Frontline Medical Communications Inc. 2016. All rights reserved.
1. Waterman BR, Owens BD, Davey S, Zacchilli MA, Belmont PJ Jr. The epidemiology of ankle sprains in the United States. J Bone Joint Surg Am. 2010;92(13):2279-2284.
2. Court-Brown CM, Caesar B. Epidemiology of adult fractures: a review. Injury. 2006;37(8):691-697.
3. Miller AN, Paul O, Boraiah S, Parker RJ, Helfet DL, Lorich DG. Functional outcomes after syndesmotic screw fixation and removal. J Orthop Trauma. 2010;24(1):12-16.
4. Edwards GS Jr, DeLee JC. Ankle diastasis without fracture. Foot Ankle. 1984;4(6):305-312.
5. Norkus SA, Floyd RT. The anatomy and mechanisms of syndesmotic ankle sprains. J Athl Train. 2001;36(1):68-73.
6. Brosky T, Nyland J, Nitz A, Caborn DN. The ankle ligaments: consideration of syndesmotic injury and implications for rehabilitation. J Orthop Sports Phys Ther. 1995;21(4):197-205.
7. Purvis GD. Displaced, unstable ankle fractures: classification, incidence, and management of a consecutive series. Clin Orthop Relat Res. 1982;(165):91-98.
8. Vosseller JT, Karl JW, Greisberg JK. Incidence of syndesmotic injury. Orthopedics. 2014;37(3):e226-e229.
9. Stark E, Tornetta P 3rd, Creevy WR. Syndesmotic instability in Weber B ankle fractures: a clinical evaluation. J Orthop Trauma. 2007;21(9):643-646.
10. Tornetta P 3rd, Axelrad TW, Sibai TA, Creevy WR. Treatment of the stress positive ligamentous SE4 ankle fracture: incidence of syndesmotic injury and clinical decision making. J Orthop Trauma. 2012;26(11):659-661.
11. Xenos JS, Hopkinson WJ, Mulligan ME, Olson EJ, Popovic NA. The tibiofibular syndesmosis. Evaluation of the ligamentous structures, methods of fixation, and radiographic assessment. J Bone Joint Surg Am. 1995;77(6):847-856.
12. Ebraheim NA, Lu J, Yang H, Mekhail AO, Yeasting RA. Radiographic and CT evaluation of tibiofibular syndesmotic diastasis: a cadaver study. Foot Ankle Int. 1997;18(11):693-698.
13. Ahmad J, Raikin SM, Pour AE, Haytmanek C. Bioabsorbable screw fixation of the syndesmosis in unstable ankle injuries. Foot Ankle Int. 2009;30(2):99-105.
14. Hovis WD, Kaiser BW, Watson JT, Bucholz RW. Treatment of syndesmotic disruptions of the ankle with bioabsorbable screw fixation. J Bone Joint Surg Am. 2002;84(1):26-31.
15. Kaukonen JP, Lamberg T, Korkala O, Pajarinen J. Fixation of syndesmotic ruptures in 38 patients with a malleolar fracture: a randomized study comparing a metallic and a bioabsorbable screw. J Orthop Trauma. 2005;19(6):392-395.
16. Thordarson DB, Samuelson M, Shepherd LE, Merkle PF, Lee J. Bioabsorbable versus stainless steel screw fixation of the syndesmosis in pronation-lateral rotation ankle fractures: a prospective randomized trial. Foot Ankle Int. 2001;22(4):335-338.
17. Moore JA Jr, Shank JR, Morgan SJ, Smith WR. Syndesmosis fixation: a comparison of three and four cortices of screw fixation without hardware removal. Foot Ankle Int. 2006;27(8):567-572.
18. Høiness P, Strømsøe K. Tricortical versus quadricortical syndesmosis fixation in ankle fractures: a prospective, randomized study comparing two methods of syndesmosis fixation. J Orthop Trauma. 2004;18(6):331-337.
19. Huber T, Schmoelz W, Bölderl A. Motion of the fibula relative to the tibia and its alterations with syndesmosis screws: a cadaver study. Foot Ankle Surg. 2012;18(3):203-209.
20. Needleman RL, Skrade DA, Stiehl JB. Effect of the syndesmotic screw on ankle motion. Foot Ankle. 1989;10(1):17-24.
21. Mendelsohn ES, Hoshino CM, Harris TG, Zinar DM. The effect of obesity on early failure after operative syndesmosis injuries. J Orthop Trauma. 2013;27(4):201-206.
22. Schepers T. Acute distal tibiofibular syndesmosis injury: a systematic review of suture-button versus syndesmotic screw repair. Int Orthop. 2012;36(6):1199-1206.
23. Cottom JM, Hyer CF, Philbin TM, Berlet GC. Transosseous fixation of the distal tibiofibular syndesmosis: comparison of an interosseous suture and Endobutton to traditional screw fixation in 50 cases. J Foot Ankle Surg. 2009;48(6):620-630.
24. Thornes B, Shannon F, Guiney AM, Hession P, Masterson E. Suture-button syndesmosis fixation: accelerated rehabilitation and improved outcomes. Clin Orthop Relat Res. 2005;(431):207-212.
25. Willmott HJ, Singh B, David LA. Outcome and complications of treatment of ankle diastasis with tightrope fixation. Injury. 2009;40(11):1204-1206.
26. Qamar F, Kadakia A, Venkateswaran B. An anatomical way of treating ankle syndesmotic injuries. J Foot Ankle Surg. 2011;50(6):762-765.
27. Degroot H, Al-Omari AA, El Ghazaly SA. Outcomes of suture button repair of the distal tibiofibular syndesmosis. Foot Ankle Int. 2011;32(3):250-256.
28. Ramsey PL, Hamilton W. Changes in tibiotalar area of contact caused by lateral talar shift. J Bone Joint Surg Am. 1976;58(3):356-357.
29. Weening B, Bhandari M. Predictors of functional outcome following transsyndesmotic screw fixation of ankle fractures. J Orthop Trauma. 2005;19(2):102-108.
30. Sagi HC, Shah AR, Sanders RW. The functional consequence of syndesmotic joint malreduction at a minimum 2-year follow-up. J Orthop Trauma. 2012;26(7):439-443.
31. Naqvi GA, Cunningham P, Lynch B, Galvin R, Awan N. Fixation of ankle syndesmotic injuries: comparison of tightrope fixation and syndesmotic screw fixation for accuracy of syndesmotic reduction. Am J Sports Med. 2012;40(12):2828-2835.
32. Marmor M, Hansen E, Han HK, Buckley J, Matityahu A. Limitations of standard fluoroscopy in detecting rotational malreduction of the syndesmosis in an ankle fracture model. Foot Ankle Int. 2011;32(6):616-622.
33. Franke J, von Recum J, Suda AJ, Grützner PA, Wendl K. Intraoperative three-dimensional imaging in the treatment of acute unstable syndesmotic injuries. J Bone Joint Surg Am. 2012;94(15):1386-1390.
34. Gardner MJ, Demetrakopoulos D, Briggs SM, Helfet DL, Lorich DG. Malreduction of the tibiofibular syndesmosis in ankle fractures. Foot Ankle Int. 2006;27(10):788-792.
35. Miller AN, Carroll EA, Parker RJ, Boraiah S, Helfet DL, Lorich DG. Direct visualization for syndesmotic stabilization of ankle fractures. Foot Ankle Int. 2009;30(5):419-426.
36. Ruan Z, Luo C, Shi Z, Zhang B, Zeng B, Zhang C. Intraoperative reduction of distal tibiofibular joint aided by three-dimensional fluoroscopy. Technol Health Care. 2011;19(3):161-166.
37. Hamid N, Loeffler BJ, Braddy W, Kellam JF, Cohen BE, Bosse MJ. Outcome after fixation of ankle fractures with an injury to the syndesmosis: the effect of the syndesmosis screw. J Bone Joint Surg Br. 2009;91(8):1069-1073.
38. Song DJ, Lanzi JT, Groth AT, et al. The effect of syndesmosis screw removal on the reduction of the distal tibiofibular joint: a prospective radiographic study. Foot Ankle Int. 2014;35(6):543-548.
Acute ankle injuries are common problems treated by orthopedic surgeons. In the United States, nearly 2 million ankle sprains occur each year,1 and ankle fractures account for 9% to 18% of all fractures treated in emergency departments.2,3 Ankle injuries that involve the syndesmotic ligaments may result in instability and require specific treatment beyond fixation of the malleolar fractures.
The usual mechanism of syndesmotic injury is external rotation of the ankle with hyperdorsiflexion of a pronated or supinated foot.4,5 Syndesmotic injuries are estimated to occur in up to 10% of ankle sprains6 and up to 23% of all ankle fractures.7 Overall US incidence of syndesmotic injury is estimated at 6445 injuries per year.8 Syndesmotic injury occurs in 39% to 45% of supination-external rotation IV ankle fractures.9,10 Pronation-external rotation ankle fractures have the highest rate of syndesmotic injury. Syndesmotic injury may be less common in other types of malleolar fracture, but the exact incidence has not been reliably reported.
Traditionally, isolated nondisplaced syndesmotic injuries are treated nonoperatively, and syndesmotic injuries with concomitant malleolar fractures are treated surgically. Various options are available for syndesmotic fixation. The gold standard is syndesmotic screw placement from the lateral aspect of the fibula through the tibia. Fixation may be achieved with screws in a variety of configurations and formats. However, fixation with two 4.5-mm screws is stronger.11,12 Functional outcomes are similar, regardless of screw material,13-16 number of cortices,17 or number of screws.18 Disadvantages specific to screw fixation include altered ankle biomechanics,19,20 potential for screw breakage,21 and need for implant removal.3Alternatively, suture button fixation is said to be equally as effective as screw fixation in achieving syndesmotic reduction, and their functional outcomes are similar.22,23 The initial cost of suture button fixation is higher than that of screw fixation, but the difference may be offset by potential elimination of a second surgery for syndesmotic screw removal.24 Soft-tissue irritation caused by the suture material and local osteolysis are reported complications of suture button fixation.25-27
Regardless of fixation method used, achieving anatomical reduction of the syndesmosis is considered the most important factor in optimizing functional outcomes.28-31 However, achieving and verifying anatomical reduction of the syndesmosis during surgery can be quite challenging.30,32-34 Various methods of lowering the malreduction risk, including direct visualization of the tibiofibular joint during reduction30,35 and intraoperative 3-dimensional imaging,33,36 have been proposed.
In the study reported here, we used a US insurance database to determine the incidence and rate of syndesmotic stabilization within various ankle injuries and fracture patterns.
Materials and Methods
All data for this study were obtained from a publicly available for-fee healthcare database, the PearlDiver Patient Records Database, which includes procedural volumes and demographic information for patients with International Classification of Diseases, Ninth Revision (ICD-9) diagnoses and procedures or Current Procedural Terminology (CPT) codes. Data for the study were derived from 2 databases within PearlDiver: a private-payer database, which has its largest contribution (>30 million individual patient records for 2007-2011) from United HealthCare, and a Medicare database (>50 million patient records for 2007-2011). Access to the database was granted by PearlDiver Technologies for the purpose of academic research. The database was stored on a password-protected server maintained by PearlDiver.
We searched the database for cases of ankle fracture fixation, including fixation of isolated lateral malleolus (CPT 27792), bimalleolar (CPT 27814), and trimalleolar (CPTs 27822 and 27823) fractures. CPT 27829 was used to search for syndesmotic fixation, and CPT 20680 for implant removal. These codes were used individually and in combination.
Overall procedural volume data are reported as number of patients with the given CPT(s) in the database output and as incidence, calculated as number of patients with the CPT of interest normalized to total number of patients in the database for that particular subgroup. Results of age group and sex analyses are reported as number of patients reported in the database output and as percentage of patients who had the CPT procedure of interest that year. As United HealthCare is the largest contributor to the private-payer portion of the database and is represented most prominently in the southern region, data for the regional analysis are presented only as incidence. This incidence was calculated as number of patients in a particular region and year normalized to total number of patients in the database for that region or year. The regions were Midwest (IA, IL, IN, KS, MI, MN, MO, ND, NE, OH, SD, WI), Northeast (CT, MA, ME, NH, NJ, NY, PA, RI, VT), South (AL, AR, DC, DE, FL, GA, KY, LA, MD, MI, NC, OK, SC, TN, TX, VA, WV), and West (AK, AZ, CA, CO, HI, ID, MT, NM, NV, OR, UT, WA, WY).
Chi-square linear-by-linear association analysis was used to determine the statistical significance of time trends in procedural volume, sex, age group, and region. For all statistical comparisons, P < .05 was considered significant.
Results
Number of open reduction and internal fixation (ORIF) procedures increased for all ankle fracture types over the period 2007 to 2011 (Table 1).
ORIF was performed for an ankle injury in 54,767 patients during the period 2007 to 2011, resulting in a cumulative incidence of 64.2 per 1000 patients (Table 2).
More ankle ORIF procedures were performed in females (33,565) than in males (21,202); incidence of ankle ORIF procedures was higher in females (68.6/1000 patients) than in males (58.4/1000 patients) (Table 2); percentages of bimalleolar and trimalleolar fractures were higher in females (bi, 40.6%; tri, 27.8%) than in males (bi, 34.6%; tri, 15.2%); and percentage of lateral malleolus fractures was higher in males (50.2%) than in females (31.6%).
Incidence of ankle ORIF procedures was similar in the South (69.6/1000 patients), Midwest (69.4/100 patients), and West (65.1/1000 patients) but lower in the Northeast (43.3/1000 patients) (Table 2). Lateral malleolus fractures were the most common ankle fractures in the Midwest (40.7%) and West (41.3%), followed by bimalleolar fractures (Midwest, 36.3%; West 36.0%) and trimalleolar fractures (Midwest, 23.0%; West, 22.7%). Bimalleolar fractures were most common in the Northeast (40.2%) and South (39.8%), followed by lateral malleolus fractures (Northeast, 34.4%; South, 38.0%) and trimalleolar fractures (Northeast, 25.4%; South, 22.3%).
Discussion
The present study found no significant change in number of lateral malleolus, bimalleolar, and trimalleolar ankle fracture ORIF procedures performed over the period 2007 to 2011. However, over the same period, incidence of syndesmosis fixation increased significantly in patients with isolated syndesmotic injuries and in patients with concomitant ankle fracture and syndesmotic injury. The largest percentage change was found in the bimalleolar ORIF group, which showed nearly a doubling of syndesmotic fixation over the 4-year study period, followed by a 38.1% increase in syndesmotic fixation in the trimalleolar ORIF group. Both groups had a syndesmotic fixation percentage change about twice that seen in the isolated lateral malleolus group.
There are several explanations for these trends. First, bimalleolar and trimalleolar fractures are more severe ankle fractures that tend to result from a more forceful mechanism, allowing for a higher rate of syndesmotic injury. Second, these trends likely do not reflect a true increase in the rate of syndesmosis injury but, rather, increased recognition of syndesmotic injury. Third, the data likely reflect a well-established approach to ankle fracture fixation and an increase in thinking that syndesmotic injuries should be stabilized in the setting of ankle fixation.
Incidence of syndesmotic injury as indicated by stabilization procedures can be compared with the data of Vosseller and colleagues,8 who reported an incidence of 6445 syndesmotic injuries per year in the United States. Our data showed fewer syndesmotic injuries, which may be related to use of CPT codes rather than ICD-9 codes for database searches, such that only operative syndesmotic injuries are represented in our data. Population differences between the 2 studies could also account for some of the differences in syndesmotic injury incidence.
We also found a significant change in the rate of hardware removal after syndesmosis ORIF. Across all treatment groups, incidence of screw removal decreased—a trend likely reflecting a change in attitude about the need for routine screw removal. Studies have shown that patients have favorable outcomes in the setting of syndesmotic screw loosening and screw breakage.37 Some authors have suggested that screw breakage or removal could be advantageous, as it allows the syndesmosis to settle into a more anatomical position after imperfect reduction.38 In addition, the trend of decreased syndesmotic screw removal could also have resulted from increased suture button fixation, which may less frequently require implant removal. Regardless, the overall trend is that routine syndesmotic implant removal has become less common.
This study had several limitations. First are the many limitations inherent to all studies that use large administrative databases, such as PearlDiver. The power of analysis depends on data quality; potential sources of error include accuracy of billing codes and physicians’ miscoding or noncoding. Although we tried to accurately represent a large population of interest through use of this database, we cannot be sure that the database represents a true cross-section of the United States. In addition, as we could not determine the method of syndesmotic fixation—the same CPT code is used for both suture button fixation and screw fixation—we could not establish trends for the rate of each method. More research is needed to establish these trends, and this research likely will require analysis of data from a large trauma center or from multiple centers.
Potential regional differences are another limitation. In the PearlDiver database, the South and Midwest are highly represented, the Northeast and West much less so. The South, Midwest, and West (but not the Northeast) had similar overall incidence and subgroup incidence of ankle ORIF. However, any regional differences in the rate of syndesmotic fixation could have skewed our data.
Ankle fractures and associated syndesmotic injuries remain a common problem. Although the prevalence of ankle fracture fixation has been relatively constant, the rate of syndesmosis stabilization has increased significantly. Young adults have the highest incidence of ankle fracture and associated syndesmotic fixation, but more ankle fractures occur in the large and growing elderly population. Increased awareness of syndesmotic injury likely has contributed to the recent rise in syndesmosis fixation seen in the present study. Given this trend, we recommend further analysis of outcome data and to establish treatment guidelines.
Am J Orthop. 2016;45(7):E472-E477. Copyright Frontline Medical Communications Inc. 2016. All rights reserved.
1. Waterman BR, Owens BD, Davey S, Zacchilli MA, Belmont PJ Jr. The epidemiology of ankle sprains in the United States. J Bone Joint Surg Am. 2010;92(13):2279-2284.
2. Court-Brown CM, Caesar B. Epidemiology of adult fractures: a review. Injury. 2006;37(8):691-697.
3. Miller AN, Paul O, Boraiah S, Parker RJ, Helfet DL, Lorich DG. Functional outcomes after syndesmotic screw fixation and removal. J Orthop Trauma. 2010;24(1):12-16.
4. Edwards GS Jr, DeLee JC. Ankle diastasis without fracture. Foot Ankle. 1984;4(6):305-312.
5. Norkus SA, Floyd RT. The anatomy and mechanisms of syndesmotic ankle sprains. J Athl Train. 2001;36(1):68-73.
6. Brosky T, Nyland J, Nitz A, Caborn DN. The ankle ligaments: consideration of syndesmotic injury and implications for rehabilitation. J Orthop Sports Phys Ther. 1995;21(4):197-205.
7. Purvis GD. Displaced, unstable ankle fractures: classification, incidence, and management of a consecutive series. Clin Orthop Relat Res. 1982;(165):91-98.
8. Vosseller JT, Karl JW, Greisberg JK. Incidence of syndesmotic injury. Orthopedics. 2014;37(3):e226-e229.
9. Stark E, Tornetta P 3rd, Creevy WR. Syndesmotic instability in Weber B ankle fractures: a clinical evaluation. J Orthop Trauma. 2007;21(9):643-646.
10. Tornetta P 3rd, Axelrad TW, Sibai TA, Creevy WR. Treatment of the stress positive ligamentous SE4 ankle fracture: incidence of syndesmotic injury and clinical decision making. J Orthop Trauma. 2012;26(11):659-661.
11. Xenos JS, Hopkinson WJ, Mulligan ME, Olson EJ, Popovic NA. The tibiofibular syndesmosis. Evaluation of the ligamentous structures, methods of fixation, and radiographic assessment. J Bone Joint Surg Am. 1995;77(6):847-856.
12. Ebraheim NA, Lu J, Yang H, Mekhail AO, Yeasting RA. Radiographic and CT evaluation of tibiofibular syndesmotic diastasis: a cadaver study. Foot Ankle Int. 1997;18(11):693-698.
13. Ahmad J, Raikin SM, Pour AE, Haytmanek C. Bioabsorbable screw fixation of the syndesmosis in unstable ankle injuries. Foot Ankle Int. 2009;30(2):99-105.
14. Hovis WD, Kaiser BW, Watson JT, Bucholz RW. Treatment of syndesmotic disruptions of the ankle with bioabsorbable screw fixation. J Bone Joint Surg Am. 2002;84(1):26-31.
15. Kaukonen JP, Lamberg T, Korkala O, Pajarinen J. Fixation of syndesmotic ruptures in 38 patients with a malleolar fracture: a randomized study comparing a metallic and a bioabsorbable screw. J Orthop Trauma. 2005;19(6):392-395.
16. Thordarson DB, Samuelson M, Shepherd LE, Merkle PF, Lee J. Bioabsorbable versus stainless steel screw fixation of the syndesmosis in pronation-lateral rotation ankle fractures: a prospective randomized trial. Foot Ankle Int. 2001;22(4):335-338.
17. Moore JA Jr, Shank JR, Morgan SJ, Smith WR. Syndesmosis fixation: a comparison of three and four cortices of screw fixation without hardware removal. Foot Ankle Int. 2006;27(8):567-572.
18. Høiness P, Strømsøe K. Tricortical versus quadricortical syndesmosis fixation in ankle fractures: a prospective, randomized study comparing two methods of syndesmosis fixation. J Orthop Trauma. 2004;18(6):331-337.
19. Huber T, Schmoelz W, Bölderl A. Motion of the fibula relative to the tibia and its alterations with syndesmosis screws: a cadaver study. Foot Ankle Surg. 2012;18(3):203-209.
20. Needleman RL, Skrade DA, Stiehl JB. Effect of the syndesmotic screw on ankle motion. Foot Ankle. 1989;10(1):17-24.
21. Mendelsohn ES, Hoshino CM, Harris TG, Zinar DM. The effect of obesity on early failure after operative syndesmosis injuries. J Orthop Trauma. 2013;27(4):201-206.
22. Schepers T. Acute distal tibiofibular syndesmosis injury: a systematic review of suture-button versus syndesmotic screw repair. Int Orthop. 2012;36(6):1199-1206.
23. Cottom JM, Hyer CF, Philbin TM, Berlet GC. Transosseous fixation of the distal tibiofibular syndesmosis: comparison of an interosseous suture and Endobutton to traditional screw fixation in 50 cases. J Foot Ankle Surg. 2009;48(6):620-630.
24. Thornes B, Shannon F, Guiney AM, Hession P, Masterson E. Suture-button syndesmosis fixation: accelerated rehabilitation and improved outcomes. Clin Orthop Relat Res. 2005;(431):207-212.
25. Willmott HJ, Singh B, David LA. Outcome and complications of treatment of ankle diastasis with tightrope fixation. Injury. 2009;40(11):1204-1206.
26. Qamar F, Kadakia A, Venkateswaran B. An anatomical way of treating ankle syndesmotic injuries. J Foot Ankle Surg. 2011;50(6):762-765.
27. Degroot H, Al-Omari AA, El Ghazaly SA. Outcomes of suture button repair of the distal tibiofibular syndesmosis. Foot Ankle Int. 2011;32(3):250-256.
28. Ramsey PL, Hamilton W. Changes in tibiotalar area of contact caused by lateral talar shift. J Bone Joint Surg Am. 1976;58(3):356-357.
29. Weening B, Bhandari M. Predictors of functional outcome following transsyndesmotic screw fixation of ankle fractures. J Orthop Trauma. 2005;19(2):102-108.
30. Sagi HC, Shah AR, Sanders RW. The functional consequence of syndesmotic joint malreduction at a minimum 2-year follow-up. J Orthop Trauma. 2012;26(7):439-443.
31. Naqvi GA, Cunningham P, Lynch B, Galvin R, Awan N. Fixation of ankle syndesmotic injuries: comparison of tightrope fixation and syndesmotic screw fixation for accuracy of syndesmotic reduction. Am J Sports Med. 2012;40(12):2828-2835.
32. Marmor M, Hansen E, Han HK, Buckley J, Matityahu A. Limitations of standard fluoroscopy in detecting rotational malreduction of the syndesmosis in an ankle fracture model. Foot Ankle Int. 2011;32(6):616-622.
33. Franke J, von Recum J, Suda AJ, Grützner PA, Wendl K. Intraoperative three-dimensional imaging in the treatment of acute unstable syndesmotic injuries. J Bone Joint Surg Am. 2012;94(15):1386-1390.
34. Gardner MJ, Demetrakopoulos D, Briggs SM, Helfet DL, Lorich DG. Malreduction of the tibiofibular syndesmosis in ankle fractures. Foot Ankle Int. 2006;27(10):788-792.
35. Miller AN, Carroll EA, Parker RJ, Boraiah S, Helfet DL, Lorich DG. Direct visualization for syndesmotic stabilization of ankle fractures. Foot Ankle Int. 2009;30(5):419-426.
36. Ruan Z, Luo C, Shi Z, Zhang B, Zeng B, Zhang C. Intraoperative reduction of distal tibiofibular joint aided by three-dimensional fluoroscopy. Technol Health Care. 2011;19(3):161-166.
37. Hamid N, Loeffler BJ, Braddy W, Kellam JF, Cohen BE, Bosse MJ. Outcome after fixation of ankle fractures with an injury to the syndesmosis: the effect of the syndesmosis screw. J Bone Joint Surg Br. 2009;91(8):1069-1073.
38. Song DJ, Lanzi JT, Groth AT, et al. The effect of syndesmosis screw removal on the reduction of the distal tibiofibular joint: a prospective radiographic study. Foot Ankle Int. 2014;35(6):543-548.
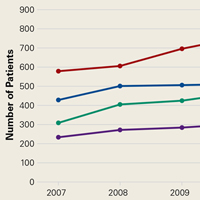
Prevalence of Low Vitamin D Levels in Patients With Orthopedic Trauma
The role of vitamin D in general health maintenance is a topic of increasing interest and importance in the medical community. Not only has vitamin D deficiency been linked to a myriad of nonorthopedic maladies, including cancer, diabetes, and cardiovascular disease, but it has demonstrated an adverse effect on musculoskeletal health.1 Authors have found a correlation between vitamin D deficiency and muscle weakness, fragility fractures, and, most recently, fracture nonunion.1 Despite the detrimental effects of vitamin D deficiency on musculoskeletal and general health, evidence exists that vitamin D deficiency is surprisingly prevalent.2 This deficiency is known to be associated with increasing age, but recent studies have also found alarming rates of deficiency in younger populations.3,4
Although there has been some discussion regarding optimal serum levels of 25-hydroxyvitamin D, most experts have defined vitamin D deficiency as a 25-hydroxyvitamin D level of 20 ng/mL or less and insufficiency as 21 to 32 ng/mL.5 Hollis and Wagner5 found increased serum parathyroid hormone and bone resorption and impaired dietary absorption of calcium when 25-hydroxyvitamin D levels were under 32 ng/mL. Given these data, a 25-hydroxyvitamin D level of 21 to 32 ng/mL (52-72 nmol/L) can be considered as indicating a relative insufficiency of vitamin D, and a level of 20 ng/mL or less can be considered as indicating vitamin D deficiency.
Vitamin D plays a vital role in bone metabolism and has been implicated in increased fracture risk and in fracture healing ability. Therefore, documenting the prevalence of vitamin D deficiency in patients with trauma is the first step in raising awareness among orthopedic traumatologists and further developing a screening-and-treatment strategy for vitamin D deficiency in these patients. Steele and colleagues6 retrospectively studied 44 patients with high- and low-energy fractures and found an almost 60% prevalence of vitamin D insufficiency. If vitamin D insufficiency is this prevalent, treatment protocols for patients with fractures may require modifications that include routine screening and treatment for low vitamin D levels.
After noting a regular occurrence of hypovitaminosis D in our patient population (independent of age, sex, or medical comorbidities), we conducted a study to determine the prevalence of vitamin D deficiency in a large orthopedic trauma population.
Patients and Methods
After obtaining Institutional Review Board approval for this study, we retrospectively reviewed the charts of all patients with a fracture treated by 1 of 4 orthopedic traumatologists within a 21-month period (January 1, 2009 to September 30, 2010). Acute fracture and recorded 25-hydroxyvitamin D level were the primary criteria for study inclusion. Given the concern about vitamin D deficiency, it became common protocol to check the serum 25-hydroxyvitamin D levels of patients with acute fractures during the review period. Exclusion criteria were age under 18 years and presence of vitamin D deficiency risk factors, including renal insufficiency (creatinine level, ≥2 mg/dL), malabsorption, gastrectomy, active liver disease, acute myocardial infarction, alcoholism, anorexia nervosa, and steroid dependency.
During the period studied, 1830 patients over age 18 years were treated by 4 fellowship-trained orthopedic traumatologists. Of these patients, 889 (487 female, 402 male) met the inclusion criteria. Mean age was 53.8 years. Demographic data (age, sex, race, independent living status, comorbid medical conditions, medications) were collected from the patients’ medical records. Clinical data collected were mechanism of injury, fracture location and type, injury date, surgery date and surgical procedure performed (when applicable), and serum 25-hydroxyvitamin D levels.
Statistical Methods
Descriptive statistics (mean, median, mode) were calculated. The χ2 test was used when all cell frequencies were more than 5, and the Fisher exact probability test was used when any cell frequency was 5 or less. Prevalence of vitamin D deficiency and insufficiency was calculated in multiple patient populations. Patients were analyzed according to age and sex subgroups.
Definitions
Vitamin D deficiency was defined as a serum 25-hydroxyvitamin D level of 20 ng/mL or less and insufficiency as 21 to 32 ng/mL.2 As the serum test was performed independent of the investigators and with use of standard medical laboratory protocols and techniques, there should be no bias in the results. We had intended to have all patients undergo serum testing during the review period because that was our usual protocol. However, test results were available for only 889 (49%) of the 1830 patients with orthopedic trauma during the review period. Although a false-positive is theoretically possible, this series of orthopedic trauma patients is the largest in the literature and therefore should be more accurate than the previously reported small series.
Results
There were no significant (P < .05) age or sex differences in prevalence of vitamin D deficiency or insufficiency in our patient population. Overall prevalence of deficiency/insufficiency was 77.39%, and prevalence of deficiency alone was 39.03% (Table 1). 

Women in the 18- to 25-year age group had a lower prevalence of deficiency (25%; P = .41) and insufficiency (41.7%; P = .16) than women in the other age groups (Table 3). 

Discussion
We conducted this study to determine the prevalence of vitamin D deficiency in a large population of patients with orthopedic trauma. Results showed that vitamin D deficiency and insufficiency were prevalent in this population, which to our knowledge is the largest studied for vitamin D deficiency. In a 6-month study of 44 fractures, Steele and colleagues6 found an overall 60% rate of deficiency/insufficiency. Although their investigation is important—it was the first of its kind to evaluate patients with various fracture types, including those with high-energy causes—its numbers were small, and the period evaluated (June 1, 2006 to February 1, 2007) was short (8 months). Use of that time frame may have led to an underestimate of the prevalence of vitamin D deficiency, as vitamin D levels are higher in late summer because of increased sun exposure. Our study of 889 patients over 21 months allowed for seasonal variability of vitamin D levels. We did not notice a specific difference in patients who were treated during winter vs summer. Furthermore, our 77% prevalence of vitamin D insufficiency and 39% prevalence of vitamin D deficiency indicate how widespread low vitamin D levels are in a large Midwestern orthopedic trauma population. In the Pacific Northwest, Bee and colleagues7 studied seasonal differences in patients with surgically treated fractures and found an average difference of 3 ng/mL between winter and summer serum levels. However, the real issue, which should not be overlooked, is that the average 25-hydroxyvitamin D level was under 30 ng/mL in both cohorts (26.4 ng/mL in winter vs 29.8 ng/mL in summer). The emphasis should be that both levels were insufficient and that seasonal variance does not really change prevalence.
With use of the current definitions, it has been estimated that 1 billion people worldwide have vitamin D deficiency or insufficiency, with the elderly and certain ethnic populations at higher risk.8-10Vitamin D deficiency is a common diagnosis among elderly patients with hip fractures. According to various reports, 60% to 90% of patients treated for hip fractures are deficient or insufficient in vitamin D.8,9Hypovitaminosis D has also been noted in medical inpatients with and without risks for this deficiency.2 Surprisingly, low vitamin D levels are not isolated to the elderly. In Massachusetts, Gordon and colleagues11 found a 52% prevalence of vitamin D deficiency in Hispanic and black adolescents. Nesby-O’Dell and colleagues10 found that 42% of 15- to 49-year-old black women in the United States had vitamin D deficiency at the end of winter. Bogunovic and colleagues12 noted 5.5 times higher risk of low vitamin D levels in patients with darker skin tones. Although vitamin D deficiency has been linked to specific races, it frequently occurs in lower-risk populations as well. Sullivan and colleagues4 found a 48% prevalence of vitamin D deficiency in white preadolescent girls in Maine. Tangpricha and colleagues3 reported a 32% prevalence of vitamin D deficiency in otherwise fit healthcare providers sampled at a Boston hospital. Bogunovic and colleagues12 also showed that patients between ages 18 years and 50 years, and men, were more likely to have low vitamin D levels.
Establishing the prevalence of hypovitaminosis D in orthopedic trauma patients is needed in order to raise awareness of the disease and modify screening and treatment protocols. Brinker and O’Connor13 found vitamin D deficiency in 68% of patients with fracture nonunions, which suggests that hypovitaminosis D may partly account for difficulty in achieving fracture union. Bogunovic and colleagues12 found vitamin D insufficiency in 43% of 723 patients who underwent orthopedic surgery. Isolating the 121 patients on the trauma service revealed a 66% prevalence of low vitamin D levels. Our 77% prevalence of low vitamin D levels in 889 patients adds to the evidence that low levels are common in patients with orthopedic trauma. Understanding the importance of vitamin D deficiency can be significant in reducing the risk of complications, including delayed unions and nonunions, associated with treating orthopedic trauma cases.
Although our study indicates an alarming prevalence of insufficient vitamin D levels in our patient population, it does not provide a cause-and-effect link between low serum 25-hydroxyvitamin D levels and risk of fracture or nonunion. However, further investigations may yield clinically relevant data linking hypovitaminosis D with fracture risk. Although we did not include patients with nonunion in this study, new prospective investigations will address nonunions and subgroup analysis of race, fracture type, management type (surgical vs nonsurgical), injury date (to determine seasonal effect), and different treatment regimens.
The primary limitation of this study was its retrospective design. In addition, though we collected vitamin D data from 889 patients with acute fracture, our serum collection protocols were not standardized. Most patients who were admitted during initial orthopedic consultation in the emergency department had serum 25-hydroxyvitamin D levels drawn during their hospital stay, and patients initially treated in an ambulatory setting may not have had serum vitamin D levels drawn for up to 2 weeks after injury (the significance of this delay is unknown). Furthermore, the serum result rate for the overall orthopedic trauma population during the review period was only 49%, which could indicate selection bias. There are multiple explanations for the low rate. As with any new protocol or method, it takes time for the order to become standard practice; in the early stages, individuals can forget to ask for the test. In addition, during the review period, the serum test was also relatively new at our facility, and it was a “send-out” test, which could partly account for the lack of consistency. For example, some specimens were lost, and, in a number of other cases, excluded patients mistakenly had their 1,25-hydroxyvitamin D levels measured and were not comparable to included patients. Nevertheless, our sample of 889 patients with acute fractures remains the largest (by several hundred) reported in the literature.
From a practical standpoint, the present results were useful in updating our treatment protocols. Now we typically treat patients only prophylactically, with 50,000 units of vitamin D2 for 8 weeks and daily vitamin D3 and calcium until fracture healing. Patients are encouraged to continue daily vitamin D and calcium supplementation after fracture healing to maintain bone health. Compliance, however, remains a continued challenge and lack thereof can potentially explain the confusing effect of a supplementation protocol on the serum 25-hydroxyvitamin D level.14 The only patients who are not given prophylactic treatment are those who previously had been denied it (patients with chronic kidney disease or elevated blood calcium levels).
Vitamin D deficiency and insufficiency are prevalent in patients with orthopedic trauma. Studies are needed to further elucidate the relationship between low vitamin D levels and risk of complications. Retrospectively, without compliance monitoring, we have not seen a direct correlation with fracture complications.15 Our goal here was to increase orthopedic surgeons’ awareness of the problem and of the need to consider addressing low serum vitamin D levels. The treatment is low cost and low risk. The ultimate goal—if there is a prospective direct correlation between low serum vitamin D levels and complications—is to develop treatment strategies that can effectively lower the prevalence of low vitamin D levels.
Am J Orthop. 2016;45(7):E522-E526. Copyright Frontline Medical Communications Inc. 2016. All rights reserved.
1. Zaidi SA, Singh G, Owojori O, et al. Vitamin D deficiency in medical inpatients: a retrospective study of implications of untreated versus treated deficiency. Nutr Metab Insights. 2016;9:65-69.
2. Thomas MK, Lloyd-Jones DM, Thadhani RI, et al. Hypovitaminosis D in medical inpatients. N Engl J Med. 1998;338(12):777-783.
3. Tangpricha V, Pearce EN, Chen TC, Holick MF. Vitamin D insufficiency among free-living healthy young adults. Am J Med. 2002;112(8):659-662.
4. Sullivan SS, Rosen CJ, Halteman WA, Chen TC, Holick MF. Adolescent girls in Maine are at risk for vitamin D insufficiency. J Am Diet Assoc. 2005;105(6):971-974.
5. Hollis BW, Wagner CL. Normal serum vitamin D levels. N Engl J Med. 2005;352(5):515-516.
6. Steele B, Serota A, Helfet DL, Peterson M, Lyman S, Lane JM. Vitamin D deficiency: a common occurrence in both high- and low-energy fractures. HSS J. 2008;4(2):143-148.
7. Bee CR, Sheerin DV, Wuest TK, Fitzpatrick DC. Serum vitamin D levels in orthopaedic trauma patients living in the northwestern United States. J Orthop Trauma. 2013;27(5):e103-e106.
8. Bischoff-Ferrari HA, Can U, Staehelin HB, et al. Severe vitamin D deficiency in Swiss hip fracture patients. Bone. 2008;42(3):597-602.
9. Pieper CF, Colon-Emeric C, Caminis J, et al. Distribution and correlates of serum 25-hydroxyvitamin D levels in a sample of patients with hip fracture. Am J Geriatr Pharmacother. 2007;5(4):335-340.
10. Nesby-O’Dell S, Scanlon KS, Cogswell ME, et al. Hypovitaminosis D prevalence and determinants among African American and white women of reproductive age: third National Health and Nutrition Examination Survey, 1988–1994. Am J Clin Nutr. 2002;76(1):187-192.
11. Gordon CM, DePeter KC, Feldman HA, Grace E, Emans SJ. Prevalence of vitamin D deficiency among healthy adolescents. Arch Pediatr Adolesc Med. 2004;158(6):531-537.
12. Bogunovic L, Kim AD, Beamer BS, Nguyen J, Lane JM. Hypovitaminosis D in patients scheduled to undergo orthopaedic surgery: a single-center analysis. J Bone Joint Surg Am. 2010;92(13):2300-2304.
13. Brinker MR, O’Connor DP. Outcomes of tibial nonunion in older adults following treatment using the Ilizarov method. J Orthop Trauma. 2007;21(9):634-642.
14. Robertson DS, Jenkins T, Murtha YM, et al. Effectiveness of vitamin D therapy in orthopaedic trauma patients. J Orthop Trauma. 2015;29(11):e451-e453.
15. Bodendorfer BM, Cook JL, Robertson DS, et al. Do 25-hydroxyvitamin D levels correlate with fracture complications: J Orthop Trauma. 2016;30(9):e312-e317.
The role of vitamin D in general health maintenance is a topic of increasing interest and importance in the medical community. Not only has vitamin D deficiency been linked to a myriad of nonorthopedic maladies, including cancer, diabetes, and cardiovascular disease, but it has demonstrated an adverse effect on musculoskeletal health.1 Authors have found a correlation between vitamin D deficiency and muscle weakness, fragility fractures, and, most recently, fracture nonunion.1 Despite the detrimental effects of vitamin D deficiency on musculoskeletal and general health, evidence exists that vitamin D deficiency is surprisingly prevalent.2 This deficiency is known to be associated with increasing age, but recent studies have also found alarming rates of deficiency in younger populations.3,4
Although there has been some discussion regarding optimal serum levels of 25-hydroxyvitamin D, most experts have defined vitamin D deficiency as a 25-hydroxyvitamin D level of 20 ng/mL or less and insufficiency as 21 to 32 ng/mL.5 Hollis and Wagner5 found increased serum parathyroid hormone and bone resorption and impaired dietary absorption of calcium when 25-hydroxyvitamin D levels were under 32 ng/mL. Given these data, a 25-hydroxyvitamin D level of 21 to 32 ng/mL (52-72 nmol/L) can be considered as indicating a relative insufficiency of vitamin D, and a level of 20 ng/mL or less can be considered as indicating vitamin D deficiency.
Vitamin D plays a vital role in bone metabolism and has been implicated in increased fracture risk and in fracture healing ability. Therefore, documenting the prevalence of vitamin D deficiency in patients with trauma is the first step in raising awareness among orthopedic traumatologists and further developing a screening-and-treatment strategy for vitamin D deficiency in these patients. Steele and colleagues6 retrospectively studied 44 patients with high- and low-energy fractures and found an almost 60% prevalence of vitamin D insufficiency. If vitamin D insufficiency is this prevalent, treatment protocols for patients with fractures may require modifications that include routine screening and treatment for low vitamin D levels.
After noting a regular occurrence of hypovitaminosis D in our patient population (independent of age, sex, or medical comorbidities), we conducted a study to determine the prevalence of vitamin D deficiency in a large orthopedic trauma population.
Patients and Methods
After obtaining Institutional Review Board approval for this study, we retrospectively reviewed the charts of all patients with a fracture treated by 1 of 4 orthopedic traumatologists within a 21-month period (January 1, 2009 to September 30, 2010). Acute fracture and recorded 25-hydroxyvitamin D level were the primary criteria for study inclusion. Given the concern about vitamin D deficiency, it became common protocol to check the serum 25-hydroxyvitamin D levels of patients with acute fractures during the review period. Exclusion criteria were age under 18 years and presence of vitamin D deficiency risk factors, including renal insufficiency (creatinine level, ≥2 mg/dL), malabsorption, gastrectomy, active liver disease, acute myocardial infarction, alcoholism, anorexia nervosa, and steroid dependency.
During the period studied, 1830 patients over age 18 years were treated by 4 fellowship-trained orthopedic traumatologists. Of these patients, 889 (487 female, 402 male) met the inclusion criteria. Mean age was 53.8 years. Demographic data (age, sex, race, independent living status, comorbid medical conditions, medications) were collected from the patients’ medical records. Clinical data collected were mechanism of injury, fracture location and type, injury date, surgery date and surgical procedure performed (when applicable), and serum 25-hydroxyvitamin D levels.
Statistical Methods
Descriptive statistics (mean, median, mode) were calculated. The χ2 test was used when all cell frequencies were more than 5, and the Fisher exact probability test was used when any cell frequency was 5 or less. Prevalence of vitamin D deficiency and insufficiency was calculated in multiple patient populations. Patients were analyzed according to age and sex subgroups.
Definitions
Vitamin D deficiency was defined as a serum 25-hydroxyvitamin D level of 20 ng/mL or less and insufficiency as 21 to 32 ng/mL.2 As the serum test was performed independent of the investigators and with use of standard medical laboratory protocols and techniques, there should be no bias in the results. We had intended to have all patients undergo serum testing during the review period because that was our usual protocol. However, test results were available for only 889 (49%) of the 1830 patients with orthopedic trauma during the review period. Although a false-positive is theoretically possible, this series of orthopedic trauma patients is the largest in the literature and therefore should be more accurate than the previously reported small series.
Results
There were no significant (P < .05) age or sex differences in prevalence of vitamin D deficiency or insufficiency in our patient population. Overall prevalence of deficiency/insufficiency was 77.39%, and prevalence of deficiency alone was 39.03% (Table 1).
Women in the 18- to 25-year age group had a lower prevalence of deficiency (25%; P = .41) and insufficiency (41.7%; P = .16) than women in the other age groups (Table 3).
Discussion
We conducted this study to determine the prevalence of vitamin D deficiency in a large population of patients with orthopedic trauma. Results showed that vitamin D deficiency and insufficiency were prevalent in this population, which to our knowledge is the largest studied for vitamin D deficiency. In a 6-month study of 44 fractures, Steele and colleagues6 found an overall 60% rate of deficiency/insufficiency. Although their investigation is important—it was the first of its kind to evaluate patients with various fracture types, including those with high-energy causes—its numbers were small, and the period evaluated (June 1, 2006 to February 1, 2007) was short (8 months). Use of that time frame may have led to an underestimate of the prevalence of vitamin D deficiency, as vitamin D levels are higher in late summer because of increased sun exposure. Our study of 889 patients over 21 months allowed for seasonal variability of vitamin D levels. We did not notice a specific difference in patients who were treated during winter vs summer. Furthermore, our 77% prevalence of vitamin D insufficiency and 39% prevalence of vitamin D deficiency indicate how widespread low vitamin D levels are in a large Midwestern orthopedic trauma population. In the Pacific Northwest, Bee and colleagues7 studied seasonal differences in patients with surgically treated fractures and found an average difference of 3 ng/mL between winter and summer serum levels. However, the real issue, which should not be overlooked, is that the average 25-hydroxyvitamin D level was under 30 ng/mL in both cohorts (26.4 ng/mL in winter vs 29.8 ng/mL in summer). The emphasis should be that both levels were insufficient and that seasonal variance does not really change prevalence.
With use of the current definitions, it has been estimated that 1 billion people worldwide have vitamin D deficiency or insufficiency, with the elderly and certain ethnic populations at higher risk.8-10Vitamin D deficiency is a common diagnosis among elderly patients with hip fractures. According to various reports, 60% to 90% of patients treated for hip fractures are deficient or insufficient in vitamin D.8,9Hypovitaminosis D has also been noted in medical inpatients with and without risks for this deficiency.2 Surprisingly, low vitamin D levels are not isolated to the elderly. In Massachusetts, Gordon and colleagues11 found a 52% prevalence of vitamin D deficiency in Hispanic and black adolescents. Nesby-O’Dell and colleagues10 found that 42% of 15- to 49-year-old black women in the United States had vitamin D deficiency at the end of winter. Bogunovic and colleagues12 noted 5.5 times higher risk of low vitamin D levels in patients with darker skin tones. Although vitamin D deficiency has been linked to specific races, it frequently occurs in lower-risk populations as well. Sullivan and colleagues4 found a 48% prevalence of vitamin D deficiency in white preadolescent girls in Maine. Tangpricha and colleagues3 reported a 32% prevalence of vitamin D deficiency in otherwise fit healthcare providers sampled at a Boston hospital. Bogunovic and colleagues12 also showed that patients between ages 18 years and 50 years, and men, were more likely to have low vitamin D levels.
Establishing the prevalence of hypovitaminosis D in orthopedic trauma patients is needed in order to raise awareness of the disease and modify screening and treatment protocols. Brinker and O’Connor13 found vitamin D deficiency in 68% of patients with fracture nonunions, which suggests that hypovitaminosis D may partly account for difficulty in achieving fracture union. Bogunovic and colleagues12 found vitamin D insufficiency in 43% of 723 patients who underwent orthopedic surgery. Isolating the 121 patients on the trauma service revealed a 66% prevalence of low vitamin D levels. Our 77% prevalence of low vitamin D levels in 889 patients adds to the evidence that low levels are common in patients with orthopedic trauma. Understanding the importance of vitamin D deficiency can be significant in reducing the risk of complications, including delayed unions and nonunions, associated with treating orthopedic trauma cases.
Although our study indicates an alarming prevalence of insufficient vitamin D levels in our patient population, it does not provide a cause-and-effect link between low serum 25-hydroxyvitamin D levels and risk of fracture or nonunion. However, further investigations may yield clinically relevant data linking hypovitaminosis D with fracture risk. Although we did not include patients with nonunion in this study, new prospective investigations will address nonunions and subgroup analysis of race, fracture type, management type (surgical vs nonsurgical), injury date (to determine seasonal effect), and different treatment regimens.
The primary limitation of this study was its retrospective design. In addition, though we collected vitamin D data from 889 patients with acute fracture, our serum collection protocols were not standardized. Most patients who were admitted during initial orthopedic consultation in the emergency department had serum 25-hydroxyvitamin D levels drawn during their hospital stay, and patients initially treated in an ambulatory setting may not have had serum vitamin D levels drawn for up to 2 weeks after injury (the significance of this delay is unknown). Furthermore, the serum result rate for the overall orthopedic trauma population during the review period was only 49%, which could indicate selection bias. There are multiple explanations for the low rate. As with any new protocol or method, it takes time for the order to become standard practice; in the early stages, individuals can forget to ask for the test. In addition, during the review period, the serum test was also relatively new at our facility, and it was a “send-out” test, which could partly account for the lack of consistency. For example, some specimens were lost, and, in a number of other cases, excluded patients mistakenly had their 1,25-hydroxyvitamin D levels measured and were not comparable to included patients. Nevertheless, our sample of 889 patients with acute fractures remains the largest (by several hundred) reported in the literature.
From a practical standpoint, the present results were useful in updating our treatment protocols. Now we typically treat patients only prophylactically, with 50,000 units of vitamin D2 for 8 weeks and daily vitamin D3 and calcium until fracture healing. Patients are encouraged to continue daily vitamin D and calcium supplementation after fracture healing to maintain bone health. Compliance, however, remains a continued challenge and lack thereof can potentially explain the confusing effect of a supplementation protocol on the serum 25-hydroxyvitamin D level.14 The only patients who are not given prophylactic treatment are those who previously had been denied it (patients with chronic kidney disease or elevated blood calcium levels).
Vitamin D deficiency and insufficiency are prevalent in patients with orthopedic trauma. Studies are needed to further elucidate the relationship between low vitamin D levels and risk of complications. Retrospectively, without compliance monitoring, we have not seen a direct correlation with fracture complications.15 Our goal here was to increase orthopedic surgeons’ awareness of the problem and of the need to consider addressing low serum vitamin D levels. The treatment is low cost and low risk. The ultimate goal—if there is a prospective direct correlation between low serum vitamin D levels and complications—is to develop treatment strategies that can effectively lower the prevalence of low vitamin D levels.
Am J Orthop. 2016;45(7):E522-E526. Copyright Frontline Medical Communications Inc. 2016. All rights reserved.
1. Zaidi SA, Singh G, Owojori O, et al. Vitamin D deficiency in medical inpatients: a retrospective study of implications of untreated versus treated deficiency. Nutr Metab Insights. 2016;9:65-69.
2. Thomas MK, Lloyd-Jones DM, Thadhani RI, et al. Hypovitaminosis D in medical inpatients. N Engl J Med. 1998;338(12):777-783.
3. Tangpricha V, Pearce EN, Chen TC, Holick MF. Vitamin D insufficiency among free-living healthy young adults. Am J Med. 2002;112(8):659-662.
4. Sullivan SS, Rosen CJ, Halteman WA, Chen TC, Holick MF. Adolescent girls in Maine are at risk for vitamin D insufficiency. J Am Diet Assoc. 2005;105(6):971-974.
5. Hollis BW, Wagner CL. Normal serum vitamin D levels. N Engl J Med. 2005;352(5):515-516.
6. Steele B, Serota A, Helfet DL, Peterson M, Lyman S, Lane JM. Vitamin D deficiency: a common occurrence in both high- and low-energy fractures. HSS J. 2008;4(2):143-148.
7. Bee CR, Sheerin DV, Wuest TK, Fitzpatrick DC. Serum vitamin D levels in orthopaedic trauma patients living in the northwestern United States. J Orthop Trauma. 2013;27(5):e103-e106.
8. Bischoff-Ferrari HA, Can U, Staehelin HB, et al. Severe vitamin D deficiency in Swiss hip fracture patients. Bone. 2008;42(3):597-602.
9. Pieper CF, Colon-Emeric C, Caminis J, et al. Distribution and correlates of serum 25-hydroxyvitamin D levels in a sample of patients with hip fracture. Am J Geriatr Pharmacother. 2007;5(4):335-340.
10. Nesby-O’Dell S, Scanlon KS, Cogswell ME, et al. Hypovitaminosis D prevalence and determinants among African American and white women of reproductive age: third National Health and Nutrition Examination Survey, 1988–1994. Am J Clin Nutr. 2002;76(1):187-192.
11. Gordon CM, DePeter KC, Feldman HA, Grace E, Emans SJ. Prevalence of vitamin D deficiency among healthy adolescents. Arch Pediatr Adolesc Med. 2004;158(6):531-537.
12. Bogunovic L, Kim AD, Beamer BS, Nguyen J, Lane JM. Hypovitaminosis D in patients scheduled to undergo orthopaedic surgery: a single-center analysis. J Bone Joint Surg Am. 2010;92(13):2300-2304.
13. Brinker MR, O’Connor DP. Outcomes of tibial nonunion in older adults following treatment using the Ilizarov method. J Orthop Trauma. 2007;21(9):634-642.
14. Robertson DS, Jenkins T, Murtha YM, et al. Effectiveness of vitamin D therapy in orthopaedic trauma patients. J Orthop Trauma. 2015;29(11):e451-e453.
15. Bodendorfer BM, Cook JL, Robertson DS, et al. Do 25-hydroxyvitamin D levels correlate with fracture complications: J Orthop Trauma. 2016;30(9):e312-e317.
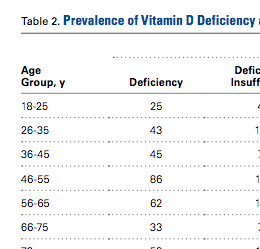
How Well Does the Braden Nutrition Subscale Agree With the VA Nutrition Classification Scheme Related to Pressure Ulcer Risk?
A pressure ulcer (PrU) is a localized injury to the skin and/or deep tissues that is due to pressure, friction, or shearing forces. Pressure ulcers are strongly associated with serious comorbidities, particularly inadequate nutrition and immobility.1,2 Pressure ulcers increase hospital costs significantly. In the U.S., PrU care is about $11 billion annually and a cost of between $2,000 and $21,410 per individual PrU.3-5
The impact of nosocomial PrUs remains a key health and economic concern of acute care facilities worldwide. In the U.S., about 2.5 million inpatients annually develop some degree of a PrU during their hospital stay. The reported incidence rates range from 0.4% to 38%.3,6 Each year about 60,000 people die of complications of a PrU.3,6,7 Inadequate nutrition is a critical factor that contributes to the incidence of PrUs.8-12 Consequences of inadequate nutrition have included alterations in skin integrity resulting in PrUs, longer hospital stays, increased costs of care, and higher rates of mortality.9 As a patient’s nutritional status becomes compromised, the likelihood of developing a PrU increases, especially if an individual is immobilized.7,9-11,13
Braden Scale History
The Braden Scale for Predicting Pressure Sore Risk was developed by Barbara Braden, PhD, RN, and Nancy Bergstrom, PhD, RN, in 1987.
The scale is composed of 6 factors: sensory perception, moisture, activity, mobility, friction and shear, and nutrition.14 Each factor is scored on a scale of 1 to 4 points (friction and shear are scored on a point scale of only 1 to 3) for a total possible score of 6 to 23 points (the lower the score, the greater the assumed PrU risk).
The Braden nutrition subscale relies heavily on recording observed or patient self-reported eating habits. It is typically documented by nurses who assess the daily intake of meals: recording a score of 4 if the patient’s meal intake is excellent (eats most of every meal), 3 if the patient’s intake is adequate (eats more than half of most meals), 2 if the patient’s intake is probably inadequate (rarely eats a complete meal), and 1 if a patient’s intake is very poor (never eats a complete meal) (Table 1).14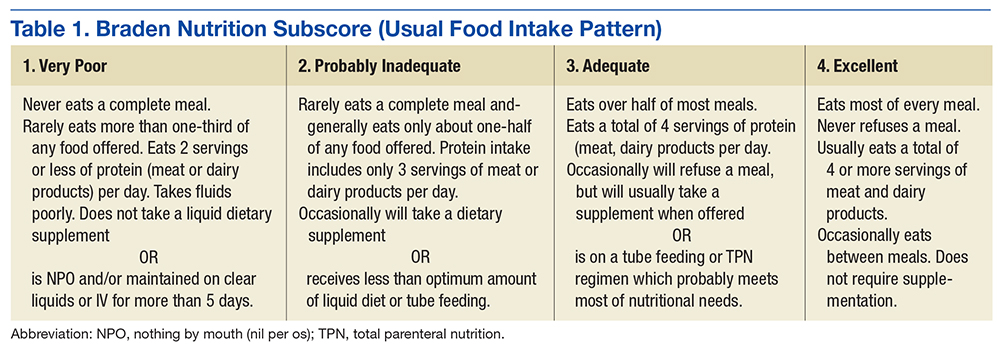
Historically, the Braden scale is reported to have good reliability when used by registered nurses as a risk prediction tool.14,16 A recent review also reported high interrater reliability of the Braden scale total score among nurses, nursing assistants, and graduate assistants.17 However, other studies suggest certain subscales (such as sensory and nutrition) may have very low interrater reliability among nurses and poor PrU predictability.18,19 To date, there are no known studies evaluating the agreement of the Braden nutrition subscale primarily used by nurses and the VA Nutrition Classification Scheme (VANCS) used by dietitians.
The VA standard of care recommends that PrU risk assessments are documented for all hospitalized veterans within 24 hours of admission, daily, with transfers or discharges, and when there is a status change in the patient. In addition, nutritional assessments by dietitians (using the VANCS) are encouraged within 24 hours of acute care hospitalization.20
The VANCS performed by dietitians consists of 4 classifications: no nutritional compromise, mild nutritional compromise, moderate nutritional compromise, and severenutritional compromise. These classifications are based on well-documented “comprehensive approaches to defining nutritional status that uses multiple parameters” including nutrition history, weight (body mass index and weight loss), diagnoses, diet (and diet orders), brief physical assessment, and preliminary laboratory data (serum albumin/pre-albumin and total lymphocyte count).20,21
The predictive ability of a risk assessment tool is critical to its clinical effectiveness in determining a clinical outcome.17 The Braden scale has been used for more than 30 years in various settings without any significant change to the scale or subscales. In a 2012 study, 4 medical factors were found to be more predictive of PrUs than the Braden scale total score in a sample of 213 acutely ill adult veterans.8 By performing a retrospective study using logistic regression predictive models, severe nutritional compromise (as identified by a dietitian), pneumonia, candidiasis, and surgery were identified as stronger predictors of PrU risk than was the Braden total score.8
With malnutrition as one of the most significant predictive factors in PrU risk, it is critical to determine whether discrepancies exist between the Braden nutrition subscale used primarily by nurses and the VANCS used by dietitians. Hence, the overall purpose of this study was to determine the level of agreement between the Braden nutrition subscale scores documented by nurses and the VANCS used by dietitians and examine the relationship of these assessments with PrU development.
Methods
The parent study was approved by the University of Florida Institutional Review Board before data collection. This secondary analysis of the parent study examined data already collected by Cowan and colleagues, which demonstrated the significance of nutritional compromise in PrU risk.
The de-identified data subset consisted of general demographics, hospital length of stay, specific diagnoses, Braden scores, PrU status, and registered dietician nutritional classification data from 213 acutely ill veterans admitted to North Florida/South Georgia Veterans Health System (NF/SGVHS) in Florida for more than 3 days between January and July 2008.8 The sample consisted of 100 veterans with nosocomial PrUs and 113 veterans without PrUs during their admission.
Scoring
Using the de-identified dataset, the variables of interest (VANCS, Braden nutrition subscale score, and the presence/absence of PrU) were coded. The VANCS was given a corresponding score ranging from 1 to 4 (1, severe nutritional compromise; 2, moderate nutritional compromise; 3, mild nutritional compromise; and 4, no nutritional compromise). The Braden nutrition subscale ranged from 1 to 4 (1 very poor nutrition; 2, probably inadequate nutrition; 3, adequate nutrition; and 4, excellent nutrition). PrU development was coded as 0, no PrU development and 1, PrU development. All nutritional assessments had been recorded in the electronic health record before any PrU reported in the parent study.
Statistical Analysis
After coding the variables of interest, the data were transferred into SAS v 9.4 (Cary, NC). The data collected compared VANCS and Braden nutrition subscale results. In addition, the authors examined the agreement between the score assigned to the VANCS and Braden nutrition subscale results with a weighted
Additionally, the authors computed sensitivity and specificity of the Braden nutrition subscale using the VANCS as the gold standard. The severe and moderately compromised categories of the VANCS combined to form the high-risk category, and the mild-to-no compromise categories were combined to form the low-risk category. The Braden nutrition subscale was similarly dichotomized with the very poor and probably inadequate intake forming the high-risk category and the adequate and excellent intake forming the low-risk category. Sensitivity and specificity of the Braden were then calculated.
Results
Nursing assessments using the Braden nutrition subscale were completed on 213 patients whose mean age (SD) was 71.0 (10.6) years. The VANCS documented by dietitians was completed on 205 patients. For 7 patients, a nutrition assessment was documented only by the Braden nutrition subscale and not the VANCS. Most of the patients were male (97%, n = 206), and white (81.4%, n = 171). The weighted
Landis and colleagues suggest that a 
Figure 2 shows the percentage of patients who developed a PrU during hospitalization among different measures of Braden nutrition subscale vs VANCS. In Figure 2, nutritional categories 1, 2, and 3 correspond to very poor intake (Braden)/severe compromise (VANCS), probably inadequate intake (Braden)/moderate compromise (VANCS), and adequate intake (Braden)/mild compromise (VANCS), respectively. There were 3 patients who had a no compromise VANCS; none of these had a PrU, so their data are not represented in Figure 2.
Discussion
Findings from this study indicate that the VANCS documented by dietitians is superior in assessing nutritional risk and predicting the development of PrUs in acutely ill hospitalized veterans compared with the Braden nutrition subscale. This study also shows that the Braden nutrition subscale did not accurately predict PrU development in acutely ill veterans. This finding concurs with the Serpa and Santos study in which the Braden nutrition subscale scores were not predictive for PrU development in hospitalized patients.
One possible explanation for the findings in this study is that the nutrition subscale of the Braden tool asks the assessing clinician to evaluate the amount of food intake the patient is currently taking in for their usual meals. This assessment is highly subjective and speculative and does not account for recent intake fluctuations or weight loss. By comparison, the VANCS is more comprehensive in its ability to assess nutritional compromise based on multiple factors, such as recent weight loss, laboratory indices, body habitus, dentition, and swallowing ability.20 The National Pressure Ulcer Advisory Panel suggests that following an acute care admission, a patient receive a consult from a dietitian if the health care provider suspects that the patient may be nutritionally compromised.1 The study findings demonstrate the utility of the VANCS as predictive of PrU risk.
Unfortunately, the authors have learned that the VANCS may be phased out soon, and many VA facilities are no longer using it. Findings from this study and other recent scientific literature suggest that all inpatients may benefit from nutritional assessments by dietitians. When performed, dietitian assessments provide the basis for more accurate nursing assessment of nutritional risk and targeted interventions. Nursing professionals should be encouraged to review the dietitian assessment and consultation notes and to incorporate this information into a more comprehensive PrU prevention and treatment plan.
Interestingly, in spite of those assessed to have severe nutritional compromise by dietitian assessment (n = 39), very few of these patients (n = 4) had an ICD-9 diagnosis related to malnutrition (ICD-9 codes, 262, 273.8, 269.9, 263.9) entered in their chart for that hospitalization. This observation suggests that 88% of patients with severe nutritional compromise were not appropriately coded at discharge. Improper coding has implications for researchers using ICD-9 diagnosis codes at discharge for accurate analysis of risk factors as well as for health care providers who may look at coded diagnoses information in the charts when considering comorbid conditions for health management.
This study highlights the importance of nutritional status as a risk factor for PrU development. Reasons suggested for nutritional status seeming to be the most significant correlate to PrUs in the acute care setting include the following: decreased protein alters oncotic pressure, making tissue prone to edema; decreases in subcutaneous fat reduce protection from pressure effects; nutritional compromise alters cellular transport of nutrients and waste and makes tissue cells more vulnerable to deformation and physical stresses; and lactate (a by-product of anaerobic glycolysis) or any other metabolic by-product of malnutrition could cause biochemical stress, and tissue cells can die faster as a result of the increased plasma membrane permeability.7,24-26
Limitations
This study was limited to 1 sample of veterans hospitalized in the 2 acute care facilities of NF/SGVHS and the use of a retrospective chart review. As a result, further research is necessary to establish generalizability to other acute care settings and high-risk populations. In spite of these limitations, this and other studies highlight the need for revision of the Braden scale, specifically the nutritional subscale, to lessen the ambiguity seen between dietitian and nursing assessments while also increasing the accuracy in determining a patient’s nutrition risk of PrU development during hospitalization.
Conclusion
These findings provide evidence that dietitians’ documentation of the VANCS related to nutritional compromise are superior to current nutritional risk assessments using the Braden nutrition subscale in predicting PrU risk.
Acknowledgments
The authors acknowledge that this work was supported by the resources of the North Florida/South Georgia Veterans Health System in Gainesville, Florida, and in part by a Small Project Award from the VA Office of Nursing Services.
1. National Pressure Ulcer Advisory Panel, European Pressure Ulcer Advisory Panel, Pan Pacific Pressure Injury Alliance. Prevention and Treatment of Pressure Ulcers: Clinical Practice Guideline. http://www.npuap.org/resources/educational-and-clinical -resources/prevention-and-treatment-of-pressure -ulcers-clinical-practice-guideline. Updated 2014. Accessed November 7, 2016.
2. National Pressure Ulcer Advisory Panel, European Pressure Ulcer Advisory Panel, Pan Pacific Pressure Injury Alliance. Prevention and treatment of pressure ulcers: quick reference guide. http://www .npuap.org/wp-content/uploads/2014/08/Updated -10-16-14-Quick-Reference-Guide-DIGITAL-NPUAP-EPUAP-PPPIA-16Oct2014.pdf. Updated October 16, 2014. Accessed October 21, 2016.
3. Sullivan N. Preventing in-facility pressure ulcers. In: Agency for Healthcare Research and Quality. Making Health Care Safer II. An Updated Critical Analysis of the Evidence for Patient Safety Practices. Evidence Reports/Technology Assessments. http://www.ahrq.gov/sites/default/files/wysiwyg/research/findings/evidence-based-reports/services/quality/ptsafetyII-full.pdf:212-232. Published March 2013. Accessed October 21, 2016.
4. Russo CA, Steiner C, Spector W. Hospitalizations related to pressure ulcers among adults 18 years and older, 2006. In: Healthcare Cost and Utilization Project (HCUP) Statistical Briefs. http://www.ncbi .nlm.nih.gov/books/NBK54557. Published December 2008. Accessed October 21, 2016.
5. Spetz J, Brown DS, Aydin C, Donaldson N. The value of reducing hospital-acquired pressure ulcer prevalence: an illustrative analysis. J Nurs Adm. 2013;43(4):235-241.
6. Whittington KT, Briones R. National prevalence and incidence study: 6-year sequential acute care data. Adv Skin Wound Care. 2004;17(9):490-494.
7. Dorner B, Posthauer ME, Thomas D; National Pressure Ulcer Advisory Panel. The role of nutrition in pressure ulcer prevention and treatment: National Pressure Ulcer Advisory Panel white paper. http://www.npuap.org/wp-content/uploads/2012/03/Nutrition-White-Paper-Website-Version.pdf. Published 2009. Accessed November 7, 2016.
8. Cowan LJ, Stechmiller JK, Rowe M, Kairalla JA. Enhancing Braden pressure ulcer risk assessment in acutely ill adult veterans. Wound Repair Regen. 2012;20(2):137-148.
9. Correia MI, Hegazi RA, Higashiguchi T, et al. Evidence-based recommendations for addressing malnutrition in health care: an updated strategy from the feedM.E. Global Study Group. J Am Med Dir Assoc. 2014;15(8):544-550.
10. Malafarina V, Úriz-Otano F, Fernández-Catalán C, Tejedo-Flors D. Nutritional status and pressure ulcers. Risk assessment and estimation in older adults. J Am Geriatr Soc. 2014;62(6):1209-1210.
11. Posthauer ME, Banks M, Dorner B, Schols JM. The role of nutrition for pressure ulcer management: national pressure ulcer advisory panel, European pressure ulcer advisory panel, and pan pacific pressure injury alliance white paper. Adv Skin Wound Care. 2015;28(4):175-188.
12. Brito PA, de Vasconcelos Generoso S, Correia MI. Prevalence of pressure ulcers in hospitals in Brazil and association with nutritional status—a multicenter, cross-sectional study. Nutrition. 2013;29(4):646-649.
13. Coleman S, Gorecki C, Nelson EA, et al. Patient risk factors for pressure ulcer development: systematic review. Int J Nurs Stud. 2013;50(7):974-1003.
14. Bergstrom N, Braden BJ, Laguzza A, Holman V. The Braden Scale for predicting pressure sore risk. Nurs Res. 1987;36(4):205-210.
15. Ayello EA, Braden B. How and why to do pressure ulcer risk assessment. Adv Skin Wound Care. 2002;15(3):125-131.
16. Wang LH, Chen HL, Yan HY, et al. Inter-rater reliability of three most commonly used pressure ulcer risk assessment scales in clinical practice. Int Wound J. 2015;12(5):590-594.
17. Wilchesky M, Lungu O. Predictive and concurrent validity of the Braden scale in long-term care: a meta-analysis. Wound Repair Regen. 2015;23(1):44-56.
18. Kottner J, Dassen T. An interrater reliability study of the Braden scale in two nursing homes. Int J Nurs Stud. 2008;45(10):1501-1511.
19. Yatabe MS, Taguchi F, Ishida I, et al. Mini nutritional assessment as a useful method of predicting the development of pressure ulcers in elderly inpatients. J Am Geriatr Soc. 2013;61(10):1698-1704.
20. Hiller L, Lowery JC, Davis JA, Shore CJ, Striplin DT. Nutritional status classification in the Department of Veterans Affairs. J Am Diet Assoc. 2001;101(7):786-792.
21. U.S. Department of Veterans Affairs. VHA Handbook 1109.02. Clinical nutrition management. http://www.va.gov/vhapublications/ViewPublica tion.asp?pub_ID=2493. Published February 2012. Accessed October 21, 2016.
22. Landis JR, Koch GG. The measurement of observer agreement for categorical data. Biometrics. 1977;33(1):159-174.
23. Serpa LF, Santos VL. Validity of the Braden Nutrition Subscale in predicting pressure ulcer development. J Wound Ostomy Continence Nurs. 2014;41(5):436-443.
24. Reddy M, Gill SS, Rochon PA. Preventing pressure ulcers: a systematic review. JAMA. 2006;296(8):974-984.
25. Cooper KL. Evidence-based prevention of pressure ulcers in the intensive care unit. Crit Care Nurse. 2013;33(6):57-66.
26. Leopold E, Gefen A. Changes in permeability of the plasma membrane of myoblasts to fluorescent dyes with different molecular masses under sustained uniaxial stretching. Med Eng Phys. 2013;35(5):601-607.
A pressure ulcer (PrU) is a localized injury to the skin and/or deep tissues that is due to pressure, friction, or shearing forces. Pressure ulcers are strongly associated with serious comorbidities, particularly inadequate nutrition and immobility.1,2 Pressure ulcers increase hospital costs significantly. In the U.S., PrU care is about $11 billion annually and a cost of between $2,000 and $21,410 per individual PrU.3-5
The impact of nosocomial PrUs remains a key health and economic concern of acute care facilities worldwide. In the U.S., about 2.5 million inpatients annually develop some degree of a PrU during their hospital stay. The reported incidence rates range from 0.4% to 38%.3,6 Each year about 60,000 people die of complications of a PrU.3,6,7 Inadequate nutrition is a critical factor that contributes to the incidence of PrUs.8-12 Consequences of inadequate nutrition have included alterations in skin integrity resulting in PrUs, longer hospital stays, increased costs of care, and higher rates of mortality.9 As a patient’s nutritional status becomes compromised, the likelihood of developing a PrU increases, especially if an individual is immobilized.7,9-11,13
Braden Scale History
The Braden Scale for Predicting Pressure Sore Risk was developed by Barbara Braden, PhD, RN, and Nancy Bergstrom, PhD, RN, in 1987.
The scale is composed of 6 factors: sensory perception, moisture, activity, mobility, friction and shear, and nutrition.14 Each factor is scored on a scale of 1 to 4 points (friction and shear are scored on a point scale of only 1 to 3) for a total possible score of 6 to 23 points (the lower the score, the greater the assumed PrU risk).
The Braden nutrition subscale relies heavily on recording observed or patient self-reported eating habits. It is typically documented by nurses who assess the daily intake of meals: recording a score of 4 if the patient’s meal intake is excellent (eats most of every meal), 3 if the patient’s intake is adequate (eats more than half of most meals), 2 if the patient’s intake is probably inadequate (rarely eats a complete meal), and 1 if a patient’s intake is very poor (never eats a complete meal) (Table 1).14
Historically, the Braden scale is reported to have good reliability when used by registered nurses as a risk prediction tool.14,16 A recent review also reported high interrater reliability of the Braden scale total score among nurses, nursing assistants, and graduate assistants.17 However, other studies suggest certain subscales (such as sensory and nutrition) may have very low interrater reliability among nurses and poor PrU predictability.18,19 To date, there are no known studies evaluating the agreement of the Braden nutrition subscale primarily used by nurses and the VA Nutrition Classification Scheme (VANCS) used by dietitians.
The VA standard of care recommends that PrU risk assessments are documented for all hospitalized veterans within 24 hours of admission, daily, with transfers or discharges, and when there is a status change in the patient. In addition, nutritional assessments by dietitians (using the VANCS) are encouraged within 24 hours of acute care hospitalization.20
The VANCS performed by dietitians consists of 4 classifications: no nutritional compromise, mild nutritional compromise, moderate nutritional compromise, and severenutritional compromise. These classifications are based on well-documented “comprehensive approaches to defining nutritional status that uses multiple parameters” including nutrition history, weight (body mass index and weight loss), diagnoses, diet (and diet orders), brief physical assessment, and preliminary laboratory data (serum albumin/pre-albumin and total lymphocyte count).20,21
The predictive ability of a risk assessment tool is critical to its clinical effectiveness in determining a clinical outcome.17 The Braden scale has been used for more than 30 years in various settings without any significant change to the scale or subscales. In a 2012 study, 4 medical factors were found to be more predictive of PrUs than the Braden scale total score in a sample of 213 acutely ill adult veterans.8 By performing a retrospective study using logistic regression predictive models, severe nutritional compromise (as identified by a dietitian), pneumonia, candidiasis, and surgery were identified as stronger predictors of PrU risk than was the Braden total score.8
With malnutrition as one of the most significant predictive factors in PrU risk, it is critical to determine whether discrepancies exist between the Braden nutrition subscale used primarily by nurses and the VANCS used by dietitians. Hence, the overall purpose of this study was to determine the level of agreement between the Braden nutrition subscale scores documented by nurses and the VANCS used by dietitians and examine the relationship of these assessments with PrU development.
Methods
The parent study was approved by the University of Florida Institutional Review Board before data collection. This secondary analysis of the parent study examined data already collected by Cowan and colleagues, which demonstrated the significance of nutritional compromise in PrU risk.
The de-identified data subset consisted of general demographics, hospital length of stay, specific diagnoses, Braden scores, PrU status, and registered dietician nutritional classification data from 213 acutely ill veterans admitted to North Florida/South Georgia Veterans Health System (NF/SGVHS) in Florida for more than 3 days between January and July 2008.8 The sample consisted of 100 veterans with nosocomial PrUs and 113 veterans without PrUs during their admission.
Scoring
Using the de-identified dataset, the variables of interest (VANCS, Braden nutrition subscale score, and the presence/absence of PrU) were coded. The VANCS was given a corresponding score ranging from 1 to 4 (1, severe nutritional compromise; 2, moderate nutritional compromise; 3, mild nutritional compromise; and 4, no nutritional compromise). The Braden nutrition subscale ranged from 1 to 4 (1 very poor nutrition; 2, probably inadequate nutrition; 3, adequate nutrition; and 4, excellent nutrition). PrU development was coded as 0, no PrU development and 1, PrU development. All nutritional assessments had been recorded in the electronic health record before any PrU reported in the parent study.
Statistical Analysis
After coding the variables of interest, the data were transferred into SAS v 9.4 (Cary, NC). The data collected compared VANCS and Braden nutrition subscale results. In addition, the authors examined the agreement between the score assigned to the VANCS and Braden nutrition subscale results with a weighted
Additionally, the authors computed sensitivity and specificity of the Braden nutrition subscale using the VANCS as the gold standard. The severe and moderately compromised categories of the VANCS combined to form the high-risk category, and the mild-to-no compromise categories were combined to form the low-risk category. The Braden nutrition subscale was similarly dichotomized with the very poor and probably inadequate intake forming the high-risk category and the adequate and excellent intake forming the low-risk category. Sensitivity and specificity of the Braden were then calculated.
Results
Nursing assessments using the Braden nutrition subscale were completed on 213 patients whose mean age (SD) was 71.0 (10.6) years. The VANCS documented by dietitians was completed on 205 patients. For 7 patients, a nutrition assessment was documented only by the Braden nutrition subscale and not the VANCS. Most of the patients were male (97%, n = 206), and white (81.4%, n = 171). The weighted
Landis and colleagues suggest that a
Figure 2 shows the percentage of patients who developed a PrU during hospitalization among different measures of Braden nutrition subscale vs VANCS. In Figure 2, nutritional categories 1, 2, and 3 correspond to very poor intake (Braden)/severe compromise (VANCS), probably inadequate intake (Braden)/moderate compromise (VANCS), and adequate intake (Braden)/mild compromise (VANCS), respectively. There were 3 patients who had a no compromise VANCS; none of these had a PrU, so their data are not represented in Figure 2.
Discussion
Findings from this study indicate that the VANCS documented by dietitians is superior in assessing nutritional risk and predicting the development of PrUs in acutely ill hospitalized veterans compared with the Braden nutrition subscale. This study also shows that the Braden nutrition subscale did not accurately predict PrU development in acutely ill veterans. This finding concurs with the Serpa and Santos study in which the Braden nutrition subscale scores were not predictive for PrU development in hospitalized patients.
One possible explanation for the findings in this study is that the nutrition subscale of the Braden tool asks the assessing clinician to evaluate the amount of food intake the patient is currently taking in for their usual meals. This assessment is highly subjective and speculative and does not account for recent intake fluctuations or weight loss. By comparison, the VANCS is more comprehensive in its ability to assess nutritional compromise based on multiple factors, such as recent weight loss, laboratory indices, body habitus, dentition, and swallowing ability.20 The National Pressure Ulcer Advisory Panel suggests that following an acute care admission, a patient receive a consult from a dietitian if the health care provider suspects that the patient may be nutritionally compromised.1 The study findings demonstrate the utility of the VANCS as predictive of PrU risk.
Unfortunately, the authors have learned that the VANCS may be phased out soon, and many VA facilities are no longer using it. Findings from this study and other recent scientific literature suggest that all inpatients may benefit from nutritional assessments by dietitians. When performed, dietitian assessments provide the basis for more accurate nursing assessment of nutritional risk and targeted interventions. Nursing professionals should be encouraged to review the dietitian assessment and consultation notes and to incorporate this information into a more comprehensive PrU prevention and treatment plan.
Interestingly, in spite of those assessed to have severe nutritional compromise by dietitian assessment (n = 39), very few of these patients (n = 4) had an ICD-9 diagnosis related to malnutrition (ICD-9 codes, 262, 273.8, 269.9, 263.9) entered in their chart for that hospitalization. This observation suggests that 88% of patients with severe nutritional compromise were not appropriately coded at discharge. Improper coding has implications for researchers using ICD-9 diagnosis codes at discharge for accurate analysis of risk factors as well as for health care providers who may look at coded diagnoses information in the charts when considering comorbid conditions for health management.
This study highlights the importance of nutritional status as a risk factor for PrU development. Reasons suggested for nutritional status seeming to be the most significant correlate to PrUs in the acute care setting include the following: decreased protein alters oncotic pressure, making tissue prone to edema; decreases in subcutaneous fat reduce protection from pressure effects; nutritional compromise alters cellular transport of nutrients and waste and makes tissue cells more vulnerable to deformation and physical stresses; and lactate (a by-product of anaerobic glycolysis) or any other metabolic by-product of malnutrition could cause biochemical stress, and tissue cells can die faster as a result of the increased plasma membrane permeability.7,24-26
Limitations
This study was limited to 1 sample of veterans hospitalized in the 2 acute care facilities of NF/SGVHS and the use of a retrospective chart review. As a result, further research is necessary to establish generalizability to other acute care settings and high-risk populations. In spite of these limitations, this and other studies highlight the need for revision of the Braden scale, specifically the nutritional subscale, to lessen the ambiguity seen between dietitian and nursing assessments while also increasing the accuracy in determining a patient’s nutrition risk of PrU development during hospitalization.
Conclusion
These findings provide evidence that dietitians’ documentation of the VANCS related to nutritional compromise are superior to current nutritional risk assessments using the Braden nutrition subscale in predicting PrU risk.
Acknowledgments
The authors acknowledge that this work was supported by the resources of the North Florida/South Georgia Veterans Health System in Gainesville, Florida, and in part by a Small Project Award from the VA Office of Nursing Services.
1. National Pressure Ulcer Advisory Panel, European Pressure Ulcer Advisory Panel, Pan Pacific Pressure Injury Alliance. Prevention and Treatment of Pressure Ulcers: Clinical Practice Guideline. http://www.npuap.org/resources/educational-and-clinical -resources/prevention-and-treatment-of-pressure -ulcers-clinical-practice-guideline. Updated 2014. Accessed November 7, 2016.
2. National Pressure Ulcer Advisory Panel, European Pressure Ulcer Advisory Panel, Pan Pacific Pressure Injury Alliance. Prevention and treatment of pressure ulcers: quick reference guide. http://www .npuap.org/wp-content/uploads/2014/08/Updated -10-16-14-Quick-Reference-Guide-DIGITAL-NPUAP-EPUAP-PPPIA-16Oct2014.pdf. Updated October 16, 2014. Accessed October 21, 2016.
3. Sullivan N. Preventing in-facility pressure ulcers. In: Agency for Healthcare Research and Quality. Making Health Care Safer II. An Updated Critical Analysis of the Evidence for Patient Safety Practices. Evidence Reports/Technology Assessments. http://www.ahrq.gov/sites/default/files/wysiwyg/research/findings/evidence-based-reports/services/quality/ptsafetyII-full.pdf:212-232. Published March 2013. Accessed October 21, 2016.
4. Russo CA, Steiner C, Spector W. Hospitalizations related to pressure ulcers among adults 18 years and older, 2006. In: Healthcare Cost and Utilization Project (HCUP) Statistical Briefs. http://www.ncbi .nlm.nih.gov/books/NBK54557. Published December 2008. Accessed October 21, 2016.
5. Spetz J, Brown DS, Aydin C, Donaldson N. The value of reducing hospital-acquired pressure ulcer prevalence: an illustrative analysis. J Nurs Adm. 2013;43(4):235-241.
6. Whittington KT, Briones R. National prevalence and incidence study: 6-year sequential acute care data. Adv Skin Wound Care. 2004;17(9):490-494.
7. Dorner B, Posthauer ME, Thomas D; National Pressure Ulcer Advisory Panel. The role of nutrition in pressure ulcer prevention and treatment: National Pressure Ulcer Advisory Panel white paper. http://www.npuap.org/wp-content/uploads/2012/03/Nutrition-White-Paper-Website-Version.pdf. Published 2009. Accessed November 7, 2016.
8. Cowan LJ, Stechmiller JK, Rowe M, Kairalla JA. Enhancing Braden pressure ulcer risk assessment in acutely ill adult veterans. Wound Repair Regen. 2012;20(2):137-148.
9. Correia MI, Hegazi RA, Higashiguchi T, et al. Evidence-based recommendations for addressing malnutrition in health care: an updated strategy from the feedM.E. Global Study Group. J Am Med Dir Assoc. 2014;15(8):544-550.
10. Malafarina V, Úriz-Otano F, Fernández-Catalán C, Tejedo-Flors D. Nutritional status and pressure ulcers. Risk assessment and estimation in older adults. J Am Geriatr Soc. 2014;62(6):1209-1210.
11. Posthauer ME, Banks M, Dorner B, Schols JM. The role of nutrition for pressure ulcer management: national pressure ulcer advisory panel, European pressure ulcer advisory panel, and pan pacific pressure injury alliance white paper. Adv Skin Wound Care. 2015;28(4):175-188.
12. Brito PA, de Vasconcelos Generoso S, Correia MI. Prevalence of pressure ulcers in hospitals in Brazil and association with nutritional status—a multicenter, cross-sectional study. Nutrition. 2013;29(4):646-649.
13. Coleman S, Gorecki C, Nelson EA, et al. Patient risk factors for pressure ulcer development: systematic review. Int J Nurs Stud. 2013;50(7):974-1003.
14. Bergstrom N, Braden BJ, Laguzza A, Holman V. The Braden Scale for predicting pressure sore risk. Nurs Res. 1987;36(4):205-210.
15. Ayello EA, Braden B. How and why to do pressure ulcer risk assessment. Adv Skin Wound Care. 2002;15(3):125-131.
16. Wang LH, Chen HL, Yan HY, et al. Inter-rater reliability of three most commonly used pressure ulcer risk assessment scales in clinical practice. Int Wound J. 2015;12(5):590-594.
17. Wilchesky M, Lungu O. Predictive and concurrent validity of the Braden scale in long-term care: a meta-analysis. Wound Repair Regen. 2015;23(1):44-56.
18. Kottner J, Dassen T. An interrater reliability study of the Braden scale in two nursing homes. Int J Nurs Stud. 2008;45(10):1501-1511.
19. Yatabe MS, Taguchi F, Ishida I, et al. Mini nutritional assessment as a useful method of predicting the development of pressure ulcers in elderly inpatients. J Am Geriatr Soc. 2013;61(10):1698-1704.
20. Hiller L, Lowery JC, Davis JA, Shore CJ, Striplin DT. Nutritional status classification in the Department of Veterans Affairs. J Am Diet Assoc. 2001;101(7):786-792.
21. U.S. Department of Veterans Affairs. VHA Handbook 1109.02. Clinical nutrition management. http://www.va.gov/vhapublications/ViewPublica tion.asp?pub_ID=2493. Published February 2012. Accessed October 21, 2016.
22. Landis JR, Koch GG. The measurement of observer agreement for categorical data. Biometrics. 1977;33(1):159-174.
23. Serpa LF, Santos VL. Validity of the Braden Nutrition Subscale in predicting pressure ulcer development. J Wound Ostomy Continence Nurs. 2014;41(5):436-443.
24. Reddy M, Gill SS, Rochon PA. Preventing pressure ulcers: a systematic review. JAMA. 2006;296(8):974-984.
25. Cooper KL. Evidence-based prevention of pressure ulcers in the intensive care unit. Crit Care Nurse. 2013;33(6):57-66.
26. Leopold E, Gefen A. Changes in permeability of the plasma membrane of myoblasts to fluorescent dyes with different molecular masses under sustained uniaxial stretching. Med Eng Phys. 2013;35(5):601-607.
Laxative Use with Patient-Controlled Analgesia in the Hospital and Associated Outcomes
From the Division of General Internal Medicine (Dr. Lenz), Division of Biomedical Statistics and Informatics (Mr. Schroeder), and the Division of Hospital Internal Medicine (Ms. Lawson and Dr. Yu), Mayo Clinic, Rochester, MN.
Abstract
- Objective: To describe prophylactic laxative effectiveness and prescribing patterns in patients initiated on intravenous (IV) opioid analgesia.
- Design: Retrospective cohort study.
- Setting and participants: All patients who were on IV narcotics with a patient-controlled pump while admitted to a general medicine service at the Mayo Clinic in Rochester in 2011 and 2012 were identified. Patients were excluded if constipation or diarrhea were diagnosed prior to IV opioid analgesia initiation.
- Measurements: Prophylactic laxatives were defined as laxatives prescribed within 24 hours of IV opioid analgesia initiation to be given even in the absence of constipation. Constipation was recorded when diagnosed during the hospitalization. Severe constipation was defined as constipation resulting in an abdominal CT or X-ray; abdominal distension, pain, or bloating; or if an enema was performed during the hospitalization.
- Results: Of 283 patients, 101 (36%) received prophylactic laxatives and 182 (64%) did not. Constipation occurred in 61 (34%) not on prophylactic laxatives and in 49 (49%) on prophylactic laxatives (P = 0.015). Severe constipation occurred in 23 (13%) not on prophylactic laxatives and in 33 (33%) on prophylactic laxatives (P < 0.001).
- Conclusion: A large percentage of patients are not receiving prophylactic laxatives when receiving IV opioid analgesia in the hospital. Current laxative strategies are not effectively preventing constipation in patients when prescribed.
Key words: constipation; opioids; hospital medicine; patient-controlled analgesia; laxatives.
Opioid-induced constipation (OIC) is defined as a change, when initiating opioid therapy, from baseline bowel habits and defecation patterns that is characterized by any of the following: reduced bowel frequency; development or worsening of straining; a sense of incomplete evacuation; or a patient’s perception of distress related to bowel habits [1]. It is an important side effect to consider when initiating narcotic analgesia. It has been estimated that approximately 3% to 4% of the population is on chronic narcotic pain relievers in the outpatient setting [2,3], and 37% to 81% of these patients will experience constipation [3–9]. Because of the high incidence of constipation, the prophylactic prescription of laxatives with initiation of opioid pain relievers is frequently recommended [10–15]. Furthermore, it has been shown that among patients admitted to the hospital with cancer, there is a lower incidence of constipation amongst those who have received prophylactic laxatives [16]. However, there is no evidence in the literature that prophylactic laxatives improve outcomes in patients on opioid analgesia in the general medicine inpatient setting. Furthermore, studies have illustrated that recommendations for prophylactic laxative use are not reliably followed [3,9].
While the incidence of OIC is well described in the outpatient setting [17,18], there are few studies looking at the incidence of OIC in the hospital setting. It has been shown, however, that occurrence during even a brief hospitalization is possible [4,6]. Acute constipation while hospitalized can theoretically lead to longer hospitalizations, increased pain, and decreased quality of life [6,7,19]. Recent research has focused heavily on the use of novel agents such as peripherally acting mu-opioid receptor antagonists in the treatment of OIC [20–23]. However, the expense of these agents makes them less than ideal in the prophylactic setting. This study will assess the effectiveness and prescribing patterns of prophylactic laxatives in the inpatient general medicine setting over a 2-year period at our institution in patients initiated on patient-controlled analgesia with hydromorphone, morphine, or fentanyl.
Methods
This study was approved by the institutional review board at the Mayo Clinic Rochester. All patients who were initiated on intravenous analgesia with an electronic patient-controlled opioid pump (PCA) while admitted to a general medicine service in 2011 and 2012 were identified. Patients who received PCA therapy were identified through a pharmacy database. Only patients older than 18 years of age were included in the study. PCA therapy was selected for our analysis because PCA therapy is not regularly administered on an outpatient basis. All of these patients, therefore, had a change in their narcotic regimen on admission to the hospital. Patients were excluded from the study if they were on a PCA for less than 24 hours; had a PCA initiated on a service other than a general medicine service; were on a scheduled laxative regimen prior to admission; or carried a diagnosis of bowel obstruction, chronic diarrhea, constipation, or intestinal discontinuity (eg, those with previous diversions or ostomies).
A retrospective review of each patient’s chart was conducted with the assistance of a team of nurse abstractors. Basic demographic data were recorded for each patient. Date of hospital admission and discharge; scheduled laxatives ordered and administered (any dose of sennosides, polyethylene glycol, docusate, bisacodyl, lactulose, or magnesium citrate); abdominal X-rays and abdominal CT scans performed for constipation; and any administration of enemas were recorded. Fiber supplements were not considered laxatives. If a patient was documented to have constipation during their hospitalization this was recorded. Patients were classified as having severe constipation if an abdominal CT or x-ray was performed for the indication of constipation; if abdominal distension, pain, or bloating were documented due to constipation; or if an enema was performed during the hospitalization.
For analysis purposes, patients who started receiving scheduled laxatives (as opposed to laxatives “as needed”)on or before the day of PCA initiation were classified as receiving prophylactic laxatives. Baseline patient characteristics and outcomes were compared using the chi-square test for nominal variables and the rank sum test for continuous variables. In all cases, 2-tailed tests were performed with P values ≤ 0.05 considered statistically significant. A nominal logistic regression model was utilized to assess for independent association of risk factors with the outcome of constipation.
Results
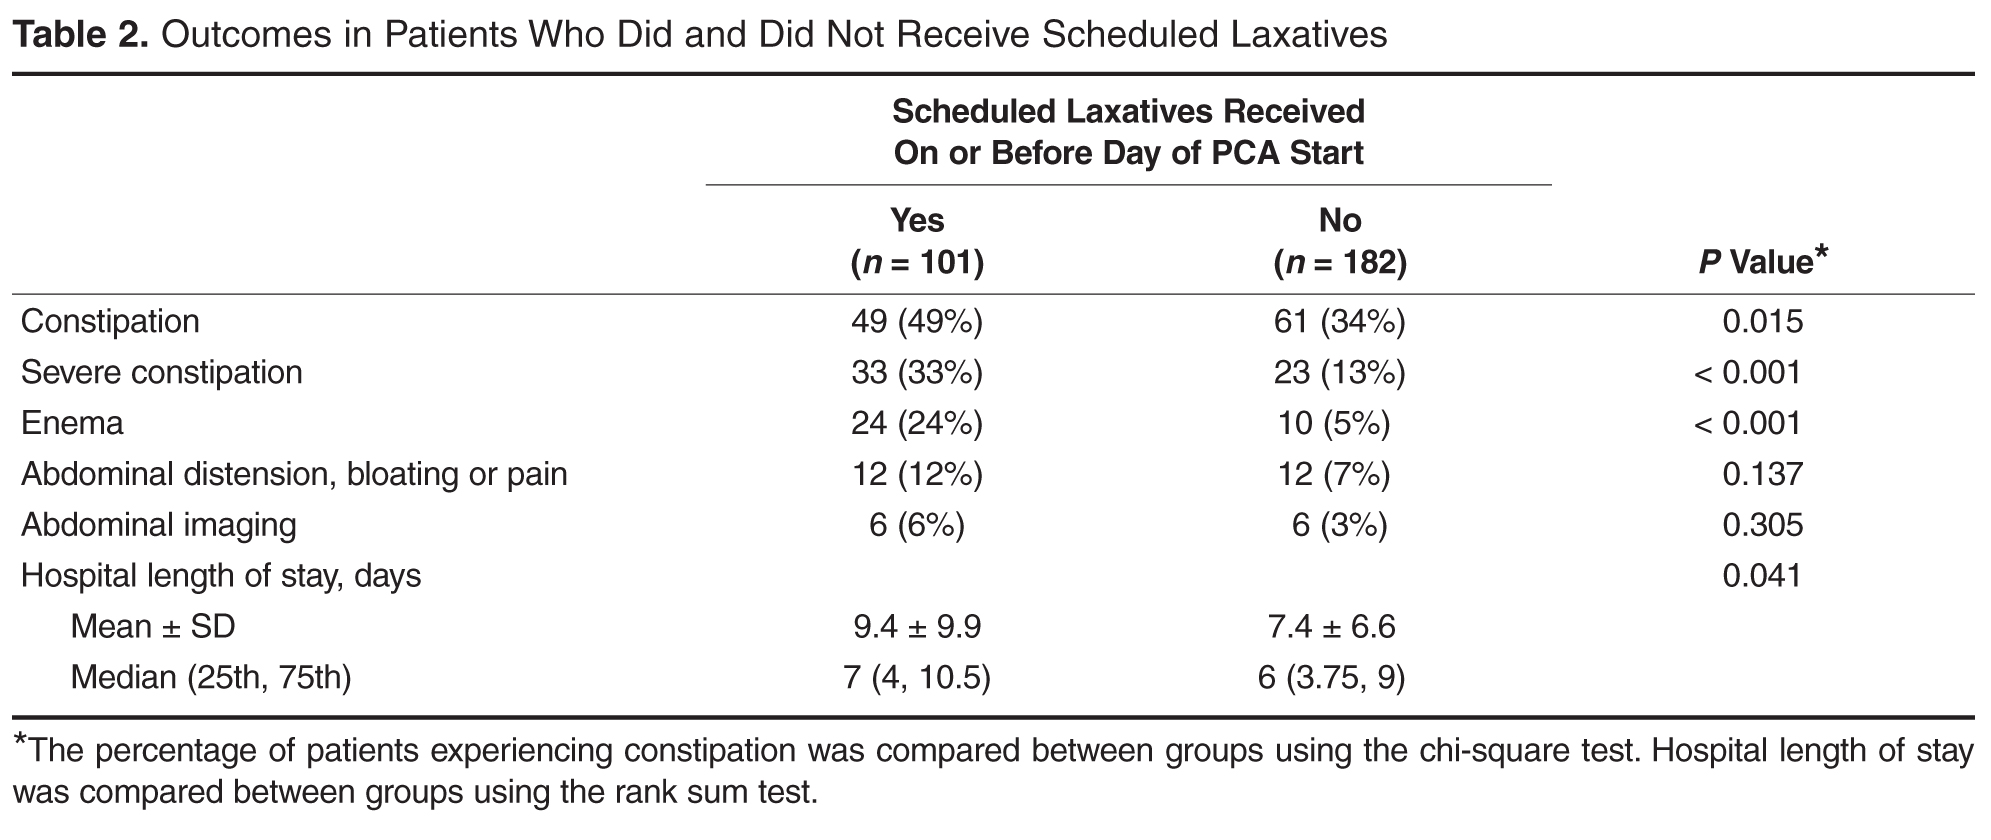

Discussion
Patients initiated on opioid therapy were not prescribed prophylactic laxatives in 64% of our cohort in the inpatient setting. When prescribed, current laxative strategies did not effectively prevent constipation with 49% experiencing OIC. Our data serves as a strong reminder of the magnitude of the problem of OIC in the inpatient setting.
The strength of our paper lies in its role as a magnitude assessment. This retrospective review reveals for that among a diverse group of patients hospitalized within a large academic institution, OIC remains prevalent. Furthermore, the high incidence of severe constipation indicates the potential for increased health care costs and patient discomfort secondary to OIC emphasizing the importance of prevention of OIC. Recent guidelines have made a push toward prophylactic laxative utilization earlier. Specifically, the European Palliative Research Collaborative offers a “strong recommendation to routinely prescribe laxatives for the management or prophylaxis of opioid-induced constipation” [10]. Additionally, the American Society of Interventional Pain Physicians suggests that “a physician should consider the initiation of a bowel regimen even before the development of constipation and definitely after the development of constipation” [11]. Our manuscript serves as a reminder that OIC remains a very prevalent problem and that prophylactic laxatives are still being underutilized.
This is a retrospective study and thus has inherent limitations. Specifically, we are limited to those cases of constipation that were documented in the medical record. The presentation of constipation is varied between patients. This variation in presentation of OIC is inherent to the disease process as is demonstrated in the broad definition for OIC [1]. The cases of constipation that we are reporting clearly were bothersome enough to warrant documentation in the medical record, and while there may have been cases that escaped documentation, we can be confident that the cases of OIC we are reporting are true cases of OIC. The numbers we report can therefore be taken to represent a minimum number of cases of constipation occurring in our study population.
It has been suggested that OIC prevalence varies with type of opioid and duration of opioid therapy [24]. We did not compare dose, type, or duration of opioid therapy in this study. This could certainly account for the seemingly higher rate of constipation within the group treated with prophylactic laxatives as compared with those not treated with prophylactic laxatives. Physicians likely have a higher propensity to prescribe prophylactic laxatives to patients receiving high doses of opioids who are in turn at higher risk for OIC. We cannot say whether differences in efficacy exist between prophylactic laxative regimens or which opioids (dose and duration) cause the most constipation based upon our data. Future studies incorporating dose, duration, and opioid type along with the variables we collected in this study could potentially construct successful logistic regression models with predictive power to identify those at highest risk of OIC.
Our rate of OIC is consistent with previously published figures [3–9]. However, we demonstrate for the first time that prophylactic laxatives are prescribed infrequently and unsuccessfully in the inpatient setting. This is consistent with prescribing rates in the outpatient setting [9,25]. Furthermore, we observed a higher rate of constipation in those treated with prophylactic laxatives compared to those that did not receive prophylactic laxatives. Pottegard et al similarly demonstrated an increased rate of constipation in those utilizing laxative therapy [25]. This is likely secondary to providers recommending prophylactic laxatives to those patients most likely to develop constipation. Despite being able to recognize high-risk patients, providers are unable to prevent OIC as little is known regarding optimal laxative strategies. Previous studies comparing treatment regimens for the relief of constipation in the palliative care population have been largely inconclusive [26]. There have been no studies to date comparing different prophylactic laxatives in the inpatient setting.
Future directions for research in this area would ideally take the form of randomized controlled trials investigating efficacy of different prophylactic laxatives in the inpatient setting. These trials would ideally include well-defined patient groups receiving specific narcotics for specific reasons. These studies would be best if powered to assess the effect of narcotic dosage and duration of therapy as well. Alternatively, larger retrospective chart reviews could be performed including narcotic dosage, type, and duration of therapy with a planned logistic regression model attempting to account for likely independent variables.
Conclusion
Our study demonstrates for the first time that prophylactic laxatives are not being prescribed frequently to patients on opioid analgesia in the inpatient general medicine setting. Additionally, while providers seem to be identifying patients at higher risk of constipation, they are still unable to prevent constipation in a high percentage of patients. Further research into this area would be beneficial to prevent this uncomfortable, costly, and preventable complication of opioid analgesia.
Corresponding author: Roger Yu, MD, Mayo Clinic, 200 First St. SW, Rochester, MN 55905, [email protected].
Funding/support: This research was supported by the Mayo Clinic Return to Work program nurses for data abstraction.
Financial disclosures: None.
1. Mearin F, Lacy BE, Chang L, et al. Bowel disorders. Gastroenterology 2016.
2. Boudreau D, Von Korff M, Rutter CM, et al. Trends in long-term opioid therapy for chronic non-cancer pain. Pharmacoepidemiol Drug Saf 2009;18:1166–75.
3. Choung RS, Locke GR 3rd, Zinsmeister AR, et al. Opioid bowel dysfunction and narcotic bowel syndrome: a population-based study. Am J Gastroenterol 2009;104:1199–204.
4. Droney J, Ross J, Gretton S, et al. Constipation in cancer patients on morphine. Support Care Cancer 2008;16:453–9.
5. Sykes NP. The relationship between opioid use and laxative use in terminally ill cancer patients. Palliat Med 1998;12:375–82.
6. Bell TJ, Panchal SJ, Miaskowski C, et al. The prevalence, severity, and impact of opioid-induced bowel dysfunction: results of a US and European Patient Survey (PROBE 1). Pain Med 2009;10:35–42.
7. Cook SF, Lanza L, Zhou X, et al. Gastrointestinal side effects in chronic opioid users: results from a population-based survey. Aliment Pharmacol Ther 2008;27:1224–32.
8. Moore RA, McQuay HJ. Prevalence of opioid adverse events in chronic non-malignant pain: systematic review of randomised trials of oral opioids. Arthritis Res Ther 2005:7:R1046–51.
9. Bouvy ML, Buurma H, Egberts TC. Laxative prescribing in relation to opioid use and the influence of pharmacy-based intervention. J Clin Pharm Ther 2002;27:107–10.
10. Caraceni A, Hanks G, Kaasa S, et al. Use of opioid analgesics in the treatment of cancer pain: evidence-based recommendations from the EAPC. Lancet Oncol 2012:13:e58–68.
11. Manchikanti L, Abdi S, Atluri S, et al. American Society of Interventional Pain Physicians (ASIPP) guidelines for responsible opioid prescribing in chronic non-cancer pain: Part 2--guidance. Pain Physician 2012;15(3 Suppl):S67–116.
12. Cameron JC. Constipation related to narcotic therapy. A protocol for nurses and patients. Cancer Nurs 1992;15:372–7.
13. Levy MH. Pharmacologic treatment of cancer pain. N Engl J Med 1996;335:1124–32.
14. Swegle JM, Logemann D. Management of common opioid-induced adverse effects. Am Fam Physician 2006;74:1347–54.
15. Donnelly S, Davis MP, Walsh D, Naughton M. Morphine in cancer pain management: a practical guide. Support Care Cancer 2002;10:13–35.
16. Ishihara M, Ikesue H Matsunaga H, et al. A multi-institutional study analyzing effect of prophylactic medication for prevention of opioid-induced gastrointestinal dysfunction. Clin J Pain 2012;28:373–81.
17. Kalso E, Edwards JE, Moore RA, McQuay HJ. Opioids in chronic non-cancer pain: systematic review of efficacy and safety. Pain 2004;112:372–80.
18. Tuteja AK, Biskupiak J, Stoddard GJ, Lipman AG. Opioid-induced bowel disorders and narcotic bowel syndrome in patients with chronic non-cancer pain. Neurogastroenterol Motil 2010; 22:424–30, e96.
19. Brock C, Olesen SS, Olesen AE, et al. Opioid-induced bowel dysfunction: pathophysiology and management. Drugs 2012;72:1847–65.
20. Camilleri M. Opioid-induced constipation: challenges and therapeutic opportunities. Am J Gastroenterol 2011;106:835–42.
21. Candy B, Jones L, Goodman ML, et al. Laxatives or methylnaltrexone for the management of constipation in palliative care patients. Cochrane Database Syst Rev 2011(1):CD003448.
22. Ford AC, Brenner DM, Schoenfeld PS. Efficacy of pharmacological therapies for the treatment of opioid-induced constipation: systematic review and meta-analysis. Am J Gastroenterol 2013;108:1566–74.
23. Jansen JP, Lorch D, Langan J, et al. A randomized, placebo-controlled phase 3 trial (Study SB-767905/012) of alvimopan for opioid-induced bowel dysfunction in patients with non-cancer pain. J Pain 2011;12:185–93.
24. Camilleri M, Drossman DA, Becker G, et al. Emerging treatments in neurogastroenterology: a multidisciplinary working group consensus statement on opioid-induced constipation. Neurogastroenterol Motil 2014;26:1386–95.
25. Pottegard A, Knudsen TB, van Heesch K, et al. Information on risk of constipation for Danish users of opioids, and their laxative use. Int J Clin Pharm 2014;36:291–4.
26. Candy B, Jones L, Larkin PJ, et al. Laxatives for the management of constipation in people receiving palliative care. Cochrane Database Syst Rev 2015(5):CD003448.
From the Division of General Internal Medicine (Dr. Lenz), Division of Biomedical Statistics and Informatics (Mr. Schroeder), and the Division of Hospital Internal Medicine (Ms. Lawson and Dr. Yu), Mayo Clinic, Rochester, MN.
Abstract
- Objective: To describe prophylactic laxative effectiveness and prescribing patterns in patients initiated on intravenous (IV) opioid analgesia.
- Design: Retrospective cohort study.
- Setting and participants: All patients who were on IV narcotics with a patient-controlled pump while admitted to a general medicine service at the Mayo Clinic in Rochester in 2011 and 2012 were identified. Patients were excluded if constipation or diarrhea were diagnosed prior to IV opioid analgesia initiation.
- Measurements: Prophylactic laxatives were defined as laxatives prescribed within 24 hours of IV opioid analgesia initiation to be given even in the absence of constipation. Constipation was recorded when diagnosed during the hospitalization. Severe constipation was defined as constipation resulting in an abdominal CT or X-ray; abdominal distension, pain, or bloating; or if an enema was performed during the hospitalization.
- Results: Of 283 patients, 101 (36%) received prophylactic laxatives and 182 (64%) did not. Constipation occurred in 61 (34%) not on prophylactic laxatives and in 49 (49%) on prophylactic laxatives (P = 0.015). Severe constipation occurred in 23 (13%) not on prophylactic laxatives and in 33 (33%) on prophylactic laxatives (P < 0.001).
- Conclusion: A large percentage of patients are not receiving prophylactic laxatives when receiving IV opioid analgesia in the hospital. Current laxative strategies are not effectively preventing constipation in patients when prescribed.
Key words: constipation; opioids; hospital medicine; patient-controlled analgesia; laxatives.
Opioid-induced constipation (OIC) is defined as a change, when initiating opioid therapy, from baseline bowel habits and defecation patterns that is characterized by any of the following: reduced bowel frequency; development or worsening of straining; a sense of incomplete evacuation; or a patient’s perception of distress related to bowel habits [1]. It is an important side effect to consider when initiating narcotic analgesia. It has been estimated that approximately 3% to 4% of the population is on chronic narcotic pain relievers in the outpatient setting [2,3], and 37% to 81% of these patients will experience constipation [3–9]. Because of the high incidence of constipation, the prophylactic prescription of laxatives with initiation of opioid pain relievers is frequently recommended [10–15]. Furthermore, it has been shown that among patients admitted to the hospital with cancer, there is a lower incidence of constipation amongst those who have received prophylactic laxatives [16]. However, there is no evidence in the literature that prophylactic laxatives improve outcomes in patients on opioid analgesia in the general medicine inpatient setting. Furthermore, studies have illustrated that recommendations for prophylactic laxative use are not reliably followed [3,9].
While the incidence of OIC is well described in the outpatient setting [17,18], there are few studies looking at the incidence of OIC in the hospital setting. It has been shown, however, that occurrence during even a brief hospitalization is possible [4,6]. Acute constipation while hospitalized can theoretically lead to longer hospitalizations, increased pain, and decreased quality of life [6,7,19]. Recent research has focused heavily on the use of novel agents such as peripherally acting mu-opioid receptor antagonists in the treatment of OIC [20–23]. However, the expense of these agents makes them less than ideal in the prophylactic setting. This study will assess the effectiveness and prescribing patterns of prophylactic laxatives in the inpatient general medicine setting over a 2-year period at our institution in patients initiated on patient-controlled analgesia with hydromorphone, morphine, or fentanyl.
Methods
This study was approved by the institutional review board at the Mayo Clinic Rochester. All patients who were initiated on intravenous analgesia with an electronic patient-controlled opioid pump (PCA) while admitted to a general medicine service in 2011 and 2012 were identified. Patients who received PCA therapy were identified through a pharmacy database. Only patients older than 18 years of age were included in the study. PCA therapy was selected for our analysis because PCA therapy is not regularly administered on an outpatient basis. All of these patients, therefore, had a change in their narcotic regimen on admission to the hospital. Patients were excluded from the study if they were on a PCA for less than 24 hours; had a PCA initiated on a service other than a general medicine service; were on a scheduled laxative regimen prior to admission; or carried a diagnosis of bowel obstruction, chronic diarrhea, constipation, or intestinal discontinuity (eg, those with previous diversions or ostomies).
A retrospective review of each patient’s chart was conducted with the assistance of a team of nurse abstractors. Basic demographic data were recorded for each patient. Date of hospital admission and discharge; scheduled laxatives ordered and administered (any dose of sennosides, polyethylene glycol, docusate, bisacodyl, lactulose, or magnesium citrate); abdominal X-rays and abdominal CT scans performed for constipation; and any administration of enemas were recorded. Fiber supplements were not considered laxatives. If a patient was documented to have constipation during their hospitalization this was recorded. Patients were classified as having severe constipation if an abdominal CT or x-ray was performed for the indication of constipation; if abdominal distension, pain, or bloating were documented due to constipation; or if an enema was performed during the hospitalization.
For analysis purposes, patients who started receiving scheduled laxatives (as opposed to laxatives “as needed”)on or before the day of PCA initiation were classified as receiving prophylactic laxatives. Baseline patient characteristics and outcomes were compared using the chi-square test for nominal variables and the rank sum test for continuous variables. In all cases, 2-tailed tests were performed with P values ≤ 0.05 considered statistically significant. A nominal logistic regression model was utilized to assess for independent association of risk factors with the outcome of constipation.
Results
Discussion
Patients initiated on opioid therapy were not prescribed prophylactic laxatives in 64% of our cohort in the inpatient setting. When prescribed, current laxative strategies did not effectively prevent constipation with 49% experiencing OIC. Our data serves as a strong reminder of the magnitude of the problem of OIC in the inpatient setting.
The strength of our paper lies in its role as a magnitude assessment. This retrospective review reveals for that among a diverse group of patients hospitalized within a large academic institution, OIC remains prevalent. Furthermore, the high incidence of severe constipation indicates the potential for increased health care costs and patient discomfort secondary to OIC emphasizing the importance of prevention of OIC. Recent guidelines have made a push toward prophylactic laxative utilization earlier. Specifically, the European Palliative Research Collaborative offers a “strong recommendation to routinely prescribe laxatives for the management or prophylaxis of opioid-induced constipation” [10]. Additionally, the American Society of Interventional Pain Physicians suggests that “a physician should consider the initiation of a bowel regimen even before the development of constipation and definitely after the development of constipation” [11]. Our manuscript serves as a reminder that OIC remains a very prevalent problem and that prophylactic laxatives are still being underutilized.
This is a retrospective study and thus has inherent limitations. Specifically, we are limited to those cases of constipation that were documented in the medical record. The presentation of constipation is varied between patients. This variation in presentation of OIC is inherent to the disease process as is demonstrated in the broad definition for OIC [1]. The cases of constipation that we are reporting clearly were bothersome enough to warrant documentation in the medical record, and while there may have been cases that escaped documentation, we can be confident that the cases of OIC we are reporting are true cases of OIC. The numbers we report can therefore be taken to represent a minimum number of cases of constipation occurring in our study population.
It has been suggested that OIC prevalence varies with type of opioid and duration of opioid therapy [24]. We did not compare dose, type, or duration of opioid therapy in this study. This could certainly account for the seemingly higher rate of constipation within the group treated with prophylactic laxatives as compared with those not treated with prophylactic laxatives. Physicians likely have a higher propensity to prescribe prophylactic laxatives to patients receiving high doses of opioids who are in turn at higher risk for OIC. We cannot say whether differences in efficacy exist between prophylactic laxative regimens or which opioids (dose and duration) cause the most constipation based upon our data. Future studies incorporating dose, duration, and opioid type along with the variables we collected in this study could potentially construct successful logistic regression models with predictive power to identify those at highest risk of OIC.
Our rate of OIC is consistent with previously published figures [3–9]. However, we demonstrate for the first time that prophylactic laxatives are prescribed infrequently and unsuccessfully in the inpatient setting. This is consistent with prescribing rates in the outpatient setting [9,25]. Furthermore, we observed a higher rate of constipation in those treated with prophylactic laxatives compared to those that did not receive prophylactic laxatives. Pottegard et al similarly demonstrated an increased rate of constipation in those utilizing laxative therapy [25]. This is likely secondary to providers recommending prophylactic laxatives to those patients most likely to develop constipation. Despite being able to recognize high-risk patients, providers are unable to prevent OIC as little is known regarding optimal laxative strategies. Previous studies comparing treatment regimens for the relief of constipation in the palliative care population have been largely inconclusive [26]. There have been no studies to date comparing different prophylactic laxatives in the inpatient setting.
Future directions for research in this area would ideally take the form of randomized controlled trials investigating efficacy of different prophylactic laxatives in the inpatient setting. These trials would ideally include well-defined patient groups receiving specific narcotics for specific reasons. These studies would be best if powered to assess the effect of narcotic dosage and duration of therapy as well. Alternatively, larger retrospective chart reviews could be performed including narcotic dosage, type, and duration of therapy with a planned logistic regression model attempting to account for likely independent variables.
Conclusion
Our study demonstrates for the first time that prophylactic laxatives are not being prescribed frequently to patients on opioid analgesia in the inpatient general medicine setting. Additionally, while providers seem to be identifying patients at higher risk of constipation, they are still unable to prevent constipation in a high percentage of patients. Further research into this area would be beneficial to prevent this uncomfortable, costly, and preventable complication of opioid analgesia.
Corresponding author: Roger Yu, MD, Mayo Clinic, 200 First St. SW, Rochester, MN 55905, [email protected].
Funding/support: This research was supported by the Mayo Clinic Return to Work program nurses for data abstraction.
Financial disclosures: None.
1. Mearin F, Lacy BE, Chang L, et al. Bowel disorders. Gastroenterology 2016.
2. Boudreau D, Von Korff M, Rutter CM, et al. Trends in long-term opioid therapy for chronic non-cancer pain. Pharmacoepidemiol Drug Saf 2009;18:1166–75.
3. Choung RS, Locke GR 3rd, Zinsmeister AR, et al. Opioid bowel dysfunction and narcotic bowel syndrome: a population-based study. Am J Gastroenterol 2009;104:1199–204.
4. Droney J, Ross J, Gretton S, et al. Constipation in cancer patients on morphine. Support Care Cancer 2008;16:453–9.
5. Sykes NP. The relationship between opioid use and laxative use in terminally ill cancer patients. Palliat Med 1998;12:375–82.
6. Bell TJ, Panchal SJ, Miaskowski C, et al. The prevalence, severity, and impact of opioid-induced bowel dysfunction: results of a US and European Patient Survey (PROBE 1). Pain Med 2009;10:35–42.
7. Cook SF, Lanza L, Zhou X, et al. Gastrointestinal side effects in chronic opioid users: results from a population-based survey. Aliment Pharmacol Ther 2008;27:1224–32.
8. Moore RA, McQuay HJ. Prevalence of opioid adverse events in chronic non-malignant pain: systematic review of randomised trials of oral opioids. Arthritis Res Ther 2005:7:R1046–51.
9. Bouvy ML, Buurma H, Egberts TC. Laxative prescribing in relation to opioid use and the influence of pharmacy-based intervention. J Clin Pharm Ther 2002;27:107–10.
10. Caraceni A, Hanks G, Kaasa S, et al. Use of opioid analgesics in the treatment of cancer pain: evidence-based recommendations from the EAPC. Lancet Oncol 2012:13:e58–68.
11. Manchikanti L, Abdi S, Atluri S, et al. American Society of Interventional Pain Physicians (ASIPP) guidelines for responsible opioid prescribing in chronic non-cancer pain: Part 2--guidance. Pain Physician 2012;15(3 Suppl):S67–116.
12. Cameron JC. Constipation related to narcotic therapy. A protocol for nurses and patients. Cancer Nurs 1992;15:372–7.
13. Levy MH. Pharmacologic treatment of cancer pain. N Engl J Med 1996;335:1124–32.
14. Swegle JM, Logemann D. Management of common opioid-induced adverse effects. Am Fam Physician 2006;74:1347–54.
15. Donnelly S, Davis MP, Walsh D, Naughton M. Morphine in cancer pain management: a practical guide. Support Care Cancer 2002;10:13–35.
16. Ishihara M, Ikesue H Matsunaga H, et al. A multi-institutional study analyzing effect of prophylactic medication for prevention of opioid-induced gastrointestinal dysfunction. Clin J Pain 2012;28:373–81.
17. Kalso E, Edwards JE, Moore RA, McQuay HJ. Opioids in chronic non-cancer pain: systematic review of efficacy and safety. Pain 2004;112:372–80.
18. Tuteja AK, Biskupiak J, Stoddard GJ, Lipman AG. Opioid-induced bowel disorders and narcotic bowel syndrome in patients with chronic non-cancer pain. Neurogastroenterol Motil 2010; 22:424–30, e96.
19. Brock C, Olesen SS, Olesen AE, et al. Opioid-induced bowel dysfunction: pathophysiology and management. Drugs 2012;72:1847–65.
20. Camilleri M. Opioid-induced constipation: challenges and therapeutic opportunities. Am J Gastroenterol 2011;106:835–42.
21. Candy B, Jones L, Goodman ML, et al. Laxatives or methylnaltrexone for the management of constipation in palliative care patients. Cochrane Database Syst Rev 2011(1):CD003448.
22. Ford AC, Brenner DM, Schoenfeld PS. Efficacy of pharmacological therapies for the treatment of opioid-induced constipation: systematic review and meta-analysis. Am J Gastroenterol 2013;108:1566–74.
23. Jansen JP, Lorch D, Langan J, et al. A randomized, placebo-controlled phase 3 trial (Study SB-767905/012) of alvimopan for opioid-induced bowel dysfunction in patients with non-cancer pain. J Pain 2011;12:185–93.
24. Camilleri M, Drossman DA, Becker G, et al. Emerging treatments in neurogastroenterology: a multidisciplinary working group consensus statement on opioid-induced constipation. Neurogastroenterol Motil 2014;26:1386–95.
25. Pottegard A, Knudsen TB, van Heesch K, et al. Information on risk of constipation for Danish users of opioids, and their laxative use. Int J Clin Pharm 2014;36:291–4.
26. Candy B, Jones L, Larkin PJ, et al. Laxatives for the management of constipation in people receiving palliative care. Cochrane Database Syst Rev 2015(5):CD003448.
Patient-Reported Outcome Measures: How Do Digital Tablets Stack Up to Paper Forms? A Randomized, Controlled Study
Over the past several decades, patient-reported outcomes (PROs) have become increasingly important in assessing the quality and effectiveness of medical and surgical care.1,2 The benefit lies in the ability of PROs to characterize the impact of medical interventions on symptoms, function, and other outcomes from the patient’s perspective. Consequently, clinical practices can improve patients’ objective findings (from radiographic and clinical examinations) as well as their preferences in a social-psychological context.2,3 As a patient’s satisfaction with a surgical intervention may not correlate with the surgeon’s objective assessment of outcome, PROs offer unique insight into the patient’s perceptions of well-being.4
Health-related quality-of-life assessments can be made with either general-health or disease-specific instruments. These instruments traditionally are administered with pen and paper—a data collection method with several limitations, chief being the need to manually transfer the data into an electronic medical record, a research database, or both. In addition, administering surveys on paper risks potential disqualification of partially or incorrectly completed surveys. With pen and paper, it is difficult to mandate that every question be answered accurately.
Currently, there is a potential role for electronic medical records and digital tablet devices in survey administration and data collection and storage. Theoretical advantages include direct input of survey data into databases (eliminating manual data entry and associated entry errors), improved accuracy and completion rates, and long-term storage not dependent on paper charts.5To our knowledge, there have been no prospective studies of different orthopedic outcomes collection methods. Some studies have evaluated use of touch-based tablets in data collection. Dy and colleagues6 considered administration of the DASH (Disabilities of the Arm, Shoulder, and Hand) survey on an iPad tablet (Apple Computers) and retrospectively compared the tablet and paper completion rates. The tablet group’s rate (98%) was significantly higher than the paper group’s rate (76%). Aktas and colleagues7 reported a high completion rate for a tablet survey of palliative care outcomes (they did not compare modalities). A handful of other studies have found higher intraclass correlation and validation for digital data collection than for paper collection.7-14 The comparability of the data collected digitally vs on paper was the nidus for our decision to prospectively evaluate the ease and reliability of digital data collection.
We conducted a prospective, randomized study to compare the performance of tablet and paper versions of several general-health and musculoskeletal disease–specific questionnaires. We hypothesized the tablet and paper surveys would have similar completion rates and times.
Methods
This study was approved by our Institutional Review Board. Participants were recruited during their clinic visit to 3 subspecialty orthopedic services (upper extremity, spine, arthroplasty). The questionnaires included basic demographics questions and questions about tablet use (comfort level with computers, measured on a Likert scale ranging from 1 (strongly disagree) to 5 (strongly agree), and ownership of a tablet or smartphone). Also included were European Quality of Life–5 Dimensions (EQ-5D, General Health), a disease questionnaire specific to 1 of the 3 subspecialty services, and a satisfaction survey. Patients were asked to complete the Oswestry Disability Index (ODI) for low-back pain, the Neck Disability Index (NDI) for neck pain, the Hip Disability and Osteoarthritis Outcomes Score (HOOS) for hip pain, the Knee Injury and Osteoarthritis Outcomes Score (KOOS) for knee pain, or the QuickDASH survey for upper extremity complaints (subspecialty-specific). After recruitment, a computer-generated randomization technique was used to randomly assign patients to either a paper or an electronic (iPad) data collection group.15 We included all surveys for which patients had sufficient completion time (no clinic staff interruptions) and excluded surveys marked incomplete (because of interruptions for clinic workflow efficiency). For direct input from tablets and for data storage, we used the Research Electronic Data Capture (REDCap) system hosted at our institution.16 Our staff registered patients as REDCap participants, assigned them to their disease-specific study arms, and gave them tablets to use to complete the surveys.
Patients who were randomly assigned to take the surveys on paper were given a packet that included the demographics survey, the EQ-5D, a disease-specific survey, and a satisfaction survey. Their responses were then manually entered by the investigators into the REDCap system.
Patients who were randomly assigned to take the surveys on tablets used the REDCap survey feature, which allowed them to directly input their responses into the database (Figure). 
Our primary outcome measure was survey completion rate. Secondary outcome measures were total time for completion, number of questions left unanswered on incomplete surveys, patient satisfaction with survey length (Likert scale, 1-5), ease of completion (Likert scale, 1-5), ability to comprehend questions (Likert scale, 1-5), and preference for the other survey modality (Appendix). 
We used SPSS statistical software (IBM) to analyze our data, t test to compare continuous variables, χ2 test to compare categorical variables, and linear regression to test the relationship between number of questions and completion rate. Statistical significance was set at P < .05.
Results
Of the 510 patients enrolled in the study, 483 completed the initial demographics questionnaire and were included in the analysis. Patients were excluded if they were unable to complete the initial demographics questionnaire because of clinic workflow (eg, immediate need to be seen by physician, need to transfer to radiology for imaging and not being able to revisit the survey). Mean age was 56 years (range, 14-93 years), and 51% of the respondents were female. Fifty percent owned tablets, 70% owned smartphones, and mean (SD) self-rating of computer skills was 3.13 (1.16) (Likert scale, 1-5). There were no significant demographic differences between the tablet and paper groups (Table 1). 
For each disease-specific questionnaire, the instrument’s published instructions for calculating scores were followed; these scores were then compared in order to further characterize the groups. There were significant differences in scores on the EQ-5D descriptive questions, a pain visual analog scale (VAS), and the NDI. Mean EQ-5D score was 0.664 for the tablet group and 0.699 for the paper group (P = .041), mean pain VAS score was 62.5 for the tablet group and 71.6 for the paper group (P < .001), and mean NDI score was 42.8 for the tablet group and 32.4 for the paper group (P = .033). 
The overall completion rate for all questionnaires was 84.4%. The KOOS completion rate was 83.3% for the tablet group and 54.5% for the paper group (P = .023). Although it was not statistically significant, there was a trend toward higher rates of completing all disease-specific questionnaires in the tablet group relative to the paper group. 
Satisfaction regarding the surveys and their modalities was similar between the groups. 
Discussion
Electronic data entry has many advantages over traditional paper-based data collection and can be used with PRO surveys to measure response to treatment. Our study evaluated whether completion rates differed between surveys administered on digital tablets and those administered on traditional paper forms in a clinic setting. We selected general-health and disease-specific instruments commonly used to collect PROs from orthopedic patients. Our primary outcome measure was survey completion rate. Secondary outcome measures were total time for completion, number of questions left unanswered on incomplete surveys, patient satisfaction, and survey preferences.
In this study, our tablet and paper groups had similar overall survey completion rates, which suggests digital tablet-based data collection is noninferior to traditional pen-and-paper data collection with respect to patient response rate in the clinical setting. It is worth emphasizing that the tablet surveys were made to resemble and function as much as possible like the paper surveys. For example, patients were allowed to select multiple answers as well as advance without answering a question. Paper surveys were mimicked so we could study inherent differences in patient responsiveness without adding digital features to prevent patients from selecting multiple answers or skipping questions. We postulate that adding these digital features could have introduced a significant difference in patient responsiveness.
Time for survey completion was not significantly different between the tablet and paper groups, demonstrating that data can be digitally collected and the aforementioned advantages realized without significant delay or clinic workflow disruption. In the future, patients may be able to complete their forms digitally, on their own devices, before arriving for their clinic visits—resulting in improved clinic workflow and data collection efficiency.
Scores computed for the health-related quality-of-life questionnaires were not significantly different between the tablet and paper groups, except for EQ-5D and NDI. Although statistically significant, the 0.035 difference between the groups’ EQ-5D scores (0.664, 0.699) is not clinically significant. (Pickard and colleagues17 established that 0.06 is the clinically significant difference between EQ-5D scores in the United States.) If there were any clinical difference in the present study, our paper group patients appeared to be in better health than our tablet group patients.
Patients’ motivation to complete surveys often plays a large role in meaningful rates of completion. On our subjective satisfaction survey, a larger percentage of patients reported they would prefer to use a tablet for future surveys (Table 4). This finding may be driven by the novelty or ease of using a popular device. Nevertheless, we think it is worthwhile to heed patient preferences, as they may point to more successful data collection and compliance.
Several other studies have compared electronic and paper data capture.6,7,9-14,18-22 Dy and colleagues6 reported on administering the DASH survey on an iPad tablet using REDCap in an outpatient setting. They found that the percentage of surveys that could be scored (<3 questions left unanswered) was significantly higher for their tablet group (98%) than their paper group (76%). The larger difference in survey completion rates in their study (vs ours) may be attributable to their use of DASH, which has more survey items (compared with QuickDASH, the instrument we used) and thus may be more sensitive to detecting differences, at the risk of increasing the burden on survey takers.23 Aktas and colleagues7 conducted a similar but smaller study of completion rates, completion times, and overall practicality of using digital tablets to collect PROs in a palliative care clinic (they did not compare tablet and paper modalities). Marsh and colleagues,12 who studied the agreement between data collected on electronic and paper versions of the WOMAC (Western Ontario and McMaster Universities) Osteoarthritis Index and the SF-12 (12-item Short Form Health Survey, Version 2) after total hip and total knee arthroplasty, found a high intraclass correlation coefficient between the 2 methods. Griffiths-Jones and colleagues11 also found a high degree of agreement between patient data collected on digital and paper surveys. In a similar study, Fanning and McAuley10 compared digital tablet and paper survey administration in an older population and found a higher percentage of preference for tablets, with ease of use and anxiety during survey completion correlating with preference. These findings mirror ours, even with our inclusion of patients in a broader age range.
Strengths of our study included its overall cohort size and the variety of measurement instruments used. In addition, we measured time for survey completion to assess the practicality of tablet-based data collection and refrained from using digital features that could have artificially improved the completion rate for this survey modality.
Our study had a few limitations. First, we recruited unequal numbers of patients from the different subspecialties—a result of each subspecialty having a different number of attending physicians and a different patient volume. Given randomization and use of similar patients across the study arms, however, this likely did not present any significant bias. Second, each patient completed a tablet survey or a paper survey but not both, and therefore we could not compare a patient’s performance on the 2 modalities. However, the burden of completing the same survey more than once likely would have lowered our participation rate and introduced additional biases we wanted to avoid. Third, despite our attempt to mimic the look of a paper survey, the tablet’s user interface presented several potential difficulties. For example, its small text and small answer buttons may have been limiting for patients with poor vision. These design features emphasize the importance of having a user interface that can be adapted to the individual, regardless of handicap. Indeed, adaptability is a potential strength of digital interfaces. For adaptability, an interface designer can use large, scalable text and add audio prompts and other features.
Our findings can be useful in evaluating patient responsiveness to surveys administered on digital tablets in an outpatient clinic setting. In this prospective, randomized study, we found that, for survey completion, use of a tablet device did not require more time than use of a paper form. In addition, the administration modalities had similar completion and error rates for a variety of orthopedic outcomes surveys. We did not activate digital features that would have given unfair advantage to the digital data collection modality. We also found a strong preference for use of technology in PRO data collection, and this may help improve collection rates. Last, though optimizing the flow of patients in our clinic was not a strict research metric, we prioritized making sure patients were not spending any more time completing these surveys than in the past. Given the potential benefits of digital surveys—immediate and accurate transfer of collected data into multiple databases, including the patient’s electronic medical record—our experience supports continuing validation of these instruments for potential wider use.
Am J Orthop. 2016;45(7):E451-E457. Copyright Frontline Medical Communications Inc. 2016. All rights reserved.
1. Howie L, Hirsch B, Locklear T, Abernethy AP. Assessing the value of patient-generated data to comparative effectiveness research. Health Aff (Millwood). 2014;33(7):1220-1228.
2. Higginson IJ, Carr AJ. Measuring quality of life: using quality of life measures in the clinical setting. BMJ. 2001;322(7297):1297-1300.
3. Revicki D, Hays RD, Cella D, Sloan J. Recommended methods for determining responsiveness and minimally important differences for patient-reported outcomes. J Clin Epidemiol. 2008;61(2):102-109.
4. Guyatt GH, Feeny DH, Patrick DL. Measuring health-related quality of life. Ann Intern Med. 1993;118(8):622-629.
5. Paudel D, Ahmed M, Pradhan A, Lal Dangol R. Successful use of tablet personal computers and wireless technologies for the 2011 Nepal Demographic and Health Survey. Glob Heal Sci Pract. 2013;1(2):277-284.
6. Dy CJ, Schmicker T, Tran Q, Chadwick B, Daluiski A. The use of a tablet computer to complete the DASH questionnaire. J Hand Surg Am. 2012;37(12):2589-2594.
7. Aktas A, Hullihen B, Shrotriya S, Thomas S, Walsh D, Estfan B. Connected health: cancer symptom and quality-of-life assessment using a tablet computer: a pilot study. Am J Hosp Palliat Care. 2015;32(2):189-197.
8. Basnov M, Kongsved SM, Bech P, Hjollund NH. Reliability of Short Form-36 in an internet- and a pen-and-paper version. Inform Health Soc Care. 2009;34(1):53-58.
9. Bellamy N, Wilson C, Hendrikz J, et al; EDC Study Group. Osteoarthritis Index delivered by mobile phone (m-WOMAC) is valid, reliable, and responsive. J Clin Epidemiol. 2011;64(2):182-190.
10. Fanning J, McAuley E. A comparison of tablet computer and paper-based questionnaires in healthy aging research. JMIR Res Protoc. 2014;3(3):e38.
11. Griffiths-Jones W, Norton MR, Fern ED, Williams DH. The equivalence of remote electronic and paper patient reported outcome (PRO) collection. J Arthroplasty. 2014;29(11):2136-2139.
12. Marsh JD, Bryant DM, Macdonald SJ, Naudie DD. Patients respond similarly to paper and electronic versions of the WOMAC and SF-12 following total joint arthroplasty. J Arthroplasty. 2014;29(4):670-673.
13. Olajos-Clow J, Minard J, Szpiro K, et al. Validation of an electronic version of the Mini Asthma Quality of Life Questionnaire. Respir Med. 2010;104(5):658-667.
14. Shervin N, Dorrwachter J, Bragdon CR, Shervin D, Zurakowski D, Malchau H. Comparison of paper and computer-based questionnaire modes for measuring health outcomes in patients undergoing total hip arthroplasty. J Bone Joint Surg Am. 2011;93(3):285-293.
15. Suresh K. An overview of randomization techniques: an unbiased assessment of outcome in clinical research. J Hum Reprod Sci. 2011;4(1):8-11.
16. Harris PA, Taylor R, Thielke R, Payne J, Gonzalez N, Conde JG. Research electronic data capture (REDCap)—a metadata-driven methodology and workflow process for providing translational research informatics support. J Biomed Inform. 2009;42(2):377-381.
17. Pickard AS, Neary MP, Cella D. Estimation of minimally important differences in EQ-5D utility and VAS scores in cancer. Health Qual Life Outcomes. 2007;5:70.
18. Abdel Messih M, Naylor JM, Descallar J, Manickam A, Mittal R, Harris IA. Mail versus telephone administration of the Oxford Knee and Hip Scores. J Arthroplasty. 2014;29(3):491-494.
19. Kongsved SM, Basnov M, Holm-Christensen K, Hjollund NH. Response rate and completeness of questionnaires: a randomized study of internet versus paper-and-pencil versions. J Med Internet Res. 2007;9(3):e25.
20. Theiler R, Bischoff-Ferrari HA, Good M, Bellamy N. Responsiveness of the electronic touch screen WOMAC 3.1 OA Index in a short term clinical trial with rofecoxib. Osteoarthritis Cartilage. 2004;12(11):912-916.
21. Ryan JM, Corry JR, Attewell R, Smithson MJ. A comparison of an electronic version of the SF-36 General Health Questionnaire to the standard paper version. Qual Life Res. 2002;11(1):19-26.
22. Wilson AS, Kitas GD, Carruthers DM, et al. Computerized information-gathering in specialist rheumatology clinics: an initial evaluation of an electronic version of the Short Form 36. Rheumatology. 2002;41(3):268-273.
23. Angst F, Goldhahn J, Drerup S, Flury M, Schwyzer HK, Simmen BR. How sharp is the short QuickDASH? A refined content and validity analysis of the Short Form of the Disabilities of the Shoulder, Arm and Hand questionnaire in the strata of symptoms and function and specific joint conditions. Qual Life Res. 2009;18(8):1043-1051.
Over the past several decades, patient-reported outcomes (PROs) have become increasingly important in assessing the quality and effectiveness of medical and surgical care.1,2 The benefit lies in the ability of PROs to characterize the impact of medical interventions on symptoms, function, and other outcomes from the patient’s perspective. Consequently, clinical practices can improve patients’ objective findings (from radiographic and clinical examinations) as well as their preferences in a social-psychological context.2,3 As a patient’s satisfaction with a surgical intervention may not correlate with the surgeon’s objective assessment of outcome, PROs offer unique insight into the patient’s perceptions of well-being.4
Health-related quality-of-life assessments can be made with either general-health or disease-specific instruments. These instruments traditionally are administered with pen and paper—a data collection method with several limitations, chief being the need to manually transfer the data into an electronic medical record, a research database, or both. In addition, administering surveys on paper risks potential disqualification of partially or incorrectly completed surveys. With pen and paper, it is difficult to mandate that every question be answered accurately.
Currently, there is a potential role for electronic medical records and digital tablet devices in survey administration and data collection and storage. Theoretical advantages include direct input of survey data into databases (eliminating manual data entry and associated entry errors), improved accuracy and completion rates, and long-term storage not dependent on paper charts.5To our knowledge, there have been no prospective studies of different orthopedic outcomes collection methods. Some studies have evaluated use of touch-based tablets in data collection. Dy and colleagues6 considered administration of the DASH (Disabilities of the Arm, Shoulder, and Hand) survey on an iPad tablet (Apple Computers) and retrospectively compared the tablet and paper completion rates. The tablet group’s rate (98%) was significantly higher than the paper group’s rate (76%). Aktas and colleagues7 reported a high completion rate for a tablet survey of palliative care outcomes (they did not compare modalities). A handful of other studies have found higher intraclass correlation and validation for digital data collection than for paper collection.7-14 The comparability of the data collected digitally vs on paper was the nidus for our decision to prospectively evaluate the ease and reliability of digital data collection.
We conducted a prospective, randomized study to compare the performance of tablet and paper versions of several general-health and musculoskeletal disease–specific questionnaires. We hypothesized the tablet and paper surveys would have similar completion rates and times.
Methods
This study was approved by our Institutional Review Board. Participants were recruited during their clinic visit to 3 subspecialty orthopedic services (upper extremity, spine, arthroplasty). The questionnaires included basic demographics questions and questions about tablet use (comfort level with computers, measured on a Likert scale ranging from 1 (strongly disagree) to 5 (strongly agree), and ownership of a tablet or smartphone). Also included were European Quality of Life–5 Dimensions (EQ-5D, General Health), a disease questionnaire specific to 1 of the 3 subspecialty services, and a satisfaction survey. Patients were asked to complete the Oswestry Disability Index (ODI) for low-back pain, the Neck Disability Index (NDI) for neck pain, the Hip Disability and Osteoarthritis Outcomes Score (HOOS) for hip pain, the Knee Injury and Osteoarthritis Outcomes Score (KOOS) for knee pain, or the QuickDASH survey for upper extremity complaints (subspecialty-specific). After recruitment, a computer-generated randomization technique was used to randomly assign patients to either a paper or an electronic (iPad) data collection group.15 We included all surveys for which patients had sufficient completion time (no clinic staff interruptions) and excluded surveys marked incomplete (because of interruptions for clinic workflow efficiency). For direct input from tablets and for data storage, we used the Research Electronic Data Capture (REDCap) system hosted at our institution.16 Our staff registered patients as REDCap participants, assigned them to their disease-specific study arms, and gave them tablets to use to complete the surveys.
Patients who were randomly assigned to take the surveys on paper were given a packet that included the demographics survey, the EQ-5D, a disease-specific survey, and a satisfaction survey. Their responses were then manually entered by the investigators into the REDCap system.
Patients who were randomly assigned to take the surveys on tablets used the REDCap survey feature, which allowed them to directly input their responses into the database (Figure).
Our primary outcome measure was survey completion rate. Secondary outcome measures were total time for completion, number of questions left unanswered on incomplete surveys, patient satisfaction with survey length (Likert scale, 1-5), ease of completion (Likert scale, 1-5), ability to comprehend questions (Likert scale, 1-5), and preference for the other survey modality (Appendix).
We used SPSS statistical software (IBM) to analyze our data, t test to compare continuous variables, χ2 test to compare categorical variables, and linear regression to test the relationship between number of questions and completion rate. Statistical significance was set at P < .05.
Results
Of the 510 patients enrolled in the study, 483 completed the initial demographics questionnaire and were included in the analysis. Patients were excluded if they were unable to complete the initial demographics questionnaire because of clinic workflow (eg, immediate need to be seen by physician, need to transfer to radiology for imaging and not being able to revisit the survey). Mean age was 56 years (range, 14-93 years), and 51% of the respondents were female. Fifty percent owned tablets, 70% owned smartphones, and mean (SD) self-rating of computer skills was 3.13 (1.16) (Likert scale, 1-5). There were no significant demographic differences between the tablet and paper groups (Table 1).
For each disease-specific questionnaire, the instrument’s published instructions for calculating scores were followed; these scores were then compared in order to further characterize the groups. There were significant differences in scores on the EQ-5D descriptive questions, a pain visual analog scale (VAS), and the NDI. Mean EQ-5D score was 0.664 for the tablet group and 0.699 for the paper group (P = .041), mean pain VAS score was 62.5 for the tablet group and 71.6 for the paper group (P < .001), and mean NDI score was 42.8 for the tablet group and 32.4 for the paper group (P = .033).
The overall completion rate for all questionnaires was 84.4%. The KOOS completion rate was 83.3% for the tablet group and 54.5% for the paper group (P = .023). Although it was not statistically significant, there was a trend toward higher rates of completing all disease-specific questionnaires in the tablet group relative to the paper group.
Satisfaction regarding the surveys and their modalities was similar between the groups.
Discussion
Electronic data entry has many advantages over traditional paper-based data collection and can be used with PRO surveys to measure response to treatment. Our study evaluated whether completion rates differed between surveys administered on digital tablets and those administered on traditional paper forms in a clinic setting. We selected general-health and disease-specific instruments commonly used to collect PROs from orthopedic patients. Our primary outcome measure was survey completion rate. Secondary outcome measures were total time for completion, number of questions left unanswered on incomplete surveys, patient satisfaction, and survey preferences.
In this study, our tablet and paper groups had similar overall survey completion rates, which suggests digital tablet-based data collection is noninferior to traditional pen-and-paper data collection with respect to patient response rate in the clinical setting. It is worth emphasizing that the tablet surveys were made to resemble and function as much as possible like the paper surveys. For example, patients were allowed to select multiple answers as well as advance without answering a question. Paper surveys were mimicked so we could study inherent differences in patient responsiveness without adding digital features to prevent patients from selecting multiple answers or skipping questions. We postulate that adding these digital features could have introduced a significant difference in patient responsiveness.
Time for survey completion was not significantly different between the tablet and paper groups, demonstrating that data can be digitally collected and the aforementioned advantages realized without significant delay or clinic workflow disruption. In the future, patients may be able to complete their forms digitally, on their own devices, before arriving for their clinic visits—resulting in improved clinic workflow and data collection efficiency.
Scores computed for the health-related quality-of-life questionnaires were not significantly different between the tablet and paper groups, except for EQ-5D and NDI. Although statistically significant, the 0.035 difference between the groups’ EQ-5D scores (0.664, 0.699) is not clinically significant. (Pickard and colleagues17 established that 0.06 is the clinically significant difference between EQ-5D scores in the United States.) If there were any clinical difference in the present study, our paper group patients appeared to be in better health than our tablet group patients.
Patients’ motivation to complete surveys often plays a large role in meaningful rates of completion. On our subjective satisfaction survey, a larger percentage of patients reported they would prefer to use a tablet for future surveys (Table 4). This finding may be driven by the novelty or ease of using a popular device. Nevertheless, we think it is worthwhile to heed patient preferences, as they may point to more successful data collection and compliance.
Several other studies have compared electronic and paper data capture.6,7,9-14,18-22 Dy and colleagues6 reported on administering the DASH survey on an iPad tablet using REDCap in an outpatient setting. They found that the percentage of surveys that could be scored (<3 questions left unanswered) was significantly higher for their tablet group (98%) than their paper group (76%). The larger difference in survey completion rates in their study (vs ours) may be attributable to their use of DASH, which has more survey items (compared with QuickDASH, the instrument we used) and thus may be more sensitive to detecting differences, at the risk of increasing the burden on survey takers.23 Aktas and colleagues7 conducted a similar but smaller study of completion rates, completion times, and overall practicality of using digital tablets to collect PROs in a palliative care clinic (they did not compare tablet and paper modalities). Marsh and colleagues,12 who studied the agreement between data collected on electronic and paper versions of the WOMAC (Western Ontario and McMaster Universities) Osteoarthritis Index and the SF-12 (12-item Short Form Health Survey, Version 2) after total hip and total knee arthroplasty, found a high intraclass correlation coefficient between the 2 methods. Griffiths-Jones and colleagues11 also found a high degree of agreement between patient data collected on digital and paper surveys. In a similar study, Fanning and McAuley10 compared digital tablet and paper survey administration in an older population and found a higher percentage of preference for tablets, with ease of use and anxiety during survey completion correlating with preference. These findings mirror ours, even with our inclusion of patients in a broader age range.
Strengths of our study included its overall cohort size and the variety of measurement instruments used. In addition, we measured time for survey completion to assess the practicality of tablet-based data collection and refrained from using digital features that could have artificially improved the completion rate for this survey modality.
Our study had a few limitations. First, we recruited unequal numbers of patients from the different subspecialties—a result of each subspecialty having a different number of attending physicians and a different patient volume. Given randomization and use of similar patients across the study arms, however, this likely did not present any significant bias. Second, each patient completed a tablet survey or a paper survey but not both, and therefore we could not compare a patient’s performance on the 2 modalities. However, the burden of completing the same survey more than once likely would have lowered our participation rate and introduced additional biases we wanted to avoid. Third, despite our attempt to mimic the look of a paper survey, the tablet’s user interface presented several potential difficulties. For example, its small text and small answer buttons may have been limiting for patients with poor vision. These design features emphasize the importance of having a user interface that can be adapted to the individual, regardless of handicap. Indeed, adaptability is a potential strength of digital interfaces. For adaptability, an interface designer can use large, scalable text and add audio prompts and other features.
Our findings can be useful in evaluating patient responsiveness to surveys administered on digital tablets in an outpatient clinic setting. In this prospective, randomized study, we found that, for survey completion, use of a tablet device did not require more time than use of a paper form. In addition, the administration modalities had similar completion and error rates for a variety of orthopedic outcomes surveys. We did not activate digital features that would have given unfair advantage to the digital data collection modality. We also found a strong preference for use of technology in PRO data collection, and this may help improve collection rates. Last, though optimizing the flow of patients in our clinic was not a strict research metric, we prioritized making sure patients were not spending any more time completing these surveys than in the past. Given the potential benefits of digital surveys—immediate and accurate transfer of collected data into multiple databases, including the patient’s electronic medical record—our experience supports continuing validation of these instruments for potential wider use.
Am J Orthop. 2016;45(7):E451-E457. Copyright Frontline Medical Communications Inc. 2016. All rights reserved.
1. Howie L, Hirsch B, Locklear T, Abernethy AP. Assessing the value of patient-generated data to comparative effectiveness research. Health Aff (Millwood). 2014;33(7):1220-1228.
2. Higginson IJ, Carr AJ. Measuring quality of life: using quality of life measures in the clinical setting. BMJ. 2001;322(7297):1297-1300.
3. Revicki D, Hays RD, Cella D, Sloan J. Recommended methods for determining responsiveness and minimally important differences for patient-reported outcomes. J Clin Epidemiol. 2008;61(2):102-109.
4. Guyatt GH, Feeny DH, Patrick DL. Measuring health-related quality of life. Ann Intern Med. 1993;118(8):622-629.
5. Paudel D, Ahmed M, Pradhan A, Lal Dangol R. Successful use of tablet personal computers and wireless technologies for the 2011 Nepal Demographic and Health Survey. Glob Heal Sci Pract. 2013;1(2):277-284.
6. Dy CJ, Schmicker T, Tran Q, Chadwick B, Daluiski A. The use of a tablet computer to complete the DASH questionnaire. J Hand Surg Am. 2012;37(12):2589-2594.
7. Aktas A, Hullihen B, Shrotriya S, Thomas S, Walsh D, Estfan B. Connected health: cancer symptom and quality-of-life assessment using a tablet computer: a pilot study. Am J Hosp Palliat Care. 2015;32(2):189-197.
8. Basnov M, Kongsved SM, Bech P, Hjollund NH. Reliability of Short Form-36 in an internet- and a pen-and-paper version. Inform Health Soc Care. 2009;34(1):53-58.
9. Bellamy N, Wilson C, Hendrikz J, et al; EDC Study Group. Osteoarthritis Index delivered by mobile phone (m-WOMAC) is valid, reliable, and responsive. J Clin Epidemiol. 2011;64(2):182-190.
10. Fanning J, McAuley E. A comparison of tablet computer and paper-based questionnaires in healthy aging research. JMIR Res Protoc. 2014;3(3):e38.
11. Griffiths-Jones W, Norton MR, Fern ED, Williams DH. The equivalence of remote electronic and paper patient reported outcome (PRO) collection. J Arthroplasty. 2014;29(11):2136-2139.
12. Marsh JD, Bryant DM, Macdonald SJ, Naudie DD. Patients respond similarly to paper and electronic versions of the WOMAC and SF-12 following total joint arthroplasty. J Arthroplasty. 2014;29(4):670-673.
13. Olajos-Clow J, Minard J, Szpiro K, et al. Validation of an electronic version of the Mini Asthma Quality of Life Questionnaire. Respir Med. 2010;104(5):658-667.
14. Shervin N, Dorrwachter J, Bragdon CR, Shervin D, Zurakowski D, Malchau H. Comparison of paper and computer-based questionnaire modes for measuring health outcomes in patients undergoing total hip arthroplasty. J Bone Joint Surg Am. 2011;93(3):285-293.
15. Suresh K. An overview of randomization techniques: an unbiased assessment of outcome in clinical research. J Hum Reprod Sci. 2011;4(1):8-11.
16. Harris PA, Taylor R, Thielke R, Payne J, Gonzalez N, Conde JG. Research electronic data capture (REDCap)—a metadata-driven methodology and workflow process for providing translational research informatics support. J Biomed Inform. 2009;42(2):377-381.
17. Pickard AS, Neary MP, Cella D. Estimation of minimally important differences in EQ-5D utility and VAS scores in cancer. Health Qual Life Outcomes. 2007;5:70.
18. Abdel Messih M, Naylor JM, Descallar J, Manickam A, Mittal R, Harris IA. Mail versus telephone administration of the Oxford Knee and Hip Scores. J Arthroplasty. 2014;29(3):491-494.
19. Kongsved SM, Basnov M, Holm-Christensen K, Hjollund NH. Response rate and completeness of questionnaires: a randomized study of internet versus paper-and-pencil versions. J Med Internet Res. 2007;9(3):e25.
20. Theiler R, Bischoff-Ferrari HA, Good M, Bellamy N. Responsiveness of the electronic touch screen WOMAC 3.1 OA Index in a short term clinical trial with rofecoxib. Osteoarthritis Cartilage. 2004;12(11):912-916.
21. Ryan JM, Corry JR, Attewell R, Smithson MJ. A comparison of an electronic version of the SF-36 General Health Questionnaire to the standard paper version. Qual Life Res. 2002;11(1):19-26.
22. Wilson AS, Kitas GD, Carruthers DM, et al. Computerized information-gathering in specialist rheumatology clinics: an initial evaluation of an electronic version of the Short Form 36. Rheumatology. 2002;41(3):268-273.
23. Angst F, Goldhahn J, Drerup S, Flury M, Schwyzer HK, Simmen BR. How sharp is the short QuickDASH? A refined content and validity analysis of the Short Form of the Disabilities of the Shoulder, Arm and Hand questionnaire in the strata of symptoms and function and specific joint conditions. Qual Life Res. 2009;18(8):1043-1051.