User login
Predicting Readmissions from EHR Data
Unplanned hospital readmissions are frequent, costly, and potentially avoidable.[1, 2] Due to major federal financial readmissions penalties targeting excessive 30‐day readmissions, there is increasing attention to implementing hospital‐initiated interventions to reduce readmissions.[3, 4] However, universal enrollment of all hospitalized patients into such programs may be too resource intensive for many hospitals.[5] To optimize efficiency and effectiveness, interventions should be targeted to individuals most likely to benefit.[6, 7] However, existing readmission risk‐prediction models have achieved only modest discrimination, have largely used administrative claims data not available until months after discharge, or are limited to only a subset of patients with Medicare or a specific clinical condition.[8, 9, 10, 11, 12, 13, 14] These limitations have precluded accurate identification of high‐risk individuals in an all‐payer general medical inpatient population to provide actionable information for intervention prior to discharge.
Approaches using electronic health record (EHR) data could allow early identification of high‐risk patients during the index hospitalization to enable initiation of interventions prior to discharge. To date, such strategies have relied largely on EHR data from the day of admission.[15, 16] However, given that variation in 30‐day readmission rates are thought to reflect the quality of in‐hospital care, incorporating EHR data from the entire hospital stay to reflect hospital care processes and clinical trajectory may more accurately identify at‐risk patients.[17, 18, 19, 20] Improved accuracy in risk prediction would help better target intervention efforts in the immediate postdischarge period, an interval characterized by heightened vulnerability for adverse events.[21]
To help hospitals target transitional care interventions more effectively to high‐risk individuals prior to discharge, we derived and validated a readmissions risk‐prediction model incorporating EHR data from the entire course of the index hospitalization, which we termed the full‐stay EHR model. We also compared the full‐stay EHR model performance to our group's previously derived prediction model based on EHR data on the day of admission, termed the first‐day EHR model, as well as to 2 other validated readmission models similarly intended to yield near real‐time risk predictions prior to or shortly after hospital discharge.[9, 10, 15]
METHODS
Study Design, Population, and Data Sources
We conducted an observational cohort study using EHR data from 6 hospitals in the DallasFort Worth metroplex between November 1, 2009 and October 30, 2010 using the same EHR system (Epic Systems Corp., Verona, WI). One site was a university‐affiliated safety net hospital; the remaining 5 sites were teaching and nonteaching community sites.
We included consecutive hospitalizations among adults 18 years old discharged alive from any medicine inpatient service. For individuals with multiple hospitalizations during the study period, we included only the first hospitalization. We excluded individuals who died during the index hospitalization, were transferred to another acute care facility, left against medical advice, or who died outside of the hospital within 30 days of discharge. For model derivation, we randomly split the sample into separate derivation (50%) and validation cohorts (50%).
Outcomes
The primary outcome was 30‐day hospital readmission, defined as a nonelective hospitalization within 30 days of discharge to any of 75 acute care hospitals within a 100‐mile radius of Dallas, ascertained from an all‐payer regional hospitalization database. Nonelective hospitalizations included all hospitalizations classified as a emergency, urgent, or trauma, and excluded those classified as elective as per the Centers for Medicare and Medicaid Services Claim Inpatient Admission Type Code definitions.
Predictor Variables for the Full‐Stay EHR Model
The full‐stay EHR model was iteratively developed from our group's previously derived and validated risk‐prediction model using EHR data available on admission (first‐day EHR model).[15] For the full‐stay EHR model, we included all predictor variables included in our published first‐day EHR model as candidate risk factors. Based on prior literature, we additionally expanded candidate predictors available on admission to include marital status (proxy for social isolation) and socioeconomic disadvantage (percent poverty, unemployment, median income, and educational attainment by zip code of residence as proxy measures of the social and built environment).[22, 23, 24, 25, 26, 27] We also expanded the ascertainment of prior hospitalization to include admissions at both the index hospital and any of 75 acute care hospitals from the same, separate all‐payer regional hospitalization database used to ascertain 30‐day readmissions.
Candidate predictors from the remainder of the hospital stay (ie, following the first 24 hours of admission) were included if they were: (1) available in the EHR of all participating hospitals, (2) routinely collected or available at the time of hospital discharge, and (3) plausible predictors of adverse outcomes based on prior literature and clinical expertise. These included length of stay, in‐hospital complications, transfer to an intensive or coronary care unit, blood transfusions, vital sign instabilities within 24 hours of discharge, select laboratory values at time of discharge, and disposition status. We also assessed trajectories of vital signs and selected laboratory values (defined as changes in these measures from admission to discharge).
Statistical Analysis
Model Derivation
Univariate relationships between readmission and each of the candidate predictors were assessed in the derivation cohort using a prespecified significance threshold of P 0.05. We included all factors from our previously derived and validated first‐day EHR model as candidate predictors.[15] Continuous laboratory and vital sign values at the time of discharge were categorized based on clinically meaningful cutoffs; predictors with missing values were assumed to be normal (1% missing for each variable). Significant univariate candidate variables were entered in a multivariate logistic regression model using stepwise backward selection with a prespecified significance threshold of P 0.05. We performed several sensitivity analyses to confirm the robustness of our model. First, we alternately derived the full‐stay model using stepwise forward selection. Second, we forced in all significant variables from our first‐day EHR model, and entered the candidate variables from the remainder of the hospital stay using both stepwise backward and forward selection separately. Third, prespecified interactions between variables were evaluated for inclusion. Though final predictors varied slightly between the different approaches, discrimination of each model was similar to the model derived using our primary analytic approach (C statistics 0.01, data not shown).
Model Validation
We assessed model discrimination and calibration of the derived full‐stay EHR model using the validation cohort. Model discrimination was estimated by the C statistic. The C statistic represents the probability that, given 2 hospitalized individuals (1 who was readmitted and the other who was not), the model will predict a higher risk for the readmitted patient than for the nonreadmitted patient. Model calibration was assessed by comparing predicted to observed probabilities of readmission by quintiles of risk, and with the Hosmer‐Lemeshow goodness‐of‐fit test.
Comparison to Existing Models
We compared the full‐stay EHR model performance to 3 previously published models: our group's first‐day EHR model, and the LACE (includes Length of stay, Acute (nonelective) admission status, Charlson Comorbidity Index, and Emergency department visits in the past year) and HOSPITAL (includes Hemoglobin at discharge, discharge from Oncology service, Sodium level at discharge, Procedure during index hospitalization, Index hospitalization Type (nonelective), number of Admissions in the past year, and Length of stay) models, which were both derived to predict 30‐day readmissions among general medical inpatients and were intended to help clinicians identify high‐risk patients to target for discharge interventions.[9, 10, 15] We assessed each model's performance in our validation cohort, calculating the C statistic, integrated discrimination index (IDI), and net reclassification index (NRI) compared to the full‐stay model. IDI is a summary measure of both discrimination and reclassification, where more positive values suggest improvement in model performance in both these domains compared to a reference model.[28] The NRI is defined as the sum of the net proportions of correctly reclassified persons with and without the event of interest.[29] The theoretical range of values is 2 to 2, with more positive values indicating improved net reclassification compared to a reference model. Here, we calculated a category‐based NRI to evaluate the performance of models in correctly classifying individuals with and without readmissions into the highest readmission risk quintile versus the lowest 4 risk quintiles compared to the full‐stay EHR model.[29] This prespecified cutoff is relevant for hospitals interested in identifying the highest‐risk individuals for targeted intervention.[6] Because some hospitals may be able to target a greater number of individuals for intervention, we performed a sensitivity analysis by assessing category‐based NRI for reclassification into the top 2 risk quintiles versus the lowest 3 risk quintiles and found no meaningful difference in our results (data not shown). Finally, we qualitatively assessed calibration of comparator models in our validation cohort by comparing predicted probability to observed probability of readmission by quintiles of risk for each model. We conducted all analyses using Stata 12.1 (StataCorp, College Station, TX). This study was approved by the UT Southwestern Medical Center institutional review board.
RESULTS
Overall, 32,922 index hospitalizations were included in our study cohort; 12.7% resulted in a 30‐day readmission (see Supporting Figure 1 in the online version of this article). Individuals had a mean age of 62 years and had diverse race/ethnicity and primary insurance status; half were female (Table 1). The study sample was randomly split into a derivation cohort (50%, n = 16,492) and validation cohort (50%, n = 16,430). Individuals in the derivation cohort with a 30‐day readmission had markedly different socioeconomic and clinical characteristics compared to those not readmitted (Table 1).
| Entire Cohort, N = 32,922 | Derivation Cohort, N = 16,492 | |||
|---|---|---|---|---|
|
No Readmission, N = 14,312 |
Readmission, N = 2,180 |
P Value | ||
| ||||
| Demographic characteristics | ||||
| Age, y, mean (SD) | 62 (17.3) | 61 (17.4) | 64 (17.0) | 0.001 |
| Female, n (%) | 17,715 (53.8) | 7,694 (53.8) | 1,163 (53.3) | 0.72 |
| Race/ethnicity | 0.001 | |||
| White | 21,359 (64.9) | 9,329 (65.2) | 1,361 (62.4) | |
| Black | 5,964 (18.1) | 2,520 (17.6) | 434 (19.9) | |
| Hispanic | 4,452 (13.5) | 1,931 (13.5) | 338 (15.5) | |
| Other | 1,147 (3.5) | 532 (3.7) | 47 (2.2) | |
| Marital status, n (%) | 0.001 | |||
| Single | 8,076 (24.5) | 3,516 (24.6) | 514 (23.6) | |
| Married | 13,394 (40.7) | 5,950 (41.6) | 812 (37.3) | |
| Separated/divorced | 3,468 (10.5) | 1,460 (10.2) | 251 (11.5) | |
| Widowed | 4,487 (13.7) | 1,868 (13.1) | 388 (17.8) | |
| Other | 3,497 (10.6) | 1,518 (10.6) | 215 (9.9) | |
| Primary payer, n (%) | 0.001 | |||
| Private | 13,090 (39.8) | 5,855 (40.9) | 726 (33.3) | |
| Medicare | 13,015 (39.5) | 5,597 (39.1) | 987 (45.3) | |
| Medicaid | 2,204 (6.7) | 852 (5.9) | 242 (11.1) | |
| Charity, self‐pay, or other | 4,613 (14.0) | 2,008 (14.0) | 225 (10.3) | |
| High‐poverty neighborhood, n (%)* | 7,468 (22.7) | 3,208 (22.4) | 548 (25.1) | 0.001 |
| Utilization history | ||||
| 1 ED visits in past year, n (%) | 9,299 (28.2) | 3,793 (26.5) | 823 (37.8) | 0.001 |
| 1 hospitalizations in past year, n (%) | 10,189 (30.9) | 4,074 (28.5) | 1,012 (46.4) | 0.001 |
| Clinical factors from first day of hospitalization | ||||
| Nonelective admission, n (%) | 27,818 (84.5) | 11,960 (83.6) | 1,960 (89.9) | 0.001 |
| Charlson Comorbidity Index, median (IQR)∥ | 0 (01) | 0 (00) | 0 (03) | 0.001 |
| Laboratory abnormalities within 24 hours of admission | ||||
| Albumin 2 g/dL | 355 (1.1) | 119 (0.8) | 46 (2.1) | 0.001 |
| Albumin 23 g/dL | 4,732 (14.4) | 1,956 (13.7) | 458 (21.0) | 0.001 |
| Aspartate aminotransferase >40 U/L | 4,610 (14.0) | 1,922 (13.4) | 383 (17.6) | 0.001 |
| Creatine phosphokinase 60 g/L | 3,728 (11.3) | 1,536 (10.7) | 330 (15.1) | 0.001 |
| Mean corpuscular volume >100 fL/red cell | 1,346 (4.1) | 537 (3.8) | 134 (6.2) | 0.001 |
| Platelets 90 103/L | 912 (2.8) | 357 (2.5) | 116 (5.3) | 0.001 |
| Platelets >350 103/L | 3,332 (10.1) | 1,433 (10.0) | 283 (13.0) | 0.001 |
| Prothrombin time >35 seconds | 248 (0.8) | 90 (0.6) | 35 (1.6) | 0.001 |
| Clinical factors from remainder of hospital stay | ||||
| Length of stay, d, median (IQR) | 4 (26) | 4 (26) | 5 (38) | 0.001 |
| ICU transfer after first 24 hours, n (%) | 988 (3.0) | 408 (2.9) | 94 (4.3) | 0.001 |
| Hospital complications, n (%) | ||||
| Clostridium difficile infection | 119 (0.4) | 44 (0.3) | 24 (1.1) | 0.001 |
| Pressure ulcer | 358 (1.1) | 126 (0.9) | 46 (2.1) | 0.001 |
| Venous thromboembolism | 301 (0.9) | 112 (0.8) | 34 (1.6) | 0.001 |
| Respiratory failure | 1,048 (3.2) | 463 (3.2) | 112 (5.1) | 0.001 |
| Central line‐associated bloodstream infection | 22 (0.07) | 6 (0.04) | 5 (0.23) | 0.005 |
| Catheter‐associated urinary tract infection | 47 (0.14) | 20 (0.14) | 6 (0.28) | 0.15 |
| Acute myocardial infarction | 293 (0.9) | 110 (0.8) | 32 (1.5) | 0.001 |
| Pneumonia | 1,754 (5.3) | 719 (5.0) | 154 (7.1) | 0.001 |
| Sepsis | 853 (2.6) | 368 (2.6) | 73 (3.4) | 0.04 |
| Blood transfusion during hospitalization, n (%) | 4,511 (13.7) | 1,837 (12.8) | 425 (19.5) | 0.001 |
| Laboratory abnormalities at discharge# | ||||
| Blood urea nitrogen >20 mg/dL, n (%) | 10,014 (30.4) | 4,077 (28.5) | 929 (42.6) | 0.001 |
| Sodium 135 mEq/L, n (%) | 4,583 (13.9) | 1,850 (12.9) | 440 (20.2) | 0.001 |
| Hematocrit 27 | 3,104 (9.4) | 1,231 (8.6) | 287 (13.2) | 0.001 |
| 1 vital sign instability at discharge, n (%)# | 6,192 (18.8) | 2,624 (18.3) | 525 (24.1) | 0.001 |
| Discharge location, n (%) | 0.001 | |||
| Home | 23,339 (70.9) | 10,282 (71.8) | 1,383 (63.4) | |
| Home health | 3,185 (9.7) | 1,356 (9.5) | 234 (10.7) | |
| Postacute care** | 5,990 (18.2) | 2,496 (17.4) | 549 (25.2) | |
| Hospice | 408 (1.2) | 178 (1.2) | 14 (0.6) | |
Derivation and Validation of the Full‐Stay EHR Model for 30‐Day Readmission
Our final model included 24 independent variables, including demographic characteristics, utilization history, clinical factors from the first day of admission, and clinical factors from the remainder of the hospital stay (Table 2). The strongest independent predictor of readmission was hospital‐acquired Clostridium difficile infection (adjusted odds ratio [AOR]: 2.03, 95% confidence interval [CI] 1.18‐3.48); other hospital‐acquired complications including pressure ulcers and venous thromboembolism were also significant predictors. Though having Medicaid was associated with increased odds of readmission (AOR: 1.55, 95% CI: 1.31‐1.83), other zip codelevel measures of socioeconomic disadvantage were not predictive and were not included in the final model. Being discharged to hospice was associated with markedly lower odds of readmission (AOR: 0.23, 95% CI: 0.13‐0.40).
| Odds Ratio (95% CI) | ||
|---|---|---|
| Univariate | Multivariate* | |
| ||
| Demographic characteristics | ||
| Age, per 10 years | 1.08 (1.051.11) | 1.07 (1.041.10) |
| Medicaid | 1.97 (1.702.29) | 1.55 (1.311.83) |
| Widow | 1.44 (1.281.63) | 1.27 (1.111.45) |
| Utilization history | ||
| Prior ED visit, per visit | 1.08 (1.061.10) | 1.04 (1.021.06) |
| Prior hospitalization, per hospitalization | 1.30 (1.271.34) | 1.16 (1.121.20) |
| Hospital and clinical factors from first day of hospitalization | ||
| Nonelective admission | 1.75 (1.512.03) | 1.42 (1.221.65) |
| Charlson Comorbidity Index, per point | 1.19 (1.171.21) | 1.06 (1.041.09) |
| Laboratory abnormalities within 24 hours of admission | ||
| Albumin 2 g/dL | 2.57 (1.823.62) | 1.52 (1.052.21) |
| Albumin 23 g/dL | 1.68 (1.501.88) | 1.20 (1.061.36) |
| Aspartate aminotransferase >40 U/L | 1.37 (1.221.55) | 1.21 (1.061.38) |
| Creatine phosphokinase 60 g/L | 1.48 (1.301.69) | 1.28 (1.111.46) |
| Mean corpuscular volume >100 fL/red cell | 1.68 (1.382.04) | 1.32 (1.071.62) |
| Platelets 90 103/L | 2.20 (1.772.72) | 1.56 (1.231.97) |
| Platelets >350 103/L | 1.34 (1.171.54) | 1.24 (1.081.44) |
| Prothrombin time >35 seconds | 2.58 (1.743.82) | 1.92 (1.272.90) |
| Hospital and clinical factors from remainder of hospital stay | ||
| Length of stay, per day | 1.08 (1.071.09) | 1.06 (1.041.07) |
| Hospital complications | ||
| Clostridium difficile infection | 3.61 (2.195.95) | 2.03 (1.183.48) |
| Pressure ulcer | 2.43 (1.733.41) | 1.64 (1.152.34) |
| Venous thromboembolism | 2.01 (1.362.96) | 1.55 (1.032.32) |
| Laboratory abnormalities at discharge | ||
| Blood urea nitrogen >20 mg/dL | 1.86 (1.702.04) | 1.37 (1.241.52) |
| Sodium 135 mEq/L | 1.70 (1.521.91) | 1.34 (1.181.51) |
| Hematocrit 27 | 1.61 (1.401.85) | 1.22 (1.051.41) |
| Vital sign instability at discharge, per instability | 1.29 (1.201.40) | 1.25 (1.151.36) |
| Discharged to hospice | 0.51 (0.300.89) | 0.23 (0.130.40) |
In our validation cohort, the full‐stay EHR model had fair discrimination, with a C statistic of 0.69 (95% CI: 0.68‐0.70) (Table 3). The full‐stay EHR model was well calibrated across all quintiles of risk, with slight overestimation of predicted risk in the lowest and highest quintiles (Figure 1a) (see Supporting Table 5 in the online version of this article). It also effectively stratified individuals across a broad range of predicted readmission risk from 4.1% in the lowest decile to 36.5% in the highest decile (Table 3).
| Model Name | C‐Statistic (95% CI) | IDI, % (95% CI) | NRI (95% CI) | Average Predicted Risk, % | |
|---|---|---|---|---|---|
| Lowest Decile | Highest Decile | ||||
| |||||
| Full‐stay EHR model | |||||
| Derivation cohort | 0.72 (0.70 to 0.73) | 4.1 | 36.5 | ||
| Validation cohort | 0.69 (0.68 to 0.70) | [Reference] | [Reference] | 4.1 | 36.5 |
| First‐day EHR model | 0.67 (0.66 to 0.68) | 1.2 (1.4 to 1.0) | 0.020 (0.038 to 0.002) | 5.8 | 31.9 |
| LACE model | 0.65 (0.64 to 0.66) | 2.6 (2.9 to 2.3) | 0.046 (0.067 to 0.024) | 6.1 | 27.5 |
| HOSPITAL model | 0.64 (0.62 to 0.65) | 3.2 (3.5 to 2.9) | 0.058 (0.080 to 0.035) | 6.7 | 26.6 |

Comparing the Performance of the Full‐Stay EHR Model to Other Models
The full‐stay EHR model had better discrimination compared to the first‐day EHR model and the LACE and HOSPITAL models, though the magnitude of improvement was modest (Table 3). The full‐stay EHR model also stratified individuals across a broader range of readmission risk, and was better able to discriminate and classify those in the highest quintile of risk from those in the lowest 4 quintiles of risk compared to other models as assessed by the IDI and NRI (Table 3) (see Supporting Tables 14 and Supporting Figure 2 in the online version of this article). In terms of model calibration, both the first‐day EHR and LACE models were also well calibrated, whereas the HOSPITAL model was less robust (Figure 1).
The diagnostic accuracy of the full‐stay EHR model in correctly predicting those in the highest quintile of risk was better than that of the first‐day, LACE, and HOSPITAL models, though overall improvements in the sensitivity, specificity, positive and negative predictive values, and positive and negative likelihood ratios were also modest (see Supporting Table 6 in the online version of this article).
DISCUSSION
In this study, we used clinically detailed EHR data from the entire hospitalization on 32,922 individuals treated in 6 diverse hospitals to develop an all‐payer, multicondition readmission risk‐prediction model. To our knowledge, this is the first 30‐day hospital readmission risk‐prediction model to use a comprehensive set of factors from EHR data from the entire hospital stay. Prior EHR‐based models have focused exclusively on data available on or prior to the first day of admission, which account for clinical severity on admission but do not account for factors uncovered during the inpatient stay that influence the chance of a postdischarge adverse outcome.[15, 30] We specifically assessed the prognostic impact of a comprehensive set of factors from the entire index hospitalization, including hospital‐acquired complications, clinical trajectory, and stability on discharge in predicting hospital readmissions. Our full‐stay EHR model had statistically better discrimination, calibration, and diagnostic accuracy than our existing all‐cause first‐day EHR model[15] and 2 previously published readmissions models that included more limited information from hospitalization (such as length of stay).[9, 10] However, although the more complicated full‐stay EHR model was statistically better than previously published models, we were surprised that the predictive performance was only modestly improved despite the inclusion of many additional clinically relevant prognostic factors.
Taken together, our study has several important implications. First, the added complexity and resource intensity of implementing a full‐stay EHR model yields only modestly improved readmission risk prediction. Thus, hospitals and healthcare systems interested in targeting their highest‐risk individuals for interventions to reduce 30‐day readmission should consider doing so within the first day of hospital admission. Our group's previously derived and validated first‐day EHR model, which used data only from the first day of admission, qualitatively performed nearly as well as the full‐stay EHR model.[15] Additionally, a recent study using only preadmission EHR data to predict 30‐day readmissions also achieved similar discrimination and diagnostic accuracy as our full‐stay model.[30]
Second, the field of readmissions risk‐prediction modeling may be reaching the maximum achievable model performance using data that are currently available in the EHR. Our limited ability to accurately predict all‐cause 30‐day readmission risk may reflect the influence of currently unmeasured patient, system, and community factors on readmissions.[31, 32, 33] Due to the constraints of data collected in the EHR, we were unable to include several patient‐level clinical characteristics associated with hospital readmission, including self‐perceived health status, functional impairment, and cognition.[33, 34, 35, 36] However, given their modest effect sizes (ORs ranging from 1.062.10), adequately measuring and including these risk factors in our model may not meaningfully improve model performance and diagnostic accuracy. Further, many social and behavioral patient‐level factors are also not consistently available in EHR data. Though we explored the role of several neighborhood‐level socioeconomic measuresincluding prevalence of poverty, median income, education, and unemploymentwe found that none were significantly associated with 30‐day readmissions. These particular measures may have been inadequate to characterize individual‐level social and behavioral factors, as several previous studies have demonstrated that patient‐level factors such as social support, substance abuse, and medication and visit adherence can influence readmission risk in heart failure and pneumonia.[11, 16, 22, 25] This underscores the need for more standardized routine collection of data across functional, social, and behavioral domains in clinical settings, as recently championed by the Institute of Medicine.[11, 37] Integrating data from outside the EHR on postdischarge health behaviors, self‐management, follow‐up care, recovery, and home environment may be another important but untapped strategy for further improving prediction of readmissions.[25, 38]
Third, a multicondition readmission risk‐prediction model may be a less effective strategy than more customized disease‐specific models for selected conditions associated with high 30‐day readmission rates. Our group's previously derived and internally validated models for heart failure and human immunodeficiency virus had superior discrimination compared to our full‐stay EHR model (C statistic of 0.72 for each).[11, 13] However, given differences in the included population and time periods studied, a head‐to‐head comparison of these different strategies is needed to assess differences in model performance and utility.
Our study had several strengths. To our knowledge, this is the first study to rigorously measure the additive influence of in‐hospital complications, clinical trajectory, and stability on discharge on the risk of 30‐day hospital readmission. Additionally, our study included a large, diverse study population that included all payers, all ages of adults, a mix of community, academic, and safety net hospitals, and individuals from a broad array of racial/ethnic and socioeconomic backgrounds.
Our results should be interpreted in light of several limitations. First, though we sought to represent a diverse group of hospitals, all study sites were located within north Texas and generalizability to other regions is uncertain. Second, our ascertainment of prior hospitalizations and readmissions was more inclusive than what could be typically accomplished in real time using only EHR data from a single clinical site. We performed a sensitivity analysis using only prior utilization data available within the EHR from the index hospital with no meaningful difference in our findings (data not shown). Additionally, a recent study found that 30‐day readmissions occur at the index hospital for over 75% of events, suggesting that 30‐day readmissions are fairly comprehensively captured even with only single‐site data.[39] Third, we were not able to include data on outpatient visits before or after the index hospitalization, which may influence the risk of readmission.[1, 40]
In conclusion, incorporating clinically granular EHR data from the entire course of hospitalization modestly improves prediction of 30‐day readmissions compared to models that only include information from the first 24 hours of hospital admission or models that use far fewer variables. However, given the limited improvement in prediction, our findings suggest that from the practical perspective of implementing real‐time models to identify those at highest risk for readmission, it may not be worth the added complexity of waiting until the end of a hospitalization to leverage additional data on hospital complications, and the trajectory of laboratory and vital sign values currently available in the EHR. Further improvement in prediction of readmissions will likely require accounting for psychosocial, functional, behavioral, and postdischarge factors not currently present in the inpatient EHR.
Disclosures: This study was presented at the Society of Hospital Medicine 2015 Annual Meeting in National Harbor, Maryland, and the Society of General Internal Medicine 2015 Annual Meeting in Toronto, Canada. This work was supported by the Agency for Healthcare Research and Qualityfunded UT Southwestern Center for Patient‐Centered Outcomes Research (1R24HS022418‐01) and the Commonwealth Foundation (#20100323). Drs. Nguyen and Makam received funding from the UT Southwestern KL2 Scholars Program (NIH/NCATS KL2 TR001103). Dr. Halm was also supported in part by NIH/NCATS U54 RFA‐TR‐12‐006. The study sponsors had no role in the design and conduct of the study; collection, management, analysis, and interpretation of the data; and preparation, review, or approval of the manuscript. The authors have no conflicts of interest to disclose.
- , , . Rehospitalizations among patients in the Medicare fee‐for‐service program. N Engl J Med. 2009;360(14):1418–1428.
- , , , , . Proportion of hospital readmissions deemed avoidable: a systematic review. CMAJ. 2011;183(7):E391–E402.
- , , , , , . Hospital‐initiated transitional care interventions as a patient safety strategy: a systematic review. Ann Intern Med. 2013;158(5 pt 2):433–440.
- , , , , . Interventions to reduce 30‐day rehospitalization: a systematic review. Ann Intern Med. 2011;155(8):520–528.
- , , , , , . Interventions to Improve Care Transitions at Hospital Discharge. Rockville, MD: Agency for Healthcare Research and Quality; 2013.
- , , , et al. Allocating scarce resources in real‐time to reduce heart failure readmissions: a prospective, controlled study. BMJ Qual Saf. 2013;22(12):998–1005.
- , , , , . Implementing electronic health care predictive analytics: considerations and challenges. Health Aff (Millwood). 2014;33(7):1148–1154.
- , , , et al. Risk prediction models for hospital readmission: a systematic review. JAMA. 2011;306(15):1688–1698.
- , , , et al. Derivation and validation of an index to predict early death or unplanned readmission after discharge from hospital to the community. CMAJ. 2010;182(6):551–557.
- , , , . Potentially avoidable 30‐day hospital readmissions in medical patients: derivation and validation of a prediction model. JAMA Intern Med. 2013;173(8):632–638.
- , , , et al. An automated model to identify heart failure patients at risk for 30‐day readmission or death using electronic medical record data. Med Care. 2010;48(11):981–988.
- , , , et al. An automated model using electronic medical record data identifies patients with cirrhosis at high risk for readmission. Clin Gastroenterol Hepatol. 2013;11(10):1335–1341.e1331.
- , , , , , . An electronic medical record‐based model to predict 30‐day risk of readmission and death among HIV‐infected inpatients. J Acquir Immune Defic Syndr. 2012;61(3):349–358.
- , , , et al. Development and use of an administrative claims measure for profiling hospital‐wide performance on 30‐day unplanned readmission. Ann Intern Med. 2014;161(10 suppl):S66–S75.
- , , , et al. Electronic medical record‐based multicondition models to predict the risk of 30 day readmission or death among adult medicine patients: validation and comparison to existing models. BMC Med Inform Decis Mak. 2015;15(1):39.
- , , , et al. Linking electronic health record‐extracted psychosocial data in real‐time to risk of readmission for heart failure. Psychosomatics. 2011;52(4):319–327.
- , . A conceptual framework for the study of early readmission as an indicator of quality of care. Soc Sci Med. 1996;43(11):1533–1541.
- , , , et al. Hospital readmission performance and patterns of readmission: retrospective cohort study of Medicare admissions. BMJ. 2013;347:f6571.
- , , , , , . Getting more performance from performance measurement. N Engl J Med. 2014;371(23):2145–2147.
- , , , et al. Hospital strategy uptake and reductions in unplanned readmission rates for patients with heart failure: a prospective study. J Gen Intern Med. 2015;30(5):605–611.
- . Post‐hospital syndrome—an acquired, transient condition of generalized risk. N Engl J Med. 2013;368(2):100–102.
- , , , et al. Impact of social factors on risk of readmission or mortality in pneumonia and heart failure: systematic review. J Gen Intern Med. 2013;28(2):269–282.
- , , , , , . Effect of clinical and social risk factors on hospital profiling for stroke readmission: a cohort study. Ann Intern Med. 2014;161(11):775–784.
- , , , et al. Neighborhood socioeconomic disadvantage and 30‐day rehospitalization: a retrospective cohort study. Ann Intern Med. 2014;161(11):765–774.
- , , , , , . Postdischarge environmental and socioeconomic factors and the likelihood of early hospital readmission among community‐dwelling Medicare beneficiaries. Gerontologist. 2008;48(4):495–504.
- , , . Socioeconomic status and readmissions: evidence from an urban teaching hospital. Health Aff (Millwood). 2014;33(5):778–785.
- , , , . Adding socioeconomic data to hospital readmissions calculations may produce more useful results. Health Aff (Millwood). 2014;33(5):786–791.
- , , , . Evaluating the added predictive ability of a new marker: from area under the ROC curve to reclassification and beyond. Stat Med. 2008;27(2):157–172; discussion 207–212.
- , , , , . Net reclassification improvement: computation, interpretation, and controversies: a literature review and clinician's guide. Ann Intern Med. 2014;160(2):122–131.
- , , , , , . Predicting 30‐day readmissions with preadmission electronic health record data. Med Care. 2015;53(3):283–289.
- , . Hospital readmissions—not just a measure of quality. JAMA. 2011;306(16):1796–1797.
- , . Thirty‐day readmissions—truth and consequences. N Engl J Med. 2012;366(15):1366–1369.
- , , , . Functional impairment and hospital readmission in medicare seniors. JAMA Intern Med. 2015;175(4):559–565.
- , , . Clinical and sociodemographic risk factors for readmission of Medicare beneficiaries. Health Care Financ Rev. 1988;10(1):27–36.
- , , , , , . Mini‐cog performance: novel marker of post discharge risk among patients hospitalized for heart failure. Circ Heart Fail. 2015;8(1):8–16.
- , , , , , . Association of impaired functional status at hospital discharge and subsequent rehospitalization. J Hosp Med. 2014;9(5):277–282.
- , . Patients in context—EHR capture of social and behavioral determinants of health. N Engl J Med. 2015;372(8):698–701.
- , , , , . Envisioning a social‐health information exchange as a platform to support a patient‐centered medical neighborhood: a feasibility study. J Gen Intern Med. 2015;30(1):60–67.
- , , , , , . Patient factors contributing to variation in same‐hospital readmission rate. Med Care Res Review. 2015;72(3):338–358.
- , , . Does increased access to primary care reduce hospital readmissions? Veterans Affairs Cooperative Study Group on Primary Care and Hospital Readmission. N Engl J Med. 1996;334(22):1441–1447.
Unplanned hospital readmissions are frequent, costly, and potentially avoidable.[1, 2] Due to major federal financial readmissions penalties targeting excessive 30‐day readmissions, there is increasing attention to implementing hospital‐initiated interventions to reduce readmissions.[3, 4] However, universal enrollment of all hospitalized patients into such programs may be too resource intensive for many hospitals.[5] To optimize efficiency and effectiveness, interventions should be targeted to individuals most likely to benefit.[6, 7] However, existing readmission risk‐prediction models have achieved only modest discrimination, have largely used administrative claims data not available until months after discharge, or are limited to only a subset of patients with Medicare or a specific clinical condition.[8, 9, 10, 11, 12, 13, 14] These limitations have precluded accurate identification of high‐risk individuals in an all‐payer general medical inpatient population to provide actionable information for intervention prior to discharge.
Approaches using electronic health record (EHR) data could allow early identification of high‐risk patients during the index hospitalization to enable initiation of interventions prior to discharge. To date, such strategies have relied largely on EHR data from the day of admission.[15, 16] However, given that variation in 30‐day readmission rates are thought to reflect the quality of in‐hospital care, incorporating EHR data from the entire hospital stay to reflect hospital care processes and clinical trajectory may more accurately identify at‐risk patients.[17, 18, 19, 20] Improved accuracy in risk prediction would help better target intervention efforts in the immediate postdischarge period, an interval characterized by heightened vulnerability for adverse events.[21]
To help hospitals target transitional care interventions more effectively to high‐risk individuals prior to discharge, we derived and validated a readmissions risk‐prediction model incorporating EHR data from the entire course of the index hospitalization, which we termed the full‐stay EHR model. We also compared the full‐stay EHR model performance to our group's previously derived prediction model based on EHR data on the day of admission, termed the first‐day EHR model, as well as to 2 other validated readmission models similarly intended to yield near real‐time risk predictions prior to or shortly after hospital discharge.[9, 10, 15]
METHODS
Study Design, Population, and Data Sources
We conducted an observational cohort study using EHR data from 6 hospitals in the DallasFort Worth metroplex between November 1, 2009 and October 30, 2010 using the same EHR system (Epic Systems Corp., Verona, WI). One site was a university‐affiliated safety net hospital; the remaining 5 sites were teaching and nonteaching community sites.
We included consecutive hospitalizations among adults 18 years old discharged alive from any medicine inpatient service. For individuals with multiple hospitalizations during the study period, we included only the first hospitalization. We excluded individuals who died during the index hospitalization, were transferred to another acute care facility, left against medical advice, or who died outside of the hospital within 30 days of discharge. For model derivation, we randomly split the sample into separate derivation (50%) and validation cohorts (50%).
Outcomes
The primary outcome was 30‐day hospital readmission, defined as a nonelective hospitalization within 30 days of discharge to any of 75 acute care hospitals within a 100‐mile radius of Dallas, ascertained from an all‐payer regional hospitalization database. Nonelective hospitalizations included all hospitalizations classified as a emergency, urgent, or trauma, and excluded those classified as elective as per the Centers for Medicare and Medicaid Services Claim Inpatient Admission Type Code definitions.
Predictor Variables for the Full‐Stay EHR Model
The full‐stay EHR model was iteratively developed from our group's previously derived and validated risk‐prediction model using EHR data available on admission (first‐day EHR model).[15] For the full‐stay EHR model, we included all predictor variables included in our published first‐day EHR model as candidate risk factors. Based on prior literature, we additionally expanded candidate predictors available on admission to include marital status (proxy for social isolation) and socioeconomic disadvantage (percent poverty, unemployment, median income, and educational attainment by zip code of residence as proxy measures of the social and built environment).[22, 23, 24, 25, 26, 27] We also expanded the ascertainment of prior hospitalization to include admissions at both the index hospital and any of 75 acute care hospitals from the same, separate all‐payer regional hospitalization database used to ascertain 30‐day readmissions.
Candidate predictors from the remainder of the hospital stay (ie, following the first 24 hours of admission) were included if they were: (1) available in the EHR of all participating hospitals, (2) routinely collected or available at the time of hospital discharge, and (3) plausible predictors of adverse outcomes based on prior literature and clinical expertise. These included length of stay, in‐hospital complications, transfer to an intensive or coronary care unit, blood transfusions, vital sign instabilities within 24 hours of discharge, select laboratory values at time of discharge, and disposition status. We also assessed trajectories of vital signs and selected laboratory values (defined as changes in these measures from admission to discharge).
Statistical Analysis
Model Derivation
Univariate relationships between readmission and each of the candidate predictors were assessed in the derivation cohort using a prespecified significance threshold of P 0.05. We included all factors from our previously derived and validated first‐day EHR model as candidate predictors.[15] Continuous laboratory and vital sign values at the time of discharge were categorized based on clinically meaningful cutoffs; predictors with missing values were assumed to be normal (1% missing for each variable). Significant univariate candidate variables were entered in a multivariate logistic regression model using stepwise backward selection with a prespecified significance threshold of P 0.05. We performed several sensitivity analyses to confirm the robustness of our model. First, we alternately derived the full‐stay model using stepwise forward selection. Second, we forced in all significant variables from our first‐day EHR model, and entered the candidate variables from the remainder of the hospital stay using both stepwise backward and forward selection separately. Third, prespecified interactions between variables were evaluated for inclusion. Though final predictors varied slightly between the different approaches, discrimination of each model was similar to the model derived using our primary analytic approach (C statistics 0.01, data not shown).
Model Validation
We assessed model discrimination and calibration of the derived full‐stay EHR model using the validation cohort. Model discrimination was estimated by the C statistic. The C statistic represents the probability that, given 2 hospitalized individuals (1 who was readmitted and the other who was not), the model will predict a higher risk for the readmitted patient than for the nonreadmitted patient. Model calibration was assessed by comparing predicted to observed probabilities of readmission by quintiles of risk, and with the Hosmer‐Lemeshow goodness‐of‐fit test.
Comparison to Existing Models
We compared the full‐stay EHR model performance to 3 previously published models: our group's first‐day EHR model, and the LACE (includes Length of stay, Acute (nonelective) admission status, Charlson Comorbidity Index, and Emergency department visits in the past year) and HOSPITAL (includes Hemoglobin at discharge, discharge from Oncology service, Sodium level at discharge, Procedure during index hospitalization, Index hospitalization Type (nonelective), number of Admissions in the past year, and Length of stay) models, which were both derived to predict 30‐day readmissions among general medical inpatients and were intended to help clinicians identify high‐risk patients to target for discharge interventions.[9, 10, 15] We assessed each model's performance in our validation cohort, calculating the C statistic, integrated discrimination index (IDI), and net reclassification index (NRI) compared to the full‐stay model. IDI is a summary measure of both discrimination and reclassification, where more positive values suggest improvement in model performance in both these domains compared to a reference model.[28] The NRI is defined as the sum of the net proportions of correctly reclassified persons with and without the event of interest.[29] The theoretical range of values is 2 to 2, with more positive values indicating improved net reclassification compared to a reference model. Here, we calculated a category‐based NRI to evaluate the performance of models in correctly classifying individuals with and without readmissions into the highest readmission risk quintile versus the lowest 4 risk quintiles compared to the full‐stay EHR model.[29] This prespecified cutoff is relevant for hospitals interested in identifying the highest‐risk individuals for targeted intervention.[6] Because some hospitals may be able to target a greater number of individuals for intervention, we performed a sensitivity analysis by assessing category‐based NRI for reclassification into the top 2 risk quintiles versus the lowest 3 risk quintiles and found no meaningful difference in our results (data not shown). Finally, we qualitatively assessed calibration of comparator models in our validation cohort by comparing predicted probability to observed probability of readmission by quintiles of risk for each model. We conducted all analyses using Stata 12.1 (StataCorp, College Station, TX). This study was approved by the UT Southwestern Medical Center institutional review board.
RESULTS
Overall, 32,922 index hospitalizations were included in our study cohort; 12.7% resulted in a 30‐day readmission (see Supporting Figure 1 in the online version of this article). Individuals had a mean age of 62 years and had diverse race/ethnicity and primary insurance status; half were female (Table 1). The study sample was randomly split into a derivation cohort (50%, n = 16,492) and validation cohort (50%, n = 16,430). Individuals in the derivation cohort with a 30‐day readmission had markedly different socioeconomic and clinical characteristics compared to those not readmitted (Table 1).
| Entire Cohort, N = 32,922 | Derivation Cohort, N = 16,492 | |||
|---|---|---|---|---|
|
No Readmission, N = 14,312 |
Readmission, N = 2,180 |
P Value | ||
| ||||
| Demographic characteristics | ||||
| Age, y, mean (SD) | 62 (17.3) | 61 (17.4) | 64 (17.0) | 0.001 |
| Female, n (%) | 17,715 (53.8) | 7,694 (53.8) | 1,163 (53.3) | 0.72 |
| Race/ethnicity | 0.001 | |||
| White | 21,359 (64.9) | 9,329 (65.2) | 1,361 (62.4) | |
| Black | 5,964 (18.1) | 2,520 (17.6) | 434 (19.9) | |
| Hispanic | 4,452 (13.5) | 1,931 (13.5) | 338 (15.5) | |
| Other | 1,147 (3.5) | 532 (3.7) | 47 (2.2) | |
| Marital status, n (%) | 0.001 | |||
| Single | 8,076 (24.5) | 3,516 (24.6) | 514 (23.6) | |
| Married | 13,394 (40.7) | 5,950 (41.6) | 812 (37.3) | |
| Separated/divorced | 3,468 (10.5) | 1,460 (10.2) | 251 (11.5) | |
| Widowed | 4,487 (13.7) | 1,868 (13.1) | 388 (17.8) | |
| Other | 3,497 (10.6) | 1,518 (10.6) | 215 (9.9) | |
| Primary payer, n (%) | 0.001 | |||
| Private | 13,090 (39.8) | 5,855 (40.9) | 726 (33.3) | |
| Medicare | 13,015 (39.5) | 5,597 (39.1) | 987 (45.3) | |
| Medicaid | 2,204 (6.7) | 852 (5.9) | 242 (11.1) | |
| Charity, self‐pay, or other | 4,613 (14.0) | 2,008 (14.0) | 225 (10.3) | |
| High‐poverty neighborhood, n (%)* | 7,468 (22.7) | 3,208 (22.4) | 548 (25.1) | 0.001 |
| Utilization history | ||||
| 1 ED visits in past year, n (%) | 9,299 (28.2) | 3,793 (26.5) | 823 (37.8) | 0.001 |
| 1 hospitalizations in past year, n (%) | 10,189 (30.9) | 4,074 (28.5) | 1,012 (46.4) | 0.001 |
| Clinical factors from first day of hospitalization | ||||
| Nonelective admission, n (%) | 27,818 (84.5) | 11,960 (83.6) | 1,960 (89.9) | 0.001 |
| Charlson Comorbidity Index, median (IQR)∥ | 0 (01) | 0 (00) | 0 (03) | 0.001 |
| Laboratory abnormalities within 24 hours of admission | ||||
| Albumin 2 g/dL | 355 (1.1) | 119 (0.8) | 46 (2.1) | 0.001 |
| Albumin 23 g/dL | 4,732 (14.4) | 1,956 (13.7) | 458 (21.0) | 0.001 |
| Aspartate aminotransferase >40 U/L | 4,610 (14.0) | 1,922 (13.4) | 383 (17.6) | 0.001 |
| Creatine phosphokinase 60 g/L | 3,728 (11.3) | 1,536 (10.7) | 330 (15.1) | 0.001 |
| Mean corpuscular volume >100 fL/red cell | 1,346 (4.1) | 537 (3.8) | 134 (6.2) | 0.001 |
| Platelets 90 103/L | 912 (2.8) | 357 (2.5) | 116 (5.3) | 0.001 |
| Platelets >350 103/L | 3,332 (10.1) | 1,433 (10.0) | 283 (13.0) | 0.001 |
| Prothrombin time >35 seconds | 248 (0.8) | 90 (0.6) | 35 (1.6) | 0.001 |
| Clinical factors from remainder of hospital stay | ||||
| Length of stay, d, median (IQR) | 4 (26) | 4 (26) | 5 (38) | 0.001 |
| ICU transfer after first 24 hours, n (%) | 988 (3.0) | 408 (2.9) | 94 (4.3) | 0.001 |
| Hospital complications, n (%) | ||||
| Clostridium difficile infection | 119 (0.4) | 44 (0.3) | 24 (1.1) | 0.001 |
| Pressure ulcer | 358 (1.1) | 126 (0.9) | 46 (2.1) | 0.001 |
| Venous thromboembolism | 301 (0.9) | 112 (0.8) | 34 (1.6) | 0.001 |
| Respiratory failure | 1,048 (3.2) | 463 (3.2) | 112 (5.1) | 0.001 |
| Central line‐associated bloodstream infection | 22 (0.07) | 6 (0.04) | 5 (0.23) | 0.005 |
| Catheter‐associated urinary tract infection | 47 (0.14) | 20 (0.14) | 6 (0.28) | 0.15 |
| Acute myocardial infarction | 293 (0.9) | 110 (0.8) | 32 (1.5) | 0.001 |
| Pneumonia | 1,754 (5.3) | 719 (5.0) | 154 (7.1) | 0.001 |
| Sepsis | 853 (2.6) | 368 (2.6) | 73 (3.4) | 0.04 |
| Blood transfusion during hospitalization, n (%) | 4,511 (13.7) | 1,837 (12.8) | 425 (19.5) | 0.001 |
| Laboratory abnormalities at discharge# | ||||
| Blood urea nitrogen >20 mg/dL, n (%) | 10,014 (30.4) | 4,077 (28.5) | 929 (42.6) | 0.001 |
| Sodium 135 mEq/L, n (%) | 4,583 (13.9) | 1,850 (12.9) | 440 (20.2) | 0.001 |
| Hematocrit 27 | 3,104 (9.4) | 1,231 (8.6) | 287 (13.2) | 0.001 |
| 1 vital sign instability at discharge, n (%)# | 6,192 (18.8) | 2,624 (18.3) | 525 (24.1) | 0.001 |
| Discharge location, n (%) | 0.001 | |||
| Home | 23,339 (70.9) | 10,282 (71.8) | 1,383 (63.4) | |
| Home health | 3,185 (9.7) | 1,356 (9.5) | 234 (10.7) | |
| Postacute care** | 5,990 (18.2) | 2,496 (17.4) | 549 (25.2) | |
| Hospice | 408 (1.2) | 178 (1.2) | 14 (0.6) | |
Derivation and Validation of the Full‐Stay EHR Model for 30‐Day Readmission
Our final model included 24 independent variables, including demographic characteristics, utilization history, clinical factors from the first day of admission, and clinical factors from the remainder of the hospital stay (Table 2). The strongest independent predictor of readmission was hospital‐acquired Clostridium difficile infection (adjusted odds ratio [AOR]: 2.03, 95% confidence interval [CI] 1.18‐3.48); other hospital‐acquired complications including pressure ulcers and venous thromboembolism were also significant predictors. Though having Medicaid was associated with increased odds of readmission (AOR: 1.55, 95% CI: 1.31‐1.83), other zip codelevel measures of socioeconomic disadvantage were not predictive and were not included in the final model. Being discharged to hospice was associated with markedly lower odds of readmission (AOR: 0.23, 95% CI: 0.13‐0.40).
| Odds Ratio (95% CI) | ||
|---|---|---|
| Univariate | Multivariate* | |
| ||
| Demographic characteristics | ||
| Age, per 10 years | 1.08 (1.051.11) | 1.07 (1.041.10) |
| Medicaid | 1.97 (1.702.29) | 1.55 (1.311.83) |
| Widow | 1.44 (1.281.63) | 1.27 (1.111.45) |
| Utilization history | ||
| Prior ED visit, per visit | 1.08 (1.061.10) | 1.04 (1.021.06) |
| Prior hospitalization, per hospitalization | 1.30 (1.271.34) | 1.16 (1.121.20) |
| Hospital and clinical factors from first day of hospitalization | ||
| Nonelective admission | 1.75 (1.512.03) | 1.42 (1.221.65) |
| Charlson Comorbidity Index, per point | 1.19 (1.171.21) | 1.06 (1.041.09) |
| Laboratory abnormalities within 24 hours of admission | ||
| Albumin 2 g/dL | 2.57 (1.823.62) | 1.52 (1.052.21) |
| Albumin 23 g/dL | 1.68 (1.501.88) | 1.20 (1.061.36) |
| Aspartate aminotransferase >40 U/L | 1.37 (1.221.55) | 1.21 (1.061.38) |
| Creatine phosphokinase 60 g/L | 1.48 (1.301.69) | 1.28 (1.111.46) |
| Mean corpuscular volume >100 fL/red cell | 1.68 (1.382.04) | 1.32 (1.071.62) |
| Platelets 90 103/L | 2.20 (1.772.72) | 1.56 (1.231.97) |
| Platelets >350 103/L | 1.34 (1.171.54) | 1.24 (1.081.44) |
| Prothrombin time >35 seconds | 2.58 (1.743.82) | 1.92 (1.272.90) |
| Hospital and clinical factors from remainder of hospital stay | ||
| Length of stay, per day | 1.08 (1.071.09) | 1.06 (1.041.07) |
| Hospital complications | ||
| Clostridium difficile infection | 3.61 (2.195.95) | 2.03 (1.183.48) |
| Pressure ulcer | 2.43 (1.733.41) | 1.64 (1.152.34) |
| Venous thromboembolism | 2.01 (1.362.96) | 1.55 (1.032.32) |
| Laboratory abnormalities at discharge | ||
| Blood urea nitrogen >20 mg/dL | 1.86 (1.702.04) | 1.37 (1.241.52) |
| Sodium 135 mEq/L | 1.70 (1.521.91) | 1.34 (1.181.51) |
| Hematocrit 27 | 1.61 (1.401.85) | 1.22 (1.051.41) |
| Vital sign instability at discharge, per instability | 1.29 (1.201.40) | 1.25 (1.151.36) |
| Discharged to hospice | 0.51 (0.300.89) | 0.23 (0.130.40) |
In our validation cohort, the full‐stay EHR model had fair discrimination, with a C statistic of 0.69 (95% CI: 0.68‐0.70) (Table 3). The full‐stay EHR model was well calibrated across all quintiles of risk, with slight overestimation of predicted risk in the lowest and highest quintiles (Figure 1a) (see Supporting Table 5 in the online version of this article). It also effectively stratified individuals across a broad range of predicted readmission risk from 4.1% in the lowest decile to 36.5% in the highest decile (Table 3).
| Model Name | C‐Statistic (95% CI) | IDI, % (95% CI) | NRI (95% CI) | Average Predicted Risk, % | |
|---|---|---|---|---|---|
| Lowest Decile | Highest Decile | ||||
| |||||
| Full‐stay EHR model | |||||
| Derivation cohort | 0.72 (0.70 to 0.73) | 4.1 | 36.5 | ||
| Validation cohort | 0.69 (0.68 to 0.70) | [Reference] | [Reference] | 4.1 | 36.5 |
| First‐day EHR model | 0.67 (0.66 to 0.68) | 1.2 (1.4 to 1.0) | 0.020 (0.038 to 0.002) | 5.8 | 31.9 |
| LACE model | 0.65 (0.64 to 0.66) | 2.6 (2.9 to 2.3) | 0.046 (0.067 to 0.024) | 6.1 | 27.5 |
| HOSPITAL model | 0.64 (0.62 to 0.65) | 3.2 (3.5 to 2.9) | 0.058 (0.080 to 0.035) | 6.7 | 26.6 |
Comparing the Performance of the Full‐Stay EHR Model to Other Models
The full‐stay EHR model had better discrimination compared to the first‐day EHR model and the LACE and HOSPITAL models, though the magnitude of improvement was modest (Table 3). The full‐stay EHR model also stratified individuals across a broader range of readmission risk, and was better able to discriminate and classify those in the highest quintile of risk from those in the lowest 4 quintiles of risk compared to other models as assessed by the IDI and NRI (Table 3) (see Supporting Tables 14 and Supporting Figure 2 in the online version of this article). In terms of model calibration, both the first‐day EHR and LACE models were also well calibrated, whereas the HOSPITAL model was less robust (Figure 1).
The diagnostic accuracy of the full‐stay EHR model in correctly predicting those in the highest quintile of risk was better than that of the first‐day, LACE, and HOSPITAL models, though overall improvements in the sensitivity, specificity, positive and negative predictive values, and positive and negative likelihood ratios were also modest (see Supporting Table 6 in the online version of this article).
DISCUSSION
In this study, we used clinically detailed EHR data from the entire hospitalization on 32,922 individuals treated in 6 diverse hospitals to develop an all‐payer, multicondition readmission risk‐prediction model. To our knowledge, this is the first 30‐day hospital readmission risk‐prediction model to use a comprehensive set of factors from EHR data from the entire hospital stay. Prior EHR‐based models have focused exclusively on data available on or prior to the first day of admission, which account for clinical severity on admission but do not account for factors uncovered during the inpatient stay that influence the chance of a postdischarge adverse outcome.[15, 30] We specifically assessed the prognostic impact of a comprehensive set of factors from the entire index hospitalization, including hospital‐acquired complications, clinical trajectory, and stability on discharge in predicting hospital readmissions. Our full‐stay EHR model had statistically better discrimination, calibration, and diagnostic accuracy than our existing all‐cause first‐day EHR model[15] and 2 previously published readmissions models that included more limited information from hospitalization (such as length of stay).[9, 10] However, although the more complicated full‐stay EHR model was statistically better than previously published models, we were surprised that the predictive performance was only modestly improved despite the inclusion of many additional clinically relevant prognostic factors.
Taken together, our study has several important implications. First, the added complexity and resource intensity of implementing a full‐stay EHR model yields only modestly improved readmission risk prediction. Thus, hospitals and healthcare systems interested in targeting their highest‐risk individuals for interventions to reduce 30‐day readmission should consider doing so within the first day of hospital admission. Our group's previously derived and validated first‐day EHR model, which used data only from the first day of admission, qualitatively performed nearly as well as the full‐stay EHR model.[15] Additionally, a recent study using only preadmission EHR data to predict 30‐day readmissions also achieved similar discrimination and diagnostic accuracy as our full‐stay model.[30]
Second, the field of readmissions risk‐prediction modeling may be reaching the maximum achievable model performance using data that are currently available in the EHR. Our limited ability to accurately predict all‐cause 30‐day readmission risk may reflect the influence of currently unmeasured patient, system, and community factors on readmissions.[31, 32, 33] Due to the constraints of data collected in the EHR, we were unable to include several patient‐level clinical characteristics associated with hospital readmission, including self‐perceived health status, functional impairment, and cognition.[33, 34, 35, 36] However, given their modest effect sizes (ORs ranging from 1.062.10), adequately measuring and including these risk factors in our model may not meaningfully improve model performance and diagnostic accuracy. Further, many social and behavioral patient‐level factors are also not consistently available in EHR data. Though we explored the role of several neighborhood‐level socioeconomic measuresincluding prevalence of poverty, median income, education, and unemploymentwe found that none were significantly associated with 30‐day readmissions. These particular measures may have been inadequate to characterize individual‐level social and behavioral factors, as several previous studies have demonstrated that patient‐level factors such as social support, substance abuse, and medication and visit adherence can influence readmission risk in heart failure and pneumonia.[11, 16, 22, 25] This underscores the need for more standardized routine collection of data across functional, social, and behavioral domains in clinical settings, as recently championed by the Institute of Medicine.[11, 37] Integrating data from outside the EHR on postdischarge health behaviors, self‐management, follow‐up care, recovery, and home environment may be another important but untapped strategy for further improving prediction of readmissions.[25, 38]
Third, a multicondition readmission risk‐prediction model may be a less effective strategy than more customized disease‐specific models for selected conditions associated with high 30‐day readmission rates. Our group's previously derived and internally validated models for heart failure and human immunodeficiency virus had superior discrimination compared to our full‐stay EHR model (C statistic of 0.72 for each).[11, 13] However, given differences in the included population and time periods studied, a head‐to‐head comparison of these different strategies is needed to assess differences in model performance and utility.
Our study had several strengths. To our knowledge, this is the first study to rigorously measure the additive influence of in‐hospital complications, clinical trajectory, and stability on discharge on the risk of 30‐day hospital readmission. Additionally, our study included a large, diverse study population that included all payers, all ages of adults, a mix of community, academic, and safety net hospitals, and individuals from a broad array of racial/ethnic and socioeconomic backgrounds.
Our results should be interpreted in light of several limitations. First, though we sought to represent a diverse group of hospitals, all study sites were located within north Texas and generalizability to other regions is uncertain. Second, our ascertainment of prior hospitalizations and readmissions was more inclusive than what could be typically accomplished in real time using only EHR data from a single clinical site. We performed a sensitivity analysis using only prior utilization data available within the EHR from the index hospital with no meaningful difference in our findings (data not shown). Additionally, a recent study found that 30‐day readmissions occur at the index hospital for over 75% of events, suggesting that 30‐day readmissions are fairly comprehensively captured even with only single‐site data.[39] Third, we were not able to include data on outpatient visits before or after the index hospitalization, which may influence the risk of readmission.[1, 40]
In conclusion, incorporating clinically granular EHR data from the entire course of hospitalization modestly improves prediction of 30‐day readmissions compared to models that only include information from the first 24 hours of hospital admission or models that use far fewer variables. However, given the limited improvement in prediction, our findings suggest that from the practical perspective of implementing real‐time models to identify those at highest risk for readmission, it may not be worth the added complexity of waiting until the end of a hospitalization to leverage additional data on hospital complications, and the trajectory of laboratory and vital sign values currently available in the EHR. Further improvement in prediction of readmissions will likely require accounting for psychosocial, functional, behavioral, and postdischarge factors not currently present in the inpatient EHR.
Disclosures: This study was presented at the Society of Hospital Medicine 2015 Annual Meeting in National Harbor, Maryland, and the Society of General Internal Medicine 2015 Annual Meeting in Toronto, Canada. This work was supported by the Agency for Healthcare Research and Qualityfunded UT Southwestern Center for Patient‐Centered Outcomes Research (1R24HS022418‐01) and the Commonwealth Foundation (#20100323). Drs. Nguyen and Makam received funding from the UT Southwestern KL2 Scholars Program (NIH/NCATS KL2 TR001103). Dr. Halm was also supported in part by NIH/NCATS U54 RFA‐TR‐12‐006. The study sponsors had no role in the design and conduct of the study; collection, management, analysis, and interpretation of the data; and preparation, review, or approval of the manuscript. The authors have no conflicts of interest to disclose.
- , , . Rehospitalizations among patients in the Medicare fee‐for‐service program. N Engl J Med. 2009;360(14):1418–1428.
- , , , , . Proportion of hospital readmissions deemed avoidable: a systematic review. CMAJ. 2011;183(7):E391–E402.
- , , , , , . Hospital‐initiated transitional care interventions as a patient safety strategy: a systematic review. Ann Intern Med. 2013;158(5 pt 2):433–440.
- , , , , . Interventions to reduce 30‐day rehospitalization: a systematic review. Ann Intern Med. 2011;155(8):520–528.
- , , , , , . Interventions to Improve Care Transitions at Hospital Discharge. Rockville, MD: Agency for Healthcare Research and Quality; 2013.
- , , , et al. Allocating scarce resources in real‐time to reduce heart failure readmissions: a prospective, controlled study. BMJ Qual Saf. 2013;22(12):998–1005.
- , , , , . Implementing electronic health care predictive analytics: considerations and challenges. Health Aff (Millwood). 2014;33(7):1148–1154.
- , , , et al. Risk prediction models for hospital readmission: a systematic review. JAMA. 2011;306(15):1688–1698.
- , , , et al. Derivation and validation of an index to predict early death or unplanned readmission after discharge from hospital to the community. CMAJ. 2010;182(6):551–557.
- , , , . Potentially avoidable 30‐day hospital readmissions in medical patients: derivation and validation of a prediction model. JAMA Intern Med. 2013;173(8):632–638.
- , , , et al. An automated model to identify heart failure patients at risk for 30‐day readmission or death using electronic medical record data. Med Care. 2010;48(11):981–988.
- , , , et al. An automated model using electronic medical record data identifies patients with cirrhosis at high risk for readmission. Clin Gastroenterol Hepatol. 2013;11(10):1335–1341.e1331.
- , , , , , . An electronic medical record‐based model to predict 30‐day risk of readmission and death among HIV‐infected inpatients. J Acquir Immune Defic Syndr. 2012;61(3):349–358.
- , , , et al. Development and use of an administrative claims measure for profiling hospital‐wide performance on 30‐day unplanned readmission. Ann Intern Med. 2014;161(10 suppl):S66–S75.
- , , , et al. Electronic medical record‐based multicondition models to predict the risk of 30 day readmission or death among adult medicine patients: validation and comparison to existing models. BMC Med Inform Decis Mak. 2015;15(1):39.
- , , , et al. Linking electronic health record‐extracted psychosocial data in real‐time to risk of readmission for heart failure. Psychosomatics. 2011;52(4):319–327.
- , . A conceptual framework for the study of early readmission as an indicator of quality of care. Soc Sci Med. 1996;43(11):1533–1541.
- , , , et al. Hospital readmission performance and patterns of readmission: retrospective cohort study of Medicare admissions. BMJ. 2013;347:f6571.
- , , , , , . Getting more performance from performance measurement. N Engl J Med. 2014;371(23):2145–2147.
- , , , et al. Hospital strategy uptake and reductions in unplanned readmission rates for patients with heart failure: a prospective study. J Gen Intern Med. 2015;30(5):605–611.
- . Post‐hospital syndrome—an acquired, transient condition of generalized risk. N Engl J Med. 2013;368(2):100–102.
- , , , et al. Impact of social factors on risk of readmission or mortality in pneumonia and heart failure: systematic review. J Gen Intern Med. 2013;28(2):269–282.
- , , , , , . Effect of clinical and social risk factors on hospital profiling for stroke readmission: a cohort study. Ann Intern Med. 2014;161(11):775–784.
- , , , et al. Neighborhood socioeconomic disadvantage and 30‐day rehospitalization: a retrospective cohort study. Ann Intern Med. 2014;161(11):765–774.
- , , , , , . Postdischarge environmental and socioeconomic factors and the likelihood of early hospital readmission among community‐dwelling Medicare beneficiaries. Gerontologist. 2008;48(4):495–504.
- , , . Socioeconomic status and readmissions: evidence from an urban teaching hospital. Health Aff (Millwood). 2014;33(5):778–785.
- , , , . Adding socioeconomic data to hospital readmissions calculations may produce more useful results. Health Aff (Millwood). 2014;33(5):786–791.
- , , , . Evaluating the added predictive ability of a new marker: from area under the ROC curve to reclassification and beyond. Stat Med. 2008;27(2):157–172; discussion 207–212.
- , , , , . Net reclassification improvement: computation, interpretation, and controversies: a literature review and clinician's guide. Ann Intern Med. 2014;160(2):122–131.
- , , , , , . Predicting 30‐day readmissions with preadmission electronic health record data. Med Care. 2015;53(3):283–289.
- , . Hospital readmissions—not just a measure of quality. JAMA. 2011;306(16):1796–1797.
- , . Thirty‐day readmissions—truth and consequences. N Engl J Med. 2012;366(15):1366–1369.
- , , , . Functional impairment and hospital readmission in medicare seniors. JAMA Intern Med. 2015;175(4):559–565.
- , , . Clinical and sociodemographic risk factors for readmission of Medicare beneficiaries. Health Care Financ Rev. 1988;10(1):27–36.
- , , , , , . Mini‐cog performance: novel marker of post discharge risk among patients hospitalized for heart failure. Circ Heart Fail. 2015;8(1):8–16.
- , , , , , . Association of impaired functional status at hospital discharge and subsequent rehospitalization. J Hosp Med. 2014;9(5):277–282.
- , . Patients in context—EHR capture of social and behavioral determinants of health. N Engl J Med. 2015;372(8):698–701.
- , , , , . Envisioning a social‐health information exchange as a platform to support a patient‐centered medical neighborhood: a feasibility study. J Gen Intern Med. 2015;30(1):60–67.
- , , , , , . Patient factors contributing to variation in same‐hospital readmission rate. Med Care Res Review. 2015;72(3):338–358.
- , , . Does increased access to primary care reduce hospital readmissions? Veterans Affairs Cooperative Study Group on Primary Care and Hospital Readmission. N Engl J Med. 1996;334(22):1441–1447.
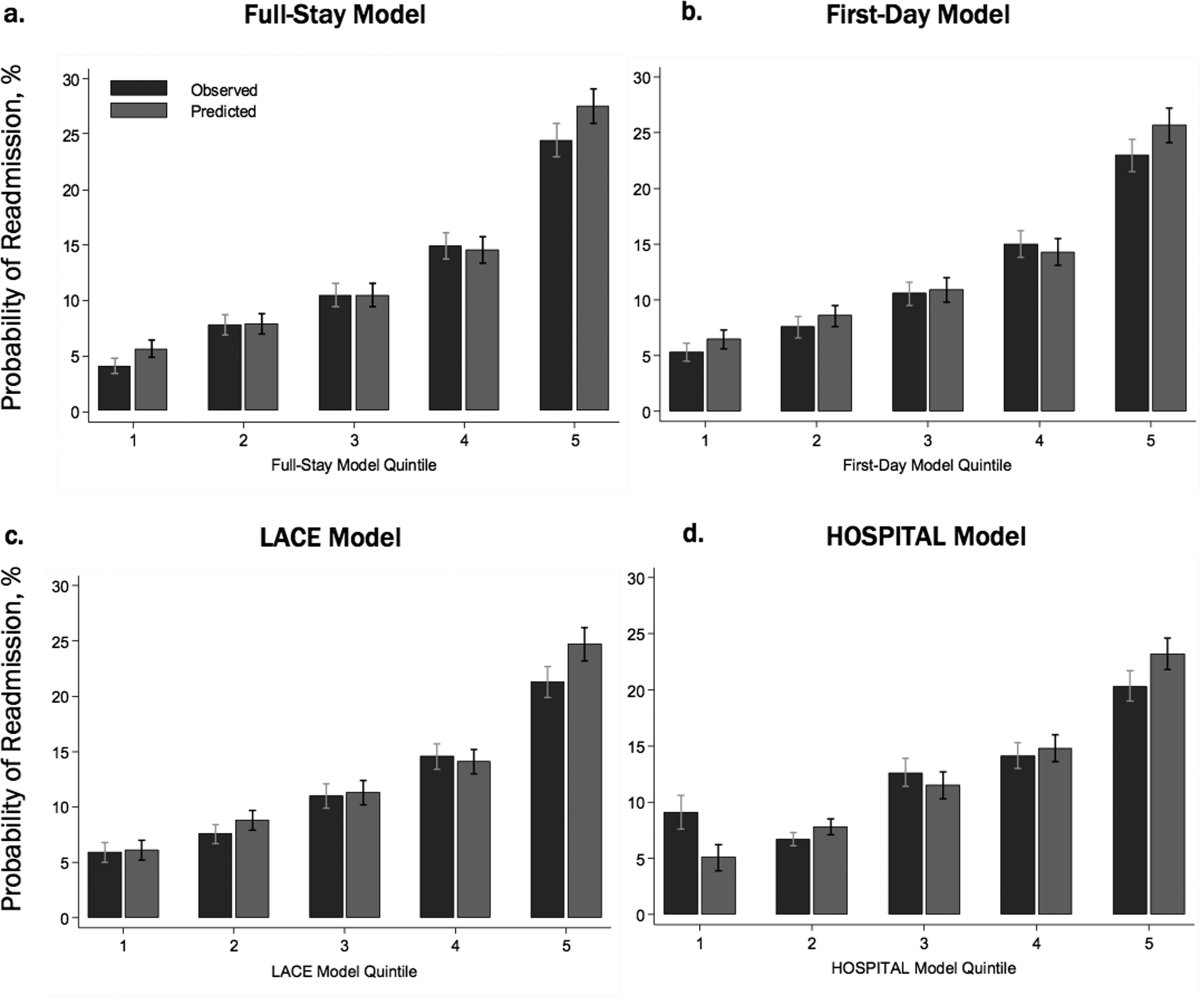
Financial Performance and Outcomes
Hospital care accounts for the single largest category of national healthcare expenditures, totaling $936.9 billion in 2013.[1] With ongoing scrutiny of US healthcare spending, hospitals are under increasing pressure to justify high costs and robust profits.[2] However, the dominant fee‐for‐service reimbursement model creates incentives for hospitals to prioritize high volume over high‐quality care to maximize profits.[3] Because hospitals may be reluctant to implement improvements if better quality is not accompanied by better payment or improved financial margins, an approach to stimulate quality improvement among hospitals has been to leverage consumer pressure through required public reporting of selected outcome metrics.[4, 5] Public reporting of outcomes is thought to influence hospital reputation; in turn, reputation affects patient perceptions and influences demand for hospital services, potentially enabling reputable hospitals to command higher prices for services to enhance hospital revenue.[6, 7]
Though improving outcomes is thought to reduce overall healthcare costs, it is unclear whether improving outcomes results in a hospital's financial return on investment.[4, 5, 8] Quality improvement can require substantial upfront investment, requiring that hospitals already have robust financial health to engage in such initiatives.[9, 10] Consequently, instead of stimulating broad efforts in quality improvement, public reporting may exacerbate existing disparities in hospital quality and finances, by rewarding already financially healthy hospitals, and by inadvertently penalizing hospitals without the means to invest in quality improvement.[11, 12, 13, 14, 15] Alternately, because fee‐for‐service remains the dominant reimbursement model for hospitals, loss of revenue through reducing readmissions may outweigh any financial gains from improved public reputation and result in worse overall financial performance, though robust evidence for this concern is lacking.[16, 17]
A small number of existing studies suggest a limited correlation between improved hospital financial performance and improved quality, patient safety, and lower readmission rates.[18, 19, 20] However, these studies had several limitations. They were conducted prior to public reporting of selected outcome metrics by the Centers for Medicare and Medicaid Services (CMS)[18, 19, 20]; used data from the Medicare Cost Report, which is not uniformly audited and thus prone to measurement error[19, 20]; used only relative measures of hospital financial performance (eg, operating margin), which do not capture the absolute amount of revenue potentially available for investment in quality improvement[18, 19]; or compared only hospitals at the extremes of financial performance, potentially exaggerating the magnitude of the relationship between hospital financial performance and quality outcomes.[19]
To address this gap in the literature, we sought to assess whether hospitals with robust financial performance have lower 30‐day risk‐standardized mortality and hospital readmission rates for acute myocardial infarction (AMI), congestive heart failure (CHF), and pneumonia (PNA). Given the concern that hospitals with the lowest mortality and readmission rates may experience a decrease in financial performance due to the lower volume of hospitalizations, we also assessed whether hospitals with the lowest readmission and mortality rates had a differential change in financial performance over time compared to hospitals with the highest rates.
METHODS
Data Sources and Study Population
This was an observational study using audited financial data from the 2008 and 2012 Hospital Annual Financial Data Files from the Office of Statewide Health Planning and Development (OSHPD) in the state of California, merged with data on outcome measures publicly reported by CMS via the Hospital Compare website for July 1, 2008 to June 30, 2011.[21, 22] We included all general acute care hospitals with available OSHPD data in 2008 and at least 1 publicly reported outcome from 2008 to 2011. We excluded hospitals without 1 year of audited financial data for 2008 and hospitals that closed during 2008 to 2011.
Measures of Financial Performance
Because we hypothesized that the absolute amount of revenue generated from clinical operations would influence investment in quality improvement programs more so than relative changes in revenue,[20] we used net revenue from operations (total operating revenue minus total operating expense) as our primary measure of hospital financial performance. We also performed 2 companion analyses using 2 commonly reported relative measures of financial performanceoperating margin (net revenue from operations divided by total operating revenue) and total margin (net total revenue divided by total revenue from all sources). Net revenue from operations for 2008 was adjusted to 2012 US dollars using the chained Consumer Price Index for all urban consumers.
Outcomes
For our primary analysis, the primary outcomes were publicly reported all‐cause 30‐day risk‐standardized mortality rates (RSMR) and readmission rates (RSRR) for AMI, CHF, and PNA aggregated over a 3‐year period. These measures were adjusted for key demographic and clinical characteristics available in Medicare data. CMS began publicly reporting 30‐day RSMR for AMI and CHF in June 2007, RSMR for PNA in June 2008, and RSRR for all 3 conditions in July 2009.[23, 24]
To assess whether public reporting had an effect on subsequent hospital financial performance, we conducted a companion analysis where the primary outcome of interest was change in hospital financial performance over time, using the same definitions of financial performance outlined above. For this companion analysis, publicly reported 30‐day RSMR and RSRR for AMI, CHF, and PNA were assessed as predictors of subsequent financial performance.
Hospital Characteristics
Hospital characteristics were ascertained from the OSHPD data. Safety‐net status was defined as hospitals with an annual Medicaid caseload (number of Medicaid discharges divided by the total number of discharges) 1 standard deviation above the mean Medicaid caseload, as defined in previous studies.[25]
Statistical Analyses
Effect of Baseline Financial Performance on Subsequent Publicly Reported Outcomes
To estimate the relationship between baseline hospital financial performance in 2008 and subsequent RSMR and RSRR for AMI, CHF, and PNA from 2008 to 2011, we used linear regression adjusted for the following hospital characteristics: teaching status, rural location, bed size, safety‐net status, ownership, Medicare caseload, and volume of cases reported for the respective outcome. We accounted for clustering of hospitals by ownership. We adjusted for hospital volume of reported cases for each condition given that the risk‐standardization models used by CMS shrink outcomes for small hospitals to the mean, and therefore do not account for a potential volume‐outcome relationship.[26] We conducted a sensitivity analysis excluding hospitals at the extremes of financial performance, defined as hospitals with extreme outlier values for each financial performance measure (eg, values more than 3 times the interquartile range above the first quartile or below the third quartile).[27] Nonlinearity of financial performance measures was assessed using restricted cubic splines. For ease of interpretation, we scaled the estimated change in RSMR and RSRR per $50 million increase in net revenue from operations, and graphed nonparametric relationships using restricted cubic splines.
Effect of Public Reporting on Subsequent Hospital Financial Performance
To assess whether public reporting had an effect on subsequent hospital financial performance, we conducted a companion hospital‐level difference‐in‐differences analysis to assess for differential changes in hospital financial performance between 2008 and 2012, stratified by tertiles of RSMR and RSRR rates from 2008 to 2011. This approach compares differences in an outcome of interest (hospital financial performance) within each group (where each group is a tertile of publicly reported rates of RSMR or RSRR), and then compares the difference in these differences between groups. Therefore, these analyses use each group as their own historical control and the opposite group as a concurrent control to account for potential secular trends. To conduct our difference‐in‐differences analysis, we compared the change in financial performance over time in the top tertile of hospitals to the change in financial performance over time in the bottom tertile of hospitals with respect to AMI, CHF, and PNA RSMR and RSRR. Our models therefore included year (2008 vs 2012), tertile of publicly reported rates for RSMR or RSRR, and the interaction between them as predictors, where the interaction was the difference‐in‐differences term and the primary predictor of interest. In addition to adjusting for hospital characteristics and accounting for clustering as mentioned above, we also included 3 separate interaction terms for year with bed size, safety‐net status, and Medicare caseload, to account for potential changes in the hospitals over time that may have independently influenced financial performance and publicly reported 30‐day measures. For sensitivity analyses, we repeated our difference‐in‐differences analyses excluding hospitals with a change in ownership and extreme outliers with respect to financial performance in 2008. We performed model diagnostics including assessment of functional form, linearity, normality, constant variance, and model misspecification. All analyses were conducted using Stata version 12.1 (StataCorp, College Station, TX). This study was deemed exempt from review by the UT Southwestern Medical Center institutional review board.
RESULTS
Among the 279 included hospitals (see Supporting Figure 1 in the online version of this article), 278 also had financial data available for 2012. In 2008, the median net revenue from operations was $1.6 million (interquartile range [IQR], $2.4 to $10.3 million), the median operating margin was 1.5% (IQR, 4.6% to 6%), and the median total margin was 2.5% (IQR, 2.2% to 7.5% (Table 1). The number of hospitals reporting each outcome, and median outcome rates, are shown in Table 2.
| 2008, n = 279 | 2012, n = 278 | |
|---|---|---|
| ||
| Hospital characteristics | ||
| Teaching, n (%) | 28 (10.0) | 28 (10.0) |
| Rural, n (%) | 55 (19.7) | 55 (19.7) |
| Bed size, n (%) | ||
| 099 (small) | 57 (20.4) | 55 (19.8) |
| 100299 (medium) | 130 (46.6) | 132 (47.5) |
| 300 (large) | 92 (33.0) | 91 (32.7) |
| Safety‐net hospital, n (%)* | 46 (16.5) | 48 (17.3) |
| Hospital ownership, n (%) | ||
| City or county | 15 (5.4) | 16 (5.8) |
| District | 42 (15.1) | 39 (14.0) |
| Investor | 66 (23.7) | 66 (23.7) |
| Private nonprofit | 156 (55.9) | 157 (56.5) |
| Medicare caseload, mean % (SD) | 41.6 (14.7) | 43.6 (14.7) |
| Financial performance measures | ||
| Net revenue from operations, median $ in millions (IQR; range) | 1.6 (2.4 to 10.3; 495.9 to 144.1) | 3.2 (2.9 to 15.4; 396.2 to 276.8) |
| Operating margin, median % (IQR; range) | 1.5 (4.6 to 6.8; 77.8 to 26.4) | 2.3 (3.9 to 8.2; 134.8 to 21.1) |
| Total margin, median % (IQR; range) | 2.5 (2.2 to 7.5; 101.0 to 26.3) | 4.5 (0.7 to 9.8; 132.2 to 31.1) |
| No. | Median % (IQR) | Adjusted % Change (95% CI) per $50 Million Increase in Net Revenue From Operations | ||
|---|---|---|---|---|
| Overall | Extreme Outliers Excluded | |||
| ||||
| Myocardial infarction | ||||
| Mortality rate | 211 | 15.2 (14.216.2) | 0.07 (0.10 to 0.24) | 0.63 (0.21 to 1.48) |
| Readmission rate | 184 | 19.4 (18.520.2) | Nonlinear | 0.34 (1.17 to 0.50) |
| Congestive heart failure | ||||
| Mortality rate | 259 | 11.1 (10.112.1) | 0.17 (0.01 to 0.35) | Nonlinear∥ |
| Readmission rate | 264 | 24.5 (23.525.6) | 0.07 (0.27 to 0.14) | 0.45 (1.36 to 0.47) |
| Pneumonia | ||||
| Mortality rate | 268 | 11.6 (10.413.2) | 0.17 (0.42 to 0.07) | 0.35 (1.19 to 0.49) |
| Readmission rate | 268 | 18.2 (17.319.1) | 0.04 (0.20 to 0.11) | 0.56 (1.27 to 0.16) |
Relationship Between Financial Performance and Publicly Reported Outcomes
Acute Myocardial Infarction
We did not observe a consistent relationship between hospital financial performance and AMI mortality and readmission rates. In our overall adjusted analyses, net revenue from operations was not associated with mortality, but was significantly associated with a decrease in AMI readmissions among hospitals with net revenue from operations between approximately $5 million to $145 million (nonlinear relationship, F statistic = 4.8, P 0.001 (Table 2, Figure 1A). However, after excluding 23 extreme outlying hospitals by net revenue from operations (10 underperformers with net revenue $49.4 million and 13 overperformers with net revenue >$52.1 million), this relationship was no longer observed. Using operating margin instead of net revenue from operations as the measure of hospital financial performance, we observed a 0.2% increase in AMI mortality (95% confidence interval [CI]: 0.06%‐0.35%) (see Supporting Table 1 and Supporting Figure 2 in the online version of this article) for each 10% increase in operating margin, which persisted with the exclusion of 5 outlying hospitals by operating margin (all 5 were underperformers, with operating margins 38.6%). However, using total margin as the measure of financial performance, there was no significant relationship with either mortality or readmissions (see Supporting Table 2 and Supporting Figure 3 in the online version of this article).
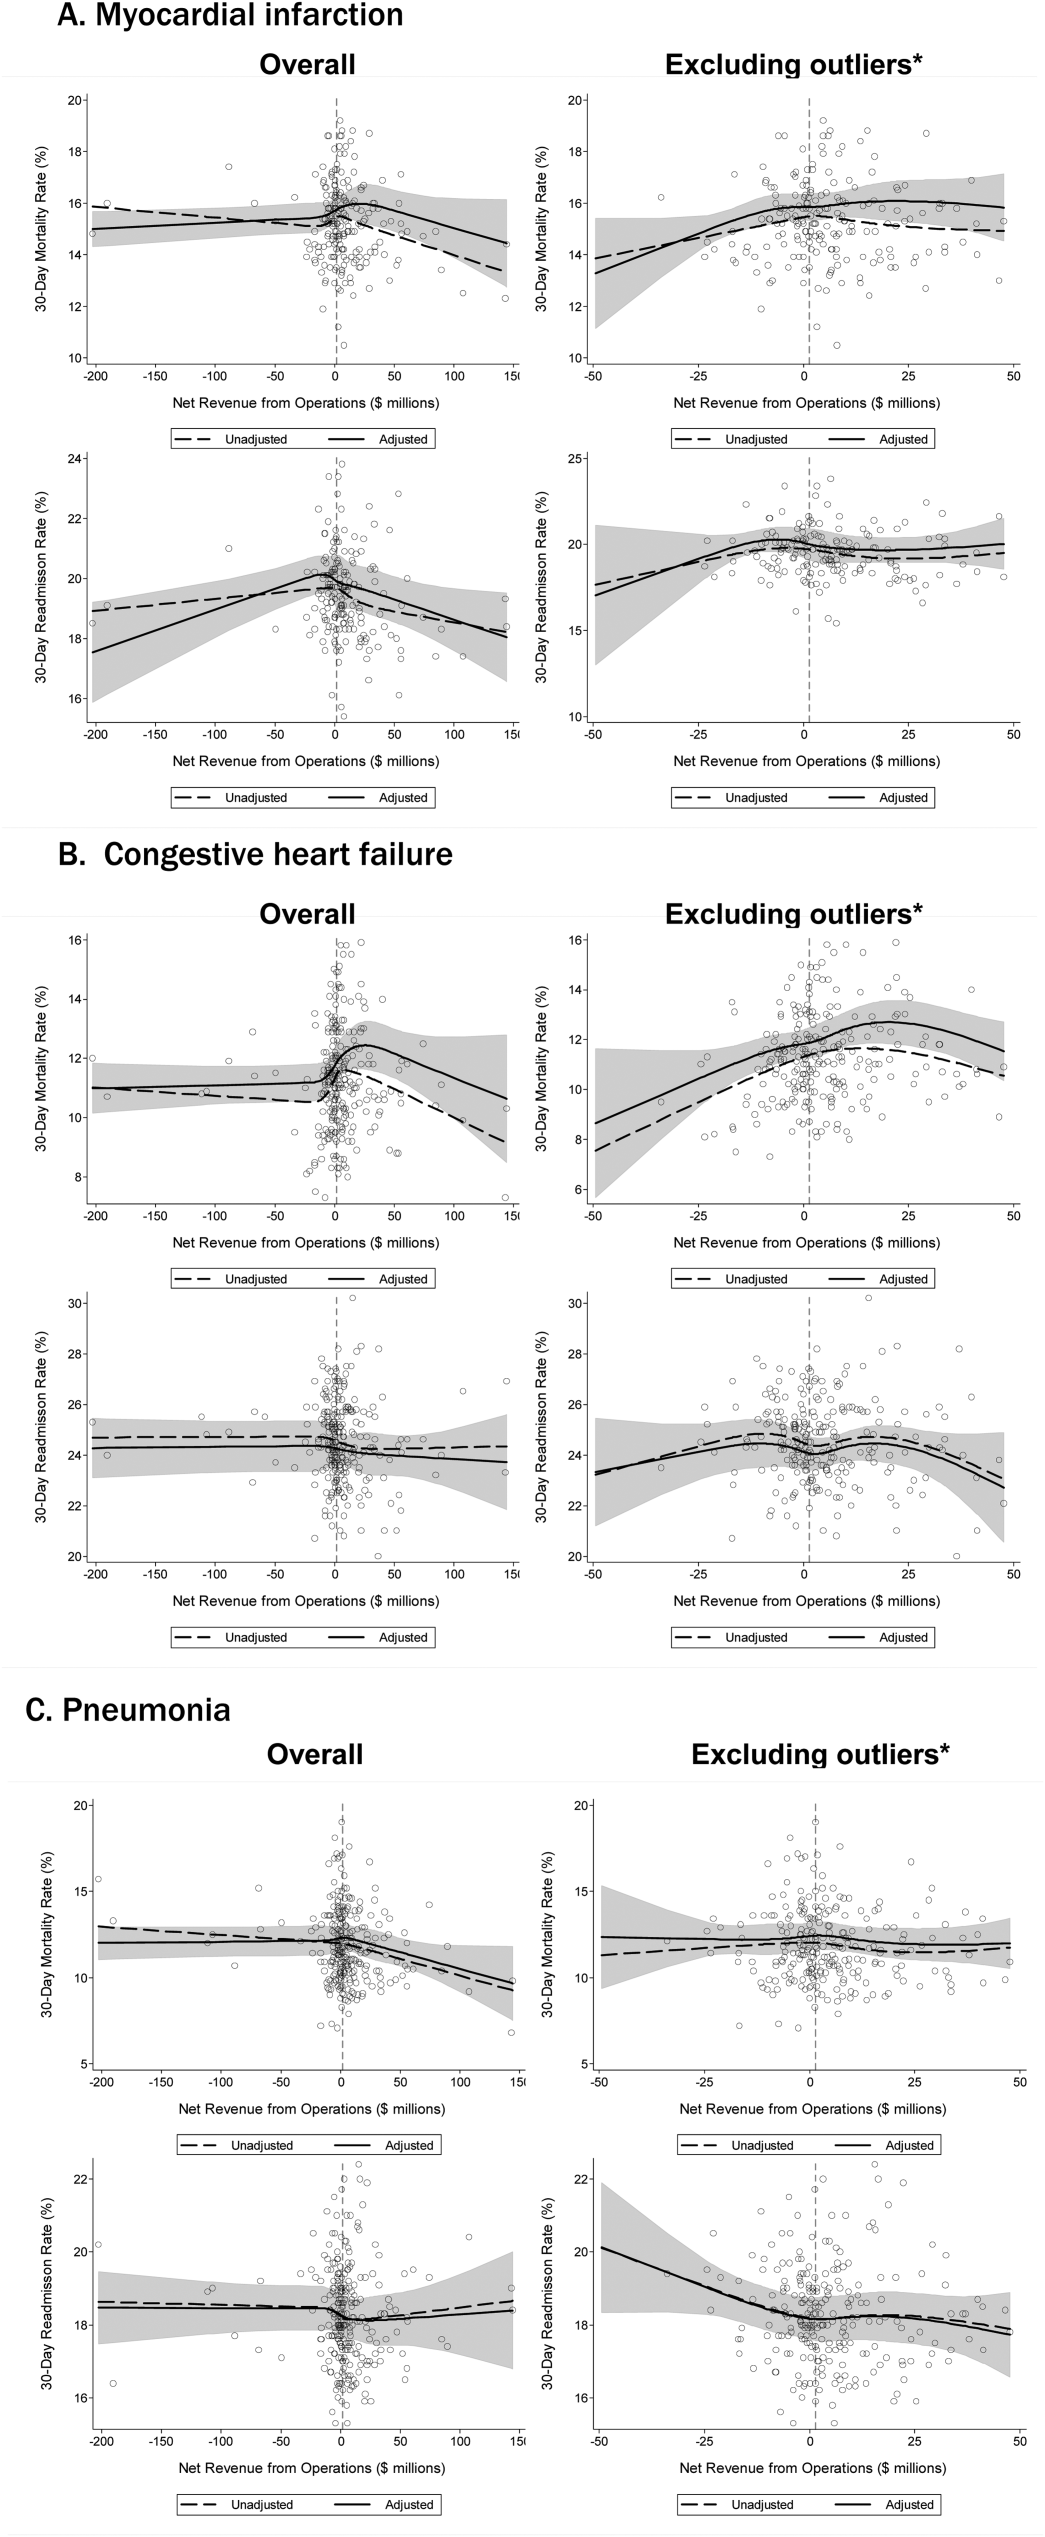
Congestive Heart Failure
In our primary analyses, we did not observe a significant relationship between net revenue from operations and CHF mortality and readmission rates. However, after excluding 23 extreme outliers, increasing net revenue from operations was associated with a modest increase in CHF mortality among hospitals, with net revenue between approximately $35 million and $20 million (nonlinear relationship, F statistic = 3.6, P = 0.008 (Table 2, Figure 1B). Using alternate measures of financial performance, we observed a consistent relationship between increasing hospital financial performance and higher 30‐day CHF mortality rate. Using operating margin, we observed a slight increase in the mortality rate for CHF (0.26% increase in CHF RSMR for every 10% increase in operating margin) (95% CI: 0.07%‐0.45%) (see Supporting Table 1 and Supporting Figure 2 in the online version of this article), which persisted after the exclusion of 5 extreme outliers. Using total margin, we observed a significant but modest association between improved hospital financial performance and increased mortality rate for CHF (nonlinear relationship, F statistic = 2.9, P = 0.03) (see Supporting Table 2 and Supporting Figure 3 in the online version of this article), which persisted after the exclusion of 3 extreme outliers (0.32% increase in CHF RSMR for every 10% increase in total margin) (95% CI: 0.03%‐0.62%).
Pneumonia
Hospital financial performance (using net revenue, operating margin, or total margin) was not associated with 30‐day PNA mortality or readmission rates.
Relationship of Readmission and Mortality Rates on Subsequent Hospital Financial Performance
Compared to hospitals in the highest tertile of readmission and mortality rates (ie, those with the worst rates), hospitals in the lowest tertile of readmission and mortality rates (ie, those with the best rates) had a similar magnitude of increase in net revenue from operations from 2008 to 2012 (Table 3). The difference‐in‐differences analyses showed no relationship between readmission or mortality rates for AMI, CHF, and PNA and changes in net revenue from operations from 2008 to 2012 (difference‐in‐differences estimates ranged from $8.61 to $6.77 million, P > 0.3 for all). These results were robust to the exclusion of hospitals with a change in ownership and extreme outliers by net revenue from operations (data not reported).
| Outcome | Tertile With Highest Outcome Rates (Worst Hospitals) | Tertile With Lowest Outcome Rates (Best Hospitals) | Difference in Net From Operations Differences Between Highest and Lowest Outcome Rate Tertiles, $ Million (95% CI) | P | ||
|---|---|---|---|---|---|---|
| Outcome, Median % (IQR) | Gain/Loss in Net Revenue From Operations From 2008 to 2012, $ Million* | Outcome, Median % (IQR) | Gain/Loss in Net Revenue from Operations From 2008 to 2012, $ Million* | |||
| ||||||
| AMI mortality | 16.7 (16.217.4) | +65.62 | 13.8 (13.314.2) | +74.23 | 8.61 (27.95 to 10.73) | 0.38 |
| AMI readmit | 20.7 (20.321.5) | +38.62 | 18.3 (17.718.6) | +31.85 | +6.77 (13.24 to 26.77) | 0.50 |
| CHF mortality | 13.0 (12.313.9) | +45.66 | 9.6 (8.910.1) | +48.60 | 2.94 (11.61 to 5.73) | 0.50 |
| CHF readmit | 26.2 (25.726.9) | +47.08 | 23.0 (22.323.5) | +46.08 | +0.99 (10.51 to 12.50) | 0.87 |
| PNA mortality | 13.9 (13.314.7) | +43.46 | 9.9 (9.310.4) | +38.28 | +5.18 (7.01 to 17.37) | 0.40 |
| PNA readmit | 19.4 (19.120.1) | +47.21 | 17.0 (16.517.3) | +45.45 | +1.76 (8.34 to 11.86) | 0.73 |
DISCUSSION
Using audited financial data from California hospitals in 2008 and 2012, and CMS data on publicly reported outcomes from 2008 to 2011, we found no consistent relationship between hospital financial performance and publicly reported outcomes for AMI and PNA. However, better hospital financial performance was associated with a modest increase in 30‐day risk‐standardized CHF mortality rates, which was consistent across all 3 measures of hospital financial performance. Reassuringly, there was no difference in the change in net revenue from operations between 2008 and 2012 between hospitals in the highest and lowest tertiles of readmission and mortality rates for AMI, CHF, and PNA. In other words, hospitals with the lowest rates of 30‐day readmissions and mortality for AMI, CHF, and PNA did not experience a loss in net revenue from operations over time, compared to hospitals with the highest readmission and mortality rates.
Our study differs in several important ways from Ly et al., the only other study to our knowledge that investigated the relationship between hospital financial performance and outcomes for patients with AMI, CHF, and PNA.[19] First, outcomes in the Ly et al. study were ascertained in 2007, which preceded public reporting of outcomes. Second, the primary comparison was between hospitals in the bottom versus top decile of operating margin. Although Ly and colleagues also found no association between hospital financial performance and mortality rates for these 3 conditions, they found a significant absolute decrease of approximately 3% in readmission rates among hospitals in the top decile of operating margin versus those in bottom decile. However, readmission rates were comparable among the remaining 80% of hospitals, suggesting that these findings primarily reflected the influence of a few outlier hospitals. Third, the use of nonuniformly audited hospital financial data may have resulted in misclassification of financial performance. Our findings also differ from 2 previous studies that identified a modest association between improved hospital financial performance and decreased adverse patient safety events.[18, 20] However, publicly reported outcomes may not be fully representative of hospital quality and patient safety.[28, 29]
The limited association between hospital financial performance and publicly reported outcomes for AMI and PNA is noteworthy for several reasons. First, publicly reporting outcomes alone without concomitant changes to reimbursement may be inadequate to create strong financial incentives for hospital investment in quality improvement initiatives. Hospitals participating in both public reporting of outcomes and pay‐for‐performance have been shown to achieve greater improvements in outcomes than hospitals engaged only in public reporting.[30] Our time interval for ascertainment of outcomes preceded CMS implementation of the Hospital Readmissions Reduction Program (HRRP) in October 2012, which withholds up to 3% of Medicare hospital reimbursements for higher than expected mortality and readmission rates for AMI, CHF, and PNA. Once outcomes data become available for a 3‐year post‐HRRP implementation period, the impact of this combined approach can be assessed. Second, because adherence to many evidence‐based process measures for these conditions (ie, aspirin use in AMI) is already high, there may be a ceiling effect present that obviates the need for further hospital financial investment to optimize delivery of best practices.[31, 32] Third, hospitals themselves may contribute little to variation in mortality and readmission risk. Of the total variation in mortality and readmission rates among Texas Medicare beneficiaries, only about 1% is attributable to hospitals, whereas 42% to 56% of the variation is explained by differences in patient characteristics.[33, 34] Fourth, there is either low‐quality or insufficient evidence that transitional care interventions specifically targeted to patients with AMI or PNA result in better outcomes.[35] Thus, greater financial investment in hospital‐initiated and postdischarge transitional care interventions for these specific conditions may result in less than the desired effect. Lastly, many hospitalizations for these conditions are emergency hospitalizations that occur after patients present to the emergency department with unexpected and potentially life‐threatening symptoms. Thus, patients may not be able to incorporate the reputation or performance metrics of a hospital in their decisions for where they are hospitalized for AMI, CHF, or PNA despite the public reporting of outcomes.
Given the strong evidence that transitional care interventions reduce readmissions and mortality among patients hospitalized with CHF, we were surprised to find that improved hospital financial performance was associated with an increased risk‐adjusted CHF mortality rate.[36] This association held true for all 3 different measures of hospital financial performance, suggesting that this unexpected finding is unlikely to be the result of statistical chance, though potential reasons for this association remain unclear. One possibility is that the CMS model for CHF mortality may not adequately risk adjust for severity of illness.[37, 38] Thus, robust financial performance may be a marker for hospitals with more advanced heart failure services that care for more patients with severe illness.
Our findings should be interpreted in the context of certain limitations. Our study only included an analysis of outcomes for AMI, CHF, and PNA among older fee‐for‐service Medicare beneficiaries aggregated at the hospital level in California between 2008 and 2012, so generalizability to other populations, conditions, states, and time periods is uncertain. The observational design precludes a robust causal inference between financial performance and outcomes. For readmissions, rates were publicly reported for only the last 2 years of the 3‐year reporting period; thus, our findings may underestimate the association between hospital financial performance and publicly reported readmission rates.
CONCLUSION
There is no consistent relationship between hospital financial performance and subsequent publicly reported outcomes for AMI and PNA. However, for unclear reasons, hospitals with better financial performance had modestly higher CHF mortality rates. Given this limited association, public reporting of outcomes may have had less than the intended impact in motivating hospitals to invest in quality improvement. Additional financial incentives in addition to public reporting, such as readmissions penalties, may help motivate hospitals with robust financial performance to further improve outcomes. This would be a key area for future investigation once outcomes data are available for the 3‐year period following CMS implementation of readmissions penalties in 2012. Reassuringly, there was no association between low 30‐day mortality and readmissions rates and subsequent poor financial performance, suggesting that improved outcomes do not necessarily lead to loss of revenue.
Disclosures
Drs. Nguyen, Halm, and Makam were supported in part by the Agency for Healthcare Research and Quality University of Texas Southwestern Center for Patient‐Centered Outcomes Research (1R24HS022418‐01). Drs. Nguyen and Makam received funding from the University of Texas Southwestern KL2 Scholars Program (NIH/NCATS KL2 TR001103). The study sponsors had no role in design and conduct of the study; collection, management, analysis, and interpretation of the data; and preparation, review, or approval of the manuscript. The authors have no conflicts of interest to disclose.
- Centers for Medicare and Medicaid Services. Office of the Actuary. National Health Statistics Group. National Healthcare Expenditures Data. Baltimore, MD; 2013. https://www.cms.gov/Research-Statistics-Data-and-Systems/Statistics-Trends-and-Reports/NationalHealthExpendData/NationalHealthAccountsHistorical.html. Accessed February 16, 2016.
- . Bitter pill: why medical bills are killing us. Time Magazine. February 20, 2013:16–55.
- . Fee‐for‐service will remain a feature of major payment reforms, requiring more changes in Medicare physician payment. Health Aff (Millwood). 2012;31(9):1977–1983.
- , , , et al. The business case for quality: case studies and an analysis. Health Aff (Millwood). 2003;22(2):17–30.
- , , , . Public reporting on quality in the United States and the United Kingdom. Health Aff (Millwood). 2003;22(3):134–148.
- , , , , . The business case for health‐care quality improvement. J Patient Saf. 2013;9(1):44–52.
- , , . Hospital performance reports: impact on quality, market share, and reputation. Health Aff (Millwood). 2005;24(4):1150–1160.
- , , , . The savings illusion—why clinical quality improvement fails to deliver bottom‐line results. N Engl J Med. 2011;365(26):e48.
- , , , , . Hospital Quality: Ingredients for Success—Overview and Lessons Learned. New York, NY: Commonwealth Fund; 2004.
- , , . Hospital Quality Improvement: Strategies and Lessons from U.S. Hospitals. New York, NY: Commonwealth Fund; 2007.
- , , , et al. Hospital financial condition and operational decisions related to the quality of hospital care. Med Care Res Rev. 2007;64(2):148–168.
- , , , , , . Will pay‐for‐performance and quality reporting affect health care disparities? Health Aff (Millwood). 2007;26(3):w405–w414.
- , , . Comparison of change in quality of care between safety‐net and non‐safety‐net hospitals. JAMA. 2008;299(18):2180–2187.
- , . Could Medicare readmission policy exacerbate health care system inequity? Ann Intern Med. 2010;152(2):114–117.
- , . Minding the gap between efforts to reduce readmissions and disparities. JAMA. 2011;305(7):715–716.
- , . Medicare Health Support Pilot Program. N Engl J Med. 2012;366(7):666; author reply 667–668.
- , . Revisiting hospital readmissions. JAMA. 2013;309(4):398–400.
- , . Hospital finances and patient safety outcomes. Inquiry. 2005;42(1):60–72.
- , , . The association between hospital margins, quality of care, and closure or other change in operating status. J Gen Intern Med. 2011;26(11):1291–1296.
- , , , . Hospital financial condition and the quality of patient care. Health Econ. 2008;17(8):977–995.
- State of California Office of Statewide Health Planning and Development. Healthcare Information Division. Annual financial data. Available at: http://www.oshpd.ca.gov/HID/Products/Hospitals/AnnFinanData/PivotProfles/default.asp. Accessed June 23, 2015.
- Centers for Medicare 4(1):11–13.
- , , , et al. Quality of care for acute myocardial infarction at urban safety‐net hospitals. Health Aff (Millwood). 2007;26(1):238–248.
- , , , et al. The Hospital Compare mortality model and the volume‐outcome relationship. Health Serv Res. 2010;45(5 Pt 1):1148–1167.
- . Exploratory Data Analysis. Boston, MA: Addison‐Wesley; 1977.
- , , , et al. Limits of readmission rates in measuring hospital quality suggest the need for added metrics. Health Aff (Millwood). 2013;32(6):1083–1091.
- , , , et al. Hospital performance measures and 30‐day readmission rates. J Gen Intern Med. 2013;28(3):377–385.
- , , , et al. Public reporting and pay for performance in hospital quality improvement. N Engl J Med. 2007;356(5):486–496.
- , , , et al. Usual source of care and outcomes following acute myocardial infarction. J Gen Intern Med. 2014;29(6):862–869.
- , . Public reporting on hospital process improvements is linked to better patient outcomes. Health Aff (Millwood). 2010;29(7):1319–1324.
- , , , . Variation in length of stay and outcomes among hospitalized patients attributable to hospitals and hospitalists. J Gen Intern Med. 2013;28(3):370–376.
- , , , , . Variation in the risk of readmission among hospitals: the relative contribution of patient, hospital and inpatient provider characteristics. J Gen Intern Med. 2014;29(4):572–578.
- , , , et al. Transitional care after hospitalization for acute stroke or myocardial infarction: a systematic review. Ann Intern Med. 2012;157(6):407–416.
- , , , . The inverse relationship between mortality rates and performance in the Hospital Quality Alliance measures. Health Aff (Millwood). 2007;26(4):1104–1110.
- , , , et al. An automated model to identify heart failure patients at risk for 30‐day readmission or death using electronic medical record data. Med Care. 2010;48(11):981–988.
- , , . Indications of biased risk adjustment in the hospital readmission reduction program. J Ambul Care Manage. 2015;38(1):39–47.
Hospital care accounts for the single largest category of national healthcare expenditures, totaling $936.9 billion in 2013.[1] With ongoing scrutiny of US healthcare spending, hospitals are under increasing pressure to justify high costs and robust profits.[2] However, the dominant fee‐for‐service reimbursement model creates incentives for hospitals to prioritize high volume over high‐quality care to maximize profits.[3] Because hospitals may be reluctant to implement improvements if better quality is not accompanied by better payment or improved financial margins, an approach to stimulate quality improvement among hospitals has been to leverage consumer pressure through required public reporting of selected outcome metrics.[4, 5] Public reporting of outcomes is thought to influence hospital reputation; in turn, reputation affects patient perceptions and influences demand for hospital services, potentially enabling reputable hospitals to command higher prices for services to enhance hospital revenue.[6, 7]
Though improving outcomes is thought to reduce overall healthcare costs, it is unclear whether improving outcomes results in a hospital's financial return on investment.[4, 5, 8] Quality improvement can require substantial upfront investment, requiring that hospitals already have robust financial health to engage in such initiatives.[9, 10] Consequently, instead of stimulating broad efforts in quality improvement, public reporting may exacerbate existing disparities in hospital quality and finances, by rewarding already financially healthy hospitals, and by inadvertently penalizing hospitals without the means to invest in quality improvement.[11, 12, 13, 14, 15] Alternately, because fee‐for‐service remains the dominant reimbursement model for hospitals, loss of revenue through reducing readmissions may outweigh any financial gains from improved public reputation and result in worse overall financial performance, though robust evidence for this concern is lacking.[16, 17]
A small number of existing studies suggest a limited correlation between improved hospital financial performance and improved quality, patient safety, and lower readmission rates.[18, 19, 20] However, these studies had several limitations. They were conducted prior to public reporting of selected outcome metrics by the Centers for Medicare and Medicaid Services (CMS)[18, 19, 20]; used data from the Medicare Cost Report, which is not uniformly audited and thus prone to measurement error[19, 20]; used only relative measures of hospital financial performance (eg, operating margin), which do not capture the absolute amount of revenue potentially available for investment in quality improvement[18, 19]; or compared only hospitals at the extremes of financial performance, potentially exaggerating the magnitude of the relationship between hospital financial performance and quality outcomes.[19]
To address this gap in the literature, we sought to assess whether hospitals with robust financial performance have lower 30‐day risk‐standardized mortality and hospital readmission rates for acute myocardial infarction (AMI), congestive heart failure (CHF), and pneumonia (PNA). Given the concern that hospitals with the lowest mortality and readmission rates may experience a decrease in financial performance due to the lower volume of hospitalizations, we also assessed whether hospitals with the lowest readmission and mortality rates had a differential change in financial performance over time compared to hospitals with the highest rates.
METHODS
Data Sources and Study Population
This was an observational study using audited financial data from the 2008 and 2012 Hospital Annual Financial Data Files from the Office of Statewide Health Planning and Development (OSHPD) in the state of California, merged with data on outcome measures publicly reported by CMS via the Hospital Compare website for July 1, 2008 to June 30, 2011.[21, 22] We included all general acute care hospitals with available OSHPD data in 2008 and at least 1 publicly reported outcome from 2008 to 2011. We excluded hospitals without 1 year of audited financial data for 2008 and hospitals that closed during 2008 to 2011.
Measures of Financial Performance
Because we hypothesized that the absolute amount of revenue generated from clinical operations would influence investment in quality improvement programs more so than relative changes in revenue,[20] we used net revenue from operations (total operating revenue minus total operating expense) as our primary measure of hospital financial performance. We also performed 2 companion analyses using 2 commonly reported relative measures of financial performanceoperating margin (net revenue from operations divided by total operating revenue) and total margin (net total revenue divided by total revenue from all sources). Net revenue from operations for 2008 was adjusted to 2012 US dollars using the chained Consumer Price Index for all urban consumers.
Outcomes
For our primary analysis, the primary outcomes were publicly reported all‐cause 30‐day risk‐standardized mortality rates (RSMR) and readmission rates (RSRR) for AMI, CHF, and PNA aggregated over a 3‐year period. These measures were adjusted for key demographic and clinical characteristics available in Medicare data. CMS began publicly reporting 30‐day RSMR for AMI and CHF in June 2007, RSMR for PNA in June 2008, and RSRR for all 3 conditions in July 2009.[23, 24]
To assess whether public reporting had an effect on subsequent hospital financial performance, we conducted a companion analysis where the primary outcome of interest was change in hospital financial performance over time, using the same definitions of financial performance outlined above. For this companion analysis, publicly reported 30‐day RSMR and RSRR for AMI, CHF, and PNA were assessed as predictors of subsequent financial performance.
Hospital Characteristics
Hospital characteristics were ascertained from the OSHPD data. Safety‐net status was defined as hospitals with an annual Medicaid caseload (number of Medicaid discharges divided by the total number of discharges) 1 standard deviation above the mean Medicaid caseload, as defined in previous studies.[25]
Statistical Analyses
Effect of Baseline Financial Performance on Subsequent Publicly Reported Outcomes
To estimate the relationship between baseline hospital financial performance in 2008 and subsequent RSMR and RSRR for AMI, CHF, and PNA from 2008 to 2011, we used linear regression adjusted for the following hospital characteristics: teaching status, rural location, bed size, safety‐net status, ownership, Medicare caseload, and volume of cases reported for the respective outcome. We accounted for clustering of hospitals by ownership. We adjusted for hospital volume of reported cases for each condition given that the risk‐standardization models used by CMS shrink outcomes for small hospitals to the mean, and therefore do not account for a potential volume‐outcome relationship.[26] We conducted a sensitivity analysis excluding hospitals at the extremes of financial performance, defined as hospitals with extreme outlier values for each financial performance measure (eg, values more than 3 times the interquartile range above the first quartile or below the third quartile).[27] Nonlinearity of financial performance measures was assessed using restricted cubic splines. For ease of interpretation, we scaled the estimated change in RSMR and RSRR per $50 million increase in net revenue from operations, and graphed nonparametric relationships using restricted cubic splines.
Effect of Public Reporting on Subsequent Hospital Financial Performance
To assess whether public reporting had an effect on subsequent hospital financial performance, we conducted a companion hospital‐level difference‐in‐differences analysis to assess for differential changes in hospital financial performance between 2008 and 2012, stratified by tertiles of RSMR and RSRR rates from 2008 to 2011. This approach compares differences in an outcome of interest (hospital financial performance) within each group (where each group is a tertile of publicly reported rates of RSMR or RSRR), and then compares the difference in these differences between groups. Therefore, these analyses use each group as their own historical control and the opposite group as a concurrent control to account for potential secular trends. To conduct our difference‐in‐differences analysis, we compared the change in financial performance over time in the top tertile of hospitals to the change in financial performance over time in the bottom tertile of hospitals with respect to AMI, CHF, and PNA RSMR and RSRR. Our models therefore included year (2008 vs 2012), tertile of publicly reported rates for RSMR or RSRR, and the interaction between them as predictors, where the interaction was the difference‐in‐differences term and the primary predictor of interest. In addition to adjusting for hospital characteristics and accounting for clustering as mentioned above, we also included 3 separate interaction terms for year with bed size, safety‐net status, and Medicare caseload, to account for potential changes in the hospitals over time that may have independently influenced financial performance and publicly reported 30‐day measures. For sensitivity analyses, we repeated our difference‐in‐differences analyses excluding hospitals with a change in ownership and extreme outliers with respect to financial performance in 2008. We performed model diagnostics including assessment of functional form, linearity, normality, constant variance, and model misspecification. All analyses were conducted using Stata version 12.1 (StataCorp, College Station, TX). This study was deemed exempt from review by the UT Southwestern Medical Center institutional review board.
RESULTS
Among the 279 included hospitals (see Supporting Figure 1 in the online version of this article), 278 also had financial data available for 2012. In 2008, the median net revenue from operations was $1.6 million (interquartile range [IQR], $2.4 to $10.3 million), the median operating margin was 1.5% (IQR, 4.6% to 6%), and the median total margin was 2.5% (IQR, 2.2% to 7.5% (Table 1). The number of hospitals reporting each outcome, and median outcome rates, are shown in Table 2.
| 2008, n = 279 | 2012, n = 278 | |
|---|---|---|
| ||
| Hospital characteristics | ||
| Teaching, n (%) | 28 (10.0) | 28 (10.0) |
| Rural, n (%) | 55 (19.7) | 55 (19.7) |
| Bed size, n (%) | ||
| 099 (small) | 57 (20.4) | 55 (19.8) |
| 100299 (medium) | 130 (46.6) | 132 (47.5) |
| 300 (large) | 92 (33.0) | 91 (32.7) |
| Safety‐net hospital, n (%)* | 46 (16.5) | 48 (17.3) |
| Hospital ownership, n (%) | ||
| City or county | 15 (5.4) | 16 (5.8) |
| District | 42 (15.1) | 39 (14.0) |
| Investor | 66 (23.7) | 66 (23.7) |
| Private nonprofit | 156 (55.9) | 157 (56.5) |
| Medicare caseload, mean % (SD) | 41.6 (14.7) | 43.6 (14.7) |
| Financial performance measures | ||
| Net revenue from operations, median $ in millions (IQR; range) | 1.6 (2.4 to 10.3; 495.9 to 144.1) | 3.2 (2.9 to 15.4; 396.2 to 276.8) |
| Operating margin, median % (IQR; range) | 1.5 (4.6 to 6.8; 77.8 to 26.4) | 2.3 (3.9 to 8.2; 134.8 to 21.1) |
| Total margin, median % (IQR; range) | 2.5 (2.2 to 7.5; 101.0 to 26.3) | 4.5 (0.7 to 9.8; 132.2 to 31.1) |
| No. | Median % (IQR) | Adjusted % Change (95% CI) per $50 Million Increase in Net Revenue From Operations | ||
|---|---|---|---|---|
| Overall | Extreme Outliers Excluded | |||
| ||||
| Myocardial infarction | ||||
| Mortality rate | 211 | 15.2 (14.216.2) | 0.07 (0.10 to 0.24) | 0.63 (0.21 to 1.48) |
| Readmission rate | 184 | 19.4 (18.520.2) | Nonlinear | 0.34 (1.17 to 0.50) |
| Congestive heart failure | ||||
| Mortality rate | 259 | 11.1 (10.112.1) | 0.17 (0.01 to 0.35) | Nonlinear∥ |
| Readmission rate | 264 | 24.5 (23.525.6) | 0.07 (0.27 to 0.14) | 0.45 (1.36 to 0.47) |
| Pneumonia | ||||
| Mortality rate | 268 | 11.6 (10.413.2) | 0.17 (0.42 to 0.07) | 0.35 (1.19 to 0.49) |
| Readmission rate | 268 | 18.2 (17.319.1) | 0.04 (0.20 to 0.11) | 0.56 (1.27 to 0.16) |
Relationship Between Financial Performance and Publicly Reported Outcomes
Acute Myocardial Infarction
We did not observe a consistent relationship between hospital financial performance and AMI mortality and readmission rates. In our overall adjusted analyses, net revenue from operations was not associated with mortality, but was significantly associated with a decrease in AMI readmissions among hospitals with net revenue from operations between approximately $5 million to $145 million (nonlinear relationship, F statistic = 4.8, P 0.001 (Table 2, Figure 1A). However, after excluding 23 extreme outlying hospitals by net revenue from operations (10 underperformers with net revenue $49.4 million and 13 overperformers with net revenue >$52.1 million), this relationship was no longer observed. Using operating margin instead of net revenue from operations as the measure of hospital financial performance, we observed a 0.2% increase in AMI mortality (95% confidence interval [CI]: 0.06%‐0.35%) (see Supporting Table 1 and Supporting Figure 2 in the online version of this article) for each 10% increase in operating margin, which persisted with the exclusion of 5 outlying hospitals by operating margin (all 5 were underperformers, with operating margins 38.6%). However, using total margin as the measure of financial performance, there was no significant relationship with either mortality or readmissions (see Supporting Table 2 and Supporting Figure 3 in the online version of this article).
Congestive Heart Failure
In our primary analyses, we did not observe a significant relationship between net revenue from operations and CHF mortality and readmission rates. However, after excluding 23 extreme outliers, increasing net revenue from operations was associated with a modest increase in CHF mortality among hospitals, with net revenue between approximately $35 million and $20 million (nonlinear relationship, F statistic = 3.6, P = 0.008 (Table 2, Figure 1B). Using alternate measures of financial performance, we observed a consistent relationship between increasing hospital financial performance and higher 30‐day CHF mortality rate. Using operating margin, we observed a slight increase in the mortality rate for CHF (0.26% increase in CHF RSMR for every 10% increase in operating margin) (95% CI: 0.07%‐0.45%) (see Supporting Table 1 and Supporting Figure 2 in the online version of this article), which persisted after the exclusion of 5 extreme outliers. Using total margin, we observed a significant but modest association between improved hospital financial performance and increased mortality rate for CHF (nonlinear relationship, F statistic = 2.9, P = 0.03) (see Supporting Table 2 and Supporting Figure 3 in the online version of this article), which persisted after the exclusion of 3 extreme outliers (0.32% increase in CHF RSMR for every 10% increase in total margin) (95% CI: 0.03%‐0.62%).
Pneumonia
Hospital financial performance (using net revenue, operating margin, or total margin) was not associated with 30‐day PNA mortality or readmission rates.
Relationship of Readmission and Mortality Rates on Subsequent Hospital Financial Performance
Compared to hospitals in the highest tertile of readmission and mortality rates (ie, those with the worst rates), hospitals in the lowest tertile of readmission and mortality rates (ie, those with the best rates) had a similar magnitude of increase in net revenue from operations from 2008 to 2012 (Table 3). The difference‐in‐differences analyses showed no relationship between readmission or mortality rates for AMI, CHF, and PNA and changes in net revenue from operations from 2008 to 2012 (difference‐in‐differences estimates ranged from $8.61 to $6.77 million, P > 0.3 for all). These results were robust to the exclusion of hospitals with a change in ownership and extreme outliers by net revenue from operations (data not reported).
| Outcome | Tertile With Highest Outcome Rates (Worst Hospitals) | Tertile With Lowest Outcome Rates (Best Hospitals) | Difference in Net From Operations Differences Between Highest and Lowest Outcome Rate Tertiles, $ Million (95% CI) | P | ||
|---|---|---|---|---|---|---|
| Outcome, Median % (IQR) | Gain/Loss in Net Revenue From Operations From 2008 to 2012, $ Million* | Outcome, Median % (IQR) | Gain/Loss in Net Revenue from Operations From 2008 to 2012, $ Million* | |||
| ||||||
| AMI mortality | 16.7 (16.217.4) | +65.62 | 13.8 (13.314.2) | +74.23 | 8.61 (27.95 to 10.73) | 0.38 |
| AMI readmit | 20.7 (20.321.5) | +38.62 | 18.3 (17.718.6) | +31.85 | +6.77 (13.24 to 26.77) | 0.50 |
| CHF mortality | 13.0 (12.313.9) | +45.66 | 9.6 (8.910.1) | +48.60 | 2.94 (11.61 to 5.73) | 0.50 |
| CHF readmit | 26.2 (25.726.9) | +47.08 | 23.0 (22.323.5) | +46.08 | +0.99 (10.51 to 12.50) | 0.87 |
| PNA mortality | 13.9 (13.314.7) | +43.46 | 9.9 (9.310.4) | +38.28 | +5.18 (7.01 to 17.37) | 0.40 |
| PNA readmit | 19.4 (19.120.1) | +47.21 | 17.0 (16.517.3) | +45.45 | +1.76 (8.34 to 11.86) | 0.73 |
DISCUSSION
Using audited financial data from California hospitals in 2008 and 2012, and CMS data on publicly reported outcomes from 2008 to 2011, we found no consistent relationship between hospital financial performance and publicly reported outcomes for AMI and PNA. However, better hospital financial performance was associated with a modest increase in 30‐day risk‐standardized CHF mortality rates, which was consistent across all 3 measures of hospital financial performance. Reassuringly, there was no difference in the change in net revenue from operations between 2008 and 2012 between hospitals in the highest and lowest tertiles of readmission and mortality rates for AMI, CHF, and PNA. In other words, hospitals with the lowest rates of 30‐day readmissions and mortality for AMI, CHF, and PNA did not experience a loss in net revenue from operations over time, compared to hospitals with the highest readmission and mortality rates.
Our study differs in several important ways from Ly et al., the only other study to our knowledge that investigated the relationship between hospital financial performance and outcomes for patients with AMI, CHF, and PNA.[19] First, outcomes in the Ly et al. study were ascertained in 2007, which preceded public reporting of outcomes. Second, the primary comparison was between hospitals in the bottom versus top decile of operating margin. Although Ly and colleagues also found no association between hospital financial performance and mortality rates for these 3 conditions, they found a significant absolute decrease of approximately 3% in readmission rates among hospitals in the top decile of operating margin versus those in bottom decile. However, readmission rates were comparable among the remaining 80% of hospitals, suggesting that these findings primarily reflected the influence of a few outlier hospitals. Third, the use of nonuniformly audited hospital financial data may have resulted in misclassification of financial performance. Our findings also differ from 2 previous studies that identified a modest association between improved hospital financial performance and decreased adverse patient safety events.[18, 20] However, publicly reported outcomes may not be fully representative of hospital quality and patient safety.[28, 29]
The limited association between hospital financial performance and publicly reported outcomes for AMI and PNA is noteworthy for several reasons. First, publicly reporting outcomes alone without concomitant changes to reimbursement may be inadequate to create strong financial incentives for hospital investment in quality improvement initiatives. Hospitals participating in both public reporting of outcomes and pay‐for‐performance have been shown to achieve greater improvements in outcomes than hospitals engaged only in public reporting.[30] Our time interval for ascertainment of outcomes preceded CMS implementation of the Hospital Readmissions Reduction Program (HRRP) in October 2012, which withholds up to 3% of Medicare hospital reimbursements for higher than expected mortality and readmission rates for AMI, CHF, and PNA. Once outcomes data become available for a 3‐year post‐HRRP implementation period, the impact of this combined approach can be assessed. Second, because adherence to many evidence‐based process measures for these conditions (ie, aspirin use in AMI) is already high, there may be a ceiling effect present that obviates the need for further hospital financial investment to optimize delivery of best practices.[31, 32] Third, hospitals themselves may contribute little to variation in mortality and readmission risk. Of the total variation in mortality and readmission rates among Texas Medicare beneficiaries, only about 1% is attributable to hospitals, whereas 42% to 56% of the variation is explained by differences in patient characteristics.[33, 34] Fourth, there is either low‐quality or insufficient evidence that transitional care interventions specifically targeted to patients with AMI or PNA result in better outcomes.[35] Thus, greater financial investment in hospital‐initiated and postdischarge transitional care interventions for these specific conditions may result in less than the desired effect. Lastly, many hospitalizations for these conditions are emergency hospitalizations that occur after patients present to the emergency department with unexpected and potentially life‐threatening symptoms. Thus, patients may not be able to incorporate the reputation or performance metrics of a hospital in their decisions for where they are hospitalized for AMI, CHF, or PNA despite the public reporting of outcomes.
Given the strong evidence that transitional care interventions reduce readmissions and mortality among patients hospitalized with CHF, we were surprised to find that improved hospital financial performance was associated with an increased risk‐adjusted CHF mortality rate.[36] This association held true for all 3 different measures of hospital financial performance, suggesting that this unexpected finding is unlikely to be the result of statistical chance, though potential reasons for this association remain unclear. One possibility is that the CMS model for CHF mortality may not adequately risk adjust for severity of illness.[37, 38] Thus, robust financial performance may be a marker for hospitals with more advanced heart failure services that care for more patients with severe illness.
Our findings should be interpreted in the context of certain limitations. Our study only included an analysis of outcomes for AMI, CHF, and PNA among older fee‐for‐service Medicare beneficiaries aggregated at the hospital level in California between 2008 and 2012, so generalizability to other populations, conditions, states, and time periods is uncertain. The observational design precludes a robust causal inference between financial performance and outcomes. For readmissions, rates were publicly reported for only the last 2 years of the 3‐year reporting period; thus, our findings may underestimate the association between hospital financial performance and publicly reported readmission rates.
CONCLUSION
There is no consistent relationship between hospital financial performance and subsequent publicly reported outcomes for AMI and PNA. However, for unclear reasons, hospitals with better financial performance had modestly higher CHF mortality rates. Given this limited association, public reporting of outcomes may have had less than the intended impact in motivating hospitals to invest in quality improvement. Additional financial incentives in addition to public reporting, such as readmissions penalties, may help motivate hospitals with robust financial performance to further improve outcomes. This would be a key area for future investigation once outcomes data are available for the 3‐year period following CMS implementation of readmissions penalties in 2012. Reassuringly, there was no association between low 30‐day mortality and readmissions rates and subsequent poor financial performance, suggesting that improved outcomes do not necessarily lead to loss of revenue.
Disclosures
Drs. Nguyen, Halm, and Makam were supported in part by the Agency for Healthcare Research and Quality University of Texas Southwestern Center for Patient‐Centered Outcomes Research (1R24HS022418‐01). Drs. Nguyen and Makam received funding from the University of Texas Southwestern KL2 Scholars Program (NIH/NCATS KL2 TR001103). The study sponsors had no role in design and conduct of the study; collection, management, analysis, and interpretation of the data; and preparation, review, or approval of the manuscript. The authors have no conflicts of interest to disclose.
- Centers for Medicare and Medicaid Services. Office of the Actuary. National Health Statistics Group. National Healthcare Expenditures Data. Baltimore, MD; 2013. https://www.cms.gov/Research-Statistics-Data-and-Systems/Statistics-Trends-and-Reports/NationalHealthExpendData/NationalHealthAccountsHistorical.html. Accessed February 16, 2016.
- . Bitter pill: why medical bills are killing us. Time Magazine. February 20, 2013:16–55.
- . Fee‐for‐service will remain a feature of major payment reforms, requiring more changes in Medicare physician payment. Health Aff (Millwood). 2012;31(9):1977–1983.
- , , , et al. The business case for quality: case studies and an analysis. Health Aff (Millwood). 2003;22(2):17–30.
- , , , . Public reporting on quality in the United States and the United Kingdom. Health Aff (Millwood). 2003;22(3):134–148.
- , , , , . The business case for health‐care quality improvement. J Patient Saf. 2013;9(1):44–52.
- , , . Hospital performance reports: impact on quality, market share, and reputation. Health Aff (Millwood). 2005;24(4):1150–1160.
- , , , . The savings illusion—why clinical quality improvement fails to deliver bottom‐line results. N Engl J Med. 2011;365(26):e48.
- , , , , . Hospital Quality: Ingredients for Success—Overview and Lessons Learned. New York, NY: Commonwealth Fund; 2004.
- , , . Hospital Quality Improvement: Strategies and Lessons from U.S. Hospitals. New York, NY: Commonwealth Fund; 2007.
- , , , et al. Hospital financial condition and operational decisions related to the quality of hospital care. Med Care Res Rev. 2007;64(2):148–168.
- , , , , , . Will pay‐for‐performance and quality reporting affect health care disparities? Health Aff (Millwood). 2007;26(3):w405–w414.
- , , . Comparison of change in quality of care between safety‐net and non‐safety‐net hospitals. JAMA. 2008;299(18):2180–2187.
- , . Could Medicare readmission policy exacerbate health care system inequity? Ann Intern Med. 2010;152(2):114–117.
- , . Minding the gap between efforts to reduce readmissions and disparities. JAMA. 2011;305(7):715–716.
- , . Medicare Health Support Pilot Program. N Engl J Med. 2012;366(7):666; author reply 667–668.
- , . Revisiting hospital readmissions. JAMA. 2013;309(4):398–400.
- , . Hospital finances and patient safety outcomes. Inquiry. 2005;42(1):60–72.
- , , . The association between hospital margins, quality of care, and closure or other change in operating status. J Gen Intern Med. 2011;26(11):1291–1296.
- , , , . Hospital financial condition and the quality of patient care. Health Econ. 2008;17(8):977–995.
- State of California Office of Statewide Health Planning and Development. Healthcare Information Division. Annual financial data. Available at: http://www.oshpd.ca.gov/HID/Products/Hospitals/AnnFinanData/PivotProfles/default.asp. Accessed June 23, 2015.
- Centers for Medicare 4(1):11–13.
- , , , et al. Quality of care for acute myocardial infarction at urban safety‐net hospitals. Health Aff (Millwood). 2007;26(1):238–248.
- , , , et al. The Hospital Compare mortality model and the volume‐outcome relationship. Health Serv Res. 2010;45(5 Pt 1):1148–1167.
- . Exploratory Data Analysis. Boston, MA: Addison‐Wesley; 1977.
- , , , et al. Limits of readmission rates in measuring hospital quality suggest the need for added metrics. Health Aff (Millwood). 2013;32(6):1083–1091.
- , , , et al. Hospital performance measures and 30‐day readmission rates. J Gen Intern Med. 2013;28(3):377–385.
- , , , et al. Public reporting and pay for performance in hospital quality improvement. N Engl J Med. 2007;356(5):486–496.
- , , , et al. Usual source of care and outcomes following acute myocardial infarction. J Gen Intern Med. 2014;29(6):862–869.
- , . Public reporting on hospital process improvements is linked to better patient outcomes. Health Aff (Millwood). 2010;29(7):1319–1324.
- , , , . Variation in length of stay and outcomes among hospitalized patients attributable to hospitals and hospitalists. J Gen Intern Med. 2013;28(3):370–376.
- , , , , . Variation in the risk of readmission among hospitals: the relative contribution of patient, hospital and inpatient provider characteristics. J Gen Intern Med. 2014;29(4):572–578.
- , , , et al. Transitional care after hospitalization for acute stroke or myocardial infarction: a systematic review. Ann Intern Med. 2012;157(6):407–416.
- , , , . The inverse relationship between mortality rates and performance in the Hospital Quality Alliance measures. Health Aff (Millwood). 2007;26(4):1104–1110.
- , , , et al. An automated model to identify heart failure patients at risk for 30‐day readmission or death using electronic medical record data. Med Care. 2010;48(11):981–988.
- , , . Indications of biased risk adjustment in the hospital readmission reduction program. J Ambul Care Manage. 2015;38(1):39–47.

Identifying an Idle Line for Its Removal
Infections acquired in the hospital are termed healthcare‐associated infections (HAIs) and include central lineassociated blood stream infections (CLABSIs). Among HAIs, CLABSIs cause the highest number of preventable deaths.[1] Central venous catheters (CVCs) or central lines are commonly used in the hospital.[2] Each year their use is linked to 250,000 cases of CLABSIs in the United States.[3] Some CLABSIs may be prevented by the prompt removal of the line.[4] However, CVCs are often retained after their clinical indication has lapsed and are then referred to as idle lines.[5, 6] In this work, we propose and theoretically test a guideline to facilitate the safe removal of an idle line by observing the agreement and disagreement between actual practice and the proposed guideline.
METHODS
Setting
This work was conducted at a large, urban, tertiary care, academic health center in the United States as a collaborative effort to improve quality at our institution.[7]
Design and Patients
The reports linked with the electronic medical records at our institution include a daily, ward‐by‐ward listing of patients who have access other than a peripheral line in place. This central line dashboard accesses the information on intravenous access charted by bedside nurses to create a list of patients on every ward who have any kind of central access. Temporary central venous lines (CVLs), peripherally inserted central catheters (PICCs), ports, and dialysis catheters are all included. The unit charge nurses and managers use this dashboard to facilitate compliance with line care bundles. We used this source to identify patients with either type of CVC (CVLs or PICCs) on 8 days in August 2014, September 2014, and October 2014. Patients were included if they had a CVC and were on a general medical or surgical ward bed on audit day. CVLs at all sites were included (femoral, subclavian, and internal jugular). Patients in an intensive care unit (ICU) or progressive care unit on the day of the audit were excluded. Patients whose catheters were for chemotherapy and those admitted for a transplant or receiving palliative or hospice care were also excluded.
Data Collection
A protocol for data collection was written out, and a training session was held to review definitions, data sources, and methods to ensure consistency. Two authors (M.M. and J.D.) assisted by an experienced clinical nurse specialist collected data on the patients captured on audit days. Each chart was reviewed on the day of the audit, the 2 days preceding the audit day, and then followed until the patient was either discharged from the hospital or transferred to a higher level of care, died, or transitioned to palliative or hospice care. Demographics, details about the line, and the criteria for justified use were extracted from the electronic medical record.
Definitions
Justified and Idle Days
To justify the presence of a CVC on any given day, we used criteria that fell under 3 categories: intravenous (IV) access needs, unstable vitals, or meeting sepsis/systemic inflammatory response syndrome (SIRS) criteria (Table 1). For vital signs, a single abnormal reading was counted as fulfilling criteria for that day. If no criterion for justified use was met, the line was considered idle for that day.
|
| IV access needs |
| Expected duration of IV antibiotics >6 days |
| Administration of TPN |
| Anticipated requirement of home IV medications |
| Requirement of IV medications with documented difficult access |
| Hemorrhage requiring blood transfusions |
| Requiring more than 3 infusions |
| Requiring more than 2 infusions and blood transfusions |
| Abnormal vitals |
| Diastolic blood pressure >120 mm Hg |
| Systolic blood pressure 90 mm Hg |
| Systolic blood pressure >200 mm Hg |
| Heart rate >120 beats per minute |
| Heart rate 50 beats per minute |
| Respiratory rate >30 breaths per minute |
| Respiratory rate 10 breaths per minute |
| Oxygen saturation 90% as measured by pulse oximetry |
| Meeting SIRS criteria (2 or more of the following present) |
| Temp >38C, Temp 36C, heart rate >90 beats per minute, respiratory rate >20 breaths per minute, WBC >12,000/mm3, WBC 1,000/mm3, bandemia >10% |
Qualifying IV access needs were defined similarly to those previously used,[5, 6] whereas those for SIRS followed the current consensus.[8] To determine the number of IV medications or infusions, the medication administration record was reviewed. If 3 or more infusions were found, their compatibility was checked using the same database that nurses use at our institution. Difficult IV access was inferred from the indication for line placement, coupled with the absence of documentation of a peripheral IV. Clinical progress notes were reviewed to extract information on the length of proposed IV antibiotic courses, and discharge instructions were reviewed to verify whether the line was removed prior to discharge or not. The cutoffs for diastolic blood pressure, respiratory rate, and oxygen saturation used to label patients hemodynamically labile are the same as those used by previous authors and also constitute the definition of hypertensive urgency.[5, 9] However, we diverged from the values previously used for tachycardia, bradycardia, and systolic hypotension using heart rates >120 and 50 beats per minute (compared to >130 and 40 beats per minute) and systolics 90 mm Hg (compared to 80 mm Hg) to justify the line.[5] Early warning scores have been used to identify hospitalized ward patients who are at risk for clinical deterioration. Although each score utilizes different thresholds, the risk for clinical deterioration increases as the vitals worsen.[10] Bearing this in mind, the thresholds we elected to use are more clinically conservative and also parallel the nursing call orders currently used at our institution.
Proposed Guideline
We propose the guideline that a CVC may be safely removed the day after the first idle day.
RESULTS
A total of 126 lines were observed in 126 patients. Eighty‐three (65.9%) of the lines were PICCs. The remaining 43 (34.1%) were CVLs. The indications for line placement were distributed between the need for central access, total parenteral nutrition, or antibiotics (Table 2).
| Description | Value |
|---|---|
| |
| Age in yrs mean (SD) | 55.7 (18) |
| Gender, n (%) | |
| Female | 66 (52.4) |
| Male | 60 (47.6) |
| Type of line, n (%) | |
| PICC | 83 (65.9) |
| CVL | 43 (34.1) |
| Indication for line placement, n (%) | |
| Meds requiring central access or TPN | 36 (28.6) |
| Antibiotics | 34 (27.0) |
| Hemodynamic instability | 30 (23.8) |
| Poor access with multiple IV medications | 18 (14.3) |
| Unknown | 8 (6.3) |
| Line removed prior to discharge, n (%) | |
| Yes | 76 (60.3) |
| No | 50 (39.7) |
Out of the 126 patients, 50 (39.7%) were discharged from the hospital, died, were transferred to a higher level of care, or transitioned to palliative or hospice care with the line in place. In the remaining 76 patients, the audit captured 635 days, out of which a line was in place for 522 (82.2%) days. Of these 522 days, the line's presence was justified by our criteria for 351 (67.2%) days. The most common reason for a line to be justified on any given day was the need for antibiotics followed by the presence of SIRS criteria (Table 3). The remaining 171 (32.7%) days were idle.
| Criteria | N | % |
|---|---|---|
| ||
| No. of factors justifying use | ||
| 1 | 184 | 52.4% |
| 2 | 127 | 36.2% |
| >2 | 40 | 11.4 |
| Reason for justifying line* | ||
| Anticipate home or >6 days of antibiotic use | 181 | 51.6 |
| SIRS criteria | 124 | 35.3 |
| TPN | 96 | 27.4 |
| Hemodynamic instability based on hr and bp | 78 | 22.2 |
| Poor access with need for IV medications | 57 | 16.2 |
| Respiratory rate (10 or >30/minute) | 25 | 7.1 |
| Active hemorrhage requiring transfusions | 12 | 3.4 |
| >3 infusions | 6 | 1.7 |
A comparison of the actual removal of the 76 central lines in practice relative to the proposed guideline of removing it the day following the first idle day is displayed in Figure 1. The central line was removed prior to our proposed guideline in 11 (14.5%) patients, and waiting for an idle day in these patients would have added 46 line days. In almost half the patients (n = 36, 47.4%), the line was removed in agreement with the proposed guideline. None of the patients in whom the line was removed prior to or in accordance with our proposed guideline required a line reinsertion. Line removal was delayed in 29 (38.2%) patients when compared to our proposed guideline. In these patients, following the guideline would have created 122 line‐free days. Most (n = 102, 83.6%) of these potential line‐free days were idle. Twenty (16.4%) were justified, of which half (n = 10) were justified by meeting SIRS criteria.

DISCUSSION
Approximately 1 in every 25 inpatients in the United States has at least 1 HAI on any given day.[11] The case fatality rate from a CLABSI may be as high as 12%, and up to 70% of these infections may be preventable.[1, 12] Interventions successful in decreasing CLABSIs have focused on patients in ICUs.[13] However, CVCs are increasingly prevalent outside the ICU, with over 4.5 million line days in non‐ICU beds reported to the National Healthcare Safety Network in 2012 compared to 2.5 million in 2010.[2, 14] However, adherence rates to infection control practices may be lower on the wards than in the ICUs.[6, 15] Consequently, although the number of CLABSIs has declined over the last decade, most are now occurring outside the ICU.[16] These trends underscore the need to develop strategies aimed at CLABSI prevention on the floors.
Analogous to the life cycle of a urinary catheter described by Meddings et al.,[17] strategies to prevent CLABSIs and other CVC‐related complications may be designed around the life cycle of a CVC. The life cycle starts with insertion and moves on to the maintenance, removal, and possible reinsertion of the line. The process thus starts with the decision to place the line. Over the last decade, this decision making has changed in part due to PICCs. This shift is reflected in PICC prevalence rates: in 2001, 11% of audited central lines were PICCs compared to 56% in 2007.[5, 6] In our audit, 66% of the CVCs were PICCs. This increase in the use of PICCs may be attributable to the ease and safety of their placement coupled with the increased availability of vascular access placement teams.[18] The risk of overuse that may result from such expediency may be countered by adhering to guidelines such as the Michigan Appropriateness Guide for Intravenous Catheters, which provides both clinically detailed guidance and an impetus for reflective decision making around intravenous access.[19]
The placement of CVCs for prolonged parenteral antibiotics may be a particular subset that bears further exploration. Similar to previous reports, we found that a large number of the CVCs were both inserted for and justified by the need for IV antibiotics.[5] Guidelines delineated by the Infectious Diseases Society of America regarding outpatient parenteral antibiotics weigh both the duration of therapy and the antimicrobial's potential for causing phlebitis when recommending the type of intravascular access.[20] Many courses may therefore be completed through peripheral or midline catheters. Developing strong partnerships between infectious disease specialists, hospitalists, and the facilities or home‐care services treating these patients may curtail the use of CVCs for antimicrobial administration.
The main focus of our work is on facilitating the safe removal of CVCs. The risk of CLABSIs increases each day a CVC is in place, and guidelines to prevent CLABSIs include recommendations to promptly remove nonessential catheters.[4, 21] There is also an emerging understanding that the risk of a PICC‐related CLABSI approaches that from a traditional central line in hospitalized patients, and PICCs confer an increased risk of venous thromboembolism.[18, 22] Although nearly half of surveyed hospitalists recently reported leaving PICCs in place until discharge day, our data suggest that this practice may be driven by the trajectory of a patient's recovery as much as by knowledge gaps related to the use of PICCs.[23] In nearly half the instances, clinical practice already mirrors our proposed guideline, with line removal coinciding with both the timing proposed by our guideline and discharge day. However, there is room for improvement, as line removal may have been expedited in the 29 patients in whom the line was retained after the first idle day. Maintaining an awareness of its presence and weighing its risks and benefits daily may facilitate the removal of a CVC. Based on the recent findings that up to a quarter of clinicians are unaware that their patients have a central line, the mere reminder of the presence of a line using such criteria may expedite its removal by triggering a purposeful reassessment of its ongoing need.[24] Premature CVC removal requiring line reinsertion is an unintended consequence that may emerge from the earlier removal of lines. In our sample, none of the patients who had lines removed either prior to or in accordance with our proposed guideline required a line reinsertion. In addition to line reinsertion, delays in laboratory testing and reporting due to the unavailability of access, increased patient discomfort, or increased workload on the bedside nurse or vascular access team must also be considered when implementing strategies aimed at decreasing line days.
We envisage using these criteria to both empower practitioners with knowledge and foster shared accountability between all team members by using a uniform tool. This can occur through partnerships between infection control, clinical nurse specialists, bedside nursing, and physicians. The electronic medical record could be leveraged to scan the record for the criteria and create a notification when the line becomes idle. In alignment with the Michigan Appropriateness Guide for Intravenous Catheters guidelines, we do not support the removal of lines by nursing staff without physician notification.[19] Such principles have been successfully harnessed in strategies to prevent both catheter‐associated urinary tract infections and CLABSIs in ICUs.[13, 25] In light of the complexity surrounding the decision making for CVCs, our criteria were focused on the wards and erred on the side of clinical caution. This clinical conservatism is apparent in the patients in whom lines were removed prior to what our guideline would propose, yet none of the patients required a line reinsertion. As concerns about recrudescent clinical instability may drive decision making around line removal, such conservatism may be warranted initially. However, the fidelity of these criteria in the clinical setting will need prospective validation. In particular, the inclusion of SIRS criteria may have led to an overestimation of justified days. Further studies may be needed to refine the criteria and find a clinical hierarchy that balances the risks and benefits of retaining a central line.
Our work has certain limitations. It is a single center's experience, and our findings may not therefore be generalizable. Except for when the indication for the line was for difficult access, we did not attempt to verify the presence of a peripheral IV. This, in combination with the inclusion of SIRS criteria, likely leads to an underestimation of idle days. In the interest of focusing on patients in whom the decision making around a line would be the least controversial, we did not continue to follow patients who were transferred to a higher level of care. It is possible, however, that these transfers were precipitated by line‐associated complications such as sepsis and would be important to track. We did not measure the agreement between data collectors, although definitions and methodologies were standardized and reviewed prior to data collection. As this was an observational assessment of a proposed guideline, we cannot predict how the recommendations generated by it will be received by clinicians. Although this may prove to be a barrier in adoption, we hope that the conversation it initiates leads to change.
Hospitalists are positioned to potentially influence the entire life cycle of a central line on the floor. Strategies can be enacted at each stage to help decrease the potential of harm from these devices to our patients. Creating and testing criteria and guidelines such as we propose represents just 1 such strategy in a multidisciplinary effort to provide the best possible care we can.
Acknowledgements
The authors thank Jennifer Dunscomb, Kristen Kelly, and their teams, and Deanna Sidwell, Todd Biggerstaff, Joan Miller, Rob Clark, and the tireless providers at Indiana University Health Methodist Hospital for their support.
Disclosures: This work was supported by the Indiana University Health Values Grant for research. The authors have no conflicts of interests to report.
- , , , , , . Estimating the proportion of healthcare‐associated infections that are reasonably preventable and the related mortality and costs. Infect Control Hosp Epidemiol. 2011;32(2):101–114.
- , , , et al. National Healthcare Safety Network (NHSN) report, data summary for 2012, device‐associated module. Am J Infect Control. 2013;41(12):1148–1166.
- , , . The risk of bloodstream infection in adults with different intravascular devices: a systematic review of 200 published prospective studies. Mayo Clin Proc. 2006;81(9):1159–1171.
- , , , et al. Guidelines for the prevention of intravascular catheter‐related infections. Clin Infect Dis. 2011;52(9):e162–e193.
- , , , et al. Temporary central venous catheter utilization patterns in a large tertiary care center: tracking the “idle central venous catheter.” Infect Control Hosp Epidemiol. 2012;33(1):50–57.
- , , , , , . Unnecessary use of central venous catheters: the need to look outside the intensive care unit. Infect Control Hosp Epidemiol. 2004;25(3):266–268.
- IU Health Methodist Hospital website. Available at: http://iuhealth.org/methodist/aboIut. Accessed October 20, 2014.
- , , , et al. Definitions for Sepsis and Organ Failure and Guidelines for the Use of Innovative Therapies in Sepsis. The ACCP/SCCM Consensus Conference Committee. American College of Chest Physicians/Society of Critical Care Medicine. Chest. 2009;136(5 suppl):e28.
- , , , , , . Acute hypertension: a systematic review and appraisal of guidelines. Ochsner J. 2014;14(4):655–663.
- , , . Predicting clinical deterioration in the hospital: the impact of outcome selection. Resuscitation. 2013;84(5):564–568.
- , , , et al. Multistate point‐prevalence survey of health care–associated infections. N Engl J Med. 2014;370(13):1198–1208.
- , , , et al. Estimating health care‐associated infections and deaths in U.S. hospitals, 2002. Public Health Rep. 2007;122(2):160–166.
- , , , et al. An intervention to decrease catheter‐related bloodstream infections in the ICU. N Engl J Med. 2006;355(26):2725–2732.
- , , , et al. Data summary for 2011, device‐associated module. Centers for Disease Control and Prevention. National Healthcare Safety Network (NHSN) Report. Available at: http://www.cdc.gov/nhsn/PDFs/dataStat/NHSN‐Report‐2011‐Data‐Summary.pdf. Published April 1, 2013. Last accessed January 2015.
- , , . Idle central venous catheter‐days pose infection risk for patients after discharge from intensive care. Am J Infect Control. 2014;42(4):453–455.
- , . Update on emerging infections: news from the Centers for Disease Control and Prevention. Vital signs: central line‐associated blood stream infections—United States, 2001, 2008, and 2009. Ann Emerg Med. 2011;58(5):447–451.
- , , , , , . Reducing unnecessary urinary catheter use and other strategies to prevent catheter‐associated urinary tract infection: an integrative review. BMJ Qual Saf. 2014;23(4):277–289.
- , , , , . The risk of bloodstream infection associated with peripherally inserted central catheters compared with central venous catheters in adults: a systematic review and meta‐analysis. Infect Control Hosp Epidemiol. 2013;34(9):908–918.
- , , , et al. The Michigan Appropriateness Guide for Intravenous Catheters (MAGIC): results from a multispecialty panel using the RAND/UCLA Appropriateness Method. Ann Intern Med. 2015;163(6 suppl):S1–S40.
- , , , et al. Practice guidelines for outpatient parenteral antimicrobial therapy. IDSA guidelines. Clin Infect Dis. 2004;38(12):1651–1672.
- , . Nonuniform risk of bloodstream infection with increasing central venous catheter‐days. Infect Control Hosp Epidemiol. 2005;26(8):715–719.
- , , , et al. Risk of venous thromboembolism associated with peripherally inserted central catheters: a systematic review and meta‐analysis. Lancet. 2013;382(9889):311–325.
- , , , , . Hospitalist experiences, practice, opinions, and knowledge regarding peripherally inserted central catheters: results of a national survey. J Hosp Med. 2013;8(11):635–638.
- , , , et al. Do clinicians know which of their patients have central venous catheters? Ann Intern Med. 2014;161(8):562.
- , , , , , . Reducing foley catheter device days in an intensive care unit: using the evidence to change practice. AACN Adv Crit Care. 2006;17(3):272–283.
Infections acquired in the hospital are termed healthcare‐associated infections (HAIs) and include central lineassociated blood stream infections (CLABSIs). Among HAIs, CLABSIs cause the highest number of preventable deaths.[1] Central venous catheters (CVCs) or central lines are commonly used in the hospital.[2] Each year their use is linked to 250,000 cases of CLABSIs in the United States.[3] Some CLABSIs may be prevented by the prompt removal of the line.[4] However, CVCs are often retained after their clinical indication has lapsed and are then referred to as idle lines.[5, 6] In this work, we propose and theoretically test a guideline to facilitate the safe removal of an idle line by observing the agreement and disagreement between actual practice and the proposed guideline.
METHODS
Setting
This work was conducted at a large, urban, tertiary care, academic health center in the United States as a collaborative effort to improve quality at our institution.[7]
Design and Patients
The reports linked with the electronic medical records at our institution include a daily, ward‐by‐ward listing of patients who have access other than a peripheral line in place. This central line dashboard accesses the information on intravenous access charted by bedside nurses to create a list of patients on every ward who have any kind of central access. Temporary central venous lines (CVLs), peripherally inserted central catheters (PICCs), ports, and dialysis catheters are all included. The unit charge nurses and managers use this dashboard to facilitate compliance with line care bundles. We used this source to identify patients with either type of CVC (CVLs or PICCs) on 8 days in August 2014, September 2014, and October 2014. Patients were included if they had a CVC and were on a general medical or surgical ward bed on audit day. CVLs at all sites were included (femoral, subclavian, and internal jugular). Patients in an intensive care unit (ICU) or progressive care unit on the day of the audit were excluded. Patients whose catheters were for chemotherapy and those admitted for a transplant or receiving palliative or hospice care were also excluded.
Data Collection
A protocol for data collection was written out, and a training session was held to review definitions, data sources, and methods to ensure consistency. Two authors (M.M. and J.D.) assisted by an experienced clinical nurse specialist collected data on the patients captured on audit days. Each chart was reviewed on the day of the audit, the 2 days preceding the audit day, and then followed until the patient was either discharged from the hospital or transferred to a higher level of care, died, or transitioned to palliative or hospice care. Demographics, details about the line, and the criteria for justified use were extracted from the electronic medical record.
Definitions
Justified and Idle Days
To justify the presence of a CVC on any given day, we used criteria that fell under 3 categories: intravenous (IV) access needs, unstable vitals, or meeting sepsis/systemic inflammatory response syndrome (SIRS) criteria (Table 1). For vital signs, a single abnormal reading was counted as fulfilling criteria for that day. If no criterion for justified use was met, the line was considered idle for that day.
|
| IV access needs |
| Expected duration of IV antibiotics >6 days |
| Administration of TPN |
| Anticipated requirement of home IV medications |
| Requirement of IV medications with documented difficult access |
| Hemorrhage requiring blood transfusions |
| Requiring more than 3 infusions |
| Requiring more than 2 infusions and blood transfusions |
| Abnormal vitals |
| Diastolic blood pressure >120 mm Hg |
| Systolic blood pressure 90 mm Hg |
| Systolic blood pressure >200 mm Hg |
| Heart rate >120 beats per minute |
| Heart rate 50 beats per minute |
| Respiratory rate >30 breaths per minute |
| Respiratory rate 10 breaths per minute |
| Oxygen saturation 90% as measured by pulse oximetry |
| Meeting SIRS criteria (2 or more of the following present) |
| Temp >38C, Temp 36C, heart rate >90 beats per minute, respiratory rate >20 breaths per minute, WBC >12,000/mm3, WBC 1,000/mm3, bandemia >10% |
Qualifying IV access needs were defined similarly to those previously used,[5, 6] whereas those for SIRS followed the current consensus.[8] To determine the number of IV medications or infusions, the medication administration record was reviewed. If 3 or more infusions were found, their compatibility was checked using the same database that nurses use at our institution. Difficult IV access was inferred from the indication for line placement, coupled with the absence of documentation of a peripheral IV. Clinical progress notes were reviewed to extract information on the length of proposed IV antibiotic courses, and discharge instructions were reviewed to verify whether the line was removed prior to discharge or not. The cutoffs for diastolic blood pressure, respiratory rate, and oxygen saturation used to label patients hemodynamically labile are the same as those used by previous authors and also constitute the definition of hypertensive urgency.[5, 9] However, we diverged from the values previously used for tachycardia, bradycardia, and systolic hypotension using heart rates >120 and 50 beats per minute (compared to >130 and 40 beats per minute) and systolics 90 mm Hg (compared to 80 mm Hg) to justify the line.[5] Early warning scores have been used to identify hospitalized ward patients who are at risk for clinical deterioration. Although each score utilizes different thresholds, the risk for clinical deterioration increases as the vitals worsen.[10] Bearing this in mind, the thresholds we elected to use are more clinically conservative and also parallel the nursing call orders currently used at our institution.
Proposed Guideline
We propose the guideline that a CVC may be safely removed the day after the first idle day.
RESULTS
A total of 126 lines were observed in 126 patients. Eighty‐three (65.9%) of the lines were PICCs. The remaining 43 (34.1%) were CVLs. The indications for line placement were distributed between the need for central access, total parenteral nutrition, or antibiotics (Table 2).
| Description | Value |
|---|---|
| |
| Age in yrs mean (SD) | 55.7 (18) |
| Gender, n (%) | |
| Female | 66 (52.4) |
| Male | 60 (47.6) |
| Type of line, n (%) | |
| PICC | 83 (65.9) |
| CVL | 43 (34.1) |
| Indication for line placement, n (%) | |
| Meds requiring central access or TPN | 36 (28.6) |
| Antibiotics | 34 (27.0) |
| Hemodynamic instability | 30 (23.8) |
| Poor access with multiple IV medications | 18 (14.3) |
| Unknown | 8 (6.3) |
| Line removed prior to discharge, n (%) | |
| Yes | 76 (60.3) |
| No | 50 (39.7) |
Out of the 126 patients, 50 (39.7%) were discharged from the hospital, died, were transferred to a higher level of care, or transitioned to palliative or hospice care with the line in place. In the remaining 76 patients, the audit captured 635 days, out of which a line was in place for 522 (82.2%) days. Of these 522 days, the line's presence was justified by our criteria for 351 (67.2%) days. The most common reason for a line to be justified on any given day was the need for antibiotics followed by the presence of SIRS criteria (Table 3). The remaining 171 (32.7%) days were idle.
| Criteria | N | % |
|---|---|---|
| ||
| No. of factors justifying use | ||
| 1 | 184 | 52.4% |
| 2 | 127 | 36.2% |
| >2 | 40 | 11.4 |
| Reason for justifying line* | ||
| Anticipate home or >6 days of antibiotic use | 181 | 51.6 |
| SIRS criteria | 124 | 35.3 |
| TPN | 96 | 27.4 |
| Hemodynamic instability based on hr and bp | 78 | 22.2 |
| Poor access with need for IV medications | 57 | 16.2 |
| Respiratory rate (10 or >30/minute) | 25 | 7.1 |
| Active hemorrhage requiring transfusions | 12 | 3.4 |
| >3 infusions | 6 | 1.7 |
A comparison of the actual removal of the 76 central lines in practice relative to the proposed guideline of removing it the day following the first idle day is displayed in Figure 1. The central line was removed prior to our proposed guideline in 11 (14.5%) patients, and waiting for an idle day in these patients would have added 46 line days. In almost half the patients (n = 36, 47.4%), the line was removed in agreement with the proposed guideline. None of the patients in whom the line was removed prior to or in accordance with our proposed guideline required a line reinsertion. Line removal was delayed in 29 (38.2%) patients when compared to our proposed guideline. In these patients, following the guideline would have created 122 line‐free days. Most (n = 102, 83.6%) of these potential line‐free days were idle. Twenty (16.4%) were justified, of which half (n = 10) were justified by meeting SIRS criteria.
DISCUSSION
Approximately 1 in every 25 inpatients in the United States has at least 1 HAI on any given day.[11] The case fatality rate from a CLABSI may be as high as 12%, and up to 70% of these infections may be preventable.[1, 12] Interventions successful in decreasing CLABSIs have focused on patients in ICUs.[13] However, CVCs are increasingly prevalent outside the ICU, with over 4.5 million line days in non‐ICU beds reported to the National Healthcare Safety Network in 2012 compared to 2.5 million in 2010.[2, 14] However, adherence rates to infection control practices may be lower on the wards than in the ICUs.[6, 15] Consequently, although the number of CLABSIs has declined over the last decade, most are now occurring outside the ICU.[16] These trends underscore the need to develop strategies aimed at CLABSI prevention on the floors.
Analogous to the life cycle of a urinary catheter described by Meddings et al.,[17] strategies to prevent CLABSIs and other CVC‐related complications may be designed around the life cycle of a CVC. The life cycle starts with insertion and moves on to the maintenance, removal, and possible reinsertion of the line. The process thus starts with the decision to place the line. Over the last decade, this decision making has changed in part due to PICCs. This shift is reflected in PICC prevalence rates: in 2001, 11% of audited central lines were PICCs compared to 56% in 2007.[5, 6] In our audit, 66% of the CVCs were PICCs. This increase in the use of PICCs may be attributable to the ease and safety of their placement coupled with the increased availability of vascular access placement teams.[18] The risk of overuse that may result from such expediency may be countered by adhering to guidelines such as the Michigan Appropriateness Guide for Intravenous Catheters, which provides both clinically detailed guidance and an impetus for reflective decision making around intravenous access.[19]
The placement of CVCs for prolonged parenteral antibiotics may be a particular subset that bears further exploration. Similar to previous reports, we found that a large number of the CVCs were both inserted for and justified by the need for IV antibiotics.[5] Guidelines delineated by the Infectious Diseases Society of America regarding outpatient parenteral antibiotics weigh both the duration of therapy and the antimicrobial's potential for causing phlebitis when recommending the type of intravascular access.[20] Many courses may therefore be completed through peripheral or midline catheters. Developing strong partnerships between infectious disease specialists, hospitalists, and the facilities or home‐care services treating these patients may curtail the use of CVCs for antimicrobial administration.
The main focus of our work is on facilitating the safe removal of CVCs. The risk of CLABSIs increases each day a CVC is in place, and guidelines to prevent CLABSIs include recommendations to promptly remove nonessential catheters.[4, 21] There is also an emerging understanding that the risk of a PICC‐related CLABSI approaches that from a traditional central line in hospitalized patients, and PICCs confer an increased risk of venous thromboembolism.[18, 22] Although nearly half of surveyed hospitalists recently reported leaving PICCs in place until discharge day, our data suggest that this practice may be driven by the trajectory of a patient's recovery as much as by knowledge gaps related to the use of PICCs.[23] In nearly half the instances, clinical practice already mirrors our proposed guideline, with line removal coinciding with both the timing proposed by our guideline and discharge day. However, there is room for improvement, as line removal may have been expedited in the 29 patients in whom the line was retained after the first idle day. Maintaining an awareness of its presence and weighing its risks and benefits daily may facilitate the removal of a CVC. Based on the recent findings that up to a quarter of clinicians are unaware that their patients have a central line, the mere reminder of the presence of a line using such criteria may expedite its removal by triggering a purposeful reassessment of its ongoing need.[24] Premature CVC removal requiring line reinsertion is an unintended consequence that may emerge from the earlier removal of lines. In our sample, none of the patients who had lines removed either prior to or in accordance with our proposed guideline required a line reinsertion. In addition to line reinsertion, delays in laboratory testing and reporting due to the unavailability of access, increased patient discomfort, or increased workload on the bedside nurse or vascular access team must also be considered when implementing strategies aimed at decreasing line days.
We envisage using these criteria to both empower practitioners with knowledge and foster shared accountability between all team members by using a uniform tool. This can occur through partnerships between infection control, clinical nurse specialists, bedside nursing, and physicians. The electronic medical record could be leveraged to scan the record for the criteria and create a notification when the line becomes idle. In alignment with the Michigan Appropriateness Guide for Intravenous Catheters guidelines, we do not support the removal of lines by nursing staff without physician notification.[19] Such principles have been successfully harnessed in strategies to prevent both catheter‐associated urinary tract infections and CLABSIs in ICUs.[13, 25] In light of the complexity surrounding the decision making for CVCs, our criteria were focused on the wards and erred on the side of clinical caution. This clinical conservatism is apparent in the patients in whom lines were removed prior to what our guideline would propose, yet none of the patients required a line reinsertion. As concerns about recrudescent clinical instability may drive decision making around line removal, such conservatism may be warranted initially. However, the fidelity of these criteria in the clinical setting will need prospective validation. In particular, the inclusion of SIRS criteria may have led to an overestimation of justified days. Further studies may be needed to refine the criteria and find a clinical hierarchy that balances the risks and benefits of retaining a central line.
Our work has certain limitations. It is a single center's experience, and our findings may not therefore be generalizable. Except for when the indication for the line was for difficult access, we did not attempt to verify the presence of a peripheral IV. This, in combination with the inclusion of SIRS criteria, likely leads to an underestimation of idle days. In the interest of focusing on patients in whom the decision making around a line would be the least controversial, we did not continue to follow patients who were transferred to a higher level of care. It is possible, however, that these transfers were precipitated by line‐associated complications such as sepsis and would be important to track. We did not measure the agreement between data collectors, although definitions and methodologies were standardized and reviewed prior to data collection. As this was an observational assessment of a proposed guideline, we cannot predict how the recommendations generated by it will be received by clinicians. Although this may prove to be a barrier in adoption, we hope that the conversation it initiates leads to change.
Hospitalists are positioned to potentially influence the entire life cycle of a central line on the floor. Strategies can be enacted at each stage to help decrease the potential of harm from these devices to our patients. Creating and testing criteria and guidelines such as we propose represents just 1 such strategy in a multidisciplinary effort to provide the best possible care we can.
Acknowledgements
The authors thank Jennifer Dunscomb, Kristen Kelly, and their teams, and Deanna Sidwell, Todd Biggerstaff, Joan Miller, Rob Clark, and the tireless providers at Indiana University Health Methodist Hospital for their support.
Disclosures: This work was supported by the Indiana University Health Values Grant for research. The authors have no conflicts of interests to report.
- , , , , , . Estimating the proportion of healthcare‐associated infections that are reasonably preventable and the related mortality and costs. Infect Control Hosp Epidemiol. 2011;32(2):101–114.
- , , , et al. National Healthcare Safety Network (NHSN) report, data summary for 2012, device‐associated module. Am J Infect Control. 2013;41(12):1148–1166.
- , , . The risk of bloodstream infection in adults with different intravascular devices: a systematic review of 200 published prospective studies. Mayo Clin Proc. 2006;81(9):1159–1171.
- , , , et al. Guidelines for the prevention of intravascular catheter‐related infections. Clin Infect Dis. 2011;52(9):e162–e193.
- , , , et al. Temporary central venous catheter utilization patterns in a large tertiary care center: tracking the “idle central venous catheter.” Infect Control Hosp Epidemiol. 2012;33(1):50–57.
- , , , , , . Unnecessary use of central venous catheters: the need to look outside the intensive care unit. Infect Control Hosp Epidemiol. 2004;25(3):266–268.
- IU Health Methodist Hospital website. Available at: http://iuhealth.org/methodist/aboIut. Accessed October 20, 2014.
- , , , et al. Definitions for Sepsis and Organ Failure and Guidelines for the Use of Innovative Therapies in Sepsis. The ACCP/SCCM Consensus Conference Committee. American College of Chest Physicians/Society of Critical Care Medicine. Chest. 2009;136(5 suppl):e28.
- , , , , , . Acute hypertension: a systematic review and appraisal of guidelines. Ochsner J. 2014;14(4):655–663.
- , , . Predicting clinical deterioration in the hospital: the impact of outcome selection. Resuscitation. 2013;84(5):564–568.
- , , , et al. Multistate point‐prevalence survey of health care–associated infections. N Engl J Med. 2014;370(13):1198–1208.
- , , , et al. Estimating health care‐associated infections and deaths in U.S. hospitals, 2002. Public Health Rep. 2007;122(2):160–166.
- , , , et al. An intervention to decrease catheter‐related bloodstream infections in the ICU. N Engl J Med. 2006;355(26):2725–2732.
- , , , et al. Data summary for 2011, device‐associated module. Centers for Disease Control and Prevention. National Healthcare Safety Network (NHSN) Report. Available at: http://www.cdc.gov/nhsn/PDFs/dataStat/NHSN‐Report‐2011‐Data‐Summary.pdf. Published April 1, 2013. Last accessed January 2015.
- , , . Idle central venous catheter‐days pose infection risk for patients after discharge from intensive care. Am J Infect Control. 2014;42(4):453–455.
- , . Update on emerging infections: news from the Centers for Disease Control and Prevention. Vital signs: central line‐associated blood stream infections—United States, 2001, 2008, and 2009. Ann Emerg Med. 2011;58(5):447–451.
- , , , , , . Reducing unnecessary urinary catheter use and other strategies to prevent catheter‐associated urinary tract infection: an integrative review. BMJ Qual Saf. 2014;23(4):277–289.
- , , , , . The risk of bloodstream infection associated with peripherally inserted central catheters compared with central venous catheters in adults: a systematic review and meta‐analysis. Infect Control Hosp Epidemiol. 2013;34(9):908–918.
- , , , et al. The Michigan Appropriateness Guide for Intravenous Catheters (MAGIC): results from a multispecialty panel using the RAND/UCLA Appropriateness Method. Ann Intern Med. 2015;163(6 suppl):S1–S40.
- , , , et al. Practice guidelines for outpatient parenteral antimicrobial therapy. IDSA guidelines. Clin Infect Dis. 2004;38(12):1651–1672.
- , . Nonuniform risk of bloodstream infection with increasing central venous catheter‐days. Infect Control Hosp Epidemiol. 2005;26(8):715–719.
- , , , et al. Risk of venous thromboembolism associated with peripherally inserted central catheters: a systematic review and meta‐analysis. Lancet. 2013;382(9889):311–325.
- , , , , . Hospitalist experiences, practice, opinions, and knowledge regarding peripherally inserted central catheters: results of a national survey. J Hosp Med. 2013;8(11):635–638.
- , , , et al. Do clinicians know which of their patients have central venous catheters? Ann Intern Med. 2014;161(8):562.
- , , , , , . Reducing foley catheter device days in an intensive care unit: using the evidence to change practice. AACN Adv Crit Care. 2006;17(3):272–283.
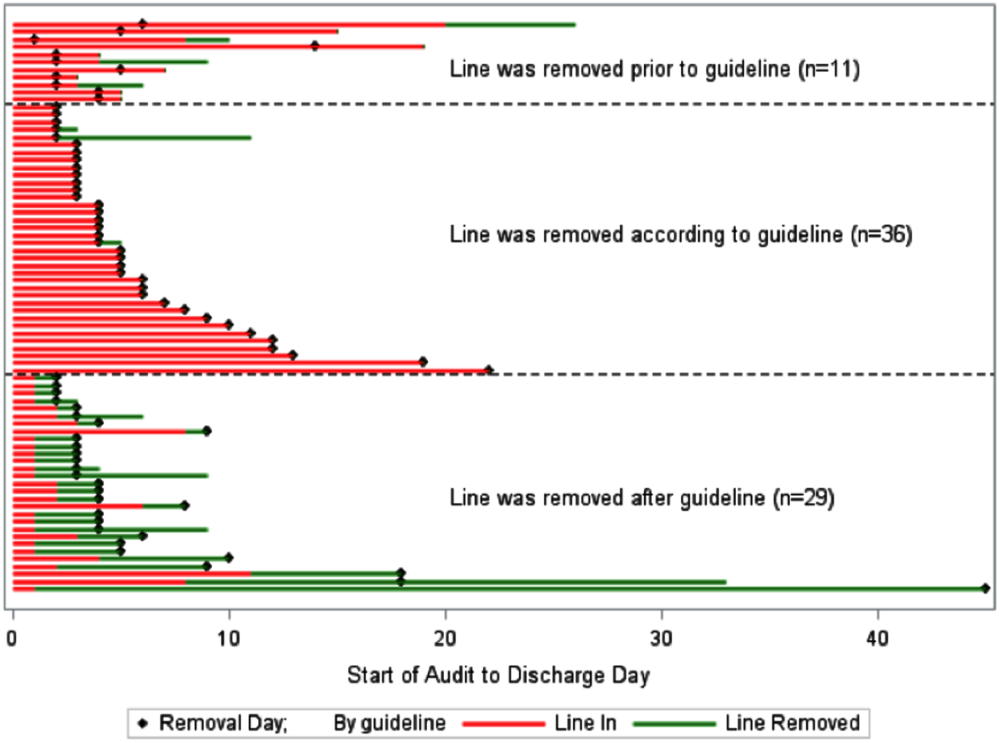
Discordance Between Patient and Provider
Patient‐centered care has been recognized by the Institute of Medicine as an essential aim of the US healthcare system.[1] A fundamental component of patient‐centered care is to engage patients and caregivers in establishing preferences, needs, values, and overall goals regarding their care.[1] Prior studies have shown that delivering high‐quality patient‐centered care is associated with improved health outcomes, and in some cases, reduced costs.[2, 3, 4, 5, 6, 7] Payors, including the Centers for Medicare and Medicaid Services under the Hospital Value‐Based Purchasing program, are increasingly tying payments to measures of patient experience.[8, 9] As more emphasis is placed on public reporting of these patient‐reported outcomes, healthcare organizations are investing in efforts to engage patients and caregivers, including efforts at establishing patients' preferences for care.[10]
In the acute care setting, a prerequisite for high‐quality patient‐centered care is identifying a patient's primary goal for recovery and then delivering care consistent with that goal.[11, 12, 13] Haberle et al. previously validated patients' most common goals for recovery in the hospital setting into 7 broad categories: (1) be cured, (2) live longer, (3) improve or maintain health, (4) be comfortable, (5) accomplish a particular life goal, (6) provide support for a family member, or (7) other.[13] When providers' understanding of these recovery goals are not concordant with the patient's stated goals, patients may receive care inconsistent with their preferences; it is not uncommon for patients to receive aggressive curative treatments (eg, cardiopulmonary resuscitation) when they have expressed otherwise.[14] On the other hand, when patient goals and priorities are clearly established, patients may have better outcomes.[15] For example, earlier conversations about patient goals and priorities in serious illness can lead to realistic expectations of treatment, enhanced goal‐concordant care, improved quality of life, higher patient satisfaction, more and earlier hospice care, fewer hospitalizations, better patient and family coping, reduced burden of decision making for families, and improved bereavement outcomes.[16, 17, 18]
Although previous studies have suggested poor patient‐physician concordance with regard to the patient's plan of care,[19, 20, 21, 22, 23, 24] there are limited data regarding providers' understanding of the patient's primary recovery goal during hospitalization. The purpose of this study was to identify the patients' Haberle goal, and then determine the degree of concordance among patients and key hospital providers regarding this goal.
METHODS
Study Setting
The Partners Human Research Committee approved the study. The study was conducted on an oncology and medical intensive care unit (MICU) at a major academic medical center in Boston, Massachusetts. The oncology unit was comprised of 2 non‐localized medical teams caring for patients admitted to that unit. The MICU was comprised of a single localized medical team. Medical teams working on these units consisted of a first responder (eg, intern or a physician assistant [PA]), medical residents, and an attending physician. Both units had dedicated nursing staff.
Study Participants
All adult patients (>17 years of age) admitted to the oncology and MICU units during the study period (November 2013 through May 2014) were eligible. These units were chosen because these patients are typically complex and have multiple medical comorbidities longer lengths of stay, and many procedures and tests. In addition, a standard method for asking patients to identify a primary recovery goal for hospitalization aligned well with ongoing institutional efforts to engage these patients in goals of care discussions.
Research assistants identified all patients admitted to each study unit for at least 48 hours and approached them in a random order with a daily target of 2 to 3 patients. Only patients who demonstrated capacity (determined by medical team), or had a legally designated healthcare proxy (who spoke English and was available to participate on their behalf) were included. Research assistants then approached the patient's nurse and a physician provider (defined for this study as housestaff physician, PA, or attending) from the primary medical team to participate in the interview (within 24 hours of patient's interview). We excluded eligible patients who did not have capacity or an available caregiver or declined to participate.
Data Collection Instrument and Interviews
Research assistants administered a validated questionnaire developed by Haberle et al. to participants after 48 hours into the patient's admission to provide time to establish mutual understanding of the diagnosis and prognosis.[13] We asked patients (or the designated healthcare proxy) to select their single, most important Haberle goal (see above). Specifically, as in the original validation study,[13] patients or proxies were asked the following question: Please tell me your most important goal of care for this hospitalization. If they did not understand this question, we asked a follow‐up question: What are you expecting will be accomplished during this hospitalization? Within 24 hours of the patient/proxy interview, we independently asked the patient's nurse and physician to select what they thought was the patient's most important goal for recovery using the same questionnaire, adapted for providers. In each case, all participants were blinded to the responses of others.
Measures
We measured the frequency that each participant (patient/proxy, nurse, and physician) selected a specific Haberle recovery goal across all patients. We measured the rate of pairwise concordance by recovery goal for each participant dyad (patient/proxy‐nurse, patient/proxy‐physician, and nurse‐physician). Finally, we calculated the frequency of cases for which all 3 participants selected the same recovery goal.
Statistical Analyses
Descriptive statistics were used to report patient demographic data. The frequencies of selected responses were calculated and reported as percentages for each type of participant. The differences in rate of responses for each Haberle goal were compared across each participant group using 2 analysis. We then performed 2‐way Kappa statistical tests to measure inter‐rater agreement for each dyad.
RESULTS
Of 1436 patients (882 oncology, 554 MICU) hospitalized during the study period, 341(156 oncology, 185 MICU) were admitted for 48 hours. Of 914 potentially eligible patients (617 oncology, 297 MICU), 191 (112 oncology and 79 MICU) were approached to participate based on our sampling strategy; of these, 8 (2 oncology and 6 MICU) did not have capacity (and no proxy was available) and 2 (1 oncology and 1 MICU) declined. Of the remaining 181 patients (109 oncology and 72 MICU), we obtained a completed questionnaire from all 3 interviewees on 109 (60.2% response rate).
Of the 109 study patients, 52 (47.7%) and 57 (52.3%) were admitted to the oncology and medical intensive care units, respectively (Table 1). Patients were predominantly middle aged, Caucasian, English‐speaking, and college‐educated. Healthcare proxies were frequently interviewed on behalf of patients in the MICU. Housestaff physicians were more often interviewed in the MICU, and PAs were interviewed only on oncology units. Compared to patient responders, nonresponders tended to be male and were admitted to oncology units (see Supporting Table 1 in the online version of this article).
| Characteristics | All Patients | Admitted to Medical Intensive Care Units | Admitted to Oncology Units |
|---|---|---|---|
| |||
| Total, no. (%) | 109 (100%) | 57 (52.3%) | 52 (47.7%) |
| Gender, no. (%) | |||
| Male | 55 (50.5%) | 28 (49.1%) | 26 (50.0%) |
| Female | 54 (49.5%) | 29 (50.9%) | 26 (50.0%) |
| Age, y, mean SD | 59.4 14 | 59.7 15 | 59.1 13 |
| Median | 61 | 61 | 60 |
| Range | 2188 | 2188 | 2285 |
| Race, no. (%) | |||
| White | 103 (94.5%) | 53 (93.0%) | 50 (96.2%) |
| Other | 6 (5.5%) | 4 (7.0%) | 2 (3.8%) |
| Language, no. (%) | |||
| English | 106 (97.2%) | 56 (98.1%) | 50 (96.2%) |
| Other | 3 (2.8%) | 1 (1.9%) | 2 (3.8%) |
| Education level, no. (%) | |||
| Less than high school | 30 (27.5%) | 17 (29.8%) | 13 (25.0%) |
| High school diploma | 27 (24.5%) | 18 (31.6%) | 9 (17.3%) |
| Some college or beyond | 52 (47.7%) | 22 (38.6%) | 30 (57.7%) |
| Patient or caregiver interviewed, no. (%) | |||
| Patient | 68 (62.4%) | 27 (47.4%) | 48 (92.3%) |
| Caregiver | 41 (37.6%) | 30 (52.6%) | 4 (7.7%) |
| Nurse interviewed, no. (unique) | 109 (75) | 57 (42) | 52 (33) |
| Physician provider interviewed, no. (%); no. unique | |||
| Attending | 27 (24.8%); 20 | 15 (26.3%); 10 | 12 (23.1%); 10 |
| Housestaff | 48 (44.0%); 39 | 42 (73.7%); 33 | 6 (11.5%); 6 |
| Physician assistant | 34 (31.2%); 25 | 0 (0%); 0 | 34 (65.4%); 25 |
The frequencies of selected Haberle recovery goals by participant type across all patients are listed in Table 2. Patients (or proxies) most often selected be cured (46.8%). Assigned nurses and physicians more commonly selected improve or maintain health (38.5% and 46.8%, respectively). Be comfortable was selected by nurses and physicians more frequently than by patients (16.5%, 16.5%, and 8.3%, respectively). The rate of responses for each Haberle goal was significantly different across all respondent groups (P 0.0001). The frequencies of selected Haberle goals were not significantly different between patients or proxies (P = 0.67), or for patients admitted to the MICU compared to oncology units (P = 0.64).
| Haberle Recovery Goal | Patient/Caregiver, no. (%), n = 109 | Physician Provider, no. (%), n = 109* | Nurse, no. (%), n = 109 |
|---|---|---|---|
| |||
| Be cured | 51 (46.8%) | 20 (18.3%) | 20 (18.3%) |
| Be comfortable | 9 (8.3%) | 18 (16.5%) | 18 (16.5%) |
| Improve or maintain health | 32 (29.4%) | 42 (38.5%) | 51 (46.8%) |
| Live longer | 14 (12.8%) | 21 (19.3%) | 12 (11%) |
| Accomplish personal goal | 2 (1.8%) | 0 (0%) | 3 (2.8%) |
| Provide support for family | 1 (0.9%) | 1 (0.9%) | 1 (0.9%) |
| Other | 0 (0%) | 7 (6.4%) | 4 (3.7%) |
Inter‐rater agreement was poor to slight for the 3 participant dyads (kappa 0.09 [0.03‐0.19], 0.19 [0.08‐0.30], and 0.20 [0.08‐0.32] for patient‐physician, patient‐nurse, and nurse‐physician, respectively). The 3 participants selected the identical recovery goal in 22 (20.2%) cases, and each selected a distinct recovery goal in 32 (29.4%) cases. Pairwise concordance between nurses and physicians was 39.4%. There were no significant differences in agreement between patients admitted to the MICU compared to oncology units (P = 0.09).
DISCUSSION
We observed poor to slight concordance among patients and key hospital providers with regard to identifying the patient's primary recovery goal during acute hospitalization. The majority of patients (or proxies), chose be cured, whereas the majority of hospital providers chose improve or maintain health. Patients were twice as likely to select be cured and half as likely to choose be comfortable compared to nurses or physicians. Strikingly, the patient (or proxy), nurse, and physician identified the same recovery goal in just 20% of cases. These findings were similar for patients admitted to either the MICU or oncology units or when healthcare proxies participated on behalf of the patient (eg, when incapacitated in the MICU).
There are many reasons why hospital providers may not correctly identify the patients' primary recovery goals. First, we do not routinely ask patients to identify recovery goals upon admission in a structured and standardized manner. In fact, clinicians often do not elicit patients' needs, concerns, and expectations regarding their care in general.[25] Second, even when recovery goals are elicited at admission, they may not be communicated effectively to all members of the care team. This could be due to geographically non‐localized teams (although we did not observe a statistically significant difference between regionalized MICU and nonregionalized oncology care units), frequent provider‐to‐provider handoffs, and siloed electronic communication (eg, email, alphanumeric pages) regarding goals of care that inevitably leaves out key providers.[26] Third, healthcare proxies who are involved in decision making on the patient's behalf may not always be available to meet with the care team in person; consequently, their input may not be considered in a timely manner or reliably communicated to all members of the care team. We observed a large discrepancy in how often patients chose be cured compared to their hospital providers. This could be explained by clinicians' unwillingness to disclose bad news or divulge accurate prognostic information that causes patients to feel depressed or lose hope, particularly for those patients with the worst prognoses.[16, 27, 28] Patients may lack sophisticated knowledge of their conditions for a variety of reasons, including low health literacy, at times choosing to hope for the best even when it is not realistic. Additionally, there may be more subtle differences in what patients and hospital providers consider the primary recovery goal in context of the main reason for hospitalization and underlying medical illness. For example, a patient with metastatic lung cancer hospitalized with recurrent postobstructive pneumonia may choose be cured as his/her primary recovery goal (thinking of the pneumonia), whereas physicians may choose improve/maintain health or comfort (thinking of the cancer). We also cannot exclude the possibility that sometimes when patients state be cured and clinicians state improve health as the primary goal, that they are really saying the same thing in different ways. However, these are 2 different constructs (cure may not be possible for many patients) that may deserve an explicit discussion for patients to have realistic expectations for their health following hospitalization.
In short, our results underscore the importance of having an open and honest dialog with patients and caregivers throughout hospitalization, and the need to provide education about the potential futility of excessive care in situations where appropriate. Simply following patients' goals without discussing their feasibility and the consequences of aggressive treatments may result in unnecessary morbidity and misuse of healthcare resources. Once goals are clearly established, communicated, and refined in hospitalized patients with serious illness, there is much reason to believe that ongoing conversation will favorably impact outcomes.[29]
We found few studies that rigorously quantified the rate of concordance of hospital recovery goals among patients and key hospital providers; however, studies that measured overall plan of care agreement have demonstrated suboptimal concordance.[20, 30, 31] Shin et al. found significant underestimation of cancer patients' needs and poor concordance between patients and oncologists in assessing perceived needs of supportive care.[20] It is also notable that nurses and physicians had low levels of concordance in our study. O'Leary and colleagues found that nurses and physicians did not reliably communicate and often did not agree on the plan of care for hospitalized patients.[30] Although geographic regionalization of care teams and multidisciplinary rounds can improve the likelihood that key members of the care team are on the same page with regard to the plan of care, there is still much room for improvement.[26, 32, 33, 34] For example, although nurses and physicians in our study independently selected individual recovery goals with similar frequencies (Table 2), we observed suboptimal concordance between nurses and providers (36.8%) for specific patients, including on our regionalized care unit (MICU). This may be due to the reasons described above.
There are several implications of these findings. As payors continue to shift payments toward value‐based metrics, largely determined by patient experience and adequate advance care planning,[9] our findings suggest that more effort should be focused on delivering care consistent with patients' primary recovery goals. As a first step, healthcare organizations can focus on efforts to systematically identify and communicate recovery goals to all members of the care team, ensuring that patients' preferences, needs, and values are captured. In addition, as innovation in patient engagement and care delivery using Web‐based and mobile technology continues to grow,[35] using these tools to capture key goals for hospitalization and recovery can play an essential role. For example, as electronic health record vendors and institutions start to implement patient portals in the acute care setting, they should consider how to configure these tools to capture key goals for hospitalization and recovery, and then communicate them to the care team; preliminary work in this area is promising.[10]
Our study has several limitations to generalizability. First, the study was conducted on 2 services (MICU and oncology) at a single institution using a sampling strategy where research assistants enrolled 2 to 3 patients per day. Although the sampling was random, the availability of patients and proxies to be interviewed may have led to selection bias. Second, the sample size was small. Third, the patients who participated were predominantly white, English‐speaking, and well educated, possibly a consequence of our sampling strategy. However, this fact makes our findings more striking; although cultural and language barriers were generally not present in our study population, large discrepancies in goal concordance still existed. Fourth, in instances when patients were unable to participate themselves, we interviewed their healthcare proxy; therefore, it is possible that the proxies' responses did not reflect those of the patient. However, we note that concordance rates did not significantly differ between the 2 services despite the fact that the proportion of proxy interviews was much higher in the MICU. Similarly, we cannot exclude the possibility that patients altered their stated goals in the presence of proxies, but patients were given the option to be interviewed alone. Patients may also have misunderstood the timing of the goals (during this hospitalization as opposed to long term), although research assistants made every effort to clarify this during the interviews. Finally, our data‐collection instrument was previously validated in hospitalized general medicine patients and not oncology or MICU patients, and it has not been used to directly ask clinicians to identify patients' recovery goals. However, there is no reason to suspect that it could not be used for this purpose in critical care as well as noncritical care settings, as the survey was developed by a multidisciplinary team that included medical professionals and was validated by clinicians who successfully identified a single, very broad goal (eg, be cured) in each case.
CONCLUSION
We report poor to slight concordance among hospitalized patients and key hospital providers with regard to the main recovery goal. Future studies should assess whether patient satisfaction and experience is adversely impacted by patient‐provider discordance regarding key recovery goals. Additionally, institutions may consider future efforts to elicit and communicate patients' primary recovery goals more effectively to all members of the care team, and address discrepancies as soon as they are discovered.
Disclosures
This work was supported by a grant from the Gordon and Betty Moore Foundation (GBMF) (grant GBMF3914). GBMF had no role in the design or conduct of the study; collection, analysis, or interpretation of data; or preparation or review of the manuscript. The authors report no conflicts of interest.
- Institute of Medicine. Crossing the Quality Chasm: A New Health System for the 21st Century. Washington, DC: National Academy of Sciences; 2001.
- , , , , , . The effects of physician communications skills on patient satisfaction; recall, and adherence. J Chronic Dis. 1984;37(9–10):755–764.
- , , , et al. Observational study of effect of patient centredness and positive approach on outcomes of general practice consultations. BMJ. 2001;323(7318):908–911.
- . Reengineering hospital discharge: a protocol to improve patient safety, reduce costs, and boost patient satisfaction. Am J Med Qual. 2009;24(4):344–346.
- , , , , . Relationship between patient satisfaction with inpatient care and hospital readmission within 30 days. Am J Manag Care. 2011;17(1):41–48.
- , , , . Patients' perception of hospital care in the United States. N Engl J Med. 2008;359(18):1921–1931.
- , , . Enhanced support for shared decision making reduced costs of care for patients with preference‐sensitive conditions. Health Aff (Millwood). 2013;32(2):285–293.
- Centers for Medicare and Medicaid Services. Medicare program; hospital inpatient value‐based purchasing program. Final rule. Fed Regist. 2011;76(88):26490–26547.
- Centers for Medicare and Medicaid Services. CMS begins implementation of key payment legislation. Available at: https://www.cms.gov/Newsroom/MediaReleaseDatabase/Press‐releases/2015‐Press‐releases‐items/2015‐07‐08.html. Published July 8, 2015.
- , , , et al. A web‐based, patient‐centered toolkit to engage patients and caregivers in the acute care setting: a preliminary evaluation [published online August 2, 2015]. J Am Med Informatics Assoc. doi: 10.1093/jamia/ocv093.
- , , , et al. Effectiveness trial of an intensive communication structure for families of long‐stay ICU patients. Chest. 2010;138(6):1340–1348.
- , , , . Understanding goals of care statements and preferences among patients and their surrogates in the medical ICU. J Hosp Palliat Nurs. 2012;14(2):126–132.
- , , , . Goals of care among hospitalized patients: a validation study. Am J Hosp Palliat Care. 2011;28(5):335–341.
- , , , et al. Factors associated with use of cardiopulmonary resuscitation in seriously ill hospitalized adults. JAMA. 1999;282(24):2333–2339.
- , , , , . End‐of‐life discussions, goal attainment, and distress at the end of life: Predictors and outcomes of receipt of care consistent with preferences. J Clin Oncol. 2010;28(7):1203–1208.
- , . Reasons why physicians do not have discussions about poor prognosis, why it matters, and what can be improved. J Clin Oncol. 2012;30(22):2715–2717.
- , , , et al. Associations between end‐of‐life discussions, patient mental health, medical care near death, and caregiver bereavement adjustment. JAMA. 2008;300(14):1665–1673.
- , , , . Prior advance care planning is associated with less decisional conflict among surrogates for critically ill patients. Ann Am Thorac Soc. 2015;12(10):1528–1533.
- , , , et al. Hospitalized patients' understanding of their plan of care. Mayo Clin Proc. 2010;85(1):47–52.
- , , , et al. Discordance in perceived needs between patients and physicians in oncology practice: a nationwide survey in Korea. J Clin Oncol. 2011;29(33):4424–4429.
- , , , , , . Leveraging standards to support patient‐centric interdisciplinary plans of care. AMIA Annu Symp Proc. 2011;2011:356–363.
- , . Discordance between physician and patient self‐rated health and all‐cause mortality. Ochsner J. 2011;11(3):232–240.
- , , , , , . Determinants of discordance between patients and physicians in their assessment of lupus disease activity. J Rheumatol. 2003;30(9):1967–1976.
- , , , , , . Predictors of discordance between physicians' and patients' appraisals of health‐related quality of life in atrial fibrillation patients: Findings from the Angiotensin II Antagonist in Paroxysmal Atrial Fibrillation Trial. Am Heart J. 2013;166(3):589–596.
- , , , et al. Uncovering the blind spot of patient satisfaction: an international survey. BMJ Qual Saf. 2011;20(11):959–965.
- , , , , , . Improving teamwork: impact of structured interdisciplinary rounds on a hospitalist unit. J Hosp Med. 2011;6(2):88–93.
- , , , . Discrepancies between patient and physician estimates for the success of stem cell transplantation. JAMA. 2001;285(8):1034–1038.
- , , , , , . Optimistic expectations and survival after hematopoietic stem cell transplantation. Biol Blood Marrow Transplant. 2003;9(6):389–396.
- , , , et al. Development of the Serious Illness Care Program: a randomised controlled trial of a palliative care communication intervention. BMJ Open. 2015;5(10):e009032.
- , , , et al. Patterns of nurse‐physician communication and agreement on the plan of care. Qual Saf Health Care. 2010;19(3):195–199.
- , , , et al. Impact of localizing physicians to hospital units on nurse‐physician communication and agreement on the plan of care. J Gen Intern Med. 2009;24(11):1223–1227.
- , , , et al. Changes in medical errors after implementation of a handoff program. N Engl J Med. 2014;371(19):1803–1812.
- , , , et al. Reorganizing a hospital ward as an accountable care unit. J Hosp Med. 2015;10(1):36–40.
- , , , . Interdisciplinary teamwork in hospitals: a review and practical recommendations for improvement. J Hosp Med. 2012;7(1):48–54.
- , , , , . An evaluation of mobile health application tools. JMIR mHealth uHealth. 2014;2(2):e19.
Patient‐centered care has been recognized by the Institute of Medicine as an essential aim of the US healthcare system.[1] A fundamental component of patient‐centered care is to engage patients and caregivers in establishing preferences, needs, values, and overall goals regarding their care.[1] Prior studies have shown that delivering high‐quality patient‐centered care is associated with improved health outcomes, and in some cases, reduced costs.[2, 3, 4, 5, 6, 7] Payors, including the Centers for Medicare and Medicaid Services under the Hospital Value‐Based Purchasing program, are increasingly tying payments to measures of patient experience.[8, 9] As more emphasis is placed on public reporting of these patient‐reported outcomes, healthcare organizations are investing in efforts to engage patients and caregivers, including efforts at establishing patients' preferences for care.[10]
In the acute care setting, a prerequisite for high‐quality patient‐centered care is identifying a patient's primary goal for recovery and then delivering care consistent with that goal.[11, 12, 13] Haberle et al. previously validated patients' most common goals for recovery in the hospital setting into 7 broad categories: (1) be cured, (2) live longer, (3) improve or maintain health, (4) be comfortable, (5) accomplish a particular life goal, (6) provide support for a family member, or (7) other.[13] When providers' understanding of these recovery goals are not concordant with the patient's stated goals, patients may receive care inconsistent with their preferences; it is not uncommon for patients to receive aggressive curative treatments (eg, cardiopulmonary resuscitation) when they have expressed otherwise.[14] On the other hand, when patient goals and priorities are clearly established, patients may have better outcomes.[15] For example, earlier conversations about patient goals and priorities in serious illness can lead to realistic expectations of treatment, enhanced goal‐concordant care, improved quality of life, higher patient satisfaction, more and earlier hospice care, fewer hospitalizations, better patient and family coping, reduced burden of decision making for families, and improved bereavement outcomes.[16, 17, 18]
Although previous studies have suggested poor patient‐physician concordance with regard to the patient's plan of care,[19, 20, 21, 22, 23, 24] there are limited data regarding providers' understanding of the patient's primary recovery goal during hospitalization. The purpose of this study was to identify the patients' Haberle goal, and then determine the degree of concordance among patients and key hospital providers regarding this goal.
METHODS
Study Setting
The Partners Human Research Committee approved the study. The study was conducted on an oncology and medical intensive care unit (MICU) at a major academic medical center in Boston, Massachusetts. The oncology unit was comprised of 2 non‐localized medical teams caring for patients admitted to that unit. The MICU was comprised of a single localized medical team. Medical teams working on these units consisted of a first responder (eg, intern or a physician assistant [PA]), medical residents, and an attending physician. Both units had dedicated nursing staff.
Study Participants
All adult patients (>17 years of age) admitted to the oncology and MICU units during the study period (November 2013 through May 2014) were eligible. These units were chosen because these patients are typically complex and have multiple medical comorbidities longer lengths of stay, and many procedures and tests. In addition, a standard method for asking patients to identify a primary recovery goal for hospitalization aligned well with ongoing institutional efforts to engage these patients in goals of care discussions.
Research assistants identified all patients admitted to each study unit for at least 48 hours and approached them in a random order with a daily target of 2 to 3 patients. Only patients who demonstrated capacity (determined by medical team), or had a legally designated healthcare proxy (who spoke English and was available to participate on their behalf) were included. Research assistants then approached the patient's nurse and a physician provider (defined for this study as housestaff physician, PA, or attending) from the primary medical team to participate in the interview (within 24 hours of patient's interview). We excluded eligible patients who did not have capacity or an available caregiver or declined to participate.
Data Collection Instrument and Interviews
Research assistants administered a validated questionnaire developed by Haberle et al. to participants after 48 hours into the patient's admission to provide time to establish mutual understanding of the diagnosis and prognosis.[13] We asked patients (or the designated healthcare proxy) to select their single, most important Haberle goal (see above). Specifically, as in the original validation study,[13] patients or proxies were asked the following question: Please tell me your most important goal of care for this hospitalization. If they did not understand this question, we asked a follow‐up question: What are you expecting will be accomplished during this hospitalization? Within 24 hours of the patient/proxy interview, we independently asked the patient's nurse and physician to select what they thought was the patient's most important goal for recovery using the same questionnaire, adapted for providers. In each case, all participants were blinded to the responses of others.
Measures
We measured the frequency that each participant (patient/proxy, nurse, and physician) selected a specific Haberle recovery goal across all patients. We measured the rate of pairwise concordance by recovery goal for each participant dyad (patient/proxy‐nurse, patient/proxy‐physician, and nurse‐physician). Finally, we calculated the frequency of cases for which all 3 participants selected the same recovery goal.
Statistical Analyses
Descriptive statistics were used to report patient demographic data. The frequencies of selected responses were calculated and reported as percentages for each type of participant. The differences in rate of responses for each Haberle goal were compared across each participant group using 2 analysis. We then performed 2‐way Kappa statistical tests to measure inter‐rater agreement for each dyad.
RESULTS
Of 1436 patients (882 oncology, 554 MICU) hospitalized during the study period, 341(156 oncology, 185 MICU) were admitted for 48 hours. Of 914 potentially eligible patients (617 oncology, 297 MICU), 191 (112 oncology and 79 MICU) were approached to participate based on our sampling strategy; of these, 8 (2 oncology and 6 MICU) did not have capacity (and no proxy was available) and 2 (1 oncology and 1 MICU) declined. Of the remaining 181 patients (109 oncology and 72 MICU), we obtained a completed questionnaire from all 3 interviewees on 109 (60.2% response rate).
Of the 109 study patients, 52 (47.7%) and 57 (52.3%) were admitted to the oncology and medical intensive care units, respectively (Table 1). Patients were predominantly middle aged, Caucasian, English‐speaking, and college‐educated. Healthcare proxies were frequently interviewed on behalf of patients in the MICU. Housestaff physicians were more often interviewed in the MICU, and PAs were interviewed only on oncology units. Compared to patient responders, nonresponders tended to be male and were admitted to oncology units (see Supporting Table 1 in the online version of this article).
| Characteristics | All Patients | Admitted to Medical Intensive Care Units | Admitted to Oncology Units |
|---|---|---|---|
| |||
| Total, no. (%) | 109 (100%) | 57 (52.3%) | 52 (47.7%) |
| Gender, no. (%) | |||
| Male | 55 (50.5%) | 28 (49.1%) | 26 (50.0%) |
| Female | 54 (49.5%) | 29 (50.9%) | 26 (50.0%) |
| Age, y, mean SD | 59.4 14 | 59.7 15 | 59.1 13 |
| Median | 61 | 61 | 60 |
| Range | 2188 | 2188 | 2285 |
| Race, no. (%) | |||
| White | 103 (94.5%) | 53 (93.0%) | 50 (96.2%) |
| Other | 6 (5.5%) | 4 (7.0%) | 2 (3.8%) |
| Language, no. (%) | |||
| English | 106 (97.2%) | 56 (98.1%) | 50 (96.2%) |
| Other | 3 (2.8%) | 1 (1.9%) | 2 (3.8%) |
| Education level, no. (%) | |||
| Less than high school | 30 (27.5%) | 17 (29.8%) | 13 (25.0%) |
| High school diploma | 27 (24.5%) | 18 (31.6%) | 9 (17.3%) |
| Some college or beyond | 52 (47.7%) | 22 (38.6%) | 30 (57.7%) |
| Patient or caregiver interviewed, no. (%) | |||
| Patient | 68 (62.4%) | 27 (47.4%) | 48 (92.3%) |
| Caregiver | 41 (37.6%) | 30 (52.6%) | 4 (7.7%) |
| Nurse interviewed, no. (unique) | 109 (75) | 57 (42) | 52 (33) |
| Physician provider interviewed, no. (%); no. unique | |||
| Attending | 27 (24.8%); 20 | 15 (26.3%); 10 | 12 (23.1%); 10 |
| Housestaff | 48 (44.0%); 39 | 42 (73.7%); 33 | 6 (11.5%); 6 |
| Physician assistant | 34 (31.2%); 25 | 0 (0%); 0 | 34 (65.4%); 25 |
The frequencies of selected Haberle recovery goals by participant type across all patients are listed in Table 2. Patients (or proxies) most often selected be cured (46.8%). Assigned nurses and physicians more commonly selected improve or maintain health (38.5% and 46.8%, respectively). Be comfortable was selected by nurses and physicians more frequently than by patients (16.5%, 16.5%, and 8.3%, respectively). The rate of responses for each Haberle goal was significantly different across all respondent groups (P 0.0001). The frequencies of selected Haberle goals were not significantly different between patients or proxies (P = 0.67), or for patients admitted to the MICU compared to oncology units (P = 0.64).
| Haberle Recovery Goal | Patient/Caregiver, no. (%), n = 109 | Physician Provider, no. (%), n = 109* | Nurse, no. (%), n = 109 |
|---|---|---|---|
| |||
| Be cured | 51 (46.8%) | 20 (18.3%) | 20 (18.3%) |
| Be comfortable | 9 (8.3%) | 18 (16.5%) | 18 (16.5%) |
| Improve or maintain health | 32 (29.4%) | 42 (38.5%) | 51 (46.8%) |
| Live longer | 14 (12.8%) | 21 (19.3%) | 12 (11%) |
| Accomplish personal goal | 2 (1.8%) | 0 (0%) | 3 (2.8%) |
| Provide support for family | 1 (0.9%) | 1 (0.9%) | 1 (0.9%) |
| Other | 0 (0%) | 7 (6.4%) | 4 (3.7%) |
Inter‐rater agreement was poor to slight for the 3 participant dyads (kappa 0.09 [0.03‐0.19], 0.19 [0.08‐0.30], and 0.20 [0.08‐0.32] for patient‐physician, patient‐nurse, and nurse‐physician, respectively). The 3 participants selected the identical recovery goal in 22 (20.2%) cases, and each selected a distinct recovery goal in 32 (29.4%) cases. Pairwise concordance between nurses and physicians was 39.4%. There were no significant differences in agreement between patients admitted to the MICU compared to oncology units (P = 0.09).
DISCUSSION
We observed poor to slight concordance among patients and key hospital providers with regard to identifying the patient's primary recovery goal during acute hospitalization. The majority of patients (or proxies), chose be cured, whereas the majority of hospital providers chose improve or maintain health. Patients were twice as likely to select be cured and half as likely to choose be comfortable compared to nurses or physicians. Strikingly, the patient (or proxy), nurse, and physician identified the same recovery goal in just 20% of cases. These findings were similar for patients admitted to either the MICU or oncology units or when healthcare proxies participated on behalf of the patient (eg, when incapacitated in the MICU).
There are many reasons why hospital providers may not correctly identify the patients' primary recovery goals. First, we do not routinely ask patients to identify recovery goals upon admission in a structured and standardized manner. In fact, clinicians often do not elicit patients' needs, concerns, and expectations regarding their care in general.[25] Second, even when recovery goals are elicited at admission, they may not be communicated effectively to all members of the care team. This could be due to geographically non‐localized teams (although we did not observe a statistically significant difference between regionalized MICU and nonregionalized oncology care units), frequent provider‐to‐provider handoffs, and siloed electronic communication (eg, email, alphanumeric pages) regarding goals of care that inevitably leaves out key providers.[26] Third, healthcare proxies who are involved in decision making on the patient's behalf may not always be available to meet with the care team in person; consequently, their input may not be considered in a timely manner or reliably communicated to all members of the care team. We observed a large discrepancy in how often patients chose be cured compared to their hospital providers. This could be explained by clinicians' unwillingness to disclose bad news or divulge accurate prognostic information that causes patients to feel depressed or lose hope, particularly for those patients with the worst prognoses.[16, 27, 28] Patients may lack sophisticated knowledge of their conditions for a variety of reasons, including low health literacy, at times choosing to hope for the best even when it is not realistic. Additionally, there may be more subtle differences in what patients and hospital providers consider the primary recovery goal in context of the main reason for hospitalization and underlying medical illness. For example, a patient with metastatic lung cancer hospitalized with recurrent postobstructive pneumonia may choose be cured as his/her primary recovery goal (thinking of the pneumonia), whereas physicians may choose improve/maintain health or comfort (thinking of the cancer). We also cannot exclude the possibility that sometimes when patients state be cured and clinicians state improve health as the primary goal, that they are really saying the same thing in different ways. However, these are 2 different constructs (cure may not be possible for many patients) that may deserve an explicit discussion for patients to have realistic expectations for their health following hospitalization.
In short, our results underscore the importance of having an open and honest dialog with patients and caregivers throughout hospitalization, and the need to provide education about the potential futility of excessive care in situations where appropriate. Simply following patients' goals without discussing their feasibility and the consequences of aggressive treatments may result in unnecessary morbidity and misuse of healthcare resources. Once goals are clearly established, communicated, and refined in hospitalized patients with serious illness, there is much reason to believe that ongoing conversation will favorably impact outcomes.[29]
We found few studies that rigorously quantified the rate of concordance of hospital recovery goals among patients and key hospital providers; however, studies that measured overall plan of care agreement have demonstrated suboptimal concordance.[20, 30, 31] Shin et al. found significant underestimation of cancer patients' needs and poor concordance between patients and oncologists in assessing perceived needs of supportive care.[20] It is also notable that nurses and physicians had low levels of concordance in our study. O'Leary and colleagues found that nurses and physicians did not reliably communicate and often did not agree on the plan of care for hospitalized patients.[30] Although geographic regionalization of care teams and multidisciplinary rounds can improve the likelihood that key members of the care team are on the same page with regard to the plan of care, there is still much room for improvement.[26, 32, 33, 34] For example, although nurses and physicians in our study independently selected individual recovery goals with similar frequencies (Table 2), we observed suboptimal concordance between nurses and providers (36.8%) for specific patients, including on our regionalized care unit (MICU). This may be due to the reasons described above.
There are several implications of these findings. As payors continue to shift payments toward value‐based metrics, largely determined by patient experience and adequate advance care planning,[9] our findings suggest that more effort should be focused on delivering care consistent with patients' primary recovery goals. As a first step, healthcare organizations can focus on efforts to systematically identify and communicate recovery goals to all members of the care team, ensuring that patients' preferences, needs, and values are captured. In addition, as innovation in patient engagement and care delivery using Web‐based and mobile technology continues to grow,[35] using these tools to capture key goals for hospitalization and recovery can play an essential role. For example, as electronic health record vendors and institutions start to implement patient portals in the acute care setting, they should consider how to configure these tools to capture key goals for hospitalization and recovery, and then communicate them to the care team; preliminary work in this area is promising.[10]
Our study has several limitations to generalizability. First, the study was conducted on 2 services (MICU and oncology) at a single institution using a sampling strategy where research assistants enrolled 2 to 3 patients per day. Although the sampling was random, the availability of patients and proxies to be interviewed may have led to selection bias. Second, the sample size was small. Third, the patients who participated were predominantly white, English‐speaking, and well educated, possibly a consequence of our sampling strategy. However, this fact makes our findings more striking; although cultural and language barriers were generally not present in our study population, large discrepancies in goal concordance still existed. Fourth, in instances when patients were unable to participate themselves, we interviewed their healthcare proxy; therefore, it is possible that the proxies' responses did not reflect those of the patient. However, we note that concordance rates did not significantly differ between the 2 services despite the fact that the proportion of proxy interviews was much higher in the MICU. Similarly, we cannot exclude the possibility that patients altered their stated goals in the presence of proxies, but patients were given the option to be interviewed alone. Patients may also have misunderstood the timing of the goals (during this hospitalization as opposed to long term), although research assistants made every effort to clarify this during the interviews. Finally, our data‐collection instrument was previously validated in hospitalized general medicine patients and not oncology or MICU patients, and it has not been used to directly ask clinicians to identify patients' recovery goals. However, there is no reason to suspect that it could not be used for this purpose in critical care as well as noncritical care settings, as the survey was developed by a multidisciplinary team that included medical professionals and was validated by clinicians who successfully identified a single, very broad goal (eg, be cured) in each case.
CONCLUSION
We report poor to slight concordance among hospitalized patients and key hospital providers with regard to the main recovery goal. Future studies should assess whether patient satisfaction and experience is adversely impacted by patient‐provider discordance regarding key recovery goals. Additionally, institutions may consider future efforts to elicit and communicate patients' primary recovery goals more effectively to all members of the care team, and address discrepancies as soon as they are discovered.
Disclosures
This work was supported by a grant from the Gordon and Betty Moore Foundation (GBMF) (grant GBMF3914). GBMF had no role in the design or conduct of the study; collection, analysis, or interpretation of data; or preparation or review of the manuscript. The authors report no conflicts of interest.
- Institute of Medicine. Crossing the Quality Chasm: A New Health System for the 21st Century. Washington, DC: National Academy of Sciences; 2001.
- , , , , , . The effects of physician communications skills on patient satisfaction; recall, and adherence. J Chronic Dis. 1984;37(9–10):755–764.
- , , , et al. Observational study of effect of patient centredness and positive approach on outcomes of general practice consultations. BMJ. 2001;323(7318):908–911.
- . Reengineering hospital discharge: a protocol to improve patient safety, reduce costs, and boost patient satisfaction. Am J Med Qual. 2009;24(4):344–346.
- , , , , . Relationship between patient satisfaction with inpatient care and hospital readmission within 30 days. Am J Manag Care. 2011;17(1):41–48.
- , , , . Patients' perception of hospital care in the United States. N Engl J Med. 2008;359(18):1921–1931.
- , , . Enhanced support for shared decision making reduced costs of care for patients with preference‐sensitive conditions. Health Aff (Millwood). 2013;32(2):285–293.
- Centers for Medicare and Medicaid Services. Medicare program; hospital inpatient value‐based purchasing program. Final rule. Fed Regist. 2011;76(88):26490–26547.
- Centers for Medicare and Medicaid Services. CMS begins implementation of key payment legislation. Available at: https://www.cms.gov/Newsroom/MediaReleaseDatabase/Press‐releases/2015‐Press‐releases‐items/2015‐07‐08.html. Published July 8, 2015.
- , , , et al. A web‐based, patient‐centered toolkit to engage patients and caregivers in the acute care setting: a preliminary evaluation [published online August 2, 2015]. J Am Med Informatics Assoc. doi: 10.1093/jamia/ocv093.
- , , , et al. Effectiveness trial of an intensive communication structure for families of long‐stay ICU patients. Chest. 2010;138(6):1340–1348.
- , , , . Understanding goals of care statements and preferences among patients and their surrogates in the medical ICU. J Hosp Palliat Nurs. 2012;14(2):126–132.
- , , , . Goals of care among hospitalized patients: a validation study. Am J Hosp Palliat Care. 2011;28(5):335–341.
- , , , et al. Factors associated with use of cardiopulmonary resuscitation in seriously ill hospitalized adults. JAMA. 1999;282(24):2333–2339.
- , , , , . End‐of‐life discussions, goal attainment, and distress at the end of life: Predictors and outcomes of receipt of care consistent with preferences. J Clin Oncol. 2010;28(7):1203–1208.
- , . Reasons why physicians do not have discussions about poor prognosis, why it matters, and what can be improved. J Clin Oncol. 2012;30(22):2715–2717.
- , , , et al. Associations between end‐of‐life discussions, patient mental health, medical care near death, and caregiver bereavement adjustment. JAMA. 2008;300(14):1665–1673.
- , , , . Prior advance care planning is associated with less decisional conflict among surrogates for critically ill patients. Ann Am Thorac Soc. 2015;12(10):1528–1533.
- , , , et al. Hospitalized patients' understanding of their plan of care. Mayo Clin Proc. 2010;85(1):47–52.
- , , , et al. Discordance in perceived needs between patients and physicians in oncology practice: a nationwide survey in Korea. J Clin Oncol. 2011;29(33):4424–4429.
- , , , , , . Leveraging standards to support patient‐centric interdisciplinary plans of care. AMIA Annu Symp Proc. 2011;2011:356–363.
- , . Discordance between physician and patient self‐rated health and all‐cause mortality. Ochsner J. 2011;11(3):232–240.
- , , , , , . Determinants of discordance between patients and physicians in their assessment of lupus disease activity. J Rheumatol. 2003;30(9):1967–1976.
- , , , , , . Predictors of discordance between physicians' and patients' appraisals of health‐related quality of life in atrial fibrillation patients: Findings from the Angiotensin II Antagonist in Paroxysmal Atrial Fibrillation Trial. Am Heart J. 2013;166(3):589–596.
- , , , et al. Uncovering the blind spot of patient satisfaction: an international survey. BMJ Qual Saf. 2011;20(11):959–965.
- , , , , , . Improving teamwork: impact of structured interdisciplinary rounds on a hospitalist unit. J Hosp Med. 2011;6(2):88–93.
- , , , . Discrepancies between patient and physician estimates for the success of stem cell transplantation. JAMA. 2001;285(8):1034–1038.
- , , , , , . Optimistic expectations and survival after hematopoietic stem cell transplantation. Biol Blood Marrow Transplant. 2003;9(6):389–396.
- , , , et al. Development of the Serious Illness Care Program: a randomised controlled trial of a palliative care communication intervention. BMJ Open. 2015;5(10):e009032.
- , , , et al. Patterns of nurse‐physician communication and agreement on the plan of care. Qual Saf Health Care. 2010;19(3):195–199.
- , , , et al. Impact of localizing physicians to hospital units on nurse‐physician communication and agreement on the plan of care. J Gen Intern Med. 2009;24(11):1223–1227.
- , , , et al. Changes in medical errors after implementation of a handoff program. N Engl J Med. 2014;371(19):1803–1812.
- , , , et al. Reorganizing a hospital ward as an accountable care unit. J Hosp Med. 2015;10(1):36–40.
- , , , . Interdisciplinary teamwork in hospitals: a review and practical recommendations for improvement. J Hosp Med. 2012;7(1):48–54.
- , , , , . An evaluation of mobile health application tools. JMIR mHealth uHealth. 2014;2(2):e19.
Discharge Preparedness and Readmission
In recent years, US hospitals have focused on decreasing readmission rates, incented by reimbursement penalties to hospitals having excessive readmissions.[1] Gaps in the quality of care provided during transitions likely contribute to preventable readmissions.[2] One compelling quality assessment in this setting is measuring patients' discharge preparedness, using key dimensions such as understanding their instructions for medication use and follow‐up. Patient‐reported preparedness for discharge may also be useful to identify risk of readmission.
Several patient‐reported measures of preparedness for discharge exist, and herein we describe 2 measures of interest. First, the Brief‐PREPARED (B‐PREPARED) measure was derived from the longer PREPARED instrument (Prescriptions, Ready to re‐enter community, Education, Placement, Assurance of safety, Realistic expectations, Empowerment, Directed to appropriate services), which reflects the patient's perceived needs at discharge. In previous research, the B‐PREPARED measure predicted emergency department (ED) visits for patients who had been recently hospitalized and had a high risk for readmission.[3] Second, the Care Transitions Measure‐3 (CTM‐3) was developed by Coleman et al. as a patient‐reported measure to discriminate between patients who were more likely to have an ED visit or readmission from those who did not. CTM‐3 has also been used to evaluate hospitals' level of care coordination and for public reporting purposes.[4, 5, 6] It has been endorsed by the National Quality Forum and incorporated into the Hospital Consumer Assessment of Healthcare Providers and Systems (HCAHPS) survey provided to samples of recently hospitalized US patients.[7] However, recent evidence from an inpatient cohort of cardiovascular patients suggests the CTM‐3 overinflates care transition scores compared to the longer 15‐item CTM. In that cohort, the CTM‐3 could not differentiate between patients who did or did not have repeat ED visits or readmission.[8] Thus far, the B‐PREPARED and CTM‐3 measures have not been compared to one another directly.
In addition to the development of patient‐reported measures, hospitals increasingly employ administrative algorithms to predict likelihood of readmission.[9] A commonly used measure is the LACE index (Length of stay, Acuity, Comorbidity, and Emergency department use).[10] The LACE index predicted readmission and death within 30 days of discharge in a large cohort in Canada. In 2 retrospective studies of recently hospitalized patients in the United States, the LACE index's ability to discriminate between patients readmitted or not ranged from slightly better than chance to moderate (C statistic 0.56‐0.77).[11, 12]
It is unknown whether adding patient‐reported preparedness measures to commonly used readmission prediction scores increases the ability to predict readmission risk. We sought to determine whether the B‐PREPARED and CTM‐3 measures were predictive of readmission or death, as compared to the LACE index, in a large cohort of cardiovascular patients. In addition, we sought to determine the additional predictive and discriminative ability gained from administering the B‐PREPARED and CTM‐3 measures, while adjusting for the LACE index and other clinical factors. We hypothesized that: (1) higher preparedness scores on both measures would predict lower risk of readmission or death in a cohort of patients hospitalized with cardiac diagnoses; and (2) because it provides more specific and actionable information, the B‐PREPARED would discriminate readmission more accurately than CTM‐3, after controlling for clinical factors.
METHODS
Study Setting and Design
The Vanderbilt Inpatient Cohort Study (VICS) is a prospective study of patients admitted with cardiovascular disease to Vanderbilt University Hospital. The purpose of VICS is to investigate the impact of patient and social factors on postdischarge health outcomes such as quality of life, unplanned hospital utilization, and mortality. The rationale and design of VICS are detailed elsewhere.[13] Briefly, participants completed a baseline interview while hospitalized, and follow‐up phone calls were conducted within 2 to 9 days and at approximately 30 and 90 days postdischarge. During the first follow‐up call conducted by research assistants, we collected preparedness for discharge data utilizing the 2 measures described below. After the 90‐day phone call, we collected healthcare utilization since the index admission. The study was approved by the Vanderbilt University Institutional Review Board.
Patients
Eligibility screening shortly after admission identified patients with acute decompensated heart failure (ADHF) and/or an intermediate or high likelihood of acute coronary syndrome (ACS) per a physician's review of the clinical record. Exclusion criteria included: age 18 years, non‐English speaker, unstable psychiatric illness, delirium, low likelihood of follow‐up (eg, no reliable telephone number), on hospice, or otherwise too ill to complete an interview. To be included in these analyses, patients must have completed the preparedness for discharge measurements during the first follow‐up call. Patients who died before discharge or before completing the follow‐up call were excluded.
Preparedness for Discharge Measures (Patient‐Reported Data)
Preparedness for discharge was assessed using the 11‐item B‐PREPARED and the 3‐item CTM‐3.
The B‐PREPARED measures how prepared patients felt leaving the hospital with regard to: self‐care information for medications and activity, equipment/community services needed, and confidence in managing one's health after hospitalization. The B‐PREPARED measure has good internal consistency reliability (Cronbach's = 0.76) and has been validated in patients of varying age within a week of discharge. Preparedness is the sum of responses to all 11 questions, with a range of 0 to 22. Higher scores reflect increased preparedness for discharge.[3]
The CTM‐3 asks patients to rate how well their preferences were considered regarding transitional needs, as well as their understanding of postdischarge self‐management and the purpose of their medications, each on a 4‐point response scale (strongly disagree to strongly agree). The sum of the 3 responses quantifies the patient's perception of the quality of the care transition at discharge (Cronbach's = 0.86,[14] 0.92 in a cohort similar to ours[8]). Scores range from 3 to 12, with higher score indicating more preparedness. Then, the sum is transformed to a 0 to 100 scale.[15]
Clinical Readmission Risk Measures (Medical Record Data)
The LACE index, published by Van Walraven et al.,[10] takes into account 4 categories of clinical data: length of hospital stay, acuity of event, comorbidities, and ED visits in the prior 6 months. More specifically, a diagnostic code‐based, modified version of the Charlson Comorbidity Index was used to calculate the comorbidity score. These clinical criteria were obtained from an administrative database and weighted according to the methods used by Van Walraven et al. An overall score was calculated on a scale of 0 to 19, with higher scores indicating higher risk of readmission or death within 30 days.
From medical records, we also collected patients' demographic data including age, race, and gender, and diagnosis of ACS, ADHF, or both at hospital admission.
Outcome Measures
Healthcare utilization data were obtained from the index hospital as well as outside facilities. The electronic medical records from Vanderbilt University Hospital provided information about healthcare utilization at Vanderbilt 90 days after initial discharge. We also used Vanderbilt records to see if patients were transferred to Vanderbilt from other hospitals or if patients visited other hospitals before or after enrollment. We supplemented this with patient self‐report during the follow‐up telephone calls (at 30 and 90 days after initial discharge) so that any additional ED and hospital visits could be captured. Mortality data were collected from medical records, Social Security data, and family reports. The main outcome was time to first unplanned hospital readmission or death within 30 and 90 days of discharge.
Analysis
To describe our sample, we summarized categorical variables with percentages and continuous variables with percentiles. To test for evidence of unadjusted covariate‐outcome relationships, we used Pearson 2 and Wilcoxon rank sum tests for categorical and continuous covariates, respectively.
For the primary analyses we used Cox proportional hazard models to examine the independent associations between the prespecified predictors for patient‐reported preparedness and time to first unplanned readmission or death within 30 and 90 days of discharge. For each outcome (30‐ and 90‐day readmission or death), we fit marginal models separately for each of the B‐PREPARED, CTM‐3, and LACE scores. We then fit multivariable models that used both preparedness measures as well as age, gender, race, and diagnosis (ADHF and/or ACS), variables available to clinicians when patients are admitted. When fitting the multivariable models, we did not find strong evidence of nonlinear effects; therefore, only linear effects are reported. To facilitate comparison of effects, we scaled continuous variables by their interquartile range (IQR). The associated, exponentiated regression parameter estimates may therefore be interpreted as hazard ratios for readmission or death per IQR change in each predictor. In addition to parameter estimation, we computed the C index to evaluate capacity for the model to discriminate those who were and were not readmitted or died. All analyses were conducted in R version 3.1.2 (R Foundation for Statistical Computing, Vienna, Austria).
RESULTS
From the cohort of 1239 patients (Figure 1), 64%, 28%, and 7% of patients were hospitalized with ACS, ADHF, or both, respectively (Table 1). Nearly 45% of patients were female, 83% were white, and the median age was 61 years (IQR 5269). The median length of stay was 3 days (IQR 25). The median preparedness scores were high for both B‐PREPARED (21, IQR 1822) and CTM‐3 (77.8, IQR 66.7100). A total of 211 (17%) and 380 (31%) were readmitted or died within 30 and 90 days, respectively. The completion rate for the postdischarge phone calls was 88%.
| Death or Readmission Within 30 Days | Death or Readmission Within 90 Days | |||||
|---|---|---|---|---|---|---|
| Not Readmitted, N = 1028 | Death/Readmitted, N = 211 | P Value | Not Readmitted, N = 859 | Death/Readmitted, N = 380 | P Value | |
| ||||||
| Gender, male | 55.8% (574) | 53.1% (112) | 0.463* | 56.3% (484) | 53.2% (202) | 0.298* |
| Female | 44.2% (454) | 46.9% (99) | 43.7% (375) | 46.8% (178) | ||
| Race, white | 83.9% (860) | 80.6% (170) | 0.237* | 86.0% (737) | 77.3% (293) | 0.001* |
| Race, nonwhite | 16.1% (165) | 19.4% (41) | 14.0% (120) | 22.7% (86) | ||
| Diagnosis ACS | 68.0% (699) | 46.4% (98) | 0.001* | 72.9% (626) | 45.0% (171) | 0.001* |
| ADHF | 24.8% (255) | 46.0% (97) | 20.3% (174) | 46.8% (178) | ||
| Both | 7.2% (74) | 7.6% (16) | 6.9% (59) | 8.2% (31) | ||
| Age | 39.4:52:61:68:80 | 37.5:53.5:62:70:82 | 0.301 | 40:52:61:68:80 | 38:52:61 :70:82 | 0.651 |
| LOS | 1:2:3:5:10 | 1:3: 4:7.5:17 | 0.001 | 1:2:3:5:9 | 1:3:4:7:15 | 0.001 |
| CTM‐3 | 55.6:66.7: 77.8:100:100 | 55.6:66.7:77.8:100 :100 | 0.305 | 55.6:66.7:88.9:100:100 | 55.6:66.7:77.8:100 :100 | 0.080 |
| B‐PREPARED | 12:18:21:22.:22 | 10:17:20:22:22 | 0.066 | 12:18:21:22:22 | 10:17:20 :22:22 | 0.030 |
| LACE | 1:4: 7:10 :14 | 3.5:7:10:13:17 | 0.001 | 1:4:6: 9:14 | 3:7:10:13:16 | 0.001 |

B‐PREPARED and CTM‐3 were moderately correlated with one another (Spearman's = 0.40, P 0.001). In bivariate analyses (Table 1), the association between B‐PREPARED and readmission or death was significant at 90 days (P = 0.030) but not 30 days. The CTM‐3 showed no significant association with readmission or death at either time point. The LACE score was significantly associated with rates of readmission at 30 and 90 days (P 0.001).
Outcomes Within 30 Days of Discharge
When examining readmission or death within 30 days of discharge, simple unadjusted models 2 and 3 showed that the B‐PREPARED and LACE scores, respectively, were each significantly associated with time to first readmission or death (Table 2). Specifically, a 4‐point increase in the B‐PREPARED score was associated with a 16% decrease in the hazard of readmission or death (hazard ratio [HR] = 0.84, 95% confidence interval [CI]: 0.72 to 0.97). A 5‐point increase in the LACE score was associated with a 100% increase in the hazard of readmission or death (HR = 2.00, 95% CI: 1.72 to 2.32). In the multivariable model with both preparedness scores and diagnosis (model 4), the B‐PREPARED score (HR = 0.82, 95% CI: 0.70 to 0.97) was significantly associated with time to first readmission or death. In the full 30‐day model including B‐PREPARED, CTM‐3, LACE, age, gender, race, and diagnosis (model 5), only the LACE score (HR = 1.83, 95% CI: 1.54 to 2.18) was independently associated with time to readmission or death. Finally, the CTM‐3 did not predict 30‐day readmission or death in any of the models tested.
| Models | HR (95% CI)* | P Value | C Index |
|---|---|---|---|
| |||
| 1. CTM (per 10‐point change) | 0.95 (0.88 to 1.03) | 0.257 | 0.523 |
| 2. B‐PREPARED (per 4‐point change) | 0.84 (0.72 to 0.97) | 0.017 | 0.537 |
| 3. LACE (per 5‐point change) | 2.00 (1.72 to 2.32) | 0.001 | 0.679 |
| 4. CTM (per 10‐point change) | 1.00 (0.92 to 1.10) | 0.935 | 0.620 |
| B‐PREPARED (per 4‐point change) | 0.82 (0.70 to 0.97) | 0.019 | |
| ADHF only (vs ACS only) | 2.46 (1.86 to 3.26) | 0.001 | |
| ADHF and ACS (vs ACS only) | 1.42 (0.84 to 2.42) | 0.191 | |
| 5. CTM (per 10‐point change) | 1.02 (0.93 to 1.11) | 0.722 | 0.692 |
| B‐PREPARED (per 4 point change) | 0.87 (0.74 to 1.03) | 0.106 | |
| LACE (per 5‐point change) | 1.83 (1.54 to 2.18) | 0.001 | |
| ADHF only (vs ACS only) | 1.51 (1.10 to 2.08) | 0.010 | |
| ADHF and ACS (vs ACS only) | 0.90 (0.52 to 1.55) | 0.690 | |
| Age (per 10‐year change) | 1.02 (0.92 to 1.14) | 0.669 | |
| Female (vs male) | 1.11 (0.85 to 1.46) | 0.438 | |
| Nonwhite (vs white) | 0.92 (0.64 to 1.30) | 0.624 | |
Outcomes Within 90 Days of Discharge
At 90 days after discharge, again the separate unadjusted models 2 and 3 demonstrated that the B‐PREPARED and LACE scores, respectively, were each significantly associated with time to first readmission or death, whereas the CTM‐3 model only showed marginal significance (Table 3). In the multivariable model with both preparedness scores and diagnosis (model 4), results were similar to 30 days as the B‐PREPARED score was significantly associated with time to first readmission or death. Lastly, in the full model (model 5) at 90 days, again the LACE score was significantly associated with time to first readmission or death. In addition, B‐PREPARED scores were associated with a significant decrease in risk of readmission or death (HR = 0.88, 95% CI: 0.78 to 1.00); CTM‐3 scores were not independently associated with outcomes.
| Model | HR (95% CI)* | P Value | C Index |
|---|---|---|---|
| |||
| 1. CTM (per 10‐point change) | 0.94 (0.89 to 1.00) | 0.051 | 0.526 |
| 2. B‐PREPARED (per 4‐point change) | 0.84 (0.75 to 0.94) | 0.002 | 0.533 |
| 3. LACE (per 5‐point change) | 2.03 (1.82 to 2.27) | 0.001 | 0.683 |
| 4. CTM (per 10‐point change) | 0.99 (0.93 to 1.06) | 0.759 | 0.640 |
| B‐PREPARED (per 4‐point change) | 0.83 (0.74 to 0.94) | 0.003 | |
| ADHF only (vs ACS only) | 2.88 (2.33 to 3.56) | 0.001 | |
| ADHF and ACS (vs ACS only) | 1.62 (1.11 to 2.38) | 0.013 | |
| 5. CTM (per 10‐point change) | 1.00 (0.94 to 1.07) | 0.932 | 0.698 |
| B‐PREPARED (per 4‐point change) | 0.88 (0.78 to 1.00) | 0.043 | |
| LACE (per 5‐point change) | 1.76 (1.55 to 2.00) | 0.001 | |
| ADHF only (vs ACS only) | 1.76 (1.39 to 2.24) | 0.001 | |
| ADHF and ACS (vs ACS only) | 1.00 (0.67 to 1.50) | 0.980 | |
| Age (per 10‐year change) | 1.00 (0.93 to 1.09) | 0.894 | |
| Female (vs male) | 1.10 (0.90 to 1.35) | 0.341 | |
| Nonwhite (vs white) | 1.14 (0.89 to 1.47) | 0.288 | |
Tables 2 and 3 also display the C indices, or the discriminative ability of the models to differentiate whether or not a patient was readmitted or died. The range of the C index is 0.5 to 1, where values closer to 0.5 indicate random predictions and values closer to 1 indicate perfect prediction. At 30 days, the individual C indices for B‐PREPARED and CTM‐3 were only slightly better than chance (0.54 and 0.52, respectively) in their discriminative abilities. However, the C indices for the LACE score alone (0.68) and the multivariable model (0.69) including all 3 measures (ie, B‐PREPARED, CTM‐3, LACE), and clinical and demographic variables, had higher utility in discriminating patients who were readmitted/died or not. The 90‐day C indices were comparable in magnitude to those at 30 days.
DISCUSSION/CONCLUSION
In this cohort of patients hospitalized with cardiovascular disease, we compared 2 patient‐reported measures of preparedness for discharge, their association with time to death or readmission at 30 and 90 days, and their ability to discriminate patients who were or were not readmitted or died. Higher preparedness as measured by higher B‐PREPARED scores was associated with lower risk of readmission or death at 30 and 90 days after discharge in unadjusted models, and at 90 days in adjusted models. CTM‐3 was not associated with the outcome in any analyses. Lastly, the individual preparedness measures were not as strongly associated with readmission or death compared to the LACE readmission index alone.
How do our findings relate to the measurement of care transition quality? We consider 2 scenarios. First, if hospitals utilize the LACE index to predict readmission, then neither self‐reported measure of preparedness adds meaningfully to its predictive ability. However, hospital management may still find the B‐PREPARED and CTM‐3 useful as a means to direct care transition quality‐improvement efforts. These measures can instruct hospitals as to what areas their patients express the greatest difficulty or lack of preparedness and closely attend to patient needs with appropriate resources. Furthermore, the patient's perception of being prepared for discharge may be different than their actual preparedness. Their perceived preparedness may be affected by cognitive impairment, dissatisfaction with medical care, depression, lower health‐related quality of life, and lower educational attainment as demonstrated by Lau et al.[16] If a patient's perception of preparedness were low, it would behoove the clinician to investigate these other issues and address those that are mutable. Additionally, perceived preparedness may not correlate with the patient's understanding of their medical conditions, so it is imperative that clinicians provide prospective guidance about their probable postdischarge trajectory. If hospitals are not utilizing the LACE index, then perhaps using the B‐PREPARED, but not the CTM‐3, may be beneficial for predicting readmission.
How do our results fit with evidence from prior studies, and what do they mean in the context of care transitions quality? First, in the psychometric evaluation of the B‐PREPARED measure in a cohort of recently hospitalized patients, the mean score was 17.3, lower than the median of 21 in our cohort.[3] Numerous studies have utilized the CTM‐3 and the longer‐version CTM‐15. Though we cannot make a direct comparison, the median in our cohort (77.8) was on par with the means from other studies, which ranged from 63 to 82.[5, 17, 18, 19] Several studies also note ceiling effects with clusters of scores at the upper end of the scale, as did we. We conjecture that our cohort's preparedness scores may be higher because our institution has made concerted efforts to improve the discharge education for cardiovascular patients.
In a comparable patient population, the TRACE‐CORE (Transitions, Risks, and Actions in Coronary Events Center for Outcomes Research and Education) study is a cohort of more than 2200 patients with ACS who were administered the CTM‐15 within 1 month of discharge.[8] In that study, the median CTM‐15 score was 66.6, which is lower than our cohort. With regard to the predictive ability of the CTM‐3, they note that CTM‐3 scores did not differentiate between patients who were or were not readmitted or had emergency department visits. Our results support their concern that the CTM‐15 and by extension the CTM‐3, though adopted widely as part of HCAHPS, may not have sufficient ability to discriminate differences in patient outcomes or the quality of care transitions.
More recently, patient‐reported preparedness for discharge was assessed in a prospective cohort in Canada.[16] Lau et al. administered a single‐item measure of readiness at the time of discharge to general medicine patients, and found that lower readiness scores were also not associated with readmission or death at 30 days, when adjusted for the LACE index as we did.
We must acknowledge the limitations of our findings. First, our sample of recently discharged patients with cardiovascular disease is different than the community‐dwelling, underserved Americans hospitalized in the prior year, which served as the sample for reducing the CTM‐15 to 3 items.[5] This fact may explain why we did not find the CTM‐3 to be associated with readmission in our sample. Second, our analyses did not include extensive adjustment for patient‐related factors. Rather, our intention was to see how well the preparedness measures performed independently and compare their abilities to predict readmission, which is particularly relevant for clinicians who may not have all possible covariates in predicting readmission. Finally, because we limited the analyses to the patients who completed the B‐PREPARED and CTM‐3 measures (88% completion rate), we may not have data for: (1) very ill patients, who had a higher risk of readmission and least prepared, and were not able to answer the postdischarge phone call; and (2) very functional patients, who had a lower risk of readmission and were too busy to answer the postdischarge phone call. This may have limited the extremes in the spectrum of our sample.
Importantly, our study has several strengths. We report on the largest sample to date with results of both B‐PREPARED and CTM‐3. Moreover, we examined how these measures compared to a widely used readmission prediction tool, the LACE index. We had very high postdischarge phone call completion rates in the week following discharge. Furthermore, we had thorough assessment of readmission data through patient report, electronic medical record documentation, and collection of outside medical records.
Further research is needed to elucidate: (1) the ideal administration time of the patient‐reported measures of preparedness (before or after discharge), and (2) the challenges to the implementation of measures in healthcare systems. Remaining research questions center on the tradeoffs and barriers to implementing a longer measure like the 11‐item B‐PREPARED compared to a shorter measure like the CTM‐3. We do not know whether longer measures preclude their use by busy clinicians, though it provides more specific information about what patients feel they need at hospital discharge. Additionally, studies need to demonstrate the mutability of preparedness and the response of measures to interventions designed to improve the hospital discharge process.
In our sample of recently hospitalized cardiovascular patients, there was a statistically significant association between patient‐reported preparedness for discharged, as measured by B‐PREPARED, and readmissions/death at 30 and 90 days, but the magnitude of the association was very small. Furthermore, another patient‐reported preparedness measure, CTM‐3, was not associated with readmissions or death at either 30 or 90 days. Lastly, neither measure discriminated well between patients who were readmitted or not, and neither measure added meaningfully to the LACE index in terms of predicting 30‐ or 90‐day readmissions.
Disclosures
This study was supported by grant R01 HL109388 from the National Heart, Lung, and Blood Institute (Dr. Kripalani) and in part by grant UL1 RR024975‐01 from the National Center for Research Resources, and grant 2 UL1 TR000445‐06 from the National Center for Advancing Translational Sciences. Dr. Kripalani is a consultant to SAI Interactive and holds equity in Bioscape Digital, and is a consultant to and holds equity in PictureRx, LLC. Dr. Bell is supported by the National Institutes of Health (K23AG048347) and by the Eisenstein Women's Heart Fund. Dr. Vasilevskis is supported by the National Institutes of Health (K23AG040157) and the Geriatric Research, Education and Clinical Center. Dr. Mixon is a Veterans Affairs Health Services Research and Development Service Career Development awardee (12‐168) at the Nashville Department of Veterans Affairs. The content is solely the responsibility of the authors and does not necessarily represent the official views of the National Institutes of Health. The funding agency was not involved in the design and conduct of the study; collection, management, analysis, and interpretation of the data; and preparation, review, or approval of the manuscript. All authors had full access to all study data and had a significant role in writing the manuscript. The contents do not represent the views of the US Department of Veterans Affairs or the United States government. Dr. Kripalani is a consultant to and holds equity in PictureRx, LLC.
- Centers for Medicare 9(9):598–603.
- , , . Brief scale measuring patient preparedness for hospital discharge to home: psychometric properties. J Hosp Med. 2008;3(6):446–454.
- , , . Assessing the quality of preparation for posthospital care from the patient's perspective: the care transitions measure. Med Care. 2005;43(3):246–255.
- , , , . Assessing the quality of transitional care: further applications of the care transitions measure. Med Care. 2008;46(3):317–322.
- , , , , . The central role of performance measurement in improving the quality of transitional care. Home Health Care Serv Q. 2007;26(4):93–104.
- Centers for Medicare 3:e001053.
- , , , et al. Risk prediction models for hospital readmission: a systematic review. JAMA. 2011;306(15):1688–1698.
- , , , et al. Derivation and validation of an index to predict early death or unplanned readmission after discharge from hospital to the community. CMAJ. 2010;182(6):551–557.
- , , , et al. Using the LACE index to predict hospital readmissions in congestive heart failure patients. BMC Cardiovasc Disord. 2014;14:97.
- , , , . Validation of a predictive model to identify patients at high risk for hospital readmission. J Healthc Qual. 2016;38(1):34–41.
- , , , et al. Determinants of health after hospital discharge: rationale and design of the Vanderbilt Inpatient Cohort Study (VICS). BMC Health Serv Res. 2014;14:10.
- . CTM frequently asked questions. Available at: http://caretransitions.org/tools-and-resources/. Accessed January 22, 2016.
- . Instructions for scoring the CTM‐3. Available at: http://caretransitions.org/tools-and-resources/. Accessed January 22, 2016.
- , , , et al. Patient‐reported discharge readiness and 30‐day risk of readmission or death: a prospective cohort study. Am J Med. 2016;129:89–95.
- , , , , . Implementaiton of the Care Transitions Intervention: sustainability and lessons learned. Prof Case Manag. 2009;14(6):282–293.
- , , , . The care transitions innovation (C‐TraIn) for socioeconomically disadvantaged adults: results of a cluster randomized controlled trial. J Gen Intern Med. 2014;29(11):1460–1467.
- , , , et al. Telephone calls to patients after discharge from the hospital: an important part of transitions of care. Med Educ Online. 2015;29(20):26701.
In recent years, US hospitals have focused on decreasing readmission rates, incented by reimbursement penalties to hospitals having excessive readmissions.[1] Gaps in the quality of care provided during transitions likely contribute to preventable readmissions.[2] One compelling quality assessment in this setting is measuring patients' discharge preparedness, using key dimensions such as understanding their instructions for medication use and follow‐up. Patient‐reported preparedness for discharge may also be useful to identify risk of readmission.
Several patient‐reported measures of preparedness for discharge exist, and herein we describe 2 measures of interest. First, the Brief‐PREPARED (B‐PREPARED) measure was derived from the longer PREPARED instrument (Prescriptions, Ready to re‐enter community, Education, Placement, Assurance of safety, Realistic expectations, Empowerment, Directed to appropriate services), which reflects the patient's perceived needs at discharge. In previous research, the B‐PREPARED measure predicted emergency department (ED) visits for patients who had been recently hospitalized and had a high risk for readmission.[3] Second, the Care Transitions Measure‐3 (CTM‐3) was developed by Coleman et al. as a patient‐reported measure to discriminate between patients who were more likely to have an ED visit or readmission from those who did not. CTM‐3 has also been used to evaluate hospitals' level of care coordination and for public reporting purposes.[4, 5, 6] It has been endorsed by the National Quality Forum and incorporated into the Hospital Consumer Assessment of Healthcare Providers and Systems (HCAHPS) survey provided to samples of recently hospitalized US patients.[7] However, recent evidence from an inpatient cohort of cardiovascular patients suggests the CTM‐3 overinflates care transition scores compared to the longer 15‐item CTM. In that cohort, the CTM‐3 could not differentiate between patients who did or did not have repeat ED visits or readmission.[8] Thus far, the B‐PREPARED and CTM‐3 measures have not been compared to one another directly.
In addition to the development of patient‐reported measures, hospitals increasingly employ administrative algorithms to predict likelihood of readmission.[9] A commonly used measure is the LACE index (Length of stay, Acuity, Comorbidity, and Emergency department use).[10] The LACE index predicted readmission and death within 30 days of discharge in a large cohort in Canada. In 2 retrospective studies of recently hospitalized patients in the United States, the LACE index's ability to discriminate between patients readmitted or not ranged from slightly better than chance to moderate (C statistic 0.56‐0.77).[11, 12]
It is unknown whether adding patient‐reported preparedness measures to commonly used readmission prediction scores increases the ability to predict readmission risk. We sought to determine whether the B‐PREPARED and CTM‐3 measures were predictive of readmission or death, as compared to the LACE index, in a large cohort of cardiovascular patients. In addition, we sought to determine the additional predictive and discriminative ability gained from administering the B‐PREPARED and CTM‐3 measures, while adjusting for the LACE index and other clinical factors. We hypothesized that: (1) higher preparedness scores on both measures would predict lower risk of readmission or death in a cohort of patients hospitalized with cardiac diagnoses; and (2) because it provides more specific and actionable information, the B‐PREPARED would discriminate readmission more accurately than CTM‐3, after controlling for clinical factors.
METHODS
Study Setting and Design
The Vanderbilt Inpatient Cohort Study (VICS) is a prospective study of patients admitted with cardiovascular disease to Vanderbilt University Hospital. The purpose of VICS is to investigate the impact of patient and social factors on postdischarge health outcomes such as quality of life, unplanned hospital utilization, and mortality. The rationale and design of VICS are detailed elsewhere.[13] Briefly, participants completed a baseline interview while hospitalized, and follow‐up phone calls were conducted within 2 to 9 days and at approximately 30 and 90 days postdischarge. During the first follow‐up call conducted by research assistants, we collected preparedness for discharge data utilizing the 2 measures described below. After the 90‐day phone call, we collected healthcare utilization since the index admission. The study was approved by the Vanderbilt University Institutional Review Board.
Patients
Eligibility screening shortly after admission identified patients with acute decompensated heart failure (ADHF) and/or an intermediate or high likelihood of acute coronary syndrome (ACS) per a physician's review of the clinical record. Exclusion criteria included: age 18 years, non‐English speaker, unstable psychiatric illness, delirium, low likelihood of follow‐up (eg, no reliable telephone number), on hospice, or otherwise too ill to complete an interview. To be included in these analyses, patients must have completed the preparedness for discharge measurements during the first follow‐up call. Patients who died before discharge or before completing the follow‐up call were excluded.
Preparedness for Discharge Measures (Patient‐Reported Data)
Preparedness for discharge was assessed using the 11‐item B‐PREPARED and the 3‐item CTM‐3.
The B‐PREPARED measures how prepared patients felt leaving the hospital with regard to: self‐care information for medications and activity, equipment/community services needed, and confidence in managing one's health after hospitalization. The B‐PREPARED measure has good internal consistency reliability (Cronbach's = 0.76) and has been validated in patients of varying age within a week of discharge. Preparedness is the sum of responses to all 11 questions, with a range of 0 to 22. Higher scores reflect increased preparedness for discharge.[3]
The CTM‐3 asks patients to rate how well their preferences were considered regarding transitional needs, as well as their understanding of postdischarge self‐management and the purpose of their medications, each on a 4‐point response scale (strongly disagree to strongly agree). The sum of the 3 responses quantifies the patient's perception of the quality of the care transition at discharge (Cronbach's = 0.86,[14] 0.92 in a cohort similar to ours[8]). Scores range from 3 to 12, with higher score indicating more preparedness. Then, the sum is transformed to a 0 to 100 scale.[15]
Clinical Readmission Risk Measures (Medical Record Data)
The LACE index, published by Van Walraven et al.,[10] takes into account 4 categories of clinical data: length of hospital stay, acuity of event, comorbidities, and ED visits in the prior 6 months. More specifically, a diagnostic code‐based, modified version of the Charlson Comorbidity Index was used to calculate the comorbidity score. These clinical criteria were obtained from an administrative database and weighted according to the methods used by Van Walraven et al. An overall score was calculated on a scale of 0 to 19, with higher scores indicating higher risk of readmission or death within 30 days.
From medical records, we also collected patients' demographic data including age, race, and gender, and diagnosis of ACS, ADHF, or both at hospital admission.
Outcome Measures
Healthcare utilization data were obtained from the index hospital as well as outside facilities. The electronic medical records from Vanderbilt University Hospital provided information about healthcare utilization at Vanderbilt 90 days after initial discharge. We also used Vanderbilt records to see if patients were transferred to Vanderbilt from other hospitals or if patients visited other hospitals before or after enrollment. We supplemented this with patient self‐report during the follow‐up telephone calls (at 30 and 90 days after initial discharge) so that any additional ED and hospital visits could be captured. Mortality data were collected from medical records, Social Security data, and family reports. The main outcome was time to first unplanned hospital readmission or death within 30 and 90 days of discharge.
Analysis
To describe our sample, we summarized categorical variables with percentages and continuous variables with percentiles. To test for evidence of unadjusted covariate‐outcome relationships, we used Pearson 2 and Wilcoxon rank sum tests for categorical and continuous covariates, respectively.
For the primary analyses we used Cox proportional hazard models to examine the independent associations between the prespecified predictors for patient‐reported preparedness and time to first unplanned readmission or death within 30 and 90 days of discharge. For each outcome (30‐ and 90‐day readmission or death), we fit marginal models separately for each of the B‐PREPARED, CTM‐3, and LACE scores. We then fit multivariable models that used both preparedness measures as well as age, gender, race, and diagnosis (ADHF and/or ACS), variables available to clinicians when patients are admitted. When fitting the multivariable models, we did not find strong evidence of nonlinear effects; therefore, only linear effects are reported. To facilitate comparison of effects, we scaled continuous variables by their interquartile range (IQR). The associated, exponentiated regression parameter estimates may therefore be interpreted as hazard ratios for readmission or death per IQR change in each predictor. In addition to parameter estimation, we computed the C index to evaluate capacity for the model to discriminate those who were and were not readmitted or died. All analyses were conducted in R version 3.1.2 (R Foundation for Statistical Computing, Vienna, Austria).
RESULTS
From the cohort of 1239 patients (Figure 1), 64%, 28%, and 7% of patients were hospitalized with ACS, ADHF, or both, respectively (Table 1). Nearly 45% of patients were female, 83% were white, and the median age was 61 years (IQR 5269). The median length of stay was 3 days (IQR 25). The median preparedness scores were high for both B‐PREPARED (21, IQR 1822) and CTM‐3 (77.8, IQR 66.7100). A total of 211 (17%) and 380 (31%) were readmitted or died within 30 and 90 days, respectively. The completion rate for the postdischarge phone calls was 88%.
| Death or Readmission Within 30 Days | Death or Readmission Within 90 Days | |||||
|---|---|---|---|---|---|---|
| Not Readmitted, N = 1028 | Death/Readmitted, N = 211 | P Value | Not Readmitted, N = 859 | Death/Readmitted, N = 380 | P Value | |
| ||||||
| Gender, male | 55.8% (574) | 53.1% (112) | 0.463* | 56.3% (484) | 53.2% (202) | 0.298* |
| Female | 44.2% (454) | 46.9% (99) | 43.7% (375) | 46.8% (178) | ||
| Race, white | 83.9% (860) | 80.6% (170) | 0.237* | 86.0% (737) | 77.3% (293) | 0.001* |
| Race, nonwhite | 16.1% (165) | 19.4% (41) | 14.0% (120) | 22.7% (86) | ||
| Diagnosis ACS | 68.0% (699) | 46.4% (98) | 0.001* | 72.9% (626) | 45.0% (171) | 0.001* |
| ADHF | 24.8% (255) | 46.0% (97) | 20.3% (174) | 46.8% (178) | ||
| Both | 7.2% (74) | 7.6% (16) | 6.9% (59) | 8.2% (31) | ||
| Age | 39.4:52:61:68:80 | 37.5:53.5:62:70:82 | 0.301 | 40:52:61:68:80 | 38:52:61 :70:82 | 0.651 |
| LOS | 1:2:3:5:10 | 1:3: 4:7.5:17 | 0.001 | 1:2:3:5:9 | 1:3:4:7:15 | 0.001 |
| CTM‐3 | 55.6:66.7: 77.8:100:100 | 55.6:66.7:77.8:100 :100 | 0.305 | 55.6:66.7:88.9:100:100 | 55.6:66.7:77.8:100 :100 | 0.080 |
| B‐PREPARED | 12:18:21:22.:22 | 10:17:20:22:22 | 0.066 | 12:18:21:22:22 | 10:17:20 :22:22 | 0.030 |
| LACE | 1:4: 7:10 :14 | 3.5:7:10:13:17 | 0.001 | 1:4:6: 9:14 | 3:7:10:13:16 | 0.001 |
B‐PREPARED and CTM‐3 were moderately correlated with one another (Spearman's = 0.40, P 0.001). In bivariate analyses (Table 1), the association between B‐PREPARED and readmission or death was significant at 90 days (P = 0.030) but not 30 days. The CTM‐3 showed no significant association with readmission or death at either time point. The LACE score was significantly associated with rates of readmission at 30 and 90 days (P 0.001).
Outcomes Within 30 Days of Discharge
When examining readmission or death within 30 days of discharge, simple unadjusted models 2 and 3 showed that the B‐PREPARED and LACE scores, respectively, were each significantly associated with time to first readmission or death (Table 2). Specifically, a 4‐point increase in the B‐PREPARED score was associated with a 16% decrease in the hazard of readmission or death (hazard ratio [HR] = 0.84, 95% confidence interval [CI]: 0.72 to 0.97). A 5‐point increase in the LACE score was associated with a 100% increase in the hazard of readmission or death (HR = 2.00, 95% CI: 1.72 to 2.32). In the multivariable model with both preparedness scores and diagnosis (model 4), the B‐PREPARED score (HR = 0.82, 95% CI: 0.70 to 0.97) was significantly associated with time to first readmission or death. In the full 30‐day model including B‐PREPARED, CTM‐3, LACE, age, gender, race, and diagnosis (model 5), only the LACE score (HR = 1.83, 95% CI: 1.54 to 2.18) was independently associated with time to readmission or death. Finally, the CTM‐3 did not predict 30‐day readmission or death in any of the models tested.
| Models | HR (95% CI)* | P Value | C Index |
|---|---|---|---|
| |||
| 1. CTM (per 10‐point change) | 0.95 (0.88 to 1.03) | 0.257 | 0.523 |
| 2. B‐PREPARED (per 4‐point change) | 0.84 (0.72 to 0.97) | 0.017 | 0.537 |
| 3. LACE (per 5‐point change) | 2.00 (1.72 to 2.32) | 0.001 | 0.679 |
| 4. CTM (per 10‐point change) | 1.00 (0.92 to 1.10) | 0.935 | 0.620 |
| B‐PREPARED (per 4‐point change) | 0.82 (0.70 to 0.97) | 0.019 | |
| ADHF only (vs ACS only) | 2.46 (1.86 to 3.26) | 0.001 | |
| ADHF and ACS (vs ACS only) | 1.42 (0.84 to 2.42) | 0.191 | |
| 5. CTM (per 10‐point change) | 1.02 (0.93 to 1.11) | 0.722 | 0.692 |
| B‐PREPARED (per 4 point change) | 0.87 (0.74 to 1.03) | 0.106 | |
| LACE (per 5‐point change) | 1.83 (1.54 to 2.18) | 0.001 | |
| ADHF only (vs ACS only) | 1.51 (1.10 to 2.08) | 0.010 | |
| ADHF and ACS (vs ACS only) | 0.90 (0.52 to 1.55) | 0.690 | |
| Age (per 10‐year change) | 1.02 (0.92 to 1.14) | 0.669 | |
| Female (vs male) | 1.11 (0.85 to 1.46) | 0.438 | |
| Nonwhite (vs white) | 0.92 (0.64 to 1.30) | 0.624 | |
Outcomes Within 90 Days of Discharge
At 90 days after discharge, again the separate unadjusted models 2 and 3 demonstrated that the B‐PREPARED and LACE scores, respectively, were each significantly associated with time to first readmission or death, whereas the CTM‐3 model only showed marginal significance (Table 3). In the multivariable model with both preparedness scores and diagnosis (model 4), results were similar to 30 days as the B‐PREPARED score was significantly associated with time to first readmission or death. Lastly, in the full model (model 5) at 90 days, again the LACE score was significantly associated with time to first readmission or death. In addition, B‐PREPARED scores were associated with a significant decrease in risk of readmission or death (HR = 0.88, 95% CI: 0.78 to 1.00); CTM‐3 scores were not independently associated with outcomes.
| Model | HR (95% CI)* | P Value | C Index |
|---|---|---|---|
| |||
| 1. CTM (per 10‐point change) | 0.94 (0.89 to 1.00) | 0.051 | 0.526 |
| 2. B‐PREPARED (per 4‐point change) | 0.84 (0.75 to 0.94) | 0.002 | 0.533 |
| 3. LACE (per 5‐point change) | 2.03 (1.82 to 2.27) | 0.001 | 0.683 |
| 4. CTM (per 10‐point change) | 0.99 (0.93 to 1.06) | 0.759 | 0.640 |
| B‐PREPARED (per 4‐point change) | 0.83 (0.74 to 0.94) | 0.003 | |
| ADHF only (vs ACS only) | 2.88 (2.33 to 3.56) | 0.001 | |
| ADHF and ACS (vs ACS only) | 1.62 (1.11 to 2.38) | 0.013 | |
| 5. CTM (per 10‐point change) | 1.00 (0.94 to 1.07) | 0.932 | 0.698 |
| B‐PREPARED (per 4‐point change) | 0.88 (0.78 to 1.00) | 0.043 | |
| LACE (per 5‐point change) | 1.76 (1.55 to 2.00) | 0.001 | |
| ADHF only (vs ACS only) | 1.76 (1.39 to 2.24) | 0.001 | |
| ADHF and ACS (vs ACS only) | 1.00 (0.67 to 1.50) | 0.980 | |
| Age (per 10‐year change) | 1.00 (0.93 to 1.09) | 0.894 | |
| Female (vs male) | 1.10 (0.90 to 1.35) | 0.341 | |
| Nonwhite (vs white) | 1.14 (0.89 to 1.47) | 0.288 | |
Tables 2 and 3 also display the C indices, or the discriminative ability of the models to differentiate whether or not a patient was readmitted or died. The range of the C index is 0.5 to 1, where values closer to 0.5 indicate random predictions and values closer to 1 indicate perfect prediction. At 30 days, the individual C indices for B‐PREPARED and CTM‐3 were only slightly better than chance (0.54 and 0.52, respectively) in their discriminative abilities. However, the C indices for the LACE score alone (0.68) and the multivariable model (0.69) including all 3 measures (ie, B‐PREPARED, CTM‐3, LACE), and clinical and demographic variables, had higher utility in discriminating patients who were readmitted/died or not. The 90‐day C indices were comparable in magnitude to those at 30 days.
DISCUSSION/CONCLUSION
In this cohort of patients hospitalized with cardiovascular disease, we compared 2 patient‐reported measures of preparedness for discharge, their association with time to death or readmission at 30 and 90 days, and their ability to discriminate patients who were or were not readmitted or died. Higher preparedness as measured by higher B‐PREPARED scores was associated with lower risk of readmission or death at 30 and 90 days after discharge in unadjusted models, and at 90 days in adjusted models. CTM‐3 was not associated with the outcome in any analyses. Lastly, the individual preparedness measures were not as strongly associated with readmission or death compared to the LACE readmission index alone.
How do our findings relate to the measurement of care transition quality? We consider 2 scenarios. First, if hospitals utilize the LACE index to predict readmission, then neither self‐reported measure of preparedness adds meaningfully to its predictive ability. However, hospital management may still find the B‐PREPARED and CTM‐3 useful as a means to direct care transition quality‐improvement efforts. These measures can instruct hospitals as to what areas their patients express the greatest difficulty or lack of preparedness and closely attend to patient needs with appropriate resources. Furthermore, the patient's perception of being prepared for discharge may be different than their actual preparedness. Their perceived preparedness may be affected by cognitive impairment, dissatisfaction with medical care, depression, lower health‐related quality of life, and lower educational attainment as demonstrated by Lau et al.[16] If a patient's perception of preparedness were low, it would behoove the clinician to investigate these other issues and address those that are mutable. Additionally, perceived preparedness may not correlate with the patient's understanding of their medical conditions, so it is imperative that clinicians provide prospective guidance about their probable postdischarge trajectory. If hospitals are not utilizing the LACE index, then perhaps using the B‐PREPARED, but not the CTM‐3, may be beneficial for predicting readmission.
How do our results fit with evidence from prior studies, and what do they mean in the context of care transitions quality? First, in the psychometric evaluation of the B‐PREPARED measure in a cohort of recently hospitalized patients, the mean score was 17.3, lower than the median of 21 in our cohort.[3] Numerous studies have utilized the CTM‐3 and the longer‐version CTM‐15. Though we cannot make a direct comparison, the median in our cohort (77.8) was on par with the means from other studies, which ranged from 63 to 82.[5, 17, 18, 19] Several studies also note ceiling effects with clusters of scores at the upper end of the scale, as did we. We conjecture that our cohort's preparedness scores may be higher because our institution has made concerted efforts to improve the discharge education for cardiovascular patients.
In a comparable patient population, the TRACE‐CORE (Transitions, Risks, and Actions in Coronary Events Center for Outcomes Research and Education) study is a cohort of more than 2200 patients with ACS who were administered the CTM‐15 within 1 month of discharge.[8] In that study, the median CTM‐15 score was 66.6, which is lower than our cohort. With regard to the predictive ability of the CTM‐3, they note that CTM‐3 scores did not differentiate between patients who were or were not readmitted or had emergency department visits. Our results support their concern that the CTM‐15 and by extension the CTM‐3, though adopted widely as part of HCAHPS, may not have sufficient ability to discriminate differences in patient outcomes or the quality of care transitions.
More recently, patient‐reported preparedness for discharge was assessed in a prospective cohort in Canada.[16] Lau et al. administered a single‐item measure of readiness at the time of discharge to general medicine patients, and found that lower readiness scores were also not associated with readmission or death at 30 days, when adjusted for the LACE index as we did.
We must acknowledge the limitations of our findings. First, our sample of recently discharged patients with cardiovascular disease is different than the community‐dwelling, underserved Americans hospitalized in the prior year, which served as the sample for reducing the CTM‐15 to 3 items.[5] This fact may explain why we did not find the CTM‐3 to be associated with readmission in our sample. Second, our analyses did not include extensive adjustment for patient‐related factors. Rather, our intention was to see how well the preparedness measures performed independently and compare their abilities to predict readmission, which is particularly relevant for clinicians who may not have all possible covariates in predicting readmission. Finally, because we limited the analyses to the patients who completed the B‐PREPARED and CTM‐3 measures (88% completion rate), we may not have data for: (1) very ill patients, who had a higher risk of readmission and least prepared, and were not able to answer the postdischarge phone call; and (2) very functional patients, who had a lower risk of readmission and were too busy to answer the postdischarge phone call. This may have limited the extremes in the spectrum of our sample.
Importantly, our study has several strengths. We report on the largest sample to date with results of both B‐PREPARED and CTM‐3. Moreover, we examined how these measures compared to a widely used readmission prediction tool, the LACE index. We had very high postdischarge phone call completion rates in the week following discharge. Furthermore, we had thorough assessment of readmission data through patient report, electronic medical record documentation, and collection of outside medical records.
Further research is needed to elucidate: (1) the ideal administration time of the patient‐reported measures of preparedness (before or after discharge), and (2) the challenges to the implementation of measures in healthcare systems. Remaining research questions center on the tradeoffs and barriers to implementing a longer measure like the 11‐item B‐PREPARED compared to a shorter measure like the CTM‐3. We do not know whether longer measures preclude their use by busy clinicians, though it provides more specific information about what patients feel they need at hospital discharge. Additionally, studies need to demonstrate the mutability of preparedness and the response of measures to interventions designed to improve the hospital discharge process.
In our sample of recently hospitalized cardiovascular patients, there was a statistically significant association between patient‐reported preparedness for discharged, as measured by B‐PREPARED, and readmissions/death at 30 and 90 days, but the magnitude of the association was very small. Furthermore, another patient‐reported preparedness measure, CTM‐3, was not associated with readmissions or death at either 30 or 90 days. Lastly, neither measure discriminated well between patients who were readmitted or not, and neither measure added meaningfully to the LACE index in terms of predicting 30‐ or 90‐day readmissions.
Disclosures
This study was supported by grant R01 HL109388 from the National Heart, Lung, and Blood Institute (Dr. Kripalani) and in part by grant UL1 RR024975‐01 from the National Center for Research Resources, and grant 2 UL1 TR000445‐06 from the National Center for Advancing Translational Sciences. Dr. Kripalani is a consultant to SAI Interactive and holds equity in Bioscape Digital, and is a consultant to and holds equity in PictureRx, LLC. Dr. Bell is supported by the National Institutes of Health (K23AG048347) and by the Eisenstein Women's Heart Fund. Dr. Vasilevskis is supported by the National Institutes of Health (K23AG040157) and the Geriatric Research, Education and Clinical Center. Dr. Mixon is a Veterans Affairs Health Services Research and Development Service Career Development awardee (12‐168) at the Nashville Department of Veterans Affairs. The content is solely the responsibility of the authors and does not necessarily represent the official views of the National Institutes of Health. The funding agency was not involved in the design and conduct of the study; collection, management, analysis, and interpretation of the data; and preparation, review, or approval of the manuscript. All authors had full access to all study data and had a significant role in writing the manuscript. The contents do not represent the views of the US Department of Veterans Affairs or the United States government. Dr. Kripalani is a consultant to and holds equity in PictureRx, LLC.
- Centers for Medicare 9(9):598–603.
- , , . Brief scale measuring patient preparedness for hospital discharge to home: psychometric properties. J Hosp Med. 2008;3(6):446–454.
- , , . Assessing the quality of preparation for posthospital care from the patient's perspective: the care transitions measure. Med Care. 2005;43(3):246–255.
- , , , . Assessing the quality of transitional care: further applications of the care transitions measure. Med Care. 2008;46(3):317–322.
- , , , , . The central role of performance measurement in improving the quality of transitional care. Home Health Care Serv Q. 2007;26(4):93–104.
- Centers for Medicare 3:e001053.
- , , , et al. Risk prediction models for hospital readmission: a systematic review. JAMA. 2011;306(15):1688–1698.
- , , , et al. Derivation and validation of an index to predict early death or unplanned readmission after discharge from hospital to the community. CMAJ. 2010;182(6):551–557.
- , , , et al. Using the LACE index to predict hospital readmissions in congestive heart failure patients. BMC Cardiovasc Disord. 2014;14:97.
- , , , . Validation of a predictive model to identify patients at high risk for hospital readmission. J Healthc Qual. 2016;38(1):34–41.
- , , , et al. Determinants of health after hospital discharge: rationale and design of the Vanderbilt Inpatient Cohort Study (VICS). BMC Health Serv Res. 2014;14:10.
- . CTM frequently asked questions. Available at: http://caretransitions.org/tools-and-resources/. Accessed January 22, 2016.
- . Instructions for scoring the CTM‐3. Available at: http://caretransitions.org/tools-and-resources/. Accessed January 22, 2016.
- , , , et al. Patient‐reported discharge readiness and 30‐day risk of readmission or death: a prospective cohort study. Am J Med. 2016;129:89–95.
- , , , , . Implementaiton of the Care Transitions Intervention: sustainability and lessons learned. Prof Case Manag. 2009;14(6):282–293.
- , , , . The care transitions innovation (C‐TraIn) for socioeconomically disadvantaged adults: results of a cluster randomized controlled trial. J Gen Intern Med. 2014;29(11):1460–1467.
- , , , et al. Telephone calls to patients after discharge from the hospital: an important part of transitions of care. Med Educ Online. 2015;29(20):26701.
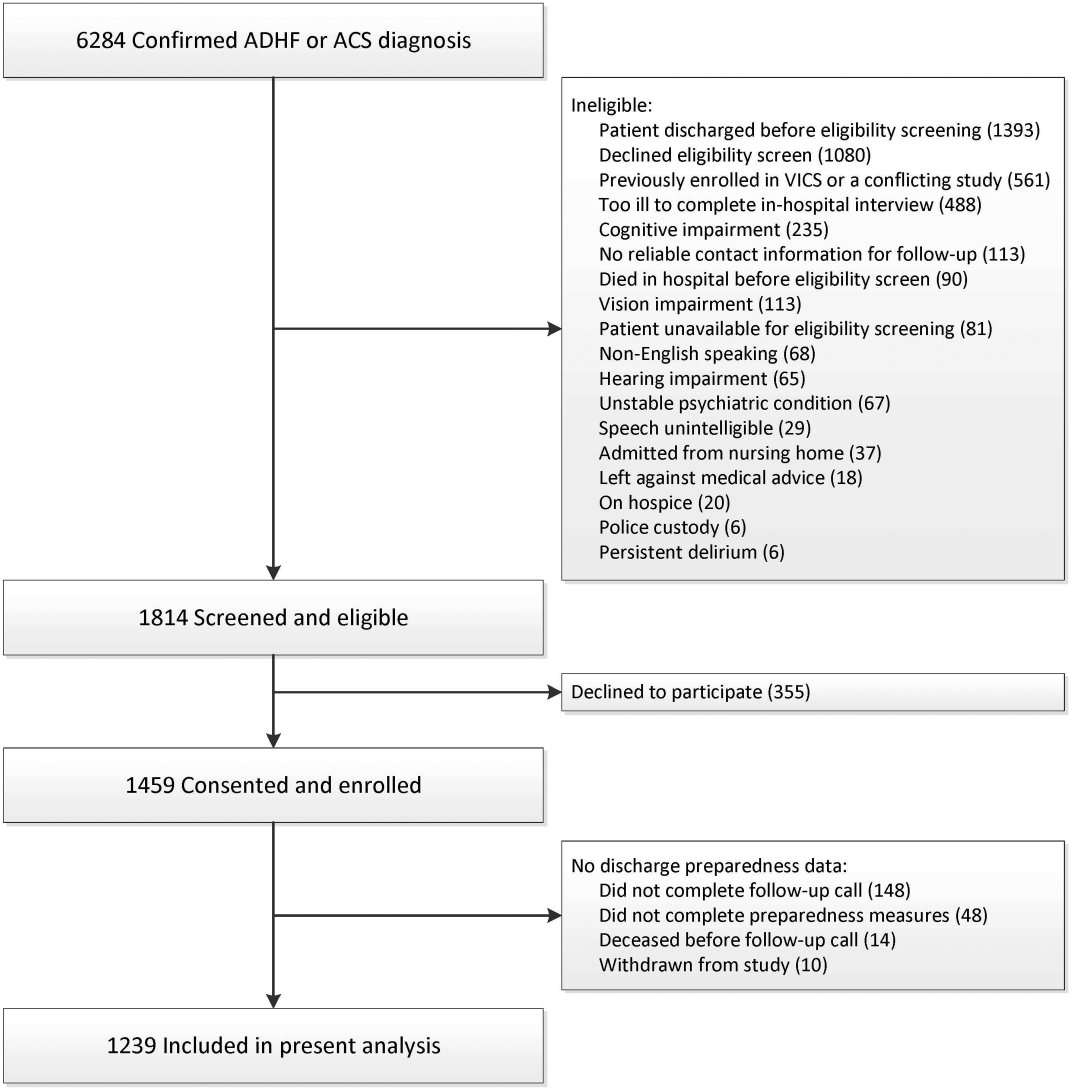
Medical scribes: How do their notes stack up?
ABSTRACT
Objective Medical scribes are increasingly employed to improve physician efficiency with regard to the electronic medical record (EMR). The impact of scribes on the quality of outpatient visit notes is not known. To assess the effect, we conducted a retrospective review of ambulatory progress notes written before and after 8 practice sites transitioned to the use of medical assistants as scribes.
Methods The Physician Documentation Quality Instrument 9 (PDQI-9) was used to compare the quality of outpatient progress notes written by medical assistant scribes with the quality of notes written by 18 primary care physicians working without a scribe. The notes pertained to diabetes encounters and same-day appointments and were written during the 3 to 6 months preceding the use of scribes (pre-scribe period) and the 3 to 6 months after scribes were employed (scribe period).
Results One hundred eight notes from the pre-scribe period and 109 from the scribe period were reviewed. Scribed notes were rated higher in overall quality than unscribed notes (mean total PDQI-9 score 30.3 for scribed notes vs 28.9 for nonscribed notes; P=.01) and more up-to-date, thorough, useful, and comprehensible. The differences were limited to diabetes encounters. For same-day appointments, scribed and nonscribed notes did not differ in quality. The total word count of all scribed and nonscribed notes was similar (mean words 618, standard deviation (SD) 273 for scribed notes vs 558 words, SD 289 for nonscribed notes; P=.12).
Conclusions In this retrospective review, ambulatory notes were of higher quality when medical assistants acted as scribes than when physicians wrote them alone, at least for diabetes visits. Our findings may not apply to professional scribes who are not part of the clinical care team. As the use of medical scribes expands, additional studies should examine the impact of scribes on other aspects of care quality.
Team-based models of primary care delivery may incorporate medical scribes to improve efficiency of electronic documentation.1-4 The employment of medical scribes has grown rapidly, and it is estimated that within several years there may be one scribe for every 9 physicians.3
Accurate documentation is important to providing high-quality patient care but can take a significant amount of time. Attending physicians have been estimated to spend as long as 52 minutes per day authoring notes.5 Medical scribes can help physicians improve the efficiency of electronic documentation6 and save time.2 Using scribes can also improve physician productivity7-10 and thereby potentially increase access to care. The impact of scribes on the quality of outpatient visit notes, however, is unknown.
A team-based care delivery model in our health system’s primary care clinics uses medical assistants to scribe notes during the outpatient encounter. We hypothesized that outpatient notes written by medical assistant scribes would be of similar quality to notes written by the same group of physicians without a scribe.
METHODS
Study design and sample
We conducted a retrospective review of ambulatory notes from 18 primary care physicians at 8 practice sites in our health system who had adopted a care model in which medical assistants act as scribes. Each physician works with 2 medical assistants. To train for the new model, the physician and medical assistants participated in 2 training sessions of 2 hours each and a half day of clinic observation and evaluation with a project manager.
Of the 18 primary care physicians included in this study, none had less than one year of experience in our health system. Tenure ranged from one to 24 years with a mean of 11.3 years.
For each participating provider, we requested all available outpatient progress notes with either an International Classification of Diseases, 9th revision (ICD-9) code for diabetes or a designation of “same day” for the 3 to 6 months preceding the use of scribes (pre-scribe period) and the 3 to 6 months after employing scribes (scribe period). We chose diabetes encounters as examples of notes addressing chronic disease management and same-day encounters as examples of problem-focused notes because these 2 types of encounters are common in outpatient primary care practice.
Note quality was evaluated using the Physician Documentation Quality Instrument 9 (PDQI-9), a validated instrument designed for this purpose, comprising 9 items rated subjectively on a 5-point Likert scale (1= not at all, 5= extremely). The items assess whether notes are up-to-date, accurate, thorough, useful, organized, comprehensible, succinct, synthesized, and internally consistent.11,12 The PDQI-9 has been applied previously in inpatient12 and outpatient settings.13
While the PDQI-9 is a validated tool, it relies on subjective ratings of note quality by the reviewer. To control for the subjective nature of the ratings, an experienced internist and an internal medicine resident coded 10 progress notes separately using the PDQI-9 and discussed the results. The process was repeated for a total of 20 notes, after which consensus was reached with >70% agreement on each attribute of the PDQI-9, suggesting that the resident’s ratings were reliable when compared with those of an experienced practicing physician.
The resident then evaluated a random sample of notes written by each physician for diabetes or same-day appointments in the pre-scribe and scribe periods. Word counts for the entire note were measured. The notes used to establish the reliability of the ratings were excluded from the analysis for this study.
Data analysis
We used linear mixed-effects models to examine note quality measures by adjusting for possible correlations of notes from the same physician. Least-squares estimates were derived; the results were not adjusted for multiple comparisons.
RESULTS
One hundred eight notes from the pre-scribe period and 109 notes from the scribe period were reviewed. Compared with notes written by a physician alone, scribed notes were rated slightly higher in overall quality (mean total PDQI-9 score 30.3 for scribe notes vs 28.9 for pre-scribe notes; P=.01) and more up-to-date, thorough, useful, and comprehensible (TABLES 1 AND 2). The differences were limited to diabetes encounters. For same day appointments, scribed notes did not differ in quality from nonscribed notes (TABLE 2). Total word count did not vary significantly between all scribe and pre-scribe notes (mean words 618, SD 273 for scribed notes vs 558 words, SD 289 for nonscribed notes; P=.12).
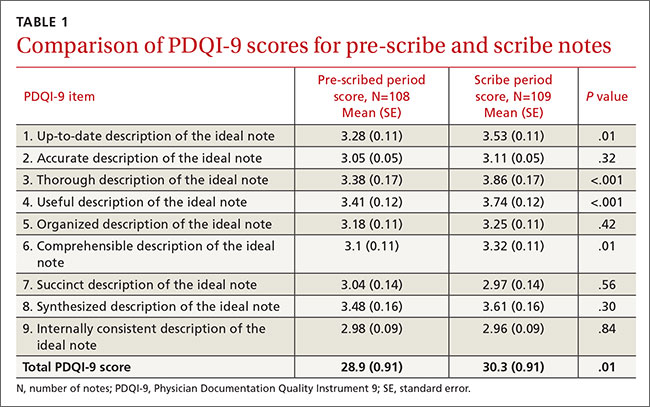
DISCUSSION
In this retrospective review of ambulatory notes, progress notes written by medical assistant scribes were of higher quality than notes physicians wrote alone, at least for diabetes visits. Scribe and pre-scribe notes were of similar quality for problem-focused same-day visits. This is the first study of which we are aware that compares the quality of scribed notes with notes written by physicians.
Quality scribe notes can save physician time. The progress note is an important vehicle for describing care provided and transferring information among physicians caring for the same patient. Writing a note, however, adds a considerable amount of time to the physician’s workflow. Using a scribe can decrease the time burden of note writing, and if scribed notes are of similar or better quality, this practice innovation can allow the physician to focus more on clinical than clerical tasks.
Over-documentation is a possible concern. While implementation of the EMR may improve certain aspects of quality of care delivered14,15 and note quality,16 concern has been raised about over-documentation related to the connection between documentation and reimbursement.17 In our study, we found that physician notes and scribed notes for both diabetes and same-day encounters often used EMR-based note templates, which can lead to over-documentation.
In general, both physician and scribed notes were rated to be of average to low quality because none of the mean scores on the 9 individual components of the PDQI-9 reached 4.0. Scribed notes were not inaccurate and had word counts similar to physician notes.
Scribing has potential drawbacks—and benefits. Drawbacks to scribing have not been well-studied. It has been suggested that using scribes to work around the EMR may actually hinder its further advancement because scribing insulates physicians from the inefficiencies of current EMRs and will not spur demands for improvements.3 Inaccurate or poor-quality notes could represent another downside to scribing, although concern about the quality of notes has not been documented. Our results suggest the opposite may be true.
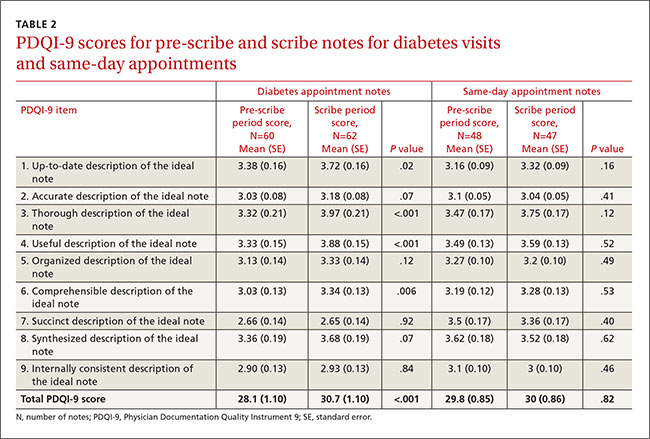
Note quality has not been associated with quality of care as assessed by clinical quality scores,13 but using scribes may improve the quality of care in other ways. For example, the EMR may negatively affect patient-physician communication,18,19 and freeing the physician from documentation may improve the interaction.8,20 Incorporating scribing into practice may also improve the physician experience,9,10,21,22 a possible benefit that we did not measure.
We also did not measure the cost of using a scribe to assist in EMR documentation compared with the cost of physician time spent in performing this task. If the scribe model were associated with cost savings through increased physician productivity, as well as improved physician experience, future EMR development might best focus on planned utilization by physician-scribe teams.
Study limitations. The study was conducted in a single health system, although at 8 different practice sites. The sites all used the same EMR, but templates used for documentation could be individualized by the physician and medical assistant team, so our findings may reflect variation in template design. Our analysis did adjust for possible correlations of notes from the same physician. The selection of note types in our study may make our results less generalizable to other encounter types. Our sample was not large enough to detect variations in note quality among different providers and scribes.
The ratings on the PDQI-9 may be subjective, and the reviewers were not blinded to whether a scribe was used to write the note. The differences in PDQI-9 scores were small. Although statistically significant, they may not significantly affect clinical practice. Our care model is unique in that scribes are active members of the clinical care team; the higher quality of scribed notes we found may not apply to professional scribes who are not part of the team.
Future research directions. In our study, medical assistants acting as scribes composed progress notes of similar or higher quality than physicians who wrote notes alone, although all notes were of generally average quality. As the use of scribes in medicine expands, additional studies should examine the impact of scribes on primary care workflow, quality and cost of care delivered, and quality of physician experience.
CORRESPONDENCE
Anita D. Misra-Hebert, MD, MPH, Center for Value-Based Care Research, Medicine Institute, 9500 Euclid Avenue, G10, Cleveland, OH 44195; [email protected].
1. Bodenheimer T, Willard-Grace R, Ghorob A. Expanding the roles of medical assistants: Who does what in primary care? JAMA Intern Med. 2014;174:1025-1026.
2. Reuben DB, Knudsen J, Senelick W, et al. The effect of a physician partner program on physician efficiency and patient satisfaction. JAMA Intern Med. 2014;174:1190-1193.
3. Gellert GA, Ramirea R, Webster S. The rise of the medical scribe industry: Implications for the advancement of electronic health records. JAMA. 2015;313:1315-1316.
4. Shultz CG, Holmstrom HL. The use of medical scribes in health care settings: a systematic review and future directions. J Am Board Fam Med. 2015;28:371-381.
5. Hripcsak G, Vawdrey DK, Fred MR, et al. Use of electronic clinical documentation: time spent and team interactions. J Am Med Inform Assoc. 2011;18:112-117.
6. Silverman L. Scribes Are Back, Helping Doctors Tackle Electronic Medical Records. NPR.org. Available at: www.npr.org/blogs/health/2014/04/21/303406306/scribes-are-back-helping-doctors-tackle-electronic-medical-records. Accessed April 23, 2014.
7. Arya R, Salovich DM, Ohman-Strickland P, et al. Impact of scribes on performance indicators in the emergency department. Acad Emerg Med. 2010;17:490-494.
8. Bank AJ, Obetz C, Konrardy A, et al. Impact of scribes on patient interaction, productivity, and revenue in a cardiology clinic: a prospective study. Clinicoecon Outcomes Res. 2013;5:399-406.
9. Bastani A, Shaqiri B, Palomba K, et al. An ED scribe program is able to improve throughput time and patient satisfaction. Am J Emerg Med. 2014;32:399-402.
10. Allen B, Banapoor B, Weeks EC, et al. An assessment of emergency department throughput and provider satisfaction after the implementation of a scribe program. Advances in Emergency Medicine. 2014;2014:e517319.
11. Stetson PD, Morrison FP, Bakken S, et al. Preliminary development of the Physician Documentation Quality Instrument. J Am Med Inform Assoc. 2008;15:534-541.
12. Stetson PD, Bakken S, Wrenn JO, et al. Assessing electronic note quality using the Physician Documentation Quality Instrument (PDQI-9). Appl Clin Inform. 2012;3:164-174.
13. Edwards ST, Neri PM, Volk LA, et al. Association of note quality and quality of care: a cross-sectional study. BMJ Qual Saf. 2013;23:406-413.
14. Schiff GD, Bates DW. Can electronic clinical documentation help prevent diagnostic errors? N Engl J Med. 2010;362:1066-1069.
15. Samal L, Wright A, Healey MJ, et al. Meaningful use and quality of care. JAMA Intern Med. 2014;174:997-998.
16. Burke HB, Sessums LL, Hoang A, et al. Electronic health records improve clinical note quality. J Am Med Inform Assoc. 2015;22:199-205.
17. Sheehy AM, Weissburg DJ, Dean SM. The role of copy-and-paste in the hospital electronic health record. JAMA Intern Med. 2014;174:1217-1218.
18. Shachak A, Hadas-Dayagi M, Ziv A, et al. Primary care physicians’ use of an electronic medical record system: a cognitive task analysis. J Gen Intern Med. 2009;24:341-348.
19. Shachak A, Reis S. The impact of electronic medical records on patient-doctor communication during consultation: a narrative literature review. J Eval Clin Pract. 2009;15:641-649.
20. Misra-Hebert AD, Rabovsky A, Yan C, et al. A team-based model of primary care delivery and physician-patient interaction. Am J Med. 2015;128:1025-1028.
21. Sinsky CA, Willard-Grace R, Schutzbank AM, et al. In search of joy in practice: a report of 23 high-functioning primary care practices. Ann Fam Med. 2013;11:272-278.
22. Koshy S, Feustel PJ, Hong M, et al. Scribes in an ambulatory urology practice: patient and physician satisfaction. J Urol. 2010;184:258-262.
ABSTRACT
Objective Medical scribes are increasingly employed to improve physician efficiency with regard to the electronic medical record (EMR). The impact of scribes on the quality of outpatient visit notes is not known. To assess the effect, we conducted a retrospective review of ambulatory progress notes written before and after 8 practice sites transitioned to the use of medical assistants as scribes.
Methods The Physician Documentation Quality Instrument 9 (PDQI-9) was used to compare the quality of outpatient progress notes written by medical assistant scribes with the quality of notes written by 18 primary care physicians working without a scribe. The notes pertained to diabetes encounters and same-day appointments and were written during the 3 to 6 months preceding the use of scribes (pre-scribe period) and the 3 to 6 months after scribes were employed (scribe period).
Results One hundred eight notes from the pre-scribe period and 109 from the scribe period were reviewed. Scribed notes were rated higher in overall quality than unscribed notes (mean total PDQI-9 score 30.3 for scribed notes vs 28.9 for nonscribed notes; P=.01) and more up-to-date, thorough, useful, and comprehensible. The differences were limited to diabetes encounters. For same-day appointments, scribed and nonscribed notes did not differ in quality. The total word count of all scribed and nonscribed notes was similar (mean words 618, standard deviation (SD) 273 for scribed notes vs 558 words, SD 289 for nonscribed notes; P=.12).
Conclusions In this retrospective review, ambulatory notes were of higher quality when medical assistants acted as scribes than when physicians wrote them alone, at least for diabetes visits. Our findings may not apply to professional scribes who are not part of the clinical care team. As the use of medical scribes expands, additional studies should examine the impact of scribes on other aspects of care quality.
Team-based models of primary care delivery may incorporate medical scribes to improve efficiency of electronic documentation.1-4 The employment of medical scribes has grown rapidly, and it is estimated that within several years there may be one scribe for every 9 physicians.3
Accurate documentation is important to providing high-quality patient care but can take a significant amount of time. Attending physicians have been estimated to spend as long as 52 minutes per day authoring notes.5 Medical scribes can help physicians improve the efficiency of electronic documentation6 and save time.2 Using scribes can also improve physician productivity7-10 and thereby potentially increase access to care. The impact of scribes on the quality of outpatient visit notes, however, is unknown.
A team-based care delivery model in our health system’s primary care clinics uses medical assistants to scribe notes during the outpatient encounter. We hypothesized that outpatient notes written by medical assistant scribes would be of similar quality to notes written by the same group of physicians without a scribe.
METHODS
Study design and sample
We conducted a retrospective review of ambulatory notes from 18 primary care physicians at 8 practice sites in our health system who had adopted a care model in which medical assistants act as scribes. Each physician works with 2 medical assistants. To train for the new model, the physician and medical assistants participated in 2 training sessions of 2 hours each and a half day of clinic observation and evaluation with a project manager.
Of the 18 primary care physicians included in this study, none had less than one year of experience in our health system. Tenure ranged from one to 24 years with a mean of 11.3 years.
For each participating provider, we requested all available outpatient progress notes with either an International Classification of Diseases, 9th revision (ICD-9) code for diabetes or a designation of “same day” for the 3 to 6 months preceding the use of scribes (pre-scribe period) and the 3 to 6 months after employing scribes (scribe period). We chose diabetes encounters as examples of notes addressing chronic disease management and same-day encounters as examples of problem-focused notes because these 2 types of encounters are common in outpatient primary care practice.
Note quality was evaluated using the Physician Documentation Quality Instrument 9 (PDQI-9), a validated instrument designed for this purpose, comprising 9 items rated subjectively on a 5-point Likert scale (1= not at all, 5= extremely). The items assess whether notes are up-to-date, accurate, thorough, useful, organized, comprehensible, succinct, synthesized, and internally consistent.11,12 The PDQI-9 has been applied previously in inpatient12 and outpatient settings.13
While the PDQI-9 is a validated tool, it relies on subjective ratings of note quality by the reviewer. To control for the subjective nature of the ratings, an experienced internist and an internal medicine resident coded 10 progress notes separately using the PDQI-9 and discussed the results. The process was repeated for a total of 20 notes, after which consensus was reached with >70% agreement on each attribute of the PDQI-9, suggesting that the resident’s ratings were reliable when compared with those of an experienced practicing physician.
The resident then evaluated a random sample of notes written by each physician for diabetes or same-day appointments in the pre-scribe and scribe periods. Word counts for the entire note were measured. The notes used to establish the reliability of the ratings were excluded from the analysis for this study.
Data analysis
We used linear mixed-effects models to examine note quality measures by adjusting for possible correlations of notes from the same physician. Least-squares estimates were derived; the results were not adjusted for multiple comparisons.
RESULTS
One hundred eight notes from the pre-scribe period and 109 notes from the scribe period were reviewed. Compared with notes written by a physician alone, scribed notes were rated slightly higher in overall quality (mean total PDQI-9 score 30.3 for scribe notes vs 28.9 for pre-scribe notes; P=.01) and more up-to-date, thorough, useful, and comprehensible (TABLES 1 AND 2). The differences were limited to diabetes encounters. For same day appointments, scribed notes did not differ in quality from nonscribed notes (TABLE 2). Total word count did not vary significantly between all scribe and pre-scribe notes (mean words 618, SD 273 for scribed notes vs 558 words, SD 289 for nonscribed notes; P=.12).
DISCUSSION
In this retrospective review of ambulatory notes, progress notes written by medical assistant scribes were of higher quality than notes physicians wrote alone, at least for diabetes visits. Scribe and pre-scribe notes were of similar quality for problem-focused same-day visits. This is the first study of which we are aware that compares the quality of scribed notes with notes written by physicians.
Quality scribe notes can save physician time. The progress note is an important vehicle for describing care provided and transferring information among physicians caring for the same patient. Writing a note, however, adds a considerable amount of time to the physician’s workflow. Using a scribe can decrease the time burden of note writing, and if scribed notes are of similar or better quality, this practice innovation can allow the physician to focus more on clinical than clerical tasks.
Over-documentation is a possible concern. While implementation of the EMR may improve certain aspects of quality of care delivered14,15 and note quality,16 concern has been raised about over-documentation related to the connection between documentation and reimbursement.17 In our study, we found that physician notes and scribed notes for both diabetes and same-day encounters often used EMR-based note templates, which can lead to over-documentation.
In general, both physician and scribed notes were rated to be of average to low quality because none of the mean scores on the 9 individual components of the PDQI-9 reached 4.0. Scribed notes were not inaccurate and had word counts similar to physician notes.
Scribing has potential drawbacks—and benefits. Drawbacks to scribing have not been well-studied. It has been suggested that using scribes to work around the EMR may actually hinder its further advancement because scribing insulates physicians from the inefficiencies of current EMRs and will not spur demands for improvements.3 Inaccurate or poor-quality notes could represent another downside to scribing, although concern about the quality of notes has not been documented. Our results suggest the opposite may be true.
Note quality has not been associated with quality of care as assessed by clinical quality scores,13 but using scribes may improve the quality of care in other ways. For example, the EMR may negatively affect patient-physician communication,18,19 and freeing the physician from documentation may improve the interaction.8,20 Incorporating scribing into practice may also improve the physician experience,9,10,21,22 a possible benefit that we did not measure.
We also did not measure the cost of using a scribe to assist in EMR documentation compared with the cost of physician time spent in performing this task. If the scribe model were associated with cost savings through increased physician productivity, as well as improved physician experience, future EMR development might best focus on planned utilization by physician-scribe teams.
Study limitations. The study was conducted in a single health system, although at 8 different practice sites. The sites all used the same EMR, but templates used for documentation could be individualized by the physician and medical assistant team, so our findings may reflect variation in template design. Our analysis did adjust for possible correlations of notes from the same physician. The selection of note types in our study may make our results less generalizable to other encounter types. Our sample was not large enough to detect variations in note quality among different providers and scribes.
The ratings on the PDQI-9 may be subjective, and the reviewers were not blinded to whether a scribe was used to write the note. The differences in PDQI-9 scores were small. Although statistically significant, they may not significantly affect clinical practice. Our care model is unique in that scribes are active members of the clinical care team; the higher quality of scribed notes we found may not apply to professional scribes who are not part of the team.
Future research directions. In our study, medical assistants acting as scribes composed progress notes of similar or higher quality than physicians who wrote notes alone, although all notes were of generally average quality. As the use of scribes in medicine expands, additional studies should examine the impact of scribes on primary care workflow, quality and cost of care delivered, and quality of physician experience.
CORRESPONDENCE
Anita D. Misra-Hebert, MD, MPH, Center for Value-Based Care Research, Medicine Institute, 9500 Euclid Avenue, G10, Cleveland, OH 44195; [email protected].
1. Bodenheimer T, Willard-Grace R, Ghorob A. Expanding the roles of medical assistants: Who does what in primary care? JAMA Intern Med. 2014;174:1025-1026.
2. Reuben DB, Knudsen J, Senelick W, et al. The effect of a physician partner program on physician efficiency and patient satisfaction. JAMA Intern Med. 2014;174:1190-1193.
3. Gellert GA, Ramirea R, Webster S. The rise of the medical scribe industry: Implications for the advancement of electronic health records. JAMA. 2015;313:1315-1316.
4. Shultz CG, Holmstrom HL. The use of medical scribes in health care settings: a systematic review and future directions. J Am Board Fam Med. 2015;28:371-381.
5. Hripcsak G, Vawdrey DK, Fred MR, et al. Use of electronic clinical documentation: time spent and team interactions. J Am Med Inform Assoc. 2011;18:112-117.
6. Silverman L. Scribes Are Back, Helping Doctors Tackle Electronic Medical Records. NPR.org. Available at: www.npr.org/blogs/health/2014/04/21/303406306/scribes-are-back-helping-doctors-tackle-electronic-medical-records. Accessed April 23, 2014.
7. Arya R, Salovich DM, Ohman-Strickland P, et al. Impact of scribes on performance indicators in the emergency department. Acad Emerg Med. 2010;17:490-494.
8. Bank AJ, Obetz C, Konrardy A, et al. Impact of scribes on patient interaction, productivity, and revenue in a cardiology clinic: a prospective study. Clinicoecon Outcomes Res. 2013;5:399-406.
9. Bastani A, Shaqiri B, Palomba K, et al. An ED scribe program is able to improve throughput time and patient satisfaction. Am J Emerg Med. 2014;32:399-402.
10. Allen B, Banapoor B, Weeks EC, et al. An assessment of emergency department throughput and provider satisfaction after the implementation of a scribe program. Advances in Emergency Medicine. 2014;2014:e517319.
11. Stetson PD, Morrison FP, Bakken S, et al. Preliminary development of the Physician Documentation Quality Instrument. J Am Med Inform Assoc. 2008;15:534-541.
12. Stetson PD, Bakken S, Wrenn JO, et al. Assessing electronic note quality using the Physician Documentation Quality Instrument (PDQI-9). Appl Clin Inform. 2012;3:164-174.
13. Edwards ST, Neri PM, Volk LA, et al. Association of note quality and quality of care: a cross-sectional study. BMJ Qual Saf. 2013;23:406-413.
14. Schiff GD, Bates DW. Can electronic clinical documentation help prevent diagnostic errors? N Engl J Med. 2010;362:1066-1069.
15. Samal L, Wright A, Healey MJ, et al. Meaningful use and quality of care. JAMA Intern Med. 2014;174:997-998.
16. Burke HB, Sessums LL, Hoang A, et al. Electronic health records improve clinical note quality. J Am Med Inform Assoc. 2015;22:199-205.
17. Sheehy AM, Weissburg DJ, Dean SM. The role of copy-and-paste in the hospital electronic health record. JAMA Intern Med. 2014;174:1217-1218.
18. Shachak A, Hadas-Dayagi M, Ziv A, et al. Primary care physicians’ use of an electronic medical record system: a cognitive task analysis. J Gen Intern Med. 2009;24:341-348.
19. Shachak A, Reis S. The impact of electronic medical records on patient-doctor communication during consultation: a narrative literature review. J Eval Clin Pract. 2009;15:641-649.
20. Misra-Hebert AD, Rabovsky A, Yan C, et al. A team-based model of primary care delivery and physician-patient interaction. Am J Med. 2015;128:1025-1028.
21. Sinsky CA, Willard-Grace R, Schutzbank AM, et al. In search of joy in practice: a report of 23 high-functioning primary care practices. Ann Fam Med. 2013;11:272-278.
22. Koshy S, Feustel PJ, Hong M, et al. Scribes in an ambulatory urology practice: patient and physician satisfaction. J Urol. 2010;184:258-262.

Regionalized Care and Adverse Events
Failures in communication among healthcare professionals are known threats to patient safety. These failures account for over 60% of root causes of sentinel events, the most serious events reported to The Joint Commission.[1] As such, identifying both patterns of effective communication as well as barriers to successful communication has been a focus of efforts aimed at improving patient safety. However, to date, the majority of this work has centered on improving communication in settings such as the operating room and intensive care unit,[2, 3, 4] or at times of care transitions.[5, 6, 7, 8]
Unique barriers exist for effective interdisciplinary communication in the hospital setting, particularly physiciannurse communication regarding shared hospitalized patients.[9] Traditionally, care of hospitalized patients is provided by physicians, nurses, and other team members working in varied workflow patterns, leading to dispersed team membership, where each team member cares for different groups of patients in different locations across the hospital. This dispersion is further heightened on teaching services, where residents' rotation schedules lead to frequent changes of care team membership, leaving inpatient care teams particularly vulnerable to ineffective communication. Evidence suggests that communication between nurses and physicians is currently suboptimal, leading to frequent disagreement regarding the patient's plan of care.[9, 10] This divergence between physician and nursing perceptions of patients' care plans may leave patients at greater risk of adverse events (AEs).
Several studies have examined the effects of regionalized inpatient care teams, where multidisciplinary team members care for the same patients on the same hospital unit, on communication and patient outcomes.[4, 11, 12, 13, 14] Results of these studies have been inconsistent, perhaps due to the particular characteristics of the care teams or to the study methodology. Thus, further rigorously done studies are required to better understand the impact of team regionalization on patient care. The goal of this study was to examine whether the implementation of regionalized inpatient care teams was associated with improvements in care team communication and preventable AEs.
METHODS
Setting, Patients, and Study Design
We performed a cohort analysis of patients at a 700‐bed tertiary care center, pre‐ and postregionalization of inpatient general medicine care teams. Our study protocol was approved by the Partners Healthcare Human Subjects Review Committee. Patients were eligible for inclusion if they were 18 years of age or older and discharged from the general medicine service (GMS) from any of the 3 participating nursing units between April 1, 2012 and June 19, 2012 (preregionalization) or April 1, 2013 and June 19, 2013 (postregionalization).
Intervention
On June 20, 2012, regionalized care was implemented on the GMS such that each of 3 GMS teams was localized to 1 of 3, 15‐bed nursing units. Prior to regionalization, the GMS physician care teams, each consisting of 1 hospitalist attending, 1 medical resident, and 2 medical interns, would care for patients on an average of 7 and up to 13 different nursing units on a given day.
Regionalized care consisted of a multifaceted intervention codeveloped by hospitalist, residency, nursing, emergency department, and hospital leadership and included: (1) regionalizing GMS teams as much as possible; (2) change in resident call structure from a traditional 4‐day call cycle to daily admitting; (3) collaborative efforts to enhance GMS patient discharges before noon to promote regionalized placement of patients without prolonging time in the emergency department (ED); (4) daily morning and postround multidisciplinary huddles to prioritize sicker patients and discharges; (5) encouragement of daily rounds at patients' bedsides with presence of physician team, nurse, and team pharmacist if available; (6) creation of unit‐ and team‐level performance reports; and (7) creation of unit‐based physician and nursing co‐leadership (Figure 1).[15]
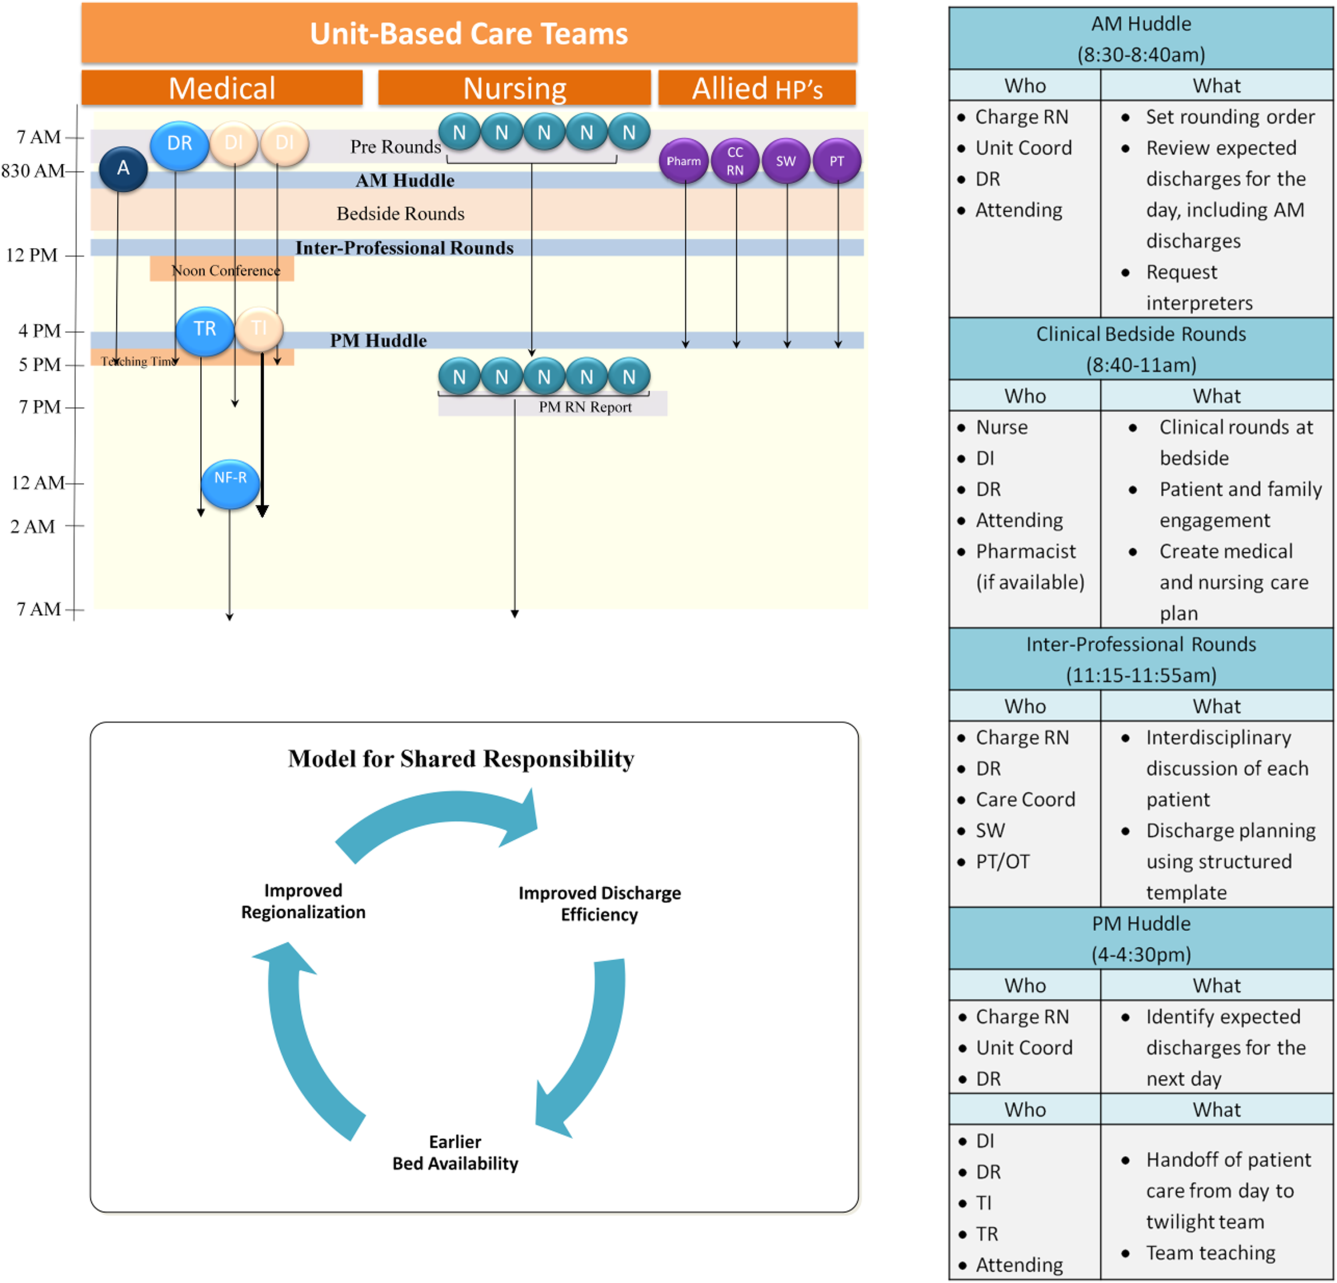
Concordance of Plan
Concordance of plan was measured via a 7‐question survey previously developed, pilot tested, and used to measure the impact of regionalized care on care team communication between inpatient nursephysician team members.[9] The survey was administered in‐person by 1 of 8 trained research assistants (RAs) (4/emntervention period) to nurse and intern pairs caring for patients on the study units pre‐ and postregionalization. GMS patients were eligible for inclusion if surveys could be administered to their nurse and intern within the first 24 hours of admission to the unit and within 48 hours of admission to the hospital, based on RA availability (thus excluding patients admitted on Fridays as surveys were not conducted over the weekend). Most often, all eligible patients admitted to the study units during time periods of data collection were included in the study. On limited occasions, the daily supply of patients surpassed RA capacity for inclusion, at which time computer‐generated randomization was utilized to randomly select patients for inclusion. Nurse and intern pairs were surveyed once during a patient's hospitalization, although they could be surveyed more than once about different patients, and patients could be included more than once if rehospitalized on the study unit and cared for by a different nurseintern pair. Of the 472 selected eligible patients, the nurses and interns of 418 patients were available and consented to survey administration, representing 361 unique nurse and intern pairs and 399 unique patients.
Each member of the pair was asked about 7 specific aspects of the patient's care plan for that day in isolation from the other team member, including: (1) the patient's primary diagnosis, (2) the patient's expressed chief concern, (3) the day's scheduled tests, (4) the day's scheduled procedures, (5) consulting services involved, (6) medication changes made that day, and (7) the patient's expected discharge date. In addition, each pair was asked the name of the other team member (ie, the nurse was asked the name of the intern and vice versa), and whether or not the patient care plan for the day had been discussed with the other team member, where concordance was defined as both members agreeing the plan had been discussed. All responses were recorded verbatim. Pairs were surveyed independently between 12 pm and 2 pm, limiting confounding by evolving plans of care over time.
Each set of surveys were then reviewed by 2 of 4 trained adjudicators, and responses to each question were scored as complete, partial, or no agreement. Rules for degree of agreement were based upon previously utilized parameters[9] as well as biweekly meetings during which common themes and disagreements in ratings were discussed, and rules generated to create consensus (see Supporting Information, Appendix, in the online version of this article).
Adverse Event Detection
Of the patients meeting eligibility criteria, 200 patients were randomly selected using computer‐generated randomization from each time period for AE outcome assessment, for a total of 400 patients.
Each patient's electronic medical record was retrospectively reviewed by a trained clinician using a previously validated screening tool to detect any possible AEs.[11] Any positive screen prompted documentation of a narrative summary including a short description of the possible AE and pertinent associated data. We defined AE as any injury due to medical management rather than the natural history of the illness, and further limited this definition to only include AEs that occurred on the study unit or as a result of care on that unit.
Two of 4 trained adjudicators, blinded to time period, then separately reviewed each narrative summary using previously validated 6‐point confidence scales to determine the presence and preventability of AE, with confidence ratings of 4 or greater used as cutoffs.[11] All AEs were also scored on a 4‐point severity scale (trivial, clinically significant, serious, or life threatening), with severe AE defined as serious or life threatening. Lastly, adjudicators grouped AEs into 1 of 10 prespecified categories.[11] Any disagreements in ratings or groupings were discussed by all 4 adjudicators to reach consensus.
Data Analysis
Patient characteristics are presented using descriptive statistics and were compared in the pre‐ and postregionalization time periods using 2 or t tests as appropriate.
To analyze whether regionalized care was associated with concordance of plan, adjudicated survey questions were assigned points of 1, 0.5, and 0 for complete, partial, and no agreement, respectively. Total mean concordance scores for any patient ranged from 0 to 7 points, and were divided by total number of answered questions (up to 7) for a range of 0 to 1. Total mean concordance scores as well as mean concordance score per survey question were compared pre‐ versus postregionalization using t tests. In sensitivity analyses, adjudicated survey responses were dichotomized with complete and partial agreement deemed concordant responses. Percent concordance for each question was then compared pre‐ versus postregionalization using 2 analysis. Questions about the name of the other team member and discussion of daily care plan with the other team member were excluded from total concordance score calculations and were compared individually pre‐ versus postregionalization, because they are not directly about the plan of care.
To analyze the association of regionalization with odds of preventable AE, we performed multivariable logistic regression adjusted for patient age, sex, race, language, and Elixhauser comorbidity score,[16] and utilized generalized estimating equations to account for clustering by hospital unit. Secondary outcomes included severe preventable AEs, nonpreventable AEs, and category of preventable AEs using similar methodology. Two‐sided P values 0.05 were considered significant, and SAS version 9.2 (SAS Institute Inc., Cary, NC) was used for all analyses.
RESULTS
The fidelity of the intervention in achieving its goal of regionalized care is discussed separately.[15] Briefly, the intervention was successful at achieving 85% regionalization by team (ie, average daily percentage of team's patients assigned to team's unit) and 87% regionalization by unit (ie, average daily percentage of unit's patients with assigned team) following implementation, compared to 20% regionalization by team and unit in the preintervention period. Importantly, the average daily census of physician care teams rose by 32%, from a mean of 10.8 patients/physician care team preregionalization to a mean of 14.3 patients/physician care team postregionalization.
Concordance of Plan
Of the 418 nurse and intern paired surveys, 4 surveys were excluded due to repeat surveys of the same patient during the same hospitalization, for a total of 197 distinct paired surveys preregionalization and 217 paired surveys postregionalization. There were no statistically significant differences in patients' age, sex, race, language, admission source, length of stay, Elixhauser comorbidity score and diagnosis‐related group weight pre‐ versus postregionalization (Table 1).
| Characteristic | Concordance of Care Plan | Adverse Events | ||||
|---|---|---|---|---|---|---|
| Pre, n = 197 | Post, n = 217 | P Value | Pre, n = 198 | Post, n = 194 | P Value | |
| ||||||
| Age, mean (SD) | 60.5 (19.4) | 57.6 (20.8) | 0.15 | 60.4 (18.9) | 58.0 (21.2) | 0.24 |
| Male, n (%) | 77 (39.1) | 92 (42.4) | 0.49 | 94 (47.5) | 85 (43.8) | 0.55 |
| Race/ethnicity, n (%) | 0.34 | 0.12 | ||||
| White | 134 (68.0) | 141 (65.0) | 132 (66.5) | 121 (62.4) | ||
| Black | 42 (21.3) | 45 (20.7) | 41 (20.8) | 54 (27.8) | ||
| Hispanic | 18 (9.1) | 21 (9.7) | 22 (11.3) | 13 (6.8) | ||
| Other/unknown | 3 (1.5) | 10 (4.6) | 3 (1.4) | 6 (2.9) | ||
| Language, n (%) | 0.30 | 0.73 | ||||
| English | 183 (92.9) | 203 (93.5) | 176 (88.7) | 175 (90.2) | ||
| Spanish | 6 (3.0) | 10 (4.6) | 10 (5.2) | 10 (5.3) | ||
| Other | 8 (4.1) | 4 (1.8) | 12 (6.1) | 9 (4.5) | ||
| Admitting source, n (%) | 1.00 | 0.10 | ||||
| Physician office | 13 (6.6) | 13 (6.0) | 13 (6.6) | 6 (3.1) | ||
| Emergency department | 136 (69.0) | 150 (69.1) | 126 (63.6) | 127 (65.5) | ||
| Transfer from different hospital | 40 (20.3) | 45 (20.7) | 54 (27.3) | 50 (25.8) | ||
| Transfer from skilled nursing facility | 8 (4.1) | 9 (4.2) | 5 (2.5) | 11 (5.6) | ||
| Length of stay, d, median (IQR) | 3.0 (4.0) | 3.0 (4.0) | 0.57 | 4.0 (5.0) | 3.0 (4.0) | 0.16 |
| Elixhauser Comorbidity Score, mean (SD) | 8.0 (8.8) | 8.3 (9.3) | 0.74 | 8.0 (8.6) | 7.8 (8.4) | 0.86 |
| DRG weight, mean (SD) | 1.6 (1.0) | 1.5 (1.0) | 0.37 | 1.5 (0.93) | 1.5 (1.1) | 0.96 |
Kappa scores for adjudications of concordance surveys (defined as both adjudicators scoring the same level of agreement (ie, both complete or partial agreement versus no agreement) ranged from 0.69 to 0.95, by question. There were no significant differences in total mean concordance scores in the care plan pre‐ versus postregionalization (0.65 vs 0.67, P = 0.26) (Table 2). Similarly, there were no significant differences in mean concordance score for each survey question, except agreement on expected date of discharge (0.56 vs 0.68, P = 0.003), knowledge of the other provider's name, and agreement that discussion of the daily plan had taken place with the other pair member. Similar results were seen when results were dichotomized (ie, partial or complete agreement vs no agreement) (Table 2).
| Concordance Outcome | Pre, n = 197 | Post, n = 217 | P Value |
|---|---|---|---|
| |||
| Concordance score* | |||
| Total concordance score, mean (SD) | 0.65 (0.17) | 0.67 (0.16) | 0.26 |
| Subgroups | |||
| Diagnosis | 0.77 (0.32) | 0.72 (0.35) | 0.11 |
| Patient's chief concern | 0.48 (0.44) | 0.48 (0.43) | 0.94 |
| Tests today | 0.67 (0.40) | 0.71 (0.42) | 0.36 |
| Procedures today | 0.93 (0.25) | 0.92 (0.25) | 0.71 |
| Medication changes today | 0.56 (0.44) | 0.59 (0.43) | 0.54 |
| Consulting services | 0.59 (0.44) | 0.60 (0.44) | 0.82 |
| Expected discharge date | 0.56 (0.44) | 0.68 (0.38) | 0.003 |
| Responding clinician knowledge of nurse's name | 0.56 (0.50) | 0.86 (0.35) | 0.001 |
| Nurse's knowledge of responding clinician's name | 0.56 (0.50) | 0.88 (0.33) | 0.001 |
| Plan discussed | 0.73 (0.45) | 0.88 (0.32) | 0.001 |
| Percent concordance, mean (SD) | |||
| Diagnosis | 92.0 (27.3) | 88.6 (31.9) | 0.25 |
| Patient's chief concern | 59.6 (49.1) | 60.6 (49.0) | 0.84 |
| Tests today | 78.9 (40.9) | 77.2 (42.1) | 0.67 |
| Procedures today | 93.5 (24.8) | 94.1 (23.7) | 0.80 |
| Medication changes today | 66.3 (33.6) | 69.9 (46.0) | 0.44 |
| Consulting services | 69.3 (46.2) | 68.9 (46.4) | 0.93 |
| Expected discharge date | 67.5 (47.0) | 82.6 (38.0) | 0.001 |
| Responding clinician knowledge of nurse's name | 55.7 (49.8) | 85.6 (35.2) | 0.001 |
| Nurse's knowledge of responding clinician's name | 55.9 (49.8) | 87.9 (32.8) | 0.001 |
| Plan discussed | 72.9 (44.6) | 88.2 (32.3) | 0.001 |
Adverse Events
Of the 400 patients screened for AEs, 8 were excluded due to missing medical record number (5) and discharge outside of study period (3). Of the final 392 patient screens (198 pre, 194 post), there were no significant differences in patients' age, sex, race, language, length of stay, or Elixhauser score pre‐ versus postregionalization (Table 1).
Kappa scores for adjudicator agreement were 0.35 for presence of AE and 0.34 for preventability of AE. Of the 392 reviewed patient records, there were 133 total AEs detected (66 pre, 67 post), 27 preventable AEs (13 pre, 14 post), and 9 severe preventable AEs (4 pre, 5 post) (Table 3). There was no significant difference in the adjusted odds of preventable AEs post‐ versus preregionalization (adjusted odds ratio: 1.37, 95% confidence interval: 0.69, 2.69). Although the low number of AEs rated as severe or life threatening precluded adjusted analysis, unadjusted results similarly demonstrated no difference in odds of severe preventable AEs pre‐ versus postregionalization. As expected, there was no significant difference in adjusted odds of nonpreventable AE after implementation of regionalized care (Table 3).
| Adverse Events | No. of Adverse Events | Adjusted Odds Ratio Post vs Pre (95% CI) | |
|---|---|---|---|
| Pre, n = 198 | Post, n = 194 | ||
| |||
| Preventable | 13 | 14 | 1.37 (0.69, 2.69) |
| Serious and preventable | 4 | 5 | |
| Nonpreventable | 47 | 50 | 1.20 (0.85, 1.75) |
Similarly, there were no significant differences in category of preventable AE pre‐ versus postregionalization. The most frequent preventable AEs in both time periods were those related to adverse drug events and to manifestations of poor glycemic control, examples of which are illustrated (Table 4).
| |
| Adverse drug event | 29‐year‐old male with history of alcohol abuse, complicated by prior withdrawal seizures/emntensive care unit admissions, presented with alcohol withdrawal. Started on standing and PRN lorazepam, kept on home medications including standing clonidine, gabapentin, citalopram, quetiapine. Became somnolent due to polypharmacy, ultimately discontinued quetiapine as discovered took only as needed at home for insomnia |
| Manifestations of poor glycemic control | 78‐year‐old male with recently diagnosed lymphoma, distant history of bladder and prostate cancer status post ileal loop diversion, presented status post syncopal event; during event, spilled boiling water on himself leading to second‐degree burns on 3% of his body. Initially admitted to trauma/burn service, ultimately transferred to medical service for ongoing multiple medical issues including obstructive uropathy, acute on chronic renal failure. Adverse event was hyperglycemia (>350 mg/dL on >2 consecutive readings) in the setting of holding his home insulin detemir and insulin aspart (had been placed on insulin aspart sliding scale alone). After hyperglycemic episodes, was placed back on weight‐based basal/nutritional insulin |
DISCUSSION
In this study of general medicine patients at a large academic medical center, we found that regionalization of care teams on general medicine services was associated with improved recognition of care team members and agreement on estimated date of patient discharge, but was not associated with improvement in overall nurse and physician concordance of the patient care plan, or the odds of preventable AEs.
This intervention importantly addresses the barrier of dispersion of team membership, a well‐recognized barrier to interdisciplinary collaboration,[17, 18] particularly with resident physician teams due to frequently changing team membership. Localization of all team members, in addition to encouragement of daily collaborative bedside rounds as part of the regionalization initiative, likely contributed to our observed improvement in team member identification and discussion of daily care plans. Similarly, regionalization resulted in improved agreement in estimations of date of patient discharge. Focus on early patient discharges was an integral part of the implementation efforts; we therefore hypothesize that mutual focus on discharge planning by both nurses and responding clinicians may have explained this observed result.
On the other hand, regionalization did not appreciably improve the overall concordance of care plan between nurses and interns, despite a significant increase in team members agreeing that the plan had been discussed. Our findings support similar prior research demonstrating that regionalizing hospitalist attendings to single nursing units had limited impact on agreement of care plan between physicians and nurses.[13] Similarly, in settings where physicians and nurses are inherently regionalized, such as the intensive care unit[4] or the operating room,[3] communication between physicians and nurses remains difficult. Collectively, our findings suggest that colocalization of physicians and nurses alone is likely insufficient to improve measured communication between care team members. Existing literature suggests that more standardized approaches to improve communication, such as structured communication tools used during daily inpatient care[19, 20] or formalized team training,[21, 22, 23] lead to improvements in communication and collaboration. Despite these findings, it is important to highlight that this study did not assess other measures of workplace culture, such as teamwork and care team cohesiveness, which may have been positively affected by this intervention, even without measurable effect on concordance of care plan. Additionally, as noted, the average daily census on each team increased by almost a third postintervention, which may have impeded improvements in care team communication.
In addition, we found that our intervention had no significant impact on preventable AEs or severe preventable AEs. Although we cannot exclude the possibility that more subtle AEs were missed with our methodology, our results indicate that regionalized care alone may be inadequate to improve major patient safety outcomes. As discussed, the volume of patients did increase postintervention; thus, another way to state our results is that we were able to increase the daily volume of patients without any significant decreases in patient safety. Nevertheless, the results on patient safety were less than desired. A recent review of interdisciplinary team care interventions on general medical wards similarly demonstrated underwhelming improvements in patient safety outcomes, although the reviewed interventions did not specifically address preventable AEs, a gap in the literature commented on by the authors.[24] Other albeit limited literature has demonstrated improvement in patient safety outcomes via multifaceted efforts aimed at improving care team member communication. Notably, these efforts include colocalization of care team members to single units but also involve additional measures to improve communication and collaboration between care team members, such as structured communication during interdisciplinary rounds, and certification of key interdisciplinary teamwork skills.[11, 14] Although our regionalized care intervention included many similar features to these accountable care units (ACUs) including unit‐based care teams, unit‐level performance reporting, and unit‐based physician and nursing coleadership, significant differences existed. Notably, in addition to the above features, the ACU model also incorporated highly structured communication models for interdisciplinary rounding, and certification processes to ensure an appropriate communication skill base among care team members.[14] Thus, although creation of regionalized care teams is likely a necessary precursor to implementation of these additional measures, alone it may be insufficient to improve patient safety outcomes.
Importantly, in our study we identified that adverse drug events and manifestations of poor glycemic control occurred in high frequency both before and following implementation of regionalized care, supporting other literature that describes the prevalence of these AEs.[11, 25, 26, 27] These results suggest that targeted interventions to address these specific AEs are likely necessary. Notably, the intervention units in our study did not consistently employ clinical pharmacists assigned specifically to that unit's care team to allow for integration within the care team. As prior research has suggested that greater collaboration with clinical pharmacists results in reduction of adverse drug events,[28] next steps may include improved integration of team‐based pharmacists into the activities of the regionalized care teams. Inpatient management of diabetes also requires specific interventions,[29, 30, 31] only some of which may be addressable by having regionalized care and better interdisciplinary communication.
Our findings are subject to several limitations. First, this was a single‐site study and thus our findings may not be generalizable to other institutions. However, regionalized care is increasingly encouraged to optimize communication between care team members.[17, 18] Therefore, our null findings may be pertinent to other institutions looking to improve patient safety outcomes, demonstrating that additional initiatives will likely be required. Second, our modes of outcome measurement possess limitations. In measuring concordance of care plan, although previously used survey techniques were employed,[9] the concordance survey has not been formally validated, and we believe some of the questions may have led to ambiguity on the part of the responders that may have resulted in less accurate responses, thus biasing toward the null. Similarly, in measuring AEs, the screening tool relied on retrospective chart review looking for specific AE types[11] and thus may not have captured more subtle AEs. Additionally, our study may have been underpowered to demonstrate significant reduction in preventable AEs, although other studies of similar methodology demonstrated significant results with similar sample size.[11] This was due in part to our lower‐than‐expected baseline AE rate (6.6% compared with approximately 10.3% in previous studies).[11] Lastly, our study solely examined the association of regionalization with concordance of care plan and preventable AEs, but importantly excluded other clinically important outcomes that may have been positively (or negatively) impacted by these regionalization efforts, such as ED wait times, provider efficiency (eg, fewer pages, less time in transit, more time at the bedside), interdisciplinary teamwork, or patient or provider satisfaction.
CONCLUSION
In summary, our findings suggest that regionalized care teams alone may be insufficient to effectively promote communication between care team members regarding the care plan or to lead to improvements in patient safety, although we recognize that there may have been benefits (or unintended harms) not measured in this study but are nonetheless important for clinical care and workplace culture. This is an important lesson, as many hospitals move toward regionalized care in an effort to improve patient safety outcomes. However, strengthening the infrastructure by colocalizing care team members to maximize opportunity for communication is likely a necessary first step toward facilitating implementation of additional initiatives that may lead to more robust patient safety improvements, such as structured interdisciplinary bedside rounds (eg, facilitating and training all team members to fulfill specific roles), teamwork training, and certification of key interdisciplinary teamwork skills. Additionally, close examination of identified prevalent and preventable AEs can help to determine which additional initiatives are most likely to have greatest impact in improving patient safety.
Disclosures: This research was supported by funds provided by Brigham and Women's Hospital (BWH) and by funds provided by the Department of Medicine at BWH. All authors had full access to all of the data in the study and were integrally involved in the design, implementation, data collection, and analyses. The first author, Dr. Stephanie Mueller, takes responsibility for the integrity for the data and the accuracy of the data analysis. Dr. Schnipper reports grants from Sanofi Aventis, outside the submitted work.
- Joint Commission on Accreditation of Healthcare Organizations. Understanding and Preventing Sentinel Events in Your Health Care Organization. Oak Brook, IL: Joint Commission; 2008.
- , , , et al. Communication failures in the operating room: an observational classification of recurrent types and effects. Qual Saf Health Care. 2004;13(5):330–334.
- , , , et al. Operating room teamwork among physicians and nurses: teamwork in the eye of the beholder. J Am Coll Surg. 2006;202(5):746–752.
- , , . Discrepant attitudes about teamwork among critical care nurses and physicians. Crit Care Med. 2003;31(3):956–959.
- , , , , . Communication failures in patient sign‐out and suggestions for improvement: a critical incident analysis. Qual Saf Health Care. 2005;14(6):401–407.
- , , , et al. Changes in medical errors after implementation of a handoff program. N Engl J Med. 2014;371(19):1803–1812.
- , , , et al. Communication and information deficits in patients discharged to rehabilitation facilities: an evaluation of five acute care hospitals. J Hosp Med. 2009;4(8):E28–E33.
- , , , , , . Deficits in communication and information transfer between hospital‐based and primary care physicians: implications for patient safety and continuity of care. JAMA. 2007;297(8):831–841.
- , , , et al. Patterns of nurse‐physician communication and agreement on the plan of care. Qual Saf Health Care. 2010;19(3):195–199.
- , , , , , . Can we talk? Priorities for patient care differed among health care providers. In: Henriksen K, Battles JB, Marks ES, Lewin DI, eds. Advances in Patient Safety: From Research to Implementation. Vol 1. Rockville, MD: Agency for Healthcare Research and Quality; 2005.
- , , , et al. Structured interdisciplinary rounds in a medical teaching unit: improving patient safety. Arch Intern Med. 2011;171(7):678–684.
- , , , , , . Improving teamwork: impact of structured interdisciplinary rounds on a hospitalist unit. J Hosp Med. 2011;6(2):88–93.
- , , , et al. Impact of localizing physicians to hospital units on nurse‐physician communication and agreement on the plan of care. J Gen Intern Med. 2009;24(11):1223–1227.
- , , , et al. Reorganizing a hospital ward as an accountable care unit. J Hosp Med. 2015;10(1):36–40.
- , , , et al. 5th time's a charm: creation of unit‐based care teams in a high occupancy hospital [abstract]. J Hosp Med. 2015;10 (suppl. 2). Available at: http://www.shmabstracts.com/abstract/5th‐times‐a‐charm‐creation‐of‐unit‐based‐care‐teams‐in‐a‐high‐occupancy‐hospital. Accessed July 28, 2015.
- , , , . Comorbidity measures for use with administrative data. Med Care. 1998;36(1):8–27.
- , , , , , . Teamwork on inpatient medical units: assessing attitudes and barriers. Qual Saf Health Care. 2010;19(2):117–121.
- , , , et al. A model for quality improvement programs in academic departments of medicine. Am J Med. 2008;121(10):922–929.
- , , , , . Improving nurse‐physician communication and satisfaction in the intensive care unit with a daily goals worksheet. Am J Crit Care. 2006;15(2):217–222.
- , , , , , . Improving communication in the ICU using daily goals. J Crit Care. 2003;18(2):71–75.
- , , , et al. Effect of crew resource management training in a multidisciplinary obstetrical setting. Int J Qual Health Care. 2008;20(4):254–263.
- , , , et al. Error reduction and performance improvement in the emergency department through formal teamwork training: evaluation results of the MedTeams project. Health Serv Res. 2002;37(6):1553–1581.
- , , , et al. Effects of teamwork training on adverse outcomes and process of care in labor and delivery: a randomized controlled trial. Obstet Gynecol. 2007;109(1):48–55.
- , , , et al. Effects of interdisciplinary team care interventions on general medical wards: a systematic review. JAMA Intern Med. 2015;175(8):1288–1298.
- , , , et al. Patient risk factors for adverse drug events in hospitalized patients. ADE Prevention Study Group. Arch Intern Med. 1999;159(21):2553–2560.
- , , , et al. Effect of a pharmacist intervention on clinically important medication errors after hospital discharge: a randomized trial. Ann Intern Med. 2012;157(1):1–10.
- , , , . Use of a standardized protocol to decrease medication errors and adverse events related to sliding scale insulin. Qual Saf Health Care. 2006;15(2):89–91.
- , , , . Clinical pharmacists and inpatient medical care: a systematic review. Arch Intern Med. 2006;166(9):955–964.
- , , , , . Improved inpatient use of basal insulin, reduced hypoglycemia, and improved glycemic control: effect of structured subcutaneous insulin orders and an insulin management algorithm. J Hosp Med. 2009;4(1):3–15.
- , , , . Effects of a computerized order set on the inpatient management of hyperglycemia: a cluster‐randomized controlled trial. Endocr Pract. 2010;16(2):209–218.
- , , , . Effects of a subcutaneous insulin protocol, clinical education, and computerized order set on the quality of inpatient management of hyperglycemia: results of a clinical trial. J Hosp Med. 2009;4(1):16–27.
Failures in communication among healthcare professionals are known threats to patient safety. These failures account for over 60% of root causes of sentinel events, the most serious events reported to The Joint Commission.[1] As such, identifying both patterns of effective communication as well as barriers to successful communication has been a focus of efforts aimed at improving patient safety. However, to date, the majority of this work has centered on improving communication in settings such as the operating room and intensive care unit,[2, 3, 4] or at times of care transitions.[5, 6, 7, 8]
Unique barriers exist for effective interdisciplinary communication in the hospital setting, particularly physiciannurse communication regarding shared hospitalized patients.[9] Traditionally, care of hospitalized patients is provided by physicians, nurses, and other team members working in varied workflow patterns, leading to dispersed team membership, where each team member cares for different groups of patients in different locations across the hospital. This dispersion is further heightened on teaching services, where residents' rotation schedules lead to frequent changes of care team membership, leaving inpatient care teams particularly vulnerable to ineffective communication. Evidence suggests that communication between nurses and physicians is currently suboptimal, leading to frequent disagreement regarding the patient's plan of care.[9, 10] This divergence between physician and nursing perceptions of patients' care plans may leave patients at greater risk of adverse events (AEs).
Several studies have examined the effects of regionalized inpatient care teams, where multidisciplinary team members care for the same patients on the same hospital unit, on communication and patient outcomes.[4, 11, 12, 13, 14] Results of these studies have been inconsistent, perhaps due to the particular characteristics of the care teams or to the study methodology. Thus, further rigorously done studies are required to better understand the impact of team regionalization on patient care. The goal of this study was to examine whether the implementation of regionalized inpatient care teams was associated with improvements in care team communication and preventable AEs.
METHODS
Setting, Patients, and Study Design
We performed a cohort analysis of patients at a 700‐bed tertiary care center, pre‐ and postregionalization of inpatient general medicine care teams. Our study protocol was approved by the Partners Healthcare Human Subjects Review Committee. Patients were eligible for inclusion if they were 18 years of age or older and discharged from the general medicine service (GMS) from any of the 3 participating nursing units between April 1, 2012 and June 19, 2012 (preregionalization) or April 1, 2013 and June 19, 2013 (postregionalization).
Intervention
On June 20, 2012, regionalized care was implemented on the GMS such that each of 3 GMS teams was localized to 1 of 3, 15‐bed nursing units. Prior to regionalization, the GMS physician care teams, each consisting of 1 hospitalist attending, 1 medical resident, and 2 medical interns, would care for patients on an average of 7 and up to 13 different nursing units on a given day.
Regionalized care consisted of a multifaceted intervention codeveloped by hospitalist, residency, nursing, emergency department, and hospital leadership and included: (1) regionalizing GMS teams as much as possible; (2) change in resident call structure from a traditional 4‐day call cycle to daily admitting; (3) collaborative efforts to enhance GMS patient discharges before noon to promote regionalized placement of patients without prolonging time in the emergency department (ED); (4) daily morning and postround multidisciplinary huddles to prioritize sicker patients and discharges; (5) encouragement of daily rounds at patients' bedsides with presence of physician team, nurse, and team pharmacist if available; (6) creation of unit‐ and team‐level performance reports; and (7) creation of unit‐based physician and nursing co‐leadership (Figure 1).[15]
Concordance of Plan
Concordance of plan was measured via a 7‐question survey previously developed, pilot tested, and used to measure the impact of regionalized care on care team communication between inpatient nursephysician team members.[9] The survey was administered in‐person by 1 of 8 trained research assistants (RAs) (4/emntervention period) to nurse and intern pairs caring for patients on the study units pre‐ and postregionalization. GMS patients were eligible for inclusion if surveys could be administered to their nurse and intern within the first 24 hours of admission to the unit and within 48 hours of admission to the hospital, based on RA availability (thus excluding patients admitted on Fridays as surveys were not conducted over the weekend). Most often, all eligible patients admitted to the study units during time periods of data collection were included in the study. On limited occasions, the daily supply of patients surpassed RA capacity for inclusion, at which time computer‐generated randomization was utilized to randomly select patients for inclusion. Nurse and intern pairs were surveyed once during a patient's hospitalization, although they could be surveyed more than once about different patients, and patients could be included more than once if rehospitalized on the study unit and cared for by a different nurseintern pair. Of the 472 selected eligible patients, the nurses and interns of 418 patients were available and consented to survey administration, representing 361 unique nurse and intern pairs and 399 unique patients.
Each member of the pair was asked about 7 specific aspects of the patient's care plan for that day in isolation from the other team member, including: (1) the patient's primary diagnosis, (2) the patient's expressed chief concern, (3) the day's scheduled tests, (4) the day's scheduled procedures, (5) consulting services involved, (6) medication changes made that day, and (7) the patient's expected discharge date. In addition, each pair was asked the name of the other team member (ie, the nurse was asked the name of the intern and vice versa), and whether or not the patient care plan for the day had been discussed with the other team member, where concordance was defined as both members agreeing the plan had been discussed. All responses were recorded verbatim. Pairs were surveyed independently between 12 pm and 2 pm, limiting confounding by evolving plans of care over time.
Each set of surveys were then reviewed by 2 of 4 trained adjudicators, and responses to each question were scored as complete, partial, or no agreement. Rules for degree of agreement were based upon previously utilized parameters[9] as well as biweekly meetings during which common themes and disagreements in ratings were discussed, and rules generated to create consensus (see Supporting Information, Appendix, in the online version of this article).
Adverse Event Detection
Of the patients meeting eligibility criteria, 200 patients were randomly selected using computer‐generated randomization from each time period for AE outcome assessment, for a total of 400 patients.
Each patient's electronic medical record was retrospectively reviewed by a trained clinician using a previously validated screening tool to detect any possible AEs.[11] Any positive screen prompted documentation of a narrative summary including a short description of the possible AE and pertinent associated data. We defined AE as any injury due to medical management rather than the natural history of the illness, and further limited this definition to only include AEs that occurred on the study unit or as a result of care on that unit.
Two of 4 trained adjudicators, blinded to time period, then separately reviewed each narrative summary using previously validated 6‐point confidence scales to determine the presence and preventability of AE, with confidence ratings of 4 or greater used as cutoffs.[11] All AEs were also scored on a 4‐point severity scale (trivial, clinically significant, serious, or life threatening), with severe AE defined as serious or life threatening. Lastly, adjudicators grouped AEs into 1 of 10 prespecified categories.[11] Any disagreements in ratings or groupings were discussed by all 4 adjudicators to reach consensus.
Data Analysis
Patient characteristics are presented using descriptive statistics and were compared in the pre‐ and postregionalization time periods using 2 or t tests as appropriate.
To analyze whether regionalized care was associated with concordance of plan, adjudicated survey questions were assigned points of 1, 0.5, and 0 for complete, partial, and no agreement, respectively. Total mean concordance scores for any patient ranged from 0 to 7 points, and were divided by total number of answered questions (up to 7) for a range of 0 to 1. Total mean concordance scores as well as mean concordance score per survey question were compared pre‐ versus postregionalization using t tests. In sensitivity analyses, adjudicated survey responses were dichotomized with complete and partial agreement deemed concordant responses. Percent concordance for each question was then compared pre‐ versus postregionalization using 2 analysis. Questions about the name of the other team member and discussion of daily care plan with the other team member were excluded from total concordance score calculations and were compared individually pre‐ versus postregionalization, because they are not directly about the plan of care.
To analyze the association of regionalization with odds of preventable AE, we performed multivariable logistic regression adjusted for patient age, sex, race, language, and Elixhauser comorbidity score,[16] and utilized generalized estimating equations to account for clustering by hospital unit. Secondary outcomes included severe preventable AEs, nonpreventable AEs, and category of preventable AEs using similar methodology. Two‐sided P values 0.05 were considered significant, and SAS version 9.2 (SAS Institute Inc., Cary, NC) was used for all analyses.
RESULTS
The fidelity of the intervention in achieving its goal of regionalized care is discussed separately.[15] Briefly, the intervention was successful at achieving 85% regionalization by team (ie, average daily percentage of team's patients assigned to team's unit) and 87% regionalization by unit (ie, average daily percentage of unit's patients with assigned team) following implementation, compared to 20% regionalization by team and unit in the preintervention period. Importantly, the average daily census of physician care teams rose by 32%, from a mean of 10.8 patients/physician care team preregionalization to a mean of 14.3 patients/physician care team postregionalization.
Concordance of Plan
Of the 418 nurse and intern paired surveys, 4 surveys were excluded due to repeat surveys of the same patient during the same hospitalization, for a total of 197 distinct paired surveys preregionalization and 217 paired surveys postregionalization. There were no statistically significant differences in patients' age, sex, race, language, admission source, length of stay, Elixhauser comorbidity score and diagnosis‐related group weight pre‐ versus postregionalization (Table 1).
| Characteristic | Concordance of Care Plan | Adverse Events | ||||
|---|---|---|---|---|---|---|
| Pre, n = 197 | Post, n = 217 | P Value | Pre, n = 198 | Post, n = 194 | P Value | |
| ||||||
| Age, mean (SD) | 60.5 (19.4) | 57.6 (20.8) | 0.15 | 60.4 (18.9) | 58.0 (21.2) | 0.24 |
| Male, n (%) | 77 (39.1) | 92 (42.4) | 0.49 | 94 (47.5) | 85 (43.8) | 0.55 |
| Race/ethnicity, n (%) | 0.34 | 0.12 | ||||
| White | 134 (68.0) | 141 (65.0) | 132 (66.5) | 121 (62.4) | ||
| Black | 42 (21.3) | 45 (20.7) | 41 (20.8) | 54 (27.8) | ||
| Hispanic | 18 (9.1) | 21 (9.7) | 22 (11.3) | 13 (6.8) | ||
| Other/unknown | 3 (1.5) | 10 (4.6) | 3 (1.4) | 6 (2.9) | ||
| Language, n (%) | 0.30 | 0.73 | ||||
| English | 183 (92.9) | 203 (93.5) | 176 (88.7) | 175 (90.2) | ||
| Spanish | 6 (3.0) | 10 (4.6) | 10 (5.2) | 10 (5.3) | ||
| Other | 8 (4.1) | 4 (1.8) | 12 (6.1) | 9 (4.5) | ||
| Admitting source, n (%) | 1.00 | 0.10 | ||||
| Physician office | 13 (6.6) | 13 (6.0) | 13 (6.6) | 6 (3.1) | ||
| Emergency department | 136 (69.0) | 150 (69.1) | 126 (63.6) | 127 (65.5) | ||
| Transfer from different hospital | 40 (20.3) | 45 (20.7) | 54 (27.3) | 50 (25.8) | ||
| Transfer from skilled nursing facility | 8 (4.1) | 9 (4.2) | 5 (2.5) | 11 (5.6) | ||
| Length of stay, d, median (IQR) | 3.0 (4.0) | 3.0 (4.0) | 0.57 | 4.0 (5.0) | 3.0 (4.0) | 0.16 |
| Elixhauser Comorbidity Score, mean (SD) | 8.0 (8.8) | 8.3 (9.3) | 0.74 | 8.0 (8.6) | 7.8 (8.4) | 0.86 |
| DRG weight, mean (SD) | 1.6 (1.0) | 1.5 (1.0) | 0.37 | 1.5 (0.93) | 1.5 (1.1) | 0.96 |
Kappa scores for adjudications of concordance surveys (defined as both adjudicators scoring the same level of agreement (ie, both complete or partial agreement versus no agreement) ranged from 0.69 to 0.95, by question. There were no significant differences in total mean concordance scores in the care plan pre‐ versus postregionalization (0.65 vs 0.67, P = 0.26) (Table 2). Similarly, there were no significant differences in mean concordance score for each survey question, except agreement on expected date of discharge (0.56 vs 0.68, P = 0.003), knowledge of the other provider's name, and agreement that discussion of the daily plan had taken place with the other pair member. Similar results were seen when results were dichotomized (ie, partial or complete agreement vs no agreement) (Table 2).
| Concordance Outcome | Pre, n = 197 | Post, n = 217 | P Value |
|---|---|---|---|
| |||
| Concordance score* | |||
| Total concordance score, mean (SD) | 0.65 (0.17) | 0.67 (0.16) | 0.26 |
| Subgroups | |||
| Diagnosis | 0.77 (0.32) | 0.72 (0.35) | 0.11 |
| Patient's chief concern | 0.48 (0.44) | 0.48 (0.43) | 0.94 |
| Tests today | 0.67 (0.40) | 0.71 (0.42) | 0.36 |
| Procedures today | 0.93 (0.25) | 0.92 (0.25) | 0.71 |
| Medication changes today | 0.56 (0.44) | 0.59 (0.43) | 0.54 |
| Consulting services | 0.59 (0.44) | 0.60 (0.44) | 0.82 |
| Expected discharge date | 0.56 (0.44) | 0.68 (0.38) | 0.003 |
| Responding clinician knowledge of nurse's name | 0.56 (0.50) | 0.86 (0.35) | 0.001 |
| Nurse's knowledge of responding clinician's name | 0.56 (0.50) | 0.88 (0.33) | 0.001 |
| Plan discussed | 0.73 (0.45) | 0.88 (0.32) | 0.001 |
| Percent concordance, mean (SD) | |||
| Diagnosis | 92.0 (27.3) | 88.6 (31.9) | 0.25 |
| Patient's chief concern | 59.6 (49.1) | 60.6 (49.0) | 0.84 |
| Tests today | 78.9 (40.9) | 77.2 (42.1) | 0.67 |
| Procedures today | 93.5 (24.8) | 94.1 (23.7) | 0.80 |
| Medication changes today | 66.3 (33.6) | 69.9 (46.0) | 0.44 |
| Consulting services | 69.3 (46.2) | 68.9 (46.4) | 0.93 |
| Expected discharge date | 67.5 (47.0) | 82.6 (38.0) | 0.001 |
| Responding clinician knowledge of nurse's name | 55.7 (49.8) | 85.6 (35.2) | 0.001 |
| Nurse's knowledge of responding clinician's name | 55.9 (49.8) | 87.9 (32.8) | 0.001 |
| Plan discussed | 72.9 (44.6) | 88.2 (32.3) | 0.001 |
Adverse Events
Of the 400 patients screened for AEs, 8 were excluded due to missing medical record number (5) and discharge outside of study period (3). Of the final 392 patient screens (198 pre, 194 post), there were no significant differences in patients' age, sex, race, language, length of stay, or Elixhauser score pre‐ versus postregionalization (Table 1).
Kappa scores for adjudicator agreement were 0.35 for presence of AE and 0.34 for preventability of AE. Of the 392 reviewed patient records, there were 133 total AEs detected (66 pre, 67 post), 27 preventable AEs (13 pre, 14 post), and 9 severe preventable AEs (4 pre, 5 post) (Table 3). There was no significant difference in the adjusted odds of preventable AEs post‐ versus preregionalization (adjusted odds ratio: 1.37, 95% confidence interval: 0.69, 2.69). Although the low number of AEs rated as severe or life threatening precluded adjusted analysis, unadjusted results similarly demonstrated no difference in odds of severe preventable AEs pre‐ versus postregionalization. As expected, there was no significant difference in adjusted odds of nonpreventable AE after implementation of regionalized care (Table 3).
| Adverse Events | No. of Adverse Events | Adjusted Odds Ratio Post vs Pre (95% CI) | |
|---|---|---|---|
| Pre, n = 198 | Post, n = 194 | ||
| |||
| Preventable | 13 | 14 | 1.37 (0.69, 2.69) |
| Serious and preventable | 4 | 5 | |
| Nonpreventable | 47 | 50 | 1.20 (0.85, 1.75) |
Similarly, there were no significant differences in category of preventable AE pre‐ versus postregionalization. The most frequent preventable AEs in both time periods were those related to adverse drug events and to manifestations of poor glycemic control, examples of which are illustrated (Table 4).
| |
| Adverse drug event | 29‐year‐old male with history of alcohol abuse, complicated by prior withdrawal seizures/emntensive care unit admissions, presented with alcohol withdrawal. Started on standing and PRN lorazepam, kept on home medications including standing clonidine, gabapentin, citalopram, quetiapine. Became somnolent due to polypharmacy, ultimately discontinued quetiapine as discovered took only as needed at home for insomnia |
| Manifestations of poor glycemic control | 78‐year‐old male with recently diagnosed lymphoma, distant history of bladder and prostate cancer status post ileal loop diversion, presented status post syncopal event; during event, spilled boiling water on himself leading to second‐degree burns on 3% of his body. Initially admitted to trauma/burn service, ultimately transferred to medical service for ongoing multiple medical issues including obstructive uropathy, acute on chronic renal failure. Adverse event was hyperglycemia (>350 mg/dL on >2 consecutive readings) in the setting of holding his home insulin detemir and insulin aspart (had been placed on insulin aspart sliding scale alone). After hyperglycemic episodes, was placed back on weight‐based basal/nutritional insulin |
DISCUSSION
In this study of general medicine patients at a large academic medical center, we found that regionalization of care teams on general medicine services was associated with improved recognition of care team members and agreement on estimated date of patient discharge, but was not associated with improvement in overall nurse and physician concordance of the patient care plan, or the odds of preventable AEs.
This intervention importantly addresses the barrier of dispersion of team membership, a well‐recognized barrier to interdisciplinary collaboration,[17, 18] particularly with resident physician teams due to frequently changing team membership. Localization of all team members, in addition to encouragement of daily collaborative bedside rounds as part of the regionalization initiative, likely contributed to our observed improvement in team member identification and discussion of daily care plans. Similarly, regionalization resulted in improved agreement in estimations of date of patient discharge. Focus on early patient discharges was an integral part of the implementation efforts; we therefore hypothesize that mutual focus on discharge planning by both nurses and responding clinicians may have explained this observed result.
On the other hand, regionalization did not appreciably improve the overall concordance of care plan between nurses and interns, despite a significant increase in team members agreeing that the plan had been discussed. Our findings support similar prior research demonstrating that regionalizing hospitalist attendings to single nursing units had limited impact on agreement of care plan between physicians and nurses.[13] Similarly, in settings where physicians and nurses are inherently regionalized, such as the intensive care unit[4] or the operating room,[3] communication between physicians and nurses remains difficult. Collectively, our findings suggest that colocalization of physicians and nurses alone is likely insufficient to improve measured communication between care team members. Existing literature suggests that more standardized approaches to improve communication, such as structured communication tools used during daily inpatient care[19, 20] or formalized team training,[21, 22, 23] lead to improvements in communication and collaboration. Despite these findings, it is important to highlight that this study did not assess other measures of workplace culture, such as teamwork and care team cohesiveness, which may have been positively affected by this intervention, even without measurable effect on concordance of care plan. Additionally, as noted, the average daily census on each team increased by almost a third postintervention, which may have impeded improvements in care team communication.
In addition, we found that our intervention had no significant impact on preventable AEs or severe preventable AEs. Although we cannot exclude the possibility that more subtle AEs were missed with our methodology, our results indicate that regionalized care alone may be inadequate to improve major patient safety outcomes. As discussed, the volume of patients did increase postintervention; thus, another way to state our results is that we were able to increase the daily volume of patients without any significant decreases in patient safety. Nevertheless, the results on patient safety were less than desired. A recent review of interdisciplinary team care interventions on general medical wards similarly demonstrated underwhelming improvements in patient safety outcomes, although the reviewed interventions did not specifically address preventable AEs, a gap in the literature commented on by the authors.[24] Other albeit limited literature has demonstrated improvement in patient safety outcomes via multifaceted efforts aimed at improving care team member communication. Notably, these efforts include colocalization of care team members to single units but also involve additional measures to improve communication and collaboration between care team members, such as structured communication during interdisciplinary rounds, and certification of key interdisciplinary teamwork skills.[11, 14] Although our regionalized care intervention included many similar features to these accountable care units (ACUs) including unit‐based care teams, unit‐level performance reporting, and unit‐based physician and nursing coleadership, significant differences existed. Notably, in addition to the above features, the ACU model also incorporated highly structured communication models for interdisciplinary rounding, and certification processes to ensure an appropriate communication skill base among care team members.[14] Thus, although creation of regionalized care teams is likely a necessary precursor to implementation of these additional measures, alone it may be insufficient to improve patient safety outcomes.
Importantly, in our study we identified that adverse drug events and manifestations of poor glycemic control occurred in high frequency both before and following implementation of regionalized care, supporting other literature that describes the prevalence of these AEs.[11, 25, 26, 27] These results suggest that targeted interventions to address these specific AEs are likely necessary. Notably, the intervention units in our study did not consistently employ clinical pharmacists assigned specifically to that unit's care team to allow for integration within the care team. As prior research has suggested that greater collaboration with clinical pharmacists results in reduction of adverse drug events,[28] next steps may include improved integration of team‐based pharmacists into the activities of the regionalized care teams. Inpatient management of diabetes also requires specific interventions,[29, 30, 31] only some of which may be addressable by having regionalized care and better interdisciplinary communication.
Our findings are subject to several limitations. First, this was a single‐site study and thus our findings may not be generalizable to other institutions. However, regionalized care is increasingly encouraged to optimize communication between care team members.[17, 18] Therefore, our null findings may be pertinent to other institutions looking to improve patient safety outcomes, demonstrating that additional initiatives will likely be required. Second, our modes of outcome measurement possess limitations. In measuring concordance of care plan, although previously used survey techniques were employed,[9] the concordance survey has not been formally validated, and we believe some of the questions may have led to ambiguity on the part of the responders that may have resulted in less accurate responses, thus biasing toward the null. Similarly, in measuring AEs, the screening tool relied on retrospective chart review looking for specific AE types[11] and thus may not have captured more subtle AEs. Additionally, our study may have been underpowered to demonstrate significant reduction in preventable AEs, although other studies of similar methodology demonstrated significant results with similar sample size.[11] This was due in part to our lower‐than‐expected baseline AE rate (6.6% compared with approximately 10.3% in previous studies).[11] Lastly, our study solely examined the association of regionalization with concordance of care plan and preventable AEs, but importantly excluded other clinically important outcomes that may have been positively (or negatively) impacted by these regionalization efforts, such as ED wait times, provider efficiency (eg, fewer pages, less time in transit, more time at the bedside), interdisciplinary teamwork, or patient or provider satisfaction.
CONCLUSION
In summary, our findings suggest that regionalized care teams alone may be insufficient to effectively promote communication between care team members regarding the care plan or to lead to improvements in patient safety, although we recognize that there may have been benefits (or unintended harms) not measured in this study but are nonetheless important for clinical care and workplace culture. This is an important lesson, as many hospitals move toward regionalized care in an effort to improve patient safety outcomes. However, strengthening the infrastructure by colocalizing care team members to maximize opportunity for communication is likely a necessary first step toward facilitating implementation of additional initiatives that may lead to more robust patient safety improvements, such as structured interdisciplinary bedside rounds (eg, facilitating and training all team members to fulfill specific roles), teamwork training, and certification of key interdisciplinary teamwork skills. Additionally, close examination of identified prevalent and preventable AEs can help to determine which additional initiatives are most likely to have greatest impact in improving patient safety.
Disclosures: This research was supported by funds provided by Brigham and Women's Hospital (BWH) and by funds provided by the Department of Medicine at BWH. All authors had full access to all of the data in the study and were integrally involved in the design, implementation, data collection, and analyses. The first author, Dr. Stephanie Mueller, takes responsibility for the integrity for the data and the accuracy of the data analysis. Dr. Schnipper reports grants from Sanofi Aventis, outside the submitted work.
- Joint Commission on Accreditation of Healthcare Organizations. Understanding and Preventing Sentinel Events in Your Health Care Organization. Oak Brook, IL: Joint Commission; 2008.
- , , , et al. Communication failures in the operating room: an observational classification of recurrent types and effects. Qual Saf Health Care. 2004;13(5):330–334.
- , , , et al. Operating room teamwork among physicians and nurses: teamwork in the eye of the beholder. J Am Coll Surg. 2006;202(5):746–752.
- , , . Discrepant attitudes about teamwork among critical care nurses and physicians. Crit Care Med. 2003;31(3):956–959.
- , , , , . Communication failures in patient sign‐out and suggestions for improvement: a critical incident analysis. Qual Saf Health Care. 2005;14(6):401–407.
- , , , et al. Changes in medical errors after implementation of a handoff program. N Engl J Med. 2014;371(19):1803–1812.
- , , , et al. Communication and information deficits in patients discharged to rehabilitation facilities: an evaluation of five acute care hospitals. J Hosp Med. 2009;4(8):E28–E33.
- , , , , , . Deficits in communication and information transfer between hospital‐based and primary care physicians: implications for patient safety and continuity of care. JAMA. 2007;297(8):831–841.
- , , , et al. Patterns of nurse‐physician communication and agreement on the plan of care. Qual Saf Health Care. 2010;19(3):195–199.
- , , , , , . Can we talk? Priorities for patient care differed among health care providers. In: Henriksen K, Battles JB, Marks ES, Lewin DI, eds. Advances in Patient Safety: From Research to Implementation. Vol 1. Rockville, MD: Agency for Healthcare Research and Quality; 2005.
- , , , et al. Structured interdisciplinary rounds in a medical teaching unit: improving patient safety. Arch Intern Med. 2011;171(7):678–684.
- , , , , , . Improving teamwork: impact of structured interdisciplinary rounds on a hospitalist unit. J Hosp Med. 2011;6(2):88–93.
- , , , et al. Impact of localizing physicians to hospital units on nurse‐physician communication and agreement on the plan of care. J Gen Intern Med. 2009;24(11):1223–1227.
- , , , et al. Reorganizing a hospital ward as an accountable care unit. J Hosp Med. 2015;10(1):36–40.
- , , , et al. 5th time's a charm: creation of unit‐based care teams in a high occupancy hospital [abstract]. J Hosp Med. 2015;10 (suppl. 2). Available at: http://www.shmabstracts.com/abstract/5th‐times‐a‐charm‐creation‐of‐unit‐based‐care‐teams‐in‐a‐high‐occupancy‐hospital. Accessed July 28, 2015.
- , , , . Comorbidity measures for use with administrative data. Med Care. 1998;36(1):8–27.
- , , , , , . Teamwork on inpatient medical units: assessing attitudes and barriers. Qual Saf Health Care. 2010;19(2):117–121.
- , , , et al. A model for quality improvement programs in academic departments of medicine. Am J Med. 2008;121(10):922–929.
- , , , , . Improving nurse‐physician communication and satisfaction in the intensive care unit with a daily goals worksheet. Am J Crit Care. 2006;15(2):217–222.
- , , , , , . Improving communication in the ICU using daily goals. J Crit Care. 2003;18(2):71–75.
- , , , et al. Effect of crew resource management training in a multidisciplinary obstetrical setting. Int J Qual Health Care. 2008;20(4):254–263.
- , , , et al. Error reduction and performance improvement in the emergency department through formal teamwork training: evaluation results of the MedTeams project. Health Serv Res. 2002;37(6):1553–1581.
- , , , et al. Effects of teamwork training on adverse outcomes and process of care in labor and delivery: a randomized controlled trial. Obstet Gynecol. 2007;109(1):48–55.
- , , , et al. Effects of interdisciplinary team care interventions on general medical wards: a systematic review. JAMA Intern Med. 2015;175(8):1288–1298.
- , , , et al. Patient risk factors for adverse drug events in hospitalized patients. ADE Prevention Study Group. Arch Intern Med. 1999;159(21):2553–2560.
- , , , et al. Effect of a pharmacist intervention on clinically important medication errors after hospital discharge: a randomized trial. Ann Intern Med. 2012;157(1):1–10.
- , , , . Use of a standardized protocol to decrease medication errors and adverse events related to sliding scale insulin. Qual Saf Health Care. 2006;15(2):89–91.
- , , , . Clinical pharmacists and inpatient medical care: a systematic review. Arch Intern Med. 2006;166(9):955–964.
- , , , , . Improved inpatient use of basal insulin, reduced hypoglycemia, and improved glycemic control: effect of structured subcutaneous insulin orders and an insulin management algorithm. J Hosp Med. 2009;4(1):3–15.
- , , , . Effects of a computerized order set on the inpatient management of hyperglycemia: a cluster‐randomized controlled trial. Endocr Pract. 2010;16(2):209–218.
- , , , . Effects of a subcutaneous insulin protocol, clinical education, and computerized order set on the quality of inpatient management of hyperglycemia: results of a clinical trial. J Hosp Med. 2009;4(1):16–27.

PCP Visits to Hospitalized Patients
Transitions in care are vulnerable periods. As patients are transferred between settings of care (such as from hospital back to the community), communication between healthcare providers is vital for care continuity.[1] A significant number of preventable adverse events may be related to ineffective communication between care providers.[1, 2, 3] The advent of specialized care, such as the introduction of hospitalists in acute care settings, has created an environment in which a patient's most responsible physician can often change multiple times as they move through the healthcare system.[4] Although there are many benefits to this type of concentrated care, the increase in care transitions may result in breakdowns in communication that may then be linked to risks in patient safety and suboptimal patient outcomes.[5, 6, 7, 8]
Improved continuity of care has been demonstrated to enhance patient safety during care transitions.[7] Efforts to develop continuity of care interventions are largely focused on care‐provider continuity, improved facilitation of communication, care planning, and increasing involvement of primary care physicians during follow‐up to hospitalizations and specialist visits.[9, 10] Such continuity of care efforts may provide a moderate benefit, but there remains room for improvement.[10, 11]
One dimension of continuity of care that has received limited attention is the potential impact of primary care physicians hospital visits to their hospitalized patients in a supportive‐care role.[12] In these situations, the primary care physician is neither the most responsible physician nor are they involved directly in their patient's hospital care. However, visiting their patient implies that they are aware of the hospitalization, thereby facilitating the potential for communication between care providers. Primary care physicians can also provide valuable contextual and relevant information as well as be involved in the discharge process. To identify the extent to which primary care physicians visit hospitalized patients and to measure the potential impact of primary care physician supportive visits on future outcomes, we used population‐level data to determine the frequency of supportive‐care visits by primary care physicians to hospitalized patients and to identify the association between these visits, patient outcomes, and health services utilization.
METHODS
Overview
We applied a retrospective cohort design utilizing linked population‐based administrative databases in the province of Ontario, Canada to examine outcome differences between patients who received a supportive‐care in‐hospital visit by their primary care physician compared to those who did not.
Databases
We assembled the cohort from linked and encrypted population‐based healthcare administrative databases. Data were derived from information on patients and physicians from the Ontario Health Insurance Plan, the Canadian Census, the Canadian Institute of Health Information Hospital Discharge Abstract Database, Registered Persons Databases, National Ambulatory Care Reporting System, Corporate Provider Database, Client Agency Program Enrolment, and Home Care Database. These databases have been validated and widely used in numerous studies.[13, 14, 15] All adults aged18 years who were discharged from the hospital in Ontario, Canada between January 1, 2008 and December 31, 2009 were included. Patients transferred to nursing homes or other acute care facilities following discharge, including rehabilitation centers, were excluded because they may have different readmission patterns. Among remaining hospitalized patients, only those with an identifiable primary care physician in the community were included. The patientprimary care physician pairings were identified using validated algorithms based on historical physician billing information.[16] This approach, adapted from previous studies, maximized the comparability among the study groups.[17, 18] In addition to having an historical relationship with the patients, primary care physicians had to have a history of conducting in‐hospital supportive visits (i.e., visits to at least 2 hospital patients within the previous year) for the patientprimary care physician pair to be included. This criterion was included to increase the likelihood that we were capturing a usual physician practice behavior and not a single circumstantial visit by a primary care physician. The history of supportive visits was also identified with physician billing data using a specific fee code.
Exposure
The exposure of interest was an in‐hospital visit in a supportive‐care role by the primary care physician during a patient's hospitalization and was obtained from physician fee codes. The fee paid for a visit during the study period was less than $20 CND.
Outcome Measures
Two different composite outcome measures were examined. The primary outcome was a composite of an emergent hospital readmission, death, or emergency department visit (without hospital admission). A composite measure was utilized to account for all outcomes simultaneously and thus be representative of the overall patient experience.[19] This approach has been applied in several studies examining continuity of care.[19, 20, 21] The secondary outcome examined processes of care. It was a composite evaluating ambulatory health services use postdischarge, specifically the number of primary care physician office visits and formal (ie, paid for by the universal provincial health plan) home‐care services. Home‐care services included both visits for nursing care as well as formal social support such as personal care. All outcome measures were assessed at 30 and 90 days following hospital discharge to assess for short and medium range outcomes.[22]
Patient Characteristics
Patient demographics including age, sex, low income (defined as individual income below $16,018 [CND] or couples income below $24,175 [CND]), living in a rural region, and the number of previous visits with primary care physicians were described from the available data. Readmission risk from the initial hospitalization was calculated based on the LACE score.[23] The LACE score is a validated measure of 30‐day readmission risk based on healthcare administrative data that account for (L) length of stay, (A) acute admission, (C) comorbid disease burden, and number of (E) emergency department visits in previous 6 months.[23] The LACE score ranges from 0 to 19, which correspond to a probability of readmissions of 2% to 43.7%, respectively. We considered individuals to have a high risk of readmission with a LACE score 10, which corresponds to a probability of readmission of 12.2%.[23]
Statistical Analyses
Descriptive statistics were used to compare patient characteristics among those with a primary care physician supportive‐care visit to those without. Logistic regression modeling was conducted to examine the impact of primary care physician visits on outcomes. The results reported here reflect the selection of adjusting for the confounders of age, sex, a history of primary care physician visits, low income, rurality, and the LACE score.
Ethics
The project analysis was conducted at the Institute for Clinical Evaluative Sciences (ICES) in Toronto, Ontario and was approved by the Sunnybrook Health Sciences Centre Research Ethics Board.
RESULTS
Overview
There were 11,316 primary care physicians identified as practicing in Ontario during the study period, of which 3236 had a history of conducting regular in‐hospital visits to 2 or more patients. The final patient cohort consisted of 164,059 hospitalized patients; 19,614 patients received a visit from their primary care physician, whereas 144,445 did not (Figure 1).

The hospitalized patients who received a visit from their primary care physician were significantly different than the patients who did not receive an in‐hospital visit (Table 1). Notably, patients who received a visit by their primary care physician had longer lengths of hospital stay (9.7 days vs 6.8 days, P<0.001). As well, a greater proportion had a high 30‐day readmission risk (LACE score10: 39.4% vs 29.9%, P<0.001) (Table 1).[21]
| Variablea | With PCP Visit (N=19,614) | Without PCP Visit (N=144,445) |
|---|---|---|
| ||
| Age, meanSD | 68.3716.85 | 65.7318.54 |
| Sex, no. of males | 9,393 (47.9%) | 67,030 (46.4%) |
| Low income | 3,937 (20.1%) | 30,157 (20.9%) |
| Individuals living in rural regions, no. | 1,951 (9.9%) | 25,731 (17.8%) |
| PCP visits in previous 6 months, meanSD | 4.764.47 | 4.174.28 |
| Length of stay, d, meanSD | 9.7217.40 | 6.7913.17 |
| Acute emergent visits, no. | 19,138 (97.6%) | 136,374 (94.4%) |
| Charlson score, meanSD | 1.061.60 | 0.921.49 |
| ED visits in previous 6 months, meanSD | 0.951.48 | 1.091.98 |
| LACE score, meanSDc | 9.022.88 | 8.103.02 |
| High risk for readmission (LACE score10), no. (%)c | 7,721 (39.4%) | 43,126 (29.9%) |
Patients who received an in‐hospital visit by their primary care physician were significantly different from those who did not (Table 2). They were older (68.4 years vs 65.7 years), and had a higher risk of readmission (LACE score of 9 vs 8). As well, proportionally fewer patients who received a visit were from rural regions than in the comparator group (9.9% of patients visited were from rural regions vs 17.8% of patients who did not receive a visit) (Table 2).
| Variable | Patients Who Received an In‐hospital Visit (N=19,614) | Patients Who Did Not Receive an In‐hospital Visit (N=144,445) | P Value |
|---|---|---|---|
| |||
| Primary outcome of emergency department visit, hospital readmission, or death | |||
| 30 days postdischarge, no. (%) | |||
| Readmission | 1,742 (8.9%) | 11,212 (7.8%) | <0.001 |
| ED visit | 2,039 (10.4%) | 16,823 (11.6%) | <0.001 |
| Death | 727 (3.7%) | 4,688 (3.2%) | <0.001 |
| Composite endpointa | 4,227 (21.6%) | 30,848 (21.4%) | 0.533 |
| 90 days postdischarge | |||
| Readmission | 2,791 (14.2%) | 18,257 (12.6%) | <0.001 |
| ED visit | 3,652 (18.6%) | 29,590 (20.5%) | <0.001 |
| Death | 1,507 (7.7%) | 9,821 (6.8%) | <0.001 |
| Composite endpointa | 7,125 (36.3%) | 52,245 (36.2%) | 0.668 |
| Secondary outcome of PCP office visits and home‐care services | |||
| 30 days postdischarge | |||
| Community PCP visits, meanSD | 3.85.1 | 3.14.6 | <0.001 |
| PCP visit, no. (%) | 15,732 (80.2%) | 108,266 (75%) | <0.001 |
| Home‐care services, no. (%) | 6,197 (31.6%) | 38,745 (26.8%) | <0.001 |
| Composite endpoint, no. (%)b | 16,851 (85.9%) | 117, 290 (81.2%) | <0.001 |
| 90 days postdischarge | |||
| Community PCP visits, meanSD | 8.210.1 | 6.99.3 | <0.001 |
| PCP visit, no. (%) | 18,112 (92.3%) | 128, 806 (89.2%) | <0.001 |
| Home‐care services, no. (%) | 7,256 (37.0%) | 45,675 (31.6%) | <0.001 |
| Composite endpoint, no. (%)b | 18, 504 (94.3%) | 132, 448 (91.7%) | <0.001 |
Individual Outcomes
Patients who received an in‐hospital visit by their primary care physician were also more likely to be readmitted within 30 days of discharge (8.9% vs 7.8%, P<0.001) and within 90 days of discharge (14.2% vs 12.6%, P<0.001). Additionally, patients who were visited by their primary care physician while hospitalized were more likely to die within 30 days postdischarge than those who did not receive an in‐hospital visit (3.7% vs 3.2%, P<0.001) and similarly by 90 days postdischarge (7.7% vs 6.8%, P<0.001) (Table 2).
Patients who received an in‐hospital visit were less likely to visit the emergency department at 30 days (10.4% vs 11.6%, P<0.001) and at 90 days (18.6% vs 20.5%, P<0.001) compared to patients who did not receive an in‐hospital visit (Table 2).
The patients who received in‐hospital visits by their primary care physician had a greater average number of primary care physician visits in the community at 30 days (3.8 vs 3.1, P<0.001) and 90 days (8.2 vs 6.9, P<0.001) (Table 2). Additionally, a higher proportion of patients who received an in‐hospital visit accessed home‐care services at 30 days postdischarge (31.6% vs 26.8%, P<0.001) and 90 days postdischarge (37.0% vs 31.6%, P<0.001) (Table 2).
Primary Outcome
There was no difference in proportion of patients who experienced the composite endpoint at 30 days (4227 [21.6%] vs 30,848 [21.4%], P>0.5) or 90 days (7125 [36.3%] vs 52,245 [36.2%], P>0.6) for patients who received an in‐hospital visit by their primary care physician compared to those who did not. The unadjusted model found no statistically significant difference between the 2 groups upon a primary care physician visit (odds ratio [OR]: 1.01; 95% confidence interval [CI]: 0.98‐1.04). However, once adjusting for differences in the groups for patient factors such as age, sex, location and health status, patients who received an in‐hospital visit by their primary care physician had lower adjusted risk for the composite outcome at 30 days postdischarge (adjusted OR [aOR]: 0.92; 95% CI: 0.89‐0.96) and 90 days postdischarge (aOR: 0.90; 95% CI: 0.87‐0.92) (Table 3). Estimates for each individual component of the composite outcome revealed significantly lower risk for ED visit and death but similar risk for readmission at both 30 days and 90 days after hospital discharge for patients who received and in‐hospital visit from their primary care physician and those who did not (Table 3).
| Variable | Unadjusted Odds Ratio (95% CI) | Adjusted Odds Ratio (95% CI)a |
|---|---|---|
| ||
| Primary outcome of emergency department visit, hospital readmission, or death | ||
| 30 days postdischarge | ||
| Readmission | 1.16 (1.10‐1.22) | 1.03 (0.97‐1.08) |
| ED visit | 0.88 (0.84‐0.92) | 0.88 (0.84‐0.92) |
| Death | 1.15 (1.06‐1.24) | 0.88 (0.81‐0.96) |
| Composite endpointb | 1.01 (0.98‐1.05) | 0.92 (0.89‐0.96) |
| 90 days postdischarge | ||
| Readmission | 1.15 (1.10‐1.20) | 1.00 (0.96‐1.04) |
| ED visit | 0.89 (0.86‐0.92) | 0.89 (0.86‐0.93) |
| Death | 1.14 (1.08‐1.21) | 0.87 (0.82‐0.93) |
| Composite endpointb | 1.01 (0.98‐1.04) | 0.90 (0.87‐0.92) |
| Secondary outcome of PCP office visits and home‐care services | ||
| 30 days postdischarge | ||
| Community PCP visits | 1.35 (1.31‐1.41) | 1.21 (1.16‐1.25) |
| Home‐care services | 1.26 (1.22‐1.30) | 1.05 (1.01‐1.09) |
| Composite endpointc | 1.41 (1.34‐1.47) | 1.16 (1.11‐1.21) |
| 90 days postdischarge | ||
| Community PCP visits | 1.46 (1.39‐1.55) | 1.25 (1.18‐1.33) |
| Home‐care services | 1.27 (1.23‐1.31) | 1.05 (1.01‐1.08) |
| Composite endpointc | 1.51 (1.42‐1.61) | 1.19 (1.12‐1.27) |
Secondary Outcome
Patients who received an in‐hospital visit by their primary care physician were more likely to experience the composite outcome of home‐care services and community primary care physician visits at 30 postdischarge (16,851 [85.9%] vs 117,290 [81.2%], P<0.001) and 90 days postdischarge (18,504 [94.3%] vs 132,448 [91.7%], P<0.001) compared to patients who did not receive an in‐hospital visit (Table 3). Once accounting for patient variables such as age, sex, location, and health status, patients who received an in‐hospital visit by their primary care physician had a higher adjusted risk for the composite outcome at 30 days postdischarge (aOR: 1.16; 95% CI: 1.11‐1.21) and 90 days postdischarge (aOR: 1.19; 95% CI: 1.12‐1.27) (Table 3).
DISCUSSION
Our population‐based study of primary care physicians is among the first to examine outcomes of patients whose primary care physicians have a history of providing supportive visits to hospitalized patients. After controlling for risk differences in patients at hospital discharge, we found that a primary care physician visit to a patient in the hospital was associated with a lower adjusted risk for the composite outcome of death, emergent hospital readmission, or emergency department visit at 30 and 90 days postdischarge compared to hospitalized patients who did not receive a visit by their primary care physician. We found this to be driven by patients having a lower risk of emergency department visits and death, whereas there was a similar risk of hospital readmission. We also found that visited patients were more likely to access home‐care services and have more primary care physician visits in the community following discharge.
The unadjusted model differs substantially from the adjusted model. On the surface this is an apparent paradox where the unadjusted results suggest an association with potential harm or no difference with a supportive visit. Conversely, the adjusted model suggests a reduction in harms. The differences between the unadjusted and adjusted model is driven by changes in the point estimates for readmission and death rates at both 30 and 90 day postdischarge. Prior to adjustment, it appears as if a primary care physician visit is associated with a significant increase of death; however, upon adjustment, it is associated with a significant reduction in death. Interestingly, this is a different effect than that observed with the secondary analysis, where the adjusted analyses demonstrate a more modest (but still positive) effect of supportive‐care visits. This observed change is likely due to differences in the patient groups. We can speculate that this may be an observed phenomenon of primary care physicians opting to visit their sicker patients, as perhaps it should be; however, further research is required to fully understand the real drivers of a supportive visit.
Our results are consistent with an earlier study that identified that a minority number of primary care physicians visit their hospitalized patients.[24] As well, findings from a randomized controlled trial of 364 patients over 60 years old identified a limited impact of primary care physician visits on patient outcomes but noted enhanced access to community health services.[12] Our work highlights the potential impact of primary care physician visits, which could, in theory, be leveraged and be an important role that primary care physicians can play in planning postdischarge care and improving the quality of care following hospitalization.
Our research study did not examine the impact of in‐hospital primary care physician visits on patient satisfaction directly. However, it has been demonstrated that patients have a strong desire for their primary care physician to be involved in their hospital care and their preference is for direct contact, with face‐to‐face visits compared to telephone or other communication.[25] This choice is important because dissatisfaction with services is associated with a loss of patient confidence in care quality and decreased adherence.[26] Also, primary care physicians acknowledge that information exchange is lacking when their patients are discharged, and that improving this aspect of a patient's care transition is important.[20] Research into discharge summaries as a tool to fill the communication gap has noted some success, yet there remains uncertainty regarding the type of information that should be included in a discharge summary, the time frame in which primary care physicians actually receive the summaries, and the accuracy of the information provided.[20, 27]
Our use of population‐based administrative data sources make the findings of our research generalizable to other similarly designed healthcare systems where a primary care physician may visit their hospitalized patients in a supportive‐care role. We were interested in a complex patientphysician interaction with a number of potential confounding factors, and our use of a composite measure represents the broad outcomes from this contact. Our cohort methodology was designed to isolate the exposure of interest while maximizing uniformity between the 2 study groups on other characteristics. Additionally a number of potential confounding factors were considered in an effort to isolate the effect of the primary care physician in‐hospital visit such as age, comorbid disease, and risk of hospital readmission.[12] The findings of our work support that of earlier research, but on a broader and more generalizable scale.[12]
There were notable differences between the intervention and control patient populations in the proportion of patients from rural regions who receive a supportive visit. This may be due to systemic differences between rural and nonrural regions with regard to access to care and ease of visit by primary care physicians. Alternatively, observed differences may be due to limitations of our study design in that some rural environments rely on primary care physicians to be involved in hospital care for the region. As such, they may actually be visiting their patients in a manner that was not captured as a supportive‐care visit. This is an important area that should be pursued in the future.
We acknowledge there are limits to our research findings. First, the nature of administrative data introduces challenges to causal inferences. As such, we are careful to describe associations and not draw causative links as there may be additional variables influencing outcomes including the patientphysician relationship, the location of the hospital relative to the physician practice and/or home, the time of the primary care physician visit, primary care physician hospital privileges for supportive‐care visits, and the number of other patients the primary care physician had in the same hospital at the same time. A second limitation is the use of the selected outcomes, which may not be direct measures of care quality.[28] However, the selected outcomes have been shown to be good quality measures in other work relevant to health policy.[8, 20, 21, 29] Third, the use of a composite outcome may over‐ or underestimate an exposure's impact.[19] Our composite outcome might have been dominated by some of its components. These observations may reflect the reality of primary care physicians visiting their sicker patients, or may be an attribute of the relatively short length of follow‐up of the study design. Fourth, we cannot determine whether there were additional interventions in place that assisted the continuity of care for primary care physician visits.[20, 27] However, this research included a broad range of hospitals throughout a large province where there were no system‐level quality interventions applied during this time. Fifth, our readmission rate may appear lower than other studies. However, our analysis is population based and not limited in focus to seniors.[30] As well, our posthospitalization death rates are similar to others, and the readmission rates are comparable to other Canadian studies.[31] Sixth, patients at higher risk for adverse outcomes may be identified as requiring more communication with their primary care physicians and we may not have fully captured this risk in our adjustment models, thereby underestimating the effect of exposure.[27] Further, primary care physicians may be involved in major medical decisions such as transitions to palliative care. A supportive‐care visit that facilitated these transitions and its ensuing outcomes may not have been included in our analysis. Seventh, our inherent assumption is that more care, such as posthospital primary care visits and home visits, denotes better care. This may not always be the case.[32] Eighth, physicians may find it difficult to visit their patient in the hospital, even when asked.[12] Finally, our findings are contingent on a system that supports primary care physicians being aware of their patients who become hospitalized. This is not only incumbent on any individual (eg, hospitalist) but a system where all providers work cohesively and seamlessly. On balance, however, these limitations do not overshadow our study's findings and conclusions.
Visits by primary care physicians to hospitalized patients are a longstanding tradition. The practice likely varies according to regional, patient, and individual physician characteristics.[16, 17, 18, 25] However, reimbursement codes for these services are present in a number of international healthcare systems' physician fee schedules with fairly modest remuneration amounts. The fairly nominal fee of less than $20 CND for a supportive‐care visit is similar to other systems and does not constitute a strong financial incentive to encourage this practice. The fee likely compensates the primary care physician for some of their time but comes with an opportunity cost to other aspects of their practice. Thus, results may differ in other environments or if the fee were higher, thereby incenting more primary care physicians to conduct visits. Indeed, the entire program for supportive hospital visits cost approximately $2.5 million CND per year for the 13 million people in the province of Ontario. Future work in this area could address the overall value and cost‐effectiveness of any potential fee changes. Still, it highlights the generalizability of our findings to other health systems and the ease in assessing the effect of the practice.
Overall, our findings underscore the importance and relevance for the practice of supportive‐care visits in its association with patient outcomes and health services utilization, which may prove to be an important key factor to improve quality healthcare. Our results suggest that an in‐hospital visit by a primary care physician may improve patient outcomes and increase subsequent support in the community. An in‐hospital supportive visit may be an additional method by which primary care physicians, and healthcare systems as a whole, strive to achieve the best care for patients.
Acknowledgements
Michael Manno, an analyst with the Institute of Clinical Evaluative Sciences (ICES) at the time of this study, assisted with the analyses.
Disclosures: This study was supported by the Institute for Clinical Evaluative Sciences (ICES), which is funded by an annual grant from the Ontario Ministry of Health and Long‐Term Care (MOHLTC). The opinions, results, and conclusions reported in this article are those of the authors and are independent from the funding sources. No endorsement by the ICES or the Ontario MOHLTC is intended or should be inferred. No researcher or persons involved in this study had any declared or otherwise known conflicts of interest. Stacey Brener received funding from a Canadian Institutes of Health Research (CIHR) Master's award in the area of primary care; the Ontario Graduate Student in Science and Technology award, an award from the CIHR Women's College Hospital Interdisciplinary Capacity Enhancement Team, and team grant OTG‐88591 from the CIHR. Susan Bronskill is supported by a CIHR New Investigator Award in the Area of Aging. Chaim Bell is supported by a CIHR/Canadian Patient Safety Institute Chair in Patient Safety and Continuity of Care. These funding agencies had no role in the design and conduct of the study; collection, management, analysis, or interpretation of the data; or preparation, review, or approval of the manuscript. The corresponding author had full access to all of the data in the study and takes responsibility for the integrity of the data and the accuracy of the data analysis. The authors report no conflicts of interest.
- , , , . Continuity of care and patient outcomes after hospital discharge. J Gen Intern Med. 2004;19(6):624–631.
- , , , et al. Incidence of adverse events and negligence in hospitalized patients: results of the Harvard Medical Practice Study I. 1991. Qual Saf Health Care. 2004;13(2):145–151; discussion 51–52.
- , , , , . The incidence and severity of adverse events affecting patients after discharge from the hospital. Ann Intern Med. 2003;138(3):161–167.
- The College of Family Physicians of Canada. Family physicians caring for hospital inpatients. Available at: http://www.cfpc.ca/uploadedFiles/Resources/Resource_Items/FPs20Inpt20Hosp20Care_En.pdf. Published October 2003. Accessed August 15, 2015.
- , , . Is volume related to outcome in health care?. A systematic review and methodologic critique of the literature. Ann Intern Med. 2002;137(6):511–520.
- , , , , , . Outcomes of care by hospitalists, general internists, and family physicians. N Engl J Med. 2007;357(25):2589–2600.
- , , , . Maintaining continuity of care: a look at the quality of communication between Ontario emergency departments and community physicians. CJEM. 2005;7(3):155–161.
- , , , et al. The independent association of provider and information continuity on outcomes after hospital discharge: implications for hospitalists. J Hosp Med. 2010;5(7):398–405.
- , , , , , . Patient‐reported care coordination: associations with primary care continuity and specialty care use. Ann Fam Med. 2011;9(4):323–329.
- , . The Wellness Planner: empowerment, quality of life, and continuity of care in mental illness. Arch Psychiatr Nurs. 2011;25(4):284–293.
- , , , et al. Evaluation of the impact of interdisciplinarity in cancer care. BMC Health Serv Res. 2011;11:144.
- , , , , . Can GP input into discharge planning result in better outcomes for the frail aged: results from a randomized controlled trial. Fam Pract. 1999;16(3):289–293.
- , , , et al. Association of ICU or hospital admission with unintentional discontinuation of medications for chronic diseases. JAMA. 2011;306(8):840–847.
- , , , , , . Potentially unintended discontinuation of long‐term medication use after elective surgical procedures. Arch Intern Med. 2006;166(22):2525–2531.
- , , , , , , . Canadian Institute for Health Information Discharge Abstract Database: A Validation Study. Toronto: Institute for Clinical Evaluative Sciences; 2006. Available at: http://www.ices.on.ca/Publications/Atlases‐and‐Reports/2006/Canadian‐Institute‐for‐Health‐Information. Accessed August 15, 2015.
- , , , . Primary care physician workforce and Medicare beneficiaries' health outcomes. JAMA. 2011;305(20):2096–2104.
- , , , . Assigning ambulatory patients and their physicians to hospitals: a method for obtaining population‐based provider performance measurements. Health Serv Res. 2007;42(1 pt 1):45–62.
- , , , , , . Administrative data algorithms can describe ambulatory physician utilization. Health Serv Res. 2007;42(4):1783–1796.
- , , , et al. Validity of composite end points in clinical trials. BMJ. 2005;330(7491):594–596.
- , , , , , . Deficits in communication and information transfer between hospital‐based and primary care physicians: implications for patient safety and continuity of care. JAMA. 2007;297(8):831–841.
- , , , , , . Predicting readmission to the psychiatric hospital in a managed care environment: implications for quality indicators. Am J Psychiatry. 1997;154(3):337–340.
- , . The validity of readmission rate as a marker of the quality of hospital care, and a recommendation for its definition. N Z Med J. 2009;122(1289):63–70.
- , , , et al. Derivation and validation of an index to predict early death or unplanned readmission after discharge from hospital to the community. CMAJ. 2010;182(6):551–557.
- , , , et al. Information exchange among physicians caring for the same patient in the community. CMAJ. 2008;179(10):1013–1018.
- . Supply of physicians' services in Ontario. Hosp Q. 1999;3(2):17.
- , , , , . Evaluation of outreach clinics held by specialists in general practice in England. J Epidemiol Community Health. 2000;54(2):149–156.
- , , , et al. Association of communication between hospital‐based physicians and primary care providers with patient outcomes. J Gen Intern Med. 2009;24(3):381–386.
- , , , et al. Relationship between hospital readmission and mortality rates for patients hospitalized with acute myocardial infarction, heart failure, or pneumonia. JAMA. 2013;309(6):587–593.
- , . A conceptual framework for the study of early readmission as an indicator of quality of care. Soc Sci Med. 1996;43(11):1533–1541.
- , , . Rehospitalizations among patients in the Medicare fee‐for‐service program. N Engl J Med. 2009;360(14):1418–1428.
- , , , et al. Effect of a postdischarge virtual ward on readmission or death for high‐risk patients: a randomized clinical trial. JAMA. 2014;312(13):1305–1312.
- , . Less is more: how less health care can result in better health. Arch Intern Med. 2010;170(9):749–750.
Transitions in care are vulnerable periods. As patients are transferred between settings of care (such as from hospital back to the community), communication between healthcare providers is vital for care continuity.[1] A significant number of preventable adverse events may be related to ineffective communication between care providers.[1, 2, 3] The advent of specialized care, such as the introduction of hospitalists in acute care settings, has created an environment in which a patient's most responsible physician can often change multiple times as they move through the healthcare system.[4] Although there are many benefits to this type of concentrated care, the increase in care transitions may result in breakdowns in communication that may then be linked to risks in patient safety and suboptimal patient outcomes.[5, 6, 7, 8]
Improved continuity of care has been demonstrated to enhance patient safety during care transitions.[7] Efforts to develop continuity of care interventions are largely focused on care‐provider continuity, improved facilitation of communication, care planning, and increasing involvement of primary care physicians during follow‐up to hospitalizations and specialist visits.[9, 10] Such continuity of care efforts may provide a moderate benefit, but there remains room for improvement.[10, 11]
One dimension of continuity of care that has received limited attention is the potential impact of primary care physicians hospital visits to their hospitalized patients in a supportive‐care role.[12] In these situations, the primary care physician is neither the most responsible physician nor are they involved directly in their patient's hospital care. However, visiting their patient implies that they are aware of the hospitalization, thereby facilitating the potential for communication between care providers. Primary care physicians can also provide valuable contextual and relevant information as well as be involved in the discharge process. To identify the extent to which primary care physicians visit hospitalized patients and to measure the potential impact of primary care physician supportive visits on future outcomes, we used population‐level data to determine the frequency of supportive‐care visits by primary care physicians to hospitalized patients and to identify the association between these visits, patient outcomes, and health services utilization.
METHODS
Overview
We applied a retrospective cohort design utilizing linked population‐based administrative databases in the province of Ontario, Canada to examine outcome differences between patients who received a supportive‐care in‐hospital visit by their primary care physician compared to those who did not.
Databases
We assembled the cohort from linked and encrypted population‐based healthcare administrative databases. Data were derived from information on patients and physicians from the Ontario Health Insurance Plan, the Canadian Census, the Canadian Institute of Health Information Hospital Discharge Abstract Database, Registered Persons Databases, National Ambulatory Care Reporting System, Corporate Provider Database, Client Agency Program Enrolment, and Home Care Database. These databases have been validated and widely used in numerous studies.[13, 14, 15] All adults aged18 years who were discharged from the hospital in Ontario, Canada between January 1, 2008 and December 31, 2009 were included. Patients transferred to nursing homes or other acute care facilities following discharge, including rehabilitation centers, were excluded because they may have different readmission patterns. Among remaining hospitalized patients, only those with an identifiable primary care physician in the community were included. The patientprimary care physician pairings were identified using validated algorithms based on historical physician billing information.[16] This approach, adapted from previous studies, maximized the comparability among the study groups.[17, 18] In addition to having an historical relationship with the patients, primary care physicians had to have a history of conducting in‐hospital supportive visits (i.e., visits to at least 2 hospital patients within the previous year) for the patientprimary care physician pair to be included. This criterion was included to increase the likelihood that we were capturing a usual physician practice behavior and not a single circumstantial visit by a primary care physician. The history of supportive visits was also identified with physician billing data using a specific fee code.
Exposure
The exposure of interest was an in‐hospital visit in a supportive‐care role by the primary care physician during a patient's hospitalization and was obtained from physician fee codes. The fee paid for a visit during the study period was less than $20 CND.
Outcome Measures
Two different composite outcome measures were examined. The primary outcome was a composite of an emergent hospital readmission, death, or emergency department visit (without hospital admission). A composite measure was utilized to account for all outcomes simultaneously and thus be representative of the overall patient experience.[19] This approach has been applied in several studies examining continuity of care.[19, 20, 21] The secondary outcome examined processes of care. It was a composite evaluating ambulatory health services use postdischarge, specifically the number of primary care physician office visits and formal (ie, paid for by the universal provincial health plan) home‐care services. Home‐care services included both visits for nursing care as well as formal social support such as personal care. All outcome measures were assessed at 30 and 90 days following hospital discharge to assess for short and medium range outcomes.[22]
Patient Characteristics
Patient demographics including age, sex, low income (defined as individual income below $16,018 [CND] or couples income below $24,175 [CND]), living in a rural region, and the number of previous visits with primary care physicians were described from the available data. Readmission risk from the initial hospitalization was calculated based on the LACE score.[23] The LACE score is a validated measure of 30‐day readmission risk based on healthcare administrative data that account for (L) length of stay, (A) acute admission, (C) comorbid disease burden, and number of (E) emergency department visits in previous 6 months.[23] The LACE score ranges from 0 to 19, which correspond to a probability of readmissions of 2% to 43.7%, respectively. We considered individuals to have a high risk of readmission with a LACE score 10, which corresponds to a probability of readmission of 12.2%.[23]
Statistical Analyses
Descriptive statistics were used to compare patient characteristics among those with a primary care physician supportive‐care visit to those without. Logistic regression modeling was conducted to examine the impact of primary care physician visits on outcomes. The results reported here reflect the selection of adjusting for the confounders of age, sex, a history of primary care physician visits, low income, rurality, and the LACE score.
Ethics
The project analysis was conducted at the Institute for Clinical Evaluative Sciences (ICES) in Toronto, Ontario and was approved by the Sunnybrook Health Sciences Centre Research Ethics Board.
RESULTS
Overview
There were 11,316 primary care physicians identified as practicing in Ontario during the study period, of which 3236 had a history of conducting regular in‐hospital visits to 2 or more patients. The final patient cohort consisted of 164,059 hospitalized patients; 19,614 patients received a visit from their primary care physician, whereas 144,445 did not (Figure 1).
The hospitalized patients who received a visit from their primary care physician were significantly different than the patients who did not receive an in‐hospital visit (Table 1). Notably, patients who received a visit by their primary care physician had longer lengths of hospital stay (9.7 days vs 6.8 days, P<0.001). As well, a greater proportion had a high 30‐day readmission risk (LACE score10: 39.4% vs 29.9%, P<0.001) (Table 1).[21]
| Variablea | With PCP Visit (N=19,614) | Without PCP Visit (N=144,445) |
|---|---|---|
| ||
| Age, meanSD | 68.3716.85 | 65.7318.54 |
| Sex, no. of males | 9,393 (47.9%) | 67,030 (46.4%) |
| Low income | 3,937 (20.1%) | 30,157 (20.9%) |
| Individuals living in rural regions, no. | 1,951 (9.9%) | 25,731 (17.8%) |
| PCP visits in previous 6 months, meanSD | 4.764.47 | 4.174.28 |
| Length of stay, d, meanSD | 9.7217.40 | 6.7913.17 |
| Acute emergent visits, no. | 19,138 (97.6%) | 136,374 (94.4%) |
| Charlson score, meanSD | 1.061.60 | 0.921.49 |
| ED visits in previous 6 months, meanSD | 0.951.48 | 1.091.98 |
| LACE score, meanSDc | 9.022.88 | 8.103.02 |
| High risk for readmission (LACE score10), no. (%)c | 7,721 (39.4%) | 43,126 (29.9%) |
Patients who received an in‐hospital visit by their primary care physician were significantly different from those who did not (Table 2). They were older (68.4 years vs 65.7 years), and had a higher risk of readmission (LACE score of 9 vs 8). As well, proportionally fewer patients who received a visit were from rural regions than in the comparator group (9.9% of patients visited were from rural regions vs 17.8% of patients who did not receive a visit) (Table 2).
| Variable | Patients Who Received an In‐hospital Visit (N=19,614) | Patients Who Did Not Receive an In‐hospital Visit (N=144,445) | P Value |
|---|---|---|---|
| |||
| Primary outcome of emergency department visit, hospital readmission, or death | |||
| 30 days postdischarge, no. (%) | |||
| Readmission | 1,742 (8.9%) | 11,212 (7.8%) | <0.001 |
| ED visit | 2,039 (10.4%) | 16,823 (11.6%) | <0.001 |
| Death | 727 (3.7%) | 4,688 (3.2%) | <0.001 |
| Composite endpointa | 4,227 (21.6%) | 30,848 (21.4%) | 0.533 |
| 90 days postdischarge | |||
| Readmission | 2,791 (14.2%) | 18,257 (12.6%) | <0.001 |
| ED visit | 3,652 (18.6%) | 29,590 (20.5%) | <0.001 |
| Death | 1,507 (7.7%) | 9,821 (6.8%) | <0.001 |
| Composite endpointa | 7,125 (36.3%) | 52,245 (36.2%) | 0.668 |
| Secondary outcome of PCP office visits and home‐care services | |||
| 30 days postdischarge | |||
| Community PCP visits, meanSD | 3.85.1 | 3.14.6 | <0.001 |
| PCP visit, no. (%) | 15,732 (80.2%) | 108,266 (75%) | <0.001 |
| Home‐care services, no. (%) | 6,197 (31.6%) | 38,745 (26.8%) | <0.001 |
| Composite endpoint, no. (%)b | 16,851 (85.9%) | 117, 290 (81.2%) | <0.001 |
| 90 days postdischarge | |||
| Community PCP visits, meanSD | 8.210.1 | 6.99.3 | <0.001 |
| PCP visit, no. (%) | 18,112 (92.3%) | 128, 806 (89.2%) | <0.001 |
| Home‐care services, no. (%) | 7,256 (37.0%) | 45,675 (31.6%) | <0.001 |
| Composite endpoint, no. (%)b | 18, 504 (94.3%) | 132, 448 (91.7%) | <0.001 |
Individual Outcomes
Patients who received an in‐hospital visit by their primary care physician were also more likely to be readmitted within 30 days of discharge (8.9% vs 7.8%, P<0.001) and within 90 days of discharge (14.2% vs 12.6%, P<0.001). Additionally, patients who were visited by their primary care physician while hospitalized were more likely to die within 30 days postdischarge than those who did not receive an in‐hospital visit (3.7% vs 3.2%, P<0.001) and similarly by 90 days postdischarge (7.7% vs 6.8%, P<0.001) (Table 2).
Patients who received an in‐hospital visit were less likely to visit the emergency department at 30 days (10.4% vs 11.6%, P<0.001) and at 90 days (18.6% vs 20.5%, P<0.001) compared to patients who did not receive an in‐hospital visit (Table 2).
The patients who received in‐hospital visits by their primary care physician had a greater average number of primary care physician visits in the community at 30 days (3.8 vs 3.1, P<0.001) and 90 days (8.2 vs 6.9, P<0.001) (Table 2). Additionally, a higher proportion of patients who received an in‐hospital visit accessed home‐care services at 30 days postdischarge (31.6% vs 26.8%, P<0.001) and 90 days postdischarge (37.0% vs 31.6%, P<0.001) (Table 2).
Primary Outcome
There was no difference in proportion of patients who experienced the composite endpoint at 30 days (4227 [21.6%] vs 30,848 [21.4%], P>0.5) or 90 days (7125 [36.3%] vs 52,245 [36.2%], P>0.6) for patients who received an in‐hospital visit by their primary care physician compared to those who did not. The unadjusted model found no statistically significant difference between the 2 groups upon a primary care physician visit (odds ratio [OR]: 1.01; 95% confidence interval [CI]: 0.98‐1.04). However, once adjusting for differences in the groups for patient factors such as age, sex, location and health status, patients who received an in‐hospital visit by their primary care physician had lower adjusted risk for the composite outcome at 30 days postdischarge (adjusted OR [aOR]: 0.92; 95% CI: 0.89‐0.96) and 90 days postdischarge (aOR: 0.90; 95% CI: 0.87‐0.92) (Table 3). Estimates for each individual component of the composite outcome revealed significantly lower risk for ED visit and death but similar risk for readmission at both 30 days and 90 days after hospital discharge for patients who received and in‐hospital visit from their primary care physician and those who did not (Table 3).
| Variable | Unadjusted Odds Ratio (95% CI) | Adjusted Odds Ratio (95% CI)a |
|---|---|---|
| ||
| Primary outcome of emergency department visit, hospital readmission, or death | ||
| 30 days postdischarge | ||
| Readmission | 1.16 (1.10‐1.22) | 1.03 (0.97‐1.08) |
| ED visit | 0.88 (0.84‐0.92) | 0.88 (0.84‐0.92) |
| Death | 1.15 (1.06‐1.24) | 0.88 (0.81‐0.96) |
| Composite endpointb | 1.01 (0.98‐1.05) | 0.92 (0.89‐0.96) |
| 90 days postdischarge | ||
| Readmission | 1.15 (1.10‐1.20) | 1.00 (0.96‐1.04) |
| ED visit | 0.89 (0.86‐0.92) | 0.89 (0.86‐0.93) |
| Death | 1.14 (1.08‐1.21) | 0.87 (0.82‐0.93) |
| Composite endpointb | 1.01 (0.98‐1.04) | 0.90 (0.87‐0.92) |
| Secondary outcome of PCP office visits and home‐care services | ||
| 30 days postdischarge | ||
| Community PCP visits | 1.35 (1.31‐1.41) | 1.21 (1.16‐1.25) |
| Home‐care services | 1.26 (1.22‐1.30) | 1.05 (1.01‐1.09) |
| Composite endpointc | 1.41 (1.34‐1.47) | 1.16 (1.11‐1.21) |
| 90 days postdischarge | ||
| Community PCP visits | 1.46 (1.39‐1.55) | 1.25 (1.18‐1.33) |
| Home‐care services | 1.27 (1.23‐1.31) | 1.05 (1.01‐1.08) |
| Composite endpointc | 1.51 (1.42‐1.61) | 1.19 (1.12‐1.27) |
Secondary Outcome
Patients who received an in‐hospital visit by their primary care physician were more likely to experience the composite outcome of home‐care services and community primary care physician visits at 30 postdischarge (16,851 [85.9%] vs 117,290 [81.2%], P<0.001) and 90 days postdischarge (18,504 [94.3%] vs 132,448 [91.7%], P<0.001) compared to patients who did not receive an in‐hospital visit (Table 3). Once accounting for patient variables such as age, sex, location, and health status, patients who received an in‐hospital visit by their primary care physician had a higher adjusted risk for the composite outcome at 30 days postdischarge (aOR: 1.16; 95% CI: 1.11‐1.21) and 90 days postdischarge (aOR: 1.19; 95% CI: 1.12‐1.27) (Table 3).
DISCUSSION
Our population‐based study of primary care physicians is among the first to examine outcomes of patients whose primary care physicians have a history of providing supportive visits to hospitalized patients. After controlling for risk differences in patients at hospital discharge, we found that a primary care physician visit to a patient in the hospital was associated with a lower adjusted risk for the composite outcome of death, emergent hospital readmission, or emergency department visit at 30 and 90 days postdischarge compared to hospitalized patients who did not receive a visit by their primary care physician. We found this to be driven by patients having a lower risk of emergency department visits and death, whereas there was a similar risk of hospital readmission. We also found that visited patients were more likely to access home‐care services and have more primary care physician visits in the community following discharge.
The unadjusted model differs substantially from the adjusted model. On the surface this is an apparent paradox where the unadjusted results suggest an association with potential harm or no difference with a supportive visit. Conversely, the adjusted model suggests a reduction in harms. The differences between the unadjusted and adjusted model is driven by changes in the point estimates for readmission and death rates at both 30 and 90 day postdischarge. Prior to adjustment, it appears as if a primary care physician visit is associated with a significant increase of death; however, upon adjustment, it is associated with a significant reduction in death. Interestingly, this is a different effect than that observed with the secondary analysis, where the adjusted analyses demonstrate a more modest (but still positive) effect of supportive‐care visits. This observed change is likely due to differences in the patient groups. We can speculate that this may be an observed phenomenon of primary care physicians opting to visit their sicker patients, as perhaps it should be; however, further research is required to fully understand the real drivers of a supportive visit.
Our results are consistent with an earlier study that identified that a minority number of primary care physicians visit their hospitalized patients.[24] As well, findings from a randomized controlled trial of 364 patients over 60 years old identified a limited impact of primary care physician visits on patient outcomes but noted enhanced access to community health services.[12] Our work highlights the potential impact of primary care physician visits, which could, in theory, be leveraged and be an important role that primary care physicians can play in planning postdischarge care and improving the quality of care following hospitalization.
Our research study did not examine the impact of in‐hospital primary care physician visits on patient satisfaction directly. However, it has been demonstrated that patients have a strong desire for their primary care physician to be involved in their hospital care and their preference is for direct contact, with face‐to‐face visits compared to telephone or other communication.[25] This choice is important because dissatisfaction with services is associated with a loss of patient confidence in care quality and decreased adherence.[26] Also, primary care physicians acknowledge that information exchange is lacking when their patients are discharged, and that improving this aspect of a patient's care transition is important.[20] Research into discharge summaries as a tool to fill the communication gap has noted some success, yet there remains uncertainty regarding the type of information that should be included in a discharge summary, the time frame in which primary care physicians actually receive the summaries, and the accuracy of the information provided.[20, 27]
Our use of population‐based administrative data sources make the findings of our research generalizable to other similarly designed healthcare systems where a primary care physician may visit their hospitalized patients in a supportive‐care role. We were interested in a complex patientphysician interaction with a number of potential confounding factors, and our use of a composite measure represents the broad outcomes from this contact. Our cohort methodology was designed to isolate the exposure of interest while maximizing uniformity between the 2 study groups on other characteristics. Additionally a number of potential confounding factors were considered in an effort to isolate the effect of the primary care physician in‐hospital visit such as age, comorbid disease, and risk of hospital readmission.[12] The findings of our work support that of earlier research, but on a broader and more generalizable scale.[12]
There were notable differences between the intervention and control patient populations in the proportion of patients from rural regions who receive a supportive visit. This may be due to systemic differences between rural and nonrural regions with regard to access to care and ease of visit by primary care physicians. Alternatively, observed differences may be due to limitations of our study design in that some rural environments rely on primary care physicians to be involved in hospital care for the region. As such, they may actually be visiting their patients in a manner that was not captured as a supportive‐care visit. This is an important area that should be pursued in the future.
We acknowledge there are limits to our research findings. First, the nature of administrative data introduces challenges to causal inferences. As such, we are careful to describe associations and not draw causative links as there may be additional variables influencing outcomes including the patientphysician relationship, the location of the hospital relative to the physician practice and/or home, the time of the primary care physician visit, primary care physician hospital privileges for supportive‐care visits, and the number of other patients the primary care physician had in the same hospital at the same time. A second limitation is the use of the selected outcomes, which may not be direct measures of care quality.[28] However, the selected outcomes have been shown to be good quality measures in other work relevant to health policy.[8, 20, 21, 29] Third, the use of a composite outcome may over‐ or underestimate an exposure's impact.[19] Our composite outcome might have been dominated by some of its components. These observations may reflect the reality of primary care physicians visiting their sicker patients, or may be an attribute of the relatively short length of follow‐up of the study design. Fourth, we cannot determine whether there were additional interventions in place that assisted the continuity of care for primary care physician visits.[20, 27] However, this research included a broad range of hospitals throughout a large province where there were no system‐level quality interventions applied during this time. Fifth, our readmission rate may appear lower than other studies. However, our analysis is population based and not limited in focus to seniors.[30] As well, our posthospitalization death rates are similar to others, and the readmission rates are comparable to other Canadian studies.[31] Sixth, patients at higher risk for adverse outcomes may be identified as requiring more communication with their primary care physicians and we may not have fully captured this risk in our adjustment models, thereby underestimating the effect of exposure.[27] Further, primary care physicians may be involved in major medical decisions such as transitions to palliative care. A supportive‐care visit that facilitated these transitions and its ensuing outcomes may not have been included in our analysis. Seventh, our inherent assumption is that more care, such as posthospital primary care visits and home visits, denotes better care. This may not always be the case.[32] Eighth, physicians may find it difficult to visit their patient in the hospital, even when asked.[12] Finally, our findings are contingent on a system that supports primary care physicians being aware of their patients who become hospitalized. This is not only incumbent on any individual (eg, hospitalist) but a system where all providers work cohesively and seamlessly. On balance, however, these limitations do not overshadow our study's findings and conclusions.
Visits by primary care physicians to hospitalized patients are a longstanding tradition. The practice likely varies according to regional, patient, and individual physician characteristics.[16, 17, 18, 25] However, reimbursement codes for these services are present in a number of international healthcare systems' physician fee schedules with fairly modest remuneration amounts. The fairly nominal fee of less than $20 CND for a supportive‐care visit is similar to other systems and does not constitute a strong financial incentive to encourage this practice. The fee likely compensates the primary care physician for some of their time but comes with an opportunity cost to other aspects of their practice. Thus, results may differ in other environments or if the fee were higher, thereby incenting more primary care physicians to conduct visits. Indeed, the entire program for supportive hospital visits cost approximately $2.5 million CND per year for the 13 million people in the province of Ontario. Future work in this area could address the overall value and cost‐effectiveness of any potential fee changes. Still, it highlights the generalizability of our findings to other health systems and the ease in assessing the effect of the practice.
Overall, our findings underscore the importance and relevance for the practice of supportive‐care visits in its association with patient outcomes and health services utilization, which may prove to be an important key factor to improve quality healthcare. Our results suggest that an in‐hospital visit by a primary care physician may improve patient outcomes and increase subsequent support in the community. An in‐hospital supportive visit may be an additional method by which primary care physicians, and healthcare systems as a whole, strive to achieve the best care for patients.
Acknowledgements
Michael Manno, an analyst with the Institute of Clinical Evaluative Sciences (ICES) at the time of this study, assisted with the analyses.
Disclosures: This study was supported by the Institute for Clinical Evaluative Sciences (ICES), which is funded by an annual grant from the Ontario Ministry of Health and Long‐Term Care (MOHLTC). The opinions, results, and conclusions reported in this article are those of the authors and are independent from the funding sources. No endorsement by the ICES or the Ontario MOHLTC is intended or should be inferred. No researcher or persons involved in this study had any declared or otherwise known conflicts of interest. Stacey Brener received funding from a Canadian Institutes of Health Research (CIHR) Master's award in the area of primary care; the Ontario Graduate Student in Science and Technology award, an award from the CIHR Women's College Hospital Interdisciplinary Capacity Enhancement Team, and team grant OTG‐88591 from the CIHR. Susan Bronskill is supported by a CIHR New Investigator Award in the Area of Aging. Chaim Bell is supported by a CIHR/Canadian Patient Safety Institute Chair in Patient Safety and Continuity of Care. These funding agencies had no role in the design and conduct of the study; collection, management, analysis, or interpretation of the data; or preparation, review, or approval of the manuscript. The corresponding author had full access to all of the data in the study and takes responsibility for the integrity of the data and the accuracy of the data analysis. The authors report no conflicts of interest.
- , , , . Continuity of care and patient outcomes after hospital discharge. J Gen Intern Med. 2004;19(6):624–631.
- , , , et al. Incidence of adverse events and negligence in hospitalized patients: results of the Harvard Medical Practice Study I. 1991. Qual Saf Health Care. 2004;13(2):145–151; discussion 51–52.
- , , , , . The incidence and severity of adverse events affecting patients after discharge from the hospital. Ann Intern Med. 2003;138(3):161–167.
- The College of Family Physicians of Canada. Family physicians caring for hospital inpatients. Available at: http://www.cfpc.ca/uploadedFiles/Resources/Resource_Items/FPs20Inpt20Hosp20Care_En.pdf. Published October 2003. Accessed August 15, 2015.
- , , . Is volume related to outcome in health care?. A systematic review and methodologic critique of the literature. Ann Intern Med. 2002;137(6):511–520.
- , , , , , . Outcomes of care by hospitalists, general internists, and family physicians. N Engl J Med. 2007;357(25):2589–2600.
- , , , . Maintaining continuity of care: a look at the quality of communication between Ontario emergency departments and community physicians. CJEM. 2005;7(3):155–161.
- , , , et al. The independent association of provider and information continuity on outcomes after hospital discharge: implications for hospitalists. J Hosp Med. 2010;5(7):398–405.
- , , , , , . Patient‐reported care coordination: associations with primary care continuity and specialty care use. Ann Fam Med. 2011;9(4):323–329.
- , . The Wellness Planner: empowerment, quality of life, and continuity of care in mental illness. Arch Psychiatr Nurs. 2011;25(4):284–293.
- , , , et al. Evaluation of the impact of interdisciplinarity in cancer care. BMC Health Serv Res. 2011;11:144.
- , , , , . Can GP input into discharge planning result in better outcomes for the frail aged: results from a randomized controlled trial. Fam Pract. 1999;16(3):289–293.
- , , , et al. Association of ICU or hospital admission with unintentional discontinuation of medications for chronic diseases. JAMA. 2011;306(8):840–847.
- , , , , , . Potentially unintended discontinuation of long‐term medication use after elective surgical procedures. Arch Intern Med. 2006;166(22):2525–2531.
- , , , , , , . Canadian Institute for Health Information Discharge Abstract Database: A Validation Study. Toronto: Institute for Clinical Evaluative Sciences; 2006. Available at: http://www.ices.on.ca/Publications/Atlases‐and‐Reports/2006/Canadian‐Institute‐for‐Health‐Information. Accessed August 15, 2015.
- , , , . Primary care physician workforce and Medicare beneficiaries' health outcomes. JAMA. 2011;305(20):2096–2104.
- , , , . Assigning ambulatory patients and their physicians to hospitals: a method for obtaining population‐based provider performance measurements. Health Serv Res. 2007;42(1 pt 1):45–62.
- , , , , , . Administrative data algorithms can describe ambulatory physician utilization. Health Serv Res. 2007;42(4):1783–1796.
- , , , et al. Validity of composite end points in clinical trials. BMJ. 2005;330(7491):594–596.
- , , , , , . Deficits in communication and information transfer between hospital‐based and primary care physicians: implications for patient safety and continuity of care. JAMA. 2007;297(8):831–841.
- , , , , , . Predicting readmission to the psychiatric hospital in a managed care environment: implications for quality indicators. Am J Psychiatry. 1997;154(3):337–340.
- , . The validity of readmission rate as a marker of the quality of hospital care, and a recommendation for its definition. N Z Med J. 2009;122(1289):63–70.
- , , , et al. Derivation and validation of an index to predict early death or unplanned readmission after discharge from hospital to the community. CMAJ. 2010;182(6):551–557.
- , , , et al. Information exchange among physicians caring for the same patient in the community. CMAJ. 2008;179(10):1013–1018.
- . Supply of physicians' services in Ontario. Hosp Q. 1999;3(2):17.
- , , , , . Evaluation of outreach clinics held by specialists in general practice in England. J Epidemiol Community Health. 2000;54(2):149–156.
- , , , et al. Association of communication between hospital‐based physicians and primary care providers with patient outcomes. J Gen Intern Med. 2009;24(3):381–386.
- , , , et al. Relationship between hospital readmission and mortality rates for patients hospitalized with acute myocardial infarction, heart failure, or pneumonia. JAMA. 2013;309(6):587–593.
- , . A conceptual framework for the study of early readmission as an indicator of quality of care. Soc Sci Med. 1996;43(11):1533–1541.
- , , . Rehospitalizations among patients in the Medicare fee‐for‐service program. N Engl J Med. 2009;360(14):1418–1428.
- , , , et al. Effect of a postdischarge virtual ward on readmission or death for high‐risk patients: a randomized clinical trial. JAMA. 2014;312(13):1305–1312.
- , . Less is more: how less health care can result in better health. Arch Intern Med. 2010;170(9):749–750.
© 2016 Society of Hospital Medicine
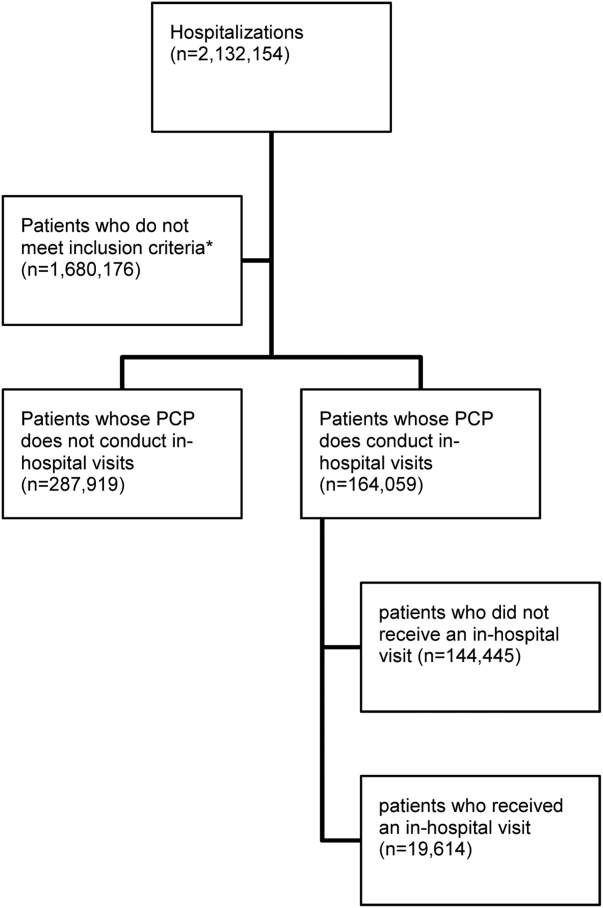
Discharge Summaries and Readmissions
Across the continuum of care, the discharge summary is a critical tool for communication among care providers.[1] In the United States, the Joint Commission policies mandate that all hospital providers complete a discharge summary for patients with specific components to foster effective communication with future providers.[2] Because outpatient providers and emergency physicians rely on clinical information in the discharge summary to ensure appropriate postdischarge continuity of care, timely documentation is potentially an essential aspect of readmission reduction initiatives.[3, 4, 5] Prior reports indicate that poor discharge documentation of follow‐up plan‐of‐care increases the risk of hospitalization, whereas structured instructions, patient education, and direct communications with primary care physicians (PCPs) reduce repeat hospital visits.[6, 7, 8, 9] However, the current literature is limited in its narrow focus on the contents of discharge summaries, considered only same‐hospital readmissions, or considered readmissions within 3 months of discharge.[10, 11, 12, 13] Moreover, some prior research has suggested no association between discharge summary timeliness with readmission,[12, 13, 14] whereas another study did find a relationship,[15] hence the need to study this further is important. Filling this gap in knowledge could provide an avenue to track and improve quality of patient care, as delays in discharge summaries have been linked with pot‐discharge adverse outcomes and patient safety concerns.[15, 16, 17, 18] Because readmissions often occur soon after discharge, having timely discharge summaries may be particularly important to outcomes.[19, 20]
This research began under the framework of evaluating a bundle of care coordination strategies that were implemented at the Johns Hopkins Health System. These strategies were informed by the early Centers for Medicare and Medicaid Services (CMS) demonstration projects and other best practices that have been documented in the literature to improve utilization and improve communication during transitions of care.[21, 22, 23, 24, 25] Later they were augmented through a contract with the Center of Medicare and Medicaid Innovation to improve access to healthcare services and improve patient outcomes through improved care coordination processes. One of the domains our institution has increased efforts to improve is in provider handoffs. Toward that goal, we have worked to disentangle the effects of different factors of provider‐to‐provider communication that may influence readmissions.[26] For example, effective written provider handoffs in the form of accurate and timely discharge summaries was considered a key care coordination component of this program, but there was institutional resistance to endorsing an expectation that discharge summary turnaround should be shortened. To build a case for this concept, we sought to test the hypothesis that, at our hospital, longer time to complete hospital discharge summaries was associated with increased readmission rates. Unique to this analysis is that, in the state of Maryland, there is statewide reporting of readmissions, so we were able to account for intra‐ and interhospital readmissions for an all‐payer population. The authors anticipated that findings from this study would help inform discharge quality‐improvement initiatives and reemphasize the importance of timely discharge documentation across all disciplines as part of quality patient care.
METHODS
Study Population and Setting
We conducted a single‐center, retrospective cohort study of 87,994 consecutive patients discharged from Johns Hopkins Hospital, which is a 1000‐bed, tertiary academic medical center in Baltimore, Maryland between January 1, 2013 and December 31, 2014. One thousand ninety‐three (1.2%) of the records on days to complete the discharge summary were missing and were excluded from the analysis.
Data Source and Covariates
Data were derived from several sources. The Johns Hopkins Hospital data mart financial database, used for mandatory reporting to the State of Maryland, provided the following patient data: age, gender, race/ethnicity, payer (Medicare, Medicaid, and other) as a proxy for socioeconomic status,[27] hospital service prior to discharge (gynecologyobstetrics, medicine, neurosciences, oncology, pediatrics, and surgical sciences), hospital length of stay (LOS) prior to discharge, Agency for Healthcare Research and Quality (AHRQ) Comorbidity Index (which is an update to the original Elixhauser methodology[28]), and all‐payerrefined diagnosis‐related group (APRDRG) and severity of illness (SOI) combinations (a tool to group patients into clinically comparable disease and SOI categories expected to use similar resources and experience similar outcomes). The Health Services Cost Review Commission (HSCRC) in Maryland provided the observed readmission rate in Maryland for each APRDRG‐SOI combination and served as an expected readmission rate. This risk stratification methodology is similar to the approach used in previous studies.[26, 29] Discharge summary turnaround time was obtained from institutional administrative databases used to track compliance with discharge summary completion. Discharge location (home, facility, home with homecare or hospice, or other) was obtained from Curaspan databases (Curaspan Health Group, Inc., Newton, MA).
Primary Outcome: 30‐Day Readmission
The primary outcome was unplanned rehospitalizations to an acute care hospital in Maryland within 30 days of discharge from Johns Hopkins Hospital. This was as defined by the Maryland HSCRC using an algorithm to exclude readmissions that were likely to be scheduled, as defined by the index admission diagnosis and readmission diagnosis; this algorithm is updated based on the CMS all‐cause readmission algorithm.[30, 31]
Primary Exposure: Days to Complete the Discharge Summary
Discharge summary completion time was defined as the date when the discharge attending physician electronically signs the discharge summary. At our institution, an auto‐fax system sends documents (eg, discharge summaries, clinic notes) to linked providers (eg, primary care providers) shortly after midnight from the day the document is signed by an attending physician. During the period of the project, the policy for discharge summaries at the Johns Hopkins Hospital went from requiring them to be completed within 30 days to 14 days, and we were hoping to use our analyses to inform decision makers why this was important. To emphasize the need for timely completion of discharge summaries, we dichotomized the number of days to complete the discharge summary into >3 versus 3 days (20th percentile cutoff) and modeled it as a continuous variable (per 3‐day increase in days to complete the discharge summary).
Statistical Analysis
To evaluate differences in patient characteristics by readmission status, analysis of variance and 2 tests were used for continuous and dichotomous variables, respectively. Logistic regression was used to evaluate the association between days to complete the discharge summary >3 days and readmission status, adjusting for potentially confounding variables. Before inclusion in the logistic regression model, we confirmed a lack of multicollinearity in the multivariable regression model using variance inflation factors. We evaluated residual versus predicted value plots and residual versus fitted value plots with a locally weighted scatterplot smoothing line. In a sensitivity analysis we evaluated the association between readmission status and different cutoffs (>8 days, 50th percentile; and >14 days, 70% percentile). In a separate analysis, we used interaction terms to test whether the association between the association between days to complete the discharge summary >3 days and hospital readmission varied by the covariates in the analysis (age, sex, race, payer, hospital service, discharge location, LOS, APRDRG‐SOI expected readmission rate, and AHRQ Comorbidity Index). We observed a significant interaction between 30‐day readmission and days to complete the discharge summary >3 days by hospital service. Hence, we separately calculated the adjusted mean readmission rates separately for each hospital service using the least squared means method for the multivariable logistic regression analysis and adjusting for the previously mentioned covariates. In a separate analysis, we used linear regression to evaluate the association between LOS and days to complete the discharge summary, adjusting for potentially confounding variables. Statistical significance was defined as a 2‐sided P < 0.05. Data were analyzed with R (version 2.15.0; R Foundation for Statistical Computing, Vienna, Austria;
RESULTS
Readmitted Patients
In the study period, 14,248 out of 87,994 (16.2%) consecutive eligible patients were readmitted to a hospital in Maryland from patients discharged from Johns Hopkins Hospital between January 1, 2013 and December 31, 2014. A total of 11,027 (77.4%) of the readmissions were back to Johns Hopkins Hospital. Table 1 compares characteristics of readmitted versus nonreadmitted patients, with the following variables being significantly different between these patient groups: age, gender, healthcare payer, hospital service, discharge location, length of stay expected readmission rate, AHRQ Comorbidity Index, and days to complete inpatient discharge summary.
| Characteristics | All Patients, N = 87,994 | Not Readmitted, N = 73,746 | Readmitted, N = 14,248 | P Value |
|---|---|---|---|---|
| ||||
| Age, y | 42.1 (25.1) | 41.3 (25.4) | 46.4 (23.1) | <0.001 |
| Male | 43,210 (49.1%) | 35,851 (48.6%) | 7,359 (51.6%) | <0.001 |
| Race | <0.001 | |||
| Caucasian | 45,705 (51.9%) | 3,8661 (52.4%) | 7,044 (49.4%) | |
| African American | 32,777 (37.2%) | 2,6841 (36.4%) | 5,936 (41.7%) | |
| Other | 9,512 (10.8%) | 8,244 (11.2%) | 1,268 (8.9%) | |
| Payer | <0.001 | |||
| Medicare | 22,345 (25.4%) | 17,614 (23.9%) | 4,731 (33.2%) | |
| Medicaid | 24,080 (27.4%) | 20,100 (27.3%) | 3,980 (27.9%) | |
| Other | 41,569 (47.2%) | 36,032 (48.9%) | 5,537 (38.9%) | |
| Hospital service | <0.001 | |||
| Gynecologyobstetrics | 9,299 (10.6%) | 8,829 (12.0%) | 470 (3.3%) | |
| Medicine | 26,036 (29.6%) | 20,069 (27.2%) | 5,967 (41.9%) | |
| Neurosciences | 8,269 (9.4%) | 7,331 (9.9%) | 938 (6.6%) | |
| Oncology | 5,222 (5.9%) | 3,898 (5.3%) | 1,324 (9.3%) | |
| Pediatrics | 17,029 (19.4%) | 14,684 (19.9%) | 2,345 (16.5%) | |
| Surgical sciences | 22,139 (25.2%) | 18,935 (25.7%) | 3,204 (22.5%) | |
| Discharge location | <0.001 | |||
| Home | 65,478 (74.4%) | 56,359 (76.4%) | 9,119 (64.0%) | |
| Home with homecare or hospice | 9,524 (10.8%) | 7,440 (10.1%) | 2,084 (14.6%) | |
| Facility (SNF, rehabilitation facility) | 5,398 (6.1%) | 4,131 (5.6%) | 1,267 (8.9%) | |
| Other | 7,594 (8.6%) | 5,816 (7.9%) | 1,778 (12.5%) | |
| Length of stay, d | 5.5 (8.6) | 5.1 (7.8) | 7.5 (11.6) | <0.001 |
| APRDRG‐SOI Expected Readmission Rate, % | 14.4 (9.5) | 13.3 (9.2) | 20.1 (9.0) | <0.001 |
| AHRQ Comorbidity Index (1 point) | 2.5 (1.4) | 2.4 (1.4) | 3.0 (1.8) | <0.001 |
| Discharge summary completed >3 days | 66,242 (75.3%) | 55,329 (75.0%) | 10,913 (76.6%) | <0.001 |
Association Between Days to Complete the Discharge Summary and Readmission
After hospital discharge, median (IQR) number of days to complete discharge summaries was 8 (416) days. After hospital discharge, median (IQR) number of days to complete discharge summaries and the number of days from discharge to readmission was 8 (416) and 11 (519) days, respectively (P < 0.001). Six thousand one hundred one patients (42.8%) were readmitted before their discharge summary was completed. The median (IQR) days to complete discharge summaries by hospital service in order from shortest to longest was: oncology, 6 (212) days; surgical sciences, 6 (312) days; pediatrics, 7 (315) days; gynecologyobstetrics, 8 (415) days; medicine, 9 (420) days; neurosciences, 12 (621) days.
When we divided the number of days to complete the discharge summary into deciles (02, 2.13, 3.14, 4.16, 6.18, 8.210, 10.114, 14.119, 19.130, >30), a longer number of days to complete discharge summaries had higher unadjusted and adjusted readmission rates (Figure 1). In unadjusted analysis, Table 2 shows that older age, male sex, African American race, oncological versus medicine hospital service, discharge location, longer LOS, higher APRDRG‐SOI expected readmission rate, and higher AHRQ Comorbidity Index were associated with readmission. Days to complete the discharge summary >3 days versus 3 days was associated with a higher readmission rate, with an unadjusted odds ratio (OR) and 95% confidence interval (CI) of 1.09 (95% CI: 1.04 to 1.13, P < 0.001).
| Characteristic | Bivariable Analysis* | Multivariable Analysis* | ||
|---|---|---|---|---|
| OR (95% CI) | P Value | OR (95% CI) | P Value | |
| ||||
| Age, 10 y | 1.09 (1.08 to 1.09) | <0.001 | 0.97 (0.95 to 0.98) | <0.001 |
| Male | 1.13 (1.09 to 1.17) | <0.001 | 1.01 (0.97 to 1.05) | 0.76 |
| Race | ||||
| Caucasian | Referent | Referent | ||
| African American | 1.21 (1.17 to 1.26) | <0.001 | 1.01 (0.96 to 1.05) | 0.74 |
| Other | 0.84 (0.79 to 0.90) | <0.001 | 0.92 (0.86 to 0.98) | 0.01 |
| Payer | ||||
| Medicare | Referent | Referent | ||
| Medicaid | 0.74 (0.70 to 0.77) | <0.001 | 1.03 (0.97 to 1.09) | 0.42 |
| Other | 0.57 (0.55 to 0.60) | <0.001 | 0.86 (0.82 to 0.91) | <0.001 |
| Hospital service | ||||
| Medicine | Referent | Referent | ||
| Gynecologyobstetrics | 0.18 (0.16 to 0.20) | <0.001 | 0.50 (0.45 to 0.56) | <0.001 |
| Neurosciences | 0.43 (0.40 to 0.46) | <0.001 | 0.76 (0.70 to 0.82) | <0.001 |
| Oncology | 1.14 (1.07 to 1.22) | <0.001 | 1.18 (1.10 to 1.28) | <0.001 |
| Pediatrics | 0.54 (0.51 to 0.57) | <0.001 | 0.77 (0.71 to 0.83) | <0.001 |
| Surgical sciences | 0.57 (0.54 to 0.60) | <0.001 | 0.92 (0.87 to 0.97) | 0.002 |
| Discharge location | ||||
| Home | Referent | |||
| Facility (SNF, rehabilitation facility) | 1.90 (1.77 to 2.03) | <0.001 | 1.11 (1.02 to 1.19) | 0.009 |
| Home with homecare or hospice | 1.73 (1.64 to 1.83) | <0.001 | 1.26 (1.19 to 1.34) | <0.001 |
| Other | 1.89 (1.78 to 2.00) | <0.001 | 1.25 (1.18 to 1.34) | <0.001 |
| Length of stay, d | 1.03 (1.02 to 1.03) | <0.001 | 1.00 (1.00 to 1.01) | <0.001 |
| APRDRG‐SOI expected readmission rate, % | 1.08 (1.07 to 1.08) | <0.001 | 1.06 (1.06 to 1.06) | <0.001 |
| AHRQ Comorbidity Index (1 point) | 1.27 (1.26 to 1.28) | <0.001 | 1.11 (1.09 to 1.12) | <0.001 |
| Discharge summary completed >3 days | 1.09 (1.04 to 1.14) | <0.001 | 1.09 (1.05 to 1.14) | <0.001 |

Multivariable and Secondary Analyses
In adjusted analysis (Table 2), patients discharged from an oncologic service relative to a medicine hospital service (OR: 1.19, 95% CI: 1.10 to 1.28, P < 0.001), patients discharged to a facility, home with homecare or hospice, or other location compared to home (facility OR: 1.11, 95% CI: 1.02 to 1.19, P = 0.009; home with homecare or hospice OR: 1.26, 95% CI: 1.19 to 1.34, P < 0.001; other OR: 1.25, 95% CI: 1.18 to 1.34, P < 0.001), patients with longer LOS (OR: 1.11 per day, 95% CI: 1.10 to 1.12, P < 0.001), patients with a higher expected readmission rates (OR: 1.01 per percent, 95% CI: 1.00 to 1.01, P < 0.001), and patients with a higher AHRQ comorbidity index (OR: 1.06 per 1 point, 95% CI: 1.06 to 1.06, P < 0.001) had higher 30‐day readmission rates. Overall, days to complete the discharge summary >3 days versus 3 days was associated with a higher readmission rate (OR: 1.09, 95% CI: 1.05 to 1.14, P < 0.001).
In a sensitivity analysis, discharge summary completion >8 days (median) versus 8 days was associated with higher unadjusted readmission rate (OR: 1.11, 95% CI: 1.07 to 1.15, P < 0.001) and a higher adjusted readmission rate (OR: 1.06, 95% CI: 1.02 to 1.10, P < 0.001). Discharge summary completion >14 days (70th percentile) versus 14 days was also associated with higher unadjusted readmission rate (OR: 1.15, 95% CI: 1.08 to 1.21, P < 0.001) and a higher adjusted readmission rate (OR: 1.09, 95% CI: 1.02 to 1.16, P = 0.008). The association between days to complete the discharge summary >3 days and readmissions was found to vary significantly by hospital service (P = 0.03). For comparing days to complete the discharge summary >3 versus 3 days, Table 3 shows that neurosciences, pediatrics, oncology, and medicine hospital services were associated with significantly increased adjusted mean readmission rates. Additionally, when days to complete the discharge summary was modeled as a continuous variable, we found that for every 3 days the odds of readmission increased by 1% (OR: 1.01, 95% CI: 1.00 to 1.01, P < 0.001).
| Days to Complete Discharge Summary by Hospital Service | Adjusted Mean Readmission Rate (95% CI)* | P Value |
|---|---|---|
| ||
| Gynecologyobstetrics | 0.30 | |
| 03 days, n = 1,792 | 5.4 (4.1 to 6.7) | |
| >3 days, n = 7,507 | 6.0 (4.9 to 7.0) | |
| Medicine | 0.04 | |
| 03 days, n = 6,137 | 21.1 (20.0 to 22.3) | |
| >3 days, n = 19,899 | 22.4 (21.6 to 23.2) | |
| Neurosciences | 0.02 | |
| 03 days, n = 1,116 | 10.1 (8.2 to 12.1) | |
| >3 days, n = 7,153 | 12.5 (11.6 to 13.5) | |
| Oncology | 0.01 | |
| 03 days, n = 1,885 | 25.0 (22.6 to 27.4) | |
| >3 days, n = 3,337 | 28.2 (26.6 to 30.2) | |
| Pediatrics | 0.001 | |
| 03 days, n = 4,561 | 9.5 (6.9 to 12.2) | |
| >3 days, n = 12,468 | 11.4 (8.9 to 13.9) | |
| Surgical sciences | 0.89 | |
| 03 days, n = 6,261 | 15.2 (14.2 to 16.1) | |
| >3 days, n = 15,878 | 15.1 (14.4 to 15.8) | |
In an unadjusted analysis, we found that the relationship between LOS and days to complete the discharge summary was not significant ( coefficient and 95% CI:, 0.01, 0.02 to 0.00, P = 0.20). However, we found a small but significant relationship in our multivariable analysis, such that each hospitalization day was associated with a 0.01 (95% CI: 0.00 to 0.02, P = 0.03) increase in days to complete the discharge summary.
DISCUSSION
In this single‐center retrospective analysis, the number of days to complete the discharge summary was significantly associated with readmissions after hospitalization. This association was independent of age, gender, comorbidity index, payer, discharge location, length of hospital stay, expected readmission rate based on diagnosis and severity of illness, and all hospital services. The odds of readmission for patients with delayed discharge summaries was small but significant. This is important in the current landscape of readmissions, particularly for institutions who are challenged to reduce readmission rates, and a small relative difference in readmissions may be the difference between getting penalized or not. In the context of prior studies, the results highlight the role of timely discharge summary as an under‐recognized metric, which may be a valid litmus test for care coordination. The findings also emphasize the potential of early summaries to expedite communication and to help facilitate quality of patient care. Hence, the study results extend the literature examining the relationship of delay in discharge summary with unfavorable patient outcomes.[15, 32]
In contrast to prior reports with limited focus on same‐hospital readmissions,[18, 33, 34, 35] readmissions beyond 30 days,[12] or focused on a specific patient population,[13, 36] this study evaluates both intra‐ and interhospital 30‐day readmissions in Maryland in an all‐payer, multi‐institution, diverse patient population. Additionally, prior research is conflicting with respect to whether timely discharges summaries are significantly associated with increased hospital readmissions.[12, 13, 14, 15] Although it is not surprising that inadequate care during hospitalization could result in readmissions, the role of discharge summaries remain underappreciated. Having a timely discharge summary may not always prevent readmissions, but our study showed that 43% of readmission occurred before the discharge summary completion. Not having a completed discharge summary at the time of readmission may have been a driver for the positive association between timely completion and 30‐day readmission we observed. This study highlights that delay in the discharge summary could be a marker of poor transitions of care, because suboptimal dissemination of critical information to care providers may result in discontinuity of patient care posthospitalization.
A plausible mechanism of the association between discharge summary delays and readmissions could be the provision of collateral information, which may potentially alter the threshold for readmissions. For example, in the emergency room/emergency department (ER/ED) setting, discharge summaries may help with preventable readmissions. For patients who present repeatedly with the same complaint, timely summaries to ER/ED providers may help reframe the patient complaints, such as patient has concern X, which was previously identified to be related to diagnosis Y. As others have shown, the content of discharge summaries, format, and accessibility (electronic vs paper chart), as well as timely distribution of summaries, are key factors that impact quality outcomes.[2, 12, 15, 37, 38] By detailing prior hospital information (ie, discharge medications, prior presentations, tests completed), summaries could help prevent errors in medication dosing, reduce unnecessary testing, and help facilitate admission triage. Summaries may have information regarding a new diagnosis such as the results of an endoscopic evaluation that revealed the source of occult gastrointestinal bleeding, which could help contextualize a complaint of repeat melena and redirect goals of care. Discussions of goals of care in the discharge summary may guide primary providers in continued care management plans.
Our study findings underscore a positive correlation between late discharge summaries and readmissions. However, the extent that this is a causal relationship is unclear; the association of delay in days to complete the discharge summary with readmission may be an epiphenomenon related to processes related to quality of clinical care. For example, delays in discharge summary completion could be a marker of other system issues, such as a stressed work environment. It is possible that providers who fail to complete timely discharge summaries may also fail to do other important functions related to transitions of care and care coordination. However, even if this is so, timely discharge summaries could become a focal point for discussion for optimization of care transitions. A discharge summary could be delayed because the patient has already been readmitted before the summary was distributed, thus making that original summary less relevant. Delays could also be a reflection of the data complexity for patients with longer hospital stays. This is supported by the small but significant relationship between LOS and days to complete the discharge summary in this study. Lastly, delays in discharge summary completion may also be a proxy of provider communication and can reflect the culture of communication at the institution.
Although unplanned hospital readmission is an important outcome, many readmissions may be related to other factors such as disease progression, rather than late summaries or the lack of postdischarge communication. For instance, prior reports did not find any association between the PCP seeing the discharge summaries or direct communications with the PCP and 30‐day clinical outcomes for readmission and death.[26, 39] However, these studies were limited in their use of self‐reported handoffs, did not measure quality of information transfer, and failed to capture a broader audience beyond the PCP, such as ED physicians or specialists.
Our results suggest that the relationship between days to complete discharge summaries and 30‐day readmissions may vary depending on whether the hospitalization is primarily surgical/procedural versus medical treatment. A recent study found that most readmissions after surgery were associated with new complications related to the procedure and not exacerbation of prior index hospitalization complications.[40] Hence, treatment for common causes of hospital readmissions after surgical or gynecological procedures, such as wound infections, acute anemia, ileus, or dehydration, may not necessarily require a completed discharge summary for appropriate management. However, we caution extending this finding to clinical practice before further studies are conducted on specific procedures and in different clinical settings.
Results from this study also support institutional policies that specify the need for practitioners to complete discharge summaries contemporaneously, such as at the time of discharge or within a couple of days. Unlike other forms of communication that are optional, discharge summaries are required, so we recommend that practitioners be held accountable for short turnaround times. For example, providers could be graded and rated on timely completions of discharge summaries, among other performance variables. Anecdotally at our institutions, we have heard from practitioners that it takes less time to complete them when you do them on the day of discharge, because the hospitalization course is fresher in their mind and they have to wade through less information in the medical record to complete an accurate discharge summary. To this point, a barrier to on‐time completion is that providers may have misconceptions about what is really vital information to convey to the next provider. In agreement with past research and in the era of the electronic medical record system, we recommend that the discharge summary should be a quick synthesis of key findings that incorporates only the important elements, such as why the patient was hospitalized, what were key findings and key responses to therapy, what is pending at the time of discharge, what medications the patient is currently taking, and what are the follow‐up plans, rather than a lengthy expose of all the findings.[13, 36, 41, 42]
Lastly, our study results should be taken in the context of its limitations. As a single‐center study, findings may lack generalizability. In particular, the results may not generalize to hospitals that lack access to statewide reporting. We were also not able to assess readmission for patients who may have been readmitted to a hospital outside of Maryland. Although we adjusted for pertinent variables such as age, gender, healthcare payer, hospital service, comorbidity index, discharge location, LOS, and expected readmission rates, there may be other relevant confounders that we failed to capture or measure optimally. Median days to complete the discharge summary in this study was 8 days, which is longer than practices at other institutions, and may also limit this study's generalizability.[15, 36, 42] However, prior research supports our findings,[15] and a systematic review found that only 29% and 52% of discharge summaries were completed by 2 weeks and 4 weeks, respectively.[9] Finally, as noted above and perhaps most important, it is possible that discharge summary turnaround time does not in itself causally impact readmissions, but rather reflects an underlying commitment of the inpatient team to effectively coordinate care following hospital discharge.
CONCLUSION
In sum, this study delineates an underappreciated but important relationship of timely discharge summary completion and readmission outcomes. The discharge summary may be a relevant metric reflecting quality of patient care. Healthcare providers may begin to target timely discharge summaries as a potential focal point of quality‐improvement projects with the goal to facilitate better patient outcomes.
Disclosures
The authors certify that no party having a direct interest in the results of the research supporting this article has or will confer a benefit on us or on any organization with which we are associated, and, if applicable, the authors certify that all financial and material support for this research (eg, Centers for Medicare and Medicaid Services, National Institutes of Health, or National Health Service grants) and work are clearly identified. This study was supported by funding opportunity, number CMS‐1C1‐12‐0001, from the Centers for Medicare and Medicaid Services and Center for Medicare and Medicaid Innovation. Its contents are solely the responsibility of the authors and do not necessarily represent the official views of the Department of Health and Human Services or any of its agencies.
- , , , et al. Development and sustainability of an inpatient‐to‐outpatient discharge handoff tool: a quality improvement project. Jt Comm J Qual Patient Saf. 2014;40(5):219–227.
- , , , , , . Documentation of mandated discharge summary components in transitions from acute to subacute care. In: Henriksen K, Battles JB, Keyes MA, et al., eds. Advances in Patient Safety: New Directions and Alternative Approaches. Vol. 2. Culture and Redesign. Rockville, MD: Agency for Healthcare Research and Quality; 2008.
- , , , . Better transitions: improving comprehension of discharge instructions. Front Health Serv Manage. 2009;25(3):11–32.
- , , , . Structured discharge education improves early outcome in orthopedic patients. Int J Orthop Trauma Nurs. 2010;14(2):66–74.
- , , , et al. Hospital discharge documentation and risk of rehospitalisation. BMJ Qual Saf. 2011;20(9):773–778.
- , , . The hospital discharge: a review of a high risk care transition with highlights of a reengineered discharge process. J Patient Saf. 2007;3(2):97–106.
- , , , , . Interventions to reduce 30‐day rehospitalization: a systematic review. Ann Intern Med. 2011;155(8):520–528.
- , , , , , . Effect of hospital follow‐up appointment on clinical event outcomes and mortality. Arch Intern Med. 2010;170(11):955–960.
- , , , , , . Deficits in communication and information transfer between hospital‐based and primary care physicians: implications for patient safety and continuity of care. JAMA. 2007;297(8):831–841.
- , , , , . Provider characteristics, clinical‐work processes and their relationship to discharge summary quality for sub‐acute care patients. J Gen Intern Med. 2012;27(1):78–84.
- , , , et al. Contemporary evidence about hospital strategies for reducing 30‐day readmissions: a national study. J Am Coll Cardiol. 2012;60(7):607–614.
- , , , . Effect of discharge summary availability during post‐discharge visits on hospital readmission. J Gen Intern Med. 2002;17(3):186–192.
- , , , et al. Association of discharge summary quality with readmission risk for patients hospitalized with heart failure exacerbation. Circ Cardiovasc Qual Outcomes. 2015;8(1):109–111.
- , , , et al. The independent association of provider and information continuity on outcomes after hospital discharge: implications for hospitalists. J Hosp Med. 2010;5(7):398–405.
- , , , , . Timeliness in discharge summary dissemination is associated with patients' clinical outcomes. J Eval Clin Pract. 2013;19(1):76–79.
- , , , et al. Communication and information deficits in patients discharged to rehabilitation facilities: an evaluation of five acute care hospitals. J Hosp Med. 2009;4(8):E28–E33.
- , , . Preventing readmissions through comprehensive discharge planning. Prof Case Manag. 2013;18(2):56–63; quiz 64–65.
- , , , et al. Effect of a postdischarge virtual ward on readmission or death for high‐risk patients: a randomized clinical trial. JAMA. 2014;312(13):1305–1312..
- , , . Risk factors for early unplanned hospital readmission in the elderly. J Gen Intern Med. 1991;6(3):223–228.
- , , , , . Differences between early and late readmissions among patients: a cohort study. Ann Intern Med. 2015;162(11):741–749.
- , , , et al. Post‐acute care payment reform demonstration report to congress supplement‐interim report. Centers for Medicare 14(3):1–14; quiz 88–89.
- , , , et al. Comprehensive discharge planning and home follow‐up of hospitalized elders: a randomized clinical trial. JAMA. 1999;281(7):613–620.
- , , , . Posthospital care transitions: patterns, complications, and risk identification. Health Serv Res. 2004;39(5):1449–1465.
- , , , et al. Transitions of care consensus policy statement: American College of Physicians, Society of General Internal Medicine, Society of Hospital Medicine, American Geriatrics Society, American College of Emergency Physicians, and Society for Academic Emergency Medicine. J Hosp Med. 2009;4(6):364–370.
- , , , et al. Association of self‐reported hospital discharge handoffs with 30‐day readmissions. JAMA Intern Med. 2013;173(8):624–629.
- , . Socioeconomic disparities in health: pathways and policies. Health Aff (Millwood). 2002;21(2):60–76.
- , , , . Comorbidity measures for use with administrative data. Med Care. 1998;36(1):8–27.
- , , , , , . Functional status impairment is associated with unplanned readmissions. Arch Phys Med Rehabil. 2013;94(10):1951–1958.
- Centers for Medicare 35(10):1044–1059.
- , , , et al. Understanding and execution of discharge instructions. Am J Med Qual. 2013;28(5):383–391.
- , , , , . Beyond the hospital gates: elucidating the interactive association of social support, depressive symptoms, and physical function with 30‐day readmissions. Am J Phys Med Rehabil. 2015;94(7):555–567.
- , , , et al. Improving the discharge process by embedding a discharge facilitator in a resident team. J Hosp Med. 2011;6(9):494–500.
- , , , et al. Hospital variation in quality of discharge summaries for patients hospitalized with heart failure exacerbation. Circ Cardiovasc Qual Outcomes. 2015;8(1):77–86
- , , , . Addressing the business of discharge: building a case for an electronic discharge summary. J Hosp Med. 2011;6(1):37–42.
- , , , , . Joint commission requirements for discharge instructions in patients with heart failure: is understanding important for preventing readmissions? J Card Fail. 2014;20(9):641–649.
- , , , et al. Association of communication between hospital‐based physicians and primary care providers with patient outcomes. J Gen Intern Med. 2009;24(3):381–386.
- , , , et al. Underlying reasons associated with hospital readmission following surgery in the united states. JAMA. 2015;313(5):483–495.
- , , , , . Assessing quality and efficiency of discharge summaries. Am J Med Qual. 2005;20(6):337–343.
- , , , et al. Comprehensive quality of discharge summaries at an academic medical center. J Hosp Med. 2013;8(8):436–443.
Across the continuum of care, the discharge summary is a critical tool for communication among care providers.[1] In the United States, the Joint Commission policies mandate that all hospital providers complete a discharge summary for patients with specific components to foster effective communication with future providers.[2] Because outpatient providers and emergency physicians rely on clinical information in the discharge summary to ensure appropriate postdischarge continuity of care, timely documentation is potentially an essential aspect of readmission reduction initiatives.[3, 4, 5] Prior reports indicate that poor discharge documentation of follow‐up plan‐of‐care increases the risk of hospitalization, whereas structured instructions, patient education, and direct communications with primary care physicians (PCPs) reduce repeat hospital visits.[6, 7, 8, 9] However, the current literature is limited in its narrow focus on the contents of discharge summaries, considered only same‐hospital readmissions, or considered readmissions within 3 months of discharge.[10, 11, 12, 13] Moreover, some prior research has suggested no association between discharge summary timeliness with readmission,[12, 13, 14] whereas another study did find a relationship,[15] hence the need to study this further is important. Filling this gap in knowledge could provide an avenue to track and improve quality of patient care, as delays in discharge summaries have been linked with pot‐discharge adverse outcomes and patient safety concerns.[15, 16, 17, 18] Because readmissions often occur soon after discharge, having timely discharge summaries may be particularly important to outcomes.[19, 20]
This research began under the framework of evaluating a bundle of care coordination strategies that were implemented at the Johns Hopkins Health System. These strategies were informed by the early Centers for Medicare and Medicaid Services (CMS) demonstration projects and other best practices that have been documented in the literature to improve utilization and improve communication during transitions of care.[21, 22, 23, 24, 25] Later they were augmented through a contract with the Center of Medicare and Medicaid Innovation to improve access to healthcare services and improve patient outcomes through improved care coordination processes. One of the domains our institution has increased efforts to improve is in provider handoffs. Toward that goal, we have worked to disentangle the effects of different factors of provider‐to‐provider communication that may influence readmissions.[26] For example, effective written provider handoffs in the form of accurate and timely discharge summaries was considered a key care coordination component of this program, but there was institutional resistance to endorsing an expectation that discharge summary turnaround should be shortened. To build a case for this concept, we sought to test the hypothesis that, at our hospital, longer time to complete hospital discharge summaries was associated with increased readmission rates. Unique to this analysis is that, in the state of Maryland, there is statewide reporting of readmissions, so we were able to account for intra‐ and interhospital readmissions for an all‐payer population. The authors anticipated that findings from this study would help inform discharge quality‐improvement initiatives and reemphasize the importance of timely discharge documentation across all disciplines as part of quality patient care.
METHODS
Study Population and Setting
We conducted a single‐center, retrospective cohort study of 87,994 consecutive patients discharged from Johns Hopkins Hospital, which is a 1000‐bed, tertiary academic medical center in Baltimore, Maryland between January 1, 2013 and December 31, 2014. One thousand ninety‐three (1.2%) of the records on days to complete the discharge summary were missing and were excluded from the analysis.
Data Source and Covariates
Data were derived from several sources. The Johns Hopkins Hospital data mart financial database, used for mandatory reporting to the State of Maryland, provided the following patient data: age, gender, race/ethnicity, payer (Medicare, Medicaid, and other) as a proxy for socioeconomic status,[27] hospital service prior to discharge (gynecologyobstetrics, medicine, neurosciences, oncology, pediatrics, and surgical sciences), hospital length of stay (LOS) prior to discharge, Agency for Healthcare Research and Quality (AHRQ) Comorbidity Index (which is an update to the original Elixhauser methodology[28]), and all‐payerrefined diagnosis‐related group (APRDRG) and severity of illness (SOI) combinations (a tool to group patients into clinically comparable disease and SOI categories expected to use similar resources and experience similar outcomes). The Health Services Cost Review Commission (HSCRC) in Maryland provided the observed readmission rate in Maryland for each APRDRG‐SOI combination and served as an expected readmission rate. This risk stratification methodology is similar to the approach used in previous studies.[26, 29] Discharge summary turnaround time was obtained from institutional administrative databases used to track compliance with discharge summary completion. Discharge location (home, facility, home with homecare or hospice, or other) was obtained from Curaspan databases (Curaspan Health Group, Inc., Newton, MA).
Primary Outcome: 30‐Day Readmission
The primary outcome was unplanned rehospitalizations to an acute care hospital in Maryland within 30 days of discharge from Johns Hopkins Hospital. This was as defined by the Maryland HSCRC using an algorithm to exclude readmissions that were likely to be scheduled, as defined by the index admission diagnosis and readmission diagnosis; this algorithm is updated based on the CMS all‐cause readmission algorithm.[30, 31]
Primary Exposure: Days to Complete the Discharge Summary
Discharge summary completion time was defined as the date when the discharge attending physician electronically signs the discharge summary. At our institution, an auto‐fax system sends documents (eg, discharge summaries, clinic notes) to linked providers (eg, primary care providers) shortly after midnight from the day the document is signed by an attending physician. During the period of the project, the policy for discharge summaries at the Johns Hopkins Hospital went from requiring them to be completed within 30 days to 14 days, and we were hoping to use our analyses to inform decision makers why this was important. To emphasize the need for timely completion of discharge summaries, we dichotomized the number of days to complete the discharge summary into >3 versus 3 days (20th percentile cutoff) and modeled it as a continuous variable (per 3‐day increase in days to complete the discharge summary).
Statistical Analysis
To evaluate differences in patient characteristics by readmission status, analysis of variance and 2 tests were used for continuous and dichotomous variables, respectively. Logistic regression was used to evaluate the association between days to complete the discharge summary >3 days and readmission status, adjusting for potentially confounding variables. Before inclusion in the logistic regression model, we confirmed a lack of multicollinearity in the multivariable regression model using variance inflation factors. We evaluated residual versus predicted value plots and residual versus fitted value plots with a locally weighted scatterplot smoothing line. In a sensitivity analysis we evaluated the association between readmission status and different cutoffs (>8 days, 50th percentile; and >14 days, 70% percentile). In a separate analysis, we used interaction terms to test whether the association between the association between days to complete the discharge summary >3 days and hospital readmission varied by the covariates in the analysis (age, sex, race, payer, hospital service, discharge location, LOS, APRDRG‐SOI expected readmission rate, and AHRQ Comorbidity Index). We observed a significant interaction between 30‐day readmission and days to complete the discharge summary >3 days by hospital service. Hence, we separately calculated the adjusted mean readmission rates separately for each hospital service using the least squared means method for the multivariable logistic regression analysis and adjusting for the previously mentioned covariates. In a separate analysis, we used linear regression to evaluate the association between LOS and days to complete the discharge summary, adjusting for potentially confounding variables. Statistical significance was defined as a 2‐sided P < 0.05. Data were analyzed with R (version 2.15.0; R Foundation for Statistical Computing, Vienna, Austria;
RESULTS
Readmitted Patients
In the study period, 14,248 out of 87,994 (16.2%) consecutive eligible patients were readmitted to a hospital in Maryland from patients discharged from Johns Hopkins Hospital between January 1, 2013 and December 31, 2014. A total of 11,027 (77.4%) of the readmissions were back to Johns Hopkins Hospital. Table 1 compares characteristics of readmitted versus nonreadmitted patients, with the following variables being significantly different between these patient groups: age, gender, healthcare payer, hospital service, discharge location, length of stay expected readmission rate, AHRQ Comorbidity Index, and days to complete inpatient discharge summary.
| Characteristics | All Patients, N = 87,994 | Not Readmitted, N = 73,746 | Readmitted, N = 14,248 | P Value |
|---|---|---|---|---|
| ||||
| Age, y | 42.1 (25.1) | 41.3 (25.4) | 46.4 (23.1) | <0.001 |
| Male | 43,210 (49.1%) | 35,851 (48.6%) | 7,359 (51.6%) | <0.001 |
| Race | <0.001 | |||
| Caucasian | 45,705 (51.9%) | 3,8661 (52.4%) | 7,044 (49.4%) | |
| African American | 32,777 (37.2%) | 2,6841 (36.4%) | 5,936 (41.7%) | |
| Other | 9,512 (10.8%) | 8,244 (11.2%) | 1,268 (8.9%) | |
| Payer | <0.001 | |||
| Medicare | 22,345 (25.4%) | 17,614 (23.9%) | 4,731 (33.2%) | |
| Medicaid | 24,080 (27.4%) | 20,100 (27.3%) | 3,980 (27.9%) | |
| Other | 41,569 (47.2%) | 36,032 (48.9%) | 5,537 (38.9%) | |
| Hospital service | <0.001 | |||
| Gynecologyobstetrics | 9,299 (10.6%) | 8,829 (12.0%) | 470 (3.3%) | |
| Medicine | 26,036 (29.6%) | 20,069 (27.2%) | 5,967 (41.9%) | |
| Neurosciences | 8,269 (9.4%) | 7,331 (9.9%) | 938 (6.6%) | |
| Oncology | 5,222 (5.9%) | 3,898 (5.3%) | 1,324 (9.3%) | |
| Pediatrics | 17,029 (19.4%) | 14,684 (19.9%) | 2,345 (16.5%) | |
| Surgical sciences | 22,139 (25.2%) | 18,935 (25.7%) | 3,204 (22.5%) | |
| Discharge location | <0.001 | |||
| Home | 65,478 (74.4%) | 56,359 (76.4%) | 9,119 (64.0%) | |
| Home with homecare or hospice | 9,524 (10.8%) | 7,440 (10.1%) | 2,084 (14.6%) | |
| Facility (SNF, rehabilitation facility) | 5,398 (6.1%) | 4,131 (5.6%) | 1,267 (8.9%) | |
| Other | 7,594 (8.6%) | 5,816 (7.9%) | 1,778 (12.5%) | |
| Length of stay, d | 5.5 (8.6) | 5.1 (7.8) | 7.5 (11.6) | <0.001 |
| APRDRG‐SOI Expected Readmission Rate, % | 14.4 (9.5) | 13.3 (9.2) | 20.1 (9.0) | <0.001 |
| AHRQ Comorbidity Index (1 point) | 2.5 (1.4) | 2.4 (1.4) | 3.0 (1.8) | <0.001 |
| Discharge summary completed >3 days | 66,242 (75.3%) | 55,329 (75.0%) | 10,913 (76.6%) | <0.001 |
Association Between Days to Complete the Discharge Summary and Readmission
After hospital discharge, median (IQR) number of days to complete discharge summaries was 8 (416) days. After hospital discharge, median (IQR) number of days to complete discharge summaries and the number of days from discharge to readmission was 8 (416) and 11 (519) days, respectively (P < 0.001). Six thousand one hundred one patients (42.8%) were readmitted before their discharge summary was completed. The median (IQR) days to complete discharge summaries by hospital service in order from shortest to longest was: oncology, 6 (212) days; surgical sciences, 6 (312) days; pediatrics, 7 (315) days; gynecologyobstetrics, 8 (415) days; medicine, 9 (420) days; neurosciences, 12 (621) days.
When we divided the number of days to complete the discharge summary into deciles (02, 2.13, 3.14, 4.16, 6.18, 8.210, 10.114, 14.119, 19.130, >30), a longer number of days to complete discharge summaries had higher unadjusted and adjusted readmission rates (Figure 1). In unadjusted analysis, Table 2 shows that older age, male sex, African American race, oncological versus medicine hospital service, discharge location, longer LOS, higher APRDRG‐SOI expected readmission rate, and higher AHRQ Comorbidity Index were associated with readmission. Days to complete the discharge summary >3 days versus 3 days was associated with a higher readmission rate, with an unadjusted odds ratio (OR) and 95% confidence interval (CI) of 1.09 (95% CI: 1.04 to 1.13, P < 0.001).
| Characteristic | Bivariable Analysis* | Multivariable Analysis* | ||
|---|---|---|---|---|
| OR (95% CI) | P Value | OR (95% CI) | P Value | |
| ||||
| Age, 10 y | 1.09 (1.08 to 1.09) | <0.001 | 0.97 (0.95 to 0.98) | <0.001 |
| Male | 1.13 (1.09 to 1.17) | <0.001 | 1.01 (0.97 to 1.05) | 0.76 |
| Race | ||||
| Caucasian | Referent | Referent | ||
| African American | 1.21 (1.17 to 1.26) | <0.001 | 1.01 (0.96 to 1.05) | 0.74 |
| Other | 0.84 (0.79 to 0.90) | <0.001 | 0.92 (0.86 to 0.98) | 0.01 |
| Payer | ||||
| Medicare | Referent | Referent | ||
| Medicaid | 0.74 (0.70 to 0.77) | <0.001 | 1.03 (0.97 to 1.09) | 0.42 |
| Other | 0.57 (0.55 to 0.60) | <0.001 | 0.86 (0.82 to 0.91) | <0.001 |
| Hospital service | ||||
| Medicine | Referent | Referent | ||
| Gynecologyobstetrics | 0.18 (0.16 to 0.20) | <0.001 | 0.50 (0.45 to 0.56) | <0.001 |
| Neurosciences | 0.43 (0.40 to 0.46) | <0.001 | 0.76 (0.70 to 0.82) | <0.001 |
| Oncology | 1.14 (1.07 to 1.22) | <0.001 | 1.18 (1.10 to 1.28) | <0.001 |
| Pediatrics | 0.54 (0.51 to 0.57) | <0.001 | 0.77 (0.71 to 0.83) | <0.001 |
| Surgical sciences | 0.57 (0.54 to 0.60) | <0.001 | 0.92 (0.87 to 0.97) | 0.002 |
| Discharge location | ||||
| Home | Referent | |||
| Facility (SNF, rehabilitation facility) | 1.90 (1.77 to 2.03) | <0.001 | 1.11 (1.02 to 1.19) | 0.009 |
| Home with homecare or hospice | 1.73 (1.64 to 1.83) | <0.001 | 1.26 (1.19 to 1.34) | <0.001 |
| Other | 1.89 (1.78 to 2.00) | <0.001 | 1.25 (1.18 to 1.34) | <0.001 |
| Length of stay, d | 1.03 (1.02 to 1.03) | <0.001 | 1.00 (1.00 to 1.01) | <0.001 |
| APRDRG‐SOI expected readmission rate, % | 1.08 (1.07 to 1.08) | <0.001 | 1.06 (1.06 to 1.06) | <0.001 |
| AHRQ Comorbidity Index (1 point) | 1.27 (1.26 to 1.28) | <0.001 | 1.11 (1.09 to 1.12) | <0.001 |
| Discharge summary completed >3 days | 1.09 (1.04 to 1.14) | <0.001 | 1.09 (1.05 to 1.14) | <0.001 |
Multivariable and Secondary Analyses
In adjusted analysis (Table 2), patients discharged from an oncologic service relative to a medicine hospital service (OR: 1.19, 95% CI: 1.10 to 1.28, P < 0.001), patients discharged to a facility, home with homecare or hospice, or other location compared to home (facility OR: 1.11, 95% CI: 1.02 to 1.19, P = 0.009; home with homecare or hospice OR: 1.26, 95% CI: 1.19 to 1.34, P < 0.001; other OR: 1.25, 95% CI: 1.18 to 1.34, P < 0.001), patients with longer LOS (OR: 1.11 per day, 95% CI: 1.10 to 1.12, P < 0.001), patients with a higher expected readmission rates (OR: 1.01 per percent, 95% CI: 1.00 to 1.01, P < 0.001), and patients with a higher AHRQ comorbidity index (OR: 1.06 per 1 point, 95% CI: 1.06 to 1.06, P < 0.001) had higher 30‐day readmission rates. Overall, days to complete the discharge summary >3 days versus 3 days was associated with a higher readmission rate (OR: 1.09, 95% CI: 1.05 to 1.14, P < 0.001).
In a sensitivity analysis, discharge summary completion >8 days (median) versus 8 days was associated with higher unadjusted readmission rate (OR: 1.11, 95% CI: 1.07 to 1.15, P < 0.001) and a higher adjusted readmission rate (OR: 1.06, 95% CI: 1.02 to 1.10, P < 0.001). Discharge summary completion >14 days (70th percentile) versus 14 days was also associated with higher unadjusted readmission rate (OR: 1.15, 95% CI: 1.08 to 1.21, P < 0.001) and a higher adjusted readmission rate (OR: 1.09, 95% CI: 1.02 to 1.16, P = 0.008). The association between days to complete the discharge summary >3 days and readmissions was found to vary significantly by hospital service (P = 0.03). For comparing days to complete the discharge summary >3 versus 3 days, Table 3 shows that neurosciences, pediatrics, oncology, and medicine hospital services were associated with significantly increased adjusted mean readmission rates. Additionally, when days to complete the discharge summary was modeled as a continuous variable, we found that for every 3 days the odds of readmission increased by 1% (OR: 1.01, 95% CI: 1.00 to 1.01, P < 0.001).
| Days to Complete Discharge Summary by Hospital Service | Adjusted Mean Readmission Rate (95% CI)* | P Value |
|---|---|---|
| ||
| Gynecologyobstetrics | 0.30 | |
| 03 days, n = 1,792 | 5.4 (4.1 to 6.7) | |
| >3 days, n = 7,507 | 6.0 (4.9 to 7.0) | |
| Medicine | 0.04 | |
| 03 days, n = 6,137 | 21.1 (20.0 to 22.3) | |
| >3 days, n = 19,899 | 22.4 (21.6 to 23.2) | |
| Neurosciences | 0.02 | |
| 03 days, n = 1,116 | 10.1 (8.2 to 12.1) | |
| >3 days, n = 7,153 | 12.5 (11.6 to 13.5) | |
| Oncology | 0.01 | |
| 03 days, n = 1,885 | 25.0 (22.6 to 27.4) | |
| >3 days, n = 3,337 | 28.2 (26.6 to 30.2) | |
| Pediatrics | 0.001 | |
| 03 days, n = 4,561 | 9.5 (6.9 to 12.2) | |
| >3 days, n = 12,468 | 11.4 (8.9 to 13.9) | |
| Surgical sciences | 0.89 | |
| 03 days, n = 6,261 | 15.2 (14.2 to 16.1) | |
| >3 days, n = 15,878 | 15.1 (14.4 to 15.8) | |
In an unadjusted analysis, we found that the relationship between LOS and days to complete the discharge summary was not significant ( coefficient and 95% CI:, 0.01, 0.02 to 0.00, P = 0.20). However, we found a small but significant relationship in our multivariable analysis, such that each hospitalization day was associated with a 0.01 (95% CI: 0.00 to 0.02, P = 0.03) increase in days to complete the discharge summary.
DISCUSSION
In this single‐center retrospective analysis, the number of days to complete the discharge summary was significantly associated with readmissions after hospitalization. This association was independent of age, gender, comorbidity index, payer, discharge location, length of hospital stay, expected readmission rate based on diagnosis and severity of illness, and all hospital services. The odds of readmission for patients with delayed discharge summaries was small but significant. This is important in the current landscape of readmissions, particularly for institutions who are challenged to reduce readmission rates, and a small relative difference in readmissions may be the difference between getting penalized or not. In the context of prior studies, the results highlight the role of timely discharge summary as an under‐recognized metric, which may be a valid litmus test for care coordination. The findings also emphasize the potential of early summaries to expedite communication and to help facilitate quality of patient care. Hence, the study results extend the literature examining the relationship of delay in discharge summary with unfavorable patient outcomes.[15, 32]
In contrast to prior reports with limited focus on same‐hospital readmissions,[18, 33, 34, 35] readmissions beyond 30 days,[12] or focused on a specific patient population,[13, 36] this study evaluates both intra‐ and interhospital 30‐day readmissions in Maryland in an all‐payer, multi‐institution, diverse patient population. Additionally, prior research is conflicting with respect to whether timely discharges summaries are significantly associated with increased hospital readmissions.[12, 13, 14, 15] Although it is not surprising that inadequate care during hospitalization could result in readmissions, the role of discharge summaries remain underappreciated. Having a timely discharge summary may not always prevent readmissions, but our study showed that 43% of readmission occurred before the discharge summary completion. Not having a completed discharge summary at the time of readmission may have been a driver for the positive association between timely completion and 30‐day readmission we observed. This study highlights that delay in the discharge summary could be a marker of poor transitions of care, because suboptimal dissemination of critical information to care providers may result in discontinuity of patient care posthospitalization.
A plausible mechanism of the association between discharge summary delays and readmissions could be the provision of collateral information, which may potentially alter the threshold for readmissions. For example, in the emergency room/emergency department (ER/ED) setting, discharge summaries may help with preventable readmissions. For patients who present repeatedly with the same complaint, timely summaries to ER/ED providers may help reframe the patient complaints, such as patient has concern X, which was previously identified to be related to diagnosis Y. As others have shown, the content of discharge summaries, format, and accessibility (electronic vs paper chart), as well as timely distribution of summaries, are key factors that impact quality outcomes.[2, 12, 15, 37, 38] By detailing prior hospital information (ie, discharge medications, prior presentations, tests completed), summaries could help prevent errors in medication dosing, reduce unnecessary testing, and help facilitate admission triage. Summaries may have information regarding a new diagnosis such as the results of an endoscopic evaluation that revealed the source of occult gastrointestinal bleeding, which could help contextualize a complaint of repeat melena and redirect goals of care. Discussions of goals of care in the discharge summary may guide primary providers in continued care management plans.
Our study findings underscore a positive correlation between late discharge summaries and readmissions. However, the extent that this is a causal relationship is unclear; the association of delay in days to complete the discharge summary with readmission may be an epiphenomenon related to processes related to quality of clinical care. For example, delays in discharge summary completion could be a marker of other system issues, such as a stressed work environment. It is possible that providers who fail to complete timely discharge summaries may also fail to do other important functions related to transitions of care and care coordination. However, even if this is so, timely discharge summaries could become a focal point for discussion for optimization of care transitions. A discharge summary could be delayed because the patient has already been readmitted before the summary was distributed, thus making that original summary less relevant. Delays could also be a reflection of the data complexity for patients with longer hospital stays. This is supported by the small but significant relationship between LOS and days to complete the discharge summary in this study. Lastly, delays in discharge summary completion may also be a proxy of provider communication and can reflect the culture of communication at the institution.
Although unplanned hospital readmission is an important outcome, many readmissions may be related to other factors such as disease progression, rather than late summaries or the lack of postdischarge communication. For instance, prior reports did not find any association between the PCP seeing the discharge summaries or direct communications with the PCP and 30‐day clinical outcomes for readmission and death.[26, 39] However, these studies were limited in their use of self‐reported handoffs, did not measure quality of information transfer, and failed to capture a broader audience beyond the PCP, such as ED physicians or specialists.
Our results suggest that the relationship between days to complete discharge summaries and 30‐day readmissions may vary depending on whether the hospitalization is primarily surgical/procedural versus medical treatment. A recent study found that most readmissions after surgery were associated with new complications related to the procedure and not exacerbation of prior index hospitalization complications.[40] Hence, treatment for common causes of hospital readmissions after surgical or gynecological procedures, such as wound infections, acute anemia, ileus, or dehydration, may not necessarily require a completed discharge summary for appropriate management. However, we caution extending this finding to clinical practice before further studies are conducted on specific procedures and in different clinical settings.
Results from this study also support institutional policies that specify the need for practitioners to complete discharge summaries contemporaneously, such as at the time of discharge or within a couple of days. Unlike other forms of communication that are optional, discharge summaries are required, so we recommend that practitioners be held accountable for short turnaround times. For example, providers could be graded and rated on timely completions of discharge summaries, among other performance variables. Anecdotally at our institutions, we have heard from practitioners that it takes less time to complete them when you do them on the day of discharge, because the hospitalization course is fresher in their mind and they have to wade through less information in the medical record to complete an accurate discharge summary. To this point, a barrier to on‐time completion is that providers may have misconceptions about what is really vital information to convey to the next provider. In agreement with past research and in the era of the electronic medical record system, we recommend that the discharge summary should be a quick synthesis of key findings that incorporates only the important elements, such as why the patient was hospitalized, what were key findings and key responses to therapy, what is pending at the time of discharge, what medications the patient is currently taking, and what are the follow‐up plans, rather than a lengthy expose of all the findings.[13, 36, 41, 42]
Lastly, our study results should be taken in the context of its limitations. As a single‐center study, findings may lack generalizability. In particular, the results may not generalize to hospitals that lack access to statewide reporting. We were also not able to assess readmission for patients who may have been readmitted to a hospital outside of Maryland. Although we adjusted for pertinent variables such as age, gender, healthcare payer, hospital service, comorbidity index, discharge location, LOS, and expected readmission rates, there may be other relevant confounders that we failed to capture or measure optimally. Median days to complete the discharge summary in this study was 8 days, which is longer than practices at other institutions, and may also limit this study's generalizability.[15, 36, 42] However, prior research supports our findings,[15] and a systematic review found that only 29% and 52% of discharge summaries were completed by 2 weeks and 4 weeks, respectively.[9] Finally, as noted above and perhaps most important, it is possible that discharge summary turnaround time does not in itself causally impact readmissions, but rather reflects an underlying commitment of the inpatient team to effectively coordinate care following hospital discharge.
CONCLUSION
In sum, this study delineates an underappreciated but important relationship of timely discharge summary completion and readmission outcomes. The discharge summary may be a relevant metric reflecting quality of patient care. Healthcare providers may begin to target timely discharge summaries as a potential focal point of quality‐improvement projects with the goal to facilitate better patient outcomes.
Disclosures
The authors certify that no party having a direct interest in the results of the research supporting this article has or will confer a benefit on us or on any organization with which we are associated, and, if applicable, the authors certify that all financial and material support for this research (eg, Centers for Medicare and Medicaid Services, National Institutes of Health, or National Health Service grants) and work are clearly identified. This study was supported by funding opportunity, number CMS‐1C1‐12‐0001, from the Centers for Medicare and Medicaid Services and Center for Medicare and Medicaid Innovation. Its contents are solely the responsibility of the authors and do not necessarily represent the official views of the Department of Health and Human Services or any of its agencies.
- , , , et al. Development and sustainability of an inpatient‐to‐outpatient discharge handoff tool: a quality improvement project. Jt Comm J Qual Patient Saf. 2014;40(5):219–227.
- , , , , , . Documentation of mandated discharge summary components in transitions from acute to subacute care. In: Henriksen K, Battles JB, Keyes MA, et al., eds. Advances in Patient Safety: New Directions and Alternative Approaches. Vol. 2. Culture and Redesign. Rockville, MD: Agency for Healthcare Research and Quality; 2008.
- , , , . Better transitions: improving comprehension of discharge instructions. Front Health Serv Manage. 2009;25(3):11–32.
- , , , . Structured discharge education improves early outcome in orthopedic patients. Int J Orthop Trauma Nurs. 2010;14(2):66–74.
- , , , et al. Hospital discharge documentation and risk of rehospitalisation. BMJ Qual Saf. 2011;20(9):773–778.
- , , . The hospital discharge: a review of a high risk care transition with highlights of a reengineered discharge process. J Patient Saf. 2007;3(2):97–106.
- , , , , . Interventions to reduce 30‐day rehospitalization: a systematic review. Ann Intern Med. 2011;155(8):520–528.
- , , , , , . Effect of hospital follow‐up appointment on clinical event outcomes and mortality. Arch Intern Med. 2010;170(11):955–960.
- , , , , , . Deficits in communication and information transfer between hospital‐based and primary care physicians: implications for patient safety and continuity of care. JAMA. 2007;297(8):831–841.
- , , , , . Provider characteristics, clinical‐work processes and their relationship to discharge summary quality for sub‐acute care patients. J Gen Intern Med. 2012;27(1):78–84.
- , , , et al. Contemporary evidence about hospital strategies for reducing 30‐day readmissions: a national study. J Am Coll Cardiol. 2012;60(7):607–614.
- , , , . Effect of discharge summary availability during post‐discharge visits on hospital readmission. J Gen Intern Med. 2002;17(3):186–192.
- , , , et al. Association of discharge summary quality with readmission risk for patients hospitalized with heart failure exacerbation. Circ Cardiovasc Qual Outcomes. 2015;8(1):109–111.
- , , , et al. The independent association of provider and information continuity on outcomes after hospital discharge: implications for hospitalists. J Hosp Med. 2010;5(7):398–405.
- , , , , . Timeliness in discharge summary dissemination is associated with patients' clinical outcomes. J Eval Clin Pract. 2013;19(1):76–79.
- , , , et al. Communication and information deficits in patients discharged to rehabilitation facilities: an evaluation of five acute care hospitals. J Hosp Med. 2009;4(8):E28–E33.
- , , . Preventing readmissions through comprehensive discharge planning. Prof Case Manag. 2013;18(2):56–63; quiz 64–65.
- , , , et al. Effect of a postdischarge virtual ward on readmission or death for high‐risk patients: a randomized clinical trial. JAMA. 2014;312(13):1305–1312..
- , , . Risk factors for early unplanned hospital readmission in the elderly. J Gen Intern Med. 1991;6(3):223–228.
- , , , , . Differences between early and late readmissions among patients: a cohort study. Ann Intern Med. 2015;162(11):741–749.
- , , , et al. Post‐acute care payment reform demonstration report to congress supplement‐interim report. Centers for Medicare 14(3):1–14; quiz 88–89.
- , , , et al. Comprehensive discharge planning and home follow‐up of hospitalized elders: a randomized clinical trial. JAMA. 1999;281(7):613–620.
- , , , . Posthospital care transitions: patterns, complications, and risk identification. Health Serv Res. 2004;39(5):1449–1465.
- , , , et al. Transitions of care consensus policy statement: American College of Physicians, Society of General Internal Medicine, Society of Hospital Medicine, American Geriatrics Society, American College of Emergency Physicians, and Society for Academic Emergency Medicine. J Hosp Med. 2009;4(6):364–370.
- , , , et al. Association of self‐reported hospital discharge handoffs with 30‐day readmissions. JAMA Intern Med. 2013;173(8):624–629.
- , . Socioeconomic disparities in health: pathways and policies. Health Aff (Millwood). 2002;21(2):60–76.
- , , , . Comorbidity measures for use with administrative data. Med Care. 1998;36(1):8–27.
- , , , , , . Functional status impairment is associated with unplanned readmissions. Arch Phys Med Rehabil. 2013;94(10):1951–1958.
- Centers for Medicare 35(10):1044–1059.
- , , , et al. Understanding and execution of discharge instructions. Am J Med Qual. 2013;28(5):383–391.
- , , , , . Beyond the hospital gates: elucidating the interactive association of social support, depressive symptoms, and physical function with 30‐day readmissions. Am J Phys Med Rehabil. 2015;94(7):555–567.
- , , , et al. Improving the discharge process by embedding a discharge facilitator in a resident team. J Hosp Med. 2011;6(9):494–500.
- , , , et al. Hospital variation in quality of discharge summaries for patients hospitalized with heart failure exacerbation. Circ Cardiovasc Qual Outcomes. 2015;8(1):77–86
- , , , . Addressing the business of discharge: building a case for an electronic discharge summary. J Hosp Med. 2011;6(1):37–42.
- , , , , . Joint commission requirements for discharge instructions in patients with heart failure: is understanding important for preventing readmissions? J Card Fail. 2014;20(9):641–649.
- , , , et al. Association of communication between hospital‐based physicians and primary care providers with patient outcomes. J Gen Intern Med. 2009;24(3):381–386.
- , , , et al. Underlying reasons associated with hospital readmission following surgery in the united states. JAMA. 2015;313(5):483–495.
- , , , , . Assessing quality and efficiency of discharge summaries. Am J Med Qual. 2005;20(6):337–343.
- , , , et al. Comprehensive quality of discharge summaries at an academic medical center. J Hosp Med. 2013;8(8):436–443.
© 2016 Society of Hospital Medicine
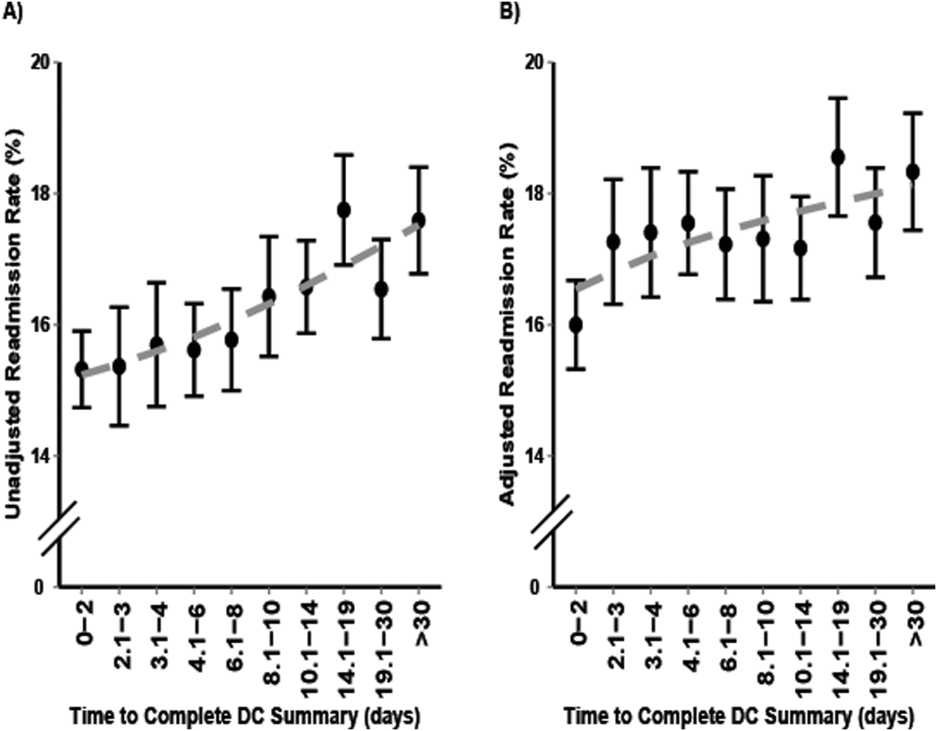
Optimizing Outcomes of Total Joint Arthroplasty Under the Comprehensive Care for Joint Replacement
On July 9, 2015, the Centers for Medicare and Medicaid Services announced the Comprehensive Care for Joint Replacement model, which aims to improve coordination of the whole episode of care for total hip and knee replacement.1 At stake is the fact that hip and knee replacements are the most common inpatient procedures among Medicare beneficiaries, costing over $7 billion in 20141 and projected to grow to $50 billion by 2030.2 Under Medicare’s new initiative, hospitals and physicians are held accountable for the quality and cost of care delivered from the time of surgery through 90 days after discharge. For the first time in the history of our profession, large-scale reimbursement is based on outcomes and value rather than fee-for-service. As a result, a hospital can either earn a reward or be held liable for added expenses related to events such as prolonged hospitalization, readmissions, and complications.
How can we optimize outcomes for total joint arthroplasty (TJA) patients in this era of Medicare (r)evolution? A good outcome starts with good patient selection. Numerous studies have been published on patient-related risk factors for postoperative TJA complications including obesity, congestive heart failure, lung disease, and depression.3,4 The risks and benefits of TJA should be carefully weighed in high-risk patients and surgery delayed until appropriate medical optimization has been achieved. Following the famous saying, “Good surgeons know how to operate, better surgeons know when to operate, and the best surgeons know when not to operate,” one cannot overemphasize the need for an objective assessment of the likelihood of patient outcome weighed against patient risk factors.
Moderating patient expectation is another crucial component given the changing demographics of our country. Patients seeking TJA today are younger, more obese, and better educated; live longer; and have higher expectations.5 Unrealistic expectations can have a profound impact on surgical outcomes, leading to frustration, dissatisfaction, and unnecessary resource utilization. For example, despite alleviating pain and restoring function in a severely degenerative joint, TJA does not necessarily translate to weight loss. There is currently conflicting evidence on this topic,6-8 and the expectation of weight loss after TJA cannot be supported. There is also a paucity of data regarding return to athletic activity after TJA and the effect of athletic activity on TJA survivorship.9 Communication and transparency are needed to moderate unrealistic expectations before surgery, outlining clear and achievable goals.
Clinical pathways for TJA have seen tremendous improvements in the past decade with the advent of multimodal analgesia, rapid recovery programs, use of spinal and regional anesthesia, and evidence-based guidelines for prevention of venous thromboembolic disease. Adequate pain control is critical to recovery. In a prospective, randomized controlled trial, Lamplot and colleagues10 showed that the use of multimodal analgesia correlated with improved pain scores, decreased narcotic usage, faster functional recovery, and higher patient satisfaction after total knee arthroplasty (TKA). In another study, Quack and colleagues11 performed a systematic review of the literature on fast-track rehabilitation and found that it reduced both inpatient length of stay and costs after TKA. With respect to anesthetic choice, Pugely and colleagues12 reviewed a national database of 14,052 cases of primary TKA and found that patients with multiple comorbidities were at higher risk of complications after general anesthesia when compared with spinal anesthesia. We should continue to invest in safer and more effective modalities for pain control and functional recovery.
Last but not least, in today’s era of Medicare’s Comprehensive Care for Joint Replacement, the role of low-volume orthopedic surgeons performing TJA deserves special mention. Over the next few years, we could likely see a decline in the role of low-volume surgeons in favor of high-volume surgeons. While most orthopedic surgeons are comfortable doing primary TJA, failed cases and complications are frequently referred to larger centers, which may create frustration among patients owing to fragmentation of care. The economic pressures related to bundled payments could further influence this transition. Given the lack of a widespread, long-standing national joint registry, the incidence of failed TJA performed by low-volume orthopedic surgeons compared with high-volume orthopedic surgeons is unknown. However, multiple studies have shown surgeon volume to be associated with lower rates of complication, mortality, readmission, reoperation, and discharge to postacute facilities.13-16 As hospitals assume further financial risk, considerable data on physician performance will undoubtedly be gathered and leveraged. Time and data will determine the value of this transition of care.
Today, more than ever, we are challenged to provide efficient, high-quality, patient-centered care. As our nation grapples with reforming a broken health care system, initiatives like the Comprehensive Care for Joint Replacement will continue to emerge in the future. Orthopedic surgeons are the gatekeepers of the system and therefore hold significant responsibility to patients and society. Ensuring good outcomes should be a top priority not just from a financial standpoint, but as a moral obligation. We shall continue to be leaders in the face of challenges, using innovation and integrity to produce the best results and advance our profession.
1. Comprehensive Care for Joint Replacement model. Centers for Medicare and Medicaid Services website. https://innovation.cms.gov/initiatives/cjr. Updated December 21, 2015. Accessed December 30, 2015.
2. Wilson NA, Schneller ES, Montgomery K, Bozic KJ. Hip and knee implants: current trends and policy considerations. Health Aff. 2008;27(6):1587-1598.
3. Bozic KJ, Lau E, Ong K, et al. Risk factors for early revision after primary total hip arthroplasty in Medicare patients. Clin Orthop Relat Res. 2014;472(2):449-454.
4. Bozic KJ, Lau E, Ong K, et al. Risk factors for early revision after primary TKA in Medicare patients. Clin Orthop Relat Res. 2014;472(1):232-237.
5. Mason JB. The new demands by patients in the modern era of total joint arthroplasty: a point of view. Clin Orthop Relat Res. 2008;466(1):146-152.
6. Riddle DL, Singh JA, Harmsen WS, Schleck CD, Lewallen DG. Clinically important body weight gain following knee arthroplasty: a five-year comparative cohort study. Arthritis Care Res. 2013;65(5):669-677.
7. Zeni JA Jr, Snyder-Mackler L. Most patients gain weight in the 2 years after total knee arthroplasty: comparison to a healthy control group. Osteoarthritis Cartilage. 2010;18(4):510-514.
8. Ast MP, Abdel MP, Lee YY, Lyman S, Ruel AV, Westrich GH. Weight changes after total hip or knee arthroplasty: prevalence, predictors, and effects on outcomes. J Bone Joint Surg Am. 2015;97(11):911-919.
9. Healy WL, Sharma S, Schwartz B, Iorio R. Athletic activity after total joint arthroplasty. J Bone Joint Surg Am. 2008;90(10):2245-2252.
10. Lamplot JD, Wagner ER, Manning DW. Multimodal pain management in total knee arthroplasty: a prospective randomized controlled trial. J Arthroplasty. 2014;29(2):329-334.
11. Quack V, Ippendorf AV, Betsch M, et al. Multidisciplinary rehabilitation and fast-track rehabilitation after knee replacement: faster, better, cheaper? A survey and systematic review of literature [in German]. Rehabilitation (Stuttg). 2015;54(4):245-251.
12. Pugely AJ, Martin CT, Gao Y, Mendoza-Lattes S, Callaghan JJ. Differences in short-term complications between spinal and general anesthesia for primary total knee arthroplasty. J Bone Joint Surg Am. 2013;95(3):193-199.
13. Katz JN, Losina E, Barrett J, et al. Association between hospital and surgeon procedure volume and outcomes of total hip replacement in the United States medicare population. J Bone Joint Surg Am. 2001;83(11):1622-1629.
14. Manley M, Ong K, Lau E, Kurtz SM. Effect of volume on total hip arthroplasty revision rates in the United States Medicare population. J Bone Joint Surg Am. 2008;90(11):2446-2451.
15. Bozic KJ, Maselli J, Pekow PS, Lindenauer PK, Vail TP, Auerbach AD. The influence of procedure volumes and standardization of care on quality and efficiency in total joint replacement surgery. J Bone Joint Surg Am. 2010;92(16):2643-2652.
16. Lau RL, Perruccio AV, Gandhi R, Mahomed NN. The role of surgeon volume on patient outcome in total knee arthroplasty: a systematic review of the literature. BMC Musculoskelet Disord. 2012;13:250.
On July 9, 2015, the Centers for Medicare and Medicaid Services announced the Comprehensive Care for Joint Replacement model, which aims to improve coordination of the whole episode of care for total hip and knee replacement.1 At stake is the fact that hip and knee replacements are the most common inpatient procedures among Medicare beneficiaries, costing over $7 billion in 20141 and projected to grow to $50 billion by 2030.2 Under Medicare’s new initiative, hospitals and physicians are held accountable for the quality and cost of care delivered from the time of surgery through 90 days after discharge. For the first time in the history of our profession, large-scale reimbursement is based on outcomes and value rather than fee-for-service. As a result, a hospital can either earn a reward or be held liable for added expenses related to events such as prolonged hospitalization, readmissions, and complications.
How can we optimize outcomes for total joint arthroplasty (TJA) patients in this era of Medicare (r)evolution? A good outcome starts with good patient selection. Numerous studies have been published on patient-related risk factors for postoperative TJA complications including obesity, congestive heart failure, lung disease, and depression.3,4 The risks and benefits of TJA should be carefully weighed in high-risk patients and surgery delayed until appropriate medical optimization has been achieved. Following the famous saying, “Good surgeons know how to operate, better surgeons know when to operate, and the best surgeons know when not to operate,” one cannot overemphasize the need for an objective assessment of the likelihood of patient outcome weighed against patient risk factors.
Moderating patient expectation is another crucial component given the changing demographics of our country. Patients seeking TJA today are younger, more obese, and better educated; live longer; and have higher expectations.5 Unrealistic expectations can have a profound impact on surgical outcomes, leading to frustration, dissatisfaction, and unnecessary resource utilization. For example, despite alleviating pain and restoring function in a severely degenerative joint, TJA does not necessarily translate to weight loss. There is currently conflicting evidence on this topic,6-8 and the expectation of weight loss after TJA cannot be supported. There is also a paucity of data regarding return to athletic activity after TJA and the effect of athletic activity on TJA survivorship.9 Communication and transparency are needed to moderate unrealistic expectations before surgery, outlining clear and achievable goals.
Clinical pathways for TJA have seen tremendous improvements in the past decade with the advent of multimodal analgesia, rapid recovery programs, use of spinal and regional anesthesia, and evidence-based guidelines for prevention of venous thromboembolic disease. Adequate pain control is critical to recovery. In a prospective, randomized controlled trial, Lamplot and colleagues10 showed that the use of multimodal analgesia correlated with improved pain scores, decreased narcotic usage, faster functional recovery, and higher patient satisfaction after total knee arthroplasty (TKA). In another study, Quack and colleagues11 performed a systematic review of the literature on fast-track rehabilitation and found that it reduced both inpatient length of stay and costs after TKA. With respect to anesthetic choice, Pugely and colleagues12 reviewed a national database of 14,052 cases of primary TKA and found that patients with multiple comorbidities were at higher risk of complications after general anesthesia when compared with spinal anesthesia. We should continue to invest in safer and more effective modalities for pain control and functional recovery.
Last but not least, in today’s era of Medicare’s Comprehensive Care for Joint Replacement, the role of low-volume orthopedic surgeons performing TJA deserves special mention. Over the next few years, we could likely see a decline in the role of low-volume surgeons in favor of high-volume surgeons. While most orthopedic surgeons are comfortable doing primary TJA, failed cases and complications are frequently referred to larger centers, which may create frustration among patients owing to fragmentation of care. The economic pressures related to bundled payments could further influence this transition. Given the lack of a widespread, long-standing national joint registry, the incidence of failed TJA performed by low-volume orthopedic surgeons compared with high-volume orthopedic surgeons is unknown. However, multiple studies have shown surgeon volume to be associated with lower rates of complication, mortality, readmission, reoperation, and discharge to postacute facilities.13-16 As hospitals assume further financial risk, considerable data on physician performance will undoubtedly be gathered and leveraged. Time and data will determine the value of this transition of care.
Today, more than ever, we are challenged to provide efficient, high-quality, patient-centered care. As our nation grapples with reforming a broken health care system, initiatives like the Comprehensive Care for Joint Replacement will continue to emerge in the future. Orthopedic surgeons are the gatekeepers of the system and therefore hold significant responsibility to patients and society. Ensuring good outcomes should be a top priority not just from a financial standpoint, but as a moral obligation. We shall continue to be leaders in the face of challenges, using innovation and integrity to produce the best results and advance our profession.
1. Comprehensive Care for Joint Replacement model. Centers for Medicare and Medicaid Services website. https://innovation.cms.gov/initiatives/cjr. Updated December 21, 2015. Accessed December 30, 2015.
2. Wilson NA, Schneller ES, Montgomery K, Bozic KJ. Hip and knee implants: current trends and policy considerations. Health Aff. 2008;27(6):1587-1598.
3. Bozic KJ, Lau E, Ong K, et al. Risk factors for early revision after primary total hip arthroplasty in Medicare patients. Clin Orthop Relat Res. 2014;472(2):449-454.
4. Bozic KJ, Lau E, Ong K, et al. Risk factors for early revision after primary TKA in Medicare patients. Clin Orthop Relat Res. 2014;472(1):232-237.
5. Mason JB. The new demands by patients in the modern era of total joint arthroplasty: a point of view. Clin Orthop Relat Res. 2008;466(1):146-152.
6. Riddle DL, Singh JA, Harmsen WS, Schleck CD, Lewallen DG. Clinically important body weight gain following knee arthroplasty: a five-year comparative cohort study. Arthritis Care Res. 2013;65(5):669-677.
7. Zeni JA Jr, Snyder-Mackler L. Most patients gain weight in the 2 years after total knee arthroplasty: comparison to a healthy control group. Osteoarthritis Cartilage. 2010;18(4):510-514.
8. Ast MP, Abdel MP, Lee YY, Lyman S, Ruel AV, Westrich GH. Weight changes after total hip or knee arthroplasty: prevalence, predictors, and effects on outcomes. J Bone Joint Surg Am. 2015;97(11):911-919.
9. Healy WL, Sharma S, Schwartz B, Iorio R. Athletic activity after total joint arthroplasty. J Bone Joint Surg Am. 2008;90(10):2245-2252.
10. Lamplot JD, Wagner ER, Manning DW. Multimodal pain management in total knee arthroplasty: a prospective randomized controlled trial. J Arthroplasty. 2014;29(2):329-334.
11. Quack V, Ippendorf AV, Betsch M, et al. Multidisciplinary rehabilitation and fast-track rehabilitation after knee replacement: faster, better, cheaper? A survey and systematic review of literature [in German]. Rehabilitation (Stuttg). 2015;54(4):245-251.
12. Pugely AJ, Martin CT, Gao Y, Mendoza-Lattes S, Callaghan JJ. Differences in short-term complications between spinal and general anesthesia for primary total knee arthroplasty. J Bone Joint Surg Am. 2013;95(3):193-199.
13. Katz JN, Losina E, Barrett J, et al. Association between hospital and surgeon procedure volume and outcomes of total hip replacement in the United States medicare population. J Bone Joint Surg Am. 2001;83(11):1622-1629.
14. Manley M, Ong K, Lau E, Kurtz SM. Effect of volume on total hip arthroplasty revision rates in the United States Medicare population. J Bone Joint Surg Am. 2008;90(11):2446-2451.
15. Bozic KJ, Maselli J, Pekow PS, Lindenauer PK, Vail TP, Auerbach AD. The influence of procedure volumes and standardization of care on quality and efficiency in total joint replacement surgery. J Bone Joint Surg Am. 2010;92(16):2643-2652.
16. Lau RL, Perruccio AV, Gandhi R, Mahomed NN. The role of surgeon volume on patient outcome in total knee arthroplasty: a systematic review of the literature. BMC Musculoskelet Disord. 2012;13:250.