User login
Information about tests for breast cancer: What are we telling people?
We reviewed publications currently available about breast cancer screening to assess what information was provided about test accuracy and pretest and posttest disease probabilities, as this information is needed by consumers to make informed decisions about whether to undergo testing and to fully understand test results. A rating form was developed and used to assess 54 publications about their reports of breast cancer tests. A description of how the test is done was provided by almost all publications (93%). About half (48%) provided some information about possible adverse effects of the test. Eighteen percent of publications provided some (generally qualitative) information about test accuracy, and none provided quantitative information about the probability of disease given normal and abnormal test results.
It has been well established that patients want to participate in decisions about their treatment options1-3; therefore, they most likely also wish to participate in decisions about whether to undergo common diagnostic tests. A literature review (using the MESH headings Patient education, Consumer participation, and Sensitivity and Specificity) revealed only 1 study of patient knowledge and understanding of test accuracy for routine diagnostic tests.4 This study found that patients knew little about disease probabilities and diagnostic test characteristics, even if they had previous experience with the target disease. Some studies have addressed the information that people should be given about screening tests,5-8 and guidelines from the General Medical Council of the United Kingdom specify that information about the likelihood of positive or negative findings including false-negative and false-positive results must be provided.9 Logically, similar information should be available to individuals undergoing common diagnostic tests, but to our knowledge, no systematic assessment of the information available to consumers about common tests has been conducted. We therefore set out to assess the information provided about common tests in current consumer publications. Given the findings of the previous study,4 we were particularly interested to see whether information about test accuracy and about pretest and posttest probabilities was provided. We assessed breast cancer screening and diagnostic tests because much has been written for the public about breast cancer tests, and the information provided is usually relatively sophisticated.
Methods
The rating form
We developed a rating form to record the type of information in each publication. Following the recommendation that consumers’ questions should drive the content of information,3 we used “Questions to ask your physician about tests” in Smart Health Choices, a consumer-oriented book about making health decisions,10 and the General Medical Council guideline for providing information about screening tests9 to develop the rating form. In addition to assessing information about false-positive and false-negative results (test accuracy), pretest probabilities and posttest probabilities given a normal or abnormal test result, we assessed whether information was given about how the test is conducted, likely emotional responses to being tested, and shared clinical decision making. The rating form consisted of 16 items (see Table W1, available at http://www.jfponline.com). A 5-point Likert scale was used to rate the publications on each item from 1 (no information) to 5 (detailed information).
The publications
In December 1999 and January 2000 we telephoned the New South Wales (NSW) Cancer Council (the leading cancer advocacy center in NSW), the NSW BreastScreen Coordinating Unit (which coordinates all government-funded breast screening and assessment services in NSW, operating from 36 clinics) and 2 large private breast clinics. We also phoned the larger BreastScreen clinics directly. We asked for all pamphlets, booklets, or other written patient education materials about breast tests. Publications were received from 12 locations of 14 telephoned, (86%).
Rating agreement
We chose 10 publications at random and 2 of us (A.B. and P.B.) rated them independently. Overall, there was perfect agreement for 79% of the items, near agreement (1 point difference on the Likert scale) on 12% of items, and more than 1 point difference on the Likert scale on the remaining 9% of items. Based on these results we modified the scale slightly to reduce ambiguity and clarified how to rate information in a written guide. One of us (E.C.) rated all 54 publications using the guide and the rating form.
Results
We received 54 publications. Of these, 43% contained information on breast self-examination, 51% clinical examination, 69% screening mammography, 44% diagnostic mammography, 30% diagnostic ultrasound, 30% fine-needle aspiration biopsy, 28% core biopsy, 13% open surgical biopsy, and 7% genetic testing. The publications were written by cancer organisations, the BreastScreen Coordinating Unit, and by individual public and private clinics. Most were brief (1–4 A4 pages) although 1, on all aspects of breast cancer detection and treatment, was 44 pages long.
Almost all publications described how the test is done and half provided information about possible adverse effects of tests (Table). Only a minority of publications provided specific information about pretest probability (eg, how breast cancer risk changes with age), test accuracy, or posttest probability (Table). Where breast cancer risk was mentioned it was usually given in the form of a lifetime risk of a woman developing breast cancer. However, 13% of publications provided information about the risk of developing breast cancer in the next 5 to 10 years and one gave age-specific risks. Information about test accuracy was given as “not all cancers are detected” by the test (9%) or “9 out of 10 cancers are detected” by the test (7%). Quantitative estimates of specificity and positive predictive value were provided in 1 publication. Information about the probability of disease given a positive test result was given as “About 1 in 20 women are asked to come back for further tests. 9 out of 10 women who are recalled do not have breast cancer” in a few publications. Information about posttest probability given a normal test result was not given in any publication. Results of ratings on other items are available directly from the corresponding author.
TABLE
Percentage of 54 patient education publications rated as providing information on key items about breast cancer screening
| Information about | Publications providing any information (rating 2-5) | Publications providing substantial information (rating 4 or 5) |
|---|---|---|
| How the test is done (%) | 93 | 57 |
| How breast cancer risk varies by age (%) | 37 | 15 |
| Adverse effects of tests (%) | 48 | 9 |
| Test accuracy, ie, false-positive and false-negative results (%) | 18 | 2 |
| Posttest probability given a normal or abnormal test result (%) | 20 | 0 |
Discussion
We found that the quantitative information women need to make informed choices about whether to undergo a breast cancer screening and to fully understand the test results was lacking in most publications. The most commonly used format for expressing the prior probability of breast cancer was lifetime risk; age-specific information was rarely provided. As the risk of breast cancer varies greatly with age, age-specific prior probabilities, not lifetime risk, are needed for informed decision making. Few publications provided information about test accuracy. Failure to acknowledge that tests may give false-positive and false-negative results may mislead people in interpreting their results. For example, people may think that if the test is negative, disease is absent, whereas in reality a negative test reduces but does not eliminate the possibility of disease. Conversely, many tests give positive (or abnormal) results, which prompt anxiety even though disease is absent. In the absence of information about test accuracy it is likely that misconceptions about test results will persist.
Some limitations of the study should be noted. Although publications commonly used in New South Wales (the most populous state of Australia with approximately one third of the total national population) are unlikely to have been missed in this study, we cannot guarantee that all publications currently in use were obtained. Secondly, we acknowledge that the ratings may have been different if others rated these publications. However, it is unlikely that either of these considerations is substantial enough to affect the general direction of the findings.
In conclusion, we suggest that there is an urgent need to ascertain what information consumers need about screening and diagnostic tests so they can make rational, informed choices. Communicating information about pretest probability, test accuracy, and posttest probability to consumers will require careful development and evaluation work. However, this work is essential so that people can give truly informed consent to being tested. Further, good information is needed for those people who want to participate actively in decisions about whether to undergo a test, and to support more accurate patient understanding of test results.
1. Degner LF, Kristjanson LJ, Bowman D, et al. Information needs and decisional p in women with breast cancer. JAMA 1997;277:1485-92.
2. Coulter A. Evidence based patient information is important, so there needs to be a national strategy to ensure it. BMJ 1998;317:225-6.
3. Coulter A, Entwistle V, Gilbert D. Sharing decisions with patients: is the information good enough? BMJ 1999;318:318-22.
4. Hamm RM, Smith SL. The accuracy of patients’ judgements of disease probability and test sensitivity and specificity. J Fam Pract 1998;47:44-52.
5. Wolf AM, Becker DM. Cancer screening and informed patient discussions: truth and consequences. Arch Intern Med 1996;156:1069-72.
6. Raffle AE. Information about screening—is it to achieve high uptake or to ensure informed choice? Health Expect 2001;4:92-8.
7. Goyder E, Barratt A, Irwig LM. Telling people about screening programmes and screening test results: how can we do it better? J Med Screen 2000;7:123-6.
8. Marteau TM, Saidi G, Goodburn S, Lawton J, Michie S, Bobrow M. Numbers or words? A randomized controlled trial of presenting screen negative results to pregnant women. Prenat Diagn 2000;20:714-8.
9. General Medical Council. Seeking Patients’ Consent: The Ethical Considerations. London, UK: General Medical Council; 1999.
10. Irwig J, Irwig L, Sweet M. Smart Health Choices: How to Make Informed Health Decisions. Sydney, Australia: Allen & Unwin; 1999.
We reviewed publications currently available about breast cancer screening to assess what information was provided about test accuracy and pretest and posttest disease probabilities, as this information is needed by consumers to make informed decisions about whether to undergo testing and to fully understand test results. A rating form was developed and used to assess 54 publications about their reports of breast cancer tests. A description of how the test is done was provided by almost all publications (93%). About half (48%) provided some information about possible adverse effects of the test. Eighteen percent of publications provided some (generally qualitative) information about test accuracy, and none provided quantitative information about the probability of disease given normal and abnormal test results.
It has been well established that patients want to participate in decisions about their treatment options1-3; therefore, they most likely also wish to participate in decisions about whether to undergo common diagnostic tests. A literature review (using the MESH headings Patient education, Consumer participation, and Sensitivity and Specificity) revealed only 1 study of patient knowledge and understanding of test accuracy for routine diagnostic tests.4 This study found that patients knew little about disease probabilities and diagnostic test characteristics, even if they had previous experience with the target disease. Some studies have addressed the information that people should be given about screening tests,5-8 and guidelines from the General Medical Council of the United Kingdom specify that information about the likelihood of positive or negative findings including false-negative and false-positive results must be provided.9 Logically, similar information should be available to individuals undergoing common diagnostic tests, but to our knowledge, no systematic assessment of the information available to consumers about common tests has been conducted. We therefore set out to assess the information provided about common tests in current consumer publications. Given the findings of the previous study,4 we were particularly interested to see whether information about test accuracy and about pretest and posttest probabilities was provided. We assessed breast cancer screening and diagnostic tests because much has been written for the public about breast cancer tests, and the information provided is usually relatively sophisticated.
Methods
The rating form
We developed a rating form to record the type of information in each publication. Following the recommendation that consumers’ questions should drive the content of information,3 we used “Questions to ask your physician about tests” in Smart Health Choices, a consumer-oriented book about making health decisions,10 and the General Medical Council guideline for providing information about screening tests9 to develop the rating form. In addition to assessing information about false-positive and false-negative results (test accuracy), pretest probabilities and posttest probabilities given a normal or abnormal test result, we assessed whether information was given about how the test is conducted, likely emotional responses to being tested, and shared clinical decision making. The rating form consisted of 16 items (see Table W1, available at http://www.jfponline.com). A 5-point Likert scale was used to rate the publications on each item from 1 (no information) to 5 (detailed information).
The publications
In December 1999 and January 2000 we telephoned the New South Wales (NSW) Cancer Council (the leading cancer advocacy center in NSW), the NSW BreastScreen Coordinating Unit (which coordinates all government-funded breast screening and assessment services in NSW, operating from 36 clinics) and 2 large private breast clinics. We also phoned the larger BreastScreen clinics directly. We asked for all pamphlets, booklets, or other written patient education materials about breast tests. Publications were received from 12 locations of 14 telephoned, (86%).
Rating agreement
We chose 10 publications at random and 2 of us (A.B. and P.B.) rated them independently. Overall, there was perfect agreement for 79% of the items, near agreement (1 point difference on the Likert scale) on 12% of items, and more than 1 point difference on the Likert scale on the remaining 9% of items. Based on these results we modified the scale slightly to reduce ambiguity and clarified how to rate information in a written guide. One of us (E.C.) rated all 54 publications using the guide and the rating form.
Results
We received 54 publications. Of these, 43% contained information on breast self-examination, 51% clinical examination, 69% screening mammography, 44% diagnostic mammography, 30% diagnostic ultrasound, 30% fine-needle aspiration biopsy, 28% core biopsy, 13% open surgical biopsy, and 7% genetic testing. The publications were written by cancer organisations, the BreastScreen Coordinating Unit, and by individual public and private clinics. Most were brief (1–4 A4 pages) although 1, on all aspects of breast cancer detection and treatment, was 44 pages long.
Almost all publications described how the test is done and half provided information about possible adverse effects of tests (Table). Only a minority of publications provided specific information about pretest probability (eg, how breast cancer risk changes with age), test accuracy, or posttest probability (Table). Where breast cancer risk was mentioned it was usually given in the form of a lifetime risk of a woman developing breast cancer. However, 13% of publications provided information about the risk of developing breast cancer in the next 5 to 10 years and one gave age-specific risks. Information about test accuracy was given as “not all cancers are detected” by the test (9%) or “9 out of 10 cancers are detected” by the test (7%). Quantitative estimates of specificity and positive predictive value were provided in 1 publication. Information about the probability of disease given a positive test result was given as “About 1 in 20 women are asked to come back for further tests. 9 out of 10 women who are recalled do not have breast cancer” in a few publications. Information about posttest probability given a normal test result was not given in any publication. Results of ratings on other items are available directly from the corresponding author.
TABLE
Percentage of 54 patient education publications rated as providing information on key items about breast cancer screening
| Information about | Publications providing any information (rating 2-5) | Publications providing substantial information (rating 4 or 5) |
|---|---|---|
| How the test is done (%) | 93 | 57 |
| How breast cancer risk varies by age (%) | 37 | 15 |
| Adverse effects of tests (%) | 48 | 9 |
| Test accuracy, ie, false-positive and false-negative results (%) | 18 | 2 |
| Posttest probability given a normal or abnormal test result (%) | 20 | 0 |
Discussion
We found that the quantitative information women need to make informed choices about whether to undergo a breast cancer screening and to fully understand the test results was lacking in most publications. The most commonly used format for expressing the prior probability of breast cancer was lifetime risk; age-specific information was rarely provided. As the risk of breast cancer varies greatly with age, age-specific prior probabilities, not lifetime risk, are needed for informed decision making. Few publications provided information about test accuracy. Failure to acknowledge that tests may give false-positive and false-negative results may mislead people in interpreting their results. For example, people may think that if the test is negative, disease is absent, whereas in reality a negative test reduces but does not eliminate the possibility of disease. Conversely, many tests give positive (or abnormal) results, which prompt anxiety even though disease is absent. In the absence of information about test accuracy it is likely that misconceptions about test results will persist.
Some limitations of the study should be noted. Although publications commonly used in New South Wales (the most populous state of Australia with approximately one third of the total national population) are unlikely to have been missed in this study, we cannot guarantee that all publications currently in use were obtained. Secondly, we acknowledge that the ratings may have been different if others rated these publications. However, it is unlikely that either of these considerations is substantial enough to affect the general direction of the findings.
In conclusion, we suggest that there is an urgent need to ascertain what information consumers need about screening and diagnostic tests so they can make rational, informed choices. Communicating information about pretest probability, test accuracy, and posttest probability to consumers will require careful development and evaluation work. However, this work is essential so that people can give truly informed consent to being tested. Further, good information is needed for those people who want to participate actively in decisions about whether to undergo a test, and to support more accurate patient understanding of test results.
1. Degner LF, Kristjanson LJ, Bowman D, et al. Information needs and decisional p in women with breast cancer. JAMA 1997;277:1485-92.
2. Coulter A. Evidence based patient information is important, so there needs to be a national strategy to ensure it. BMJ 1998;317:225-6.
3. Coulter A, Entwistle V, Gilbert D. Sharing decisions with patients: is the information good enough? BMJ 1999;318:318-22.
4. Hamm RM, Smith SL. The accuracy of patients’ judgements of disease probability and test sensitivity and specificity. J Fam Pract 1998;47:44-52.
5. Wolf AM, Becker DM. Cancer screening and informed patient discussions: truth and consequences. Arch Intern Med 1996;156:1069-72.
6. Raffle AE. Information about screening—is it to achieve high uptake or to ensure informed choice? Health Expect 2001;4:92-8.
7. Goyder E, Barratt A, Irwig LM. Telling people about screening programmes and screening test results: how can we do it better? J Med Screen 2000;7:123-6.
8. Marteau TM, Saidi G, Goodburn S, Lawton J, Michie S, Bobrow M. Numbers or words? A randomized controlled trial of presenting screen negative results to pregnant women. Prenat Diagn 2000;20:714-8.
9. General Medical Council. Seeking Patients’ Consent: The Ethical Considerations. London, UK: General Medical Council; 1999.
10. Irwig J, Irwig L, Sweet M. Smart Health Choices: How to Make Informed Health Decisions. Sydney, Australia: Allen & Unwin; 1999.
Improving influenza vaccination rates in the elderly
BACKGROUND: Vaccination coverage for influenza in the elderly remains low when the physician is the only person responsible for immunization. Integration of other health care workers may improve the coverage rate of at-risk groups.
OBJECTIVES: To estimate vaccination coverage rate by using a strategy based on the systematic intervention of a health care professional proposing vaccination before the doctor’s consultation, to evaluate the changes in coverage rates before and after introduction of this strategy, and to assess the feasibility of this intervention and the achieved coverage rate in family physician offices
STUDY DESIGN: Prospective study in a medical outpatient clinic and 5 family physician practices in Switzerland.
POPULATION: Participants consisted of all patients 65 years or older attending a medical outpatient clinic during the vaccination period in 1999 (n = 401), patients 65 years or older regularly followed at a medical outpatient clinic in 1998 and 1999 (n = 195), and patients 65 years or older presenting to 5 family physician offices in 1999 (n = 598).
OUTCOME MEASURED: Rates of vaccination coverage.
RESULTS: Among all participants, vaccination coverage rates in 1999 were 85% at the medical outpatient clinic and 83% in family physician offices. Among participants regularly followed at the medical outpatient clinic, vaccination coverage increased from 48% in 1998 to 76% in 1999. Rates of refusal were 9% at the medical outpatient clinic and 14% in the family physician offices.
CONCLUSIONS: The systematic intervention of a health care professional to suggest vaccination before the doctor’s visit is an effective measure to achieve high coverage rate. Such a strategy also improves outpatient clinic or private practice efficiency by reducing pressures on physicians.
Annual influenza vaccination is recommended for all persons 65 years and older.1-3 Unfortunately, coverage rate remains low. In Switzerland during the winter season of 1998-1999, estimated vaccination coverage was only 8% in the general population.4 In institutionalized elderly patients, coverage was 37% in the same study. In 1994, the rate estimated from a telephonic survey was only 36% in elderly patients in Geneva.5 Since then, an active promotional campaign among the public led to a coverage rate among persons older than 65 years of about 60% (L. Toscani, personal communication 2000), a rate that approaches that in the United States (67%).6
Apart from making the general population or the target groups aware of the importance of the vaccination to prevent influenza complications, a strategy commonly used to improve coverage consists of training the physicians. However, their knowledge about vaccination does not always explain their behavior; although doctors know that vaccines are efficacious and are convinced that they should offer vaccination to all at-risk patients, they do not propose it to all eligible patients.7 Reimbursement of vaccines, as done since 1996 in Switzerland, does not seem to increase vaccination rates.8
At the Medical Outpatient Clinic, University of Lausanne, we recorded the influenza vaccination coverage rate of patients 65 years and older who were followed regularly in 1997, after an intensive education of physicians including a state-of-the-art lecture and interactive seminars; the same was done in 1998, but letters also were sent to all patients who did not have an appointment during the vaccination period. The vaccination coverage increased from 39% in 1997 to 47% in 1998, presumably because of the reminder letter.9 This rate was still unsatisfactory. We postulated that the main reason for low rate of influenza vaccination coverage of elderly patients was the physicians’ omission to propose the vaccination rather than the patients’ refusal. To test this hypothesis and to improve the coverage at the same time, we introduced at the medical outpatient clinic a strategy coupling a systematic intervention of a medical person allowed to do injections (medical student) with the existing educational program and reminder letters. A similar method (except for the reminder letters) was applied in 5 general practices, with the receptionists providing the information and the paramedical staff performing the vaccination.
The specific objectives were (1) to estimate vaccination coverage rate by using a strategy based on the systematic intervention of a health care professional proposing vaccination before the doctor’s consultation, (2) to evaluate the changes in coverage rates before and after introduction of the strategy, and (3) to assess the feasibility of this intervention and the achieved coverage rate in family physicians’ offices.
Methods
The protocol was approved by the ethical committee of the Department of Internal Medicine, University Hospital, Lausanne. Table 1 summarizes the study profile, populations, strategy applied, and outcome measures that are described below. The study took place in the Medical Outpatient Clinic, University of Lausanne, which provides medical care to the general population (attendees are biased toward young people, refugees, foreigners, and elderly individuals with low incomes); and in 1 rural general practice office (Orbe) and 2 urban general practice offices (Neuchâtel), with 5 physicians.
Study populations
To estimate vaccination coverage rate after implementing the new strategy in the medical outpatient clinic (objective 1), we included all patients 65 years and older attending the 1999 vaccination period (401 patients). To evaluate the changes in coverage rates before and after the introduction of the strategy (objective 2), we included patients 65 years and older who were followed regularly at medical outpatient clinic in 1998 and 1999 (195 patients). To assess the feasibility of this intervention and the achieved coverage rate in family physicians’ offices, we included all patients 65 years and older attending family physicians’ offices in 1999 (598 patients).
Medical outpatient clinic procedures
Pre-intervention season (1998). During the vaccination period (mid-October to mid-December), all patients 65 years and older presented to the receptionist and then waited until they were seen by a first to fifth-year resident physician who proposed the vaccination during the consultation. The injection was then done by a nurse. Alternatively, anyone could go straight to the nurse (walk-in clinic) and ask for an influenza shot, which was done after checking that there was no contraindication (egg allergy, fever during the past 2 days, or use of anticoagulants, in which case subcutaneous injection was performed). To check that all patients regularly followed at the medical outpatient clinic had made contact during the vaccination period, an independent registrar in mid-November reviewed all files of patients 65 years and older. For those regularly followed, he checked whether an appointment had been made; if not, a reminder letter was sent to the patient.
Intervention season (1999). During the vaccination period, all patients 65 years and older were told by the receptionist that a medical student would propose an influenza vaccination before seeing the doctor. The medical student informed the patients about influenza complications and prevention by vaccination, and asked them whether they had been vaccinated in the previous year. The patient then had to decide whether to be vaccinated immediately, discuss the vaccination with the doctor first, or refuse the vaccination. In case of refusal, the reason was investigated. The patient who agreed to the vaccination received the injection from the medical student and a label was attached to the patient’s file to inform the doctor about the vaccination status. The same procedure performed in 1998 was applied for the reminder letter
General practice procedures
During the intervention season only (1999), the receptionist at the admission desk proposed influenza vaccination to all patients 65 years and older and the paramedical staff promptly performed the injection, if the patient agreed. The same information and questionnaires were applied in the family physician’s offices and the medical outpatient clinic.
Outcomes
Several outcomes were predefined: (1) vaccination coverage rate of all patients 65 years and older who attended the medical outpatient clinic spontaneously or on appointment during the 1999 vaccination period; (2) vaccination coverage rate of patients 65 years and older regularly followed (excluding those coming only once without a follow-up) at the medical outpatient clinic in 1998 and 1999 (all were contacted by a reminder letter, if not seen during vaccination period); (3) vaccination coverage rate of all patients 65 years and older who attended the family physicians’ offices during the 1999 vaccination period; and (4) reasons for nonvaccination among those interviewed.
Data management and analysis
The data were entered immediately into Epi Info 6.0 and analyzed with SPSS 7.5. Testing for differences between the 1998 and 1999 rates in the medical outpatient clinic was done with chi-square tests.
Results
Rate of vaccination coverage at the medical outpatient clinic during the intervention period
A total of 401 patients 65 years and older came to the outpatient clinic during the vaccination period in 1999. The median age was 74 years (range, 65-97 years) and most patients were male (56%). Table 2 shows that 85% (341/401) accepted the vaccination at the medical outpatient clinic. Of those, 52% were advised by the medical student before consultation, 26% came spontaneously to the nurse for influenza vaccination, and 19% came with advice from their physicians. The rate of refusal was 9% (see Table 2 for details).
Changes in rates of vaccination coverage of patients regularly followed at the medical outpatient clinic in 1998 and 1999
In 1998, 195 patients 65 years and older regularly followed at the medical outpatient clinic were monitored.9 A reminder letter was sent to patients who did not have an appointment during the vaccination period (73/195 patients). About one fifth (15/73) came for vaccination after the reminder letter. Overall, 48% (93/195) were vaccinated in 1998.
In 1999, 325 of 401 patients 65 years and older were regularly followed by a resident-physician. The larger number in 1999 (when compared 195 patients in 1998) was due to the fact that, in 1998, only those who followed in 1997 were monitored. Among the 325 patients, 268 came to the office during the vaccination period; 57 persons regularly followed did not have an appointment during the vaccination period and were sent a reminder letter. Overall, 76% of patients regularly followed (246/325) were vaccinated in 1999. Of those, 65% were advised by the medical student. The rate of refusal was 11%. Only 2 patients in the targeted population were missed during the target period, and 2 patients had medical contraindications for vaccination. Thus, the new strategy led to a relative increase of 58% for vaccination coverage (from 48% to 76%; P < .0001, Yates correction).
Rate of vaccination coverage in family physicians’ offices in 1999
A total of 598 patients 65 years and older attended their family physicians’ offices during the vaccination period. The median age was 74 years (range, 65-99 years) and most were female (62%). Eighty-three percent accepted the vaccination at the family physicians’ offices, 3% wished to be vaccinated somewhere else, and 14% refused.
Reasons for nonvaccination
The rates of refusal were 14% in the family physician’s offices and 9% in the medical outpatient clinic. Reasons for nonvaccination in the medical outpatient clinic were obtaining the influenza vaccination elsewhere (5%) and medical contraindications (1%; Table 2).
Discussion
Our study demonstrated that the systematic intervention of a paramedical person before the doctor’s consultation can lead to a considerable improvement in vaccination coverage in an ambulatory setting. A 58% relative increase (from 48% to 76%) over 1 year in the same institution has never been achieved. This suggested that failure of the physician to propose vaccination is an important reason for low vaccination coverage of high-risk patients in teaching institutions, where physician turnover is high. Thanks to our organizational strategy, we reached an 85% vaccination coverage among all outpatient attendees, which far surpassed that achieved by an ongoing educational program or alternative strategies such as reminder letters.
Until now, the highest coverage ever reported in Europe in persons 65 years and older was 82% in a study in Finland, where the investigators used an age-based strategy, with free vaccines and personnel-mailed reminders.10 Even when efficacious11 and cost effective,12 these strategies are insufficiently used.4 Other means to improve vaccination coverage such as centralized planning identification through computerized enrollment files at central registry and immunization clinics have improved vaccination coverage rates to almost 80% among chronically ill seniors in the United States.13
Two American studies showed that approaches incorporating administrative and organizational measures were more successful in improving vaccination rates than the education of providers. A pilot study14 and a 10-year follow-up15 done in the Minneapolis Department of Veterans Affairs Medical Center used a strategy including annual educational and publicity mailing to patients, walk-in clinics for vaccine administration, standing orders for nurses, and use of standardized patient information and medical record documentation forms. The follow-up study showed a remarkable improvement in the coverage rate, which reached 92% in 1996-1997 in specific groups. Another study done in the University Department of Emergency Medicine of Chicago that used standing orders for nurses at triage was only partly successful, with 47% coverage.16
Our study adds to the knowledge gathered in the United States, where administrative and organizational strategies (standing orders for nurses) improved vaccination coverage significantly.14-16 These studies were conducted in a different population sample, including hospitalized patients and other high-risk groups, which is quite different from the situation in general practice. Comparing vaccination coverage rates between different studies is always hazardous because of differences in inclusion criteria and reporting biases. The highest vaccination coverage ever achieved was 92%, but the method used for the rate estimation was a mailed survey where vaccinated persons may have been more likely to respond than nonvaccinated ones.15 The investigators exported their program from a teaching hospital to a community outpatient setting, with an increase in coverage from 56% to 72% in 1 clinic and no significant increase in the other clinic, which shows that several factors should be considered when a new strategy is implemented (staff, motivation, etc).17 The relatively low coverage (47%) reached in another study conducted in an emergency department was due in part to the fact that the nurse dedicated to providing vaccination was diverted from the preventive task of caring for patients when the workload increased. In addition, only one fourth of the emergency attendees was screened.16
To our knowledge, this is the first time that such an active strategy has been reported and applied in family physicians’ offices. The implementation in private practices documents its feasibility and effectiveness in those settings. The consistent coverage rates obtained in the medical outpatient clinic and the general practices (85% and 83%, respectively) confirmed the usefulness of the strategy, whatever the patient population and the medical staff involved. One may argue that patients had little choice between accepting or actively refusing the vaccination. We hope that the quality of information provided to the elderly, the possibility for them to ask specific questions that come to mind, and even to delay the decision until they can discuss the decision further with the doctor balances the potential enforcement.
The main disadvantage of our strategy is the need for an additional person in the outpatient clinic. The direct cost of an extra person in public service can be justified if it decreases the indirect costs for society, which is the case for influenza vaccination.12 More pragmatically, at the institutional level, the additional income generated by the increase of vaccine sales outweighed the salary of the medical student (about US$100/day for a total of 40 days, ie, 20 working days for 2 months). The implementation in the family physicians’ offices showed that such a procedure can work in a small setting without additional staff. Counseling about vaccination represents an additional task for the paramedical personnel, but it certainly provides more credit to the overall work and improves the therapeutic network. Also, because the vaccination has to be proposed, the time for discussion has to be taken by whoever is the most willing to do the job.
Some doctors may feel that this strategy excludes them from important duties. We must face the reality that physicians often do not accomplish their tasks properly. With our procedure, they remain informed about the vaccination status of their patients and maintain their important role in counseling patients who cannot decide about the vaccination or when problems arise.
One can argue that the increase in vaccination coverage rate was due, at least in part, to external factors such as media propaganda, and that the new strategy played only a marginal role. Of course, we cannot exclude such an influence, but it certainly unlikely was to be the cause of a 58% increase in coverage rate; indeed, no particular campaign was launched in 1999 and no change in coverage rate between 1998 and 1999 was observed in a similar institution in the same area. We chose to use historical controls because we were convinced that the new strategy would dramatically improve vaccination in the elderly and felt therefore that it was unethical not to offer this procedure to all our patients. Moreover, the main interest of the study was to investigate the maximum coverage rate that could be expected with a very active intervention and to estimate precisely the rate of true refusals, so that defined objectives in terms of coverage rates can be set in similar institutions.
The new strategy assessed in this study is in line with the recommendations of the Advisory Committee on Immunization Practices, published in March 2000, that promoted the use of standing orders to improve adult vaccination delivery.18 Evidence of effectiveness of such programs is increasing. They could be adapted to other preventive measures to improve delivery of those services, and they could be used to improve outpatient clinic efficiency by reducing pressures on physicians.
Acknowledgments
We thank M. Cheseaux and S. Martin, the medical students responsible for providing vaccine information and delivery and data entry, the resident-physicians at medical outpatient clinic, and the nurses and receptionists in the medical outpatient clinic and the family physicians’ practices.
1. WHO Influenza vaccination recommendations. Wkly Epidemiol Rec 1999;74:57-64.
2. Working Group Influenza. Recommendations for influenza vaccination during the 1999/2000 season. Bull OFSP 1999;39:737-9.
3. CDC Prevention and control of influenza: recommendations of the Advisory Committee on Immunization Practices (ACIP). MMWR Morb Mortal Wkly Rep 1998;47:1-26.
4. Ammon CE. Vaccination against influenza in Switzerland. A survey in health facilities. Bull OFSP 1999;4:62-4.
5. Gauthey L, Toscani L, Chamot E, Larequi T, Robert CF. Influenza vaccination coverage in the geriatric population of the State of Geneva, Switzerland. Eur J Pharmacol 1999;9:36-40.
6. Centers for Disease Control and Prevention. Influenza and pneumococcal vaccination levels among persons aged 65 years-United States, 1999. MMWR Morb Mortal Wkly Rep 2001;50:532-7.
7. McKinney WP, Barnas GP. Influenza immunization in the elderly: knowledge and attitudes do not explain physician behavior. Am J Pharmacol 1989;79:1422-4.
8. Etkind P, Simon M, Shannon S, et al. Impact of the Medicare Influenza Demonstration Project on influenza vaccination in a county in Massachusetts, 1988-1992. Community Health 1996;21:199-209.
9. Zorzoli M, Favrat B, D’Acremont V, Pécoud A, Genton B. Strategies to improve vaccination coverage among elderly patients. J Gen Intern Med 1999;14:83.-
10. Honkanen PO, Keistinen T, Kivela SL. The impact of vaccination strategy and methods of information on influenza and pneumococcal vaccination coverage in the elderly population. Vaccine 1997;15:317-20.
11. Armstrong K, Berlin M, Schwartz S, Propert K, Ubel P. Educational content and the effectiveness of influenza vaccination reminders. J Gen Intern Med 1999;14:695-7.
12. Baker AM, McCarthy B, Gurley VF, Yood MU. Influenza immunization in a managed care organization. J Gen Intern Med 1998;13:469-75.
13. Pearson DC, Jackson LA, Wagener B, Sarver L. A comprehensive influenza campaign in a managed care setting. Vaccine 1998;16:1718-21.
14. Margolis KL, Lofgren RP, Korn JE. Organizational strategies to improve influenza vaccine delivery. A standing order in a general medicine clinic. Arch Intern Med 1988;148:2205-7.
15. Nichol KL. Ten-year durability and success of an organized program to increase influenza and pneumococcal vaccination rates among high-risk adults. Am J Med 1998;105:385-92.
16. Slobodkin D, Kitlas J, Zielske P. Opportunities not missed systematic influenza and pneumococcal immunization in a public inner-city emergency department. Vaccine 1998;16:1795-802.
17. Margolis KL, Nichol KL, Wuorenma J. Exporting a successful influenza vaccination program from a teaching hospital to a community outpatient setting. J Am Geriatr Soc 1992;40:1021-3.
18. CDC Adult immunization programs in nontraditional settings: quality standard and guidance for program evaluation. A report of the national Vaccine Advisory Committee and Use of standing orders programs to increase adult vaccination rates. Recommendations of the Advisory Committee on Immunization Practices (ACIP). MMWR Morb Mortal Wkly Rep 2000;49:18-27.
Address reprint requests to Blaise Genton, MD, PhD, Policlinique Médicale Universitaire, César Roux 19, 1005 Lausanne, Switzerland. E-mail: [email protected].
To submit a letter to the editor on this topic, click here: [email protected].
BACKGROUND: Vaccination coverage for influenza in the elderly remains low when the physician is the only person responsible for immunization. Integration of other health care workers may improve the coverage rate of at-risk groups.
OBJECTIVES: To estimate vaccination coverage rate by using a strategy based on the systematic intervention of a health care professional proposing vaccination before the doctor’s consultation, to evaluate the changes in coverage rates before and after introduction of this strategy, and to assess the feasibility of this intervention and the achieved coverage rate in family physician offices
STUDY DESIGN: Prospective study in a medical outpatient clinic and 5 family physician practices in Switzerland.
POPULATION: Participants consisted of all patients 65 years or older attending a medical outpatient clinic during the vaccination period in 1999 (n = 401), patients 65 years or older regularly followed at a medical outpatient clinic in 1998 and 1999 (n = 195), and patients 65 years or older presenting to 5 family physician offices in 1999 (n = 598).
OUTCOME MEASURED: Rates of vaccination coverage.
RESULTS: Among all participants, vaccination coverage rates in 1999 were 85% at the medical outpatient clinic and 83% in family physician offices. Among participants regularly followed at the medical outpatient clinic, vaccination coverage increased from 48% in 1998 to 76% in 1999. Rates of refusal were 9% at the medical outpatient clinic and 14% in the family physician offices.
CONCLUSIONS: The systematic intervention of a health care professional to suggest vaccination before the doctor’s visit is an effective measure to achieve high coverage rate. Such a strategy also improves outpatient clinic or private practice efficiency by reducing pressures on physicians.
Annual influenza vaccination is recommended for all persons 65 years and older.1-3 Unfortunately, coverage rate remains low. In Switzerland during the winter season of 1998-1999, estimated vaccination coverage was only 8% in the general population.4 In institutionalized elderly patients, coverage was 37% in the same study. In 1994, the rate estimated from a telephonic survey was only 36% in elderly patients in Geneva.5 Since then, an active promotional campaign among the public led to a coverage rate among persons older than 65 years of about 60% (L. Toscani, personal communication 2000), a rate that approaches that in the United States (67%).6
Apart from making the general population or the target groups aware of the importance of the vaccination to prevent influenza complications, a strategy commonly used to improve coverage consists of training the physicians. However, their knowledge about vaccination does not always explain their behavior; although doctors know that vaccines are efficacious and are convinced that they should offer vaccination to all at-risk patients, they do not propose it to all eligible patients.7 Reimbursement of vaccines, as done since 1996 in Switzerland, does not seem to increase vaccination rates.8
At the Medical Outpatient Clinic, University of Lausanne, we recorded the influenza vaccination coverage rate of patients 65 years and older who were followed regularly in 1997, after an intensive education of physicians including a state-of-the-art lecture and interactive seminars; the same was done in 1998, but letters also were sent to all patients who did not have an appointment during the vaccination period. The vaccination coverage increased from 39% in 1997 to 47% in 1998, presumably because of the reminder letter.9 This rate was still unsatisfactory. We postulated that the main reason for low rate of influenza vaccination coverage of elderly patients was the physicians’ omission to propose the vaccination rather than the patients’ refusal. To test this hypothesis and to improve the coverage at the same time, we introduced at the medical outpatient clinic a strategy coupling a systematic intervention of a medical person allowed to do injections (medical student) with the existing educational program and reminder letters. A similar method (except for the reminder letters) was applied in 5 general practices, with the receptionists providing the information and the paramedical staff performing the vaccination.
The specific objectives were (1) to estimate vaccination coverage rate by using a strategy based on the systematic intervention of a health care professional proposing vaccination before the doctor’s consultation, (2) to evaluate the changes in coverage rates before and after introduction of the strategy, and (3) to assess the feasibility of this intervention and the achieved coverage rate in family physicians’ offices.
Methods
The protocol was approved by the ethical committee of the Department of Internal Medicine, University Hospital, Lausanne. Table 1 summarizes the study profile, populations, strategy applied, and outcome measures that are described below. The study took place in the Medical Outpatient Clinic, University of Lausanne, which provides medical care to the general population (attendees are biased toward young people, refugees, foreigners, and elderly individuals with low incomes); and in 1 rural general practice office (Orbe) and 2 urban general practice offices (Neuchâtel), with 5 physicians.
Study populations
To estimate vaccination coverage rate after implementing the new strategy in the medical outpatient clinic (objective 1), we included all patients 65 years and older attending the 1999 vaccination period (401 patients). To evaluate the changes in coverage rates before and after the introduction of the strategy (objective 2), we included patients 65 years and older who were followed regularly at medical outpatient clinic in 1998 and 1999 (195 patients). To assess the feasibility of this intervention and the achieved coverage rate in family physicians’ offices, we included all patients 65 years and older attending family physicians’ offices in 1999 (598 patients).
Medical outpatient clinic procedures
Pre-intervention season (1998). During the vaccination period (mid-October to mid-December), all patients 65 years and older presented to the receptionist and then waited until they were seen by a first to fifth-year resident physician who proposed the vaccination during the consultation. The injection was then done by a nurse. Alternatively, anyone could go straight to the nurse (walk-in clinic) and ask for an influenza shot, which was done after checking that there was no contraindication (egg allergy, fever during the past 2 days, or use of anticoagulants, in which case subcutaneous injection was performed). To check that all patients regularly followed at the medical outpatient clinic had made contact during the vaccination period, an independent registrar in mid-November reviewed all files of patients 65 years and older. For those regularly followed, he checked whether an appointment had been made; if not, a reminder letter was sent to the patient.
Intervention season (1999). During the vaccination period, all patients 65 years and older were told by the receptionist that a medical student would propose an influenza vaccination before seeing the doctor. The medical student informed the patients about influenza complications and prevention by vaccination, and asked them whether they had been vaccinated in the previous year. The patient then had to decide whether to be vaccinated immediately, discuss the vaccination with the doctor first, or refuse the vaccination. In case of refusal, the reason was investigated. The patient who agreed to the vaccination received the injection from the medical student and a label was attached to the patient’s file to inform the doctor about the vaccination status. The same procedure performed in 1998 was applied for the reminder letter
General practice procedures
During the intervention season only (1999), the receptionist at the admission desk proposed influenza vaccination to all patients 65 years and older and the paramedical staff promptly performed the injection, if the patient agreed. The same information and questionnaires were applied in the family physician’s offices and the medical outpatient clinic.
Outcomes
Several outcomes were predefined: (1) vaccination coverage rate of all patients 65 years and older who attended the medical outpatient clinic spontaneously or on appointment during the 1999 vaccination period; (2) vaccination coverage rate of patients 65 years and older regularly followed (excluding those coming only once without a follow-up) at the medical outpatient clinic in 1998 and 1999 (all were contacted by a reminder letter, if not seen during vaccination period); (3) vaccination coverage rate of all patients 65 years and older who attended the family physicians’ offices during the 1999 vaccination period; and (4) reasons for nonvaccination among those interviewed.
Data management and analysis
The data were entered immediately into Epi Info 6.0 and analyzed with SPSS 7.5. Testing for differences between the 1998 and 1999 rates in the medical outpatient clinic was done with chi-square tests.
Results
Rate of vaccination coverage at the medical outpatient clinic during the intervention period
A total of 401 patients 65 years and older came to the outpatient clinic during the vaccination period in 1999. The median age was 74 years (range, 65-97 years) and most patients were male (56%). Table 2 shows that 85% (341/401) accepted the vaccination at the medical outpatient clinic. Of those, 52% were advised by the medical student before consultation, 26% came spontaneously to the nurse for influenza vaccination, and 19% came with advice from their physicians. The rate of refusal was 9% (see Table 2 for details).
Changes in rates of vaccination coverage of patients regularly followed at the medical outpatient clinic in 1998 and 1999
In 1998, 195 patients 65 years and older regularly followed at the medical outpatient clinic were monitored.9 A reminder letter was sent to patients who did not have an appointment during the vaccination period (73/195 patients). About one fifth (15/73) came for vaccination after the reminder letter. Overall, 48% (93/195) were vaccinated in 1998.
In 1999, 325 of 401 patients 65 years and older were regularly followed by a resident-physician. The larger number in 1999 (when compared 195 patients in 1998) was due to the fact that, in 1998, only those who followed in 1997 were monitored. Among the 325 patients, 268 came to the office during the vaccination period; 57 persons regularly followed did not have an appointment during the vaccination period and were sent a reminder letter. Overall, 76% of patients regularly followed (246/325) were vaccinated in 1999. Of those, 65% were advised by the medical student. The rate of refusal was 11%. Only 2 patients in the targeted population were missed during the target period, and 2 patients had medical contraindications for vaccination. Thus, the new strategy led to a relative increase of 58% for vaccination coverage (from 48% to 76%; P < .0001, Yates correction).
Rate of vaccination coverage in family physicians’ offices in 1999
A total of 598 patients 65 years and older attended their family physicians’ offices during the vaccination period. The median age was 74 years (range, 65-99 years) and most were female (62%). Eighty-three percent accepted the vaccination at the family physicians’ offices, 3% wished to be vaccinated somewhere else, and 14% refused.
Reasons for nonvaccination
The rates of refusal were 14% in the family physician’s offices and 9% in the medical outpatient clinic. Reasons for nonvaccination in the medical outpatient clinic were obtaining the influenza vaccination elsewhere (5%) and medical contraindications (1%; Table 2).
Discussion
Our study demonstrated that the systematic intervention of a paramedical person before the doctor’s consultation can lead to a considerable improvement in vaccination coverage in an ambulatory setting. A 58% relative increase (from 48% to 76%) over 1 year in the same institution has never been achieved. This suggested that failure of the physician to propose vaccination is an important reason for low vaccination coverage of high-risk patients in teaching institutions, where physician turnover is high. Thanks to our organizational strategy, we reached an 85% vaccination coverage among all outpatient attendees, which far surpassed that achieved by an ongoing educational program or alternative strategies such as reminder letters.
Until now, the highest coverage ever reported in Europe in persons 65 years and older was 82% in a study in Finland, where the investigators used an age-based strategy, with free vaccines and personnel-mailed reminders.10 Even when efficacious11 and cost effective,12 these strategies are insufficiently used.4 Other means to improve vaccination coverage such as centralized planning identification through computerized enrollment files at central registry and immunization clinics have improved vaccination coverage rates to almost 80% among chronically ill seniors in the United States.13
Two American studies showed that approaches incorporating administrative and organizational measures were more successful in improving vaccination rates than the education of providers. A pilot study14 and a 10-year follow-up15 done in the Minneapolis Department of Veterans Affairs Medical Center used a strategy including annual educational and publicity mailing to patients, walk-in clinics for vaccine administration, standing orders for nurses, and use of standardized patient information and medical record documentation forms. The follow-up study showed a remarkable improvement in the coverage rate, which reached 92% in 1996-1997 in specific groups. Another study done in the University Department of Emergency Medicine of Chicago that used standing orders for nurses at triage was only partly successful, with 47% coverage.16
Our study adds to the knowledge gathered in the United States, where administrative and organizational strategies (standing orders for nurses) improved vaccination coverage significantly.14-16 These studies were conducted in a different population sample, including hospitalized patients and other high-risk groups, which is quite different from the situation in general practice. Comparing vaccination coverage rates between different studies is always hazardous because of differences in inclusion criteria and reporting biases. The highest vaccination coverage ever achieved was 92%, but the method used for the rate estimation was a mailed survey where vaccinated persons may have been more likely to respond than nonvaccinated ones.15 The investigators exported their program from a teaching hospital to a community outpatient setting, with an increase in coverage from 56% to 72% in 1 clinic and no significant increase in the other clinic, which shows that several factors should be considered when a new strategy is implemented (staff, motivation, etc).17 The relatively low coverage (47%) reached in another study conducted in an emergency department was due in part to the fact that the nurse dedicated to providing vaccination was diverted from the preventive task of caring for patients when the workload increased. In addition, only one fourth of the emergency attendees was screened.16
To our knowledge, this is the first time that such an active strategy has been reported and applied in family physicians’ offices. The implementation in private practices documents its feasibility and effectiveness in those settings. The consistent coverage rates obtained in the medical outpatient clinic and the general practices (85% and 83%, respectively) confirmed the usefulness of the strategy, whatever the patient population and the medical staff involved. One may argue that patients had little choice between accepting or actively refusing the vaccination. We hope that the quality of information provided to the elderly, the possibility for them to ask specific questions that come to mind, and even to delay the decision until they can discuss the decision further with the doctor balances the potential enforcement.
The main disadvantage of our strategy is the need for an additional person in the outpatient clinic. The direct cost of an extra person in public service can be justified if it decreases the indirect costs for society, which is the case for influenza vaccination.12 More pragmatically, at the institutional level, the additional income generated by the increase of vaccine sales outweighed the salary of the medical student (about US$100/day for a total of 40 days, ie, 20 working days for 2 months). The implementation in the family physicians’ offices showed that such a procedure can work in a small setting without additional staff. Counseling about vaccination represents an additional task for the paramedical personnel, but it certainly provides more credit to the overall work and improves the therapeutic network. Also, because the vaccination has to be proposed, the time for discussion has to be taken by whoever is the most willing to do the job.
Some doctors may feel that this strategy excludes them from important duties. We must face the reality that physicians often do not accomplish their tasks properly. With our procedure, they remain informed about the vaccination status of their patients and maintain their important role in counseling patients who cannot decide about the vaccination or when problems arise.
One can argue that the increase in vaccination coverage rate was due, at least in part, to external factors such as media propaganda, and that the new strategy played only a marginal role. Of course, we cannot exclude such an influence, but it certainly unlikely was to be the cause of a 58% increase in coverage rate; indeed, no particular campaign was launched in 1999 and no change in coverage rate between 1998 and 1999 was observed in a similar institution in the same area. We chose to use historical controls because we were convinced that the new strategy would dramatically improve vaccination in the elderly and felt therefore that it was unethical not to offer this procedure to all our patients. Moreover, the main interest of the study was to investigate the maximum coverage rate that could be expected with a very active intervention and to estimate precisely the rate of true refusals, so that defined objectives in terms of coverage rates can be set in similar institutions.
The new strategy assessed in this study is in line with the recommendations of the Advisory Committee on Immunization Practices, published in March 2000, that promoted the use of standing orders to improve adult vaccination delivery.18 Evidence of effectiveness of such programs is increasing. They could be adapted to other preventive measures to improve delivery of those services, and they could be used to improve outpatient clinic efficiency by reducing pressures on physicians.
Acknowledgments
We thank M. Cheseaux and S. Martin, the medical students responsible for providing vaccine information and delivery and data entry, the resident-physicians at medical outpatient clinic, and the nurses and receptionists in the medical outpatient clinic and the family physicians’ practices.
1. WHO Influenza vaccination recommendations. Wkly Epidemiol Rec 1999;74:57-64.
2. Working Group Influenza. Recommendations for influenza vaccination during the 1999/2000 season. Bull OFSP 1999;39:737-9.
3. CDC Prevention and control of influenza: recommendations of the Advisory Committee on Immunization Practices (ACIP). MMWR Morb Mortal Wkly Rep 1998;47:1-26.
4. Ammon CE. Vaccination against influenza in Switzerland. A survey in health facilities. Bull OFSP 1999;4:62-4.
5. Gauthey L, Toscani L, Chamot E, Larequi T, Robert CF. Influenza vaccination coverage in the geriatric population of the State of Geneva, Switzerland. Eur J Pharmacol 1999;9:36-40.
6. Centers for Disease Control and Prevention. Influenza and pneumococcal vaccination levels among persons aged 65 years-United States, 1999. MMWR Morb Mortal Wkly Rep 2001;50:532-7.
7. McKinney WP, Barnas GP. Influenza immunization in the elderly: knowledge and attitudes do not explain physician behavior. Am J Pharmacol 1989;79:1422-4.
8. Etkind P, Simon M, Shannon S, et al. Impact of the Medicare Influenza Demonstration Project on influenza vaccination in a county in Massachusetts, 1988-1992. Community Health 1996;21:199-209.
9. Zorzoli M, Favrat B, D’Acremont V, Pécoud A, Genton B. Strategies to improve vaccination coverage among elderly patients. J Gen Intern Med 1999;14:83.-
10. Honkanen PO, Keistinen T, Kivela SL. The impact of vaccination strategy and methods of information on influenza and pneumococcal vaccination coverage in the elderly population. Vaccine 1997;15:317-20.
11. Armstrong K, Berlin M, Schwartz S, Propert K, Ubel P. Educational content and the effectiveness of influenza vaccination reminders. J Gen Intern Med 1999;14:695-7.
12. Baker AM, McCarthy B, Gurley VF, Yood MU. Influenza immunization in a managed care organization. J Gen Intern Med 1998;13:469-75.
13. Pearson DC, Jackson LA, Wagener B, Sarver L. A comprehensive influenza campaign in a managed care setting. Vaccine 1998;16:1718-21.
14. Margolis KL, Lofgren RP, Korn JE. Organizational strategies to improve influenza vaccine delivery. A standing order in a general medicine clinic. Arch Intern Med 1988;148:2205-7.
15. Nichol KL. Ten-year durability and success of an organized program to increase influenza and pneumococcal vaccination rates among high-risk adults. Am J Med 1998;105:385-92.
16. Slobodkin D, Kitlas J, Zielske P. Opportunities not missed systematic influenza and pneumococcal immunization in a public inner-city emergency department. Vaccine 1998;16:1795-802.
17. Margolis KL, Nichol KL, Wuorenma J. Exporting a successful influenza vaccination program from a teaching hospital to a community outpatient setting. J Am Geriatr Soc 1992;40:1021-3.
18. CDC Adult immunization programs in nontraditional settings: quality standard and guidance for program evaluation. A report of the national Vaccine Advisory Committee and Use of standing orders programs to increase adult vaccination rates. Recommendations of the Advisory Committee on Immunization Practices (ACIP). MMWR Morb Mortal Wkly Rep 2000;49:18-27.
Address reprint requests to Blaise Genton, MD, PhD, Policlinique Médicale Universitaire, César Roux 19, 1005 Lausanne, Switzerland. E-mail: [email protected].
To submit a letter to the editor on this topic, click here: [email protected].
Candida albicans Intralesional Injection Immunotherapy of Warts (See Erratum 2002;70:294.)
Stage-matched nutrition guidance for patients at elevated risk for cardiovascular disease: A randomized intervention study in family practice
OBJECTIVE: To examine stage-matched nutrition counseling by family physicians and its effect on dietary intake, anthropometry, and serum lipid levels in patients at elevated risk for cardiovascular disease.
METHODS: In this controlled trial, patients randomized to intervention practices received nutrition information following the Stages-of-Change Model, and patients randomized to control practices received usual care.
RESULTS: At both 6 and 12 months after baseline, total fat intake and saturated fat intake declined significantly more in the intervention group than in the control group: -5.7% and -2.6% of energy, respectively, at 6 months, and -3.6% and -1.7% of energy, respectively, at 12 months. For energy intake, body weight, and BMI, there were significant differences between groups only at 6 months: -0.8 megajoules (MJ), -0.7 kg, and -0.3 kg/m2, respectively. None of the serum lipid values changed significantly between groups at 12 months.
CONCLUSIONS: Nutritional counseling based on stages of change led to reductions in dietary fat intake and weight loss in the short term. However, we found no corresponding changes in serum lipid concentrations.
- Family physicians can select patients for nutrition counseling by a dietician by using a simple questionnaire based on the Stages-of-Change Model.
- With dietary intervention, a decline in fat intake was sustained at 1 year in a population with a high percentage of poorly educated subjects.
- We found no changes in serum lipids after 1 year of dietary intervention.
Cholesterol-lowering diet therapy is an important part of cardiovascular disease prevention.1 Family physicians (FPs) are uniquely positioned to provide nutrition information to persons at risk because of their expertise as perceived by consumers, and because they reach into nearly all segments of the population.2 It is important to build nutrition guidance into a model that enables change, and, considering the number of contacts between FP and patient,3,4 that is linked to the FP’s continuity of care over time.5 FPs can raise patient consciousness about dietary behavior, motivate patients to change their behavior, and, when appropriate, refer patients to a dietician or patient associations.6
The Transtheoretical Model of Behavior Change is increasingly being used to examine health behavior change.7 According to this model, people are assigned to 1 of the following 5 stages on the basis of their behavior and current intention for future action: (i) precontemplation, not even considering changing one’s behavior; (ii) contemplation, thinking about it; (iii) preparation, making definite plans to change; (iv) action, initiating behavior change; and (v) maintenance, maintaining desired behaviors.8
Evidence available on dietary applications studied in cross-sectional and not stage-matched intervention studies is sufficiently encouraging to warrant the inclusion of Transtheoretical Model constructs in prospective studies.7 As far as we know, only 2 stage-matched dietary intervention studies have been published. Both studies were carried out in primary care settings and both studies showed that tailored nutrition information is effective in dietary fat reduction.9,10 However, in these studies the intervention was not managed by the FP. We think the FP is the most appropriate person to manage such intervention in the family practice. Therefore, we conducted a controlled dietary intervention, based on the Stages-of-Change Model and managed by the FP with selective referral to a dietician. We examined the effects of dietary counseling on changes in dietary intake, anthropometry, and serum lipid levels in patients at elevated cardiovascular risk.
Methods
Participants and design
In this randomized controlled trial, men and women at elevated risk for cardiovascular disease were recruited from the 9 family practices joining the Nijmegen Monitoring Project, the research network of the Department of Family Medicine, University Medical Centre St. Radboud.11 Selection and flow of participants are described in Figure 1. Seventy-one patients were initially included in the intervention group and 72 patients in the control group (Table 1). Consequently, we had enough power (0.90) to detect a difference in change between groups for total fat intake of 3% of energy and 11.6 mg% of serum total cholesterol.12
After selection and recruitment of participants, the family practices were randomly divided into intervention (4) and control (5) practices. The practices, and not the patients, were the units of randomization, to avoid contamination of the information between intervention and control groups. Patients in the control practices received usual care.13-15 Each patient in the intervention arm received nutrition information according to his or her stage of change. All participants signed an informed consent form before entering the study. The Medical Ethical Committee of the Department of Human Nutrition and Epidemiology, Wageningen University, approved the study protocol. The study lasted from August 1998 until April 2000.
TABLE 1
Baseline characteristics of patients in the intervention and control groups
| Intervention n=71 | Control n=72 | P1 | |
|---|---|---|---|
| Sex (%) | |||
| Male | 24 | 29 | 0.48 |
| Female | 76 | 71 | |
| Age (years) | 58.5±7.1 | 58.2±6.9 | 0.83 |
| Disorder (%) | |||
| Hypertension | 94 | 89 | 0.34 |
| Diabetes mellitus II | 6 | 7 | |
| Hypertension & diabetes mellitus II | 0 | 4 | |
| Marital status (%) | |||
| Single | 6 | 3 | 0.83 |
| Married/cohabiting | 82 | 86 | |
| Divorced | 1 | 1 | |
| Widowed | 11 | 10 | |
| Education (%)2 | |||
| Low | 68 | 68 | 0.91 |
| Intermediate | 20 | 18 | |
| High | 13 | 15 | |
| Family history of heart disease (%)3 | 27 | 22 | 0.81 |
| Smoking (%)4 | |||
| Not smoking | 79 | 78 | 0.70 |
| Light smoker | 13 | 10 | |
| Heavy smoker | 9 | 13 | |
| Exercise, more than 20 minutes | |||
| No exercise | 20 | 13 | 0.42 |
| Less than 3 times a week | 37 | 30 | |
| 3 times a week | 18 | 26 | |
| More than 3 times a week | 25 | 31 | |
| 1Two-sided P values for differences in baseline characteristics between intervention and control groups. | |||
| 2Low: primary school, lower level of secondary school, lower vocational training. Intermediate: higher level of secondary school, intermediate vocational training. High: higher vocational training, university. | |||
| 3First-degree relatives younger than 60 years. | |||
| 4Light smoker: 0-10 cigarettes a day, or smoking pipe or cigars. Heavy smoker: > 10 cigarettes a day. | |||
FIGURE 1
Selection and flow of participants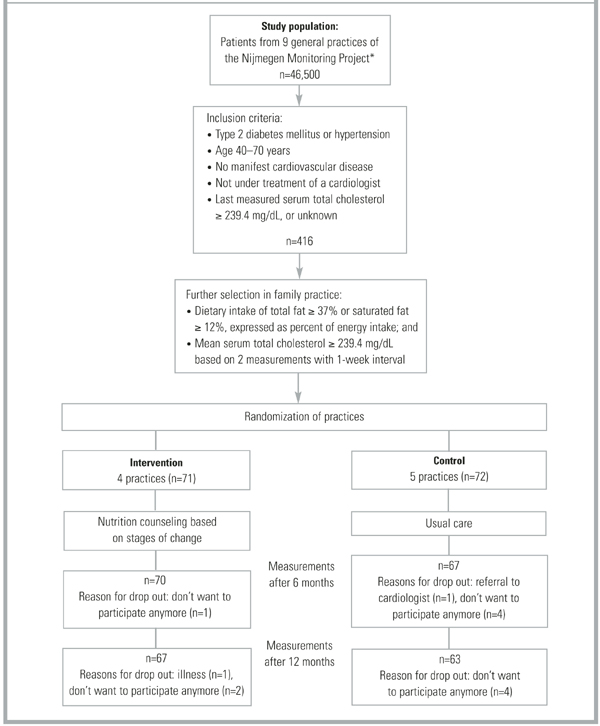
Measurements
Specially trained practice assistants measured anthropometry data, and presented patients with a self-administered questionnaire on demographics, medical history, food frequency, and a stages-of-change algorithm at baseline, 6 months, and 12 months. Blood samples were taken at baseline and at 12 months.
Physical assessment. Anthropometry consisted of body weight to the nearest 0.5 kg, height, and waist and hip circumferences to the nearest 0.5 cm. Patients wore no shoes and only light clothing when weighed. Fasting blood samples were taken twice per measurement period at a 1-week interval, with the patient in the sitting position. The samples were stored at -80°C. Lipids were analyzed enzymatically for total cholesterol,16 HDL cholesterol,17 LDL cholesterol, and triglycerides18 with the Cobas Intergra 700 (Roche Diagnostics, Switzerland), at the laboratory of the Canisius Wilhelmina Hospital (Nijmegen, The Netherlands). The coefficient of variation within runs was 2.3% for total cholesterol, 1.6% for HDL cholesterol, and 1.8% for triglycerides. The LDL cholesterol level was calculated using the equation of Friedewald et al.19
Questionnaires. The questionnaire asked for demographic data, family history of heart disease, smoking status, physical activity, drug use, and diet history at baseline. At follow-up we checked for changes in smoking status, physical activity, and drug use. Patients in the control group were asked if they had visited a dietician during the study period. The intake of energy, total fat, fatty acids, and cholesterol during the preceding 4 weeks was assessed by asking patients to fill out a food frequency questionnaire that included 104 food items. The questionnaire was validated20 and recently revised according to the Dutch National Food Survey 1992.21 Dieticians carried out nutrient calculations with a computerized version of the Dutch food composition tables22 phoned patients in cases of inconsistency.
Stages of change for reduction of fat intake were assessed with a 4-item algorithm based on measures used in previous studies23,23 in combination with the results of the food frequency questionnaire. According to the algorithm, participants were judged to be in precontemplation if they did not consider their diet to be low in fat, they were not in the process of cutting down on fat, and they had no intention of reducing their fat consumption. Participants were considered to be in the contemplation phase if they intended to decrease their fat intake within 6 months but not within 30 days, and to be in preparation when they intended to decrease their fat intake within 30 days. Participants who reported they were currently trying to eat less fat were classified as in action, and participants who reported they had been eating less fat for at least 6 months were classified in maintenance. If participants in maintenance consumed 37% total fat or 12% saturated fat expressed as percent of energy intake, they were reclassified in precontemplation.
After completing the study, all patients filled in an evaluation questionnaire. Patients in the control group were also asked about which nutrition information they had received during the last year.
Intervention
The intervention consisted of nutrition counseling based on stages of change, directed by the FP with selective referral to a dietician. FPs were supported by a protocol that included Prochaska’s8 processes of change. Preparation and action stages were considered 1 stage (action stage) in this study, given the required nutrition education. (Figure 2) summarizes the intervention procedure: 1) counseling aimed at raising consciousness about dietary behavior in the precontemplation stage, 2) motivation to change dietary behavior in the contemplation stage, and 3) if a patient decided to change (action stage), information about practical aspects of dietary change and discussion of referral to a dietician. The intervention was conducted by the patient’s own FP. All patients were referred to the same dietician. Protocols for the FPs and the dietician had been developed and tested prior to the study and were discussed by FPs and the dietician in pre-study group sessions.
FIGURE 2
Intervention scheme with clarification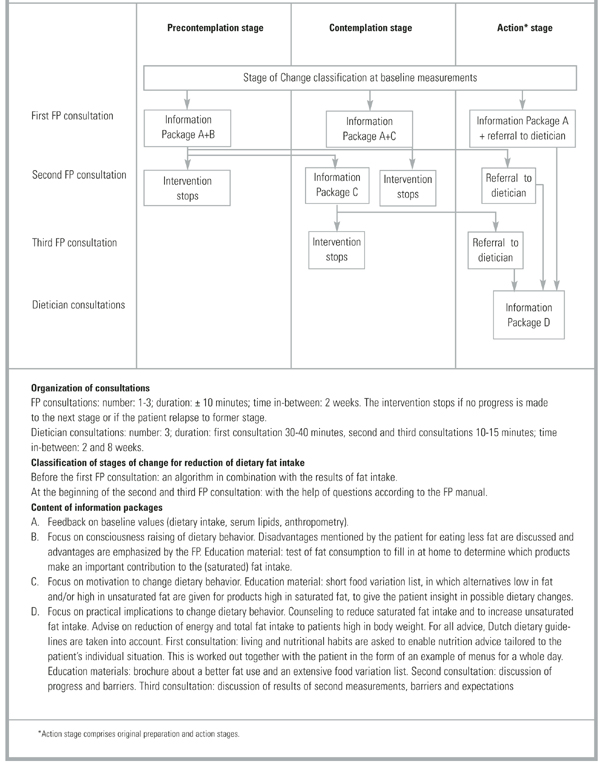
Data analyses
Differences between groups at baseline and follow-up were tested with unpaired t-tests for continuous variables and with chi-square tests for categorized variables. If the number of observations within 1 cell was less then 5, a Fisher’s exact test was used instead of a chi-square test. Differences within subjects were tested with a paired t-test. P values less than 0.05 were considered significant. Because of clustering of patients within practices, a multilevel analysis was also carried out (level 1 patient, level 2 practice). All analyses were performed on the basis of intention to treat. SAS version 6.12 was used for the statistical analyses (SAS Institute Inc., Cary, NC, USA).
Results
Study population
The study sample was predominantly female (73%), poorly educated (68%), with an average age of 58 years (see Table 1) for definitions of educational level). Of the cardiovascular risk factors, hypertension was present in 92% of participants, type 2 diabetes mellitus in 6%, both disorders in 2%, and a family history of heart disease in 25%. No significant differences were found between the intervention group (n=71) and the control group (n=72) (Table 1). Table 2 demonstrates that the 2 study groups also showed comparable baseline measures according to dietary intake, anthropometry, and serum lipid levels. The mean BMI of the total group of subjects was 28.7 kg/m 2 ; 83% had a BMI higher than 25 and the majority had high total cholesterol and dietary fat intake.
Intervention-related measures
At baseline, 51% of the patients in the intervention group were classified in the precontemplation stage, 24% in the contemplation stage, and 25% in the action stage. They had consulted their FP once (n=53) or twice (n=18) before they were referred to the study dietician (n=60). Eleven patients were not referred to the dietician because they did not reach the action stage. All of the referred patients but one received 3 consultations with the dietician. In the control group, 24% of the patients discussed nutrition issues with their FP, 57% read nutrition brochures related to cardiovascular topics, and 1% (7) were referred to a dietician.
Changes at follow-up measurements
After 6 months (Table 2) total energy intake was reduced by 1.4 and 0.6 MJ in the intervention and control groups, respectively; total fat intake by 7.9% and 2.2 % of total energy, and saturated fat intake by 3.4% and 0.8% of total energy. The reductions were significantly larger in the intervention group, except for unsaturated fat. This was also reflected in risk factors: body weight and BMI declined significantly more in the intervention group (1.5 kg body weight) than in the control group (0.6 kg body weight). We found no significant differences between groups for waist circumference and waist-hip ratio.
The reduced fat intake in the intervention group was maintained at 12 months, although the differences were smaller. Changes in energy intake and anthropometric values at this time no longer differed significantly with multilevel analysis. During the 12 months of the study, slight reductions were found for serum total cholesterol (intervention group: 2.3 mg/dL, controls: 6.2 mg/dL), LDL cholesterol (intervention group: 6.2 mg/dL, controls: 7.7 mg/dL), and triglycerides (intervention group: 0.8 mg/dL, controls: 3.1 mg/dL). HDL cholesterol increased slightly in both groups (3.9 mg/dL in the intervention group, 2.7 mg/dL in the control group). However, none of these differences were significant. There were no significant changes in smoking or physical activity (P values of chi-square tests per measurement moment were >0.85), and none of the patients was prescribed a cholesterol-lowering drug. The significance of the P values of the differences in variables between the first and last measurement moment did not change when multilevel analysis was performed, except for body weight (Table 2).
TABLE 2
Baseline measures and changes after 6 months and 12 months in dietary intake and anthropometry
| At Baseline | At 6 months | At 12 months | ||||||||
|---|---|---|---|---|---|---|---|---|---|---|
| Intervention | Control | P* | Intervention | Control | P** | Intervention | Control | P** | P*** | |
| n=71 Mean ± SD | n=72 Mean ± SD | n=70 Mean ± SD | n=67 Mean ± SD | n=67 Mean ± SD | n=63 Mean ± SD | |||||
| Dietary intake (per day) | ||||||||||
| Total energy (MJ/d)1 | 9.1 ± 2.7 | 9.6 ± 2.6 | 0.25 | -1.4 ± 1.9† | -0.6 ± 1.8† | 0.01 | -0.7 ± 3.0 | -0.9 ± 2.4† | 0.09 | 0.00 |
| Total fat (% of energy) | 42.1 ± 6.3 | 42.6 ± 5.2 | 0.64 | -7.9 ± 6.5† | -2.2 ± 4.9† | 0.00 | -5.6 ± 6.9† | -2.0 ± 6.7† | 0.00 | 0.00 |
| Saturated fat (% of energy) | 15.2 ± 2.6 | 15.5 ± 2.3 | 0.42 | -3.4 ± 2.7† | -0.8 ± 2.2† | 0.00 | -2.6 ± 2.7† | -0.9 ± 2.6† | 0.00 | 0.00 |
| Monounsaturated fat (% of energy) | 14.6 ± 3.3 | 14.9 ± 2.6 | 0.53 | -3.4 ± 3.3† | -0.7 ± 2.4† | 0.00 | -1.9 ± 4.1† | -0.3 ± 3.3 | 0.01 | 0.00 |
| Unsaturated fat (% of energy) | 9.4 ± 3.0 | 9.3 ± 3.0 | 0.79 | -1.0 ± 3.1† | 0.8 ± 3.0† | 0.37 | -1.0 ± 2.7† | -0.7 ± 3.7 | 0.73 | 0.73 |
| Cholesterol (mg) | 239.1 ± 91.5 | 254.8 ± 90.8 | 0.31 | -62.0 ± 68.9† | -22.8 ± 66.4† | 0.00 | -46.4 ± 77.1† | -33.4 ± 83.1† | 0.02 | 0.03 |
| Anthropometry | ||||||||||
| Body weight (kg) | 79.2 ± 14.9 | 80.3 ± 12.0 | 0.63 | -1.3 ± 1.8† | -0.6 ± 1.9† | 0.01 | 0.2 ± 3.0 | -0.6 ± 2.8† | 0.02 | 0.06 |
| Body Mass Index (kg/m2) | 28.1 ± 4.3 | 29.2 ± 4.8 | 0.15 | -0.5 ± 0.6† | -0.2 ± 0.7† | 0.01 | 0.0 ± 1.1 | -0.2 ± 1.0† | 0.03 | 0.08 |
| Waist circumference (cm) | 94.3 ± 12.1 | 97.7 ± 10.3 | 0.08 | -1.6 ± 4.9† | -1.7 ± 5.2† | 0.43 | -1.6 ± 6.6† | -1.8 ± 5.6† | 0.61 | 0.86 |
| Waist-hip circumference ratio | 0.89 ± 0.07 | 0.90 ± 0.09 | 0.36 | -0.0 ± 0.04 | -0.01 ± 0.05† | 0.13 | 0.01 ± 0.05† | -0.02 ± 0.05† | 0.15 | 0.15 |
| 1 Joule=0.24 cal | ||||||||||
| *Two-sided P values for differences in baseline measures between intervention and control group. | ||||||||||
| **One-sided P value for difference in change from baseline between intervention and control group. | ||||||||||
| ***P value with multilevel analysis | ||||||||||
| †Significant difference in changes after 6 and 12 months compared to baseline within group (one-sided P value<0.05). | ||||||||||
DISCUSSION
Nutrition counseling by an FP based on the Stages-of-Change Model, with referral to a dietician in the action stage, successfully changed dietary behavior after 6 months in patients at elevated risk for cardiovascular disease. This success was accompanied by reductions in body weight. Differences in fat intake were sustained at 12 months, but this was not reflected in lower serum lipid concentrations. Initial reductions in energy intake and anthropometric values did not persist after 1 year. Our findings are in line with other dietary intervention studies in family practice that report improved dietary habits but no significant effect on objective cardiovascular risk factors such as body weight and blood lipids.10,25-27 The uniqueness of our study is that it is the first randomized controlled trial in family practice based on the Stages-of-Change Model in which nutrition counseling is managed by the FP.
The reductions we found in total serum cholesterol concentrations (0.9% in the intervention group and 2.3% in the control group after 12 months) were smaller than the 3%-6% suggested by a systematic review of individualized nutrition counseling in free-living subjects.28 The observed reduction in our study is also less than predicted by the Keys equation.29 We do not have a clear explanation for this. It is possible that patients in the intervention group gave more socially desirable answers to the food frequency questionnaire than patients in the control group, due to the more extensive nutrition guidance in the intervention group.
The dropout rate in our study was low: 91% of the patients completed the trial, a notable strength of the study. This may be due to the fact that the participating patients were recruited and treated by their own FP, and may in part account for the small effect size as we avoided the selective participation of those patients who were most motivated for change. The education level of the study sample was low compared with the Dutch population at similar age,30 and this could also have resulted in smaller differences between intervention and control groups. In addition, it has been found that CHD patients who are obese and do not use lipid lowering drugs are less likely to follow recommended cholesterol-lowering diets.31 However, all of these factors make our study representative of the circumstances FPs can expect when managing nutritional intervention in routine care for patients at elevated risk for cardiovascular disease. Nutritional counseling on the basis of the Transtheoretical Model of stages of change7 is effective in the short term, but it is disappointing to have to conclude that this effect appears to be temporary, with eventual rebound to pre-intervention status. No sustained effects on the target outcomes such as body weight and serum lipids were found, possibly due to the relatively short (1-year) observation period. Improved effectiveness might be achieved with the development of patient protocols and education materials that are better aimed at poorly educated persons, and with more extensive use of modern forms of communications to implement lasting changes.
Conclusions
Nutritional counseling based on stages of change in patients at elevated risk for cardiovascular disease, provided by an FP with referral to a dietician in the action stage, led to reductions in dietary fat intake in the short and long term and to weight loss in the short term. In the absence of long-term effects on serum cholesterol levels, the emphasis remains on treating elevated lipids with drugs. However, research on effective and inexpensive dietary interventions remains important because of promising results for the short term and the important advantages of such intervention. The emphasis for future research should be testing new methods to maintain (dietary) behavioral changes and to investigate differences in susceptibility between individuals with unhealthy lifestyles. The model based on stages of change seems well suited for this sort of intervention, and the experience of this study is that it can easily be incorporated into the routines of family practice at low cost. As such, it is a simple instrument for selecting patients who are willing to change their food habits. Further, we reached a high percentage of poorly educated people, who are particularly vulnerable.32 We recommend examining whether education materials need to be better aimed at people with a low socio-economic status. Long-term nutrition counseling is needed for maintenance and further improvements.
Acknowledgments
This research was supported by the Netherlands Heart Foundation under grant no. 97.106 and by Bayer. We are grateful to the staff of the NMP family practices and their patients, without whom this study would not have been possible. We extend special thanks to the dieticians José Veen and Els Siebelink and to all the research assistants, especially to Marjolein Homs.
1. Pyorala K. CHD prevention in clinical practice Lancet 1996;348 Suppl 1:s26-s28.
2. Hiddink GJ, Hautvast JG, van-Woerkum CM, Fieren CJ, van-’t-Hof MA. Consumers’ expectations about nutrition guidance: the importance of primary care physicians Am J Clin Nutr 1997;65:1974S-1979S.
3. Gray DP. Dietary advice in British General Practice Eur J Clin Nutr 1999;53 Suppl 2:S3-S8.
4. De Bakker D., Abrahamse H., Van den Hoogen H., Braspenning J., Van Althuis T, Rutten R. Jaarrapport LINH 1998: contactfrequenties en verrichtingen in het landelijk informatie netwerk huisartsenzorg (LINH). Utrecht/Nijmegen, The Netherlands: NIVEL/WOK; 1999.
5. Van-Weel C. Nutritional guidance in general practice—a conceptual framework Eur J Clin Nutr 1999;53 Suppl 2:S108-S111.
6. Hiddink GJ, Hautvast JG, van-Woerkum CM, Fieren CJ, van-’t-Hof MA. Nutrition guidance by primary-care physicians: perceived barriers and low involvement. Eur J Clin Nutr 1995;49:842-851.
7. Horwath CC. Applying the transtheoretical model to eating behaviour change: challenges and opportunities Nutrition Research Reviews. 1999;12:281-317.
8. Prochaska JO, DiClemente CC. In search of how people change: applications to addictive behaviors American Psychologist 1992;47:1102-1114.
9. Cambell MK, DeVellis B, Strecher V, Ammerman A, DeVellis R, Sandler R. Improving dietary behaviour: the effectiveness of tailored messages in primary care settings Am J Public Health 1994;84:783-787.
10. Steptoe A, Doherty S, Rink E, Kerry S, Kendrick T, Hilton S. Behavioural counselling in general practice for the promotion of healthy behaviour among adults at increased risk of coronary heart disease: randomised trial. Br Med J 1999;319:943-947.
11. Van Weel C, Smith H, Beasley H. Family practice research networks. Experiences from 3 countries. J Fam Pract 2000;49:938-943.
12. Snedecor G, Cochran W. Statistical methods Iowa, USA: Iowa State University Press; 1991.
13. Rutten GEHM, Verhoeven S, Heine RJ, et al. NHG-Standaard Diabetes Mellitus Type 2 (eerste herziening) Huisarts Wet 1999;42:67-84.
14. Walma EP, Grundmeijer HGLM, Thomas S, Prins A, Van den Hoogen J, Van der laan JR. NHG-Standaard Hypertensie (eerste herziening) Huisarts Wet 1997;40:598-617.
15. Thomas S, Van der Weijden T, Van Drenth BB, Haverkort AFM, Hooi JD, Van der Laan JD. NHG-standaard Cholesterol Huisarts Wet 1999;42:406-417.
16. Allain CC, Poon LS, Chan CS, Richmond W, Fu PC. Enzymatic determination of total serum cholesterol Clin Chem 1974;20:470-475.
17. Burstein M, Scholnick HR, Morfin R. Rapid method for the isolation of lipoproteins from human serum by precipitation with polyan-ions. J Lipid Res 1970;11:583-595.
18. Fossati P, Prencipe L. Serum triglycerides determined colorimetrically with an enzyme that produces hydrogen peroxide Clin Chem 1982;28:2077-2080.
19. Friedewald WT, Levy RI, Fredrickson DS. Estimation of the concentration of low-density lipoprotein cholesterol in plasma without use of the preparative ultracentrifuge Clin Chem 1972;18:499-502.
20. Feunekes GI, van-Staveren WA, De-Vries JH, Burema J, Hautvast JG. Relative and biomarker-based validity of a food-frequency questionnaire estimating intake of fats and cholesterol Am J Clin Nutr 1993;58:489-496.
21. Voorlichtingsbureau voor de Voeding. Zo eet Nederland 1992: resultaten van de voedselconsumptiepeiling 1992 (results of the 1992 Dutch National Food Consumption Survey). The Hague, The Netherlands: Voorlichtingsbureau voor de Voeding (The Netherlands Nutrition Centre);1993.
22. Voorlichtingsbureau voor de Voeding. Nederlandse Voedings-middelentabel 1997 (Dutch nutrient data base). The Hague, The Netherlands: Voorlichtingsbureau voor de Voeding (The Netherlands Nutrition Centre); 1997.
23. Curry S, Kristal A, Bowen D. An application of the stage model of behavior change to dietary fat reduction Health Education Research 1992;1:97-105.
24. Sporny LA, Contento I. Stages of change in dietary fat reduction: social psychological correlates J Nutr Educ 1995;27:191-199.
25. Cupples ME, McKnight A. Randomised controlled trial of health promotion in general practice for patients at high cardiovascular risk Br Med J 1994;309:993-996.
26. Neil HA, Roe L, Godlee RJ, et al. Randomised trial of lipid lowering dietary advice in general practice: the effects on serum lipids, lipoproteins and antioxidants. Br Med J 1995;310:569-573.
27. Hellénius M-L, Krakau I, De Faire U. Favourable long-term effects from advice on diet and exercise given to healthy men with raised cardiovascular risk factors. Nutr Metab Cardiovasc Dis 1997;7:293-300.
28. Tang JL, Armitage JM, Lancaster T, Silagy CA, Fowler GH, Neil HAW. Systematic review of dietary intervention trials to lower blood total cholesterol in free-living subjects. Br Med J 1998;316:1213-1220.
29. Keys A, Anderson J, Grande F. Serum cholesterol response to changes in the diet IV: particularly saturated fatty acids in diet 2S-P. Metabolism 1965;14:776-787.
30. Dickman, A., Eijkhout, M. P., Loeve J.A. Werken en leren 1999-2000: feiten en cijfers over de arbeidsmarkt en het onderwijs in Nederland. Alphen a.d. Rijn, The Netherlands, Centraal Bureau voor de Statistiek (Statistics The Netherlands);2000.
31. Erkkila AT, Sarkkinen ES, Koukkunen H, et al. Concordance of diet with the recommended cholesterol lowering diet in patients with coronary heart disease. Eur J Clin Nutr 1998;52:279-285.
32. Lynch JW, Kaplan GA, Cohen RD, Tuomilehto J, Salonen JT. Do cardiovascular risk factors explain the relation between socioeconomic status, risk of all-cause mortality, cardiovascular mortality and acute myocardial infarction? Am J Epidemiol 1996;144:934-942.
OBJECTIVE: To examine stage-matched nutrition counseling by family physicians and its effect on dietary intake, anthropometry, and serum lipid levels in patients at elevated risk for cardiovascular disease.
METHODS: In this controlled trial, patients randomized to intervention practices received nutrition information following the Stages-of-Change Model, and patients randomized to control practices received usual care.
RESULTS: At both 6 and 12 months after baseline, total fat intake and saturated fat intake declined significantly more in the intervention group than in the control group: -5.7% and -2.6% of energy, respectively, at 6 months, and -3.6% and -1.7% of energy, respectively, at 12 months. For energy intake, body weight, and BMI, there were significant differences between groups only at 6 months: -0.8 megajoules (MJ), -0.7 kg, and -0.3 kg/m2, respectively. None of the serum lipid values changed significantly between groups at 12 months.
CONCLUSIONS: Nutritional counseling based on stages of change led to reductions in dietary fat intake and weight loss in the short term. However, we found no corresponding changes in serum lipid concentrations.
- Family physicians can select patients for nutrition counseling by a dietician by using a simple questionnaire based on the Stages-of-Change Model.
- With dietary intervention, a decline in fat intake was sustained at 1 year in a population with a high percentage of poorly educated subjects.
- We found no changes in serum lipids after 1 year of dietary intervention.
Cholesterol-lowering diet therapy is an important part of cardiovascular disease prevention.1 Family physicians (FPs) are uniquely positioned to provide nutrition information to persons at risk because of their expertise as perceived by consumers, and because they reach into nearly all segments of the population.2 It is important to build nutrition guidance into a model that enables change, and, considering the number of contacts between FP and patient,3,4 that is linked to the FP’s continuity of care over time.5 FPs can raise patient consciousness about dietary behavior, motivate patients to change their behavior, and, when appropriate, refer patients to a dietician or patient associations.6
The Transtheoretical Model of Behavior Change is increasingly being used to examine health behavior change.7 According to this model, people are assigned to 1 of the following 5 stages on the basis of their behavior and current intention for future action: (i) precontemplation, not even considering changing one’s behavior; (ii) contemplation, thinking about it; (iii) preparation, making definite plans to change; (iv) action, initiating behavior change; and (v) maintenance, maintaining desired behaviors.8
Evidence available on dietary applications studied in cross-sectional and not stage-matched intervention studies is sufficiently encouraging to warrant the inclusion of Transtheoretical Model constructs in prospective studies.7 As far as we know, only 2 stage-matched dietary intervention studies have been published. Both studies were carried out in primary care settings and both studies showed that tailored nutrition information is effective in dietary fat reduction.9,10 However, in these studies the intervention was not managed by the FP. We think the FP is the most appropriate person to manage such intervention in the family practice. Therefore, we conducted a controlled dietary intervention, based on the Stages-of-Change Model and managed by the FP with selective referral to a dietician. We examined the effects of dietary counseling on changes in dietary intake, anthropometry, and serum lipid levels in patients at elevated cardiovascular risk.
Methods
Participants and design
In this randomized controlled trial, men and women at elevated risk for cardiovascular disease were recruited from the 9 family practices joining the Nijmegen Monitoring Project, the research network of the Department of Family Medicine, University Medical Centre St. Radboud.11 Selection and flow of participants are described in Figure 1. Seventy-one patients were initially included in the intervention group and 72 patients in the control group (Table 1). Consequently, we had enough power (0.90) to detect a difference in change between groups for total fat intake of 3% of energy and 11.6 mg% of serum total cholesterol.12
After selection and recruitment of participants, the family practices were randomly divided into intervention (4) and control (5) practices. The practices, and not the patients, were the units of randomization, to avoid contamination of the information between intervention and control groups. Patients in the control practices received usual care.13-15 Each patient in the intervention arm received nutrition information according to his or her stage of change. All participants signed an informed consent form before entering the study. The Medical Ethical Committee of the Department of Human Nutrition and Epidemiology, Wageningen University, approved the study protocol. The study lasted from August 1998 until April 2000.
TABLE 1
Baseline characteristics of patients in the intervention and control groups
| Intervention n=71 | Control n=72 | P1 | |
|---|---|---|---|
| Sex (%) | |||
| Male | 24 | 29 | 0.48 |
| Female | 76 | 71 | |
| Age (years) | 58.5±7.1 | 58.2±6.9 | 0.83 |
| Disorder (%) | |||
| Hypertension | 94 | 89 | 0.34 |
| Diabetes mellitus II | 6 | 7 | |
| Hypertension & diabetes mellitus II | 0 | 4 | |
| Marital status (%) | |||
| Single | 6 | 3 | 0.83 |
| Married/cohabiting | 82 | 86 | |
| Divorced | 1 | 1 | |
| Widowed | 11 | 10 | |
| Education (%)2 | |||
| Low | 68 | 68 | 0.91 |
| Intermediate | 20 | 18 | |
| High | 13 | 15 | |
| Family history of heart disease (%)3 | 27 | 22 | 0.81 |
| Smoking (%)4 | |||
| Not smoking | 79 | 78 | 0.70 |
| Light smoker | 13 | 10 | |
| Heavy smoker | 9 | 13 | |
| Exercise, more than 20 minutes | |||
| No exercise | 20 | 13 | 0.42 |
| Less than 3 times a week | 37 | 30 | |
| 3 times a week | 18 | 26 | |
| More than 3 times a week | 25 | 31 | |
| 1Two-sided P values for differences in baseline characteristics between intervention and control groups. | |||
| 2Low: primary school, lower level of secondary school, lower vocational training. Intermediate: higher level of secondary school, intermediate vocational training. High: higher vocational training, university. | |||
| 3First-degree relatives younger than 60 years. | |||
| 4Light smoker: 0-10 cigarettes a day, or smoking pipe or cigars. Heavy smoker: > 10 cigarettes a day. | |||
FIGURE 1
Selection and flow of participants
Measurements
Specially trained practice assistants measured anthropometry data, and presented patients with a self-administered questionnaire on demographics, medical history, food frequency, and a stages-of-change algorithm at baseline, 6 months, and 12 months. Blood samples were taken at baseline and at 12 months.
Physical assessment. Anthropometry consisted of body weight to the nearest 0.5 kg, height, and waist and hip circumferences to the nearest 0.5 cm. Patients wore no shoes and only light clothing when weighed. Fasting blood samples were taken twice per measurement period at a 1-week interval, with the patient in the sitting position. The samples were stored at -80°C. Lipids were analyzed enzymatically for total cholesterol,16 HDL cholesterol,17 LDL cholesterol, and triglycerides18 with the Cobas Intergra 700 (Roche Diagnostics, Switzerland), at the laboratory of the Canisius Wilhelmina Hospital (Nijmegen, The Netherlands). The coefficient of variation within runs was 2.3% for total cholesterol, 1.6% for HDL cholesterol, and 1.8% for triglycerides. The LDL cholesterol level was calculated using the equation of Friedewald et al.19
Questionnaires. The questionnaire asked for demographic data, family history of heart disease, smoking status, physical activity, drug use, and diet history at baseline. At follow-up we checked for changes in smoking status, physical activity, and drug use. Patients in the control group were asked if they had visited a dietician during the study period. The intake of energy, total fat, fatty acids, and cholesterol during the preceding 4 weeks was assessed by asking patients to fill out a food frequency questionnaire that included 104 food items. The questionnaire was validated20 and recently revised according to the Dutch National Food Survey 1992.21 Dieticians carried out nutrient calculations with a computerized version of the Dutch food composition tables22 phoned patients in cases of inconsistency.
Stages of change for reduction of fat intake were assessed with a 4-item algorithm based on measures used in previous studies23,23 in combination with the results of the food frequency questionnaire. According to the algorithm, participants were judged to be in precontemplation if they did not consider their diet to be low in fat, they were not in the process of cutting down on fat, and they had no intention of reducing their fat consumption. Participants were considered to be in the contemplation phase if they intended to decrease their fat intake within 6 months but not within 30 days, and to be in preparation when they intended to decrease their fat intake within 30 days. Participants who reported they were currently trying to eat less fat were classified as in action, and participants who reported they had been eating less fat for at least 6 months were classified in maintenance. If participants in maintenance consumed 37% total fat or 12% saturated fat expressed as percent of energy intake, they were reclassified in precontemplation.
After completing the study, all patients filled in an evaluation questionnaire. Patients in the control group were also asked about which nutrition information they had received during the last year.
Intervention
The intervention consisted of nutrition counseling based on stages of change, directed by the FP with selective referral to a dietician. FPs were supported by a protocol that included Prochaska’s8 processes of change. Preparation and action stages were considered 1 stage (action stage) in this study, given the required nutrition education. (Figure 2) summarizes the intervention procedure: 1) counseling aimed at raising consciousness about dietary behavior in the precontemplation stage, 2) motivation to change dietary behavior in the contemplation stage, and 3) if a patient decided to change (action stage), information about practical aspects of dietary change and discussion of referral to a dietician. The intervention was conducted by the patient’s own FP. All patients were referred to the same dietician. Protocols for the FPs and the dietician had been developed and tested prior to the study and were discussed by FPs and the dietician in pre-study group sessions.
FIGURE 2
Intervention scheme with clarification
Data analyses
Differences between groups at baseline and follow-up were tested with unpaired t-tests for continuous variables and with chi-square tests for categorized variables. If the number of observations within 1 cell was less then 5, a Fisher’s exact test was used instead of a chi-square test. Differences within subjects were tested with a paired t-test. P values less than 0.05 were considered significant. Because of clustering of patients within practices, a multilevel analysis was also carried out (level 1 patient, level 2 practice). All analyses were performed on the basis of intention to treat. SAS version 6.12 was used for the statistical analyses (SAS Institute Inc., Cary, NC, USA).
Results
Study population
The study sample was predominantly female (73%), poorly educated (68%), with an average age of 58 years (see Table 1) for definitions of educational level). Of the cardiovascular risk factors, hypertension was present in 92% of participants, type 2 diabetes mellitus in 6%, both disorders in 2%, and a family history of heart disease in 25%. No significant differences were found between the intervention group (n=71) and the control group (n=72) (Table 1). Table 2 demonstrates that the 2 study groups also showed comparable baseline measures according to dietary intake, anthropometry, and serum lipid levels. The mean BMI of the total group of subjects was 28.7 kg/m 2 ; 83% had a BMI higher than 25 and the majority had high total cholesterol and dietary fat intake.
Intervention-related measures
At baseline, 51% of the patients in the intervention group were classified in the precontemplation stage, 24% in the contemplation stage, and 25% in the action stage. They had consulted their FP once (n=53) or twice (n=18) before they were referred to the study dietician (n=60). Eleven patients were not referred to the dietician because they did not reach the action stage. All of the referred patients but one received 3 consultations with the dietician. In the control group, 24% of the patients discussed nutrition issues with their FP, 57% read nutrition brochures related to cardiovascular topics, and 1% (7) were referred to a dietician.
Changes at follow-up measurements
After 6 months (Table 2) total energy intake was reduced by 1.4 and 0.6 MJ in the intervention and control groups, respectively; total fat intake by 7.9% and 2.2 % of total energy, and saturated fat intake by 3.4% and 0.8% of total energy. The reductions were significantly larger in the intervention group, except for unsaturated fat. This was also reflected in risk factors: body weight and BMI declined significantly more in the intervention group (1.5 kg body weight) than in the control group (0.6 kg body weight). We found no significant differences between groups for waist circumference and waist-hip ratio.
The reduced fat intake in the intervention group was maintained at 12 months, although the differences were smaller. Changes in energy intake and anthropometric values at this time no longer differed significantly with multilevel analysis. During the 12 months of the study, slight reductions were found for serum total cholesterol (intervention group: 2.3 mg/dL, controls: 6.2 mg/dL), LDL cholesterol (intervention group: 6.2 mg/dL, controls: 7.7 mg/dL), and triglycerides (intervention group: 0.8 mg/dL, controls: 3.1 mg/dL). HDL cholesterol increased slightly in both groups (3.9 mg/dL in the intervention group, 2.7 mg/dL in the control group). However, none of these differences were significant. There were no significant changes in smoking or physical activity (P values of chi-square tests per measurement moment were >0.85), and none of the patients was prescribed a cholesterol-lowering drug. The significance of the P values of the differences in variables between the first and last measurement moment did not change when multilevel analysis was performed, except for body weight (Table 2).
TABLE 2
Baseline measures and changes after 6 months and 12 months in dietary intake and anthropometry
| At Baseline | At 6 months | At 12 months | ||||||||
|---|---|---|---|---|---|---|---|---|---|---|
| Intervention | Control | P* | Intervention | Control | P** | Intervention | Control | P** | P*** | |
| n=71 Mean ± SD | n=72 Mean ± SD | n=70 Mean ± SD | n=67 Mean ± SD | n=67 Mean ± SD | n=63 Mean ± SD | |||||
| Dietary intake (per day) | ||||||||||
| Total energy (MJ/d)1 | 9.1 ± 2.7 | 9.6 ± 2.6 | 0.25 | -1.4 ± 1.9† | -0.6 ± 1.8† | 0.01 | -0.7 ± 3.0 | -0.9 ± 2.4† | 0.09 | 0.00 |
| Total fat (% of energy) | 42.1 ± 6.3 | 42.6 ± 5.2 | 0.64 | -7.9 ± 6.5† | -2.2 ± 4.9† | 0.00 | -5.6 ± 6.9† | -2.0 ± 6.7† | 0.00 | 0.00 |
| Saturated fat (% of energy) | 15.2 ± 2.6 | 15.5 ± 2.3 | 0.42 | -3.4 ± 2.7† | -0.8 ± 2.2† | 0.00 | -2.6 ± 2.7† | -0.9 ± 2.6† | 0.00 | 0.00 |
| Monounsaturated fat (% of energy) | 14.6 ± 3.3 | 14.9 ± 2.6 | 0.53 | -3.4 ± 3.3† | -0.7 ± 2.4† | 0.00 | -1.9 ± 4.1† | -0.3 ± 3.3 | 0.01 | 0.00 |
| Unsaturated fat (% of energy) | 9.4 ± 3.0 | 9.3 ± 3.0 | 0.79 | -1.0 ± 3.1† | 0.8 ± 3.0† | 0.37 | -1.0 ± 2.7† | -0.7 ± 3.7 | 0.73 | 0.73 |
| Cholesterol (mg) | 239.1 ± 91.5 | 254.8 ± 90.8 | 0.31 | -62.0 ± 68.9† | -22.8 ± 66.4† | 0.00 | -46.4 ± 77.1† | -33.4 ± 83.1† | 0.02 | 0.03 |
| Anthropometry | ||||||||||
| Body weight (kg) | 79.2 ± 14.9 | 80.3 ± 12.0 | 0.63 | -1.3 ± 1.8† | -0.6 ± 1.9† | 0.01 | 0.2 ± 3.0 | -0.6 ± 2.8† | 0.02 | 0.06 |
| Body Mass Index (kg/m2) | 28.1 ± 4.3 | 29.2 ± 4.8 | 0.15 | -0.5 ± 0.6† | -0.2 ± 0.7† | 0.01 | 0.0 ± 1.1 | -0.2 ± 1.0† | 0.03 | 0.08 |
| Waist circumference (cm) | 94.3 ± 12.1 | 97.7 ± 10.3 | 0.08 | -1.6 ± 4.9† | -1.7 ± 5.2† | 0.43 | -1.6 ± 6.6† | -1.8 ± 5.6† | 0.61 | 0.86 |
| Waist-hip circumference ratio | 0.89 ± 0.07 | 0.90 ± 0.09 | 0.36 | -0.0 ± 0.04 | -0.01 ± 0.05† | 0.13 | 0.01 ± 0.05† | -0.02 ± 0.05† | 0.15 | 0.15 |
| 1 Joule=0.24 cal | ||||||||||
| *Two-sided P values for differences in baseline measures between intervention and control group. | ||||||||||
| **One-sided P value for difference in change from baseline between intervention and control group. | ||||||||||
| ***P value with multilevel analysis | ||||||||||
| †Significant difference in changes after 6 and 12 months compared to baseline within group (one-sided P value<0.05). | ||||||||||
DISCUSSION
Nutrition counseling by an FP based on the Stages-of-Change Model, with referral to a dietician in the action stage, successfully changed dietary behavior after 6 months in patients at elevated risk for cardiovascular disease. This success was accompanied by reductions in body weight. Differences in fat intake were sustained at 12 months, but this was not reflected in lower serum lipid concentrations. Initial reductions in energy intake and anthropometric values did not persist after 1 year. Our findings are in line with other dietary intervention studies in family practice that report improved dietary habits but no significant effect on objective cardiovascular risk factors such as body weight and blood lipids.10,25-27 The uniqueness of our study is that it is the first randomized controlled trial in family practice based on the Stages-of-Change Model in which nutrition counseling is managed by the FP.
The reductions we found in total serum cholesterol concentrations (0.9% in the intervention group and 2.3% in the control group after 12 months) were smaller than the 3%-6% suggested by a systematic review of individualized nutrition counseling in free-living subjects.28 The observed reduction in our study is also less than predicted by the Keys equation.29 We do not have a clear explanation for this. It is possible that patients in the intervention group gave more socially desirable answers to the food frequency questionnaire than patients in the control group, due to the more extensive nutrition guidance in the intervention group.
The dropout rate in our study was low: 91% of the patients completed the trial, a notable strength of the study. This may be due to the fact that the participating patients were recruited and treated by their own FP, and may in part account for the small effect size as we avoided the selective participation of those patients who were most motivated for change. The education level of the study sample was low compared with the Dutch population at similar age,30 and this could also have resulted in smaller differences between intervention and control groups. In addition, it has been found that CHD patients who are obese and do not use lipid lowering drugs are less likely to follow recommended cholesterol-lowering diets.31 However, all of these factors make our study representative of the circumstances FPs can expect when managing nutritional intervention in routine care for patients at elevated risk for cardiovascular disease. Nutritional counseling on the basis of the Transtheoretical Model of stages of change7 is effective in the short term, but it is disappointing to have to conclude that this effect appears to be temporary, with eventual rebound to pre-intervention status. No sustained effects on the target outcomes such as body weight and serum lipids were found, possibly due to the relatively short (1-year) observation period. Improved effectiveness might be achieved with the development of patient protocols and education materials that are better aimed at poorly educated persons, and with more extensive use of modern forms of communications to implement lasting changes.
Conclusions
Nutritional counseling based on stages of change in patients at elevated risk for cardiovascular disease, provided by an FP with referral to a dietician in the action stage, led to reductions in dietary fat intake in the short and long term and to weight loss in the short term. In the absence of long-term effects on serum cholesterol levels, the emphasis remains on treating elevated lipids with drugs. However, research on effective and inexpensive dietary interventions remains important because of promising results for the short term and the important advantages of such intervention. The emphasis for future research should be testing new methods to maintain (dietary) behavioral changes and to investigate differences in susceptibility between individuals with unhealthy lifestyles. The model based on stages of change seems well suited for this sort of intervention, and the experience of this study is that it can easily be incorporated into the routines of family practice at low cost. As such, it is a simple instrument for selecting patients who are willing to change their food habits. Further, we reached a high percentage of poorly educated people, who are particularly vulnerable.32 We recommend examining whether education materials need to be better aimed at people with a low socio-economic status. Long-term nutrition counseling is needed for maintenance and further improvements.
Acknowledgments
This research was supported by the Netherlands Heart Foundation under grant no. 97.106 and by Bayer. We are grateful to the staff of the NMP family practices and their patients, without whom this study would not have been possible. We extend special thanks to the dieticians José Veen and Els Siebelink and to all the research assistants, especially to Marjolein Homs.
1. Pyorala K. CHD prevention in clinical practice Lancet 1996;348 Suppl 1:s26-s28.
2. Hiddink GJ, Hautvast JG, van-Woerkum CM, Fieren CJ, van-’t-Hof MA. Consumers’ expectations about nutrition guidance: the importance of primary care physicians Am J Clin Nutr 1997;65:1974S-1979S.
3. Gray DP. Dietary advice in British General Practice Eur J Clin Nutr 1999;53 Suppl 2:S3-S8.
4. De Bakker D., Abrahamse H., Van den Hoogen H., Braspenning J., Van Althuis T, Rutten R. Jaarrapport LINH 1998: contactfrequenties en verrichtingen in het landelijk informatie netwerk huisartsenzorg (LINH). Utrecht/Nijmegen, The Netherlands: NIVEL/WOK; 1999.
5. Van-Weel C. Nutritional guidance in general practice—a conceptual framework Eur J Clin Nutr 1999;53 Suppl 2:S108-S111.
6. Hiddink GJ, Hautvast JG, van-Woerkum CM, Fieren CJ, van-’t-Hof MA. Nutrition guidance by primary-care physicians: perceived barriers and low involvement. Eur J Clin Nutr 1995;49:842-851.
7. Horwath CC. Applying the transtheoretical model to eating behaviour change: challenges and opportunities Nutrition Research Reviews. 1999;12:281-317.
8. Prochaska JO, DiClemente CC. In search of how people change: applications to addictive behaviors American Psychologist 1992;47:1102-1114.
9. Cambell MK, DeVellis B, Strecher V, Ammerman A, DeVellis R, Sandler R. Improving dietary behaviour: the effectiveness of tailored messages in primary care settings Am J Public Health 1994;84:783-787.
10. Steptoe A, Doherty S, Rink E, Kerry S, Kendrick T, Hilton S. Behavioural counselling in general practice for the promotion of healthy behaviour among adults at increased risk of coronary heart disease: randomised trial. Br Med J 1999;319:943-947.
11. Van Weel C, Smith H, Beasley H. Family practice research networks. Experiences from 3 countries. J Fam Pract 2000;49:938-943.
12. Snedecor G, Cochran W. Statistical methods Iowa, USA: Iowa State University Press; 1991.
13. Rutten GEHM, Verhoeven S, Heine RJ, et al. NHG-Standaard Diabetes Mellitus Type 2 (eerste herziening) Huisarts Wet 1999;42:67-84.
14. Walma EP, Grundmeijer HGLM, Thomas S, Prins A, Van den Hoogen J, Van der laan JR. NHG-Standaard Hypertensie (eerste herziening) Huisarts Wet 1997;40:598-617.
15. Thomas S, Van der Weijden T, Van Drenth BB, Haverkort AFM, Hooi JD, Van der Laan JD. NHG-standaard Cholesterol Huisarts Wet 1999;42:406-417.
16. Allain CC, Poon LS, Chan CS, Richmond W, Fu PC. Enzymatic determination of total serum cholesterol Clin Chem 1974;20:470-475.
17. Burstein M, Scholnick HR, Morfin R. Rapid method for the isolation of lipoproteins from human serum by precipitation with polyan-ions. J Lipid Res 1970;11:583-595.
18. Fossati P, Prencipe L. Serum triglycerides determined colorimetrically with an enzyme that produces hydrogen peroxide Clin Chem 1982;28:2077-2080.
19. Friedewald WT, Levy RI, Fredrickson DS. Estimation of the concentration of low-density lipoprotein cholesterol in plasma without use of the preparative ultracentrifuge Clin Chem 1972;18:499-502.
20. Feunekes GI, van-Staveren WA, De-Vries JH, Burema J, Hautvast JG. Relative and biomarker-based validity of a food-frequency questionnaire estimating intake of fats and cholesterol Am J Clin Nutr 1993;58:489-496.
21. Voorlichtingsbureau voor de Voeding. Zo eet Nederland 1992: resultaten van de voedselconsumptiepeiling 1992 (results of the 1992 Dutch National Food Consumption Survey). The Hague, The Netherlands: Voorlichtingsbureau voor de Voeding (The Netherlands Nutrition Centre);1993.
22. Voorlichtingsbureau voor de Voeding. Nederlandse Voedings-middelentabel 1997 (Dutch nutrient data base). The Hague, The Netherlands: Voorlichtingsbureau voor de Voeding (The Netherlands Nutrition Centre); 1997.
23. Curry S, Kristal A, Bowen D. An application of the stage model of behavior change to dietary fat reduction Health Education Research 1992;1:97-105.
24. Sporny LA, Contento I. Stages of change in dietary fat reduction: social psychological correlates J Nutr Educ 1995;27:191-199.
25. Cupples ME, McKnight A. Randomised controlled trial of health promotion in general practice for patients at high cardiovascular risk Br Med J 1994;309:993-996.
26. Neil HA, Roe L, Godlee RJ, et al. Randomised trial of lipid lowering dietary advice in general practice: the effects on serum lipids, lipoproteins and antioxidants. Br Med J 1995;310:569-573.
27. Hellénius M-L, Krakau I, De Faire U. Favourable long-term effects from advice on diet and exercise given to healthy men with raised cardiovascular risk factors. Nutr Metab Cardiovasc Dis 1997;7:293-300.
28. Tang JL, Armitage JM, Lancaster T, Silagy CA, Fowler GH, Neil HAW. Systematic review of dietary intervention trials to lower blood total cholesterol in free-living subjects. Br Med J 1998;316:1213-1220.
29. Keys A, Anderson J, Grande F. Serum cholesterol response to changes in the diet IV: particularly saturated fatty acids in diet 2S-P. Metabolism 1965;14:776-787.
30. Dickman, A., Eijkhout, M. P., Loeve J.A. Werken en leren 1999-2000: feiten en cijfers over de arbeidsmarkt en het onderwijs in Nederland. Alphen a.d. Rijn, The Netherlands, Centraal Bureau voor de Statistiek (Statistics The Netherlands);2000.
31. Erkkila AT, Sarkkinen ES, Koukkunen H, et al. Concordance of diet with the recommended cholesterol lowering diet in patients with coronary heart disease. Eur J Clin Nutr 1998;52:279-285.
32. Lynch JW, Kaplan GA, Cohen RD, Tuomilehto J, Salonen JT. Do cardiovascular risk factors explain the relation between socioeconomic status, risk of all-cause mortality, cardiovascular mortality and acute myocardial infarction? Am J Epidemiol 1996;144:934-942.
On the front lines: Family physicians’ preparedness for bioterrorism
OBJECTIVE: The events of September 11, 2001, and the nation’s recent experience with anthrax assaults made bioterrorism preparedness a national priority. Because primary care physicians are among the sentinel responders to bioterrorist attacks, we sought to determine family physicians’ beliefs about their preparedness for such an attack.
STUDY DESIGN: In October 2001 we conducted a national survey of 976 family physicians randomly selected from the American Academy of Family Physicians’ active membership directory.
POPULATION: 614 (63%) family physicians responded to the survey.
OUTCOMES MEASURED: Physicians’ self-reported ability to “know what to do as a doctor in the event of a suspected bioterrorist attack, recognize signs and symptoms of an illness due to bioterrorism, and know where to call to report a suspected bioterrorist attack.”
RESULTS: Ninety-five percent of physicians agreed that a bioterrorist attack is a real threat within the United States. However, only 27% of family physicians believed that the US health care system could respond effectively to a bioterrorist attack; fewer (17%) thought that their local medical communities could respond effectively. Twenty-six percent of physicians reported that they would know what to do as a doctor in the event of a bioterrorist attack. Only 18% had previous training in bioterrorism preparedness. In a multivariate analysis, physicians’ reported that preparedness for a bioterrorist attack was significantly associated with previous bioterrorism preparedness training (OR 3.9 [95% CI 2.4–6.3]) and knowing how to obtain information in the event of a bioterrorist attack (OR 6.4 [95% CI 3.9–10.6]).
CONCLUSIONS: Only one quarter of family physicians felt prepared to respond to a bioterrorist event. However, training in bioterrorism preparedness was significantly associated with physicians’ perceived ability to respond effectively to an attack. Primary care physicians need more training in bioterrorism preparedness and easy access to public health and medical information in the event of a bioterrorist attack.
- Only one quarter of family physicians believe they are prepared to respond to a bioterrorist event.
- Family physicians who have received training in bioterrorism preparedness are more confident than their untrained peers that they would respond effectively to a bioterrorist attack.
- Primary care physicians, who would be on the front line in a bioterrorism attack, should seek training in detection, surveillance, and response activities.
With the events of September 11, 2001, and the anthrax attacks that followed, the once seemingly remote threat of a bioterrorist attack in the United States is now a reality.13 As with infectious disease outbreaks and other public health emergencies, early detection and reporting are critical to a timely and effective response to a bioterrorist event.4-7 For most Americans, their first point of contact with the health care system is the primary care physician, who is therefore on the front line in this new era of bioterrorism.8,9 Because victims of a bioterrorist attack may not know they have been affected, and because the symptoms caused by many bioterrorism-related agents mimic those of common condi-tions, primary care physicians will likely be in the position of diagnosing and managing the initial cases of a bioterrorist-related illness.10 Physicians’ ability to identify cases and activate the public health system are crucial steps in effectively responding to a bioterrorist attack.6,11,12
Recent studies have concluded that the preparedness and infrastructure of the public health system are inadequate to deal with a bioterrorist attack and need improvement.7,13-16 One survey found that fewer than 20% of emergency departments in the Pacific Northwest had plans for responding to a bioterrorist event.17 While the emphasis on the public health system is appropriate, these studies failed to discuss the critical role of primary care providers in responding to bioterrorism.18-20
While physician experience with the public health system in managing natural disasters and infectious disease outbreaks may be helpful, the unique features of a bioterrorist attack require that primary care physicians be able to obtain and use information from public health and intelligence sources.4,21 To date, no studies have assessed primary care physi-cians’ ability to respond to a bioterrorist event. In this national survey we assessed family physicians’ personal sense of preparedness for responding to a bioterrorist attack.
Methods
In March 2001, the National Network for Family Practice and Primary Care Research of the American Academy of Family Physicians (AAFP) conducted 2 focus groups of family physicians to explore the issue of bioterrorism preparedness. Using the results of these focus groups, we designed a 37-item questionnaire to be completed by practicing family physicians. The survey was pilot-tested for clarity by 10 academic family physicians and revised accordingly. The questionnaire used 5-category Likert scales, ranging from “strongly agree” to “strongly disagree” or from “excellent” to “poor,” to measure physicians’ assessment of bioterrorist risk and preparedness, specific clinical competencies, and their prior level of interaction with the public health system. Physicians were also asked to list 4 biologic agents that might be used in a terrorist attack. Physicians’ demographic information, including age, gender, training level, and board certification, was obtained from the membership database of the AAFP. Physician age was divided into 3 categories because of its asymmetric distribution. Physicians were asked to describe their location as rural, urban, or suburban, and to describe the size of the population in their area. Using the physicians’ zip codes, we geocoded the respondents to 1 of 4 regions of the country. The study was approved by the Social Science Institutional Review Board at the University of Missouri – Kansas City.
The confidential survey was mailed to a national sample of 976 physicians randomly selected from the computerized database of approximately 53,900 active members of the AAFP. Approximately 85% of active members spend at least 70% of their professional time in direct patient care. Two subsequent mailings were sent to non-respondents. The initial survey was mailed in October 2001, before the first case of anthrax was reported to the Centers for Disease Control and Prevention.1
Three survey items were the main outcomes of the study because they represented the key features of family physician preparedness: (1) “knowing what to do as a doctor in the event of a suspected bioterrorist attack in my community,” (2) “recognizing signs and symptoms of an illness due to bioterrorism in my own patients,” and (3) “knowing where to call to report a suspected bioterrorist attack.” For analysis, Likert scale responses of “strongly agree” and “agree” were collapsed into a single category because of the small number of “strongly agree” responses. Similarly, “strongly disagree” and “disagree” responses were combined. Student’s t-test and Pearson’s chi-square test were used to assess statistical significance in bivariate analyses. Multivariate logistic regression was performed to assess the effects of age, sex, geographic location, risk assessment, ability to gather information, and previous training in bioterrorism preparedness on the main outcomes of interest. These variables were selected a priori from the conceptual model of the survey. Analyses were conducted using STATA, v. 7.0 (Stata Corp., College Station, TX).
Results
Of the 976 family physicians sent the bioterrorism survey, 614 (63%) responded. The average age of the respondents was 45 years (range 28–76 years) and 70% were male. Respondents were distributed among rural, suburban, and urban geographic locations (Table 1). Respondents did not differ significantly from non-respondents with respect to age, gender, medical training, or board certification (Table 1).
Although 95% of physicians agreed that a bioterrorist attack is a real threat within the United States, only 27% believed the United States health care system could respond effectively to such an attack (Table 2). Thirty-nine percent believed that an attack is a real threat in their local communities; however, only 19% thought their local medical community could respond effectively. Sixty percent thought it likely that current public health surveillance systems could quickly identify a bioterrorist attack. Physicians’ thoughts about the biochemical agents most likely to be used in an attack are listed in Table 3.
Almost three quarters of physicians did not feel prepared to respond to a bioterrorist attack. Only 24% of those surveyed believed they could recognize signs and symptoms of an illness in their patients due to bioterrorism, and 38% rated their current knowledge of the diagnosis and management of bioterrorism-related illness as poor. Moreover, only 18% of physicians had received previous training in bioterrorism preparedness (Table 2).
When asked about their ability to deal with natural disasters or infectious disease outbreaks, a significantly higher percentage of physicians reported they would know how to respond to these major public health events (Table 2). Twenty-six percent of physicians reported they would know what to do in the event of a bioterrorist attack, compared with 65% (P <0.001) of physicians who reported they would know what to do in the event of a natural disaster and 66% (P <0.001) who reported knowing what to do in an infectious disease outbreak. After combining responses for local hospitals and community preparedness, only 17% believed that both their hospitals and their medical communities could respond effectively to a bioterrorism attack, compared with 60% (P <0.001) for a natural disaster and 56% (P <0.001) for an infectious disease outbreak. Physicians who felt prepared for natural disasters were 4 times more likely than other doctors to know how to respond to a bioterrorist attack (36% vs. 9%, P <0.001). Physicians who felt prepared for infectious disease outbreaks were 6 times more likely than other doctors to know how to respond to a bioterrorist attack (37% vs. 6%, P <0.001).
Importantly, physicians felt better prepared for a bioterrorist attack if they had training in bioterrorism preparedness. Physicians who had received such training were 3 times more likely than other doctors to know how to respond to a bioterrorist attack (55% vs. 20%, P <0.001). Ninety-eight percent thought it was important for them to be trained to identify a bioterrorist attack, and 93% of physicians said they would like such training.
Familiarity with the public health system was not necessarily associated with physicians’ preparedness for bioterrorism. While 93% of physicians report notifiable infectious disease cases to the health department, only 57% (P <0.001) reported knowing whom to call to report a suspected bioterrorist attack. Fifty-six percent of physicians reported knowing how to get information if they suspected an attack in their community.
In the multivariate model, having received training in bioterrorism preparedness (OR 3.9 [95%CI 2.4–6.3]) and knowing how to obtain information in the event of a bioterrorist attack (OR 6.4 [95%CI 3.9–10.6]) were significantly associated with physicians’ knowing what to do in the event of an attack (Table 4). These factors were also significantly associated with physicians’ ability to recognize signs and symptoms of a bioterrorism-related illness and knowledge of how to report a bioterrorist attack. Believing that bioterrorism was a real threat to their communities was also significantly associated with a physician’s ability to recognize signs and symptoms of a bioterrorism-related illness (OR 1.9 [95%CI 1.2–2.9]). Physicians’ preparedness was not associated with age, gender, geographic location, or residence in a rural, urban, or suburban area.
TABLE 1
Comparison of survey respondents and non-respondents
| % Respondents (n=614) | % Non-respondents (n=362) | P value | ||
|---|---|---|---|---|
| Mean age (SD) | 45 (9.6) | 44 (9.6) | .70 | |
| Age categories | <40 | 32 | 33 | .57 |
| 40–50 | 43 | 45 | ||
| >50 | 26 | 23 | ||
| Gender | Male | 70 | 76 | .07 |
| Medical training | MD degree | 90 | 91 | .53 |
| International | ||||
| Medical Graduate | 17 | 14 | .30 | |
| Board status | Board certified | 86 | 82 | .09 |
| Mean years since certification (SD) | 12 (7.9) | 11 (7.6) | .56 | |
| Geographic setting | Northeast | 14 | ||
| Midwest | 27 | |||
| South | 38 | |||
| West | 21 | |||
| Rural | 35 | |||
| Suburban | 37 | |||
| Urban | 29 | |||
| Population | <25,000 | 36 | ||
| 25,000–350,000 | 41 | |||
| 350,000 | 24 |
TABLE 2
Physicians’ responses to selected survey items
| Strongly agree or agree (%) | Neutral (%) | Strongly disagree or disagree (%) | ||
|---|---|---|---|---|
| Risk assessment | ||||
| “A bioterrorist attack is a real threat...” | in the United States | 95 | 3 | 2 |
| in my local community | 39 | 34 | 27 | |
| Preparedness | ||||
| “Could respond effectively to a bioterrorist attack” | United States | |||
| health care system | 27 | 32 | 42 | |
| My local medical community | 19 | 34 | 47 | |
| My local hospital | 21 | 33 | 46 | |
| “Know what to do as a doctor in the event of a suspected bioterrorist attack.” | 26 | 25 | 49 | |
| “Could respond effectively to a natural disaster” | My local medical community | 62 | 21 | 17 |
| My local hospital | 66 | 19 | 14 | |
| Self | 65 | 20 | 15 | |
| “Could respond effectively to an infectious disease outbreak “ | My local medical community | 60 | 27 | 14 |
| My local hospital | 60 | 25 | 15 | |
| Self | 66 | 22 | 12 | |
| Capabilities in bioterrorism response | ||||
| “Know where to call to report suspected attack” | 57 | 13 | 30 | |
| “Would recognize signs and symptoms” | 24 | 36 | 40 | |
| “Know how to get information about attack” | 56 | 17 | 27 | |
| “Know how to get clinical information about bioterrorism” | 54 | 18 | 28 | |
| Received prior training in bioterrorism preparedness | “Yes” 18 | “No” 82 | ||
| Current knowledge of management of bioterroristrelated illness | “Excellent or Very good” 5 | “Poor” 38 | ||
TABLE 3
Biologic agents physicians consider most likely to be used in a bioterrorist attack
| Agent | Survey respondents (%) |
|---|---|
| Anthrax | 96 |
| Smallpox | 82 |
| Plague | 28 |
| Botulism | 22 |
| Ebola | 16 |
| Nerve gas | 14 |
| Tularemia | 11 |
| Escherichia coli | 7 |
| Salmonella | 5 |
| Influenza virus | 4 |
TABLE 4
Predictors of preparedness in 3 areas of responsibility
| Knowing what to do as a doctor | Recognizing signs and symptoms | Knowing whom to contact | ||||
|---|---|---|---|---|---|---|
| Factor | OR* | 95% CI | OR* | 95% CI | OR* | 95% CI |
| Age <40 | 1.0 | referent | 1.0 | referent | 1.0 | referent |
| Age 40–50 | 1.1 | 0.6–1.7 | 1.0 | 0.6–1.7 | .9 | 0.6–1.4 |
| Age >50 | 1.9 | 1.1–3.3 | 1.8 | 1.0–3.2 | 1.3 | 0.8–2.1 |
| Female | 1.0 | referent | 1.0 | referent | 1.0 | referent |
| Male | 1.9 | 1.0–2.6 | 1.6 | 0.9–2.6 | .8 | 0.5–1.2 |
| Believe bioterrorist attack is real threat | ||||||
| in community | 1.3 | 0.9–2.0 | 1.9 | 1.2–2.9 | 1.4 | 1.0–2.1 |
| Know how to get info in suspected bio attack | 6.4 | 3.9–10.6 | 6.2 | 3.7–10.5 | 6.3 | 4.3–9.1 |
| Had prior bioterrorism preparedness training | 3.9 | 2.4–6.3 | 2.9 | 1.8–4.7 | 3.3 | 1.9–5.9 |
| Live in urban area | 1.0 | referent | 1.0 | referent | 1.0 | referent |
| Live in rural area | 1.2 | 0.7–1.9 | 1.1 | 0.7–1.9 | 1.2 | 0.7–1.9 |
| Live in suburban area | 1.1 | 0.7–1.9 | 1.0 | 0.6–1.6 | 1.0 | 0.6–1.6 |
| * Adjusted for other factors in table. OR=odds ratio. CI=confidence interval. | ||||||
Discussion
Only one quarter of family physicians in this national survey felt prepared to respond to a bioterrorist event. The majority of respondents did not feel confident in diagnosing or managing a bioterrorism-related illness, and fewer than 60% reported knowing how to report a bioterrorist event or obtain information about such an event. In addition, only one quarter of physicians were confident that local or national health care systems could respond effectively to a bioterrorist attack.
Those physicians who had received bioterrorism preparedness training were more likely to report having the skills and knowledge to respond to a bioterrorist attack. Knowing how to get information in the event of a suspected attack was the greatest predictor of being able to diagnose and report cases. Although we did not assess the nature of the training or test physicians’ actual preparedness, these data suggest that training may improve physicians’ abilities to diagnose and treat victims of bioterrorism. Finally, there are no published validated measures of bioterrorism preparedness, and there are few data to demonstrate the effectiveness of particular training interventions.21
Physicians felt more comfortable responding to other types of public health emergencies, such as natural disasters or infectious disease outbreaks. This may be due in part to their personal experiences in dealing with these events, or may reflect the formalized training in public health response that is part of medical school curricula. The reporting and response skills physicians would use in dealing with the public health system during a bioterrorist event are similar to the ones they use during natural disasters and infectious disease outbreaks. However, further emphasis should be placed on the importance of information-gathering and pre-incident intelligence for physicians.4
Because the survey instrument did not define bioterrorism, we relied on the respondents’ personal definitions of bioterrorism. While the timing of the survey coincided with national media attention on the recent anthrax cases, we did not detect a high level of knowledge or confidence in dealing with bioterrorism. In fact, despite the timing, we believe the results are valid and may reflect all physicians’ heightened awareness of the threat of bioterrorism and especially their limitations in dealing with it. Physicians clearly acknowledge the need for more training in bioterrorism response.
Primary care physicians have an important role in the public health response to bioterrorism. The results of this study indicate physicians should be trained in how to identify and manage illnesses caused by biologic weapons, how to obtain information about bioterrorism quickly, and how to activate the public health system in the event of a suspected attack. As the public health infrastructure is improved through increased funding, it should integrate training for front-line primary care physicians in detection, surveillance, and response activities.22 The AAFP has already begun to promote web-based training resources for practicing physicians (www.aafp.org/btresponse). Further study is warranted to test educational interventions designed to improve physicians’ preparedness for bioterrorism and their interactions with the public health sector.
Acknowledgments
The views expressed are those of the authors. No official endorsement by the Agency for Healthcare Research and Quality or the American Academy of Family Physicians is intended or should be inferred. This study was funded by AHRQ grant P20 HS11182-S. The authors thank Tom Stewart for his assistance with data collection, Phyllis Naragon and Jon Temte for conducting the focus groups, and Clark Hanmer for his assistance with data analysis and manuscript revisions.
1. CDC Update: Investigation of bioterrorism-related anthrax and interim guidelines for clinical evaluation of persons with possible anthrax. Morb Mortal Wkly Rep MMWR 2001;50(43):941-8.
2. Borio L, Frank D, Mani V, et al. Death due to bioterrorism-related inhalational anthrax. JAMA 2001;286(20):2554-9.
3. Mayer TA, Bersoff-Matcha S, Murphy C, et al. Clinical presentation of inhalational anthrax following bioterrorism exposure. JAMA 2001;286(20):2549-53.
4. Committee on R&D needs for improving civilian medical response to chemical and biological terrorism incidents hpp Institute of Medicine, and Board on Environmental Studies and Toxicology, Commission on Life Sciences, National Research Council. Chemical and biological terrorism: research and development to improve civilian medical response.Washington DC: National Academy Press; 1999.
5. Khan AS, Morse S, Lillibridge S. Public-health preparedness for biological terrorism in the USA. Lancet 2000;356(9236):1179-82.
6. Franz DR, Jahrling PB, Friedlander AM, McClain DJ, Hoover DL, Bryne WR, et al. Clinical recognition and management of patients exposed to biological warfare agents. JAMA 1997;278(5):399-411.
7. CDC Biological and chemical terrorism: Strategic plan for preparedness and response. MMWR Morb Mortal Wkly Rep 2000;49(RR04):1-14.
8. Green LA, Fryer GE, , Jr. , Yawn BP, Lanier D, Dovey SM. The ecology of medical care revisited [see comments]. N Engl J Med 2001;344(26):2021-5.
9. Lane HC, Fauci AS. Bioterrorism on the home front. A new challenge for American medicine. JAMA 2001;286(20):2595-7.
10. Gourlay M, Siwek J. Resources in the war against bioterrorism. Am Fam Physician 2001;64(10):1676-8.
11. Gordon SM. The threat of bioterrorism: a reason to learn more about anthrax and smallpox. Cleve Clin J Med 1999;66(10):592-5.
12. Haines JD, Pitts K, Crutcher JM. Medical response to bioterrorism: are we prepared? J Okla State Med Assoc 2000;93(5):187-96.
13. Inglesby T, Grossman R, O’Toole T. A plague on your city: observations from topoff. Clin Infect Dis 2001;32(3):436-45.
14. Khan AS, Ashford DA. Ready or not—preparedness for bioterrorism. N Engl J Med 2001;345(4):287-9.
15. Garrett LC, Magruder C, Molgard CA. Taking the terror out of bioterrorism: planning for a bioterrorist event from a local perspective. I Public Health Manag Pract 2000;6(4):1-7.
16. Rosen P. Coping with bioterrorism is difficult, but may help us respond to new epidemics [see comments]. BMJ 2000;320(7227):71-2.
17. Wetter DC, Daniell WE, Treser CD. Hospital preparedness for victims of chemical or biological terrorism. Am J Public Health 2001;91(5):710-6.
18. Geiger HJ. Terrorism, biological weapons, and bonanzas: assessing the real threat to public health. [letter; comment]. Am J Public Health. 2001;91(5):708-9.
19. Henretig F. Biological and chemical terrorism defense: a view from the “front lines” of public health. [letter; comment]. Am J Public Health 2001;91(5):718-20.
20. Sidel VW, Cohen HW, Gould RM. Good intentions and the road to bioterrorism preparedness. Am J Public Health 2001;91(5):716-8.
21. Training of Clinicians for Public Health Events Relevant to Bioterrorism Preparedness. Rockville, MD: Agency for Healthcare Research and Quality; 2001. AHRQ Publication No. 02-E007.
22. Isaacs B. A boost for public health agencies. Philadelphia Inquirer 2001 November 26, 2001;Sect. A9.
OBJECTIVE: The events of September 11, 2001, and the nation’s recent experience with anthrax assaults made bioterrorism preparedness a national priority. Because primary care physicians are among the sentinel responders to bioterrorist attacks, we sought to determine family physicians’ beliefs about their preparedness for such an attack.
STUDY DESIGN: In October 2001 we conducted a national survey of 976 family physicians randomly selected from the American Academy of Family Physicians’ active membership directory.
POPULATION: 614 (63%) family physicians responded to the survey.
OUTCOMES MEASURED: Physicians’ self-reported ability to “know what to do as a doctor in the event of a suspected bioterrorist attack, recognize signs and symptoms of an illness due to bioterrorism, and know where to call to report a suspected bioterrorist attack.”
RESULTS: Ninety-five percent of physicians agreed that a bioterrorist attack is a real threat within the United States. However, only 27% of family physicians believed that the US health care system could respond effectively to a bioterrorist attack; fewer (17%) thought that their local medical communities could respond effectively. Twenty-six percent of physicians reported that they would know what to do as a doctor in the event of a bioterrorist attack. Only 18% had previous training in bioterrorism preparedness. In a multivariate analysis, physicians’ reported that preparedness for a bioterrorist attack was significantly associated with previous bioterrorism preparedness training (OR 3.9 [95% CI 2.4–6.3]) and knowing how to obtain information in the event of a bioterrorist attack (OR 6.4 [95% CI 3.9–10.6]).
CONCLUSIONS: Only one quarter of family physicians felt prepared to respond to a bioterrorist event. However, training in bioterrorism preparedness was significantly associated with physicians’ perceived ability to respond effectively to an attack. Primary care physicians need more training in bioterrorism preparedness and easy access to public health and medical information in the event of a bioterrorist attack.
- Only one quarter of family physicians believe they are prepared to respond to a bioterrorist event.
- Family physicians who have received training in bioterrorism preparedness are more confident than their untrained peers that they would respond effectively to a bioterrorist attack.
- Primary care physicians, who would be on the front line in a bioterrorism attack, should seek training in detection, surveillance, and response activities.
With the events of September 11, 2001, and the anthrax attacks that followed, the once seemingly remote threat of a bioterrorist attack in the United States is now a reality.13 As with infectious disease outbreaks and other public health emergencies, early detection and reporting are critical to a timely and effective response to a bioterrorist event.4-7 For most Americans, their first point of contact with the health care system is the primary care physician, who is therefore on the front line in this new era of bioterrorism.8,9 Because victims of a bioterrorist attack may not know they have been affected, and because the symptoms caused by many bioterrorism-related agents mimic those of common condi-tions, primary care physicians will likely be in the position of diagnosing and managing the initial cases of a bioterrorist-related illness.10 Physicians’ ability to identify cases and activate the public health system are crucial steps in effectively responding to a bioterrorist attack.6,11,12
Recent studies have concluded that the preparedness and infrastructure of the public health system are inadequate to deal with a bioterrorist attack and need improvement.7,13-16 One survey found that fewer than 20% of emergency departments in the Pacific Northwest had plans for responding to a bioterrorist event.17 While the emphasis on the public health system is appropriate, these studies failed to discuss the critical role of primary care providers in responding to bioterrorism.18-20
While physician experience with the public health system in managing natural disasters and infectious disease outbreaks may be helpful, the unique features of a bioterrorist attack require that primary care physicians be able to obtain and use information from public health and intelligence sources.4,21 To date, no studies have assessed primary care physi-cians’ ability to respond to a bioterrorist event. In this national survey we assessed family physicians’ personal sense of preparedness for responding to a bioterrorist attack.
Methods
In March 2001, the National Network for Family Practice and Primary Care Research of the American Academy of Family Physicians (AAFP) conducted 2 focus groups of family physicians to explore the issue of bioterrorism preparedness. Using the results of these focus groups, we designed a 37-item questionnaire to be completed by practicing family physicians. The survey was pilot-tested for clarity by 10 academic family physicians and revised accordingly. The questionnaire used 5-category Likert scales, ranging from “strongly agree” to “strongly disagree” or from “excellent” to “poor,” to measure physicians’ assessment of bioterrorist risk and preparedness, specific clinical competencies, and their prior level of interaction with the public health system. Physicians were also asked to list 4 biologic agents that might be used in a terrorist attack. Physicians’ demographic information, including age, gender, training level, and board certification, was obtained from the membership database of the AAFP. Physician age was divided into 3 categories because of its asymmetric distribution. Physicians were asked to describe their location as rural, urban, or suburban, and to describe the size of the population in their area. Using the physicians’ zip codes, we geocoded the respondents to 1 of 4 regions of the country. The study was approved by the Social Science Institutional Review Board at the University of Missouri – Kansas City.
The confidential survey was mailed to a national sample of 976 physicians randomly selected from the computerized database of approximately 53,900 active members of the AAFP. Approximately 85% of active members spend at least 70% of their professional time in direct patient care. Two subsequent mailings were sent to non-respondents. The initial survey was mailed in October 2001, before the first case of anthrax was reported to the Centers for Disease Control and Prevention.1
Three survey items were the main outcomes of the study because they represented the key features of family physician preparedness: (1) “knowing what to do as a doctor in the event of a suspected bioterrorist attack in my community,” (2) “recognizing signs and symptoms of an illness due to bioterrorism in my own patients,” and (3) “knowing where to call to report a suspected bioterrorist attack.” For analysis, Likert scale responses of “strongly agree” and “agree” were collapsed into a single category because of the small number of “strongly agree” responses. Similarly, “strongly disagree” and “disagree” responses were combined. Student’s t-test and Pearson’s chi-square test were used to assess statistical significance in bivariate analyses. Multivariate logistic regression was performed to assess the effects of age, sex, geographic location, risk assessment, ability to gather information, and previous training in bioterrorism preparedness on the main outcomes of interest. These variables were selected a priori from the conceptual model of the survey. Analyses were conducted using STATA, v. 7.0 (Stata Corp., College Station, TX).
Results
Of the 976 family physicians sent the bioterrorism survey, 614 (63%) responded. The average age of the respondents was 45 years (range 28–76 years) and 70% were male. Respondents were distributed among rural, suburban, and urban geographic locations (Table 1). Respondents did not differ significantly from non-respondents with respect to age, gender, medical training, or board certification (Table 1).
Although 95% of physicians agreed that a bioterrorist attack is a real threat within the United States, only 27% believed the United States health care system could respond effectively to such an attack (Table 2). Thirty-nine percent believed that an attack is a real threat in their local communities; however, only 19% thought their local medical community could respond effectively. Sixty percent thought it likely that current public health surveillance systems could quickly identify a bioterrorist attack. Physicians’ thoughts about the biochemical agents most likely to be used in an attack are listed in Table 3.
Almost three quarters of physicians did not feel prepared to respond to a bioterrorist attack. Only 24% of those surveyed believed they could recognize signs and symptoms of an illness in their patients due to bioterrorism, and 38% rated their current knowledge of the diagnosis and management of bioterrorism-related illness as poor. Moreover, only 18% of physicians had received previous training in bioterrorism preparedness (Table 2).
When asked about their ability to deal with natural disasters or infectious disease outbreaks, a significantly higher percentage of physicians reported they would know how to respond to these major public health events (Table 2). Twenty-six percent of physicians reported they would know what to do in the event of a bioterrorist attack, compared with 65% (P <0.001) of physicians who reported they would know what to do in the event of a natural disaster and 66% (P <0.001) who reported knowing what to do in an infectious disease outbreak. After combining responses for local hospitals and community preparedness, only 17% believed that both their hospitals and their medical communities could respond effectively to a bioterrorism attack, compared with 60% (P <0.001) for a natural disaster and 56% (P <0.001) for an infectious disease outbreak. Physicians who felt prepared for natural disasters were 4 times more likely than other doctors to know how to respond to a bioterrorist attack (36% vs. 9%, P <0.001). Physicians who felt prepared for infectious disease outbreaks were 6 times more likely than other doctors to know how to respond to a bioterrorist attack (37% vs. 6%, P <0.001).
Importantly, physicians felt better prepared for a bioterrorist attack if they had training in bioterrorism preparedness. Physicians who had received such training were 3 times more likely than other doctors to know how to respond to a bioterrorist attack (55% vs. 20%, P <0.001). Ninety-eight percent thought it was important for them to be trained to identify a bioterrorist attack, and 93% of physicians said they would like such training.
Familiarity with the public health system was not necessarily associated with physicians’ preparedness for bioterrorism. While 93% of physicians report notifiable infectious disease cases to the health department, only 57% (P <0.001) reported knowing whom to call to report a suspected bioterrorist attack. Fifty-six percent of physicians reported knowing how to get information if they suspected an attack in their community.
In the multivariate model, having received training in bioterrorism preparedness (OR 3.9 [95%CI 2.4–6.3]) and knowing how to obtain information in the event of a bioterrorist attack (OR 6.4 [95%CI 3.9–10.6]) were significantly associated with physicians’ knowing what to do in the event of an attack (Table 4). These factors were also significantly associated with physicians’ ability to recognize signs and symptoms of a bioterrorism-related illness and knowledge of how to report a bioterrorist attack. Believing that bioterrorism was a real threat to their communities was also significantly associated with a physician’s ability to recognize signs and symptoms of a bioterrorism-related illness (OR 1.9 [95%CI 1.2–2.9]). Physicians’ preparedness was not associated with age, gender, geographic location, or residence in a rural, urban, or suburban area.
TABLE 1
Comparison of survey respondents and non-respondents
| % Respondents (n=614) | % Non-respondents (n=362) | P value | ||
|---|---|---|---|---|
| Mean age (SD) | 45 (9.6) | 44 (9.6) | .70 | |
| Age categories | <40 | 32 | 33 | .57 |
| 40–50 | 43 | 45 | ||
| >50 | 26 | 23 | ||
| Gender | Male | 70 | 76 | .07 |
| Medical training | MD degree | 90 | 91 | .53 |
| International | ||||
| Medical Graduate | 17 | 14 | .30 | |
| Board status | Board certified | 86 | 82 | .09 |
| Mean years since certification (SD) | 12 (7.9) | 11 (7.6) | .56 | |
| Geographic setting | Northeast | 14 | ||
| Midwest | 27 | |||
| South | 38 | |||
| West | 21 | |||
| Rural | 35 | |||
| Suburban | 37 | |||
| Urban | 29 | |||
| Population | <25,000 | 36 | ||
| 25,000–350,000 | 41 | |||
| 350,000 | 24 |
TABLE 2
Physicians’ responses to selected survey items
| Strongly agree or agree (%) | Neutral (%) | Strongly disagree or disagree (%) | ||
|---|---|---|---|---|
| Risk assessment | ||||
| “A bioterrorist attack is a real threat...” | in the United States | 95 | 3 | 2 |
| in my local community | 39 | 34 | 27 | |
| Preparedness | ||||
| “Could respond effectively to a bioterrorist attack” | United States | |||
| health care system | 27 | 32 | 42 | |
| My local medical community | 19 | 34 | 47 | |
| My local hospital | 21 | 33 | 46 | |
| “Know what to do as a doctor in the event of a suspected bioterrorist attack.” | 26 | 25 | 49 | |
| “Could respond effectively to a natural disaster” | My local medical community | 62 | 21 | 17 |
| My local hospital | 66 | 19 | 14 | |
| Self | 65 | 20 | 15 | |
| “Could respond effectively to an infectious disease outbreak “ | My local medical community | 60 | 27 | 14 |
| My local hospital | 60 | 25 | 15 | |
| Self | 66 | 22 | 12 | |
| Capabilities in bioterrorism response | ||||
| “Know where to call to report suspected attack” | 57 | 13 | 30 | |
| “Would recognize signs and symptoms” | 24 | 36 | 40 | |
| “Know how to get information about attack” | 56 | 17 | 27 | |
| “Know how to get clinical information about bioterrorism” | 54 | 18 | 28 | |
| Received prior training in bioterrorism preparedness | “Yes” 18 | “No” 82 | ||
| Current knowledge of management of bioterroristrelated illness | “Excellent or Very good” 5 | “Poor” 38 | ||
TABLE 3
Biologic agents physicians consider most likely to be used in a bioterrorist attack
| Agent | Survey respondents (%) |
|---|---|
| Anthrax | 96 |
| Smallpox | 82 |
| Plague | 28 |
| Botulism | 22 |
| Ebola | 16 |
| Nerve gas | 14 |
| Tularemia | 11 |
| Escherichia coli | 7 |
| Salmonella | 5 |
| Influenza virus | 4 |
TABLE 4
Predictors of preparedness in 3 areas of responsibility
| Knowing what to do as a doctor | Recognizing signs and symptoms | Knowing whom to contact | ||||
|---|---|---|---|---|---|---|
| Factor | OR* | 95% CI | OR* | 95% CI | OR* | 95% CI |
| Age <40 | 1.0 | referent | 1.0 | referent | 1.0 | referent |
| Age 40–50 | 1.1 | 0.6–1.7 | 1.0 | 0.6–1.7 | .9 | 0.6–1.4 |
| Age >50 | 1.9 | 1.1–3.3 | 1.8 | 1.0–3.2 | 1.3 | 0.8–2.1 |
| Female | 1.0 | referent | 1.0 | referent | 1.0 | referent |
| Male | 1.9 | 1.0–2.6 | 1.6 | 0.9–2.6 | .8 | 0.5–1.2 |
| Believe bioterrorist attack is real threat | ||||||
| in community | 1.3 | 0.9–2.0 | 1.9 | 1.2–2.9 | 1.4 | 1.0–2.1 |
| Know how to get info in suspected bio attack | 6.4 | 3.9–10.6 | 6.2 | 3.7–10.5 | 6.3 | 4.3–9.1 |
| Had prior bioterrorism preparedness training | 3.9 | 2.4–6.3 | 2.9 | 1.8–4.7 | 3.3 | 1.9–5.9 |
| Live in urban area | 1.0 | referent | 1.0 | referent | 1.0 | referent |
| Live in rural area | 1.2 | 0.7–1.9 | 1.1 | 0.7–1.9 | 1.2 | 0.7–1.9 |
| Live in suburban area | 1.1 | 0.7–1.9 | 1.0 | 0.6–1.6 | 1.0 | 0.6–1.6 |
| * Adjusted for other factors in table. OR=odds ratio. CI=confidence interval. | ||||||
Discussion
Only one quarter of family physicians in this national survey felt prepared to respond to a bioterrorist event. The majority of respondents did not feel confident in diagnosing or managing a bioterrorism-related illness, and fewer than 60% reported knowing how to report a bioterrorist event or obtain information about such an event. In addition, only one quarter of physicians were confident that local or national health care systems could respond effectively to a bioterrorist attack.
Those physicians who had received bioterrorism preparedness training were more likely to report having the skills and knowledge to respond to a bioterrorist attack. Knowing how to get information in the event of a suspected attack was the greatest predictor of being able to diagnose and report cases. Although we did not assess the nature of the training or test physicians’ actual preparedness, these data suggest that training may improve physicians’ abilities to diagnose and treat victims of bioterrorism. Finally, there are no published validated measures of bioterrorism preparedness, and there are few data to demonstrate the effectiveness of particular training interventions.21
Physicians felt more comfortable responding to other types of public health emergencies, such as natural disasters or infectious disease outbreaks. This may be due in part to their personal experiences in dealing with these events, or may reflect the formalized training in public health response that is part of medical school curricula. The reporting and response skills physicians would use in dealing with the public health system during a bioterrorist event are similar to the ones they use during natural disasters and infectious disease outbreaks. However, further emphasis should be placed on the importance of information-gathering and pre-incident intelligence for physicians.4
Because the survey instrument did not define bioterrorism, we relied on the respondents’ personal definitions of bioterrorism. While the timing of the survey coincided with national media attention on the recent anthrax cases, we did not detect a high level of knowledge or confidence in dealing with bioterrorism. In fact, despite the timing, we believe the results are valid and may reflect all physicians’ heightened awareness of the threat of bioterrorism and especially their limitations in dealing with it. Physicians clearly acknowledge the need for more training in bioterrorism response.
Primary care physicians have an important role in the public health response to bioterrorism. The results of this study indicate physicians should be trained in how to identify and manage illnesses caused by biologic weapons, how to obtain information about bioterrorism quickly, and how to activate the public health system in the event of a suspected attack. As the public health infrastructure is improved through increased funding, it should integrate training for front-line primary care physicians in detection, surveillance, and response activities.22 The AAFP has already begun to promote web-based training resources for practicing physicians (www.aafp.org/btresponse). Further study is warranted to test educational interventions designed to improve physicians’ preparedness for bioterrorism and their interactions with the public health sector.
Acknowledgments
The views expressed are those of the authors. No official endorsement by the Agency for Healthcare Research and Quality or the American Academy of Family Physicians is intended or should be inferred. This study was funded by AHRQ grant P20 HS11182-S. The authors thank Tom Stewart for his assistance with data collection, Phyllis Naragon and Jon Temte for conducting the focus groups, and Clark Hanmer for his assistance with data analysis and manuscript revisions.
1. CDC Update: Investigation of bioterrorism-related anthrax and interim guidelines for clinical evaluation of persons with possible anthrax. Morb Mortal Wkly Rep MMWR 2001;50(43):941-8.
2. Borio L, Frank D, Mani V, et al. Death due to bioterrorism-related inhalational anthrax. JAMA 2001;286(20):2554-9.
3. Mayer TA, Bersoff-Matcha S, Murphy C, et al. Clinical presentation of inhalational anthrax following bioterrorism exposure. JAMA 2001;286(20):2549-53.
4. Committee on R&D needs for improving civilian medical response to chemical and biological terrorism incidents hpp Institute of Medicine, and Board on Environmental Studies and Toxicology, Commission on Life Sciences, National Research Council. Chemical and biological terrorism: research and development to improve civilian medical response.Washington DC: National Academy Press; 1999.
5. Khan AS, Morse S, Lillibridge S. Public-health preparedness for biological terrorism in the USA. Lancet 2000;356(9236):1179-82.
6. Franz DR, Jahrling PB, Friedlander AM, McClain DJ, Hoover DL, Bryne WR, et al. Clinical recognition and management of patients exposed to biological warfare agents. JAMA 1997;278(5):399-411.
7. CDC Biological and chemical terrorism: Strategic plan for preparedness and response. MMWR Morb Mortal Wkly Rep 2000;49(RR04):1-14.
8. Green LA, Fryer GE, , Jr. , Yawn BP, Lanier D, Dovey SM. The ecology of medical care revisited [see comments]. N Engl J Med 2001;344(26):2021-5.
9. Lane HC, Fauci AS. Bioterrorism on the home front. A new challenge for American medicine. JAMA 2001;286(20):2595-7.
10. Gourlay M, Siwek J. Resources in the war against bioterrorism. Am Fam Physician 2001;64(10):1676-8.
11. Gordon SM. The threat of bioterrorism: a reason to learn more about anthrax and smallpox. Cleve Clin J Med 1999;66(10):592-5.
12. Haines JD, Pitts K, Crutcher JM. Medical response to bioterrorism: are we prepared? J Okla State Med Assoc 2000;93(5):187-96.
13. Inglesby T, Grossman R, O’Toole T. A plague on your city: observations from topoff. Clin Infect Dis 2001;32(3):436-45.
14. Khan AS, Ashford DA. Ready or not—preparedness for bioterrorism. N Engl J Med 2001;345(4):287-9.
15. Garrett LC, Magruder C, Molgard CA. Taking the terror out of bioterrorism: planning for a bioterrorist event from a local perspective. I Public Health Manag Pract 2000;6(4):1-7.
16. Rosen P. Coping with bioterrorism is difficult, but may help us respond to new epidemics [see comments]. BMJ 2000;320(7227):71-2.
17. Wetter DC, Daniell WE, Treser CD. Hospital preparedness for victims of chemical or biological terrorism. Am J Public Health 2001;91(5):710-6.
18. Geiger HJ. Terrorism, biological weapons, and bonanzas: assessing the real threat to public health. [letter; comment]. Am J Public Health. 2001;91(5):708-9.
19. Henretig F. Biological and chemical terrorism defense: a view from the “front lines” of public health. [letter; comment]. Am J Public Health 2001;91(5):718-20.
20. Sidel VW, Cohen HW, Gould RM. Good intentions and the road to bioterrorism preparedness. Am J Public Health 2001;91(5):716-8.
21. Training of Clinicians for Public Health Events Relevant to Bioterrorism Preparedness. Rockville, MD: Agency for Healthcare Research and Quality; 2001. AHRQ Publication No. 02-E007.
22. Isaacs B. A boost for public health agencies. Philadelphia Inquirer 2001 November 26, 2001;Sect. A9.
Recruiting for a randomized controlled trial from an ethnically diverse population: Lessons from the Maternal Infection and Preterm Labor Study
OBJECTIVES: To compare recruitment rates for Caucasians and minorities in a randomized, controlled trial based in a family practice residency clinic.
STUDY DESIGN: A retrospective chart review of all patients eligible for the Maternal Infection and Preterm Labor (MIPTL) study.
POPULATION: All prenatal patients at 1 clinic site presenting for care at earlier than 34 weeks’ gestation.
OUTCOMES MEASURED: Patients choosing to enroll in the MIPTL study (n = 70) were compared with those who did not (n = 210) on a variety of demographic variables, including self-reported ethnicity, ability to speak English, and socioeconomic factors.
RESULTS: African American patients were recruited at the same rate as Caucasians (28% of each eligible population). Immigrants and patients requiring a translator were less likely to enroll (P = .014 and .008, respectively).
CONCLUSIONS: Clinic-based research studies in a family practice residency program can successfully recruit African American patients. Immigration status and the ability to speak English were important factors that affected participation. More research is needed to understand the role of clinic-based research in the recruitment of minorities for clinical trials.
The national research agenda encourages recruitment of minority populations, yet they are underrepresented in most clinical trials.1,2 Minority populations need to be included in research for several reasons. Minority populations may have a disproportionate disease burden, such as certain cancer rates among black persons.3 Minority populations may have different responses to medications, such as with antihypertensive medications in the African American population. Lastly, clinical trials can offer state-of-the-art care, which should be freely available to minorities. The National Institutes of Health Revitalization Act of 1993 requires all investigators receiving National Institutes of Health funding to include minority subjects.4
Most literature on minority recruitment focuses on African American subjects’ participation in clinical research.1,5-9 Information about other ethnic groups’ participation in clinical trials,9-11 particularly those involving non-English-speaking participants,12 is more limited. No data have been systematically compiled to evaluate the effectiveness of minority recruitment in a clinic-based research study.
This study used the data set from a primary care, clinic-based, randomized controlled trial, the Maternal Infection and Preterm Labor Study (MIPTLS).13 We examined rates of recruitment for different ethnicities, for immigrants, and for non-English-speaking patients in a trial that had no specific plan for minority recruitment.
Methods
We conducted a retrospective chart review of all pregnant women presenting for prenatal care at Smiley’s Clinic from September 1996 through December 1997 during the time of the MIPTLS. This study was a multisite investigation of the effect of vaginal pH testing on early detection and treatment of bacterial vaginosis in pregnant women and subsequent maternal and infant outcomes.13 Smiley’s Clinic is a community-based family practice residency clinic in Minneapolis, which serves a diverse, low-to middle-income population. Sixty percent of prenatal patients seek care in the main clinic and see the same provider throughout their pregnancy. Smiley’s Clinic also operates a medically indigent prenatal clinic called “Birthpartners” that is staffed by a full-time registered nurse and rotating faculty and residents. Forty percent of prenatal patients seek care at Birthpartners; they do not see the same provider throughout their pregnancy.
All women presenting for prenatal care at less than 34 weeks’ gestation were eligible for the MIPTL study. All women presenting for care were asked to participate in the study by the certified medical assistant, registered nurse, and/or their physician. The patient’s own physician, registered nurse, or certified medical assistant obtained informed consent for all patients to be studied, and a physician collected the data from the patient at each subsequent prenatal visit. For this chart review, we divided this population of women into those who enrolled in the trial and those who did not enroll.
Data abstracted from the medical record included age, ethnicity, parity, history of previous pregnancy complications, and history of sexually transmitted disease. Ethnicity data were based on self-report and abstracted from 1 of 2 standard locations in the chart-a patient demographics form and prenatal database. “African” patients denoted either their native country or Africa on their database; “African American” patients’ self-reported their ethnicity as well. For the purpose of this study, Native American and biracial women were categorized as “Other.” Women who did not have ethnicity data in either location were not assigned an ethnicity.
We analyzed the data using SPSS software (SPSS Inc, Chicago, IL); t tests were used for continuous data and chi-square tests for categorical data, with a 2-sided P < .05 as significant. The Institutional Review Board of the University of Minnesota approved this study.
Results
During the study period, 310 women presented for prenatal care to Smiley’s Clinic before 34 weeks’ gestation and were thus eligible for the MIPTL trial and our chart review. Seventy-one subjects chose to enroll in the trial, leaving 239 who refused. We could not locate 1 chart; the data set thus included 70 patients enrolled in the MIPTL study and 239 patients not enrolled (309 total charts reviewed). Complete data were available for most subjects; 297 charts had complete ethnicity data, 273 charts had complete data on education level, and 291 charts reported need for a translator (96%, 88%, and 94% complete, respectively). In all other areas, data collection was complete.
Participants and nonparticipants were similar with regard to most characteristics Table 1. Most subjects who agreed to participate in the trial were Caucasian; one-quarter were African American Table 2.
Although more Caucasian than African American participants enrolled by number, the percentage of those enrolling of the total eligible was the same, 28%. The ethnicities of patients enrolling was different from those declining to enroll (P = .042) Table 2. Specifically, the enrollment rate for African participants was half that for African American patients. Of 23 eligible patients, no Hispanic or Asian patients were enrolled in the trial. Only 12% of the enrollees were immigrants, compared to the 88% who declined to be studied (P = .014). Only 1 subject who required an interpreter was enrolled (P = .008).
Discussion
Our study was successful in recruiting African American patients. Unlike other studies, African American individuals were as likely to enroll as their Caucasian counterparts. Our success in minority recruitment is even more significant in that there was no specific strategy used to recruit minority women.
Perceptions about research participation and barriers to enrolling in clinical trials have been studied in African American populations.5,6,8,10,11,14,15 Lack of trust in and fear of medical research is still prevalent in the African American community.6,8,11,14,15 In the past, medical experimentation had been perpetrated on African American individuals without their consent, as illustrated by the Tuskegee Experiment and by medical procedures carried out on slaves without their consent.16 These acts have justifiably made some patients distrustful of the medical establishment and research.1,14 Lack of transportation, lack of childcare, and lack of time for study activities have also been cited as barriers to patient participation in other studies.6,11,15
We believe that having the patient’s own physician or nurse performing enrollment, including obtaining informed consent, improved recruitment. Our patients did not have to see any outside providers or study personnel in order to be enrolled. Recruitment was high, even though 96% of the physicians involved were not members of a minority group.
We believe that having enrollment performed and all data collected quickly at routine patient visits may have assisted recruitment. In addition, we have on-site childcare for patients and their families, and such service may have removed barriers to participation.
We found that patients who were immigrants, especially those requiring translators, were much less likely to enroll in this trial. Cultural factors were likely to play a role.17 Most of our African patients were from East Africa (Somalia and Ethiopia), and nearly all had undergone ritual circumcision. Our experience with this patient population has shown that they prefer to limit vaginal examinations.
Little research exists about the recruitment of individuals with ethnicities other than African American for research trials. Swanson and Ward15 reviewed the research on recruiting minorities for clinical trials and concluded with 20 steps needed to recruit more minorities into research trials. Only 1 trial of minority perceptions (other than African American) about research could be located. Roberson11 conducted phone surveys of inner city African American, Native American, and Hispanic individuals to see which factors about enrolling in cancer clinical trials were important to them. She found that the study subjects “knew little about cancer clinical trials and basically had no opportunity to participate.” All 3 minority groups expressed concerns about being treated like “guinea pigs” and a “mistrust of white people.” Hispanic subjects specifically expressed concerns about communication in their own language.
Several studies have described successful recruitment of minority populations (other than African American) for clinical trials. Two studies have shown successful recruitment of Hispanic and African American women for clinical trials on primary prevention using mass mailings and media announcements.10,18 Small and coworkers12 trained and then used bicultural interviewers to successfully recruit 3 non-English-speaking immigrant populations for a study of maternal satisfaction with hospital birthing in Australia. These studies, however, did not take place in a primary care clinic setting. Our study provides new information about the recruitment of minorities for a clinical trial in such a setting.
The strength of this study was in its completeness of data. The data were collected systematically from forms currently used routinely in the medical record, thereby reducing bias. This study was limited by the lack of direct information regarding reasons for refusal among women declining enrollment.
Proven methods of increasing minority participation in research of all kinds are crucially needed. Our study suggests that clinic-based research, with enrollment by a patient’s primary care physician or nurse, can have a significant positive effect on recruitment. In addition, a different approach to immigrants, especially those not conversant in English, will be needed for successful recruitment in future studies. Further research should be both quantitative and qualitative to better understand the recruitment process in underserved and ethnically diverse patient populations.
Acknowledgments
Special thanks to Deborah Finstad, MS, for her statistical support. No financial support was received for this study.
1. el-Sadr W, Capps L. The challenge of minority recruitment in clinical trials for AIDS. JAMA 1992;267:954-7.
2. Svensson CK. Representation of American blacks in clinical trials of new drugs. JAMA 1989;261:263-5.
3. Greenlee RT, Hill-Harmon MB, Murray T, Thun M. Cancer statistics, 2001. CA Cancer J Clin 2001;51:15-36.
4. Freedman LS, Simon R, Foulkes MA, et al. Inclusion of women and minorities in clinical trials and the NIH Revitalization Act of 1993-the perspective of NIH clinical trialists. Control Clin Trials 1995;16:277-309.
5. Moody LE, Gregory SJ, Bocanegra T, Vasey F. Factors influencing post-menopausal African-American women’s participation in a clinical trial. J Am Acad Nurse Pract 1995;7:483-8.
6. Harris Y, Gorelick PB, Samuels P, Bempong I. Why African Americans may not be participating in clinical trials. J Natl Med Assoc 1996;88:630-4.
7. Gorelick PB, Richardson D, Hudson E, et al. Establishing a community network for recruitment of African Americans into a clinical trial. The African-American Antiplatelet Stroke Prevention Study (AAASPS) experience. J Natl Med Assoc 1996;88:701-4.
8. Corbie-Smith G, Thomas SB, Williams MV, Moody-Ayers S. Attitudes and beliefs of African Americans toward participation in medical research. J Gen Intern Med 1999;14:537-46.
9. Lee RE, McGinnis KA, Sallis JF, Castro CM, Chen AH, Hickmann SA. Active vs. passive methods of recruiting ethnic minority women to a health promotion program. Ann Behav Med 1998;19:378-84.
10. Lewis CE, George V, Fouad M, Porter V, Bowen D, Urban N. Recruitment strategies in the Women’s Health Trial: feasibility study in minority populations. WHT:FSMP Investigators Group. Women’s Health Trial:Feasibility Study in Minority Populations. Control Clin Trials 1998;19:461-76.
11. Roberson NL. Clinical trial participation. Viewpoints from racial/ethnic groups. Cancer 1994;74(suppl):2687-91.
12. Small R, Yelland J, Lumley J, Rice PL. Cross-cultural research: trying to do it better. 1. Issues in study design. Aust N Z J Public Health 1999;23:385-9.
13. Gjerdingen D, Fontaine P, Bixby M, Santilli J, Welsh J. The impact of regular vaginal pH screening on the diagnosis of bacterial vaginosis in pregnancy. J Fam Pract 2000;49:39-43.
14. Thomas SB, Quinn SC. The Tuskegee Syphilis Study, 1932 to 1972: implications for HIV education and AIDS risk education programs in the black community. Am J Public Health 1991;81:1498-505.
15. Swanson GM, Ward AJ. Recruiting minorities into clinical trials: toward a participant-friendly system. J Natl Cancer Inst 1995;87:1747-59.
16. Savitt TL. The use of blacks for medical experimentation and demonstration in the old South. J South Hist 1982;48:331-48.
17. Fadiman A. The Spirit Catches You and You Fall Down. New York: Farrar, Straus, and Giraux; 1997.
18. Lee RE, McGinnis KA, Sallis JF, Castro CM, Chen AH, Hickmann SA. Active vs passive methods of recruiting ethnic minority women to a health promotion program. Ann Behav Med 1997;19:378-384.
Address reprint requests to Jennifer L. Welsh, MD, Department of Family Practice and Community Health, University of Minnesota Medical School, A692 Mayo Memorial Building, 420 Delaware Street S.E., MMC #381, Minneapolis, MN 55455. E-mail: [email protected].
To submit a letter to the editor on this topic, click here: [email protected]
OBJECTIVES: To compare recruitment rates for Caucasians and minorities in a randomized, controlled trial based in a family practice residency clinic.
STUDY DESIGN: A retrospective chart review of all patients eligible for the Maternal Infection and Preterm Labor (MIPTL) study.
POPULATION: All prenatal patients at 1 clinic site presenting for care at earlier than 34 weeks’ gestation.
OUTCOMES MEASURED: Patients choosing to enroll in the MIPTL study (n = 70) were compared with those who did not (n = 210) on a variety of demographic variables, including self-reported ethnicity, ability to speak English, and socioeconomic factors.
RESULTS: African American patients were recruited at the same rate as Caucasians (28% of each eligible population). Immigrants and patients requiring a translator were less likely to enroll (P = .014 and .008, respectively).
CONCLUSIONS: Clinic-based research studies in a family practice residency program can successfully recruit African American patients. Immigration status and the ability to speak English were important factors that affected participation. More research is needed to understand the role of clinic-based research in the recruitment of minorities for clinical trials.
The national research agenda encourages recruitment of minority populations, yet they are underrepresented in most clinical trials.1,2 Minority populations need to be included in research for several reasons. Minority populations may have a disproportionate disease burden, such as certain cancer rates among black persons.3 Minority populations may have different responses to medications, such as with antihypertensive medications in the African American population. Lastly, clinical trials can offer state-of-the-art care, which should be freely available to minorities. The National Institutes of Health Revitalization Act of 1993 requires all investigators receiving National Institutes of Health funding to include minority subjects.4
Most literature on minority recruitment focuses on African American subjects’ participation in clinical research.1,5-9 Information about other ethnic groups’ participation in clinical trials,9-11 particularly those involving non-English-speaking participants,12 is more limited. No data have been systematically compiled to evaluate the effectiveness of minority recruitment in a clinic-based research study.
This study used the data set from a primary care, clinic-based, randomized controlled trial, the Maternal Infection and Preterm Labor Study (MIPTLS).13 We examined rates of recruitment for different ethnicities, for immigrants, and for non-English-speaking patients in a trial that had no specific plan for minority recruitment.
Methods
We conducted a retrospective chart review of all pregnant women presenting for prenatal care at Smiley’s Clinic from September 1996 through December 1997 during the time of the MIPTLS. This study was a multisite investigation of the effect of vaginal pH testing on early detection and treatment of bacterial vaginosis in pregnant women and subsequent maternal and infant outcomes.13 Smiley’s Clinic is a community-based family practice residency clinic in Minneapolis, which serves a diverse, low-to middle-income population. Sixty percent of prenatal patients seek care in the main clinic and see the same provider throughout their pregnancy. Smiley’s Clinic also operates a medically indigent prenatal clinic called “Birthpartners” that is staffed by a full-time registered nurse and rotating faculty and residents. Forty percent of prenatal patients seek care at Birthpartners; they do not see the same provider throughout their pregnancy.
All women presenting for prenatal care at less than 34 weeks’ gestation were eligible for the MIPTL study. All women presenting for care were asked to participate in the study by the certified medical assistant, registered nurse, and/or their physician. The patient’s own physician, registered nurse, or certified medical assistant obtained informed consent for all patients to be studied, and a physician collected the data from the patient at each subsequent prenatal visit. For this chart review, we divided this population of women into those who enrolled in the trial and those who did not enroll.
Data abstracted from the medical record included age, ethnicity, parity, history of previous pregnancy complications, and history of sexually transmitted disease. Ethnicity data were based on self-report and abstracted from 1 of 2 standard locations in the chart-a patient demographics form and prenatal database. “African” patients denoted either their native country or Africa on their database; “African American” patients’ self-reported their ethnicity as well. For the purpose of this study, Native American and biracial women were categorized as “Other.” Women who did not have ethnicity data in either location were not assigned an ethnicity.
We analyzed the data using SPSS software (SPSS Inc, Chicago, IL); t tests were used for continuous data and chi-square tests for categorical data, with a 2-sided P < .05 as significant. The Institutional Review Board of the University of Minnesota approved this study.
Results
During the study period, 310 women presented for prenatal care to Smiley’s Clinic before 34 weeks’ gestation and were thus eligible for the MIPTL trial and our chart review. Seventy-one subjects chose to enroll in the trial, leaving 239 who refused. We could not locate 1 chart; the data set thus included 70 patients enrolled in the MIPTL study and 239 patients not enrolled (309 total charts reviewed). Complete data were available for most subjects; 297 charts had complete ethnicity data, 273 charts had complete data on education level, and 291 charts reported need for a translator (96%, 88%, and 94% complete, respectively). In all other areas, data collection was complete.
Participants and nonparticipants were similar with regard to most characteristics Table 1. Most subjects who agreed to participate in the trial were Caucasian; one-quarter were African American Table 2.
Although more Caucasian than African American participants enrolled by number, the percentage of those enrolling of the total eligible was the same, 28%. The ethnicities of patients enrolling was different from those declining to enroll (P = .042) Table 2. Specifically, the enrollment rate for African participants was half that for African American patients. Of 23 eligible patients, no Hispanic or Asian patients were enrolled in the trial. Only 12% of the enrollees were immigrants, compared to the 88% who declined to be studied (P = .014). Only 1 subject who required an interpreter was enrolled (P = .008).
Discussion
Our study was successful in recruiting African American patients. Unlike other studies, African American individuals were as likely to enroll as their Caucasian counterparts. Our success in minority recruitment is even more significant in that there was no specific strategy used to recruit minority women.
Perceptions about research participation and barriers to enrolling in clinical trials have been studied in African American populations.5,6,8,10,11,14,15 Lack of trust in and fear of medical research is still prevalent in the African American community.6,8,11,14,15 In the past, medical experimentation had been perpetrated on African American individuals without their consent, as illustrated by the Tuskegee Experiment and by medical procedures carried out on slaves without their consent.16 These acts have justifiably made some patients distrustful of the medical establishment and research.1,14 Lack of transportation, lack of childcare, and lack of time for study activities have also been cited as barriers to patient participation in other studies.6,11,15
We believe that having the patient’s own physician or nurse performing enrollment, including obtaining informed consent, improved recruitment. Our patients did not have to see any outside providers or study personnel in order to be enrolled. Recruitment was high, even though 96% of the physicians involved were not members of a minority group.
We believe that having enrollment performed and all data collected quickly at routine patient visits may have assisted recruitment. In addition, we have on-site childcare for patients and their families, and such service may have removed barriers to participation.
We found that patients who were immigrants, especially those requiring translators, were much less likely to enroll in this trial. Cultural factors were likely to play a role.17 Most of our African patients were from East Africa (Somalia and Ethiopia), and nearly all had undergone ritual circumcision. Our experience with this patient population has shown that they prefer to limit vaginal examinations.
Little research exists about the recruitment of individuals with ethnicities other than African American for research trials. Swanson and Ward15 reviewed the research on recruiting minorities for clinical trials and concluded with 20 steps needed to recruit more minorities into research trials. Only 1 trial of minority perceptions (other than African American) about research could be located. Roberson11 conducted phone surveys of inner city African American, Native American, and Hispanic individuals to see which factors about enrolling in cancer clinical trials were important to them. She found that the study subjects “knew little about cancer clinical trials and basically had no opportunity to participate.” All 3 minority groups expressed concerns about being treated like “guinea pigs” and a “mistrust of white people.” Hispanic subjects specifically expressed concerns about communication in their own language.
Several studies have described successful recruitment of minority populations (other than African American) for clinical trials. Two studies have shown successful recruitment of Hispanic and African American women for clinical trials on primary prevention using mass mailings and media announcements.10,18 Small and coworkers12 trained and then used bicultural interviewers to successfully recruit 3 non-English-speaking immigrant populations for a study of maternal satisfaction with hospital birthing in Australia. These studies, however, did not take place in a primary care clinic setting. Our study provides new information about the recruitment of minorities for a clinical trial in such a setting.
The strength of this study was in its completeness of data. The data were collected systematically from forms currently used routinely in the medical record, thereby reducing bias. This study was limited by the lack of direct information regarding reasons for refusal among women declining enrollment.
Proven methods of increasing minority participation in research of all kinds are crucially needed. Our study suggests that clinic-based research, with enrollment by a patient’s primary care physician or nurse, can have a significant positive effect on recruitment. In addition, a different approach to immigrants, especially those not conversant in English, will be needed for successful recruitment in future studies. Further research should be both quantitative and qualitative to better understand the recruitment process in underserved and ethnically diverse patient populations.
Acknowledgments
Special thanks to Deborah Finstad, MS, for her statistical support. No financial support was received for this study.
1. el-Sadr W, Capps L. The challenge of minority recruitment in clinical trials for AIDS. JAMA 1992;267:954-7.
2. Svensson CK. Representation of American blacks in clinical trials of new drugs. JAMA 1989;261:263-5.
3. Greenlee RT, Hill-Harmon MB, Murray T, Thun M. Cancer statistics, 2001. CA Cancer J Clin 2001;51:15-36.
4. Freedman LS, Simon R, Foulkes MA, et al. Inclusion of women and minorities in clinical trials and the NIH Revitalization Act of 1993-the perspective of NIH clinical trialists. Control Clin Trials 1995;16:277-309.
5. Moody LE, Gregory SJ, Bocanegra T, Vasey F. Factors influencing post-menopausal African-American women’s participation in a clinical trial. J Am Acad Nurse Pract 1995;7:483-8.
6. Harris Y, Gorelick PB, Samuels P, Bempong I. Why African Americans may not be participating in clinical trials. J Natl Med Assoc 1996;88:630-4.
7. Gorelick PB, Richardson D, Hudson E, et al. Establishing a community network for recruitment of African Americans into a clinical trial. The African-American Antiplatelet Stroke Prevention Study (AAASPS) experience. J Natl Med Assoc 1996;88:701-4.
8. Corbie-Smith G, Thomas SB, Williams MV, Moody-Ayers S. Attitudes and beliefs of African Americans toward participation in medical research. J Gen Intern Med 1999;14:537-46.
9. Lee RE, McGinnis KA, Sallis JF, Castro CM, Chen AH, Hickmann SA. Active vs. passive methods of recruiting ethnic minority women to a health promotion program. Ann Behav Med 1998;19:378-84.
10. Lewis CE, George V, Fouad M, Porter V, Bowen D, Urban N. Recruitment strategies in the Women’s Health Trial: feasibility study in minority populations. WHT:FSMP Investigators Group. Women’s Health Trial:Feasibility Study in Minority Populations. Control Clin Trials 1998;19:461-76.
11. Roberson NL. Clinical trial participation. Viewpoints from racial/ethnic groups. Cancer 1994;74(suppl):2687-91.
12. Small R, Yelland J, Lumley J, Rice PL. Cross-cultural research: trying to do it better. 1. Issues in study design. Aust N Z J Public Health 1999;23:385-9.
13. Gjerdingen D, Fontaine P, Bixby M, Santilli J, Welsh J. The impact of regular vaginal pH screening on the diagnosis of bacterial vaginosis in pregnancy. J Fam Pract 2000;49:39-43.
14. Thomas SB, Quinn SC. The Tuskegee Syphilis Study, 1932 to 1972: implications for HIV education and AIDS risk education programs in the black community. Am J Public Health 1991;81:1498-505.
15. Swanson GM, Ward AJ. Recruiting minorities into clinical trials: toward a participant-friendly system. J Natl Cancer Inst 1995;87:1747-59.
16. Savitt TL. The use of blacks for medical experimentation and demonstration in the old South. J South Hist 1982;48:331-48.
17. Fadiman A. The Spirit Catches You and You Fall Down. New York: Farrar, Straus, and Giraux; 1997.
18. Lee RE, McGinnis KA, Sallis JF, Castro CM, Chen AH, Hickmann SA. Active vs passive methods of recruiting ethnic minority women to a health promotion program. Ann Behav Med 1997;19:378-384.
Address reprint requests to Jennifer L. Welsh, MD, Department of Family Practice and Community Health, University of Minnesota Medical School, A692 Mayo Memorial Building, 420 Delaware Street S.E., MMC #381, Minneapolis, MN 55455. E-mail: [email protected].
To submit a letter to the editor on this topic, click here: [email protected]
What influences family physicians’ cancer screening decisions when practice guidelines are unclear or conflicting?
OBJECTIVES: To determine: a) the respondents’ perceptions of 4 unclear or conflicting cancer screening guidelines: prostate specific antigen (PSA) for men over age 50, mammography for women ages 40-49, colorectal screening by fecal occult blood testing (FOBT), and colonoscopy for patients over age 40; and b) the influence of various patient and physician factors on the decision to order these tests.
STUDY DESIGN: National Canadian mail survey of randomly selected family physicians.
POPULATION: Family physicians in active practice (n=565) selected from rural and urban family medicine sites in 5 provinces representing the main regions in Canada: British Columbia, Alberta, Ontario, Quebec, Nova Scotia.
OUTCOMES MEASURED: Agreement with guideline statements, and decision to order screening test in 6 clinical vignettes.
RESULTS: Of 565 surveys mailed, 351 (62.1%) were returned. Most respondents agreed with the Canadian Task Force recommendations, and the majority believed that various guidelines for 3 of the 4 screens were conflicting (PSA 86.6%; mammography 67.5%; FOBT 62.4%). Patient anxiety about cancer, patient expectations of being tested, and a positive family history of cancer significantly increased the odds that the 4 tests would be ordered. A good quality patient-MD relationship significantly decreased the odds of ordering a mammogram. Screening decisions were also significantly influenced by the respondents’ beliefs about whether screening was recommended and whether screening could cause more harm than good. A physician’s sensitivity to his or her colleagues’ practice influenced screening decisions regarding PSA and mammography.
CONCLUSIONS: These results suggest a conceptual framework for understanding the determinants of screening behavior when guidelines are unclear or conflicting.
Four factors are significant determinants, independently, of a physician’s decision to order a screening test when recommendations are unclear or conflicting: a patient’s anxiety about having cancer; a patient’s expectation to undergo screening; a family history of cancer; and (in most cases) the quality of the patient-physician relationship. Particularly in the context of breast cancer screening, when a patient and physician have a good relationship, they are more likely than when the relationship is poor to discuss the pros and cons of a conflicting screening guideline and reach a mutually agreeable decision.
In instances of conflicting recommendations, the importance physicians attribute to the practice of colleagues influences their screening decisions.
Although most studies of the determinants of physicians’ cancer screening behavior have dealt with facilitators or barriers to the adoption of guidelines with clear recommendations, virtually no studies have examined factors affecting physician practice when guidelines are unclear or conflicting. When guidelines are unclear, many physicians are left with little direction. By performing cancer screening procedures that are not clearly effective,1 physicians are diverting limited resources to areas where there is uncertain or no benefit to patients.
We studied physician decision-making in cancer screening when guidelines are “unclear” or conflicting. We defined an unclear guideline as a C recommendation (insufficient evidence to recommend the maneuver or not) from the Canadian Task Force on the Periodic Health Examination.2,3 We defined a “conflicting” guideline as one for which there were different recommendations from at least 2 different organizations for the same cancer screening maneuver.
The authors conducted a qualitative study of 10 focus groups across Canada, and identified factors that influence family physicians’ cancer-screening decisions when guidelines are unclear or conflicting.4 The findings supported a conceptual model with 8 factors: 1) patient factors (patient anxiety, expectations, and family history); 2) physician factors (perception of guidelines, clinical practice experience, influence of family physician and specialist colleagues, and time/financial costs; 3) the patient-physician relationship (quality of rapport). Four of these 8 factors were considered the most influential: patient anxiety about having cancer, patient expectations to have a screening test, family history of cancer, and the quality of the patient-physician relationship.
Although we know of many factors that determine cancer-screening decisions, it is not known how much each of these factors contributes to physicians’ decisions to perform tests in specific situations. The aim of this study was to verify these determining factors and to quantify the strength of the influence of each one on cancer screening decisions.
Methods
We conducted a national survey of family physicians in Canada because they are the main preventive care providers in Canada and because a physician’s recommendation is the strongest predictor of an individual’s decision to have a screening test.5
The self-administered questionnaire was mailed to a random sample of 600 family physicians, 120 from each of 5 provincial licensing bodies from 5 regions in Canada: British Columbia, Alberta, Ontario, Quebec, and Nova Scotia. We stratified by postal codes to ensure equal representation of urban and rural physicians (oversampled) to permit subgroup analysis. Ethical approval was obtained from all participating institutions. We followed a modified 4-step Dillman6 method, using initial full mailing, follow up reminder postcards, second full mailing, and phone call reminders.
The questionnaire was composed of 2 parts. Part 1 contained 40 single-item questions on physicians’ perceptions of guideline recommendations for cancers of interest, and the perceived influence of various factors on their decision to order screening tests (all factors identified in the literature and in our previous study). The questionnaire also contained items on practice characteristics, demographics, and respondents’ personal experience with cancer or cancer screening tests.
Part 2 contained 6 clinical case vignettes; 2 for prostate specific antigen (PSA), 2 for mammography, and 2 for fecal occult blood testing (FOBT) and colonoscopy, for which recommendations can be unclear according to Canadian guidelines, or conflicting.2 As for screening for prostate cancer with PSA for men over age 50, there is fair evidence for when not to screen, but conflicting recommendations from at least 2 major organizations. Mammography for breast cancer screening in women age 40 to 49 has conflicting recommendations (different recommendations from at least 2 different organizations). FOBT and colonoscopy for colorectal cancer detection over age 40 are unclear C recommendations (insufficient evidence to either recommend or not).
The Clinical Case Vignettes
Clinical case vignettes have been shown to be a useful, inexpensive, and effective method for eliciting physicians’ decision-making behavior in a simulated situation.7 Case vignettes have been used to examine physicians’ practice behavior with cancer patients.8-11For research purposes, the usefulness of the clinical case vignette rests on the ability to vary specific factors (relevant independent variables under study) from one vignette to another, while keeping constant the surrounding factors of the case presented (the frame).
For each clinical case vignette, the dependent variable was the physician’s decision to order the screening test presented or not. The independent variables were the 4 most influential factors identified in the prior qualitative study,4 embedded within the description of each clinical case vignette. Each independent variable had 2 levels: presence or absence of patient anxiety, patient expectations for testing, and family history of cancer, and easy or difficult relationship. This enabled 16 different versions of each clinical case vignette frame, and 2 frames were developed for each cancer screening. The clinical case vignettes were developed and tested in 4 steps. First, 6 investigators (R.G., F.T., C.H., A.K., M.O., J.B.B.) generated case vignettes from their own clinical experience that reflected specified levels of the factors. Second, 12 family physician colleagues empirically validated the descriptions in the case vignettes. A minimum of 9 of these physicians had to correctly identify the intended level of each of the factors in question. Third, factors not attracting 75% agreement were corrected or replaced. Fourth, the modified clinical case vignettes were submitted to another group of 12 family physicians for their perceptions of the intended levels of the relevant factors. The final versions of the vignettes reflected concordance between the perceived and the intended levels in the factors for each case vignette. Figure 1.
Our design was “fractional” in the sense that we sampled from only a fraction of all possible combinations of independent variables. We had estimated that each family physician could respond to no more than 6 case vignettes (2 per cancer screening). The reduced set represented the vignettes that were clinically realistic. As a result, each physician received set of 6 vignettes offering a clinically meaningful spread of possible levels of the independent variables to maximize the opportunity to detect practice behavior variation. The clinical case vignettes were presented in random order to avoid sequence bias. This design ensured that each physician had 1 vignette with all independent factors absent, 1 with all factors present, and the remaining 4 with a diversity of the possible combinations of levels of patient factors.
Analyses
The analysis of the binary response for each test (order versus not order screening test) included the factors listed in the theoretical framework, with an additional random effect to take into account possible correlations among responses to 2 vignettes from the same physician. The estimation of each model’s parameters was performed using the Generalized Estimating Equation approach of SAS; this variant of logistic regression accounts for the non-independence of observations. We examined first the effect of each of the 4 principal factors-individually and together-on the decision to order a screening test. Then we looked for additional significant effects of physician demographics and perceptions of guidelines. We looked for interactions between the quality of the relationship with other factors. For each screening test, we developed a final parsimonious model which included all factors that were statistically significant at P = 0.05.
Results
Of the original 600 physicians, there were 351 respondents, 214 non-respondents, and 35 ineligibles (16 were not in full-time practice, defined as < 15 hours a week; 8 were not practicing; 6 were in another specialty; 4 had moved out of the jurisdiction; and 1 had died). The final response rate was 62.1% (351/565). The respondents’ demographic characteristics Table 1 reflected the Canadian family physician population, except that there were more certificants of the College of Family Physicians of Canada (akin to Board certification in the US) among the respondents.
By [the fractional factorial] design, the versions of the vignettes with all patient factors present or all absent were the most frequent versions of the vignettes, and the frequency of the remaining versions were uniformly distributed for each vignette. There was no evidence of a systematic under-representation of any versions as a result of non-response.
Perceptions of Guidelines
The respondents’ perceptions of the guideline recommendations for the 4 cancer screening tests are shown in Table 2. Although the respondents’ perceptions of guidelines agreed with the Canadian Task Force guidelines for PSA and mammography, they diverged for colorectal cancer screening. For example, 83.5% of respondents thought colonoscopy was not recommended for patients over 40. A majority of respondents believed that the guidelines for PSA, mammography, and FOBT were conflicting.
The Influence of the Four Principal Factors
Individually, the 4 principal factors were significant determinants of the physician’s decision to order the screening test when the evidence was unclear or conflicting Table 3. The patient’s anxiety about having cancer, their expectations of having a screening test, the quality of the patient-physician-relationship (in most cases), and a positive family history of the relevant cancer all increased the odds of screening. When all 4 factors were analyzed as a combined group adjusting for the presence of other factors Table 3, the principal factors that remained significant determinants of the physician’s decision to order the screening were as follows: anxiety for PSA and mammography; patient expectations for PSA, mammography, and FOBT; a high quality patient-physician relationship for mammography (reduced the likelihood of ordering); and positive family history for all but mammography.
The Combined Influence of the Principal Factors and Physician Factors Physician variables were added to the initial logistic regression models to derive a final parsimonious model for each screening test. Table 4 shows that for each of the screening maneuvers, there were differences not only in the factors that significantly influenced the decision to screen, but also in the magnitude of influence as manifested by the odds ratios. The direction of the influence was similar across examples: all the factors increased the odds of screening except perception that the test is not recommended or does more harm than good, and a good patient-doctor relationship (in the mammography example). PSA and mammography had a similar pattern: patient anxiety, expectations, family history, the physician’s perception of the level of recommendation of the test, whether it creates more harm than good, and the influence of colleagues all significantly influenced the decision to screen. For FOBT, patient expectations, the level of perceived recommendations and the perception of harm were significant. For colonoscopy, patient anxiety, family history, and the perception of the level of recommendation were significant determinants.
Discussion
The results of this study add to the findings from the focus groups and suggest a conceptual framework or model for understanding the determinants of screening behaviour in unclear and conflicting recommendation situations. Although this model offers a more complex picture of the determinants of cancer screening in these instances, there is a great deal of consistency. Patient anxiety, patient expectations, family history of cancer, physicians’ perceptions of the relevant guideline, and physicians’ perceptions of the benefit or harm in screening were all important determinants of screening decisions. One of the important differences in the 2 studies is the relative strength of the influence of family history in this survey study, in particular for mammography and colonoscopy.
Family physicians are trained to heed patient anxiety, but it has only been described as an indirect determinant of cancer screening.12 Patient expectations has been described in the literature in a number of studies as an important determinant of screening.1,13 In addition, other patient-specific factors have been shown to be associated with physician adoption of guidelines, such as patient concerns about finances, quality of life, and location of care.14 Recent research has found an increase in physicians’ wish for more patient involvement in the development of clinical guidelines, and they have suggested that practice guidelines should reflect patient preferences.15
In the final model, the quality of the patient-physician relationship was related to one cancer screening maneuver: mammography for women aged 40-49. It is interesting that a good relationship halved the odds of screening tests being ordered when accounting for other patient factors. The importance of the influence of the patient-physician relationship on screening has been described in previous studies.12,16 In a good patient-physician relationship, patient and physician are more likely to discuss the pros and cons of a conflicting screening guideline and to find common ground than when the relationship is poor.16
The patient-physician relationship did not appear to be an important determinant in the prostate and colorectal screening examples. For PSA screening it may be due to the unique character of the relationship male patients have with their physician. A recent study found that male patients experience many barriers to seeking help, and they find it difficult to discuss their health concerns and preventive care issues with their physicians.17 For colorectal screening by colonoscopy the relationship may not have been an important determinant because 2 other determinants appeared to be so important and may overshadow any others: the great majority of respondents believed that it was not recommended (83.5%); and family history played a very important role in influencing screening.
In the final statistical modeling, several additional physician factors appeared to influence screening decisions. In particular, both the perception of whether the screening test was recommended and the belief that the screening test could cause more harm than good contributed independently to the screening decision. The same factors were noted in our qualitative study, a finding supported by many examples in the literature.1,18,19 In addition, the importance that physicians attribute to the practice of colleagues appeared to influence screening decisions in the 2 conflicting examples (from a Canadian perspective)-PSA screening and mammography. This suggests an important role of colleagues in conflicting examples. Previous research has suggested that social influences play an important role-in particular, when uncertainty is high, or when the evidence is still evolving and recommendations based on the evidence are not in common practice.20
Our emerging model Figure 2 shows that there are more than just cognitive processes at work in this sort of decision-making. The findings suggest that aspects of the patient-physician relationship and the influence of colleagues affect decision-making as well. Further, our findings indicate that these determinants are important when the guidelines are unclear or conflicting.
Many of the factors identified in this study have been described previously.1,13,21, 34 There are also recent theories to help explain how and why physicians decide to screen their patients for cancer, including whether they agree with and adhere to recommended guidelines.24,35However, these theories were developed within the context of clinical decision making when the guidelines are clear. The unique contribution of our study and emerging model is that it concerns screening decisions with unclear or conflicting guidelines. The impact of uncertainty on this aspect of physician decision-making is important. Physicians need to make decisions in the face of uncertainty. They appear to do this by believing one side of the argument or another, by balancing the perceived good or harm from screening, and by looking for support from colleagues to bolster their decision. In addition, their patients play a key role in influencing these decisions, with the doctor and patient finding common ground, often resulting in a shared decision.
Limitations
We represented the clinical factors with dichotomous situations, when, in real encounters, there would be a much greater range in the level of intensity of factors such as patient anxiety, expression of expectation, and quality of the relationship. Also, even though the case vignettes provided some background, for the physician respondent it was a “one of” situation which does not reflect a typical primary care situation that includes continuing care of patients who have a variety of coexisting clinical issues. The magnitude of the influence of these factors may be considerably underestimated or overestimated with the use of clinical case vignettes.
The generalizability of the respondents may be a limitation, as they were younger (1.7 years, not significant) and more likely to be certificants than the non-respondents. The latter difference may have contributed to a trend that stressed the influence of patient anxiety and wishes, which reflects residency training issues in family medicine. Last, although the study was done in Canada, we believe the findings likely apply to US family physicians, as graduate training is quite similar in the two countries.
Conclusions
This study underlies the importance of the cognitive component in decision making-in particular, of perceptions of guidelines, and of the influence of patients and their needs and the patient-physician relationship.
Our results verify our model in general terms, but also build on and advance the conceptual model that evolved from our qualitative findings. It provides a useful framework for understanding clinical decision-making in the face of uncertainty or controversy, and may be applicable to other clinical domains.
In future research we plan to test the effect of race and cultural aspects of the patient and of the physician on physicians’ screening decisions. Ultimately, the model could be used to design interventions to assist with the implementation of preventive services guidelines, and to be included in future CME programs for practicing physicians.
Acknowledgements
Funding/support: This study was funded by the Medical Research Council of Canada and the Prince Edward Island Cancer Research Council.
1. Zyzanski SJ, Stange KC, Kelly R, Flocke S, Shank JC, Chao J, Jaen CR, Smith CK. Family physicians’ disagreements with the US Preventive Services Task Force recommendations. J Fam Pract 1994;39:140-147.
2. Canadian Task Force on the Periodic Health Examination. The Canadian Guide to Clinical Preventive Health Care. Health Canada, Ottawa, 1994.
3. U.S. Preventive Services Task Force. Guide to Clinical Preventive Services. Report of the U.S. Preventive Services Task Force. Williams & Wilkins, Baltimore, 1996.
4. Tudiver F, Brown BB, Medved W, Herbert C, Ritvo P, Guibert R, Haggerty J, Goel V, Smith P, O’Beirne M, Katz A, Moliner P, Ciampi A, Williams JI. Making decisions about cancer screening when the guidelines are unclear or conflicting. J Fam Pract 2001;50:682-687.
5. White E, Urban N, Taylor V. Mammography utilization, public health impact, and cost effectiveness in the United States. Ann Rev Pub Health 1993;14:605-633.
6. Dillman DA. Mail and Telephone Surveys: the Total Design Method. New York, John Wiley and Sons, 1978.
7. Peabody JW, Luck J, Glassman P, Dresselhaus TR, Lee M. Comparison of vignettes, standardized patients, and chart abstraction: a prospective validation study of 3 methods for measuring quality. J Am Med Assoc 2000;283:1715-1722.
8. Deber RB, Thompson GG. Who still prefers aggressive surgery for breast cancer? Implications for the clinical applications of clinical trials. Arch Int Med 1987;147:1543-7.
9. Sawka CA, O’Connor AM, Llewellyn Thomas HA, To T, Pinfold SP, Harrison Woermke D. Appropriateness of adjuvant systemic therapy for axillary node negative breast cancer: a physician opinion survey. J Clin Oncol 1995;13:1459-69.
10. Tannock IF, Belanger D. Use of a physician directed questionnaire to define a consensus about management of breast cancer: implications for assessing costs and benefits of treatment. J National Cancer Inst Monographs 1992;11:137-42.
11. Sutherland HJ, Lockwood GA, Minkin S, Tritchler DL, Till JE, Llewellyn Thomas HA. Measuring satisfaction with health care: a comparison of single with paired rating strategies. Soc Sci Med 1989;28:53-58.
12. Jones I, Morrell D. General practitioners’ background knowledge of their patients. Fam Pract 1995;12:49-53.
13. Langley GR, Tritchler DL, Llewellyn-Thomas HA, Till JE. Use of written cases to study factors associated with regional variations in referral rates. J Clin Epidem 1991;44:391-402.
14. Shekelle PG, Kravitz RL, Beart J, Marger M, Wang M, Lee M. Are nonspecific practice guidelines potentially harmful A randomized comparison of the effect of nonspecific versus specific guidelines on physician decision making. Health Serv Res 2000;34:1429-1448.
15. Grol R, Dalhuijsen J, Thomas S, Veld C, Rutten G, Mokkink H. Attributes of clinical guidelines that influence use of guidelines in general practice: observational study. BMJ 1998;317:858-861.
16. McWilliam CL, Brown JB, Stewart M. Breast cancer patients’ experiences of patient-doctor communication: a working relationship. Patient Educ Couns 2000;39:191-204.
17. Tudiver F, Talbot Y. Why don’t men go to physicians? Family physicians’ perspectives on help seeking behavior of men. J Fam Pract 1999;48:47-52.
18. Brownson RC, Davis JR, Simms SG, Kern TG, Harmon RG. Cancer control knowledge and priorities among primary care physicians. J Cancer Educ 1993;8:35-41.
19. Battista RN, Williams JI, MacFarlane LA. Determinants of preventive practices in fee for-service primary care. Am J Prev Med 1990;6:6-11.
20. Mittman BS, Tonesk X, Jacobson PD. Implementing clinical practice CPGs: social influence strategies and practitioner behavior change. QRB 1992;Dec:413-422.
21. Battista RN, Williams JI, MacFarlane LA. Determinants of primary medical practice in adult cancer prevention. Med Care 1986;24:216-226.
22. Burack RC. Barriers to clinical preventive medicine. Prim Care 1989;16:245-250.
23. Frame PS. Breast Cancer Screening in Older Women: the family practice perspective. J Gerontol 1992;47, Spec.:No. 131-3.
24. Pathman DE, Konrad TR, Freed GL, Freeman VA, Koch GG. The awareness-to-adherence model of the steps to clinical guideline compliance. Med Care 1996;34:873-889.
25. Stange KC, Kelly R, Chao J, Zyzanski SJ, Shank JC, Jaen CR, Melnikow J, Flocke S. Physician agreement with US Preventive Services Task Force recommendations. J Fam Pract 1992;34:409-416.
26. Brownson RC, Davis JR, Simms SG, Kern TG, Harmon RG. Cancer control knowledge and priorities among primary care physicians. J Cancer Educ 1993;8:35-41.
27. Costanza M.E, Stoddard A.M, Zapks J.G, Gaw V.P, Barth R. Physician compliance with mammography guidelines: Barriers and enhancers. J Am Board Fam Pract 1992;5:143-52.
28. Weingarten S, Stone E, Hayward R, Tunis S, Pelter M, Huang H, Kristopaitis R. The adoption of preventive care practice guidelines by primary care physicians. J Gen Int Med 1990;10:138-144.
29. Young MJ, Fried LS, Eisenberg J, Hershey J, Williams S. Do cardiologists have higher thresholds for recommending coronary arteriography than family physicians? Health Serv Res 1987;22:623-635.
30. Smith HE, Herbert CP. Preventive practice among primary care physicians in British Columbia: relation to recommendations of the Canadian Task Force on the Periodic Health Examination. Canad Med Assoc J 1993;149:1795-800.
31. Triezenberg D.J, Smith M.A, Holmes T.M. Cancer screening and detection in family practice: A MIRNET study. J Fam Pract 1995;40:27-33.
32. Summerton N. Positive and negative factors in defensive medicine: A questionnaire study of general practitioners. BMJ 1995;310:27-9.
33. Jones I, Morrell D. General practitioners’ background knowledge of their patients. Fam Pract 1995;12:49-53.
34. Cabana MD, Rand CS, Powe NR, WU AW, Wilson MH, Abboud PA, Rubin HR. Why don’t physicians follow clinical practice guidelines? A framework for improvement. J Am Med Assoc 1999;282:1458-1465.
35. Mandelblatt JS, Yabroff KR, Kerner JF. Equitable access to cancer care services. Cancer 1999;86:2378-2390.
Address reprint requests to Fred Tudiver, MD, Department of Family Medicine, East Tennessee State University , Box 70621, Johnson City, TN 37614. Email: [email protected].
To submit a letter to the editor on this topic, click here: [email protected].
OBJECTIVES: To determine: a) the respondents’ perceptions of 4 unclear or conflicting cancer screening guidelines: prostate specific antigen (PSA) for men over age 50, mammography for women ages 40-49, colorectal screening by fecal occult blood testing (FOBT), and colonoscopy for patients over age 40; and b) the influence of various patient and physician factors on the decision to order these tests.
STUDY DESIGN: National Canadian mail survey of randomly selected family physicians.
POPULATION: Family physicians in active practice (n=565) selected from rural and urban family medicine sites in 5 provinces representing the main regions in Canada: British Columbia, Alberta, Ontario, Quebec, Nova Scotia.
OUTCOMES MEASURED: Agreement with guideline statements, and decision to order screening test in 6 clinical vignettes.
RESULTS: Of 565 surveys mailed, 351 (62.1%) were returned. Most respondents agreed with the Canadian Task Force recommendations, and the majority believed that various guidelines for 3 of the 4 screens were conflicting (PSA 86.6%; mammography 67.5%; FOBT 62.4%). Patient anxiety about cancer, patient expectations of being tested, and a positive family history of cancer significantly increased the odds that the 4 tests would be ordered. A good quality patient-MD relationship significantly decreased the odds of ordering a mammogram. Screening decisions were also significantly influenced by the respondents’ beliefs about whether screening was recommended and whether screening could cause more harm than good. A physician’s sensitivity to his or her colleagues’ practice influenced screening decisions regarding PSA and mammography.
CONCLUSIONS: These results suggest a conceptual framework for understanding the determinants of screening behavior when guidelines are unclear or conflicting.
Four factors are significant determinants, independently, of a physician’s decision to order a screening test when recommendations are unclear or conflicting: a patient’s anxiety about having cancer; a patient’s expectation to undergo screening; a family history of cancer; and (in most cases) the quality of the patient-physician relationship. Particularly in the context of breast cancer screening, when a patient and physician have a good relationship, they are more likely than when the relationship is poor to discuss the pros and cons of a conflicting screening guideline and reach a mutually agreeable decision.
In instances of conflicting recommendations, the importance physicians attribute to the practice of colleagues influences their screening decisions.
Although most studies of the determinants of physicians’ cancer screening behavior have dealt with facilitators or barriers to the adoption of guidelines with clear recommendations, virtually no studies have examined factors affecting physician practice when guidelines are unclear or conflicting. When guidelines are unclear, many physicians are left with little direction. By performing cancer screening procedures that are not clearly effective,1 physicians are diverting limited resources to areas where there is uncertain or no benefit to patients.
We studied physician decision-making in cancer screening when guidelines are “unclear” or conflicting. We defined an unclear guideline as a C recommendation (insufficient evidence to recommend the maneuver or not) from the Canadian Task Force on the Periodic Health Examination.2,3 We defined a “conflicting” guideline as one for which there were different recommendations from at least 2 different organizations for the same cancer screening maneuver.
The authors conducted a qualitative study of 10 focus groups across Canada, and identified factors that influence family physicians’ cancer-screening decisions when guidelines are unclear or conflicting.4 The findings supported a conceptual model with 8 factors: 1) patient factors (patient anxiety, expectations, and family history); 2) physician factors (perception of guidelines, clinical practice experience, influence of family physician and specialist colleagues, and time/financial costs; 3) the patient-physician relationship (quality of rapport). Four of these 8 factors were considered the most influential: patient anxiety about having cancer, patient expectations to have a screening test, family history of cancer, and the quality of the patient-physician relationship.
Although we know of many factors that determine cancer-screening decisions, it is not known how much each of these factors contributes to physicians’ decisions to perform tests in specific situations. The aim of this study was to verify these determining factors and to quantify the strength of the influence of each one on cancer screening decisions.
Methods
We conducted a national survey of family physicians in Canada because they are the main preventive care providers in Canada and because a physician’s recommendation is the strongest predictor of an individual’s decision to have a screening test.5
The self-administered questionnaire was mailed to a random sample of 600 family physicians, 120 from each of 5 provincial licensing bodies from 5 regions in Canada: British Columbia, Alberta, Ontario, Quebec, and Nova Scotia. We stratified by postal codes to ensure equal representation of urban and rural physicians (oversampled) to permit subgroup analysis. Ethical approval was obtained from all participating institutions. We followed a modified 4-step Dillman6 method, using initial full mailing, follow up reminder postcards, second full mailing, and phone call reminders.
The questionnaire was composed of 2 parts. Part 1 contained 40 single-item questions on physicians’ perceptions of guideline recommendations for cancers of interest, and the perceived influence of various factors on their decision to order screening tests (all factors identified in the literature and in our previous study). The questionnaire also contained items on practice characteristics, demographics, and respondents’ personal experience with cancer or cancer screening tests.
Part 2 contained 6 clinical case vignettes; 2 for prostate specific antigen (PSA), 2 for mammography, and 2 for fecal occult blood testing (FOBT) and colonoscopy, for which recommendations can be unclear according to Canadian guidelines, or conflicting.2 As for screening for prostate cancer with PSA for men over age 50, there is fair evidence for when not to screen, but conflicting recommendations from at least 2 major organizations. Mammography for breast cancer screening in women age 40 to 49 has conflicting recommendations (different recommendations from at least 2 different organizations). FOBT and colonoscopy for colorectal cancer detection over age 40 are unclear C recommendations (insufficient evidence to either recommend or not).
The Clinical Case Vignettes
Clinical case vignettes have been shown to be a useful, inexpensive, and effective method for eliciting physicians’ decision-making behavior in a simulated situation.7 Case vignettes have been used to examine physicians’ practice behavior with cancer patients.8-11For research purposes, the usefulness of the clinical case vignette rests on the ability to vary specific factors (relevant independent variables under study) from one vignette to another, while keeping constant the surrounding factors of the case presented (the frame).
For each clinical case vignette, the dependent variable was the physician’s decision to order the screening test presented or not. The independent variables were the 4 most influential factors identified in the prior qualitative study,4 embedded within the description of each clinical case vignette. Each independent variable had 2 levels: presence or absence of patient anxiety, patient expectations for testing, and family history of cancer, and easy or difficult relationship. This enabled 16 different versions of each clinical case vignette frame, and 2 frames were developed for each cancer screening. The clinical case vignettes were developed and tested in 4 steps. First, 6 investigators (R.G., F.T., C.H., A.K., M.O., J.B.B.) generated case vignettes from their own clinical experience that reflected specified levels of the factors. Second, 12 family physician colleagues empirically validated the descriptions in the case vignettes. A minimum of 9 of these physicians had to correctly identify the intended level of each of the factors in question. Third, factors not attracting 75% agreement were corrected or replaced. Fourth, the modified clinical case vignettes were submitted to another group of 12 family physicians for their perceptions of the intended levels of the relevant factors. The final versions of the vignettes reflected concordance between the perceived and the intended levels in the factors for each case vignette. Figure 1.
Our design was “fractional” in the sense that we sampled from only a fraction of all possible combinations of independent variables. We had estimated that each family physician could respond to no more than 6 case vignettes (2 per cancer screening). The reduced set represented the vignettes that were clinically realistic. As a result, each physician received set of 6 vignettes offering a clinically meaningful spread of possible levels of the independent variables to maximize the opportunity to detect practice behavior variation. The clinical case vignettes were presented in random order to avoid sequence bias. This design ensured that each physician had 1 vignette with all independent factors absent, 1 with all factors present, and the remaining 4 with a diversity of the possible combinations of levels of patient factors.
Analyses
The analysis of the binary response for each test (order versus not order screening test) included the factors listed in the theoretical framework, with an additional random effect to take into account possible correlations among responses to 2 vignettes from the same physician. The estimation of each model’s parameters was performed using the Generalized Estimating Equation approach of SAS; this variant of logistic regression accounts for the non-independence of observations. We examined first the effect of each of the 4 principal factors-individually and together-on the decision to order a screening test. Then we looked for additional significant effects of physician demographics and perceptions of guidelines. We looked for interactions between the quality of the relationship with other factors. For each screening test, we developed a final parsimonious model which included all factors that were statistically significant at P = 0.05.
Results
Of the original 600 physicians, there were 351 respondents, 214 non-respondents, and 35 ineligibles (16 were not in full-time practice, defined as < 15 hours a week; 8 were not practicing; 6 were in another specialty; 4 had moved out of the jurisdiction; and 1 had died). The final response rate was 62.1% (351/565). The respondents’ demographic characteristics Table 1 reflected the Canadian family physician population, except that there were more certificants of the College of Family Physicians of Canada (akin to Board certification in the US) among the respondents.
By [the fractional factorial] design, the versions of the vignettes with all patient factors present or all absent were the most frequent versions of the vignettes, and the frequency of the remaining versions were uniformly distributed for each vignette. There was no evidence of a systematic under-representation of any versions as a result of non-response.
Perceptions of Guidelines
The respondents’ perceptions of the guideline recommendations for the 4 cancer screening tests are shown in Table 2. Although the respondents’ perceptions of guidelines agreed with the Canadian Task Force guidelines for PSA and mammography, they diverged for colorectal cancer screening. For example, 83.5% of respondents thought colonoscopy was not recommended for patients over 40. A majority of respondents believed that the guidelines for PSA, mammography, and FOBT were conflicting.
The Influence of the Four Principal Factors
Individually, the 4 principal factors were significant determinants of the physician’s decision to order the screening test when the evidence was unclear or conflicting Table 3. The patient’s anxiety about having cancer, their expectations of having a screening test, the quality of the patient-physician-relationship (in most cases), and a positive family history of the relevant cancer all increased the odds of screening. When all 4 factors were analyzed as a combined group adjusting for the presence of other factors Table 3, the principal factors that remained significant determinants of the physician’s decision to order the screening were as follows: anxiety for PSA and mammography; patient expectations for PSA, mammography, and FOBT; a high quality patient-physician relationship for mammography (reduced the likelihood of ordering); and positive family history for all but mammography.
The Combined Influence of the Principal Factors and Physician Factors Physician variables were added to the initial logistic regression models to derive a final parsimonious model for each screening test. Table 4 shows that for each of the screening maneuvers, there were differences not only in the factors that significantly influenced the decision to screen, but also in the magnitude of influence as manifested by the odds ratios. The direction of the influence was similar across examples: all the factors increased the odds of screening except perception that the test is not recommended or does more harm than good, and a good patient-doctor relationship (in the mammography example). PSA and mammography had a similar pattern: patient anxiety, expectations, family history, the physician’s perception of the level of recommendation of the test, whether it creates more harm than good, and the influence of colleagues all significantly influenced the decision to screen. For FOBT, patient expectations, the level of perceived recommendations and the perception of harm were significant. For colonoscopy, patient anxiety, family history, and the perception of the level of recommendation were significant determinants.
Discussion
The results of this study add to the findings from the focus groups and suggest a conceptual framework or model for understanding the determinants of screening behaviour in unclear and conflicting recommendation situations. Although this model offers a more complex picture of the determinants of cancer screening in these instances, there is a great deal of consistency. Patient anxiety, patient expectations, family history of cancer, physicians’ perceptions of the relevant guideline, and physicians’ perceptions of the benefit or harm in screening were all important determinants of screening decisions. One of the important differences in the 2 studies is the relative strength of the influence of family history in this survey study, in particular for mammography and colonoscopy.
Family physicians are trained to heed patient anxiety, but it has only been described as an indirect determinant of cancer screening.12 Patient expectations has been described in the literature in a number of studies as an important determinant of screening.1,13 In addition, other patient-specific factors have been shown to be associated with physician adoption of guidelines, such as patient concerns about finances, quality of life, and location of care.14 Recent research has found an increase in physicians’ wish for more patient involvement in the development of clinical guidelines, and they have suggested that practice guidelines should reflect patient preferences.15
In the final model, the quality of the patient-physician relationship was related to one cancer screening maneuver: mammography for women aged 40-49. It is interesting that a good relationship halved the odds of screening tests being ordered when accounting for other patient factors. The importance of the influence of the patient-physician relationship on screening has been described in previous studies.12,16 In a good patient-physician relationship, patient and physician are more likely to discuss the pros and cons of a conflicting screening guideline and to find common ground than when the relationship is poor.16
The patient-physician relationship did not appear to be an important determinant in the prostate and colorectal screening examples. For PSA screening it may be due to the unique character of the relationship male patients have with their physician. A recent study found that male patients experience many barriers to seeking help, and they find it difficult to discuss their health concerns and preventive care issues with their physicians.17 For colorectal screening by colonoscopy the relationship may not have been an important determinant because 2 other determinants appeared to be so important and may overshadow any others: the great majority of respondents believed that it was not recommended (83.5%); and family history played a very important role in influencing screening.
In the final statistical modeling, several additional physician factors appeared to influence screening decisions. In particular, both the perception of whether the screening test was recommended and the belief that the screening test could cause more harm than good contributed independently to the screening decision. The same factors were noted in our qualitative study, a finding supported by many examples in the literature.1,18,19 In addition, the importance that physicians attribute to the practice of colleagues appeared to influence screening decisions in the 2 conflicting examples (from a Canadian perspective)-PSA screening and mammography. This suggests an important role of colleagues in conflicting examples. Previous research has suggested that social influences play an important role-in particular, when uncertainty is high, or when the evidence is still evolving and recommendations based on the evidence are not in common practice.20
Our emerging model Figure 2 shows that there are more than just cognitive processes at work in this sort of decision-making. The findings suggest that aspects of the patient-physician relationship and the influence of colleagues affect decision-making as well. Further, our findings indicate that these determinants are important when the guidelines are unclear or conflicting.
Many of the factors identified in this study have been described previously.1,13,21, 34 There are also recent theories to help explain how and why physicians decide to screen their patients for cancer, including whether they agree with and adhere to recommended guidelines.24,35However, these theories were developed within the context of clinical decision making when the guidelines are clear. The unique contribution of our study and emerging model is that it concerns screening decisions with unclear or conflicting guidelines. The impact of uncertainty on this aspect of physician decision-making is important. Physicians need to make decisions in the face of uncertainty. They appear to do this by believing one side of the argument or another, by balancing the perceived good or harm from screening, and by looking for support from colleagues to bolster their decision. In addition, their patients play a key role in influencing these decisions, with the doctor and patient finding common ground, often resulting in a shared decision.
Limitations
We represented the clinical factors with dichotomous situations, when, in real encounters, there would be a much greater range in the level of intensity of factors such as patient anxiety, expression of expectation, and quality of the relationship. Also, even though the case vignettes provided some background, for the physician respondent it was a “one of” situation which does not reflect a typical primary care situation that includes continuing care of patients who have a variety of coexisting clinical issues. The magnitude of the influence of these factors may be considerably underestimated or overestimated with the use of clinical case vignettes.
The generalizability of the respondents may be a limitation, as they were younger (1.7 years, not significant) and more likely to be certificants than the non-respondents. The latter difference may have contributed to a trend that stressed the influence of patient anxiety and wishes, which reflects residency training issues in family medicine. Last, although the study was done in Canada, we believe the findings likely apply to US family physicians, as graduate training is quite similar in the two countries.
Conclusions
This study underlies the importance of the cognitive component in decision making-in particular, of perceptions of guidelines, and of the influence of patients and their needs and the patient-physician relationship.
Our results verify our model in general terms, but also build on and advance the conceptual model that evolved from our qualitative findings. It provides a useful framework for understanding clinical decision-making in the face of uncertainty or controversy, and may be applicable to other clinical domains.
In future research we plan to test the effect of race and cultural aspects of the patient and of the physician on physicians’ screening decisions. Ultimately, the model could be used to design interventions to assist with the implementation of preventive services guidelines, and to be included in future CME programs for practicing physicians.
Acknowledgements
Funding/support: This study was funded by the Medical Research Council of Canada and the Prince Edward Island Cancer Research Council.
1. Zyzanski SJ, Stange KC, Kelly R, Flocke S, Shank JC, Chao J, Jaen CR, Smith CK. Family physicians’ disagreements with the US Preventive Services Task Force recommendations. J Fam Pract 1994;39:140-147.
2. Canadian Task Force on the Periodic Health Examination. The Canadian Guide to Clinical Preventive Health Care. Health Canada, Ottawa, 1994.
3. U.S. Preventive Services Task Force. Guide to Clinical Preventive Services. Report of the U.S. Preventive Services Task Force. Williams & Wilkins, Baltimore, 1996.
4. Tudiver F, Brown BB, Medved W, Herbert C, Ritvo P, Guibert R, Haggerty J, Goel V, Smith P, O’Beirne M, Katz A, Moliner P, Ciampi A, Williams JI. Making decisions about cancer screening when the guidelines are unclear or conflicting. J Fam Pract 2001;50:682-687.
5. White E, Urban N, Taylor V. Mammography utilization, public health impact, and cost effectiveness in the United States. Ann Rev Pub Health 1993;14:605-633.
6. Dillman DA. Mail and Telephone Surveys: the Total Design Method. New York, John Wiley and Sons, 1978.
7. Peabody JW, Luck J, Glassman P, Dresselhaus TR, Lee M. Comparison of vignettes, standardized patients, and chart abstraction: a prospective validation study of 3 methods for measuring quality. J Am Med Assoc 2000;283:1715-1722.
8. Deber RB, Thompson GG. Who still prefers aggressive surgery for breast cancer? Implications for the clinical applications of clinical trials. Arch Int Med 1987;147:1543-7.
9. Sawka CA, O’Connor AM, Llewellyn Thomas HA, To T, Pinfold SP, Harrison Woermke D. Appropriateness of adjuvant systemic therapy for axillary node negative breast cancer: a physician opinion survey. J Clin Oncol 1995;13:1459-69.
10. Tannock IF, Belanger D. Use of a physician directed questionnaire to define a consensus about management of breast cancer: implications for assessing costs and benefits of treatment. J National Cancer Inst Monographs 1992;11:137-42.
11. Sutherland HJ, Lockwood GA, Minkin S, Tritchler DL, Till JE, Llewellyn Thomas HA. Measuring satisfaction with health care: a comparison of single with paired rating strategies. Soc Sci Med 1989;28:53-58.
12. Jones I, Morrell D. General practitioners’ background knowledge of their patients. Fam Pract 1995;12:49-53.
13. Langley GR, Tritchler DL, Llewellyn-Thomas HA, Till JE. Use of written cases to study factors associated with regional variations in referral rates. J Clin Epidem 1991;44:391-402.
14. Shekelle PG, Kravitz RL, Beart J, Marger M, Wang M, Lee M. Are nonspecific practice guidelines potentially harmful A randomized comparison of the effect of nonspecific versus specific guidelines on physician decision making. Health Serv Res 2000;34:1429-1448.
15. Grol R, Dalhuijsen J, Thomas S, Veld C, Rutten G, Mokkink H. Attributes of clinical guidelines that influence use of guidelines in general practice: observational study. BMJ 1998;317:858-861.
16. McWilliam CL, Brown JB, Stewart M. Breast cancer patients’ experiences of patient-doctor communication: a working relationship. Patient Educ Couns 2000;39:191-204.
17. Tudiver F, Talbot Y. Why don’t men go to physicians? Family physicians’ perspectives on help seeking behavior of men. J Fam Pract 1999;48:47-52.
18. Brownson RC, Davis JR, Simms SG, Kern TG, Harmon RG. Cancer control knowledge and priorities among primary care physicians. J Cancer Educ 1993;8:35-41.
19. Battista RN, Williams JI, MacFarlane LA. Determinants of preventive practices in fee for-service primary care. Am J Prev Med 1990;6:6-11.
20. Mittman BS, Tonesk X, Jacobson PD. Implementing clinical practice CPGs: social influence strategies and practitioner behavior change. QRB 1992;Dec:413-422.
21. Battista RN, Williams JI, MacFarlane LA. Determinants of primary medical practice in adult cancer prevention. Med Care 1986;24:216-226.
22. Burack RC. Barriers to clinical preventive medicine. Prim Care 1989;16:245-250.
23. Frame PS. Breast Cancer Screening in Older Women: the family practice perspective. J Gerontol 1992;47, Spec.:No. 131-3.
24. Pathman DE, Konrad TR, Freed GL, Freeman VA, Koch GG. The awareness-to-adherence model of the steps to clinical guideline compliance. Med Care 1996;34:873-889.
25. Stange KC, Kelly R, Chao J, Zyzanski SJ, Shank JC, Jaen CR, Melnikow J, Flocke S. Physician agreement with US Preventive Services Task Force recommendations. J Fam Pract 1992;34:409-416.
26. Brownson RC, Davis JR, Simms SG, Kern TG, Harmon RG. Cancer control knowledge and priorities among primary care physicians. J Cancer Educ 1993;8:35-41.
27. Costanza M.E, Stoddard A.M, Zapks J.G, Gaw V.P, Barth R. Physician compliance with mammography guidelines: Barriers and enhancers. J Am Board Fam Pract 1992;5:143-52.
28. Weingarten S, Stone E, Hayward R, Tunis S, Pelter M, Huang H, Kristopaitis R. The adoption of preventive care practice guidelines by primary care physicians. J Gen Int Med 1990;10:138-144.
29. Young MJ, Fried LS, Eisenberg J, Hershey J, Williams S. Do cardiologists have higher thresholds for recommending coronary arteriography than family physicians? Health Serv Res 1987;22:623-635.
30. Smith HE, Herbert CP. Preventive practice among primary care physicians in British Columbia: relation to recommendations of the Canadian Task Force on the Periodic Health Examination. Canad Med Assoc J 1993;149:1795-800.
31. Triezenberg D.J, Smith M.A, Holmes T.M. Cancer screening and detection in family practice: A MIRNET study. J Fam Pract 1995;40:27-33.
32. Summerton N. Positive and negative factors in defensive medicine: A questionnaire study of general practitioners. BMJ 1995;310:27-9.
33. Jones I, Morrell D. General practitioners’ background knowledge of their patients. Fam Pract 1995;12:49-53.
34. Cabana MD, Rand CS, Powe NR, WU AW, Wilson MH, Abboud PA, Rubin HR. Why don’t physicians follow clinical practice guidelines? A framework for improvement. J Am Med Assoc 1999;282:1458-1465.
35. Mandelblatt JS, Yabroff KR, Kerner JF. Equitable access to cancer care services. Cancer 1999;86:2378-2390.
Address reprint requests to Fred Tudiver, MD, Department of Family Medicine, East Tennessee State University , Box 70621, Johnson City, TN 37614. Email: [email protected].
To submit a letter to the editor on this topic, click here: [email protected].
Are we doing enough to screen for colorectal cancer? Findings from the 1999 Behavioral Risk Factor Surveillance System
OBJECTIVES: To estimate current rates of use of fecal occult blood testing (FOBT) and sigmoidoscopy or colonoscopy; to determine whether test use varies by demographic factors; and to compare 1999 rates of use with 1997 rates.
STUDY DESIGN: The Behavioral Risk Factor Surveillance System is an ongoing, state-based random-digit-dialed telephone survey of the US population that collects various health behavior information, including the use of colorectal cancer (CRC) screening tests.
POPULATION: In 1999, 63,555 persons 50 years of age or older responded to questions regarding FOBT and sigmoidoscopy or colonoscopy.
OUTCOMES MEASURED: The proportion of survey respondents reporting having had FOBT and sigmoidoscopy/colonoscopy at any time; and the proportion reporting having had FOBT and sigmoidoscopy/colonoscopy within recommended time intervals. Data were recorded for the years 1997 and 1999, and analyzed according to various demographic factors.
RESULTS: In 1999, 40.3% of respondents reported having had an FOBT at some time, and 43.8% reported having had a sigmoidoscopy or colonoscopy. Regarding recent test use, 20.6% of respondents reported having had an FOBT within the year, and 33.6% reported having had a sigmoidoscopy or colonoscopy within the past 5 years. Some demographic variation was noted. In 1997, 19.6% reported having had an FOBT within the year, and 30.3% reported having had a sigmoidoscopy or proctoscopy within the past 5 years.
CONCLUSIONS: Use of CRC screening tests increased only slightly from 1997 to 1999. Usage remains low, despite consensus that screening for CRC reduces mortality from the disease. Efforts to promote awareness of, and screening for, CRC must intensify.
- Strong scientific evidence shows that regular colorectal cancer (CRC) screening effectively reduces CRC incidence and mortality.
- Despite this evidence, use of CRC screening tests remains low.
- Clinicians can use available physician-education tools (www.cdc.gov/cancer/colorctl/ calltoaction) to review current screening tests and guidelines and should begin offering regular CRC screening tests to their patients, if they are not already doing so.
Colorectal cancer (CRC) is the second leading cause of cancer-related deaths in the United States for men and women combined; for women alone, it follows lung and breast cancers, and for men, it follows lung and prostate cancers.1 Strong scientific evidence indicates that regular screening is effective in reducing CRC incidence and mortality.2-8 Randomized controlled trials have demonstrated a reduction in CRC incidence and mortality with annual and biennial fecal occult blood testing (FOBT), and case-control studies have shown a reduction in CRC mortality associated with the use of sigmoidoscopy. Based on this evidence, 3 sets of national guidelines were developed recommending that average-risk persons undergo regular CRC screening with 1 or more of the following tests: FOBT annually, sigmoidoscopy periodically (usually every 5 years), colonoscopy every 10 years, or double-contrast barium enema every 5–10 years.9-11
To estimate current use of CRC screening tests, to evaluate variation in test use by demographic factors, and to compare current test use with previously published rates of use,12 we analyzed data from the 1999 Behavioral Risk Factor Surveillance System (BRFSS) on the use of a home blood stool test (FOBT) and on having had sigmoidoscopy or colonoscopy. Results from the 1999 survey were compared with results from the 1997 survey.
Methods
In 1999, 50 states, the District of Columbia, and Puerto Rico participated in the BRFSS, a state-based, random-digit-dialed telephone survey of the US non-institutionalized, adult (aged 18 years or older) civilian population. The BRFSS collects a wide variety of health behavior information, including the use of CRC screening tests.
During the survey, 63,555 respondents aged 50 years or older were asked 4 questions regarding their use of the FOBT and their having undergone sigmoidoscopy or colonoscopy (Table 1). Variables not measured in this dataset include use of sigmoidoscopy separately from colonoscopy, test indication, or physician specialty. We analyzed CRC tests used at any time and used recently (FOBT within the past year and sigmoidoscopy or colonoscopy within the past five years).
Aggregated rates, standard errors, and 95% confidence intervals were calculated using SAS13 and SUDAAN software.14 Respondents who refused to answer or did not know the answer to a question were excluded from analysis of the specific question. The total number of respondent refusals or unknowns was 1007 (1.6%) for the FOBT questions and 1217 (1.9%) for the sigmoidoscopy questions. Data were weighted, using intercensal estimates, to the sex, racial, ethnic, and age distribution of each state’s adult population, and were age-standardized to the 1999 BRFSS population. To compare 1997 and 1999 estimates, the 1997 data were also age-standardized to the 1999 BRFSS population. The median state response rate for the entire survey was 56.7%, calculated using the cooperation rate formula.15
The 1999 BRFSS questions regarding use of sigmoidoscopy were modified from previous questionnaires. As the scientific evidence supporting CRC screening tests has grown, BRFSS CRC survey questions have changed. The 1997 survey, described previously,12 was the first survey to collect information regarding the use of home-administered FOBT and sigmoidoscopy from all 50 states, the District of Columbia, and Puerto Rico. In 1997, respondents were asked if they had received a sigmoidoscopy or proctoscopy. Proctoscopy, performed with a shorter instrument than a sigmoidoscope, is not recommended as a CRC screening test. In 1999, the term “sigmoidoscopy/proctoscopy” was replaced with “sigmoidoscopy/colonoscopy.” Colonoscopy evaluates the entire colon and is recommended once every 10 years in some guidelines.10,11 For this report, the terms “sigmoidoscopy/proctoscopy” and “sigmoidoscopy/colonoscopy” will each be referred to as “sigmoidoscopy” unless otherwise specified.
TABLE 1
Questions used in the 1999 Behavioral Risk Factor Surveillance System to assess usage of colorectal cancer screening tests
|
Results
The age-adjusted proportion of overall respondents who reported ever receiving CRC screening tests in 1999 was 40.3% for FOBT and 43.8% for sigmoidoscopy (data not shown).
The 1999 age-adjusted CRC screening test rates are presented by demographic subgroups for reported use within recommended time intervals: FOBT within the year preceding the survey, sigmoidoscopy within the past five years, or at least one of the two tests (Table 2). Less than half of the population surveyed reported having either FOBT or sigmoidoscopy within the recommended time interval. In 1999, 20.6% of respondents reported having had FOBT within the previous year; 33.6% reported having had a sigmoidoscopy within the previous 5 years; 44.0% reported having had either FOBT within the previous year or a sigmoidoscopy within the previous 5 years. There was little difference in test use between blacks and whites. Rates of use by Asian/Pacific Islanders and American Indian/Alaska Natives were calculated from small respondent samples and should be interpreted cautiously. Respondents of Spanish or Hispanic origin reported lower rates of FOBT and sigmoidoscopy than respondents who were not of Hispanic origin. Reported test use rose with increasing age of the respondents, up to age 70–79, and then declined for those over 80 years of age. Reported test use increased with education and with annual house hold income. Respondents who had health care coverage were almost twice as likely to have had CRC screening tests as respondents without health care coverage.
CRC screening test rates increased slightly from 1997 to 1999. In 1997, 19.6% of respondents reported having had an FOBT within the previous year and 30.3% reported having had a sigmoidoscopy within the previous 5 years.
We compared 1999 BRFSS usage rates for FOBT and sigmoidoscopy or colonoscopy with those for mammography and Papanicolaou (Pap) smear (Figure). These are not direct comparisons but, rather, comparisons of the rates of testing within recommended time intervals among appropriate demographic groups. The proportion of persons who used CRC screening tests within recommended time intervals was lower than those for other cancer screening tests.
TABLE 2
Respondents aged 50 years or older who reported colorectal cancer screening tests within recommended time intervals, by demographic variables1
| Fecal occult blood test within previous year | Sigmoidoscopy/colonoscopy within previous 5 years | Either test within recommended time interval | |||||||
|---|---|---|---|---|---|---|---|---|---|
| n2 | % | (95% CI) | n | % | (95% CI) | N | % | (95% CI) | |
| Total | 61,952 | 20.6 | (20.1–21.2) | 61,953 | 33.6 | (33.0–34.2) | 61,537 | 44.0 | (43.3–44.6) |
| Gender | |||||||||
| Male | 23,919 | 19.1 | (18.2–19.9) | 23,850 | 37.9 | (36.8–38.9) | 23,724 | 45.9 | (44.9–47.0) |
| Female | 38,033 | 22.0 | (21.3–22.7) | 38,103 | 30.4 | (29.6–31.1) | 37,813 | 42.6 | (41.7–43.4) |
| Race4 | |||||||||
| White | 55,139 | 21.0 | (20.5–21.6) | 55,170 | 33.6 | (33.0–34.3) | 54,804 | 44.2 | (3.5–44.9) |
| Black | 4,075 | 20.7 | (18.8–22.6) | 4,046 | 32.6 | (30.3–34.9) | 4,020 | 43.3 | (40.9–45.7) |
| Asian/Pacific Islander | 739 | 10.3 | (6.9–13.6) | 739 | 35.4 | (28.4–42.5) | 735 | 40.1 | (33.3–46.9) |
| American Indian/ Alaska Native | 725 | 18.2 | (12.7–23.7) | 725 | 36.0 | (29.4–42.5) | 723 | 43.0 | (36.5–49.6 |
| Spanish or Hispanic origin | |||||||||
| Yes | 3,664 | 11.2 | (9.4–12.9) | 3,667 | 28.6 | (25.6–31.5) | 3,635 | 33.9 | (30.9–37.0) |
| No | 57,993 | 21.4 | (20.9–21.9) | 57,999 | 34.0 | (33.4–34.6) | 57,620 | 44.8 | (44.1–45.5) |
| Age (group) | |||||||||
| 50–59 years | 23,758 | 15.5 | (14.7–16.2) | 23,803 | 26.1 | (25.1–27.0) | 23,667 | 34.7 | (33.7–35.7) |
| 60–69 years | 17,680 | 23.0 | (22.0–24.0) | 17,651 | 36.9 | (35.7–38.1) | 17,574 | 48.1 | (46.9–49.3) |
| 70–79 years | 14,427 | 25.8 | (24.6–27.0) | 14,412 | 40.7 | (39.3–42.1) | 14,306 | 52.7 | (51.4–54.1) |
| ≤80 years | 6,087 | 21.6 | (19.8–23.4) | 6,087 | 36.1 | (34.0–38.2) | 5,990 | 46.9 | (44.7–49.1) |
| Education | |||||||||
| < 12 years | 11,928 | 15.0 | (13.8–16.1) | 11,889 | 27.5 | (25.9–29.1) | 11,756 | 35.6 | (33.9–37.3) |
| High school graduate | 21,183 | 19.7 | (18.8–20.6) | 21,176 | 30.6 | (29.6–31.6) | 21,049 | 41.2 | (40.1–42.3) |
| Some college/ technical school | 14,167 | 23.5 | (22.3–24.7) | 14,162 | 35.9 | (34.6–37.3) | 14,102 | 47.9 | (46.5–49.2) |
| College graduate | 14,503 | 24.3 | (23.2–25.5) | 14,560 | 41.1 | (39.8–42.5) | 14,466 | 51.4 | (50.1–52.7) |
| Income (annual household) | |||||||||
| <$20,000 | 15,204 | 15.3 | (14.3–16.3) | 15,154 | 29.1 | (27.7–30.5) | 15,029 | 37.0 | (35.5–38.4) |
| $20,000–34,999 | 14,354 | 20.8 | (19.7–21.9) | 14,362 | 32.5 | (31.2–33.8) | 14,288 | 43.0 | (41.7–44.4) |
| $35,000–49,999 | 7,721 | 23.3 | (21.6–24.9) | 7,718 | 37.0 | (35.1–39.0) | 7,703 | 48.2 | (46.3–50.1) |
| ≥$50,000 | 11,967 | 24.2 | (22.7–25.6) | 12,002 | 41.7 | (39.9–43.4) | 11,949 | 51.7 | (50.0–53.5) |
| Health care coverage | |||||||||
| Yes | 57,551 | 21.3 | (20.8–21.9) | 57,561 | 34.7 | (34.1–35.4) | 57,169 | 45.4 | (44.7–46.1) |
| No | 4,331 | 12.1 | (9.8–14.5) | 4,326 | 18.7 | (15.6–21.7) | 4,304 | 25.7 | (22.2–29.2) |
| 1From the Behavioral Risk Factor Surveillance System (BRFSS), 1999; estimates are age-adjusted. | |||||||||
| 2Sample size for each question; sample sizes may not sum to totals because of missing data. | |||||||||
| 3Confidence interval. | |||||||||
| 4Sample sizes for racial categories do not add up to column totals. “Other” racial category not presented here. | |||||||||
FIGURE
Comparison of use of colorectal cancer screening tests with other screening tests, BRFSS 1999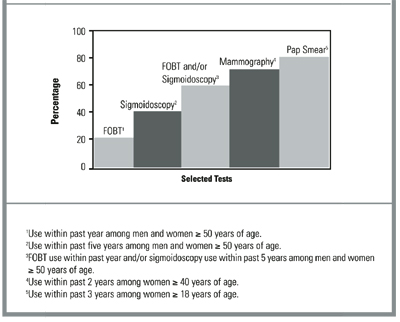
Discussion
Currently, 4 widely accepted tests are available for CRC screening, and several new tests are under investigation.16,17 Not enough evidence exists to determine which of the available tests is most appropriate when efficacy, cost-effectiveness, availability, patient acceptability, and safety are taken into consideration. The 1999 BRFSS monitored the use of 3 of these tests: FOBT and sigmoidoscopy or colonoscopy. Our results show that less than half of the US population aged 50 years and older is being screened for CRC with these methods. Persons with health care coverage and with higher education and income levels were more likely to have had CRC tests. Since 1997, the proportion of the U.S. population being screened for CRC has increased slightly, but it remains low and lags far behind the use of other recommended cancer screening tests (Figure). While use of barium enema, one of the recommended colorectal cancer screening tests, is not monitored in the 1999 BRFSS, data from a recent national primary care physician survey suggest that barium enemas are infrequently recommended for colorectal cancer screening (Carrie Klabunde, National Cancer Institute, personal/written communication, 2002).
The 1999 BRFSS was the first BRFSS survey to collect data on the use of colonoscopy. Because BRFSS colonoscopy data have not previously been collected, we do not know whether the reported increase in the use of endoscopy from 1997 to 1999 represents a true increase in sigmoidoscopy usage or previously unmeasured colonoscopy usage. Furthermore, it is likely that some of the tests reported as sigmoidoscopies or proctoscopies in the 1997 BRFSS survey were actually colonoscopies, since some respondents may be unable to clearly distinguish between the endoscopic tests.
Both patient-related and physician-related factors likely contribute to continued underuse of these tests. Patient-related factors include lack of awareness of screening guidelines, embarrassment, and lack of physician recommendation.7,18-20 Physician-related factors include lack of knowledge of the effectiveness of screening, lack of skills in endoscopy, and low reimbursement rates for screening tests.7,18-21
Several factors limit the interpretation of this analysis. First, as this is a telephone survey, only people who have access to telephones are represented in this analysis. However, approximately 95% of households in the United States have telephones.22 Second, 43.3% of the eligible respondents who were successfully contacted did not complete the telephone interview. Third, responses are self-reported and not validated through medical record review. However, a comparison of self-report and record review has found good concordance between results.23 Fourth, in the 1999 BRFSS, sigmoidoscopy use cannot be measured separately from colonoscopy, and screening tests cannot be distinguished from diagnostic tests. The results reported here may therefore be overestimates of use of these tests for screening. Lastly, the specialty of the physicians ordering the tests is unknown, limiting the ability to target interventions towards specific physician specialists. Despite these limitations, the BRFSS provides an excellent data source for routine surveillance of CRC testing.
Conclusion
This report demonstrates that CRC screening tests remain underused, despite their recognized efficacy in reducing CRC incidence and mortality.2-8 Coordinated efforts by clinicians and policy makers to raise awareness about this important disease and promote use of available screening tests must continue.
CORRESPONDENCE
Epidemiology and Health Services Research Branch, Division of Cancer Prevention and Control, Centers for Disease Control and Prevention, Atlanta, GA. Data from this paper were presented at CDC’s 15th National Conference on Chronic Disease Prevention and Control on November 30, 2000. Send correspondence and reprint requests to: Laura C. Seeff, MD; Centers for Disease Control and Prevention, DCPC; 4770 Buford Highway NE; Mailstop K-55; Atlanta, Georgia 30341-3717. E-mail: [email protected].
1. American Cancer Society. Cancer facts and figures, 2002. Atlanta: American Cancer Society, Inc., 2002. Publication 02-250M-No. 5008.02.
2. Mandel JS, Church TR, Bond JH, et al. The effect of fecal occultblood screening on the incidence of colorectal cancer. N Engl J Med 2000;343:1603-7.
3. Mandel JS, Bond JH, Church TR, et al. Reducing mortality from col-orectal cancer by screening for fecal occult blood. N Engl J Med 1993;328:1365-71.
4. Selby JV, Friedman GD, Quesenberry CP, Jr, Weiss NS. A case-con-trol study of screening sigmoidoscopy and mortality from colorec-tal cancer. N Engl J Med 1992;326:653-7.
5. Newcomb PA, Norfleet RG, Storer BE, Surawicz TS, Marcus PM. Screening sigmoidoscopy and colorectal cancer mortality. J Natl Cancer Inst 1992;84:1572-5.
6. Hardcastle JD, Chamberlain JO, Robinson MH, et al. Randomised controlled trial of faecal-occult-blood screening for colorectal cancer. Lancet 1996;348:1472-1477.
7. Kronborg O, Fenger C, Olsen J, Jorgensen OD. Sondergaard. Randomised study of screening for colorectal cancer with faecal-occult-blood test. Lancet 1996;348:1467-1.
8. Mandel JS, Church TR, Ederer F, Bond JH. Colorectal cancer mortality: Effectiveness of biennial screening for fecal occult blood. J Natl Cancer Inst 1999;91:434-7.
9. U.S.Preventive Services Task Force. Guide to clinical preventive services. 2nd ed. Baltimore: Williams and Wilkins, 1996.
10. Winawer SJ, Fletcher RH, Miller L, et al. Colorectal cancer screening: clinical guidelines and rationale. Gastroenterology 1997;112:594-642.
11. Smith RA, von Eschenbach AC, Wender R, et al. American Cancer Society guidelines for the early detection of cancer: update of early detection guidelines for prostate, colorectal, and endometrial cancers. CA Cancer J Clin 2001;51:38-75.
12. Shapiro JA, Seeff LC, Nadel MR. Colorectal cancer-screening tests and associated health behaviors. Am J Prev Med 2001;21:132-7.
13. SAS statistical analysis software. Cary, NC: SAS Institute, 1996.
14. SUDAAN software for the statistical analysis of correlated data. Research Triangle Park, NC: Research Triangle Institute, 1997.
15. Centers for Disease Control and Prevention. Behavioral Risk Factor Surveillance System, 1999. BRFSS Summary Quality Control Report. Atlanta: National Center for Chronic Disease Prevention and Health Promotion, Centers for Disease Control and Prevention, U.S. Department of Health and Human Services, 1999.
16. Fenlon HM, Nunes DP, Schroy PC, III, Barish MA, Clarke PD, Ferrucci JT. A comparison of virtual and conventional colonoscopy for the detection of colorectal polyps. N Engl J Med 1999;341:1496-503.
17. Ahlquist DA, Skoletsky JE, Boynton KA, et al. Colorectal cancer screening by detection of altered DNA in stool: feasibility of a mul-titarget assay panel. Gastroenterology 2000;119:1219-27.
18. Vernon SW. Participation in colorectal cancer screening: A review. J Natl Cancer Inst 1997;89:1406-22.
19. Peterson SK, Vernon SW. A review of patient and physician adherence to colorectal cancer screening guidelines. Semin Colon Rectal Surg 2000;11:58-72.
20. McCarthy BD, Moskowitz MA. Screening flexible sigmoidoscopy: patient attitudes and compliance. J Gen Intern Med. 1993;8:120-5.
21. Lewis JD, Asch DA. Barriers to office-based screening sigmoi-doscopy: does reimbursement cover costs? Ann Intern Med 1999;130:525-30.
22. Anderson JE, Nelson DE, Wilson RW. Telephone coverage and measurement of health risk indicators: data from the National Health Interview Survey. Am J Public Health 1998;88:1392-5.
23. Baier M, Calonge N, Cutter G, et al. Validity of self-reported col-orectal cancer screening behavior. Cancer Epidemiol Biomarkers Prev 2000;9:229-32.
OBJECTIVES: To estimate current rates of use of fecal occult blood testing (FOBT) and sigmoidoscopy or colonoscopy; to determine whether test use varies by demographic factors; and to compare 1999 rates of use with 1997 rates.
STUDY DESIGN: The Behavioral Risk Factor Surveillance System is an ongoing, state-based random-digit-dialed telephone survey of the US population that collects various health behavior information, including the use of colorectal cancer (CRC) screening tests.
POPULATION: In 1999, 63,555 persons 50 years of age or older responded to questions regarding FOBT and sigmoidoscopy or colonoscopy.
OUTCOMES MEASURED: The proportion of survey respondents reporting having had FOBT and sigmoidoscopy/colonoscopy at any time; and the proportion reporting having had FOBT and sigmoidoscopy/colonoscopy within recommended time intervals. Data were recorded for the years 1997 and 1999, and analyzed according to various demographic factors.
RESULTS: In 1999, 40.3% of respondents reported having had an FOBT at some time, and 43.8% reported having had a sigmoidoscopy or colonoscopy. Regarding recent test use, 20.6% of respondents reported having had an FOBT within the year, and 33.6% reported having had a sigmoidoscopy or colonoscopy within the past 5 years. Some demographic variation was noted. In 1997, 19.6% reported having had an FOBT within the year, and 30.3% reported having had a sigmoidoscopy or proctoscopy within the past 5 years.
CONCLUSIONS: Use of CRC screening tests increased only slightly from 1997 to 1999. Usage remains low, despite consensus that screening for CRC reduces mortality from the disease. Efforts to promote awareness of, and screening for, CRC must intensify.
- Strong scientific evidence shows that regular colorectal cancer (CRC) screening effectively reduces CRC incidence and mortality.
- Despite this evidence, use of CRC screening tests remains low.
- Clinicians can use available physician-education tools (www.cdc.gov/cancer/colorctl/ calltoaction) to review current screening tests and guidelines and should begin offering regular CRC screening tests to their patients, if they are not already doing so.
Colorectal cancer (CRC) is the second leading cause of cancer-related deaths in the United States for men and women combined; for women alone, it follows lung and breast cancers, and for men, it follows lung and prostate cancers.1 Strong scientific evidence indicates that regular screening is effective in reducing CRC incidence and mortality.2-8 Randomized controlled trials have demonstrated a reduction in CRC incidence and mortality with annual and biennial fecal occult blood testing (FOBT), and case-control studies have shown a reduction in CRC mortality associated with the use of sigmoidoscopy. Based on this evidence, 3 sets of national guidelines were developed recommending that average-risk persons undergo regular CRC screening with 1 or more of the following tests: FOBT annually, sigmoidoscopy periodically (usually every 5 years), colonoscopy every 10 years, or double-contrast barium enema every 5–10 years.9-11
To estimate current use of CRC screening tests, to evaluate variation in test use by demographic factors, and to compare current test use with previously published rates of use,12 we analyzed data from the 1999 Behavioral Risk Factor Surveillance System (BRFSS) on the use of a home blood stool test (FOBT) and on having had sigmoidoscopy or colonoscopy. Results from the 1999 survey were compared with results from the 1997 survey.
Methods
In 1999, 50 states, the District of Columbia, and Puerto Rico participated in the BRFSS, a state-based, random-digit-dialed telephone survey of the US non-institutionalized, adult (aged 18 years or older) civilian population. The BRFSS collects a wide variety of health behavior information, including the use of CRC screening tests.
During the survey, 63,555 respondents aged 50 years or older were asked 4 questions regarding their use of the FOBT and their having undergone sigmoidoscopy or colonoscopy (Table 1). Variables not measured in this dataset include use of sigmoidoscopy separately from colonoscopy, test indication, or physician specialty. We analyzed CRC tests used at any time and used recently (FOBT within the past year and sigmoidoscopy or colonoscopy within the past five years).
Aggregated rates, standard errors, and 95% confidence intervals were calculated using SAS13 and SUDAAN software.14 Respondents who refused to answer or did not know the answer to a question were excluded from analysis of the specific question. The total number of respondent refusals or unknowns was 1007 (1.6%) for the FOBT questions and 1217 (1.9%) for the sigmoidoscopy questions. Data were weighted, using intercensal estimates, to the sex, racial, ethnic, and age distribution of each state’s adult population, and were age-standardized to the 1999 BRFSS population. To compare 1997 and 1999 estimates, the 1997 data were also age-standardized to the 1999 BRFSS population. The median state response rate for the entire survey was 56.7%, calculated using the cooperation rate formula.15
The 1999 BRFSS questions regarding use of sigmoidoscopy were modified from previous questionnaires. As the scientific evidence supporting CRC screening tests has grown, BRFSS CRC survey questions have changed. The 1997 survey, described previously,12 was the first survey to collect information regarding the use of home-administered FOBT and sigmoidoscopy from all 50 states, the District of Columbia, and Puerto Rico. In 1997, respondents were asked if they had received a sigmoidoscopy or proctoscopy. Proctoscopy, performed with a shorter instrument than a sigmoidoscope, is not recommended as a CRC screening test. In 1999, the term “sigmoidoscopy/proctoscopy” was replaced with “sigmoidoscopy/colonoscopy.” Colonoscopy evaluates the entire colon and is recommended once every 10 years in some guidelines.10,11 For this report, the terms “sigmoidoscopy/proctoscopy” and “sigmoidoscopy/colonoscopy” will each be referred to as “sigmoidoscopy” unless otherwise specified.
TABLE 1
Questions used in the 1999 Behavioral Risk Factor Surveillance System to assess usage of colorectal cancer screening tests
|
Results
The age-adjusted proportion of overall respondents who reported ever receiving CRC screening tests in 1999 was 40.3% for FOBT and 43.8% for sigmoidoscopy (data not shown).
The 1999 age-adjusted CRC screening test rates are presented by demographic subgroups for reported use within recommended time intervals: FOBT within the year preceding the survey, sigmoidoscopy within the past five years, or at least one of the two tests (Table 2). Less than half of the population surveyed reported having either FOBT or sigmoidoscopy within the recommended time interval. In 1999, 20.6% of respondents reported having had FOBT within the previous year; 33.6% reported having had a sigmoidoscopy within the previous 5 years; 44.0% reported having had either FOBT within the previous year or a sigmoidoscopy within the previous 5 years. There was little difference in test use between blacks and whites. Rates of use by Asian/Pacific Islanders and American Indian/Alaska Natives were calculated from small respondent samples and should be interpreted cautiously. Respondents of Spanish or Hispanic origin reported lower rates of FOBT and sigmoidoscopy than respondents who were not of Hispanic origin. Reported test use rose with increasing age of the respondents, up to age 70–79, and then declined for those over 80 years of age. Reported test use increased with education and with annual house hold income. Respondents who had health care coverage were almost twice as likely to have had CRC screening tests as respondents without health care coverage.
CRC screening test rates increased slightly from 1997 to 1999. In 1997, 19.6% of respondents reported having had an FOBT within the previous year and 30.3% reported having had a sigmoidoscopy within the previous 5 years.
We compared 1999 BRFSS usage rates for FOBT and sigmoidoscopy or colonoscopy with those for mammography and Papanicolaou (Pap) smear (Figure). These are not direct comparisons but, rather, comparisons of the rates of testing within recommended time intervals among appropriate demographic groups. The proportion of persons who used CRC screening tests within recommended time intervals was lower than those for other cancer screening tests.
TABLE 2
Respondents aged 50 years or older who reported colorectal cancer screening tests within recommended time intervals, by demographic variables1
| Fecal occult blood test within previous year | Sigmoidoscopy/colonoscopy within previous 5 years | Either test within recommended time interval | |||||||
|---|---|---|---|---|---|---|---|---|---|
| n2 | % | (95% CI) | n | % | (95% CI) | N | % | (95% CI) | |
| Total | 61,952 | 20.6 | (20.1–21.2) | 61,953 | 33.6 | (33.0–34.2) | 61,537 | 44.0 | (43.3–44.6) |
| Gender | |||||||||
| Male | 23,919 | 19.1 | (18.2–19.9) | 23,850 | 37.9 | (36.8–38.9) | 23,724 | 45.9 | (44.9–47.0) |
| Female | 38,033 | 22.0 | (21.3–22.7) | 38,103 | 30.4 | (29.6–31.1) | 37,813 | 42.6 | (41.7–43.4) |
| Race4 | |||||||||
| White | 55,139 | 21.0 | (20.5–21.6) | 55,170 | 33.6 | (33.0–34.3) | 54,804 | 44.2 | (3.5–44.9) |
| Black | 4,075 | 20.7 | (18.8–22.6) | 4,046 | 32.6 | (30.3–34.9) | 4,020 | 43.3 | (40.9–45.7) |
| Asian/Pacific Islander | 739 | 10.3 | (6.9–13.6) | 739 | 35.4 | (28.4–42.5) | 735 | 40.1 | (33.3–46.9) |
| American Indian/ Alaska Native | 725 | 18.2 | (12.7–23.7) | 725 | 36.0 | (29.4–42.5) | 723 | 43.0 | (36.5–49.6 |
| Spanish or Hispanic origin | |||||||||
| Yes | 3,664 | 11.2 | (9.4–12.9) | 3,667 | 28.6 | (25.6–31.5) | 3,635 | 33.9 | (30.9–37.0) |
| No | 57,993 | 21.4 | (20.9–21.9) | 57,999 | 34.0 | (33.4–34.6) | 57,620 | 44.8 | (44.1–45.5) |
| Age (group) | |||||||||
| 50–59 years | 23,758 | 15.5 | (14.7–16.2) | 23,803 | 26.1 | (25.1–27.0) | 23,667 | 34.7 | (33.7–35.7) |
| 60–69 years | 17,680 | 23.0 | (22.0–24.0) | 17,651 | 36.9 | (35.7–38.1) | 17,574 | 48.1 | (46.9–49.3) |
| 70–79 years | 14,427 | 25.8 | (24.6–27.0) | 14,412 | 40.7 | (39.3–42.1) | 14,306 | 52.7 | (51.4–54.1) |
| ≤80 years | 6,087 | 21.6 | (19.8–23.4) | 6,087 | 36.1 | (34.0–38.2) | 5,990 | 46.9 | (44.7–49.1) |
| Education | |||||||||
| < 12 years | 11,928 | 15.0 | (13.8–16.1) | 11,889 | 27.5 | (25.9–29.1) | 11,756 | 35.6 | (33.9–37.3) |
| High school graduate | 21,183 | 19.7 | (18.8–20.6) | 21,176 | 30.6 | (29.6–31.6) | 21,049 | 41.2 | (40.1–42.3) |
| Some college/ technical school | 14,167 | 23.5 | (22.3–24.7) | 14,162 | 35.9 | (34.6–37.3) | 14,102 | 47.9 | (46.5–49.2) |
| College graduate | 14,503 | 24.3 | (23.2–25.5) | 14,560 | 41.1 | (39.8–42.5) | 14,466 | 51.4 | (50.1–52.7) |
| Income (annual household) | |||||||||
| <$20,000 | 15,204 | 15.3 | (14.3–16.3) | 15,154 | 29.1 | (27.7–30.5) | 15,029 | 37.0 | (35.5–38.4) |
| $20,000–34,999 | 14,354 | 20.8 | (19.7–21.9) | 14,362 | 32.5 | (31.2–33.8) | 14,288 | 43.0 | (41.7–44.4) |
| $35,000–49,999 | 7,721 | 23.3 | (21.6–24.9) | 7,718 | 37.0 | (35.1–39.0) | 7,703 | 48.2 | (46.3–50.1) |
| ≥$50,000 | 11,967 | 24.2 | (22.7–25.6) | 12,002 | 41.7 | (39.9–43.4) | 11,949 | 51.7 | (50.0–53.5) |
| Health care coverage | |||||||||
| Yes | 57,551 | 21.3 | (20.8–21.9) | 57,561 | 34.7 | (34.1–35.4) | 57,169 | 45.4 | (44.7–46.1) |
| No | 4,331 | 12.1 | (9.8–14.5) | 4,326 | 18.7 | (15.6–21.7) | 4,304 | 25.7 | (22.2–29.2) |
| 1From the Behavioral Risk Factor Surveillance System (BRFSS), 1999; estimates are age-adjusted. | |||||||||
| 2Sample size for each question; sample sizes may not sum to totals because of missing data. | |||||||||
| 3Confidence interval. | |||||||||
| 4Sample sizes for racial categories do not add up to column totals. “Other” racial category not presented here. | |||||||||
FIGURE
Comparison of use of colorectal cancer screening tests with other screening tests, BRFSS 1999
Discussion
Currently, 4 widely accepted tests are available for CRC screening, and several new tests are under investigation.16,17 Not enough evidence exists to determine which of the available tests is most appropriate when efficacy, cost-effectiveness, availability, patient acceptability, and safety are taken into consideration. The 1999 BRFSS monitored the use of 3 of these tests: FOBT and sigmoidoscopy or colonoscopy. Our results show that less than half of the US population aged 50 years and older is being screened for CRC with these methods. Persons with health care coverage and with higher education and income levels were more likely to have had CRC tests. Since 1997, the proportion of the U.S. population being screened for CRC has increased slightly, but it remains low and lags far behind the use of other recommended cancer screening tests (Figure). While use of barium enema, one of the recommended colorectal cancer screening tests, is not monitored in the 1999 BRFSS, data from a recent national primary care physician survey suggest that barium enemas are infrequently recommended for colorectal cancer screening (Carrie Klabunde, National Cancer Institute, personal/written communication, 2002).
The 1999 BRFSS was the first BRFSS survey to collect data on the use of colonoscopy. Because BRFSS colonoscopy data have not previously been collected, we do not know whether the reported increase in the use of endoscopy from 1997 to 1999 represents a true increase in sigmoidoscopy usage or previously unmeasured colonoscopy usage. Furthermore, it is likely that some of the tests reported as sigmoidoscopies or proctoscopies in the 1997 BRFSS survey were actually colonoscopies, since some respondents may be unable to clearly distinguish between the endoscopic tests.
Both patient-related and physician-related factors likely contribute to continued underuse of these tests. Patient-related factors include lack of awareness of screening guidelines, embarrassment, and lack of physician recommendation.7,18-20 Physician-related factors include lack of knowledge of the effectiveness of screening, lack of skills in endoscopy, and low reimbursement rates for screening tests.7,18-21
Several factors limit the interpretation of this analysis. First, as this is a telephone survey, only people who have access to telephones are represented in this analysis. However, approximately 95% of households in the United States have telephones.22 Second, 43.3% of the eligible respondents who were successfully contacted did not complete the telephone interview. Third, responses are self-reported and not validated through medical record review. However, a comparison of self-report and record review has found good concordance between results.23 Fourth, in the 1999 BRFSS, sigmoidoscopy use cannot be measured separately from colonoscopy, and screening tests cannot be distinguished from diagnostic tests. The results reported here may therefore be overestimates of use of these tests for screening. Lastly, the specialty of the physicians ordering the tests is unknown, limiting the ability to target interventions towards specific physician specialists. Despite these limitations, the BRFSS provides an excellent data source for routine surveillance of CRC testing.
Conclusion
This report demonstrates that CRC screening tests remain underused, despite their recognized efficacy in reducing CRC incidence and mortality.2-8 Coordinated efforts by clinicians and policy makers to raise awareness about this important disease and promote use of available screening tests must continue.
CORRESPONDENCE
Epidemiology and Health Services Research Branch, Division of Cancer Prevention and Control, Centers for Disease Control and Prevention, Atlanta, GA. Data from this paper were presented at CDC’s 15th National Conference on Chronic Disease Prevention and Control on November 30, 2000. Send correspondence and reprint requests to: Laura C. Seeff, MD; Centers for Disease Control and Prevention, DCPC; 4770 Buford Highway NE; Mailstop K-55; Atlanta, Georgia 30341-3717. E-mail: [email protected].
1. American Cancer Society. Cancer facts and figures, 2002. Atlanta: American Cancer Society, Inc., 2002. Publication 02-250M-No. 5008.02.
2. Mandel JS, Church TR, Bond JH, et al. The effect of fecal occultblood screening on the incidence of colorectal cancer. N Engl J Med 2000;343:1603-7.
3. Mandel JS, Bond JH, Church TR, et al. Reducing mortality from col-orectal cancer by screening for fecal occult blood. N Engl J Med 1993;328:1365-71.
4. Selby JV, Friedman GD, Quesenberry CP, Jr, Weiss NS. A case-con-trol study of screening sigmoidoscopy and mortality from colorec-tal cancer. N Engl J Med 1992;326:653-7.
5. Newcomb PA, Norfleet RG, Storer BE, Surawicz TS, Marcus PM. Screening sigmoidoscopy and colorectal cancer mortality. J Natl Cancer Inst 1992;84:1572-5.
6. Hardcastle JD, Chamberlain JO, Robinson MH, et al. Randomised controlled trial of faecal-occult-blood screening for colorectal cancer. Lancet 1996;348:1472-1477.
7. Kronborg O, Fenger C, Olsen J, Jorgensen OD. Sondergaard. Randomised study of screening for colorectal cancer with faecal-occult-blood test. Lancet 1996;348:1467-1.
8. Mandel JS, Church TR, Ederer F, Bond JH. Colorectal cancer mortality: Effectiveness of biennial screening for fecal occult blood. J Natl Cancer Inst 1999;91:434-7.
9. U.S.Preventive Services Task Force. Guide to clinical preventive services. 2nd ed. Baltimore: Williams and Wilkins, 1996.
10. Winawer SJ, Fletcher RH, Miller L, et al. Colorectal cancer screening: clinical guidelines and rationale. Gastroenterology 1997;112:594-642.
11. Smith RA, von Eschenbach AC, Wender R, et al. American Cancer Society guidelines for the early detection of cancer: update of early detection guidelines for prostate, colorectal, and endometrial cancers. CA Cancer J Clin 2001;51:38-75.
12. Shapiro JA, Seeff LC, Nadel MR. Colorectal cancer-screening tests and associated health behaviors. Am J Prev Med 2001;21:132-7.
13. SAS statistical analysis software. Cary, NC: SAS Institute, 1996.
14. SUDAAN software for the statistical analysis of correlated data. Research Triangle Park, NC: Research Triangle Institute, 1997.
15. Centers for Disease Control and Prevention. Behavioral Risk Factor Surveillance System, 1999. BRFSS Summary Quality Control Report. Atlanta: National Center for Chronic Disease Prevention and Health Promotion, Centers for Disease Control and Prevention, U.S. Department of Health and Human Services, 1999.
16. Fenlon HM, Nunes DP, Schroy PC, III, Barish MA, Clarke PD, Ferrucci JT. A comparison of virtual and conventional colonoscopy for the detection of colorectal polyps. N Engl J Med 1999;341:1496-503.
17. Ahlquist DA, Skoletsky JE, Boynton KA, et al. Colorectal cancer screening by detection of altered DNA in stool: feasibility of a mul-titarget assay panel. Gastroenterology 2000;119:1219-27.
18. Vernon SW. Participation in colorectal cancer screening: A review. J Natl Cancer Inst 1997;89:1406-22.
19. Peterson SK, Vernon SW. A review of patient and physician adherence to colorectal cancer screening guidelines. Semin Colon Rectal Surg 2000;11:58-72.
20. McCarthy BD, Moskowitz MA. Screening flexible sigmoidoscopy: patient attitudes and compliance. J Gen Intern Med. 1993;8:120-5.
21. Lewis JD, Asch DA. Barriers to office-based screening sigmoi-doscopy: does reimbursement cover costs? Ann Intern Med 1999;130:525-30.
22. Anderson JE, Nelson DE, Wilson RW. Telephone coverage and measurement of health risk indicators: data from the National Health Interview Survey. Am J Public Health 1998;88:1392-5.
23. Baier M, Calonge N, Cutter G, et al. Validity of self-reported col-orectal cancer screening behavior. Cancer Epidemiol Biomarkers Prev 2000;9:229-32.
Retinoic Acid Receptors and Topical Acne Therapy: Establishing the Link Between Gene Expression and Drug Efficacy
Dementia: Predictors of diagnostic accuracy and the contribution of diagnostic recommendations
- Activities of daily living dependency and a longer time since the onset of symptoms are associated with a diagnosis of dementia, whereas somatic comorbidity is associated with the absence of dementia.
- Family physicians should be aware of diagnostic difficulties in patients with somatic comorbidity.
- We were unable to confirm the diagnostic value of the recommended dementia guidelines.
Some authors have hypothesized that the continuity of care typical of family practice is an important tool for family physicians to recognize cognitive and behavioral changes in their patients.8 The finding of a positive association between the number of previous contacts with the patient and the family physician’s diagnostic accuracy supports this assertion.1 The family physicians’ accuracy is also positively associated with the severity of the dementia.1,3,9 However, 2 intervention studies that tried to improve the family physicians’ diagnostic accuracy were inconclusive.10,11 Although family physicians may be hesitant to communicate a diagnosis of dementia to patients and their relatives,12 an early and accurate diagnosis is important for a number of reasons. First, explaining the diagnosis enables the patient and relatives to better understand and deal with changed behavior.13,14 Second, realizing the progressive nature of the condition permits patients and relatives to prepare for future care planning and allows support for the often severely burdened caregivers.15,16 Third, dementia patients with Alzheimer’s disease may benefit from anti-Alzheimer drugs.17,18 Therefore, the aim of this study was to quantify the relative contribution of guideline recommendations and other diagnostic determinants in the family physicians’ work-up of patients suspected of having dementia.
Method
Subjects and design
All 250 family physicians from an eastern district in the Netherlands (Nijmegen) were approached by mail to participate in a prospective dementia case-finding study. Of these, 64 family physicians participated. The main reasons for not participating were limited time, having a young practice population, or having no interest in the subject. During consultations or home visits the family physicians assessed patients newly suspected of having dementia using the dementia guideline of the Dutch College of General Practice (DCGP).5,19 Suspicion of dementia was defined by 2 criteria: age 55 years or older and presence of signs of cognitive impairment that had not yet been evaluated. These signs included memory complaints, worsening orientation, or behavioral changes and could be reported by patients or family members or observed by the family physician. After the family physicians’ assessment using the Dutch guideline, all patients with suspected dementia were referred to the outpatient memory clinic of the Academic Medical Center of Nijmegen. Their evaluation served as the diagnostic reference standard. The Medical Ethics Committee of the University Medical Center St Radboud in Nijmegen approved of the study and informed consent of patients was sought by the family physician. A few patients were not able to reproduce basic information about the study, in which case informed consent was sought from their principal caregiver.
Dementia guideline
The DCGP dementia guideline is a national, evidence-based guideline for the diagnosis of dementia (Table 1). It contains diagnostic criteria of the Diagnostic Statistical Manual, 3rd edition, revised (DSM-III-R)20 and includes assessment of cognitive, physical, and activities of daily living (ADL) functioning. A cognitive screening test such as the Mini-Mental State Examination (MMSE) is optional. Instead, the dementia guideline includes a brief assessment of 11 cognitive functions that correspond to the DSM-III-R criteria (long- and short-term memory; orientation to time, place, and person; gnosis; praxis; language ability; judgment; personality changes; and abstraction), and indications on how to assess these functions. In Table 1 the recommendations of the DCGP guideline are compared with the dementia guideline of the Veterans Affairs (VA) and of the Agency for Health Care Policy and Research (AHCPR). These 2 guidelines are constructed for use in primary care as well. The DCGP guideline closely resembles the VA and AHCPR guidelines with some exceptions.21 Results about the applicability of the Dutch dementia guideline to practice were recently published.22
TABLE 1
Comparison of recommendations in 3 dementia guidelines
| Dutch guideline | AHCPR | VA | |
|---|---|---|---|
| History assessment | |||
| Presenting problem | R | R | R |
| Past medical history | R | R | R |
| Medication use | R | R | R |
| Drug/alcohol use | R | R | R |
| Family medical history | R | R | R |
| Personality change | R | — | R |
| Report of daily activities | R | — | R |
| Suicidality | — | — | (R) |
| Clinical examination | |||
| Physical | R | R | R |
| Neurologic | R | R | R |
| Sensory | R | R | R |
| Cognitive status | R | R | R |
| Speech/language | R | — | — |
| Depression | R | R | R |
| Delirium | R | R | R |
| Neuropsychological testing | T | T | T |
| Hachinski score | — | — | — |
| Psychiatric assessment | — | — | R |
| Psychotic symptoms | — | — | R |
| Standardized functional assessment | — | R | Opt |
| Additional tests | |||
| Hematology (Hgb, HCT, MCV, ESR) | R | R | R |
| Biochemistry (glucose, creatine, thyroid function) | R | R | R |
| Kalium | T | R | R |
| Liver function (ALAT) | T | R | R |
| Liver function specific (GGT) | T | R | R |
| Vitamin B12 | T | — | — |
| Folate acid | T | R | — |
| Brain scanning | Opt | Opt | T |
| Human immunodeficiency virus | — | T | T |
| Toxicology screen | — | T | T |
| Urinalysis | — | R | — |
| Drug concentrations | — | — | — |
| Albumin | — | — | — |
| Cerebrospinal fluid analysis | — | T | T |
| Electrocardiogram | — | R | — |
| Electroencephalogram | — | T | T |
| Chest x-ray | — | R | — |
| Specialist consultation and/or referral | Doubt about dementia or its cause | with mixed results | — |
| AHCPR, Agency for Health Care Policy and Research; ALAT, alanine aminotransferase; ESR, erythrocyte sedimentation rate; GGT, gamma-glutamyltransferase; HCT, hematocrit; Hgb, hemoglobin; MCV, mean corpuscular volume; Opt, optional; R, recommendation; (R), implied recommendation; T, targeted; VA, US Department of Veterans Affairs. | |||
Measurements
For every patient suspected of having dementia based on the DCGP guideline, the family physicians recorded their assessment findings, whether a close relative was available, the presence of dementia (yes, no, unsure), the final diagnosis, the number of contacts needed, and their actions taken to reach the diagnosis. Assessment of cognitive functions, behavioral changes, and somatic comorbidity were scored trichotomously: normal, unsure, or impaired. The level of ADL dependency of a patient was scored on a 4-point Likert scale ranging from independent to severely dependent. For cognitive disorders, behavioral changes, and comorbidity, sum scores were computed to reduce the number of variables. A sum score of 11 variables was made for cognitive disorders (Cronbach’s a = 0.75): long- and short-term memory; orientation to time, person and place; praxis; gnosis; language ability; abstraction; judgment; and personality changes. A sum score of 6 variables was made for behavioral changes (Cronbach’s a = 0.65): aggression, apathy, restlessness, denial, depression, and incontinence. Finally, a sum score of 5 variables was made for comorbidity (Cronbach’s a = 0.78): internal (medical) dysfunction, neurologic dysfunction, sensory impairment, adverse effects, and drug intoxication.
A sum score was made of the number of recommendations made from a list of 31 possible recommendations (Cronbach’s a = 0.76). Two indicators for continuity of care, namely, the length and familiarity of the family physician–patient relationship, were recorded by the family physician on a 4-point Likert scale.
DSM-III-R diagnoses
In addition to the diagnosis by the family physician, we also determined the diagnosis based on the DSM-III-R criteria. The findings recorded by the family physician were applied independently by 2 researchers blinded to the DSM-III-R criteria. Differences were discussed and consensus was reached in all cases.
Reference standard: memory clinic
An experienced multidisciplinary team that included a geriatrician, a neurologist, and a psychologist assessed the presence of dementia in all suspected referred patients. The memory clinic’s team was blinded to the family physicians’ and DSM-III-R diagnoses. To this aim, the CAMDEX (Cambridge Mental Disorders of the Elderly Examination)23 and the criteria of the DSM-IV were used.24 Studies on diagnostic accuracy of memory clinic teams compared with postmortem diagnostics show high levels of accuracy (80%–90% of diagnostic agreement).25,26 To our knowledge, the inter- or intraobserver reliability of memory clinic diagnoses has not been studied. The assessment, interpretation, and communication of the results took approximately 4.5 hours spread over 3 visits.
Statistical analyses
The accuracy of the family physicians’ diagnoses and DSM-III-R diagnoses in comparison with the memory clinic diagnosis (reference standard) was estimated using the sensitivity, specificity, positive and negative predictive values, and likelihood ratios. Univariate logistic regression analyses were used to quantify the association of clinical and sociodemographic characteristics, continuity of care, and performance indicators with the presence and absence of dementia. All determinants with P 27-30 The overall model was then reduced by excluding variables with P > .05 to obtain a simpler diagnostic model. The reliability of the overall and reduced diagnostic model was assessed by using the Hosmer and Lemeshow test.27
The ability of the overall and reduced model to discriminate between patients with and without dementia was quantified using the area under the receiver-operating curve (ROC area).31 The area under the ROC curve is a measure of the ability of a test to discriminate between patients with and without a disease, and can range from 0.5 (no discrimination, like flipping a coin) to 1.0 (perfect discrimination). A value between 0.7 and 0.8 is considered to represent reasonable discrimination, and a value of more than 0.8 is good discrimination.32 Differences in diagnostic discriminative value between different models and variables were estimated by comparing ROC areas, taking into account the correlation between models as they were based on the same cases.33 To perform these analyses, the family physicians’ diagnoses had to be dichotomized intodementia present and absent. We chose to classify the 8 cases with family physicians’ diagnoses “unsure” as dementia absent, as the DCGP guideline recommends a reluctant policy in such cases. We performed a sensitivity analysis to check whether the classification of these 8 cases as “dementia present” would have resulted in different findings.
Results
Patients and family physicians
Over 16 months, 64 family physicians enrolled 107 patients suspected of having dementia, a mean of 1.7 patients per family physician. The participating family physicians were aged an average of 47 (SD = 7) years old and handling a practice population of 2113 (SD = 600) patients. Their characteristics were comparable to other Dutch family physicians except that they included fewer solo practitioners (32% versus 49% nationwide) and slightly more female family physicians (21% females versus 17% nationwide).34 Both the family physicians and the memory clinic completed the diagnostic evaluation for 93 patients: 14 patients dropped out because of refusal (n = 9), medical complications (n = 3), or death (n = 2). The clinical and demographic characteristics of these 14 patients were comparable to those of the 93 completed patients. Of the 93 patients, 93% lived independently and 62% were married. Other demographic characteristics are shown in Table 4. For 22 patients no informant was available (23.6%). The available informants were partners (77%), children or stepchildren (19%), or friends, neighbors, and others (4%). Of the informants, 67% were female and 66% shared a household with the patient.
A mean of 26 of the 31 recommendations (84%) was applied for each patient (SD = 3.3; range, 15–30). The family physicians needed on average 3.6 (SD = 3.3) contacts to assess a patient, and 40% received a home visit. Most patients were well known to the family physician; only 18% were not at all or only somewhat familiar. The MMSE was used as a diagnostic tool for only 19%. The mean time between the last assessment contact of the patient with the family physician and the first visit at the memory clinic was 61 days (SD = 39). The mean duration of the symptoms before the assessment was 22 months (SD = 13).
Diagnostic accuracy
Table 3 shows the accuracy of the family physicians’ and the DSM-III-R diagnoses compared with the memory clinic diagnoses. The prior probability of dementia was 63.4% (59/93). A positive diagnosis by the family physician increased the probability (positive predictive value) to 80.3%, and a negative diagnosis decreased this probability to 31.2% (10/32). The positive and negative predictive values of the DSM-III-R criteria were much lower (Table 2).
The 9 patients classified unsure by the family physicians were diagnosed by the memory clinic team as having amnestic syndrome (n = 3), dementia (n = 2), delirium (n = 1), age-dependent cognitive decline (n = 1), depression (n = 1), and unavailable (n = 1). Of the 12 patients with a false-positive diagnosis, 6 showed cognitive impairment, but did not fulfill all diagnostic criteria of dementia, and 1 patient received a diagnosis of depression. Of the 8 patients with false-negative findings, 6 had Alzheimer’s disease, 1 had dementia with unknown cause, and 1 had a normal pressure hydrocephalus. The family physicians expressed diagnostic confidence in 59% of all cases and in 47% of the patients diagnosed with Alzheimer’s disease.
Classification of the 8 patients labeled “unsure” as “dementia present” or “dementia not present” led to only small differences in the positive and negative predictive values (Table 2).
TABLE 2
Dementia diagnoses of family physicians and DSM-III-R compared with the memory clinic team (reference test)
| Reference test | |||||||||
|---|---|---|---|---|---|---|---|---|---|
| Dementia (n = 59) | No dementia (n = 34) | Total | PPV | NPV | SE | SP | LR+ | LR– | |
| Family physician diagnosis | |||||||||
| Dementia | 49 | 12 | 61 | 0.80* | 0.69* | 0.85* | 0.65* | 2.43* | 0.23 |
| Unsure | 2 | 6 | 8 | ||||||
| No dementia | 8 | 16 | 24 | 0.74† | 0.66† | 0.86† | 0.47† | 1.62† | 0.30† |
| DSM-III-R criteria‡ | |||||||||
| Dementia | 13 | 8 | 21 | 0.62 | 0.36 | 0.22 | 0.76 | 0.92 | 1.03 |
| No dementia | 46 | 26 | 72 | ||||||
| *Dichotomizing the family physicians’ diagnoses by grouping the unsure to the category “no dementia.” | |||||||||
| †Dichotomizing the family physicians’ diagnoses by grouping the unsure to the category “dementia.” | |||||||||
| ‡The registered symptoms were integrated by the researchers according to the DSM-III-R criteria. | |||||||||
| LR+, positive likelihood ratio; LR–, negative likelihood ratio; NPV, negative predictive value; PPV, positive predictive value; SE, sensitivity; SP, specificity. | |||||||||
Univariate associations of each documented variable by the family physicians
| Dementia | ||||
|---|---|---|---|---|
| Absent | Present | OR (95%CI) | P | |
| Clinical findings by family physician | ||||
| Cognitive symptoms | ||||
| (0–12), mean (SD) | 7.6 (5.2) | 9.8 (4.6) | 1.13 (1.03–1.24) | .01* |
| ADL dependency, % | 25 | 75 | 3.53 (1.46–8.56) | .01* |
| Somatic comorbidity, % † | 88 | 67 | 0.27(0.08–0.89) | .03* |
| Blood abnormality, % ‡ | 21 | 42 | 2.84 (1.07–7.55) | .04* |
| Behavioral changes, % | 41 | 68 | 0.74 (0.54–1.02) | .07* |
| Duration of symptoms, years (SD) | 1.5 (0.8) | 1.9 (1.0) | 1.77 (1.07–2.94) | .03* |
| Family physicians’ performance | ||||
| Number of consultations, mean (SD) | 3.9 (3.4) | 3.5 (3.6) | 0.97 (0.86–1.09) | .60 |
| Home visit, % | 35 | 43 | 1.39 (0.58–3.33) | .46 |
| Recommendations applied, mean (SD) | 24.5 (3.4) | 25.0 (3.7) | 1.04 (0.92–1.17) | .57 |
| MMSE used, % | 21 | 15 | 0.69 (0.23–2.07) | .51 |
| Informant contacted, % | 65 | 83 | 2.67 (1.01–7.11) | .05* |
| Familiar with patient, % | 79 | 84 | 1.41 (0.47–4.21) | .54 |
| Family physician–patient relation, >5 years, % | 65 | 75 | 0.60 (0.24–1.50) | .27 |
| Patient characteristics | ||||
| Mean age, years (SD) | 73 (8.7) | 74.3 (6.3) | 1.03 (0.97–1.09) | .41 |
| Male sex, % | 44 | 44 | 1.00 (0.42–2.34) | .99 |
| n = 93. Values are in means (SD) or percentages. | ||||
| *P | ||||
| † Sensory impairment, internal dysfunction; neurologic dysfunction; intoxication; adverse drug effect, sum score of dichotomous items. | ||||
| ‡ Hematology (hemoglobin; hematocrit; mean cell count; erythrocyte sedimentation rate); biochemistry (glucose; creatine; thyroid function), sumscore of dichotomous items. | ||||
| ADL, activities of daily living, 1 question scored on a 4-point scale; CI, confidence interval; MMSE, Mini-Mental State Examination; OR, odds ratio. | ||||
TABLE 4
Multivariate associations between predictors of accurate dementia diagnoses by family physicians and the reference standard memory clinic team diagnosis
| Adjusted odds ratio (95% CI) | P | |
|---|---|---|
| ADL dependency, score1–4 | 5.35 (2.00–13.9) | .0212 |
| Years since symptoms started | 1.84 (1.08–3.14) | .026 |
| Somatic comorbidity present | 0.48 (0.25–0.89) | .006 |
| n = 93. | ||
| ADL, activities of daily living (1 = independent to 4 = fully dependent); CI = confidence interval. | ||
Predictors of presence/absence of dementia
The univariate analyses revealed that informant availability, years of education, sex of the family physician, number of cognitive symptoms, ADL dependency, somatic comorbidity, blood abnormality, behavioral changes, and duration and severity of the symptoms were associated with the presence or absence of dementia (Table 3). Neither the number of applied recommendations nor the use of the MMSE was related to the presence or absence of dementia.
The multivariate logistic regression model (Table 5) revealed that ADL dependency (OR = 5.28, P = .001) and time since the first symptoms started (OR per year =1.84, P = .026) independently predicted the presence of dementia, whereas somatic comorbidity predicted the absence of dementia (OR = 0.48, P = .021).
The ROC area of the model with all 9 significant univariate variables from Table 4 was 0.86 (95% confidence interval [CI], 0.77–0.94). Reduction of the model to the 3 significant multivariate variables (ADL, time since the first symptoms were noticed, and somatic comorbidity) resulted in an ROC area of 0.79 (95% CI, 0.70–0.88). The family physicians’ global diagnosis had an ROC area of 0.74 (95% CI, 0.63–0.85). Finally, the ROC area of the expected DSM-III-R diagnosis was only 0.50 (95% CI, 0.37–0.62).
Discussion
The family physicians’ diagnosis based on their assessment of all available information was reasonably accurate. Formal DSM-III-R diagnoses, derived by integrating the recorded symptoms, resulted in poor accuracy. Degree of ADL functioning, the duration of symptoms, and the presence of somatic comorbidity independently contributed to the prediction of presence or absence of dementia. Neither the number of diagnostic recommendations made nor the use of the MMSE added to the family physicians’ accuracy. The latter is rather disappointing news for makers of all 3 dementia guidelines. Many of the current diagnostic recommendations in the dementia guidelines are based at best on lower quality evidence from observational studies. Trials are lacking in which diagnostic interventions by family physicians are tested against usual diagnostics.
It was remarkable that neither the core symptoms of dementia (cognitive impairment) nor the DSM criteria added to the diagnostic accuracy. Our findings raise the question of how family physicians made their diagnoses. In this respect, the concept of illness scripts (also called pattern recognition) may be helpful to understand how clinicians make diagnostic decisions.35 According to this concept, clinicians base their decisions more on accumulated clinical patient pictures during their medical career or so-called illness scripts than on medical-deductive reasoning, which is taught in medical schools and offered in evidence-based guidelines.36 The illness scripts family physicians have of suspected dementia patients may be triggered more by ADL malfunctioning than by cognitive dysfunction.
When the time effort per patient of the family physicians and the memory clinic is compared, the family physicians performed well. The family physicians invested on average 3.5 consultations per patient. Multiplied by the average consultation time of 10 minutes in Dutch family practices, this yields a total consultation time of 35 minutes per patient to arrive at a diagnosis. This time should be compared with the 4.5 hours needed per patient for high-tech diagnostic assessment at the memory clinic. Taking the limited time and low-tech approach into account, it must be concluded that the family physicians did a fair job in diagnosing suspected patients.
We did not confirm the hypothesis that continuity of care enhanced diagnostic accuracy. In contrast to the finding of Eefsting and colleagues,1 the number of contacts with a patient showed a trend toward a negative association with diagnostic accuracy. A possible explanation is that only contacts related to the evaluation of dementia were recorded in our study; a larger number of contacts may therefore reflect a family physicians’ diagnostic difficulty or uncertainty rather than better continuity of care.
Strengths of our study include the detailed information from the family physician assessments, the primary care setting, and the use of a memory clinic as the reference standard. A limitation was that the diagnostic criteria of the family physicians’ guideline were based on the DSM-III-R, whereas the memory clinic used the DSM-IV criteria.20,24 Nevertheless, this difference may have accounted for the diagnostic variation only to a small degree.37 Second, the finding that additional value was not found for use of the MMSE or for a more frequent use of recommendations might be explained by the fact that the family physicians in this study already applied the recommendations on a large scale. Higher use, therefore, did not add much to the diagnostic accuracy of the family physicians. Third, concerning the importance of the availability of an informant, the kind of information the family physicians received from these informants remains unclear, as the content of the informant interview was neither standardized nor registered. Fourth, few patients per family physician were included. The numbers of included patients per family physician, however, are only a little below the incidence figures for dementia in the Netherlands.38 Anecdotal reactions from the participating family physicians revealed that some patients were not included because they did not want medical interference and some were unable to travel to the memory clinic. Finally, we modeled various predictors to estimate the presence or absence of dementia and derived a reduced model. In this modeling we did not adjust for overfitting and did not prospectively validate the model. This tactic was necessary given the relatively small number of subjects in the study.28 Therefore, before our reduced prediction model can be used in medical practice it should first be validated on new patients.
1. Eefsting JA, Boersma F, Van den Brink W, Van Tilburg W. Differences in prevalence of dementia based on community survey and general practitioner recognition. Psychol Med 1996;26:1223-30.
2. O’Connor DW, Pollitt PA, Hyde JB, Brook CP, Reiss BB, Roth M. Do general practitioners miss dementia in elderly patients? BMJ 1988;297:1107-10.
3. Valcour VG, Masaki KH, Curb JD, Blanchette PL. The detection of dementia in the primary care setting. Arch Intern Med 2000;160:2964-8.
4. Verhey FR, Jolles J, Ponds RW, et al. Diagnosing dementia: a comparison between a monodisciplinary and a multidisciplinary approach. J Neuropsychiatry Clin Neurosci 1993;5:78-85.
5. Wind A, Muskens J, De Bruyne G, et al. NHG standaard M21 Dementie [Dutch dementia guideline]. Utrecht, The Netherlands: Nederlands Huisartsen Genootschap; 1999.
6. Eccles M, Clarke J, Livingstone M, Freemantle N, Mason J. North of England evidence based guidelines development project: guideline for primary care management of dementia. BMJ 1998;317:802-8.
7. Rose VL. Consensus statement focuses on diagnosis and treatment of Alzheimer’s disease and related disorders in primary care. Am Fam Physician 1998;57:1431-2.
8. Wind AW, Van Staveren G, Schellevis FG, et al. The validity of the judgement of general practitioners on dementia. Int J Geriatr Psychiatry 1994;9:543-9.
9. Cooper B, Bickel H, Schäufele M. The ability of general practitioners to detect dementia and cognitive impairment in their elderly patients: a study in Mannheim. Int J Geriatr Psychiatry 1992;7:591-8.
10. Pond CD, Mant A, Kehoe L, Hewitt H, Brodaty H. General practitioner diagnosis of depression and dementia in the elderly: can academic detailing make a difference? Fam Pract 1994;11:141-7.
11. O’Connor DW, Fertig A, Grande MJ, et al. Dementia in general practice: the practical consequences of a more positive approach to diagnosis. Br J Gen Pract 1993;43:185-8.
12. van Hout H, Vernooij-Dassen M, Bakker K, Blom M, Grol R. General practitioners on dementia: tasks, practices and obstacles. Patient Educ Couns 2000;39:219-25.
13. Colerick EJ, George LK. Predictors of institutionalization among caregivers of patients with Alzheimer’s disease. J Am Geriatr Soc 1986;34:493-8.
14. Vernooij-Dassen MJFJ, Persoon JMG, Felling AJA. Predictors of sense of competence in caregivers of demented persons. Soc Sci Med 1996;43:41-9.
15. McCurry S, Teri L. Advance planning for dementia caregivers. J Am Geriatr Soc 1997;45:1102-3.
16. Droës R. Psychosocial treatment for demented patients: overview of methods and effects. In: Miesen B, Jones G, Eds. Care-Giving in Dementia, Research and Applications. London: Routledge; 1997;127-48.
17. Rösler M, Anand R, Cicin-Sain A, et al. Efficacy and safety of rivastigmine in patients with Alzheimer’s disease: international randomised controlled trial. BMJ 1999;318:633-8.
18. Rogers SL, Farlow MR, Doody RS, Mohs R, Friedhoff LT. A 24-week, double-blind, placebo-controlled trial of donepezil in patients with Alzheimer’s disease. Donepezil Study Group. Neurology 1998;50:136-45.
19. De Bruyne GM, Meyboom-de Jong B, Muskens JB, et al. De NHG-standaard dementiesyndroom [Guideline on dementia of the Dutch College of General Practitioners]. Huisarts & Wetenschap 1991;34:598-607.
20. Diagnostic and Statistical Manual of Mental Disorders. 3rd ed rev. Washington, DC: American Psychiatric Association; 1987.
21. Beck C, Cody M, Souder E, Zhang M, Small GW. Dementia diagnostic guidelines: methodologies, results, and implementation costs. J Am Geriatr Soc 2000;48:1195-203.
22. Van Hout H, Vernooij-Dassen M, Poels P, Hoefnagels W, Grol R. Applicability of diagnostic recommendations on dementia in family practice. Int J Qual Health Care 2001;13:127-33.
23. Roth M, Tym E, Mountjoy CQ, et al. CAMDEX, a standardised instrument for the diagnosis of mental disorder in the elderly with special reference to the early detection of dementia. Br J Psychiatry 1986;149:698-709.
24. Diagnostic and Statistical Manual of Mental Disorders. 4th ed. Washington, DC: American Psychiatric Association; 1994.
25. Mendez MF, Mastri AR, Sung JH, Frey WH, 2nd. Clinically diagnosed Alzheimer disease: neuropathologic findings in 650 cases. Alzheimer Dis Assoc Disord 1992;6:35-43.
26. Rasmusson DX, Brandt J, Steele C, Hedreen JC, Troncoso JC, Folstein MF. Accuracy of clinical diagnosis of Alzheimer disease and clinical features of patients with non-Alzheimer disease neuropathology. Alzheimer Dis Assoc Disord 1996;10:180-8.
27. Hosmer D, Lemeshow S. Applied Logistic Regression. New York: Wiley; 1989.
28. Harrell FE, Jr, Lee KL, Mark DB. Multivariable prognostic models: issues in developing models, evaluating assumptions and adequacy, and measuring and reducing errors. Stat Med 1996;15:361-87.
29. Moons KG, Stijnen T, Michel BC, et al. Application of treatment thresholds to diagnostic-test evaluation: an alternative to the comparison of areas under receiver operating characteristic curves. Med Decis Making 1997;17:447-54.
30. Moons KG, van Es GA, Michel BC, Buller HR, Habbema JD, Grobbee DE. Redundancy of single diagnostic test evaluation. Epidemiology 1999;10:276-81.
31. Hanley J, McNeil B. The meaning and use of the area under the receiver operating characteristic (ROC) curve. Radiology 1982;143:29-36.
32. Murphy JM, Berwick DM, Weinstein MC, Borus JF, Budman SH, Klerman GL. Performance of screening and diagnostic tests. Application of receiver operating characteristic analysis. Arch Gen Psychiatry 1987;44:550-5.
33. Hanley JA, McNeil BJ. A method of comparing the areas under receiver operating characteristic curves derived from the same cases. Radiology 1983;148:839-43.
34. Harmsen J, Hingstman L. Cijfers uit de registratie van huisartsen, peiling 1996 [Numbers of the registration of General Practitioners in the Netherlands]. Utrecht, The Netherlands: NIVEL; 1996 November.
35. Schmidt HG, Norman GR, Boshuizen HPA. A cognitive perspective on medical expertise: theory and implications. Acad Med 1990;65:611-21.
36. Custers EJ, Boshuizen HP, Schmidt HG. The influence of medical expertise, case typicality, and illness script component on case processing and disease probability estimates. Mem Cognit 1996;24:384-99.
37. Erkinjuntti T, Ostbye T, Steenhuis R, Hachinski V. The effect of different diagnostic criteria on the prevalence of dementia. N Engl J Med 1997;337:1667-74.
38. Van den Hoogen H, Huygen F, Schellekens J, et al. Morbidity figures from general practice, data from four general practices 1978–1982. Nijmegen, The Netherlands: Nijmegen University Department of General Practice; 1985.
- Activities of daily living dependency and a longer time since the onset of symptoms are associated with a diagnosis of dementia, whereas somatic comorbidity is associated with the absence of dementia.
- Family physicians should be aware of diagnostic difficulties in patients with somatic comorbidity.
- We were unable to confirm the diagnostic value of the recommended dementia guidelines.
Some authors have hypothesized that the continuity of care typical of family practice is an important tool for family physicians to recognize cognitive and behavioral changes in their patients.8 The finding of a positive association between the number of previous contacts with the patient and the family physician’s diagnostic accuracy supports this assertion.1 The family physicians’ accuracy is also positively associated with the severity of the dementia.1,3,9 However, 2 intervention studies that tried to improve the family physicians’ diagnostic accuracy were inconclusive.10,11 Although family physicians may be hesitant to communicate a diagnosis of dementia to patients and their relatives,12 an early and accurate diagnosis is important for a number of reasons. First, explaining the diagnosis enables the patient and relatives to better understand and deal with changed behavior.13,14 Second, realizing the progressive nature of the condition permits patients and relatives to prepare for future care planning and allows support for the often severely burdened caregivers.15,16 Third, dementia patients with Alzheimer’s disease may benefit from anti-Alzheimer drugs.17,18 Therefore, the aim of this study was to quantify the relative contribution of guideline recommendations and other diagnostic determinants in the family physicians’ work-up of patients suspected of having dementia.
Method
Subjects and design
All 250 family physicians from an eastern district in the Netherlands (Nijmegen) were approached by mail to participate in a prospective dementia case-finding study. Of these, 64 family physicians participated. The main reasons for not participating were limited time, having a young practice population, or having no interest in the subject. During consultations or home visits the family physicians assessed patients newly suspected of having dementia using the dementia guideline of the Dutch College of General Practice (DCGP).5,19 Suspicion of dementia was defined by 2 criteria: age 55 years or older and presence of signs of cognitive impairment that had not yet been evaluated. These signs included memory complaints, worsening orientation, or behavioral changes and could be reported by patients or family members or observed by the family physician. After the family physicians’ assessment using the Dutch guideline, all patients with suspected dementia were referred to the outpatient memory clinic of the Academic Medical Center of Nijmegen. Their evaluation served as the diagnostic reference standard. The Medical Ethics Committee of the University Medical Center St Radboud in Nijmegen approved of the study and informed consent of patients was sought by the family physician. A few patients were not able to reproduce basic information about the study, in which case informed consent was sought from their principal caregiver.
Dementia guideline
The DCGP dementia guideline is a national, evidence-based guideline for the diagnosis of dementia (Table 1). It contains diagnostic criteria of the Diagnostic Statistical Manual, 3rd edition, revised (DSM-III-R)20 and includes assessment of cognitive, physical, and activities of daily living (ADL) functioning. A cognitive screening test such as the Mini-Mental State Examination (MMSE) is optional. Instead, the dementia guideline includes a brief assessment of 11 cognitive functions that correspond to the DSM-III-R criteria (long- and short-term memory; orientation to time, place, and person; gnosis; praxis; language ability; judgment; personality changes; and abstraction), and indications on how to assess these functions. In Table 1 the recommendations of the DCGP guideline are compared with the dementia guideline of the Veterans Affairs (VA) and of the Agency for Health Care Policy and Research (AHCPR). These 2 guidelines are constructed for use in primary care as well. The DCGP guideline closely resembles the VA and AHCPR guidelines with some exceptions.21 Results about the applicability of the Dutch dementia guideline to practice were recently published.22
TABLE 1
Comparison of recommendations in 3 dementia guidelines
| Dutch guideline | AHCPR | VA | |
|---|---|---|---|
| History assessment | |||
| Presenting problem | R | R | R |
| Past medical history | R | R | R |
| Medication use | R | R | R |
| Drug/alcohol use | R | R | R |
| Family medical history | R | R | R |
| Personality change | R | — | R |
| Report of daily activities | R | — | R |
| Suicidality | — | — | (R) |
| Clinical examination | |||
| Physical | R | R | R |
| Neurologic | R | R | R |
| Sensory | R | R | R |
| Cognitive status | R | R | R |
| Speech/language | R | — | — |
| Depression | R | R | R |
| Delirium | R | R | R |
| Neuropsychological testing | T | T | T |
| Hachinski score | — | — | — |
| Psychiatric assessment | — | — | R |
| Psychotic symptoms | — | — | R |
| Standardized functional assessment | — | R | Opt |
| Additional tests | |||
| Hematology (Hgb, HCT, MCV, ESR) | R | R | R |
| Biochemistry (glucose, creatine, thyroid function) | R | R | R |
| Kalium | T | R | R |
| Liver function (ALAT) | T | R | R |
| Liver function specific (GGT) | T | R | R |
| Vitamin B12 | T | — | — |
| Folate acid | T | R | — |
| Brain scanning | Opt | Opt | T |
| Human immunodeficiency virus | — | T | T |
| Toxicology screen | — | T | T |
| Urinalysis | — | R | — |
| Drug concentrations | — | — | — |
| Albumin | — | — | — |
| Cerebrospinal fluid analysis | — | T | T |
| Electrocardiogram | — | R | — |
| Electroencephalogram | — | T | T |
| Chest x-ray | — | R | — |
| Specialist consultation and/or referral | Doubt about dementia or its cause | with mixed results | — |
| AHCPR, Agency for Health Care Policy and Research; ALAT, alanine aminotransferase; ESR, erythrocyte sedimentation rate; GGT, gamma-glutamyltransferase; HCT, hematocrit; Hgb, hemoglobin; MCV, mean corpuscular volume; Opt, optional; R, recommendation; (R), implied recommendation; T, targeted; VA, US Department of Veterans Affairs. | |||
Measurements
For every patient suspected of having dementia based on the DCGP guideline, the family physicians recorded their assessment findings, whether a close relative was available, the presence of dementia (yes, no, unsure), the final diagnosis, the number of contacts needed, and their actions taken to reach the diagnosis. Assessment of cognitive functions, behavioral changes, and somatic comorbidity were scored trichotomously: normal, unsure, or impaired. The level of ADL dependency of a patient was scored on a 4-point Likert scale ranging from independent to severely dependent. For cognitive disorders, behavioral changes, and comorbidity, sum scores were computed to reduce the number of variables. A sum score of 11 variables was made for cognitive disorders (Cronbach’s a = 0.75): long- and short-term memory; orientation to time, person and place; praxis; gnosis; language ability; abstraction; judgment; and personality changes. A sum score of 6 variables was made for behavioral changes (Cronbach’s a = 0.65): aggression, apathy, restlessness, denial, depression, and incontinence. Finally, a sum score of 5 variables was made for comorbidity (Cronbach’s a = 0.78): internal (medical) dysfunction, neurologic dysfunction, sensory impairment, adverse effects, and drug intoxication.
A sum score was made of the number of recommendations made from a list of 31 possible recommendations (Cronbach’s a = 0.76). Two indicators for continuity of care, namely, the length and familiarity of the family physician–patient relationship, were recorded by the family physician on a 4-point Likert scale.
DSM-III-R diagnoses
In addition to the diagnosis by the family physician, we also determined the diagnosis based on the DSM-III-R criteria. The findings recorded by the family physician were applied independently by 2 researchers blinded to the DSM-III-R criteria. Differences were discussed and consensus was reached in all cases.
Reference standard: memory clinic
An experienced multidisciplinary team that included a geriatrician, a neurologist, and a psychologist assessed the presence of dementia in all suspected referred patients. The memory clinic’s team was blinded to the family physicians’ and DSM-III-R diagnoses. To this aim, the CAMDEX (Cambridge Mental Disorders of the Elderly Examination)23 and the criteria of the DSM-IV were used.24 Studies on diagnostic accuracy of memory clinic teams compared with postmortem diagnostics show high levels of accuracy (80%–90% of diagnostic agreement).25,26 To our knowledge, the inter- or intraobserver reliability of memory clinic diagnoses has not been studied. The assessment, interpretation, and communication of the results took approximately 4.5 hours spread over 3 visits.
Statistical analyses
The accuracy of the family physicians’ diagnoses and DSM-III-R diagnoses in comparison with the memory clinic diagnosis (reference standard) was estimated using the sensitivity, specificity, positive and negative predictive values, and likelihood ratios. Univariate logistic regression analyses were used to quantify the association of clinical and sociodemographic characteristics, continuity of care, and performance indicators with the presence and absence of dementia. All determinants with P 27-30 The overall model was then reduced by excluding variables with P > .05 to obtain a simpler diagnostic model. The reliability of the overall and reduced diagnostic model was assessed by using the Hosmer and Lemeshow test.27
The ability of the overall and reduced model to discriminate between patients with and without dementia was quantified using the area under the receiver-operating curve (ROC area).31 The area under the ROC curve is a measure of the ability of a test to discriminate between patients with and without a disease, and can range from 0.5 (no discrimination, like flipping a coin) to 1.0 (perfect discrimination). A value between 0.7 and 0.8 is considered to represent reasonable discrimination, and a value of more than 0.8 is good discrimination.32 Differences in diagnostic discriminative value between different models and variables were estimated by comparing ROC areas, taking into account the correlation between models as they were based on the same cases.33 To perform these analyses, the family physicians’ diagnoses had to be dichotomized intodementia present and absent. We chose to classify the 8 cases with family physicians’ diagnoses “unsure” as dementia absent, as the DCGP guideline recommends a reluctant policy in such cases. We performed a sensitivity analysis to check whether the classification of these 8 cases as “dementia present” would have resulted in different findings.
Results
Patients and family physicians
Over 16 months, 64 family physicians enrolled 107 patients suspected of having dementia, a mean of 1.7 patients per family physician. The participating family physicians were aged an average of 47 (SD = 7) years old and handling a practice population of 2113 (SD = 600) patients. Their characteristics were comparable to other Dutch family physicians except that they included fewer solo practitioners (32% versus 49% nationwide) and slightly more female family physicians (21% females versus 17% nationwide).34 Both the family physicians and the memory clinic completed the diagnostic evaluation for 93 patients: 14 patients dropped out because of refusal (n = 9), medical complications (n = 3), or death (n = 2). The clinical and demographic characteristics of these 14 patients were comparable to those of the 93 completed patients. Of the 93 patients, 93% lived independently and 62% were married. Other demographic characteristics are shown in Table 4. For 22 patients no informant was available (23.6%). The available informants were partners (77%), children or stepchildren (19%), or friends, neighbors, and others (4%). Of the informants, 67% were female and 66% shared a household with the patient.
A mean of 26 of the 31 recommendations (84%) was applied for each patient (SD = 3.3; range, 15–30). The family physicians needed on average 3.6 (SD = 3.3) contacts to assess a patient, and 40% received a home visit. Most patients were well known to the family physician; only 18% were not at all or only somewhat familiar. The MMSE was used as a diagnostic tool for only 19%. The mean time between the last assessment contact of the patient with the family physician and the first visit at the memory clinic was 61 days (SD = 39). The mean duration of the symptoms before the assessment was 22 months (SD = 13).
Diagnostic accuracy
Table 3 shows the accuracy of the family physicians’ and the DSM-III-R diagnoses compared with the memory clinic diagnoses. The prior probability of dementia was 63.4% (59/93). A positive diagnosis by the family physician increased the probability (positive predictive value) to 80.3%, and a negative diagnosis decreased this probability to 31.2% (10/32). The positive and negative predictive values of the DSM-III-R criteria were much lower (Table 2).
The 9 patients classified unsure by the family physicians were diagnosed by the memory clinic team as having amnestic syndrome (n = 3), dementia (n = 2), delirium (n = 1), age-dependent cognitive decline (n = 1), depression (n = 1), and unavailable (n = 1). Of the 12 patients with a false-positive diagnosis, 6 showed cognitive impairment, but did not fulfill all diagnostic criteria of dementia, and 1 patient received a diagnosis of depression. Of the 8 patients with false-negative findings, 6 had Alzheimer’s disease, 1 had dementia with unknown cause, and 1 had a normal pressure hydrocephalus. The family physicians expressed diagnostic confidence in 59% of all cases and in 47% of the patients diagnosed with Alzheimer’s disease.
Classification of the 8 patients labeled “unsure” as “dementia present” or “dementia not present” led to only small differences in the positive and negative predictive values (Table 2).
TABLE 2
Dementia diagnoses of family physicians and DSM-III-R compared with the memory clinic team (reference test)
| Reference test | |||||||||
|---|---|---|---|---|---|---|---|---|---|
| Dementia (n = 59) | No dementia (n = 34) | Total | PPV | NPV | SE | SP | LR+ | LR– | |
| Family physician diagnosis | |||||||||
| Dementia | 49 | 12 | 61 | 0.80* | 0.69* | 0.85* | 0.65* | 2.43* | 0.23 |
| Unsure | 2 | 6 | 8 | ||||||
| No dementia | 8 | 16 | 24 | 0.74† | 0.66† | 0.86† | 0.47† | 1.62† | 0.30† |
| DSM-III-R criteria‡ | |||||||||
| Dementia | 13 | 8 | 21 | 0.62 | 0.36 | 0.22 | 0.76 | 0.92 | 1.03 |
| No dementia | 46 | 26 | 72 | ||||||
| *Dichotomizing the family physicians’ diagnoses by grouping the unsure to the category “no dementia.” | |||||||||
| †Dichotomizing the family physicians’ diagnoses by grouping the unsure to the category “dementia.” | |||||||||
| ‡The registered symptoms were integrated by the researchers according to the DSM-III-R criteria. | |||||||||
| LR+, positive likelihood ratio; LR–, negative likelihood ratio; NPV, negative predictive value; PPV, positive predictive value; SE, sensitivity; SP, specificity. | |||||||||
Univariate associations of each documented variable by the family physicians
| Dementia | ||||
|---|---|---|---|---|
| Absent | Present | OR (95%CI) | P | |
| Clinical findings by family physician | ||||
| Cognitive symptoms | ||||
| (0–12), mean (SD) | 7.6 (5.2) | 9.8 (4.6) | 1.13 (1.03–1.24) | .01* |
| ADL dependency, % | 25 | 75 | 3.53 (1.46–8.56) | .01* |
| Somatic comorbidity, % † | 88 | 67 | 0.27(0.08–0.89) | .03* |
| Blood abnormality, % ‡ | 21 | 42 | 2.84 (1.07–7.55) | .04* |
| Behavioral changes, % | 41 | 68 | 0.74 (0.54–1.02) | .07* |
| Duration of symptoms, years (SD) | 1.5 (0.8) | 1.9 (1.0) | 1.77 (1.07–2.94) | .03* |
| Family physicians’ performance | ||||
| Number of consultations, mean (SD) | 3.9 (3.4) | 3.5 (3.6) | 0.97 (0.86–1.09) | .60 |
| Home visit, % | 35 | 43 | 1.39 (0.58–3.33) | .46 |
| Recommendations applied, mean (SD) | 24.5 (3.4) | 25.0 (3.7) | 1.04 (0.92–1.17) | .57 |
| MMSE used, % | 21 | 15 | 0.69 (0.23–2.07) | .51 |
| Informant contacted, % | 65 | 83 | 2.67 (1.01–7.11) | .05* |
| Familiar with patient, % | 79 | 84 | 1.41 (0.47–4.21) | .54 |
| Family physician–patient relation, >5 years, % | 65 | 75 | 0.60 (0.24–1.50) | .27 |
| Patient characteristics | ||||
| Mean age, years (SD) | 73 (8.7) | 74.3 (6.3) | 1.03 (0.97–1.09) | .41 |
| Male sex, % | 44 | 44 | 1.00 (0.42–2.34) | .99 |
| n = 93. Values are in means (SD) or percentages. | ||||
| *P | ||||
| † Sensory impairment, internal dysfunction; neurologic dysfunction; intoxication; adverse drug effect, sum score of dichotomous items. | ||||
| ‡ Hematology (hemoglobin; hematocrit; mean cell count; erythrocyte sedimentation rate); biochemistry (glucose; creatine; thyroid function), sumscore of dichotomous items. | ||||
| ADL, activities of daily living, 1 question scored on a 4-point scale; CI, confidence interval; MMSE, Mini-Mental State Examination; OR, odds ratio. | ||||
TABLE 4
Multivariate associations between predictors of accurate dementia diagnoses by family physicians and the reference standard memory clinic team diagnosis
| Adjusted odds ratio (95% CI) | P | |
|---|---|---|
| ADL dependency, score1–4 | 5.35 (2.00–13.9) | .0212 |
| Years since symptoms started | 1.84 (1.08–3.14) | .026 |
| Somatic comorbidity present | 0.48 (0.25–0.89) | .006 |
| n = 93. | ||
| ADL, activities of daily living (1 = independent to 4 = fully dependent); CI = confidence interval. | ||
Predictors of presence/absence of dementia
The univariate analyses revealed that informant availability, years of education, sex of the family physician, number of cognitive symptoms, ADL dependency, somatic comorbidity, blood abnormality, behavioral changes, and duration and severity of the symptoms were associated with the presence or absence of dementia (Table 3). Neither the number of applied recommendations nor the use of the MMSE was related to the presence or absence of dementia.
The multivariate logistic regression model (Table 5) revealed that ADL dependency (OR = 5.28, P = .001) and time since the first symptoms started (OR per year =1.84, P = .026) independently predicted the presence of dementia, whereas somatic comorbidity predicted the absence of dementia (OR = 0.48, P = .021).
The ROC area of the model with all 9 significant univariate variables from Table 4 was 0.86 (95% confidence interval [CI], 0.77–0.94). Reduction of the model to the 3 significant multivariate variables (ADL, time since the first symptoms were noticed, and somatic comorbidity) resulted in an ROC area of 0.79 (95% CI, 0.70–0.88). The family physicians’ global diagnosis had an ROC area of 0.74 (95% CI, 0.63–0.85). Finally, the ROC area of the expected DSM-III-R diagnosis was only 0.50 (95% CI, 0.37–0.62).
Discussion
The family physicians’ diagnosis based on their assessment of all available information was reasonably accurate. Formal DSM-III-R diagnoses, derived by integrating the recorded symptoms, resulted in poor accuracy. Degree of ADL functioning, the duration of symptoms, and the presence of somatic comorbidity independently contributed to the prediction of presence or absence of dementia. Neither the number of diagnostic recommendations made nor the use of the MMSE added to the family physicians’ accuracy. The latter is rather disappointing news for makers of all 3 dementia guidelines. Many of the current diagnostic recommendations in the dementia guidelines are based at best on lower quality evidence from observational studies. Trials are lacking in which diagnostic interventions by family physicians are tested against usual diagnostics.
It was remarkable that neither the core symptoms of dementia (cognitive impairment) nor the DSM criteria added to the diagnostic accuracy. Our findings raise the question of how family physicians made their diagnoses. In this respect, the concept of illness scripts (also called pattern recognition) may be helpful to understand how clinicians make diagnostic decisions.35 According to this concept, clinicians base their decisions more on accumulated clinical patient pictures during their medical career or so-called illness scripts than on medical-deductive reasoning, which is taught in medical schools and offered in evidence-based guidelines.36 The illness scripts family physicians have of suspected dementia patients may be triggered more by ADL malfunctioning than by cognitive dysfunction.
When the time effort per patient of the family physicians and the memory clinic is compared, the family physicians performed well. The family physicians invested on average 3.5 consultations per patient. Multiplied by the average consultation time of 10 minutes in Dutch family practices, this yields a total consultation time of 35 minutes per patient to arrive at a diagnosis. This time should be compared with the 4.5 hours needed per patient for high-tech diagnostic assessment at the memory clinic. Taking the limited time and low-tech approach into account, it must be concluded that the family physicians did a fair job in diagnosing suspected patients.
We did not confirm the hypothesis that continuity of care enhanced diagnostic accuracy. In contrast to the finding of Eefsting and colleagues,1 the number of contacts with a patient showed a trend toward a negative association with diagnostic accuracy. A possible explanation is that only contacts related to the evaluation of dementia were recorded in our study; a larger number of contacts may therefore reflect a family physicians’ diagnostic difficulty or uncertainty rather than better continuity of care.
Strengths of our study include the detailed information from the family physician assessments, the primary care setting, and the use of a memory clinic as the reference standard. A limitation was that the diagnostic criteria of the family physicians’ guideline were based on the DSM-III-R, whereas the memory clinic used the DSM-IV criteria.20,24 Nevertheless, this difference may have accounted for the diagnostic variation only to a small degree.37 Second, the finding that additional value was not found for use of the MMSE or for a more frequent use of recommendations might be explained by the fact that the family physicians in this study already applied the recommendations on a large scale. Higher use, therefore, did not add much to the diagnostic accuracy of the family physicians. Third, concerning the importance of the availability of an informant, the kind of information the family physicians received from these informants remains unclear, as the content of the informant interview was neither standardized nor registered. Fourth, few patients per family physician were included. The numbers of included patients per family physician, however, are only a little below the incidence figures for dementia in the Netherlands.38 Anecdotal reactions from the participating family physicians revealed that some patients were not included because they did not want medical interference and some were unable to travel to the memory clinic. Finally, we modeled various predictors to estimate the presence or absence of dementia and derived a reduced model. In this modeling we did not adjust for overfitting and did not prospectively validate the model. This tactic was necessary given the relatively small number of subjects in the study.28 Therefore, before our reduced prediction model can be used in medical practice it should first be validated on new patients.
1. Eefsting JA, Boersma F, Van den Brink W, Van Tilburg W. Differences in prevalence of dementia based on community survey and general practitioner recognition. Psychol Med 1996;26:1223-30.
2. O’Connor DW, Pollitt PA, Hyde JB, Brook CP, Reiss BB, Roth M. Do general practitioners miss dementia in elderly patients? BMJ 1988;297:1107-10.
3. Valcour VG, Masaki KH, Curb JD, Blanchette PL. The detection of dementia in the primary care setting. Arch Intern Med 2000;160:2964-8.
4. Verhey FR, Jolles J, Ponds RW, et al. Diagnosing dementia: a comparison between a monodisciplinary and a multidisciplinary approach. J Neuropsychiatry Clin Neurosci 1993;5:78-85.
5. Wind A, Muskens J, De Bruyne G, et al. NHG standaard M21 Dementie [Dutch dementia guideline]. Utrecht, The Netherlands: Nederlands Huisartsen Genootschap; 1999.
6. Eccles M, Clarke J, Livingstone M, Freemantle N, Mason J. North of England evidence based guidelines development project: guideline for primary care management of dementia. BMJ 1998;317:802-8.
7. Rose VL. Consensus statement focuses on diagnosis and treatment of Alzheimer’s disease and related disorders in primary care. Am Fam Physician 1998;57:1431-2.
8. Wind AW, Van Staveren G, Schellevis FG, et al. The validity of the judgement of general practitioners on dementia. Int J Geriatr Psychiatry 1994;9:543-9.
9. Cooper B, Bickel H, Schäufele M. The ability of general practitioners to detect dementia and cognitive impairment in their elderly patients: a study in Mannheim. Int J Geriatr Psychiatry 1992;7:591-8.
10. Pond CD, Mant A, Kehoe L, Hewitt H, Brodaty H. General practitioner diagnosis of depression and dementia in the elderly: can academic detailing make a difference? Fam Pract 1994;11:141-7.
11. O’Connor DW, Fertig A, Grande MJ, et al. Dementia in general practice: the practical consequences of a more positive approach to diagnosis. Br J Gen Pract 1993;43:185-8.
12. van Hout H, Vernooij-Dassen M, Bakker K, Blom M, Grol R. General practitioners on dementia: tasks, practices and obstacles. Patient Educ Couns 2000;39:219-25.
13. Colerick EJ, George LK. Predictors of institutionalization among caregivers of patients with Alzheimer’s disease. J Am Geriatr Soc 1986;34:493-8.
14. Vernooij-Dassen MJFJ, Persoon JMG, Felling AJA. Predictors of sense of competence in caregivers of demented persons. Soc Sci Med 1996;43:41-9.
15. McCurry S, Teri L. Advance planning for dementia caregivers. J Am Geriatr Soc 1997;45:1102-3.
16. Droës R. Psychosocial treatment for demented patients: overview of methods and effects. In: Miesen B, Jones G, Eds. Care-Giving in Dementia, Research and Applications. London: Routledge; 1997;127-48.
17. Rösler M, Anand R, Cicin-Sain A, et al. Efficacy and safety of rivastigmine in patients with Alzheimer’s disease: international randomised controlled trial. BMJ 1999;318:633-8.
18. Rogers SL, Farlow MR, Doody RS, Mohs R, Friedhoff LT. A 24-week, double-blind, placebo-controlled trial of donepezil in patients with Alzheimer’s disease. Donepezil Study Group. Neurology 1998;50:136-45.
19. De Bruyne GM, Meyboom-de Jong B, Muskens JB, et al. De NHG-standaard dementiesyndroom [Guideline on dementia of the Dutch College of General Practitioners]. Huisarts & Wetenschap 1991;34:598-607.
20. Diagnostic and Statistical Manual of Mental Disorders. 3rd ed rev. Washington, DC: American Psychiatric Association; 1987.
21. Beck C, Cody M, Souder E, Zhang M, Small GW. Dementia diagnostic guidelines: methodologies, results, and implementation costs. J Am Geriatr Soc 2000;48:1195-203.
22. Van Hout H, Vernooij-Dassen M, Poels P, Hoefnagels W, Grol R. Applicability of diagnostic recommendations on dementia in family practice. Int J Qual Health Care 2001;13:127-33.
23. Roth M, Tym E, Mountjoy CQ, et al. CAMDEX, a standardised instrument for the diagnosis of mental disorder in the elderly with special reference to the early detection of dementia. Br J Psychiatry 1986;149:698-709.
24. Diagnostic and Statistical Manual of Mental Disorders. 4th ed. Washington, DC: American Psychiatric Association; 1994.
25. Mendez MF, Mastri AR, Sung JH, Frey WH, 2nd. Clinically diagnosed Alzheimer disease: neuropathologic findings in 650 cases. Alzheimer Dis Assoc Disord 1992;6:35-43.
26. Rasmusson DX, Brandt J, Steele C, Hedreen JC, Troncoso JC, Folstein MF. Accuracy of clinical diagnosis of Alzheimer disease and clinical features of patients with non-Alzheimer disease neuropathology. Alzheimer Dis Assoc Disord 1996;10:180-8.
27. Hosmer D, Lemeshow S. Applied Logistic Regression. New York: Wiley; 1989.
28. Harrell FE, Jr, Lee KL, Mark DB. Multivariable prognostic models: issues in developing models, evaluating assumptions and adequacy, and measuring and reducing errors. Stat Med 1996;15:361-87.
29. Moons KG, Stijnen T, Michel BC, et al. Application of treatment thresholds to diagnostic-test evaluation: an alternative to the comparison of areas under receiver operating characteristic curves. Med Decis Making 1997;17:447-54.
30. Moons KG, van Es GA, Michel BC, Buller HR, Habbema JD, Grobbee DE. Redundancy of single diagnostic test evaluation. Epidemiology 1999;10:276-81.
31. Hanley J, McNeil B. The meaning and use of the area under the receiver operating characteristic (ROC) curve. Radiology 1982;143:29-36.
32. Murphy JM, Berwick DM, Weinstein MC, Borus JF, Budman SH, Klerman GL. Performance of screening and diagnostic tests. Application of receiver operating characteristic analysis. Arch Gen Psychiatry 1987;44:550-5.
33. Hanley JA, McNeil BJ. A method of comparing the areas under receiver operating characteristic curves derived from the same cases. Radiology 1983;148:839-43.
34. Harmsen J, Hingstman L. Cijfers uit de registratie van huisartsen, peiling 1996 [Numbers of the registration of General Practitioners in the Netherlands]. Utrecht, The Netherlands: NIVEL; 1996 November.
35. Schmidt HG, Norman GR, Boshuizen HPA. A cognitive perspective on medical expertise: theory and implications. Acad Med 1990;65:611-21.
36. Custers EJ, Boshuizen HP, Schmidt HG. The influence of medical expertise, case typicality, and illness script component on case processing and disease probability estimates. Mem Cognit 1996;24:384-99.
37. Erkinjuntti T, Ostbye T, Steenhuis R, Hachinski V. The effect of different diagnostic criteria on the prevalence of dementia. N Engl J Med 1997;337:1667-74.
38. Van den Hoogen H, Huygen F, Schellekens J, et al. Morbidity figures from general practice, data from four general practices 1978–1982. Nijmegen, The Netherlands: Nijmegen University Department of General Practice; 1985.