User login
Evidence-based guidelines for management of nursing home-acquired pneumonia
—William Osler, ca 1900
We convened a multidisciplinary, multispecialty panel to develop comprehensive evidence and consensus-based guidelines for managing nursing home-acquired pneumonia. The panel began with explicit criteria for process of care quality measures, performed a comprehensive review of the English-language literature, evaluated the quality of the evidence, and drafted a set of proposed guidelines. The panel reviewed the draft, an annotated bibliography, and data from a study of 30-day survival from nursing home-acquired pneumonia, and then participated in an all-day meeting in January 2001. Using a modified Delphi process, the panel refined the guidelines and developed a care pathway. The guidelines recommend a comprehensive approach, including immunization of staff and residents, and communication between nursing staff and the attending physician within 2 hours of symptom onset. Probable pneumonia was defined. An algorithm was delineated for assessing the patient’s wishes for hospitalization and aggressive care, and deciding on hospitalization based on the severity of the illness as well as the capacity of the nursing home to provide acute care. The timing and extent of evaluation in a nursing home relative to the rapid initiation of antibiotics should depend on whether the patient has any unstable vital signs. An antibiotic covering Streptococcus pneumoniae, Haemophilus influenzae, common gram-negative rods, and Staphylococcus aureus should be given for 10 to 14 days, orally if the patient is able to take medications by mouth.
Mortality from nursing home-acquired pneumonia is as high as 44%,1and nearly a third of those who survive suffer significant functional decline.2 Nursing home-acquired pneumonia is an entity distinct from community-acquired pneumonia in the elderly and nosocomial pneumonia. Older adults in nursing homes are more likely than community-dwelling older persons, but less likely than hospitalized elderly patients, to be colonized with gram-negative rods and pathogens with multiple antibiotic resistance.3-8Inappropriate use of antibiotics in long-term care facilities contributes significantly to the growing problem of antibiotic resistance generally.9 In addition, most nursing home residents are cognitively impaired, immunocompromised, have multiple functional deficits, or have dysphagia, which further contributes to their vulnerability.10
In recent work11 with a national nursing home sample, we showed that high quality care, including appropriate antibiotic use, hospitalization when indicated, and rapid identification of and response to respiratory symptoms, is associated with improved survival of residents who acquire pneumonia. Unfortunately, we also found that many of the 58 nursing homes in our study provided less than adequate care; for example, only 31% of residents received antibiotics within one 8-hour shift of symptom onset.11
Convincing evidence indicates that treatment guidelines improve pneumonia outcomes in acute care settings,12,13 and preliminary indications suggest that they may have a positive impact on processes of care in nursing facilities.14 Three guidelines on diagnosis and treatment of infections in nursing homes have been published in the last 2 years,15-17but these guidelines are not specific to pneumonia. The only guideline specific to nursing home-acquired pneumonia used current community practice in 1 metropolitan area to define guidelines for antibiotic use.18 The outline specifically does not address issues of diagnostic work-up, decision to hospitalize, or timing of initial antibiotic treatment. We therefore convened a national panel of experts in infectious disease, pharmacology, pulmonology, geriatrics, and nursing to develop comprehensive evidence-based guidelines for management of nursing home-acquired pneumonia. The guidelines address immunization, infection control, timing and thoroughness of nurse and physician evaluation of lower respiratory tract infections, criteria for hospitalization, and criteria for antibiotic spectrum, timing, route, and duration.
Guideline development
Literature review
A comprehensive literature review was undertaken using Ovid (http://www.ovid.com/) and the “explode” version of each of the following key words: nursing homes, long-term care facilities, skilled nursing facilities, and pneumonia, to search MEDLINE from 1975 through 2000. Only studies published in English and germane to nursing home residents in the United States and Canada were examined. Results of the search were augmented by a local mulidisciplinary team, consisting of faculty in geriatric studies, infectious disease, pulmonology, and pharmacology at the University of Colorado Health Sciences Center, an internist who practices exclusively in nursing homes, and a nursing home nurse consultant. This team developed explicit criteria for nursing home-acquired pneumonia processes of care, as described previously.11
Construction of draft guidelines
Working with the explicit criteria developed by the local team, the data from our retrospective study of process of care and survival, and the published literature on nursing home-acquired pneumonia, we drafted an initial set of comprehensive guidelines. We then graded the recommendations according to a standard system for defining quality, with 3 categories for recommendation strength (A, good evidence; B, moderate evidence; C, poor evidence) and 3 grades for quality of evidence (I, at least 1 properly randomized, controlled trial; II, at least 1 well-designed clinical trial without randomization from cohort or case-controlled analytic studies, multiple time series, or dramatic results in uncontrolled experiments; III, opinions of respected authorities based on clinical experience, descriptive studies, or reports of expert committees).19 Published Canadian and American guidelines for treatment of community-acquired and nosocomial pneumonia formed a template for the antibiotic recommendations.20,21
Modified delphi process
A multidisciplinary, multispecialty panel was recruited from nationally recognized experts in nursing home-acquired pneumonia, geriatric and infectious disease pharmacology, pneumonia treatment guideline development, and nursing home nurses (see Appendix). Panel members received an annotated version of the draft guidelines with a bibliography and the questionnaire described below. A table of the activity spectrum of currently available antibiotics, a table summarizing published reports on the microbiology of nursing home-acquired pneumonia (see Table 1), and tables summarizing our retrospective study of care processes in nursing homes and 30-day survival11were also included in that mailing.
The questionnaire asked whether each proposed guideline was clear, specific, feasible, measurable, and commensurate with his or her usual practice. Panelists were also asked to score each proposed guideline on its importance in determining the outcome of a nursing home-acquired pneumonia episode on a 5-point Likert scale, with 1 being not important and 5 being extremely important. Suggestions for substantive changes were elicited. The questionnaires were returned 2 weeks before an all-day, face-to-face meeting. For each guideline we calculated the percentage of panelists who agreed that it met each of the 5 criteria outlined. The means and standard deviations of the guideline weights were analyzed. Suggestions for substantive changes in the guidelines were collated and presented in tabular form, along with results of the survey, at the beginning of the meeting.
The most controversial guidelines were found to be classification of symptoms into a diagnosis of probable pneumonia, criteria for hospitalization, evaluation and treatment of residents not being hospitalized, and antibiotic choice. Less controversial were recommendations for immunization and treatment duration. The panel meeting devoted 2 hours to each of the 4 most controversial guidelines. The draft guideline was read and results of the pre-meeting ratings and suggestions were discussed. The guidelines were revised substantially and voted on. A care pathway was also developed at the meeting.
Because revisions were extensive and 1 of the panelists was participating by telephone, a copy of the revised guidelines and care pathway was sent to the panelists for further review and comment after the meeting. At that time, they were asked to rate each guideline on how confident they were that the recommendation should be included as part of the proposed guidelines using a 5-point Likert scale, with 1 denoting not confident and 5 denoting very confident. Because the lowest mean confidence rating was 3.4 after this iterative process, no guidelines were dropped from the set agreed upon at the meeting. Final revisions were made to the guidelines and their respective strength-and-quality-of-evidence grades, and approved by the panel.
TABLE 1
Nursing home pneumonia etiology according to studies using verified sputum* or blood culture
| Study | N | Year | Streptococcus pneumoniae (%) | Staphylococcus aureus (%) | Gram-negative rods (%) | Haemophilus influenzae (%) | Anerobes (%) | Multiple organisms (%) |
|---|---|---|---|---|---|---|---|---|
| Alvarez3 | 414 | 1988 | 32 | — | 29 | — | — | 22% |
| Peterson4 | 123 | 1988 | 10 | 3 | 21 | 9 | — | — |
| Marrie5 | 131 | 1989 | 16 | 13 | 13 | — | 4 | — |
| Hirata-Davis6 | 50 | 1991 | 12 | 4 | 15 | 10 | — | — |
| Drinka7 | 17 | 1994 | 30 | 6 | — | 25 | — | (Atypicals = 0) |
| Marrie and Blanchard51 | 71 | 1997 | 2/5 | — | 2/5 | — | — | — |
| Pick8 | 257 (98 aspirations) | 1996 | 3 | 38 | 6 | 3 | — | Group B streptococci 43% |
| *Expectorated sputum with > 25 white blood cells per low-power field and < 10 squamous epithelial cells per low-power field. | ||||||||
Recommendations
Each of the 25 guidelines is presented below. The strength and quality of evidence rating and panelists’ mean confidence score are shown in parentheses.
Prevention
- Residents should be vaccinated against Streptococcus pneumoniae at admission unless there is documentation of vaccination within 5 years preceding admission or they were allergic to previous pneumococcal vaccine. (A/I/4.7)22-27
- Residents should be vaccinated against influenza by December of each year if they are not allergic to eggs or previous influenza vaccine. Residents admitted between December and March should be vaccinated if not already immunized for the current influenza season, and they are not allergic as described above. (A/I/5.0)27,28
- The nursing facility should provide and strongly recommend immunization against influenza for all employees by December of each year if the employee is not allergic to eggs or previous vaccine. (A/I/4.9)29,30
Initial evaluation of residents with respiratory impairment
Once a resident has been noted to have a significant change in respiratory status, the clinician should use the care pathway outlined in (Figure 1). The panel believed that nurse practitioners and physician assistants with appropriate supervision could substitute for physician care in all pathway activities. Guideline recommendations 4 through 8 address the rapid recognition and physician notification of serious respiratory symptoms:
- Physicians with nursing home residents should be available or have cross-coverage by pager 24 hours/day, 7 days/week. (Absent/Absent/4.8)
- Nursing home staff should page the physician within 1 hour when a resident is noted to have any 2 of the following signs or symptoms: new or worsening cough; increased or newly purulent sputum; decline in cognitive, physical, or functional status; fever; hypothermia; dyspnea; tachypnea; chest pain; or new or worsening hypoxemia. (Absent/Absent/4.3)
- Nurse evaluation at symptom onset should include, at least, vital signs (temperature, pulse rate, respiratory rate, and blood pressure) and oxygen saturation if a pulse oximeter is available in the facility. (Absent/Absent/4.5)
- When notified as in guideline #5, the physician should call back within 1 hour. (Absent/Absent/4.3)
- If the nurse does not hear back from the physician within 1 hour, he or she should notify the director of nurses or designee. The nurse and the director of nurses should agree on a plan to notify the medical director or designee and ask him or her to assume care of that episode until the medical director can contact the attending physician. (Absent/Absent/3.5)
Once the physician has been notified, he or she must decide whether pneumonia is a leading consideration in the diagnosis of the reported change.
- The physician and nursing home staff should concur that pneumonia is a leading consideration in the diagnosis of the change noted in guideline #5 above, if the patient has 2 or more of the following signs or symptoms: new or worsening cough; newly purulent sputum; fever of 100.5°F or 2°F more than baseline; hypothermia < 96°F; dyspnea; respiratory rate > 25 breaths per minute; tachycardia; new or worse hypoxemia; pleuritic chest pain; a decline in cognitive or functional status; or new rales or rhonchi on chest examination. Such patients will be referred to in the remainder of the guidelines as having “probable pneumonia.” (C/III/4.1)5,31
FIGURE
Care pathway for nursing home-acquired pneumonia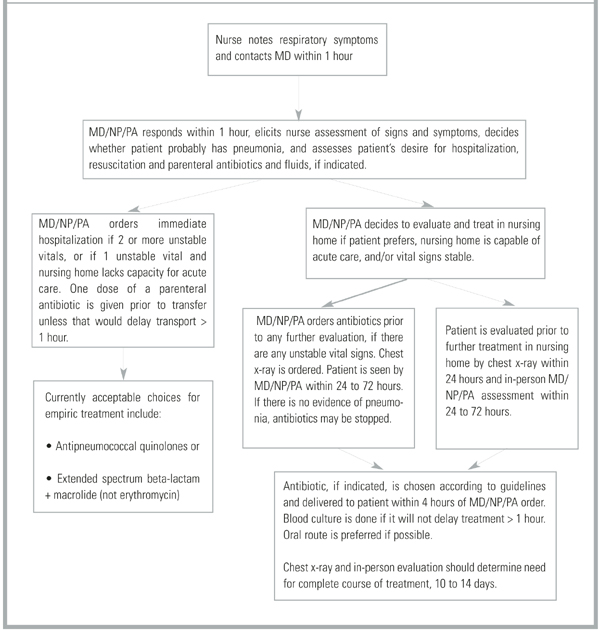
Venue of care
Once pneumonia is considered likely, the physician must decide whether to hospitalize the resident. Because nursing home-acquired pneumonia is frequently the terminal event of a long and debilitating illness, this decision is especially important.
- The patient’s desire for hospitalization and aggressive care should be assessed directly if possible, or by chart review or discussion with the patient’s health care proxy. Patients with prior orders for no hospitalization or who refuse hospitalization (personally or by proxy) should not be hospitalized. (Absent/Absent/4.8)32
For patients willing to be hospitalized, the panel suggested categorization into 1 of 3 groups: patients whose severity of illness mandates hospitalization; patients whose severity of illness is such that the nursing home’s capacity to deliver acute care should be considered; and patients so stable that treatment in the nursing home is preferable. This set of recommendations is based on 2 retrospective series which suggest that only patients with elevated respiratory rates benefit from hospitalization2 and that patients hospitalized according to criteria similar to these tended to have better survival.11 These recommendations are modeled after Fine’s prediction rule to identify low-risk patients with community-acquired pneumonia,33 and take into account the mortality prediction model of Naughton and coworkers34 for nursing home-acquired pneumonia.
- Patients with 2 or more of the following symptoms should be hospitalized (C/III/4.1)2,11:
- If the nursing home cannot provide vital sign assessment every 4 hours, laboratory access, parenteral hydration, and 2 licensed nurses per shift in the facility, serious consideration should be given to hospitalizing patients with any one of the above. (C/III/4.1)11,35,36
- Patients with none of the above should be treated in the nursing home unless the patient or proxy insists on hospitalization. (B/II/4.5)2,11,33,34
Evaluating and monitoring patients who remain in nursing homes
- Nurse evaluation each shift should include, at least, vital signs with measured respiratory rate and oxygen saturation until symptoms resolve. (C/III/4.5)16,17,37
Although a study published by Mehr and colleagues38 after the panel proceedings suggested that patients with multiple signs and symptoms of nursing home-acquired pneumonia are so likely to have an infiltrate on chest x-ray that treating without first obtaining an x-ray may be acceptable, the panel recommended that:
- Patients with probable pneumonia should have a chest x-ray. (C/III/4.2)15,39
- Patients with probable pneumonia should be evaluated in person by the physician, ideally within 24 hours and certainly within 72 hours. (Absent/Absent/4.5)
- Because of the issue of antibiotic resistance, and not because of anticipated direct patient benefit, patients for whom antibiotics are ordered should have 1 blood culture drawn if this can be accomplished without delaying initiation of antibiotics longer than 1 hour. (C/III/3.4)37,40
The panel did not recommend sputum Gram’s stain and culture even though 2 recent guidelines on evaluating infection in long-term care facilities did.15,16 Obtaining high-quality sputa in this population is notoriously difficult.1
TABLE 2
Key recommendations of evidence
| Guideline | Strength/quality of evidence |
|---|---|
| 1, 2, 3: Vaccinate staff and residents against influenza and residents against Streptococcus pneumoniae. | A/I |
| 4, 5, 6, 7, 8: Nursing assessment of change in condition should include a full set of vital signs with oxygen saturation. Initial communication with the physician should be completed within 2 hours of symptom onset. | Absent |
| 9: Probable pneumonia is defined as 2 or more of the following: new or worsening cough; newly purulent sputum; temperature > 100.5°F, < 96°F, or 2°F more than baseline; respiratory rate > 25 breaths per minute, tachycardia; new or worsening hypoxia; pleuritic chest pain; decline in cognitive or functional status; physical findings on chest examination such as rales or rhonchi. | C/III |
| 10: Patient’s desire for hospitalization and aggressive care should be assessed at the onset of the episode and directly with the patient, if possible. | Absent |
| 11, 12, 13: The decision to hospitalize should be based on a combination of vital sign criteria, active comorbidity, and nursing home capabilities. | C/III |
| 23: The antibiotic chosen as empiric therapy should cover S pneumoniae, Haemophilus influenzae, common gram-negative rods, and Staphylococcus aureus. | B/II |
| 25: Use oral antibiotics if the patient can take oral medication. | A/I |
| Recommendations were graded according to a standard system,19with 3 categories for recommendation strength (A, good evidence; B, moderate evidence; C, poor evidence) and 3 grades for quality of evidence (I, at least 1 properly randomized, controlled trial; II, at least 1 well-designed clinical trial without randomization from cohort or case-controlled analytic studies, multiple time series, or dramatic results in uncontrolled experiments; III, opinions of respected authorities based on clinical experience, descriptive studies, or reports of expert committees). | |
Antibiotic use
Extrapolating from studies of hospital- and community-acquired pneumonia indicating a survival benefit for patients who receive antibiotics within 8 hours of arrival in hospital or symptom onset,40 the panel made the following recommendations, which do not conflict with 3 recently published guidelines on use of antibiotics in long-term care facilities.16
- Patients being sent immediately to the hospital should receive 1 dose of parenteral antibiotics prior to leaving the nursing home unless this treatment would delay transport for more than 1 hour. The hospital should be notified of the antibiotic given. (B/II/4.4)40
- A single dose of antibiotics should be ordered immediately (simultaneously with the chest x-ray order) if the patient has any of the following: systolic blood pressure < 90 mm Hg or 20 mm Hg less than baseline; oxygen saturation < 90% on room air at sea level; pulse > 130 beats per minute; respiratory rate > 30 breaths per minute; or temperature > 101.5°F. (B/II/4.5)40,41
- For patients with probable pneumonia who are stable (oxygen saturation > 90%, systolic blood pressure > 90 mm Hg, pulse < 120 beats per minute, and respiratory rate < 30 beats per minute), a decision to use antibiotics may await results of the chest x-ray if they will be available within 24 hours. (C/III/3.8)40,41 If the chest x-ray does not confirm the suspicion of pneumonia, consideration should be given to stopping antibiotic treatment.
- Antibiotics, if ordered, should be delivered to the patient within 4 hours of the orders being given by the physician. (B/II/4.5)40,41
- If the patient is able to take oral medication, that route is preferred, except that patients being sent to the hospital should have 1 parenteral dose. (A/I/4.7)4,42,43
Because it is difficult to obtain a bacteriologic diagnosis in most nursing home residents, the initial choice of antibiotic must be empiric. Based on the published studies of nursing home-acquired pneumonia bacteriology, half of which used high-quality sputum samples (> 25 white blood cells per low-power field and < 10 squamous epithelial cells per low-power field, (see Table 1), the panel recommended a broad-spectrum antibiotic covering S pneumoniae, Haemophilus influenzae, gram-negative rods, and Staphylococcus aureus. In areas or facilities where resistance of S pneumoniae to penicillin is known to be high, treatment should be modified accordingly. These recommendations differ from those proposed by the Society of Health Care Epidemiology of America in their 2000 position paper,16 but are similar to those proposed by Naughton and Mylotte18 in their guideline derived from current community practice in Buffalo, New York, except that the current panel recommends the addition of a macrolide. These differences are driven by controversy over the relative importance of gram-negative rods as etiologic vs colonizing organisms in nursing home-acquired pneumonia; the relative importance of atypical organisms; and by the current panel’s concern that an important percentage of bacteria in long-term care facilities may already be resistant to many of the antibiotics endorsed by the Society of Health Care Epidemiology of America. Moreover, 3 studies have suggested a survival benefit of broader-spectrum empiric treatment in nursing home-acquired pneumonia.11,44,45
- The antibiotic chosen as empiric therapy needs to cover S pneumoniae, H influenzae, gram-neg-ative rods, and S aureus. (B/II/4.5)37,31,39,44-51
- Currently acceptable choices for empiric treatment include: antipneumococcal quinolones or an extended-spectrum beta-lactam plus a macrolide other than erythromycin. (C/III/4.5)45,52,53
- Treat for 10 to 14 days. (B/II/4.4)18,25
Conclusions
A multidisciplinary, multispecialty panel of nationally recognized experts in nursing home-acquired pneumonia achieved consensus in proposing guidelines and a care pathway to prevent, recognize, evaluate, and treat nursing home-acquired pneumonia. For immunization and use of oral antibiotics when possible, evidence was sufficient to make a strong (A/I) recommendation. Even in areas in which evidence was lacking, the panel agreed readily. Thus for most of the 25 proposed guidelines, strong evidence and/or ready consensus existed among national experts from many disciplines.
The process of guideline development that we followed was systematic and meticulous. The panel was diverse, including nurses and pharmacologists, nationally recognized experts in infectious disease, nursing home care, geriatrics, and pulmonology. The breadth of the panel’s collective experience, and the rigor of the Delphi process we followed, lend face validity to the proposed guidelines despite some differences with other guidelines, as noted above.45,53
These guidelines are uniquely comprehensive. They address management of pneumonia from prevention through diagnosis, the decision to hospitalize, and treatment. Such a comprehensive approach is essential given the many people and systems that interact in the care of nursing home residents, a uniquely frail and vulnerable population. Evidence from our work and others11,13 suggests that only a comprehensive approach will, over time, improve the outcome of this important illness.
The guidelines have 2 important limitations. They have not yet been approved by any official professional society, nor have they been tested prospectively. Prospective testing is required to validate whether, in fact, the proposed guidelines can be implemented and, if implemented, they will improve mortality, function, cost of care, rehospitalization rates, and community discharge rates. We chose not to seek official approval of the guidelines until they can be proven effective.
We believe the proposed guidelines can and should be used to the fullest extent possible by nursing homes and physicians who practice there, because the combination of evidence and consensus is strong. Nursing home-acquired pneumonia causes excess mortality and functional loss. The proposed guidelines, based as they are in empiric evidence, common sense, and expert consensus, offer some hope of decreasing rehospitalization and cost, mitigating functional decline, and improving survival.
APPENDIX: PANEL MEMBERS . Diana Blake, RN, Western Hills Health Care Center, Lakewood, CO; JoAnn G. Congdon, RN, PhD, University of Colorado HSC, Denver, CO; Douglas Fish, PharmD, University of Colorado, Denver, CO; Evelyn Hutt, MD, University of Colorado HSC, Denver, CO; Denise Iskra, RN, Life Care of Westminster, Westminster, CO; Andrew M. Kramer, MD, University of Colorado, Denver, CO; Thomas J. Marrie, MD, University of Alberta, Edmonton, Alberta, Canada; Mark Loeb, MD, McMaster University, Hamilton, Ontario, Canada; Wayne C. McCormick, MD, MPH, Harborview Medical Center, Seattle, WA; Annette M. Medina-Walpole, MD, University of Rochester, Rochester, NY; David R. Mehr, MD, MS, University of Missouri–Columbia, Columbia, MO; Michael S. Niederman, MD, State University of New York at Stony Brook, Mineola, NY; Phillip K. Peterson, MD, University of Minnesota, Minneapolis, MN; J. Mark Ruscin, PharmD, University of Colorado, Denver, CO; Thomas T. Yoshikawa, MD, Charles Drew University, Los Angeles, CA.
Acknowledgments
The authors acknowledge the members of the panel for their thoughtful participation and willingness to review multiple drafts of the guidelines and manuscript; Steven Teutsch, MD, Senior Director, Outcomes Research and Management, Merck & Co., Inc., for his support and advice; Lisa Lampinen for manuscript preparation; and Merck & Co., Inc., for funding.
1. Medina-Walpole AM, Katz PR. Nursing home-acquired pneumonia. J Am Geriatr Soc 1999;47:1005-15.
2. Fried TR, Gillick MR, Lipsitz LA. Short-term functional outcomes of long-term care residents with pneumonia treated with and without hospital transfer. J Am Geriatr Soc 1997;45:302-6.
3. Alvarez S, Shell CG, Woolley TW, et al. Nosocomial infections occurring in nursing home residents. J Gerontol 1988;43:M9-17.
4. Peterson PK, Stein DJ, Guay D, et al. Prospective study of lower respiratory tract infections in an extended-care nursing home program: potential role of oral ciprofloxacin. Am J Med 1988;85:164-71.
5. Marrie TJ, Durant H, Yates L. Community-acquired pneumonia requiring hospitalization: 5-year prospective study. Rev Infect Dis 1989;11:586-99.
6. Hirata-Davis CAI, Stein DJ, Guay DRP, Gruninger RP, Peterson PK. A randomized study of ciprofloxacin versus ceftriaxone in the treatment of nursing home-acquired lower respiratory tract infections. J Am Geriatr Soc 1991;39:979-85.
7. Drinka PJ, Gauerke C, Voeks S, et al. Pneumonia in a nursing home. J Gen Intern Med 1994;9:650-2.
8. Pick N, McDonald A, Bennett N, et al. Pulmonary aspiration in a long-term care setting: clinical and laboratory observations and an analysis of risk factors. J Am Geriatr Soc 1996;44:763-8.
9. John JF, Ribner BS. Antibiotic resistance in long-term care facilities. Infec Control Hosp Epidemiol 1991;12:245-50.
10. Gabrel CS. Characteristics of elderly nursing home current residents and discharges: data from the 1997 National Nursing Home Survey. Advance Data 2000;312:1-15.
11. Hutt E, Frederickson E, Kramer AM. Association between quality of care and survival in nursing home acquired pneumonia. Abstract presented at: American Geriatrics Society 58th Annual Scientific Meeting; May 9-13, 2001; Chicago, IL.
12. Evans RS, Pestotnik SL, Classen DC, et al. A computer-assisted management program for antibiotics and other antiinfective agents. N Engl J Med 1998;338:232-8.
13. Dempsey CL. Nursing home-acquired pneumonia: outcomes from a clinical process improvement program. Pharmacotherapy 1995;15:33S-38S.
14. Naughton BJ, Mylotte JM, Ramadan F, Karuza J, Priore RL. Antibiotic use, hospital admissions and mortality before and after implementing guidelines for nursing home-acquired pneumonia. J Am Geriatr Soc 2001;49:1020-4.
15. Bentley DW, Bradley S, High K, Schoenbaum S, Taler G, Yoshikawa TT. Practice guideline for evaluation of fever and infection in long-term care facilities. J Am Geriatr Soc 2001;49:210-22.
16. Nicolle LE, Bentley DW, Garibaldi R, Neuhaus E, Smith PW. Antimicrobial use in long-term care facilities. Infect Control Hosp Epidemiol 2000;21:537-45.
17. Loeb M, Bentley DW, Bradley S, et al. Development of minimum criteria for the initiation of antibiotics in residents of long-term-care facilities: results of a consensus conference. Infec Control Hosp Epidemiol 2001;22:120-4.
18. Naughton B, Mylotte JM. Treatment guideline for nursing home-acquired pneumonia based on community practice. J Am Geriatr Soc 2000;48:82-8.
19. Gross PA, Swenson DL, Dellinger EP, et al. Purpose of quality standards for infectious diseases. Clin Infect Dis 1994;18:421.-
20. Niederman MS, Bass JB, Campbell GD, et al. Guidelines for the initial management of adults with community acquired pneumonia: diagnosis, assessment of severity, and initial antimicrobial therapy. Am Rev Respir Dis 1993;148:1418-26.
21. Campbell GD, Niederman MS, Broughton WA, et al. Hospital-acquired pneumonia in adults: diagnosis, assessment of severity, initial antimicrobial therapy, and preventative strategies. Am J Respir Crit Care Med 1995;153:1711-25.
22. Fine MJ, Smith MA, Carson CA, et al. Efficacy of pneumococcal vaccination in adults: a meta-analysis of randomized controlled trials. Arch Intern Med 1994;154:2666-77.
23. Ortqvist A, Hedlund J, Burman L, et al. Randomised trial of 23-valent pneumococcal capsular polysaccharide vaccine in prevention of pneumonia in middle-aged and elderly people. Lancet 1998;351:399-403.
24. Koivula I, Sten M, Leinonen M, Makela PH. Clinical efficacy of pneumococcal vaccine in the elderly: a randomized, single-blind population-based trial. Am J Med 1997;103:281-90.
25. Quick RE, Hoge CW, Hamilton DJ, Whitney CJ, Borges M, Kobayashi JM. Underutilization of pneumococcal vaccine in nursing homes in Washington state: report of a serotype-specific outbreak and a survey. Am J Med 1993;94:149-52.
26. Nuorti JP, Butlere JC, Crutcher JM, et al. An outbreak of multidrug-resistant pneumococcal pneumonia and bacteremia among unvaccinated nursing home residents. N Engl J Med 1998;338:1861-8.
27. Loeb M, McGeer A, McArthur M, Walter S, Simor AE. Risk factors for pneumonia and other lower respiratory tract infections in elderly residents of long-term care facilities. Arch Intern Med 1999;159:2058-64.
28. Gross PA, Hermogenes AW, Sacks HS, Lau J, Levandowski RA. The efficacy of influenza vaccine in elderly persons. Ann Intern Med 1995;123:518-27.
29. Potter J, Stott DJ, Roberts MA, et al. Influenza vaccination of health care workers in long-term-care hospitals reduces the mortality of elderly patients. J Infect Dis 1997;175:1-6.
30. Carman WF, Elder AG, Wallace LA, et al. Effects of influenza vaccination of health-care workers on mortality of elderly people in long-term care: a randomised controlled trial. Lancet 2000;355:93-7.
31. McGeer A, Campbell B, Emori TG, et al. Definitions of infection for surveillance in long-term care facilities. Am J Infect Control 1991;19:1-7.
32. Mehr DR. Nursing home acquired pneumonia: how and where to treat? J Am Board Fam Pract 1997;10:168-70.
33. Fine MJ, Auble TE, Yealy DM, et al. A prediction rule to identify low-risk patients with community-acquired pneumonia. N Engl J Med 1997;336:243-50.
34. Naughton BJ, Mylotte JM, Tayara A. Outcome of nursing home-acquired pneumonia: derivation and application of a practical model to predict 30 day mortality. J Am Geriatr Soc 2000;48:1292-9.
35. Li J, Birkhead GS, Strogatz DS, Coles FB. Impact of institution size, staffing patterns, and infection control practices on communicable disease outbreaks in New York state nursing homes. Am J Epidemiol 1996;143:1042-9.
36. Kutner JS, Kramer AM, Mortimore EF, Feuerberg MA. Hospitalization of nursing home residents: a qualitative study. Ann Long-Term Care 1998;6:1-10.
37. Meehan TP, Chua-Reyes JM, Tate J, et al. Process of care performance, patient characteristics, and outcomes in elderly patients hospitalized with community-acquired or nursing home-acquired pneumonia. Chest 2000;117:1378-85.
38. Mehr DR, Binder EF, Kruse RL, Zweig SC, Madsen RW, D’Agostino RB. Clinical findings associated with radiographic pneumonia in nursing home residents. J Fam Pract 2001;50:931-7.
39. Bentley DW. Bacterial pneumonia in the elderly: clinical features, diagnosis, etiology, and treatment. Gerontology 1984;30:297-307.
40. Meehan TP, Fine MJ, Krumholz HM, et al. Quality of care, process, and outcomes in elderly patients with pneumonia. JAMA 1997;278:2080-4.
41. Luna CM, Vujacich P, Niederman MS, et al. Impact of BAL data on the therapy and outcome of ventilator-associated pneumonia. Chest 1997;111:676-85.
42. Degelau J, Guay D, Straub K, Luxenberg MG. Effectiveness of oral antibiotic treatment in nursing home-acquired pneumonia. J Am Geriatr Soc 1995;43:245-51.
43. Medina-Walpole AM, McCormick WC. Provider practice patterns in nursing home-acquired pneumonia. J Am Geriatr Soc 1998;46:187-92.
44. Mehr DR, Foxman B, Colombo P. Risk factors for mortality from lower respiratory infections in nursing home patients. J Fam Pract 1992;34:585-91.
45. Gleason PP, Meehan TP, Fine JM, Galusha DH, Fine MJ. Associations between initial antimicrobial therapy and medical outcomes for hospitalized elderly patients with pneumonia. Arch Intern Med 1999;159:2562-72.
46. Garb JL, Brown RB, Garb JR, Tuthill RW. Differences in etiology of pneumonias in nursing home and community patients. JAMA 1978;240:2169-72.
47. Nicolle LE, McIntyre M, Zacharies H, MacDonnell JA. Twelve-month surveillance of infections in institutionalized elderly men. J Am Geriatr Soc 1994;32:513-9.
48. Phillips SL, Branaman-Phillips J. The use of intramuscular cefoperazone versus intramuscular ceftriaxone in patients with nursing home-acquired pneumonia. J Am Geriatr Soc 1993;41:1071-4.
49. Chow CW, Senathiragah N, Rawji J, Chan M, Lee-Pack LR, Chan CK. Interim report on drug utilization review of community-acquired and nosocomial pneumonia: clinical, bacteriological and radiological spectrum. Can J Infect Dis 1994;5(Suppl C):20C-27C.
50. Muder RR. Pneumonia in residents of long-term care facilities: epidemiology, etiology, management, and prevention. Am J Med 1998;105:319-30.
51. Marrie TJ, Blanchard W. A comparison of nursing home-acquired pneumonia patients with patients with community-acquired pneumonia and nursing home patients without pneumonia. J Am Geriatr Soc 1997;45:50-5.
52. Gilbert DN, Moellering RC, Sande MA. The Sanford Guide to Antimicrobial Therapy. 30th ed. Hyde Park, VT: Antimicrobial Therapy, Inc.; 2001.
53. Troy CJ, Peeling RW, Ellis AG, et al. Chlamydia pneumoniae as a new source of infectious outbreaks in nursing homes. JAMA 1997;277:1214-8.
—William Osler, ca 1900
We convened a multidisciplinary, multispecialty panel to develop comprehensive evidence and consensus-based guidelines for managing nursing home-acquired pneumonia. The panel began with explicit criteria for process of care quality measures, performed a comprehensive review of the English-language literature, evaluated the quality of the evidence, and drafted a set of proposed guidelines. The panel reviewed the draft, an annotated bibliography, and data from a study of 30-day survival from nursing home-acquired pneumonia, and then participated in an all-day meeting in January 2001. Using a modified Delphi process, the panel refined the guidelines and developed a care pathway. The guidelines recommend a comprehensive approach, including immunization of staff and residents, and communication between nursing staff and the attending physician within 2 hours of symptom onset. Probable pneumonia was defined. An algorithm was delineated for assessing the patient’s wishes for hospitalization and aggressive care, and deciding on hospitalization based on the severity of the illness as well as the capacity of the nursing home to provide acute care. The timing and extent of evaluation in a nursing home relative to the rapid initiation of antibiotics should depend on whether the patient has any unstable vital signs. An antibiotic covering Streptococcus pneumoniae, Haemophilus influenzae, common gram-negative rods, and Staphylococcus aureus should be given for 10 to 14 days, orally if the patient is able to take medications by mouth.
Mortality from nursing home-acquired pneumonia is as high as 44%,1and nearly a third of those who survive suffer significant functional decline.2 Nursing home-acquired pneumonia is an entity distinct from community-acquired pneumonia in the elderly and nosocomial pneumonia. Older adults in nursing homes are more likely than community-dwelling older persons, but less likely than hospitalized elderly patients, to be colonized with gram-negative rods and pathogens with multiple antibiotic resistance.3-8Inappropriate use of antibiotics in long-term care facilities contributes significantly to the growing problem of antibiotic resistance generally.9 In addition, most nursing home residents are cognitively impaired, immunocompromised, have multiple functional deficits, or have dysphagia, which further contributes to their vulnerability.10
In recent work11 with a national nursing home sample, we showed that high quality care, including appropriate antibiotic use, hospitalization when indicated, and rapid identification of and response to respiratory symptoms, is associated with improved survival of residents who acquire pneumonia. Unfortunately, we also found that many of the 58 nursing homes in our study provided less than adequate care; for example, only 31% of residents received antibiotics within one 8-hour shift of symptom onset.11
Convincing evidence indicates that treatment guidelines improve pneumonia outcomes in acute care settings,12,13 and preliminary indications suggest that they may have a positive impact on processes of care in nursing facilities.14 Three guidelines on diagnosis and treatment of infections in nursing homes have been published in the last 2 years,15-17but these guidelines are not specific to pneumonia. The only guideline specific to nursing home-acquired pneumonia used current community practice in 1 metropolitan area to define guidelines for antibiotic use.18 The outline specifically does not address issues of diagnostic work-up, decision to hospitalize, or timing of initial antibiotic treatment. We therefore convened a national panel of experts in infectious disease, pharmacology, pulmonology, geriatrics, and nursing to develop comprehensive evidence-based guidelines for management of nursing home-acquired pneumonia. The guidelines address immunization, infection control, timing and thoroughness of nurse and physician evaluation of lower respiratory tract infections, criteria for hospitalization, and criteria for antibiotic spectrum, timing, route, and duration.
Guideline development
Literature review
A comprehensive literature review was undertaken using Ovid (http://www.ovid.com/) and the “explode” version of each of the following key words: nursing homes, long-term care facilities, skilled nursing facilities, and pneumonia, to search MEDLINE from 1975 through 2000. Only studies published in English and germane to nursing home residents in the United States and Canada were examined. Results of the search were augmented by a local mulidisciplinary team, consisting of faculty in geriatric studies, infectious disease, pulmonology, and pharmacology at the University of Colorado Health Sciences Center, an internist who practices exclusively in nursing homes, and a nursing home nurse consultant. This team developed explicit criteria for nursing home-acquired pneumonia processes of care, as described previously.11
Construction of draft guidelines
Working with the explicit criteria developed by the local team, the data from our retrospective study of process of care and survival, and the published literature on nursing home-acquired pneumonia, we drafted an initial set of comprehensive guidelines. We then graded the recommendations according to a standard system for defining quality, with 3 categories for recommendation strength (A, good evidence; B, moderate evidence; C, poor evidence) and 3 grades for quality of evidence (I, at least 1 properly randomized, controlled trial; II, at least 1 well-designed clinical trial without randomization from cohort or case-controlled analytic studies, multiple time series, or dramatic results in uncontrolled experiments; III, opinions of respected authorities based on clinical experience, descriptive studies, or reports of expert committees).19 Published Canadian and American guidelines for treatment of community-acquired and nosocomial pneumonia formed a template for the antibiotic recommendations.20,21
Modified delphi process
A multidisciplinary, multispecialty panel was recruited from nationally recognized experts in nursing home-acquired pneumonia, geriatric and infectious disease pharmacology, pneumonia treatment guideline development, and nursing home nurses (see Appendix). Panel members received an annotated version of the draft guidelines with a bibliography and the questionnaire described below. A table of the activity spectrum of currently available antibiotics, a table summarizing published reports on the microbiology of nursing home-acquired pneumonia (see Table 1), and tables summarizing our retrospective study of care processes in nursing homes and 30-day survival11were also included in that mailing.
The questionnaire asked whether each proposed guideline was clear, specific, feasible, measurable, and commensurate with his or her usual practice. Panelists were also asked to score each proposed guideline on its importance in determining the outcome of a nursing home-acquired pneumonia episode on a 5-point Likert scale, with 1 being not important and 5 being extremely important. Suggestions for substantive changes were elicited. The questionnaires were returned 2 weeks before an all-day, face-to-face meeting. For each guideline we calculated the percentage of panelists who agreed that it met each of the 5 criteria outlined. The means and standard deviations of the guideline weights were analyzed. Suggestions for substantive changes in the guidelines were collated and presented in tabular form, along with results of the survey, at the beginning of the meeting.
The most controversial guidelines were found to be classification of symptoms into a diagnosis of probable pneumonia, criteria for hospitalization, evaluation and treatment of residents not being hospitalized, and antibiotic choice. Less controversial were recommendations for immunization and treatment duration. The panel meeting devoted 2 hours to each of the 4 most controversial guidelines. The draft guideline was read and results of the pre-meeting ratings and suggestions were discussed. The guidelines were revised substantially and voted on. A care pathway was also developed at the meeting.
Because revisions were extensive and 1 of the panelists was participating by telephone, a copy of the revised guidelines and care pathway was sent to the panelists for further review and comment after the meeting. At that time, they were asked to rate each guideline on how confident they were that the recommendation should be included as part of the proposed guidelines using a 5-point Likert scale, with 1 denoting not confident and 5 denoting very confident. Because the lowest mean confidence rating was 3.4 after this iterative process, no guidelines were dropped from the set agreed upon at the meeting. Final revisions were made to the guidelines and their respective strength-and-quality-of-evidence grades, and approved by the panel.
TABLE 1
Nursing home pneumonia etiology according to studies using verified sputum* or blood culture
| Study | N | Year | Streptococcus pneumoniae (%) | Staphylococcus aureus (%) | Gram-negative rods (%) | Haemophilus influenzae (%) | Anerobes (%) | Multiple organisms (%) |
|---|---|---|---|---|---|---|---|---|
| Alvarez3 | 414 | 1988 | 32 | — | 29 | — | — | 22% |
| Peterson4 | 123 | 1988 | 10 | 3 | 21 | 9 | — | — |
| Marrie5 | 131 | 1989 | 16 | 13 | 13 | — | 4 | — |
| Hirata-Davis6 | 50 | 1991 | 12 | 4 | 15 | 10 | — | — |
| Drinka7 | 17 | 1994 | 30 | 6 | — | 25 | — | (Atypicals = 0) |
| Marrie and Blanchard51 | 71 | 1997 | 2/5 | — | 2/5 | — | — | — |
| Pick8 | 257 (98 aspirations) | 1996 | 3 | 38 | 6 | 3 | — | Group B streptococci 43% |
| *Expectorated sputum with > 25 white blood cells per low-power field and < 10 squamous epithelial cells per low-power field. | ||||||||
Recommendations
Each of the 25 guidelines is presented below. The strength and quality of evidence rating and panelists’ mean confidence score are shown in parentheses.
Prevention
- Residents should be vaccinated against Streptococcus pneumoniae at admission unless there is documentation of vaccination within 5 years preceding admission or they were allergic to previous pneumococcal vaccine. (A/I/4.7)22-27
- Residents should be vaccinated against influenza by December of each year if they are not allergic to eggs or previous influenza vaccine. Residents admitted between December and March should be vaccinated if not already immunized for the current influenza season, and they are not allergic as described above. (A/I/5.0)27,28
- The nursing facility should provide and strongly recommend immunization against influenza for all employees by December of each year if the employee is not allergic to eggs or previous vaccine. (A/I/4.9)29,30
Initial evaluation of residents with respiratory impairment
Once a resident has been noted to have a significant change in respiratory status, the clinician should use the care pathway outlined in (Figure 1). The panel believed that nurse practitioners and physician assistants with appropriate supervision could substitute for physician care in all pathway activities. Guideline recommendations 4 through 8 address the rapid recognition and physician notification of serious respiratory symptoms:
- Physicians with nursing home residents should be available or have cross-coverage by pager 24 hours/day, 7 days/week. (Absent/Absent/4.8)
- Nursing home staff should page the physician within 1 hour when a resident is noted to have any 2 of the following signs or symptoms: new or worsening cough; increased or newly purulent sputum; decline in cognitive, physical, or functional status; fever; hypothermia; dyspnea; tachypnea; chest pain; or new or worsening hypoxemia. (Absent/Absent/4.3)
- Nurse evaluation at symptom onset should include, at least, vital signs (temperature, pulse rate, respiratory rate, and blood pressure) and oxygen saturation if a pulse oximeter is available in the facility. (Absent/Absent/4.5)
- When notified as in guideline #5, the physician should call back within 1 hour. (Absent/Absent/4.3)
- If the nurse does not hear back from the physician within 1 hour, he or she should notify the director of nurses or designee. The nurse and the director of nurses should agree on a plan to notify the medical director or designee and ask him or her to assume care of that episode until the medical director can contact the attending physician. (Absent/Absent/3.5)
Once the physician has been notified, he or she must decide whether pneumonia is a leading consideration in the diagnosis of the reported change.
- The physician and nursing home staff should concur that pneumonia is a leading consideration in the diagnosis of the change noted in guideline #5 above, if the patient has 2 or more of the following signs or symptoms: new or worsening cough; newly purulent sputum; fever of 100.5°F or 2°F more than baseline; hypothermia < 96°F; dyspnea; respiratory rate > 25 breaths per minute; tachycardia; new or worse hypoxemia; pleuritic chest pain; a decline in cognitive or functional status; or new rales or rhonchi on chest examination. Such patients will be referred to in the remainder of the guidelines as having “probable pneumonia.” (C/III/4.1)5,31
FIGURE
Care pathway for nursing home-acquired pneumonia
Venue of care
Once pneumonia is considered likely, the physician must decide whether to hospitalize the resident. Because nursing home-acquired pneumonia is frequently the terminal event of a long and debilitating illness, this decision is especially important.
- The patient’s desire for hospitalization and aggressive care should be assessed directly if possible, or by chart review or discussion with the patient’s health care proxy. Patients with prior orders for no hospitalization or who refuse hospitalization (personally or by proxy) should not be hospitalized. (Absent/Absent/4.8)32
For patients willing to be hospitalized, the panel suggested categorization into 1 of 3 groups: patients whose severity of illness mandates hospitalization; patients whose severity of illness is such that the nursing home’s capacity to deliver acute care should be considered; and patients so stable that treatment in the nursing home is preferable. This set of recommendations is based on 2 retrospective series which suggest that only patients with elevated respiratory rates benefit from hospitalization2 and that patients hospitalized according to criteria similar to these tended to have better survival.11 These recommendations are modeled after Fine’s prediction rule to identify low-risk patients with community-acquired pneumonia,33 and take into account the mortality prediction model of Naughton and coworkers34 for nursing home-acquired pneumonia.
- Patients with 2 or more of the following symptoms should be hospitalized (C/III/4.1)2,11:
- If the nursing home cannot provide vital sign assessment every 4 hours, laboratory access, parenteral hydration, and 2 licensed nurses per shift in the facility, serious consideration should be given to hospitalizing patients with any one of the above. (C/III/4.1)11,35,36
- Patients with none of the above should be treated in the nursing home unless the patient or proxy insists on hospitalization. (B/II/4.5)2,11,33,34
Evaluating and monitoring patients who remain in nursing homes
- Nurse evaluation each shift should include, at least, vital signs with measured respiratory rate and oxygen saturation until symptoms resolve. (C/III/4.5)16,17,37
Although a study published by Mehr and colleagues38 after the panel proceedings suggested that patients with multiple signs and symptoms of nursing home-acquired pneumonia are so likely to have an infiltrate on chest x-ray that treating without first obtaining an x-ray may be acceptable, the panel recommended that:
- Patients with probable pneumonia should have a chest x-ray. (C/III/4.2)15,39
- Patients with probable pneumonia should be evaluated in person by the physician, ideally within 24 hours and certainly within 72 hours. (Absent/Absent/4.5)
- Because of the issue of antibiotic resistance, and not because of anticipated direct patient benefit, patients for whom antibiotics are ordered should have 1 blood culture drawn if this can be accomplished without delaying initiation of antibiotics longer than 1 hour. (C/III/3.4)37,40
The panel did not recommend sputum Gram’s stain and culture even though 2 recent guidelines on evaluating infection in long-term care facilities did.15,16 Obtaining high-quality sputa in this population is notoriously difficult.1
TABLE 2
Key recommendations of evidence
| Guideline | Strength/quality of evidence |
|---|---|
| 1, 2, 3: Vaccinate staff and residents against influenza and residents against Streptococcus pneumoniae. | A/I |
| 4, 5, 6, 7, 8: Nursing assessment of change in condition should include a full set of vital signs with oxygen saturation. Initial communication with the physician should be completed within 2 hours of symptom onset. | Absent |
| 9: Probable pneumonia is defined as 2 or more of the following: new or worsening cough; newly purulent sputum; temperature > 100.5°F, < 96°F, or 2°F more than baseline; respiratory rate > 25 breaths per minute, tachycardia; new or worsening hypoxia; pleuritic chest pain; decline in cognitive or functional status; physical findings on chest examination such as rales or rhonchi. | C/III |
| 10: Patient’s desire for hospitalization and aggressive care should be assessed at the onset of the episode and directly with the patient, if possible. | Absent |
| 11, 12, 13: The decision to hospitalize should be based on a combination of vital sign criteria, active comorbidity, and nursing home capabilities. | C/III |
| 23: The antibiotic chosen as empiric therapy should cover S pneumoniae, Haemophilus influenzae, common gram-negative rods, and Staphylococcus aureus. | B/II |
| 25: Use oral antibiotics if the patient can take oral medication. | A/I |
| Recommendations were graded according to a standard system,19with 3 categories for recommendation strength (A, good evidence; B, moderate evidence; C, poor evidence) and 3 grades for quality of evidence (I, at least 1 properly randomized, controlled trial; II, at least 1 well-designed clinical trial without randomization from cohort or case-controlled analytic studies, multiple time series, or dramatic results in uncontrolled experiments; III, opinions of respected authorities based on clinical experience, descriptive studies, or reports of expert committees). | |
Antibiotic use
Extrapolating from studies of hospital- and community-acquired pneumonia indicating a survival benefit for patients who receive antibiotics within 8 hours of arrival in hospital or symptom onset,40 the panel made the following recommendations, which do not conflict with 3 recently published guidelines on use of antibiotics in long-term care facilities.16
- Patients being sent immediately to the hospital should receive 1 dose of parenteral antibiotics prior to leaving the nursing home unless this treatment would delay transport for more than 1 hour. The hospital should be notified of the antibiotic given. (B/II/4.4)40
- A single dose of antibiotics should be ordered immediately (simultaneously with the chest x-ray order) if the patient has any of the following: systolic blood pressure < 90 mm Hg or 20 mm Hg less than baseline; oxygen saturation < 90% on room air at sea level; pulse > 130 beats per minute; respiratory rate > 30 breaths per minute; or temperature > 101.5°F. (B/II/4.5)40,41
- For patients with probable pneumonia who are stable (oxygen saturation > 90%, systolic blood pressure > 90 mm Hg, pulse < 120 beats per minute, and respiratory rate < 30 beats per minute), a decision to use antibiotics may await results of the chest x-ray if they will be available within 24 hours. (C/III/3.8)40,41 If the chest x-ray does not confirm the suspicion of pneumonia, consideration should be given to stopping antibiotic treatment.
- Antibiotics, if ordered, should be delivered to the patient within 4 hours of the orders being given by the physician. (B/II/4.5)40,41
- If the patient is able to take oral medication, that route is preferred, except that patients being sent to the hospital should have 1 parenteral dose. (A/I/4.7)4,42,43
Because it is difficult to obtain a bacteriologic diagnosis in most nursing home residents, the initial choice of antibiotic must be empiric. Based on the published studies of nursing home-acquired pneumonia bacteriology, half of which used high-quality sputum samples (> 25 white blood cells per low-power field and < 10 squamous epithelial cells per low-power field, (see Table 1), the panel recommended a broad-spectrum antibiotic covering S pneumoniae, Haemophilus influenzae, gram-negative rods, and Staphylococcus aureus. In areas or facilities where resistance of S pneumoniae to penicillin is known to be high, treatment should be modified accordingly. These recommendations differ from those proposed by the Society of Health Care Epidemiology of America in their 2000 position paper,16 but are similar to those proposed by Naughton and Mylotte18 in their guideline derived from current community practice in Buffalo, New York, except that the current panel recommends the addition of a macrolide. These differences are driven by controversy over the relative importance of gram-negative rods as etiologic vs colonizing organisms in nursing home-acquired pneumonia; the relative importance of atypical organisms; and by the current panel’s concern that an important percentage of bacteria in long-term care facilities may already be resistant to many of the antibiotics endorsed by the Society of Health Care Epidemiology of America. Moreover, 3 studies have suggested a survival benefit of broader-spectrum empiric treatment in nursing home-acquired pneumonia.11,44,45
- The antibiotic chosen as empiric therapy needs to cover S pneumoniae, H influenzae, gram-neg-ative rods, and S aureus. (B/II/4.5)37,31,39,44-51
- Currently acceptable choices for empiric treatment include: antipneumococcal quinolones or an extended-spectrum beta-lactam plus a macrolide other than erythromycin. (C/III/4.5)45,52,53
- Treat for 10 to 14 days. (B/II/4.4)18,25
Conclusions
A multidisciplinary, multispecialty panel of nationally recognized experts in nursing home-acquired pneumonia achieved consensus in proposing guidelines and a care pathway to prevent, recognize, evaluate, and treat nursing home-acquired pneumonia. For immunization and use of oral antibiotics when possible, evidence was sufficient to make a strong (A/I) recommendation. Even in areas in which evidence was lacking, the panel agreed readily. Thus for most of the 25 proposed guidelines, strong evidence and/or ready consensus existed among national experts from many disciplines.
The process of guideline development that we followed was systematic and meticulous. The panel was diverse, including nurses and pharmacologists, nationally recognized experts in infectious disease, nursing home care, geriatrics, and pulmonology. The breadth of the panel’s collective experience, and the rigor of the Delphi process we followed, lend face validity to the proposed guidelines despite some differences with other guidelines, as noted above.45,53
These guidelines are uniquely comprehensive. They address management of pneumonia from prevention through diagnosis, the decision to hospitalize, and treatment. Such a comprehensive approach is essential given the many people and systems that interact in the care of nursing home residents, a uniquely frail and vulnerable population. Evidence from our work and others11,13 suggests that only a comprehensive approach will, over time, improve the outcome of this important illness.
The guidelines have 2 important limitations. They have not yet been approved by any official professional society, nor have they been tested prospectively. Prospective testing is required to validate whether, in fact, the proposed guidelines can be implemented and, if implemented, they will improve mortality, function, cost of care, rehospitalization rates, and community discharge rates. We chose not to seek official approval of the guidelines until they can be proven effective.
We believe the proposed guidelines can and should be used to the fullest extent possible by nursing homes and physicians who practice there, because the combination of evidence and consensus is strong. Nursing home-acquired pneumonia causes excess mortality and functional loss. The proposed guidelines, based as they are in empiric evidence, common sense, and expert consensus, offer some hope of decreasing rehospitalization and cost, mitigating functional decline, and improving survival.
APPENDIX: PANEL MEMBERS . Diana Blake, RN, Western Hills Health Care Center, Lakewood, CO; JoAnn G. Congdon, RN, PhD, University of Colorado HSC, Denver, CO; Douglas Fish, PharmD, University of Colorado, Denver, CO; Evelyn Hutt, MD, University of Colorado HSC, Denver, CO; Denise Iskra, RN, Life Care of Westminster, Westminster, CO; Andrew M. Kramer, MD, University of Colorado, Denver, CO; Thomas J. Marrie, MD, University of Alberta, Edmonton, Alberta, Canada; Mark Loeb, MD, McMaster University, Hamilton, Ontario, Canada; Wayne C. McCormick, MD, MPH, Harborview Medical Center, Seattle, WA; Annette M. Medina-Walpole, MD, University of Rochester, Rochester, NY; David R. Mehr, MD, MS, University of Missouri–Columbia, Columbia, MO; Michael S. Niederman, MD, State University of New York at Stony Brook, Mineola, NY; Phillip K. Peterson, MD, University of Minnesota, Minneapolis, MN; J. Mark Ruscin, PharmD, University of Colorado, Denver, CO; Thomas T. Yoshikawa, MD, Charles Drew University, Los Angeles, CA.
Acknowledgments
The authors acknowledge the members of the panel for their thoughtful participation and willingness to review multiple drafts of the guidelines and manuscript; Steven Teutsch, MD, Senior Director, Outcomes Research and Management, Merck & Co., Inc., for his support and advice; Lisa Lampinen for manuscript preparation; and Merck & Co., Inc., for funding.
1. Medina-Walpole AM, Katz PR. Nursing home-acquired pneumonia. J Am Geriatr Soc 1999;47:1005-15.
2. Fried TR, Gillick MR, Lipsitz LA. Short-term functional outcomes of long-term care residents with pneumonia treated with and without hospital transfer. J Am Geriatr Soc 1997;45:302-6.
3. Alvarez S, Shell CG, Woolley TW, et al. Nosocomial infections occurring in nursing home residents. J Gerontol 1988;43:M9-17.
4. Peterson PK, Stein DJ, Guay D, et al. Prospective study of lower respiratory tract infections in an extended-care nursing home program: potential role of oral ciprofloxacin. Am J Med 1988;85:164-71.
5. Marrie TJ, Durant H, Yates L. Community-acquired pneumonia requiring hospitalization: 5-year prospective study. Rev Infect Dis 1989;11:586-99.
6. Hirata-Davis CAI, Stein DJ, Guay DRP, Gruninger RP, Peterson PK. A randomized study of ciprofloxacin versus ceftriaxone in the treatment of nursing home-acquired lower respiratory tract infections. J Am Geriatr Soc 1991;39:979-85.
7. Drinka PJ, Gauerke C, Voeks S, et al. Pneumonia in a nursing home. J Gen Intern Med 1994;9:650-2.
8. Pick N, McDonald A, Bennett N, et al. Pulmonary aspiration in a long-term care setting: clinical and laboratory observations and an analysis of risk factors. J Am Geriatr Soc 1996;44:763-8.
9. John JF, Ribner BS. Antibiotic resistance in long-term care facilities. Infec Control Hosp Epidemiol 1991;12:245-50.
10. Gabrel CS. Characteristics of elderly nursing home current residents and discharges: data from the 1997 National Nursing Home Survey. Advance Data 2000;312:1-15.
11. Hutt E, Frederickson E, Kramer AM. Association between quality of care and survival in nursing home acquired pneumonia. Abstract presented at: American Geriatrics Society 58th Annual Scientific Meeting; May 9-13, 2001; Chicago, IL.
12. Evans RS, Pestotnik SL, Classen DC, et al. A computer-assisted management program for antibiotics and other antiinfective agents. N Engl J Med 1998;338:232-8.
13. Dempsey CL. Nursing home-acquired pneumonia: outcomes from a clinical process improvement program. Pharmacotherapy 1995;15:33S-38S.
14. Naughton BJ, Mylotte JM, Ramadan F, Karuza J, Priore RL. Antibiotic use, hospital admissions and mortality before and after implementing guidelines for nursing home-acquired pneumonia. J Am Geriatr Soc 2001;49:1020-4.
15. Bentley DW, Bradley S, High K, Schoenbaum S, Taler G, Yoshikawa TT. Practice guideline for evaluation of fever and infection in long-term care facilities. J Am Geriatr Soc 2001;49:210-22.
16. Nicolle LE, Bentley DW, Garibaldi R, Neuhaus E, Smith PW. Antimicrobial use in long-term care facilities. Infect Control Hosp Epidemiol 2000;21:537-45.
17. Loeb M, Bentley DW, Bradley S, et al. Development of minimum criteria for the initiation of antibiotics in residents of long-term-care facilities: results of a consensus conference. Infec Control Hosp Epidemiol 2001;22:120-4.
18. Naughton B, Mylotte JM. Treatment guideline for nursing home-acquired pneumonia based on community practice. J Am Geriatr Soc 2000;48:82-8.
19. Gross PA, Swenson DL, Dellinger EP, et al. Purpose of quality standards for infectious diseases. Clin Infect Dis 1994;18:421.-
20. Niederman MS, Bass JB, Campbell GD, et al. Guidelines for the initial management of adults with community acquired pneumonia: diagnosis, assessment of severity, and initial antimicrobial therapy. Am Rev Respir Dis 1993;148:1418-26.
21. Campbell GD, Niederman MS, Broughton WA, et al. Hospital-acquired pneumonia in adults: diagnosis, assessment of severity, initial antimicrobial therapy, and preventative strategies. Am J Respir Crit Care Med 1995;153:1711-25.
22. Fine MJ, Smith MA, Carson CA, et al. Efficacy of pneumococcal vaccination in adults: a meta-analysis of randomized controlled trials. Arch Intern Med 1994;154:2666-77.
23. Ortqvist A, Hedlund J, Burman L, et al. Randomised trial of 23-valent pneumococcal capsular polysaccharide vaccine in prevention of pneumonia in middle-aged and elderly people. Lancet 1998;351:399-403.
24. Koivula I, Sten M, Leinonen M, Makela PH. Clinical efficacy of pneumococcal vaccine in the elderly: a randomized, single-blind population-based trial. Am J Med 1997;103:281-90.
25. Quick RE, Hoge CW, Hamilton DJ, Whitney CJ, Borges M, Kobayashi JM. Underutilization of pneumococcal vaccine in nursing homes in Washington state: report of a serotype-specific outbreak and a survey. Am J Med 1993;94:149-52.
26. Nuorti JP, Butlere JC, Crutcher JM, et al. An outbreak of multidrug-resistant pneumococcal pneumonia and bacteremia among unvaccinated nursing home residents. N Engl J Med 1998;338:1861-8.
27. Loeb M, McGeer A, McArthur M, Walter S, Simor AE. Risk factors for pneumonia and other lower respiratory tract infections in elderly residents of long-term care facilities. Arch Intern Med 1999;159:2058-64.
28. Gross PA, Hermogenes AW, Sacks HS, Lau J, Levandowski RA. The efficacy of influenza vaccine in elderly persons. Ann Intern Med 1995;123:518-27.
29. Potter J, Stott DJ, Roberts MA, et al. Influenza vaccination of health care workers in long-term-care hospitals reduces the mortality of elderly patients. J Infect Dis 1997;175:1-6.
30. Carman WF, Elder AG, Wallace LA, et al. Effects of influenza vaccination of health-care workers on mortality of elderly people in long-term care: a randomised controlled trial. Lancet 2000;355:93-7.
31. McGeer A, Campbell B, Emori TG, et al. Definitions of infection for surveillance in long-term care facilities. Am J Infect Control 1991;19:1-7.
32. Mehr DR. Nursing home acquired pneumonia: how and where to treat? J Am Board Fam Pract 1997;10:168-70.
33. Fine MJ, Auble TE, Yealy DM, et al. A prediction rule to identify low-risk patients with community-acquired pneumonia. N Engl J Med 1997;336:243-50.
34. Naughton BJ, Mylotte JM, Tayara A. Outcome of nursing home-acquired pneumonia: derivation and application of a practical model to predict 30 day mortality. J Am Geriatr Soc 2000;48:1292-9.
35. Li J, Birkhead GS, Strogatz DS, Coles FB. Impact of institution size, staffing patterns, and infection control practices on communicable disease outbreaks in New York state nursing homes. Am J Epidemiol 1996;143:1042-9.
36. Kutner JS, Kramer AM, Mortimore EF, Feuerberg MA. Hospitalization of nursing home residents: a qualitative study. Ann Long-Term Care 1998;6:1-10.
37. Meehan TP, Chua-Reyes JM, Tate J, et al. Process of care performance, patient characteristics, and outcomes in elderly patients hospitalized with community-acquired or nursing home-acquired pneumonia. Chest 2000;117:1378-85.
38. Mehr DR, Binder EF, Kruse RL, Zweig SC, Madsen RW, D’Agostino RB. Clinical findings associated with radiographic pneumonia in nursing home residents. J Fam Pract 2001;50:931-7.
39. Bentley DW. Bacterial pneumonia in the elderly: clinical features, diagnosis, etiology, and treatment. Gerontology 1984;30:297-307.
40. Meehan TP, Fine MJ, Krumholz HM, et al. Quality of care, process, and outcomes in elderly patients with pneumonia. JAMA 1997;278:2080-4.
41. Luna CM, Vujacich P, Niederman MS, et al. Impact of BAL data on the therapy and outcome of ventilator-associated pneumonia. Chest 1997;111:676-85.
42. Degelau J, Guay D, Straub K, Luxenberg MG. Effectiveness of oral antibiotic treatment in nursing home-acquired pneumonia. J Am Geriatr Soc 1995;43:245-51.
43. Medina-Walpole AM, McCormick WC. Provider practice patterns in nursing home-acquired pneumonia. J Am Geriatr Soc 1998;46:187-92.
44. Mehr DR, Foxman B, Colombo P. Risk factors for mortality from lower respiratory infections in nursing home patients. J Fam Pract 1992;34:585-91.
45. Gleason PP, Meehan TP, Fine JM, Galusha DH, Fine MJ. Associations between initial antimicrobial therapy and medical outcomes for hospitalized elderly patients with pneumonia. Arch Intern Med 1999;159:2562-72.
46. Garb JL, Brown RB, Garb JR, Tuthill RW. Differences in etiology of pneumonias in nursing home and community patients. JAMA 1978;240:2169-72.
47. Nicolle LE, McIntyre M, Zacharies H, MacDonnell JA. Twelve-month surveillance of infections in institutionalized elderly men. J Am Geriatr Soc 1994;32:513-9.
48. Phillips SL, Branaman-Phillips J. The use of intramuscular cefoperazone versus intramuscular ceftriaxone in patients with nursing home-acquired pneumonia. J Am Geriatr Soc 1993;41:1071-4.
49. Chow CW, Senathiragah N, Rawji J, Chan M, Lee-Pack LR, Chan CK. Interim report on drug utilization review of community-acquired and nosocomial pneumonia: clinical, bacteriological and radiological spectrum. Can J Infect Dis 1994;5(Suppl C):20C-27C.
50. Muder RR. Pneumonia in residents of long-term care facilities: epidemiology, etiology, management, and prevention. Am J Med 1998;105:319-30.
51. Marrie TJ, Blanchard W. A comparison of nursing home-acquired pneumonia patients with patients with community-acquired pneumonia and nursing home patients without pneumonia. J Am Geriatr Soc 1997;45:50-5.
52. Gilbert DN, Moellering RC, Sande MA. The Sanford Guide to Antimicrobial Therapy. 30th ed. Hyde Park, VT: Antimicrobial Therapy, Inc.; 2001.
53. Troy CJ, Peeling RW, Ellis AG, et al. Chlamydia pneumoniae as a new source of infectious outbreaks in nursing homes. JAMA 1997;277:1214-8.
Aspirin prophylaxis in patients at low risk for cardiovascular disease: A systematic review of all-cause mortality
- Only 3 primary prevention studies of aspirin included low-risk subjects and measured all-cause mortality.
- Two of those studies demonstrated no significant decrease in mortality with low-dose aspirin.
- The Nurses Health Study demonstrated a dose-dependent increase in mortality with aspirin use.
- There is insufficient evidence for or against recommending aspirin to low-risk individuals.
Cardiovascular disease is the leading cause of death in the United States, and aspirin, a platelet aggregate inhibitor, is often recommended as prophylaxis for cardiovascular disease.1-3Clinical studies have demonstrated the benefit of aspirin use for secondary prevention of cardiovascular disease and stroke.1,4-10 In high-risk subjects, aspirin has been proven effective in primary prevention of major cardiovascular events and nonfatal ischemic heart disease.11-13 Sanmuganathan and colleagues recently reported a meta-analysis of 4 randomized trials of aspirin for primary prevention. Although they determined that aspirin treatment is safe if the coronary event rate is at least 1.5% each year and unsafe if the rate is no higher than 0.5% each year, they did not address all-cause mortality, and 2 of the 4 trials did not include low-risk subjects.9
Many physicians and patients are prescribing aspirin with the expectation of reduced mortality in high-risk and low-risk individuals. Media advertisements and health programs may not clearly delineate the population for whom aspirin has clear benefits. A recent review suggested that aspirin is likely to be effective for primary prevention in yet to be defined groups.14 This review seeks to answer 2 questions. First, are there any primary prevention studies using aspirin that included only low-risk subjects? Second, should aspirin be prescribed routinely to persons at low risk for cardiovascular disease to decrease total mortality?
Methods
Search strategy
The MEDLINE database and the Cochrane Library were systematically searched using the terms aspirin or antiplatelet therapy and primary prevention or prevention and primary and mortality. An additional search was made with primary prevention and myocardial infarction or stroke. The Internet was searched (http://www.google.com) by using the same search terms. The studies were limited to human populations. Search results consisted of abstracts, complete reviews, and reference lists from articles. Morbidity associated with aspirin use also was reviewed.
Selection criteria: end points
Only those studies that investigated primary prevention of cardiovascular disease using aspirin, had low-risk subjects, and included a measure of total mortality were part of our analysis. We used the 2001 Adult Treatment Panel III Guidelines and the recent British Medical Journal clinical evidence guidelines on primary prevention of cardiovascular disorders to define the low-risk patient.15,16 Those guidelines classified major risk factors for ischemic vascular disease as hypertension, low high-density lipoprotein cholesterol, high lowdensity lipoprotein cholesterol, family history of premature coronary heart disease, smoking, diabetes, and advancing age (men ≥ 45 years, women ≥ 55 years). We also classified those patients with past cerebrovascular events, myocardial infarction, and angina as high risk. We defined low risk as having no more than 1 of these risk factors.
Every trial was evaluated independently by each author according to the Jadad scale.17 Based on information in the original articles, we recalculated the odds ratios (ORs) for each study. The results of the 2 randomized trails were combined by means of the Mantel-Haenszel method for combining ORs, and StatXact 4 for Windows was used for the analysis.18,19 The data were used to create a forest plot of mortal-ity.19 The decision to combine studies of like type was made a priority.
Results
MEDLINE search results for aspirin and primary prevention yielded 291 articles. Antiplatelet therapy and primary prevention yielded 64 articles. Myocardial infarction or stroke and primary prevention yielded 514 articles. Cross-referencing aspirin, prevention, and mortality yielded 690 articles. The Cochrane Library search of antiplatelet therapy and prevention and primary yielded 17 complete reviews and 6 abstracts of systematic reviews. No additional studies published or unpublished were identified through the Internet.
Five clinical trials and 1 cohort study that evaluated aspirin for primary prevention were identi-fied.11,12,20-23 One of those, a pilot study, was excluded because it did not provide mortality data for the aspirin and placebo groups.23 Two clinical trials, the Hypertension Optimal Treatment Trial and the Thrombosis Prevention Trial, did not include low-risk subjects.11,12 Although no studies were identified that included only low-risk subjects, 3 studies met our inclusion criteria. Characteristics of those 3 studies are reported in Table 1.
The US Physicians Health Study (USPHS) randomized physicians into 4 treatment groups: aspirin plus beta-carotene, aspirin plus placebo, betacarotene plus placebo, and placebo plus placebo.20 Both aspirin groups took 325 mg every other day. The mean age was 53.2 years.24 Fifty percent of the participants were current or past smokers, and 9% had hypertension. Although the rate of myocardial infarction was significantly lower in the aspirin group, there was no reduction in total cardiovascular mortality. The results are reported in Table 2. More side effects were noted in the aspirin group, including gastric ulcers, gastrointestinal bleeding, hemorrhagic stroke, and other bleeding disorders.20 No separate analysis of low-risk subjects’ risk was performed.
In the British Doctors Study (BDS), 66% of patients were randomized to take aspirin once daily and 33% were to avoid aspirin.21 More than half of the subjects were at least 60 years old. Physicians with stroke, myocardial infarction, ulcer disease, or currently taking any aspirin products were excluded. Six percent of the subjects had a history of heart disease other than myocardial infarction, 10% had hypertension, and 75% of participants were currently smoking or had a history of smoking. No significant differences were noted between groups for myocardial infarction or total mortality. By the end of the study, 44% of the aspirin group had discontinued aspirin secondary to side effects, the most common being dyspepsia. Of the control group, 2% per year started using aspirin because they developed risk factors such as vascular disease or for primary prevention. Low-risk individuals were not evaluated separately.
The Nurses Health Study (NHS) was a cohort study of women who were free of diagnosed coronary heart disease, stroke, and cancer at the start of the study. However, 29% of the women smoked and 15% had hypertension.22 The mean age was 46.0 years, and the follow-up was 96.7% of total potential person years. The study respondents were asked how many aspirin tablets they took per week: 0, 1 to 3, 4 to 6, 7 to 14, or 15+. Those who smoked or were overweight were more likely to take aspirin. No separate analysis of low-risk subjects was performed. Mortality from aspirin use was clearly dose dependent. For study participants taking 1 to 6 aspirin tablets each week, mortality was 0.84% (OR, 1.51; 95% confidence interval [CI], 1.26–1.82); for those taking 7 to 14 aspirin tablets, mortality was 0.99% (OR, 1.80; CI, 1.39–2.33); and for those taking 15+ aspirin tablets, mortality was 1.82% (OR, 3.32; CI, 2.62–4.21). Rates of myocardial infarction and stroke also were higher for all groups taking aspirin (see Table 2). When combined, the USPHS and the BDS demonstrated no significant difference in mortality between aspirin and placebo groups, whereas the NHS found increased mortality from aspirin (Figure).
TABLE 1
Characteristics of aspirin studies that included low-risk subjects
| USPHS | BDS | NHS | |
|---|---|---|---|
| Trial | Steering Committee20 | Peto et al21 | Manson et al22 |
| Study population | Healthy US physicians | Healthy UK physicians | Healthy US nurses |
| Study type | Randomized controlled trial | Randomized controlled trial | Cohort |
| Subjects in aspirin group | 11,037 | 3429 | 35,048 |
| Subjects in control group | 11,034 | 1710 | 52,630 |
| Treatment | 325 mg aspirin every other day | 500 mg/d aspirin | 1–15 aspirin tablets/wk |
| Comparison | Placebo | No aspirin | None |
| Follow-up time (y) | 5 | 6 | 6 |
| Jadad score | |||
| Randomization† | 1 | 2 | NA* |
| Blinding ‡ | 1 | 0 | NA |
| Withdrawals § | 1 | 0 | NA |
| Total | 3 | 2 | NA |
| Significant difference in mortality | No | No | Yes in favor of no aspirin |
| *The Jadad scale does not apply to cohort studies. | |||
| †Two points maximum. | |||
| ‡Two points maximum. | |||
| §One point maximum. | |||
| BDS, British Doctors Study; NA, not applicable; NHS, Nurses Health Study; USPHS, US Physicians Health Study. | |||
TABLE 2
Rates of myocardial infarction, stroke, total cardiovascular mortality, and total mortality in studies of aspirin vs no aspirin that included low-risk patients
| Study | |||
|---|---|---|---|
| Outcome | USPHS (5 y) | BDS (6 y) | NHS (6 y) |
| Myocardial infarction | |||
| Aspirin, n (%) | 139 (1.26) | 169 (4.93) | 244 (0.70) |
| No aspirin, n (%) | 239 (2.17) | 88 (5.15) | 157 (0.30) |
| OR (CI) | 0.58 (0.47–0.71) | 0.96 (0.73–1.24) | 2.34 (1.92–2.86)* |
| Stroke | |||
| Aspirin, n (%) | 119 (1.08) | 91 (2.65) | 109 (0.31) |
| No aspirin, n (%) | 98 (0.89) | 39 (2.28) | 89 (0.17) |
| OR (CI) | 1.22 (0.93–1.59) | 1.17 (0.80–1.71) | 1.84 (1.39–2.44)* |
| Total cardiovascular mortality | |||
| Aspirin, n (%) | 81 (0.73) | 148 (4.32) | 68 (0.19) |
| No aspirin, n (%) | 83 (0.75) | 79 (4.62) | 62 (0.12) |
| OR (CI) | 0.98 (0.72–1.33) | 0.93 (0.70–1.23) | 1.65 (1.17–2.33)* |
| Total mortality | |||
| Aspirin, n (%) | 217 (1.97) | 270 (7.87) | 354 (1.01) |
| No aspirin, n (%) | 227 (2.06) | 151 (8.83) | 292 (0.55) |
| OR (CI) | 0.95 (0.79–1.15) | 0.88 (0.72–1.09) | 1.83 (1.57–2.14)* |
| *OR significant at the .05 level. | |||
| BDS, British Doctors Study; CI, 95% confidence interval; n (%), number (percentage) of patients taking or not taking aspirin; NHS, Nurses Health Study; OR, odds ratio; USPHS, US Physicians Health Study. | |||
FIGURE Forest plot of mortality in healthy patients on aspirin
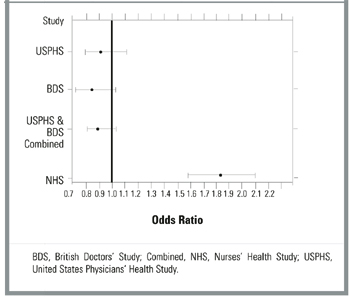
Discussion
To date, there has been no study of aspirin for primary prevention that included a separate analysis of patients who were free of cardiovascular risk factors. Each of the 3 studies that included low-risk subjects grouped them with subjects at higher risk, those known to benefit from aspirin.9,11,12 Even so, none of those studies demonstrated a statistically significant decrease in all-cause mortality. Even when combined, the BDS and the USPHS demonstrated no significant improvement in mortality. Mortality in the BDS was nearly 4 times greater than that in the USPHS. This finding is likely due to the higher baseline rate of smoking and other risk factors in the British doctors. In contrast to the BDS, the USPHS demonstrated significantly decreased rates for fatal and nonfatal myocardial infarction. Our analysis of the NHS associated aspirin with increased mortality, fatal myocardial infarction, and nonfatal myocardial infarction at any dose. The nurses on average had lower risk than the doctors, fewer smoked, and they were younger.
Many studies have clearly demonstrated the benefits of aspirin for primary prevention in high-risk subjects.10-12,25 There may be other benefits to taking prophylactic aspirin. In the Cancer Prevention Study II, aspirin use was associated with decreased death rates from colon cancer.26 Unfortunately, that study did not measure all-cause mortality.
There are a number of limitations to this study. There were no strictly low-risk studies of aspirin for primary prevention of cardiovascular mortality, and there was a paucity of studies that included low-risk subjects. Because the studies analyzed did not include only low-risk subjects, the results may not apply to all low-risk patients. The BDS did not include a placebo and was not blinded. Although not statistically significant, the ORs tended toward a protective effect for aspirin in the 2 randomized trials. The large difference in mortality between those 2 trials remains unexplained. The NHS was the only study to include women, and it was a cohort study, which is subject to selection and reporting biases. Therefore, aspirin users may have been at higher mortality risk due to smoking, obesity, or other illness, thus rendering the association between aspirin and higher mortality meaningless.
Many studies have shown significant side effects of aspirin, including epistaxis, peptic ulcer disease, gastrointestinal bleeds, and hemorrhagic stroke.15,20-22,27-32 In the BDS, 17% more subjects in the aspirin group developed peptic ulcer disease, and 19% stopped treatment during the first year secondary to gastrointestinal complaints.21
In conclusion, there is currently no evidence to recommend for or against the use of aspirin in low-risk individuals to decrease mortality. There may be other reasons to take aspirin prophylactically such as to reduce myocardial infarction or colon cancer. However, these benefits have not been established in a low-risk population. Health care providers should ask all patients whether they are taking aspirin and evaluate the risk-benefit ratio before recommending it.
1. Fuster V, Dyken M, Vokonas P, Hennekens C. Aspirin as a therapeutic agent in cardiovascular disease. Circulation 1993;87:659-75.
2. Weiss H, Aledort L. Impaired platelet/connective tissue reaction in man after aspirin ingestion. Lancet 1967;2:495-7.
3. Preston F, Whipps S, Jackson C, et al. Inhibition of prostacyclin and platelet thromboxane A2 after low dose aspirin. N Engl J Med 1981;304:76-9.
4. Hankey GJ. One year after CAPRIE, IST, and ESPS 2. Cerebrovasc Dis 1998;8(suppl 5):1-7.
5. Buring J, Hennekens C. Prevention of cardiovascular disease: risks and benefits of aspirin. J Gen Intern Med 1990;5(suppl 5):S54-7.
6. Sivenius J, Laakso M, Penttila IM, et al. The European Stroke Prevention Study: results according to sex. Neurology 1991;41:1189-92.
7. Lewis H, Davis J, Archibald D, Steinke W, Smitherman T. Protective effects of aspirin against acute myocardial infarction and death in men with unstable angina. N Engl J Med 1983;309:396-403.
8. Antiplatelet Trialists’ Collaboration. Collaborative overview of randomised trials of anti platelet therapy. Prevention of death, myocardial infarction, and stroke by prolonged antiplatelet therapy in various categories of patients. BMJ 1994;308:81-106.
9. Sanmuganathan PS, Ghahramani P, Jackson PR, Wallis EJ, Ramsay LE. Aspirin for primary prevention of coronary heart disease: safety and absolute benefit related to coronary risk derived from metaanalysis of randomised trials. Heart 2001;85:265-71.
10. The Salt Collaborative Group. Swedish Aspirin Low dose Trial (SALT) of 75 mg aspirin as secondary prophylaxis after cerebrovascular ischemic events. Lancet 1991;338:1345-9.
11. Hansson L, Zanchetti A, Carruthers SG, et al. Effects of intensive blood-pressure lowering and low-dose aspirin in patients with hypertension: principal results of the Hypertension Optimal Treatment (HOT) randomised trial. Lancet 1998;351:1755-62.
12. The Medical Research Council’s General Practice Research Framework. Thrombosis prevention trial: randomised trial of low intensity oral anticoagulation with warfarin and low-dose aspirin in the primary prevention of ischaemic heart disease in men at increased risk. Lancet 1998;351:233-41.
13. Gum PA, Thamilarasan M, Watanabe J, Blackstone EH, Lauer MS. Aspirin use and all-cause mortality among patients being evaluated for known or suspected coronary artery disease. JAMA 2001;286:1187-94.
14. Havranek EP. Primary Prevention of CHD: nine ways to reduce risk. Am Fam Phys 1999;59:1455-63-1466.
15. National Cholesterol Education Program. Third Report on the Expert Panel on Detection, Evaluation, and Treatment of High Blood Cholesterol in Adults (ATP III). Washington, DC: US Department of Health and Human Services; 2001. NIH Publication 01-3305.
16. Primary Prevention of Cardiovascular Disordersn, Clinical Evidence. London: British Medical Journal; 2001;64-5.
17. Jadad AR, Moore A, Corroll D, et al. Assessing the quality of reports of randomized clinical trials: is binding necessary? Control Clin Trials 1996;17:1-12.
18. Sutton AJ, Abrams KR, Jones DR, Sheldon TA, Song F. Methods for Meta-Analysis in Medical Research. New York: John Wiley & Sons; 2000;42-5,64-72.
19. StatXact 4 for Windows [computer program]. Cambridge, MA: CYTEL Software Corp; 2000.
20. Steering Committee of the Physician’s Health Study Research Study Group. Final report on the aspirin component of the ongoing Physicians’ Health Study. N Engl J Med 1989;321:129-35.
21. Peto R, Gray R, Collins R, et al. Randomized trial of prophylactic daily aspirin in British male doctors. BMJ 1988;296:313-6.
22. Manson J, Stampfer M, Colditz G, et al. A prospective study of aspirin use and primary prevention of cardiovascular disease in women. JAMA 1991;266:521-7.
23. Silagy C, McNeil J, Donnan G, et al. The Pace Pilot Study: 12 month results and implications for future primary prevention trials in the elderly. J Am Geriatr Soc 1994;42:643-7.
24. Manson J, Buring J, Satterfield S, Hennekens C. Baseline characteristics of participants in the Physicians Health Study: a randomized trial of aspirin and beta carotene in U.S. physicians. Am J Prev Med 1991;7:150-4.
25. Antithrombotic Trialists’ Collaboration. Collaborative meta-analysis of randomized trials of antiplatelet therapy for prevention of death, myocardial infarction, and stroke in high risk patients. BMJ 2002;324:71-86.
26. Thun M, Namboodiri M, Heath C. Aspirin use and reduced risk of fatal colon cancer. N Engl J Med 1991;325:1593-6.
27. Hennekens C, Buring J. Aspirin in the primary prevention of cardiovascular disease. Cardiol Clin 1994;12:443-50.
28. Hennekens CH, Jonas MA, Buring JE. Antiplatelet therapy and risk of stroke. Ann Epidemiol 1993;3:568-70.
29. Iso H, Hennekens C, Stampfer M, et al. Prospective study of aspirin use and risk of stroke in women. Stroke 1999;30:1764-71.
30. Kronmal RA, Hart R, Manolio T, et al. Aspirin use and incident stroke in the cardiovascular study. Stroke 1998;29:887-94.
31. Paganini-Hill A, Chao A, Ross RK, Henderson B. Aspirin use and chronic diseases: a cohort study of the elderly. BMJ 1989;299:1247-50.
32. Silagy C, McNeil J, Donnan G, et al. Adverse effects of low dose aspirin in a healthy population. Clin Pharmacol Ther 1993;54:84-9.
- Only 3 primary prevention studies of aspirin included low-risk subjects and measured all-cause mortality.
- Two of those studies demonstrated no significant decrease in mortality with low-dose aspirin.
- The Nurses Health Study demonstrated a dose-dependent increase in mortality with aspirin use.
- There is insufficient evidence for or against recommending aspirin to low-risk individuals.
Cardiovascular disease is the leading cause of death in the United States, and aspirin, a platelet aggregate inhibitor, is often recommended as prophylaxis for cardiovascular disease.1-3Clinical studies have demonstrated the benefit of aspirin use for secondary prevention of cardiovascular disease and stroke.1,4-10 In high-risk subjects, aspirin has been proven effective in primary prevention of major cardiovascular events and nonfatal ischemic heart disease.11-13 Sanmuganathan and colleagues recently reported a meta-analysis of 4 randomized trials of aspirin for primary prevention. Although they determined that aspirin treatment is safe if the coronary event rate is at least 1.5% each year and unsafe if the rate is no higher than 0.5% each year, they did not address all-cause mortality, and 2 of the 4 trials did not include low-risk subjects.9
Many physicians and patients are prescribing aspirin with the expectation of reduced mortality in high-risk and low-risk individuals. Media advertisements and health programs may not clearly delineate the population for whom aspirin has clear benefits. A recent review suggested that aspirin is likely to be effective for primary prevention in yet to be defined groups.14 This review seeks to answer 2 questions. First, are there any primary prevention studies using aspirin that included only low-risk subjects? Second, should aspirin be prescribed routinely to persons at low risk for cardiovascular disease to decrease total mortality?
Methods
Search strategy
The MEDLINE database and the Cochrane Library were systematically searched using the terms aspirin or antiplatelet therapy and primary prevention or prevention and primary and mortality. An additional search was made with primary prevention and myocardial infarction or stroke. The Internet was searched (http://www.google.com) by using the same search terms. The studies were limited to human populations. Search results consisted of abstracts, complete reviews, and reference lists from articles. Morbidity associated with aspirin use also was reviewed.
Selection criteria: end points
Only those studies that investigated primary prevention of cardiovascular disease using aspirin, had low-risk subjects, and included a measure of total mortality were part of our analysis. We used the 2001 Adult Treatment Panel III Guidelines and the recent British Medical Journal clinical evidence guidelines on primary prevention of cardiovascular disorders to define the low-risk patient.15,16 Those guidelines classified major risk factors for ischemic vascular disease as hypertension, low high-density lipoprotein cholesterol, high lowdensity lipoprotein cholesterol, family history of premature coronary heart disease, smoking, diabetes, and advancing age (men ≥ 45 years, women ≥ 55 years). We also classified those patients with past cerebrovascular events, myocardial infarction, and angina as high risk. We defined low risk as having no more than 1 of these risk factors.
Every trial was evaluated independently by each author according to the Jadad scale.17 Based on information in the original articles, we recalculated the odds ratios (ORs) for each study. The results of the 2 randomized trails were combined by means of the Mantel-Haenszel method for combining ORs, and StatXact 4 for Windows was used for the analysis.18,19 The data were used to create a forest plot of mortal-ity.19 The decision to combine studies of like type was made a priority.
Results
MEDLINE search results for aspirin and primary prevention yielded 291 articles. Antiplatelet therapy and primary prevention yielded 64 articles. Myocardial infarction or stroke and primary prevention yielded 514 articles. Cross-referencing aspirin, prevention, and mortality yielded 690 articles. The Cochrane Library search of antiplatelet therapy and prevention and primary yielded 17 complete reviews and 6 abstracts of systematic reviews. No additional studies published or unpublished were identified through the Internet.
Five clinical trials and 1 cohort study that evaluated aspirin for primary prevention were identi-fied.11,12,20-23 One of those, a pilot study, was excluded because it did not provide mortality data for the aspirin and placebo groups.23 Two clinical trials, the Hypertension Optimal Treatment Trial and the Thrombosis Prevention Trial, did not include low-risk subjects.11,12 Although no studies were identified that included only low-risk subjects, 3 studies met our inclusion criteria. Characteristics of those 3 studies are reported in Table 1.
The US Physicians Health Study (USPHS) randomized physicians into 4 treatment groups: aspirin plus beta-carotene, aspirin plus placebo, betacarotene plus placebo, and placebo plus placebo.20 Both aspirin groups took 325 mg every other day. The mean age was 53.2 years.24 Fifty percent of the participants were current or past smokers, and 9% had hypertension. Although the rate of myocardial infarction was significantly lower in the aspirin group, there was no reduction in total cardiovascular mortality. The results are reported in Table 2. More side effects were noted in the aspirin group, including gastric ulcers, gastrointestinal bleeding, hemorrhagic stroke, and other bleeding disorders.20 No separate analysis of low-risk subjects’ risk was performed.
In the British Doctors Study (BDS), 66% of patients were randomized to take aspirin once daily and 33% were to avoid aspirin.21 More than half of the subjects were at least 60 years old. Physicians with stroke, myocardial infarction, ulcer disease, or currently taking any aspirin products were excluded. Six percent of the subjects had a history of heart disease other than myocardial infarction, 10% had hypertension, and 75% of participants were currently smoking or had a history of smoking. No significant differences were noted between groups for myocardial infarction or total mortality. By the end of the study, 44% of the aspirin group had discontinued aspirin secondary to side effects, the most common being dyspepsia. Of the control group, 2% per year started using aspirin because they developed risk factors such as vascular disease or for primary prevention. Low-risk individuals were not evaluated separately.
The Nurses Health Study (NHS) was a cohort study of women who were free of diagnosed coronary heart disease, stroke, and cancer at the start of the study. However, 29% of the women smoked and 15% had hypertension.22 The mean age was 46.0 years, and the follow-up was 96.7% of total potential person years. The study respondents were asked how many aspirin tablets they took per week: 0, 1 to 3, 4 to 6, 7 to 14, or 15+. Those who smoked or were overweight were more likely to take aspirin. No separate analysis of low-risk subjects was performed. Mortality from aspirin use was clearly dose dependent. For study participants taking 1 to 6 aspirin tablets each week, mortality was 0.84% (OR, 1.51; 95% confidence interval [CI], 1.26–1.82); for those taking 7 to 14 aspirin tablets, mortality was 0.99% (OR, 1.80; CI, 1.39–2.33); and for those taking 15+ aspirin tablets, mortality was 1.82% (OR, 3.32; CI, 2.62–4.21). Rates of myocardial infarction and stroke also were higher for all groups taking aspirin (see Table 2). When combined, the USPHS and the BDS demonstrated no significant difference in mortality between aspirin and placebo groups, whereas the NHS found increased mortality from aspirin (Figure).
TABLE 1
Characteristics of aspirin studies that included low-risk subjects
| USPHS | BDS | NHS | |
|---|---|---|---|
| Trial | Steering Committee20 | Peto et al21 | Manson et al22 |
| Study population | Healthy US physicians | Healthy UK physicians | Healthy US nurses |
| Study type | Randomized controlled trial | Randomized controlled trial | Cohort |
| Subjects in aspirin group | 11,037 | 3429 | 35,048 |
| Subjects in control group | 11,034 | 1710 | 52,630 |
| Treatment | 325 mg aspirin every other day | 500 mg/d aspirin | 1–15 aspirin tablets/wk |
| Comparison | Placebo | No aspirin | None |
| Follow-up time (y) | 5 | 6 | 6 |
| Jadad score | |||
| Randomization† | 1 | 2 | NA* |
| Blinding ‡ | 1 | 0 | NA |
| Withdrawals § | 1 | 0 | NA |
| Total | 3 | 2 | NA |
| Significant difference in mortality | No | No | Yes in favor of no aspirin |
| *The Jadad scale does not apply to cohort studies. | |||
| †Two points maximum. | |||
| ‡Two points maximum. | |||
| §One point maximum. | |||
| BDS, British Doctors Study; NA, not applicable; NHS, Nurses Health Study; USPHS, US Physicians Health Study. | |||
TABLE 2
Rates of myocardial infarction, stroke, total cardiovascular mortality, and total mortality in studies of aspirin vs no aspirin that included low-risk patients
| Study | |||
|---|---|---|---|
| Outcome | USPHS (5 y) | BDS (6 y) | NHS (6 y) |
| Myocardial infarction | |||
| Aspirin, n (%) | 139 (1.26) | 169 (4.93) | 244 (0.70) |
| No aspirin, n (%) | 239 (2.17) | 88 (5.15) | 157 (0.30) |
| OR (CI) | 0.58 (0.47–0.71) | 0.96 (0.73–1.24) | 2.34 (1.92–2.86)* |
| Stroke | |||
| Aspirin, n (%) | 119 (1.08) | 91 (2.65) | 109 (0.31) |
| No aspirin, n (%) | 98 (0.89) | 39 (2.28) | 89 (0.17) |
| OR (CI) | 1.22 (0.93–1.59) | 1.17 (0.80–1.71) | 1.84 (1.39–2.44)* |
| Total cardiovascular mortality | |||
| Aspirin, n (%) | 81 (0.73) | 148 (4.32) | 68 (0.19) |
| No aspirin, n (%) | 83 (0.75) | 79 (4.62) | 62 (0.12) |
| OR (CI) | 0.98 (0.72–1.33) | 0.93 (0.70–1.23) | 1.65 (1.17–2.33)* |
| Total mortality | |||
| Aspirin, n (%) | 217 (1.97) | 270 (7.87) | 354 (1.01) |
| No aspirin, n (%) | 227 (2.06) | 151 (8.83) | 292 (0.55) |
| OR (CI) | 0.95 (0.79–1.15) | 0.88 (0.72–1.09) | 1.83 (1.57–2.14)* |
| *OR significant at the .05 level. | |||
| BDS, British Doctors Study; CI, 95% confidence interval; n (%), number (percentage) of patients taking or not taking aspirin; NHS, Nurses Health Study; OR, odds ratio; USPHS, US Physicians Health Study. | |||
FIGURE Forest plot of mortality in healthy patients on aspirin
Discussion
To date, there has been no study of aspirin for primary prevention that included a separate analysis of patients who were free of cardiovascular risk factors. Each of the 3 studies that included low-risk subjects grouped them with subjects at higher risk, those known to benefit from aspirin.9,11,12 Even so, none of those studies demonstrated a statistically significant decrease in all-cause mortality. Even when combined, the BDS and the USPHS demonstrated no significant improvement in mortality. Mortality in the BDS was nearly 4 times greater than that in the USPHS. This finding is likely due to the higher baseline rate of smoking and other risk factors in the British doctors. In contrast to the BDS, the USPHS demonstrated significantly decreased rates for fatal and nonfatal myocardial infarction. Our analysis of the NHS associated aspirin with increased mortality, fatal myocardial infarction, and nonfatal myocardial infarction at any dose. The nurses on average had lower risk than the doctors, fewer smoked, and they were younger.
Many studies have clearly demonstrated the benefits of aspirin for primary prevention in high-risk subjects.10-12,25 There may be other benefits to taking prophylactic aspirin. In the Cancer Prevention Study II, aspirin use was associated with decreased death rates from colon cancer.26 Unfortunately, that study did not measure all-cause mortality.
There are a number of limitations to this study. There were no strictly low-risk studies of aspirin for primary prevention of cardiovascular mortality, and there was a paucity of studies that included low-risk subjects. Because the studies analyzed did not include only low-risk subjects, the results may not apply to all low-risk patients. The BDS did not include a placebo and was not blinded. Although not statistically significant, the ORs tended toward a protective effect for aspirin in the 2 randomized trials. The large difference in mortality between those 2 trials remains unexplained. The NHS was the only study to include women, and it was a cohort study, which is subject to selection and reporting biases. Therefore, aspirin users may have been at higher mortality risk due to smoking, obesity, or other illness, thus rendering the association between aspirin and higher mortality meaningless.
Many studies have shown significant side effects of aspirin, including epistaxis, peptic ulcer disease, gastrointestinal bleeds, and hemorrhagic stroke.15,20-22,27-32 In the BDS, 17% more subjects in the aspirin group developed peptic ulcer disease, and 19% stopped treatment during the first year secondary to gastrointestinal complaints.21
In conclusion, there is currently no evidence to recommend for or against the use of aspirin in low-risk individuals to decrease mortality. There may be other reasons to take aspirin prophylactically such as to reduce myocardial infarction or colon cancer. However, these benefits have not been established in a low-risk population. Health care providers should ask all patients whether they are taking aspirin and evaluate the risk-benefit ratio before recommending it.
1. Fuster V, Dyken M, Vokonas P, Hennekens C. Aspirin as a therapeutic agent in cardiovascular disease. Circulation 1993;87:659-75.
2. Weiss H, Aledort L. Impaired platelet/connective tissue reaction in man after aspirin ingestion. Lancet 1967;2:495-7.
3. Preston F, Whipps S, Jackson C, et al. Inhibition of prostacyclin and platelet thromboxane A2 after low dose aspirin. N Engl J Med 1981;304:76-9.
4. Hankey GJ. One year after CAPRIE, IST, and ESPS 2. Cerebrovasc Dis 1998;8(suppl 5):1-7.
5. Buring J, Hennekens C. Prevention of cardiovascular disease: risks and benefits of aspirin. J Gen Intern Med 1990;5(suppl 5):S54-7.
6. Sivenius J, Laakso M, Penttila IM, et al. The European Stroke Prevention Study: results according to sex. Neurology 1991;41:1189-92.
7. Lewis H, Davis J, Archibald D, Steinke W, Smitherman T. Protective effects of aspirin against acute myocardial infarction and death in men with unstable angina. N Engl J Med 1983;309:396-403.
8. Antiplatelet Trialists’ Collaboration. Collaborative overview of randomised trials of anti platelet therapy. Prevention of death, myocardial infarction, and stroke by prolonged antiplatelet therapy in various categories of patients. BMJ 1994;308:81-106.
9. Sanmuganathan PS, Ghahramani P, Jackson PR, Wallis EJ, Ramsay LE. Aspirin for primary prevention of coronary heart disease: safety and absolute benefit related to coronary risk derived from metaanalysis of randomised trials. Heart 2001;85:265-71.
10. The Salt Collaborative Group. Swedish Aspirin Low dose Trial (SALT) of 75 mg aspirin as secondary prophylaxis after cerebrovascular ischemic events. Lancet 1991;338:1345-9.
11. Hansson L, Zanchetti A, Carruthers SG, et al. Effects of intensive blood-pressure lowering and low-dose aspirin in patients with hypertension: principal results of the Hypertension Optimal Treatment (HOT) randomised trial. Lancet 1998;351:1755-62.
12. The Medical Research Council’s General Practice Research Framework. Thrombosis prevention trial: randomised trial of low intensity oral anticoagulation with warfarin and low-dose aspirin in the primary prevention of ischaemic heart disease in men at increased risk. Lancet 1998;351:233-41.
13. Gum PA, Thamilarasan M, Watanabe J, Blackstone EH, Lauer MS. Aspirin use and all-cause mortality among patients being evaluated for known or suspected coronary artery disease. JAMA 2001;286:1187-94.
14. Havranek EP. Primary Prevention of CHD: nine ways to reduce risk. Am Fam Phys 1999;59:1455-63-1466.
15. National Cholesterol Education Program. Third Report on the Expert Panel on Detection, Evaluation, and Treatment of High Blood Cholesterol in Adults (ATP III). Washington, DC: US Department of Health and Human Services; 2001. NIH Publication 01-3305.
16. Primary Prevention of Cardiovascular Disordersn, Clinical Evidence. London: British Medical Journal; 2001;64-5.
17. Jadad AR, Moore A, Corroll D, et al. Assessing the quality of reports of randomized clinical trials: is binding necessary? Control Clin Trials 1996;17:1-12.
18. Sutton AJ, Abrams KR, Jones DR, Sheldon TA, Song F. Methods for Meta-Analysis in Medical Research. New York: John Wiley & Sons; 2000;42-5,64-72.
19. StatXact 4 for Windows [computer program]. Cambridge, MA: CYTEL Software Corp; 2000.
20. Steering Committee of the Physician’s Health Study Research Study Group. Final report on the aspirin component of the ongoing Physicians’ Health Study. N Engl J Med 1989;321:129-35.
21. Peto R, Gray R, Collins R, et al. Randomized trial of prophylactic daily aspirin in British male doctors. BMJ 1988;296:313-6.
22. Manson J, Stampfer M, Colditz G, et al. A prospective study of aspirin use and primary prevention of cardiovascular disease in women. JAMA 1991;266:521-7.
23. Silagy C, McNeil J, Donnan G, et al. The Pace Pilot Study: 12 month results and implications for future primary prevention trials in the elderly. J Am Geriatr Soc 1994;42:643-7.
24. Manson J, Buring J, Satterfield S, Hennekens C. Baseline characteristics of participants in the Physicians Health Study: a randomized trial of aspirin and beta carotene in U.S. physicians. Am J Prev Med 1991;7:150-4.
25. Antithrombotic Trialists’ Collaboration. Collaborative meta-analysis of randomized trials of antiplatelet therapy for prevention of death, myocardial infarction, and stroke in high risk patients. BMJ 2002;324:71-86.
26. Thun M, Namboodiri M, Heath C. Aspirin use and reduced risk of fatal colon cancer. N Engl J Med 1991;325:1593-6.
27. Hennekens C, Buring J. Aspirin in the primary prevention of cardiovascular disease. Cardiol Clin 1994;12:443-50.
28. Hennekens CH, Jonas MA, Buring JE. Antiplatelet therapy and risk of stroke. Ann Epidemiol 1993;3:568-70.
29. Iso H, Hennekens C, Stampfer M, et al. Prospective study of aspirin use and risk of stroke in women. Stroke 1999;30:1764-71.
30. Kronmal RA, Hart R, Manolio T, et al. Aspirin use and incident stroke in the cardiovascular study. Stroke 1998;29:887-94.
31. Paganini-Hill A, Chao A, Ross RK, Henderson B. Aspirin use and chronic diseases: a cohort study of the elderly. BMJ 1989;299:1247-50.
32. Silagy C, McNeil J, Donnan G, et al. Adverse effects of low dose aspirin in a healthy population. Clin Pharmacol Ther 1993;54:84-9.
The third person in the room: Frequency, role, and influence of companions during primary care medical encounters
- Sixteen percent of adult patients have a companion present in the examination room during their ambulatory medical appointments.
- Companions are more common with older, less well educated, and more medically or socially complex patients.
- Companions participate actively during the encounter.
- Companions often improve patient and physician understanding during the encounter.
Although common, third party involvement in adult medical care has not been well studied. This prospective study explored the frequency of companions, the reasons for accompaniment, and the companion’s influence on the medical encounter from the perspective of the patient, the companion, and the physician.
Methods
Setting, physicians, and patients
The study was conducted at the general internal medicine practice of the University of Colorado Health Sciences Center. Fifteen full-time faculty and 42 internal medicine residents participated. A companion was defined as any person older than 18 years who accompanied a patient to a medical visit and was designated as an examination room companion if that person spent any portion of the visit in the examination room; otherwise, that person was designated as a waiting room companion. Persons employed solely to provide transportation services for patients were not considered companions.
Study design
The study consisted of 2 parts: a prospective study to document the frequency of patient accompaniment by a third person to ambulatory medicine visits, and a survey of patients, companions, and physicians to explore the rationales and influence of the companion during the medical encounter. A professional research assistant was present for an average of 8 of 10 half-day clinics per week. To accomplish the first objective, a research assistant directly observed 1294 consecutive patient visits from September 22 to October 29, 1998. To accomplish the second objective, from mid-September to mid-November, a professional research assistant attempted to enroll all consecutive patients accompanied to their appointments. Unaccompanied patients were approached for consent at the convenience of the research assistant. Patients and their companions were approached for consent in the waiting room immediately before their visits.
For inclusion, patients and companions provided consent and were literate in English. Patients, companions, and physicians independently completed self-administered questionnaires immediately after their visits. All were informed that responses were confidential and would not be disclosed to one another. This study was reviewed and approved by the Colorado Multiple Institutional Review Board.
Questionnaire development
The survey instruments were developed after a thorough review of existing research1,6-10and refined by pilot testing and review with a professional survey consultant. Patients and companions completed demographic questions (Table 1). Patients rated their overall health, stated their relationship to the companion, and indicated the reasons for companion accompaniment (Table 2). Patients and companions indicated from a list of 7 items (Table 2) how the companion influenced the visit and rated the companion’s helpfulness during the encounter (5-point Likert scale: 1 = very unhelpful to 5 = very helpful).
TABLE 1
Patient demographics and characteristics*
| Companion in examination room (A) | Patient alone (B) | P, A vs B | Companion in waiting room (C) | P, A vs C | |
|---|---|---|---|---|---|
| Total | 115 | 121 | 85 | ||
| Female | 57 (54) | 76 (73) | .19 | 58 (71) | .022 |
| Age (y) | |||||
| 18–44 | 21 (20) | 39 (33) | <.001> | 16 (20) | .06 |
| 45–64 | 34 (33) | 55 (46) | 39 (49) | ||
| ≥65 | 49 (47) | 26 (22) | 25 (31) | ||
| Race | |||||
| White | 73 (72) | 79 (66) | .09 | 56 (73) | .73 |
| Black/African American | 7 (7) | 22 (18) | 8 (10) | ||
| Hispanic/Latino | 16 (16) | 14 (12) | 11 (14) | ||
| Other | 5 (5) | 5 (5) | 2 (3) | ||
| Education ≤ high school | 57 (56) | 40 (33) | <.001> | 48 (61) | .56 |
| Income (US dollars/y) | |||||
| 47 (51) | 61 (54) | .82 | 39 (53) | .50 | |
| 15,000–35,000 | 23 (25) | 29 (25) | 22 (30) | ||
| >35,000 | 23 (25) | 24 (21) | 13 (18) | ||
| Self-noted health | |||||
| Poor/fair | 58 (53) | 53 (44) | .37 | 40 (48) | .13 |
| Good | 28 (25) | 34 (28) | 32 (38) | ||
| Very good/excellent | 24 (22) | 34 (28) | 12 (14) | ||
| Medical and social complexity (MD rating) | |||||
| Simple/straightforward | 6 (5) | 27 (24) | <.001> | 11 (13) | <.001> |
| Average | 24 (21) | 36 (32) | 32 (39) | ||
| Somewhat/very complex | 83 (73) | 51 (45) | 39 (48) | ||
| Patient visit type | |||||
| Return with primary provider | 85 (75) | 73 (64) | .16 | 51 (62) | .07 |
| New with primary provider | 18 (16) | 28 (25) | 15 (18) | ||
| Episodic with provider other than primary | 10 (9) | 13 (12) | 16 (20) | ||
| Physician | |||||
| Faculty | 68 (62) | 55 (45) | .01 | 44 (52) | .19 |
| Resident | 42 (38) | 66 (55) | 40 (48) | ||
| Some categories are missing data, so the columns do not equal n. Percentages were computed based on available data, and some columns equal 101% because of round-off error. | |||||
| *Values are number (percentage) unless otherwise indicated. | |||||
TABLE 2
Patients’ and companions’ reports of companion’s reasons for accompaniment and influence on the medical encounter*
| Patient’s report | Companion’s report | ||||||
|---|---|---|---|---|---|---|---|
| Companion in waiting room | Companion in examination room | P † waiting room | Companion in waiting room | Companion in examination room | P † waiting room | ||
| Companion’s reasons for accompaniment | |||||||
| Help with transportation | 58 (69) | 61 (55) | .05 | 64 (79) | 66 (58) | .003 | |
| Provide company | 39 (46) | 58 (53) | .39 | 43 (53) | 55 (49) | .59 | |
| Help communicate concerns to the doctor | 6 (7) | 56 (51) | <.001> | 5 (6) | 60 (53) | <.001> | |
| Help remember physician’s advice and instructions | 4 (5) | 51 (46) | <.001> | 5 (6) | 54 (48) | <.001> | |
| Provide emotional support | 20 (24) | 48 (44) | .004 | 27 (33) | 60 (53) | .006 | |
| Express concerns regarding the patient to the physician | 6 (7) | 41 (37) | <.001> | 9 (11) | 51 (45) | <.001> | |
| Help make decisions | 5 (6) | 39 (35) | <.001> | 2 (2) | 32 (28) | <.001> | |
| Help with language barriers | 1 (1) | 14 (13) | .003 | 0 (0) | 12 (11) | <.002> | |
| Help with insurance or payment forms | 7 (8) | 11 (10) | .69 | 7 (9) | 5 (4) | .23 | |
| Companion’s influence on medical encounter | |||||||
| No influence or don’t know | 57 (70) | 28 (25) | <.001> | 58 (72) | 24 (21) | <.001> | |
| Companion influenced | |||||||
| Physician understanding | 5 (6) | 63 (57) | <.001> | 5 (6) | 69 (61) | <.001> | |
| Patient understanding | 3 (4) | 59 (54) | <.001> | 10 (12) | 68 (60) | <.001> | |
| Tests ordered | 3 (4) | 13 (12) | .039 | 1 (1) | 12 (11) | .01 | |
| Prescribed treatment | 1 (1) | 26 (24) | <.001> | 4 (5) | 26 (23) | <.001> | |
| Number of referrals | 0 (0) | 10 (9) | .005 | 1 (1) | 6 (5) | .13 | |
| Length of visit | 7 (8) | 19 (17) | .07 | 6 (7) | 20 (18) | .04 | |
| *Values are number (percentage) unless otherwise indicated. | |||||||
| † Difference between waiting room and examination room companion. | |||||||
TABLE 3
Physician report of examination room companion’s influence on the medical encounter*
| Decreased | No influence | Increased | |
|---|---|---|---|
| Communication | |||
| Physician’s understanding | 1 (1) | 43 (39) | 66 (60 |
| Patient’s understanding | 0 (0) | 59 (54) | 51 (46) |
| Resource use | |||
| Time spent explaining/ counseling | 9 (8) | 66 (60) | 35 (32) |
| Length of visit | 6 (7) | 75 (68) | 28 (25) |
| Treatment recommended | 2 (2) | 106 (96) | 2 (2) |
| Number of referrals | 1 (1) | 106 (96) | 2 (2) |
| Number of tests ordered | 2 (2) | 106 (96) | 1 (1) |
| n = 114. | |||
| *Values are number (percentage). | |||
Physician report of examination room companion’s behaviors
| Behavior | n (%) |
|---|---|
| Active behaviors | |
| Clarified or expanded history | 71 (65) |
| Supportive/encouraging toward patient | 71 (65) |
| Asked questions/requested explanations | 53 (48) |
| Discussed concerns about patient’s symptoms/problems | 50 (45) |
| Made evaluation or treatment requests | 19 (17) |
| Took notes | 14 (13) |
| Distractive behaviors | |
| Discussed own symptoms | 16 (15) |
| Discouraging/controlling toward patient | 7 (6) |
| Passive behaviors | |
| Passive observer | 17 (15) |
| n = 114. | |
Data analysis
Data were used from each member of a set regardless of survey completion by other set members. One patient had 2 examination room companions and 2 patients had 2 waiting room companions. In each case, both companions were surveyed. In the 2 cases in which a patient had waiting and examination room companions, the examination room companion was considered more influential for the medical encounter and only that person was surveyed.
The data were analyzed with SAS version 6.12 (SAS Inc, Cary, NC) using bivariate and multivariable methods. Comparisons were made between patient categories (patient alone, patient with examination room companion, patients with waiting room companion) using the chi-square statistic for categorical variables.
Multivariable analyses were conducted to explore the effects of various independent variables on the decision to bring a companion into the examination room. The outcome variables for the regression models were defined by patient status (patient alone, patient with examination room companion, patient with waiting room companion). All significant variables (P ≤ .05) in bivariate analyses were entered into the multivariate analyses. Odds ratios (ORs) with 95% confidence intervals (CIs) were obtained for each variable in the model.
Patient and companion agreement on the reasons for accompaniment and influence on the medical encounter were measured with the kappa statistic. Kappas (κ) of 1.0 to .75 denote excellent agreement, .4 to .75 denote good agreement, and 0 to .4 denote marginal agreement.11
RESULTS
Of the 1294 patient visits, 834 (64%) were to faculty physicians and 451 (35%) were to resident physicians. Overall, companions were present for 29% (n = 374) of patient visits and accompanied the patient into the examination room for 16% (n = 212) of visits. Companions accompanied patients to 23% (n = 196) of faculty visits and 39% (n = 178) of resident visits (P P = .98).
Ninety-three percent (121/130) of unaccompanied patients and 92% (200/217) of consecutive patient–companion pairs approached for consent agreed to participate in the study. In 26 cases the patient or the companion refused to participate for 1of the following reasons: language barrier, too ill, lack of time, invasion of privacy, or uncomfortable with process of consent. Patients and physicians completed surveys for 97% of patient encounters, and companions completed surveys for 99% of patient encounters.
Comparisons between accompanied and unaccompanied patients are presented in Table 1. The fact that faculty physicians had a greater proportion of accompanied patients who received and completed surveys is likely due to the necessity of English literacy for inclusion into the survey study. At this practice site, patients cared for by residents are more likely to be non-English speaking and have a companion for the purpose of translation. Examination room companions were often the spouse or partner (55%), parents (17%), or less frequently roommate or friend (7%), whereas waiting room companions were commonly a spouse or partner (46%) or roommate or friend (24%). Overall, family members accounted for 93% of examination room companions and 76% of waiting room companions. Examination room companions were more likely to be female than waiting room companions (65% vs 51%, P = .05). Patients who were older, less well educated, and whose cases had greater medical or social complexity were more likely to have a companion in the examination room.
Patients’ and companions’ assessments of the reasons for accompaniment and the companions’ influence on communication and resource use are shown in Table 2. The patients’ and companions’ stated reasons for companion accompaniment were in good agreement with the kappa statistic ranging from 0.41 for “help with insurance forms” to 0.61 for “help remember the physician’s advice.” Patients’ and companions’ agreement regarding the influence of the companion on the medical visit was less than 0.4, suggesting marginal agreement for tests ordered (κ = .29), prescribed treatment (κ = .36), and length of visit (κ = .33). There was good agreement for number of referrals (κ = .45) and for physician and patient understanding (κ = .62 and .60, respectively).
Table 3 displays the physicians’ reports of the examination room companion’s influence on the medical encounter. Table 4 shows the physicians’ reports of the behavior of the examination room companions.
Patients regarded examination and waiting room companions as “very helpful” for 84% and 71% of visits, respectively, and as “very unhelpful” for 1% of visits. Of the 121 patients who came alone to their medical visits, 7% indicated that they considered bringing a companion to their visits and 16% thought a companion’s presence would have been helpful.
Physicians regarded examination room companions as “somewhat to very helpful” for 66% of visits. When physicians did not have contact with a companion, they indicated that contact would have been helpful for 16% of patient encounters.
Multivariable analyses explored the effects of independent variables on the decision to bring a companion into the examination room. A physician rating of a case of having greater medical and social complexity was the only variable associated with companion accompaniment to the examination room vs not having a companion (OR, 1.7; 95% CI, 1.4–2.1). Patient characteristics and patients’ reported reasons for accompaniment were factors influencing accompaniment into the examination room vs the waiting room. A need for help with communicating concerns to the physician (OR, 7.8; 95% CI, 2.4–25.6), help with remembering the physician’s advice and instructions (OR, 7.1; 95% CI, 2.0–25.3), and greater medical and social complexity of cases (OR, 1.5; 95% CI, 1.1–2.0) were associated with being accompanied to the examination room over just the waiting room. In contrast, needing help with transportation was negatively associated with having a companion in the examination room vs the waiting room (OR, 0.2; 95% CI, 0.1–0.5).
DISCUSSION
Companions frequently accompany adult patients and participate in ambulatory medical encounters. We found that companions accompanied 29% of patients and were present in the examination room for 16% of outpatient medical encounters. Examination room companions often were present to aid communication with the physician and to help the patient remember instructions. Physicians, patients, and companions believed that physician and patient understanding often were favorably affected by the presence of a companion. A companion’s presence in the examination room had beneficial effects on patient and physician understanding and very rarely had a negative effect. These findings reflect the results of previous studies in which approximately 33% of patients were accompanied to family medicine and geriatric encounters and 66% of these companions were present in the examination room.1,7-10,12,13 The only variable associated with accompaniment into the examination room vs presenting to one’s appointment alone was a physician rating of greater medical and social complexity. This finding also corroborates the findings of other studies.7,14,15
Some research has suggested a negative effect of a third person during the medical encounter. For example, older patients in triadic encounters raise fewer topics, are less assertive, and participate less in humor and joint decision making.6 Other research has failed to find a benefit in health outcomes with the presence of a companion, and unaccompanied patients rated themselves as having greater understanding of their medical problems and greater faith that their physicians were doing everything possible for them than patients accompanied to their visits.15 Still others have found that physicians provide more information and time but less emotional support to accompanied patients.7
Unique to our study was the specific assessment of companion influence on various aspects of the medical encounter from the perspectives of the companion, patient, and physician. As expected, examination room companions had significant influence on aspects of communication. Examination room companions were generally considered helpful by patients and physicians. Physicians may use the companion and patient as barometers of the visit’s accomplished goals. Hence, the time spent listening to a companion provide information about a patient’s medical problems might be balanced by the provision of less emotional support to the patient, especially if the companion is providing that support. The physician may offer an explanation until confident that either party (patient or companion) has a complete understanding. As demonstrated by the results, physicians, patients, and companions thought that patient understanding was increased in approximately 50% of encounters by a companion’s presence, and companions overwhelmingly were considered very helpful by patients.
Our study was limited to 1 urban, academic, general internal medicine practice and may not be generalizable to other settings. The method of assessing medical and social complexities was simple, and the very presence of an examination room companion may have biased physicians to rate these patients as having more complex problems than unaccompanied patients. Also, the longer period of the second part of the study necessary to enroll 200 patient–companion pairs, compared with the companion frequency data of the first part of the study, suggested that we did not enroll “consecutive” patient–companion pairs. This may be explained by the exclusion of patient–companion pairs when either party was not literate in English. Also, the logistics of obtaining consent and administering post visit questionnaires by a single research assistant interfered with the attempt to enroll all patient–companion pairs. Convenience enrollment of unaccompanied patients may have been biased. The effect of the companion on the medical encounter was not verified by objective measures such as timing visit length. Further, patients, companions, and physicians rated the effect of the companion’s presence immediately after the encounter; the full effect of the companion’s presence might require more time to emerge.
Companions frequently accompany patients to their ambulatory general medicine visits. The companion is usually a family member who is present at the request of the patient. Companions assume important roles and are overwhelmingly considered helpful by patients. Nonetheless, some of the behaviors that contribute to an effective physician–patient relationship might be diluted by the presence of a companion. Future directions of study include (1) assessing the effect of the companion on the physician–patient relationship, including specific aspects of communication and behavior, and (2) determining whether companion involvement influences health outcomes or resource use.
· Acknowledgments ·
We thank Marcia Blake, MA, for her statistical expertise; Jean Kutner, MD, MSPH, for her assistance with data analysis and statistical expertise; and Robert Dellavalle, MD, PhD, for his editorial assistance.
1. American Medical Association, Council on Scientific Affairs. Physician and family caregivers: a model for partnership. JAMA 1993;269:1282-4.
2. Botelho RJ, Lue BH, Fiscella K. Family involvement in routine health care: a survey of patients’ behaviors and p. J Fam Pract 1996;42:572-6.
3. Levine C, Zuckerman C. The trouble with families: toward an ethic of accommodation. Ann Intern Med 1999;130:148-52.
4. Zuckerman C. End of Life Care Decisions and Hospital Legal Counsel: Current Involvement and Opportunities for the Future. New York: Milbank Memorial Fund; 1999:8.
5. Jecker NS. The role of intimate others in medical decision making. Gerontologist 1990;30:65-71.
6. Greene MG, Majerovitz D, Adelman RD, Rizzo C. The effects of the presence of a third person on the physician older patient medical interview. J Am Geriatr Soc 1994;42:413-9.
7. Labrecque MS, Blanchard CG, Ruckdeschel JC, Blanchard EB. The impact of family presence on the physician cancer patient interaction. Soc Sci Med 1991;33:1253-61.
8. Medalie JH, Zyzanski SJ, Langa D, Stange KC. The family in family practice: is it a reality? J Fam Pract 1998;46:390-5.
9. Brown JB, Brett P, Stewart M, Marshall JN. Roles and influence of people who accompany patients on visits to the doctor. Can Fam Phys 1998;44:1644-50.
10. Beisecker AE, Brecheisen MA, Ashworth J, Hayes J. Perceptions of the role of cancer patients’ companions during medical appointments. J Psychosoc Oncol 1996;14:29-45.
11. Rosner B. Fundamentals of Biostatistics. San Francisco, CA: Duxbury Press; 1995.
12. Greene MG, Adelman RD, Charon R, Hoffman S. Ageism in the medical encounter: an exploratory study of the doctor elderly patient relationship. Lang Commun 1986;6:113-24.
13. Beisecker AE. The influence of a companion on the doctor elderly patient interaction. Health Commun 1989;1:55-70.
14. Beiseker AE. Aging and the desire of information and input in medical decisions: patients’ consumerism in medical encounters. Gerontologist 1998;28:330-5.
15. Prohaska TR, Glasser M. Patients’ views of family involvement in medical care decisions and encounters. Res Aging 1996;18:52-69.
- Sixteen percent of adult patients have a companion present in the examination room during their ambulatory medical appointments.
- Companions are more common with older, less well educated, and more medically or socially complex patients.
- Companions participate actively during the encounter.
- Companions often improve patient and physician understanding during the encounter.
Although common, third party involvement in adult medical care has not been well studied. This prospective study explored the frequency of companions, the reasons for accompaniment, and the companion’s influence on the medical encounter from the perspective of the patient, the companion, and the physician.
Methods
Setting, physicians, and patients
The study was conducted at the general internal medicine practice of the University of Colorado Health Sciences Center. Fifteen full-time faculty and 42 internal medicine residents participated. A companion was defined as any person older than 18 years who accompanied a patient to a medical visit and was designated as an examination room companion if that person spent any portion of the visit in the examination room; otherwise, that person was designated as a waiting room companion. Persons employed solely to provide transportation services for patients were not considered companions.
Study design
The study consisted of 2 parts: a prospective study to document the frequency of patient accompaniment by a third person to ambulatory medicine visits, and a survey of patients, companions, and physicians to explore the rationales and influence of the companion during the medical encounter. A professional research assistant was present for an average of 8 of 10 half-day clinics per week. To accomplish the first objective, a research assistant directly observed 1294 consecutive patient visits from September 22 to October 29, 1998. To accomplish the second objective, from mid-September to mid-November, a professional research assistant attempted to enroll all consecutive patients accompanied to their appointments. Unaccompanied patients were approached for consent at the convenience of the research assistant. Patients and their companions were approached for consent in the waiting room immediately before their visits.
For inclusion, patients and companions provided consent and were literate in English. Patients, companions, and physicians independently completed self-administered questionnaires immediately after their visits. All were informed that responses were confidential and would not be disclosed to one another. This study was reviewed and approved by the Colorado Multiple Institutional Review Board.
Questionnaire development
The survey instruments were developed after a thorough review of existing research1,6-10and refined by pilot testing and review with a professional survey consultant. Patients and companions completed demographic questions (Table 1). Patients rated their overall health, stated their relationship to the companion, and indicated the reasons for companion accompaniment (Table 2). Patients and companions indicated from a list of 7 items (Table 2) how the companion influenced the visit and rated the companion’s helpfulness during the encounter (5-point Likert scale: 1 = very unhelpful to 5 = very helpful).
TABLE 1
Patient demographics and characteristics*
| Companion in examination room (A) | Patient alone (B) | P, A vs B | Companion in waiting room (C) | P, A vs C | |
|---|---|---|---|---|---|
| Total | 115 | 121 | 85 | ||
| Female | 57 (54) | 76 (73) | .19 | 58 (71) | .022 |
| Age (y) | |||||
| 18–44 | 21 (20) | 39 (33) | <.001> | 16 (20) | .06 |
| 45–64 | 34 (33) | 55 (46) | 39 (49) | ||
| ≥65 | 49 (47) | 26 (22) | 25 (31) | ||
| Race | |||||
| White | 73 (72) | 79 (66) | .09 | 56 (73) | .73 |
| Black/African American | 7 (7) | 22 (18) | 8 (10) | ||
| Hispanic/Latino | 16 (16) | 14 (12) | 11 (14) | ||
| Other | 5 (5) | 5 (5) | 2 (3) | ||
| Education ≤ high school | 57 (56) | 40 (33) | <.001> | 48 (61) | .56 |
| Income (US dollars/y) | |||||
| 47 (51) | 61 (54) | .82 | 39 (53) | .50 | |
| 15,000–35,000 | 23 (25) | 29 (25) | 22 (30) | ||
| >35,000 | 23 (25) | 24 (21) | 13 (18) | ||
| Self-noted health | |||||
| Poor/fair | 58 (53) | 53 (44) | .37 | 40 (48) | .13 |
| Good | 28 (25) | 34 (28) | 32 (38) | ||
| Very good/excellent | 24 (22) | 34 (28) | 12 (14) | ||
| Medical and social complexity (MD rating) | |||||
| Simple/straightforward | 6 (5) | 27 (24) | <.001> | 11 (13) | <.001> |
| Average | 24 (21) | 36 (32) | 32 (39) | ||
| Somewhat/very complex | 83 (73) | 51 (45) | 39 (48) | ||
| Patient visit type | |||||
| Return with primary provider | 85 (75) | 73 (64) | .16 | 51 (62) | .07 |
| New with primary provider | 18 (16) | 28 (25) | 15 (18) | ||
| Episodic with provider other than primary | 10 (9) | 13 (12) | 16 (20) | ||
| Physician | |||||
| Faculty | 68 (62) | 55 (45) | .01 | 44 (52) | .19 |
| Resident | 42 (38) | 66 (55) | 40 (48) | ||
| Some categories are missing data, so the columns do not equal n. Percentages were computed based on available data, and some columns equal 101% because of round-off error. | |||||
| *Values are number (percentage) unless otherwise indicated. | |||||
TABLE 2
Patients’ and companions’ reports of companion’s reasons for accompaniment and influence on the medical encounter*
| Patient’s report | Companion’s report | ||||||
|---|---|---|---|---|---|---|---|
| Companion in waiting room | Companion in examination room | P † waiting room | Companion in waiting room | Companion in examination room | P † waiting room | ||
| Companion’s reasons for accompaniment | |||||||
| Help with transportation | 58 (69) | 61 (55) | .05 | 64 (79) | 66 (58) | .003 | |
| Provide company | 39 (46) | 58 (53) | .39 | 43 (53) | 55 (49) | .59 | |
| Help communicate concerns to the doctor | 6 (7) | 56 (51) | <.001> | 5 (6) | 60 (53) | <.001> | |
| Help remember physician’s advice and instructions | 4 (5) | 51 (46) | <.001> | 5 (6) | 54 (48) | <.001> | |
| Provide emotional support | 20 (24) | 48 (44) | .004 | 27 (33) | 60 (53) | .006 | |
| Express concerns regarding the patient to the physician | 6 (7) | 41 (37) | <.001> | 9 (11) | 51 (45) | <.001> | |
| Help make decisions | 5 (6) | 39 (35) | <.001> | 2 (2) | 32 (28) | <.001> | |
| Help with language barriers | 1 (1) | 14 (13) | .003 | 0 (0) | 12 (11) | <.002> | |
| Help with insurance or payment forms | 7 (8) | 11 (10) | .69 | 7 (9) | 5 (4) | .23 | |
| Companion’s influence on medical encounter | |||||||
| No influence or don’t know | 57 (70) | 28 (25) | <.001> | 58 (72) | 24 (21) | <.001> | |
| Companion influenced | |||||||
| Physician understanding | 5 (6) | 63 (57) | <.001> | 5 (6) | 69 (61) | <.001> | |
| Patient understanding | 3 (4) | 59 (54) | <.001> | 10 (12) | 68 (60) | <.001> | |
| Tests ordered | 3 (4) | 13 (12) | .039 | 1 (1) | 12 (11) | .01 | |
| Prescribed treatment | 1 (1) | 26 (24) | <.001> | 4 (5) | 26 (23) | <.001> | |
| Number of referrals | 0 (0) | 10 (9) | .005 | 1 (1) | 6 (5) | .13 | |
| Length of visit | 7 (8) | 19 (17) | .07 | 6 (7) | 20 (18) | .04 | |
| *Values are number (percentage) unless otherwise indicated. | |||||||
| † Difference between waiting room and examination room companion. | |||||||
TABLE 3
Physician report of examination room companion’s influence on the medical encounter*
| Decreased | No influence | Increased | |
|---|---|---|---|
| Communication | |||
| Physician’s understanding | 1 (1) | 43 (39) | 66 (60 |
| Patient’s understanding | 0 (0) | 59 (54) | 51 (46) |
| Resource use | |||
| Time spent explaining/ counseling | 9 (8) | 66 (60) | 35 (32) |
| Length of visit | 6 (7) | 75 (68) | 28 (25) |
| Treatment recommended | 2 (2) | 106 (96) | 2 (2) |
| Number of referrals | 1 (1) | 106 (96) | 2 (2) |
| Number of tests ordered | 2 (2) | 106 (96) | 1 (1) |
| n = 114. | |||
| *Values are number (percentage). | |||
Physician report of examination room companion’s behaviors
| Behavior | n (%) |
|---|---|
| Active behaviors | |
| Clarified or expanded history | 71 (65) |
| Supportive/encouraging toward patient | 71 (65) |
| Asked questions/requested explanations | 53 (48) |
| Discussed concerns about patient’s symptoms/problems | 50 (45) |
| Made evaluation or treatment requests | 19 (17) |
| Took notes | 14 (13) |
| Distractive behaviors | |
| Discussed own symptoms | 16 (15) |
| Discouraging/controlling toward patient | 7 (6) |
| Passive behaviors | |
| Passive observer | 17 (15) |
| n = 114. | |
Data analysis
Data were used from each member of a set regardless of survey completion by other set members. One patient had 2 examination room companions and 2 patients had 2 waiting room companions. In each case, both companions were surveyed. In the 2 cases in which a patient had waiting and examination room companions, the examination room companion was considered more influential for the medical encounter and only that person was surveyed.
The data were analyzed with SAS version 6.12 (SAS Inc, Cary, NC) using bivariate and multivariable methods. Comparisons were made between patient categories (patient alone, patient with examination room companion, patients with waiting room companion) using the chi-square statistic for categorical variables.
Multivariable analyses were conducted to explore the effects of various independent variables on the decision to bring a companion into the examination room. The outcome variables for the regression models were defined by patient status (patient alone, patient with examination room companion, patient with waiting room companion). All significant variables (P ≤ .05) in bivariate analyses were entered into the multivariate analyses. Odds ratios (ORs) with 95% confidence intervals (CIs) were obtained for each variable in the model.
Patient and companion agreement on the reasons for accompaniment and influence on the medical encounter were measured with the kappa statistic. Kappas (κ) of 1.0 to .75 denote excellent agreement, .4 to .75 denote good agreement, and 0 to .4 denote marginal agreement.11
RESULTS
Of the 1294 patient visits, 834 (64%) were to faculty physicians and 451 (35%) were to resident physicians. Overall, companions were present for 29% (n = 374) of patient visits and accompanied the patient into the examination room for 16% (n = 212) of visits. Companions accompanied patients to 23% (n = 196) of faculty visits and 39% (n = 178) of resident visits (P P = .98).
Ninety-three percent (121/130) of unaccompanied patients and 92% (200/217) of consecutive patient–companion pairs approached for consent agreed to participate in the study. In 26 cases the patient or the companion refused to participate for 1of the following reasons: language barrier, too ill, lack of time, invasion of privacy, or uncomfortable with process of consent. Patients and physicians completed surveys for 97% of patient encounters, and companions completed surveys for 99% of patient encounters.
Comparisons between accompanied and unaccompanied patients are presented in Table 1. The fact that faculty physicians had a greater proportion of accompanied patients who received and completed surveys is likely due to the necessity of English literacy for inclusion into the survey study. At this practice site, patients cared for by residents are more likely to be non-English speaking and have a companion for the purpose of translation. Examination room companions were often the spouse or partner (55%), parents (17%), or less frequently roommate or friend (7%), whereas waiting room companions were commonly a spouse or partner (46%) or roommate or friend (24%). Overall, family members accounted for 93% of examination room companions and 76% of waiting room companions. Examination room companions were more likely to be female than waiting room companions (65% vs 51%, P = .05). Patients who were older, less well educated, and whose cases had greater medical or social complexity were more likely to have a companion in the examination room.
Patients’ and companions’ assessments of the reasons for accompaniment and the companions’ influence on communication and resource use are shown in Table 2. The patients’ and companions’ stated reasons for companion accompaniment were in good agreement with the kappa statistic ranging from 0.41 for “help with insurance forms” to 0.61 for “help remember the physician’s advice.” Patients’ and companions’ agreement regarding the influence of the companion on the medical visit was less than 0.4, suggesting marginal agreement for tests ordered (κ = .29), prescribed treatment (κ = .36), and length of visit (κ = .33). There was good agreement for number of referrals (κ = .45) and for physician and patient understanding (κ = .62 and .60, respectively).
Table 3 displays the physicians’ reports of the examination room companion’s influence on the medical encounter. Table 4 shows the physicians’ reports of the behavior of the examination room companions.
Patients regarded examination and waiting room companions as “very helpful” for 84% and 71% of visits, respectively, and as “very unhelpful” for 1% of visits. Of the 121 patients who came alone to their medical visits, 7% indicated that they considered bringing a companion to their visits and 16% thought a companion’s presence would have been helpful.
Physicians regarded examination room companions as “somewhat to very helpful” for 66% of visits. When physicians did not have contact with a companion, they indicated that contact would have been helpful for 16% of patient encounters.
Multivariable analyses explored the effects of independent variables on the decision to bring a companion into the examination room. A physician rating of a case of having greater medical and social complexity was the only variable associated with companion accompaniment to the examination room vs not having a companion (OR, 1.7; 95% CI, 1.4–2.1). Patient characteristics and patients’ reported reasons for accompaniment were factors influencing accompaniment into the examination room vs the waiting room. A need for help with communicating concerns to the physician (OR, 7.8; 95% CI, 2.4–25.6), help with remembering the physician’s advice and instructions (OR, 7.1; 95% CI, 2.0–25.3), and greater medical and social complexity of cases (OR, 1.5; 95% CI, 1.1–2.0) were associated with being accompanied to the examination room over just the waiting room. In contrast, needing help with transportation was negatively associated with having a companion in the examination room vs the waiting room (OR, 0.2; 95% CI, 0.1–0.5).
DISCUSSION
Companions frequently accompany adult patients and participate in ambulatory medical encounters. We found that companions accompanied 29% of patients and were present in the examination room for 16% of outpatient medical encounters. Examination room companions often were present to aid communication with the physician and to help the patient remember instructions. Physicians, patients, and companions believed that physician and patient understanding often were favorably affected by the presence of a companion. A companion’s presence in the examination room had beneficial effects on patient and physician understanding and very rarely had a negative effect. These findings reflect the results of previous studies in which approximately 33% of patients were accompanied to family medicine and geriatric encounters and 66% of these companions were present in the examination room.1,7-10,12,13 The only variable associated with accompaniment into the examination room vs presenting to one’s appointment alone was a physician rating of greater medical and social complexity. This finding also corroborates the findings of other studies.7,14,15
Some research has suggested a negative effect of a third person during the medical encounter. For example, older patients in triadic encounters raise fewer topics, are less assertive, and participate less in humor and joint decision making.6 Other research has failed to find a benefit in health outcomes with the presence of a companion, and unaccompanied patients rated themselves as having greater understanding of their medical problems and greater faith that their physicians were doing everything possible for them than patients accompanied to their visits.15 Still others have found that physicians provide more information and time but less emotional support to accompanied patients.7
Unique to our study was the specific assessment of companion influence on various aspects of the medical encounter from the perspectives of the companion, patient, and physician. As expected, examination room companions had significant influence on aspects of communication. Examination room companions were generally considered helpful by patients and physicians. Physicians may use the companion and patient as barometers of the visit’s accomplished goals. Hence, the time spent listening to a companion provide information about a patient’s medical problems might be balanced by the provision of less emotional support to the patient, especially if the companion is providing that support. The physician may offer an explanation until confident that either party (patient or companion) has a complete understanding. As demonstrated by the results, physicians, patients, and companions thought that patient understanding was increased in approximately 50% of encounters by a companion’s presence, and companions overwhelmingly were considered very helpful by patients.
Our study was limited to 1 urban, academic, general internal medicine practice and may not be generalizable to other settings. The method of assessing medical and social complexities was simple, and the very presence of an examination room companion may have biased physicians to rate these patients as having more complex problems than unaccompanied patients. Also, the longer period of the second part of the study necessary to enroll 200 patient–companion pairs, compared with the companion frequency data of the first part of the study, suggested that we did not enroll “consecutive” patient–companion pairs. This may be explained by the exclusion of patient–companion pairs when either party was not literate in English. Also, the logistics of obtaining consent and administering post visit questionnaires by a single research assistant interfered with the attempt to enroll all patient–companion pairs. Convenience enrollment of unaccompanied patients may have been biased. The effect of the companion on the medical encounter was not verified by objective measures such as timing visit length. Further, patients, companions, and physicians rated the effect of the companion’s presence immediately after the encounter; the full effect of the companion’s presence might require more time to emerge.
Companions frequently accompany patients to their ambulatory general medicine visits. The companion is usually a family member who is present at the request of the patient. Companions assume important roles and are overwhelmingly considered helpful by patients. Nonetheless, some of the behaviors that contribute to an effective physician–patient relationship might be diluted by the presence of a companion. Future directions of study include (1) assessing the effect of the companion on the physician–patient relationship, including specific aspects of communication and behavior, and (2) determining whether companion involvement influences health outcomes or resource use.
· Acknowledgments ·
We thank Marcia Blake, MA, for her statistical expertise; Jean Kutner, MD, MSPH, for her assistance with data analysis and statistical expertise; and Robert Dellavalle, MD, PhD, for his editorial assistance.
1. American Medical Association, Council on Scientific Affairs. Physician and family caregivers: a model for partnership. JAMA 1993;269:1282-4.
2. Botelho RJ, Lue BH, Fiscella K. Family involvement in routine health care: a survey of patients’ behaviors and p. J Fam Pract 1996;42:572-6.
3. Levine C, Zuckerman C. The trouble with families: toward an ethic of accommodation. Ann Intern Med 1999;130:148-52.
4. Zuckerman C. End of Life Care Decisions and Hospital Legal Counsel: Current Involvement and Opportunities for the Future. New York: Milbank Memorial Fund; 1999:8.
5. Jecker NS. The role of intimate others in medical decision making. Gerontologist 1990;30:65-71.
6. Greene MG, Majerovitz D, Adelman RD, Rizzo C. The effects of the presence of a third person on the physician older patient medical interview. J Am Geriatr Soc 1994;42:413-9.
7. Labrecque MS, Blanchard CG, Ruckdeschel JC, Blanchard EB. The impact of family presence on the physician cancer patient interaction. Soc Sci Med 1991;33:1253-61.
8. Medalie JH, Zyzanski SJ, Langa D, Stange KC. The family in family practice: is it a reality? J Fam Pract 1998;46:390-5.
9. Brown JB, Brett P, Stewart M, Marshall JN. Roles and influence of people who accompany patients on visits to the doctor. Can Fam Phys 1998;44:1644-50.
10. Beisecker AE, Brecheisen MA, Ashworth J, Hayes J. Perceptions of the role of cancer patients’ companions during medical appointments. J Psychosoc Oncol 1996;14:29-45.
11. Rosner B. Fundamentals of Biostatistics. San Francisco, CA: Duxbury Press; 1995.
12. Greene MG, Adelman RD, Charon R, Hoffman S. Ageism in the medical encounter: an exploratory study of the doctor elderly patient relationship. Lang Commun 1986;6:113-24.
13. Beisecker AE. The influence of a companion on the doctor elderly patient interaction. Health Commun 1989;1:55-70.
14. Beiseker AE. Aging and the desire of information and input in medical decisions: patients’ consumerism in medical encounters. Gerontologist 1998;28:330-5.
15. Prohaska TR, Glasser M. Patients’ views of family involvement in medical care decisions and encounters. Res Aging 1996;18:52-69.
Physician job satisfaction, job dissatisfaction, and physician turnover
OBJECTIVES: We studied how physicians’ relative satisfaction and/or dissatisfaction with 10 distinct aspects of their work protected against or promoted their plans for leaving their jobs.
STUDY DESIGN: We used a cross-sectional mail survey.
POPULATION: We used questionnaire data from 1939 practicing generalists and specialists across the United States.
OUTCOMES MEASURED: Using logistic regression analysis, we assessed whether physicians in the top and bottom quartiles of satisfaction for each of 10 aspects of their work and communities were more or less likely to anticipate leaving their jobs within 2 years, compared with physicians in mid-satisfaction quartiles. Separate analyses were compiled for generalists vs specialists, and physicians by age groups (27-44 years, 45-54 years, and 55 years and older).
RESULTS: Generalists and specialists had generally comparable levels of satisfaction, whereas physicians in the oldest age group indicated greater satisfaction than younger physicians in 8 of the 10 work areas. One quarter (27%) of physicians anticipated a moderate-to-definite likelihood of leaving their practices within 2 years. The percentage that anticipated leaving varied with physicians’ age, starting at 29% of those 34 years or younger, steadily decreasing with age until a nadir of 22% of those from 45 to 49 years, then reversing direction to steadily increase thereafter. Across the 5 groups (ie, the 2 specialty clusters and 3 age groups), there were only 14 instances in which physicians in the lowest satisfaction quartiles were more likely to anticipate leaving than those of average satisfaction. In only 2 cases were physicians in the highest satisfaction quartiles less likely to anticipate leaving. Relative dissatisfaction with pay and with relationships with communities was associated with plans for leaving in nearly all physician groups. For specific specialty and age groups, anticipated departure also correlated with relative dissatisfaction with other selected areas of work.
CONCLUSIONS: To promote retention, these data suggest that physicians and their employers should avoid physician dissatisfaction in particular; building particularly high levels of satisfaction generally is not helpful for this end. Avoiding relative dissatisfaction with pay and with community relationships appears broadly important.
Until recently, the satisfaction of physicians was studied only among those working in special settings, such as in rural and urban underserved areas. In these settings, a less than satisfying work environment sometimes leads physicians to leave their jobs, with subsequent costs for needy communities.1,2 Now, with US physicians often employed by others, physicians’ autonomy constrained, medicine managed as a business, and incomes falling for some specialties, the satisfaction of rank and file physicians in all locations and specialties can no longer be assumed.3-5 Indeed, unhappiness is increasing among physicians, with growing numbers considering job changes, nonclinical work, and early retirement.6-8 Some physicians regret ever pursuing a medical career.8-10
Dissatisfaction among physicians is a concern even if medical work still pays handsomely and medical schools still have an abundance of applicants. Physicians’ satisfaction relates to their job effectiveness, including the quality of care they render, their patients’ compliance with recommended care, patients’ satisfaction with care, and patients’ health outcomes.6,9,11-15 The most obvious consequence of a dissatisfying job, however, is that physicians will quit to work elsewhere, disrupting patient-physician continuity and creating organizational instability and replacement costs, estimated at nearly $250,000 per physician lost.16-18 A job change also brings personal and financial costs to physicians and their families.
Although common experience and prior studies show that physicians’ job satisfaction generally influences whether they leave their jobs, little more is known about how satisfaction relates to job changes for physicians. From studies of other professions, we know that satisfaction is a multidimensional concept in which individuals can be satisfied with some aspects of work while dissatisfied with others.16,19 Further, we know that workers’ satisfaction with only some aspects of work correlates with turnover.16,20 For example, in 1 recent study rural generalist physicians who were satisfied with their local communities remained longer in their jobs, whereas their satisfaction with most other aspects of work, including with autonomy and doctor-patient relationships, was unrelated to their retention.2 The effects of workers’ satisfaction and dissatisfaction may also require separate assessment, because greater dissatisfaction with a given aspect of work may lead a worker to leave a job, but increasingly higher levels of satisfaction with the same issue may not lead to ever-increasing chances of retention, or vice versa.15,21
The goal of this study was to better understand the relationship between physicians’ satisfaction with various aspects of their work and whether or not they have thoughts or plans to leave their jobs. We assessed whether anticipated job departure related to satisfaction at both the upper and lower ends of its range; that is, whether particularly high satisfaction levels relative to other physicians protected against job change plans and significant relative dissatisfaction promoted such plans. We also assessed how the satisfaction/job-change relationship varied for physician groups with differing needs and values, specifically for generalists compared with specialists, and for younger, midcareer, and older physicians.
Methods
Subjects, survey mailings, and response rates
A sampling frame, previously described,22,23 was constructed from the American Medical Association’s Physician Masterfile. The target population was the 171,252 civilian physicians listed as participating in direct patient care (rather than in training, administration, teaching, inactive, etc), including generalists (family physicians, general internists, and general pediatricians; general practitioners were not included) and specialists (medical and pediatric nonsurgical subspecialists) in the United States. We stratified the frame into geographic regions of high and low penetration of managed care, non-Hispanic white vs other physician ethnicity, and the 5-targeted specialty groupings.
We drew a random sample of 5704 physicians, oversampling smaller strata. Questionnaires and up to 3 follow-up mailings were sent to the sample from January through September 1997. A total of 2325 physicians responded, 52% when corrected for noncontact and ineligibility.24 Based on information on the Masterfile, response rates did not differ by age, for those in office vs hospital-based practices, or for those in communities of high vs low managed care penetration. However, response rates were higher for subspecialists than for generalists, US medical graduates than for international graduates, and those for whom race-ethnicity was listed as black, “missing,” or “other” than for those listed as Hispanic, non-Hispanic white, or Asian. Statistical weighting in analyses adjusted for group contact and response rate differences.
We dropped the 218 respondents who worked less than 25 hours per week in activities related to patient care and another 169 physicians who primarily practiced outside of their specialty, such as general internists who worked as endocrinologists or oncologists. Analyses were based on the remaining 1939 physicians.
Questionnaire design and analyses
The questionnaire included 36 declarative statements about physicians’ views and regard for various features of their work and practices, to which respondents provided Likert-scaled responses from “strongly agree” to “strongly disagree.”22 Representative statements were, “I feel a strong personal connection with my patients” and “My total compensation package is fair.” These items were drawn from previous studies of physician satisfaction, from issues raised in physician focus groups we assembled, and through the suggestions of experts. We then used exploratory factor analysis with a pilot physician sample, followed by confirmatory factor analysis with a validation physician sample to group these items into 10 scales reflecting physicians’ satisfaction with 10 aspects of their work.22,23 Scale alpha coefficients of reliability ranged from 0.65 to 0.77.
Physicians’ anticipated departure from their jobs was measured through a questionnaire item asking “What is the likelihood that you will leave your current practice situation within two years?”, with allowable responses of “none,” “slight,” “moderate,” “likely,” and “definitely.” Social psychology research has substantiated the use of people’s expressed intentions as measures of their future behavior.25 Prior studies26-28 have used anticipated departure and anticipated retention as expeditious proxy indicators for actual job departure and retention, with correlation coefficients between workers’ plans to leave and subsequent departure typically measured at about 0.5. In the only validating physician study, rural physicians in Western Australia much more often left their practices if they had predicted 10 years earlier that they would (odds ratio [OR], 3.3).29 Shorter-term predictions, such as the 2-year time horizon used in this study, should be even more accurate.
This study’s dichotomous outcome indicator-whether physicians anticipated leaving their jobs within 2 years-defined planned “leavers” as those who indicated a moderate, likely, or definite likelihood of leaving their practices; planned “retainees” were those who envisioned only a slight or no chance of leaving. This cut point was selected for both its face validity-falling at the scale point at which leaving became a real possibility for subjects and no longer an unlikely event-and because it yielded an adequately balanced split in outcome values.
In analyses, levels of satisfaction with the 10 aspects of work and anticipated job departure were described for generalists, specialists, and physicians in 3 age groups. We compared groups on satisfaction levels and anticipated departure rates with t tests and 1-way analysis of variance.
We used logistic regression analysis to model separately the anticipated departure of each of the 5 groups. We entered satisfaction levels for each of the 10 areas of work into the models as 2 dichotomous (dummy) variables, yielding 20 satisfaction indicator variables. Ten of these indicators reflected values in the top quartile of satisfaction (ie, top quartile vs lower 3 quartiles) in each area of work and another 10 indicators reflected values in the lowest quartile of satisfaction (bottom quartile vs upper 3 quartiles). Cut points for the middle vs high satisfaction groups for the 10 areas of work ranged from 3.0 to 4.25 on the satisfaction scale (in which 1 indicated dissatisfaction; 3, neutral; and 5, satisfaction); for the middle vs lower satisfaction group, cut points ranged from 2.0 to 3.33. The inclusion of dichotomous indicators of high and low satisfaction for each area of work treated the middle 2 satisfaction quartiles statistically as the omitted, comparison category. This analytic approach modeled the effects on anticipated departure of relatively high and low satisfaction levels for each area of work, compared with more typical, midrange satisfaction levels, simultaneously controlling for relative satisfaction in the other 9 areas of work. We also included control variables for sex, age, and whether physicians owned their practices.
The logistic models for the 5 physician groups were repeated with the more parsimonious forward stepwise variable selection approach to test the robustness of the model findings and as a functional colinearity check.30 With only 1 exception of the 100 satisfaction-departure associations tested across the 5 physician groups, the findings were identical to those of the full logistic models. We reported only the full logistic models.
The statistical significance level was set at .01, to partially adjust for this study’s numerous comparisons.
Results
Unweighted characterizations of the 1939 eligible respondent physicians found that 70% were male and 72% non-Hispanic white, with a median age of 46 years (range, 27-88 years). Most were married (84%) and had children (85%). There were 459 family physicians (24%), 375 general internists (19%), 494 general pediatricians (25%), and 611 pediatric and medical subspecialists (32%). Eighteen percent worked in solo practices, 36% worked in small groups, and the rest worked in larger groups. Most (57%) owned their practices. Physicians had worked in their current practices for a median duration of 9 years when surveyed (range, 0-58 years).
Satisfaction scores
As a whole, the generalist and specialist physicians reported midrange satisfaction levels in the 10 areas of work assessed Table 1). For 2 work facets-administrative responsibilities and having adequate personal time-the average satisfaction scores for both groups indicated overall dissatisfaction. Physicians indicated greatest satisfaction with their intrinsic rewards from patient care, specifically their personal connection with and gratitude from patients.
The mean satisfaction scores of generalists and specialists were comparable for 7 of the 10 aspects of practice. In the remaining 3 areas, the generalist-specialist differences in satisfaction were small. Satisfaction scores varied more often with age, with physicians 55 years and older more satisfied than younger physicians in 8 of the 10 areas queried.
Anticipated job turnover
In total, 27.1% of physicians foresaw leaving their practices within the next 2 years: 13.8% believed leaving was likely or definite and 13.3% believed they had a moderate chance of leaving. Generalist and specialist physicians perceived similar chances of leaving (26.7% vs 30.0%, respectively; P = .31), with and without adjusting for age and sex. In contrast, physicians of various age groups anticipated different likelihoods of leaving Figure 1), with a 29% rate for the youngest group, a nadir of 22% to 23% for physicians aged 45 to 54 years, and again higher rates for older physicians, reaching 63% for those 70 years and older (P < .001).
Those who anticipated leaving their jobs within 2 years frequently also anticipated leaving the practice of clinical medicine entirely within 5 years, including 84% of leavers older than 54 years, 50% of leavers 45 to 54 years, and even 33% of leavers younger than 45 years.
Satisfaction with work and anticipated job turnover
Overall observations. In analyses that controlled for satisfaction with other facets of work and for several physician characteristics, we found that physicians’ regard for only some aspects of work was associated with their anticipated departure from their jobs (Table 2 and Table 3). Further, we found that physicians who were relatively dissatisfied with a variety of aspects of their work more often foresaw leaving their jobs than those with median satisfaction levels. In contrast, intentions to leave were generally just as likely for those of high and median satisfaction levels.Figure 2 shows the typical relationship between satisfaction and anticipated departure. In this example, as in most instances, the transition from lower to higher likelihood of anticipated departure occurs only when physicians’ feelings drop below neutral into dissatisfied levels.
Generalists and specialists. Among generalists and compared with those of average satisfaction (the omitted group in the statistical models), leaving one’s job was anticipated more often by those less satisfied with their pay (OR, 3.65; P < .0001), with their relationships with their communities (OR, 2.26; P < .0001), and with their relationships with the nonphysician staff in their offices (OR, 1.59; P < .01) Table 2). Only for 1 area of work, patient care issues (eg, feeling overwhelmed with patients’ demands and feeling that time constraints prevented good relationships with patients), were generalists in the highest satisfaction quartile less likely to anticipate leaving their practices than generalists with midrange satisfaction scores (OR, 0.60; P < .01).
For specialists, those reporting lowest satisfaction with their pay (OR, 3.24; P = .01) and community relationships (OR, 3.89; P < .01) anticipated leaving more often than those with midrange scores Table 2). For no aspects of work were the most satisfied specialists less likely to anticipate leaving than specialists of average satisfaction.
Younger, midcareer, and older physicians. Among physicians in the youngest group-aged 27 through 44 years-those who were least satisfied with their pay (OR, 4.62; P < .0001) and with their relationships with their communities (OR, 2.79; P < .0001) more often anticipated leaving their jobs than those of median satisfaction Table 3). For no facets of work among younger physicians were those who were most satisfied less likely to anticipate leaving.
For physicians aged 45 through 54 years, anticipated job departure was more common for those least satisfied with 5 areas of work, including again those least satisfied with pay (OR, 11.60; P < .0001) and with their community relationships (OR, 2.11; P < .01). One unexpected association was noted for these midcareer physicians: those in the highest quartile of satisfaction with their pay more often anticipated leaving their practices than those with midrange pay satisfaction scores (OR, 3.36; P < .01).
In the oldest physician group, those least satisfied with their community relationships (OR, 3.31; P < .01) and least satisfied with the administrative aspects of their work (OR, 2.64; P < .01) more often anticipated leaving their jobs. Fewer of those most satisfied with patient care issues foresaw leaving (OR, 0.30; P < .01). Unexpectedly, older physicians who were least satisfied with their relationships with other physicians were less likely to anticipate leaving their practices (OR, 0.36; P < .01).
Discussion
Our study has demonstrated 3 aspects of how physicians’ regard for their work relates to their plans to leave their jobs: (1) physicians’ plans to leave correlate with their satisfaction with only some aspects of their work; (2) the aspects of work for which satisfaction is associated with plans for leaving differ somewhat for generalists and specialists, and for physicians at various stages of their careers; and (3) anticipated job departure is more common among physicians who are relatively dissatisfied with any of a variety of aspects of their work, whereas satisfaction higher than median levels generally does not protect physicians from thoughts of leaving their jobs. To our knowledge, these last 2 features of the relationship between satisfaction and anticipated departure have not been demonstrated previously.
Even when physicians are displeased with a given aspect of their work, they are not always inclined to leave their jobs. For example, physicians in this and other studies2,31 were least satisfied with the administrative requirements of their work, yet dissatisfaction in this area was not associated with the departure plans of most physician groups. In some cases, a dissatisfying issue is simply not important enough to individuals to warrant a job change. Physicians also have options to leaving, such as problem-solving with managers and coworkers, and taking comfort in the more satisfying aspects of their work.32 Thus, to know when dissatisfaction leads to job changes, one must actually test for statistical associations between the two.
In tests of this kind in the present study, we found 14 instances in which physicians in the lowest satisfaction quartiles were more likely to anticipate leaving than were those of average satisfaction. We found only 2 situations in which physicians in the highest satisfaction quartiles were less likely to anticipate leaving. To promote retention, these data suggest that physicians and their employers should avoid relative dissatisfaction in particular. These data also suggest that building ever-increasing higher levels of satisfaction generally does not prevent turnover. Thus, to foster workforce stability, practice managers should address aspects of physicians’ work or jobs causing them dissatisfaction, or more specifically, satisfaction lower than that of physicians working elsewhere. For aspects of work about which physicians are already satisfied, managers need not foster even higher satisfaction.
Satisfaction with specific aspects of work and turnover
Relative dissatisfaction with one’s community was associated with departure plans for all physician groups. An individual’s relationship with a community-measured in this study through questions about feeling “at home,” a sense of belonging, respected, and strongly connected23-is basic to human existence,33,34 but its importance has been underappreciated in physicians’ lives and careers.33,35 Practices might promote workforce stability by providing opportunities and incentives for employed physicians to participate in local and state professional and community service organizations. Expectations can be set and time allocated for physicians to work with school health programs and volunteer clinics, speak to community groups, and become involved in other ways that build a sense of membership and contribution. These activities will be new for some physicians, will not always come naturally, and may need to be taught and encouraged.
Relative dissatisfaction with pay was associated with departure plans for all of this study’s physician groups, except for physicians older than 55 years. Further and unexpectedly, midcareer physicians who were particularly satisfied with their pay were also more likely to anticipate leaving. Perhaps midcareer physicians who are and feel well paid also more often feel that they can afford to retire or pursue second careers. We have no data to test this explanation. Similarly, we cannot know why older physicians who were least satisfied with their collegial relationships less often planned to leave their jobs. We wondered if this surprising finding was a result of confounding by physicians’ employment in group vs solo practices; we reasoned that among older physicians, those in solo practice may not get along as well with local physicians, but for unrelated reasons may be more attached to their practices and thus less likely to retire or otherwise plan to leave. This possibility proved not to be the case when we added an indicator of solo vs group practice to the statistical model for the older physician group.
How physicians felt about their relationships with patients and about their autonomy was not related to their intentions to leave their practices. Perhaps these once-central features of doctoring have lost their importance to physicians, or maybe physicians believe they will not find better relationships or more autonomy elsewhere, and thus see no benefit in changing jobs.
Age, satisfaction, and anticipated job changes
As in previous studies,36,37 the older physicians of this study were generally more satisfied than the younger physicians. Older physicians, nevertheless, more often anticipated leaving their jobs. We suspect that in many cases an older physician’s thoughts of leaving a position are related to their retirement plans, but our data did not allow us to explore this relationship in detail. We also suspect that physicians’ satisfaction with their jobs influences their plans not only for leaving that particular job but also their plans for leaving the practice of medicine entirely; however, satisfaction with somewhat different aspects of work may influence each of the 2 types of career moves. For example, relative dissatisfaction with relationships with patients may push a physician toward retirement even though it did not seem to promote thoughts of a job change for this study’s physicians.
Common beliefs about physicians’ careers would have predicted the “J”-shape relationship between anticipated job departure rates and increasing physician age Figure 1). Young physicians fresh from training are thought to change jobs once or twice during an initial period of professional experimentation, then settle into suitable practice situations and raise their families. Later in life, job departures again become more common when children leave home, work takes on new meaning in middle age, and physicians become interested in and able to retire or pursue new jobs or second careers. Data from this study generally confirm these common notions, although the nadir in anticipated job departures occurred later than we expected.
Limitations
This study’s 52% response rate, although typical for physician studies,38 may have yielded results not representative of physicians as a whole. To assess this possibility, we compared survey data from this study’s early and late respondents and found meaningful time trends in only 4 of 140 questionnaire items, providing some evidence that nonrespondents-if assumed to be in effect very late respondents-were similar to respondents. Nevertheless, to help adjust for any response bias we weighted analyses.
Statistical associations may not reflect causal relationships in a cross-sectional study such as this. Further, this study’s findings may have differed if actual job departure was available as an outcome measure, even though anticipated departure is a validated and frequently used proxy indicator of workers who will leave their jobs.26-28 A measure of convergent validity was demonstrated in this study, as 16 of the 18 statistical associations between anticipated departure and satisfaction were in the expected direction, and age fluctuated with anticipated departure as we had expected it would with actual departure.
Conclusions and implications
These findings suggest that physicians who are relatively dissatisfied with specific aspects of their work more often plan to leave their jobs, and that these particular work aspects differ somewhat with age and specialty. Practice managers and employers concerned with maintaining a stable physician workforce should address relative dissatisfaction among physicians-particularly with income and community relationships-but need not build high levels of satisfaction. Physicians looking for stable employment should seek positions that they feel offer appropriate compensation and are located in communities to which they can connect. Once there, they should devote time and energy building ties in their communities.
Further research must confirm whether retention indeed improves by remediating relative dissatisfaction with the areas of physicians’ work flagged as important in this study. It also remains to be seen whether other outcomes of physicians’ work, such as the quality of care they provide, also relate primarily to relative dissatisfaction rather than satisfaction, and, specifically, to dissatisfaction with the same aspects of work seeming to affect job departure plans.
Acknowledgments
The authors thank the physician-fellows of UNC’s Primary Care Research Fellowship and the JFP’s reviewers for their thoughtful suggestions for strengthening this report. We also thank the many physician respondents who shared their time and revealed to us important aspects of their lives.
1. Office of the Inspector General. National Health Service Corps: a survey of providers, facilities, and staff. Washington, DC: Office of the Inspector General; April 1994. Report OEI-09-91-01310.
2. Pathman DE, Williams ES, Konrad TR. Rural physician satisfaction: its sources and relationship to retention. J Rural Health 1996;12:366-77.
3. Kassirer JP. Doctor discontent. N Engl J Med 1998;339:1543-44.
4. Dalen JE. Managed competition: who will win? Who will lose? Arch Intern Med 1996;156:2033-5.
5. Schroeder SA. The troubled profession: is medicine’s glass half full or half empty? Ann Intern Med 1992;116:583-92.
6. Hadley J, Mitchell JM, Sulmasy DP, Bloche G. Perceived financial incentives, HMO market penetration, and physicians’ practice styles and satisfaction. Health Serv Res 1999;34:307-21.
7. Kralewski JE, Dowd B, Feldman R, Shapiro J. The physician rebellion. N Engl J Med 1987;315:339-42.
8. Belkin L. Many in medicine are calling rules a professional malaise (part one of three). New York Times. February 18, 1990; sect A:1, 13.
9. Hadley J, Cantor JC, Willke RJ, Feder J, Cohen AB. Young physicians most and least likely to have second thoughts about a career in medicine. Acad Med 1992;67:180-90.
10. Lewis CE. How satisfying is the practice of internal medicine? Ann Intern Med 1991;114:1-5.
11. Price KL. The Study of Turnover. Ames, IA: The Iowa State University Press; 1977.
12. DiMatteo MR, Sherbourne CD, Hays RD, et al. Physicians’ characteristics influence patients’ adherence to medical treatment: results from the Medical Outcomes Study. Health Psychol 1993;12:93-102.
13. Weisman CS, Nathanson CA. Professional satisfaction and client outcomes: a comparative organizational analysis. Med Care 1985;23:1179-92.
14. Melville A. Job satisfaction in general practice: implications for prescribing. Soc Sci Med 1980;14A:495-9.
15. Grol R, Mokkink H, Smits A, et al. Work satisfaction of general practitioners and the quality of patient care. Fam Pract (Great Britain) 1985;2:128-35.
16. Lichtenstein RL. The job satisfaction and retention of physicians in organized settings: a literature review. Med Care Rev 1984;41:139-79.
17. Berger JE, Boyle RL. How to avoid the high costs of physician turnover. Med Group Manage J 1992;November-December:80-91.
18. Buchbinder SB, Wilson M, Melick CF, Powe NR. Estimates of costs of primary care physician turnover. Am J Manag Care 1999;5:1431-8.
19. Herzberg F. The Motivation to Work. New York: Wiley; 1959.
20. Stamps PL. Physicians and organizations: an uneasy alliance or a welcome relief? J Fam Pract 1995;41:27-32.
21. Silver PF. Job satisfaction and dissatisfaction revisited. Educ Psychol Res 1987;7:1-20.
22. Konrad TR, Williams ES, Linzer M, et al. Measuring physician job satisfaction in a changing workplace and a challenging environment. Med Care 1999;37:1174-82.
23. Williams ES, Konrad TR, Linzer M, et al. Refining the measurement of physician job satisfaction: results from the Physician Worklife Survey. Med Care 1999;37:1140-54.
24. Council of American Survey Research Organizations (CASRO). On the Definition of Response Rates: A Special Report of the CASRO Task Force on Completion Rates. Port Jefferson, NY: CASRO; 1982.
25. Ajzen I, Fishbein M. Understanding Attitudes and Predicting Social Behavior. Englewood Cliffs, NJ: Prentice-Hall; 1980.
26. Steel RP, Ovalle NK. A review and meta-analysis of research on the relationship between behavioral intentions and employee turnover. J Appl Psychol 1984;69:673-86.
27. Price JL, Mueller CW. Absenteeism and Turnover of Hospital Employees. Greenwich, CT: JAI Press, Inc; 1986.
28. Mobley WH, Horner SO, Hollingsworth AT. An evaluation of precursors of hospital employee turnover. J Appl Psychol 1978;63:408-14.
29. Kamien M. Staying in or leaving rural practice: 1996 outcomes of rural doctors’ 1986 intentions. Med J Aust 1998;169:318-21.
30. Kleinbaum DG. Epidemiologic Research: Principles and Quantitative Methods. New York: Van Nostrand Reinhold; 1982.
31. Herzberg F. Work and the Nature of Man. New York: New American Library; 1966.
32. Reames HR, Dunstone DC. Professional satisfaction of physicians. Arch Intern Med 1989;149:1951-6.
33. Cutchin MP. Community and self: concepts for rural physician integration and retention. Soc Sci Med 1997;44:1661-74.
34. Fried M. The structure and significance of community satisfaction. Popul Environ 1984;7:61-4.
35. Pathman DE, Konrad TR, Ricketts TC. The National Health Service Corps experience for rural physicians in the late 1980s. JAMA 1994;272:1341-8.
36. Frank E, McMurray JE, Linzer M, Elon L. Career satisfaction of US women physicians: results from the Women Physicians’ Health Study. Arch Intern Med 1999;159:1417-26.
37. Cooper CL, Rout U, Faragher B. Mental health, job satisfaction, and job stress among general practitioners. Br Med J 1989;298:366-70.
38. Asch DA, Jedrziewski MK, Christakis NA. Response rates to surveys published in medical journals. J Clin Epidemiol 1997;50:1129-36.
Address reprint requests to Donald Pathman, MD, MPH, Cecil G. Sheps Center for Health Services Research, University of North Carolina, CB# 7590, Chapel Hill, NC 27599-7590. E-mail: [email protected].
To submit a letter to the editor on this topic, click here:[email protected].
OBJECTIVES: We studied how physicians’ relative satisfaction and/or dissatisfaction with 10 distinct aspects of their work protected against or promoted their plans for leaving their jobs.
STUDY DESIGN: We used a cross-sectional mail survey.
POPULATION: We used questionnaire data from 1939 practicing generalists and specialists across the United States.
OUTCOMES MEASURED: Using logistic regression analysis, we assessed whether physicians in the top and bottom quartiles of satisfaction for each of 10 aspects of their work and communities were more or less likely to anticipate leaving their jobs within 2 years, compared with physicians in mid-satisfaction quartiles. Separate analyses were compiled for generalists vs specialists, and physicians by age groups (27-44 years, 45-54 years, and 55 years and older).
RESULTS: Generalists and specialists had generally comparable levels of satisfaction, whereas physicians in the oldest age group indicated greater satisfaction than younger physicians in 8 of the 10 work areas. One quarter (27%) of physicians anticipated a moderate-to-definite likelihood of leaving their practices within 2 years. The percentage that anticipated leaving varied with physicians’ age, starting at 29% of those 34 years or younger, steadily decreasing with age until a nadir of 22% of those from 45 to 49 years, then reversing direction to steadily increase thereafter. Across the 5 groups (ie, the 2 specialty clusters and 3 age groups), there were only 14 instances in which physicians in the lowest satisfaction quartiles were more likely to anticipate leaving than those of average satisfaction. In only 2 cases were physicians in the highest satisfaction quartiles less likely to anticipate leaving. Relative dissatisfaction with pay and with relationships with communities was associated with plans for leaving in nearly all physician groups. For specific specialty and age groups, anticipated departure also correlated with relative dissatisfaction with other selected areas of work.
CONCLUSIONS: To promote retention, these data suggest that physicians and their employers should avoid physician dissatisfaction in particular; building particularly high levels of satisfaction generally is not helpful for this end. Avoiding relative dissatisfaction with pay and with community relationships appears broadly important.
Until recently, the satisfaction of physicians was studied only among those working in special settings, such as in rural and urban underserved areas. In these settings, a less than satisfying work environment sometimes leads physicians to leave their jobs, with subsequent costs for needy communities.1,2 Now, with US physicians often employed by others, physicians’ autonomy constrained, medicine managed as a business, and incomes falling for some specialties, the satisfaction of rank and file physicians in all locations and specialties can no longer be assumed.3-5 Indeed, unhappiness is increasing among physicians, with growing numbers considering job changes, nonclinical work, and early retirement.6-8 Some physicians regret ever pursuing a medical career.8-10
Dissatisfaction among physicians is a concern even if medical work still pays handsomely and medical schools still have an abundance of applicants. Physicians’ satisfaction relates to their job effectiveness, including the quality of care they render, their patients’ compliance with recommended care, patients’ satisfaction with care, and patients’ health outcomes.6,9,11-15 The most obvious consequence of a dissatisfying job, however, is that physicians will quit to work elsewhere, disrupting patient-physician continuity and creating organizational instability and replacement costs, estimated at nearly $250,000 per physician lost.16-18 A job change also brings personal and financial costs to physicians and their families.
Although common experience and prior studies show that physicians’ job satisfaction generally influences whether they leave their jobs, little more is known about how satisfaction relates to job changes for physicians. From studies of other professions, we know that satisfaction is a multidimensional concept in which individuals can be satisfied with some aspects of work while dissatisfied with others.16,19 Further, we know that workers’ satisfaction with only some aspects of work correlates with turnover.16,20 For example, in 1 recent study rural generalist physicians who were satisfied with their local communities remained longer in their jobs, whereas their satisfaction with most other aspects of work, including with autonomy and doctor-patient relationships, was unrelated to their retention.2 The effects of workers’ satisfaction and dissatisfaction may also require separate assessment, because greater dissatisfaction with a given aspect of work may lead a worker to leave a job, but increasingly higher levels of satisfaction with the same issue may not lead to ever-increasing chances of retention, or vice versa.15,21
The goal of this study was to better understand the relationship between physicians’ satisfaction with various aspects of their work and whether or not they have thoughts or plans to leave their jobs. We assessed whether anticipated job departure related to satisfaction at both the upper and lower ends of its range; that is, whether particularly high satisfaction levels relative to other physicians protected against job change plans and significant relative dissatisfaction promoted such plans. We also assessed how the satisfaction/job-change relationship varied for physician groups with differing needs and values, specifically for generalists compared with specialists, and for younger, midcareer, and older physicians.
Methods
Subjects, survey mailings, and response rates
A sampling frame, previously described,22,23 was constructed from the American Medical Association’s Physician Masterfile. The target population was the 171,252 civilian physicians listed as participating in direct patient care (rather than in training, administration, teaching, inactive, etc), including generalists (family physicians, general internists, and general pediatricians; general practitioners were not included) and specialists (medical and pediatric nonsurgical subspecialists) in the United States. We stratified the frame into geographic regions of high and low penetration of managed care, non-Hispanic white vs other physician ethnicity, and the 5-targeted specialty groupings.
We drew a random sample of 5704 physicians, oversampling smaller strata. Questionnaires and up to 3 follow-up mailings were sent to the sample from January through September 1997. A total of 2325 physicians responded, 52% when corrected for noncontact and ineligibility.24 Based on information on the Masterfile, response rates did not differ by age, for those in office vs hospital-based practices, or for those in communities of high vs low managed care penetration. However, response rates were higher for subspecialists than for generalists, US medical graduates than for international graduates, and those for whom race-ethnicity was listed as black, “missing,” or “other” than for those listed as Hispanic, non-Hispanic white, or Asian. Statistical weighting in analyses adjusted for group contact and response rate differences.
We dropped the 218 respondents who worked less than 25 hours per week in activities related to patient care and another 169 physicians who primarily practiced outside of their specialty, such as general internists who worked as endocrinologists or oncologists. Analyses were based on the remaining 1939 physicians.
Questionnaire design and analyses
The questionnaire included 36 declarative statements about physicians’ views and regard for various features of their work and practices, to which respondents provided Likert-scaled responses from “strongly agree” to “strongly disagree.”22 Representative statements were, “I feel a strong personal connection with my patients” and “My total compensation package is fair.” These items were drawn from previous studies of physician satisfaction, from issues raised in physician focus groups we assembled, and through the suggestions of experts. We then used exploratory factor analysis with a pilot physician sample, followed by confirmatory factor analysis with a validation physician sample to group these items into 10 scales reflecting physicians’ satisfaction with 10 aspects of their work.22,23 Scale alpha coefficients of reliability ranged from 0.65 to 0.77.
Physicians’ anticipated departure from their jobs was measured through a questionnaire item asking “What is the likelihood that you will leave your current practice situation within two years?”, with allowable responses of “none,” “slight,” “moderate,” “likely,” and “definitely.” Social psychology research has substantiated the use of people’s expressed intentions as measures of their future behavior.25 Prior studies26-28 have used anticipated departure and anticipated retention as expeditious proxy indicators for actual job departure and retention, with correlation coefficients between workers’ plans to leave and subsequent departure typically measured at about 0.5. In the only validating physician study, rural physicians in Western Australia much more often left their practices if they had predicted 10 years earlier that they would (odds ratio [OR], 3.3).29 Shorter-term predictions, such as the 2-year time horizon used in this study, should be even more accurate.
This study’s dichotomous outcome indicator-whether physicians anticipated leaving their jobs within 2 years-defined planned “leavers” as those who indicated a moderate, likely, or definite likelihood of leaving their practices; planned “retainees” were those who envisioned only a slight or no chance of leaving. This cut point was selected for both its face validity-falling at the scale point at which leaving became a real possibility for subjects and no longer an unlikely event-and because it yielded an adequately balanced split in outcome values.
In analyses, levels of satisfaction with the 10 aspects of work and anticipated job departure were described for generalists, specialists, and physicians in 3 age groups. We compared groups on satisfaction levels and anticipated departure rates with t tests and 1-way analysis of variance.
We used logistic regression analysis to model separately the anticipated departure of each of the 5 groups. We entered satisfaction levels for each of the 10 areas of work into the models as 2 dichotomous (dummy) variables, yielding 20 satisfaction indicator variables. Ten of these indicators reflected values in the top quartile of satisfaction (ie, top quartile vs lower 3 quartiles) in each area of work and another 10 indicators reflected values in the lowest quartile of satisfaction (bottom quartile vs upper 3 quartiles). Cut points for the middle vs high satisfaction groups for the 10 areas of work ranged from 3.0 to 4.25 on the satisfaction scale (in which 1 indicated dissatisfaction; 3, neutral; and 5, satisfaction); for the middle vs lower satisfaction group, cut points ranged from 2.0 to 3.33. The inclusion of dichotomous indicators of high and low satisfaction for each area of work treated the middle 2 satisfaction quartiles statistically as the omitted, comparison category. This analytic approach modeled the effects on anticipated departure of relatively high and low satisfaction levels for each area of work, compared with more typical, midrange satisfaction levels, simultaneously controlling for relative satisfaction in the other 9 areas of work. We also included control variables for sex, age, and whether physicians owned their practices.
The logistic models for the 5 physician groups were repeated with the more parsimonious forward stepwise variable selection approach to test the robustness of the model findings and as a functional colinearity check.30 With only 1 exception of the 100 satisfaction-departure associations tested across the 5 physician groups, the findings were identical to those of the full logistic models. We reported only the full logistic models.
The statistical significance level was set at .01, to partially adjust for this study’s numerous comparisons.
Results
Unweighted characterizations of the 1939 eligible respondent physicians found that 70% were male and 72% non-Hispanic white, with a median age of 46 years (range, 27-88 years). Most were married (84%) and had children (85%). There were 459 family physicians (24%), 375 general internists (19%), 494 general pediatricians (25%), and 611 pediatric and medical subspecialists (32%). Eighteen percent worked in solo practices, 36% worked in small groups, and the rest worked in larger groups. Most (57%) owned their practices. Physicians had worked in their current practices for a median duration of 9 years when surveyed (range, 0-58 years).
Satisfaction scores
As a whole, the generalist and specialist physicians reported midrange satisfaction levels in the 10 areas of work assessed Table 1). For 2 work facets-administrative responsibilities and having adequate personal time-the average satisfaction scores for both groups indicated overall dissatisfaction. Physicians indicated greatest satisfaction with their intrinsic rewards from patient care, specifically their personal connection with and gratitude from patients.
The mean satisfaction scores of generalists and specialists were comparable for 7 of the 10 aspects of practice. In the remaining 3 areas, the generalist-specialist differences in satisfaction were small. Satisfaction scores varied more often with age, with physicians 55 years and older more satisfied than younger physicians in 8 of the 10 areas queried.
Anticipated job turnover
In total, 27.1% of physicians foresaw leaving their practices within the next 2 years: 13.8% believed leaving was likely or definite and 13.3% believed they had a moderate chance of leaving. Generalist and specialist physicians perceived similar chances of leaving (26.7% vs 30.0%, respectively; P = .31), with and without adjusting for age and sex. In contrast, physicians of various age groups anticipated different likelihoods of leaving Figure 1), with a 29% rate for the youngest group, a nadir of 22% to 23% for physicians aged 45 to 54 years, and again higher rates for older physicians, reaching 63% for those 70 years and older (P < .001).
Those who anticipated leaving their jobs within 2 years frequently also anticipated leaving the practice of clinical medicine entirely within 5 years, including 84% of leavers older than 54 years, 50% of leavers 45 to 54 years, and even 33% of leavers younger than 45 years.
Satisfaction with work and anticipated job turnover
Overall observations. In analyses that controlled for satisfaction with other facets of work and for several physician characteristics, we found that physicians’ regard for only some aspects of work was associated with their anticipated departure from their jobs (Table 2 and Table 3). Further, we found that physicians who were relatively dissatisfied with a variety of aspects of their work more often foresaw leaving their jobs than those with median satisfaction levels. In contrast, intentions to leave were generally just as likely for those of high and median satisfaction levels.Figure 2 shows the typical relationship between satisfaction and anticipated departure. In this example, as in most instances, the transition from lower to higher likelihood of anticipated departure occurs only when physicians’ feelings drop below neutral into dissatisfied levels.
Generalists and specialists. Among generalists and compared with those of average satisfaction (the omitted group in the statistical models), leaving one’s job was anticipated more often by those less satisfied with their pay (OR, 3.65; P < .0001), with their relationships with their communities (OR, 2.26; P < .0001), and with their relationships with the nonphysician staff in their offices (OR, 1.59; P < .01) Table 2). Only for 1 area of work, patient care issues (eg, feeling overwhelmed with patients’ demands and feeling that time constraints prevented good relationships with patients), were generalists in the highest satisfaction quartile less likely to anticipate leaving their practices than generalists with midrange satisfaction scores (OR, 0.60; P < .01).
For specialists, those reporting lowest satisfaction with their pay (OR, 3.24; P = .01) and community relationships (OR, 3.89; P < .01) anticipated leaving more often than those with midrange scores Table 2). For no aspects of work were the most satisfied specialists less likely to anticipate leaving than specialists of average satisfaction.
Younger, midcareer, and older physicians. Among physicians in the youngest group-aged 27 through 44 years-those who were least satisfied with their pay (OR, 4.62; P < .0001) and with their relationships with their communities (OR, 2.79; P < .0001) more often anticipated leaving their jobs than those of median satisfaction Table 3). For no facets of work among younger physicians were those who were most satisfied less likely to anticipate leaving.
For physicians aged 45 through 54 years, anticipated job departure was more common for those least satisfied with 5 areas of work, including again those least satisfied with pay (OR, 11.60; P < .0001) and with their community relationships (OR, 2.11; P < .01). One unexpected association was noted for these midcareer physicians: those in the highest quartile of satisfaction with their pay more often anticipated leaving their practices than those with midrange pay satisfaction scores (OR, 3.36; P < .01).
In the oldest physician group, those least satisfied with their community relationships (OR, 3.31; P < .01) and least satisfied with the administrative aspects of their work (OR, 2.64; P < .01) more often anticipated leaving their jobs. Fewer of those most satisfied with patient care issues foresaw leaving (OR, 0.30; P < .01). Unexpectedly, older physicians who were least satisfied with their relationships with other physicians were less likely to anticipate leaving their practices (OR, 0.36; P < .01).
Discussion
Our study has demonstrated 3 aspects of how physicians’ regard for their work relates to their plans to leave their jobs: (1) physicians’ plans to leave correlate with their satisfaction with only some aspects of their work; (2) the aspects of work for which satisfaction is associated with plans for leaving differ somewhat for generalists and specialists, and for physicians at various stages of their careers; and (3) anticipated job departure is more common among physicians who are relatively dissatisfied with any of a variety of aspects of their work, whereas satisfaction higher than median levels generally does not protect physicians from thoughts of leaving their jobs. To our knowledge, these last 2 features of the relationship between satisfaction and anticipated departure have not been demonstrated previously.
Even when physicians are displeased with a given aspect of their work, they are not always inclined to leave their jobs. For example, physicians in this and other studies2,31 were least satisfied with the administrative requirements of their work, yet dissatisfaction in this area was not associated with the departure plans of most physician groups. In some cases, a dissatisfying issue is simply not important enough to individuals to warrant a job change. Physicians also have options to leaving, such as problem-solving with managers and coworkers, and taking comfort in the more satisfying aspects of their work.32 Thus, to know when dissatisfaction leads to job changes, one must actually test for statistical associations between the two.
In tests of this kind in the present study, we found 14 instances in which physicians in the lowest satisfaction quartiles were more likely to anticipate leaving than were those of average satisfaction. We found only 2 situations in which physicians in the highest satisfaction quartiles were less likely to anticipate leaving. To promote retention, these data suggest that physicians and their employers should avoid relative dissatisfaction in particular. These data also suggest that building ever-increasing higher levels of satisfaction generally does not prevent turnover. Thus, to foster workforce stability, practice managers should address aspects of physicians’ work or jobs causing them dissatisfaction, or more specifically, satisfaction lower than that of physicians working elsewhere. For aspects of work about which physicians are already satisfied, managers need not foster even higher satisfaction.
Satisfaction with specific aspects of work and turnover
Relative dissatisfaction with one’s community was associated with departure plans for all physician groups. An individual’s relationship with a community-measured in this study through questions about feeling “at home,” a sense of belonging, respected, and strongly connected23-is basic to human existence,33,34 but its importance has been underappreciated in physicians’ lives and careers.33,35 Practices might promote workforce stability by providing opportunities and incentives for employed physicians to participate in local and state professional and community service organizations. Expectations can be set and time allocated for physicians to work with school health programs and volunteer clinics, speak to community groups, and become involved in other ways that build a sense of membership and contribution. These activities will be new for some physicians, will not always come naturally, and may need to be taught and encouraged.
Relative dissatisfaction with pay was associated with departure plans for all of this study’s physician groups, except for physicians older than 55 years. Further and unexpectedly, midcareer physicians who were particularly satisfied with their pay were also more likely to anticipate leaving. Perhaps midcareer physicians who are and feel well paid also more often feel that they can afford to retire or pursue second careers. We have no data to test this explanation. Similarly, we cannot know why older physicians who were least satisfied with their collegial relationships less often planned to leave their jobs. We wondered if this surprising finding was a result of confounding by physicians’ employment in group vs solo practices; we reasoned that among older physicians, those in solo practice may not get along as well with local physicians, but for unrelated reasons may be more attached to their practices and thus less likely to retire or otherwise plan to leave. This possibility proved not to be the case when we added an indicator of solo vs group practice to the statistical model for the older physician group.
How physicians felt about their relationships with patients and about their autonomy was not related to their intentions to leave their practices. Perhaps these once-central features of doctoring have lost their importance to physicians, or maybe physicians believe they will not find better relationships or more autonomy elsewhere, and thus see no benefit in changing jobs.
Age, satisfaction, and anticipated job changes
As in previous studies,36,37 the older physicians of this study were generally more satisfied than the younger physicians. Older physicians, nevertheless, more often anticipated leaving their jobs. We suspect that in many cases an older physician’s thoughts of leaving a position are related to their retirement plans, but our data did not allow us to explore this relationship in detail. We also suspect that physicians’ satisfaction with their jobs influences their plans not only for leaving that particular job but also their plans for leaving the practice of medicine entirely; however, satisfaction with somewhat different aspects of work may influence each of the 2 types of career moves. For example, relative dissatisfaction with relationships with patients may push a physician toward retirement even though it did not seem to promote thoughts of a job change for this study’s physicians.
Common beliefs about physicians’ careers would have predicted the “J”-shape relationship between anticipated job departure rates and increasing physician age Figure 1). Young physicians fresh from training are thought to change jobs once or twice during an initial period of professional experimentation, then settle into suitable practice situations and raise their families. Later in life, job departures again become more common when children leave home, work takes on new meaning in middle age, and physicians become interested in and able to retire or pursue new jobs or second careers. Data from this study generally confirm these common notions, although the nadir in anticipated job departures occurred later than we expected.
Limitations
This study’s 52% response rate, although typical for physician studies,38 may have yielded results not representative of physicians as a whole. To assess this possibility, we compared survey data from this study’s early and late respondents and found meaningful time trends in only 4 of 140 questionnaire items, providing some evidence that nonrespondents-if assumed to be in effect very late respondents-were similar to respondents. Nevertheless, to help adjust for any response bias we weighted analyses.
Statistical associations may not reflect causal relationships in a cross-sectional study such as this. Further, this study’s findings may have differed if actual job departure was available as an outcome measure, even though anticipated departure is a validated and frequently used proxy indicator of workers who will leave their jobs.26-28 A measure of convergent validity was demonstrated in this study, as 16 of the 18 statistical associations between anticipated departure and satisfaction were in the expected direction, and age fluctuated with anticipated departure as we had expected it would with actual departure.
Conclusions and implications
These findings suggest that physicians who are relatively dissatisfied with specific aspects of their work more often plan to leave their jobs, and that these particular work aspects differ somewhat with age and specialty. Practice managers and employers concerned with maintaining a stable physician workforce should address relative dissatisfaction among physicians-particularly with income and community relationships-but need not build high levels of satisfaction. Physicians looking for stable employment should seek positions that they feel offer appropriate compensation and are located in communities to which they can connect. Once there, they should devote time and energy building ties in their communities.
Further research must confirm whether retention indeed improves by remediating relative dissatisfaction with the areas of physicians’ work flagged as important in this study. It also remains to be seen whether other outcomes of physicians’ work, such as the quality of care they provide, also relate primarily to relative dissatisfaction rather than satisfaction, and, specifically, to dissatisfaction with the same aspects of work seeming to affect job departure plans.
Acknowledgments
The authors thank the physician-fellows of UNC’s Primary Care Research Fellowship and the JFP’s reviewers for their thoughtful suggestions for strengthening this report. We also thank the many physician respondents who shared their time and revealed to us important aspects of their lives.
1. Office of the Inspector General. National Health Service Corps: a survey of providers, facilities, and staff. Washington, DC: Office of the Inspector General; April 1994. Report OEI-09-91-01310.
2. Pathman DE, Williams ES, Konrad TR. Rural physician satisfaction: its sources and relationship to retention. J Rural Health 1996;12:366-77.
3. Kassirer JP. Doctor discontent. N Engl J Med 1998;339:1543-44.
4. Dalen JE. Managed competition: who will win? Who will lose? Arch Intern Med 1996;156:2033-5.
5. Schroeder SA. The troubled profession: is medicine’s glass half full or half empty? Ann Intern Med 1992;116:583-92.
6. Hadley J, Mitchell JM, Sulmasy DP, Bloche G. Perceived financial incentives, HMO market penetration, and physicians’ practice styles and satisfaction. Health Serv Res 1999;34:307-21.
7. Kralewski JE, Dowd B, Feldman R, Shapiro J. The physician rebellion. N Engl J Med 1987;315:339-42.
8. Belkin L. Many in medicine are calling rules a professional malaise (part one of three). New York Times. February 18, 1990; sect A:1, 13.
9. Hadley J, Cantor JC, Willke RJ, Feder J, Cohen AB. Young physicians most and least likely to have second thoughts about a career in medicine. Acad Med 1992;67:180-90.
10. Lewis CE. How satisfying is the practice of internal medicine? Ann Intern Med 1991;114:1-5.
11. Price KL. The Study of Turnover. Ames, IA: The Iowa State University Press; 1977.
12. DiMatteo MR, Sherbourne CD, Hays RD, et al. Physicians’ characteristics influence patients’ adherence to medical treatment: results from the Medical Outcomes Study. Health Psychol 1993;12:93-102.
13. Weisman CS, Nathanson CA. Professional satisfaction and client outcomes: a comparative organizational analysis. Med Care 1985;23:1179-92.
14. Melville A. Job satisfaction in general practice: implications for prescribing. Soc Sci Med 1980;14A:495-9.
15. Grol R, Mokkink H, Smits A, et al. Work satisfaction of general practitioners and the quality of patient care. Fam Pract (Great Britain) 1985;2:128-35.
16. Lichtenstein RL. The job satisfaction and retention of physicians in organized settings: a literature review. Med Care Rev 1984;41:139-79.
17. Berger JE, Boyle RL. How to avoid the high costs of physician turnover. Med Group Manage J 1992;November-December:80-91.
18. Buchbinder SB, Wilson M, Melick CF, Powe NR. Estimates of costs of primary care physician turnover. Am J Manag Care 1999;5:1431-8.
19. Herzberg F. The Motivation to Work. New York: Wiley; 1959.
20. Stamps PL. Physicians and organizations: an uneasy alliance or a welcome relief? J Fam Pract 1995;41:27-32.
21. Silver PF. Job satisfaction and dissatisfaction revisited. Educ Psychol Res 1987;7:1-20.
22. Konrad TR, Williams ES, Linzer M, et al. Measuring physician job satisfaction in a changing workplace and a challenging environment. Med Care 1999;37:1174-82.
23. Williams ES, Konrad TR, Linzer M, et al. Refining the measurement of physician job satisfaction: results from the Physician Worklife Survey. Med Care 1999;37:1140-54.
24. Council of American Survey Research Organizations (CASRO). On the Definition of Response Rates: A Special Report of the CASRO Task Force on Completion Rates. Port Jefferson, NY: CASRO; 1982.
25. Ajzen I, Fishbein M. Understanding Attitudes and Predicting Social Behavior. Englewood Cliffs, NJ: Prentice-Hall; 1980.
26. Steel RP, Ovalle NK. A review and meta-analysis of research on the relationship between behavioral intentions and employee turnover. J Appl Psychol 1984;69:673-86.
27. Price JL, Mueller CW. Absenteeism and Turnover of Hospital Employees. Greenwich, CT: JAI Press, Inc; 1986.
28. Mobley WH, Horner SO, Hollingsworth AT. An evaluation of precursors of hospital employee turnover. J Appl Psychol 1978;63:408-14.
29. Kamien M. Staying in or leaving rural practice: 1996 outcomes of rural doctors’ 1986 intentions. Med J Aust 1998;169:318-21.
30. Kleinbaum DG. Epidemiologic Research: Principles and Quantitative Methods. New York: Van Nostrand Reinhold; 1982.
31. Herzberg F. Work and the Nature of Man. New York: New American Library; 1966.
32. Reames HR, Dunstone DC. Professional satisfaction of physicians. Arch Intern Med 1989;149:1951-6.
33. Cutchin MP. Community and self: concepts for rural physician integration and retention. Soc Sci Med 1997;44:1661-74.
34. Fried M. The structure and significance of community satisfaction. Popul Environ 1984;7:61-4.
35. Pathman DE, Konrad TR, Ricketts TC. The National Health Service Corps experience for rural physicians in the late 1980s. JAMA 1994;272:1341-8.
36. Frank E, McMurray JE, Linzer M, Elon L. Career satisfaction of US women physicians: results from the Women Physicians’ Health Study. Arch Intern Med 1999;159:1417-26.
37. Cooper CL, Rout U, Faragher B. Mental health, job satisfaction, and job stress among general practitioners. Br Med J 1989;298:366-70.
38. Asch DA, Jedrziewski MK, Christakis NA. Response rates to surveys published in medical journals. J Clin Epidemiol 1997;50:1129-36.
Address reprint requests to Donald Pathman, MD, MPH, Cecil G. Sheps Center for Health Services Research, University of North Carolina, CB# 7590, Chapel Hill, NC 27599-7590. E-mail: [email protected].
To submit a letter to the editor on this topic, click here:[email protected].
Building research capacity in family medicine: Evaluation of the Grant Generating Project
OBJECTIVES: To evaluate the Grant Generating Project (GGP), a program designed to train and assist family medicine researchers to secure research funding as part of an overall strategy to increase research capacity in family medicine in the United States and Canada.
STUDY DESIGN: We surveyed participants in the GGP program. • POPULATION First- through fourth-year participants in the GGP program starting from 1995. Participants were faculty members of American and Canadian family medicine departments.
OUTCOMES MEASURED: Information was obtained on the number of grants/contracts submitted, funded, not funded, and pending by GGP participants following their participation in the GGP research training program. In addition, respondents were asked to evaluate the different components of the GGP program.
RESULTS: Eighteen of the 23 former GGP participants completed the survey. A total of 58 grants/contracts were submitted by respondents, representing approximately US$19.3 million. Currently, 17 (29%) are pending, representing $10.8 million (including training grants). Given the current track record, $4.8 million additional grants funds could be generated. GGP strengths cited by respondents included an effort to enhance family medicine research; personal attention, guidance, motivation, and feedback from GGP faculty and mentors; development of grant-writing skills, including the concept paper; encouragement to attend family medicine meetings; ability to meet and learn from peers; mock study section experience; and the ability to teach, mentor, and encourage others as the GGP experience did for them. Major challenges cited were a variable degree of commitment from mentors, lack of a long-term commitment to participants, and difficulty accommodating the research focus and skill level of participants. In general, most respondents regarded the GGP program as well worth the time and effort invested.
CONCLUSIONS: One to 2 years after participating in the program, participants achieved a remarkable track record of grant submissions. Moreover, the GGP program has had a substantial impact on participants; many are now teaching and mentoring others in their department. If sustained, the program will greatly increase the research capacity of the discipline of family medicine.
In 1995, in recognition of the need for trained family medicine researchers,1-6 the North American Primary Care Research Group (NAPCRG) Committee on Building Research Capacity launched the Family Medicine Grant Generating Project (GGP) to help family medicine researchers successfully apply for their first major research grant. Between 1995 and the time of the evaluation, 23 faculty participants from 21 family medicine departments enrolled in this year-long “fellowship without walls” designed to permit participants to remain housed in their home department while working on their research proposal. Participants attended 3 GGP sessions held in conjunction with the annual meeting of the Society of Teachers of Family Medicine (STFM), and the NACPRG and the Primary Care Research Methods and Statistics meetings over the course of 1 year. Additionally, participants worked via e-mail, telephone, and postal mail with GGP faculty and research mentors during the year. Many participants met in person with mentors.
Although the program is referred to as a “fellowship” and participants as “fellows,” this is neither a traditional family medicine “fellowship” in which participants are housed for a designated time period (usually 2 years), nor an innovative fellowship in which individuals spend concentrated time at another institution. Traditional fellowships usually offer courses for academic credit in a variety of topics such as statistics and epidemiology and typically result in a master’s degree. GGP, however, is designed to train fellows in the design and writing of competitive external grant proposals: it does not offer courses or a degree. Over the fellowship year, fellows attend sessions that focus on the various tools, techniques, and methods required to produce a competitive proposal. These sessions include time devoted to concept paper development, conducting a literature review, development of specific aims, and elaboration of various research methodologies. GGP uses the term “fellowship” to identify the program as a special 1-year period with at least 25% of the time devoted to developing “grantsmanship skills” and producing a competitive proposal. This program is the only one of its kind in family medicine and therefore cannot be compared with more traditional fellowships programs. This article reports on the evaluation results.
Methods
From December 1999 through April 2000 we mailed surveys to 23 former GGP participants. Respondents were asked to evaluate the GGP’s components (statistics, concept paper, grant writing, mentoring) on a scale from “not at all helpful” to “very helpful.” Several open-ended questions were asked about their program expectations; what they considered GGP’s strengths and weaknesses; how participation contributed to their academic career and helped increase research capacity; the barriers encountered in achieving their research goals; the skills learned; suggestions for improving the program; and advice they would give to future applicants. Respondents were asked to indicate the grants/contracts that they submitted after their fellowship. In addition, demographic information was obtained on age, employment position, date of initiation of GGP, the year they graduated from medical school, and the year they participated in the GGP program.
Eighteen (78%) of the participants returned a completed survey. Reasons for not completing the survey, given either by the participants who chose not to complete the survey, or by their departments, included the participant now working outside research; the participant on leave; the participant in the middle of writing a research grant (R01) and therefore not having time to complete the survey; and lack of response (only 2 participants did not respond after 3 attempts to contact them). Of those who did not complete the survey, 1 was from the first-year class, 2 were from the second-year class, and 2 were from the third-year class.
Results
The average age of respondents was 43.8 years (range, 37-53 years). Most were at the assistant professor level. An additional 4 were at the associate professor level, 2 were research directors, 1 was a professor, 1 was a clinician investigator, and 1 was an interim chair. A total of 12 of the respondents were physicians, 5 had a PhD, and 1 had a Doctor of Public Health degree; 4 of the physicians also had a Masters in Public Health and 2 had a PhD. The average number of years since obtaining their terminal degree was 15.1 years (range, 4-26 years). Most respondents (11) had their terminal degree 15 years or more.
Evaluation of research activities
A total of 58 grants/contracts were submitted by the respondents, representing approximately US$19.3 million. These figures represent an underestimate because 1 first-year class respondent only mentioned having submitted more than 10 grants over the last 3 years ranging from $50,000 to more than $1 million, but did not elaborate further. Due to this lack of specification, this information could not be entered into the subsequent analysis. Seven (12%) of those submitted were training grants, representing approximately $1.7 million. Most (32, or 55%) of the submitted grants/contracts were to nonfederal organizations, whereas 19 (or -33%) were to federal agencies. Although 22 (38%) of the submitted grants/contracts were for less than $50,000, 11 (19%) (excluding training grants) were for more than $300,000. Nineteen (33%) of the submitted grants/contracts were funded including 4 training grants, representing approximately $1 million excluding training grants ($2.3 million including training grants).
Although 22 (38%) of the grant submissions were not funded (representing approximately $6.2 million), another 17 (29%) were pending, representing approximately $10.8 million, including training grants. Based on prior experience, approximately 46% of these pending grants may receive funding, which could result in an additional $4.8 million.
Table 1 shows the number of grants/contracts submitted, funded, not funded, and pending as Principal Investigator (PI) or Co-PI by class year of the GGP fellowship. Most (42, 72%) of the grants/contracts submitted were by the first- or second-year class fellows with 12 grants pending and 16 funded. The Figure 1 shows the number of grants/contracts submitted by submission date and fellowship class year. The number of submissions increased within 1 to 2 years of the fellowship.
Although the sample size was too small for statistical evaluation, some trends are noted. Only 3 of the 18 respondents indicated that they had not submitted a grant or contract as PI or Co-PI, whereas 1 respondent indicated being an evaluator or research director on 6 funded grants. The average number of grants submitted by participants was 4.4. Participants who had submitted a grant tended to be older and to have held their terminal degree for a longer time. Thirty-seven of the total grant/contract submissions were by respondents older than the mean age of 43 years, and 41 of the total grant/contract submissions were by respondents who had received their terminal degree more than 15 years ago. The latter respondents also accounted for 15 of the 19 funded grants. No difference was noted in the rate of grant submission by terminal degree type.
Several respondents also indicated the following grant roles: qualitative analyst on 2 grants; research writer, administrator, project director, or evaluator on 8 grants; co-investigator on 2 grants; and consultant on 4 grants. Twelve of these grants were funded, with 4 training grants representing approximately $1.7 million and 8 research grants representing approximately $1.3 million.
Evaluation of GGP components
Table 2 shows the evaluation of each GGP component. Most respondents indicated that the concept paper and the grant-writing components were very helpful. Additional components indicated as very helpful included networking, mock reviews, consultant mentoring, and peer groups. Compared with the concept paper and grant-writing components, the statistics and the mentoring components were rated as less helpful. Expectations of the GGP
Respondents were asked to describe their major expectations of the GGP. Most respondents replied that they expected to receive help in grant writing, to better understand the grant application process, and to develop helpful relationships with experienced researchers.
All of the respondents indicated that most of their expectations were met. However, respondents were mixed regarding the mentoring process. Although 8 indicated that the mentoring was very helpful, some respondents had difficulty in identifying a mentor or were never successful in finding a mentor, whereas others indicated problems with long distance mentoring.
Strengths of the GGP
Respondents indicated that program strengths include enhancing the value of family medicine research, receiving guidance and feedback, learning from the experiences of their peers, and developing grant-writing skills. Respondents specifically mentioned the focus on the NIH grant process and the mock study section as strengths.
With respect to how the GGP contributed to their career, 7 of the respondents said that the program helped them connect with other researchers and gave them confidence in grant writing. In other instances, the GGP program helped respondents to achieve a more secure position, obtain a promotion, start a career, or change academic departments/institutions. As one respondent mentioned, “I think more critically and more daringly . . . I [was] promoted after that from assistant to associate.”
Most respondents indicated that the GGP program enabled them to mentor, teach, and encourage other faculty members in their department in their grant-writing efforts. As one respondent mentioned, the GGP experience ”. . . has helped me to bridge the gap between clinicians and researchers.”
Challenges of the GGP
The most specific challenge of the GGP program mentioned by respondents was the variable commitment of mentors and the lack of having a mentor with expertise in a respondent’s area of research. The major barriers to respondents toward achieving their research goals were (1) the lack of a supportive research environment including a lack of financial support, few peers engaged in research, a lack of local mentoring, and infrastructural and administrative barriers (eg, no links to statisticians, confused priorities within department, and lack of diversity and foresight in department); (2) the lack of time to do research while participating in clinical duties and academic activities; and (3) the lack of information about funding opportunities at their institution. One respondent mentioned not having any external barriers but that the GGP experience “. . . did cause me to reevaluate and ultimately redefine my research goals.”
When asked what skills they learned during the GGP that helped them address these barriers, several respondents indicated (1) time management, including how to realistically organize the research process; (2) the ability to make connections with outside mentors and consultants; and (3) confidence development, such as contacting a program specialist despite poor information from their institution. However, respondents who mentioned the barrier of a nonsupportive research environment indicated that skills to address this barrier were not taught in the GGP program. Recommendations for improving the GGP
Suggestions for improving the GGP program included having 2 GGP entry levels (for beginning researchers and experienced researchers), continuing networking opportunities for “graduates,” addressing the need for female mentors, following up with consultations and mentoring, and having a mentor with expertise in participants’ area of research.
With respect to advice to future applicants, respondents mentioned being more aggressive in working with a mentor, having reasonable expectations, having long-term support from the department, using time efficiently to network, and reflecting on one’s motivation toward an intensive research career. As one participant said, “I would support the application 100% and notify them that it is one of the best investments of time they can make for their academic career.”
Discussion
The respondents’ comments made clear that the GGP is an “excellent place to start a career.” Most respondents appeared to regard the program as well worth the time and effort invested. Aside from some adjustments, such as consistency in mentoring and accommodating the research focus and skill level of participants, it is “. . . very important to continue [the] effort to train new researchers.” Interestingly, the GGP had a substantial impact on the extent to which many participants are now teaching and mentoring others to help develop the skills necessary for meaningful research.
Moreover, within 1 to 2 years of the program participants achieved a remarkable track record of grant submissions. Although for some participants “. . . breaking in [getting grant awards] still seems mysterious and forbidding,” they appreciated the opportunity to learn how to write a coherent concept paper, how to apply “good methods,” the importance of a track record, and to learn from experienced researchers.
As a result in large part of this evaluation, funding for the GGP has been continued with support from NAPCRG, the American Academy of Family Physicians, the STFM, the College of Family Physicians of Canada, and the home departments of participating academic departments and community-based residency programs.
Family medicine is poised to generate new knowledge through the development of its own research agenda-one that focuses on integrated, relationship-centered patient, family, and community health care.7 Young researchers, however, need to be nurtured, mentored, and organizationally supported.8 Research initiatives such as the GGP represent a collective enterprise, a building of coalitions toward the development of a culture of family medicine research. Continued research success requires commitments from both individuals and departments if family medicine research is to grow and prosper.
1. Green LA, Graham R, Stephens GG, Frey JJ. A preface concerning Keystone III. Fam Med 2001;33:230-1.
2. Culpepper L, Franks P. Family medicine research. Status at the end of the first decade. JAMA 1983;249:67.-
3. Perkoff GT. The research environment in family practice. J Fam Pract 1985;21:393.-
4. Rogers JC, Holloway RL, Miller SM. Academic mentoring and family medicine’s research productivity. Fam Med 1990;22:186-90.
5. What Does It Mean to Build Research Capacity? Results of an Affinity Diagram Group Process by the NAPCRG Committee on Building Research Capacity and the AFMO Research Subcommittee. November 1999.;
6. Task Force on Building Capacity for Research in Primary Care. Putting Research Into Practice: Report of the Task Force on Building Capacity for Research in Primary Care. Minneapolis, MN: The Task Force; 1993.
7. Stange KC, Miller WL, McWhinney I. Developing the knowledge base of family practice. Fam Med 2001;33:286-97.
8. Teixeira R. The mentoring process: beneficial to manager, employee, and organization. Clin Lab Manage Rev 1999;13:314-6.
Address reprint requests to James D. Campbell, PhD, Department of Family and Community Medicine, MA 306 Medical Sciences Building, Columbia, MO 65212. E-mail: [email protected].
To submit a letter to the editor on this topic, click here:[email protected].
OBJECTIVES: To evaluate the Grant Generating Project (GGP), a program designed to train and assist family medicine researchers to secure research funding as part of an overall strategy to increase research capacity in family medicine in the United States and Canada.
STUDY DESIGN: We surveyed participants in the GGP program. • POPULATION First- through fourth-year participants in the GGP program starting from 1995. Participants were faculty members of American and Canadian family medicine departments.
OUTCOMES MEASURED: Information was obtained on the number of grants/contracts submitted, funded, not funded, and pending by GGP participants following their participation in the GGP research training program. In addition, respondents were asked to evaluate the different components of the GGP program.
RESULTS: Eighteen of the 23 former GGP participants completed the survey. A total of 58 grants/contracts were submitted by respondents, representing approximately US$19.3 million. Currently, 17 (29%) are pending, representing $10.8 million (including training grants). Given the current track record, $4.8 million additional grants funds could be generated. GGP strengths cited by respondents included an effort to enhance family medicine research; personal attention, guidance, motivation, and feedback from GGP faculty and mentors; development of grant-writing skills, including the concept paper; encouragement to attend family medicine meetings; ability to meet and learn from peers; mock study section experience; and the ability to teach, mentor, and encourage others as the GGP experience did for them. Major challenges cited were a variable degree of commitment from mentors, lack of a long-term commitment to participants, and difficulty accommodating the research focus and skill level of participants. In general, most respondents regarded the GGP program as well worth the time and effort invested.
CONCLUSIONS: One to 2 years after participating in the program, participants achieved a remarkable track record of grant submissions. Moreover, the GGP program has had a substantial impact on participants; many are now teaching and mentoring others in their department. If sustained, the program will greatly increase the research capacity of the discipline of family medicine.
In 1995, in recognition of the need for trained family medicine researchers,1-6 the North American Primary Care Research Group (NAPCRG) Committee on Building Research Capacity launched the Family Medicine Grant Generating Project (GGP) to help family medicine researchers successfully apply for their first major research grant. Between 1995 and the time of the evaluation, 23 faculty participants from 21 family medicine departments enrolled in this year-long “fellowship without walls” designed to permit participants to remain housed in their home department while working on their research proposal. Participants attended 3 GGP sessions held in conjunction with the annual meeting of the Society of Teachers of Family Medicine (STFM), and the NACPRG and the Primary Care Research Methods and Statistics meetings over the course of 1 year. Additionally, participants worked via e-mail, telephone, and postal mail with GGP faculty and research mentors during the year. Many participants met in person with mentors.
Although the program is referred to as a “fellowship” and participants as “fellows,” this is neither a traditional family medicine “fellowship” in which participants are housed for a designated time period (usually 2 years), nor an innovative fellowship in which individuals spend concentrated time at another institution. Traditional fellowships usually offer courses for academic credit in a variety of topics such as statistics and epidemiology and typically result in a master’s degree. GGP, however, is designed to train fellows in the design and writing of competitive external grant proposals: it does not offer courses or a degree. Over the fellowship year, fellows attend sessions that focus on the various tools, techniques, and methods required to produce a competitive proposal. These sessions include time devoted to concept paper development, conducting a literature review, development of specific aims, and elaboration of various research methodologies. GGP uses the term “fellowship” to identify the program as a special 1-year period with at least 25% of the time devoted to developing “grantsmanship skills” and producing a competitive proposal. This program is the only one of its kind in family medicine and therefore cannot be compared with more traditional fellowships programs. This article reports on the evaluation results.
Methods
From December 1999 through April 2000 we mailed surveys to 23 former GGP participants. Respondents were asked to evaluate the GGP’s components (statistics, concept paper, grant writing, mentoring) on a scale from “not at all helpful” to “very helpful.” Several open-ended questions were asked about their program expectations; what they considered GGP’s strengths and weaknesses; how participation contributed to their academic career and helped increase research capacity; the barriers encountered in achieving their research goals; the skills learned; suggestions for improving the program; and advice they would give to future applicants. Respondents were asked to indicate the grants/contracts that they submitted after their fellowship. In addition, demographic information was obtained on age, employment position, date of initiation of GGP, the year they graduated from medical school, and the year they participated in the GGP program.
Eighteen (78%) of the participants returned a completed survey. Reasons for not completing the survey, given either by the participants who chose not to complete the survey, or by their departments, included the participant now working outside research; the participant on leave; the participant in the middle of writing a research grant (R01) and therefore not having time to complete the survey; and lack of response (only 2 participants did not respond after 3 attempts to contact them). Of those who did not complete the survey, 1 was from the first-year class, 2 were from the second-year class, and 2 were from the third-year class.
Results
The average age of respondents was 43.8 years (range, 37-53 years). Most were at the assistant professor level. An additional 4 were at the associate professor level, 2 were research directors, 1 was a professor, 1 was a clinician investigator, and 1 was an interim chair. A total of 12 of the respondents were physicians, 5 had a PhD, and 1 had a Doctor of Public Health degree; 4 of the physicians also had a Masters in Public Health and 2 had a PhD. The average number of years since obtaining their terminal degree was 15.1 years (range, 4-26 years). Most respondents (11) had their terminal degree 15 years or more.
Evaluation of research activities
A total of 58 grants/contracts were submitted by the respondents, representing approximately US$19.3 million. These figures represent an underestimate because 1 first-year class respondent only mentioned having submitted more than 10 grants over the last 3 years ranging from $50,000 to more than $1 million, but did not elaborate further. Due to this lack of specification, this information could not be entered into the subsequent analysis. Seven (12%) of those submitted were training grants, representing approximately $1.7 million. Most (32, or 55%) of the submitted grants/contracts were to nonfederal organizations, whereas 19 (or -33%) were to federal agencies. Although 22 (38%) of the submitted grants/contracts were for less than $50,000, 11 (19%) (excluding training grants) were for more than $300,000. Nineteen (33%) of the submitted grants/contracts were funded including 4 training grants, representing approximately $1 million excluding training grants ($2.3 million including training grants).
Although 22 (38%) of the grant submissions were not funded (representing approximately $6.2 million), another 17 (29%) were pending, representing approximately $10.8 million, including training grants. Based on prior experience, approximately 46% of these pending grants may receive funding, which could result in an additional $4.8 million.
Table 1 shows the number of grants/contracts submitted, funded, not funded, and pending as Principal Investigator (PI) or Co-PI by class year of the GGP fellowship. Most (42, 72%) of the grants/contracts submitted were by the first- or second-year class fellows with 12 grants pending and 16 funded. The Figure 1 shows the number of grants/contracts submitted by submission date and fellowship class year. The number of submissions increased within 1 to 2 years of the fellowship.
Although the sample size was too small for statistical evaluation, some trends are noted. Only 3 of the 18 respondents indicated that they had not submitted a grant or contract as PI or Co-PI, whereas 1 respondent indicated being an evaluator or research director on 6 funded grants. The average number of grants submitted by participants was 4.4. Participants who had submitted a grant tended to be older and to have held their terminal degree for a longer time. Thirty-seven of the total grant/contract submissions were by respondents older than the mean age of 43 years, and 41 of the total grant/contract submissions were by respondents who had received their terminal degree more than 15 years ago. The latter respondents also accounted for 15 of the 19 funded grants. No difference was noted in the rate of grant submission by terminal degree type.
Several respondents also indicated the following grant roles: qualitative analyst on 2 grants; research writer, administrator, project director, or evaluator on 8 grants; co-investigator on 2 grants; and consultant on 4 grants. Twelve of these grants were funded, with 4 training grants representing approximately $1.7 million and 8 research grants representing approximately $1.3 million.
Evaluation of GGP components
Table 2 shows the evaluation of each GGP component. Most respondents indicated that the concept paper and the grant-writing components were very helpful. Additional components indicated as very helpful included networking, mock reviews, consultant mentoring, and peer groups. Compared with the concept paper and grant-writing components, the statistics and the mentoring components were rated as less helpful. Expectations of the GGP
Respondents were asked to describe their major expectations of the GGP. Most respondents replied that they expected to receive help in grant writing, to better understand the grant application process, and to develop helpful relationships with experienced researchers.
All of the respondents indicated that most of their expectations were met. However, respondents were mixed regarding the mentoring process. Although 8 indicated that the mentoring was very helpful, some respondents had difficulty in identifying a mentor or were never successful in finding a mentor, whereas others indicated problems with long distance mentoring.
Strengths of the GGP
Respondents indicated that program strengths include enhancing the value of family medicine research, receiving guidance and feedback, learning from the experiences of their peers, and developing grant-writing skills. Respondents specifically mentioned the focus on the NIH grant process and the mock study section as strengths.
With respect to how the GGP contributed to their career, 7 of the respondents said that the program helped them connect with other researchers and gave them confidence in grant writing. In other instances, the GGP program helped respondents to achieve a more secure position, obtain a promotion, start a career, or change academic departments/institutions. As one respondent mentioned, “I think more critically and more daringly . . . I [was] promoted after that from assistant to associate.”
Most respondents indicated that the GGP program enabled them to mentor, teach, and encourage other faculty members in their department in their grant-writing efforts. As one respondent mentioned, the GGP experience ”. . . has helped me to bridge the gap between clinicians and researchers.”
Challenges of the GGP
The most specific challenge of the GGP program mentioned by respondents was the variable commitment of mentors and the lack of having a mentor with expertise in a respondent’s area of research. The major barriers to respondents toward achieving their research goals were (1) the lack of a supportive research environment including a lack of financial support, few peers engaged in research, a lack of local mentoring, and infrastructural and administrative barriers (eg, no links to statisticians, confused priorities within department, and lack of diversity and foresight in department); (2) the lack of time to do research while participating in clinical duties and academic activities; and (3) the lack of information about funding opportunities at their institution. One respondent mentioned not having any external barriers but that the GGP experience “. . . did cause me to reevaluate and ultimately redefine my research goals.”
When asked what skills they learned during the GGP that helped them address these barriers, several respondents indicated (1) time management, including how to realistically organize the research process; (2) the ability to make connections with outside mentors and consultants; and (3) confidence development, such as contacting a program specialist despite poor information from their institution. However, respondents who mentioned the barrier of a nonsupportive research environment indicated that skills to address this barrier were not taught in the GGP program. Recommendations for improving the GGP
Suggestions for improving the GGP program included having 2 GGP entry levels (for beginning researchers and experienced researchers), continuing networking opportunities for “graduates,” addressing the need for female mentors, following up with consultations and mentoring, and having a mentor with expertise in participants’ area of research.
With respect to advice to future applicants, respondents mentioned being more aggressive in working with a mentor, having reasonable expectations, having long-term support from the department, using time efficiently to network, and reflecting on one’s motivation toward an intensive research career. As one participant said, “I would support the application 100% and notify them that it is one of the best investments of time they can make for their academic career.”
Discussion
The respondents’ comments made clear that the GGP is an “excellent place to start a career.” Most respondents appeared to regard the program as well worth the time and effort invested. Aside from some adjustments, such as consistency in mentoring and accommodating the research focus and skill level of participants, it is “. . . very important to continue [the] effort to train new researchers.” Interestingly, the GGP had a substantial impact on the extent to which many participants are now teaching and mentoring others to help develop the skills necessary for meaningful research.
Moreover, within 1 to 2 years of the program participants achieved a remarkable track record of grant submissions. Although for some participants “. . . breaking in [getting grant awards] still seems mysterious and forbidding,” they appreciated the opportunity to learn how to write a coherent concept paper, how to apply “good methods,” the importance of a track record, and to learn from experienced researchers.
As a result in large part of this evaluation, funding for the GGP has been continued with support from NAPCRG, the American Academy of Family Physicians, the STFM, the College of Family Physicians of Canada, and the home departments of participating academic departments and community-based residency programs.
Family medicine is poised to generate new knowledge through the development of its own research agenda-one that focuses on integrated, relationship-centered patient, family, and community health care.7 Young researchers, however, need to be nurtured, mentored, and organizationally supported.8 Research initiatives such as the GGP represent a collective enterprise, a building of coalitions toward the development of a culture of family medicine research. Continued research success requires commitments from both individuals and departments if family medicine research is to grow and prosper.
1. Green LA, Graham R, Stephens GG, Frey JJ. A preface concerning Keystone III. Fam Med 2001;33:230-1.
2. Culpepper L, Franks P. Family medicine research. Status at the end of the first decade. JAMA 1983;249:67.-
3. Perkoff GT. The research environment in family practice. J Fam Pract 1985;21:393.-
4. Rogers JC, Holloway RL, Miller SM. Academic mentoring and family medicine’s research productivity. Fam Med 1990;22:186-90.
5. What Does It Mean to Build Research Capacity? Results of an Affinity Diagram Group Process by the NAPCRG Committee on Building Research Capacity and the AFMO Research Subcommittee. November 1999.;
6. Task Force on Building Capacity for Research in Primary Care. Putting Research Into Practice: Report of the Task Force on Building Capacity for Research in Primary Care. Minneapolis, MN: The Task Force; 1993.
7. Stange KC, Miller WL, McWhinney I. Developing the knowledge base of family practice. Fam Med 2001;33:286-97.
8. Teixeira R. The mentoring process: beneficial to manager, employee, and organization. Clin Lab Manage Rev 1999;13:314-6.
Address reprint requests to James D. Campbell, PhD, Department of Family and Community Medicine, MA 306 Medical Sciences Building, Columbia, MO 65212. E-mail: [email protected].
To submit a letter to the editor on this topic, click here:[email protected].
If electronic medical records are so great, why aren’t family physicians using them?
OBJECTIVE: The chasm theory of marketing states that fundamental differences exist between early adopters of technology and the mainstream marketplace, making it difficult for technology to transition to the mainstream market. We investigated possible differences in attitudes and beliefs about electronic medical records (EMRs) between current EMR users (early market) and nonusers (mainstream market).
STUDY DESIGN: Cross-sectional mail survey.
POPULATION: Active members in the Indiana Academy of Family Physicians 2000–2001 membership database (N = 1328).
OUTCOMES MEASURED: Differences in attitudes, beliefs, and demographic characteristics of EMR users and nonusers.
RESULTS: The overall return rate was 51.7%; 14.4% of respondents currently use an EMR. Electronic medical record users were more likely to practice in urban areas or to be hospital-based and reported seeing fewer patients. Nonusers were less likely to believe that (1) physicians should computerize their medical records; (2) current EMRs are a useful tool for physicians; (3) EMRs improve quality of medical records and decrease errors; and (4) it is easy to enter data into current EMRs. Nonusers were more likely to believe that paper records are more secure and more confidential than EMRs. Both users and nonusers believed that current EMRs are too expensive.
CONCLUSIONS: A chasm exists between EMR users and nonusers regarding issues that affect EMR implementation, including necessity, usefulness, data entry, cost, security and confidentiality. To reach full implementation of EMRs in family medicine, organizations should use these data to target their research, education, and marketing efforts.
- Physicians have major concerns about data entry, cost, security, and confidentiality of current electronic medical records (EMRs), resulting in their questioning the need for EMRs and the usefulness of existing EMRS.
- There are large differences in the perceptions of physicians who do and do not use EMRs.
- Before EMRs will be accepted by a majority of family physicians, EMR companies must balance cost against the needs of mainstream family physicians.
—Clement J. McDonald, MD1
The benefits of using electronic medical records (EMRs) instead of paper records have been well documented.1-6 However, the current use (5% to 10%) falls very short of the 100% by the year 2000 recommended by a 1991 Institute of Medicine (IOM) report7; furthermore, the rate of EMR use has remained relatively unchanged (5% to 10%) over the past decade. Given this stagnant rate of growth despite the IOM’s support, it is important to analyze the needs and perceptions of physicians with regard to EMRs.
There are few articles on the use of EMRs in out-patient settings.1-20 Only 2 studies have analyzed the perceived needs and preferences for use of EMRs and family physicians.11,12 The first study found significant concerns about the ease of data entry, data confidentiality, data sharing, and initial EMR train-ing.11 The other article rated user requirements in rank order, but was limited by a 24% response rate.12 Most of the literature and information on the Internet about EMRs focuses on the needs and perceptions of current EMR users.1-20
The chasm theory of marketing (Figure) states that the early market of new product adopters (the first 5% to 10%) often has different concerns than the mainstream market. This group leaps ahead of the mainstream, creating a chasm.21 Early market adopters are more willing to endure technical difficulties and poor service to make a product work if it promises a competitive advantage, while mainstream users are more likely to look for widely used products that are inexpensive and easily assimilated into their current work environment with little organizational discomfort.21 Products engineered for the needs of the early market are often too complex to meet the needs of mainstream users; therefore, many products are unable to cross the chasm from early markets to mainstream markets because they fail to meet the needs of the mainstream users.21
This theory may explain the slow adoption of EMRs by family physicians. The purpose of this study was to investigate differences in attitudes and beliefs about EMRs between current EMR users (early market) and nonusers (mainstream market).
FIGURE 1
Chasm theory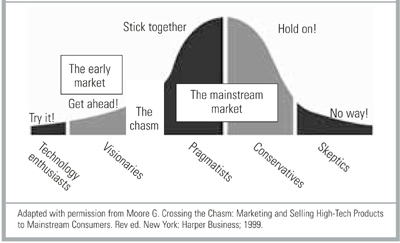
Methods
The study population comprised active members of the Indiana Academy of Family Physicians (IAFP) listed in the 2000–2001 IAFP Membership Database. IAFP members who were practicing outside of Indiana or who spent less than 4 hours per week seeing patients were excluded from the study, leaving a study population of 1398 participants.
The authors designed a 53-item questionnaire based on the principles outlined in the 1991 Institute of Medicine report.7,18,19 Six physicians with expertise in medical informatics screened the questionnaire for content validity. Twelve academic family physicians reviewed the instrument for structure, clarity, and relevance to test face validity. Ten resident physicians generated a test–retest reliability rate of >80% for each item over a 2-week interval.
The questionnaire consisted of 3 parts. The first section included questions about physician demographics, use of computer aided technology, practice location and type, and volume of patients. The second section contained questions about respondents’ attitudes, beliefs, and concerns regarding current and emerging technologic issues related to EMRs using a 4-point Likert scale ranging from “strongly agree” to “strongly disagree.” The Likert Scale also contained a “Don’t Know” option. The third section included multiple-choice questions to evaluate specific computer technology needs and preferences of family physicians. The final item was an open-ended question inviting a written response about any issues the respondent felt were not adequately addressed by the questionnaire.
Questionnaires were mailed in January 2001, with a followup mailing to nonrespondents 3 weeks later.22 Of the 726 (51.7%) responses, 45 (6.2%) were excluded because they did not indicate user or nonuser EMR status and 63 (8.8%) were excluded because half or more of the questions were unanswered. There were 618 (44.2%) usable surveys. The questionnaires were scanned into an electronic database and verified for accuracy using TELEform® software; the data were analyzed using SPSS® (Version 10.0). The Likert scales were collapsed to a dichotomous variable, “agree” (strongly agree and agree) and “disagree” (strongly disagree, disagree, and unsure) for this analysis. Differences in demographic characteristics and attitudes, beliefs, and concerns were tested for significance using chi-square tests and the z-test of proportions. Statistical significance was determined by P < .05.
Results
Demographic and practice characteristics of the respondents are presented in Table 1. Of the 618 respondents, 89 (14.4%) were EMR users. A comparison of the users and nonusers revealed that there were no statistically significant differences in age or sex. EMR nonusers were more likely to practice in a suburban or rural location and were more often in a solo or small practice (2–6 physicians). Nonusers also tended to see an average of 31 more patients per week (116 vs 85).
Table 2 presents responses to questions about respondents’ experience with computer technology. A significantly greater proportion of EMR users use the Internet at home (98.9% vs 89.3%), at work (88.6% vs 62.8%), e-mail at work (78.4% vs 48.2%), and personal digital assistants (PDAs) (49.4% vs 26.1%). Other differences in technology use were not statistically significant.
Responses to questions about perceived EMR need and usefulness are summarized in Table 3. Nonusers were significantly less likely than users to believe that (1) physicians should computerize their medical records (67.7% vs 92.1%); (2) current EMRs are useful (51.5% vs 92.0%); (3) EMRs will reduce their risk of making medical errors (56.6% vs 78.7%); and (4) EMRs will improve health care quality in their office (52.4% vs 80.9%) or in the United States overall (54.3% vs 78.4%). Most respondents (77.6%) expressed an interest in an EMR system that would connect all physician practices, laboratories, radiography facilities, and hospitals for the secure exchange of patient data (85.4% user vs 76.2% nonuser; P = .076).
Table 4 summarizes the attitudes and beliefs of respondents about previously reported potential obstacles to EMR use, including: (1) data input; (2) cost; and (3) confidentiality and security.1,11,12,14,17-20,23,24 Few respondents (55.1% users vs 13.4% nonusers) stated that it is easy to enter data into current EMRs. Many respondents in both groups (61.8% vs 68.0%) responded that EMRs are too costly. Users tend to consider a relatively higher price as affordable for setting up an EMR system (66% would pay more than $5000) and are willing to pay a slightly higher monthly fee for the ongoing use of an EMR (65% would pay more than $100 per month). Users consider EMRs as more secure (54.5% users vs 21.2% nonusers) and more confidential (62.5% users vs 21.9% nonusers) than paper records. Few respondents stated they would object to sharing their EMR data with other physicians (24.9% nonusers vs 13.6% users).
TABLE 1
Demographic characteristics of respondents
| Characteristic | User n (%) | Nonuser n (%) | P |
|---|---|---|---|
| Female | 23 (26.1) | 131 (25.0) | .925 |
| Mean age (y) | 44.1 (8.84 SD) | 44.6 (9.29 SD) | .059 |
| Mean number of outpatient visits per week | 85.1 (51.4 SD) | 116.1 (55.2 SD) | <.001 |
| County type | |||
| Rural | 26 (29.5) | 194 (37.2) | .013 |
| Suburban | 28 (31.8) | 204 (39.1) | |
| Urban | 34 (38.6) | 124 (23.8) | |
| Practice setting | |||
| Solo | 12 (13.6) | 101 (19.3) | .003 |
| Small FP (2–6) | 21 (23.9) | 191 (36.5) | |
| Large FP (>6) | 8 (9.1) | 55 (10.5) | |
| Multispecialty group | 9 (10.2) | 54 (10.3) | |
| Hospital employee | 25 (28.4) | 91 (17.4) | |
| Other | 13 (14.8) | 31 (5.9) | |
| 89 users and 529 nonusers responded. | |||
| The number of users or nonusers for a given variable may be less than the total due to missing responses. | |||
| FP, family practice; SD, standard deviation. | |||
TABLE 2
Technology use by respondents
| User n (%) | Nonuser n (%) | P | |
|---|---|---|---|
| Computer use at home | |||
| Computer | 89/89 (100.0) | 507/527 (96.2) | .122 |
| Internet | 88/89 (98.9) | 467/523 (89.3) | .007 |
| 83/89 (93.3) | 451/521 (86.6) | .111 | |
| Computer use at work | |||
| Computer | 86/87 (98.9) | 467/506 (92.3) | .043 |
| Internet | 78/88 (88.6) | 318/506 (62.8) | <.001 |
| 69/88 (78.4) | 242/502 (48.2) | <.001 | |
| Computerized scheduling | 83/89 (93.3) | 420/526 (79.8) | .004 |
| Computerized billing | 79/84 (94.0) | 458/489 (93.7) | .999 |
| Handheld computer user | 44/89 (49.4) | 137/525 (26.1) | <.001 |
| 89 users and 529 nonusers responded. The number of users or nonusers for a given variable may be less than the total due to missing responses. | |||
TABLE 3
Attitudes and beliefs regarding electronic medical records
| Number (%) agreeing with statement | P | ||
|---|---|---|---|
| User | Nonuser | ||
| Physicians should computerize their medical records | 82/89 (92.1) | 354/523 (67.7) | <.001 |
| Currently available EMRs are a useful tool for physicians (92.0) (51.5) | 81/88 | 269/522 | <.001 |
| EMRs will improve the quality of care in physicians’ offices | 72/89 (80.9) | 274/523 (52.4) | <.001 |
| Widespread use of EMRs would improve healthcare quality in the United States | 69/88 (78.4) | 283/521 (54.3) | <.001 |
| EMRs will reduce my risk of making medical errors | 70/89 (78.7) | 297/525 (56.6) | <.001 |
| I am interested in an EMR that would connect all physician practices, labs, x-ray facilities, and hospitals in my area securely for the exchange of patient data | 76/89 (85.4) | 398/522 (76.2) | .076 |
| 89 users and 529 nonusers responded. The number of users or nonusers for a given variable may be less than the total due to missing responses. | |||
| EMR, electronic medical records. | |||
TABLE 4
Possible barriers to electronic medical record use
| Number (%) agreeing with statement | P | ||
|---|---|---|---|
| User | Nonuser | ||
| Security and confidentiality | |||
| EMRs are more secure | 48/88 (54.5) | 111/523 (21.2) | <.001 |
| EMRs are more confidential | 55/88 (62.5) | 115/524 (21.9) | <.001 |
| Object to sharing EMR data with other physicians | 11/81 (13.6) | 121/486 (24.9) | .037 |
| Usefulness | |||
| Easy to enter data | 49/89 (55.1) | 70/521 (13.4) | <.001 |
| Ability to use an EMR with minimal training | 79/87 (90.8) | 479/522 (91.8) | .929 |
| Would like direct link to Medline | 73/88 (83.0) | 298/522 (57.1) | <.001 |
| Would like direct links to updated treatment guidelines | 73/87 (83.9) | 360/521 (69.1) | .007 |
| Would like direct link to patient education materials | 83/88 (94.3) | 421/520 (81.0) | .003 |
| EMR data should be available without patient or physician identifiers for use in clinical and health care services research | 46/89 (51.7) | 263/521 (50.5) | .924 |
| Costs | |||
| Current EMRs are too costly | 55/89 (61.8) | 355/522 (68.0) | <.001 |
| Affordable price per physician to set up an EMR system | |||
| <$1000 | 5/77 (6.5) | 65/464 (14.0) | <.001 |
| $1000–$4999 | 21/77 (27.3) | 202/464 (43.5) | |
| $5000–$9999 | 27/77 (35.1) | 147/464 (31.7) | |
| $10,000–$19,999 | 17/77 (22.1) | 42/464 (9.1) | |
| >$20,000 | 7/77 (9.1) | 8/464 (1.7) | |
| Willing to spend monthly for ongoing use of an EMR | |||
| <$50 | 3 (3.9) | 89 (19.7) | .013 |
| $50–$99 | 23 (30.3) | 101 (22.4) | |
| $100–$149 | 25 (32.9) | 139 (30.8) | |
| $150–$199 | 14 (18.4) | 79 (17.5) | |
| >$200 | 11 (14.5) | 43 (9.5) | |
| 89 users and 529 nonusers responded. The number of users or nonusers for a given variable may be less than the total due to missing responses. EMR, electronic medical records. | |||
Discussion
Despite the low penetration of EMRs (14.4%), family physicians in Indiana are interested in using EMRs. Most users (85.4%) and nonusers (76.2%) expressed interest in a system that would securely connect all physician practices, laboratories, radiography facilities, and hospitals in their area for exchanging patient data. Many family physicians are currently using the Internet (67%), e-mail (53%), computers (93%), and PDAs (30%) in their practice.
Despite this expressed interest, only two thirds of nonusers believe that physicians should computerize their medical records. This may be related to the fact that only half of the responding nonusers perceive that current EMRs are useful for physicians. There was also a considerable lack of belief that EMRs will improve quality or reduce medical errors. Replies to the open-ended question indicated that 5% to 10% of respondents, for a variety of reasons, have strong feelings about computerizing their offices. A targeted, educational effort to show the advantages of EMRs may be useful for improving physician perceptions of EMRs.
The demographic profile of the nonusers may indicate that current EMRs are not perceived as being well adapted for use in rural, solo, or small-group practice. EMRs may be thought of as more feasible for larger organizations with larger capital budgets and robust information technology support systems. The differences in the volume of patients treated between users and nonusers suggest that productivity concerns may also be important.
Both EMR users and nonusers believe current EMRs are too costly. The data suggests that family physicians are willing to pay a relatively low set-up charge <$5000 would be accepted by more than 87% of respondents) and a very low monthly fee (<$100 would be accepted by more than 81% of respondents) for the use of an EMR. Few current EMRs can be installed and operated within these price specifications. This supports the previously published view that physicians believe current EMRs are not cost effective.17 Lower prices or greater perceived value is needed for physicians to consider EMRs a wise business choice.
Data entry is a concern for both users and nonusers. Practicing family medicine requires varied skills, a fast pace, treating patients from multiple age groups, diagnosing conditions from a myriad of potentially unrelated complaints, and keeping a comprehensive record from multiple sources. These factors make data entry the largest potential obstacle to the effective use of computers in family medi-cine.1,14,18-20 Our data indicate that only 55% of users and 13.4% of nonusers believe data entry is easy for current EMRs. Perceived and actual ease of data entry must be improved before widespread adoption of EMRs by family physicians can be realized.
Concerns about security and confidentiality generated the largest number of written comments. Despite evidence to the contrary,9,23,24,28,29 nonusers believe that there are more security and confidentiality risks involved with EMRs than paper records. A small group emphatically expressed dismay at the possibility of subjecting their office to a “Big Brother”-type system. The Health Insurance Portability and Accountability Act (HIPAA) sets the standards for medical record (electronic and written) confidentiality and security, and the creation of an EMR that is HIPAA compliant may give providers greater confidence in its security and confidentiality.23,24 Educating physicians about the security and confidentiality risks of paper records and the safeguards built into EMR programs may help alleviate these concerns.
It is encouraging that both users and nonusers seem to understand the potential usefulness of EMRs. Over half of the nonusers believe an EMR is a useful way to provide patient education materials, participate in clinical and health services research, launch a literature search (eg, Medline), or obtain up-to-date treatment guidelines. To increase the number of physicians using EMRs, vendors should maximize and promote the use of EMR features.
The results of this study are limited by the response rate. Although this rate introduces the possibility of a nonresponse bias, it is comparable to or exceeds the response rate in other physician EMR surveys.11,12,23-27 Evidence of nonresponse bias includes the high rate of EMR use by Indiana family physicians (14.4%) compared to previous studies, suggesting users were more likely to respond than nonusers. Questionnaires that were returned early in the survey showed an EMR use rate of 40%, but this number dropped quickly after the first 2 weeks. A very small percentage of questionnaires returned near the end of the study were from EMR users. The nonresponse bias of the study is likely toward EMR users and nonusers who have seriously considered using EMRs; since this is the segment of the physician market most likely to adopt EMRs, the sample is likely adequate for the attempted analysis. The study is also limited by its focus on family physicians in Indiana, and may differ from the views of physicians in other specialties or states.
Conclusions
Our data demonstrate the existence of a chasm between EMR users (early adopters) and nonusers (mainstream market) regarding attitudes and perceptions that impact the implementation of EMRs by family physicians. Specifically, EMR nonusers exhibit the following important differences from users: (1) less perceived need for EMRs; (2) greater concerns about EMR data entry; (3) less confidence in the security and confidentiality of EMRs; and (4) more concerns about the cost for installation and ongoing use of EMRs.
Further studies are needed to examine nonusers in more detail and to discover if current EMRs can meet the needs of the mainstream physician user. Our research suggests that data entry, cost, security and confidentiality, and connectivity issues are important starting points. A qualitative study of nonusers is desirable to better understand the true needs of the mainstream physician. Broadening this study to include all specialties throughout the country would also be useful.
The IOM has repeatedly called for the computerization of the US medical system.7,28,29 Government, industry, and physician organizations should use the results of this study to target their research, education, and marketing efforts regarding EMRs, and to develop EMRs that meet the needs of most practicing family physicians, especially family physicians in small group, high-volume, rural or suburban practices.
Acknowledgments
This study was undertaken as part of the faculty development fellowship at the University of North Carolina Department of Family Medicine and funded by the Bureau of Health Professions grant no. HRSA#1-D14-HP00019. We thank the Indiana Academy of Family Physicians, St. Francis Family Practice Residency, Indiana University Department of Family Medicine, Bowen Research Center, UNC Faculty Development Fellowship 2000–2001 fellows, Nancy Loomis, and Jenny Kirby for their support.
1. McDonald CJ. The barriers to electronic medical record systems and how to overcome them. J Am Med Inform Assoc 1997;4:213-21.
2. Wager KA, SM Ornstein, Jenkins RG. Perceived value of computer-based patient records among clinician users. MD Comput 1997;14:334-6,338-340.
3. Wager KA, Lee FW, White AW, Ward DM, Ornstein SM. Impact of an electronic medical record system on community-based primary care practices. J Am Board Fam Pract 2000;13:338-48.
4. Spann SJ. Should the complete medical record be computerized in family practice? An affirmative view. J Fam Pract 1990;30:457-60.
5. Ornstein SM. Electronic medical records in family practice: the time is now. J Fam Pract 1997;44:45-8.
6. Rodnick JE. Should the complete medical record be computerized in family practice? An opposing view. J Fam Pract 1990;30:460-4.
7. Dick RS. The Institute of Medicine’s patient record study and its implications for record administrators. Top Health Rec Manage 1991;11:67-72.
8. Swanson T, Dostal J, Eichhorst B, Jernigan C, Knox M, Roper K. Recent implementations of electronic medical records in four family practice residency programs. Acad Med 1997;72:607-12.
9. Woodward B. The computer-based patient record and confidentiality. N Engl J Med 1995;333:1419-22.
10. Wager KA, Heda S, Austin CJ. Developing a health information network within an integrated delivery system: a case study. Top Health Inf Manage 1997;17:20-31.
11. Strasberg HR, Tudiver F, Holbrook AM, Geiger G, Keshavjee KK, Troyan S. Moving towards an electronic patient record: a survey to assess the needs of community family physicians. Proc AMIA Symp 1998;230-4.
12. Smith WR, Zastrow R. User requirements for the computerized patient record: physician opinions. Proc Annu Symp Comput Appl Med Care 1994;994.-
13. Powsner SM, Wyatt JC, Wright P. Opportunities for and challenges of computerisation. Lancet 1998;352:1617-22.
14. Musham C, Orstein SM, Jenkins RG. Family practice educators’ perceptions of computer-based patient records. Fam Med 1995;27:571-5.
15. Arias-Vimarlund V, Ljunggren M, Timpka T. Implementation of computer-based patient records in primary care: the societal health economic effects. Proc AMIA Annu Fall Symp 1996;503-7.
16. Lawler F, Cacy JR, Viviani N, Hamm RM, Cobb SW. Implementation and termination of a computerized medical information system. J Fam Pract 1996;42:233-6.
17. Lindberg DA, Humpreys BL. Medical informatics. JAMA 1996;275:1821-2.
18. Levitt JI. Why physicians continue to reject the computerized medical record. Minn Med 1994;7(8):17-21.
19. Lenhart JG, Honess K, Covington D, Johnson KE. An analysis of trends, perceptions, and use patterns of electronic medical records among US family practice residency programs. Fam Med 2000;32:109-14.
20. Bernstein RM, Hollingworth GR, Viner G, Lemelin J. Family practice informatics: research issues in computerized medical records. Proc Annu Symp Comput Appl Med Care 1993;93-7.
21. Moore G. Crossing the Chasm: Marketing and Selling High-Tech Products to Mainstream Consumers. Rev ed. New York: Harper Business; 1999.
22. Dillman DA. Mail and Internet Surveys: The Tailored Design Method. 2nd ed. New York: John Wiley & Sons; 1999.
23. Kibbe DC. A problem-oriented approach to the HIPAA security standards. Fam Pract Manag 2001;8(7):37-43.
24. Kibbe DC. What you need to know about HIPAA now. Fam Pract Manag 2001;8(3):43-7.
25. Bomba D. A comparative study of computerised medical records usage among general practitioners in Australia and Sweden. Medinfo 1998;(Pt 1):55-9.
26. Ebell MH, Gaspar DL, Khurana S. Family physicians’ p for computerized decision-support hardware and software. J Fam Pract 1997;45:137-41.
27. Kalsman MW, Acosta DA. Use of the Internet as a medical resource by rural physicians. J Am Board Fam Pract 2000;13:349-52.
28. Committee on Quality Healthcare in America, eds. Crossing the Quality Chasm: A New Health System for the 21st Century. Washington, DC: National Academy Press; 2001.
29. Kohn L, Corrigan J, Donaldson M, eds. To Err Is Human: Building a Safer Health System. Washington, DC: National Academy Press; 2000.
OBJECTIVE: The chasm theory of marketing states that fundamental differences exist between early adopters of technology and the mainstream marketplace, making it difficult for technology to transition to the mainstream market. We investigated possible differences in attitudes and beliefs about electronic medical records (EMRs) between current EMR users (early market) and nonusers (mainstream market).
STUDY DESIGN: Cross-sectional mail survey.
POPULATION: Active members in the Indiana Academy of Family Physicians 2000–2001 membership database (N = 1328).
OUTCOMES MEASURED: Differences in attitudes, beliefs, and demographic characteristics of EMR users and nonusers.
RESULTS: The overall return rate was 51.7%; 14.4% of respondents currently use an EMR. Electronic medical record users were more likely to practice in urban areas or to be hospital-based and reported seeing fewer patients. Nonusers were less likely to believe that (1) physicians should computerize their medical records; (2) current EMRs are a useful tool for physicians; (3) EMRs improve quality of medical records and decrease errors; and (4) it is easy to enter data into current EMRs. Nonusers were more likely to believe that paper records are more secure and more confidential than EMRs. Both users and nonusers believed that current EMRs are too expensive.
CONCLUSIONS: A chasm exists between EMR users and nonusers regarding issues that affect EMR implementation, including necessity, usefulness, data entry, cost, security and confidentiality. To reach full implementation of EMRs in family medicine, organizations should use these data to target their research, education, and marketing efforts.
- Physicians have major concerns about data entry, cost, security, and confidentiality of current electronic medical records (EMRs), resulting in their questioning the need for EMRs and the usefulness of existing EMRS.
- There are large differences in the perceptions of physicians who do and do not use EMRs.
- Before EMRs will be accepted by a majority of family physicians, EMR companies must balance cost against the needs of mainstream family physicians.
—Clement J. McDonald, MD1
The benefits of using electronic medical records (EMRs) instead of paper records have been well documented.1-6 However, the current use (5% to 10%) falls very short of the 100% by the year 2000 recommended by a 1991 Institute of Medicine (IOM) report7; furthermore, the rate of EMR use has remained relatively unchanged (5% to 10%) over the past decade. Given this stagnant rate of growth despite the IOM’s support, it is important to analyze the needs and perceptions of physicians with regard to EMRs.
There are few articles on the use of EMRs in out-patient settings.1-20 Only 2 studies have analyzed the perceived needs and preferences for use of EMRs and family physicians.11,12 The first study found significant concerns about the ease of data entry, data confidentiality, data sharing, and initial EMR train-ing.11 The other article rated user requirements in rank order, but was limited by a 24% response rate.12 Most of the literature and information on the Internet about EMRs focuses on the needs and perceptions of current EMR users.1-20
The chasm theory of marketing (Figure) states that the early market of new product adopters (the first 5% to 10%) often has different concerns than the mainstream market. This group leaps ahead of the mainstream, creating a chasm.21 Early market adopters are more willing to endure technical difficulties and poor service to make a product work if it promises a competitive advantage, while mainstream users are more likely to look for widely used products that are inexpensive and easily assimilated into their current work environment with little organizational discomfort.21 Products engineered for the needs of the early market are often too complex to meet the needs of mainstream users; therefore, many products are unable to cross the chasm from early markets to mainstream markets because they fail to meet the needs of the mainstream users.21
This theory may explain the slow adoption of EMRs by family physicians. The purpose of this study was to investigate differences in attitudes and beliefs about EMRs between current EMR users (early market) and nonusers (mainstream market).
FIGURE 1
Chasm theory
Methods
The study population comprised active members of the Indiana Academy of Family Physicians (IAFP) listed in the 2000–2001 IAFP Membership Database. IAFP members who were practicing outside of Indiana or who spent less than 4 hours per week seeing patients were excluded from the study, leaving a study population of 1398 participants.
The authors designed a 53-item questionnaire based on the principles outlined in the 1991 Institute of Medicine report.7,18,19 Six physicians with expertise in medical informatics screened the questionnaire for content validity. Twelve academic family physicians reviewed the instrument for structure, clarity, and relevance to test face validity. Ten resident physicians generated a test–retest reliability rate of >80% for each item over a 2-week interval.
The questionnaire consisted of 3 parts. The first section included questions about physician demographics, use of computer aided technology, practice location and type, and volume of patients. The second section contained questions about respondents’ attitudes, beliefs, and concerns regarding current and emerging technologic issues related to EMRs using a 4-point Likert scale ranging from “strongly agree” to “strongly disagree.” The Likert Scale also contained a “Don’t Know” option. The third section included multiple-choice questions to evaluate specific computer technology needs and preferences of family physicians. The final item was an open-ended question inviting a written response about any issues the respondent felt were not adequately addressed by the questionnaire.
Questionnaires were mailed in January 2001, with a followup mailing to nonrespondents 3 weeks later.22 Of the 726 (51.7%) responses, 45 (6.2%) were excluded because they did not indicate user or nonuser EMR status and 63 (8.8%) were excluded because half or more of the questions were unanswered. There were 618 (44.2%) usable surveys. The questionnaires were scanned into an electronic database and verified for accuracy using TELEform® software; the data were analyzed using SPSS® (Version 10.0). The Likert scales were collapsed to a dichotomous variable, “agree” (strongly agree and agree) and “disagree” (strongly disagree, disagree, and unsure) for this analysis. Differences in demographic characteristics and attitudes, beliefs, and concerns were tested for significance using chi-square tests and the z-test of proportions. Statistical significance was determined by P < .05.
Results
Demographic and practice characteristics of the respondents are presented in Table 1. Of the 618 respondents, 89 (14.4%) were EMR users. A comparison of the users and nonusers revealed that there were no statistically significant differences in age or sex. EMR nonusers were more likely to practice in a suburban or rural location and were more often in a solo or small practice (2–6 physicians). Nonusers also tended to see an average of 31 more patients per week (116 vs 85).
Table 2 presents responses to questions about respondents’ experience with computer technology. A significantly greater proportion of EMR users use the Internet at home (98.9% vs 89.3%), at work (88.6% vs 62.8%), e-mail at work (78.4% vs 48.2%), and personal digital assistants (PDAs) (49.4% vs 26.1%). Other differences in technology use were not statistically significant.
Responses to questions about perceived EMR need and usefulness are summarized in Table 3. Nonusers were significantly less likely than users to believe that (1) physicians should computerize their medical records (67.7% vs 92.1%); (2) current EMRs are useful (51.5% vs 92.0%); (3) EMRs will reduce their risk of making medical errors (56.6% vs 78.7%); and (4) EMRs will improve health care quality in their office (52.4% vs 80.9%) or in the United States overall (54.3% vs 78.4%). Most respondents (77.6%) expressed an interest in an EMR system that would connect all physician practices, laboratories, radiography facilities, and hospitals for the secure exchange of patient data (85.4% user vs 76.2% nonuser; P = .076).
Table 4 summarizes the attitudes and beliefs of respondents about previously reported potential obstacles to EMR use, including: (1) data input; (2) cost; and (3) confidentiality and security.1,11,12,14,17-20,23,24 Few respondents (55.1% users vs 13.4% nonusers) stated that it is easy to enter data into current EMRs. Many respondents in both groups (61.8% vs 68.0%) responded that EMRs are too costly. Users tend to consider a relatively higher price as affordable for setting up an EMR system (66% would pay more than $5000) and are willing to pay a slightly higher monthly fee for the ongoing use of an EMR (65% would pay more than $100 per month). Users consider EMRs as more secure (54.5% users vs 21.2% nonusers) and more confidential (62.5% users vs 21.9% nonusers) than paper records. Few respondents stated they would object to sharing their EMR data with other physicians (24.9% nonusers vs 13.6% users).
TABLE 1
Demographic characteristics of respondents
| Characteristic | User n (%) | Nonuser n (%) | P |
|---|---|---|---|
| Female | 23 (26.1) | 131 (25.0) | .925 |
| Mean age (y) | 44.1 (8.84 SD) | 44.6 (9.29 SD) | .059 |
| Mean number of outpatient visits per week | 85.1 (51.4 SD) | 116.1 (55.2 SD) | <.001 |
| County type | |||
| Rural | 26 (29.5) | 194 (37.2) | .013 |
| Suburban | 28 (31.8) | 204 (39.1) | |
| Urban | 34 (38.6) | 124 (23.8) | |
| Practice setting | |||
| Solo | 12 (13.6) | 101 (19.3) | .003 |
| Small FP (2–6) | 21 (23.9) | 191 (36.5) | |
| Large FP (>6) | 8 (9.1) | 55 (10.5) | |
| Multispecialty group | 9 (10.2) | 54 (10.3) | |
| Hospital employee | 25 (28.4) | 91 (17.4) | |
| Other | 13 (14.8) | 31 (5.9) | |
| 89 users and 529 nonusers responded. | |||
| The number of users or nonusers for a given variable may be less than the total due to missing responses. | |||
| FP, family practice; SD, standard deviation. | |||
TABLE 2
Technology use by respondents
| User n (%) | Nonuser n (%) | P | |
|---|---|---|---|
| Computer use at home | |||
| Computer | 89/89 (100.0) | 507/527 (96.2) | .122 |
| Internet | 88/89 (98.9) | 467/523 (89.3) | .007 |
| 83/89 (93.3) | 451/521 (86.6) | .111 | |
| Computer use at work | |||
| Computer | 86/87 (98.9) | 467/506 (92.3) | .043 |
| Internet | 78/88 (88.6) | 318/506 (62.8) | <.001 |
| 69/88 (78.4) | 242/502 (48.2) | <.001 | |
| Computerized scheduling | 83/89 (93.3) | 420/526 (79.8) | .004 |
| Computerized billing | 79/84 (94.0) | 458/489 (93.7) | .999 |
| Handheld computer user | 44/89 (49.4) | 137/525 (26.1) | <.001 |
| 89 users and 529 nonusers responded. The number of users or nonusers for a given variable may be less than the total due to missing responses. | |||
TABLE 3
Attitudes and beliefs regarding electronic medical records
| Number (%) agreeing with statement | P | ||
|---|---|---|---|
| User | Nonuser | ||
| Physicians should computerize their medical records | 82/89 (92.1) | 354/523 (67.7) | <.001 |
| Currently available EMRs are a useful tool for physicians (92.0) (51.5) | 81/88 | 269/522 | <.001 |
| EMRs will improve the quality of care in physicians’ offices | 72/89 (80.9) | 274/523 (52.4) | <.001 |
| Widespread use of EMRs would improve healthcare quality in the United States | 69/88 (78.4) | 283/521 (54.3) | <.001 |
| EMRs will reduce my risk of making medical errors | 70/89 (78.7) | 297/525 (56.6) | <.001 |
| I am interested in an EMR that would connect all physician practices, labs, x-ray facilities, and hospitals in my area securely for the exchange of patient data | 76/89 (85.4) | 398/522 (76.2) | .076 |
| 89 users and 529 nonusers responded. The number of users or nonusers for a given variable may be less than the total due to missing responses. | |||
| EMR, electronic medical records. | |||
TABLE 4
Possible barriers to electronic medical record use
| Number (%) agreeing with statement | P | ||
|---|---|---|---|
| User | Nonuser | ||
| Security and confidentiality | |||
| EMRs are more secure | 48/88 (54.5) | 111/523 (21.2) | <.001 |
| EMRs are more confidential | 55/88 (62.5) | 115/524 (21.9) | <.001 |
| Object to sharing EMR data with other physicians | 11/81 (13.6) | 121/486 (24.9) | .037 |
| Usefulness | |||
| Easy to enter data | 49/89 (55.1) | 70/521 (13.4) | <.001 |
| Ability to use an EMR with minimal training | 79/87 (90.8) | 479/522 (91.8) | .929 |
| Would like direct link to Medline | 73/88 (83.0) | 298/522 (57.1) | <.001 |
| Would like direct links to updated treatment guidelines | 73/87 (83.9) | 360/521 (69.1) | .007 |
| Would like direct link to patient education materials | 83/88 (94.3) | 421/520 (81.0) | .003 |
| EMR data should be available without patient or physician identifiers for use in clinical and health care services research | 46/89 (51.7) | 263/521 (50.5) | .924 |
| Costs | |||
| Current EMRs are too costly | 55/89 (61.8) | 355/522 (68.0) | <.001 |
| Affordable price per physician to set up an EMR system | |||
| <$1000 | 5/77 (6.5) | 65/464 (14.0) | <.001 |
| $1000–$4999 | 21/77 (27.3) | 202/464 (43.5) | |
| $5000–$9999 | 27/77 (35.1) | 147/464 (31.7) | |
| $10,000–$19,999 | 17/77 (22.1) | 42/464 (9.1) | |
| >$20,000 | 7/77 (9.1) | 8/464 (1.7) | |
| Willing to spend monthly for ongoing use of an EMR | |||
| <$50 | 3 (3.9) | 89 (19.7) | .013 |
| $50–$99 | 23 (30.3) | 101 (22.4) | |
| $100–$149 | 25 (32.9) | 139 (30.8) | |
| $150–$199 | 14 (18.4) | 79 (17.5) | |
| >$200 | 11 (14.5) | 43 (9.5) | |
| 89 users and 529 nonusers responded. The number of users or nonusers for a given variable may be less than the total due to missing responses. EMR, electronic medical records. | |||
Discussion
Despite the low penetration of EMRs (14.4%), family physicians in Indiana are interested in using EMRs. Most users (85.4%) and nonusers (76.2%) expressed interest in a system that would securely connect all physician practices, laboratories, radiography facilities, and hospitals in their area for exchanging patient data. Many family physicians are currently using the Internet (67%), e-mail (53%), computers (93%), and PDAs (30%) in their practice.
Despite this expressed interest, only two thirds of nonusers believe that physicians should computerize their medical records. This may be related to the fact that only half of the responding nonusers perceive that current EMRs are useful for physicians. There was also a considerable lack of belief that EMRs will improve quality or reduce medical errors. Replies to the open-ended question indicated that 5% to 10% of respondents, for a variety of reasons, have strong feelings about computerizing their offices. A targeted, educational effort to show the advantages of EMRs may be useful for improving physician perceptions of EMRs.
The demographic profile of the nonusers may indicate that current EMRs are not perceived as being well adapted for use in rural, solo, or small-group practice. EMRs may be thought of as more feasible for larger organizations with larger capital budgets and robust information technology support systems. The differences in the volume of patients treated between users and nonusers suggest that productivity concerns may also be important.
Both EMR users and nonusers believe current EMRs are too costly. The data suggests that family physicians are willing to pay a relatively low set-up charge <$5000 would be accepted by more than 87% of respondents) and a very low monthly fee (<$100 would be accepted by more than 81% of respondents) for the use of an EMR. Few current EMRs can be installed and operated within these price specifications. This supports the previously published view that physicians believe current EMRs are not cost effective.17 Lower prices or greater perceived value is needed for physicians to consider EMRs a wise business choice.
Data entry is a concern for both users and nonusers. Practicing family medicine requires varied skills, a fast pace, treating patients from multiple age groups, diagnosing conditions from a myriad of potentially unrelated complaints, and keeping a comprehensive record from multiple sources. These factors make data entry the largest potential obstacle to the effective use of computers in family medi-cine.1,14,18-20 Our data indicate that only 55% of users and 13.4% of nonusers believe data entry is easy for current EMRs. Perceived and actual ease of data entry must be improved before widespread adoption of EMRs by family physicians can be realized.
Concerns about security and confidentiality generated the largest number of written comments. Despite evidence to the contrary,9,23,24,28,29 nonusers believe that there are more security and confidentiality risks involved with EMRs than paper records. A small group emphatically expressed dismay at the possibility of subjecting their office to a “Big Brother”-type system. The Health Insurance Portability and Accountability Act (HIPAA) sets the standards for medical record (electronic and written) confidentiality and security, and the creation of an EMR that is HIPAA compliant may give providers greater confidence in its security and confidentiality.23,24 Educating physicians about the security and confidentiality risks of paper records and the safeguards built into EMR programs may help alleviate these concerns.
It is encouraging that both users and nonusers seem to understand the potential usefulness of EMRs. Over half of the nonusers believe an EMR is a useful way to provide patient education materials, participate in clinical and health services research, launch a literature search (eg, Medline), or obtain up-to-date treatment guidelines. To increase the number of physicians using EMRs, vendors should maximize and promote the use of EMR features.
The results of this study are limited by the response rate. Although this rate introduces the possibility of a nonresponse bias, it is comparable to or exceeds the response rate in other physician EMR surveys.11,12,23-27 Evidence of nonresponse bias includes the high rate of EMR use by Indiana family physicians (14.4%) compared to previous studies, suggesting users were more likely to respond than nonusers. Questionnaires that were returned early in the survey showed an EMR use rate of 40%, but this number dropped quickly after the first 2 weeks. A very small percentage of questionnaires returned near the end of the study were from EMR users. The nonresponse bias of the study is likely toward EMR users and nonusers who have seriously considered using EMRs; since this is the segment of the physician market most likely to adopt EMRs, the sample is likely adequate for the attempted analysis. The study is also limited by its focus on family physicians in Indiana, and may differ from the views of physicians in other specialties or states.
Conclusions
Our data demonstrate the existence of a chasm between EMR users (early adopters) and nonusers (mainstream market) regarding attitudes and perceptions that impact the implementation of EMRs by family physicians. Specifically, EMR nonusers exhibit the following important differences from users: (1) less perceived need for EMRs; (2) greater concerns about EMR data entry; (3) less confidence in the security and confidentiality of EMRs; and (4) more concerns about the cost for installation and ongoing use of EMRs.
Further studies are needed to examine nonusers in more detail and to discover if current EMRs can meet the needs of the mainstream physician user. Our research suggests that data entry, cost, security and confidentiality, and connectivity issues are important starting points. A qualitative study of nonusers is desirable to better understand the true needs of the mainstream physician. Broadening this study to include all specialties throughout the country would also be useful.
The IOM has repeatedly called for the computerization of the US medical system.7,28,29 Government, industry, and physician organizations should use the results of this study to target their research, education, and marketing efforts regarding EMRs, and to develop EMRs that meet the needs of most practicing family physicians, especially family physicians in small group, high-volume, rural or suburban practices.
Acknowledgments
This study was undertaken as part of the faculty development fellowship at the University of North Carolina Department of Family Medicine and funded by the Bureau of Health Professions grant no. HRSA#1-D14-HP00019. We thank the Indiana Academy of Family Physicians, St. Francis Family Practice Residency, Indiana University Department of Family Medicine, Bowen Research Center, UNC Faculty Development Fellowship 2000–2001 fellows, Nancy Loomis, and Jenny Kirby for their support.
1. McDonald CJ. The barriers to electronic medical record systems and how to overcome them. J Am Med Inform Assoc 1997;4:213-21.
2. Wager KA, SM Ornstein, Jenkins RG. Perceived value of computer-based patient records among clinician users. MD Comput 1997;14:334-6,338-340.
3. Wager KA, Lee FW, White AW, Ward DM, Ornstein SM. Impact of an electronic medical record system on community-based primary care practices. J Am Board Fam Pract 2000;13:338-48.
4. Spann SJ. Should the complete medical record be computerized in family practice? An affirmative view. J Fam Pract 1990;30:457-60.
5. Ornstein SM. Electronic medical records in family practice: the time is now. J Fam Pract 1997;44:45-8.
6. Rodnick JE. Should the complete medical record be computerized in family practice? An opposing view. J Fam Pract 1990;30:460-4.
7. Dick RS. The Institute of Medicine’s patient record study and its implications for record administrators. Top Health Rec Manage 1991;11:67-72.
8. Swanson T, Dostal J, Eichhorst B, Jernigan C, Knox M, Roper K. Recent implementations of electronic medical records in four family practice residency programs. Acad Med 1997;72:607-12.
9. Woodward B. The computer-based patient record and confidentiality. N Engl J Med 1995;333:1419-22.
10. Wager KA, Heda S, Austin CJ. Developing a health information network within an integrated delivery system: a case study. Top Health Inf Manage 1997;17:20-31.
11. Strasberg HR, Tudiver F, Holbrook AM, Geiger G, Keshavjee KK, Troyan S. Moving towards an electronic patient record: a survey to assess the needs of community family physicians. Proc AMIA Symp 1998;230-4.
12. Smith WR, Zastrow R. User requirements for the computerized patient record: physician opinions. Proc Annu Symp Comput Appl Med Care 1994;994.-
13. Powsner SM, Wyatt JC, Wright P. Opportunities for and challenges of computerisation. Lancet 1998;352:1617-22.
14. Musham C, Orstein SM, Jenkins RG. Family practice educators’ perceptions of computer-based patient records. Fam Med 1995;27:571-5.
15. Arias-Vimarlund V, Ljunggren M, Timpka T. Implementation of computer-based patient records in primary care: the societal health economic effects. Proc AMIA Annu Fall Symp 1996;503-7.
16. Lawler F, Cacy JR, Viviani N, Hamm RM, Cobb SW. Implementation and termination of a computerized medical information system. J Fam Pract 1996;42:233-6.
17. Lindberg DA, Humpreys BL. Medical informatics. JAMA 1996;275:1821-2.
18. Levitt JI. Why physicians continue to reject the computerized medical record. Minn Med 1994;7(8):17-21.
19. Lenhart JG, Honess K, Covington D, Johnson KE. An analysis of trends, perceptions, and use patterns of electronic medical records among US family practice residency programs. Fam Med 2000;32:109-14.
20. Bernstein RM, Hollingworth GR, Viner G, Lemelin J. Family practice informatics: research issues in computerized medical records. Proc Annu Symp Comput Appl Med Care 1993;93-7.
21. Moore G. Crossing the Chasm: Marketing and Selling High-Tech Products to Mainstream Consumers. Rev ed. New York: Harper Business; 1999.
22. Dillman DA. Mail and Internet Surveys: The Tailored Design Method. 2nd ed. New York: John Wiley & Sons; 1999.
23. Kibbe DC. A problem-oriented approach to the HIPAA security standards. Fam Pract Manag 2001;8(7):37-43.
24. Kibbe DC. What you need to know about HIPAA now. Fam Pract Manag 2001;8(3):43-7.
25. Bomba D. A comparative study of computerised medical records usage among general practitioners in Australia and Sweden. Medinfo 1998;(Pt 1):55-9.
26. Ebell MH, Gaspar DL, Khurana S. Family physicians’ p for computerized decision-support hardware and software. J Fam Pract 1997;45:137-41.
27. Kalsman MW, Acosta DA. Use of the Internet as a medical resource by rural physicians. J Am Board Fam Pract 2000;13:349-52.
28. Committee on Quality Healthcare in America, eds. Crossing the Quality Chasm: A New Health System for the 21st Century. Washington, DC: National Academy Press; 2001.
29. Kohn L, Corrigan J, Donaldson M, eds. To Err Is Human: Building a Safer Health System. Washington, DC: National Academy Press; 2000.
Should intrathecal narcotics be used as a sole labor analgesic? A prospective comparison of spinal opioids and epidural bupivacaine
OBJECTIVE: Intrathecal narcotics (ITNs) are being used in some settings as a sole labor analgesic. However, they have not been directly compared to epidural analgesia.
STUDY DESIGN: We used a prospective observational design.
POPULATION: Eighty-two women with uncomplicated full-term pregnancies were enrolled upon analgesia request during spontaneous labor with cervical dilation 3 to 7 cm. Sixty-three chose ITNs (morphine and fentanyl), and 19 chose epidural analgesia (continuous infusion of bupivacaine and fentanyl).
OUTCOMES MEASURED: Pain scores were documented using a visual analog scale. Satisfaction and side effects were rated with Likert scales during a structured interview on the first postpartum day. Outcomes were analyzed with multivariate regression techniques.
RESULTS: Intrathecal narcotics were associated with significantly higher pain scores than was epidural analgesia during the first and second stages of labor and on an overall postpartum rating. The median effective duration of action for ITNs was between 60 and 120 minutes; however, ITNs provided excellent analgesia for a subgroup of women who delivered within 2 to 3 hours of receiving them. Although women in both groups were satisfied with their pain management, women receiving ITNs had statistically lower overall satisfaction scores.
CONCLUSIONS: Within the limitations of a nonrandomized study, a single intrathecal injection of morphine and fentanyl has a shorter duration of action and provides less effective pain control than a continuous epidural infusion of bupivacaine and fentanyl. However, ITNs may have a role in settings with limited support from anesthesiologists or for women whose labors are progressing rapidly.
- Stand-alone intrathecal morphine and fentanyl (intrathecal narcotics [ITNs]) are associated with significantly higher pain levels than continuous epidural analgesia with bupivacaine and fentanyl.
- Intrathecal narcotics provide excellent pain relief for women who deliver within 2 to 3 hours of receiving them.
- Lower pain levels are significantly correlated with greater satisfaction with labor pain management.
- Women receiving ITNs were subjectively more satisfied with their ability to walk during labor.
- There was no difference in overall side effect severity between groups.
The subarachnoid injection of opioids, a technique termed “intrathecal narcotics” (ITNs), was first adapted to obstetric practice in the early 1980s1 and has since been achieving increasing acceptance as a safe and effective method for managing labor pain. Compared to epidural local anesthetics, ITNs are easy to administer, provide rapid-onset pain relief, and do not cause motor blockade.2-4 Compared to parenteral opioids, ITNs provide better pain control and are less likely to result in neonatal respiratory depression.5 Despite these advantages, there is uncertainty as to whether ITNs are an analgesic option that deserves wider acceptance, or whether they have a role distinct from the combined spinal epidural technique.
Studies of ITNs given as part of a combined spinal epidural have documented a rapid onset of profound pain relief during the first stage of labor.2-4,6 However, in these studies, when the initial dose of subarachnoid opioid wore off, epidural drugs were administered either immediately or within 1 to 3 hours. Therefore, these studies fail to provide information about the effectiveness of stand-alone ITNs during advanced first- and second-stage labor.
Existing studies of stand-alone ITNs have in fact been favorable to the technique.7-9 However, these studies used patients’ retrospective assessments or nurses’ comments in the medical record rather than pain scores obtained during labor. No prospective studies have documented pain scores during the second stage of labor in women receiving ITNs as a sole labor analgesic. Nor have there been direct comparisons of second-stage pain scores involving women receiving ITNs and women receiving continuous infusion epidural drugs. This prospective study was therefore undertaken to compare the effectiveness of stand-alone ITNs to that of epidural analgesia in the first and second stages of labor, as well as to compare women’s satisfaction with their pain management and their subjective experiences with side effects.
Methods
Setting and subjects
Fairview University Medical Center is a merged community-university teaching hospital with more than 4000 births per year. In 1999, 50% of women undergoing spontaneous vaginal delivery received ITNs and only 6% had epidural analgesia. Although both methods are available to patients, institutional culture has historically favored ITNs, perhaps because a managed care environment favors a simple, cost-effective method.2,10 The Labor Pain Management Study was approved by the University of Minnesota’s Committee on Human Subjects.
Study design
We distributed brochures describing the study during routine prenatal visits and childbirth education classes; women were also informed about the study when they presented to the hospital in spontaneous labor. Parturients with uncomplicated term singleton pregnancies were enrolled when they attained cervical dilation between 3 and 7 cm and requested pain medication. The primary obstetric care providers—including obstetricians, family physicians, and certified nurse midwives—were responsible for managing the participants’ labors.
We originally designed a randomized, 2-arm clinical trial. However, it became clear during the recruiting process that most women in early labor, and even those in prenatal classes during the third trimester, had already made their decisions about the type of pain medication they wanted. Despite receiving an unbiased presentation of the 2 treatment options, women were reluctant to accept random assignment. After 6 weeks, a change in protocol allowed each subject who had refused randomization to choose either ITNs or epidural analgesia, taking into account the recommendations of her care providers. The response rate for eligible women asked to participate under the revised protocol was 66%.
Analgesia
Experienced anesthesiologists from a large private practice provided the analgesia. For ITNs, 0.25 mg morphine sulfate and 25 to 35 μg fentanyl were injected into the subarachnoid space via the L2-L3 or L3-L4 interspace. To decrease postpartum nausea and itching, naltrexone (6.25 mg sublingually) was given to all subjects in the ITNs group within 30 minutes of vaginal delivery. Epidural analgesia consisted of an 8- to 10-mL bolus of 0.25% bupivacaine with 50 μg fentanyl, followed immediately by a continuous infusion of 0.125% bupivacaine with 2 μg/mL fentanyl. The anesthesiologist selected an initial infusion rate between 8 and 12 mL/h. The infusion was discontinued or significantly decreased during the second stage of labor.
Outcomes
Study participants rated their pain using the visual analog scale (VAS). Research assistants instructed participants to place a mark on the 0- to 100-mm VAS scale at the time of request for analgesia, at placement, at 5, 30, and 60 minutes following placement, and every 60 minutes throughout the first stage of labor. One score was collected during the early portion of the second stage, and a retrospective overall rating was obtained within 24 hours of delivery. An analyst uninvolved with the data collection subsequently measured VAS scores to the nearest millimeter.
On the first postpartum day, each subject participated in a structured interview, using 5-point Likert scales to rate her overall satisfaction with pain control and her ability to walk and push during labor. Women used a standardized 3-point scale to rate the severity of symptoms, including nausea, vomiting, pruritus, urinary retention, headache, and the inability to walk or to push.
Primary outcomes were the mean pain scores for the first and second stages of labor, the duration of adequate pain relief (defined as a VAS score ≤ 30 mm), and the retrospective mean score for overall labor pain. Secondary outcomes included women’s satisfaction ratings and subjective experiences with side effects.
Statistical analysis
Initial sample size calculations indicated that 36 women would be needed, equally divided between 2 groups, for the study to have 85% power to detect a 10-mm difference in the group mean VAS scores in the second stage of labor. A 10-mm change in the VAS score represents 1 standard deviation11 and is considered clinically significant.12 As a result of more rapid enrollment in the ITNs group, the group sizes became unequal. We continued to recruit until there were 19 women in the epidural group.
We calculated a time-weighted mean VAS score for each subject for the first stage of labor. A VAS score of 30 mm or less was considered the “zone of analgesic success.”13 Mean VAS scores, the percentage of women whose scores remained in the analgesic success zone, and satisfaction ratings in the ITNs and epidural groups were compared using multivariate linear and logistic regression methods. The outcomes were adjusted for maternal age, parity, previous spinal analgesic use, cervical dilation at time of placement, oxytocin use prior to placement, and baby’s weight. Side effects were compared using 2 tests for categorical outcomes and Student t tests for the mean severity indices.
The duration of successful analgesia was compared using time-to-event methods—Kaplan-Meier life tables and the log-rank test.14 The event of interest was analgesic failure. The time to the event was the number of minutes after placement of spinal analgesic until the VAS score rose above 30.
Results
Eighty-two women enrolled and completed the study between May 1, 1999, and March 1, 2000; 63 received ITNs and 19 received epidurals. Only 9 women underwent random assignment. Demographic and baseline characteristics for the 2 study groups are shown in Table 1. There were no statistically significant differences between groups, although women in the epidural group were older and had slightly less cervical dilation at the time of analgesic placement. The mean VAS scores prior to analgesic placement were similar (65.3 for ITNs, 67.8 for epidural; P = .73).
TABLE 1
Demographic and baseline characteristics of the study participants
| Intrathecal narcotics (n = 63) | Epidural (n = 19) | P | |
|---|---|---|---|
| Demographic characteristics | |||
| Age (years) | 28.4 ± 5.7 | 30.7 ± 3.6 | .10 |
| Nulliparous (%) | 63.5 | 47.4 | .21 |
| Caucasian (%) | 74.6 | 84.2 | .39 |
| Marital status single (%) | 20.6 | 10.5 | .32 |
| Employer-paid insurance (%) | 81.0 | 94.7 | .15 |
| Gestational age (weeks) | 39.5 ± 1.1 | 39.4 ± 1.4 | .69 |
| Baseline characteristics | |||
| Previous ITNs or epidural (%)* | 65.2 | 80.0 | .40 |
| Cervical dilation (cm) | |||
| On admission | |||
| Parity 0 | 2.6 ± 1.3 | 2.8 ± 1.3 | .75 |
| Parity > 0 | 2.6 ± 1.3 | 1.7 ± 0.9 | .07 |
| At analgesic placement | |||
| Parity 0 | 4.4 ± 1.4 | 4.1 ± 0.9 | .46 |
| Parity > 0 | 4.6 ± 1.4 | 3.8 ± 1.1 | .09 |
| Negative station at analgesic placement (%) | 51.7 | 63.2 | .38 |
| ROM prior to placement (%) | 55.6 | 68.4 | .32 |
| Oxytocin use prior to placement (%) | 30.2 | 36.8 | .59 |
| VAS at time of placement | 65.3 ± 29.0 | 67.8 ± 18.5 | .73 |
| Data are presented as mean ± SD or as percent. | |||
| *Previous ITNs or epidural analgesia includes parous women only. | |||
| ITNs, intrathecal narcotics; ROM, rupture of membranes; VAS, visual analog scale. | |||
Analgesia
Two women who initially received ITNs were subsequently given an epidural, but they remained in the ITN group for analysis. Eight women (13%) in the ITN group required a second intrathecal injection, and only 5 (8%) received a pudendal nerve block in the second stage of labor.
Pain
Women receiving epidural analgesia had significantly lower mean pain scores for the first and the second stages of labor, as well as for the overall postpartum assessment Table 2. Adjusting with multivariate regression did not significantly alter the results. For women in both groups, the mean postpartum overall VAS scores exceeded both the first-and second-stage scores measured during labor and appeared to reflect the higher of the 2.
From the standpoint of “analgesic success,” the odds of having a VAS score ≤ 30 throughout the first stage of labor were 24 times greater for women receiving epidural analgesia than for those receiving ITNs (Table 2, adjusted odds ratio [OR] = 24.4, 95% CI = 5.1–116.3, number needed to treat [NNT] = 2). Of note, however, VAS scores remained in the “zone of analgesic success” for 12 women (20% of the ITN group) who delivered within 3 hours of receiving ITNs. In the second stage, the odds of having successful analgesia were 7 times higher for women receiving epidural analgesia (adjusted OR = 7.1, 95% CI = 1.7–29.1, NNT = 3).
The difference in the duration of effective pain relief was also highly significant (Figure 1, log-rank test, P < .001). For women receiving ITNs, the median duration of effective pain relief in the first stage of labor was between 60 and 120 minutes. Continuous epidural infusion, by contrast, maintained successful analgesia for most women for the entire duration of the first stage.
TABLE 2
Pain ratings and overall satisfaction with pain management
| Outcome | Intrathecal narcotics (n = 63) | Epidural (n = 19) | Adjusted differences |
|---|---|---|---|
| Stage 1 VAS | 35.1 ± 20.6 | 9.7 ± 9.6 | 24.7* |
| Stage 2 VAS | 58.5 ± 33.7 | 23.1 ± 23.5 | 42.0* |
| Overall VAS | 61.8 ± 24.9 | 24.6 ± 30.0 | 37.6* |
| Overall satisfaction with pain management (5 = very satisfied) | 3.9 ± 0.9 | 4.7 ± 0.5 | –0.8† |
| Data are presented as mean ± SD. Differences are adjusted for maternal age, parity, previous spinal analgesic use, cervical dilation at time of placement, oxytocin use prior to placement, and weight of baby. | |||
| Differences are *P < .001 or † P = .001. | |||
| VAS, visual analog scale. | |||
FIGURE 1
Kaplan-Meier analysis of the time to analgesic failure (VAS score > 30)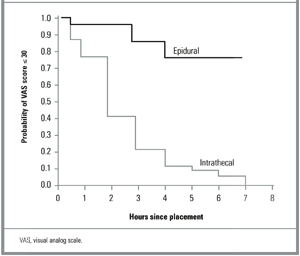
Satisfaction
Although women in both groups expressed overall satisfaction with the way their pain was controlled during labor, there were significant differences between groups. On a Likert scale where 5 = very satisfied, 4 = satisfied, and 3 = neutral, the mean rating for women in the epidural group was 4.7, compared to 3.9 for women receiving ITNs (P = .001). High levels of satisfaction correlated significantly with lower postpartum overall VAS scores (r = 20.50, P < .001). There were similar relationships between overall satisfaction and mean VAS scores in the first stage (r = 2.35, P = .002) and the second stage (r = 20.25, P = .040) of labor.
Side effects
Women receiving ITNs were significantly more likely to experience itching than were those receiving epidural analgesia (P < .001; Figure 2). In fact, 95% of the ITN group experienced itching, although nearly two thirds indicated that the symptom was mild or brief and did not interfere with the overall birthing experience. Nausea and vomiting were reported slightly more often in the ITN group, but the difference was not statistically significant. Women receiving epidural analgesia were significantly more likely to experience headaches (P < .001) and an inability to walk (P < .001). They also reported more difficulty with urination (P = .15) and with pushing (P = .23), neither of which reached statistical significance. None of the women reporting headaches were diagnosed as having postdural puncture headaches, and none required a blood patch for treatment. On the side effect severity index, 29% of women in the ITN group reported at least 1 “very bad” symptom, compared to 17% in the epidural group (P = .30).
FIGURE 2
Side effects of labor analgesia: percentage of women reporting the symptom in each treatment group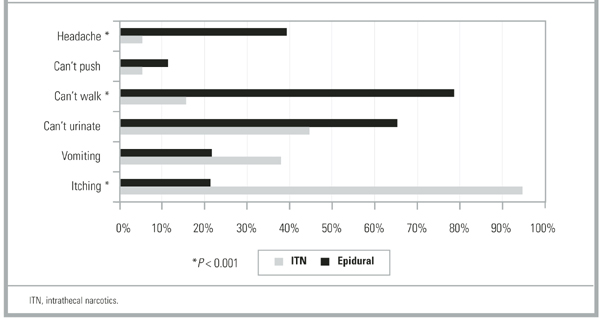
Discussion
Evidence-based practice guidelines developed for obstetric analgesia by the American Society of Anesthesiologists are equivocal regarding the analgesic efficacy of spinal opioids compared to epidural local anesthetics.5 Within the limitations of a non-randomized study, our data indicate that intrathecal morphine and fentanyl (ITNs) provide less satisfactory pain control than a continuous epidural infusion of bupivacaine and fentanyl. This was true during the first and second stages of labor and on an overall pain rating from the first postpartum day. The limited duration of action of ITNs is likely to account for their lesser effectiveness. We found that the effective median duration of intrathecal morphine and fentanyl was between 60 and 120 minutes as determined by life table analysis of VAS scores.
Prior studies have evaluated intrathecal opioids in the context of combined spinal epidural analgesia and found the time to request for additional pain medication to be 90 to 150 minutes, with variation depending on which opioid was used and whether a local anesthetic was added.2,3,15 Although our clinical experience is that most women are grateful for 2 to 3 hours of relief from pain during active labor, our participants’ satisfaction with pain management was clearly related to the worst pain they experienced during labor, which in turn influenced their view of the overall effectiveness of the analgesic they received. This finding is similar to that of a survey of 1000 Australian women, where inadequate pain relief was the most frequent cause of dissatisfaction with the childbirth experience as a whole.16
Given our results, it seems reasonable to ask why stand-alone ITNs have become as popular as they have in certain hospital settings. One possibility is that they have offsetting benefits in terms of greater ease of administration and lower cost than epidural analgesia. Community and military hospitals that use ITNs as a sole method cite just such logistical advantages.7-9 Compared to epidural analgesia, ITNs are technically easier to administer and place fewer demands on nurses, obstetricians, and anesthesia personnel.7 In smaller and more rural hospitals that do not have anesthesiologists on staff, anesthetists, obstetricians, or family physicians may perform the spinal injection and safely monitor patients following ITNs.7,17
A second possibility is that ITNs offer the advantage of fewer side effects than epidural analgesia. Our data illustrate the differing side effect profiles of the 2 methods and support the conclusion that there is a trade-off among the expected side effects of opioids and local anesthetics rather than a clear advantage for ITNs. Women receiving intrathecal opioids were subjectively more satisfied with their ability to walk, but they were no more satisfied with their ability to push in the second stage than were women receiving epidural analgesia. It is possible that factors other than motor blockade—such as the constraints of monitors, catheters, and intravenous lines—prevented women in the epidural group from being satisfied with their ability to ambulate. Although the link between reduced motor blockade and fewer operative deliveries is controversial,18 ambulation in labor has been shown to foster a sense of control and improve maternal satisfaction.19,20
Finally, our data indicate that ITNs are an excellent analgesic for a subset of women who deliver rapidly. Studies of combined spinal epidural analgesia have also documented a significant proportion of women who are able to deliver with ITNs alone. In an early case series, 9 (60%) of 15 women receiving intrathecal morphine and fentanyl delivered without any epidural drugs, with pudendal nerve block for perineal anesthesia.2 In 2 recent combined spinal epidural trials, intrathecal sufentanil provided adequate analgesia as a sole agent in 16% to 20% of nulliparous women and in 45% of parous women.4,15
Our observational study is limited by the nonrandomized, nonblinded allocation of the 2 treatments. Observational studies are often viewed as subject to bias due to unrecognized confounders. As noted earlier, women in our study were reluctant to accept randomization and tended to be influenced toward a choice of ITNs due to an institutional history of preference for that method. It is possible that women choosing epidural analgesia in an environment favoring ITNs would be more likely to justify their choices with positive responses during a postpartum interview. However, it seems less likely that the large differences in VAS scores obtained during labor were so influenced. In addition, we used regression analysis to control for several factors shown in others studies to be associated with labor pain.10,21,22
Conclusion
Should ITNs be used as a sole labor analgesic? For hospitals with limited analgesic options, stand-alone ITNs can be a simple and effective method that improves pain management compared to parenteral opioids. Selecting appropriate candidates for ITNs and refraining from offering them too early in labor can improve their success. For hospitals with a full range of analgesic options, the appropriate use of stand-alone ITNs will spare some women added restrictions and side effects compared to continuous epidural analgesia and may improve their satisfaction with mobility. Ultimately, the choice of analgesia for labor rests with the woman herself. True informed consent means that all available options, including stand-alone ITNs, have been presented.
Acknowledgments
The authors wish to acknowledge James Neaton, PhD, Division of Biostatistics, School of Public Health, University of Minnesota; Richard Palahnuik, MD, Department of Anesthesiology; and Preston Williams, MD, FACOG, Department of Obstetrics and Gynecology, for assistance in study design and manuscript review, and the Labor Pain Management Study research assistants, anesthesiologists, and nursing staff of the Fairview University Medical Center BirthPlace who helped develop and implement the clinical protocols.
1. Scott PV, Bowen FE, Cartwright P, et al. Intrathecal morphine as sole analgesic during labour. BMJ 1980;281:351-5.
2. Leighton BL, DeSimone CA, Norris MC, Ben David B. Intrathecal narcotics for labor revisited: the combination of fentanyl and morphine intrathecally provides rapid onset of profound, prolonged analgesia. Anesth Analg 1989;69:122-5.
3. D’Angelo R, Anderson MT, Philip J, Eisenach JC. Intrathecal sufentanil compared to epidural bupivacaine for labor analgesia. Anesthesiology 1994;80:1209-15.
4. Tsen LC, Thue B, Datta S, Segal S. Is combined spinal-epidural analgesia associated with more rapid cervical dilation in nulliparous patients when compared with conventional epidural analgesia? Anesthesiology 1999;91:920-5.
5. Practice guidelines for obstetrical anesthesia: a report by the American Society of Anesthesiologists Task Force on Obstetrical Anesthesia Anesthesiology 1999;90:600-11.
6. Abouleish A, Abouleish E, Camann W. Combined spinal-epidural analgesia in advanced labour. Can J Anaesth 1994;41:575-8.
7. Herpolsheimer A, Schretenthaler J. The use of intrapartum intrathecal narcotic analgesia in a community-based hospital. Obstet Gynecol 1994;84:931-6.
8. Rust LA, Waring RW, Hall GL, Nelson EI. Intrathecal narcotics for obstetric analgesia in a community hospital. Am J Obstet Gynecol 1994;170:1643-6.
9. Zapp J, Thorne T. Comfortable labor with intrathecal narcotics. Mil Med 1995;160:217-9.
10. Fontaine P, Adam P. Intrathecal narcotics are associated with prolonged second-stage labor and increased oxytocin use. J Fam Pract 2000;49:515-20.
11. Ludington E, Dexter F. Statistical analysis of total labor pain using the visual analog scale and application to studies of analgesic effectiveness during childbirth. Anesth Analg 1998;87:723-7.
12. Todd KH, Funk JP. The minimum clinically important difference in physician-assigned visual analog scales. Acad Emerg Med 1996;3:142-6.
13. Mantha S, Thisted R, Foss J, Ellis JE, Roizen MF. A proposal to use confidence intervals for visual analog scale data for pain measurement to determine clinical significance. Anesth Analg 1993;77:1041-7.
14. Lee ET. Statistical Methods for Survival Data Analysis. 2nd ed. New York: John Wiley & Sons; 1992.
15. Gambling DR, Sharma SK, Ramin SM, et al. A randomized study of combined spinal-epidural analgesia versus intravenous meperidine during labor: impact on cesarean delivery rate. Anesthesiology 1998;89:1336-44.
16. Paech MJ. The King Edward Memorial Hospital 1000 mother survey of methods of pain relief in labor. Anaesth Int Care 1991;19:393-9.
17. Stephens MB, Ford RE. Intrathecal narcotics for labor analgesia. Am Fam Physician 1997;56:463-70.
18. Bloom SL, McIntire DD, Kelly MA, et al. Lack of effect of walking on labor and delivery. N Engl J Med 1998;339:76-9.
19. Collis RE, Davies DW, Aveling W. Randomised comparison of combined spinal-epidural and standard epidural analgesia in labour. Lancet 1995;345:1413-6.
20. Collis RE, Harding SA, Morgan BM. Effect of maternal ambulation on labour with low-dose combined spinal-epidural analgesia. Anaesthesia 1999;54:535-9.
21. Melzack R. Severity of labour pain: influence of physical as well as psychologic variables. CMAJ 1984;130:579-84.
22. Green JM. Expectations and experiences of pain in labor: findings from a large prospective study. Birth 1993;20:65-72.
OBJECTIVE: Intrathecal narcotics (ITNs) are being used in some settings as a sole labor analgesic. However, they have not been directly compared to epidural analgesia.
STUDY DESIGN: We used a prospective observational design.
POPULATION: Eighty-two women with uncomplicated full-term pregnancies were enrolled upon analgesia request during spontaneous labor with cervical dilation 3 to 7 cm. Sixty-three chose ITNs (morphine and fentanyl), and 19 chose epidural analgesia (continuous infusion of bupivacaine and fentanyl).
OUTCOMES MEASURED: Pain scores were documented using a visual analog scale. Satisfaction and side effects were rated with Likert scales during a structured interview on the first postpartum day. Outcomes were analyzed with multivariate regression techniques.
RESULTS: Intrathecal narcotics were associated with significantly higher pain scores than was epidural analgesia during the first and second stages of labor and on an overall postpartum rating. The median effective duration of action for ITNs was between 60 and 120 minutes; however, ITNs provided excellent analgesia for a subgroup of women who delivered within 2 to 3 hours of receiving them. Although women in both groups were satisfied with their pain management, women receiving ITNs had statistically lower overall satisfaction scores.
CONCLUSIONS: Within the limitations of a nonrandomized study, a single intrathecal injection of morphine and fentanyl has a shorter duration of action and provides less effective pain control than a continuous epidural infusion of bupivacaine and fentanyl. However, ITNs may have a role in settings with limited support from anesthesiologists or for women whose labors are progressing rapidly.
- Stand-alone intrathecal morphine and fentanyl (intrathecal narcotics [ITNs]) are associated with significantly higher pain levels than continuous epidural analgesia with bupivacaine and fentanyl.
- Intrathecal narcotics provide excellent pain relief for women who deliver within 2 to 3 hours of receiving them.
- Lower pain levels are significantly correlated with greater satisfaction with labor pain management.
- Women receiving ITNs were subjectively more satisfied with their ability to walk during labor.
- There was no difference in overall side effect severity between groups.
The subarachnoid injection of opioids, a technique termed “intrathecal narcotics” (ITNs), was first adapted to obstetric practice in the early 1980s1 and has since been achieving increasing acceptance as a safe and effective method for managing labor pain. Compared to epidural local anesthetics, ITNs are easy to administer, provide rapid-onset pain relief, and do not cause motor blockade.2-4 Compared to parenteral opioids, ITNs provide better pain control and are less likely to result in neonatal respiratory depression.5 Despite these advantages, there is uncertainty as to whether ITNs are an analgesic option that deserves wider acceptance, or whether they have a role distinct from the combined spinal epidural technique.
Studies of ITNs given as part of a combined spinal epidural have documented a rapid onset of profound pain relief during the first stage of labor.2-4,6 However, in these studies, when the initial dose of subarachnoid opioid wore off, epidural drugs were administered either immediately or within 1 to 3 hours. Therefore, these studies fail to provide information about the effectiveness of stand-alone ITNs during advanced first- and second-stage labor.
Existing studies of stand-alone ITNs have in fact been favorable to the technique.7-9 However, these studies used patients’ retrospective assessments or nurses’ comments in the medical record rather than pain scores obtained during labor. No prospective studies have documented pain scores during the second stage of labor in women receiving ITNs as a sole labor analgesic. Nor have there been direct comparisons of second-stage pain scores involving women receiving ITNs and women receiving continuous infusion epidural drugs. This prospective study was therefore undertaken to compare the effectiveness of stand-alone ITNs to that of epidural analgesia in the first and second stages of labor, as well as to compare women’s satisfaction with their pain management and their subjective experiences with side effects.
Methods
Setting and subjects
Fairview University Medical Center is a merged community-university teaching hospital with more than 4000 births per year. In 1999, 50% of women undergoing spontaneous vaginal delivery received ITNs and only 6% had epidural analgesia. Although both methods are available to patients, institutional culture has historically favored ITNs, perhaps because a managed care environment favors a simple, cost-effective method.2,10 The Labor Pain Management Study was approved by the University of Minnesota’s Committee on Human Subjects.
Study design
We distributed brochures describing the study during routine prenatal visits and childbirth education classes; women were also informed about the study when they presented to the hospital in spontaneous labor. Parturients with uncomplicated term singleton pregnancies were enrolled when they attained cervical dilation between 3 and 7 cm and requested pain medication. The primary obstetric care providers—including obstetricians, family physicians, and certified nurse midwives—were responsible for managing the participants’ labors.
We originally designed a randomized, 2-arm clinical trial. However, it became clear during the recruiting process that most women in early labor, and even those in prenatal classes during the third trimester, had already made their decisions about the type of pain medication they wanted. Despite receiving an unbiased presentation of the 2 treatment options, women were reluctant to accept random assignment. After 6 weeks, a change in protocol allowed each subject who had refused randomization to choose either ITNs or epidural analgesia, taking into account the recommendations of her care providers. The response rate for eligible women asked to participate under the revised protocol was 66%.
Analgesia
Experienced anesthesiologists from a large private practice provided the analgesia. For ITNs, 0.25 mg morphine sulfate and 25 to 35 μg fentanyl were injected into the subarachnoid space via the L2-L3 or L3-L4 interspace. To decrease postpartum nausea and itching, naltrexone (6.25 mg sublingually) was given to all subjects in the ITNs group within 30 minutes of vaginal delivery. Epidural analgesia consisted of an 8- to 10-mL bolus of 0.25% bupivacaine with 50 μg fentanyl, followed immediately by a continuous infusion of 0.125% bupivacaine with 2 μg/mL fentanyl. The anesthesiologist selected an initial infusion rate between 8 and 12 mL/h. The infusion was discontinued or significantly decreased during the second stage of labor.
Outcomes
Study participants rated their pain using the visual analog scale (VAS). Research assistants instructed participants to place a mark on the 0- to 100-mm VAS scale at the time of request for analgesia, at placement, at 5, 30, and 60 minutes following placement, and every 60 minutes throughout the first stage of labor. One score was collected during the early portion of the second stage, and a retrospective overall rating was obtained within 24 hours of delivery. An analyst uninvolved with the data collection subsequently measured VAS scores to the nearest millimeter.
On the first postpartum day, each subject participated in a structured interview, using 5-point Likert scales to rate her overall satisfaction with pain control and her ability to walk and push during labor. Women used a standardized 3-point scale to rate the severity of symptoms, including nausea, vomiting, pruritus, urinary retention, headache, and the inability to walk or to push.
Primary outcomes were the mean pain scores for the first and second stages of labor, the duration of adequate pain relief (defined as a VAS score ≤ 30 mm), and the retrospective mean score for overall labor pain. Secondary outcomes included women’s satisfaction ratings and subjective experiences with side effects.
Statistical analysis
Initial sample size calculations indicated that 36 women would be needed, equally divided between 2 groups, for the study to have 85% power to detect a 10-mm difference in the group mean VAS scores in the second stage of labor. A 10-mm change in the VAS score represents 1 standard deviation11 and is considered clinically significant.12 As a result of more rapid enrollment in the ITNs group, the group sizes became unequal. We continued to recruit until there were 19 women in the epidural group.
We calculated a time-weighted mean VAS score for each subject for the first stage of labor. A VAS score of 30 mm or less was considered the “zone of analgesic success.”13 Mean VAS scores, the percentage of women whose scores remained in the analgesic success zone, and satisfaction ratings in the ITNs and epidural groups were compared using multivariate linear and logistic regression methods. The outcomes were adjusted for maternal age, parity, previous spinal analgesic use, cervical dilation at time of placement, oxytocin use prior to placement, and baby’s weight. Side effects were compared using 2 tests for categorical outcomes and Student t tests for the mean severity indices.
The duration of successful analgesia was compared using time-to-event methods—Kaplan-Meier life tables and the log-rank test.14 The event of interest was analgesic failure. The time to the event was the number of minutes after placement of spinal analgesic until the VAS score rose above 30.
Results
Eighty-two women enrolled and completed the study between May 1, 1999, and March 1, 2000; 63 received ITNs and 19 received epidurals. Only 9 women underwent random assignment. Demographic and baseline characteristics for the 2 study groups are shown in Table 1. There were no statistically significant differences between groups, although women in the epidural group were older and had slightly less cervical dilation at the time of analgesic placement. The mean VAS scores prior to analgesic placement were similar (65.3 for ITNs, 67.8 for epidural; P = .73).
TABLE 1
Demographic and baseline characteristics of the study participants
| Intrathecal narcotics (n = 63) | Epidural (n = 19) | P | |
|---|---|---|---|
| Demographic characteristics | |||
| Age (years) | 28.4 ± 5.7 | 30.7 ± 3.6 | .10 |
| Nulliparous (%) | 63.5 | 47.4 | .21 |
| Caucasian (%) | 74.6 | 84.2 | .39 |
| Marital status single (%) | 20.6 | 10.5 | .32 |
| Employer-paid insurance (%) | 81.0 | 94.7 | .15 |
| Gestational age (weeks) | 39.5 ± 1.1 | 39.4 ± 1.4 | .69 |
| Baseline characteristics | |||
| Previous ITNs or epidural (%)* | 65.2 | 80.0 | .40 |
| Cervical dilation (cm) | |||
| On admission | |||
| Parity 0 | 2.6 ± 1.3 | 2.8 ± 1.3 | .75 |
| Parity > 0 | 2.6 ± 1.3 | 1.7 ± 0.9 | .07 |
| At analgesic placement | |||
| Parity 0 | 4.4 ± 1.4 | 4.1 ± 0.9 | .46 |
| Parity > 0 | 4.6 ± 1.4 | 3.8 ± 1.1 | .09 |
| Negative station at analgesic placement (%) | 51.7 | 63.2 | .38 |
| ROM prior to placement (%) | 55.6 | 68.4 | .32 |
| Oxytocin use prior to placement (%) | 30.2 | 36.8 | .59 |
| VAS at time of placement | 65.3 ± 29.0 | 67.8 ± 18.5 | .73 |
| Data are presented as mean ± SD or as percent. | |||
| *Previous ITNs or epidural analgesia includes parous women only. | |||
| ITNs, intrathecal narcotics; ROM, rupture of membranes; VAS, visual analog scale. | |||
Analgesia
Two women who initially received ITNs were subsequently given an epidural, but they remained in the ITN group for analysis. Eight women (13%) in the ITN group required a second intrathecal injection, and only 5 (8%) received a pudendal nerve block in the second stage of labor.
Pain
Women receiving epidural analgesia had significantly lower mean pain scores for the first and the second stages of labor, as well as for the overall postpartum assessment Table 2. Adjusting with multivariate regression did not significantly alter the results. For women in both groups, the mean postpartum overall VAS scores exceeded both the first-and second-stage scores measured during labor and appeared to reflect the higher of the 2.
From the standpoint of “analgesic success,” the odds of having a VAS score ≤ 30 throughout the first stage of labor were 24 times greater for women receiving epidural analgesia than for those receiving ITNs (Table 2, adjusted odds ratio [OR] = 24.4, 95% CI = 5.1–116.3, number needed to treat [NNT] = 2). Of note, however, VAS scores remained in the “zone of analgesic success” for 12 women (20% of the ITN group) who delivered within 3 hours of receiving ITNs. In the second stage, the odds of having successful analgesia were 7 times higher for women receiving epidural analgesia (adjusted OR = 7.1, 95% CI = 1.7–29.1, NNT = 3).
The difference in the duration of effective pain relief was also highly significant (Figure 1, log-rank test, P < .001). For women receiving ITNs, the median duration of effective pain relief in the first stage of labor was between 60 and 120 minutes. Continuous epidural infusion, by contrast, maintained successful analgesia for most women for the entire duration of the first stage.
TABLE 2
Pain ratings and overall satisfaction with pain management
| Outcome | Intrathecal narcotics (n = 63) | Epidural (n = 19) | Adjusted differences |
|---|---|---|---|
| Stage 1 VAS | 35.1 ± 20.6 | 9.7 ± 9.6 | 24.7* |
| Stage 2 VAS | 58.5 ± 33.7 | 23.1 ± 23.5 | 42.0* |
| Overall VAS | 61.8 ± 24.9 | 24.6 ± 30.0 | 37.6* |
| Overall satisfaction with pain management (5 = very satisfied) | 3.9 ± 0.9 | 4.7 ± 0.5 | –0.8† |
| Data are presented as mean ± SD. Differences are adjusted for maternal age, parity, previous spinal analgesic use, cervical dilation at time of placement, oxytocin use prior to placement, and weight of baby. | |||
| Differences are *P < .001 or † P = .001. | |||
| VAS, visual analog scale. | |||
FIGURE 1
Kaplan-Meier analysis of the time to analgesic failure (VAS score > 30)
Satisfaction
Although women in both groups expressed overall satisfaction with the way their pain was controlled during labor, there were significant differences between groups. On a Likert scale where 5 = very satisfied, 4 = satisfied, and 3 = neutral, the mean rating for women in the epidural group was 4.7, compared to 3.9 for women receiving ITNs (P = .001). High levels of satisfaction correlated significantly with lower postpartum overall VAS scores (r = 20.50, P < .001). There were similar relationships between overall satisfaction and mean VAS scores in the first stage (r = 2.35, P = .002) and the second stage (r = 20.25, P = .040) of labor.
Side effects
Women receiving ITNs were significantly more likely to experience itching than were those receiving epidural analgesia (P < .001; Figure 2). In fact, 95% of the ITN group experienced itching, although nearly two thirds indicated that the symptom was mild or brief and did not interfere with the overall birthing experience. Nausea and vomiting were reported slightly more often in the ITN group, but the difference was not statistically significant. Women receiving epidural analgesia were significantly more likely to experience headaches (P < .001) and an inability to walk (P < .001). They also reported more difficulty with urination (P = .15) and with pushing (P = .23), neither of which reached statistical significance. None of the women reporting headaches were diagnosed as having postdural puncture headaches, and none required a blood patch for treatment. On the side effect severity index, 29% of women in the ITN group reported at least 1 “very bad” symptom, compared to 17% in the epidural group (P = .30).
FIGURE 2
Side effects of labor analgesia: percentage of women reporting the symptom in each treatment group
Discussion
Evidence-based practice guidelines developed for obstetric analgesia by the American Society of Anesthesiologists are equivocal regarding the analgesic efficacy of spinal opioids compared to epidural local anesthetics.5 Within the limitations of a non-randomized study, our data indicate that intrathecal morphine and fentanyl (ITNs) provide less satisfactory pain control than a continuous epidural infusion of bupivacaine and fentanyl. This was true during the first and second stages of labor and on an overall pain rating from the first postpartum day. The limited duration of action of ITNs is likely to account for their lesser effectiveness. We found that the effective median duration of intrathecal morphine and fentanyl was between 60 and 120 minutes as determined by life table analysis of VAS scores.
Prior studies have evaluated intrathecal opioids in the context of combined spinal epidural analgesia and found the time to request for additional pain medication to be 90 to 150 minutes, with variation depending on which opioid was used and whether a local anesthetic was added.2,3,15 Although our clinical experience is that most women are grateful for 2 to 3 hours of relief from pain during active labor, our participants’ satisfaction with pain management was clearly related to the worst pain they experienced during labor, which in turn influenced their view of the overall effectiveness of the analgesic they received. This finding is similar to that of a survey of 1000 Australian women, where inadequate pain relief was the most frequent cause of dissatisfaction with the childbirth experience as a whole.16
Given our results, it seems reasonable to ask why stand-alone ITNs have become as popular as they have in certain hospital settings. One possibility is that they have offsetting benefits in terms of greater ease of administration and lower cost than epidural analgesia. Community and military hospitals that use ITNs as a sole method cite just such logistical advantages.7-9 Compared to epidural analgesia, ITNs are technically easier to administer and place fewer demands on nurses, obstetricians, and anesthesia personnel.7 In smaller and more rural hospitals that do not have anesthesiologists on staff, anesthetists, obstetricians, or family physicians may perform the spinal injection and safely monitor patients following ITNs.7,17
A second possibility is that ITNs offer the advantage of fewer side effects than epidural analgesia. Our data illustrate the differing side effect profiles of the 2 methods and support the conclusion that there is a trade-off among the expected side effects of opioids and local anesthetics rather than a clear advantage for ITNs. Women receiving intrathecal opioids were subjectively more satisfied with their ability to walk, but they were no more satisfied with their ability to push in the second stage than were women receiving epidural analgesia. It is possible that factors other than motor blockade—such as the constraints of monitors, catheters, and intravenous lines—prevented women in the epidural group from being satisfied with their ability to ambulate. Although the link between reduced motor blockade and fewer operative deliveries is controversial,18 ambulation in labor has been shown to foster a sense of control and improve maternal satisfaction.19,20
Finally, our data indicate that ITNs are an excellent analgesic for a subset of women who deliver rapidly. Studies of combined spinal epidural analgesia have also documented a significant proportion of women who are able to deliver with ITNs alone. In an early case series, 9 (60%) of 15 women receiving intrathecal morphine and fentanyl delivered without any epidural drugs, with pudendal nerve block for perineal anesthesia.2 In 2 recent combined spinal epidural trials, intrathecal sufentanil provided adequate analgesia as a sole agent in 16% to 20% of nulliparous women and in 45% of parous women.4,15
Our observational study is limited by the nonrandomized, nonblinded allocation of the 2 treatments. Observational studies are often viewed as subject to bias due to unrecognized confounders. As noted earlier, women in our study were reluctant to accept randomization and tended to be influenced toward a choice of ITNs due to an institutional history of preference for that method. It is possible that women choosing epidural analgesia in an environment favoring ITNs would be more likely to justify their choices with positive responses during a postpartum interview. However, it seems less likely that the large differences in VAS scores obtained during labor were so influenced. In addition, we used regression analysis to control for several factors shown in others studies to be associated with labor pain.10,21,22
Conclusion
Should ITNs be used as a sole labor analgesic? For hospitals with limited analgesic options, stand-alone ITNs can be a simple and effective method that improves pain management compared to parenteral opioids. Selecting appropriate candidates for ITNs and refraining from offering them too early in labor can improve their success. For hospitals with a full range of analgesic options, the appropriate use of stand-alone ITNs will spare some women added restrictions and side effects compared to continuous epidural analgesia and may improve their satisfaction with mobility. Ultimately, the choice of analgesia for labor rests with the woman herself. True informed consent means that all available options, including stand-alone ITNs, have been presented.
Acknowledgments
The authors wish to acknowledge James Neaton, PhD, Division of Biostatistics, School of Public Health, University of Minnesota; Richard Palahnuik, MD, Department of Anesthesiology; and Preston Williams, MD, FACOG, Department of Obstetrics and Gynecology, for assistance in study design and manuscript review, and the Labor Pain Management Study research assistants, anesthesiologists, and nursing staff of the Fairview University Medical Center BirthPlace who helped develop and implement the clinical protocols.
1. Scott PV, Bowen FE, Cartwright P, et al. Intrathecal morphine as sole analgesic during labour. BMJ 1980;281:351-5.
2. Leighton BL, DeSimone CA, Norris MC, Ben David B. Intrathecal narcotics for labor revisited: the combination of fentanyl and morphine intrathecally provides rapid onset of profound, prolonged analgesia. Anesth Analg 1989;69:122-5.
3. D’Angelo R, Anderson MT, Philip J, Eisenach JC. Intrathecal sufentanil compared to epidural bupivacaine for labor analgesia. Anesthesiology 1994;80:1209-15.
4. Tsen LC, Thue B, Datta S, Segal S. Is combined spinal-epidural analgesia associated with more rapid cervical dilation in nulliparous patients when compared with conventional epidural analgesia? Anesthesiology 1999;91:920-5.
5. Practice guidelines for obstetrical anesthesia: a report by the American Society of Anesthesiologists Task Force on Obstetrical Anesthesia Anesthesiology 1999;90:600-11.
6. Abouleish A, Abouleish E, Camann W. Combined spinal-epidural analgesia in advanced labour. Can J Anaesth 1994;41:575-8.
7. Herpolsheimer A, Schretenthaler J. The use of intrapartum intrathecal narcotic analgesia in a community-based hospital. Obstet Gynecol 1994;84:931-6.
8. Rust LA, Waring RW, Hall GL, Nelson EI. Intrathecal narcotics for obstetric analgesia in a community hospital. Am J Obstet Gynecol 1994;170:1643-6.
9. Zapp J, Thorne T. Comfortable labor with intrathecal narcotics. Mil Med 1995;160:217-9.
10. Fontaine P, Adam P. Intrathecal narcotics are associated with prolonged second-stage labor and increased oxytocin use. J Fam Pract 2000;49:515-20.
11. Ludington E, Dexter F. Statistical analysis of total labor pain using the visual analog scale and application to studies of analgesic effectiveness during childbirth. Anesth Analg 1998;87:723-7.
12. Todd KH, Funk JP. The minimum clinically important difference in physician-assigned visual analog scales. Acad Emerg Med 1996;3:142-6.
13. Mantha S, Thisted R, Foss J, Ellis JE, Roizen MF. A proposal to use confidence intervals for visual analog scale data for pain measurement to determine clinical significance. Anesth Analg 1993;77:1041-7.
14. Lee ET. Statistical Methods for Survival Data Analysis. 2nd ed. New York: John Wiley & Sons; 1992.
15. Gambling DR, Sharma SK, Ramin SM, et al. A randomized study of combined spinal-epidural analgesia versus intravenous meperidine during labor: impact on cesarean delivery rate. Anesthesiology 1998;89:1336-44.
16. Paech MJ. The King Edward Memorial Hospital 1000 mother survey of methods of pain relief in labor. Anaesth Int Care 1991;19:393-9.
17. Stephens MB, Ford RE. Intrathecal narcotics for labor analgesia. Am Fam Physician 1997;56:463-70.
18. Bloom SL, McIntire DD, Kelly MA, et al. Lack of effect of walking on labor and delivery. N Engl J Med 1998;339:76-9.
19. Collis RE, Davies DW, Aveling W. Randomised comparison of combined spinal-epidural and standard epidural analgesia in labour. Lancet 1995;345:1413-6.
20. Collis RE, Harding SA, Morgan BM. Effect of maternal ambulation on labour with low-dose combined spinal-epidural analgesia. Anaesthesia 1999;54:535-9.
21. Melzack R. Severity of labour pain: influence of physical as well as psychologic variables. CMAJ 1984;130:579-84.
22. Green JM. Expectations and experiences of pain in labor: findings from a large prospective study. Birth 1993;20:65-72.
Comparison of thin versus standard esophagogastroduodenoscopy
OBJECTIVE: To compare the tolerance, feasibility, and safety of ultrathin esophagogastroduodenoscopy (EGD) in unsedated patients with conventional EGD in sedated patients.
STUDY DESIGN: This was an unblinded, randomized controlled trial.
POPULATION: Diagnostic EGD was performed on 72 adult outpatients at a US Air Force community hospital residency. Patients were randomized to either ultrathin or conventional EGD (n = 33 and 39, respectively).
OUTCOMES MEASURED: Patients reported their tolerance of the procedure (pain, choking, gagging, and anxiety; scale 0–10), and the endoscopist reported the effectiveness of the procedure (successful intubation, reaching duodenum, retroflexion, and duration of examination and recovery) and safety (complications).
RESULTS: No statistically significant difference was noted between the 2 groups in mean procedure time or pain during the procedure. Mean (± standard error) recovery time was approximately halved in the ultrathin group vs the conventional group (21.5 ± 2.3 min vs 55.4 ± 2.3 min, P < .0001). Although patients undergoing ultrathin EGD had higher mean gagging and choking scores, they had lower mean anxiety scores. Of 33 patients randomized to the unsedated ultrathin EGD procedure, 29 completed the protocol. The retroflexion maneuver was completed in 85% of patients in the ultrathin EGD group and 100% of patients in the conventional EGD group (P = .017). No statistically significant difference was noted between groups as to the likelihood of reaching the second portion of the duodenum (97% vs 100%).
CONCLUSIONS: Most patients tolerate ultrathin EGD with significantly shorter recovery time and less overall anxiety than with the conventioanl procedure. Techniques to reduce gagging and choking associated with ultrathin EGD may improve patient acceptance and tolerability. Adoption of ultrathin EGD by primary care physicians may decrease cost, time, and inconvenience while increasing access to EGD for many patients.
- Most patients tolerate unsedated, ultrathin esophagogastroduodenoscopy (EGD).
- The recovery time is approximately halved for ultrathin unsedated EGDs.
- Patients undergoing unsedated EGD report more gagging and choking than do patients having the sedated examination.
- Patients receiving sedated upper endoscopy report more anxiety than those receiving an unsedated examination.
- Once credentialed in upper endoscopy, physicians do not require further training or skills to perform ultrathin EGD.
Hacker et al1 reported that 3 times as many patients prefer esophagogastroduodenoscopy (EGD) to upper gastrointestinal roentgenography. EGD is safe, with complication rates between 5 and 10 per 10,000 procedures.2 However, only 2% of US family physicians perform upper endoscopy.3
In the United States, conventional EGD is usually performed under conscious sedation to reduce discomfort and anxiety.4 Conscious sedation has potential negative aspects, including costs and side effects,5 increased risks of respiratory depression,2 and, very rarely, mortality.5 Indirect costs related to lost work are unmeasured. All these factors may decrease patient tolerance or acceptance of conventional EGD with conscious sedation.
In the last decade, an ultrathin (5.3–5.9 mm diameter) fiberoptic endoscope was developed. Shaker et al6 used an ultrathin endoscope to perform transnasal endoscopy of the gastrointestinal tract. Since then, several prospective studies have evaluated ultrathin EGD.7-9 One study compared ultrathin with conventional EGD, although both groups of subjects were unsedated.10 Studies comparing EGD techniques were performed in large medical centers by gastroenterologists.7-17 The purpose of this study was to assess the feasibility, safety, and patient tolerance of unsedated ultrathin EGD by generalists in a community setting.
Methods
Outpatients (aged 20–80 years) from a US Air Force family practice residency were referred to a family practice endoscopist for further evaluation of dyspepsia, heartburn, and epigastric pain. Exclusion criteria included pregnancy, evidence of acute gastrointestinal hemorrhage, potential need for therapeutic endoscopy, a medically unstable patient (eg, recent myocardial infarction or stroke), coagulopathy, unstable angina, severe chronic obstructive pulmonary disease, and severe aortic stenosis. The local institutional review board approved the study.
An Olympus GIF-N230 gastrointestinal videoscope (Olympus America Inc, Melville, NY) with an outer diameter of 6.0 mm, an accessory channel of 2.0 mm, a working length of 122 cm, tip deflection of 180° (up and down) and 160° (right and left), with a field of view of 120° was used for the ultrathin procedures. An Olympus GIF-130 standard gastroscope (Olympus America Inc) with an outer diameter of 9.8 mm, an accessory channel of 2.8 mm, a working length of 103 cm, tip deflection of 210° up, 90° down, and 100° right and left, with a field of view of 120°, was used for the conventional procedures. Both endoscopes are forward-viewing (Figure 1).
After standard informed consent was obtained, the endoscopist made a phone call to access a computer-generated patient list for randomization. No patient withdrew after randomization. The endoscopist (T.W.) performed all endoscopies in the gastrointestinal suite with the patient in the left lateral position. An intravenous line was started and tetracaine 2% was sprayed in the posterior pharynx; pulse oximetry, cardiac monitoring, and verbal reassurance by the endoscopist were provided to patients in both groups. Sedation was slowly titrated in increments of 25 mg meperidine (or 50 mg fentanyl if the patient was allergic to meperidine) and 0.5 mg midazolam until a suitable level of sedation was obtained for endoscopy. Biopsy samples were obtained when indicated. Patients who were unable to tolerate the unsedated examination were given intravenous sedation, and the examination was completed using ultrathin EGD.
Upon discharge from the recovery area, all patients completed a questionnaire regarding their tolerance of the procedure. Patients completed 10-point visual scales indicating pain, choking, gagging, and anxiety both during the insertion of the endoscope and for the remainder of the examination. Patients were asked if they would choose to have the procedure again if endoscopy were indicated in the future. After the procedure, the endoscopist completed a questionnaire assessing the completeness of the examination (eg, whether the endoscope was advanced to the second portion of the duodenum and retroflexion was performed). Indications for the procedure, demographics, clinical findings, complications, the duration of the examination, and recovery duration were noted.
This study was planned to achieve a power of 0.80 to detect changes of 2.0 on tolerance scores between the study groups. Statistical analyses included the independent t-test, Fisher exact test, Mann-Whitney U test, and chi-square test. Multivariate regression analysis and analysis of variance were used to assess the effect that sex may have had on patients’ tolerance scores. Analysis was by intention to treat.
FIGURE 1
Ultrathin endoscope, GIF-N230 (left); standard endoscope, GIF-130 (right) 
Results
Of 80 outpatients eligible for the study, 8 (10%) declined entry before randomization. Of 72 remaining, 33 were randomized to ultrathin EGD and 39 to the conventional procedure. The 2 groups were evenly matched for age, race, body mass index (BMI), indication, and EGD findings (Tables 1 and 2). There were more women in the conventional group (80% vs 55%, P = .041; Table 1).
During endoscope insertion, patients undergoing ultrathin EGD had higher mean gagging and choking scores, but lower anxiety scores. For the remainder of the procedure, ultrathin EGD patients had higher gagging scores but no statistically significant differences were noted between groups for pain, choking, or anxiety (Table 2). Twenty-nine patients (88%) assigned to the ultrathin EGD group completed the unsedated examination, and 32 (97%) were willing to repeat an unsedated procedure with the ultrathin endoscope in the future. The mean (± standard error) dose of meperidine was 48.8 ± 2.3 mg; 2 patients required fentanyl 62.5 ± 12.5 mg and midazolam 2.2 ± 0.1 mg. Of the 4 patients allocated to the ultrathin group, which required sedation, the mean dose of meperidine was 50 ± 0 mg and mida-zolam 2.8 ± 0.5 mg. The time required for sedation in the conventional group was 4.1 ± 0.6 min and in the ultrathin EGD group was 5.5 ± 0.5 min (P = .280).
The second portion of the duodenum was reached as often with the ultrathin endoscope as with the conventional apparatus (Table 2). However, retroflexion was achieved less often with ultrathin EGD than with conventional EGD (85% vs 100%, P = .017). Although examination times did not differ between groups, the recovery time was significantly shorter with ultrathin EGD (21.5 ± 2.3 min vs 55.4 ± 2.3 min, P < .0001). No complications were noted in either group. Analysis of variance and multiple regression analysis showed no statistically significant difference in the tolerance scores by sex.
TABLE 1
Patient demographics
| Characteristic | Ultrathin EGD (n = 33) | Conventional EGD (n = 39) | P |
|---|---|---|---|
| Age, y (mean ± SE) | 49.8 ± 2.9 | 46.9 ± 2.2 | .406 |
| Female (%) | 55 | 80 | .041 |
| Race (%) | |||
| Caucasian | 7 | 44 | .123 |
| African American | 27 | 39 | |
| Other | 6 | 18 | |
| Body mass index (mean ± SE) | 28.8 ± 0.88 | 28.7 ± 0.81 | .966 |
| EGD, esophagogastroduodenoscopy; SE, standard error. | |||
TABLE 2
Indications and esophagogastroduodenoscopy findings
| Ultrathin EGD | Conventional EGD | P | |
|---|---|---|---|
| Indications, n (%) | |||
| GERD | 26 (79) | 22 (56) | .050 |
| Abdominal pain | 9 (27) | 18 (46) | .143 |
| Dyspepsia | 2 (6) | 7 (18) | .166 |
| EGD findings, n (%) | |||
| Esophagitis | 9 (27) | 6 (15) | .254 |
| Hiatal hernia | 15 (45) | 13 (33) | .338 |
| Gastritis | 20 (61) | 29 (74) | .310 |
| Gastric ulcer | 1 (3) | 4 (10) | .366 |
| Duodenal ulcer | 0 | 0 | |
| CLO test positive | 4 (13) | 11 (28) | .150 |
| Patient tolerance, score (mean ±SE) | |||
| During insertion | |||
| Anxiety | 3.2 ± 0.47 | 5.7 ± 0.45 | <.0001 |
| Pain | 2.0 ± 0.34 | 1.4 ± 0.29 | .574 |
| Choking | 3.0 ± 0.42 | 1.0 ± 0.32 | .022 |
| Gagging | 4.2 ± 0.45 | 1.3 ± 0.34 | <.0001 |
| During procedure | |||
| Anxiety | 3.1 ± 0.48 | 2.5 ± 0.43 | .350 |
| Pain | 1.3 ± 0.31 | 1.2 ± 0.27 | .771 |
| Choking | 1.7 ± 0.33 | 1.0 ± 0.25 | .081 |
| Gagging | 2.4 ± 0.35 | 1.2 ± 0.28 | .007 |
| Technical aspects of procedure | |||
| To second portion of duodenum (%) | 97 | 100 | .458 |
| Retroflexed (%) | 85 | 100 | .017 |
| Duration of examination, min (mean ± SE) | 18.2 ± 0.93 | 17.5 ± 1.1 | .632 |
| Duration of recovery, min (mean ± SE) | 21.5 ± 2.3 | 55.4 ± 2.3 | <.0001 |
| EGD, esophagogastroduodenoscopy; GERD, gastroesophageal reflux disease; SE, standard error. | |||
Discussion
We examined differences in patients’ experiences during EGD when a relatively thin scope was used without sedation vs a conventional wider scope with sedation. We expected the ultrathin scope to be preferable to both patients and physicians because of the reduced risk and lower cost associated with an unsedated procedure performed in an out-patient setting.
This study has major implications for family physicians. First, ultrathin EGD requires less recovery time than the conventional procedure. In addition, unsedated endoscopy does not require continuous cardiopulmonary monitoring.18 In contrast, conventional EGD generally requires a minimum of 2 support personnel: 1 to assist the endoscopist and 1 to monitor vital signs. A third assistant is occasionally needed to monitor patients in recovery. Ultrathin EGD requires only 1 assistant. A thorough exploration of cost savings associated with ultrathin EGD was beyond the scope of this study. A recent study13 found that ultrathin EGD required less procedure time, less time in the procedure room, and less recovery time, with a cost savings of US $125 per procedure. Second, EGD is traditionally limited to being perforen type=med in gastrointestinal suites. Our findings suggested that most patients can tolerate ultrathin EGD in an outpatient setting, thereby offering easier access to the procedure.
Increased gagging and choking associated with the ultrathin device suggests that its deployment will require techniques to reduce gagging. Transnasal upper endoscopy appears to cause less gagging and choking,8,9,11,14-17,19 but has not been studied in the family practice setting. Other techniques to determine pharyngeal sensitivity are needed.20,21 One study10 found that ultrathin EGD was tolerated better than conventional EGD for unsedated examinations; investigators22 identified younger age and higher levels of pre-endoscopic anxiety as predictors of patient intolerance of unsedated endoscopy.
Although the success rate of retroflexion and duodenal intubation has not been reported in other studies6-9,11,12,14-17,19,23 of ultrathin EGD, we could not perform retroflexion in 15% of subjects in the ultrathin EGD group. Inability to retroflex was secondary to patient intolerance and increased instrument flexibility. In these patients, the endoscopist might switch to a normal diameter scope; however, in a large national study using a standard diameter endoscope, retroflexion was not performed in 7% of patients.24 The most frequent contribution of retroflexion is the identification of a dysfunctional lower esophageal sphincter. In our experience, a small fundal polyp and a large diverticulum in the cardia would be missed in the absence of this maneuver. In contrast, we were unable to intubate the duodenum in 3% of patients undergoing ultrathin EGD. Rodney and colleagues24 cited in their national study that with use of the standard endoscope, duodenal intubation was not achieved in 7% of patients. With increased experience with the ultrathin device, endoscopists may be able to develop techniques to overcome the increased flexibility (eg, using the biopsy forceps in the accessory channel to increase rigidity).
Although we found no significant differences in the proportion of clinical findings between the 2 groups, the findings may have been different had we been able to retroflex the scope in the ultrathin EGD group. The diagnostic accuracy,11,17 image quality,11,23 and adequacy of the smaller biopsy specimen for pathologic diagnosis9,25,26 for ultrathin EGD have been reviewed and consistently determined to be clinically acceptable. Image quality of the 2 techniques is comparable (Figure 2). Although the biopsy specimens obtained with the ultrathin endoscope were smaller than samples of tissue obtained with the conventional device, CLO test positivity did not differ between the groups.
Conventional EGD required more recovery time and was associated with significantly higher anxiety. It is possible that the relatively higher anxiety experienced by patients in the conventional EGD group can be explained by fear of loss of control, fear about risks related to sedation, or a combination of psychosocial factors. One limitation in the conventional EGD group was the potential bias of the seda-tion when patients responded to the postrecovery surveys. Future studies may control for this sedation-effect bias by repeated measures over a period of a few days. Another limitation of our study was that the verbal reassurance offered to patients before and during endoscopy was nonscripted and may have influenced tolerance scores. A third limitation was that the patient questionnaire was given to patients by the endoscopist, thereby possibly introducing a social desirability bias. Finally, the small sample size limited the ability to detect differences that may be clinically meaningful.
Ultrathin EGD costs less, provides similar results, and has acceptable tolerability compared with conventional EGD. Once they are EGD credentialed, clinicians do not require further training or skills to perform the procedure with the ultrathin device. As more family physicians feel comfortable performing EGD in an outpatient setting, more patients will have access to this important procedure.
FIGURE 2
View of gastric ulcer with GIF-N230 (A) and GIF-130 (B)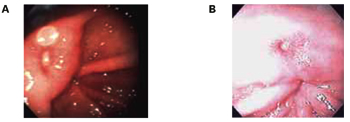
Acknowledgments
The investigators acknowledge Olympus for the use of a GIF-N230 gastrointestinal videoscope, which was used for the ultrathin procedures. We also acknowledge Staff Sergeant Ron O’Dell for his photograph of the endoscopes.
1. Hacker JFD, Chobanian SJ, Johnson DA, Winters C, Jr, Cattau EL, J. Patient preference in upper gastrointestinal studies: roentgenography versus endoscopy. South Med J 1987;80:1091-3.
2. Zurad EG Indications, Contraindications, and Complications of Upper Gastrointestinal Endoscopy. Kansas City, KS: American Academy of Family Physicians; 1994.
3. American Academy of Family Physicians Practice Profile II Survey. Leawood, KS: American Academy of Family Physicians; 1998.
4. Daneshmend TK, Bell GD, Logan RF. Sedation for upper gastrointestinal endoscopy: results of a nationwide survey. Gut 1991;32:12-5.
5. Mokhashi MS, Hawes RH. Struggling toward easier endoscopy [editorial]. Gastrointest Endosc 1998;48:432-40.
6. Shaker R. Unsedated trans-nasal pharyngoesophagogastroduodenoscopy (T-EGD): technique. Gastrointest Endosc 1994;40:346-8.
7. De Gregorio BT, Poorman JC, Katon RM. Peroral ultrathin endoscopy in adult patients. Gastrointest Endosc 1997;45:303-6.
8. Rey JF, Duforest D, Marek TA. Prospective comparison of nasal versus oral insertion of a thin video endoscope in healthy volunteers. Endoscopy 1996;28:422-4.
9. Dumortier J, Ponchon T, Scoazec JY, et al. Prospective evaluation of transnasal esophagogastroduodenoscopy: feasibility and study on performance and tolerance. Gastrointest Endosc 1999;49(3 Pt 1):285-91.
10. Mulcahy HE, Riches A, Kiely M, Farthing MJ, Fairclough PD. A prospective controlled trial of an ultrathin versus a conventional endoscope in unsedated upper gastrointestinal endoscopy. Endoscopy 2001;33:311-6.
11. Zaman A, Hahn M, Hapke R, Knigge K, Fennerty MB, Katon RM. A randomized trial of peroral versus transnasal unsedated endoscopy using an ultrathin videoendoscope. Gastrointest Endosc 1999;49(3 Pt 1):279-84.
12. Zaman A, Hapke R, Sahagun G, Katon RM. Unsedated peroral endoscopy with a video ultrathin endoscope: patient acceptance, tolerance, and diagnostic accuracy. Am J Gastroenterol 1998;93:1260-3.
13. Gorelick AB, Inadomi JM, Barnett JL. Unsedated small-caliber esophagogastroduodenoscopy (EGD): less expensive and less time-consuming than conventional EGD. J Clin Gastroenterol 2001;33:210-4.
14. Craig A, Hanlon J, Dent J, Schoeman M. A comparison of transnasal and transoral endoscopy with small-diameter endoscopes in unsedated patients. Gastrointest Endosc 1999;49(3 Pt 1):292-6.
15. Nozaki R, Fujiyoshi T, Tamura M, Tsuchiya A, Takagi K, Takano M. Evaluation of small caliber transnasal panendoscopes for upper GI screening examination. Dig Endosc 1995;7:155-9.
16. Campo R, Montserrat A, Brullet E. Transnasal gastroscopy compared to conventional gastroscopy: a randomized study of feasibility, safety, and tolerance. Endoscopy 1998;30:448-52.
17. Dean R, Dua K, Massey B, Berger W, Hogan WJ, Shaker R. A comparative study of unsedated transnasal esophagogastroduodenoscopy and conventional EGD. Gastrointest Endosc 1996;44:422-4.
18. Banks MR, Kumar PJ, Mulcahy HE. Pulse oximetry saturation levels during routine unsedated diagnostic upper gastrointestinal endoscopy. Scand J Gastroenterol 2001;36:105-9.
19. Bampton PA, Reid DP, Johnson RD, Fitch RJ, Dent J. A comparison of transnasal and transoral oesophagogastroduodenoscopy. J Gastroenterol Hepatol 1998;13:579-84.
20. Ladas SD, Tassios PS, Raptis SA. A simple test for predicting patients’ tolerance of upper gastrointestinal endoscopy. Endoscopy 1997;29:430.
21. Ladas SD, Raptis SA. Selection of patients for upper gastrointestinal endoscopy without sedation. The finger-throat test. Ital J Gastroenterol 1986;18:162-5.
22. Mulcahy HE, Kelly P, Banks MR, et al. Factors associated with tolerance to, and discomfort with, unsedated diagnostic gastroscopy. Scand J Gastroenterol 2001;36:1352-7.
23. Sorbi D, Gostout CJ, Henry J, Lindor KD. Unsedated small-caliber esophagogastroduodenoscopy (EGD) versus conventional EGD: a comparative study. Gastroenterology 1999;117:1301-7.
24. Rodney WM, Weber JR, Swedberg JA, et al. Esophago-gastroduodenoscopy by family physicians phase II: a national multisite study of 2,500 procedures. Fam Pract Res J 1993;13:121-31.
25. Saeian K, Townsend WF, Rochling FA, et al. Unsedated transnasal EGD: an alternative approach to conventional esophagogastroduodenoscopy for documenting Helicobacter pylori eradication. Gastrointest Endosc 1999;49(3 Pt 1):297-301.
26. Yousfi MM, El-Zimaity HM, Cole RA, Genta RM, Graham DY. Detection of Helicobacter pylori by rapid urease tests: is biopsy size a critical variable? Gastrointest Endosc 1996;43:222-4.
OBJECTIVE: To compare the tolerance, feasibility, and safety of ultrathin esophagogastroduodenoscopy (EGD) in unsedated patients with conventional EGD in sedated patients.
STUDY DESIGN: This was an unblinded, randomized controlled trial.
POPULATION: Diagnostic EGD was performed on 72 adult outpatients at a US Air Force community hospital residency. Patients were randomized to either ultrathin or conventional EGD (n = 33 and 39, respectively).
OUTCOMES MEASURED: Patients reported their tolerance of the procedure (pain, choking, gagging, and anxiety; scale 0–10), and the endoscopist reported the effectiveness of the procedure (successful intubation, reaching duodenum, retroflexion, and duration of examination and recovery) and safety (complications).
RESULTS: No statistically significant difference was noted between the 2 groups in mean procedure time or pain during the procedure. Mean (± standard error) recovery time was approximately halved in the ultrathin group vs the conventional group (21.5 ± 2.3 min vs 55.4 ± 2.3 min, P < .0001). Although patients undergoing ultrathin EGD had higher mean gagging and choking scores, they had lower mean anxiety scores. Of 33 patients randomized to the unsedated ultrathin EGD procedure, 29 completed the protocol. The retroflexion maneuver was completed in 85% of patients in the ultrathin EGD group and 100% of patients in the conventional EGD group (P = .017). No statistically significant difference was noted between groups as to the likelihood of reaching the second portion of the duodenum (97% vs 100%).
CONCLUSIONS: Most patients tolerate ultrathin EGD with significantly shorter recovery time and less overall anxiety than with the conventioanl procedure. Techniques to reduce gagging and choking associated with ultrathin EGD may improve patient acceptance and tolerability. Adoption of ultrathin EGD by primary care physicians may decrease cost, time, and inconvenience while increasing access to EGD for many patients.
- Most patients tolerate unsedated, ultrathin esophagogastroduodenoscopy (EGD).
- The recovery time is approximately halved for ultrathin unsedated EGDs.
- Patients undergoing unsedated EGD report more gagging and choking than do patients having the sedated examination.
- Patients receiving sedated upper endoscopy report more anxiety than those receiving an unsedated examination.
- Once credentialed in upper endoscopy, physicians do not require further training or skills to perform ultrathin EGD.
Hacker et al1 reported that 3 times as many patients prefer esophagogastroduodenoscopy (EGD) to upper gastrointestinal roentgenography. EGD is safe, with complication rates between 5 and 10 per 10,000 procedures.2 However, only 2% of US family physicians perform upper endoscopy.3
In the United States, conventional EGD is usually performed under conscious sedation to reduce discomfort and anxiety.4 Conscious sedation has potential negative aspects, including costs and side effects,5 increased risks of respiratory depression,2 and, very rarely, mortality.5 Indirect costs related to lost work are unmeasured. All these factors may decrease patient tolerance or acceptance of conventional EGD with conscious sedation.
In the last decade, an ultrathin (5.3–5.9 mm diameter) fiberoptic endoscope was developed. Shaker et al6 used an ultrathin endoscope to perform transnasal endoscopy of the gastrointestinal tract. Since then, several prospective studies have evaluated ultrathin EGD.7-9 One study compared ultrathin with conventional EGD, although both groups of subjects were unsedated.10 Studies comparing EGD techniques were performed in large medical centers by gastroenterologists.7-17 The purpose of this study was to assess the feasibility, safety, and patient tolerance of unsedated ultrathin EGD by generalists in a community setting.
Methods
Outpatients (aged 20–80 years) from a US Air Force family practice residency were referred to a family practice endoscopist for further evaluation of dyspepsia, heartburn, and epigastric pain. Exclusion criteria included pregnancy, evidence of acute gastrointestinal hemorrhage, potential need for therapeutic endoscopy, a medically unstable patient (eg, recent myocardial infarction or stroke), coagulopathy, unstable angina, severe chronic obstructive pulmonary disease, and severe aortic stenosis. The local institutional review board approved the study.
An Olympus GIF-N230 gastrointestinal videoscope (Olympus America Inc, Melville, NY) with an outer diameter of 6.0 mm, an accessory channel of 2.0 mm, a working length of 122 cm, tip deflection of 180° (up and down) and 160° (right and left), with a field of view of 120° was used for the ultrathin procedures. An Olympus GIF-130 standard gastroscope (Olympus America Inc) with an outer diameter of 9.8 mm, an accessory channel of 2.8 mm, a working length of 103 cm, tip deflection of 210° up, 90° down, and 100° right and left, with a field of view of 120°, was used for the conventional procedures. Both endoscopes are forward-viewing (Figure 1).
After standard informed consent was obtained, the endoscopist made a phone call to access a computer-generated patient list for randomization. No patient withdrew after randomization. The endoscopist (T.W.) performed all endoscopies in the gastrointestinal suite with the patient in the left lateral position. An intravenous line was started and tetracaine 2% was sprayed in the posterior pharynx; pulse oximetry, cardiac monitoring, and verbal reassurance by the endoscopist were provided to patients in both groups. Sedation was slowly titrated in increments of 25 mg meperidine (or 50 mg fentanyl if the patient was allergic to meperidine) and 0.5 mg midazolam until a suitable level of sedation was obtained for endoscopy. Biopsy samples were obtained when indicated. Patients who were unable to tolerate the unsedated examination were given intravenous sedation, and the examination was completed using ultrathin EGD.
Upon discharge from the recovery area, all patients completed a questionnaire regarding their tolerance of the procedure. Patients completed 10-point visual scales indicating pain, choking, gagging, and anxiety both during the insertion of the endoscope and for the remainder of the examination. Patients were asked if they would choose to have the procedure again if endoscopy were indicated in the future. After the procedure, the endoscopist completed a questionnaire assessing the completeness of the examination (eg, whether the endoscope was advanced to the second portion of the duodenum and retroflexion was performed). Indications for the procedure, demographics, clinical findings, complications, the duration of the examination, and recovery duration were noted.
This study was planned to achieve a power of 0.80 to detect changes of 2.0 on tolerance scores between the study groups. Statistical analyses included the independent t-test, Fisher exact test, Mann-Whitney U test, and chi-square test. Multivariate regression analysis and analysis of variance were used to assess the effect that sex may have had on patients’ tolerance scores. Analysis was by intention to treat.
FIGURE 1
Ultrathin endoscope, GIF-N230 (left); standard endoscope, GIF-130 (right)
Results
Of 80 outpatients eligible for the study, 8 (10%) declined entry before randomization. Of 72 remaining, 33 were randomized to ultrathin EGD and 39 to the conventional procedure. The 2 groups were evenly matched for age, race, body mass index (BMI), indication, and EGD findings (Tables 1 and 2). There were more women in the conventional group (80% vs 55%, P = .041; Table 1).
During endoscope insertion, patients undergoing ultrathin EGD had higher mean gagging and choking scores, but lower anxiety scores. For the remainder of the procedure, ultrathin EGD patients had higher gagging scores but no statistically significant differences were noted between groups for pain, choking, or anxiety (Table 2). Twenty-nine patients (88%) assigned to the ultrathin EGD group completed the unsedated examination, and 32 (97%) were willing to repeat an unsedated procedure with the ultrathin endoscope in the future. The mean (± standard error) dose of meperidine was 48.8 ± 2.3 mg; 2 patients required fentanyl 62.5 ± 12.5 mg and midazolam 2.2 ± 0.1 mg. Of the 4 patients allocated to the ultrathin group, which required sedation, the mean dose of meperidine was 50 ± 0 mg and mida-zolam 2.8 ± 0.5 mg. The time required for sedation in the conventional group was 4.1 ± 0.6 min and in the ultrathin EGD group was 5.5 ± 0.5 min (P = .280).
The second portion of the duodenum was reached as often with the ultrathin endoscope as with the conventional apparatus (Table 2). However, retroflexion was achieved less often with ultrathin EGD than with conventional EGD (85% vs 100%, P = .017). Although examination times did not differ between groups, the recovery time was significantly shorter with ultrathin EGD (21.5 ± 2.3 min vs 55.4 ± 2.3 min, P < .0001). No complications were noted in either group. Analysis of variance and multiple regression analysis showed no statistically significant difference in the tolerance scores by sex.
TABLE 1
Patient demographics
| Characteristic | Ultrathin EGD (n = 33) | Conventional EGD (n = 39) | P |
|---|---|---|---|
| Age, y (mean ± SE) | 49.8 ± 2.9 | 46.9 ± 2.2 | .406 |
| Female (%) | 55 | 80 | .041 |
| Race (%) | |||
| Caucasian | 7 | 44 | .123 |
| African American | 27 | 39 | |
| Other | 6 | 18 | |
| Body mass index (mean ± SE) | 28.8 ± 0.88 | 28.7 ± 0.81 | .966 |
| EGD, esophagogastroduodenoscopy; SE, standard error. | |||
TABLE 2
Indications and esophagogastroduodenoscopy findings
| Ultrathin EGD | Conventional EGD | P | |
|---|---|---|---|
| Indications, n (%) | |||
| GERD | 26 (79) | 22 (56) | .050 |
| Abdominal pain | 9 (27) | 18 (46) | .143 |
| Dyspepsia | 2 (6) | 7 (18) | .166 |
| EGD findings, n (%) | |||
| Esophagitis | 9 (27) | 6 (15) | .254 |
| Hiatal hernia | 15 (45) | 13 (33) | .338 |
| Gastritis | 20 (61) | 29 (74) | .310 |
| Gastric ulcer | 1 (3) | 4 (10) | .366 |
| Duodenal ulcer | 0 | 0 | |
| CLO test positive | 4 (13) | 11 (28) | .150 |
| Patient tolerance, score (mean ±SE) | |||
| During insertion | |||
| Anxiety | 3.2 ± 0.47 | 5.7 ± 0.45 | <.0001 |
| Pain | 2.0 ± 0.34 | 1.4 ± 0.29 | .574 |
| Choking | 3.0 ± 0.42 | 1.0 ± 0.32 | .022 |
| Gagging | 4.2 ± 0.45 | 1.3 ± 0.34 | <.0001 |
| During procedure | |||
| Anxiety | 3.1 ± 0.48 | 2.5 ± 0.43 | .350 |
| Pain | 1.3 ± 0.31 | 1.2 ± 0.27 | .771 |
| Choking | 1.7 ± 0.33 | 1.0 ± 0.25 | .081 |
| Gagging | 2.4 ± 0.35 | 1.2 ± 0.28 | .007 |
| Technical aspects of procedure | |||
| To second portion of duodenum (%) | 97 | 100 | .458 |
| Retroflexed (%) | 85 | 100 | .017 |
| Duration of examination, min (mean ± SE) | 18.2 ± 0.93 | 17.5 ± 1.1 | .632 |
| Duration of recovery, min (mean ± SE) | 21.5 ± 2.3 | 55.4 ± 2.3 | <.0001 |
| EGD, esophagogastroduodenoscopy; GERD, gastroesophageal reflux disease; SE, standard error. | |||
Discussion
We examined differences in patients’ experiences during EGD when a relatively thin scope was used without sedation vs a conventional wider scope with sedation. We expected the ultrathin scope to be preferable to both patients and physicians because of the reduced risk and lower cost associated with an unsedated procedure performed in an out-patient setting.
This study has major implications for family physicians. First, ultrathin EGD requires less recovery time than the conventional procedure. In addition, unsedated endoscopy does not require continuous cardiopulmonary monitoring.18 In contrast, conventional EGD generally requires a minimum of 2 support personnel: 1 to assist the endoscopist and 1 to monitor vital signs. A third assistant is occasionally needed to monitor patients in recovery. Ultrathin EGD requires only 1 assistant. A thorough exploration of cost savings associated with ultrathin EGD was beyond the scope of this study. A recent study13 found that ultrathin EGD required less procedure time, less time in the procedure room, and less recovery time, with a cost savings of US $125 per procedure. Second, EGD is traditionally limited to being perforen type=med in gastrointestinal suites. Our findings suggested that most patients can tolerate ultrathin EGD in an outpatient setting, thereby offering easier access to the procedure.
Increased gagging and choking associated with the ultrathin device suggests that its deployment will require techniques to reduce gagging. Transnasal upper endoscopy appears to cause less gagging and choking,8,9,11,14-17,19 but has not been studied in the family practice setting. Other techniques to determine pharyngeal sensitivity are needed.20,21 One study10 found that ultrathin EGD was tolerated better than conventional EGD for unsedated examinations; investigators22 identified younger age and higher levels of pre-endoscopic anxiety as predictors of patient intolerance of unsedated endoscopy.
Although the success rate of retroflexion and duodenal intubation has not been reported in other studies6-9,11,12,14-17,19,23 of ultrathin EGD, we could not perform retroflexion in 15% of subjects in the ultrathin EGD group. Inability to retroflex was secondary to patient intolerance and increased instrument flexibility. In these patients, the endoscopist might switch to a normal diameter scope; however, in a large national study using a standard diameter endoscope, retroflexion was not performed in 7% of patients.24 The most frequent contribution of retroflexion is the identification of a dysfunctional lower esophageal sphincter. In our experience, a small fundal polyp and a large diverticulum in the cardia would be missed in the absence of this maneuver. In contrast, we were unable to intubate the duodenum in 3% of patients undergoing ultrathin EGD. Rodney and colleagues24 cited in their national study that with use of the standard endoscope, duodenal intubation was not achieved in 7% of patients. With increased experience with the ultrathin device, endoscopists may be able to develop techniques to overcome the increased flexibility (eg, using the biopsy forceps in the accessory channel to increase rigidity).
Although we found no significant differences in the proportion of clinical findings between the 2 groups, the findings may have been different had we been able to retroflex the scope in the ultrathin EGD group. The diagnostic accuracy,11,17 image quality,11,23 and adequacy of the smaller biopsy specimen for pathologic diagnosis9,25,26 for ultrathin EGD have been reviewed and consistently determined to be clinically acceptable. Image quality of the 2 techniques is comparable (Figure 2). Although the biopsy specimens obtained with the ultrathin endoscope were smaller than samples of tissue obtained with the conventional device, CLO test positivity did not differ between the groups.
Conventional EGD required more recovery time and was associated with significantly higher anxiety. It is possible that the relatively higher anxiety experienced by patients in the conventional EGD group can be explained by fear of loss of control, fear about risks related to sedation, or a combination of psychosocial factors. One limitation in the conventional EGD group was the potential bias of the seda-tion when patients responded to the postrecovery surveys. Future studies may control for this sedation-effect bias by repeated measures over a period of a few days. Another limitation of our study was that the verbal reassurance offered to patients before and during endoscopy was nonscripted and may have influenced tolerance scores. A third limitation was that the patient questionnaire was given to patients by the endoscopist, thereby possibly introducing a social desirability bias. Finally, the small sample size limited the ability to detect differences that may be clinically meaningful.
Ultrathin EGD costs less, provides similar results, and has acceptable tolerability compared with conventional EGD. Once they are EGD credentialed, clinicians do not require further training or skills to perform the procedure with the ultrathin device. As more family physicians feel comfortable performing EGD in an outpatient setting, more patients will have access to this important procedure.
FIGURE 2
View of gastric ulcer with GIF-N230 (A) and GIF-130 (B)
Acknowledgments
The investigators acknowledge Olympus for the use of a GIF-N230 gastrointestinal videoscope, which was used for the ultrathin procedures. We also acknowledge Staff Sergeant Ron O’Dell for his photograph of the endoscopes.
1. Hacker JFD, Chobanian SJ, Johnson DA, Winters C, Jr, Cattau EL, J. Patient preference in upper gastrointestinal studies: roentgenography versus endoscopy. South Med J 1987;80:1091-3.
2. Zurad EG Indications, Contraindications, and Complications of Upper Gastrointestinal Endoscopy. Kansas City, KS: American Academy of Family Physicians; 1994.
3. American Academy of Family Physicians Practice Profile II Survey. Leawood, KS: American Academy of Family Physicians; 1998.
4. Daneshmend TK, Bell GD, Logan RF. Sedation for upper gastrointestinal endoscopy: results of a nationwide survey. Gut 1991;32:12-5.
5. Mokhashi MS, Hawes RH. Struggling toward easier endoscopy [editorial]. Gastrointest Endosc 1998;48:432-40.
6. Shaker R. Unsedated trans-nasal pharyngoesophagogastroduodenoscopy (T-EGD): technique. Gastrointest Endosc 1994;40:346-8.
7. De Gregorio BT, Poorman JC, Katon RM. Peroral ultrathin endoscopy in adult patients. Gastrointest Endosc 1997;45:303-6.
8. Rey JF, Duforest D, Marek TA. Prospective comparison of nasal versus oral insertion of a thin video endoscope in healthy volunteers. Endoscopy 1996;28:422-4.
9. Dumortier J, Ponchon T, Scoazec JY, et al. Prospective evaluation of transnasal esophagogastroduodenoscopy: feasibility and study on performance and tolerance. Gastrointest Endosc 1999;49(3 Pt 1):285-91.
10. Mulcahy HE, Riches A, Kiely M, Farthing MJ, Fairclough PD. A prospective controlled trial of an ultrathin versus a conventional endoscope in unsedated upper gastrointestinal endoscopy. Endoscopy 2001;33:311-6.
11. Zaman A, Hahn M, Hapke R, Knigge K, Fennerty MB, Katon RM. A randomized trial of peroral versus transnasal unsedated endoscopy using an ultrathin videoendoscope. Gastrointest Endosc 1999;49(3 Pt 1):279-84.
12. Zaman A, Hapke R, Sahagun G, Katon RM. Unsedated peroral endoscopy with a video ultrathin endoscope: patient acceptance, tolerance, and diagnostic accuracy. Am J Gastroenterol 1998;93:1260-3.
13. Gorelick AB, Inadomi JM, Barnett JL. Unsedated small-caliber esophagogastroduodenoscopy (EGD): less expensive and less time-consuming than conventional EGD. J Clin Gastroenterol 2001;33:210-4.
14. Craig A, Hanlon J, Dent J, Schoeman M. A comparison of transnasal and transoral endoscopy with small-diameter endoscopes in unsedated patients. Gastrointest Endosc 1999;49(3 Pt 1):292-6.
15. Nozaki R, Fujiyoshi T, Tamura M, Tsuchiya A, Takagi K, Takano M. Evaluation of small caliber transnasal panendoscopes for upper GI screening examination. Dig Endosc 1995;7:155-9.
16. Campo R, Montserrat A, Brullet E. Transnasal gastroscopy compared to conventional gastroscopy: a randomized study of feasibility, safety, and tolerance. Endoscopy 1998;30:448-52.
17. Dean R, Dua K, Massey B, Berger W, Hogan WJ, Shaker R. A comparative study of unsedated transnasal esophagogastroduodenoscopy and conventional EGD. Gastrointest Endosc 1996;44:422-4.
18. Banks MR, Kumar PJ, Mulcahy HE. Pulse oximetry saturation levels during routine unsedated diagnostic upper gastrointestinal endoscopy. Scand J Gastroenterol 2001;36:105-9.
19. Bampton PA, Reid DP, Johnson RD, Fitch RJ, Dent J. A comparison of transnasal and transoral oesophagogastroduodenoscopy. J Gastroenterol Hepatol 1998;13:579-84.
20. Ladas SD, Tassios PS, Raptis SA. A simple test for predicting patients’ tolerance of upper gastrointestinal endoscopy. Endoscopy 1997;29:430.
21. Ladas SD, Raptis SA. Selection of patients for upper gastrointestinal endoscopy without sedation. The finger-throat test. Ital J Gastroenterol 1986;18:162-5.
22. Mulcahy HE, Kelly P, Banks MR, et al. Factors associated with tolerance to, and discomfort with, unsedated diagnostic gastroscopy. Scand J Gastroenterol 2001;36:1352-7.
23. Sorbi D, Gostout CJ, Henry J, Lindor KD. Unsedated small-caliber esophagogastroduodenoscopy (EGD) versus conventional EGD: a comparative study. Gastroenterology 1999;117:1301-7.
24. Rodney WM, Weber JR, Swedberg JA, et al. Esophago-gastroduodenoscopy by family physicians phase II: a national multisite study of 2,500 procedures. Fam Pract Res J 1993;13:121-31.
25. Saeian K, Townsend WF, Rochling FA, et al. Unsedated transnasal EGD: an alternative approach to conventional esophagogastroduodenoscopy for documenting Helicobacter pylori eradication. Gastrointest Endosc 1999;49(3 Pt 1):297-301.
26. Yousfi MM, El-Zimaity HM, Cole RA, Genta RM, Graham DY. Detection of Helicobacter pylori by rapid urease tests: is biopsy size a critical variable? Gastrointest Endosc 1996;43:222-4.
Continuity and quality of care in type 2 diabetes
OBJECTIVE: We investigated the relationship between continuity of care and the quality of care received by patients with type 2 diabetes mellitus.
STUDY DESIGN: We used a cross-sectional patient survey and medical record review.
POPULATION: Consecutive patients with an established diagnosis of type 2 diabetes mellitus presented to 1 of 6 clinics within the Residency Research Network of South Texas, a network of 6 family practice residencies affiliated with the University of Texas Health Science Center at San Antonio.
OUTCOMES MEASURED: Continuity was measured as the proportion of visits within the past year to the patient’s usual primary care provider. A quality of care score was computed based on the American Diabetes Association’s Provider Recognition Program criteria from data collected through medical record review and patient surveys. Each patient was awarded points based on the presence or absence of each criterion.
RESULTS: The continuity score was associated significantly with the quality of care score in the anticipated direction (r = .15, P = .04). Patients who had seen their usual providers within the past year were significantly more likely to have had an eye examination, a foot examination, 2 blood pressure measurements, and a lipid analysis.
CONCLUSIONS: Continuity of care is associated with the quality of care received by patients with type 2 diabetes mellitus. Continuity of care may influence provider and patient behaviors in ways that improve quality. Further research on how continuity contributes to improved quality is needed.
- For patients with diabetes, continuity of care is associated with the quality of care: as continuity improves, so does the quality of care.
- Patients with diabetes who report that they have seen their usual primary care provider in the past year are more likely to have received an eye examination, a foot examination, 2 blood pressure measurements, and a lipid level analysis.
Studies of the care of adult diabetic patients in the primary care setting continue to document poor adherence to current guidelines for managing diabetes.1,2 One study of quality of care among diabetic patients in outpatient primary care offices found that Medicare patients often did not achieve recommended targets for blood glucose and lipid levels or blood pressure control and that glycosylated hemoglobin levels and cholesterol were not monitored at recommended intervals.3 As Blonde and colleagues pointed out, these variations in quality have no clear rationale or basis in scientific fact.4 Therefore, other explanations must be explored.
Berwick and others pointed out that quality of health care is determined most often by systems or processes rather than by individual behavior.5 One health care process that is important to primary care is continuity of care, or the development of a sustained relationship with a provider.6 Continuity of care is associated with favorable outcomes of care,7 including recognition of behavioral problems,8 patient adherence to physicians’ advice,9 being up to date on immunizations,10 effective communication between physician and patient, and the accumulated knowledge of the physician with regard to the patient’s history.11
In a previous study of continuity among patients with type 2 diabetes mellitus, patients with regular health care providers had improved glucose control and were more likely to have had a cholesterol measurement and influenza vaccination in the preceding year.12 These findings suggest that an understanding of the relation between continuity and quality might provide useful insights into improving the care diabetic patients receive. The purpose of this study was to examine the relation between continuity of care and the quality of care received by adult patients with type 2 diabetes mellitus.
Methods
Setting
The study was conducted at 6 clinics in 5 communities across south Texas. These clinics comprise the Residency Research Network of South Texas (RRNeST) and are in San Antonio, Corpus Christi, McAllen, Harlingen, and Laredo. The 174 family physicians at these sites serve a population that is predominantly Mexican American. A more detailed description of RRNeST has been published elsewhere.13
Participants
Patients at each site were eligible for the study if they said that they had an established diagnosis of type 2 diabetes for at least 1 year. Patients were excluded if they were younger than 18 years or pregnant. To provide adequate opportunity for continuity, patients also were excluded if they had been attending the clinic for less than 1 year. We also excluded patients who were seeing residents in their first year of training because these patients had experienced a change in their primary care provider within the past year when they were reassigned to a first-year resident.
Data collection and measures
A patient survey, offered in English or Spanish, included questions on demographics and patient satisfaction with diabetes care adapted from the Physician Recognition Program Survey, as described below. It also included questions on ambulatory health care use within the past year with the use of items from the Components of Primary Care Instrument.14 Consecutive patients who met the inclusion and exclusion criteria were asked by the office staff or their physicians to complete this survey. Patients returned the survey to staff or a survey collection box, and results were kept confidential from their physicians. Patient recruitment occurred over a 6-month period from October 1998 to March 1999.
Quality of care measurement
Quality of care measures are traditionally classified into 3 domains: structure, process, and outcomes.15 Structural measures consider whether the components of the health care delivery system are accessible and of high quality. Process indicators answer the question: Was the right thing done at the right time in the right place to the right person? An outcome measure of quality considers whether health care improves or declines as a result of the care given and includes death, disability, disease, discomfort, and dissatisfaction.16
The American Diabetes Association’s Provider Recognition Program (http://www.ncqa.org/dprp[mp1]), cosponsored by the National Committee for Quality Assurance, assessed key measures that were carefully defined and tested for their relation to improved care for people with diabetes (Table 1).17 Provider Recognition Program measures are consistent with the Diabetes Quality Improvement Project measures (see www.dqip.org), but go beyond the Diabetes Quality Improvement Project by applying performance criteria to each measure. The Provider Recognition Program includes primarily process measures (was an eye examination performed in the past year?) and 2 outcome measures (glycosylated hemoglobin and diastolic blood pressure). In addition, the Provider Recognition Program includes survey measures of patient satisfaction, which many consider the fourth domain of quality.18
Individual items from the Provider Recognition Program were obtained through a medical record abstraction for each patient who returned a completed survey. The chart abstractions were completed at each site by nurses or physicians but not by the primary care physician of the patient. A standard chart abstraction form addressed each item of the Provider Recognition Program measures.
The Provider Recognition Program patient satisfaction items were administered in the patient survey portion of the data collection and combined with the medical record data. A quality score was derived for each patient by using the Provider Recognition Program established scoring criteria, as shown in Table 1.
TABLE 1
American Diabetes Association and National Committee for Quality Assurance Provider Recognition Program measures
| Measure | Frequency/patient response | Data source | Score |
|---|---|---|---|
| HbA1c | Once/year | Chart | 10.0 |
| HbA1c < 8% | 2.5 | ||
| HbA1c <10% | 2.5 | ||
| Eye examination | Once/year | Chart | 10.0 |
| Foot examination | Once/year | Chart | 10.0 |
| BP frequency | Twice/year | Chart | 10.0 |
| Diastolic 90 mm Hg | 5.0 | ||
| Urine protein/microalbumin | Once/year | Chart | 10.0 |
| Lipid profile | Once/year | Chart | 10.0 |
| Self-management education | Once/year | Survey | 10.0 |
| Nutrition counseling | Once/year | Survey | 10.0 |
| Self-monitor glucose | Yes or no | Survey | |
| Not on insulin | 1.0 | ||
| On insulin | 4.0 | ||
| Tobacco-use status and counseling if needed | Yes or no | Chart | 10.0 |
| Patient satisfaction | Excellent, very good, good, fair, or poor | Survey | |
| Overall DM care | 1.0 | ||
| Questions answered | 1.0 | ||
| Access for emergencies | 1.0 | ||
| Laboratory results explained | 1.0 | ||
| Courtesy/personal manner of provider | 1.0 | ||
| Total | 110.0 | ||
| BP, blood pressure; DM, diabetes mellitus; Hb, hemoglobin. | |||
Continuity measurement
Patients were asked to record the number of ambulatory physician visits to their usual provider, to another provider in the same office, or to any physicians outside of the usual provider’s office for the past 12 months. These items were adapted from the Components of Primary Care Instrument, a validated instrument for measuring the various components of primary care, including continuity.14 The responses to these questions were used to calculate a visit-based continuity of care score, the Usual Provider Continuity score. This score is calculated by dividing the number of visits to the usual provider by the total number of ambulatory visits. The continuity score ranged from 0 to 1, with a higher value representing a higher level of continuity. The Usual Provider Continuity score has been used in previous studies of continuity.19,20
Analysis
A t-test compared the quality of care mean scores between those who had and those who had not seen their usual physician in the past year. A Pearson bivariate correlation assessed the relationship between the Usual Provider Continuity score and the quality of care score. A chi-square test with odds ratios to determine the strength of the relationship evaluated the association between seeing one’s usual physician in the past year and each quality of care indicator. A 2-level regression model determined the relationship between the Usual Provider Continuity score and the quality of care score. In the first level of the model, we entered age, education, sex, total number of clinic visits, and self-rated health status. To adjust for clinic level effects on quality, a dummy variable was created for each clinic site in the first level of the regression model, with the San Antonio Family Health Center set as the default value. We entered the continuity score in the second level of the model to assess its relationship to quality of care, after adjusting for the above variables.
Results
A total of 397 patients completed surveys between November 1999 and April 2000. Each site returned an average of 66 surveys, with a range of 9 to 121. There were 76 physicians represented by these 397 patients, for an average of 5.22 patients per physician. At 1 site, only 9 surveys were returned due to a lack of adequate clinic staffing. Earlier patient surveys conducted within this network demonstrated a refusal rate of less than 20%. The mean number of physicians participating at each site was 18.3, with a range of 2 to 30; 35.6% of physicians were faculty (range by site, 0% to 100%).
Patient demographics are shown in Table 2 and are compared with the characteristics of the general adult patient population from a previous study (Sandra K. Burge, PhD, oral communication, December 2001). Most subjects were Hispanic, female, and married. Half of the sample had less than a high school education, and 36% had no health insurance. The mean Continuity and Quality of Care scores are also shown in Table 2. There were no significant differences in continuity scores across clinic sites, but 2 sites had significantly higher Quality of Care scores.
The first set of analyses compared quality of care between those who had (90.1%) and those who had not (9.9%) seen their usual providers in the past year. The overall quality of care score was significantly higher for patients who reported that they had seen their usual providers in the past year (73.0 vs 67.1, P = .038). The association between patients having seen their usual providers in the past year and each quality indicator is shown in Table 3. Patients who had seen their usual providers were significantly more likely to have had an eye examination, a foot examination, 2 blood pressure measurements, and a lipid analysis in the past year.
The second set of analyses examined the relation between the continuity or Usual Provider Continuity score and quality of care. A total of 214 subjects had complete chart and survey data that allowed for calculation of Continuity and quality of care scores. The overall quality of care score was associated significantly with the Usual Provider Continuity score in the hypothesized direction (r = .148, P = .03). As continuity improved, so did quality of care. In the 2-level multiple regression model, after adjusting for age, sex, education, total number of clinic visits, self-rated general health status, and clinic site, the relations between the Usual Provider Continuity score and the quality of care score remained significant (P = .03; Table 4). Total number of visits was not associated with the quality of care score.
TABLE 2
Characteristics of sample
| Characteristic | Diabetic subjects | Adult clinic population |
|---|---|---|
| Mean (SD) age, y | 56.15 (12.34) | 41.4 |
| % Female | 68.2 | 74 |
| % Hispanic | 80.5 | 80 |
| % Preferred Spanish survey | 19.2 | 19 |
| % Married | 54.1 | 57.0 |
| % Subjects with less than high school education | 49.8 | 29 |
| % Subjects without health insurance | 36.6 | 31 |
| Mean (SD) Usual Provider Continuity score | 0.72 (0.31) | NA |
| Mean (SD) total visits | 7.75 (6.32) | NA |
| Mean (SD) quality of care score | 72.3 (14.3) | NA |
| NA, not available; SD, standard deviation. | ||
TABLE 3
Association between individual quality indicators and a visit to usual provider in past year
| OR (CI) | |
|---|---|
| HbA1c in past year? | 1.76 (0.81–3.84) |
| Eye examination in past year? | 1.99 (1.01–4.04)* |
| Foot examination in past year? | 2.62 (1.27–5.41)* |
| Blood pressure reading twice in past year? | 2.51 (1.07–5.94)* |
| Lipid test in past year? | 4.11 (2.02–8.38)* |
| Urine protein in past year? | 1.52 (0.76–3.05) |
| Self-management education in past year? | 1.60 (0.75–3.43) |
| Diet education in past year? | 1.04 (0.45–2.37) |
| Self-monitoring of glucose? | 1.15 (0.52–2.56) |
| Tobacco status and counseling? | 0.97 (0.38–2.46) |
| Very satisfied with | |
| Diabetes care overall? | 1.23 (0.54–2.81) |
| Diabetes questions answered? | 1.32 (0.61–2.84) |
| Access during emergencies? | 1.58 (0.69–3.61) |
| Explanation of laboratory results? | 1.4 (0.55–3.90) |
| Courtesy/personal manner of provider? | 1.46 (0.72–2.97) |
| *P < .05. | |
| CI, 95% confidence interval; Hb, hemoglobin; OR, odds ratio. | |
TABLE 4
Regression model: continuity score and quality of care
| Variable | Standardized beta | t | P |
|---|---|---|---|
| Age | .13 | 1.63 | .10 |
| Sex | .02 | .21 | .83 |
| Education level | .11 | 1.37 | .17 |
| General health status | -.01 | -.06 | .95 |
| Site A | .04 | .52 | .60 |
| Site B | .20 | 2.25 | .02 |
| Site C | .18 | 2.01 | .05 |
| Site D | .03 | .38 | .71 |
| Site E | -.02 | -.20 | .84 |
| Total visits | .08 | 1.05 | .30 |
| Continuity score | .17 | 2.24 | .03 |
Discussion
Patients who reported that they saw their regular providers in the past year had higher Quality of Care scores. Further, continuity of care received by diabetic patients was directly related to their overall quality of care. In a closer examination of the quality indicators, patients who reported that they had seen their usual providers within the past year were more likely to have received an eye examination, a foot examination, 2 blood pressure measurements, and a lipid analysis.
Why should continuity be associated with quality of care? Flocke and colleagues found that continuity was associated with accumulated knowledge of the patient by the physician as well as the coordination of care.14 These processes of care may have contributed to higher quality of care for patients with type 2 diabetes. The usual provider recognized the need for eye examinations and lipid measurements and coordinated these referrals. In another study, continuity was significantly related to patient adherence to advice about behavioral risk factors.10 In a similar fashion, continuity may have encouraged patient adherence to recommended screening tests such as referrals for eye examinations or returning for a fasting lipid measurement.
The lack of a relationship between the patients’ reports of seeing their usual providers within the past year and the other quality of care indicators is also of interest. Systems may have been established in those clinics to ensure delivery of those services regardless of whether or not patients are seen by their usual providers. For example, referral for diet education and self-monitoring of blood glucose may have been delegated to clinic staff. Some indicators, such as glycosylated hemoglobin, may be implemented at such high levels and with such low variability that there is not enough variation in the measure to detect any relation to continuity. Approximately 95% of our sample had a glycosylated hemoglobin measured within the past year on chart review.
Although the relationship between continuity and quality of care was significant, it was also fairly weak (r = .148). Other barriers may have been more important than continuity in determining the quality of care provided to patients with type 2 diabetes. For example, to improve quality of care, clinicians must keep track of multiple indicators over long periods. Many current medical record systems offer inadequate support for this function. Because this structure may vary by clinic, we included clinic sites as dummy variables in the multiple regression model. Even after adjusting for clinic site, continuity was significantly associated with quality. However, 2 clinic sites had significantly higher mean quality of care scores than did the other sites. Upon closer examination, 1 clinic site had an electronic medical record with prompts for preventive services.
Several limitations to this study must be mentioned. Recall bias is a possibility; the continuity data were based on patient recall of physician office visits over a 12-month period. This is a nonrandom sample; we enrolled a consecutive sample of consenting patients from the clinic population. Thus, this sample may have been heavily weighted with frequent attenders. Patients who were visually impaired, had low literacy skills, or had very poor health status may have declined participation in the study. We were able to collect only performance data from the primary care providers’ charts. If a patient had a blood pressure measurement or a glycosylated hemoglobin measurement recorded at another physician’s office, then the primary care chart might not be adequate to document the overall quality of care received by the patient over the past 12 months. Another limitation is the predominant use of process indicators rather than outcome indicators, such as quality of life, morbidity, or mortality, as measures of quality of care.
The cross-sectional design of the study and the limitations of data collected create the possibility that an unmeasured confounder caused the relation between continuity and quality. It is possible that patients who were more aggressive about seeking care from their usual providers were also more likely to keep appointments for eye and foot examinations. It is also possible that patients who did not see their usual providers sought care only for acute illnesses and were willing to see any available provider. If so, the competing demands of patient care during the acute care visit may have prevented the provider from obtaining the necessary laboratory tests or referrals needed to improve the quality of diabetes care.21 The setting of the study, ie, residency clinics, might have limited the generalizability of these findings to other community family physician practices. With the help of their supervising physicians, residents might have overcome competing demands of practice to attend to preventive measures, leading us to underestimate the strength of the relation between continuity and quality.
Current changes in the financing and organization of health care create significant threats to a sustained relationship between a provider and a patient.22 In a recent report from the Community Tracking Survey, 1 of 6 consumers changed insurance plans in a 1-year period. Of those, 23% also changed their usual source of care.23 Understanding how the physician–patient relationship might influence quality of care and patient outcomes may facilitate successful organizational interventions within a health care delivery system. If continuity promotes improvements in quality of care, as suggested by the results of this study, policies that promote continuity should be considered in an effort to improve the overall quality of care delivered to adult patients with diabetes.
1. Peters AL, Legorreta AP, Ossorio RC, Davidson MB. Quality of out-patient care provided to diabetic patients. Diabetes Care 1996;19:601-6.
2. Ho M, Marger M, Beart J, et al. Is the quality of diabetes care better in a diabetes clinic or a general medicine clinic? Diabetes Care 1997;20:472-5.
3. Kell SH, Drass J, Barker BR, et al. Measures of disease control in Medicare beneficiaries with diabetes mellitus. J Am Geriatr Soc 1999;47:417-22.
4. Blonde L, Dey J, Testa MA, Guthrie D. Defining and measuring quality of diabetes care. Prim Care 1999;26:841-55.
5. Berwick DM. Continuous improvement as an ideal in health care. N Engl J Med 1989;320:53-6.
6. Starfield BH, Simborg DW, Horn SD, Yourtree SA. Continuity and coordination in primary care: their achievement and utility. Med Care 1976;14:625-36.
7. Dietrich AJ, Marton KI. Does continuous care from a physician make a difference? J Fam Pract 1982;15:929-37.
8. Becker M, Drachman R, Kirscht J. Continuity of pediatrician: new support for an old shibboleth. J Pediatr 1974;84:599-605.
9. Safran DG, Taira DA, Rogers WH, et al. Linking primary care performance to outcomes of care. J Fam Pract 1998;47:213-20.
10. Flocke SA, Stange KC, Zyzanski SJ. The association of the attributes of primary care with the delivery of clinical preventive services. Med Care 1998;36:AS21-30.
11. Safran DG, Kosinski M, Tarlov AR, et al. The primary care assessment survey: tests of data quality and measurement performance. Med Care 1998;36:728-38.
12. O’Conner PJ, Desai J, Rush WA, et al. Is having a regular provider of diabetes care related to the intensity of care and glycemic control? J Fam Pract 1998;47:290-7.
13. Albright TL, Parchman M, Burge SK. Predictors of self-care behavior in adults with type 2 diabetes: an RRNeST study. Fam Med 2001;33:354-60.
14. Flocke SA. Measuring the attributes of primary care: development of a new instrument. J Fam Pract 1997;45:64-74.
15. Donabedian A. Explorations in Quality Assessment and Montoring. Vol 1. The Definition of Quality and Approaches to Its Assessment. Ann Arbor, MI: Health Administration Press; 1980.
16. Lohr KN. Outcome measurement: concepts and questions Inquiry 1988;25:37-50.
17. American Diabetes Association. Standards of medical care for patients with diabetes mellitus. Diabetes Care 1997;20(suppl 1):S5-13.
18. Brooks RH, BcGlynn EA, Cleary P. Measuring Quality of Care. N Engl J Med 1996;335:966-70.
19. Starfield B. Primary Care: Concept, Evaluation and Policy. New York: Oxford University Press; 1992.
20. Mainous AG, Gill JM. The importance of continuity of care in the likelihood of future hospitalization: is site of care equivalent to a primary clinician? Am J Public Health 1998;88:1539-41.
21. Jaen CR, Stange KC, Nutting PA. Competing demands of primary care: a model for the delivery of clinical preventive services. J Fam Pract 1994;38:166-71.
22. Emmanuel EJ, Dubler NN. Preserving the physician-patient relationship in the era of managed care. JAMA 1995;273:323-9.
23. Cunningham PJ, Kohn LT. Who is likely to switch health plans? Data Bulletin Number 18. Washington, DC: Center for Studying Health System Change; July 2000. Available at: http://www.hschange.com/CONTENT/263/.
OBJECTIVE: We investigated the relationship between continuity of care and the quality of care received by patients with type 2 diabetes mellitus.
STUDY DESIGN: We used a cross-sectional patient survey and medical record review.
POPULATION: Consecutive patients with an established diagnosis of type 2 diabetes mellitus presented to 1 of 6 clinics within the Residency Research Network of South Texas, a network of 6 family practice residencies affiliated with the University of Texas Health Science Center at San Antonio.
OUTCOMES MEASURED: Continuity was measured as the proportion of visits within the past year to the patient’s usual primary care provider. A quality of care score was computed based on the American Diabetes Association’s Provider Recognition Program criteria from data collected through medical record review and patient surveys. Each patient was awarded points based on the presence or absence of each criterion.
RESULTS: The continuity score was associated significantly with the quality of care score in the anticipated direction (r = .15, P = .04). Patients who had seen their usual providers within the past year were significantly more likely to have had an eye examination, a foot examination, 2 blood pressure measurements, and a lipid analysis.
CONCLUSIONS: Continuity of care is associated with the quality of care received by patients with type 2 diabetes mellitus. Continuity of care may influence provider and patient behaviors in ways that improve quality. Further research on how continuity contributes to improved quality is needed.
- For patients with diabetes, continuity of care is associated with the quality of care: as continuity improves, so does the quality of care.
- Patients with diabetes who report that they have seen their usual primary care provider in the past year are more likely to have received an eye examination, a foot examination, 2 blood pressure measurements, and a lipid level analysis.
Studies of the care of adult diabetic patients in the primary care setting continue to document poor adherence to current guidelines for managing diabetes.1,2 One study of quality of care among diabetic patients in outpatient primary care offices found that Medicare patients often did not achieve recommended targets for blood glucose and lipid levels or blood pressure control and that glycosylated hemoglobin levels and cholesterol were not monitored at recommended intervals.3 As Blonde and colleagues pointed out, these variations in quality have no clear rationale or basis in scientific fact.4 Therefore, other explanations must be explored.
Berwick and others pointed out that quality of health care is determined most often by systems or processes rather than by individual behavior.5 One health care process that is important to primary care is continuity of care, or the development of a sustained relationship with a provider.6 Continuity of care is associated with favorable outcomes of care,7 including recognition of behavioral problems,8 patient adherence to physicians’ advice,9 being up to date on immunizations,10 effective communication between physician and patient, and the accumulated knowledge of the physician with regard to the patient’s history.11
In a previous study of continuity among patients with type 2 diabetes mellitus, patients with regular health care providers had improved glucose control and were more likely to have had a cholesterol measurement and influenza vaccination in the preceding year.12 These findings suggest that an understanding of the relation between continuity and quality might provide useful insights into improving the care diabetic patients receive. The purpose of this study was to examine the relation between continuity of care and the quality of care received by adult patients with type 2 diabetes mellitus.
Methods
Setting
The study was conducted at 6 clinics in 5 communities across south Texas. These clinics comprise the Residency Research Network of South Texas (RRNeST) and are in San Antonio, Corpus Christi, McAllen, Harlingen, and Laredo. The 174 family physicians at these sites serve a population that is predominantly Mexican American. A more detailed description of RRNeST has been published elsewhere.13
Participants
Patients at each site were eligible for the study if they said that they had an established diagnosis of type 2 diabetes for at least 1 year. Patients were excluded if they were younger than 18 years or pregnant. To provide adequate opportunity for continuity, patients also were excluded if they had been attending the clinic for less than 1 year. We also excluded patients who were seeing residents in their first year of training because these patients had experienced a change in their primary care provider within the past year when they were reassigned to a first-year resident.
Data collection and measures
A patient survey, offered in English or Spanish, included questions on demographics and patient satisfaction with diabetes care adapted from the Physician Recognition Program Survey, as described below. It also included questions on ambulatory health care use within the past year with the use of items from the Components of Primary Care Instrument.14 Consecutive patients who met the inclusion and exclusion criteria were asked by the office staff or their physicians to complete this survey. Patients returned the survey to staff or a survey collection box, and results were kept confidential from their physicians. Patient recruitment occurred over a 6-month period from October 1998 to March 1999.
Quality of care measurement
Quality of care measures are traditionally classified into 3 domains: structure, process, and outcomes.15 Structural measures consider whether the components of the health care delivery system are accessible and of high quality. Process indicators answer the question: Was the right thing done at the right time in the right place to the right person? An outcome measure of quality considers whether health care improves or declines as a result of the care given and includes death, disability, disease, discomfort, and dissatisfaction.16
The American Diabetes Association’s Provider Recognition Program (http://www.ncqa.org/dprp[mp1]), cosponsored by the National Committee for Quality Assurance, assessed key measures that were carefully defined and tested for their relation to improved care for people with diabetes (Table 1).17 Provider Recognition Program measures are consistent with the Diabetes Quality Improvement Project measures (see www.dqip.org), but go beyond the Diabetes Quality Improvement Project by applying performance criteria to each measure. The Provider Recognition Program includes primarily process measures (was an eye examination performed in the past year?) and 2 outcome measures (glycosylated hemoglobin and diastolic blood pressure). In addition, the Provider Recognition Program includes survey measures of patient satisfaction, which many consider the fourth domain of quality.18
Individual items from the Provider Recognition Program were obtained through a medical record abstraction for each patient who returned a completed survey. The chart abstractions were completed at each site by nurses or physicians but not by the primary care physician of the patient. A standard chart abstraction form addressed each item of the Provider Recognition Program measures.
The Provider Recognition Program patient satisfaction items were administered in the patient survey portion of the data collection and combined with the medical record data. A quality score was derived for each patient by using the Provider Recognition Program established scoring criteria, as shown in Table 1.
TABLE 1
American Diabetes Association and National Committee for Quality Assurance Provider Recognition Program measures
| Measure | Frequency/patient response | Data source | Score |
|---|---|---|---|
| HbA1c | Once/year | Chart | 10.0 |
| HbA1c < 8% | 2.5 | ||
| HbA1c <10% | 2.5 | ||
| Eye examination | Once/year | Chart | 10.0 |
| Foot examination | Once/year | Chart | 10.0 |
| BP frequency | Twice/year | Chart | 10.0 |
| Diastolic 90 mm Hg | 5.0 | ||
| Urine protein/microalbumin | Once/year | Chart | 10.0 |
| Lipid profile | Once/year | Chart | 10.0 |
| Self-management education | Once/year | Survey | 10.0 |
| Nutrition counseling | Once/year | Survey | 10.0 |
| Self-monitor glucose | Yes or no | Survey | |
| Not on insulin | 1.0 | ||
| On insulin | 4.0 | ||
| Tobacco-use status and counseling if needed | Yes or no | Chart | 10.0 |
| Patient satisfaction | Excellent, very good, good, fair, or poor | Survey | |
| Overall DM care | 1.0 | ||
| Questions answered | 1.0 | ||
| Access for emergencies | 1.0 | ||
| Laboratory results explained | 1.0 | ||
| Courtesy/personal manner of provider | 1.0 | ||
| Total | 110.0 | ||
| BP, blood pressure; DM, diabetes mellitus; Hb, hemoglobin. | |||
Continuity measurement
Patients were asked to record the number of ambulatory physician visits to their usual provider, to another provider in the same office, or to any physicians outside of the usual provider’s office for the past 12 months. These items were adapted from the Components of Primary Care Instrument, a validated instrument for measuring the various components of primary care, including continuity.14 The responses to these questions were used to calculate a visit-based continuity of care score, the Usual Provider Continuity score. This score is calculated by dividing the number of visits to the usual provider by the total number of ambulatory visits. The continuity score ranged from 0 to 1, with a higher value representing a higher level of continuity. The Usual Provider Continuity score has been used in previous studies of continuity.19,20
Analysis
A t-test compared the quality of care mean scores between those who had and those who had not seen their usual physician in the past year. A Pearson bivariate correlation assessed the relationship between the Usual Provider Continuity score and the quality of care score. A chi-square test with odds ratios to determine the strength of the relationship evaluated the association between seeing one’s usual physician in the past year and each quality of care indicator. A 2-level regression model determined the relationship between the Usual Provider Continuity score and the quality of care score. In the first level of the model, we entered age, education, sex, total number of clinic visits, and self-rated health status. To adjust for clinic level effects on quality, a dummy variable was created for each clinic site in the first level of the regression model, with the San Antonio Family Health Center set as the default value. We entered the continuity score in the second level of the model to assess its relationship to quality of care, after adjusting for the above variables.
Results
A total of 397 patients completed surveys between November 1999 and April 2000. Each site returned an average of 66 surveys, with a range of 9 to 121. There were 76 physicians represented by these 397 patients, for an average of 5.22 patients per physician. At 1 site, only 9 surveys were returned due to a lack of adequate clinic staffing. Earlier patient surveys conducted within this network demonstrated a refusal rate of less than 20%. The mean number of physicians participating at each site was 18.3, with a range of 2 to 30; 35.6% of physicians were faculty (range by site, 0% to 100%).
Patient demographics are shown in Table 2 and are compared with the characteristics of the general adult patient population from a previous study (Sandra K. Burge, PhD, oral communication, December 2001). Most subjects were Hispanic, female, and married. Half of the sample had less than a high school education, and 36% had no health insurance. The mean Continuity and Quality of Care scores are also shown in Table 2. There were no significant differences in continuity scores across clinic sites, but 2 sites had significantly higher Quality of Care scores.
The first set of analyses compared quality of care between those who had (90.1%) and those who had not (9.9%) seen their usual providers in the past year. The overall quality of care score was significantly higher for patients who reported that they had seen their usual providers in the past year (73.0 vs 67.1, P = .038). The association between patients having seen their usual providers in the past year and each quality indicator is shown in Table 3. Patients who had seen their usual providers were significantly more likely to have had an eye examination, a foot examination, 2 blood pressure measurements, and a lipid analysis in the past year.
The second set of analyses examined the relation between the continuity or Usual Provider Continuity score and quality of care. A total of 214 subjects had complete chart and survey data that allowed for calculation of Continuity and quality of care scores. The overall quality of care score was associated significantly with the Usual Provider Continuity score in the hypothesized direction (r = .148, P = .03). As continuity improved, so did quality of care. In the 2-level multiple regression model, after adjusting for age, sex, education, total number of clinic visits, self-rated general health status, and clinic site, the relations between the Usual Provider Continuity score and the quality of care score remained significant (P = .03; Table 4). Total number of visits was not associated with the quality of care score.
TABLE 2
Characteristics of sample
| Characteristic | Diabetic subjects | Adult clinic population |
|---|---|---|
| Mean (SD) age, y | 56.15 (12.34) | 41.4 |
| % Female | 68.2 | 74 |
| % Hispanic | 80.5 | 80 |
| % Preferred Spanish survey | 19.2 | 19 |
| % Married | 54.1 | 57.0 |
| % Subjects with less than high school education | 49.8 | 29 |
| % Subjects without health insurance | 36.6 | 31 |
| Mean (SD) Usual Provider Continuity score | 0.72 (0.31) | NA |
| Mean (SD) total visits | 7.75 (6.32) | NA |
| Mean (SD) quality of care score | 72.3 (14.3) | NA |
| NA, not available; SD, standard deviation. | ||
TABLE 3
Association between individual quality indicators and a visit to usual provider in past year
| OR (CI) | |
|---|---|
| HbA1c in past year? | 1.76 (0.81–3.84) |
| Eye examination in past year? | 1.99 (1.01–4.04)* |
| Foot examination in past year? | 2.62 (1.27–5.41)* |
| Blood pressure reading twice in past year? | 2.51 (1.07–5.94)* |
| Lipid test in past year? | 4.11 (2.02–8.38)* |
| Urine protein in past year? | 1.52 (0.76–3.05) |
| Self-management education in past year? | 1.60 (0.75–3.43) |
| Diet education in past year? | 1.04 (0.45–2.37) |
| Self-monitoring of glucose? | 1.15 (0.52–2.56) |
| Tobacco status and counseling? | 0.97 (0.38–2.46) |
| Very satisfied with | |
| Diabetes care overall? | 1.23 (0.54–2.81) |
| Diabetes questions answered? | 1.32 (0.61–2.84) |
| Access during emergencies? | 1.58 (0.69–3.61) |
| Explanation of laboratory results? | 1.4 (0.55–3.90) |
| Courtesy/personal manner of provider? | 1.46 (0.72–2.97) |
| *P < .05. | |
| CI, 95% confidence interval; Hb, hemoglobin; OR, odds ratio. | |
TABLE 4
Regression model: continuity score and quality of care
| Variable | Standardized beta | t | P |
|---|---|---|---|
| Age | .13 | 1.63 | .10 |
| Sex | .02 | .21 | .83 |
| Education level | .11 | 1.37 | .17 |
| General health status | -.01 | -.06 | .95 |
| Site A | .04 | .52 | .60 |
| Site B | .20 | 2.25 | .02 |
| Site C | .18 | 2.01 | .05 |
| Site D | .03 | .38 | .71 |
| Site E | -.02 | -.20 | .84 |
| Total visits | .08 | 1.05 | .30 |
| Continuity score | .17 | 2.24 | .03 |
Discussion
Patients who reported that they saw their regular providers in the past year had higher Quality of Care scores. Further, continuity of care received by diabetic patients was directly related to their overall quality of care. In a closer examination of the quality indicators, patients who reported that they had seen their usual providers within the past year were more likely to have received an eye examination, a foot examination, 2 blood pressure measurements, and a lipid analysis.
Why should continuity be associated with quality of care? Flocke and colleagues found that continuity was associated with accumulated knowledge of the patient by the physician as well as the coordination of care.14 These processes of care may have contributed to higher quality of care for patients with type 2 diabetes. The usual provider recognized the need for eye examinations and lipid measurements and coordinated these referrals. In another study, continuity was significantly related to patient adherence to advice about behavioral risk factors.10 In a similar fashion, continuity may have encouraged patient adherence to recommended screening tests such as referrals for eye examinations or returning for a fasting lipid measurement.
The lack of a relationship between the patients’ reports of seeing their usual providers within the past year and the other quality of care indicators is also of interest. Systems may have been established in those clinics to ensure delivery of those services regardless of whether or not patients are seen by their usual providers. For example, referral for diet education and self-monitoring of blood glucose may have been delegated to clinic staff. Some indicators, such as glycosylated hemoglobin, may be implemented at such high levels and with such low variability that there is not enough variation in the measure to detect any relation to continuity. Approximately 95% of our sample had a glycosylated hemoglobin measured within the past year on chart review.
Although the relationship between continuity and quality of care was significant, it was also fairly weak (r = .148). Other barriers may have been more important than continuity in determining the quality of care provided to patients with type 2 diabetes. For example, to improve quality of care, clinicians must keep track of multiple indicators over long periods. Many current medical record systems offer inadequate support for this function. Because this structure may vary by clinic, we included clinic sites as dummy variables in the multiple regression model. Even after adjusting for clinic site, continuity was significantly associated with quality. However, 2 clinic sites had significantly higher mean quality of care scores than did the other sites. Upon closer examination, 1 clinic site had an electronic medical record with prompts for preventive services.
Several limitations to this study must be mentioned. Recall bias is a possibility; the continuity data were based on patient recall of physician office visits over a 12-month period. This is a nonrandom sample; we enrolled a consecutive sample of consenting patients from the clinic population. Thus, this sample may have been heavily weighted with frequent attenders. Patients who were visually impaired, had low literacy skills, or had very poor health status may have declined participation in the study. We were able to collect only performance data from the primary care providers’ charts. If a patient had a blood pressure measurement or a glycosylated hemoglobin measurement recorded at another physician’s office, then the primary care chart might not be adequate to document the overall quality of care received by the patient over the past 12 months. Another limitation is the predominant use of process indicators rather than outcome indicators, such as quality of life, morbidity, or mortality, as measures of quality of care.
The cross-sectional design of the study and the limitations of data collected create the possibility that an unmeasured confounder caused the relation between continuity and quality. It is possible that patients who were more aggressive about seeking care from their usual providers were also more likely to keep appointments for eye and foot examinations. It is also possible that patients who did not see their usual providers sought care only for acute illnesses and were willing to see any available provider. If so, the competing demands of patient care during the acute care visit may have prevented the provider from obtaining the necessary laboratory tests or referrals needed to improve the quality of diabetes care.21 The setting of the study, ie, residency clinics, might have limited the generalizability of these findings to other community family physician practices. With the help of their supervising physicians, residents might have overcome competing demands of practice to attend to preventive measures, leading us to underestimate the strength of the relation between continuity and quality.
Current changes in the financing and organization of health care create significant threats to a sustained relationship between a provider and a patient.22 In a recent report from the Community Tracking Survey, 1 of 6 consumers changed insurance plans in a 1-year period. Of those, 23% also changed their usual source of care.23 Understanding how the physician–patient relationship might influence quality of care and patient outcomes may facilitate successful organizational interventions within a health care delivery system. If continuity promotes improvements in quality of care, as suggested by the results of this study, policies that promote continuity should be considered in an effort to improve the overall quality of care delivered to adult patients with diabetes.
1. Peters AL, Legorreta AP, Ossorio RC, Davidson MB. Quality of out-patient care provided to diabetic patients. Diabetes Care 1996;19:601-6.
2. Ho M, Marger M, Beart J, et al. Is the quality of diabetes care better in a diabetes clinic or a general medicine clinic? Diabetes Care 1997;20:472-5.
3. Kell SH, Drass J, Barker BR, et al. Measures of disease control in Medicare beneficiaries with diabetes mellitus. J Am Geriatr Soc 1999;47:417-22.
4. Blonde L, Dey J, Testa MA, Guthrie D. Defining and measuring quality of diabetes care. Prim Care 1999;26:841-55.
5. Berwick DM. Continuous improvement as an ideal in health care. N Engl J Med 1989;320:53-6.
6. Starfield BH, Simborg DW, Horn SD, Yourtree SA. Continuity and coordination in primary care: their achievement and utility. Med Care 1976;14:625-36.
7. Dietrich AJ, Marton KI. Does continuous care from a physician make a difference? J Fam Pract 1982;15:929-37.
8. Becker M, Drachman R, Kirscht J. Continuity of pediatrician: new support for an old shibboleth. J Pediatr 1974;84:599-605.
9. Safran DG, Taira DA, Rogers WH, et al. Linking primary care performance to outcomes of care. J Fam Pract 1998;47:213-20.
10. Flocke SA, Stange KC, Zyzanski SJ. The association of the attributes of primary care with the delivery of clinical preventive services. Med Care 1998;36:AS21-30.
11. Safran DG, Kosinski M, Tarlov AR, et al. The primary care assessment survey: tests of data quality and measurement performance. Med Care 1998;36:728-38.
12. O’Conner PJ, Desai J, Rush WA, et al. Is having a regular provider of diabetes care related to the intensity of care and glycemic control? J Fam Pract 1998;47:290-7.
13. Albright TL, Parchman M, Burge SK. Predictors of self-care behavior in adults with type 2 diabetes: an RRNeST study. Fam Med 2001;33:354-60.
14. Flocke SA. Measuring the attributes of primary care: development of a new instrument. J Fam Pract 1997;45:64-74.
15. Donabedian A. Explorations in Quality Assessment and Montoring. Vol 1. The Definition of Quality and Approaches to Its Assessment. Ann Arbor, MI: Health Administration Press; 1980.
16. Lohr KN. Outcome measurement: concepts and questions Inquiry 1988;25:37-50.
17. American Diabetes Association. Standards of medical care for patients with diabetes mellitus. Diabetes Care 1997;20(suppl 1):S5-13.
18. Brooks RH, BcGlynn EA, Cleary P. Measuring Quality of Care. N Engl J Med 1996;335:966-70.
19. Starfield B. Primary Care: Concept, Evaluation and Policy. New York: Oxford University Press; 1992.
20. Mainous AG, Gill JM. The importance of continuity of care in the likelihood of future hospitalization: is site of care equivalent to a primary clinician? Am J Public Health 1998;88:1539-41.
21. Jaen CR, Stange KC, Nutting PA. Competing demands of primary care: a model for the delivery of clinical preventive services. J Fam Pract 1994;38:166-71.
22. Emmanuel EJ, Dubler NN. Preserving the physician-patient relationship in the era of managed care. JAMA 1995;273:323-9.
23. Cunningham PJ, Kohn LT. Who is likely to switch health plans? Data Bulletin Number 18. Washington, DC: Center for Studying Health System Change; July 2000. Available at: http://www.hschange.com/CONTENT/263/.
Reading level of privacy policies on Internet health Web sites
OBJECTIVE: Most individuals would like to maintain the privacy of their medical information on the World Wide Web (WWW). In response, commercial interests and other sites post privacy policies that are designed to inform users of how their information will be used. However, it is not known if these statements are comprehensible to most WWW users. The purpose of this study was to determine the reading level of privacy statements on Internet health Web sites and to determine whether these statements can inform users of their rights.
STUDY DESIGN: This was a descriptive study. Eighty Internet health sites were examined and the readability of their privacy policies was determined. The selected sample included the top 25 Internet health sites as well as other sites that a user might encounter while researching a common problem such as high blood pressure. Sixty percent of the sites were commercial (.com), 17.5% were organizations (.org), 8.8% were from the United Kingdom (.uk), 3.8% were United States governmental (.gov), and 2.5% were educational (.edu).
OUTCOMES MEASURED: The readability level of the privacy policies was calculated using the Flesch, the Fry, and the SMOG readability levels.
RESULTS: Of the 80 Internet health Web sites studied, 30% (including 23% of the commercial Web sites) had no privacy policy posted. The average readability level of the remaining sites required 2 years of college level education to comprehend, and no Web site had a privacy policy that was comprehensible by most English-speaking individuals in the United States.
CONCLUSIONS: The privacy policies of health Web sites are not easily understood by most individuals in the United States and do not serve to inform users of their rights. Possible remedies include rewriting policies to make them comprehensible and protecting online health information by using legal statutes or standardized insignias indicating compliance with a set of privacy standards (eg, “Health on the Net” [HON] http://www.hon.ch).
Approximately 33 million individuals in the United States have used the Internet to access medical information.1,2 Even though most people would like to maintain the privacy of their medical and other information,3-6 few users of the Internet take steps to do so.7 Commercial vendors develop profiles of individual users of the Internet. The information tracked includes Web sites visited; terms entered into search engines (including medical terms); goods or services bought online; and participation in forums, chat rooms, and e-mail lists (eg, listservs). The text of any postings in forums and email lists can also be tracked. This information is sold to anyone willing to pay for it, including advertisers, employers, and insurance companies. Commercial vendors use this information to offer goods and services targeted to a user’s needs, including medical needs. For example, an individual who visits Web sites dedicated to the care of diabetes mellitus will receive advertising about new diabetes medications and glucose monitoring devices. However, the information can and has been used in other ways, leading to job termination and arrest.8 A user who repeatedly visits a breast-cancer-related Web site, for example, could be discriminated against by a potential employer or insurance company because she is suspected of being afflicted with the disease.
Unauthorized access to an individual’s personal information also occurs. Doubleclick.com, a corporation that collects user information, has had several high-profile breaches of computer security, leaving individuals’ information vulnerable to exploitation.9
The importance of the confidentiality of medical information has been underscored by the recent publication of the new “Standards for Privacy of Individually Identifiable Health Information” by the Department of Health and Human Services.10 In part, these guidelines are designed to “protect the privacy of individually identifiable health information.”10 Although Internet use does not generate a formal medical record, online profiling allows the collection of detailed medical information about a user’s diagnoses, medications, etc, which essentially creates “individually identifiable health information” when associated with their names.
One proposed solution to maintaining Internet privacy has been the voluntary posting of privacy statements. These statements serve to inform users of the privacy policies of the Web site, such as what user information is collected and with whom this information will be shared. Three recent studies have shown that the readability level of much of the patient information on the Internet is beyond the comprehension of many individuals in the United States.11-13 For voluntary privacy statements to be useful, they need to be written at a level understood by most individuals using the Internet. The purpose of this study was to determine the readability level of privacy statements on Internet health Web sites.
Methods
A total of 80 Internet health Web sites were examined in May 2001 to see if they included privacy policies. To emulate the way a consumer might find information on the Internet, 55 of the sites were selected by entering search terms for common conditions into a widely used Internet search engine (http://www.google.com). The terms searched for were “high blood pressure,” “fever,” “cough,” and “wellness.” The other 25 Web sites analyzed represent the most commonly visited health information Web sites on the Internet.10 For Web sites identified by Google, the Web pages represented by the top 10 results for each term were viewed, and any links on those pages were followed until 55 health information Web sites were identified. We did not limit the Web sites to only those identified by the search engines because in many cases, users will follow the links on a page identified by the search engine. Links that led to medical school lectures, nonhuman diseases, online journal articles aimed at health care professionals, or the contents of e-mail or listserv summaries were omitted.
The Web sites were then examined by 1 researcher (J.J.W.) to see if they included privacy statements. This review included looking at the page that the link led to, the Web site’s homepage, any Web site policies, “about us” type of material, etc. Links to privacy foundations such as Health on the Net were considered to represent privacy statements. If a privacy statement was found, the text was copied into Microsoft Word 98 for Macintosh (Microsoft Corporation, Redmond, WA) and the documents’ Flesch Reading Ease score was generated using the built-in software in Microsoft Word 98 (Macintosh). The same privacy statements were printed and then analyzed using 2 hand-calculation methods: the Fry Readability formula and the SMOG method (simplified measure of gobbledygook).15 If a Web site was found to have no privacy statement, this was confirmed by a second researcher (M.G.). Web sites on which no privacy policy was found after 2 searches were not contacted to determine if a policy exists. It is not likely that end users would contact a site to determine the existence of a privacy policy. Thus, there would be the de facto absence of a privacy policy with respect to the end user. Ten percent of the readability levels were analyzed by a second researcher (D.M.D.) and found to have accurate coding. All data were entered into Microsoft Excel spreadsheet and analyzed using the built-in statistical formulas. We did not seek to evaluate the content of the privacy statements themselves.
Approximately 40 different readability formulas are available for use, all of which will give a reasonably accurate grade level (generally plus or minus 1 grade level with 68% confidence: an acceptable standard in the field).16 Most of these formulas rely on number of syllables in a word and sentence length to judge readability. In general, readability is easier when there are a low number of words per sentence, characters per word, and syllables per word, and a low percentage of passive sentences.16 Illustrations and tables also improve the readability. The Flesch Reading Ease score is one of the most widely used and validated systems for scoring readability. It is the standard used by the insurance industry for consumer documents and contracts.17,18 Documents scoring 70 or above are described as “easy” and are written at the grade school level. A score of 60 to 70 is described as “standard” and written at approximately at the high school level. Scores below 60 are described as “fairly difficult,” “difficult,” or “very difficult” as the score decreases.19 The Fry formula is a hand-calculation method that is recommended by experts in the field for use with patient education materials. The SMOG is another hand-calculation method commonly used for evaluation of health information.16 Results from the Fry formula and SMOG methods are expressed as standard United States grade levels.
Results
Of the 80 health Web sites in the initial sample, 2 had recently closed down and an additional 24 (30%) (including 23% of the commercial Web sites) did not have a privacy statement. Thus, the privacy statements of 54 Web sites were analyzed using the 3 readability formulas. The Web site domains for the 80 Web sites as well as the 54 with privacy statements are shown in the Table. The average Flesch Reading Ease score of privacy statements was 39 or “difficult.” This level is similar to reading a corporate annual report. The Flesch Reading Ease score range was 24.4 to 54.2. This range is described as “very difficult” (eg, similar to reading legal contracts) to “fairly difficult” (eg, similar to reading novels such as the Henry James novel, The Ambassadors).19 The Fry formula had a readability level equal to 14.6 or 14th grade 6th month (range, 10–17). The overall SMOG readability level was 14.7 (range, 11–19).
TABLE
Domains of all Web sites examined and percentage with privacy statements
| Top level domain | All Web sites examined (n = 80) | Web sites with a privacy policy (n = 54) |
|---|---|---|
| Commercial (.com) | 48 (60%) | 37 (68.5%) |
| Organizations (.org) | 14 (17.5%) | 8 (14.8%) |
| United Kingdom (.uk) | 7 (8.8%) | 5 (9.2%) |
| Government (.gov) | 3 (3.8%) | 3 (5.6%) |
| Network (.net) | 2 (2.5%) | 0 (0.0%) |
| Educational (.edu) | 2 (2.5%) | 1 (1.8%) |
| Web site did not exist* | 2 (2.5%) | 0 (0.0%) |
| South Africa (.za) | 1 (1.2%) | 0 (0.0%) |
| Numerical (no domain listed) | 1 (1.2%) | 0 (0.0%) |
| Total | 80 (100%) | 54 (100%) |
| *Although the list of the top 25 health-related WWW sites was current, 2 of the sites had gone out of business and were no longer available. | ||
Discussion
The goal of this study was to determine the readability level of privacy statements on Internet health Web sites. Privacy statements are meant to protect the individual, a particularly important endeavor when dealing with medical information because of its potentially sensitive nature. Only 70% of the health Web sites examined in this study even contained a privacy statement. The readability levels of the privacy statements found were considered difficult and would require approximately 2 years of university training to be comprehensible. In contrast, only 60% of diabetic patients in 1 study could understand information written at the 6th grade reading level.20 Most studies find that only a minority of patients can comprehend information written at a 9th grade reading level.21-24 Overall, for 90% of adults to be able to read and comprehend written materials, the materials should be written at less than the 8th grade reading level.16 Although current Internet users may be a more educated group than the general population, this trend is changing. A recent study found that 21% of individuals with less than a high school education have Internet access, as do 43% of high school graduates.25 Because an individual’s actual reading level is usually 2 to 5 grades below the grade completed,26 many of these individuals will not be able to comprehend a Web site’s privacy policy and thus may not be protected or understand their options pertaining to protection.
Many patients are beginning to use the Internet as a source of information and many are unaware that their every move is being tracked. Physicians can help to protect patients by making them aware of this problem and suggesting that patients take steps to protect their information.
A number of possible solutions can be applied to this problem. Rewriting privacy policies to be comprehensible to most Internet users should be the initial step. Resources are available to Web site developers that help to maximize the readability of information.27-29 More widespread use of the “Health on the Net” (HON, http://www.hon.ch) privacy criteria would reassure individuals that their data are secure. Consideration should also be given to extending the same protection to medical information gleaned from the Internet by Web sites and advertising companies as is given to the formal medical record because, in effect, they can reflect the same type of information. For example, on several sites, users can enter medications they are taking and diagnoses (http://www.drkoop.com and others).
The first limitation of this study is that the Web sites studied represent a minority of the health Web sites on the Internet. However, the study set includes the top 25 visited health Web sites and did seek many different types of Web sites for evaluation. Also, none of the Web sites had a policy that was written at a level comprehensible to most of the English-speaking people in the United States. It is unlikely that including more Web sites would substantially change the outcome. Finally, given the large (and unknown) number of health Web sites on the Internet, it is not practical to obtain a large enough sample to be representative of all health Web sites.
The second problem is readability levels themselves. Readability calculations have been criticized because they depend mainly on sentence length and the number of syllables per word. If an individual is familiar with the sentence terminology, it may be possible to interpret the information correctly using context clues. However, most individuals do not have a working knowledge of legal terminology (eg, “indemnify”) and thus may not be able to use these clues to determine the meaning of a sentence.
Conclusions
Thirty percent of health Web sites do not have privacy statements, and those that are posted are beyond the reading level of most adults. For this reason, current privacy statements do not function to adequately inform users of a Web site’s privacy policy and do not protect users’ privacy rights.
1. Pew Internet and American Life Project Survey. Daily Internet activities. Available at: http://www.pewinternet.org/reports/chart.asp?img=6_daily_activities.jpg. Accessed April 10, 2001.
2. Pew Internet and American Life Project Survey. Internet activities. Available at: http://www.pewinternet.org/reports/chart.asp?img=6_internet_activities.jpg. Accessed April 10, 2001.
3. Cheng TL, Savageau JA, Sattler AL, DeWitt TG. Confidentiality in health care. A survey of knowledge, perceptions, and attitudes among high school students. JAMA 1993;269:1404-7.
4. Merz JF, Spina BJ, Sankar P. Patient consent for release of sensitive information from their medical records: an exploratory study. Behav Sci Law 1999;17:445-54.
5. Weiss BD. Confidentiality expectations of patients, physicians, and medical students. JAMA 1982;247:2695-7.
6. Fox S, Rainie L, Horrigan J, Lenhart A, Spooner T, Carter C. Trust and privacy online: why Americans want to re-write the rules. The Internet Life Report. Pew Internet and American Life Project; August 20, 2000. Available at http://www.pewinternet.org/reports/toc.asp?Report=19. Accessed April 19, 2001.
7. WebSideStory. Cookie rejection less than 1 percent on the Web According to WebSideStory. Available at: http://www.websidestory.com/cgibin/wss.cgi?corporate&news&press_2_1 24. Accessed April 19, 2001.
8. The Privacy Foundation. EEOC v. Burlington Northern Santa Fe Railroad. Available at: http://www.privacyfoundation.org/legal/case/show.asp?id=25&t=2. Accessed May 5, 2002.
9. Junk Busters. DoubleClick reaches settlement on class action suits. Available at: http://www.junkbusters.com/new.html#March. Accessed May 21, 2001.
10. Departmen of Health and Human Services. Standards for privacy of individually identifiable health information. Department of Health and Human Services, Federal Register, 2000 45 CFR Parts 160 and 164. Available at: http://aspe.hhs.gov/admnsimp/final/pvcguide1.htm. Accessed May 6, 2002.
11. Graber MA, Roller CM, Kaeble B. Readability levels of patient education material on the World Wide Web. J Fam Pract 1999;48:58-61.
12. D’Alessandro DM, Kingsley P, Johnson-West J. The readability of pediatric patient education materials on the World Wide Web. Arch Pediatr Adolesc Med 2001;155:807-12.
13. Berland GK, Elliott MN, Morales LS, et al. Health Information on the Internet: accessibility, quality, and readability in English and Spanish. JAMA 2001;285:2612-21.
14. Lee RD, Conley DA, Preikschat A. Wit’s wisdom on eHealth Wit SoundView. Available at: http://us.mediametrix.com/home.jsp_2000. Accessed June 6, 2001.
15. McLaughlin G. SMOG grading: a new readability formula. J Reading 1989;12:639-46.
16. Doak CC, Doak LG, Root JH. Teaching Patients With Low Literacy Skills. 2nd ed. Philadelphia: JB Lippincott; 1995.
17. Kincaid JP, Fishburne RP, Rogers RL, Chissom BS. Derivation of New Readability Formulas (Automated Reliability Index, Fog Count and Flesch Reading Ease Formula) for Navy Enlisted Personnel. Millington, TN: Naval Air Station; 1975. Branch report 8-75.
18. Flesch R. A new readability yardstick. J Appl Psychol 1948;32:221-33.
19. Roberts JC, Fletcher RH, Fletcher SW. Effects of peer review and editing on the readability of articles published in Annals of Internal Medicine. JAMA 1994;272:119-21.Also available at: http://www.amaassn.org/public/peer/7_13_94/pv3083x.htm. Accessed January 11, 2001.
20. Overland JE, Hoskins PL, McGill MJ, Yue DK. Low literacy: a problem in diabetes education. Diabet Med 1993;10:847-50.
21. Foltz A, Sullivan J. Reading level, learning presentation preference, and desire for information among cancer patients. J Cancer Educ 1996;11:32-8.
22. Davis TC, Mayeaux EJ, Fredrickson D, Bocchini JA, Jr, Jackson RH, Murphy PW. Reading ability of parents compared with reading level of pediatric patient education materials. Pediatrics 1994;93:460-8.
23. Wilson FL. Measuring patients’ ability to read and comprehend: a first step in patient education. Nursingconnections 1995 Winter;8(4):17-25.
24. Estey A, Musseau A, Keehn L. Patient’s understanding of health information: a multihospital comparison. Patient Educ Couns 1994;24(1):73-8.
25. Pew Internet and American Life Project Survey. Internet and specific population groups. Available at: http://www.pewinternet.org/datadump/demo.asp?img=6_specific_pop_groups.jpg. Accessed May 22, 2001.
26. Lee PP. Why literacy matters. Links between reading ability and health. Arch Ophthalmol 1999;117:100-3.
27. Gaston N, Daniels P. Guidelines: writing for adults with limited reading skills. Available at: http://www.cyfernet.org/research/writeadult.html. Accessed September 18, 2000.
28. Smith S. Readability testing health information. Available at: http://www.prenataled.com/story9.htm. Accessed September 18, 2000.
29. Lynch PJ, Horton S. Web Style Guide: Basic Design Principles for Creating Web Sites. New Haven, CT: Yale University Press; 1999. Also available at: http://info.med.yale.edu/caim/manual/. Accessed March 1, 2000.
OBJECTIVE: Most individuals would like to maintain the privacy of their medical information on the World Wide Web (WWW). In response, commercial interests and other sites post privacy policies that are designed to inform users of how their information will be used. However, it is not known if these statements are comprehensible to most WWW users. The purpose of this study was to determine the reading level of privacy statements on Internet health Web sites and to determine whether these statements can inform users of their rights.
STUDY DESIGN: This was a descriptive study. Eighty Internet health sites were examined and the readability of their privacy policies was determined. The selected sample included the top 25 Internet health sites as well as other sites that a user might encounter while researching a common problem such as high blood pressure. Sixty percent of the sites were commercial (.com), 17.5% were organizations (.org), 8.8% were from the United Kingdom (.uk), 3.8% were United States governmental (.gov), and 2.5% were educational (.edu).
OUTCOMES MEASURED: The readability level of the privacy policies was calculated using the Flesch, the Fry, and the SMOG readability levels.
RESULTS: Of the 80 Internet health Web sites studied, 30% (including 23% of the commercial Web sites) had no privacy policy posted. The average readability level of the remaining sites required 2 years of college level education to comprehend, and no Web site had a privacy policy that was comprehensible by most English-speaking individuals in the United States.
CONCLUSIONS: The privacy policies of health Web sites are not easily understood by most individuals in the United States and do not serve to inform users of their rights. Possible remedies include rewriting policies to make them comprehensible and protecting online health information by using legal statutes or standardized insignias indicating compliance with a set of privacy standards (eg, “Health on the Net” [HON] http://www.hon.ch).
Approximately 33 million individuals in the United States have used the Internet to access medical information.1,2 Even though most people would like to maintain the privacy of their medical and other information,3-6 few users of the Internet take steps to do so.7 Commercial vendors develop profiles of individual users of the Internet. The information tracked includes Web sites visited; terms entered into search engines (including medical terms); goods or services bought online; and participation in forums, chat rooms, and e-mail lists (eg, listservs). The text of any postings in forums and email lists can also be tracked. This information is sold to anyone willing to pay for it, including advertisers, employers, and insurance companies. Commercial vendors use this information to offer goods and services targeted to a user’s needs, including medical needs. For example, an individual who visits Web sites dedicated to the care of diabetes mellitus will receive advertising about new diabetes medications and glucose monitoring devices. However, the information can and has been used in other ways, leading to job termination and arrest.8 A user who repeatedly visits a breast-cancer-related Web site, for example, could be discriminated against by a potential employer or insurance company because she is suspected of being afflicted with the disease.
Unauthorized access to an individual’s personal information also occurs. Doubleclick.com, a corporation that collects user information, has had several high-profile breaches of computer security, leaving individuals’ information vulnerable to exploitation.9
The importance of the confidentiality of medical information has been underscored by the recent publication of the new “Standards for Privacy of Individually Identifiable Health Information” by the Department of Health and Human Services.10 In part, these guidelines are designed to “protect the privacy of individually identifiable health information.”10 Although Internet use does not generate a formal medical record, online profiling allows the collection of detailed medical information about a user’s diagnoses, medications, etc, which essentially creates “individually identifiable health information” when associated with their names.
One proposed solution to maintaining Internet privacy has been the voluntary posting of privacy statements. These statements serve to inform users of the privacy policies of the Web site, such as what user information is collected and with whom this information will be shared. Three recent studies have shown that the readability level of much of the patient information on the Internet is beyond the comprehension of many individuals in the United States.11-13 For voluntary privacy statements to be useful, they need to be written at a level understood by most individuals using the Internet. The purpose of this study was to determine the readability level of privacy statements on Internet health Web sites.
Methods
A total of 80 Internet health Web sites were examined in May 2001 to see if they included privacy policies. To emulate the way a consumer might find information on the Internet, 55 of the sites were selected by entering search terms for common conditions into a widely used Internet search engine (http://www.google.com). The terms searched for were “high blood pressure,” “fever,” “cough,” and “wellness.” The other 25 Web sites analyzed represent the most commonly visited health information Web sites on the Internet.10 For Web sites identified by Google, the Web pages represented by the top 10 results for each term were viewed, and any links on those pages were followed until 55 health information Web sites were identified. We did not limit the Web sites to only those identified by the search engines because in many cases, users will follow the links on a page identified by the search engine. Links that led to medical school lectures, nonhuman diseases, online journal articles aimed at health care professionals, or the contents of e-mail or listserv summaries were omitted.
The Web sites were then examined by 1 researcher (J.J.W.) to see if they included privacy statements. This review included looking at the page that the link led to, the Web site’s homepage, any Web site policies, “about us” type of material, etc. Links to privacy foundations such as Health on the Net were considered to represent privacy statements. If a privacy statement was found, the text was copied into Microsoft Word 98 for Macintosh (Microsoft Corporation, Redmond, WA) and the documents’ Flesch Reading Ease score was generated using the built-in software in Microsoft Word 98 (Macintosh). The same privacy statements were printed and then analyzed using 2 hand-calculation methods: the Fry Readability formula and the SMOG method (simplified measure of gobbledygook).15 If a Web site was found to have no privacy statement, this was confirmed by a second researcher (M.G.). Web sites on which no privacy policy was found after 2 searches were not contacted to determine if a policy exists. It is not likely that end users would contact a site to determine the existence of a privacy policy. Thus, there would be the de facto absence of a privacy policy with respect to the end user. Ten percent of the readability levels were analyzed by a second researcher (D.M.D.) and found to have accurate coding. All data were entered into Microsoft Excel spreadsheet and analyzed using the built-in statistical formulas. We did not seek to evaluate the content of the privacy statements themselves.
Approximately 40 different readability formulas are available for use, all of which will give a reasonably accurate grade level (generally plus or minus 1 grade level with 68% confidence: an acceptable standard in the field).16 Most of these formulas rely on number of syllables in a word and sentence length to judge readability. In general, readability is easier when there are a low number of words per sentence, characters per word, and syllables per word, and a low percentage of passive sentences.16 Illustrations and tables also improve the readability. The Flesch Reading Ease score is one of the most widely used and validated systems for scoring readability. It is the standard used by the insurance industry for consumer documents and contracts.17,18 Documents scoring 70 or above are described as “easy” and are written at the grade school level. A score of 60 to 70 is described as “standard” and written at approximately at the high school level. Scores below 60 are described as “fairly difficult,” “difficult,” or “very difficult” as the score decreases.19 The Fry formula is a hand-calculation method that is recommended by experts in the field for use with patient education materials. The SMOG is another hand-calculation method commonly used for evaluation of health information.16 Results from the Fry formula and SMOG methods are expressed as standard United States grade levels.
Results
Of the 80 health Web sites in the initial sample, 2 had recently closed down and an additional 24 (30%) (including 23% of the commercial Web sites) did not have a privacy statement. Thus, the privacy statements of 54 Web sites were analyzed using the 3 readability formulas. The Web site domains for the 80 Web sites as well as the 54 with privacy statements are shown in the Table. The average Flesch Reading Ease score of privacy statements was 39 or “difficult.” This level is similar to reading a corporate annual report. The Flesch Reading Ease score range was 24.4 to 54.2. This range is described as “very difficult” (eg, similar to reading legal contracts) to “fairly difficult” (eg, similar to reading novels such as the Henry James novel, The Ambassadors).19 The Fry formula had a readability level equal to 14.6 or 14th grade 6th month (range, 10–17). The overall SMOG readability level was 14.7 (range, 11–19).
TABLE
Domains of all Web sites examined and percentage with privacy statements
| Top level domain | All Web sites examined (n = 80) | Web sites with a privacy policy (n = 54) |
|---|---|---|
| Commercial (.com) | 48 (60%) | 37 (68.5%) |
| Organizations (.org) | 14 (17.5%) | 8 (14.8%) |
| United Kingdom (.uk) | 7 (8.8%) | 5 (9.2%) |
| Government (.gov) | 3 (3.8%) | 3 (5.6%) |
| Network (.net) | 2 (2.5%) | 0 (0.0%) |
| Educational (.edu) | 2 (2.5%) | 1 (1.8%) |
| Web site did not exist* | 2 (2.5%) | 0 (0.0%) |
| South Africa (.za) | 1 (1.2%) | 0 (0.0%) |
| Numerical (no domain listed) | 1 (1.2%) | 0 (0.0%) |
| Total | 80 (100%) | 54 (100%) |
| *Although the list of the top 25 health-related WWW sites was current, 2 of the sites had gone out of business and were no longer available. | ||
Discussion
The goal of this study was to determine the readability level of privacy statements on Internet health Web sites. Privacy statements are meant to protect the individual, a particularly important endeavor when dealing with medical information because of its potentially sensitive nature. Only 70% of the health Web sites examined in this study even contained a privacy statement. The readability levels of the privacy statements found were considered difficult and would require approximately 2 years of university training to be comprehensible. In contrast, only 60% of diabetic patients in 1 study could understand information written at the 6th grade reading level.20 Most studies find that only a minority of patients can comprehend information written at a 9th grade reading level.21-24 Overall, for 90% of adults to be able to read and comprehend written materials, the materials should be written at less than the 8th grade reading level.16 Although current Internet users may be a more educated group than the general population, this trend is changing. A recent study found that 21% of individuals with less than a high school education have Internet access, as do 43% of high school graduates.25 Because an individual’s actual reading level is usually 2 to 5 grades below the grade completed,26 many of these individuals will not be able to comprehend a Web site’s privacy policy and thus may not be protected or understand their options pertaining to protection.
Many patients are beginning to use the Internet as a source of information and many are unaware that their every move is being tracked. Physicians can help to protect patients by making them aware of this problem and suggesting that patients take steps to protect their information.
A number of possible solutions can be applied to this problem. Rewriting privacy policies to be comprehensible to most Internet users should be the initial step. Resources are available to Web site developers that help to maximize the readability of information.27-29 More widespread use of the “Health on the Net” (HON, http://www.hon.ch) privacy criteria would reassure individuals that their data are secure. Consideration should also be given to extending the same protection to medical information gleaned from the Internet by Web sites and advertising companies as is given to the formal medical record because, in effect, they can reflect the same type of information. For example, on several sites, users can enter medications they are taking and diagnoses (http://www.drkoop.com and others).
The first limitation of this study is that the Web sites studied represent a minority of the health Web sites on the Internet. However, the study set includes the top 25 visited health Web sites and did seek many different types of Web sites for evaluation. Also, none of the Web sites had a policy that was written at a level comprehensible to most of the English-speaking people in the United States. It is unlikely that including more Web sites would substantially change the outcome. Finally, given the large (and unknown) number of health Web sites on the Internet, it is not practical to obtain a large enough sample to be representative of all health Web sites.
The second problem is readability levels themselves. Readability calculations have been criticized because they depend mainly on sentence length and the number of syllables per word. If an individual is familiar with the sentence terminology, it may be possible to interpret the information correctly using context clues. However, most individuals do not have a working knowledge of legal terminology (eg, “indemnify”) and thus may not be able to use these clues to determine the meaning of a sentence.
Conclusions
Thirty percent of health Web sites do not have privacy statements, and those that are posted are beyond the reading level of most adults. For this reason, current privacy statements do not function to adequately inform users of a Web site’s privacy policy and do not protect users’ privacy rights.
1. Pew Internet and American Life Project Survey. Daily Internet activities. Available at: http://www.pewinternet.org/reports/chart.asp?img=6_daily_activities.jpg. Accessed April 10, 2001.
2. Pew Internet and American Life Project Survey. Internet activities. Available at: http://www.pewinternet.org/reports/chart.asp?img=6_internet_activities.jpg. Accessed April 10, 2001.
3. Cheng TL, Savageau JA, Sattler AL, DeWitt TG. Confidentiality in health care. A survey of knowledge, perceptions, and attitudes among high school students. JAMA 1993;269:1404-7.
4. Merz JF, Spina BJ, Sankar P. Patient consent for release of sensitive information from their medical records: an exploratory study. Behav Sci Law 1999;17:445-54.
5. Weiss BD. Confidentiality expectations of patients, physicians, and medical students. JAMA 1982;247:2695-7.
6. Fox S, Rainie L, Horrigan J, Lenhart A, Spooner T, Carter C. Trust and privacy online: why Americans want to re-write the rules. The Internet Life Report. Pew Internet and American Life Project; August 20, 2000. Available at http://www.pewinternet.org/reports/toc.asp?Report=19. Accessed April 19, 2001.
7. WebSideStory. Cookie rejection less than 1 percent on the Web According to WebSideStory. Available at: http://www.websidestory.com/cgibin/wss.cgi?corporate&news&press_2_1 24. Accessed April 19, 2001.
8. The Privacy Foundation. EEOC v. Burlington Northern Santa Fe Railroad. Available at: http://www.privacyfoundation.org/legal/case/show.asp?id=25&t=2. Accessed May 5, 2002.
9. Junk Busters. DoubleClick reaches settlement on class action suits. Available at: http://www.junkbusters.com/new.html#March. Accessed May 21, 2001.
10. Departmen of Health and Human Services. Standards for privacy of individually identifiable health information. Department of Health and Human Services, Federal Register, 2000 45 CFR Parts 160 and 164. Available at: http://aspe.hhs.gov/admnsimp/final/pvcguide1.htm. Accessed May 6, 2002.
11. Graber MA, Roller CM, Kaeble B. Readability levels of patient education material on the World Wide Web. J Fam Pract 1999;48:58-61.
12. D’Alessandro DM, Kingsley P, Johnson-West J. The readability of pediatric patient education materials on the World Wide Web. Arch Pediatr Adolesc Med 2001;155:807-12.
13. Berland GK, Elliott MN, Morales LS, et al. Health Information on the Internet: accessibility, quality, and readability in English and Spanish. JAMA 2001;285:2612-21.
14. Lee RD, Conley DA, Preikschat A. Wit’s wisdom on eHealth Wit SoundView. Available at: http://us.mediametrix.com/home.jsp_2000. Accessed June 6, 2001.
15. McLaughlin G. SMOG grading: a new readability formula. J Reading 1989;12:639-46.
16. Doak CC, Doak LG, Root JH. Teaching Patients With Low Literacy Skills. 2nd ed. Philadelphia: JB Lippincott; 1995.
17. Kincaid JP, Fishburne RP, Rogers RL, Chissom BS. Derivation of New Readability Formulas (Automated Reliability Index, Fog Count and Flesch Reading Ease Formula) for Navy Enlisted Personnel. Millington, TN: Naval Air Station; 1975. Branch report 8-75.
18. Flesch R. A new readability yardstick. J Appl Psychol 1948;32:221-33.
19. Roberts JC, Fletcher RH, Fletcher SW. Effects of peer review and editing on the readability of articles published in Annals of Internal Medicine. JAMA 1994;272:119-21.Also available at: http://www.amaassn.org/public/peer/7_13_94/pv3083x.htm. Accessed January 11, 2001.
20. Overland JE, Hoskins PL, McGill MJ, Yue DK. Low literacy: a problem in diabetes education. Diabet Med 1993;10:847-50.
21. Foltz A, Sullivan J. Reading level, learning presentation preference, and desire for information among cancer patients. J Cancer Educ 1996;11:32-8.
22. Davis TC, Mayeaux EJ, Fredrickson D, Bocchini JA, Jr, Jackson RH, Murphy PW. Reading ability of parents compared with reading level of pediatric patient education materials. Pediatrics 1994;93:460-8.
23. Wilson FL. Measuring patients’ ability to read and comprehend: a first step in patient education. Nursingconnections 1995 Winter;8(4):17-25.
24. Estey A, Musseau A, Keehn L. Patient’s understanding of health information: a multihospital comparison. Patient Educ Couns 1994;24(1):73-8.
25. Pew Internet and American Life Project Survey. Internet and specific population groups. Available at: http://www.pewinternet.org/datadump/demo.asp?img=6_specific_pop_groups.jpg. Accessed May 22, 2001.
26. Lee PP. Why literacy matters. Links between reading ability and health. Arch Ophthalmol 1999;117:100-3.
27. Gaston N, Daniels P. Guidelines: writing for adults with limited reading skills. Available at: http://www.cyfernet.org/research/writeadult.html. Accessed September 18, 2000.
28. Smith S. Readability testing health information. Available at: http://www.prenataled.com/story9.htm. Accessed September 18, 2000.
29. Lynch PJ, Horton S. Web Style Guide: Basic Design Principles for Creating Web Sites. New Haven, CT: Yale University Press; 1999. Also available at: http://info.med.yale.edu/caim/manual/. Accessed March 1, 2000.