User login
Effect of Topical Benzoyl Peroxide/Clindamycin Versus Topical Clindamycin and Vehicle in the Reduction of Propionibacterium acnes
Survey methodology for the uninitiated
Research using self-developed questionnaires is a popular study design in family practice and is frequently used for gathering data on knowledge, beliefs, attitudes, and behaviors. A Medline literature search from 1966 to 2000 identified 53,101 articles related to questionnaires, of which 2088 were directly related to family practice. Despite the large number of questionnaire-related articles, however, only 2 in the general medical literature1,2 and 1 in the family practice literature3 were directly related to research methodology.
To obtain guidance on survey research methodology, novice family practice researchers often must go through volumes of information by specialists in other disciplines. For example, a search of a psychology database (PsychInfo)4 from 1966 to 2000 produced 45 articles about questionnaire methodology. The goal of this article is to synthesize pertinent survey research methodology tenets-from other disciplines as well as from family practice-in a manner that is meaningful to novice family practice researchers as well as to research consumers. This article is not aimed at answering all questions, but rather is meant to serve as a general guideline for those with little formal research training who seek guidance in developing and administering questionnaires.
Avoiding common pitfalls in survey research
Although constructing a questionnaire is not exceedingly complex, simple mistakes can be avoided by following some basic rules and guidelines. The Figure is a checklist for conducting a survey research project that combines guidelines and suggestions from published survey research literature,5-9 and the cumulative experience of the authors. Two of the authors (M.J.D. and K.C.O.) are experienced survey researchers who have published, in peer-reviewed journals, numerous studies that used questionnaires.10-19 One of the authors (MJD) has been teaching research to residents and junior faculty for over a decade, and has been an advisor on scores of resident, student, and faculty research projects. The perspective of the novice researcher is represented by 1 author (C.R.W.).
Getting started
The “quick and dirty” approach is perhaps the most common pitfall in survey research. Because of the ease of administration and the relatively low cost of survey research, questionnaires can be developed and administered quickly. The researcher, however, should be sure to consider whether or not a survey is the most appropriate method to answer a research question. Adequate time must be given to thoroughly searching the relevant literature, developing and focusing on an appropriate research question, and defining the target population for the study (see Figure A, Getting Started). Large, multisite surveys are more likely to be generalizeable and to be published in peer-reviewed journals.
One way to avoid undertaking a project too rapidly and giving inadequate attention to the survey research process is for novice researchers to avoid independent research. Those with little or no experience must realize that researchers in both family practice and other fields perform research in teams, with the various participants bringing specific skills to the process.20 Oversights, mistakes, and biases in the design of questionnaires can always occur, whether a researcher is working independently or as a member of a team. It seems reasonable to assume, however, that significant problems are much less likely to occur when a multidisciplinary team approach is involved rather than an individual researcher undertaking a study independently.
Ideally, a research team should include a statistician, a professional with experience in the content areas of the study, and a senior investigator.21 The desirable area of expertise, however, is often not readily available to family physicians, especially those in community-based settings. Individuals with some training in research who are interested in being involved can usually be found in colleges and universities, hospitals, and at the local public health department. Psychologists, sociologists, health services researchers, public health epidemiologists, and nursing educators are all potential resources and possible collaborators. Establishing the necessary relationships to form an ad hoc research team is certainly more time and labor intensive than undertaking research independently, but generally results in the collection of more useful information.
Novices should consult survey methodology books before and during the study.5-9 Excellent resources are available that provide a comprehensive overview of survey methods,22 means for improving response rates,23 and methods for constructing relatively brief but thorough survey questions.5 Academic family practice fellowships often provide training in survey methodology. In addition, many family practice researchers respond favorably to requests for information or advice requested by telephone or email contact. The novice author of this article reports excellent success in contacting experts in this manner. With the advent of the Internet, a “cyberspace” team comprised of experts in the topic and the methodology is a reasonable and helpful option for the novice.
Survey content and structure
Novice researchers often assume that developing a questionnaire is an intuitive process attainable by virtually anyone, regardless of their level of research training. While it is true that questionnaires are relatively simple to construct, developing an instrument that is valid and reliable is not intuitive. An instrument is valid if it actually measures what we think it is measuring, and it is reliable if it measures the phenomenon consistently in repeated applications.24 By following a few basic guidelines, those with limited research training can develop survey instruments capable of producing valid and reliable information. The 3 primary concerns for developing appropriate questions (items) are: (1) response format; (2) content; and (3) wording and placement (see Figure B, Survey Questions; and Figure C, Designing and Formatting the Survey).
Format
Questionnaires generally use a closed-ended format rather than an open-ended format. Closed formats spell out response options instead of asking study subjects to respond in their own words. Although there are many reasons for using closed formats, their primary advantages over open formats is that they are more specific and provide the same frame of reference to all respondents, and they allow quantitative analysis. A disadvantage is that they limit the possible range of responses envisioned by the investigators. Questionnaires with closed formats are therefore not as helpful as qualitative methods in the early, exploratory phases of a research project.
Closed-ended items can be formatted into several different categories (classes) of measurement, based on the relationship of the response categories to one another. Nominal measurements are responses that are sorted into unordered categories, such as demographic variables (ie, sex, ethnicity). Ordinal measurements are similar to nominal, except that there is a definite order to the categories. For example, ordinal items may ask respondents to rank their preferences among a list of options from the least desirable to the most desirable.
Survey items that ask for respondents(delete apostrophe) to rank order preferences are often a more useful than items that state, “check all that apply.” While checking all relevant responses may be necessary for certain items, such questions often lose valuable information as they can only supply raw percentages without supplying any comparison between responses. If a survey uses a rank order response, it enables determining the relative importance of the different categories during data analysis Table 1.
Two additional tools used on questionnaires are continuous variables and scales. Continuous variables can be simple counts (eg, the number of times something occurred) or physical attributes (eg, age or weight). A general rule when collecting information on continuous variables is to avoid obtaining the information in ranges of categories unless absolutely necessary. Response categories that reflect ranges of responses can always be constructed after the information is gathered, but if the information is gathered in ranges from the start, it cannot later be expanded to reflect specific values.
Scales are used by survey researchers to assess the intensity of respondents’ attitudes about a specific issue or issues. Likert scales are probably the best known and most widely used for measuring attitudes. These scales typically present respondents with a statement and ask them to indicate whether they “strongly agree,” “agree,” “neither agree nor disagree,” “disagree,” or “strongly disagree.” The wording of the response categories can be changed to reflect other concepts (eg, approval or disapproval), and the standard 5-response format can be expanded or abbreviated if necessary.
There are no hard and fast rules for determining the number of response categories to use for scaled items, or whether to use a neutral category or one that reflects uncertainty. Research indicates that the reliability of respondents’ ratings declines when using more than 9 rating scale points.25 However, the reliability of a scale increases when the number of rating scale points is increased, with maximum benefit achieved with 5 or 7 scale points.25,26 Since the objective of using scales is to gauge respondent’s preferences, it is sometimes argued that a middle point or category of uncertainty category should not be used. Odd-numbered rating scales, however, conform better with the underlying tenets of many statistical tests, suggesting the need for including this category.29 As the number of rating scale points increases, respondents’ use of the midpoint category decreases substantially. 30 Thus, based on the available literature, it is generally advisable to use between 5 and 7 response categories and an uncertainty category, unless there is a compelling reason to force respondents to choose between 2 competing perspectives or alternatives.
Content
Items should not be included on questionnaires when the only justification for inclusion is that the investigator feels the information “would be really interesting to know.” Rather, for each item, you should ask yourself how it addresses the study’s research question and how it will be used in the data analysis stage of the study. Researchers should develop a data analysis plan in advance of administering a questionnaire to determine exactly how each question will be used in the analysis. When the relationship between a particular item and the study’s research question is unclear, or it is not known how an item will be used in the analysis, the item should be removed from the questionnaire.
Wording and placement
The wording of questions should be kept simple, regardless of the education level of the respondents. Questions should be kept as short and direct as possible since shorter surveys tend to have higher response rates.31,32 Each question should be scrutinized to ensure it is appropriate for the respondents and does not require or assume an inappropriate level of knowledge about a topic. Since first impressions are important for setting the tone of a questionnaire, never begin with sensitive or threatening questions.33 Questionnaires should begin with simple, introductory (“warm-up”)“questions to help establish trust and an appropriate frame of mind for respondents.34 Other successful strategies are: (1) when addressing multiple topics, insert an introductory statement immediately preceding each topic (eg, “In the next section we would like to ask you about …”); (2) request demographic information at the end of the questionnaire; and (3) always provide explicit instructions to avoid any confusion on the part of respondents.35
Additional, clear information on survey content and structure is available in 2 books from Sage Publications.5,36 By following simple guidelines and common sense, most family practice researchers can construct valid and reliable questionnaires. As a final safeguard, once a final draft of the questionnaire is completed, the researcher should always be the first respondent. By placing yourself in the respondent’s role and taking the time to think about and respond to each question, problems with the instrument that were overlooked are sometimes identified.
Analyzing surveys
It is not within the scope of this project to address statistical analysis of survey data. Before attempting data analysis, investigators should receive appropriate training or consult with a qualified professional. There are 3 topics that can and should be understood by novice researchers related to data analysis (Figure D, Developing a Framework for Analysis).
Coding
Before analyzing survey data it is necessary to assign numbers (codes) to the responses obtained. Since the computer program that is used for analyzing data does not know what the numbers mean, the researcher assigns meaning to the codes so that the results can be interpreted correctly. Coding refers to the process of developing the codes, assigning them to responses, and documenting the decision rules used for assigning specific codes to specific response categories. For example, almost all questionnaires contain missing values when respondents elect to not answer an item. Unique codes need to be assigned to distinguish between an item’s missing values, items that may not be applicable to a particular respondent, and responses that have a “none” or “no opinion” category.
Data can be entered into appropriate data files once codes have been assigned to responses and a codebook compiled that defines the codes and their corresponding response categories. It is important to ensure that the data are free of errors (are clean) prior to performing data analysis. Although many methods can be used for data cleaning (ie, data can be entered twice and results compared consistency), at a minimum all of the codes should be checked to ensure only legitimate codes appear.
Frequency distributions are tables produced by statistical software that display the number of respondents in each response category for each item (variable) used in the analysis. By carefully examining frequency tables, the researcher can check for illegitimate codes. Frequency tables also display the relative distribution of responses and allow identification of items that do not conform to expectations given what is known about the study population.
Sample size
Since it is usually not possible to study all of the members of the group (population) of interest in a study, a subset (sample) of the population is generally selected for study from the sampling frame. Sampling is the process by which study subjects are selected from the target population, while the sample frame is the members of a population who have a chance of being included in the survey. In probability samples, each member of the sampling frame has a known probability of being selected for the study, whereas in nonprobability samples, the probability of selection is unknown. When a high degree of precision in sampling is needed to unambiguously identify the magnitude of a problem in a population or the factors that cause the problem, then probability sampling techniques must be used.
When conducting an analytical study that examines precisely whether statistically significant differences exist between groups in a population, power analysis is used to determine what size sample is needed to detect the differences. Estimates of sample size based on power are inversely related to the expected size of the differences “(effect size)”-that is, detecting smaller differences requires a larger sample. If an analytical study is undertaken to determine the magnitude of the differences between 2 groups, it is necessary to work with a statistician or other methodology expert to perform the appropriate power analysis. For a basic but valuable description of sample size estimation, see chapter 13 of Hulley and Cummings.21
In contrast to analytical studies, exploratory and descriptive studies can frequently be conducted without the need for a power analysis. While some descriptive studies may require the use of probability techniques and precise sample estimates, this often is not the case for studies that establish the existence of a problem or estimating its dimensions. When conducting an exploratory or descriptive study using a survey design and a nonprobability sampling technique, considerations other than effect size or precision are used to determine sample size. For example, the availability of eligible respondents, limitations of time and resources, and the need for pilot study data can all contribute to selecting a nonprobability sample. When these types of sampling techniques are used, however, it is important to remember that the validity and reliability of the findings are not assured, and the findings cannot be used to demonstrate the existence of differences between groups. The findings of these types of studies are only suggestive and have limited application beyond the specific study setting.
Response rate
The response rate is a measure indicating the percentage of the identified sample that completed and returned the questionnaire. It is calculated by dividing the number of completed questionnaires by the total sample size identified for the study. For example, if a study is mailed to 500 physicians questionnaires and 100 returned a completed questionnaire, the response rate would be 20% (100/500).
The response rate for mailed questionnaires is extremely variable. Charities are generally content with a 1% to 3% response rate, the US Census Bureau expects to achieve a 99% rate, and among the general population, a 10% response rate is not uncommon. Although an 80% response rate is possible from an extremely motivated population, a rate of 70% is generally considered excellent.34
The effect of nonresponse on the results of a survey depend on the degree to which those not responding are systematically different from the population from which they are drawn.24 When the response rate is high (ie, 95%), the results obtained from the sample will likely provide accurate information about the target population (sampling frame) even if the nonrespondents are distinctly different. However, if nonrespondents differ in a systematic way from the target population and the response rate is low, bias in how much the survey results accurately reflect the true characteristics of the target population is likely.
When calculating the response rate, participants who have died or retired can be removed from the denominator as appropriate. Nonrespondents, however, who refuse to participate, do not return the survey, or have moved should be included. This bias tends to be more problematic in “sensitive” areas of research37 than in studies of common, nonthreatening topics.38 Imputing values for missing data from nonrespondents is complex and generally should not be undertaken.39
Given the importance of response rate, every effort must be made to obtain as many completed questionnaires as possible and strategies to maximize the response rate should be integrated into the study design (see Dillman23 for a useful discussion of successful strategies). Some simple means for improving response rates include constructing a short questionnaire, sending a well-written and personalized cover letter containing your signature, and emphasizing the importance of the study and the confidentiality of responses. It is also advisable to include a self-addressed, stamped envelope for return responses, and sometimes a small incentive is worthwhile. The National Center for Education Statistics notes that all surveys require some follow-up to achieve desirable response rates.40 Survey researchers, therefore, should develop procedures for monitoring responses and implement follow-up plans shortly after the survey begins.
Generally, 2 or 3 mailings are used to maximize response rates. Use of post card reminders is an inexpensive, though untested, method to increase response. Several randomized studies have reported an increase in response rate from physicians in private practice with the use of monetary incentives, although the optimum amount is debated. Everett et al40 compared the use of a $1 incentive vs no monetary incentive and found a significant increase with the incentive group (response rates: 63% in the $1 group; 45% in the no incentive group; P < .0001).41 Other studies have compared $2, $5, $10, $20, and $25 incentives and found that $2 or $5 incentives are most cost effective.4245 Similar findings have been reported for physician surveys in other countries.31,46 In an assessment of incentive for enrollees in a health plan, a $2 incentive was more cost effective than a $5 incentive.47 A $1 incentive was as effective as $2 in significantly increasing response rate in a low-income population.48 Quality of responses have not varied by use of incentives and there does not appear to be an incentive-bias.
Use of lottery appears to also increase response rate in both physicians and the lay public, although there are no studies comparing lottery to a monetary incentive enclosed for all participants.31,49 Use of either certified or priority return mail appears to increase response rates, and may be more cost effective when used for the second mailing.45,48
Pilot testing
Though pilot testing is generally included in the development of a survey, it is often inadequately conducted Figure F Final Preparation). Frequently, investigators are eager to answer their research question and pilot testing is synonymous with letting a few colleagues take a quick look and make a few comments. Table 2 illustrates a problem that could have been avoided with proper pilot testing.10 One of the questions in the survey asked about how time is allotted for faculty to pursue scholarly activities and research (Format A). Unfortunately, the question mixes 2 types of time in 1 question: extended time away from the institution (sabbatical and mini-sabbatical) and time in the routine schedule. This was confusing to respondents and could have been avoided by separating the content into 2 separate questions (Format B).
Investigators should consider carefully whom to include in the pilot testing. Not only should this include the project team and survey “experts”, but it should also include a sample of the target audience. Pilot testing among multiple groups provides feedback about the wording and clarity of questions, appropriateness of the questions for the target population, and the presence of redundant or unnecessary items.
Conclusions
One of the authors (C.R.W.) recently worked on her first questionnaire project. Among the many lessons she learned was the value of a team in providing assistance, the importance of considering if the time spent on a particular activity makes it cost effective, and the need to be flexible depending on circumstances. She found that establishing good communication with the team cuts down on errors and wasted effort. Rewarding the team for all of their hard work improves morale and provides a positive model for future projects.
The mailed self-administered questionnaire is an important tool in primary care research. For family practice to continue its maturation as a research discipline, family practitioners need to be conversant in survey methodology and familiar with its pitfalls. We hope this primer-designed specifically for use in the family practice setting-will provide not only basic guidelines for novices but will also inspire further investigation.
Acknowledgments
The authors thank Laura Snell, MPH, for her thoughtful review of the manuscript. We also thank Olive Chen, PhD, for research assistance and Janice Rookstool for manuscript preparation.
1. Siebert C, Lipsett LF, Greenblatt J, Silverman RE. Survey of physician practice behaviors related to diabetes mellitus in the U.S. I. Design and methods. Diabetes Care 1993;16:759-64.
2. Weller AC. Editorial peer review: methodology and data collection. Bull Med Libr Assoc 1990;78:258-70.
3. Myerson S. Improving the response rates in primary care research. Some methods used in a survey on stress in general practice since the new contract (1990). Fam Pract 1993;10:342-6.
4. PsycINFO: your source for psychological abstracts. PsycINFO Web site. Available at: http://www.apa.org/psycinfo. Accessed April 11, 2002.
5. Converse JM, Presser S. Survey Questions: Handcrafting The Standardized Questionnaire. Quantitative Applications in the Social Sciences. Newbury Park, CA: Sage Publications; 1986.
6. Cox J. Your Opinion, Please!: How to Build the Best Questionnaires in the Field of Education. Thousand Oaks, CA: Corwin Press; 1996.
7. Fink A. ed The Survey Kit. Thousand Oaks, CA: Sage Publications; 1995.
8. Fowler F. Survey Research Methods. Applied Social Research Methods Series. Newbury Park, CA: Sage Publications; 1991.
9. Fowler F. Improving Survey Questions. Applied Social Research Methods Series. Newbury Park, CA: Sage Publications; 1995.
10. Oeffinger KC, Roaten SP, , Jr. Ader DN, Buchanan RJ. Support and rewards for scholarly activity in family medicine: a national survey. Fam Med 1997;29:508-12.
11. Oeffinger KC, Snell LM, Foster BM, Panico KG, Archer RK. Diagnosis of acute bronchitis in adults: a national survey of family physicians. J Fam Pract 1997;45:402-9.
12. Oeffinger KC, Snell LM, Foster BM, Panico KG, Archer RK. Treatment of acute bronchitis in adults. A national survey of family physicians. J Fam Pract 1998;46:469-75.
13. Oeffinger KC, Eshelman DA, Tomlinson GE, Buchanan GR. Programs for adult survivors of childhood cancer. J Clin Oncol 1998;16:2864-7.
14. Robinson MK, DeHaven MJ, Koch KA. The effects of the patient self-determination act on patient knowledge and behavior. J Fam Pract 1993;37:363-8.
15. Murphee DD, DeHaven MJ. Does grandma need condoms: condom use among women in a family practice setting. Arch Fam Med 1995;4:233-8.
16. DeHaven MJ, Wilson GR, Murphee DD, Grundig JP. An examination of family medicine residency program director’s views on research. Fam Med 1997;29:33-8.
17. Smith GE, DeHaven MJ, Grundig JP, Wilson GR. African-American males and prostate cancer: assessing knowledge levels in the community. J Natl Med Assoc 1997;89:387-91.
18. DeHaven MJ, Wilson GR, O’Connor PO. Creating a research culture: what we can learn from residencies that are successful in research. Fam Med 1998;30:501-7.
19. Koch KA, DeHaven MJ, Robinson MK. Futility: it’s magic. Clinical Pulmonary Medicine 1998;5:358-63.
20. Rogers J. Family medicine research: a matter of values and vision. Fam Med 1995;27:180-1.
21. Hulley SB, Cummings S, eds. Designing Clinical Research: An Epidemiological Approach. Baltimore, MD: Williams & Wilkins; 1988.
22. Babbie E. Survey research methods. Belmont, CA: Wadsworth Publishing; 1973.
23. Dillman DA. Mail and Telephone Surveys: The Total Design Method. New York: John Wiley & Sons; 1978.
24. Carmines EG, Zeller R. Reliability and Validity Assessment. Quantitative Applications in the Social Sciences, 17. Newbury Park, CA: Sage Publications; 1979.
25. Preston CC, Colman AM. Optimal number of response categories in rating scales: reliability, validity, discriminating power, and respondent p. Acta Psychol (Amst) 2000;104:1-15.
26. Bandalos DL, Enders CK. The effects of non-normality and number of response categories on reliability. Appl Meas Ed 1996;9:151-60.
27. Cicchetti DV, Showalter D, Tyrer PJ. The effect of number of rating scale categories on levels of interrater reliability: a Monte Carlo investigation. Appl Psychol Meas 1985;9:31-6.
28. Nunnally JC. Psychometric Theory. New York: McGraw-Hill; 1967.
29. Likert R. A technique for the measurement of attitudes. Arch Psychol 1932;140:55.-
30. Matell MS, Jacoby J. Is there an optimal number of alternatives for Likert scale items? Effects of testing time and scale properties. J Appl Psychol 1972;56:506-9.
31. Kalantar JS, Talley NJ. The effects of lottery incentive and length of questionnaire on health survey response rates: a randomized study. J Clin Epidemiol 1999;52:1117-22.
32. Yammarino FJ, Skinner SJ, Childers TL. Understanding mail survey response behavior: a meta-analysis. Public Opin Q 1991;55:613-39.
33. Bailey KD. Methods of Social Research. New York: The Free Press; 1994.
34. Backstrom CH, Hursh-Cesar G. Survey Research. 2nd ed. New York: John Wiley & Sons; 1981.
35. Babbie E. The Practice of Social Research. Belmont, CA: Wadsworth Publishing; 1989.
36. Fowler FJ. Survey Research Methods. Applied Social Research Methods, Volume 1. Newbury Park, CA: Sage Publications; 1988.
37. Hill A, Roberts J, Ewings P, Gunnell D. Non-response bias in a lifestyle survey. J Public Health Med 1997;19:203-7.
38. O’Neill TW, Marsden D, Silman AJ. Differences in the characteristics of responders and non-responders in a prevalence survey of vertebral osteoporosis. European Vertebral Osteoporosis Study Group. Osteoporos Int 1995;5:327-34.
39. Jones J. The effects of non-response on statistical inference. J Health Soc Policy 1996;8:49-62.
40. National Center for Education Statistics. Standard for achieving acceptable survey response rates, NCES Standard: II-04-92. 2001. Available at: http://www.nces.ed.gov/statprog/Stand11_04.asp. Last accessed April 11, 2002.
41. Everett SA, Price JH, Bedell AW, Telljohann SK. The effect of a monetary incentive in increasing the return rate of a survey to family physicians. Eval Health Prof 1997;20:207-14.
42. Asch DA, Christakis NA, Ubel PA. Conducting physician mail surveys on a limited budget. A randomized trial comparing $2 bill versus $5 bill incentives. Med Care 1998;36:95-9.
43. VanGeest JB, Wynia MK, Cummins DS, Wilson IB. Effects of different monetary incentives on the return rate of a national mail survey of physicians. Med Care 2001;39:197-201.
44. Tambor ES, Chase GA, Faden RR, Geller G, Hofman KJ, Holtzman NA. Improving response rates through incentive and follow-up: the effect on a survey of physicians’ knowledge of genetics. Am J Public Health 1993;83:1599-603.
45. Kasprzyk D, Montano DE, St Lawrence JS, Phillips WR. The effects of variations in mode of delivery and monetary incentive on physicians’ responses to a mailed survey assessing STD practice patterns. Eval Health Prof 2001;24:3-17.
46. Deehan A, Templeton L, Taylor C, Drummond C, Strang J. The effect of cash and other financial inducements on the response rate of general practitioners in a national postal study. Br J Gen Pract 1997;47(415):87-90.
47. Shaw MJ, Beebe TJ, Jensen HL, Adlis SA. The use of monetary incentives in a community survey: impact on response rates, data quality, and cost. Health Serv Res 2001;35:1339-46.
48. Gibson PJ, Koepsell TD, Diehr P, Hale C. Increasing response rates for mailed surveys of Medicaid clients and other low-income populations. Am J Epidemiol 1999;149:1057-62.
49. Baron G, De Wals P, Milord F. Cost-effectiveness of a lottery for increasing physicians’ responses to a mail survey. Eval Health Prof 2001;24:47-52.
Address correspondence to Cristen R. Wall, MD, The University of Texas Southwestern Medical Center, Department of Family Practice and Community Medicine, 6263 Harry Hines Boulevard, Dallas, TX 75390-9067. E-mail: Cristen.[email protected].
To submit a letter to the editor on this topic, click here:[email protected].
Research using self-developed questionnaires is a popular study design in family practice and is frequently used for gathering data on knowledge, beliefs, attitudes, and behaviors. A Medline literature search from 1966 to 2000 identified 53,101 articles related to questionnaires, of which 2088 were directly related to family practice. Despite the large number of questionnaire-related articles, however, only 2 in the general medical literature1,2 and 1 in the family practice literature3 were directly related to research methodology.
To obtain guidance on survey research methodology, novice family practice researchers often must go through volumes of information by specialists in other disciplines. For example, a search of a psychology database (PsychInfo)4 from 1966 to 2000 produced 45 articles about questionnaire methodology. The goal of this article is to synthesize pertinent survey research methodology tenets-from other disciplines as well as from family practice-in a manner that is meaningful to novice family practice researchers as well as to research consumers. This article is not aimed at answering all questions, but rather is meant to serve as a general guideline for those with little formal research training who seek guidance in developing and administering questionnaires.
Avoiding common pitfalls in survey research
Although constructing a questionnaire is not exceedingly complex, simple mistakes can be avoided by following some basic rules and guidelines. The Figure is a checklist for conducting a survey research project that combines guidelines and suggestions from published survey research literature,5-9 and the cumulative experience of the authors. Two of the authors (M.J.D. and K.C.O.) are experienced survey researchers who have published, in peer-reviewed journals, numerous studies that used questionnaires.10-19 One of the authors (MJD) has been teaching research to residents and junior faculty for over a decade, and has been an advisor on scores of resident, student, and faculty research projects. The perspective of the novice researcher is represented by 1 author (C.R.W.).
Getting started
The “quick and dirty” approach is perhaps the most common pitfall in survey research. Because of the ease of administration and the relatively low cost of survey research, questionnaires can be developed and administered quickly. The researcher, however, should be sure to consider whether or not a survey is the most appropriate method to answer a research question. Adequate time must be given to thoroughly searching the relevant literature, developing and focusing on an appropriate research question, and defining the target population for the study (see Figure A, Getting Started). Large, multisite surveys are more likely to be generalizeable and to be published in peer-reviewed journals.
One way to avoid undertaking a project too rapidly and giving inadequate attention to the survey research process is for novice researchers to avoid independent research. Those with little or no experience must realize that researchers in both family practice and other fields perform research in teams, with the various participants bringing specific skills to the process.20 Oversights, mistakes, and biases in the design of questionnaires can always occur, whether a researcher is working independently or as a member of a team. It seems reasonable to assume, however, that significant problems are much less likely to occur when a multidisciplinary team approach is involved rather than an individual researcher undertaking a study independently.
Ideally, a research team should include a statistician, a professional with experience in the content areas of the study, and a senior investigator.21 The desirable area of expertise, however, is often not readily available to family physicians, especially those in community-based settings. Individuals with some training in research who are interested in being involved can usually be found in colleges and universities, hospitals, and at the local public health department. Psychologists, sociologists, health services researchers, public health epidemiologists, and nursing educators are all potential resources and possible collaborators. Establishing the necessary relationships to form an ad hoc research team is certainly more time and labor intensive than undertaking research independently, but generally results in the collection of more useful information.
Novices should consult survey methodology books before and during the study.5-9 Excellent resources are available that provide a comprehensive overview of survey methods,22 means for improving response rates,23 and methods for constructing relatively brief but thorough survey questions.5 Academic family practice fellowships often provide training in survey methodology. In addition, many family practice researchers respond favorably to requests for information or advice requested by telephone or email contact. The novice author of this article reports excellent success in contacting experts in this manner. With the advent of the Internet, a “cyberspace” team comprised of experts in the topic and the methodology is a reasonable and helpful option for the novice.
Survey content and structure
Novice researchers often assume that developing a questionnaire is an intuitive process attainable by virtually anyone, regardless of their level of research training. While it is true that questionnaires are relatively simple to construct, developing an instrument that is valid and reliable is not intuitive. An instrument is valid if it actually measures what we think it is measuring, and it is reliable if it measures the phenomenon consistently in repeated applications.24 By following a few basic guidelines, those with limited research training can develop survey instruments capable of producing valid and reliable information. The 3 primary concerns for developing appropriate questions (items) are: (1) response format; (2) content; and (3) wording and placement (see Figure B, Survey Questions; and Figure C, Designing and Formatting the Survey).
Format
Questionnaires generally use a closed-ended format rather than an open-ended format. Closed formats spell out response options instead of asking study subjects to respond in their own words. Although there are many reasons for using closed formats, their primary advantages over open formats is that they are more specific and provide the same frame of reference to all respondents, and they allow quantitative analysis. A disadvantage is that they limit the possible range of responses envisioned by the investigators. Questionnaires with closed formats are therefore not as helpful as qualitative methods in the early, exploratory phases of a research project.
Closed-ended items can be formatted into several different categories (classes) of measurement, based on the relationship of the response categories to one another. Nominal measurements are responses that are sorted into unordered categories, such as demographic variables (ie, sex, ethnicity). Ordinal measurements are similar to nominal, except that there is a definite order to the categories. For example, ordinal items may ask respondents to rank their preferences among a list of options from the least desirable to the most desirable.
Survey items that ask for respondents(delete apostrophe) to rank order preferences are often a more useful than items that state, “check all that apply.” While checking all relevant responses may be necessary for certain items, such questions often lose valuable information as they can only supply raw percentages without supplying any comparison between responses. If a survey uses a rank order response, it enables determining the relative importance of the different categories during data analysis Table 1.
Two additional tools used on questionnaires are continuous variables and scales. Continuous variables can be simple counts (eg, the number of times something occurred) or physical attributes (eg, age or weight). A general rule when collecting information on continuous variables is to avoid obtaining the information in ranges of categories unless absolutely necessary. Response categories that reflect ranges of responses can always be constructed after the information is gathered, but if the information is gathered in ranges from the start, it cannot later be expanded to reflect specific values.
Scales are used by survey researchers to assess the intensity of respondents’ attitudes about a specific issue or issues. Likert scales are probably the best known and most widely used for measuring attitudes. These scales typically present respondents with a statement and ask them to indicate whether they “strongly agree,” “agree,” “neither agree nor disagree,” “disagree,” or “strongly disagree.” The wording of the response categories can be changed to reflect other concepts (eg, approval or disapproval), and the standard 5-response format can be expanded or abbreviated if necessary.
There are no hard and fast rules for determining the number of response categories to use for scaled items, or whether to use a neutral category or one that reflects uncertainty. Research indicates that the reliability of respondents’ ratings declines when using more than 9 rating scale points.25 However, the reliability of a scale increases when the number of rating scale points is increased, with maximum benefit achieved with 5 or 7 scale points.25,26 Since the objective of using scales is to gauge respondent’s preferences, it is sometimes argued that a middle point or category of uncertainty category should not be used. Odd-numbered rating scales, however, conform better with the underlying tenets of many statistical tests, suggesting the need for including this category.29 As the number of rating scale points increases, respondents’ use of the midpoint category decreases substantially. 30 Thus, based on the available literature, it is generally advisable to use between 5 and 7 response categories and an uncertainty category, unless there is a compelling reason to force respondents to choose between 2 competing perspectives or alternatives.
Content
Items should not be included on questionnaires when the only justification for inclusion is that the investigator feels the information “would be really interesting to know.” Rather, for each item, you should ask yourself how it addresses the study’s research question and how it will be used in the data analysis stage of the study. Researchers should develop a data analysis plan in advance of administering a questionnaire to determine exactly how each question will be used in the analysis. When the relationship between a particular item and the study’s research question is unclear, or it is not known how an item will be used in the analysis, the item should be removed from the questionnaire.
Wording and placement
The wording of questions should be kept simple, regardless of the education level of the respondents. Questions should be kept as short and direct as possible since shorter surveys tend to have higher response rates.31,32 Each question should be scrutinized to ensure it is appropriate for the respondents and does not require or assume an inappropriate level of knowledge about a topic. Since first impressions are important for setting the tone of a questionnaire, never begin with sensitive or threatening questions.33 Questionnaires should begin with simple, introductory (“warm-up”)“questions to help establish trust and an appropriate frame of mind for respondents.34 Other successful strategies are: (1) when addressing multiple topics, insert an introductory statement immediately preceding each topic (eg, “In the next section we would like to ask you about …”); (2) request demographic information at the end of the questionnaire; and (3) always provide explicit instructions to avoid any confusion on the part of respondents.35
Additional, clear information on survey content and structure is available in 2 books from Sage Publications.5,36 By following simple guidelines and common sense, most family practice researchers can construct valid and reliable questionnaires. As a final safeguard, once a final draft of the questionnaire is completed, the researcher should always be the first respondent. By placing yourself in the respondent’s role and taking the time to think about and respond to each question, problems with the instrument that were overlooked are sometimes identified.
Analyzing surveys
It is not within the scope of this project to address statistical analysis of survey data. Before attempting data analysis, investigators should receive appropriate training or consult with a qualified professional. There are 3 topics that can and should be understood by novice researchers related to data analysis (Figure D, Developing a Framework for Analysis).
Coding
Before analyzing survey data it is necessary to assign numbers (codes) to the responses obtained. Since the computer program that is used for analyzing data does not know what the numbers mean, the researcher assigns meaning to the codes so that the results can be interpreted correctly. Coding refers to the process of developing the codes, assigning them to responses, and documenting the decision rules used for assigning specific codes to specific response categories. For example, almost all questionnaires contain missing values when respondents elect to not answer an item. Unique codes need to be assigned to distinguish between an item’s missing values, items that may not be applicable to a particular respondent, and responses that have a “none” or “no opinion” category.
Data can be entered into appropriate data files once codes have been assigned to responses and a codebook compiled that defines the codes and their corresponding response categories. It is important to ensure that the data are free of errors (are clean) prior to performing data analysis. Although many methods can be used for data cleaning (ie, data can be entered twice and results compared consistency), at a minimum all of the codes should be checked to ensure only legitimate codes appear.
Frequency distributions are tables produced by statistical software that display the number of respondents in each response category for each item (variable) used in the analysis. By carefully examining frequency tables, the researcher can check for illegitimate codes. Frequency tables also display the relative distribution of responses and allow identification of items that do not conform to expectations given what is known about the study population.
Sample size
Since it is usually not possible to study all of the members of the group (population) of interest in a study, a subset (sample) of the population is generally selected for study from the sampling frame. Sampling is the process by which study subjects are selected from the target population, while the sample frame is the members of a population who have a chance of being included in the survey. In probability samples, each member of the sampling frame has a known probability of being selected for the study, whereas in nonprobability samples, the probability of selection is unknown. When a high degree of precision in sampling is needed to unambiguously identify the magnitude of a problem in a population or the factors that cause the problem, then probability sampling techniques must be used.
When conducting an analytical study that examines precisely whether statistically significant differences exist between groups in a population, power analysis is used to determine what size sample is needed to detect the differences. Estimates of sample size based on power are inversely related to the expected size of the differences “(effect size)”-that is, detecting smaller differences requires a larger sample. If an analytical study is undertaken to determine the magnitude of the differences between 2 groups, it is necessary to work with a statistician or other methodology expert to perform the appropriate power analysis. For a basic but valuable description of sample size estimation, see chapter 13 of Hulley and Cummings.21
In contrast to analytical studies, exploratory and descriptive studies can frequently be conducted without the need for a power analysis. While some descriptive studies may require the use of probability techniques and precise sample estimates, this often is not the case for studies that establish the existence of a problem or estimating its dimensions. When conducting an exploratory or descriptive study using a survey design and a nonprobability sampling technique, considerations other than effect size or precision are used to determine sample size. For example, the availability of eligible respondents, limitations of time and resources, and the need for pilot study data can all contribute to selecting a nonprobability sample. When these types of sampling techniques are used, however, it is important to remember that the validity and reliability of the findings are not assured, and the findings cannot be used to demonstrate the existence of differences between groups. The findings of these types of studies are only suggestive and have limited application beyond the specific study setting.
Response rate
The response rate is a measure indicating the percentage of the identified sample that completed and returned the questionnaire. It is calculated by dividing the number of completed questionnaires by the total sample size identified for the study. For example, if a study is mailed to 500 physicians questionnaires and 100 returned a completed questionnaire, the response rate would be 20% (100/500).
The response rate for mailed questionnaires is extremely variable. Charities are generally content with a 1% to 3% response rate, the US Census Bureau expects to achieve a 99% rate, and among the general population, a 10% response rate is not uncommon. Although an 80% response rate is possible from an extremely motivated population, a rate of 70% is generally considered excellent.34
The effect of nonresponse on the results of a survey depend on the degree to which those not responding are systematically different from the population from which they are drawn.24 When the response rate is high (ie, 95%), the results obtained from the sample will likely provide accurate information about the target population (sampling frame) even if the nonrespondents are distinctly different. However, if nonrespondents differ in a systematic way from the target population and the response rate is low, bias in how much the survey results accurately reflect the true characteristics of the target population is likely.
When calculating the response rate, participants who have died or retired can be removed from the denominator as appropriate. Nonrespondents, however, who refuse to participate, do not return the survey, or have moved should be included. This bias tends to be more problematic in “sensitive” areas of research37 than in studies of common, nonthreatening topics.38 Imputing values for missing data from nonrespondents is complex and generally should not be undertaken.39
Given the importance of response rate, every effort must be made to obtain as many completed questionnaires as possible and strategies to maximize the response rate should be integrated into the study design (see Dillman23 for a useful discussion of successful strategies). Some simple means for improving response rates include constructing a short questionnaire, sending a well-written and personalized cover letter containing your signature, and emphasizing the importance of the study and the confidentiality of responses. It is also advisable to include a self-addressed, stamped envelope for return responses, and sometimes a small incentive is worthwhile. The National Center for Education Statistics notes that all surveys require some follow-up to achieve desirable response rates.40 Survey researchers, therefore, should develop procedures for monitoring responses and implement follow-up plans shortly after the survey begins.
Generally, 2 or 3 mailings are used to maximize response rates. Use of post card reminders is an inexpensive, though untested, method to increase response. Several randomized studies have reported an increase in response rate from physicians in private practice with the use of monetary incentives, although the optimum amount is debated. Everett et al40 compared the use of a $1 incentive vs no monetary incentive and found a significant increase with the incentive group (response rates: 63% in the $1 group; 45% in the no incentive group; P < .0001).41 Other studies have compared $2, $5, $10, $20, and $25 incentives and found that $2 or $5 incentives are most cost effective.4245 Similar findings have been reported for physician surveys in other countries.31,46 In an assessment of incentive for enrollees in a health plan, a $2 incentive was more cost effective than a $5 incentive.47 A $1 incentive was as effective as $2 in significantly increasing response rate in a low-income population.48 Quality of responses have not varied by use of incentives and there does not appear to be an incentive-bias.
Use of lottery appears to also increase response rate in both physicians and the lay public, although there are no studies comparing lottery to a monetary incentive enclosed for all participants.31,49 Use of either certified or priority return mail appears to increase response rates, and may be more cost effective when used for the second mailing.45,48
Pilot testing
Though pilot testing is generally included in the development of a survey, it is often inadequately conducted Figure F Final Preparation). Frequently, investigators are eager to answer their research question and pilot testing is synonymous with letting a few colleagues take a quick look and make a few comments. Table 2 illustrates a problem that could have been avoided with proper pilot testing.10 One of the questions in the survey asked about how time is allotted for faculty to pursue scholarly activities and research (Format A). Unfortunately, the question mixes 2 types of time in 1 question: extended time away from the institution (sabbatical and mini-sabbatical) and time in the routine schedule. This was confusing to respondents and could have been avoided by separating the content into 2 separate questions (Format B).
Investigators should consider carefully whom to include in the pilot testing. Not only should this include the project team and survey “experts”, but it should also include a sample of the target audience. Pilot testing among multiple groups provides feedback about the wording and clarity of questions, appropriateness of the questions for the target population, and the presence of redundant or unnecessary items.
Conclusions
One of the authors (C.R.W.) recently worked on her first questionnaire project. Among the many lessons she learned was the value of a team in providing assistance, the importance of considering if the time spent on a particular activity makes it cost effective, and the need to be flexible depending on circumstances. She found that establishing good communication with the team cuts down on errors and wasted effort. Rewarding the team for all of their hard work improves morale and provides a positive model for future projects.
The mailed self-administered questionnaire is an important tool in primary care research. For family practice to continue its maturation as a research discipline, family practitioners need to be conversant in survey methodology and familiar with its pitfalls. We hope this primer-designed specifically for use in the family practice setting-will provide not only basic guidelines for novices but will also inspire further investigation.
Acknowledgments
The authors thank Laura Snell, MPH, for her thoughtful review of the manuscript. We also thank Olive Chen, PhD, for research assistance and Janice Rookstool for manuscript preparation.
1. Siebert C, Lipsett LF, Greenblatt J, Silverman RE. Survey of physician practice behaviors related to diabetes mellitus in the U.S. I. Design and methods. Diabetes Care 1993;16:759-64.
2. Weller AC. Editorial peer review: methodology and data collection. Bull Med Libr Assoc 1990;78:258-70.
3. Myerson S. Improving the response rates in primary care research. Some methods used in a survey on stress in general practice since the new contract (1990). Fam Pract 1993;10:342-6.
4. PsycINFO: your source for psychological abstracts. PsycINFO Web site. Available at: http://www.apa.org/psycinfo. Accessed April 11, 2002.
5. Converse JM, Presser S. Survey Questions: Handcrafting The Standardized Questionnaire. Quantitative Applications in the Social Sciences. Newbury Park, CA: Sage Publications; 1986.
6. Cox J. Your Opinion, Please!: How to Build the Best Questionnaires in the Field of Education. Thousand Oaks, CA: Corwin Press; 1996.
7. Fink A. ed The Survey Kit. Thousand Oaks, CA: Sage Publications; 1995.
8. Fowler F. Survey Research Methods. Applied Social Research Methods Series. Newbury Park, CA: Sage Publications; 1991.
9. Fowler F. Improving Survey Questions. Applied Social Research Methods Series. Newbury Park, CA: Sage Publications; 1995.
10. Oeffinger KC, Roaten SP, , Jr. Ader DN, Buchanan RJ. Support and rewards for scholarly activity in family medicine: a national survey. Fam Med 1997;29:508-12.
11. Oeffinger KC, Snell LM, Foster BM, Panico KG, Archer RK. Diagnosis of acute bronchitis in adults: a national survey of family physicians. J Fam Pract 1997;45:402-9.
12. Oeffinger KC, Snell LM, Foster BM, Panico KG, Archer RK. Treatment of acute bronchitis in adults. A national survey of family physicians. J Fam Pract 1998;46:469-75.
13. Oeffinger KC, Eshelman DA, Tomlinson GE, Buchanan GR. Programs for adult survivors of childhood cancer. J Clin Oncol 1998;16:2864-7.
14. Robinson MK, DeHaven MJ, Koch KA. The effects of the patient self-determination act on patient knowledge and behavior. J Fam Pract 1993;37:363-8.
15. Murphee DD, DeHaven MJ. Does grandma need condoms: condom use among women in a family practice setting. Arch Fam Med 1995;4:233-8.
16. DeHaven MJ, Wilson GR, Murphee DD, Grundig JP. An examination of family medicine residency program director’s views on research. Fam Med 1997;29:33-8.
17. Smith GE, DeHaven MJ, Grundig JP, Wilson GR. African-American males and prostate cancer: assessing knowledge levels in the community. J Natl Med Assoc 1997;89:387-91.
18. DeHaven MJ, Wilson GR, O’Connor PO. Creating a research culture: what we can learn from residencies that are successful in research. Fam Med 1998;30:501-7.
19. Koch KA, DeHaven MJ, Robinson MK. Futility: it’s magic. Clinical Pulmonary Medicine 1998;5:358-63.
20. Rogers J. Family medicine research: a matter of values and vision. Fam Med 1995;27:180-1.
21. Hulley SB, Cummings S, eds. Designing Clinical Research: An Epidemiological Approach. Baltimore, MD: Williams & Wilkins; 1988.
22. Babbie E. Survey research methods. Belmont, CA: Wadsworth Publishing; 1973.
23. Dillman DA. Mail and Telephone Surveys: The Total Design Method. New York: John Wiley & Sons; 1978.
24. Carmines EG, Zeller R. Reliability and Validity Assessment. Quantitative Applications in the Social Sciences, 17. Newbury Park, CA: Sage Publications; 1979.
25. Preston CC, Colman AM. Optimal number of response categories in rating scales: reliability, validity, discriminating power, and respondent p. Acta Psychol (Amst) 2000;104:1-15.
26. Bandalos DL, Enders CK. The effects of non-normality and number of response categories on reliability. Appl Meas Ed 1996;9:151-60.
27. Cicchetti DV, Showalter D, Tyrer PJ. The effect of number of rating scale categories on levels of interrater reliability: a Monte Carlo investigation. Appl Psychol Meas 1985;9:31-6.
28. Nunnally JC. Psychometric Theory. New York: McGraw-Hill; 1967.
29. Likert R. A technique for the measurement of attitudes. Arch Psychol 1932;140:55.-
30. Matell MS, Jacoby J. Is there an optimal number of alternatives for Likert scale items? Effects of testing time and scale properties. J Appl Psychol 1972;56:506-9.
31. Kalantar JS, Talley NJ. The effects of lottery incentive and length of questionnaire on health survey response rates: a randomized study. J Clin Epidemiol 1999;52:1117-22.
32. Yammarino FJ, Skinner SJ, Childers TL. Understanding mail survey response behavior: a meta-analysis. Public Opin Q 1991;55:613-39.
33. Bailey KD. Methods of Social Research. New York: The Free Press; 1994.
34. Backstrom CH, Hursh-Cesar G. Survey Research. 2nd ed. New York: John Wiley & Sons; 1981.
35. Babbie E. The Practice of Social Research. Belmont, CA: Wadsworth Publishing; 1989.
36. Fowler FJ. Survey Research Methods. Applied Social Research Methods, Volume 1. Newbury Park, CA: Sage Publications; 1988.
37. Hill A, Roberts J, Ewings P, Gunnell D. Non-response bias in a lifestyle survey. J Public Health Med 1997;19:203-7.
38. O’Neill TW, Marsden D, Silman AJ. Differences in the characteristics of responders and non-responders in a prevalence survey of vertebral osteoporosis. European Vertebral Osteoporosis Study Group. Osteoporos Int 1995;5:327-34.
39. Jones J. The effects of non-response on statistical inference. J Health Soc Policy 1996;8:49-62.
40. National Center for Education Statistics. Standard for achieving acceptable survey response rates, NCES Standard: II-04-92. 2001. Available at: http://www.nces.ed.gov/statprog/Stand11_04.asp. Last accessed April 11, 2002.
41. Everett SA, Price JH, Bedell AW, Telljohann SK. The effect of a monetary incentive in increasing the return rate of a survey to family physicians. Eval Health Prof 1997;20:207-14.
42. Asch DA, Christakis NA, Ubel PA. Conducting physician mail surveys on a limited budget. A randomized trial comparing $2 bill versus $5 bill incentives. Med Care 1998;36:95-9.
43. VanGeest JB, Wynia MK, Cummins DS, Wilson IB. Effects of different monetary incentives on the return rate of a national mail survey of physicians. Med Care 2001;39:197-201.
44. Tambor ES, Chase GA, Faden RR, Geller G, Hofman KJ, Holtzman NA. Improving response rates through incentive and follow-up: the effect on a survey of physicians’ knowledge of genetics. Am J Public Health 1993;83:1599-603.
45. Kasprzyk D, Montano DE, St Lawrence JS, Phillips WR. The effects of variations in mode of delivery and monetary incentive on physicians’ responses to a mailed survey assessing STD practice patterns. Eval Health Prof 2001;24:3-17.
46. Deehan A, Templeton L, Taylor C, Drummond C, Strang J. The effect of cash and other financial inducements on the response rate of general practitioners in a national postal study. Br J Gen Pract 1997;47(415):87-90.
47. Shaw MJ, Beebe TJ, Jensen HL, Adlis SA. The use of monetary incentives in a community survey: impact on response rates, data quality, and cost. Health Serv Res 2001;35:1339-46.
48. Gibson PJ, Koepsell TD, Diehr P, Hale C. Increasing response rates for mailed surveys of Medicaid clients and other low-income populations. Am J Epidemiol 1999;149:1057-62.
49. Baron G, De Wals P, Milord F. Cost-effectiveness of a lottery for increasing physicians’ responses to a mail survey. Eval Health Prof 2001;24:47-52.
Address correspondence to Cristen R. Wall, MD, The University of Texas Southwestern Medical Center, Department of Family Practice and Community Medicine, 6263 Harry Hines Boulevard, Dallas, TX 75390-9067. E-mail: Cristen.[email protected].
To submit a letter to the editor on this topic, click here:[email protected].
Racial and ethnic disparities in the quality of primary care for children
OBJECTIVES: Healthy People 2010 calls for greater access to high-quality primary care as a means to reduce racial and ethnic disparities in children’s health. Disparities in primary care quality have rarely been studied for children, and the few studies that have been conducted among adults are not readily applicable to children because of the different health care needs of the 2 populations. This study compared the quality of primary care experienced specifically by children of different racial and ethnic groups.
STUDY DESIGN: We used a random cross-sectional community sample of children. Parents were questioned via structured telephone interview with the Primary Care Assessment Tool about a selected child’s primary care experiences. Responses were compared across racial and ethnic groups, with white children as the reference group.
POPULATION: The sample consisted of parents of 413 elementary school children, ages 5 to 12 years, enrolled in 1 school district spanning 3 suburban cities in San Bernardino County, California.
OUTCOMES MEASURED: We measured cardinal features of primary care quality including first-contact care (accessibility and utilization), longitudinality (strength of affiliation and interpersonal relationship), comprehensiveness (services offered and received), and coordination of care.
RESULTS: After controlling for family demographics, socioeconomic status, and health system characteristics, minority children experienced poorer quality of primary care across most domains of care compared with white children. Asian Americans reported the lowest quality of care across most domains, but particularly in first-contact utilization, interpersonal relationship, and comprehensiveness of services received.
CONCLUSIONS: Racial and ethnic disparities in quality persist in many aspects of primary care delivery. The findings suggested that these disparities are not simply reflections of ability to pay, health disparities, sociodemographics, or racial variations in expectations for care. The findings in this study that parents of minority children, in particular Asian Americans, report lower quality of primary care is consistent with previous research among adults but had not been demonstrated previously for children.
- Asian American children experience the greatest disparities in quality across most aspects of primary care delivery. Asian children had the largest deficits in seeking first-contact care from their providers, establishing effective patient-provider interpersonal relationships, and receiving the full complement of preventive services. The results suggest that racial disparities in primary care quality are not simply a reflection of ability to pay, health status disparities, or racial differences in expectations for care.
- Health plans and providers should extend efforts to encourage development of a regular source of primary care for minority children, in particular Asian Americans. Delivery of high-quality primary care is particularly important for Asian American children because they are more likely to be in poor health and at greater risk for contracting certain communicable diseases than other racial groups.
Substantial disparities in children’s health and health care continue to exist across racial and ethnic groups in the United States.1-4 With the release of Healthy People 2010, the United States has reaffirmed its commitment to eliminating these growing racial and economic disparities in children’s health. Healthy People 2010 calls for greater and more equitable delivery of high-quality primary care* and prevention to reduce these disparities. A strong primary care-oriented health care system is associated with more frequent and complete delivery of preventive services for children,7-10 fewer complications from chronic illnesses,11-14 and better health outcomes.15-17
However, intensifying pressures to contain medical care costs in the US health care system have meant that even children with financial access to care are not guaranteed to receive high quality primary care. The for-profit nature of many health care delivery systems continues to raise serious concerns about quality because of the financial interest to reduce use of services. Safety-net providers such as community health centers are being forced to compete in the market-driven system and may have to compromise the quality of care they provide to vulnerable, primarily minority populations.18 Because of these concerns, consumers, providers, purchasers, and federal and state agencies are demanding better monitoring of the quality of primary care, particularly for vulnerable populations.19
Previous studies have identified significant racial and ethnic disparities in the quality of primary care among adults. Shi used nationally representative data from the Medical Expenditure Panel Survey and found that racial and ethnic minority adults experience worse primary care across most of its cardinal attributes, with the greatest differences being in the accessibility of medical care.20 Murray-Garcia and colleagues21 also found that Asian American adults tend to report the lowest quality of primary care among racial and ethnic groups, although the results may be attributable in part to differences in patient expectations or survey response practices rather than to actual differences in quality. In 2 separate studies, Taira and colleagues22,23 previously demonstrated similar findings regarding lower reported quality of primary care among Asian American adults. Finally, Morales et al24 found that, with the exception of Asians and Pacific Islanders, there were few differences between minorities and whites in satisfaction with primary care and ratings of access and communication.
Studies of primary care among adults, however, are not readily applicable to children for several reasons.25 First, a unique set of primary care financing, organization, and delivery systems has been developed for children. Examples include the recent State Children’s Health Insurance Program and nontraditional delivery settings such as school-based health centers. Second, childhood is a unique developmental stage of life during which children’s health care experiences strongly influence their future health and health care utilization. Third, primary care for children emphasizes preventive care rather than acute care as for adults and therefore must be evaluated differently.
Racial and ethnic disparities in primary care quality have rarely been studied for children.26 Although several studies have evaluated racial differences in children’s use of primary care services, few have evaluated racial differences in more qualitative primary care experiences. Weech-Maldonado and colleagues, conducting the only study of this type, found that Asian, black, and Hispanic children experienced poorer access, timeliness to care, and communication with providers compared to whites. However, language appeared to play an important factor in these disparities.27
The purpose of this study was to examine racial and ethnic differences in the quality of primary care specifically for children. Primary care was uniquely assessed, pursuant to the Institute of Medicine’s definition, with the use of a reliable and valid instrument asking parents to report on, rather than rate, the quality of care for their children. The study sought to identify deficits in primary care quality among children to lay groundwork for the development of clinical strategies and health care policies to eliminate health disparities.
Methods
Study design and setting
A cross-sectional community-based survey was conducted in a random sample of 1200 parents of elementary school children in 1 school district. The district spans 3 large suburban communities in San Bernardino County, California, near Los Angeles. The area encompasses a population of about 300,000 and approximately 17% of the population live in poverty. In San Bernardino County, there are 72.5 health care providers per 100,000 inhabitants; this rate is lower than the overall rate of 90 providers per 100,000 for the State of California.28 Because the county has several rural areas (with low physician presence) that are not served by the school district, the physician ratio is likely to be an underestimate for the more urban geographic area under study.
A school district was selected as the setting for this study because it provides the single most comprehensive list of children in a community. A community sample avoids the biases associated with research based in provider settings that generally include only the most frequent users of health services.
The school district serves a population of 18,000 racially and socioeconomically diverse elementary school children in 20 elementary schools (kindergarten through grade 6). The racial and ethnic makeup of the population is approximately 43% Hispanic; 42% white; 10% Asian, Filipino, and Pacific Islander; 5% black; and fewer than 1% American Indian. The sampling frame was sorted and systematically sampled by the child’s sex, grade level, and school strata to ensure that the sample was representative of the community. To improve the analytic capacity of the sample, Asian and black subgroups were oversampled at 4 times the rate for Asians (compared with whites) and 16 times the rate for blacks to obtain approximately equal numbers of respondents across racial and ethnic groups.
In San Bernardino County, as in a growing number of other counties in California and throughout the United States, non-white racial and ethnic groups are beginning to represent more of the population. In this study, Hispanics are the numerical majority, but we continue to use the term “minority” to represent Asian, black, and Hispanic racial and ethnic groups because in most areas of the United States these groups continue to be the numerical minority.
Data collection
The Johns Hopkins University Office for Research Subjects approved the survey instrument and administration procedures. Questionnaires were administered through structured telephone interviews between November 2000 and January 2001.
Two rounds of informational mailers were sent to parents in advance of contact by telephone. To maintain legal privacy protections for parents, clerks employed by the school district made initial contact with families to schedule appointments for interviewers to complete the telephone interview. Reminder letters were mailed to parents who had scheduled an appointment but were not reached by telephone contact.
Of the original sample of 1200 children, 289 families had moved or left the school district, disconnected their telephone number, or had a telephone number that was busy or not answered on repeated (10+) attempts; 59 families were unable to participate because of language difficulties. Parents who reported to the study clerks that they were unable to complete the survey in English or Spanish were excluded from participation. Negative terming of 2 questions and alternate wording of 2 similar questions were used to check comprehension. Concern was raised in 1 case, but this was resolved through follow-up questioning.
Interviews were completed with the families of 413 children. After subtracting the unreachable families from the original sampling frame, the overall response rate was 49%. Children without a regular source of care were excluded from the analyses, leaving 403 respondents in the analytic sample.
Nonrespondents were similar to respondents in terms of child’s sex, race and ethnicity, and school in which the child was enrolled. Respondents were slightly more likely than nonrespondents (P < .05) to have a younger child (mean age = 8.1 vs 8.4 years). Data for these comparisons were available through an administrative data set provided by the school district and assembled each school year through an enrollment form completed by parents.
Measurement
Race and ethnicity. Race data were available through the parent-completed school enrollment files provided by the school district. The categories of race or ethnicity were white (non-Hispanic), Hispanic, black (non-Hispanic), Asian, Filipino, Pacific Islander, and American Indian. To ensure a sufficiently large sample size, we combined Asian, Filipino, and Pacific Islander into a single category called Asian. We also excluded American Indian from the study sample because of extremely small numbers.
Primary care quality. For this study we used the Pediatric Primary Care Assessment Tool (PCAT) developed by the Johns Hopkins Primary Care Policy Center for the Underserved to evaluate 4 cardinal attributes of primary care quality: first-contact care, longitudinality, comprehensiveness, and coordination Table 1. Scale scores were generated for each attribute based on summed responses to questions, with 4 Likert-type response choices: definitely (score = 4), probably (score = 3), probably not (score = 2), and definitely not (score = 1). “Don’t know” responses were coded as the middle score (2.5) because we assumed that not knowing about an important feature of primary care signified some partial failure to convey the availability of that particular feature. For example, parents’ not knowing whether their child could receive immunizations from the provider signified some partial communication failure on the part of the provider. Both child and adult versions of the instrument have been developed, the reliability and validity of which are reported elsewhere.29,30
Within each cardinal attribute, the PCAT assesses structural characteristics of the facility or provider that reflect the capacity to achieve quality primary care and processes of care that indicate the achievement of the function in actual practice. Only patients who reported a regular source of care (n = 403) were asked to assess the quality of primary care.
First-contact care. Two subdomains of first-contact care are measured by the PCAT: accessibility of the provider and the degree to which the provider is used as a single point of entry into the medical care system. Accessibility is evaluated with 8 questions about characteristics of the health system that facilitate access (eg, If the facility is open on weekends, would the provider see the child the same day?). The utilization subdomain is scored with an algorithm that assigns a higher score for each type of service (acute illness, regular check-up, and immunizations) that is sought from the parent-identified regular source of care.
Longitudinality. Two subdomains of longitudinality are measured by the PCAT: interpersonal relationship with the provider and extent of affiliation. The relationship subdomain is evaluated with 14 questions concerning the parents’ perception of the “person orientation” of the interactions between provider, parents and child (eg, the degree of interest the provider has in the child as a person rather than as someone with a medical problem). The extent of affiliation subdomain addresses the extent of the child’s relationship with a specific provider. This is scored with an algorithm that assigns a higher score if the provider identified as the regular source of care also knows the child best and is the provider from whom care would be sought for a new problem.
Comprehensiveness. Two subdomains of comprehensiveness are measured by the PCAT: services available and services provided. Six questions address the availability of specific primary care services (eg, immunizations and tests for lead poisoning). Another 5 questions address the services received from the primary care source (eg, discussions of ways to stay healthy such as eating nutritious foods and getting enough sleep).
Coordination. For children who have visited a specialist (n = 135), 7 questions address the degree of interaction and integration between the primary care physician and specialist services (eg, Did the primary care provider know that you made the visit to the specialist?).
Covariates. We selected covariates based on previous studies demonstrating a relation between the variables and aspects of primary care quality such as accessibility and continuity of care. We controlled for socioeconomic status (income, employment, and education), characteristics of the health care system (provider specialty, practice setting, and cost-sharing requirements), and demographics (child’s age, sex, general health status, and insurance coverage). Because of extensive managed care penetration in California, we clarified the range of practice settings by using names of local managed care clinics, public health centers, and group practices as examples.
Analysis
The independent variable was racial and ethnic background, and its analytic categories included Asian, black, Hispanic, and white. Comparisons were made between race or ethnicity and the study covariates and scores for the primary care subdomains. Frequencies of the study covariates were compared across racial and ethnic groups, and the significance of these differences was assessed with chi-squared tests of association. Generalized linear model procedures were used to assess differences in primary care quality across racial and ethnic groups after adjusting for study covariates. Bonferroni t tests were used to test significance and account for multiple comparisons.
Two total primary care scores were generated by summing the mean scores for the primary care subdomains. The first total primary care score (A) included coordination of care, a domain that was answered only by a subset of the population that reported they had visited a specialist since they first saw their regular provider. Therefore, total score A was limited to 1 subset of the population (n = 135). The second total primary care score (B) did not include coordination of care and thus included the full study sample.
Multiple linear regression analyses were conducted to predict primary care quality. Four models were constructed incrementally, with the first including only dummy variables of race and ethnicity (with white “race” as the reference group). Additional models controlled for (1) socioeconomic status covariates, (2) health system characteristics, and (3) socioeconomic status, health system characteristics, and demographics. The models were constructed separately for primary care scores A and B. Regression coefficients and respective P values are reported for race/ethnicity categories and study covariates. The coefficient of determination (R2 and adjusted R2) is reported for each model to describe how much of the variance in primary care quality was explained by the study variables.
Table 2 compares the unadjusted socioeconomic status, health system characteristics, and demographic factors of our analytic sample across racial and ethnic groups. As per the sampling strategy, respondents were nearly equally divided among the 4 categories of race and ethnicity. Most respondents (74.3%) had family incomes greater than $36,000/year, although a significantly smaller proportion of black (64.2%) and Hispanic (67.7%) families had incomes above this amount compared with whites (90.2%) and Asians (84.0%; P < .001). Racial and ethnic groups also differed in maternal education and employment, with Asians reporting the highest proportion with a high school education or greater (P < .01) and blacks reporting the highest employment among mothers (P < .001).
With regard to health system factors, Asians and whites were most likely to report seeking care at a doctor’s office (58.8% and 57.0%, respectively) compared to seeking care from a health maintenance organization clinic or other setting (P < .001). Hispanics reported the largest proportion of children receiving care from a health maintenance organization clinic setting (39.4%), and Asians reported the smallest proportion (20.6%; P < .05). White respondents had the highest proportion covered by private health insurance (86.6%) and Hispanic respondents had the lowest (79.1%; P < .05). Hispanics were most likely to be uninsured (13.13%; P < .05).
Asians were most likely to report having any cost sharing such as a deductible or co-payment (83.2%; P < .01). There were no significant differences in child’s age, sex, or health status across racial and ethnic groups.
Table 3 compares adjusted primary care quality scores across racial and ethnic groups. The attribute scales were standardized by summing the responses to each question in the attribute and dividing by the number of questions (range, 1-4). In general, Asian, black, and Hispanic parents reported slightly lower quality of primary care than did whites. Minority parents reported lower scores for 6 of the 7 subdomains, although only some of the findings were significant. Asian respondents reported the lowest (or statistically equivalent to the lowest) primary care quality for 5 of the 7 domains, reflecting differences of approximately 5% to 10%. These scores were significantly lower than those reported by whites for first-contact accessibility (P < .05), first-contact utilization (P < .01), interpersonal relationship (P < .05), and comprehensiveness of services received (P < .001). Moreover, Asians reported significantly lower mean scores than did whites for both total primary care scales. Black respondents reported significantly worse first-contact utilization but slightly greater accessibility than did whites, although the difference was not significant.
Table 4 presents 4 multiple regression models for the 2 versions of total primary care quality after successive adjustment for socioeconomic status, health system characteristics, and demographics. In model 1A (not adjusted for any covariates) Asian and black races (vs whites) were significant negative predictors of primary care quality. In model 1B (ie, coordination of care domain excluded) all minority groups (vs whites) were significant negative predictors of quality (P < .01). In models 2B and 3B, after controlling for socioeconomic status and health system characteristics, respectively, 2 additional covariates positively predicted total primary care quality. These were family income greater than $36,000 (P < .01) and having a pediatrician as opposed to any other type of family practitioner or generalist primary care provider (P < .001). Despite the addition of these covariates to models 2 and 3, minority racial and ethnic groups remained significant negative predictors for both versions of primary care quality (P < .05). Asian race remained a particularly significant predictor of quality (P < .001).
In model 4A, which controlled for all covariates, older child age and, nonintuitively, being uninsured were significant positive predictors of quality (likely due to the small number of uninsured respondents). In model 4B, health status was a significant predictor of quality (P < .05). With the addition of the full complement of covariates, Hispanic and black race and ethnicity became nonsignificant in both models despite small changes in the magnitude of the coefficients and P values (.07 and .06, respectively). The loss of significance in this model is likely attributable to the number of variables that was controlled for given the moderate sample size rather than to any confounding effects of specific covariates. In model 4A, Asian race remained a significant negative predictor of quality (P < .05). In model 4B, Asian race remained a strong negative predictor of quality and having a pediatrician remained a strong positive predictor (P < .001 for both). After adjustment for the natural rise in R2 associated with the inclusion of additional covariates, the final models for both total scales (A and B) explained only about 8% and 11%, respectively, of the variation in primary care quality.
Discussion
This community-based study advances the literature by demonstrating that Asian, black, and Hispanic children experience poorer quality of primary care than whites, even after controlling for many differences in socioeconomic status, health system factors, and demographics. This suggests that racial and ethnic differences in quality of care are not simple reflections of ability to pay, health disparities, or other sociodemographics.
The findings in this study that parents of minority children, in particular Asian Americans, report lower quality of primary care is consistent with previous research among adults but has not been demonstrated previously for children.20-24 This finding is particularly important because of the growing numbers of Asian Americans in the United States and because Asian children, despite their family’s higher education, are more likely than whites and some other ethnic groups to be in fair or poor health, underimmunized, and at risk for contracting preventable illnesses such as hepatitis B.31-33 These differences in health and health risk may be remedied in part by the receipt of high-quality primary care.34
Of the primary care measures, the greatest difference between Asians and whites was in comprehensiveness of services received. This domain covered the range of services that patients could receive from their regular provider and included items such as preventive counseling and discussions about growth and development. Although language was unlikely to be a determinant of quality in this study (because we excluded those unable to complete the survey in English or Spanish), it does not discount the potential of undetected or unstudied language difficulties to enhance disparities in health care. For example, even though Asian families in our study were able to communicate sufficiently in English, they might have rated the patient-provider relationship lower because of trouble finding a provider who spoke their language. Regardless, the finding suggests the importance of making services more widely available to minority groups, including improvements in communication about existing primary care services.
An interesting secondary finding was that parents who reported a pediatrician as the child’s regular source of care reported higher quality primary care than did parents reporting other generalist providers. In particular, pediatricians appeared to perform better than other providers on 3 of the attributes: utilization of services (P < .02), patient-provider relationship (P < .0001), and services provided (P < .0001; data not shown). The differences may be attributable in part to the greater frequency of visits to pediatricians for well-child care; thus, greater opportunities may exist for delivery of preventive services and the development of the patient-provider relationship. Future research should explore the experience of minority patients receiving care from various provider specialties.
Despite significant findings, the most comprehensive regression models explained only a small proportion of the variation in primary care quality (about 11%). Other factors that may play a role in determining primary care quality, but were not included in this analysis, include health insurance plan restrictions (discussed in an upcoming paper), practice arrangements, racial concordance between the patient and provider, family mobility, and perhaps provider-specific factors such as training or years in practice.
This study has several limitations. First, the cross-sectional design and analysis allowed the demonstration of association and not of causality. Second, this study examined only 4 broad classifications of race and ethnicity that do not capture within-group variations in ethnicity or culture that could be associated with differences in quality of care received. Standard measurements of race and ethnicity also do not fully capture biologic, cultural, socioeconomic, and political aspects of multiculturalism that may interact and produce more complex findings than those reported.35
Third, because of the moderate response rate, the respondents in this study may not be fully representative of the population under study. Although respondents were demographically similar to nonrespondents, participants may have been more likely than nonrespondents to have children in poorer health status or have more negative experiences with the health care system. Although this does not threaten the internal validity of this study (because response rates did not differ substantially across racial groups), such bias could lead to lower overall estimates of primary care quality regardless of racial group.
Fourth, studies that rely on patient reporting to compare quality of care across racial groups often may capture racial and ethnic group variations in perceptions of care or different standards for assessing care. In this study, we used an instrument for assessing quality of care that relies heavily on factual reporting (eg, waiting times and receipt of particular services) rather than on satisfaction or performance ratings, so our study was less subject to these biases.
In conclusion, this study demonstrated significant differences in the quality of primary care for children across racial and ethnic groups. These findings in part suggest that ensuring adequate health insurance coverage may not be sufficient to reduce racial and ethnic disparities in quality of care. Although the cause or mechanism of these disparities in quality is not entirely established, the findings encourage careful additional monitoring of the delivery of primary care, in particular to minority children. At a minimum, health care providers and organizations should make primary care services more accessible to minority families, provide the services in a culturally and linguistically competent manner (to encourage the development of the physician-patient relationship), and communicate more effectively with families about the range of child health services offered.
*The Institute of Medicine defines primary care as “the provision of integrated, accessible health care services by clinicians who are accountable for addressing a large majority of personal health care needs, developing a sustained partnership with patients, and practicing in the context of family and community.”5 The practice of primary care is best characterized as a set of attributes or functions that, only when performed together, constitute the delivery of primary care. Empirical studies have further delineated and operationalized 4 core attributes of primary care: first-contact care with a designated primary care physician; longitudinality, or ongoing care, with a physician or place of care; comprehensiveness of services; and coordination or integration of those services6Table 1.
Acknowledgments
The authors thank Barbara Starfield, MD, Lisa Cooper, MD, and Maria Trent, MD, for their thoughtful review of this manuscript. They also thank Jane Lyon for her generous support of and help in coordinating the study in the school district.
1. Newacheck PW, Hughes DC, Stoddard J. Children’s access to primary care: differences by race, income and insurance status. Pediatrics 1996;97:26-32.
2. Weinick RM, Weigers ME, Cohen JW. Children’s health insurance, access to care, and health status: new findings. Health Aff 1998;17 (2):127-36.
3. Halfon N, Inkelas M, Wood D. Nonfinancial barriers to care for children and youth. Annu Rev Public Health 1995;16:447-72.
4. Aday L, Fleming G, Andersen R. Access to Medical Care in the US: Who Has It, Who Doesn’t? Chicago: Pluribus Press; 1984.
5. Donaldson M, Yordy K, Lohr K, Vanselow N. Primary Care: America’s Health in a New Era. Washington DC: National Academy Press; 1996.
6. Starfield B. Primary Care: Balancing Health Needs, Services, and Technology. New York: Oxford University Press; 1998.
7. Bindman AB, Grumbach K, Osmond D, et al. Primary care and receipt of preventive services. J Gen Intern Med 1996;11:269-76.
8. Flocke SA, Strange KC, Zyzanski SJ. The association of attributes of primary care with the delivery of clinical preventive services. J Fam Pract 1998;36(suppl):AS21-30.
9. O’Malley AS, Forrest CB. Continuity of care and delivery of ambulatory services to children in community health clinics. J Comm Health 1996;21:159-73.
10. Lieu TA, Black SB, Ray P, et al. Risk factors for delayed immunization among children in an HMO. Am J Public Health 1994;84:1621-5.
11. Shea S, Misra D, Ehrlich M, et al. Predisposing factors for severe, uncontrolled hypertension in an inner-city minority population. N Engl J Med 1992;327:776-81.
12. Lurie N, Ward N, Shapiro M, Brook R. Termination from Medi-Cal-does it affect health? N Engl J Med 1984;311:480-4.
13. Fihn S, Wicher J. Withdrawing routine outpatient medical services: effects on access and health. J Gen Intern Med 1988;3:356-62.
14. Gill J, Mainous A. The role of provider continuity in preventing hospitalizations. Arch Fam Med 1998;7:352-7.
15. Safran DG, Taira D, Rogers WH, et al. Linking primary care performance to outcomes of care. J Fam Pract 1998;47:213-9.
16. Shi L. The relationship between primary care and life chances. J Health Care Poor Underserved 1992;3:321-5.
17. Shi L. Primary care, specialty care, and life chances. Int J Health Serv 1994;24:431-58.
18. Dievler A, Giovannini T. Community health centers: promise and performance. Med Care Res Rev 1998;55:405-31.
19. McGlynn E, Halfon N. Overview of issues in improving quality of care for children. Health Serv Res 1998;33(4 pt 2):977-1000.
20. Shi L. Experience of primary care by racial and ethnic groups in the United States. Med Care 1999;37:1068-77.
21. Murray-Garcia J, Selby J, Schmittdiel J, et al. Racial and ethnic differences in a patient survey: patients’ values, ratings, and reports regarding physician primary care performance in a large health maintenance organization. Med Care 2000;38:300-10.
22. Taira D, Safran D, Seto T, et al. Do patient assessments of primary care differ by patient ethnicity? HSR 2001;36:1059-71.
23. Taira D, Safran D, Seto T, et al. Asian-American patient ratings of physician primary care performance. J Gen Intern Med 199;12:237-42.
24. Morales L, Elliot M, Weech-Maldonado R, et al. Differences in CAHPS adult survey reports and ratings by race and ethnicity: an analysis of the national CAHPS Benchmarking Data 1.0. HSR 2001;36:595-617.
25. Forrest C, Simpson L, Clancy C. Child health services research. Challenges and opportunities. JAMA 1997;277:1787-93.
26. Mangione-Smith R, McGlynn E. Assessing the quality of healthcare provided to children. Health Serv Res 1998;33(4 pt 2):1059-90.
27. Weech-Maldonado R, Morales L, Spritzer K, et al. Racial and ethnic differences in parents’ assessments of pediatric care in Medicaid managed care. HSR 2001;36:575-94.
28. Health Resources and Services Administration. Community Health Status Report: San Bernardino County, July. Bethesda, MD: US Department of Health and Human Services; 2000.
29. Cassady C, Starfield B, Hurtado M, et al. Measuring consumer experiences with primary care. Pediatrics 2000;105(4 pt 2):998-1003.
30. Shi L, Starfield B, Xu J. Validating the Adult Primary Care Assessment Tool. J Fam Pract 2001;50:E1.-
31. Weigers M, Weinick R, Cohen J. Children’s Health, 1996. Rockville, MD: Agency for Health Care Policy and Research; 1998.
32. Vaccination coverage by race/ethnicity and poverty level among children aged 19-35 months-United States, 1997. MMWR Morb Mortal Wkly Rep 1998;47(44):956-9.
33. Hepatitis B vaccination coverage among Asian and Pacific Islander children-United States, 1998. MMWR Morb Mortal Wkly Rep 2000;49 (27):616-9.
34. Starfield B. Motherhood and apple pie: the effectiveness of medical care for children. Milbank Q 1985;63:523-46.
35. LaVeist T. Beyond dummy variables and sample selection: what health services researchers ought to know about race as a variable. Health Serv Res 1994;29:1-16.
Address reprint requests to Gregory D. Stevens, PhD, MHS, Department of Health Policy and Management, Johns Hopkins University School of Hygiene and Public Health, 624 N. Broadway, Rm. 661, Baltimore, MD 21205. E-mail: [email protected].
To submit a letter to the editor on this topic, click here: [email protected].
OBJECTIVES: Healthy People 2010 calls for greater access to high-quality primary care as a means to reduce racial and ethnic disparities in children’s health. Disparities in primary care quality have rarely been studied for children, and the few studies that have been conducted among adults are not readily applicable to children because of the different health care needs of the 2 populations. This study compared the quality of primary care experienced specifically by children of different racial and ethnic groups.
STUDY DESIGN: We used a random cross-sectional community sample of children. Parents were questioned via structured telephone interview with the Primary Care Assessment Tool about a selected child’s primary care experiences. Responses were compared across racial and ethnic groups, with white children as the reference group.
POPULATION: The sample consisted of parents of 413 elementary school children, ages 5 to 12 years, enrolled in 1 school district spanning 3 suburban cities in San Bernardino County, California.
OUTCOMES MEASURED: We measured cardinal features of primary care quality including first-contact care (accessibility and utilization), longitudinality (strength of affiliation and interpersonal relationship), comprehensiveness (services offered and received), and coordination of care.
RESULTS: After controlling for family demographics, socioeconomic status, and health system characteristics, minority children experienced poorer quality of primary care across most domains of care compared with white children. Asian Americans reported the lowest quality of care across most domains, but particularly in first-contact utilization, interpersonal relationship, and comprehensiveness of services received.
CONCLUSIONS: Racial and ethnic disparities in quality persist in many aspects of primary care delivery. The findings suggested that these disparities are not simply reflections of ability to pay, health disparities, sociodemographics, or racial variations in expectations for care. The findings in this study that parents of minority children, in particular Asian Americans, report lower quality of primary care is consistent with previous research among adults but had not been demonstrated previously for children.
- Asian American children experience the greatest disparities in quality across most aspects of primary care delivery. Asian children had the largest deficits in seeking first-contact care from their providers, establishing effective patient-provider interpersonal relationships, and receiving the full complement of preventive services. The results suggest that racial disparities in primary care quality are not simply a reflection of ability to pay, health status disparities, or racial differences in expectations for care.
- Health plans and providers should extend efforts to encourage development of a regular source of primary care for minority children, in particular Asian Americans. Delivery of high-quality primary care is particularly important for Asian American children because they are more likely to be in poor health and at greater risk for contracting certain communicable diseases than other racial groups.
Substantial disparities in children’s health and health care continue to exist across racial and ethnic groups in the United States.1-4 With the release of Healthy People 2010, the United States has reaffirmed its commitment to eliminating these growing racial and economic disparities in children’s health. Healthy People 2010 calls for greater and more equitable delivery of high-quality primary care* and prevention to reduce these disparities. A strong primary care-oriented health care system is associated with more frequent and complete delivery of preventive services for children,7-10 fewer complications from chronic illnesses,11-14 and better health outcomes.15-17
However, intensifying pressures to contain medical care costs in the US health care system have meant that even children with financial access to care are not guaranteed to receive high quality primary care. The for-profit nature of many health care delivery systems continues to raise serious concerns about quality because of the financial interest to reduce use of services. Safety-net providers such as community health centers are being forced to compete in the market-driven system and may have to compromise the quality of care they provide to vulnerable, primarily minority populations.18 Because of these concerns, consumers, providers, purchasers, and federal and state agencies are demanding better monitoring of the quality of primary care, particularly for vulnerable populations.19
Previous studies have identified significant racial and ethnic disparities in the quality of primary care among adults. Shi used nationally representative data from the Medical Expenditure Panel Survey and found that racial and ethnic minority adults experience worse primary care across most of its cardinal attributes, with the greatest differences being in the accessibility of medical care.20 Murray-Garcia and colleagues21 also found that Asian American adults tend to report the lowest quality of primary care among racial and ethnic groups, although the results may be attributable in part to differences in patient expectations or survey response practices rather than to actual differences in quality. In 2 separate studies, Taira and colleagues22,23 previously demonstrated similar findings regarding lower reported quality of primary care among Asian American adults. Finally, Morales et al24 found that, with the exception of Asians and Pacific Islanders, there were few differences between minorities and whites in satisfaction with primary care and ratings of access and communication.
Studies of primary care among adults, however, are not readily applicable to children for several reasons.25 First, a unique set of primary care financing, organization, and delivery systems has been developed for children. Examples include the recent State Children’s Health Insurance Program and nontraditional delivery settings such as school-based health centers. Second, childhood is a unique developmental stage of life during which children’s health care experiences strongly influence their future health and health care utilization. Third, primary care for children emphasizes preventive care rather than acute care as for adults and therefore must be evaluated differently.
Racial and ethnic disparities in primary care quality have rarely been studied for children.26 Although several studies have evaluated racial differences in children’s use of primary care services, few have evaluated racial differences in more qualitative primary care experiences. Weech-Maldonado and colleagues, conducting the only study of this type, found that Asian, black, and Hispanic children experienced poorer access, timeliness to care, and communication with providers compared to whites. However, language appeared to play an important factor in these disparities.27
The purpose of this study was to examine racial and ethnic differences in the quality of primary care specifically for children. Primary care was uniquely assessed, pursuant to the Institute of Medicine’s definition, with the use of a reliable and valid instrument asking parents to report on, rather than rate, the quality of care for their children. The study sought to identify deficits in primary care quality among children to lay groundwork for the development of clinical strategies and health care policies to eliminate health disparities.
Methods
Study design and setting
A cross-sectional community-based survey was conducted in a random sample of 1200 parents of elementary school children in 1 school district. The district spans 3 large suburban communities in San Bernardino County, California, near Los Angeles. The area encompasses a population of about 300,000 and approximately 17% of the population live in poverty. In San Bernardino County, there are 72.5 health care providers per 100,000 inhabitants; this rate is lower than the overall rate of 90 providers per 100,000 for the State of California.28 Because the county has several rural areas (with low physician presence) that are not served by the school district, the physician ratio is likely to be an underestimate for the more urban geographic area under study.
A school district was selected as the setting for this study because it provides the single most comprehensive list of children in a community. A community sample avoids the biases associated with research based in provider settings that generally include only the most frequent users of health services.
The school district serves a population of 18,000 racially and socioeconomically diverse elementary school children in 20 elementary schools (kindergarten through grade 6). The racial and ethnic makeup of the population is approximately 43% Hispanic; 42% white; 10% Asian, Filipino, and Pacific Islander; 5% black; and fewer than 1% American Indian. The sampling frame was sorted and systematically sampled by the child’s sex, grade level, and school strata to ensure that the sample was representative of the community. To improve the analytic capacity of the sample, Asian and black subgroups were oversampled at 4 times the rate for Asians (compared with whites) and 16 times the rate for blacks to obtain approximately equal numbers of respondents across racial and ethnic groups.
In San Bernardino County, as in a growing number of other counties in California and throughout the United States, non-white racial and ethnic groups are beginning to represent more of the population. In this study, Hispanics are the numerical majority, but we continue to use the term “minority” to represent Asian, black, and Hispanic racial and ethnic groups because in most areas of the United States these groups continue to be the numerical minority.
Data collection
The Johns Hopkins University Office for Research Subjects approved the survey instrument and administration procedures. Questionnaires were administered through structured telephone interviews between November 2000 and January 2001.
Two rounds of informational mailers were sent to parents in advance of contact by telephone. To maintain legal privacy protections for parents, clerks employed by the school district made initial contact with families to schedule appointments for interviewers to complete the telephone interview. Reminder letters were mailed to parents who had scheduled an appointment but were not reached by telephone contact.
Of the original sample of 1200 children, 289 families had moved or left the school district, disconnected their telephone number, or had a telephone number that was busy or not answered on repeated (10+) attempts; 59 families were unable to participate because of language difficulties. Parents who reported to the study clerks that they were unable to complete the survey in English or Spanish were excluded from participation. Negative terming of 2 questions and alternate wording of 2 similar questions were used to check comprehension. Concern was raised in 1 case, but this was resolved through follow-up questioning.
Interviews were completed with the families of 413 children. After subtracting the unreachable families from the original sampling frame, the overall response rate was 49%. Children without a regular source of care were excluded from the analyses, leaving 403 respondents in the analytic sample.
Nonrespondents were similar to respondents in terms of child’s sex, race and ethnicity, and school in which the child was enrolled. Respondents were slightly more likely than nonrespondents (P < .05) to have a younger child (mean age = 8.1 vs 8.4 years). Data for these comparisons were available through an administrative data set provided by the school district and assembled each school year through an enrollment form completed by parents.
Measurement
Race and ethnicity. Race data were available through the parent-completed school enrollment files provided by the school district. The categories of race or ethnicity were white (non-Hispanic), Hispanic, black (non-Hispanic), Asian, Filipino, Pacific Islander, and American Indian. To ensure a sufficiently large sample size, we combined Asian, Filipino, and Pacific Islander into a single category called Asian. We also excluded American Indian from the study sample because of extremely small numbers.
Primary care quality. For this study we used the Pediatric Primary Care Assessment Tool (PCAT) developed by the Johns Hopkins Primary Care Policy Center for the Underserved to evaluate 4 cardinal attributes of primary care quality: first-contact care, longitudinality, comprehensiveness, and coordination Table 1. Scale scores were generated for each attribute based on summed responses to questions, with 4 Likert-type response choices: definitely (score = 4), probably (score = 3), probably not (score = 2), and definitely not (score = 1). “Don’t know” responses were coded as the middle score (2.5) because we assumed that not knowing about an important feature of primary care signified some partial failure to convey the availability of that particular feature. For example, parents’ not knowing whether their child could receive immunizations from the provider signified some partial communication failure on the part of the provider. Both child and adult versions of the instrument have been developed, the reliability and validity of which are reported elsewhere.29,30
Within each cardinal attribute, the PCAT assesses structural characteristics of the facility or provider that reflect the capacity to achieve quality primary care and processes of care that indicate the achievement of the function in actual practice. Only patients who reported a regular source of care (n = 403) were asked to assess the quality of primary care.
First-contact care. Two subdomains of first-contact care are measured by the PCAT: accessibility of the provider and the degree to which the provider is used as a single point of entry into the medical care system. Accessibility is evaluated with 8 questions about characteristics of the health system that facilitate access (eg, If the facility is open on weekends, would the provider see the child the same day?). The utilization subdomain is scored with an algorithm that assigns a higher score for each type of service (acute illness, regular check-up, and immunizations) that is sought from the parent-identified regular source of care.
Longitudinality. Two subdomains of longitudinality are measured by the PCAT: interpersonal relationship with the provider and extent of affiliation. The relationship subdomain is evaluated with 14 questions concerning the parents’ perception of the “person orientation” of the interactions between provider, parents and child (eg, the degree of interest the provider has in the child as a person rather than as someone with a medical problem). The extent of affiliation subdomain addresses the extent of the child’s relationship with a specific provider. This is scored with an algorithm that assigns a higher score if the provider identified as the regular source of care also knows the child best and is the provider from whom care would be sought for a new problem.
Comprehensiveness. Two subdomains of comprehensiveness are measured by the PCAT: services available and services provided. Six questions address the availability of specific primary care services (eg, immunizations and tests for lead poisoning). Another 5 questions address the services received from the primary care source (eg, discussions of ways to stay healthy such as eating nutritious foods and getting enough sleep).
Coordination. For children who have visited a specialist (n = 135), 7 questions address the degree of interaction and integration between the primary care physician and specialist services (eg, Did the primary care provider know that you made the visit to the specialist?).
Covariates. We selected covariates based on previous studies demonstrating a relation between the variables and aspects of primary care quality such as accessibility and continuity of care. We controlled for socioeconomic status (income, employment, and education), characteristics of the health care system (provider specialty, practice setting, and cost-sharing requirements), and demographics (child’s age, sex, general health status, and insurance coverage). Because of extensive managed care penetration in California, we clarified the range of practice settings by using names of local managed care clinics, public health centers, and group practices as examples.
Analysis
The independent variable was racial and ethnic background, and its analytic categories included Asian, black, Hispanic, and white. Comparisons were made between race or ethnicity and the study covariates and scores for the primary care subdomains. Frequencies of the study covariates were compared across racial and ethnic groups, and the significance of these differences was assessed with chi-squared tests of association. Generalized linear model procedures were used to assess differences in primary care quality across racial and ethnic groups after adjusting for study covariates. Bonferroni t tests were used to test significance and account for multiple comparisons.
Two total primary care scores were generated by summing the mean scores for the primary care subdomains. The first total primary care score (A) included coordination of care, a domain that was answered only by a subset of the population that reported they had visited a specialist since they first saw their regular provider. Therefore, total score A was limited to 1 subset of the population (n = 135). The second total primary care score (B) did not include coordination of care and thus included the full study sample.
Multiple linear regression analyses were conducted to predict primary care quality. Four models were constructed incrementally, with the first including only dummy variables of race and ethnicity (with white “race” as the reference group). Additional models controlled for (1) socioeconomic status covariates, (2) health system characteristics, and (3) socioeconomic status, health system characteristics, and demographics. The models were constructed separately for primary care scores A and B. Regression coefficients and respective P values are reported for race/ethnicity categories and study covariates. The coefficient of determination (R2 and adjusted R2) is reported for each model to describe how much of the variance in primary care quality was explained by the study variables.
Table 2 compares the unadjusted socioeconomic status, health system characteristics, and demographic factors of our analytic sample across racial and ethnic groups. As per the sampling strategy, respondents were nearly equally divided among the 4 categories of race and ethnicity. Most respondents (74.3%) had family incomes greater than $36,000/year, although a significantly smaller proportion of black (64.2%) and Hispanic (67.7%) families had incomes above this amount compared with whites (90.2%) and Asians (84.0%; P < .001). Racial and ethnic groups also differed in maternal education and employment, with Asians reporting the highest proportion with a high school education or greater (P < .01) and blacks reporting the highest employment among mothers (P < .001).
With regard to health system factors, Asians and whites were most likely to report seeking care at a doctor’s office (58.8% and 57.0%, respectively) compared to seeking care from a health maintenance organization clinic or other setting (P < .001). Hispanics reported the largest proportion of children receiving care from a health maintenance organization clinic setting (39.4%), and Asians reported the smallest proportion (20.6%; P < .05). White respondents had the highest proportion covered by private health insurance (86.6%) and Hispanic respondents had the lowest (79.1%; P < .05). Hispanics were most likely to be uninsured (13.13%; P < .05).
Asians were most likely to report having any cost sharing such as a deductible or co-payment (83.2%; P < .01). There were no significant differences in child’s age, sex, or health status across racial and ethnic groups.
Table 3 compares adjusted primary care quality scores across racial and ethnic groups. The attribute scales were standardized by summing the responses to each question in the attribute and dividing by the number of questions (range, 1-4). In general, Asian, black, and Hispanic parents reported slightly lower quality of primary care than did whites. Minority parents reported lower scores for 6 of the 7 subdomains, although only some of the findings were significant. Asian respondents reported the lowest (or statistically equivalent to the lowest) primary care quality for 5 of the 7 domains, reflecting differences of approximately 5% to 10%. These scores were significantly lower than those reported by whites for first-contact accessibility (P < .05), first-contact utilization (P < .01), interpersonal relationship (P < .05), and comprehensiveness of services received (P < .001). Moreover, Asians reported significantly lower mean scores than did whites for both total primary care scales. Black respondents reported significantly worse first-contact utilization but slightly greater accessibility than did whites, although the difference was not significant.
Table 4 presents 4 multiple regression models for the 2 versions of total primary care quality after successive adjustment for socioeconomic status, health system characteristics, and demographics. In model 1A (not adjusted for any covariates) Asian and black races (vs whites) were significant negative predictors of primary care quality. In model 1B (ie, coordination of care domain excluded) all minority groups (vs whites) were significant negative predictors of quality (P < .01). In models 2B and 3B, after controlling for socioeconomic status and health system characteristics, respectively, 2 additional covariates positively predicted total primary care quality. These were family income greater than $36,000 (P < .01) and having a pediatrician as opposed to any other type of family practitioner or generalist primary care provider (P < .001). Despite the addition of these covariates to models 2 and 3, minority racial and ethnic groups remained significant negative predictors for both versions of primary care quality (P < .05). Asian race remained a particularly significant predictor of quality (P < .001).
In model 4A, which controlled for all covariates, older child age and, nonintuitively, being uninsured were significant positive predictors of quality (likely due to the small number of uninsured respondents). In model 4B, health status was a significant predictor of quality (P < .05). With the addition of the full complement of covariates, Hispanic and black race and ethnicity became nonsignificant in both models despite small changes in the magnitude of the coefficients and P values (.07 and .06, respectively). The loss of significance in this model is likely attributable to the number of variables that was controlled for given the moderate sample size rather than to any confounding effects of specific covariates. In model 4A, Asian race remained a significant negative predictor of quality (P < .05). In model 4B, Asian race remained a strong negative predictor of quality and having a pediatrician remained a strong positive predictor (P < .001 for both). After adjustment for the natural rise in R2 associated with the inclusion of additional covariates, the final models for both total scales (A and B) explained only about 8% and 11%, respectively, of the variation in primary care quality.
Discussion
This community-based study advances the literature by demonstrating that Asian, black, and Hispanic children experience poorer quality of primary care than whites, even after controlling for many differences in socioeconomic status, health system factors, and demographics. This suggests that racial and ethnic differences in quality of care are not simple reflections of ability to pay, health disparities, or other sociodemographics.
The findings in this study that parents of minority children, in particular Asian Americans, report lower quality of primary care is consistent with previous research among adults but has not been demonstrated previously for children.20-24 This finding is particularly important because of the growing numbers of Asian Americans in the United States and because Asian children, despite their family’s higher education, are more likely than whites and some other ethnic groups to be in fair or poor health, underimmunized, and at risk for contracting preventable illnesses such as hepatitis B.31-33 These differences in health and health risk may be remedied in part by the receipt of high-quality primary care.34
Of the primary care measures, the greatest difference between Asians and whites was in comprehensiveness of services received. This domain covered the range of services that patients could receive from their regular provider and included items such as preventive counseling and discussions about growth and development. Although language was unlikely to be a determinant of quality in this study (because we excluded those unable to complete the survey in English or Spanish), it does not discount the potential of undetected or unstudied language difficulties to enhance disparities in health care. For example, even though Asian families in our study were able to communicate sufficiently in English, they might have rated the patient-provider relationship lower because of trouble finding a provider who spoke their language. Regardless, the finding suggests the importance of making services more widely available to minority groups, including improvements in communication about existing primary care services.
An interesting secondary finding was that parents who reported a pediatrician as the child’s regular source of care reported higher quality primary care than did parents reporting other generalist providers. In particular, pediatricians appeared to perform better than other providers on 3 of the attributes: utilization of services (P < .02), patient-provider relationship (P < .0001), and services provided (P < .0001; data not shown). The differences may be attributable in part to the greater frequency of visits to pediatricians for well-child care; thus, greater opportunities may exist for delivery of preventive services and the development of the patient-provider relationship. Future research should explore the experience of minority patients receiving care from various provider specialties.
Despite significant findings, the most comprehensive regression models explained only a small proportion of the variation in primary care quality (about 11%). Other factors that may play a role in determining primary care quality, but were not included in this analysis, include health insurance plan restrictions (discussed in an upcoming paper), practice arrangements, racial concordance between the patient and provider, family mobility, and perhaps provider-specific factors such as training or years in practice.
This study has several limitations. First, the cross-sectional design and analysis allowed the demonstration of association and not of causality. Second, this study examined only 4 broad classifications of race and ethnicity that do not capture within-group variations in ethnicity or culture that could be associated with differences in quality of care received. Standard measurements of race and ethnicity also do not fully capture biologic, cultural, socioeconomic, and political aspects of multiculturalism that may interact and produce more complex findings than those reported.35
Third, because of the moderate response rate, the respondents in this study may not be fully representative of the population under study. Although respondents were demographically similar to nonrespondents, participants may have been more likely than nonrespondents to have children in poorer health status or have more negative experiences with the health care system. Although this does not threaten the internal validity of this study (because response rates did not differ substantially across racial groups), such bias could lead to lower overall estimates of primary care quality regardless of racial group.
Fourth, studies that rely on patient reporting to compare quality of care across racial groups often may capture racial and ethnic group variations in perceptions of care or different standards for assessing care. In this study, we used an instrument for assessing quality of care that relies heavily on factual reporting (eg, waiting times and receipt of particular services) rather than on satisfaction or performance ratings, so our study was less subject to these biases.
In conclusion, this study demonstrated significant differences in the quality of primary care for children across racial and ethnic groups. These findings in part suggest that ensuring adequate health insurance coverage may not be sufficient to reduce racial and ethnic disparities in quality of care. Although the cause or mechanism of these disparities in quality is not entirely established, the findings encourage careful additional monitoring of the delivery of primary care, in particular to minority children. At a minimum, health care providers and organizations should make primary care services more accessible to minority families, provide the services in a culturally and linguistically competent manner (to encourage the development of the physician-patient relationship), and communicate more effectively with families about the range of child health services offered.
*The Institute of Medicine defines primary care as “the provision of integrated, accessible health care services by clinicians who are accountable for addressing a large majority of personal health care needs, developing a sustained partnership with patients, and practicing in the context of family and community.”5 The practice of primary care is best characterized as a set of attributes or functions that, only when performed together, constitute the delivery of primary care. Empirical studies have further delineated and operationalized 4 core attributes of primary care: first-contact care with a designated primary care physician; longitudinality, or ongoing care, with a physician or place of care; comprehensiveness of services; and coordination or integration of those services6Table 1.
Acknowledgments
The authors thank Barbara Starfield, MD, Lisa Cooper, MD, and Maria Trent, MD, for their thoughtful review of this manuscript. They also thank Jane Lyon for her generous support of and help in coordinating the study in the school district.
1. Newacheck PW, Hughes DC, Stoddard J. Children’s access to primary care: differences by race, income and insurance status. Pediatrics 1996;97:26-32.
2. Weinick RM, Weigers ME, Cohen JW. Children’s health insurance, access to care, and health status: new findings. Health Aff 1998;17 (2):127-36.
3. Halfon N, Inkelas M, Wood D. Nonfinancial barriers to care for children and youth. Annu Rev Public Health 1995;16:447-72.
4. Aday L, Fleming G, Andersen R. Access to Medical Care in the US: Who Has It, Who Doesn’t? Chicago: Pluribus Press; 1984.
5. Donaldson M, Yordy K, Lohr K, Vanselow N. Primary Care: America’s Health in a New Era. Washington DC: National Academy Press; 1996.
6. Starfield B. Primary Care: Balancing Health Needs, Services, and Technology. New York: Oxford University Press; 1998.
7. Bindman AB, Grumbach K, Osmond D, et al. Primary care and receipt of preventive services. J Gen Intern Med 1996;11:269-76.
8. Flocke SA, Strange KC, Zyzanski SJ. The association of attributes of primary care with the delivery of clinical preventive services. J Fam Pract 1998;36(suppl):AS21-30.
9. O’Malley AS, Forrest CB. Continuity of care and delivery of ambulatory services to children in community health clinics. J Comm Health 1996;21:159-73.
10. Lieu TA, Black SB, Ray P, et al. Risk factors for delayed immunization among children in an HMO. Am J Public Health 1994;84:1621-5.
11. Shea S, Misra D, Ehrlich M, et al. Predisposing factors for severe, uncontrolled hypertension in an inner-city minority population. N Engl J Med 1992;327:776-81.
12. Lurie N, Ward N, Shapiro M, Brook R. Termination from Medi-Cal-does it affect health? N Engl J Med 1984;311:480-4.
13. Fihn S, Wicher J. Withdrawing routine outpatient medical services: effects on access and health. J Gen Intern Med 1988;3:356-62.
14. Gill J, Mainous A. The role of provider continuity in preventing hospitalizations. Arch Fam Med 1998;7:352-7.
15. Safran DG, Taira D, Rogers WH, et al. Linking primary care performance to outcomes of care. J Fam Pract 1998;47:213-9.
16. Shi L. The relationship between primary care and life chances. J Health Care Poor Underserved 1992;3:321-5.
17. Shi L. Primary care, specialty care, and life chances. Int J Health Serv 1994;24:431-58.
18. Dievler A, Giovannini T. Community health centers: promise and performance. Med Care Res Rev 1998;55:405-31.
19. McGlynn E, Halfon N. Overview of issues in improving quality of care for children. Health Serv Res 1998;33(4 pt 2):977-1000.
20. Shi L. Experience of primary care by racial and ethnic groups in the United States. Med Care 1999;37:1068-77.
21. Murray-Garcia J, Selby J, Schmittdiel J, et al. Racial and ethnic differences in a patient survey: patients’ values, ratings, and reports regarding physician primary care performance in a large health maintenance organization. Med Care 2000;38:300-10.
22. Taira D, Safran D, Seto T, et al. Do patient assessments of primary care differ by patient ethnicity? HSR 2001;36:1059-71.
23. Taira D, Safran D, Seto T, et al. Asian-American patient ratings of physician primary care performance. J Gen Intern Med 199;12:237-42.
24. Morales L, Elliot M, Weech-Maldonado R, et al. Differences in CAHPS adult survey reports and ratings by race and ethnicity: an analysis of the national CAHPS Benchmarking Data 1.0. HSR 2001;36:595-617.
25. Forrest C, Simpson L, Clancy C. Child health services research. Challenges and opportunities. JAMA 1997;277:1787-93.
26. Mangione-Smith R, McGlynn E. Assessing the quality of healthcare provided to children. Health Serv Res 1998;33(4 pt 2):1059-90.
27. Weech-Maldonado R, Morales L, Spritzer K, et al. Racial and ethnic differences in parents’ assessments of pediatric care in Medicaid managed care. HSR 2001;36:575-94.
28. Health Resources and Services Administration. Community Health Status Report: San Bernardino County, July. Bethesda, MD: US Department of Health and Human Services; 2000.
29. Cassady C, Starfield B, Hurtado M, et al. Measuring consumer experiences with primary care. Pediatrics 2000;105(4 pt 2):998-1003.
30. Shi L, Starfield B, Xu J. Validating the Adult Primary Care Assessment Tool. J Fam Pract 2001;50:E1.-
31. Weigers M, Weinick R, Cohen J. Children’s Health, 1996. Rockville, MD: Agency for Health Care Policy and Research; 1998.
32. Vaccination coverage by race/ethnicity and poverty level among children aged 19-35 months-United States, 1997. MMWR Morb Mortal Wkly Rep 1998;47(44):956-9.
33. Hepatitis B vaccination coverage among Asian and Pacific Islander children-United States, 1998. MMWR Morb Mortal Wkly Rep 2000;49 (27):616-9.
34. Starfield B. Motherhood and apple pie: the effectiveness of medical care for children. Milbank Q 1985;63:523-46.
35. LaVeist T. Beyond dummy variables and sample selection: what health services researchers ought to know about race as a variable. Health Serv Res 1994;29:1-16.
Address reprint requests to Gregory D. Stevens, PhD, MHS, Department of Health Policy and Management, Johns Hopkins University School of Hygiene and Public Health, 624 N. Broadway, Rm. 661, Baltimore, MD 21205. E-mail: [email protected].
To submit a letter to the editor on this topic, click here: [email protected].
Bilateral leg edema, pulmonary hypertension, and obstructive sleep apnea
This study was undertaken to clarify whether pulmonary hypertension is a useful marker for underlying obstructive sleep apnea in patients with edema. Twenty-eight ambulatory adults with bilateral leg edema and a normal echocardiogram were enrolled. Sixteen subjects had pulmonary hypertension, and 12 subjects had normal pulmonary artery pressures. Spirometry, pulse oximetry on room air, and polysomnography were obtained for each subject. Ten of 16 (63%) pulmonary hypertension subjects and 9 of 12 (75%) nonpulmonary hypertension subjects had obstructive sleep apnea (P = .48). Eleven of 16 (69%) pulmonary hypertension subjects and 11 of 12 (92%) nonpulmonary hypertension subjects were obese (P = .20). If these results are generalizable, obstructive sleep apnea is frequently associated with bilateral leg edema and obesity, regardless of the presence of pulmonary hypertension. Thus, especially in obese patients, bilateral leg edema may be a useful clinical marker for underlying obstructive sleep apnea.
We previously found an association between bilateral leg edema and pulmonary hypertension in primary care patients.1 After consideration of the differential diagnosis of pulmonary hypertension, obstructive sleep apnea was deemed the most likely explanation for the high frequency of pulmonary hypertension.2 Subsequently, we identified an association among leg edema, obesity, pulmonary hypertension, and obstructive sleep apnea in ambulatory patients with normal left ventricular function.3
Our earlier data failed to clarify whether leg edema, obesity, pulmonary hypertension, or a combination thereof is the most useful marker for obstructive sleep apnea. This cross-sectional study was undertaken to determine whether subjects with bilateral leg edema and pulmonary hypertension have a higher frequency of obstructive sleep apnea than edematous subjects with normal pulmonary artery pressures.
Methods
A single physician (R.P.B.) enrolled a convenience sample of subjects from an inner city group family practice in Cleveland OH, from July 1995 to September 1997, and from a 2-physician suburban family practice near Cleveland, OH, from October 1997 to July 2000. Ambulatory patients older than 18 years with bilateral pitting leg edema, no clinically overt lung disease, no echocardiographic evidence of a cardiac abnormality, and an echocardiogram that permitted an estimation of the pulmonary artery pressure were eligible to participate in the study. The methodology for estimating the pulmonary artery pressures has been described previously.3-5 For this study, pulmonary hypertension was defined as an estimated pulmonary artery systolic pressure > 30 mm Hg, whereas an estimated pulmonary artery systolic pressure 30 mm Hg was considered normal.
Subjects were excluded if their echocardiogram revealed valvular heart disease, congenital heart disease, or left ventricular systolic or diastolic dysfunction; if they used dihydropyridine calcium antagonists; if they had a known pulmonary condition; or if pulmonary function evaluation indicated the presence of obstructive or restrictive lung disease. Individuals with asthma were included as long as the asthma was well controlled. The protocol was approved by the Institutional Review Board at the MetroHealth Medical Center (Cleveland, OH).
The medical history of each subject was reviewed for risk factors recognized as being associated with pulmonary hypertension,3 and subjects answered the Epworth sleepiness scale questions.6 The percent predicted forced vital capacity (FVC), the percent predicted forced expiratory volume in 1 second (FEV1), and the FEV1 in relation to the FVC were determined by spirometry (Brentwood Spiroscan 2000, Hoks Electronics, Inc, Japan). Oxygen saturations on room air were determined by oximetry (N-20, Nellcor, Inc, Hayward, CA). Polysomnography was performed on all subjects in a sleep laboratory, and the average number of episodes of apneas and hypopneas per hour of sleep (apnea-hypopnea index) was calculated.
No universally accepted criteria exist for diagnosing obstructive sleep apnea.7 For this study, obstructive sleep apnea was defined as an apneahypopnea index of ≥ 20 events per hour,8 or a rapid eye movement-specific apnea-hypopnea index of ≥ 20 events per hour. Levels of serum albumin, antinuclear antibody, rheumatoid factor, and thyroid stimulating hormone were obtained on all subjects, as were sedimentation rate and results of liver function tests. Subjects were considered obese if they had a body mass index (weight in kg/height in m2) of more than 30 kg/m2.9
Mean values between study groups were compared with Student’s t-test, and 2 statistics were used to compare differences between proportions. A final regression analysis was conducted to test whether controlling for potential confounding variables altered the univariate association observed. A hierarchical logistic regression analysis was performed by first regressing obstructive sleep apnea status on potential confounding variables as the first level, and then allowing pulmonary hypertension status to enter the equation as the second level. These analyses compared the extent to which pulmonary hypertension is associated with obstructive sleep apnea status before and after adjusting for confounding variables.
Results
Twenty-eight subjects enrolled in the study, 16 with pulmonary hypertension and 12 without. Findings regarding 15 of the 16 subjects with pulmonary hypertension were reported previously.3 The edema was mild (1+ or 2+ pitting) for most subjects, typically presenting as an incidental examination finding. Of the edematous patients recruited for enrollment, many more than the number who actually participated were ineligible because their echocardiograms did not allow an estimation of the pulmonary artery pressure.
Demographic information on the subjects with and without pulmonary hypertension is shown in Table 1. Subjects with pulmonary hypertension were older (mean age 63.4 ± 13.6 years versus 52.2 ± 9.9 years, P = .02). Most subjects in both groups were obese. There were no differences between the 2 groups in sex, race, education, marital status, body mass indices, or duration of edema.
Ten of 16 (63%) subjects with pulmonary hypertension and 9 of 12 (75%) subjects without pulmonary hypertension had obstructive sleep apnea (P = .48). There were no differences between the 2 groups in apnea-hypopnea indices, spirometry measurements, oxygen saturation, asthma, systemic hypertension, previous use of appetite suppressants, use of prescription medications, or Epworth sleepiness scale scores. Because Epworth sleepiness scale scores of 9 to 10 or less are considered mild,6 the low Epworth sleepiness scale scores in both groups indicate that many individuals with obstructive sleep apnea and edema lack symptoms of excessive daytime sleepiness. In the hierarchical logistic regression analysis, the probability associated with the adjusted regression coefficient for pulmonary hypertension status was .71, indicating that even with adjustment for potential confounding variables (age, duration of edema), there was no association between pulmonary hypertension and obstructive sleep apnea.
TABLE 1
Demographic characteristics, pathologic conditions, and laboratory data of subjects with bilateral leg edema
| Variable | Pulmonary hypertension (n = 16) | No pulmonary hypertension (n = 12) | P |
|---|---|---|---|
| Age (y) | 63.4 ± 13.6 | 52.2 ± 9.9 | .02 |
| Female sex | 69% | 75% | .72 |
| White race | 88% | 100% | .49 |
| Body mass index (kg/m2) | 37.2 ± 11.0 | 39.1 ± 12.1 | .66 |
| Obesity (BMI ≥ 30) | 69% | 92% | .20 |
| Education | |||
| High school graduate or higher | 53%* | 53%* | .95 |
| Marital status | |||
| Married | 47%* | 67% | .30 |
| Duration of edema | |||
| > 2 years | 64%* | 55%* | .70 |
| Pulmonary artery pressure (mm Hg) | 37.3 ± 6.0 | 25.4 ± 4.2 | .001 |
| Obstructive sleep apnea | 63% | 75% | .48 |
| Apnea-hypopnea index | 32.3 ± 28.5 | 31.8 ± 23.4 | .96 |
| Systemic hypertension | 38% | 33% | .82 |
| Asthma | 6% | 17% | .56 |
| Spirometry data | |||
| FVC (% predicted) | 77.4 ± 17.6 | 70.3 ± 14.2 | .27 |
| FEV1(% predicted) | 82.8 ± 18.6 | 73.7 ± 15.1 | .17 |
| FEV1/FVC (%) | 106.9 ± 11.0 | 105.2 ± 6.5 | .64 |
| Oxygen saturation (%) | 96.7 ± 1.4 | 97.7 ± 1.7 | .31 |
| Epworth sleepiness scale score | 10.3 ± 4.9 | 8.0 ± 4.7 | .24 |
| Date presented as mean ± SD unless otherwise noted. | |||
| *Slightly reduced sample size due to occasional missing data. | |||
| FVC, forced vital capacity; FEV 1 , forced expiratory volume in 1 second. | |||
Discussion
We found a high prevalence of obstructive sleep apnea (68%) in patients with bilateral leg edema, most of whom were obese. The proportion of obstructive sleep apnea was high whether or not pulmonary hypertension was present. Our findings suggest that bilateral leg edema, but not pulmonary hypertension, may be a useful marker for underlying obstructive sleep apnea, especially in obese patients. Moreover, if the data are generalizable, many individuals with bilateral leg edema and normal left ventricular systolic function may be misdiagnosed or underdiagnosed as having idiopathic edema, venous insufficiency,1 or diastolic dysfunction.10 The finding that subjects with pulmonary hypertension were older than those with normal pulmonary artery pressures suggests that either patient age or the duration of the obstructive sleep apnea may be important variables in the development of pulmonary hypertension in edematous patients with obstructive sleep apnea.
Because of the small sample, a type II error might be the explanation for the lack of difference between the pulmonary hypertension and nonpulmonary hypertension groups. Because of the small sample size and the possibility of selection bias, the results of this study should be interpreted with caution. These findings need to be replicated with a larger sample to confirm the association. In addition, further research is necessary to clarify whether leg edema, obesity, or a combination thereof is the most useful marker for obstructive sleep apnea.
If our patients are typical of those in other practices, we estimate that leg edema associated with obstructive sleep apnea occurs frequently compared with other cardiovascular diseases. In both the inner city and suburban family practices of one of the authors (R.P.B.), leg edema associated with obstructive sleep apnea is the third most common cardiovascular condition, occurring less often than systemic hypertension and coronary artery disease but more frequently than congestive heart failure, cerebrovascular accidents, or cardiac arrhythmias.
Because our experience represents primary care rather than tertiary or specialty care, and because our experience is similar in inner city and suburban settings, we believe that our experience may be generalizable to a variety of practice settings. We now practice according to the clinical dictum that for patients without symptoms or signs of congestive heart failure and without overt lung disease, bilateral leg edema represents obstructive sleep apnea until proven otherwise.
Our data raise the question of a possible causal relationship between obstructive sleep apnea and leg edema. Most of the participants in our study have not used nasal continuous positive airway pressure (CPAP) for long. However, using nightly nasal CPAP, 4 edematous patients experienced reduced leg edema, and 3 have stopped using diuretic medication (Blankfield, unpublished data). This small subset of obstructive sleep apnea patients suggests that obstructive sleep apnea may be a cause of edema.
Making a diagnosis of obstructive sleep apnea does not necessarily mean that treatment is indicated. An abnormal apnea-hypopnea index without excessive daytime sleepiness does not warrant treatment.11 The results of this study have unclear clinical relevance for patients with obstructive sleep apnea and edema who lack symptoms of daytime somnolence because no study has evaluated whether treating obstructive sleep apnea alters morbidity or mortality in these individuals. Accordingly, it may be prudent for clinicians to refer edematous patients for polysomnography only if they have symptoms of excessive daytime sleepiness, desire a remedy for their edema, use diuretic medication, or develop complications of edema formation such as cellulitis, stasis dermatitis, or venous stasis ulcers.
However, if obstructive sleep apnea contributes to or causes pulmonary hypertension or edema, then it may be advisable to treat patients who have these cardiovascular complications, regardless of the presence or absence of symptoms of sleep-disordered breathing. Previous research is inconclusive regarding a causal relationship between obstructive sleep apnea and pulmonary hypertension. Most of the literature favors the premise that obstructive sleep apnea is not a cause of pulmonary hypertension,12-17 but some studies suggest otherwise.18,19
If subsequent research demonstrates that obstructive sleep apnea causes either pulmonary hypertension or edema, then clinical trials will be necessary to document whether morbidity and mortality rates improve after appropriate treatment of the obstructive sleep apnea. This information will be essential to determine if treatment is warranted for obstructive sleep apnea patients who have pulmonary hypertension or edema, but who lack symptoms of excessive daytime sleepiness.
Acknowledgments
The authors appreciate data collection assistance by Louise Wiatrak, MA and Simone Powers, data entry assistance by Amy Tapolyai, MBA, and Gregory Zyzanski, and manuscript assistance by Kurt Stange, MD, PhD.
1. Blankfield RP, Finkelhor RS, Alexander JJ, et al. Etiology and diagnosis of bilateral leg edema in primary care. Am J Med 1998;105:192-7.
2. Young T, Palta M, Dempsey J, Skatrud J, Weber S, Badr S. The occurrence of sleepdisordered breathing among middle-aged adults. N Engl J Med 1993;328:1230-5.
3. Blankfield RP, Hudgel DW, Tapolyai AA, Zyzanski SJ. Bilateral leg edema, obesity, pulmonary hypertension, and obstructive sleep apnea. Arch Intern Med 2000;160:2357-62.
4. Kircher BJ, Himelman RB, Schiller NB. Noninvasive estimation of right atrial pressure from the inspiratory collapse of the inferior vena cava. Am J Cardiol 1990;66:493-6.
5. Chan KL, Currie PJ, Seward JB, Hagler DJ, Mair DD, Tajik AJ. Comparison of three Doppler ultrasound methods in the prediction of pulmonary artery pressure. J Am Coll Cardiol 1987;9:549-54.
6. Johns MW. A new method for measuring daytime sleepiness: the Epworth sleepiness scale. Sleep 1991;14:540-5.
7. Strohl KP, Redline S. Recognition of obstructive sleep apnea. Am J Respir Crit Care Med 1996;154:279-89.
8. Wiegand L, Zwillich CW. Obstructive sleep apnea. Dis Mon 1994;40:197-252.
9. Stevens J, Cai J, Thun MJ, Wood JL. Evaluation of WHO and NHANES II standards for overweight using mortality rates. J Am Diet Assoc 2000;100:825-7.
10. Caruana L, Petrie MC, Davie AP, McMurray JJ. Do patients with suspected heart failure and preserved left ventricular systolic function suffer from “diastolic heart failure” or from misdiagnosis? A prospective descriptive study. BMJ 2000;321:215-8.
11. Barbé F, Mayorales LR, Duran J, et al. Treatment with continuous positive airway pressure is not effective in patients with sleep apnea but no daytime sleepiness: a randomized, controlled trial. Ann Intern Med 2001;134:1015-23.
12. Sanner BM, Doberauer C, Konermann M, Sturm A, Zidek W. Pulmonary hypertension in patients with obstructive sleep apnea syndrome. Arch Intern Med 1997;157:2483-7.
13. Bradley TD, Rutherford R, Grossman RF, et al. Role of daytime hypoxemia in the pathogenesis of right heart failure in the obstructive sleep apnea syndrome. Am Rev Respir Dis 1985;131:835-9.
14. Weitzenblum E, Krieger J, Apprill M, et al. Daytime pulmonary hypertension in patients with obstructive sleep apnea syndrome. Am Rev Respir Dis 1988;138:345-9.
15. Krieger J, Sforza E, Apprill M, Lampert E, Weitzenblum E, Ratomaharo J. Pulmonary hypertension, hypoxemia, and hypercapnia in obstructive sleep apnea. Chest 1989;96:729-37.
16. Laks L, Lehrhaft B, Grunstein RR, Sullivan CE. Pulmonary hypertension in obstructive sleep apnoea. Eur Respir J 1995;8:537-41.
17. Shinozaki T, Tatsumi K, Sakuma T, et al. Daytime pulmonary hypertension in the obstructive sleep apnea syndrome [in Japanese]. Nihon Kyobu Shikkan Gakkai Zasshi 1995;33:1073-9.
18. Sajkov D, Cowie RJ, Thornton AT, Espinoza HA, McEvoy RD. Pulmonary hypertension and hypoxemia in obstructive sleep apnea syndrome. Am J Respir Crit Care Med 1994;149:416-22.
19. Sajkov D, Wang T, Saunders NA, Bune AJ, Neill AM, McEvoy RD. Daytime pulmonary hemodynamics in patients with obstructive sleep apnea without lung disease. Am J Respir Crit Care Med 1999;159:1518-26.
This study was undertaken to clarify whether pulmonary hypertension is a useful marker for underlying obstructive sleep apnea in patients with edema. Twenty-eight ambulatory adults with bilateral leg edema and a normal echocardiogram were enrolled. Sixteen subjects had pulmonary hypertension, and 12 subjects had normal pulmonary artery pressures. Spirometry, pulse oximetry on room air, and polysomnography were obtained for each subject. Ten of 16 (63%) pulmonary hypertension subjects and 9 of 12 (75%) nonpulmonary hypertension subjects had obstructive sleep apnea (P = .48). Eleven of 16 (69%) pulmonary hypertension subjects and 11 of 12 (92%) nonpulmonary hypertension subjects were obese (P = .20). If these results are generalizable, obstructive sleep apnea is frequently associated with bilateral leg edema and obesity, regardless of the presence of pulmonary hypertension. Thus, especially in obese patients, bilateral leg edema may be a useful clinical marker for underlying obstructive sleep apnea.
We previously found an association between bilateral leg edema and pulmonary hypertension in primary care patients.1 After consideration of the differential diagnosis of pulmonary hypertension, obstructive sleep apnea was deemed the most likely explanation for the high frequency of pulmonary hypertension.2 Subsequently, we identified an association among leg edema, obesity, pulmonary hypertension, and obstructive sleep apnea in ambulatory patients with normal left ventricular function.3
Our earlier data failed to clarify whether leg edema, obesity, pulmonary hypertension, or a combination thereof is the most useful marker for obstructive sleep apnea. This cross-sectional study was undertaken to determine whether subjects with bilateral leg edema and pulmonary hypertension have a higher frequency of obstructive sleep apnea than edematous subjects with normal pulmonary artery pressures.
Methods
A single physician (R.P.B.) enrolled a convenience sample of subjects from an inner city group family practice in Cleveland OH, from July 1995 to September 1997, and from a 2-physician suburban family practice near Cleveland, OH, from October 1997 to July 2000. Ambulatory patients older than 18 years with bilateral pitting leg edema, no clinically overt lung disease, no echocardiographic evidence of a cardiac abnormality, and an echocardiogram that permitted an estimation of the pulmonary artery pressure were eligible to participate in the study. The methodology for estimating the pulmonary artery pressures has been described previously.3-5 For this study, pulmonary hypertension was defined as an estimated pulmonary artery systolic pressure > 30 mm Hg, whereas an estimated pulmonary artery systolic pressure 30 mm Hg was considered normal.
Subjects were excluded if their echocardiogram revealed valvular heart disease, congenital heart disease, or left ventricular systolic or diastolic dysfunction; if they used dihydropyridine calcium antagonists; if they had a known pulmonary condition; or if pulmonary function evaluation indicated the presence of obstructive or restrictive lung disease. Individuals with asthma were included as long as the asthma was well controlled. The protocol was approved by the Institutional Review Board at the MetroHealth Medical Center (Cleveland, OH).
The medical history of each subject was reviewed for risk factors recognized as being associated with pulmonary hypertension,3 and subjects answered the Epworth sleepiness scale questions.6 The percent predicted forced vital capacity (FVC), the percent predicted forced expiratory volume in 1 second (FEV1), and the FEV1 in relation to the FVC were determined by spirometry (Brentwood Spiroscan 2000, Hoks Electronics, Inc, Japan). Oxygen saturations on room air were determined by oximetry (N-20, Nellcor, Inc, Hayward, CA). Polysomnography was performed on all subjects in a sleep laboratory, and the average number of episodes of apneas and hypopneas per hour of sleep (apnea-hypopnea index) was calculated.
No universally accepted criteria exist for diagnosing obstructive sleep apnea.7 For this study, obstructive sleep apnea was defined as an apneahypopnea index of ≥ 20 events per hour,8 or a rapid eye movement-specific apnea-hypopnea index of ≥ 20 events per hour. Levels of serum albumin, antinuclear antibody, rheumatoid factor, and thyroid stimulating hormone were obtained on all subjects, as were sedimentation rate and results of liver function tests. Subjects were considered obese if they had a body mass index (weight in kg/height in m2) of more than 30 kg/m2.9
Mean values between study groups were compared with Student’s t-test, and 2 statistics were used to compare differences between proportions. A final regression analysis was conducted to test whether controlling for potential confounding variables altered the univariate association observed. A hierarchical logistic regression analysis was performed by first regressing obstructive sleep apnea status on potential confounding variables as the first level, and then allowing pulmonary hypertension status to enter the equation as the second level. These analyses compared the extent to which pulmonary hypertension is associated with obstructive sleep apnea status before and after adjusting for confounding variables.
Results
Twenty-eight subjects enrolled in the study, 16 with pulmonary hypertension and 12 without. Findings regarding 15 of the 16 subjects with pulmonary hypertension were reported previously.3 The edema was mild (1+ or 2+ pitting) for most subjects, typically presenting as an incidental examination finding. Of the edematous patients recruited for enrollment, many more than the number who actually participated were ineligible because their echocardiograms did not allow an estimation of the pulmonary artery pressure.
Demographic information on the subjects with and without pulmonary hypertension is shown in Table 1. Subjects with pulmonary hypertension were older (mean age 63.4 ± 13.6 years versus 52.2 ± 9.9 years, P = .02). Most subjects in both groups were obese. There were no differences between the 2 groups in sex, race, education, marital status, body mass indices, or duration of edema.
Ten of 16 (63%) subjects with pulmonary hypertension and 9 of 12 (75%) subjects without pulmonary hypertension had obstructive sleep apnea (P = .48). There were no differences between the 2 groups in apnea-hypopnea indices, spirometry measurements, oxygen saturation, asthma, systemic hypertension, previous use of appetite suppressants, use of prescription medications, or Epworth sleepiness scale scores. Because Epworth sleepiness scale scores of 9 to 10 or less are considered mild,6 the low Epworth sleepiness scale scores in both groups indicate that many individuals with obstructive sleep apnea and edema lack symptoms of excessive daytime sleepiness. In the hierarchical logistic regression analysis, the probability associated with the adjusted regression coefficient for pulmonary hypertension status was .71, indicating that even with adjustment for potential confounding variables (age, duration of edema), there was no association between pulmonary hypertension and obstructive sleep apnea.
TABLE 1
Demographic characteristics, pathologic conditions, and laboratory data of subjects with bilateral leg edema
| Variable | Pulmonary hypertension (n = 16) | No pulmonary hypertension (n = 12) | P |
|---|---|---|---|
| Age (y) | 63.4 ± 13.6 | 52.2 ± 9.9 | .02 |
| Female sex | 69% | 75% | .72 |
| White race | 88% | 100% | .49 |
| Body mass index (kg/m2) | 37.2 ± 11.0 | 39.1 ± 12.1 | .66 |
| Obesity (BMI ≥ 30) | 69% | 92% | .20 |
| Education | |||
| High school graduate or higher | 53%* | 53%* | .95 |
| Marital status | |||
| Married | 47%* | 67% | .30 |
| Duration of edema | |||
| > 2 years | 64%* | 55%* | .70 |
| Pulmonary artery pressure (mm Hg) | 37.3 ± 6.0 | 25.4 ± 4.2 | .001 |
| Obstructive sleep apnea | 63% | 75% | .48 |
| Apnea-hypopnea index | 32.3 ± 28.5 | 31.8 ± 23.4 | .96 |
| Systemic hypertension | 38% | 33% | .82 |
| Asthma | 6% | 17% | .56 |
| Spirometry data | |||
| FVC (% predicted) | 77.4 ± 17.6 | 70.3 ± 14.2 | .27 |
| FEV1(% predicted) | 82.8 ± 18.6 | 73.7 ± 15.1 | .17 |
| FEV1/FVC (%) | 106.9 ± 11.0 | 105.2 ± 6.5 | .64 |
| Oxygen saturation (%) | 96.7 ± 1.4 | 97.7 ± 1.7 | .31 |
| Epworth sleepiness scale score | 10.3 ± 4.9 | 8.0 ± 4.7 | .24 |
| Date presented as mean ± SD unless otherwise noted. | |||
| *Slightly reduced sample size due to occasional missing data. | |||
| FVC, forced vital capacity; FEV 1 , forced expiratory volume in 1 second. | |||
Discussion
We found a high prevalence of obstructive sleep apnea (68%) in patients with bilateral leg edema, most of whom were obese. The proportion of obstructive sleep apnea was high whether or not pulmonary hypertension was present. Our findings suggest that bilateral leg edema, but not pulmonary hypertension, may be a useful marker for underlying obstructive sleep apnea, especially in obese patients. Moreover, if the data are generalizable, many individuals with bilateral leg edema and normal left ventricular systolic function may be misdiagnosed or underdiagnosed as having idiopathic edema, venous insufficiency,1 or diastolic dysfunction.10 The finding that subjects with pulmonary hypertension were older than those with normal pulmonary artery pressures suggests that either patient age or the duration of the obstructive sleep apnea may be important variables in the development of pulmonary hypertension in edematous patients with obstructive sleep apnea.
Because of the small sample, a type II error might be the explanation for the lack of difference between the pulmonary hypertension and nonpulmonary hypertension groups. Because of the small sample size and the possibility of selection bias, the results of this study should be interpreted with caution. These findings need to be replicated with a larger sample to confirm the association. In addition, further research is necessary to clarify whether leg edema, obesity, or a combination thereof is the most useful marker for obstructive sleep apnea.
If our patients are typical of those in other practices, we estimate that leg edema associated with obstructive sleep apnea occurs frequently compared with other cardiovascular diseases. In both the inner city and suburban family practices of one of the authors (R.P.B.), leg edema associated with obstructive sleep apnea is the third most common cardiovascular condition, occurring less often than systemic hypertension and coronary artery disease but more frequently than congestive heart failure, cerebrovascular accidents, or cardiac arrhythmias.
Because our experience represents primary care rather than tertiary or specialty care, and because our experience is similar in inner city and suburban settings, we believe that our experience may be generalizable to a variety of practice settings. We now practice according to the clinical dictum that for patients without symptoms or signs of congestive heart failure and without overt lung disease, bilateral leg edema represents obstructive sleep apnea until proven otherwise.
Our data raise the question of a possible causal relationship between obstructive sleep apnea and leg edema. Most of the participants in our study have not used nasal continuous positive airway pressure (CPAP) for long. However, using nightly nasal CPAP, 4 edematous patients experienced reduced leg edema, and 3 have stopped using diuretic medication (Blankfield, unpublished data). This small subset of obstructive sleep apnea patients suggests that obstructive sleep apnea may be a cause of edema.
Making a diagnosis of obstructive sleep apnea does not necessarily mean that treatment is indicated. An abnormal apnea-hypopnea index without excessive daytime sleepiness does not warrant treatment.11 The results of this study have unclear clinical relevance for patients with obstructive sleep apnea and edema who lack symptoms of daytime somnolence because no study has evaluated whether treating obstructive sleep apnea alters morbidity or mortality in these individuals. Accordingly, it may be prudent for clinicians to refer edematous patients for polysomnography only if they have symptoms of excessive daytime sleepiness, desire a remedy for their edema, use diuretic medication, or develop complications of edema formation such as cellulitis, stasis dermatitis, or venous stasis ulcers.
However, if obstructive sleep apnea contributes to or causes pulmonary hypertension or edema, then it may be advisable to treat patients who have these cardiovascular complications, regardless of the presence or absence of symptoms of sleep-disordered breathing. Previous research is inconclusive regarding a causal relationship between obstructive sleep apnea and pulmonary hypertension. Most of the literature favors the premise that obstructive sleep apnea is not a cause of pulmonary hypertension,12-17 but some studies suggest otherwise.18,19
If subsequent research demonstrates that obstructive sleep apnea causes either pulmonary hypertension or edema, then clinical trials will be necessary to document whether morbidity and mortality rates improve after appropriate treatment of the obstructive sleep apnea. This information will be essential to determine if treatment is warranted for obstructive sleep apnea patients who have pulmonary hypertension or edema, but who lack symptoms of excessive daytime sleepiness.
Acknowledgments
The authors appreciate data collection assistance by Louise Wiatrak, MA and Simone Powers, data entry assistance by Amy Tapolyai, MBA, and Gregory Zyzanski, and manuscript assistance by Kurt Stange, MD, PhD.
1. Blankfield RP, Finkelhor RS, Alexander JJ, et al. Etiology and diagnosis of bilateral leg edema in primary care. Am J Med 1998;105:192-7.
2. Young T, Palta M, Dempsey J, Skatrud J, Weber S, Badr S. The occurrence of sleepdisordered breathing among middle-aged adults. N Engl J Med 1993;328:1230-5.
3. Blankfield RP, Hudgel DW, Tapolyai AA, Zyzanski SJ. Bilateral leg edema, obesity, pulmonary hypertension, and obstructive sleep apnea. Arch Intern Med 2000;160:2357-62.
4. Kircher BJ, Himelman RB, Schiller NB. Noninvasive estimation of right atrial pressure from the inspiratory collapse of the inferior vena cava. Am J Cardiol 1990;66:493-6.
5. Chan KL, Currie PJ, Seward JB, Hagler DJ, Mair DD, Tajik AJ. Comparison of three Doppler ultrasound methods in the prediction of pulmonary artery pressure. J Am Coll Cardiol 1987;9:549-54.
6. Johns MW. A new method for measuring daytime sleepiness: the Epworth sleepiness scale. Sleep 1991;14:540-5.
7. Strohl KP, Redline S. Recognition of obstructive sleep apnea. Am J Respir Crit Care Med 1996;154:279-89.
8. Wiegand L, Zwillich CW. Obstructive sleep apnea. Dis Mon 1994;40:197-252.
9. Stevens J, Cai J, Thun MJ, Wood JL. Evaluation of WHO and NHANES II standards for overweight using mortality rates. J Am Diet Assoc 2000;100:825-7.
10. Caruana L, Petrie MC, Davie AP, McMurray JJ. Do patients with suspected heart failure and preserved left ventricular systolic function suffer from “diastolic heart failure” or from misdiagnosis? A prospective descriptive study. BMJ 2000;321:215-8.
11. Barbé F, Mayorales LR, Duran J, et al. Treatment with continuous positive airway pressure is not effective in patients with sleep apnea but no daytime sleepiness: a randomized, controlled trial. Ann Intern Med 2001;134:1015-23.
12. Sanner BM, Doberauer C, Konermann M, Sturm A, Zidek W. Pulmonary hypertension in patients with obstructive sleep apnea syndrome. Arch Intern Med 1997;157:2483-7.
13. Bradley TD, Rutherford R, Grossman RF, et al. Role of daytime hypoxemia in the pathogenesis of right heart failure in the obstructive sleep apnea syndrome. Am Rev Respir Dis 1985;131:835-9.
14. Weitzenblum E, Krieger J, Apprill M, et al. Daytime pulmonary hypertension in patients with obstructive sleep apnea syndrome. Am Rev Respir Dis 1988;138:345-9.
15. Krieger J, Sforza E, Apprill M, Lampert E, Weitzenblum E, Ratomaharo J. Pulmonary hypertension, hypoxemia, and hypercapnia in obstructive sleep apnea. Chest 1989;96:729-37.
16. Laks L, Lehrhaft B, Grunstein RR, Sullivan CE. Pulmonary hypertension in obstructive sleep apnoea. Eur Respir J 1995;8:537-41.
17. Shinozaki T, Tatsumi K, Sakuma T, et al. Daytime pulmonary hypertension in the obstructive sleep apnea syndrome [in Japanese]. Nihon Kyobu Shikkan Gakkai Zasshi 1995;33:1073-9.
18. Sajkov D, Cowie RJ, Thornton AT, Espinoza HA, McEvoy RD. Pulmonary hypertension and hypoxemia in obstructive sleep apnea syndrome. Am J Respir Crit Care Med 1994;149:416-22.
19. Sajkov D, Wang T, Saunders NA, Bune AJ, Neill AM, McEvoy RD. Daytime pulmonary hemodynamics in patients with obstructive sleep apnea without lung disease. Am J Respir Crit Care Med 1999;159:1518-26.
General health screenings to improve cardiovascular risk profiles: A randomized controlled trial in general practice with 5-year follow-up
OBJECTIVES: To investigate the impact of general health screenings and discussions with general practitioners on the cardiovascular risk profile of a random population of patients.
STUDY DESIGN: A population-based, randomized, controlled, 5-year follow-up trial conducted in a primary care setting.
POPULATION: The study group consisted of 2000 patients, randomly selected middle-aged men and women aged 30 to 50 years, from family practices in the district of Ebeltoft, Denmark. Of these patients, 1507 (75.4%) agreed to participate. Patients were randomized into (1) a control group that received no health screenings, (2) an intervention group that received 2 health screenings, (3) an intervention group that received both the 2 screenings and a 45-minute follow-up consultation annually.
OUTCOMES MEASURED: Cardiovascular risk score (CRS), body mass index (BMI), blood pressure, serum cholesterol, carbon monoxide in expiratory air, and tobacco use.
RESULTS: After 5 years, the CRS, BMI, and serum cholesterol levels were lower in the intervention groups compared with the control group. The improved outcome was greater in the baseline risk groups. The number of patients with elevated CRS in the intervention groups was approximately half the number of patients with elevated CRS in the control group. The difference was not a result of medication use. There was no difference between the group that received consultations after the screenings and the group that had health screenings alone.
CONCLUSIONS: Health screenings reduced the CRS in the intervention groups. After 5 years of follow-up, the number of persons at elevated cardiovascular risk was about half that expected, based on the prevalence/proportion in a population not receiving the health checks (the control group). The impact of intervention was higher among at-risk individuals. Consultations about health did not appear to improve the cardiovascular profile of the study population.
- Health screening decreased cardiovascular risk in the general population.
- The mean cardiovascular risk score was modestly reduced, and the proportion of persons at elevated cardiovascular risk was reduced to about half that expected after 5 years.
- The impact was more marked among groups at risk for cardiovascular disease.
- Planned health discussions in relation to the health screening did not seem to increase the impact on cardiovascular risk profile.
Many general practitioners believe their patients benefit from preventive health care and, as a result, many concentrate on identifying and treating risk factors for coronary heart disease (CHD),1,2 as many studies show that intervention can reduce risk.3-6 Other studies have suggested that such intervention results in only modest improvements in the risk profile of the general population,7-12 which raises questions about the efficacy of preventive health care.13,16 As of the early 1990s, few randomized, controlled, long-term trials have documented the effect of health screening as a primary prevention tool in reducing cardiovascular risk in the general population.17,18 In earlier large-scale studies on multiple-riskfactor intervention, interventions were not restricted to the intervention groups (controls received similar interventions to some extent); moreover, the studies contained other methodological problems that may have minimized the outcomes between control and intervention groups.19-21
This study was inspired by a Danish trial22 that focused not only on the prevention of CHD, but on preventing general health problems using lifestyle changes as the primary intervention tool.23 During the 1990s, results from 2 studies using different, though comparable, randomized designs were published.7-10 These studies focused more narrowly on the prevention of CHD8,17,18 and only 1 study had follow-up of more than 1 year. Relevant studies of the impact of intervention, therefore, are still lacking.
This article reports on the impact of general health screenings and health discussions with general practitioners on the cardiovascular risk profile of an unrandomized population. Other aspects of the study have been reported elsewhere.24-32
Methods
Setting and participants
The study took place in the district of Ebeltoft, Aarhus County, Denmark, a rural area with a total population of approximately 13,000. All 9 general practitioners from the district participated. Before the study began, the general practitioners participated in 4 meetings on prevention of heart and lung disease, dietary advice, and engaging in health discussions with patients.
Of 3464 inhabitants aged 30 to 49 years by January 1, 1991, and registered with a local general practitioner, a random sample of 2000 (57.7%) were invited to participate in the study. An employee of Aarhus County who was not otherwise involved in the study selected participants by birth dates. Registration with a general practitioner gives free access to medical services and is available to all Danish citizens. The 3464 persons from whom the participants were drawn constituted 87% of the entire population in the selected age group.
In September 1991, the 2000 persons received an invitation to participate along with a questionnaire about general demographic information and lifestyle, signed by their general practitioner. All who agreed to participate received an extensive supplementary baseline questionnaire with detailed questions that evaluated the participant’s health, lifestyle, psychosocial status, and psychosocial life events. Participants were informed by their general practitioner about which intervention they would be offered.
Randomization
Participants were randomly assigned to 1 of 3 groups by proportional, stratified randomization based on the general practitioner with whom they were registered, their sex, age, cohabitation status, and body mass index (BMI). All 3 groups received questionnaires. Health screenings were offered to 2 of the groups and follow-up health discussions with the general practitioner were offered to participants in only 1 of the 2 intervention groups. An employee of Aarhus County who was not otherwise involved in the study carried out the randomization.
Health screenings
Participants were given a multiphasic, broad-spectrum screening. This included a calculation of cardiovascular risk score (CRS), giving an estimate of the risk of premature cardiovascular disease for each individual. Figure 1 shows the calculation of CRS based on sex, familial inheritance (number of family members with ischemic heart disease before age 55), tobacco use, blood pressure, serum cholesterol (total), and BMI33 and the subsequent division into risk groups. Baseline health screenings were performed by 3 laboratory assistants between December 1991 and June 1992 and took place in the town of Ebeltoft, in the central clinic which 5 of the general practitioners shared. A few weeks after the health screening, all those tested received personal written feedback from their general practitioners. Where values fell outside the normal range, the feedback included advice relating primarily to lifestyle changes. All participants who had been advised that they had an elevated or high CRS were encouraged to see their general practitioner, regardless of their randomization group. All tested participants also received pamphlets on leading a healthy lifestyle from the Danish Heart Foundation.
FIGURE 1
Calculation of cardiovascular risk score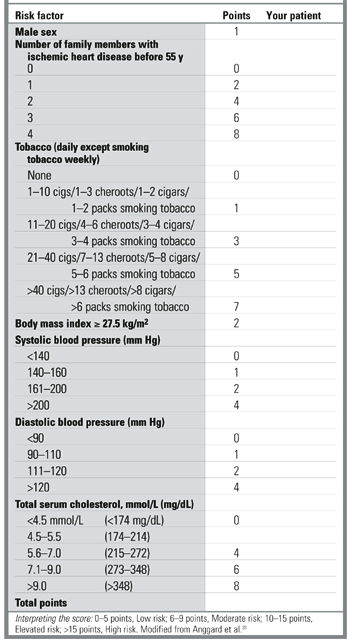
Health discussions
A 45-minute consultation with their own general practitioner was offered to participants from the health screening plus discussion group. Prior to the consultation, the participants completed a short questionnaire about suitable topics for discussion. At the end of the consultation, general practitioners invited participants to set a maximum of 3 health-related lifestyle goals for the following year. In cooperation with the participant, general practitioners then recorded these goals in a separate questionnaire.
Follow-up
Follow-up took place 1 and 5 years after the baseline intervention. Participants received follow-up questionnaires and were offered health screenings and health discussions according to their group of randomization. Participants in the health screening plus discussion group were offered annual consultations. The control group was promised a health screening and a health discussion at the end of the study period. Other details of the design are outlined elsewhere.23
Data analysis and statistics
SPSS version 9.0 for Windows was used to analyze results. Double data entry was used for the laboratory tests. Differences between groups were evaluated by 2- test for categorical data, by t-test for means, and by nonparametric testing for nonparametric data. Ninety-five percent confidence intervals (95% CI) were applied to relative risk (RR) values. Information was used from the baseline questionnaires to identify baseline risk groups among all those randomized. At the 5-year follow-up, randomized groups were compared according to the intention-to-treat rule (ie, regardless of their compliance with the intervention program).
Results
Participation at baseline and follow-up
Seventy-five percent (1507) of the 2000 persons invited to participate agreed to take part in the study. The percentage was higher among women (80.0%) than among men (71.0%).
Table 1shows the distribution of sociodemographic and cardiovascular risk factors at baseline among the randomized groups. No significant differences between groups were found. General practitioners advised 11.4% (103 persons) of the 905 tested in the intervention groups that they had an elevated or high CRS (≥10) at baseline. Of these, 52 belonged to the health screening group and 51 to the health screening plus discussion group. Prior to the test almost all participants were unaware of any existing cardiovascular disease.
Of the 443 persons in the health screening plus discussion group who accepted the offer of a consultation, 307 (69.3%) (95% CI, 64.8%–73.6%) decided to change their lifestyle in 1 or more respects. The number was significantly higher among those who had been advised of an elevated cardiovascular risk and who accepted the offer of a health discussion: 46 of 51 (90.2%) (95% CI, 78.6%–96.7%). In decreasing frequency, the goals set related to weight (63%) (95% CI, 47.5%–76.8%), diet (50.0%) (95% CI, 34.9%–65.1%), physical activity (50.0%) (95% CI, 34.9%–65.1%), smoking (43.5%) (95% CI 28.9%–58.9%), alcohol use (17.4%) (95% CI 7.8%–31.4%), and work (13.0%) (95% CI, 4.9%–26.3%). Emotional well-being, drug treatment, and other subjects (in each case by 2 different participants) were also discussed.
Figure 2 presents the flowchart of the study, focusing on participation in the health screenings. For the health discussions, the participation rate at baseline (1992) was very high. However, interest declined markedly in the follow-up period. Among baseline participants in the health screening plus discussion group, the percentage who agreed to the follow-up consultations was 97.1% in 1992, 35.7% in 1993, 16.9% in 1994, 15.1% in 1995, 8.6% in 1996, and 7.0% in 1997 (87.9% in 1992, 32.3% in 1993, 15.3% in 1994, 13.7% in 1995, 7.7% in 1996, and 6.5% in 1997 of all those randomized into the health screening plus discussion group). In total, 88.9% of those randomized into the health screening plus discussion group had at least 1 health discussion, 45.2% had at least 2 discussions, and 18.1% had at least 3 discussions.
TABLE 1
Baseline demographics and cardiovascular risk factors
| Control | Health screening | Health screening plus discussion | Valid N | |
|---|---|---|---|---|
| All participants | N = 501 | N = 502 | N = 504 | |
| Age in years | 40.4 (5.8) | 40.4 (5.6) | 40.6 (5.7) | 1507 |
| % males | 48.3 | 48.6 | 49.0 | 1507 |
| % cohabitating | 81.7 | 82.3 | 83.8 | 1496 |
| % smokers* | 51.4 | 51.4 | 53.9 | 1501 |
| BMI (kg/m2) | 24.4 (4.0) | 24.1 (3.6) | 24.6 (4.2) | 1463 |
| Screened participants | N = 449 | N = 456 | ||
| CRS | — | 5.69 (3.11) | 5.95 (3.07) | 905 |
| BMI (kg/m2) | — | 24.8 (3.8) | 25.3 (4.7) | 905 |
| Systolic BP (mm Hg) | — | 122.2 (14.5) | 123.0 (16.0) | 905 |
| Diastolic BP (mm Hg) | 77.7 (9.5) | 77.2 (10.0) | 905 | |
| Serum cholesterol (mmol/L)† | — | 5.60 (1.05) | 5.68 (1.06) | 905 |
| CO in exp. air (parts/million)‡ | ||||
| Among all | — | 3 (2–17) | 3 (2–16) | 905 |
| Among smokers | — | 17 (10–24) | 16 (8–24) | 461 |
| Values presented as mean (SD) unless otherwise noted. | ||||
| *Including occasional smokers. | ||||
| †To convert mmol/L to mg/dL, multiply by 38.7. | ||||
| ‡Median (25%–75% percentile). | ||||
| BMI, body mass index; BP, blood pressure; CO, carbon monoxide; CRS, cardiovascular risk score. | ||||
FIGURE 2
Flowchart of participation in The Ebeltoft Health Promotion Study, focusing on participation in the health screenings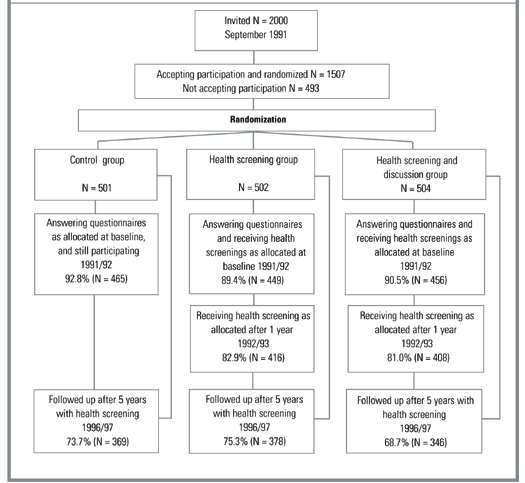
Impact on cardiovascular risk
Table 2 shows the mean CRS and other cardiovascular risk factors at the 5-year follow-up. No significant differences were noted in any of the measures between the 2 intervention groups; therefore, data from these 2 groups are presented together. In comparison to the control group, participants in the intervention groups have a significantly lower CRS, BMI, and serum cholesterol level after 5 years. There were no significant differences between the control and intervention groups in terms of blood pressure. Differences between the control and the intervention groups are more pronounced among the baseline risk groups. Smoking and CO concentration were not significantly affected overall or between risk groups.
Table 3 shows a marked difference between the control and the intervention groups in the prevalence of persons with elevated CRS at the 5-year follow-up. The RR is reduced to about half—at the 5-year follow-up the prevalence of those with elevated CRS in the intervention groups is approximately half that in the control group. The absolute risk reduction is 8.6% (number needed to treat = 11.6). The same pattern is evident among baseline risk groups—the RR of having elevated CRS is reduced to about half, but with larger absolute risk reductions.
According to self-reported data at the 5-year follow-up, the positive impact on cardiovascular risk factors was not a result of medication. In the control group, 6.8% were using blood pressure medicine, compared to 4.8% in the intervention groups; 1.0% of the control group and 0.9% of the intervention groups were on heart medication, and 3.9% of the control group and 3.7% of the intervention groups were on diuretic medication.
TABLE 2
Cardiovascular risk score and other cardiovascular risk factors after 5 years of follow-up
| Control | Intervention | |
|---|---|---|
| All participants | N = 369 | N = 724 |
| CRS | 6.25 (3.47) | 5.69 (3.05)* |
| BMI (kg/m2) | 26.5 (4.4) | 25.9 (4.1)† |
| Systolic BP (mm Hg) | 132.6 (19.9) | 130.9 (18.2) |
| Diastolic BP (mm Hg) | 81.0 (11.7) | 79.8 (10.5) |
| Serum cholesterol (mmol/L)‡ | 5.68 (1.06) | 5.54 (1.03)† |
| Smoker participants | N = 181 | N = 345 |
| CRS | 7.47 (3.56) | 6.79 (3.11)† |
| BMI (kg/m2) | 26.2 (4.5) | 25.4 (4.0) |
| Systolic BP (mm Hg) | 132.8 (19.8) | 128.4 (17.4)* |
| Diastolic BP (mm Hg) | 80.9 (11.6) | 78.3 (10.2)* |
| Serum cholesterol (mmol/L)‡ | 5.73 (0.97) | 5.57 (1.07) |
| Overweight participants § | N = 58 | N = 111 |
| CRS | 9.28 (3.29) | 7.50 (2.99)* |
| BMI (kg/m2) | 33.6 (3.9) | 32.2 (3.6)† |
| Systolic BP (mm Hg) | 147.0 (22.3) | 139.0 (20.1)† |
| Diastolic BP (mm Hg) | 89.8 (12.3) | 84.4 (10.7)* |
| Serum cholesterol (mmol/L)‡ | 6.20 (1.12) | 5.81 (0.96)† |
| Values presented as mean (SD) unless otherwise noted. | ||
| *P < .01; | ||
| †P < .05. | ||
| ‡To convert mmol/L to mg/dL, multiply by 38.7. | ||
| §Self-reported BMI ≥ 27.5. | ||
| BMI, body mass index; BP, blood pressure; CO, carbon monoxide; CRS, cardiovascular risk score. | ||
TABLE 3
Prevalence proportion and relative risk of having elevated cardiovascular risk score or other cardiovascular risk factors, after 5 years of follow-up
| Control (%) | Intervention (%) | Intervention/control RR (95% CI) | |
|---|---|---|---|
| All participants | N = 369 | N = 724 | |
| Elevated or high CRS (≥10) | 18.7 | 10.1* | 0.54 (0.40–0.73) |
| BMI (≥27.5 kg/m2) | 35.0 | 30.8 | 0.88 (0.74–1.05) |
| Systolic BP (≥140 mm Hg) | 30.9 | 27.1 | 0.88 (0.72–1.06) |
| Diastolic BP (≥90 mm Hg) | 21.1 | 16.2† | 0.77 (0.59–0.99) |
| Serum cholesterol (≥6 mmol/L)‡ | 39.0 | 31.4† | 0.80 (0.68–0.95) |
| Smoker participants | N = 181 | N = 345 | |
| Elevated or high CRS (≥10) | 28.7 | 16.5* | 0.58 (0.41–0.80) |
| BMI (≥27.5 kg/m2) | 33.7 | 29.3 | 0.87 (0.67–1.13) |
| Systolic BP (≥140 mm Hg) | 31.5 | 23.2† | 0.74 (0.55–0.98) |
| Diastolic BP (≥90 mm Hg) | 22.1 | 12.5* | 0.56 (0.38–0.83) |
| Serum cholesterol (≥6 mmol/L)‡ | 40.3 | 32.5 | 0.81 (0.64–1.02) |
| Overweight participants§ | N = 58 | N = 111 | |
| Elevated or high CRS (≥10) | 46.6 | 21.6* | 0.46 (0.30–0.73) |
| BMI (≥27.5 kg/m2) | 100.0 | 91.9† | 0.92 (0.87–0.97) |
| Systolic BP (≥140 mm Hg) | 63.8 | 36.9* | 0.58 (0.42–0.79) |
| Diastolic BP (≥90 mm Hg) | 46.6 | 26.1* | 0.56 (0.37–0.85) |
| Serum cholesterol (≥6 mmol/L)‡ | 58.6 | 41.4† | 0.71 (0.52–0.96) |
| *P < .01; | |||
| †P < .05. | |||
| ‡ To convert mmol/L to mg/dL, multiply by 38.7. | |||
| §Self-reported BMI ≥ 27.5. | |||
| BMI, body mass index; BP, blood pressure; CRS, cardiovascular risk score; RR, relative risk. | |||
Discussion
This study is the first to present 5-year follow-up results from a randomized controlled trial showing the impact of general health screenings and discussions with general practitioners on the cardiovascular risk profile of a general population. The intervention had a modest impact on mean CRS in the general population, and a marked impact on the prevalence of those who were at cardiovascular risk. The impact was significantly greater for groups at cardiovascular risk; the relative risk reduction was approximately the same in those at risk as those not at risk, but with larger absolute risk reductions. The study does not indicate whether the reduction in CRS factors will result in reduced morbidity or mortality.
At the 5-year follow-up there was no difference between the CRS in the health screening plus discussion group and the screening only group. The discussion alone had no discernible impact. Several factors, however, may obscure the role of the discussions with general practitioners in this study. For ethical reasons, all persons advised of an elevated cardiovascular risk were offered a consultation with their general practitioner, regardless of their intervention group. Although consultations in such cases were probably not as extensive and detailed as those offered as part of the study, they may confound the difference in the degree of intervention between the 2 groups. The Danish Health System ensures that all participants can see their own general practitioner at no cost whenever they wish. Participants who were not offered a health discussion as part of the study may nevertheless have taken advantage of this free system to consult their general practitioner, especially if they were advised to do so. Moreover, the low rate of participation after the primary health discussion weakens the strength of the intervention in the health screening plus discussion group. Although the study thus does not provide evidence that such discussions played an essential role in the intervention, health screenings alone may not achieve the same impact. The psychological impact of the intervention may also be different for those who had personal consultations with their general practitioner after the health screening. The BMI values included a few individuals with unhealthily low BMI (<19). The distribution was not significantly different between the groups, although a tendency for an unhealthily low BMI of a slightly greater number of patients was seen in the intervention groups, highlighting the fact that weight loss is not always a relevant factor. Focusing on lifestyle changes might trigger some individuals to indulge in anorexic attitudes and behavior.
The results indicate that health screenings should be both population-based and individually oriented, and that general practitioners should be involved. The population screening is necessary to identify those at risk, since almost none of those with elevated cardiovascular risk were aware of their condition prior to screening. The fact that the general practitioner personally contacted the participants may have increased the participation rate, which is high in this study. In the written feedback after the screenings, general practitioners adjusted their advice to individual participants according to test results, and where appropriate advised them to come in for a personal consultation.
For several reasons, the impact of the intervention—both health screenings and discussions—may be greater than our findings suggest. We cannot measure the impact of the questionnaires on the control group—a methodological problem which also affected the OXCHECK study.7,8 In the British Family Heart Study,9,10 the control group was apparently unaffected, but the design of that study makes it impossible to assess the impact of subsequent intervention on baseline risk groups. Moreover, the fact that all the participants in the present study live in a small community may reduce the differences in degrees of intervention among the groups, although this is partially addressed by placing cohabiting couples in the same intervention group. Contact among patients within the various clinics involved may also have blurred the differences between the intervention groups.
In the present study, the general practitioners were not trained in any specific psychotherapeutic method for conducting the health discussions. The low rate of participation in follow-up consultations suggests a need to find better methods of motivating participants. Training general practitioners to use motivational discussions to inspire behavioral change, for example, might increase the impact of the intervention.3,4 Counseling to trigger changes in attitude and behavior, particularly when modified to the individual’s readiness to change, might be more effective than a traditional health discussion focusing mainly on various risk factors.
Important findings from this study are that a major part of the population is interested in having health screenings and discussions with their general practitioner, although interest declines rapidly; that individuals with elevated risk of coronary heart disease set relevant goals for themselves for lifestyle changes; and that cardiovascular risk after 5 years of follow-up is reduced. Planned health discussions about the health screening results do not seem to reduce cardiovascular risk.
Acknowledgments
The following general practitioners participated in the study: A. Bøgedal, P. Grønbæk, L. Jørgensen, P.T. Jørgensen, H. Lundberg, J.M. Nielsen, G.S. Pedersen, J.C. Rahbek, and N. Bie. We thank the staff at the general practitioners clinic in Ebeltoft for their extraordinary efforts, including the extensive and brilliant administrative assistance given by A. Hilligsøe and E. Therkildsen. Thanks also to A. Brock, head of the laboratory at Randers Central Hospital for analysis of blood and urine, and Sally Laird for revision of English texts relating to the study.
1. Calnan M, Cant S, Williams S, Killoran A. Involvement of the primary health care team in coronary heart disease prevention. Br J Gen Pract 1994;44:224-8.
2. Christensen B. Effect of general practitioners advice to men with increased risk of ischemic heart disease. Ugeskr Laeger 1995;157:4244-8 (Danish).
3. Hjermann I, Velve Byre K, Holme I, Leren P. Effect of diet and smoking intervention on the incidence of coronary heart disease. Report from the Oslo Study Group of a randomized trial in healthy men. Lancet 1981;2:1303-10.
4. Puska P, Salonen JT, Nissinen A, et al. Change in risk factors for coronary heart disease during 10 years of a community intervention programme (North Karelia project). Br Med J (Clin Res Ed) 1983;287:1840-4.
5. Farquhar JW, Fortmann SP, Flora JA, et al. Effects of community-wide education on cardiovascular disease risk factors. The Stanford Five-City Project. JAMA 1990;264:359-65.
6. Wilhelmsen L, Berglund G, Elmfeldt D, et al. The multifactor primary prevention trial in Goteborg, Sweden. Eur Heart J 1986;4:279-88.
7. Effectiveness of health checks conducted by nurses in primary care: results of the OXCHECK study after one year. Imperial Cancer Research Fund OXCHECK Study Group. BMJ 1994;308:308-12.
8. Effectiveness of health checks conducted by nurses in primary care: final results of the OXCHECK study. Imperial Cancer Research Fund OXCHECK Study Group. BMJ 1995;310:1099-1104.
9. Randomized controlled trial evaluating cardiovascular screening and intervention in general practice: principal results of British family heart study. Family Heart Study Group. BMJ 1994;308:313-20.
10. British family heart study: its design and method, and prevalence of cardiovascular risk factors. Family heart study group. Br J Gen Pract 1994;44:62-7.
11. Knutsen SF, Knutsen R. The Tromso Survey: the Family Intervention study the effect of intervention on some coronary risk factors and dietary habits: a 6-year follow-up. Prev Med 1991;20:197-212.
12. Cupples ME, McKnight A. Randomised controlled trial of health promotion in general practice for patients at high cardiovascular risk. BMJ 1994;309:993-6.
13. Stott N. Screening for cardiovascular risk in general practice. BMJ 1994;308:285-6.
14. Stewart-Brown S, Farmer A. Screening could seriously damage your health. BMJ 1997;314:533-4.
15. J, Skrabanek P. Coronary heart disease is not preventable by population interventions. Lancet 1988;2:839-41.
16. Waller D, Agass M, Mant D, Coulter A, Fuller A, Jones L. Health checks in general practice: another example of inverse care? Br Med J 1990;300:1115-8.
17. Ebrahim S, Smith GD. Systematic review of randomised controlled trials of multiple risk factor interventions for preventing coronary heart disease. BMJ 1997;314:1666-74.
18. Ebrahim S, Davey Smith G. Multiple risk factor interventions for primary prevention of coronary heart disease (Cohrane Review). In: The Cochrane Library, Issue 3, 2001. Oxford: Update Software.
19. Cutler JL, Ramcharan S, Feldman R, Siegelaub AB, Campbell B, Friedman GD, Dales LG, Collen MF. Multiphasic checkup evaluation study. 1. Methods and population. Prev Med 1973;2:197-206.
20. Dales LG, Friedman GD, Collen MF. Evaluating periodic multiphasic health checkups: a controlled trial. J Chronic Dis 1979;32:385-404.
21. Multiple risk factor intervention trial. Risk factor changes and mortality results. Multiple Risk Factor Intervention Trial Research Group. JAMA 1982;248:1465-77.
22. Bille PE, Freund KC, Frimodt-Møller J. Forebyggende helbred-sundersøgelser/helbreds-samtaler for voksne i Nordjyllands Amt. Denmark: B.J. Grafik; 1990.
23. Lauritzen T, Leboeuf-Yde C, Lunde IM, Nielsen KD. Ebeltoft project: baseline data from a five-year randomized, controlled, prospective health promotion study in a Danish population. Br J Gen Pract 1995;45:542-7.
24. Sorensen HT, Thulstrup AM, Norgdard B, et al. Fetal growth and blood pressure in a Danish population aged 31-51 years. Scand Cardiovasc J 2000;34:390-5.
25. Thulstrup AM, Norgard B, Steffensen FH, Vilstrup H, Sorensen HT, Lauritzen T. Waist circumference and body mass index as predictors of elevated alanine transaminase in Danes aged 30 to 50 years. Dan Med Bull 1999;46:429-31.
26. Thulstrup AM, Sorensen HT, Steffensen FH, Vilstrup H, Lauritzen T. Changes in liver-derived enzymes and self-reported alcohol consumption. A 1-year follow-up study in Denmark. Scand J Gastroenterol 1999;34:189-93.
27. Steffensen FH, Sorensen HT, Brock A, Vilstrup H, Lauritzen T. Alcohol consumption and liver enzymes in persons 30-50 years of age. Cross-sectional study from Ebeltoft. Ugeskr Laeger 1997;159:5945-50.
28. Steffensen FH, Sorensen HT, Brock A, Vilstrup H, Lauritzen T. Alcohol consumption and serum liver-derived enzymes in a Danish population aged 30-50 years. Int J Epidemiol 1997;26:92-9.
29. Leboeuf-Yde C, Klougart N, Lauritzen T. How common is low back pain in the Nordic population? Data from a recent study on a middle-aged general Danish population and four surveys previously conducted in the Nordic countries. Spine 1996;21:1518-25.
30. Lauritzen T, Christiansen JS, Brock A, Mogensen CE. Repeated screening for albumin-creatinine ratio in an unselected population. The Ebeltoft Health Promotion Study, a randomized, population-based intervention trial on health test and health conversations with general practitioners. J Diabetes Complications 1994;8:146-9.
31. Karlsmose B, Lauritzen T, Engberg M, Parving A. A five-year longitudinal study of hearing in a Danish rural population aged 31-50 years. Br J Audiol 2000;34:47-55.
32. Karlsmose B, Lauritzen T, Parving A. Prevalence of hearing impairment and subjective hearing problems in a rural Danish population aged 31-50 years. Br J Audiol 1999;33:395-402.
33. Anggard EE, Land JM, Lenihan CJ, et al. Prevention of cardiovascular disease in general practice: a proposed model. Br Med J (Clin Res Ed) 1986;293:177-80.
34. Roberts A, Roberts P. Intensive cardiovascular risk factor intervention in a rural practice: a glimmer of hope. Br J Gen Pract 1998;48:967-70.
OBJECTIVES: To investigate the impact of general health screenings and discussions with general practitioners on the cardiovascular risk profile of a random population of patients.
STUDY DESIGN: A population-based, randomized, controlled, 5-year follow-up trial conducted in a primary care setting.
POPULATION: The study group consisted of 2000 patients, randomly selected middle-aged men and women aged 30 to 50 years, from family practices in the district of Ebeltoft, Denmark. Of these patients, 1507 (75.4%) agreed to participate. Patients were randomized into (1) a control group that received no health screenings, (2) an intervention group that received 2 health screenings, (3) an intervention group that received both the 2 screenings and a 45-minute follow-up consultation annually.
OUTCOMES MEASURED: Cardiovascular risk score (CRS), body mass index (BMI), blood pressure, serum cholesterol, carbon monoxide in expiratory air, and tobacco use.
RESULTS: After 5 years, the CRS, BMI, and serum cholesterol levels were lower in the intervention groups compared with the control group. The improved outcome was greater in the baseline risk groups. The number of patients with elevated CRS in the intervention groups was approximately half the number of patients with elevated CRS in the control group. The difference was not a result of medication use. There was no difference between the group that received consultations after the screenings and the group that had health screenings alone.
CONCLUSIONS: Health screenings reduced the CRS in the intervention groups. After 5 years of follow-up, the number of persons at elevated cardiovascular risk was about half that expected, based on the prevalence/proportion in a population not receiving the health checks (the control group). The impact of intervention was higher among at-risk individuals. Consultations about health did not appear to improve the cardiovascular profile of the study population.
- Health screening decreased cardiovascular risk in the general population.
- The mean cardiovascular risk score was modestly reduced, and the proportion of persons at elevated cardiovascular risk was reduced to about half that expected after 5 years.
- The impact was more marked among groups at risk for cardiovascular disease.
- Planned health discussions in relation to the health screening did not seem to increase the impact on cardiovascular risk profile.
Many general practitioners believe their patients benefit from preventive health care and, as a result, many concentrate on identifying and treating risk factors for coronary heart disease (CHD),1,2 as many studies show that intervention can reduce risk.3-6 Other studies have suggested that such intervention results in only modest improvements in the risk profile of the general population,7-12 which raises questions about the efficacy of preventive health care.13,16 As of the early 1990s, few randomized, controlled, long-term trials have documented the effect of health screening as a primary prevention tool in reducing cardiovascular risk in the general population.17,18 In earlier large-scale studies on multiple-riskfactor intervention, interventions were not restricted to the intervention groups (controls received similar interventions to some extent); moreover, the studies contained other methodological problems that may have minimized the outcomes between control and intervention groups.19-21
This study was inspired by a Danish trial22 that focused not only on the prevention of CHD, but on preventing general health problems using lifestyle changes as the primary intervention tool.23 During the 1990s, results from 2 studies using different, though comparable, randomized designs were published.7-10 These studies focused more narrowly on the prevention of CHD8,17,18 and only 1 study had follow-up of more than 1 year. Relevant studies of the impact of intervention, therefore, are still lacking.
This article reports on the impact of general health screenings and health discussions with general practitioners on the cardiovascular risk profile of an unrandomized population. Other aspects of the study have been reported elsewhere.24-32
Methods
Setting and participants
The study took place in the district of Ebeltoft, Aarhus County, Denmark, a rural area with a total population of approximately 13,000. All 9 general practitioners from the district participated. Before the study began, the general practitioners participated in 4 meetings on prevention of heart and lung disease, dietary advice, and engaging in health discussions with patients.
Of 3464 inhabitants aged 30 to 49 years by January 1, 1991, and registered with a local general practitioner, a random sample of 2000 (57.7%) were invited to participate in the study. An employee of Aarhus County who was not otherwise involved in the study selected participants by birth dates. Registration with a general practitioner gives free access to medical services and is available to all Danish citizens. The 3464 persons from whom the participants were drawn constituted 87% of the entire population in the selected age group.
In September 1991, the 2000 persons received an invitation to participate along with a questionnaire about general demographic information and lifestyle, signed by their general practitioner. All who agreed to participate received an extensive supplementary baseline questionnaire with detailed questions that evaluated the participant’s health, lifestyle, psychosocial status, and psychosocial life events. Participants were informed by their general practitioner about which intervention they would be offered.
Randomization
Participants were randomly assigned to 1 of 3 groups by proportional, stratified randomization based on the general practitioner with whom they were registered, their sex, age, cohabitation status, and body mass index (BMI). All 3 groups received questionnaires. Health screenings were offered to 2 of the groups and follow-up health discussions with the general practitioner were offered to participants in only 1 of the 2 intervention groups. An employee of Aarhus County who was not otherwise involved in the study carried out the randomization.
Health screenings
Participants were given a multiphasic, broad-spectrum screening. This included a calculation of cardiovascular risk score (CRS), giving an estimate of the risk of premature cardiovascular disease for each individual. Figure 1 shows the calculation of CRS based on sex, familial inheritance (number of family members with ischemic heart disease before age 55), tobacco use, blood pressure, serum cholesterol (total), and BMI33 and the subsequent division into risk groups. Baseline health screenings were performed by 3 laboratory assistants between December 1991 and June 1992 and took place in the town of Ebeltoft, in the central clinic which 5 of the general practitioners shared. A few weeks after the health screening, all those tested received personal written feedback from their general practitioners. Where values fell outside the normal range, the feedback included advice relating primarily to lifestyle changes. All participants who had been advised that they had an elevated or high CRS were encouraged to see their general practitioner, regardless of their randomization group. All tested participants also received pamphlets on leading a healthy lifestyle from the Danish Heart Foundation.
FIGURE 1
Calculation of cardiovascular risk score
Health discussions
A 45-minute consultation with their own general practitioner was offered to participants from the health screening plus discussion group. Prior to the consultation, the participants completed a short questionnaire about suitable topics for discussion. At the end of the consultation, general practitioners invited participants to set a maximum of 3 health-related lifestyle goals for the following year. In cooperation with the participant, general practitioners then recorded these goals in a separate questionnaire.
Follow-up
Follow-up took place 1 and 5 years after the baseline intervention. Participants received follow-up questionnaires and were offered health screenings and health discussions according to their group of randomization. Participants in the health screening plus discussion group were offered annual consultations. The control group was promised a health screening and a health discussion at the end of the study period. Other details of the design are outlined elsewhere.23
Data analysis and statistics
SPSS version 9.0 for Windows was used to analyze results. Double data entry was used for the laboratory tests. Differences between groups were evaluated by 2- test for categorical data, by t-test for means, and by nonparametric testing for nonparametric data. Ninety-five percent confidence intervals (95% CI) were applied to relative risk (RR) values. Information was used from the baseline questionnaires to identify baseline risk groups among all those randomized. At the 5-year follow-up, randomized groups were compared according to the intention-to-treat rule (ie, regardless of their compliance with the intervention program).
Results
Participation at baseline and follow-up
Seventy-five percent (1507) of the 2000 persons invited to participate agreed to take part in the study. The percentage was higher among women (80.0%) than among men (71.0%).
Table 1shows the distribution of sociodemographic and cardiovascular risk factors at baseline among the randomized groups. No significant differences between groups were found. General practitioners advised 11.4% (103 persons) of the 905 tested in the intervention groups that they had an elevated or high CRS (≥10) at baseline. Of these, 52 belonged to the health screening group and 51 to the health screening plus discussion group. Prior to the test almost all participants were unaware of any existing cardiovascular disease.
Of the 443 persons in the health screening plus discussion group who accepted the offer of a consultation, 307 (69.3%) (95% CI, 64.8%–73.6%) decided to change their lifestyle in 1 or more respects. The number was significantly higher among those who had been advised of an elevated cardiovascular risk and who accepted the offer of a health discussion: 46 of 51 (90.2%) (95% CI, 78.6%–96.7%). In decreasing frequency, the goals set related to weight (63%) (95% CI, 47.5%–76.8%), diet (50.0%) (95% CI, 34.9%–65.1%), physical activity (50.0%) (95% CI, 34.9%–65.1%), smoking (43.5%) (95% CI 28.9%–58.9%), alcohol use (17.4%) (95% CI 7.8%–31.4%), and work (13.0%) (95% CI, 4.9%–26.3%). Emotional well-being, drug treatment, and other subjects (in each case by 2 different participants) were also discussed.
Figure 2 presents the flowchart of the study, focusing on participation in the health screenings. For the health discussions, the participation rate at baseline (1992) was very high. However, interest declined markedly in the follow-up period. Among baseline participants in the health screening plus discussion group, the percentage who agreed to the follow-up consultations was 97.1% in 1992, 35.7% in 1993, 16.9% in 1994, 15.1% in 1995, 8.6% in 1996, and 7.0% in 1997 (87.9% in 1992, 32.3% in 1993, 15.3% in 1994, 13.7% in 1995, 7.7% in 1996, and 6.5% in 1997 of all those randomized into the health screening plus discussion group). In total, 88.9% of those randomized into the health screening plus discussion group had at least 1 health discussion, 45.2% had at least 2 discussions, and 18.1% had at least 3 discussions.
TABLE 1
Baseline demographics and cardiovascular risk factors
| Control | Health screening | Health screening plus discussion | Valid N | |
|---|---|---|---|---|
| All participants | N = 501 | N = 502 | N = 504 | |
| Age in years | 40.4 (5.8) | 40.4 (5.6) | 40.6 (5.7) | 1507 |
| % males | 48.3 | 48.6 | 49.0 | 1507 |
| % cohabitating | 81.7 | 82.3 | 83.8 | 1496 |
| % smokers* | 51.4 | 51.4 | 53.9 | 1501 |
| BMI (kg/m2) | 24.4 (4.0) | 24.1 (3.6) | 24.6 (4.2) | 1463 |
| Screened participants | N = 449 | N = 456 | ||
| CRS | — | 5.69 (3.11) | 5.95 (3.07) | 905 |
| BMI (kg/m2) | — | 24.8 (3.8) | 25.3 (4.7) | 905 |
| Systolic BP (mm Hg) | — | 122.2 (14.5) | 123.0 (16.0) | 905 |
| Diastolic BP (mm Hg) | 77.7 (9.5) | 77.2 (10.0) | 905 | |
| Serum cholesterol (mmol/L)† | — | 5.60 (1.05) | 5.68 (1.06) | 905 |
| CO in exp. air (parts/million)‡ | ||||
| Among all | — | 3 (2–17) | 3 (2–16) | 905 |
| Among smokers | — | 17 (10–24) | 16 (8–24) | 461 |
| Values presented as mean (SD) unless otherwise noted. | ||||
| *Including occasional smokers. | ||||
| †To convert mmol/L to mg/dL, multiply by 38.7. | ||||
| ‡Median (25%–75% percentile). | ||||
| BMI, body mass index; BP, blood pressure; CO, carbon monoxide; CRS, cardiovascular risk score. | ||||
FIGURE 2
Flowchart of participation in The Ebeltoft Health Promotion Study, focusing on participation in the health screenings
Impact on cardiovascular risk
Table 2 shows the mean CRS and other cardiovascular risk factors at the 5-year follow-up. No significant differences were noted in any of the measures between the 2 intervention groups; therefore, data from these 2 groups are presented together. In comparison to the control group, participants in the intervention groups have a significantly lower CRS, BMI, and serum cholesterol level after 5 years. There were no significant differences between the control and intervention groups in terms of blood pressure. Differences between the control and the intervention groups are more pronounced among the baseline risk groups. Smoking and CO concentration were not significantly affected overall or between risk groups.
Table 3 shows a marked difference between the control and the intervention groups in the prevalence of persons with elevated CRS at the 5-year follow-up. The RR is reduced to about half—at the 5-year follow-up the prevalence of those with elevated CRS in the intervention groups is approximately half that in the control group. The absolute risk reduction is 8.6% (number needed to treat = 11.6). The same pattern is evident among baseline risk groups—the RR of having elevated CRS is reduced to about half, but with larger absolute risk reductions.
According to self-reported data at the 5-year follow-up, the positive impact on cardiovascular risk factors was not a result of medication. In the control group, 6.8% were using blood pressure medicine, compared to 4.8% in the intervention groups; 1.0% of the control group and 0.9% of the intervention groups were on heart medication, and 3.9% of the control group and 3.7% of the intervention groups were on diuretic medication.
TABLE 2
Cardiovascular risk score and other cardiovascular risk factors after 5 years of follow-up
| Control | Intervention | |
|---|---|---|
| All participants | N = 369 | N = 724 |
| CRS | 6.25 (3.47) | 5.69 (3.05)* |
| BMI (kg/m2) | 26.5 (4.4) | 25.9 (4.1)† |
| Systolic BP (mm Hg) | 132.6 (19.9) | 130.9 (18.2) |
| Diastolic BP (mm Hg) | 81.0 (11.7) | 79.8 (10.5) |
| Serum cholesterol (mmol/L)‡ | 5.68 (1.06) | 5.54 (1.03)† |
| Smoker participants | N = 181 | N = 345 |
| CRS | 7.47 (3.56) | 6.79 (3.11)† |
| BMI (kg/m2) | 26.2 (4.5) | 25.4 (4.0) |
| Systolic BP (mm Hg) | 132.8 (19.8) | 128.4 (17.4)* |
| Diastolic BP (mm Hg) | 80.9 (11.6) | 78.3 (10.2)* |
| Serum cholesterol (mmol/L)‡ | 5.73 (0.97) | 5.57 (1.07) |
| Overweight participants § | N = 58 | N = 111 |
| CRS | 9.28 (3.29) | 7.50 (2.99)* |
| BMI (kg/m2) | 33.6 (3.9) | 32.2 (3.6)† |
| Systolic BP (mm Hg) | 147.0 (22.3) | 139.0 (20.1)† |
| Diastolic BP (mm Hg) | 89.8 (12.3) | 84.4 (10.7)* |
| Serum cholesterol (mmol/L)‡ | 6.20 (1.12) | 5.81 (0.96)† |
| Values presented as mean (SD) unless otherwise noted. | ||
| *P < .01; | ||
| †P < .05. | ||
| ‡To convert mmol/L to mg/dL, multiply by 38.7. | ||
| §Self-reported BMI ≥ 27.5. | ||
| BMI, body mass index; BP, blood pressure; CO, carbon monoxide; CRS, cardiovascular risk score. | ||
TABLE 3
Prevalence proportion and relative risk of having elevated cardiovascular risk score or other cardiovascular risk factors, after 5 years of follow-up
| Control (%) | Intervention (%) | Intervention/control RR (95% CI) | |
|---|---|---|---|
| All participants | N = 369 | N = 724 | |
| Elevated or high CRS (≥10) | 18.7 | 10.1* | 0.54 (0.40–0.73) |
| BMI (≥27.5 kg/m2) | 35.0 | 30.8 | 0.88 (0.74–1.05) |
| Systolic BP (≥140 mm Hg) | 30.9 | 27.1 | 0.88 (0.72–1.06) |
| Diastolic BP (≥90 mm Hg) | 21.1 | 16.2† | 0.77 (0.59–0.99) |
| Serum cholesterol (≥6 mmol/L)‡ | 39.0 | 31.4† | 0.80 (0.68–0.95) |
| Smoker participants | N = 181 | N = 345 | |
| Elevated or high CRS (≥10) | 28.7 | 16.5* | 0.58 (0.41–0.80) |
| BMI (≥27.5 kg/m2) | 33.7 | 29.3 | 0.87 (0.67–1.13) |
| Systolic BP (≥140 mm Hg) | 31.5 | 23.2† | 0.74 (0.55–0.98) |
| Diastolic BP (≥90 mm Hg) | 22.1 | 12.5* | 0.56 (0.38–0.83) |
| Serum cholesterol (≥6 mmol/L)‡ | 40.3 | 32.5 | 0.81 (0.64–1.02) |
| Overweight participants§ | N = 58 | N = 111 | |
| Elevated or high CRS (≥10) | 46.6 | 21.6* | 0.46 (0.30–0.73) |
| BMI (≥27.5 kg/m2) | 100.0 | 91.9† | 0.92 (0.87–0.97) |
| Systolic BP (≥140 mm Hg) | 63.8 | 36.9* | 0.58 (0.42–0.79) |
| Diastolic BP (≥90 mm Hg) | 46.6 | 26.1* | 0.56 (0.37–0.85) |
| Serum cholesterol (≥6 mmol/L)‡ | 58.6 | 41.4† | 0.71 (0.52–0.96) |
| *P < .01; | |||
| †P < .05. | |||
| ‡ To convert mmol/L to mg/dL, multiply by 38.7. | |||
| §Self-reported BMI ≥ 27.5. | |||
| BMI, body mass index; BP, blood pressure; CRS, cardiovascular risk score; RR, relative risk. | |||
Discussion
This study is the first to present 5-year follow-up results from a randomized controlled trial showing the impact of general health screenings and discussions with general practitioners on the cardiovascular risk profile of a general population. The intervention had a modest impact on mean CRS in the general population, and a marked impact on the prevalence of those who were at cardiovascular risk. The impact was significantly greater for groups at cardiovascular risk; the relative risk reduction was approximately the same in those at risk as those not at risk, but with larger absolute risk reductions. The study does not indicate whether the reduction in CRS factors will result in reduced morbidity or mortality.
At the 5-year follow-up there was no difference between the CRS in the health screening plus discussion group and the screening only group. The discussion alone had no discernible impact. Several factors, however, may obscure the role of the discussions with general practitioners in this study. For ethical reasons, all persons advised of an elevated cardiovascular risk were offered a consultation with their general practitioner, regardless of their intervention group. Although consultations in such cases were probably not as extensive and detailed as those offered as part of the study, they may confound the difference in the degree of intervention between the 2 groups. The Danish Health System ensures that all participants can see their own general practitioner at no cost whenever they wish. Participants who were not offered a health discussion as part of the study may nevertheless have taken advantage of this free system to consult their general practitioner, especially if they were advised to do so. Moreover, the low rate of participation after the primary health discussion weakens the strength of the intervention in the health screening plus discussion group. Although the study thus does not provide evidence that such discussions played an essential role in the intervention, health screenings alone may not achieve the same impact. The psychological impact of the intervention may also be different for those who had personal consultations with their general practitioner after the health screening. The BMI values included a few individuals with unhealthily low BMI (<19). The distribution was not significantly different between the groups, although a tendency for an unhealthily low BMI of a slightly greater number of patients was seen in the intervention groups, highlighting the fact that weight loss is not always a relevant factor. Focusing on lifestyle changes might trigger some individuals to indulge in anorexic attitudes and behavior.
The results indicate that health screenings should be both population-based and individually oriented, and that general practitioners should be involved. The population screening is necessary to identify those at risk, since almost none of those with elevated cardiovascular risk were aware of their condition prior to screening. The fact that the general practitioner personally contacted the participants may have increased the participation rate, which is high in this study. In the written feedback after the screenings, general practitioners adjusted their advice to individual participants according to test results, and where appropriate advised them to come in for a personal consultation.
For several reasons, the impact of the intervention—both health screenings and discussions—may be greater than our findings suggest. We cannot measure the impact of the questionnaires on the control group—a methodological problem which also affected the OXCHECK study.7,8 In the British Family Heart Study,9,10 the control group was apparently unaffected, but the design of that study makes it impossible to assess the impact of subsequent intervention on baseline risk groups. Moreover, the fact that all the participants in the present study live in a small community may reduce the differences in degrees of intervention among the groups, although this is partially addressed by placing cohabiting couples in the same intervention group. Contact among patients within the various clinics involved may also have blurred the differences between the intervention groups.
In the present study, the general practitioners were not trained in any specific psychotherapeutic method for conducting the health discussions. The low rate of participation in follow-up consultations suggests a need to find better methods of motivating participants. Training general practitioners to use motivational discussions to inspire behavioral change, for example, might increase the impact of the intervention.3,4 Counseling to trigger changes in attitude and behavior, particularly when modified to the individual’s readiness to change, might be more effective than a traditional health discussion focusing mainly on various risk factors.
Important findings from this study are that a major part of the population is interested in having health screenings and discussions with their general practitioner, although interest declines rapidly; that individuals with elevated risk of coronary heart disease set relevant goals for themselves for lifestyle changes; and that cardiovascular risk after 5 years of follow-up is reduced. Planned health discussions about the health screening results do not seem to reduce cardiovascular risk.
Acknowledgments
The following general practitioners participated in the study: A. Bøgedal, P. Grønbæk, L. Jørgensen, P.T. Jørgensen, H. Lundberg, J.M. Nielsen, G.S. Pedersen, J.C. Rahbek, and N. Bie. We thank the staff at the general practitioners clinic in Ebeltoft for their extraordinary efforts, including the extensive and brilliant administrative assistance given by A. Hilligsøe and E. Therkildsen. Thanks also to A. Brock, head of the laboratory at Randers Central Hospital for analysis of blood and urine, and Sally Laird for revision of English texts relating to the study.
1. Calnan M, Cant S, Williams S, Killoran A. Involvement of the primary health care team in coronary heart disease prevention. Br J Gen Pract 1994;44:224-8.
2. Christensen B. Effect of general practitioners advice to men with increased risk of ischemic heart disease. Ugeskr Laeger 1995;157:4244-8 (Danish).
3. Hjermann I, Velve Byre K, Holme I, Leren P. Effect of diet and smoking intervention on the incidence of coronary heart disease. Report from the Oslo Study Group of a randomized trial in healthy men. Lancet 1981;2:1303-10.
4. Puska P, Salonen JT, Nissinen A, et al. Change in risk factors for coronary heart disease during 10 years of a community intervention programme (North Karelia project). Br Med J (Clin Res Ed) 1983;287:1840-4.
5. Farquhar JW, Fortmann SP, Flora JA, et al. Effects of community-wide education on cardiovascular disease risk factors. The Stanford Five-City Project. JAMA 1990;264:359-65.
6. Wilhelmsen L, Berglund G, Elmfeldt D, et al. The multifactor primary prevention trial in Goteborg, Sweden. Eur Heart J 1986;4:279-88.
7. Effectiveness of health checks conducted by nurses in primary care: results of the OXCHECK study after one year. Imperial Cancer Research Fund OXCHECK Study Group. BMJ 1994;308:308-12.
8. Effectiveness of health checks conducted by nurses in primary care: final results of the OXCHECK study. Imperial Cancer Research Fund OXCHECK Study Group. BMJ 1995;310:1099-1104.
9. Randomized controlled trial evaluating cardiovascular screening and intervention in general practice: principal results of British family heart study. Family Heart Study Group. BMJ 1994;308:313-20.
10. British family heart study: its design and method, and prevalence of cardiovascular risk factors. Family heart study group. Br J Gen Pract 1994;44:62-7.
11. Knutsen SF, Knutsen R. The Tromso Survey: the Family Intervention study the effect of intervention on some coronary risk factors and dietary habits: a 6-year follow-up. Prev Med 1991;20:197-212.
12. Cupples ME, McKnight A. Randomised controlled trial of health promotion in general practice for patients at high cardiovascular risk. BMJ 1994;309:993-6.
13. Stott N. Screening for cardiovascular risk in general practice. BMJ 1994;308:285-6.
14. Stewart-Brown S, Farmer A. Screening could seriously damage your health. BMJ 1997;314:533-4.
15. J, Skrabanek P. Coronary heart disease is not preventable by population interventions. Lancet 1988;2:839-41.
16. Waller D, Agass M, Mant D, Coulter A, Fuller A, Jones L. Health checks in general practice: another example of inverse care? Br Med J 1990;300:1115-8.
17. Ebrahim S, Smith GD. Systematic review of randomised controlled trials of multiple risk factor interventions for preventing coronary heart disease. BMJ 1997;314:1666-74.
18. Ebrahim S, Davey Smith G. Multiple risk factor interventions for primary prevention of coronary heart disease (Cohrane Review). In: The Cochrane Library, Issue 3, 2001. Oxford: Update Software.
19. Cutler JL, Ramcharan S, Feldman R, Siegelaub AB, Campbell B, Friedman GD, Dales LG, Collen MF. Multiphasic checkup evaluation study. 1. Methods and population. Prev Med 1973;2:197-206.
20. Dales LG, Friedman GD, Collen MF. Evaluating periodic multiphasic health checkups: a controlled trial. J Chronic Dis 1979;32:385-404.
21. Multiple risk factor intervention trial. Risk factor changes and mortality results. Multiple Risk Factor Intervention Trial Research Group. JAMA 1982;248:1465-77.
22. Bille PE, Freund KC, Frimodt-Møller J. Forebyggende helbred-sundersøgelser/helbreds-samtaler for voksne i Nordjyllands Amt. Denmark: B.J. Grafik; 1990.
23. Lauritzen T, Leboeuf-Yde C, Lunde IM, Nielsen KD. Ebeltoft project: baseline data from a five-year randomized, controlled, prospective health promotion study in a Danish population. Br J Gen Pract 1995;45:542-7.
24. Sorensen HT, Thulstrup AM, Norgdard B, et al. Fetal growth and blood pressure in a Danish population aged 31-51 years. Scand Cardiovasc J 2000;34:390-5.
25. Thulstrup AM, Norgard B, Steffensen FH, Vilstrup H, Sorensen HT, Lauritzen T. Waist circumference and body mass index as predictors of elevated alanine transaminase in Danes aged 30 to 50 years. Dan Med Bull 1999;46:429-31.
26. Thulstrup AM, Sorensen HT, Steffensen FH, Vilstrup H, Lauritzen T. Changes in liver-derived enzymes and self-reported alcohol consumption. A 1-year follow-up study in Denmark. Scand J Gastroenterol 1999;34:189-93.
27. Steffensen FH, Sorensen HT, Brock A, Vilstrup H, Lauritzen T. Alcohol consumption and liver enzymes in persons 30-50 years of age. Cross-sectional study from Ebeltoft. Ugeskr Laeger 1997;159:5945-50.
28. Steffensen FH, Sorensen HT, Brock A, Vilstrup H, Lauritzen T. Alcohol consumption and serum liver-derived enzymes in a Danish population aged 30-50 years. Int J Epidemiol 1997;26:92-9.
29. Leboeuf-Yde C, Klougart N, Lauritzen T. How common is low back pain in the Nordic population? Data from a recent study on a middle-aged general Danish population and four surveys previously conducted in the Nordic countries. Spine 1996;21:1518-25.
30. Lauritzen T, Christiansen JS, Brock A, Mogensen CE. Repeated screening for albumin-creatinine ratio in an unselected population. The Ebeltoft Health Promotion Study, a randomized, population-based intervention trial on health test and health conversations with general practitioners. J Diabetes Complications 1994;8:146-9.
31. Karlsmose B, Lauritzen T, Engberg M, Parving A. A five-year longitudinal study of hearing in a Danish rural population aged 31-50 years. Br J Audiol 2000;34:47-55.
32. Karlsmose B, Lauritzen T, Parving A. Prevalence of hearing impairment and subjective hearing problems in a rural Danish population aged 31-50 years. Br J Audiol 1999;33:395-402.
33. Anggard EE, Land JM, Lenihan CJ, et al. Prevention of cardiovascular disease in general practice: a proposed model. Br Med J (Clin Res Ed) 1986;293:177-80.
34. Roberts A, Roberts P. Intensive cardiovascular risk factor intervention in a rural practice: a glimmer of hope. Br J Gen Pract 1998;48:967-70.
Association of higher costs with symptoms and diagnosis of depression
OBJECTIVE: We examined the relationships among depressive symptoms, physician diagnosis of depression, and charges for care.
STUDY DESIGN: We used a prospective observational design.
POPULATION: Five hundred eight new adult patients were randomly assigned to senior residents in family practice and internal medicine.
OUTCOMES MEASURED: Self-reports of health status assessment (Medical Outcomes Study Short Form-36) and depressive symptoms (Beck Depression Inventory) were determined at study entry and at 1-year follow-up. Physician diagnosis of depression was determined by chart audit; charges for care were monitored electronically.
RESULTS: Symptoms of depression and the diagnosis of depression were associated with charges for care. Statistical models were developed to identify predictors for the occurrence and magnitude of medical charges. Neither depressive symptoms nor diagnosis of depression significantly predicted the occurrence of charges in the areas studied, but physician diagnosis of depression predicted the magnitude of primary care and total charges.
CONCLUSIONS: A complex relationship exists among depressive symptoms, the diagnosis of depression, and charges for medical care. Understanding these relationships may help primary care physicians diagnose depression and deliver primary care to depressed patients more effectively while managing health care expenditures.
- Diagnosis of depression is associated with higher costs.
- Failure to diagnose depression may raise laboratory costs.
- Diagnosis of depression with few symptoms deserves study.
As US medical care has evolved, physicians have been expected to recognize and treat mental health problems in primary care,1 “the hidden mental health network.”2,3 Primary care clinicians are expected to observe signs of possible mental health problems, incorporate those observations into differential diagnoses, and decide which problems to treat or monitor and which to send for consultation or referral.4 These decisions can have important financial and health consequences, especially in dealing with depression.
Depression is common in the community5 and among primary care patients, 6% to 9% of whom report symptoms of major depression.6-8 An additional 10% to 15% of primary care patients show signs of less severe but important depressive problems.8,9 “Subclinical depression” is marked by symptoms that might indicate physical disease, signs of depression, or both; recognition may affect costs of care.10-13
Research has begun to define the impact of depression on processes14 and costs of care.15-17 For example, elderly patients reporting symptoms of depression have more laboratory tests performed at higher cost.15 Primary care patients diagnosed with depression had total yearly health care costs almost double those of patients without depression, with increased costs secondary to higher medical utilization and not mental health specialty treatment.16 There is evidence that depressive symptoms and the diagnosis of depression may predict increases in costs of care.17
Costs of care might be influenced by the model used by primary care physicians to identify depression.18 For example, a biomedical model might use more laboratory testing to reach a diagnosis of depression by exclusion, whereas a psychosocial model would use fewer laboratory tests while the physician pursues psychosocial issues. To identify optimal strategies for practice, it is important to determine how symptoms of depression and physician diagnosis of depression might interrelate and affect medical care costs.
We explored the following hypotheses: (1) that there are significant differences in each type of charge determined by the presence or absence of symptoms and diagnosis of depression; (2) that depressive symptoms and physician diagnosis of depression predict the occurrence of charges for specialty care, emergency services, laboratory services, and hospitalization; and (3) that depressive symptoms and physician diagnosis of depression predict the magnitude of medical charges for primary care, specialty care, emergency services, laboratory services, hospitalization, and total charges.
Methods
Study design
Five hundred eight adult nonpregnant new patients were assigned randomly to primary care providers in either family practice or general internal medicine clinics in a teaching hospital. Children younger than 18 years and pregnant women were excluded because they are not followed in general internal medicine. At enrollment and follow-up, self-reported depression was determined with the abbreviated Beck Depression Inventory (BDI)19 and health status was measured with the Medical Outcomes Studies Short Form-36 (MOS SF-36).20 To avoid altering clinician practice, physicians were not provided with either score. Physicians included 105 senior residents (second and third year) in family practice and general internal medicine.
Measures
Beck Depression Inventory. The BDI is a reliable and valid instrument used to measure depressive symptoms.19,21 The abbreviated version includes 13 items weighted and summed to produce a total score.19 A score between 9 and 15 indicates moderate depression, and a score of at least 16 indicates severe depression. The BDI is used widely for screening and to assess treatment efficacy.22 In this study, a BDI score between 0 and 8 was considered “low” or normal, and a score of at least 9 was considered “high” or indicative of symptoms of depression.
At study entrance or exit, 130 patients were identified with significant symptoms of depression (BDI > 8) by meeting criteria for moderate or severe depression19 and thus identifying roughly the top quartile of BDI scores among participants. This proportion approximates that of primary care patients estimated to experience significant depression.6,7
Medical Outcomes Studies Short Form-36. Health status was measured with the MOS SF-36,20 a 36-item self-report questionnaire. Reliability has been verified for difficult populations.23 Summary measures can describe a physical component score and a mental component score.24,25 The physical component score was used in this study to measure physical health status.
Medical chart review. Two physicians (K.D.B. and J.A.R.) reviewed the charts to identify notations of depression on problem lists and in visit notes to signify physician diagnosis of depression.
Charges. Charges were used as a proxy for costs. Electronic data for all health system charges were monitored from the initial visit through 1 full year of care. Six categories were monitored: primary care, specialty care, laboratory testing, emergency department, hospitalization, and total charges. Pharmacy charges were excluded because some patients purchased prescriptions outside the hospital system.
Statistical procedures
Mean log values for each area of medical charges were determined and contrasted with the Duncan multiple range test26 to explore the first hypothesis that charges are associated with symptoms and diagnoses of depression. Next, a double hurdle model was used to test the hypotheses that depressive symptoms and physician diagnosis of depression predict the occurrence and magnitude of charges for a variety of services.27,28 In a double hurdle model, the first “hurdle,” or step, involves exploring whether there are variables that can significantly predict the occurrence of an event (such as a medical charge). The second step involves exploring whether there are variables that can predict the magnitude of the event (eg, a medical charge).
Log-transformation of charges was performed to eliminate undue influence from outliers. No logistic regression models were developed for the occurrence of primary care charges or total charges (the first hurdle) because all study patients had charges in both categories. Results are presented by hypothesis.
Results
Seventy-seven of 508 study patients (15.1%) were identified as depressed by their primary care providers in chart notes. BDI scores showed considerable spread (range, 0–31) and were significantly associated with the diagnosis of depression (P < .001). Whereas 140 patients reported BDI scores of at least 9, only 36 of these patients were diagnosed as depressed by their physicians. Similarly, 41 patients were diagnosed as depressed despite reporting low (normal) BDI scores. Patients were assigned to 1 of 4 groups: those diagnosed as depressed and having high (abnormal) BDI scores (n = 36); those diagnosed as depressed despite low BDI scores (n = 41); those not diagnosed as depressed despite high BDI scores (n = 94); and those not diagnosed as depressed and not having high BDI scores (n = 337).
Hypothesis 1: overall impact of symptoms and diagnosis on charges
Groups diagnosed with depression had significantly higher log primary care charges than did those not diagnosed (Table 1). Both groups diagnosed with depression showed the highest primary care and total medical charges. Patients diagnosed with depression and reporting high BDI scores had higher specialty charges than those not depressed. Highest laboratory costs were found for those diagnosed as depressed despite low BDI scores and those with elevated BDI scores who were not diagnosed as depressed. There were no significant differences among groups for log charges for emergency care and hospital charges.
TABLE 1
Log charges of care by diagnosis and symptoms of depression
| Diagnosis of depression | No diagnosis of depression | |||
|---|---|---|---|---|
| Charges† | BDI ≥ 9 | BDI < 9 | BDI ≥ 9 | BDI < 9 |
| Primary care | 5.868* | 6.054* | 5.431 | 5.347 |
| Specialty care | 4.266* | 3.742* | 3.332 | 2.927 |
| Emergency care | 1.681 | 2.172 | 1.604 | 1.248 |
| Laboratory tests | 6.121 | 6.473‡ | 6.357‡ | 5.401 |
| Hospital charges | 2.174 | 3.742 | 1.548 | 1.1893 |
| Total charges | 7.704 | 7.878 | 7.508 | 6.979 |
| *Log costs were higher for patients with the diagnosis of depression regardless of BDI score than for those with no diagnosis and a BDI below 9. | ||||
| † All charges are logarithmic. | ||||
| ‡ Log costs were higher for patients with the diagnosis of depression and a BDI score below 9 or no diagnosis and a BDI score of at least 9 than for those with no diagnosis and a BDI score below 9. | ||||
| BDI, Beck Depression Inventory. | ||||
Hypotheses 2 and 3: factors predicting occurrence and magnitude of charges
Cost models are presented as regressions in Table 2. The left side of the table presents logistic regressions exploring which variables predict whether or not a patient accrues charges in all areas except primary care and total charges. Because all patients had at least 1 primary care visit charge and, hence, a total charge, it was not possible to develop a model to predict the occurrence of those charges.
Physical health status (measured by the physical component score of the MOS SF-36) predicted the occurrence of all charges measured with the exception of laboratory tests. Advanced patient age predicted increased likelihood of charges in each area; female sex showed a trend toward predicting occurrence of emergency care charges; and education showed a trend toward predicting occurrence of laboratory charges. BDI scores (measure of symptoms of depression) and physician diagnosis of depression failed to contribute significantly to the prediction of specialty care, emergency care, laboratory testing, or hospital charges. However, there was a trend for depressive symptoms to predict the occurrence of laboratory charges.
The right side of Table 2 presents regression models that predicted the magnitude of the different categories of charges. Physical health status was a significant predictor of the magnitude of all types of charges except emergency care. Patient age contributed to prediction of size of all types of charges except emergency visits and laboratory tests. Female sex was a significant predictor of magnitude of charges in primary care, laboratory tests, and total medical charges. The diagnosis of depression was a significant predictor of magnitude of primary care (P = .0029) and total medical (P = .0158) charges. Neither depressive symptoms nor the diagnosis of depression contributed significantly to the prediction of magnitude of charges for specialty care, emergency care, laboratory testing, or hospital use, although there was a trend for depressive symptoms to predict the magnitude of laboratory costs. Although an interaction term was entered into both kinds of regression equations, there was no evidence of a significant contribution from the interaction of symptoms of depression and diagnosis of depression in any of the predictor models developed.
TABLE 2
Regression analyses predicting charges
| Occurrence | Magnitude | |||||
|---|---|---|---|---|---|---|
| Charges | Independent variable* | Beta | P | Beta | P | R 2 |
| Primary care | PCS | — | — | -.0961 | .04 | 10.40% |
| Sex | — | — | -.1271 | .004 | ||
| Age (y) | — | — | .1891 | .0001 | ||
| Diagnosis | — | — | .2097 | .003 | ||
| Specialty care | PCS | -.1583 | .005 | -.1904 | .004 | 2.40% |
| Age (y) | .2235 | .0002 | .1261 | .07 | ||
| Emergency care | PCS | -.2518 | .0003 | — | — | 9.75% |
| Sex | -.1344 | .06 | — | — | ||
| Education | — | — | -.2827 | .0068 | ||
| Age (y) | -.1621 | .04 | — | — | ||
| Laboratory tests | PCS | — | — | -.2689 | .0001 | 19.90% |
| Sex | — | — | .1459 | .0009 | ||
| Education | .0408 | .09 | — | — | ||
| Age (y) | -.0411 | .0001 | .1978 | .0001 | ||
| BDI score | .2487 | .08 | .0945 | .08 | ||
| Hospital care | PCS | -.2583 | .0007 | -.2554 | .04 | 9.40% |
| Education | — | — | -.2632 | .02 | ||
| Age (y) | .0089 | .0007 | — | — | ||
| Total charges | PCS | — | — | -.2547 | .0001 | 17.00% |
| Sex | — | — | .0846 | .05 | ||
| Age (y) | — | — | .2193 | .0001 | ||
| Diagnosis | — | — | .1631 | .02 | ||
| *Only variables significantly associated with the occurrence or magnitude of charges for each component are shown. | ||||||
| BDI, Beck Depression Inventory; PCS, physical component score. | ||||||
Discussion
Medical charges were related to symptoms of depression and physician diagnosis of depression in this study. Although the patient sample was small, it was representative of the primary care population in displaying a wide range of depressive symptoms as measured by the BDI.6,7 In this study, physician diagnosis of depression was related to self-reported depression ratings: those diagnosed as depressed had significantly higher BDI scores than did those not diagnosed as depressed. However, the relationship between self-reported symptoms and diagnosis was not perfect: 72% of patients with high BDI scores were not recognized as depressed, as often occurs in primary care.6,7 In fact, more patients diagnosed with depression had low BDI scores (< 9, n = 41) than high BDI scores (> 8, n = 36). Clearly, other factors enter the process by which primary care physicians reach the diagnosis of depression.
Symptoms of depression and the diagnosis of depression probably influence the process of care in different ways. Differences in process of care likely would be reflected in different relationships to medical charges. Physician diagnosis of depression was associated with higher primary care and total costs and contributed to models predicting magnitude of primary care and total charges. However, neither symptoms of depression nor diagnosis of depression predicted which patients were more likely to incur charges for specialty care, emergency care, laboratory tests, or hospitalization. There was a trend only for the symptoms of depression to predict who would incur laboratory charges. These findings suggest that the relationship between depression and primary care charges and total charges is clear but less apparent when looking at less frequently occurring charges.
Other demographic factors showed fairly robust associations with the occurrence of charges. Patient age predicted who would get specialty care, emergency care, laboratory costs, and hospitalization, and there was a trend for female sex to predict occurrence of emergency department charges. Health status proved to be a significant predictor of the magnitude of all charges except those for emergency care. These powerful influences must be considered to accurately assess the impact of depression on charges.
Age also predicted the total amount of charges for primary and all medical care for the year and showed a trend toward prediction of magnitude of specialty charges. Female sex was a significant predictor of magnitude of primary care charges, laboratory charges, and total charges, and less education was a significant predictor of magnitude of emergency department and hospital charges. Some of these demographic predictors are readily explained. For example, as patients age, the number and costs of medical problems often increase. More education may enhance socioeconomic status and self-care, each of which may buffer against the need for emergency care and hospitalization. The reasons that charges are often higher for women are probably more complex. Higher utilization of primary and specialty care for women was associated with lower self-report-ed health status, less education, and lower socioeconomic status in our previous study.29
These results also suggest that physician diagnosis of depression in the absence of elevated BDI scores may flag a different kind of patient presentation. Diagnosis of depression without elevated BDI scores could result from effective treatment controlling the symptoms of previously diagnosed depression, but this does not adequately explain the occurrence. Perhaps other aspects of physician–patient interaction trigger a depression diagnosis without symptoms. This group ranked highest for log-transformed charges for 5 of the 6 areas explored: only for specialty care did those with high BDI scores and diagnosis of depression rank higher in total cost. This strong association with charges implies that these patients represent diagnostic dilemmas, thereby generating more primary care visits and laboratory tests. They may be diagnosed as depressed despite their low BDI scores simply because no organic explanation can be readily identified.
BDI scores showed a trend toward predicting higher laboratory charges in our models. This finding supports the importance of depressive symptoms in influencing the process of primary care, especially laboratory testing.15,30 Perhaps the diagnosis of depression actually slowed the ordering of laboratory tests.18 Because our data did not allow a separation of charges for laboratory tests before and after the diagnosis of depression, we did not test this possibility.
The size of this sample (N = 508) and the length of time patients were followed (1 year) might not have provided adequate power to fully test the contributions of symptoms and diagnosis of depression to the 6 sets of charges. This was likely true for hospitalization charges because hospitalization was an infrequent event in this study. Previous, larger studies found indications of increased hospitalization charges for those diagnosed as depressed17 and those with symptoms of depression.15,30 Alternatively, the recent emphasis on decreasing hospitalizations to reduce medical costs may mean that hospitalization for depressive symptoms rather than for physical illness is less likely to occur.31 In addition, these observations were made by resident physicians and not by community clinicians. It is not clear whether these results would generalize to another setting, although they are consistent with community observations in previous research.
These data do suggest an intriguing interplay of the impact of physician diagnosis of depression and presence of symptoms of depression in a number of indicators of charges and utilization in primary care. Even though each element was associated with increased utilization and charges, their differential impact is unclear. Both may prove important for efforts to enhance recognition of depression; recognition of a mental health problem appeared to shift the process of care in this and previous studies.14,32 To date, there are no data indicating that the diagnosis of depression reduces utilization or costs of primary care delivery. What is known is that physicians working in primary care are more apt to accurately diagnose those with more severe symptoms of depression than those with more transient or less severe symptoms.16,33 Although introducing a screening device such as the BDI or the PRIME-MD9 likely would increase the number of patients diagnosed with depression, it is unclear what impact that would have on the process, costs, and outcomes of care. Simpler interventions such as training in communication skills such as empathy34 might provide the primary care physician with all the tools needed for identification of emotional distress and mental health problems14,30 and appropriate treatment or referral.
1. deGruy F. Mental health care in the primary care setting. In: Donaldson MS, Yordy KD, Lohr KN, Vanselow NA, eds. Primary Care: America’s Health in the New Era. Washington, DC: National Academy Press; 1996;285-311.
2. Regier DA, Goldberg ID, Taube CA. The de facto US mental health services system: a public health perspective. Arch Gen Psychiatry 1978;35:685-93.
3. Schurman RA, Kramer PD, Mitchell JB. The hidden mental health network. Treatment of mental illness by nonpsychiatrist physicians. Arch Gen Psychiatry 1985;42:89-94.
4. Nutting PA, Franks P, Clancy CM. Referral and consultation in primary care: do we understand what we’re doing? [editorial; comment]. J Fam Pract 1992;35:21-3.
5. Laepine JP, Gastpar M, Mendlewicz J, Tylee A. Depression in the community: the first pan-European study DEPRES (Depression Research in European Society). Int Clin Psychopharmacol 1997;12:19-29.
6. Panel DG. Clinical Practice Guidelines. Vol I. Washington, DC: Agency for Health Care Policy and Research; 1993.
7. Panel DG. Clinical Practice Guidelines. Vol II. Washington, DC: Agency for Health Care Policy and Research; 1993.
8. Katon W. The epidemiology of depression in medical care. Int J Psychiatry Med 1987;17:93-112.
9. Spitzer RL, Williams JB, Kroenke K, et al. Utility of a new procedure for diagnosing mental disorders in primary care. The PRIME-MD 1000 study [see comments]. JAMA 1994;272:1749-56.
10. Greenberg PE, Stiglin LE, Finkelstein SN, Berndt ER. The economic burden of depression in 1990 [see comments]. J Clin Psychiatry 1993;54:405-18.
11. Kirmayer LJ, Robbins JM. Three forms of somatization in primary care: prevalence, co-occurrence, and sociodemographic characteristics. J Nerv Ment Dis 1991;179:647-55.
12. Kirmayer LJ, Robbins JM, Dworkind M, Yaffe MJ. Somatization and the recognition of depression and anxiety in primary care. Am J Psychiatry 1993;150:734-41.
13. Kirmayer LJ, Robbins JM. Patients who somatize in primary care: a longitudinal study of cognitive and social characteristics. Psychol Med 1996;26:937-51.
14. Callahan EJ, Bertakis KD, Azari R, et al. The influence of depression on physician-patient interaction in primary care. Fam Med 1996;28:346-51.
15. Callahan CM, Kesterson JG, Tierney WM. Association of symptoms of depression with diagnostic test charges among older adults. Ann Intern Med 1997;126:426-32.
16. Simon GE, VonKorff M, Barlow W. Health care costs of primary care patients with recognized depression. Arch Gen Psychiatry 1995;52:850-6.
17. Simon G, Ormel J, VonKorff M, Barlow W. Health care costs associated with depressive and anxiety disorders in primary care. Am J Psychiatry 1995;152:352-7.
18. Carney PA, Rhodes LA, Eliassen MS, et al. Variations in approaching the diagnosis of depression: a guided focus group study. J Fam Pract 1998;46:73-82.
19. Beck AT, Beck RW. Screening depressed patients in family practice. A rapid technique. Postgrad Med 1972;52:81-5.
20. Ware JE, Jr, Sherbourne CD. The MOS 36-item short-form health survey (SF-36). I. Conceptual framework and item selection. Med Care 1992;30:473-83.
21. Beck AT, Ward CH, Mendelson M. An inventory for measuring depression. Arch Gen Psychiatry 1961;4:561-71.
22. Beck AT, Steer RA, Garbin MG. Psychometric properties of the Beck Depression Inventory: twenty-five years of evaluation. Clin Psychol Rev 1988;8:77-100.
23. Stewart AL, Hays RD, Ware JE, Jr. The MOS short-form general health survey. Reliability and validity in a patient population. Med Care 1988;26:724-35.
24. McHorney CA, Ware JE, Jr, Raczek AE. The MOS 36-Item Short-Form Health Survey (SF-36): II. Psychometric and clinical tests of validity in measuring physical and mental health constructs. Med Care 1993;31:247-63.
25. Ware JE, Kosinski M, Keller SD. SF-36 Physical and Mental Health Summary Scales: A User’s Manual. Boston: Nimrod Press; 1994.
26. Harter HL. Critical values for Duncan’s new multiple range test. Biometrics 1960;16:671-85.
27. Duan N. Smearing estimates: a nonparametric retransformation method. J Am Stat Assoc 1983;78:605-10.
28. Duan N, Manning WG, Morris CN, Newhouse JP. A comparison of alternative models for the demand for medical care. J Business Econ Stat 1983;1:115-26.
29. Bertakis KD, Azari R, Helms LJ, Callahan EJ, Robbins JA. Gender differences in the utilization of health care services. J Fam Pract 2000;49:147-52.
30. Unutzer J, Patrick DL, Simon G, et al. Depressive symptoms and the cost of health services in HMO patients aged 65 years and older. A 4-year prospective study. JAMA 1997;277:1618-23.
31. Leslie DL, Rosenheck R. Shifting to outpatient care? Mental health care use and cost under private insurance. Am J Psychiatry 1999;156:1250-7.
32. Callahan EJ, Jaéen CR, Crabtree BF, et al. The impact of recent emotional distress and diagnosis of depression or anxiety on the physi-cian-patient encounter in family practice [see comments]. J Fam Pract 1998;46:410-8.
33. Coyne JC, Schwenk TL, Fechner-Bates S. Nondetection of depression by primary care physicians reconsidered [see comments]. Gen Hosp Psychiatry 1995;17:3-12.
34. Suchman AL, Markakis K, Beckman HB, Frankel R. A model of empathic communication in the medical interview [see comments]. JAMA 1997;277:678-82.
OBJECTIVE: We examined the relationships among depressive symptoms, physician diagnosis of depression, and charges for care.
STUDY DESIGN: We used a prospective observational design.
POPULATION: Five hundred eight new adult patients were randomly assigned to senior residents in family practice and internal medicine.
OUTCOMES MEASURED: Self-reports of health status assessment (Medical Outcomes Study Short Form-36) and depressive symptoms (Beck Depression Inventory) were determined at study entry and at 1-year follow-up. Physician diagnosis of depression was determined by chart audit; charges for care were monitored electronically.
RESULTS: Symptoms of depression and the diagnosis of depression were associated with charges for care. Statistical models were developed to identify predictors for the occurrence and magnitude of medical charges. Neither depressive symptoms nor diagnosis of depression significantly predicted the occurrence of charges in the areas studied, but physician diagnosis of depression predicted the magnitude of primary care and total charges.
CONCLUSIONS: A complex relationship exists among depressive symptoms, the diagnosis of depression, and charges for medical care. Understanding these relationships may help primary care physicians diagnose depression and deliver primary care to depressed patients more effectively while managing health care expenditures.
- Diagnosis of depression is associated with higher costs.
- Failure to diagnose depression may raise laboratory costs.
- Diagnosis of depression with few symptoms deserves study.
As US medical care has evolved, physicians have been expected to recognize and treat mental health problems in primary care,1 “the hidden mental health network.”2,3 Primary care clinicians are expected to observe signs of possible mental health problems, incorporate those observations into differential diagnoses, and decide which problems to treat or monitor and which to send for consultation or referral.4 These decisions can have important financial and health consequences, especially in dealing with depression.
Depression is common in the community5 and among primary care patients, 6% to 9% of whom report symptoms of major depression.6-8 An additional 10% to 15% of primary care patients show signs of less severe but important depressive problems.8,9 “Subclinical depression” is marked by symptoms that might indicate physical disease, signs of depression, or both; recognition may affect costs of care.10-13
Research has begun to define the impact of depression on processes14 and costs of care.15-17 For example, elderly patients reporting symptoms of depression have more laboratory tests performed at higher cost.15 Primary care patients diagnosed with depression had total yearly health care costs almost double those of patients without depression, with increased costs secondary to higher medical utilization and not mental health specialty treatment.16 There is evidence that depressive symptoms and the diagnosis of depression may predict increases in costs of care.17
Costs of care might be influenced by the model used by primary care physicians to identify depression.18 For example, a biomedical model might use more laboratory testing to reach a diagnosis of depression by exclusion, whereas a psychosocial model would use fewer laboratory tests while the physician pursues psychosocial issues. To identify optimal strategies for practice, it is important to determine how symptoms of depression and physician diagnosis of depression might interrelate and affect medical care costs.
We explored the following hypotheses: (1) that there are significant differences in each type of charge determined by the presence or absence of symptoms and diagnosis of depression; (2) that depressive symptoms and physician diagnosis of depression predict the occurrence of charges for specialty care, emergency services, laboratory services, and hospitalization; and (3) that depressive symptoms and physician diagnosis of depression predict the magnitude of medical charges for primary care, specialty care, emergency services, laboratory services, hospitalization, and total charges.
Methods
Study design
Five hundred eight adult nonpregnant new patients were assigned randomly to primary care providers in either family practice or general internal medicine clinics in a teaching hospital. Children younger than 18 years and pregnant women were excluded because they are not followed in general internal medicine. At enrollment and follow-up, self-reported depression was determined with the abbreviated Beck Depression Inventory (BDI)19 and health status was measured with the Medical Outcomes Studies Short Form-36 (MOS SF-36).20 To avoid altering clinician practice, physicians were not provided with either score. Physicians included 105 senior residents (second and third year) in family practice and general internal medicine.
Measures
Beck Depression Inventory. The BDI is a reliable and valid instrument used to measure depressive symptoms.19,21 The abbreviated version includes 13 items weighted and summed to produce a total score.19 A score between 9 and 15 indicates moderate depression, and a score of at least 16 indicates severe depression. The BDI is used widely for screening and to assess treatment efficacy.22 In this study, a BDI score between 0 and 8 was considered “low” or normal, and a score of at least 9 was considered “high” or indicative of symptoms of depression.
At study entrance or exit, 130 patients were identified with significant symptoms of depression (BDI > 8) by meeting criteria for moderate or severe depression19 and thus identifying roughly the top quartile of BDI scores among participants. This proportion approximates that of primary care patients estimated to experience significant depression.6,7
Medical Outcomes Studies Short Form-36. Health status was measured with the MOS SF-36,20 a 36-item self-report questionnaire. Reliability has been verified for difficult populations.23 Summary measures can describe a physical component score and a mental component score.24,25 The physical component score was used in this study to measure physical health status.
Medical chart review. Two physicians (K.D.B. and J.A.R.) reviewed the charts to identify notations of depression on problem lists and in visit notes to signify physician diagnosis of depression.
Charges. Charges were used as a proxy for costs. Electronic data for all health system charges were monitored from the initial visit through 1 full year of care. Six categories were monitored: primary care, specialty care, laboratory testing, emergency department, hospitalization, and total charges. Pharmacy charges were excluded because some patients purchased prescriptions outside the hospital system.
Statistical procedures
Mean log values for each area of medical charges were determined and contrasted with the Duncan multiple range test26 to explore the first hypothesis that charges are associated with symptoms and diagnoses of depression. Next, a double hurdle model was used to test the hypotheses that depressive symptoms and physician diagnosis of depression predict the occurrence and magnitude of charges for a variety of services.27,28 In a double hurdle model, the first “hurdle,” or step, involves exploring whether there are variables that can significantly predict the occurrence of an event (such as a medical charge). The second step involves exploring whether there are variables that can predict the magnitude of the event (eg, a medical charge).
Log-transformation of charges was performed to eliminate undue influence from outliers. No logistic regression models were developed for the occurrence of primary care charges or total charges (the first hurdle) because all study patients had charges in both categories. Results are presented by hypothesis.
Results
Seventy-seven of 508 study patients (15.1%) were identified as depressed by their primary care providers in chart notes. BDI scores showed considerable spread (range, 0–31) and were significantly associated with the diagnosis of depression (P < .001). Whereas 140 patients reported BDI scores of at least 9, only 36 of these patients were diagnosed as depressed by their physicians. Similarly, 41 patients were diagnosed as depressed despite reporting low (normal) BDI scores. Patients were assigned to 1 of 4 groups: those diagnosed as depressed and having high (abnormal) BDI scores (n = 36); those diagnosed as depressed despite low BDI scores (n = 41); those not diagnosed as depressed despite high BDI scores (n = 94); and those not diagnosed as depressed and not having high BDI scores (n = 337).
Hypothesis 1: overall impact of symptoms and diagnosis on charges
Groups diagnosed with depression had significantly higher log primary care charges than did those not diagnosed (Table 1). Both groups diagnosed with depression showed the highest primary care and total medical charges. Patients diagnosed with depression and reporting high BDI scores had higher specialty charges than those not depressed. Highest laboratory costs were found for those diagnosed as depressed despite low BDI scores and those with elevated BDI scores who were not diagnosed as depressed. There were no significant differences among groups for log charges for emergency care and hospital charges.
TABLE 1
Log charges of care by diagnosis and symptoms of depression
| Diagnosis of depression | No diagnosis of depression | |||
|---|---|---|---|---|
| Charges† | BDI ≥ 9 | BDI < 9 | BDI ≥ 9 | BDI < 9 |
| Primary care | 5.868* | 6.054* | 5.431 | 5.347 |
| Specialty care | 4.266* | 3.742* | 3.332 | 2.927 |
| Emergency care | 1.681 | 2.172 | 1.604 | 1.248 |
| Laboratory tests | 6.121 | 6.473‡ | 6.357‡ | 5.401 |
| Hospital charges | 2.174 | 3.742 | 1.548 | 1.1893 |
| Total charges | 7.704 | 7.878 | 7.508 | 6.979 |
| *Log costs were higher for patients with the diagnosis of depression regardless of BDI score than for those with no diagnosis and a BDI below 9. | ||||
| † All charges are logarithmic. | ||||
| ‡ Log costs were higher for patients with the diagnosis of depression and a BDI score below 9 or no diagnosis and a BDI score of at least 9 than for those with no diagnosis and a BDI score below 9. | ||||
| BDI, Beck Depression Inventory. | ||||
Hypotheses 2 and 3: factors predicting occurrence and magnitude of charges
Cost models are presented as regressions in Table 2. The left side of the table presents logistic regressions exploring which variables predict whether or not a patient accrues charges in all areas except primary care and total charges. Because all patients had at least 1 primary care visit charge and, hence, a total charge, it was not possible to develop a model to predict the occurrence of those charges.
Physical health status (measured by the physical component score of the MOS SF-36) predicted the occurrence of all charges measured with the exception of laboratory tests. Advanced patient age predicted increased likelihood of charges in each area; female sex showed a trend toward predicting occurrence of emergency care charges; and education showed a trend toward predicting occurrence of laboratory charges. BDI scores (measure of symptoms of depression) and physician diagnosis of depression failed to contribute significantly to the prediction of specialty care, emergency care, laboratory testing, or hospital charges. However, there was a trend for depressive symptoms to predict the occurrence of laboratory charges.
The right side of Table 2 presents regression models that predicted the magnitude of the different categories of charges. Physical health status was a significant predictor of the magnitude of all types of charges except emergency care. Patient age contributed to prediction of size of all types of charges except emergency visits and laboratory tests. Female sex was a significant predictor of magnitude of charges in primary care, laboratory tests, and total medical charges. The diagnosis of depression was a significant predictor of magnitude of primary care (P = .0029) and total medical (P = .0158) charges. Neither depressive symptoms nor the diagnosis of depression contributed significantly to the prediction of magnitude of charges for specialty care, emergency care, laboratory testing, or hospital use, although there was a trend for depressive symptoms to predict the magnitude of laboratory costs. Although an interaction term was entered into both kinds of regression equations, there was no evidence of a significant contribution from the interaction of symptoms of depression and diagnosis of depression in any of the predictor models developed.
TABLE 2
Regression analyses predicting charges
| Occurrence | Magnitude | |||||
|---|---|---|---|---|---|---|
| Charges | Independent variable* | Beta | P | Beta | P | R 2 |
| Primary care | PCS | — | — | -.0961 | .04 | 10.40% |
| Sex | — | — | -.1271 | .004 | ||
| Age (y) | — | — | .1891 | .0001 | ||
| Diagnosis | — | — | .2097 | .003 | ||
| Specialty care | PCS | -.1583 | .005 | -.1904 | .004 | 2.40% |
| Age (y) | .2235 | .0002 | .1261 | .07 | ||
| Emergency care | PCS | -.2518 | .0003 | — | — | 9.75% |
| Sex | -.1344 | .06 | — | — | ||
| Education | — | — | -.2827 | .0068 | ||
| Age (y) | -.1621 | .04 | — | — | ||
| Laboratory tests | PCS | — | — | -.2689 | .0001 | 19.90% |
| Sex | — | — | .1459 | .0009 | ||
| Education | .0408 | .09 | — | — | ||
| Age (y) | -.0411 | .0001 | .1978 | .0001 | ||
| BDI score | .2487 | .08 | .0945 | .08 | ||
| Hospital care | PCS | -.2583 | .0007 | -.2554 | .04 | 9.40% |
| Education | — | — | -.2632 | .02 | ||
| Age (y) | .0089 | .0007 | — | — | ||
| Total charges | PCS | — | — | -.2547 | .0001 | 17.00% |
| Sex | — | — | .0846 | .05 | ||
| Age (y) | — | — | .2193 | .0001 | ||
| Diagnosis | — | — | .1631 | .02 | ||
| *Only variables significantly associated with the occurrence or magnitude of charges for each component are shown. | ||||||
| BDI, Beck Depression Inventory; PCS, physical component score. | ||||||
Discussion
Medical charges were related to symptoms of depression and physician diagnosis of depression in this study. Although the patient sample was small, it was representative of the primary care population in displaying a wide range of depressive symptoms as measured by the BDI.6,7 In this study, physician diagnosis of depression was related to self-reported depression ratings: those diagnosed as depressed had significantly higher BDI scores than did those not diagnosed as depressed. However, the relationship between self-reported symptoms and diagnosis was not perfect: 72% of patients with high BDI scores were not recognized as depressed, as often occurs in primary care.6,7 In fact, more patients diagnosed with depression had low BDI scores (< 9, n = 41) than high BDI scores (> 8, n = 36). Clearly, other factors enter the process by which primary care physicians reach the diagnosis of depression.
Symptoms of depression and the diagnosis of depression probably influence the process of care in different ways. Differences in process of care likely would be reflected in different relationships to medical charges. Physician diagnosis of depression was associated with higher primary care and total costs and contributed to models predicting magnitude of primary care and total charges. However, neither symptoms of depression nor diagnosis of depression predicted which patients were more likely to incur charges for specialty care, emergency care, laboratory tests, or hospitalization. There was a trend only for the symptoms of depression to predict who would incur laboratory charges. These findings suggest that the relationship between depression and primary care charges and total charges is clear but less apparent when looking at less frequently occurring charges.
Other demographic factors showed fairly robust associations with the occurrence of charges. Patient age predicted who would get specialty care, emergency care, laboratory costs, and hospitalization, and there was a trend for female sex to predict occurrence of emergency department charges. Health status proved to be a significant predictor of the magnitude of all charges except those for emergency care. These powerful influences must be considered to accurately assess the impact of depression on charges.
Age also predicted the total amount of charges for primary and all medical care for the year and showed a trend toward prediction of magnitude of specialty charges. Female sex was a significant predictor of magnitude of primary care charges, laboratory charges, and total charges, and less education was a significant predictor of magnitude of emergency department and hospital charges. Some of these demographic predictors are readily explained. For example, as patients age, the number and costs of medical problems often increase. More education may enhance socioeconomic status and self-care, each of which may buffer against the need for emergency care and hospitalization. The reasons that charges are often higher for women are probably more complex. Higher utilization of primary and specialty care for women was associated with lower self-report-ed health status, less education, and lower socioeconomic status in our previous study.29
These results also suggest that physician diagnosis of depression in the absence of elevated BDI scores may flag a different kind of patient presentation. Diagnosis of depression without elevated BDI scores could result from effective treatment controlling the symptoms of previously diagnosed depression, but this does not adequately explain the occurrence. Perhaps other aspects of physician–patient interaction trigger a depression diagnosis without symptoms. This group ranked highest for log-transformed charges for 5 of the 6 areas explored: only for specialty care did those with high BDI scores and diagnosis of depression rank higher in total cost. This strong association with charges implies that these patients represent diagnostic dilemmas, thereby generating more primary care visits and laboratory tests. They may be diagnosed as depressed despite their low BDI scores simply because no organic explanation can be readily identified.
BDI scores showed a trend toward predicting higher laboratory charges in our models. This finding supports the importance of depressive symptoms in influencing the process of primary care, especially laboratory testing.15,30 Perhaps the diagnosis of depression actually slowed the ordering of laboratory tests.18 Because our data did not allow a separation of charges for laboratory tests before and after the diagnosis of depression, we did not test this possibility.
The size of this sample (N = 508) and the length of time patients were followed (1 year) might not have provided adequate power to fully test the contributions of symptoms and diagnosis of depression to the 6 sets of charges. This was likely true for hospitalization charges because hospitalization was an infrequent event in this study. Previous, larger studies found indications of increased hospitalization charges for those diagnosed as depressed17 and those with symptoms of depression.15,30 Alternatively, the recent emphasis on decreasing hospitalizations to reduce medical costs may mean that hospitalization for depressive symptoms rather than for physical illness is less likely to occur.31 In addition, these observations were made by resident physicians and not by community clinicians. It is not clear whether these results would generalize to another setting, although they are consistent with community observations in previous research.
These data do suggest an intriguing interplay of the impact of physician diagnosis of depression and presence of symptoms of depression in a number of indicators of charges and utilization in primary care. Even though each element was associated with increased utilization and charges, their differential impact is unclear. Both may prove important for efforts to enhance recognition of depression; recognition of a mental health problem appeared to shift the process of care in this and previous studies.14,32 To date, there are no data indicating that the diagnosis of depression reduces utilization or costs of primary care delivery. What is known is that physicians working in primary care are more apt to accurately diagnose those with more severe symptoms of depression than those with more transient or less severe symptoms.16,33 Although introducing a screening device such as the BDI or the PRIME-MD9 likely would increase the number of patients diagnosed with depression, it is unclear what impact that would have on the process, costs, and outcomes of care. Simpler interventions such as training in communication skills such as empathy34 might provide the primary care physician with all the tools needed for identification of emotional distress and mental health problems14,30 and appropriate treatment or referral.
1. deGruy F. Mental health care in the primary care setting. In: Donaldson MS, Yordy KD, Lohr KN, Vanselow NA, eds. Primary Care: America’s Health in the New Era. Washington, DC: National Academy Press; 1996;285-311.
2. Regier DA, Goldberg ID, Taube CA. The de facto US mental health services system: a public health perspective. Arch Gen Psychiatry 1978;35:685-93.
3. Schurman RA, Kramer PD, Mitchell JB. The hidden mental health network. Treatment of mental illness by nonpsychiatrist physicians. Arch Gen Psychiatry 1985;42:89-94.
4. Nutting PA, Franks P, Clancy CM. Referral and consultation in primary care: do we understand what we’re doing? [editorial; comment]. J Fam Pract 1992;35:21-3.
5. Laepine JP, Gastpar M, Mendlewicz J, Tylee A. Depression in the community: the first pan-European study DEPRES (Depression Research in European Society). Int Clin Psychopharmacol 1997;12:19-29.
6. Panel DG. Clinical Practice Guidelines. Vol I. Washington, DC: Agency for Health Care Policy and Research; 1993.
7. Panel DG. Clinical Practice Guidelines. Vol II. Washington, DC: Agency for Health Care Policy and Research; 1993.
8. Katon W. The epidemiology of depression in medical care. Int J Psychiatry Med 1987;17:93-112.
9. Spitzer RL, Williams JB, Kroenke K, et al. Utility of a new procedure for diagnosing mental disorders in primary care. The PRIME-MD 1000 study [see comments]. JAMA 1994;272:1749-56.
10. Greenberg PE, Stiglin LE, Finkelstein SN, Berndt ER. The economic burden of depression in 1990 [see comments]. J Clin Psychiatry 1993;54:405-18.
11. Kirmayer LJ, Robbins JM. Three forms of somatization in primary care: prevalence, co-occurrence, and sociodemographic characteristics. J Nerv Ment Dis 1991;179:647-55.
12. Kirmayer LJ, Robbins JM, Dworkind M, Yaffe MJ. Somatization and the recognition of depression and anxiety in primary care. Am J Psychiatry 1993;150:734-41.
13. Kirmayer LJ, Robbins JM. Patients who somatize in primary care: a longitudinal study of cognitive and social characteristics. Psychol Med 1996;26:937-51.
14. Callahan EJ, Bertakis KD, Azari R, et al. The influence of depression on physician-patient interaction in primary care. Fam Med 1996;28:346-51.
15. Callahan CM, Kesterson JG, Tierney WM. Association of symptoms of depression with diagnostic test charges among older adults. Ann Intern Med 1997;126:426-32.
16. Simon GE, VonKorff M, Barlow W. Health care costs of primary care patients with recognized depression. Arch Gen Psychiatry 1995;52:850-6.
17. Simon G, Ormel J, VonKorff M, Barlow W. Health care costs associated with depressive and anxiety disorders in primary care. Am J Psychiatry 1995;152:352-7.
18. Carney PA, Rhodes LA, Eliassen MS, et al. Variations in approaching the diagnosis of depression: a guided focus group study. J Fam Pract 1998;46:73-82.
19. Beck AT, Beck RW. Screening depressed patients in family practice. A rapid technique. Postgrad Med 1972;52:81-5.
20. Ware JE, Jr, Sherbourne CD. The MOS 36-item short-form health survey (SF-36). I. Conceptual framework and item selection. Med Care 1992;30:473-83.
21. Beck AT, Ward CH, Mendelson M. An inventory for measuring depression. Arch Gen Psychiatry 1961;4:561-71.
22. Beck AT, Steer RA, Garbin MG. Psychometric properties of the Beck Depression Inventory: twenty-five years of evaluation. Clin Psychol Rev 1988;8:77-100.
23. Stewart AL, Hays RD, Ware JE, Jr. The MOS short-form general health survey. Reliability and validity in a patient population. Med Care 1988;26:724-35.
24. McHorney CA, Ware JE, Jr, Raczek AE. The MOS 36-Item Short-Form Health Survey (SF-36): II. Psychometric and clinical tests of validity in measuring physical and mental health constructs. Med Care 1993;31:247-63.
25. Ware JE, Kosinski M, Keller SD. SF-36 Physical and Mental Health Summary Scales: A User’s Manual. Boston: Nimrod Press; 1994.
26. Harter HL. Critical values for Duncan’s new multiple range test. Biometrics 1960;16:671-85.
27. Duan N. Smearing estimates: a nonparametric retransformation method. J Am Stat Assoc 1983;78:605-10.
28. Duan N, Manning WG, Morris CN, Newhouse JP. A comparison of alternative models for the demand for medical care. J Business Econ Stat 1983;1:115-26.
29. Bertakis KD, Azari R, Helms LJ, Callahan EJ, Robbins JA. Gender differences in the utilization of health care services. J Fam Pract 2000;49:147-52.
30. Unutzer J, Patrick DL, Simon G, et al. Depressive symptoms and the cost of health services in HMO patients aged 65 years and older. A 4-year prospective study. JAMA 1997;277:1618-23.
31. Leslie DL, Rosenheck R. Shifting to outpatient care? Mental health care use and cost under private insurance. Am J Psychiatry 1999;156:1250-7.
32. Callahan EJ, Jaéen CR, Crabtree BF, et al. The impact of recent emotional distress and diagnosis of depression or anxiety on the physi-cian-patient encounter in family practice [see comments]. J Fam Pract 1998;46:410-8.
33. Coyne JC, Schwenk TL, Fechner-Bates S. Nondetection of depression by primary care physicians reconsidered [see comments]. Gen Hosp Psychiatry 1995;17:3-12.
34. Suchman AL, Markakis K, Beckman HB, Frankel R. A model of empathic communication in the medical interview [see comments]. JAMA 1997;277:678-82.
Randomized placebo-controlled trial comparing efficacy and safety of valdecoxib with naproxen in patients with osteoarthritis
OBJECTIVE: We compared the efficacy and upper gastrointestinal safety of the cyclooxygenase-2–specific inhibitor valdecoxib with naproxen and placebo in treating moderate to severe osteoarthritis of the knee.
STUDY DESIGN: This multicenter, randomized, double-blind, placebo-controlled study compared the efficacy and upper gastrointestinal tract safety of valdecoxib at dosages of 5, 10, and 20 mg once daily with placebo and naproxen at the dosage of 500 mg twice daily.
POPULATION: We included patients who had been diagnosed with moderate to severe osteoarthritis of the knee according to the modified criteria of the American College of Rheumatology.
OUTCOMES MEASURED: The Patient’s and Physician’s Global Assessment of Arthritis (PaGAA, PhGAA), Patient’s Assessment of Arthritis Pain–Visual Analog Scale (PAAP-VAS), and Western Ontario and McMaster’s Universities (WOMAC) Osteoarthritis indices were assessed at baseline and at weeks 2, 6, and 12. Upper gastrointestinal ulceration was assessed by pre- and posttreatment endoscopies.
RESULTS: Valdecoxib 10 and 20 mg once daily (but not 5 mg once daily) demonstrated similar efficacy to naproxen at 500 mg twice daily, and all 3 dosages were superior to placebo for the PaGAA, PhGAA, PAAP-VAS, and WOMAC Osteoarthritis indices at most assessments throughout the 12-week study (P < .05). The incidence of endoscopically proven ulcers was significantly higher in the naproxen group than in the 5- and 10-mg valdecoxib groups, but not in the 20-mg valdecoxib group. All 3 valdecoxib doses were comparable to placebo in ulcer incidence.
CONCLUSIONS: Valdecoxib (10 and 20 mg once daily) is significantly superior to placebo and as effective as naproxen (500 mg twice daily) in improving moderate to severe osteoarthritis of the knee. Upper gastrointestinal tract safety of valdecoxib (5 and 10 mg) was comparable to that of placebo and significantly better than that of naproxen.
- The cyclooxygenase-2–specific inhibitor valdecoxib 10 or 20 mg once daily is as effective as naproxen 500 mg twice daily.
- Valdecoxib at the recommended dose for treatment of osteoarthritis (10 mg once daily) had better upper gastrointestinal safety than naproxen.
Current medical therapies for osteoarthritis include conventional nonsteroidal anti-inflammatory drugs (NSAIDs), acetaminophen, glucosamine sulfate, and intra-articular injections of corticosteroids and hyaluronic acid. However, long-term use of corticosteroid injections can exacerbate damage to the affected joints.1,2 Conventional NSAIDs are associated with upper gastrointestinal tract ulceration and inhibition of platelet function.3
Cyclooxygenase-2 (COX-2)–specific inhibitors have demonstrated equivalent efficacy to conventional NSAIDs in treating pain and inflammation associated with osteoarthritis and rheumatoid arthritis. Further, COX-2–specific inhibitors significantly reduce the incidence of gastrointestinal ulceration and bleeding side effects caused by conventional NSAIDs.4,5 Valdecoxib (Bextra; Pharmacia Corporation and Pfizer Corporation) is a novel COX-2–specific inhibitor that is approximately 28,000-fold more selective against COX-2 than against COX-1. As a potent COX-2–specific inhibitor, valdecoxib is expected to provide efficacy equivalent to conventional NSAIDs for treatment of arthritis and spare the COX-1–related side effects. This randomized, placebo-controlled, double-blind, 12-week study was designed to test this hypothesis by comparing the efficacy and upper gastrointestinal tract safety of valdecoxib with that of naproxen, a leading conventional NSAID comparator.
Methods
Study population
Ambulatory adults who had been diagnosed with moderate to severe osteoarthritis of the knee according to the modified criteria of the American College of Rheumatology6,7 were eligible to participate in the trial. Patients were recruited from primary care and rheumatology specialty settings. Patients who had baseline scores of at least 40 mm on the Patient’s Assessment of Arthritis Pain–Visual Analog Scale (PAAP-VAS) and baseline categorical scores of poor to very poor on the Patient’s (PaGAA) and Physician’s (PhGAA) Global Assessments of Arthritis were included.8,9 Any patient suffering from inflammatory arthritis, gout, pseudogout, Paget disease, or any chronic pain syndrome that might interfere with assessment of the Index Knee was excluded from the trial. Patients diagnosed with osteoarthritis of the hip ipsilateral to the Index Knee, severe anserine bursitis, acute joint trauma, or complete loss of articular cartilage on the Index Knee also were excluded. Patients were not eligible if they had active gastrointestinal disease, gastrointestinal tract ulceration 30 days before the trial, a significant bleeding disorder, or a history of gastric or duodenal surgery. Patients with an esophageal, gastric, pyloric channel, or duodenal ulcer or a score of at least 10 for esophageal, gastric, or duodenal erosions at the pretreatment endoscopy examination also were excluded.
FIGURE 1
Patient’s global assessment of arthritis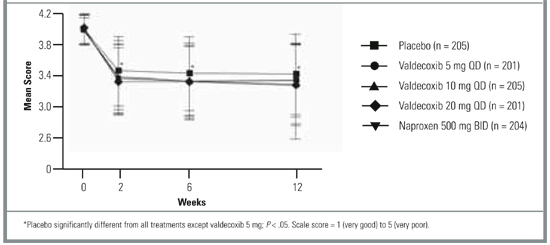
Study design
This multicenter, randomized, double-blind, placebo-controlled study compared the efficacy and upper gastrointestinal tract safety of valdecoxib at dosages of 5, 10, and 20 mg once daily with placebo and naproxen at a dosage of 500 mg twice daily in relieving moderate to severe osteoarthritis of the knee. The trial was conducted in 85 centers in the United States and Canada, in accordance with the principles of good clinical practice and the Declaration of Helsinki. Eligible patients were randomized to treatment groups and self-administered oral study medication. Patients were randomized to study treatment in the order in which they were enrolled into the study by using a treatment sequence that was determined by a Searle-prepared computer-generated randomization schedule. Patients received their allocated study medications in bottles labeled A and B according to the randomization schedule. Personnel at the study centers carried out the assessments and remained blinded throughout the study. Eligible patients were enrolled and discontinued regular pain medication. Patients discontinued their normal medications at the following specified times before the baseline endoscopy: NSAIDs (including full-dose aspirin at a dosage of ≥325 mg/day) at 48 hours, corticosteroid injections at 4 weeks, and intra-articular injections of corticosteroid or hyaluronic acid preparations at 3 and 6 months, respectively. The use of antiulcer drugs, including H2 blockers, proton pump inhibitors, misoprostol, and sucralfate, was discontinued at least 24 hours before the baseline endoscopy.
Efficacy assessments
The following arthritis assessments were made at baseline and at 2, 6, and 12 weeks or at early termination after study drug administration. PaGAA or PhGAA was measured on a 5-point categorical scale, where 1 = very good, 2 = good, 3 = fair, 4 = poor, and 5 = very poor. The PAAP-VAS was measured on a scale of 0 to 100 mm, where 0 = no pain and 100 = most severe pain. The Western Ontario and McMaster’s Universities (WOMAC) Osteoarthritis indices including Pain, Stiffness, Physical Function, and Composite were measured as described previously.10
Upper gastrointestinal assessments
Upper gastrointestinal tract endoscopy was performed within 7 days before the first study dose and at the 12-week assessment or at early termination if the patient withdrew. An endoscopy could be performed at any time if the patient experienced symptoms suggestive of an ulcer. The endoscopists performing baseline and 12-week (early termination) assessments remained blinded throughout the study.
General safety assessments
Clinical laboratory tests were performed at screening, baseline, weeks 2, 6, and 12, or at early termination, and a complete physical examination was performed at screening and final visits. The incidence of adverse events occurring in each treatment arm was monitored throughout the study. Adverse events occurring within 7 days and serious adverse events occurring within 30 days of the last study dosage of medication were included in the safety analyses.
Statistical analyses
A sample size of 200 patients per treatment group was deemed sufficient to detect a difference in ulcer rates of 5% for valdecoxib vs 16% for naproxen, with 80% power and type 1 error at .017 (adjusted for 3 primary comparisons against placebo). Homogeneity of treatment groups at baseline with respect to age, height, weight, duration of osteoarthritis, PAAP-VAS, and WOMAC Osteoarthritis Index scores was assessed with 2-way analysis of variance, with treatment group and center as factors. All other demographics and baseline characteristics were compared with the Cochran-Mantel-Haenszel (CMH) test, stratified by center.
All efficacy assessments were performed on the modified intent-to-treat (ITT) cohort by using the last observation carried forward approach. The ITT cohort comprised all patients who were randomized and had taken at least 1 dose of study medication. Analyses of mean change from baseline for PaGAA, PhGAA, PAAP-VAS, and WOMAC Osteoarthritis indices were performed by using analysis of covariance, with treatment and center as factors and the corresponding baseline score as the covariate. Pairwise comparisons of valdecoxib at dosages of 10 and 20 mg once daily vs placebo were interpreted with the Hochberg procedure.11 Primary pairwise comparisons were amended in the statistical analysis plan before data unblinding to compare placebo with 10 and 20 mg valdecoxib, but not with the 5-mg dose. For all other comparisons, including 5 mg valdecoxib and naproxen vs placebo, differences were considered significant if the pairwise P values were less than .05. The incidence of withdrawal due to treatment failure was analyzed by the Fisher exact test, and the time to withdrawal in each treatment group was analyzed by log-rank test and plotted with the Kaplan-Meier product limit.12,13
Upper gastrointestinal tract endoscopic analyses were performed on the upper gastrointestinal tract ITT population. Randomized patients were included in this cohort if they received at least 1 dose of study medication and had undergone pretreatment and posttreatment endoscopies. Overall and pairwise comparisons of gastroduodenal, gastric, and duodenal ulcers and erosions were assessed with the CMH test stratified by center. The incidence of adverse events was compared between treatment groups with the Fisher exact test. Changes in vital signs were compared between treatment groups with an analysis of covariance using pairwise treatment comparisons, with treatment group as a factor and baseline value as a covariate.
Results
Patient baseline characteristics
Of the 1019 eligible randomized patients, 1 patient randomized to 10 mg/day valdecoxib, 1 to 20 mg/day valdecoxib, and 1 to 500 mg naproxen twice daily did not take the study medication and were excluded from efficacy and safety analyses. The remaining 1016 randomized patients received study medication and were included in the ITT cohort on which analyses of all efficacy end points were based. A total of 269 patients withdrew before the end of the study due to treatment failure, preexisting protocol violations, noncompliance, or adverse signs and symptoms, or were lost to follow-up: 74 patients in the placebo group, 39 in the 5-mg valdecoxib group, 56 in the 10-mg valdecoxib group, 44 in the 20-mg valdecoxib group, and 56 in the naproxen group. The upper gastrointestinal tract ITT cohort comprised 908 patients who were included in the upper gastrointestinal tract safety analyses. More than 90% of patients included in the study evaluated their osteoarthritis as poor to very poor as assessed by baseline PaGAA scores. Treatment groups were homogeneous with respect to demographics, vital signs, medical history, and all baseline arthritis assessments (Table 1).
TABLE 1
Patient baseline characteristics
| Valdecoxib | Naproxen | ||||
|---|---|---|---|---|---|
| Placebo (n = 205) | 5 mg qd (n = 201) | 10 mg qd (n = 206) | 20 mg qd (n = 202) | 500 mg bid (n = 205) | |
| Mean (SD) age, y | 60.3 (10.5) | 58.7 (11.9) | 59.8 (11.0) | 59.6 (10.4) | 60.4 (10.7) |
| Mean (SD) weight, kg | 87.5 (21.2) | 91.4 (22.6) | 89.3 (21.4) | 92.6 (23.7) | 88.1 (21.7) |
| Race, n (%) | |||||
| White | 162 (79) | 155 (77) | 154 (75) | 160 (79) | 163 (80) |
| Black | 21 (10) | 26 (13) | 24 (12) | 24 (12) | 23 (11) |
| Asian | 1 (0) | 1 (0) | 1 (0) | 1 (0) | 2 (1) |
| Hispanic | 19 (9) | 18 (9) | 25 (12) | 15 (7) | 15 (7) |
| Male sex, n (%) | 73 (36) | 73 (36) | 72 (35) | 66 (33) | 76 (37) |
| Mean (SD) disease duration, y | 8.3 (8.0) | 9.8 (9.5) | 8.7 (8.0) | 9.2 (8.0) | 9.4 (8.7) |
| History of GI bleeding, n (%) | 2 (1) | 0 (0) | 3 (1) | 2 (1) | 3 (1) |
| History of gastroduodenal ulcer, n (%) | 20 (10) | 21 (10) | 24 (12) | 28 (14) | 31 (15) |
| PaGAA, n (%) | |||||
| Poor | 168 (82) | 175 (87) | 168 (82) | 162 (80) | 169 (82) |
| Very poor | 33 (16) | 23 (11) | 32 (16) | 36 (18) | 31 (15) |
| PhGAA, n (%) | |||||
| Poor | 179 (87) | 181 (90) | 176 (85) | 173 (86) | 175 (85) |
| Very poor | 24 (12) | 18 (9) | 25 (12) | 24 (12) | 25 (12) |
| No significant differences were observed between treatment groups at any baseline characteristic. | |||||
| bid, twice daily; GI, gastrointestinal; PaGAA, Patient’s Global Assessment of Arthritis; PhGAA, Physician’s Global Assessment of Arthritis; qd, once daily. | |||||
Efficacy
The least square mean change in the PaGAA was significantly improved at most assessments in response to valdecoxib (10 and 20 mg/day) and 500 mg naproxen twice daily compared with placebo (Table 2). However, the improvement in response to valdecoxib 5 mg qd did not reach statistical significance (Table 2). Significant improvements in the PhGAA were observed in response to valdecoxib and naproxen at all assessments (Table 2).
The dosages of 20 mg/day valdecoxib and 500 mg naproxen twice daily were associated with a reduction in pain, as assessed by the PAAP-VAS scores. Pain reduction associated with 5 and 10 mg/day valdecoxib was significantly better than that with placebo at all assessments except for week 12 (Table 2).
Valdecoxib and naproxen treatments improved the WOMAC Pain, Stiffness, Physical Function, and Composite indices compared with placebo at 2, 6, and 12 weeks. Valdecoxib 20 mg/day and naproxen 500 mg twice daily produced statistically significant changes in all WOMAC Osteoarthritis scores throughout the 12-week study period compared with placebo (P < .05). WOMAC Pain scores for 10 mg valdecoxib were significantly different from those for placebo at 2 weeks (P < .001) but not at 6 or 12 weeks. No significant differences were noted between any of the valdecoxib treatment doses and naproxen in terms of improvement in WOMAC indices.
The incidences of withdrawal due to treatment failure were 20% (95% confidence interval [CI], 15.3–26.8) in the placebo group; 8% (95% CI, 4.8–12.8), 12% (95% CI, 7.8–17.1), and 10% (95% CI, 6.3–15.2) in the 5-, 10-, and 20-mg/day valdecoxib groups; and 6% (95% CI, 3.6–10.9) in the 500-mg naproxen group (P < .05; Table 3). Patients in the placebo group withdrew at a significantly faster rate than those in the 4 active treatment groups (P < .05), but there were no significant differences in withdrawal rates across the 4 active treatment groups.
TABLE 2
Baseline arthritis assessments and mean changes from baseline scores
| Valdecoxib | Naproxen | ||||
|---|---|---|---|---|---|
| Placebo (n = 205) | 5 mg qd (n = 201) | 10 mg qd (n = 205) | 20 mg qd (n = 201) | 500 mg bid (n = 204) | |
| PhGAA§ | |||||
| Baseline mean | 4.10 | 4.07 | 4.09 | 4.09 | 4.10 |
| LSM change | |||||
| Week 2 (CI) | -1.04 (-1.16, -0.91) | -1.31‡(-1.44, -1.19) | -1.37‡(-1.50, -1.25) | -1.42‡(-1.54, -1.29) | -1.35‡(-1.48, -1.23) |
| Week 6 (CI) | -1.22 (-1.35, -1.08) | -1.44*(-1.58, -1.31) | -1.50†(-1.63, -1.36) | -1.41* (-1.55, -1.28) | -1.45* (-1.59, -1.32) |
| Week 12 (CI) | -1.22 (-1.36, -1.08) | -1.43* (-1.58, -1.28) | -1.52†(-1.67, -1.38) | -1.45* (-1.60, -1.31) | -1.43* (-1.58, -1.29) |
| PAAP║ | |||||
| Baseline mean | 71.20 | 71.42 | 72.41 | 72.54 | 72.36 |
| LSM change | |||||
| Week 2 (CI) | -21.19 (-24.80, -17.58) | -28.46†(-32.11, -24.82) | -30.21‡(-33.83, -26.59) | -32.07‡(-35.73, -28.41) | -31.03‡(-34.66, -27.40) |
| Week 6 (CI) | -23.92 (-27.72, -20.12) | -30.81†(-34.65, -26.97) | -29.85* (-33.67, -26.04) | -32.28†(-36.13, -28.42) | -31.84†(-35.66, -28.02) |
| Week 12 (CI) | -25.97 (-30.02, -21.92) | -31.33 (-35.42, -27.24) | -30.41 (-34.47, -30.41) | -32.70* (-36.81, -32.70) | -31.83* (-35.90, -27.76) |
| WOMAC OA, Stiffness ¶ | |||||
| Baseline mean | 4.84 | 4.87 | 4.91 | 4.73 | 4.94 |
| LSM change | |||||
| Week 2 (CI) | -0.78 (-0.98, -0.57) | -1.03 (-1.24, -0.82) | -1.20†(-1.41, -0.99) | -1.24†(-1.45, -1.03) | -1.28‡(-1.49, -1.08) |
| Week 6 (CI) | -1.04 (-1.27, -0.82) | -1.25 (-1.48, -1.02) | -1.42* (-1.65, -1.20) | -1.43* (-1.66, -1.20) | -1.40†(-1.62, -1.17) |
| Week 12 (CI) | -1.12 (-1.36, -0.89) | -1.33 (-1.57, -1.09) | -1.41 (-1.65, -1.17) | -1.46* (-1.70, -1.22) | -1.54* (-1.78, -1.30) |
| WOMAC OA, Composite # | |||||
| Baseline mean | 53.49 | 53.03 | 54.73 | 53.42 | 53.67 |
| LSM change | |||||
| Week 2 (CI) | -10.13 (-12.28, -7.99) | -13.26* (-15.42, -11.09) | -15.05‡(-17.20, -12.90) | -15.44‡(-17.63, -13.32) | -15.47‡(-17.63, -13.32) |
| Week 6 (CI) | -12.98 (-15.45, -10.51) | -15.47 (-17.97, -12.98) | -16.74* (-19.22, -14.26) | -17.33* (-19.48, -14.51) | -16.99* (-19.48, -14.51) |
| Week 12 (CI) | -13.48 (-16.07, -10.89) | -16.84 (-19.46, -14.23) | -17.34* (-19.93, -14.74) | -17.22* (-20.64, -15.44) | -18.04* (-20.64, -15.44) |
| *P < .05 vs placebo, significant. | |||||
| † P < .01 vs placebo, significant. | |||||
| ‡ P < .001 vs placebo, significant. | |||||
| § Scale = 1 (very good) to 5 (very poor). | |||||
| ║ Scale = 0 mm (no pain) to 100 mm (most severe pain). | |||||
| ¶ Scale = 0 (no symptoms) to 8 (worse symptoms). | |||||
| # Scale = 0 (no symptoms) to 96 (worse symptoms). | |||||
| bid, twice daily; CI, 95% confidence interval; LSM, least square mean; PAAP, Patient’s Assessment of Arthritis Pain; PhGAA, Physician’s Global Assessment of Arthritis; qd, once daily; WOMAC OA, Western Ontario and McMaster’s Universities Osteoarthritis Index. | |||||
TABLE 3
Incidence of gastroduodenal, gastric, and duodenal ulcers (>5 mm) at final endoscopic evaluation
| Valdecoxib | Naproxen | ||||
|---|---|---|---|---|---|
| Placebo (n = 178) | 5 mg qd (n = 188) | 10 mg qd (n = 174) | 20 mg qd (n = 185) | 500 mg bid (n = 183) | |
| Gastroduodenal§ | 8 (4) [2.1, 9.0] | 6 (3)† [1.3, 7.1] | 5 (3)† [1.1, 6.9] | 10 (5) [2.8, 10.0] | 18 (10)* [6.1, 15.3] |
| Gastric§ | 8 (4) [2.1, 9.0] | 4 (2)‡ [0.7, 5.7] | 3 (2)‡ [0.4, 5.4] | 9 (5) [2.4, 9.3] | 16 (9) [5.2, 14.1] |
| Duodenal§ | 0 (0) [0.05, 2.6] | 2 (1) [0.2, 4.2] | 2 (1) [0.2, 4.5] | 1 (1) [0.0, 3.4] | 2 (1) [0.2, 4.3] |
| Symptomatic ulcers (n) | 0 | 1 | 2 | 3 | 7 |
| *P < .05 vs placebo. | |||||
| † P < .05 vs naproxen. | |||||
| ‡ P < .01 vs naproxen. | |||||
| § Data are presented as n (%) [95% confidence interval]. | |||||
| bid, twice daily; qd, once daily. | |||||
Safety
Valdecoxib and placebo had comparable upper gastrointestinal tract ulceration rates, whereas naproxen produced a significantly higher incidence of upper gastrointestinal tract ulcers than did 5 and 10 mg valdecoxib and placebo (P < .05). There were 14 adjudicated symptomatic ulcers during the study: 1 in the 5-mg valdecoxib group, 2 in the 10-mg valdecoxib group, 3 in the 20-mg valdecoxib group, and 7 in the 500-mg naproxen group.
Adverse events with an incidence of at least 5% in any treatment group and adverse events leading to withdrawal from the study are summarized by body system in Table 4. There were no significant differences in the incidence of adverse events between the valdecoxib and placebo groups. In contrast, 500 mg naproxen twice daily was associated with significantly more adverse events than 5 or 10 mg/day valdecoxib (P < .05). The incidence of adverse events was similar in the 20-mg valdecoxib and naproxen groups. Most adverse events were reported in the gastrointestinal system and consisted of abdominal pain, constipation, diarrhea, dyspepsia, flatulence, and nausea. The incidences of constipation, diarrhea, and flatulence were significantly higher in the naproxen group than in the 5-, 10-, and 20-mg valdecoxib groups, respectively. Other adverse events included accidental injury, headache, myalgia, and upper respiratory tract infections. Valdecoxib at 5 mg/day produced a significantly higher incidence of myalgia than did placebo, and valdecoxib at 20 mg/day produced a significantly lower incidence of upper respiratory tract infections than did placebo. Adverse events causing withdrawal with an incidence of at least 1% were accidental injury, abdominal pain, diarrhea, dyspepsia, nausea, abnormal hepatic function, rash, and blurred vision. The proportion of patients in the naproxen group (12.7%) who withdrew from the study was significantly greater than those for the 5-and 20-mg valdecoxib (6.0% and 5.5%) groups (P < .05), although the incidence of withdrawal due to adverse events in the 10-mg valdecoxib and naproxen groups were similar. In addition, gastrointestinal adverse events commonly related to NSAID treatment, such as dyspepsia and constipation, were more frequent in the naproxen group than in the valdecoxib and placebo groups.
TABLE 4
Adverse events
| Valdecoxib | Naproxen | ||||
|---|---|---|---|---|---|
| Placebo (n = 178) | 5 mg qd (n = 188) | 10 mg qd (n = 174) | 20 mg qd (n = 185) | 500 mg bid (n = 183) | |
| Incidence ≥ 5% in any treatment group | |||||
| Total | 109 (53.2) | 112 (55.7)† | 113 (55.1)† | 121 (60.2) | 139 (68.1)* |
| Accidental injury | 11 (5.4) | 3 (1.5) | 10 (4.9) | 12 (6.0) | 9 (4.4) |
| Headache | 11 (5.4) | 12 (6.0) | 7 (3.4) | 14 (7.0) | 9 (4.4) |
| Abdominal pain | 19 (9.3) | 14 (7.0) | 18 (8.8) | 13 (6.5) | 25 (12.3) |
| Constipation | 6 (2.9) | 4 (2.0) | 1 (0.5)† | 4 (2.0) | 12 (5.9) |
| Diarrhea | 10 (4.9) | 7 (3.5) | 14 (6.8) | 11 (5.5) | 12 (5.9) |
| Dyspepsia | 15 (7.3) | 22 (10.9) | 22 (10.7) | 20 (9.9)† | 35 (17.2)* |
| Flatulence | 12 (5.9) | 7 (3.5) | 5 (2.4)† | 9 (4.5) | 14 (6.9) |
| Nausea | 10 (4.9) | 18 (9.0) | 17 (8.3) | 9 (4.5) | 10 (4.9) |
| Myalgia | 0 (0.0) | 13 (6.5)*† | 3 (1.5) | 2 (1.0) | 1 (0.5) |
| Upper respiratory tract infections | 18 (8.8) | 9 (4.5) | 10 (4.9) | 7 (3.5)* | 10 (4.9) |
| Incidence ≥ 1% in any treatment group causing withdrawal | |||||
| Total | 17 (8.3) | 12 (6.0)† | 18 (8.8) | 11 (5.5)† | 26 (12.7) |
| Accidental injury | 2 (1.0) | 0 (0.0) | 0 (0.0) | 1 (0.5) | 1 (0.5) |
| Abdominal pain | 5 (2.4) | 2 (1.0) | 6 (2.9) | 2 (1.0) | 7 (3.4) |
| Diarrhea | 0 (0.0) | 0 (0.0) | 1 (0.5) | 1 (0.5) | 3 (1.5) |
| Dyspepsia | 2 (1.0) | 2 (1.0) | 3 (1.5) | 1 (0.5)† | 9 (4.4)* |
| Nausea | 2 (1.0) | 1 (0.5) | 2 (1.0) | 1 (0.5) | 2 (1.0) |
| Abnormal hepatic function | 0 (0.0) | 2 (1.0) | 0 (0.0) | 0 (0.0) | 0 (0.0) |
| Rash | 0 (0.0) | 2 (1.0) | 1 (0.5) | 0 (0.0) | 0 (0.0) |
| Blurred vision | 2 (1.0) | 0 (0.0) | 1 (0.5) | 0 (0.0) | 0 (0.0) |
| *P < .05 vs placebo. | |||||
| † P < .05 vs naproxen. | |||||
| ‡ Data are presented as number (%) of patients reporting events. | |||||
| bid, twice daily; qd, once daily. | |||||
FIGURE 2
Western Ontario and McMaster’s Universities Osteoarthritis Pain Index
Discussion
This study confirmed that the novel COX-2–specific inhibitor valdecoxib at a dosage of 10 or 20 mg/day is as effective as naproxen at a dosage of 500 mg twice daily in relieving moderate to severe osteoarthritis of the knee over 12 weeks. In addition, treatment with 10 mg/day valdecoxib orally, the recommended dosage for treatment of osteoarthritis, is associated with a significantly lower gastroduodenal ulceration rate than occurs with the conventional NSAID, naproxen.
Patients receiving 10 and 20 mg/day valdecoxib experienced significant improvements in the signs and symptoms of osteoarthritis, and in all assessments the efficacies of valdecoxib 10 and 20 mg/day were numerically similar to that of naproxen. This finding is consistent with the inhibition of prostaglandin production in inflamed synovial tissue and in the central pain pathway. Increased COX-2 activity in the spinal cord in response to tissue damage and in the synovial membrane of osteoarthritis patients is at least partly responsible for joint inflammation and sensitization to inflammatory pain.14–16 The efficacy of valdecoxib in treating moderate to severe osteoarthritis of the knee was consistent with reports of other COX-2–specific inhibitors that are comparable to conventional NSAIDs in relieving chronic pain and inflammation.17,18 These data confirmed that 10 mg/day valdecoxib is as effective as 500 mg naproxen twice daily in treating the pain and inflammation associated with osteoarthritis. The efficacy of 10 mg/day valdecoxib makes it one of the most potent COX-2–specific inhibitors for treating moderate to severe osteoarthritis.
Conventional NSAIDs were associated with a significant risk of serious gastrointestinal complications such as ulceration and perforation and low gastrointestinal tolerability.20–22 Naproxen treatment of osteoarthritis and rheumatoid arthritis demonstrated a higher rate of endoscopically proven gastrointestinal ulceration than did COX-2–specific inhibitors,17,23 and that finding was confirmed in this study for 10 mg valdecoxib. Naproxen treatment was associated with significantly more gastroduodenal ulcers than 5 or 10 mg valdecoxib. We found no significant difference between 20 mg valdecoxib and naproxen, which might be explained by a lower incidence of ulcers with naproxen than reported in previous studies.24 In terms of numbers needed to treat, 14 patients would be needed to observe a difference in endoscopic ulcer rates between valdecoxib (5 or 10 mg) and naproxen compared with 20 patients to observe a difference between 20 mg valdecoxib and naproxen and 16 to observe a difference in ulcer rates between naproxen and placebo.
Valdecoxib at a dosage of 10 mg/day also demonstrated overall improved gastrointestinal tolerability, with significantly fewer adverse events and withdrawals due to adverse events, in particular gastrointestinal-related events such as constipation and dyspepsia, than did naproxen. The improved upper gastrointestinal tract safety of valdecoxib was as expected because the COX-1–sparing nature of this agent allows effective inhibition of COX-2 without inhibiting COX-1 in the gastric mucosa and platelets. An improved gastrointestinal safety profile is an important consideration in the treatment of osteoarthritis because the moderate to severe gastrointestinal complications associated with conventional NSAID therapy frequently lead to poor patient compliance or discontinuation of the medication.25,26
Overall, this study suggests clinical benefits of single daily doses of 10 and 20 mg valdecoxib and improved upper gastrointestinal tract safety for the 10-mg dose, compared with 500 mg/day naproxen. No additional efficacy benefit was obtained from a 20-mg dose as opposed to a 10-mg dose. Valdecoxib (10 mg) is a potent and effective once-daily alternative to conventional NSAIDs, with a gastrointestinal safety advantage that will be of value to rheumatologists and primary care physicians alike.
FIGURE 3
Western Ontario and Western Universities Osteoarthritis Physical Function Index
1. Klippel J, et al. Primer on the Rheumatic Diseases. 12th ed. Atlanta, GA: Arthritis Foundation; 2001.
2. Felson DT. Epidemiology of hip and knee osteoarthritis. Epidemiol Rev 1988;10:1-28.
3. Borda IT, Koff R. NSAIDs: A Profile of Adverse Effects. Philadelphia: Hanley and Belfus; 1995.
4. Bensen WG, Fiechtner JJ, McMillen JI, et al. Treatment of osteoarthritis with celecoxib, a cyclooxygenase-2 inhibitor: a randomized controlled trial. Mayo Clin Proc 1999;74:1095-105.
5. Geis GS. Update on clinical developments with celecoxib, a new specific COX-2 inhibitor: what can we expect? J Rheumatol 1999;26(suppl 56):31-6.
6. Altman R, Asch E, Bloch G, et al. The American College of Rheumatology criteria for the classification and reportings of osteoarthritis of the knee. Arthritis Rheum 1986;29:1039-49.
7. Schumacher HR. Primer on the Rheumatic Diseases. Atlanta, GA: Arthritis Foundation; 1986.
8. Cooperating Clinics Committee of American Rheumatism Association. A seven day variability study of 499 patients with peripheral rheumatoid arthritis. Arthritis Rheum 1965;8:302-34.
9. Ward JR, Williams HJ, Boyce E, et al. Comparison of auranofin, gold sodium thiomalate, and placebo in the treatment of rheumatoid arthritis. Subsets of responses. Am J Med 1983;75:133-7.
10. Bellamy N. WOMAC Osteoarthritis Index: A User’s Guide. London, Ontario, Canada: The Western Ontario and McMaster Universities; 1995.
11. Hochberg Y. A sharper Bonferroni procedure for multiple tests of significance. Biometrika 1998;75:800-2.
12. Miller R. Survival Analyses. New York: John Wiley & Sons; 1998.
13. Simon R, Lee YJ. Nonparametric confidence limits for survival probabilities and median survival time. Cancer Treat Rep 1982;66:37-42.
14. Amin AR, Attur M, Patel RN, et al. Superinduction of cyclooxygenase-2 activity in human osteoarthritis-affected cartilage. Influence of nitric oxide. J Clin Invest 1997;99:1231-7.
15. Hay C, de Belleroche J. Carrageenan-induced hyperalgesia is associated with increased cyclooxygenase-2 expression in spinal cord. Neuroreport 1997;8:1249-51.
16. Kang RY, Freire Moar, Sigal E, et al. Expression of cyclooxygenase-2 in human and an animal model of rheumatoid arthritis. Br J Rheumatol 1996;35:711-8.
17. Bensen WG, Zhao SZ, Burke TA, et al. Upper gastrointestinal tolerability of celecoxib, a COX-2 specific inhibitor, compared to naproxen and placebo. J Rheumatol 2000;27:1876-83.
18. Day R, Morrison B, Luza A, et al. A randomized trial of the efficacy and tolerability of the COX-2 inhibitor rofecoxib vs ibuprofen in patients with osteoarthritis. Rofecoxib/Ibuprofen Comparator Study Group. Arch Intern Med 2000;160:1781-7.
19. Fiechtner J, Sikes D, Recker D. A double-blind, placebo-controlled dose ranging study to evaluate the efficacy of valdecoxib, a novel COX-2 specific inhibitor, in treating the signs and symptoms of osteoarthritis of the knee. Paper presented at: European League Against Rheumatism (EULAR); May 13–16, 2001; Prague, Czech Republic.
20. Garcia Rodriguez LA, Jick H. Risk of upper gastrointestinal bleeding and perforation associated with individual nonsteroidal anti-inflammatory drugs. Lancet 1994;343:769-72.
21. Singh G, Ramey DR, Morfeld D, et al. Gastrointestinal tract complications of nonsteroidal anti-inflammatory drug treatment in rheumatoid arthritis. A prospective observational cohort study. Arch Intern Med 1996;156:1530-6.
22. Singh G, Rosen Ramey D. NSAID induced gastrointestinal complications: the ARAMIS perspective-1997. Arthritis, Rheumatism, and Aging Medical Information System. J Rheumatol 1998;51(suppl):8-16.
23. Watson DJ, Harper SE, Zhao PL, et al. Gastrointestinal tolerability of the selective cyclooxygenase-2 (COX-2) inhibitor rofecoxib compared with nonselective COX-1 and COX-2 inhibitors in osteoarthritis. Arch Intern Med 2000;160:2998-3003.
24. Simon LS, Weaver AL, Graham DY, et al. Anti-inflammatory and upper gastrointestinal effects of celecoxib in rheumatoid arthritis: a randomized controlled trial. JAMA 1999;282:1921-8.
25. Langman MJ, Jensen DM, Watson DJ, et al. Adverse upper gastrointestinal effects of rofecoxib compared with NSAIDs. JAMA 1999;282:1929-33.
26. Scholes D, Stergachis A, Penna P, Normand E, Hansten P. Nonsteroidal anti-inflammatory drug discontinuation in patients with osteoarthritis. J Rheumatol 1995;22:708-12.
OBJECTIVE: We compared the efficacy and upper gastrointestinal safety of the cyclooxygenase-2–specific inhibitor valdecoxib with naproxen and placebo in treating moderate to severe osteoarthritis of the knee.
STUDY DESIGN: This multicenter, randomized, double-blind, placebo-controlled study compared the efficacy and upper gastrointestinal tract safety of valdecoxib at dosages of 5, 10, and 20 mg once daily with placebo and naproxen at the dosage of 500 mg twice daily.
POPULATION: We included patients who had been diagnosed with moderate to severe osteoarthritis of the knee according to the modified criteria of the American College of Rheumatology.
OUTCOMES MEASURED: The Patient’s and Physician’s Global Assessment of Arthritis (PaGAA, PhGAA), Patient’s Assessment of Arthritis Pain–Visual Analog Scale (PAAP-VAS), and Western Ontario and McMaster’s Universities (WOMAC) Osteoarthritis indices were assessed at baseline and at weeks 2, 6, and 12. Upper gastrointestinal ulceration was assessed by pre- and posttreatment endoscopies.
RESULTS: Valdecoxib 10 and 20 mg once daily (but not 5 mg once daily) demonstrated similar efficacy to naproxen at 500 mg twice daily, and all 3 dosages were superior to placebo for the PaGAA, PhGAA, PAAP-VAS, and WOMAC Osteoarthritis indices at most assessments throughout the 12-week study (P < .05). The incidence of endoscopically proven ulcers was significantly higher in the naproxen group than in the 5- and 10-mg valdecoxib groups, but not in the 20-mg valdecoxib group. All 3 valdecoxib doses were comparable to placebo in ulcer incidence.
CONCLUSIONS: Valdecoxib (10 and 20 mg once daily) is significantly superior to placebo and as effective as naproxen (500 mg twice daily) in improving moderate to severe osteoarthritis of the knee. Upper gastrointestinal tract safety of valdecoxib (5 and 10 mg) was comparable to that of placebo and significantly better than that of naproxen.
- The cyclooxygenase-2–specific inhibitor valdecoxib 10 or 20 mg once daily is as effective as naproxen 500 mg twice daily.
- Valdecoxib at the recommended dose for treatment of osteoarthritis (10 mg once daily) had better upper gastrointestinal safety than naproxen.
Current medical therapies for osteoarthritis include conventional nonsteroidal anti-inflammatory drugs (NSAIDs), acetaminophen, glucosamine sulfate, and intra-articular injections of corticosteroids and hyaluronic acid. However, long-term use of corticosteroid injections can exacerbate damage to the affected joints.1,2 Conventional NSAIDs are associated with upper gastrointestinal tract ulceration and inhibition of platelet function.3
Cyclooxygenase-2 (COX-2)–specific inhibitors have demonstrated equivalent efficacy to conventional NSAIDs in treating pain and inflammation associated with osteoarthritis and rheumatoid arthritis. Further, COX-2–specific inhibitors significantly reduce the incidence of gastrointestinal ulceration and bleeding side effects caused by conventional NSAIDs.4,5 Valdecoxib (Bextra; Pharmacia Corporation and Pfizer Corporation) is a novel COX-2–specific inhibitor that is approximately 28,000-fold more selective against COX-2 than against COX-1. As a potent COX-2–specific inhibitor, valdecoxib is expected to provide efficacy equivalent to conventional NSAIDs for treatment of arthritis and spare the COX-1–related side effects. This randomized, placebo-controlled, double-blind, 12-week study was designed to test this hypothesis by comparing the efficacy and upper gastrointestinal tract safety of valdecoxib with that of naproxen, a leading conventional NSAID comparator.
Methods
Study population
Ambulatory adults who had been diagnosed with moderate to severe osteoarthritis of the knee according to the modified criteria of the American College of Rheumatology6,7 were eligible to participate in the trial. Patients were recruited from primary care and rheumatology specialty settings. Patients who had baseline scores of at least 40 mm on the Patient’s Assessment of Arthritis Pain–Visual Analog Scale (PAAP-VAS) and baseline categorical scores of poor to very poor on the Patient’s (PaGAA) and Physician’s (PhGAA) Global Assessments of Arthritis were included.8,9 Any patient suffering from inflammatory arthritis, gout, pseudogout, Paget disease, or any chronic pain syndrome that might interfere with assessment of the Index Knee was excluded from the trial. Patients diagnosed with osteoarthritis of the hip ipsilateral to the Index Knee, severe anserine bursitis, acute joint trauma, or complete loss of articular cartilage on the Index Knee also were excluded. Patients were not eligible if they had active gastrointestinal disease, gastrointestinal tract ulceration 30 days before the trial, a significant bleeding disorder, or a history of gastric or duodenal surgery. Patients with an esophageal, gastric, pyloric channel, or duodenal ulcer or a score of at least 10 for esophageal, gastric, or duodenal erosions at the pretreatment endoscopy examination also were excluded.
FIGURE 1
Patient’s global assessment of arthritis
Study design
This multicenter, randomized, double-blind, placebo-controlled study compared the efficacy and upper gastrointestinal tract safety of valdecoxib at dosages of 5, 10, and 20 mg once daily with placebo and naproxen at a dosage of 500 mg twice daily in relieving moderate to severe osteoarthritis of the knee. The trial was conducted in 85 centers in the United States and Canada, in accordance with the principles of good clinical practice and the Declaration of Helsinki. Eligible patients were randomized to treatment groups and self-administered oral study medication. Patients were randomized to study treatment in the order in which they were enrolled into the study by using a treatment sequence that was determined by a Searle-prepared computer-generated randomization schedule. Patients received their allocated study medications in bottles labeled A and B according to the randomization schedule. Personnel at the study centers carried out the assessments and remained blinded throughout the study. Eligible patients were enrolled and discontinued regular pain medication. Patients discontinued their normal medications at the following specified times before the baseline endoscopy: NSAIDs (including full-dose aspirin at a dosage of ≥325 mg/day) at 48 hours, corticosteroid injections at 4 weeks, and intra-articular injections of corticosteroid or hyaluronic acid preparations at 3 and 6 months, respectively. The use of antiulcer drugs, including H2 blockers, proton pump inhibitors, misoprostol, and sucralfate, was discontinued at least 24 hours before the baseline endoscopy.
Efficacy assessments
The following arthritis assessments were made at baseline and at 2, 6, and 12 weeks or at early termination after study drug administration. PaGAA or PhGAA was measured on a 5-point categorical scale, where 1 = very good, 2 = good, 3 = fair, 4 = poor, and 5 = very poor. The PAAP-VAS was measured on a scale of 0 to 100 mm, where 0 = no pain and 100 = most severe pain. The Western Ontario and McMaster’s Universities (WOMAC) Osteoarthritis indices including Pain, Stiffness, Physical Function, and Composite were measured as described previously.10
Upper gastrointestinal assessments
Upper gastrointestinal tract endoscopy was performed within 7 days before the first study dose and at the 12-week assessment or at early termination if the patient withdrew. An endoscopy could be performed at any time if the patient experienced symptoms suggestive of an ulcer. The endoscopists performing baseline and 12-week (early termination) assessments remained blinded throughout the study.
General safety assessments
Clinical laboratory tests were performed at screening, baseline, weeks 2, 6, and 12, or at early termination, and a complete physical examination was performed at screening and final visits. The incidence of adverse events occurring in each treatment arm was monitored throughout the study. Adverse events occurring within 7 days and serious adverse events occurring within 30 days of the last study dosage of medication were included in the safety analyses.
Statistical analyses
A sample size of 200 patients per treatment group was deemed sufficient to detect a difference in ulcer rates of 5% for valdecoxib vs 16% for naproxen, with 80% power and type 1 error at .017 (adjusted for 3 primary comparisons against placebo). Homogeneity of treatment groups at baseline with respect to age, height, weight, duration of osteoarthritis, PAAP-VAS, and WOMAC Osteoarthritis Index scores was assessed with 2-way analysis of variance, with treatment group and center as factors. All other demographics and baseline characteristics were compared with the Cochran-Mantel-Haenszel (CMH) test, stratified by center.
All efficacy assessments were performed on the modified intent-to-treat (ITT) cohort by using the last observation carried forward approach. The ITT cohort comprised all patients who were randomized and had taken at least 1 dose of study medication. Analyses of mean change from baseline for PaGAA, PhGAA, PAAP-VAS, and WOMAC Osteoarthritis indices were performed by using analysis of covariance, with treatment and center as factors and the corresponding baseline score as the covariate. Pairwise comparisons of valdecoxib at dosages of 10 and 20 mg once daily vs placebo were interpreted with the Hochberg procedure.11 Primary pairwise comparisons were amended in the statistical analysis plan before data unblinding to compare placebo with 10 and 20 mg valdecoxib, but not with the 5-mg dose. For all other comparisons, including 5 mg valdecoxib and naproxen vs placebo, differences were considered significant if the pairwise P values were less than .05. The incidence of withdrawal due to treatment failure was analyzed by the Fisher exact test, and the time to withdrawal in each treatment group was analyzed by log-rank test and plotted with the Kaplan-Meier product limit.12,13
Upper gastrointestinal tract endoscopic analyses were performed on the upper gastrointestinal tract ITT population. Randomized patients were included in this cohort if they received at least 1 dose of study medication and had undergone pretreatment and posttreatment endoscopies. Overall and pairwise comparisons of gastroduodenal, gastric, and duodenal ulcers and erosions were assessed with the CMH test stratified by center. The incidence of adverse events was compared between treatment groups with the Fisher exact test. Changes in vital signs were compared between treatment groups with an analysis of covariance using pairwise treatment comparisons, with treatment group as a factor and baseline value as a covariate.
Results
Patient baseline characteristics
Of the 1019 eligible randomized patients, 1 patient randomized to 10 mg/day valdecoxib, 1 to 20 mg/day valdecoxib, and 1 to 500 mg naproxen twice daily did not take the study medication and were excluded from efficacy and safety analyses. The remaining 1016 randomized patients received study medication and were included in the ITT cohort on which analyses of all efficacy end points were based. A total of 269 patients withdrew before the end of the study due to treatment failure, preexisting protocol violations, noncompliance, or adverse signs and symptoms, or were lost to follow-up: 74 patients in the placebo group, 39 in the 5-mg valdecoxib group, 56 in the 10-mg valdecoxib group, 44 in the 20-mg valdecoxib group, and 56 in the naproxen group. The upper gastrointestinal tract ITT cohort comprised 908 patients who were included in the upper gastrointestinal tract safety analyses. More than 90% of patients included in the study evaluated their osteoarthritis as poor to very poor as assessed by baseline PaGAA scores. Treatment groups were homogeneous with respect to demographics, vital signs, medical history, and all baseline arthritis assessments (Table 1).
TABLE 1
Patient baseline characteristics
| Valdecoxib | Naproxen | ||||
|---|---|---|---|---|---|
| Placebo (n = 205) | 5 mg qd (n = 201) | 10 mg qd (n = 206) | 20 mg qd (n = 202) | 500 mg bid (n = 205) | |
| Mean (SD) age, y | 60.3 (10.5) | 58.7 (11.9) | 59.8 (11.0) | 59.6 (10.4) | 60.4 (10.7) |
| Mean (SD) weight, kg | 87.5 (21.2) | 91.4 (22.6) | 89.3 (21.4) | 92.6 (23.7) | 88.1 (21.7) |
| Race, n (%) | |||||
| White | 162 (79) | 155 (77) | 154 (75) | 160 (79) | 163 (80) |
| Black | 21 (10) | 26 (13) | 24 (12) | 24 (12) | 23 (11) |
| Asian | 1 (0) | 1 (0) | 1 (0) | 1 (0) | 2 (1) |
| Hispanic | 19 (9) | 18 (9) | 25 (12) | 15 (7) | 15 (7) |
| Male sex, n (%) | 73 (36) | 73 (36) | 72 (35) | 66 (33) | 76 (37) |
| Mean (SD) disease duration, y | 8.3 (8.0) | 9.8 (9.5) | 8.7 (8.0) | 9.2 (8.0) | 9.4 (8.7) |
| History of GI bleeding, n (%) | 2 (1) | 0 (0) | 3 (1) | 2 (1) | 3 (1) |
| History of gastroduodenal ulcer, n (%) | 20 (10) | 21 (10) | 24 (12) | 28 (14) | 31 (15) |
| PaGAA, n (%) | |||||
| Poor | 168 (82) | 175 (87) | 168 (82) | 162 (80) | 169 (82) |
| Very poor | 33 (16) | 23 (11) | 32 (16) | 36 (18) | 31 (15) |
| PhGAA, n (%) | |||||
| Poor | 179 (87) | 181 (90) | 176 (85) | 173 (86) | 175 (85) |
| Very poor | 24 (12) | 18 (9) | 25 (12) | 24 (12) | 25 (12) |
| No significant differences were observed between treatment groups at any baseline characteristic. | |||||
| bid, twice daily; GI, gastrointestinal; PaGAA, Patient’s Global Assessment of Arthritis; PhGAA, Physician’s Global Assessment of Arthritis; qd, once daily. | |||||
Efficacy
The least square mean change in the PaGAA was significantly improved at most assessments in response to valdecoxib (10 and 20 mg/day) and 500 mg naproxen twice daily compared with placebo (Table 2). However, the improvement in response to valdecoxib 5 mg qd did not reach statistical significance (Table 2). Significant improvements in the PhGAA were observed in response to valdecoxib and naproxen at all assessments (Table 2).
The dosages of 20 mg/day valdecoxib and 500 mg naproxen twice daily were associated with a reduction in pain, as assessed by the PAAP-VAS scores. Pain reduction associated with 5 and 10 mg/day valdecoxib was significantly better than that with placebo at all assessments except for week 12 (Table 2).
Valdecoxib and naproxen treatments improved the WOMAC Pain, Stiffness, Physical Function, and Composite indices compared with placebo at 2, 6, and 12 weeks. Valdecoxib 20 mg/day and naproxen 500 mg twice daily produced statistically significant changes in all WOMAC Osteoarthritis scores throughout the 12-week study period compared with placebo (P < .05). WOMAC Pain scores for 10 mg valdecoxib were significantly different from those for placebo at 2 weeks (P < .001) but not at 6 or 12 weeks. No significant differences were noted between any of the valdecoxib treatment doses and naproxen in terms of improvement in WOMAC indices.
The incidences of withdrawal due to treatment failure were 20% (95% confidence interval [CI], 15.3–26.8) in the placebo group; 8% (95% CI, 4.8–12.8), 12% (95% CI, 7.8–17.1), and 10% (95% CI, 6.3–15.2) in the 5-, 10-, and 20-mg/day valdecoxib groups; and 6% (95% CI, 3.6–10.9) in the 500-mg naproxen group (P < .05; Table 3). Patients in the placebo group withdrew at a significantly faster rate than those in the 4 active treatment groups (P < .05), but there were no significant differences in withdrawal rates across the 4 active treatment groups.
TABLE 2
Baseline arthritis assessments and mean changes from baseline scores
| Valdecoxib | Naproxen | ||||
|---|---|---|---|---|---|
| Placebo (n = 205) | 5 mg qd (n = 201) | 10 mg qd (n = 205) | 20 mg qd (n = 201) | 500 mg bid (n = 204) | |
| PhGAA§ | |||||
| Baseline mean | 4.10 | 4.07 | 4.09 | 4.09 | 4.10 |
| LSM change | |||||
| Week 2 (CI) | -1.04 (-1.16, -0.91) | -1.31‡(-1.44, -1.19) | -1.37‡(-1.50, -1.25) | -1.42‡(-1.54, -1.29) | -1.35‡(-1.48, -1.23) |
| Week 6 (CI) | -1.22 (-1.35, -1.08) | -1.44*(-1.58, -1.31) | -1.50†(-1.63, -1.36) | -1.41* (-1.55, -1.28) | -1.45* (-1.59, -1.32) |
| Week 12 (CI) | -1.22 (-1.36, -1.08) | -1.43* (-1.58, -1.28) | -1.52†(-1.67, -1.38) | -1.45* (-1.60, -1.31) | -1.43* (-1.58, -1.29) |
| PAAP║ | |||||
| Baseline mean | 71.20 | 71.42 | 72.41 | 72.54 | 72.36 |
| LSM change | |||||
| Week 2 (CI) | -21.19 (-24.80, -17.58) | -28.46†(-32.11, -24.82) | -30.21‡(-33.83, -26.59) | -32.07‡(-35.73, -28.41) | -31.03‡(-34.66, -27.40) |
| Week 6 (CI) | -23.92 (-27.72, -20.12) | -30.81†(-34.65, -26.97) | -29.85* (-33.67, -26.04) | -32.28†(-36.13, -28.42) | -31.84†(-35.66, -28.02) |
| Week 12 (CI) | -25.97 (-30.02, -21.92) | -31.33 (-35.42, -27.24) | -30.41 (-34.47, -30.41) | -32.70* (-36.81, -32.70) | -31.83* (-35.90, -27.76) |
| WOMAC OA, Stiffness ¶ | |||||
| Baseline mean | 4.84 | 4.87 | 4.91 | 4.73 | 4.94 |
| LSM change | |||||
| Week 2 (CI) | -0.78 (-0.98, -0.57) | -1.03 (-1.24, -0.82) | -1.20†(-1.41, -0.99) | -1.24†(-1.45, -1.03) | -1.28‡(-1.49, -1.08) |
| Week 6 (CI) | -1.04 (-1.27, -0.82) | -1.25 (-1.48, -1.02) | -1.42* (-1.65, -1.20) | -1.43* (-1.66, -1.20) | -1.40†(-1.62, -1.17) |
| Week 12 (CI) | -1.12 (-1.36, -0.89) | -1.33 (-1.57, -1.09) | -1.41 (-1.65, -1.17) | -1.46* (-1.70, -1.22) | -1.54* (-1.78, -1.30) |
| WOMAC OA, Composite # | |||||
| Baseline mean | 53.49 | 53.03 | 54.73 | 53.42 | 53.67 |
| LSM change | |||||
| Week 2 (CI) | -10.13 (-12.28, -7.99) | -13.26* (-15.42, -11.09) | -15.05‡(-17.20, -12.90) | -15.44‡(-17.63, -13.32) | -15.47‡(-17.63, -13.32) |
| Week 6 (CI) | -12.98 (-15.45, -10.51) | -15.47 (-17.97, -12.98) | -16.74* (-19.22, -14.26) | -17.33* (-19.48, -14.51) | -16.99* (-19.48, -14.51) |
| Week 12 (CI) | -13.48 (-16.07, -10.89) | -16.84 (-19.46, -14.23) | -17.34* (-19.93, -14.74) | -17.22* (-20.64, -15.44) | -18.04* (-20.64, -15.44) |
| *P < .05 vs placebo, significant. | |||||
| † P < .01 vs placebo, significant. | |||||
| ‡ P < .001 vs placebo, significant. | |||||
| § Scale = 1 (very good) to 5 (very poor). | |||||
| ║ Scale = 0 mm (no pain) to 100 mm (most severe pain). | |||||
| ¶ Scale = 0 (no symptoms) to 8 (worse symptoms). | |||||
| # Scale = 0 (no symptoms) to 96 (worse symptoms). | |||||
| bid, twice daily; CI, 95% confidence interval; LSM, least square mean; PAAP, Patient’s Assessment of Arthritis Pain; PhGAA, Physician’s Global Assessment of Arthritis; qd, once daily; WOMAC OA, Western Ontario and McMaster’s Universities Osteoarthritis Index. | |||||
TABLE 3
Incidence of gastroduodenal, gastric, and duodenal ulcers (>5 mm) at final endoscopic evaluation
| Valdecoxib | Naproxen | ||||
|---|---|---|---|---|---|
| Placebo (n = 178) | 5 mg qd (n = 188) | 10 mg qd (n = 174) | 20 mg qd (n = 185) | 500 mg bid (n = 183) | |
| Gastroduodenal§ | 8 (4) [2.1, 9.0] | 6 (3)† [1.3, 7.1] | 5 (3)† [1.1, 6.9] | 10 (5) [2.8, 10.0] | 18 (10)* [6.1, 15.3] |
| Gastric§ | 8 (4) [2.1, 9.0] | 4 (2)‡ [0.7, 5.7] | 3 (2)‡ [0.4, 5.4] | 9 (5) [2.4, 9.3] | 16 (9) [5.2, 14.1] |
| Duodenal§ | 0 (0) [0.05, 2.6] | 2 (1) [0.2, 4.2] | 2 (1) [0.2, 4.5] | 1 (1) [0.0, 3.4] | 2 (1) [0.2, 4.3] |
| Symptomatic ulcers (n) | 0 | 1 | 2 | 3 | 7 |
| *P < .05 vs placebo. | |||||
| † P < .05 vs naproxen. | |||||
| ‡ P < .01 vs naproxen. | |||||
| § Data are presented as n (%) [95% confidence interval]. | |||||
| bid, twice daily; qd, once daily. | |||||
Safety
Valdecoxib and placebo had comparable upper gastrointestinal tract ulceration rates, whereas naproxen produced a significantly higher incidence of upper gastrointestinal tract ulcers than did 5 and 10 mg valdecoxib and placebo (P < .05). There were 14 adjudicated symptomatic ulcers during the study: 1 in the 5-mg valdecoxib group, 2 in the 10-mg valdecoxib group, 3 in the 20-mg valdecoxib group, and 7 in the 500-mg naproxen group.
Adverse events with an incidence of at least 5% in any treatment group and adverse events leading to withdrawal from the study are summarized by body system in Table 4. There were no significant differences in the incidence of adverse events between the valdecoxib and placebo groups. In contrast, 500 mg naproxen twice daily was associated with significantly more adverse events than 5 or 10 mg/day valdecoxib (P < .05). The incidence of adverse events was similar in the 20-mg valdecoxib and naproxen groups. Most adverse events were reported in the gastrointestinal system and consisted of abdominal pain, constipation, diarrhea, dyspepsia, flatulence, and nausea. The incidences of constipation, diarrhea, and flatulence were significantly higher in the naproxen group than in the 5-, 10-, and 20-mg valdecoxib groups, respectively. Other adverse events included accidental injury, headache, myalgia, and upper respiratory tract infections. Valdecoxib at 5 mg/day produced a significantly higher incidence of myalgia than did placebo, and valdecoxib at 20 mg/day produced a significantly lower incidence of upper respiratory tract infections than did placebo. Adverse events causing withdrawal with an incidence of at least 1% were accidental injury, abdominal pain, diarrhea, dyspepsia, nausea, abnormal hepatic function, rash, and blurred vision. The proportion of patients in the naproxen group (12.7%) who withdrew from the study was significantly greater than those for the 5-and 20-mg valdecoxib (6.0% and 5.5%) groups (P < .05), although the incidence of withdrawal due to adverse events in the 10-mg valdecoxib and naproxen groups were similar. In addition, gastrointestinal adverse events commonly related to NSAID treatment, such as dyspepsia and constipation, were more frequent in the naproxen group than in the valdecoxib and placebo groups.
TABLE 4
Adverse events
| Valdecoxib | Naproxen | ||||
|---|---|---|---|---|---|
| Placebo (n = 178) | 5 mg qd (n = 188) | 10 mg qd (n = 174) | 20 mg qd (n = 185) | 500 mg bid (n = 183) | |
| Incidence ≥ 5% in any treatment group | |||||
| Total | 109 (53.2) | 112 (55.7)† | 113 (55.1)† | 121 (60.2) | 139 (68.1)* |
| Accidental injury | 11 (5.4) | 3 (1.5) | 10 (4.9) | 12 (6.0) | 9 (4.4) |
| Headache | 11 (5.4) | 12 (6.0) | 7 (3.4) | 14 (7.0) | 9 (4.4) |
| Abdominal pain | 19 (9.3) | 14 (7.0) | 18 (8.8) | 13 (6.5) | 25 (12.3) |
| Constipation | 6 (2.9) | 4 (2.0) | 1 (0.5)† | 4 (2.0) | 12 (5.9) |
| Diarrhea | 10 (4.9) | 7 (3.5) | 14 (6.8) | 11 (5.5) | 12 (5.9) |
| Dyspepsia | 15 (7.3) | 22 (10.9) | 22 (10.7) | 20 (9.9)† | 35 (17.2)* |
| Flatulence | 12 (5.9) | 7 (3.5) | 5 (2.4)† | 9 (4.5) | 14 (6.9) |
| Nausea | 10 (4.9) | 18 (9.0) | 17 (8.3) | 9 (4.5) | 10 (4.9) |
| Myalgia | 0 (0.0) | 13 (6.5)*† | 3 (1.5) | 2 (1.0) | 1 (0.5) |
| Upper respiratory tract infections | 18 (8.8) | 9 (4.5) | 10 (4.9) | 7 (3.5)* | 10 (4.9) |
| Incidence ≥ 1% in any treatment group causing withdrawal | |||||
| Total | 17 (8.3) | 12 (6.0)† | 18 (8.8) | 11 (5.5)† | 26 (12.7) |
| Accidental injury | 2 (1.0) | 0 (0.0) | 0 (0.0) | 1 (0.5) | 1 (0.5) |
| Abdominal pain | 5 (2.4) | 2 (1.0) | 6 (2.9) | 2 (1.0) | 7 (3.4) |
| Diarrhea | 0 (0.0) | 0 (0.0) | 1 (0.5) | 1 (0.5) | 3 (1.5) |
| Dyspepsia | 2 (1.0) | 2 (1.0) | 3 (1.5) | 1 (0.5)† | 9 (4.4)* |
| Nausea | 2 (1.0) | 1 (0.5) | 2 (1.0) | 1 (0.5) | 2 (1.0) |
| Abnormal hepatic function | 0 (0.0) | 2 (1.0) | 0 (0.0) | 0 (0.0) | 0 (0.0) |
| Rash | 0 (0.0) | 2 (1.0) | 1 (0.5) | 0 (0.0) | 0 (0.0) |
| Blurred vision | 2 (1.0) | 0 (0.0) | 1 (0.5) | 0 (0.0) | 0 (0.0) |
| *P < .05 vs placebo. | |||||
| † P < .05 vs naproxen. | |||||
| ‡ Data are presented as number (%) of patients reporting events. | |||||
| bid, twice daily; qd, once daily. | |||||
FIGURE 2
Western Ontario and McMaster’s Universities Osteoarthritis Pain Index
Discussion
This study confirmed that the novel COX-2–specific inhibitor valdecoxib at a dosage of 10 or 20 mg/day is as effective as naproxen at a dosage of 500 mg twice daily in relieving moderate to severe osteoarthritis of the knee over 12 weeks. In addition, treatment with 10 mg/day valdecoxib orally, the recommended dosage for treatment of osteoarthritis, is associated with a significantly lower gastroduodenal ulceration rate than occurs with the conventional NSAID, naproxen.
Patients receiving 10 and 20 mg/day valdecoxib experienced significant improvements in the signs and symptoms of osteoarthritis, and in all assessments the efficacies of valdecoxib 10 and 20 mg/day were numerically similar to that of naproxen. This finding is consistent with the inhibition of prostaglandin production in inflamed synovial tissue and in the central pain pathway. Increased COX-2 activity in the spinal cord in response to tissue damage and in the synovial membrane of osteoarthritis patients is at least partly responsible for joint inflammation and sensitization to inflammatory pain.14–16 The efficacy of valdecoxib in treating moderate to severe osteoarthritis of the knee was consistent with reports of other COX-2–specific inhibitors that are comparable to conventional NSAIDs in relieving chronic pain and inflammation.17,18 These data confirmed that 10 mg/day valdecoxib is as effective as 500 mg naproxen twice daily in treating the pain and inflammation associated with osteoarthritis. The efficacy of 10 mg/day valdecoxib makes it one of the most potent COX-2–specific inhibitors for treating moderate to severe osteoarthritis.
Conventional NSAIDs were associated with a significant risk of serious gastrointestinal complications such as ulceration and perforation and low gastrointestinal tolerability.20–22 Naproxen treatment of osteoarthritis and rheumatoid arthritis demonstrated a higher rate of endoscopically proven gastrointestinal ulceration than did COX-2–specific inhibitors,17,23 and that finding was confirmed in this study for 10 mg valdecoxib. Naproxen treatment was associated with significantly more gastroduodenal ulcers than 5 or 10 mg valdecoxib. We found no significant difference between 20 mg valdecoxib and naproxen, which might be explained by a lower incidence of ulcers with naproxen than reported in previous studies.24 In terms of numbers needed to treat, 14 patients would be needed to observe a difference in endoscopic ulcer rates between valdecoxib (5 or 10 mg) and naproxen compared with 20 patients to observe a difference between 20 mg valdecoxib and naproxen and 16 to observe a difference in ulcer rates between naproxen and placebo.
Valdecoxib at a dosage of 10 mg/day also demonstrated overall improved gastrointestinal tolerability, with significantly fewer adverse events and withdrawals due to adverse events, in particular gastrointestinal-related events such as constipation and dyspepsia, than did naproxen. The improved upper gastrointestinal tract safety of valdecoxib was as expected because the COX-1–sparing nature of this agent allows effective inhibition of COX-2 without inhibiting COX-1 in the gastric mucosa and platelets. An improved gastrointestinal safety profile is an important consideration in the treatment of osteoarthritis because the moderate to severe gastrointestinal complications associated with conventional NSAID therapy frequently lead to poor patient compliance or discontinuation of the medication.25,26
Overall, this study suggests clinical benefits of single daily doses of 10 and 20 mg valdecoxib and improved upper gastrointestinal tract safety for the 10-mg dose, compared with 500 mg/day naproxen. No additional efficacy benefit was obtained from a 20-mg dose as opposed to a 10-mg dose. Valdecoxib (10 mg) is a potent and effective once-daily alternative to conventional NSAIDs, with a gastrointestinal safety advantage that will be of value to rheumatologists and primary care physicians alike.
FIGURE 3
Western Ontario and Western Universities Osteoarthritis Physical Function Index
1. Klippel J, et al. Primer on the Rheumatic Diseases. 12th ed. Atlanta, GA: Arthritis Foundation; 2001.
2. Felson DT. Epidemiology of hip and knee osteoarthritis. Epidemiol Rev 1988;10:1-28.
3. Borda IT, Koff R. NSAIDs: A Profile of Adverse Effects. Philadelphia: Hanley and Belfus; 1995.
4. Bensen WG, Fiechtner JJ, McMillen JI, et al. Treatment of osteoarthritis with celecoxib, a cyclooxygenase-2 inhibitor: a randomized controlled trial. Mayo Clin Proc 1999;74:1095-105.
5. Geis GS. Update on clinical developments with celecoxib, a new specific COX-2 inhibitor: what can we expect? J Rheumatol 1999;26(suppl 56):31-6.
6. Altman R, Asch E, Bloch G, et al. The American College of Rheumatology criteria for the classification and reportings of osteoarthritis of the knee. Arthritis Rheum 1986;29:1039-49.
7. Schumacher HR. Primer on the Rheumatic Diseases. Atlanta, GA: Arthritis Foundation; 1986.
8. Cooperating Clinics Committee of American Rheumatism Association. A seven day variability study of 499 patients with peripheral rheumatoid arthritis. Arthritis Rheum 1965;8:302-34.
9. Ward JR, Williams HJ, Boyce E, et al. Comparison of auranofin, gold sodium thiomalate, and placebo in the treatment of rheumatoid arthritis. Subsets of responses. Am J Med 1983;75:133-7.
10. Bellamy N. WOMAC Osteoarthritis Index: A User’s Guide. London, Ontario, Canada: The Western Ontario and McMaster Universities; 1995.
11. Hochberg Y. A sharper Bonferroni procedure for multiple tests of significance. Biometrika 1998;75:800-2.
12. Miller R. Survival Analyses. New York: John Wiley & Sons; 1998.
13. Simon R, Lee YJ. Nonparametric confidence limits for survival probabilities and median survival time. Cancer Treat Rep 1982;66:37-42.
14. Amin AR, Attur M, Patel RN, et al. Superinduction of cyclooxygenase-2 activity in human osteoarthritis-affected cartilage. Influence of nitric oxide. J Clin Invest 1997;99:1231-7.
15. Hay C, de Belleroche J. Carrageenan-induced hyperalgesia is associated with increased cyclooxygenase-2 expression in spinal cord. Neuroreport 1997;8:1249-51.
16. Kang RY, Freire Moar, Sigal E, et al. Expression of cyclooxygenase-2 in human and an animal model of rheumatoid arthritis. Br J Rheumatol 1996;35:711-8.
17. Bensen WG, Zhao SZ, Burke TA, et al. Upper gastrointestinal tolerability of celecoxib, a COX-2 specific inhibitor, compared to naproxen and placebo. J Rheumatol 2000;27:1876-83.
18. Day R, Morrison B, Luza A, et al. A randomized trial of the efficacy and tolerability of the COX-2 inhibitor rofecoxib vs ibuprofen in patients with osteoarthritis. Rofecoxib/Ibuprofen Comparator Study Group. Arch Intern Med 2000;160:1781-7.
19. Fiechtner J, Sikes D, Recker D. A double-blind, placebo-controlled dose ranging study to evaluate the efficacy of valdecoxib, a novel COX-2 specific inhibitor, in treating the signs and symptoms of osteoarthritis of the knee. Paper presented at: European League Against Rheumatism (EULAR); May 13–16, 2001; Prague, Czech Republic.
20. Garcia Rodriguez LA, Jick H. Risk of upper gastrointestinal bleeding and perforation associated with individual nonsteroidal anti-inflammatory drugs. Lancet 1994;343:769-72.
21. Singh G, Ramey DR, Morfeld D, et al. Gastrointestinal tract complications of nonsteroidal anti-inflammatory drug treatment in rheumatoid arthritis. A prospective observational cohort study. Arch Intern Med 1996;156:1530-6.
22. Singh G, Rosen Ramey D. NSAID induced gastrointestinal complications: the ARAMIS perspective-1997. Arthritis, Rheumatism, and Aging Medical Information System. J Rheumatol 1998;51(suppl):8-16.
23. Watson DJ, Harper SE, Zhao PL, et al. Gastrointestinal tolerability of the selective cyclooxygenase-2 (COX-2) inhibitor rofecoxib compared with nonselective COX-1 and COX-2 inhibitors in osteoarthritis. Arch Intern Med 2000;160:2998-3003.
24. Simon LS, Weaver AL, Graham DY, et al. Anti-inflammatory and upper gastrointestinal effects of celecoxib in rheumatoid arthritis: a randomized controlled trial. JAMA 1999;282:1921-8.
25. Langman MJ, Jensen DM, Watson DJ, et al. Adverse upper gastrointestinal effects of rofecoxib compared with NSAIDs. JAMA 1999;282:1929-33.
26. Scholes D, Stergachis A, Penna P, Normand E, Hansten P. Nonsteroidal anti-inflammatory drug discontinuation in patients with osteoarthritis. J Rheumatol 1995;22:708-12.
Association of cervical cryotherapy with inadequate follow-up colposcopy
OBJECTIVE: We studied the anatomic changes that occur in the ectocervix after cryotherapy and the role these changes play in the adequacy of follow-up colposcopic examination.
STUDY DESIGN: We retrospectively reviewed patients’ charts.
POPULATION: Between January 1, 1991, and December 1, 1995, 268 women underwent 2 colposcopic examinations in 7 state-run public health clinics.
OUTCOMES MEASURED: The likelihood that a follow-up colposcopic examination would be inadequate.
RESULTS: Of the 268 women who underwent 2 colposcopic examinations during the study period, 83 had cryotherapy, 24 had loop excision of the ectocervical portion or cervical conization, and 96 had no procedure. Sixty-five were excluded because of missing data. Subjects were similar with respect to age, whether endocervical curettage was performed, presence of cervical dysplasia or human papilloma virus, and whether glandular involvement was noted. Patients who had cryotherapy had an increased likelihood of inadequate follow-up colposcopic examination compared with women who had no procedure (adjusted odds ratio = 18.7, 95% confidence interval = 7.0–49.8).
CONCLUSIONS: Undergoing cryotherapy of the uterine cervix increases the risk that a follow-up colposcopic examination will be inadequate. Given the reported high rates of regression of mild and moderate cervical dysplasia and the risks posed by possibly unnecessary procedures performed after inadequate colposcopic examination, a trend toward less aggressive therapy and watchful waiting may be appropriate but should be investigated in a controlled clinical trial.
- Based on this study, cervical cryotherapy increases the risk that a follow-up colposcopic examination will be inadequate.
- Further studies are needed to determine the most effective treatment for mild cervical dysplasia and possible local effects of cryotherapy.
Cryotherapy is an accepted procedure for treating low-grade cervical dysplasia.1,2 Only minor modifications of the precise technique of cryotherapy application have occurred since its inception. Currently the double-freeze technique of cryotherapy is an accepted treatment for mild and focal moderate dysplasia of the uterine cervix.3 Cervical cryotherapy is used widely not only because of its proven efficacy but also because of its ease of use in the outpatient setting and lack of known significant side effects. The procedure can be performed in the office setting without the use of local or general anesthesia, making it superior to the more invasive procedures performed before the availability of cryotherapy (eg, cervical conization and hysterectomy).
There has been limited investigation of the effects of cryotherapy on the anatomy of the uterine cervix. Whereas one study showed that cryotherapy has no effect on subsequent fertility or pregnancy outcome,4 another in adolescents reported cervical stenosis and pelvic inflammatory disease as possible treatment side effects.5 In addition, a study published in 1984 by Jobson and Homesley reported higher rates of retraction of the proximal squamocolumnar junction into the endocervical canal in patients undergoing cryotherapy compared with patients undergoing carbon dioxide laser ablation6; 47% of the follow-up colposcopic examinations were inadequate in that study population. Adequacy of colposcopic examination is defined as complete visualization of the transformation zone, visualization of the entire lesion, if present, and correlation between cytologic and histologic findings and the colposcopist’s impression.7 Failure to meet any one of these criteria leads to an inadequate colposcopic examination requiring further, more invasive evaluation. This study compared the rate of adequate and inadequate colposcopic examinations in women with and without a history of cryotherapy. Other factors found to influence the adequacy of follow-up colposcopy also are described.
Methods
We performed a retrospective cohort study using data collected from 7 of 14 state-run public health clinics. These 7 sites included rural and urban clinics. All women undergoing at least 2 colposcopic examinations in these clinics between January 1, 1991, and December 1, 1995, were included. Women underwent initial colposcopic examination after an abnormality was noted on a screening Pap test. Only women who had both colposcopic examinations in the same clinic were included. Care provided in these clinics included Pap test screening, colposcopic examinations, and treatment of identified cervical dysplasia with cervical cryotherapy, conization, and loop excision of the ectocervical portion (LEEP). State-contracted physicians trained in obstetrics and gynecology followed women who attended these clinics.
Chart review was used to determine the adequacy of the initial examination, whether an intervening procedure was done, and the adequacy of follow-up colposcopic examination. Adequacy was documented by the physician performing the colposcopic examination with the use of a standard form consistent among clinics. The accepted criteria for adequacy were used, and each colposcopic examination was documented as adequate or inadequate based on the colposcopist’s findings. Charts were reviewed and data were abstracted by 3 reviewers. Cervical biopsy results, presence of human papilloma virus (HPV) noted on routine cytology, endocervical curettage (ECC) results, and routine demographic data also were recorded. The management and therapeutic protocols were consistent across the 7 clinics.
Women were excluded from the analysis if (1) they had cryotherapy performed before their initial colposcopic examination (n = 1), (2) the date of the initial colposcopic examination was not available (n = 36), (3) information confirming the type of treatment used between colposcopic examinations was unknown (n = 32), (4) initial colposcopic examination was inadequate (n = 16), or (5) the adequacy of the follow-up colposcopic examination was not documented (n = 6). The total number of women excluded was 65 because some women met multiple exclusion criteria.
The management after initial colposcopic examination was done according to whether the women had cryotherapy, cone, LEEP, or no procedure between initial and follow-up colposcopic examinations. Univariate analysis of the association between the management group with clinic of treatment, performance of ECC, biopsy results, presence of HPV, and cytologic presence of glandular atypia was performed. Mean age and duration (interval between initial and follow-up colposcopic examinations or between the procedure and follow-up examination) were calculated for all groups.
The odds ratio of an inadequate follow-up colposcopic examination was estimated for type of treatment (cryotherapy, cone/LEEP) compared with no treatment, age, clinic where treatment was provided, performance of ECC, biopsy results, presence of HPV, and presence of glandular atypia. The 95% confidence intervals about the relative odds estimates were calculated. Mean age and duration between initial colposcopy and follow-up colposcopy were calculated for the groups with adequate and inadequate follow-up colposcopic examinations.
Multivariable logistic regression analysis was used to evaluate the association of adequacy of follow-up colposcopic examination with age (years), clinic where colposcopic examination was performed, duration (days), whether or not ECC was performed, biopsy results from the initial colposcopic examination, presence of HPV, and presence of glandular atypia noted on initial colposcopy. Biopsy results were categorized as normal or abnormal in the model that is reported. The stepwise backward elimination technique was used to evaluate the best model. The 95% confidence intervals about the adjusted odds ratio were calculated.
The Pearson chi-square test was used to test the significance of the association between binary variables. The significance of the difference between means was tested with the one-way analysis of variance. Data were analyzed with the personal computer version of the Statistical Package for the Social Sciences (SPSS/PC+ version 8.0).
Results
Between January 1, 1991, and December 31, 1995, 3225 women underwent colposcopic evaluation or treatment at 7 county colposcopy clinics in Oklahoma. Two hundred sixty-eight of these women underwent 2 examinations during the study period. There were 203 of 268 subjects available for analysis after exclusions for missing data. Eighty-three patients (41.1%) had cryotherapy, 24 (11.9%) underwent a cone biopsy or a LEEP procedure, and 96 (47.5%) underwent no procedure between initial and follow-up colposcopic examinations.
Table 1 shows characteristics of women who had cryotherapy, cone/LEEP, and no procedure. The groups were similar with respect to age, whether ECC was performed, presence of HPV, and whether glandular involvement was noted. There was an association between the degree of cervical dysplasia and the three treatment groups, which was expected because degree of dysplasia determines treatment modality. Women who had cryotherapy had follow-up colposcopy (mean = 565 days) later than women who had cone or LEEP (mean = 319 days) or no procedure (mean = 339 days; P < .0001).
Thirty-three percent (n = 67) had inadequate follow-up colposcopic examinations. These included a large proportion of women, 61.4%, who had cryotherapy (51/83) compared with 20.8% (5/24) of women who had cone or LEEP and 11.5% (11/96) of women who had no procedure.
Table 2 shows the relationship between inadequate second colposcopy and previous cryotherapy, cone/LEEP, abnormal cervical biopsy, ECC, presence of HPV, and presence of glandular atypia. Patients who had cryotherapy had an increased likelihood of inadequate follow-up compared with patients who had no procedure (adjusted odds ratio =18.67, 95% confidence interval = 6.99–49.81). Cone/LEEP increased the likelihood of inadequate follow-up but was not statistically significant. Age, duration, ECC, presence of HPV, or presence of glandular atypia did not increase the likelihood of subsequent inadequate colposcopic examination. Odds ratio estimates for different clinics are not reported but were imprecise due to small numbers.
TABLE 1
Characteristics of patients with and without cryotherapy between initial and follow-up colposcopy
| Characteristic | Cryotherapy (n = 82) | Cone or LEEP (n = 24) | No procedure (n = 96) | P* |
|---|---|---|---|---|
| Mean age (y) | 24.6 | 26.5 | 23.8 | .229 |
| Mean duration†(d) | 565 | 319 | 339 | .004 |
| ECC (%) | 80.2 | 75.0 | 7.1 | .135 |
| Cervical dysplasia (%) | < .001 | |||
| Normal | 21.7 | 19.0 | 39.5 | |
| Mild dysplasia | 58.0 | 23.8 | 45.3 | |
| >Mild dysplasia | 20.3 | 57.1 | 15.1 | |
| HPV (%) | 72.6 | 52.4 | 60.4 | .130 |
| Glandular atypia (%) | 23.9 | 38.1 | 17.8 | .125 |
| *Pearson 2 for proportions and analysis of variance for means. | ||||
| †Duration from treatment (cryotherapy) or examination to follow-up colposcopic examination. | ||||
| ECC, endocervical curettage; HPV, human papilloma virus; LEEP, loop excision of the ectocervical portion. | ||||
TABLE 2
Likelihood of inadequate follow-up colposcopic examination*
| Characteristics | Adjusted OR | 95% CI |
|---|---|---|
| Cryotherapy | 18.66 | 6.99–49.81 |
| Cone or LEEP | 3.01 | 0.78–11.58 |
| Cervical dysplasia | ||
| Mild | NA | |
| >Mild | NA | |
| ECC | NA | |
| HPV | NA | |
| Glandular atypia | NA | |
| *Logistic regression model included the clinic of colposcopy (not shown). Age (years) and duration (days; from treatment or first colposcopy to second colposcopy) were removed from the model by backward elimination. | ||
| CI, confidence interval; ECC, endocervical curettage ; HPV, human papilloma virus; LEEP, loop excision of the ectocervical portion; NA, not applicable; OR, odds ratio. | ||
Discussion
Undergoing cryotherapy of the uterine cervix increases the risk that a follow-up colposcopic examination will be inadequate. This agrees with the findings of Jobson and Homesley’s 1984 study,6 which looked at the efficacy of cryotherapy vs carbon dioxide laser ablation in the treatment of cervical dysplasia. Although it was not the focus of their study, a high rate of inadequacy was noted on follow-up colposcopic examinations after cryotherapy.
Because of the retrospective design of this study, we could not randomly assign women to a treatment group. However, the study groups were similar with respect to other variables potentially associated with the outcome measure. In addition, we attempted to control confounding variables by using multivariable analysis. By including the clinic where the examination was performed, we attempted to limit the effect of the subjective assignment of adequacy by the physician. This is a limitation of this study.
We found an association between the clinics where the follow-up colposcopist’s examinations were performed and whether a follow-up examination was adequate or inadequate. The determination of adequacy depends on the physician’s observations during the colposcopic examination. We were unable to measure the intra- or interobservation variation between the examinations. However, we attempted to control for this effect by including the clinic site in the multivariable analysis.
The current standard of care for inadequate colposcopic examination recommends more invasive evaluation with a procedure such as cervical conization or LEEP. This allows clarification of discordance between cytology, histology, and the colposcopist’s impression; sampling of any lesion that may extend past the view of standard colposcopy; and histologic evaluation of the entire transformation zone. Given the reported high rates of spontaneous regression of mild and moderate cervical dysplasias with a watchful waiting approach,8 12 we wonder whether we are performing unnecessary procedures (LEEP and conization) after cryotherapy as a result of inadequate follow-up colposcopic examinations. A study evaluating the pathologic findings of cone or LEEP specimens from inadequate colposcopic examinations after cryotherapy would help answer these questions. If there is no persistence or progression of dysplasia, then this would support the hypothesis that cryotherapy leads to unnecessary, invasive procedures. Further controlled trials are required to answer these questions.
ACKNOWLEDGMENTS
The authors acknowledge the assistance of Adeline Yerkes, of the Chronic Disease Division, Oklahoma State Department of Health, in facilitating access to the county clinic records.
1. Ferris DG. Office procedures: colposcopy. Prim Care 1997;24:241-67.
2. Crisp WE, Asadourian L, Romberger W. Application of cryosurgery to gynecologic malignancy. Obstet Gynecol 1967;30:668-73.
3. Mayeaux EJ, Jr, Spigener SD, German JA. Cryotherapy of the uterine cervix. J Fam Pract 1998;47:99-102.
4. Benrubi GI, Young M, Nuss RC. Intrapartum outcome of term pregnancy after cervical cryotherapy. J Reprod Med 1984;29:251-4.
5. Hillard PA, Biro FM, Wildey L. Complications of cervical cryotherapy in adolescents. J Reprod Med 1991;36:711-5.
6. Jobson VW, Homesley HD. Comparison of cryosurgery and carbon dioxide laser ablation for treatment of cervical intraepithelial neoplasia. Colposc Gynecol Laser Surg 1984;1:173-80.
7. Ryan KJ. Kistner’s Gynecology and Women’s Health. 7th ed. St Louis, MO: Mosby; 1999.
8. Ostergard DR. Cryosurgical treatment of cervical intraepithelial neoplasia. Obstet Gynecol 1980;56:231-3.
9. Walton LA, Edelman DA, Fowler WC, Jr, Photopulos GJ. Cryosurgery for the treatment of cervical intraepithelial neoplasia during the reproductive years. Obstet Gynecol 1980;55:353-7.
10. Hemmingsson E, Stendahl U, Stenson S. Cryosurgical treatment of cervical intraepithelial neoplasia with follow-up of five to eight years. Am J Obstet Gynecol 1981;139:144-7.
11. Andersen ES, Husth M. Cryosurgery for cervical intraepithelial neoplasia: 10-year follow-up. Gynecol Oncol 1992;45:240-2.
12. Benedet JL, Miller DM, Nickerson KG, Anderson GH. The results of cryosurgical treatment of cervical intraepithelial neoplasia at one, five, and ten years. Am J Obstet Gynecol 1987;157:268-73.
OBJECTIVE: We studied the anatomic changes that occur in the ectocervix after cryotherapy and the role these changes play in the adequacy of follow-up colposcopic examination.
STUDY DESIGN: We retrospectively reviewed patients’ charts.
POPULATION: Between January 1, 1991, and December 1, 1995, 268 women underwent 2 colposcopic examinations in 7 state-run public health clinics.
OUTCOMES MEASURED: The likelihood that a follow-up colposcopic examination would be inadequate.
RESULTS: Of the 268 women who underwent 2 colposcopic examinations during the study period, 83 had cryotherapy, 24 had loop excision of the ectocervical portion or cervical conization, and 96 had no procedure. Sixty-five were excluded because of missing data. Subjects were similar with respect to age, whether endocervical curettage was performed, presence of cervical dysplasia or human papilloma virus, and whether glandular involvement was noted. Patients who had cryotherapy had an increased likelihood of inadequate follow-up colposcopic examination compared with women who had no procedure (adjusted odds ratio = 18.7, 95% confidence interval = 7.0–49.8).
CONCLUSIONS: Undergoing cryotherapy of the uterine cervix increases the risk that a follow-up colposcopic examination will be inadequate. Given the reported high rates of regression of mild and moderate cervical dysplasia and the risks posed by possibly unnecessary procedures performed after inadequate colposcopic examination, a trend toward less aggressive therapy and watchful waiting may be appropriate but should be investigated in a controlled clinical trial.
- Based on this study, cervical cryotherapy increases the risk that a follow-up colposcopic examination will be inadequate.
- Further studies are needed to determine the most effective treatment for mild cervical dysplasia and possible local effects of cryotherapy.
Cryotherapy is an accepted procedure for treating low-grade cervical dysplasia.1,2 Only minor modifications of the precise technique of cryotherapy application have occurred since its inception. Currently the double-freeze technique of cryotherapy is an accepted treatment for mild and focal moderate dysplasia of the uterine cervix.3 Cervical cryotherapy is used widely not only because of its proven efficacy but also because of its ease of use in the outpatient setting and lack of known significant side effects. The procedure can be performed in the office setting without the use of local or general anesthesia, making it superior to the more invasive procedures performed before the availability of cryotherapy (eg, cervical conization and hysterectomy).
There has been limited investigation of the effects of cryotherapy on the anatomy of the uterine cervix. Whereas one study showed that cryotherapy has no effect on subsequent fertility or pregnancy outcome,4 another in adolescents reported cervical stenosis and pelvic inflammatory disease as possible treatment side effects.5 In addition, a study published in 1984 by Jobson and Homesley reported higher rates of retraction of the proximal squamocolumnar junction into the endocervical canal in patients undergoing cryotherapy compared with patients undergoing carbon dioxide laser ablation6; 47% of the follow-up colposcopic examinations were inadequate in that study population. Adequacy of colposcopic examination is defined as complete visualization of the transformation zone, visualization of the entire lesion, if present, and correlation between cytologic and histologic findings and the colposcopist’s impression.7 Failure to meet any one of these criteria leads to an inadequate colposcopic examination requiring further, more invasive evaluation. This study compared the rate of adequate and inadequate colposcopic examinations in women with and without a history of cryotherapy. Other factors found to influence the adequacy of follow-up colposcopy also are described.
Methods
We performed a retrospective cohort study using data collected from 7 of 14 state-run public health clinics. These 7 sites included rural and urban clinics. All women undergoing at least 2 colposcopic examinations in these clinics between January 1, 1991, and December 1, 1995, were included. Women underwent initial colposcopic examination after an abnormality was noted on a screening Pap test. Only women who had both colposcopic examinations in the same clinic were included. Care provided in these clinics included Pap test screening, colposcopic examinations, and treatment of identified cervical dysplasia with cervical cryotherapy, conization, and loop excision of the ectocervical portion (LEEP). State-contracted physicians trained in obstetrics and gynecology followed women who attended these clinics.
Chart review was used to determine the adequacy of the initial examination, whether an intervening procedure was done, and the adequacy of follow-up colposcopic examination. Adequacy was documented by the physician performing the colposcopic examination with the use of a standard form consistent among clinics. The accepted criteria for adequacy were used, and each colposcopic examination was documented as adequate or inadequate based on the colposcopist’s findings. Charts were reviewed and data were abstracted by 3 reviewers. Cervical biopsy results, presence of human papilloma virus (HPV) noted on routine cytology, endocervical curettage (ECC) results, and routine demographic data also were recorded. The management and therapeutic protocols were consistent across the 7 clinics.
Women were excluded from the analysis if (1) they had cryotherapy performed before their initial colposcopic examination (n = 1), (2) the date of the initial colposcopic examination was not available (n = 36), (3) information confirming the type of treatment used between colposcopic examinations was unknown (n = 32), (4) initial colposcopic examination was inadequate (n = 16), or (5) the adequacy of the follow-up colposcopic examination was not documented (n = 6). The total number of women excluded was 65 because some women met multiple exclusion criteria.
The management after initial colposcopic examination was done according to whether the women had cryotherapy, cone, LEEP, or no procedure between initial and follow-up colposcopic examinations. Univariate analysis of the association between the management group with clinic of treatment, performance of ECC, biopsy results, presence of HPV, and cytologic presence of glandular atypia was performed. Mean age and duration (interval between initial and follow-up colposcopic examinations or between the procedure and follow-up examination) were calculated for all groups.
The odds ratio of an inadequate follow-up colposcopic examination was estimated for type of treatment (cryotherapy, cone/LEEP) compared with no treatment, age, clinic where treatment was provided, performance of ECC, biopsy results, presence of HPV, and presence of glandular atypia. The 95% confidence intervals about the relative odds estimates were calculated. Mean age and duration between initial colposcopy and follow-up colposcopy were calculated for the groups with adequate and inadequate follow-up colposcopic examinations.
Multivariable logistic regression analysis was used to evaluate the association of adequacy of follow-up colposcopic examination with age (years), clinic where colposcopic examination was performed, duration (days), whether or not ECC was performed, biopsy results from the initial colposcopic examination, presence of HPV, and presence of glandular atypia noted on initial colposcopy. Biopsy results were categorized as normal or abnormal in the model that is reported. The stepwise backward elimination technique was used to evaluate the best model. The 95% confidence intervals about the adjusted odds ratio were calculated.
The Pearson chi-square test was used to test the significance of the association between binary variables. The significance of the difference between means was tested with the one-way analysis of variance. Data were analyzed with the personal computer version of the Statistical Package for the Social Sciences (SPSS/PC+ version 8.0).
Results
Between January 1, 1991, and December 31, 1995, 3225 women underwent colposcopic evaluation or treatment at 7 county colposcopy clinics in Oklahoma. Two hundred sixty-eight of these women underwent 2 examinations during the study period. There were 203 of 268 subjects available for analysis after exclusions for missing data. Eighty-three patients (41.1%) had cryotherapy, 24 (11.9%) underwent a cone biopsy or a LEEP procedure, and 96 (47.5%) underwent no procedure between initial and follow-up colposcopic examinations.
Table 1 shows characteristics of women who had cryotherapy, cone/LEEP, and no procedure. The groups were similar with respect to age, whether ECC was performed, presence of HPV, and whether glandular involvement was noted. There was an association between the degree of cervical dysplasia and the three treatment groups, which was expected because degree of dysplasia determines treatment modality. Women who had cryotherapy had follow-up colposcopy (mean = 565 days) later than women who had cone or LEEP (mean = 319 days) or no procedure (mean = 339 days; P < .0001).
Thirty-three percent (n = 67) had inadequate follow-up colposcopic examinations. These included a large proportion of women, 61.4%, who had cryotherapy (51/83) compared with 20.8% (5/24) of women who had cone or LEEP and 11.5% (11/96) of women who had no procedure.
Table 2 shows the relationship between inadequate second colposcopy and previous cryotherapy, cone/LEEP, abnormal cervical biopsy, ECC, presence of HPV, and presence of glandular atypia. Patients who had cryotherapy had an increased likelihood of inadequate follow-up compared with patients who had no procedure (adjusted odds ratio =18.67, 95% confidence interval = 6.99–49.81). Cone/LEEP increased the likelihood of inadequate follow-up but was not statistically significant. Age, duration, ECC, presence of HPV, or presence of glandular atypia did not increase the likelihood of subsequent inadequate colposcopic examination. Odds ratio estimates for different clinics are not reported but were imprecise due to small numbers.
TABLE 1
Characteristics of patients with and without cryotherapy between initial and follow-up colposcopy
| Characteristic | Cryotherapy (n = 82) | Cone or LEEP (n = 24) | No procedure (n = 96) | P* |
|---|---|---|---|---|
| Mean age (y) | 24.6 | 26.5 | 23.8 | .229 |
| Mean duration†(d) | 565 | 319 | 339 | .004 |
| ECC (%) | 80.2 | 75.0 | 7.1 | .135 |
| Cervical dysplasia (%) | < .001 | |||
| Normal | 21.7 | 19.0 | 39.5 | |
| Mild dysplasia | 58.0 | 23.8 | 45.3 | |
| >Mild dysplasia | 20.3 | 57.1 | 15.1 | |
| HPV (%) | 72.6 | 52.4 | 60.4 | .130 |
| Glandular atypia (%) | 23.9 | 38.1 | 17.8 | .125 |
| *Pearson 2 for proportions and analysis of variance for means. | ||||
| †Duration from treatment (cryotherapy) or examination to follow-up colposcopic examination. | ||||
| ECC, endocervical curettage; HPV, human papilloma virus; LEEP, loop excision of the ectocervical portion. | ||||
TABLE 2
Likelihood of inadequate follow-up colposcopic examination*
| Characteristics | Adjusted OR | 95% CI |
|---|---|---|
| Cryotherapy | 18.66 | 6.99–49.81 |
| Cone or LEEP | 3.01 | 0.78–11.58 |
| Cervical dysplasia | ||
| Mild | NA | |
| >Mild | NA | |
| ECC | NA | |
| HPV | NA | |
| Glandular atypia | NA | |
| *Logistic regression model included the clinic of colposcopy (not shown). Age (years) and duration (days; from treatment or first colposcopy to second colposcopy) were removed from the model by backward elimination. | ||
| CI, confidence interval; ECC, endocervical curettage ; HPV, human papilloma virus; LEEP, loop excision of the ectocervical portion; NA, not applicable; OR, odds ratio. | ||
Discussion
Undergoing cryotherapy of the uterine cervix increases the risk that a follow-up colposcopic examination will be inadequate. This agrees with the findings of Jobson and Homesley’s 1984 study,6 which looked at the efficacy of cryotherapy vs carbon dioxide laser ablation in the treatment of cervical dysplasia. Although it was not the focus of their study, a high rate of inadequacy was noted on follow-up colposcopic examinations after cryotherapy.
Because of the retrospective design of this study, we could not randomly assign women to a treatment group. However, the study groups were similar with respect to other variables potentially associated with the outcome measure. In addition, we attempted to control confounding variables by using multivariable analysis. By including the clinic where the examination was performed, we attempted to limit the effect of the subjective assignment of adequacy by the physician. This is a limitation of this study.
We found an association between the clinics where the follow-up colposcopist’s examinations were performed and whether a follow-up examination was adequate or inadequate. The determination of adequacy depends on the physician’s observations during the colposcopic examination. We were unable to measure the intra- or interobservation variation between the examinations. However, we attempted to control for this effect by including the clinic site in the multivariable analysis.
The current standard of care for inadequate colposcopic examination recommends more invasive evaluation with a procedure such as cervical conization or LEEP. This allows clarification of discordance between cytology, histology, and the colposcopist’s impression; sampling of any lesion that may extend past the view of standard colposcopy; and histologic evaluation of the entire transformation zone. Given the reported high rates of spontaneous regression of mild and moderate cervical dysplasias with a watchful waiting approach,8 12 we wonder whether we are performing unnecessary procedures (LEEP and conization) after cryotherapy as a result of inadequate follow-up colposcopic examinations. A study evaluating the pathologic findings of cone or LEEP specimens from inadequate colposcopic examinations after cryotherapy would help answer these questions. If there is no persistence or progression of dysplasia, then this would support the hypothesis that cryotherapy leads to unnecessary, invasive procedures. Further controlled trials are required to answer these questions.
ACKNOWLEDGMENTS
The authors acknowledge the assistance of Adeline Yerkes, of the Chronic Disease Division, Oklahoma State Department of Health, in facilitating access to the county clinic records.
1. Ferris DG. Office procedures: colposcopy. Prim Care 1997;24:241-67.
2. Crisp WE, Asadourian L, Romberger W. Application of cryosurgery to gynecologic malignancy. Obstet Gynecol 1967;30:668-73.
3. Mayeaux EJ, Jr, Spigener SD, German JA. Cryotherapy of the uterine cervix. J Fam Pract 1998;47:99-102.
4. Benrubi GI, Young M, Nuss RC. Intrapartum outcome of term pregnancy after cervical cryotherapy. J Reprod Med 1984;29:251-4.
5. Hillard PA, Biro FM, Wildey L. Complications of cervical cryotherapy in adolescents. J Reprod Med 1991;36:711-5.
6. Jobson VW, Homesley HD. Comparison of cryosurgery and carbon dioxide laser ablation for treatment of cervical intraepithelial neoplasia. Colposc Gynecol Laser Surg 1984;1:173-80.
7. Ryan KJ. Kistner’s Gynecology and Women’s Health. 7th ed. St Louis, MO: Mosby; 1999.
8. Ostergard DR. Cryosurgical treatment of cervical intraepithelial neoplasia. Obstet Gynecol 1980;56:231-3.
9. Walton LA, Edelman DA, Fowler WC, Jr, Photopulos GJ. Cryosurgery for the treatment of cervical intraepithelial neoplasia during the reproductive years. Obstet Gynecol 1980;55:353-7.
10. Hemmingsson E, Stendahl U, Stenson S. Cryosurgical treatment of cervical intraepithelial neoplasia with follow-up of five to eight years. Am J Obstet Gynecol 1981;139:144-7.
11. Andersen ES, Husth M. Cryosurgery for cervical intraepithelial neoplasia: 10-year follow-up. Gynecol Oncol 1992;45:240-2.
12. Benedet JL, Miller DM, Nickerson KG, Anderson GH. The results of cryosurgical treatment of cervical intraepithelial neoplasia at one, five, and ten years. Am J Obstet Gynecol 1987;157:268-73.
Computer-using patients want Internet services from family physicians
- Computer-using patients desire Web-based services to augment their care.
- Practice Web sites should be designed to go beyond information alone and incorporate services such as online appointments.
- Physicians should consider providing “virtual visits” to assist with disease management.
Patients are increasingly using the Internet to obtain medical information. Few practice Web sites provide services beyond information about the clinic and common medical diseases. We surveyed computer-using patients at 4 family medicine clinics in Denver, Colorado, by assessing their desire for Internet services from their providers. Patients were especially interested in getting e-mail reminders about appointments, online booking of appointments in real time, and receiving updates about new advances in treatment. Patients were also interested in virtual visits for simple and chronic medical problems and for following chronic conditions through virtual means. We concluded that computer-using patients desire Internet services to augment their medical care. As growth and communication via the Internet continue, primary care physicians should move more aggressively toward adding services to their practices’ Internet Web sites beyond the simple provision of information.
Patients are increasingly using the Internet to obtain medical information. A recent Harris poll estimated that 98 million Americans have retrieved health-related information online, an increase of 44 million since 1998.1 Previous studies examined patients’ subjective ratings2 of medical information sites and assessed the quality of medical information available through the World Wide Web.3 However, very little research has been published regarding patients’ interest in “e-health” services.4,5 The health care industry lags far behind other industries in terms of providing useful Internet services for the consumer.
We hypothesized that computer-using patients were interested in using the current and potential future services of Web-based technology to augment their care through clinic-based Web sites. The purpose of this study was to specifically determine the interests and needs of computer-using patients in clinic Web services beyond informational services alone.
Methods
An anonymous survey was given to a convenience sample of patients from 4 Denver Family Medicine clinics, with each surveying anywhere from 40 to 110 patients. The clinical sites used in this survey were socioeconomically diverse and included 1 community-based residency clinic, 1 university-based residency clinic, and 2 health maintenance organization clinics. A total of 600 surveys were distributed. Patient surveys were placed at the front desk, where the personnel were requested to ask patients to complete this volunteer survey. Computer and noncomputer users were asked to take the survey and their computer-using status was noted on the survey. Surveys were completed during the visit and returned to the front desk for collection. The surveys represented visits in these clinics from July 2000 to November 2000. This anonymous survey assessed patient demographics, Internet use, and patients’ interest in Internet services. Preferences for 22 Internet services were assessed on a Likert scale of 1 (definitely would not use) to 10 (definitely would use).
Data were analyzed using SPSS version 10 for Windows (SPSS Inc., Chicago, IL). Only computer users were included in the final calculations because of the very small percentage of noncomputer users (7.4%) who volunteered to take the survey. Frequencies were used to describe the computer-using survey respondents, their use of computers, and their preferences for Web-based services. Tests were used to evaluate significant variations among the survey respondents.
Results
Of 600 surveys, 227 were returned (37.8%). Most respondents were female (66.3%) with a mean age of 44.7 years. The vast majority of those who responded to this survey owned computers at home (90.0%) and/or had them at work (83.7%); 44.5% were college graduates and 52.1% had chronic medical conditions. Data on patients’ current use of the Internet are shown in Table 1.
Patient’s desires for Web-based services are summarized in Table 2. Patients displayed a strong interest in front desk services such as being able to book appointments in real time (mean Likert score, 8.50) over the Internet and getting e-mail reminders about appointments (mean Likert score, 8.61). Back office services ranking high included requesting medication refills online (mean Likert score, 8.47) to requesting a referral (mean Likert score, 8.26). The ability to send a message to “your doctor” also ranked high (mean Likert score, 8.40). There was relatively little interest in taking a virtual tour of the clinic (mean Likert score, 6.26) or having a page of links to health insurance company Web sites (mean Likert score, 6.73).
Patients displayed moderate interest in virtual visits (a patient-to-physician encounter conducted using the Internet alone), with 66.0% showing interest in a virtual visit for a simple medical problem. A slightly lower percentage (57.7%) was interested in a virtual visit for a chronic medical problem. Approximately a third of patients (32.6%) was more interested in a real-time virtual visit that used a personal computer (PC) videoconference rather than a real-time e-mail conversation (ie, “chat room” or one-on-one “chat”). Not surprisingly, a larger percentage of patients was more willing to make a virtual visit if it offered a lower co-payment (62%). Only 46.7% of patients indicated they would be interested in a virtual visit if it required the usual co-payment.
Interest in virtual visits for simple medical problems was higher among patients who had previously used the Internet to order products online (74.6% vs 45.0%, P < .001). Patients with chronic diseases were more likely to be interested in virtual visits for simple medical problems (70.8% vs 62.2%, P = .213), although this association was not statistically significant. A higher education level was associated with obtaining medical information over the Internet. College graduates were more likely than nongraduates to have used the Internet to obtain medical information (50% vs 33.6%, P < .05).
TABLE 1
Internet use among computer-using patients
| Type of use | % |
|---|---|
| Internet used at least once | 93.8 |
| E-mail used as a means of communication | 90.0 |
| Hours of Internet use each week | |
| 0–4 | 38.4 |
| 5–8 | 25.8 |
| 9–12 | 18.2 |
| 13–16 | 3.0 |
| >16 | 14.6 |
| Have used the Internet to order online | 69.2 |
| Have used the Internet to pay bills online | 19.1 |
| Have used the Internet to obtain medical information | 58.4 |
TABLE 2
Internet services desired by computer-using patients
| Service | Mean Likert score* |
|---|---|
| Receive e-mail reminders about appointments | 8.61 |
| Receive updates about advances in treatment | 8.56 |
| Make an appointment online with immediate confirmation | 8.50 |
| Obtain prescription refills | 8.47 |
| Send a message to your doctor | 8.40 |
| Look at your medical records through a secure site | 8.32 |
| Obtain a referral | 8.26 |
| Receive e-mail reminders about upcoming health services | 8.22 |
| Receive e-mail reminders about upcoming clinic services | 8.14 |
| View immunization records | 8.04 |
| Complete registration/reason for visit online | 8.00 |
| Send updates on health/condition to your doctor | 7.97 |
| Communicate with provider regularly about chronic disease | 7.90 |
| Send requests for medical record release | 7.88 |
| Send feedback/suggestions to clinic | 7.83 |
| Obtain recommendations on good patient education sites | 7.48 |
| Request an appointment by e-mail, receive response within 24 h | 7.46 |
| Send a message to billing | 7.45 |
| Obtain specific directions and map to clinic | 6.75 |
| Use a computer in the clinic waiting room for medical information | 6.74 |
| Obtain links to health insurance company Web sites | 6.73 |
| Take a virtual tour of the clinic or hospital | 6.26 |
| *Likert scale: from 1 (least important) to 10 (most important). | |
Discussion
Patients who used computers and the Internet showed significant interest in using Web-based services from their family physicians. These patients were especially interested in using the Internet for front desk services and common tasks, which are frequently provided over a busy telephone line. Services related to providing information were of less interest, and patients displayed only moderate interest in virtual visits. Using PC videoconferencing instead of e-mail communication would increase patients’ interest in a virtual visit. Poor videoconferencing capability over PCs, lack of access, or perhaps a fear of insufficient security over Web-based communications might limit interest.6-8
The survey had several limitations. As noted, only 7.4% of noncomputer users took the survey when requested by front desk staff. Therefore, we limited our analysis to computer-using patients. However, given the current statistics of Internet use and growth in access to all sectors of our population, it is likely that most practices will find a sufficient percentage of “connected” patients to apply the study’s findings. Assessment of online use at a specific clinic site will be useful in prioritizing the need and application of Internet services. The low response rate of our survey is likely due to the voluntary nature of the survey and the challenge of the front desk staff in finding time to encourage patients to take the survey. The practices that participated were busy ones that must move patients in a timely fashion from the front desk area to examination rooms.
Businesses with many employees who use e-commerce and banking services may especially benefit from signing up with a practice that offers online services. Patients with chronic diseases usually require more frequent visits with their physicians. We hope that patients with chronic disease will take advantage of “virtual visits” as they become available, thereby freeing them from transportation costs, lost time, and productivity.
Other desired services such as online appointment scheduling, medication refills, and referral requests might improve the efficiency in front and back office functions by reducing the number of lengthy telephone calls. We hope to perform future studies that evaluate the impact of Internet services on efficiency and patient/provider satisfaction.
Physicians should place a high priority on building service components into their practice Web sites. Interfacing these Web-based services with electronic medical records is another important task that needs further programmer development and attention by physicians. We hope that continued research in e-health care will further catalyze technologic developments that improve disease management, increase practice efficiency and patient satisfaction, and reduce medical errors.
Acknowledgments
The authors thank Lu Sandoval and Coline Bublitz for their help in preparing the data. They also thank Richard Drexilius, MD, at the Swedish Family Medicine Center; Manoj Pawar, MD, at the Exempla Family Medicine Center; and Carl Severin, MD, at the Kaiser Centerpointe Clinic for allowing the authors to perform the survey at their facilities. Special thanks to Perry Dickinson, MD, for his editorial assistance.
1. Taylor H. Explosive growth of “cyberchondriacs” continues. New York: Harris Interactive; August 11, 2000. Available at: http://www.harrisinteractive.com/harris_poll/index.asp?PID=104. Accessed April 7, 2002.
2. Helwig AL, Lovelle A, Guse CE, Gottlieb MS. An office based Internet patient education system: a pilot study. J Fam Pract 1999;48:123-7.
3. Sandvik H. Health information and interaction on the Internet: a survey of female urinary incontinence. BMJ [serial online] 1999;319(7201):29-32. Available at: http://www.bmj.com. Accessed January 12, 2002.
4. Coiera E. Information epidemics, economics, and immunity on the Internet: we still know so little about the effect of information on public health. BMJ [serial online] 1998;317(7171):1469-70.Available at: http://www.bmj.com/. Accessed January 12, 2002.
5. McGinnis J. The ehealth landscape: a terrain map of emerging information and communication technologies in health and health care [Acrobat document]. Princeton, NJ: The Robert Wood Johnson Foundation; 2001:14. Available at: http://www.rwjf.org/app/rw_publications_and_links/publicationsPdfs/eHealth.pdf. Accessed April 7, 2002.
6. California HealthCare Foundation and the Internet Healthcare Coalition. Ethics survey of consumer attitudes about health Websites. Oakland, CA: California HealthCare Foundation; January, 2000. Available at: http://ehealth.chcf.org/view.cfm?section=Consumer&itemID=1740. Accessed January 12, 2002.
7. Patrick JR. Gallup survey finds most Americans shun using Internet for personal health information. Turlock, CA: MedicAlert Foundation; November 13, 2000. Available at: http://www.medicalert.org/blue/pressreleases/galluprelease.asp. Accessed April 7, 2002.
8. Sanborn G. Online healthcare consumers focused on privacy. New York: Cyber Dialogue; July 12, 2000. Available online from fulcrum analytics at: http://www.cyberdialogue.com/news/releases/2000/07-12-cch-privacy.html. Accessed April 7, 2002.
- Computer-using patients desire Web-based services to augment their care.
- Practice Web sites should be designed to go beyond information alone and incorporate services such as online appointments.
- Physicians should consider providing “virtual visits” to assist with disease management.
Patients are increasingly using the Internet to obtain medical information. Few practice Web sites provide services beyond information about the clinic and common medical diseases. We surveyed computer-using patients at 4 family medicine clinics in Denver, Colorado, by assessing their desire for Internet services from their providers. Patients were especially interested in getting e-mail reminders about appointments, online booking of appointments in real time, and receiving updates about new advances in treatment. Patients were also interested in virtual visits for simple and chronic medical problems and for following chronic conditions through virtual means. We concluded that computer-using patients desire Internet services to augment their medical care. As growth and communication via the Internet continue, primary care physicians should move more aggressively toward adding services to their practices’ Internet Web sites beyond the simple provision of information.
Patients are increasingly using the Internet to obtain medical information. A recent Harris poll estimated that 98 million Americans have retrieved health-related information online, an increase of 44 million since 1998.1 Previous studies examined patients’ subjective ratings2 of medical information sites and assessed the quality of medical information available through the World Wide Web.3 However, very little research has been published regarding patients’ interest in “e-health” services.4,5 The health care industry lags far behind other industries in terms of providing useful Internet services for the consumer.
We hypothesized that computer-using patients were interested in using the current and potential future services of Web-based technology to augment their care through clinic-based Web sites. The purpose of this study was to specifically determine the interests and needs of computer-using patients in clinic Web services beyond informational services alone.
Methods
An anonymous survey was given to a convenience sample of patients from 4 Denver Family Medicine clinics, with each surveying anywhere from 40 to 110 patients. The clinical sites used in this survey were socioeconomically diverse and included 1 community-based residency clinic, 1 university-based residency clinic, and 2 health maintenance organization clinics. A total of 600 surveys were distributed. Patient surveys were placed at the front desk, where the personnel were requested to ask patients to complete this volunteer survey. Computer and noncomputer users were asked to take the survey and their computer-using status was noted on the survey. Surveys were completed during the visit and returned to the front desk for collection. The surveys represented visits in these clinics from July 2000 to November 2000. This anonymous survey assessed patient demographics, Internet use, and patients’ interest in Internet services. Preferences for 22 Internet services were assessed on a Likert scale of 1 (definitely would not use) to 10 (definitely would use).
Data were analyzed using SPSS version 10 for Windows (SPSS Inc., Chicago, IL). Only computer users were included in the final calculations because of the very small percentage of noncomputer users (7.4%) who volunteered to take the survey. Frequencies were used to describe the computer-using survey respondents, their use of computers, and their preferences for Web-based services. Tests were used to evaluate significant variations among the survey respondents.
Results
Of 600 surveys, 227 were returned (37.8%). Most respondents were female (66.3%) with a mean age of 44.7 years. The vast majority of those who responded to this survey owned computers at home (90.0%) and/or had them at work (83.7%); 44.5% were college graduates and 52.1% had chronic medical conditions. Data on patients’ current use of the Internet are shown in Table 1.
Patient’s desires for Web-based services are summarized in Table 2. Patients displayed a strong interest in front desk services such as being able to book appointments in real time (mean Likert score, 8.50) over the Internet and getting e-mail reminders about appointments (mean Likert score, 8.61). Back office services ranking high included requesting medication refills online (mean Likert score, 8.47) to requesting a referral (mean Likert score, 8.26). The ability to send a message to “your doctor” also ranked high (mean Likert score, 8.40). There was relatively little interest in taking a virtual tour of the clinic (mean Likert score, 6.26) or having a page of links to health insurance company Web sites (mean Likert score, 6.73).
Patients displayed moderate interest in virtual visits (a patient-to-physician encounter conducted using the Internet alone), with 66.0% showing interest in a virtual visit for a simple medical problem. A slightly lower percentage (57.7%) was interested in a virtual visit for a chronic medical problem. Approximately a third of patients (32.6%) was more interested in a real-time virtual visit that used a personal computer (PC) videoconference rather than a real-time e-mail conversation (ie, “chat room” or one-on-one “chat”). Not surprisingly, a larger percentage of patients was more willing to make a virtual visit if it offered a lower co-payment (62%). Only 46.7% of patients indicated they would be interested in a virtual visit if it required the usual co-payment.
Interest in virtual visits for simple medical problems was higher among patients who had previously used the Internet to order products online (74.6% vs 45.0%, P < .001). Patients with chronic diseases were more likely to be interested in virtual visits for simple medical problems (70.8% vs 62.2%, P = .213), although this association was not statistically significant. A higher education level was associated with obtaining medical information over the Internet. College graduates were more likely than nongraduates to have used the Internet to obtain medical information (50% vs 33.6%, P < .05).
TABLE 1
Internet use among computer-using patients
| Type of use | % |
|---|---|
| Internet used at least once | 93.8 |
| E-mail used as a means of communication | 90.0 |
| Hours of Internet use each week | |
| 0–4 | 38.4 |
| 5–8 | 25.8 |
| 9–12 | 18.2 |
| 13–16 | 3.0 |
| >16 | 14.6 |
| Have used the Internet to order online | 69.2 |
| Have used the Internet to pay bills online | 19.1 |
| Have used the Internet to obtain medical information | 58.4 |
TABLE 2
Internet services desired by computer-using patients
| Service | Mean Likert score* |
|---|---|
| Receive e-mail reminders about appointments | 8.61 |
| Receive updates about advances in treatment | 8.56 |
| Make an appointment online with immediate confirmation | 8.50 |
| Obtain prescription refills | 8.47 |
| Send a message to your doctor | 8.40 |
| Look at your medical records through a secure site | 8.32 |
| Obtain a referral | 8.26 |
| Receive e-mail reminders about upcoming health services | 8.22 |
| Receive e-mail reminders about upcoming clinic services | 8.14 |
| View immunization records | 8.04 |
| Complete registration/reason for visit online | 8.00 |
| Send updates on health/condition to your doctor | 7.97 |
| Communicate with provider regularly about chronic disease | 7.90 |
| Send requests for medical record release | 7.88 |
| Send feedback/suggestions to clinic | 7.83 |
| Obtain recommendations on good patient education sites | 7.48 |
| Request an appointment by e-mail, receive response within 24 h | 7.46 |
| Send a message to billing | 7.45 |
| Obtain specific directions and map to clinic | 6.75 |
| Use a computer in the clinic waiting room for medical information | 6.74 |
| Obtain links to health insurance company Web sites | 6.73 |
| Take a virtual tour of the clinic or hospital | 6.26 |
| *Likert scale: from 1 (least important) to 10 (most important). | |
Discussion
Patients who used computers and the Internet showed significant interest in using Web-based services from their family physicians. These patients were especially interested in using the Internet for front desk services and common tasks, which are frequently provided over a busy telephone line. Services related to providing information were of less interest, and patients displayed only moderate interest in virtual visits. Using PC videoconferencing instead of e-mail communication would increase patients’ interest in a virtual visit. Poor videoconferencing capability over PCs, lack of access, or perhaps a fear of insufficient security over Web-based communications might limit interest.6-8
The survey had several limitations. As noted, only 7.4% of noncomputer users took the survey when requested by front desk staff. Therefore, we limited our analysis to computer-using patients. However, given the current statistics of Internet use and growth in access to all sectors of our population, it is likely that most practices will find a sufficient percentage of “connected” patients to apply the study’s findings. Assessment of online use at a specific clinic site will be useful in prioritizing the need and application of Internet services. The low response rate of our survey is likely due to the voluntary nature of the survey and the challenge of the front desk staff in finding time to encourage patients to take the survey. The practices that participated were busy ones that must move patients in a timely fashion from the front desk area to examination rooms.
Businesses with many employees who use e-commerce and banking services may especially benefit from signing up with a practice that offers online services. Patients with chronic diseases usually require more frequent visits with their physicians. We hope that patients with chronic disease will take advantage of “virtual visits” as they become available, thereby freeing them from transportation costs, lost time, and productivity.
Other desired services such as online appointment scheduling, medication refills, and referral requests might improve the efficiency in front and back office functions by reducing the number of lengthy telephone calls. We hope to perform future studies that evaluate the impact of Internet services on efficiency and patient/provider satisfaction.
Physicians should place a high priority on building service components into their practice Web sites. Interfacing these Web-based services with electronic medical records is another important task that needs further programmer development and attention by physicians. We hope that continued research in e-health care will further catalyze technologic developments that improve disease management, increase practice efficiency and patient satisfaction, and reduce medical errors.
Acknowledgments
The authors thank Lu Sandoval and Coline Bublitz for their help in preparing the data. They also thank Richard Drexilius, MD, at the Swedish Family Medicine Center; Manoj Pawar, MD, at the Exempla Family Medicine Center; and Carl Severin, MD, at the Kaiser Centerpointe Clinic for allowing the authors to perform the survey at their facilities. Special thanks to Perry Dickinson, MD, for his editorial assistance.
1. Taylor H. Explosive growth of “cyberchondriacs” continues. New York: Harris Interactive; August 11, 2000. Available at: http://www.harrisinteractive.com/harris_poll/index.asp?PID=104. Accessed April 7, 2002.
2. Helwig AL, Lovelle A, Guse CE, Gottlieb MS. An office based Internet patient education system: a pilot study. J Fam Pract 1999;48:123-7.
3. Sandvik H. Health information and interaction on the Internet: a survey of female urinary incontinence. BMJ [serial online] 1999;319(7201):29-32. Available at: http://www.bmj.com. Accessed January 12, 2002.
4. Coiera E. Information epidemics, economics, and immunity on the Internet: we still know so little about the effect of information on public health. BMJ [serial online] 1998;317(7171):1469-70.Available at: http://www.bmj.com/. Accessed January 12, 2002.
5. McGinnis J. The ehealth landscape: a terrain map of emerging information and communication technologies in health and health care [Acrobat document]. Princeton, NJ: The Robert Wood Johnson Foundation; 2001:14. Available at: http://www.rwjf.org/app/rw_publications_and_links/publicationsPdfs/eHealth.pdf. Accessed April 7, 2002.
6. California HealthCare Foundation and the Internet Healthcare Coalition. Ethics survey of consumer attitudes about health Websites. Oakland, CA: California HealthCare Foundation; January, 2000. Available at: http://ehealth.chcf.org/view.cfm?section=Consumer&itemID=1740. Accessed January 12, 2002.
7. Patrick JR. Gallup survey finds most Americans shun using Internet for personal health information. Turlock, CA: MedicAlert Foundation; November 13, 2000. Available at: http://www.medicalert.org/blue/pressreleases/galluprelease.asp. Accessed April 7, 2002.
8. Sanborn G. Online healthcare consumers focused on privacy. New York: Cyber Dialogue; July 12, 2000. Available online from fulcrum analytics at: http://www.cyberdialogue.com/news/releases/2000/07-12-cch-privacy.html. Accessed April 7, 2002.
Reasons for after-hours calls
- High utilizers (6 or more calls per year) represented 0.6% of active patients but accounted for 23% of calls.
- The most common reasons for after-hours calls were medication refills and concerns, pain, issues of pregnant patients, and fever.
- The number of after-hours calls peaked in the spring and summer, and doubled on Saturdays.
Previous studies of after-hours calls to family physicians focused on caller demographics, medical triage skills, and patient satisfaction, and were usually conducted for a limited time. We examined the frequency and nature of calls to a family practice residency over 1 year. Caller and patient information, date, time, and chief complaint were obtained from answering service logs. The 5 most frequent chief complaints related to medications, pain, obstetric issues, fever, and nausea. Interestingly, 56 “high utilizers” (0.6% of all patients) accounted for 23% of the calls.
Although telephone calls may account for 10% to 25% of all patient contacts,1,2 few studies have examined the frequency and nature of these calls over an extended time. A month-long study3 found that patients who telephoned after hours were 3 times more likely to rate their problem in the highest severity category compared with the physician’s rating of the problem. This study, done in July, may not reflect the diversity of patient problems, because of seasonal variations; also, it did not appear to include obstetric problems, which are a prominent reason for calls to family practice physicians.4,5 Many physician groups use answering services to screen calls as a method for decreasing the number of calls. The purpose of this study was to document the frequency and nature of after-hours calls to a family practice office over 1 year.
METHODS
All after-hours telephone calls (5 PM to 8 AM, weekends and holidays) made to a freestanding community-based family practice training program were collected for the 12-month period between April 2000 and March 2001. A recorded message directed the caller to call 911 for a life-threatening emergency or stay on the line for operator assistance. Emergency calls were forwarded to the resident physician on call. Sixteen family medicine residents supported by 8 faculty physicians took primary calls on a rotating basis. The practice had approximately 9000 active patients (at least 1 visit in the last 3 years), and about 1350 patient visits per month. Approximately 30% were covered by Medicaid, 10% by Medicare, 35% by managed care, and 12% by indemnity insurance; 13% were uninsured.
The operator recorded date and time, caller’s and patient’s first and last names, primary care physician, patient’s pregnancy status, date of last office visit, chief complaint(s), and whether the caller felt the situation was an emergency.
Previous studies variously classified patient calls based on diagnostic group, chief complaint, symptom, treatment and medication, injury, and organ system affected.1,3,6-10 We followed the lead of Benjamin8and Perkins and colleagues,1 who used the patient’s chief complaint to categorize calls. We classified the patient’s chief complaint by searching for key words such as “heart” (eg, “fast heartbeat,” “pains near heart,” or “isn’t feeling well, heart failure a couple of years ago”). This allowed for the broad inclusion of chief complaints while avoiding the risk of premature diagnosis.
A research assistant entered information from the operator’s records into a Microsoft Access Database. Patients who called more than 6 times after hours during the year were arbitrarily defined as “high utilizers.” We also gathered data on these callers’ hospital emergency room visits and admissions to affiliated hospitals. The HealthOne Institutional Review Board approved the study.
RESULTS
A total of 3538 calls were made by 1564 patients; 2465 were clinical calls, and key words or phrases were used to classify them under chief complaint headings. If a caller had a multiple-symptom complaint (ie, fever and headache), it was classified under all appropriate headings and counted twice. The total number of complaints is therefore higher than the total number of calls. Table 1 presents the frequency and percentage of after-hours clinical calls for all subjects, and separately for high utilizers. Table 2 presents the average number of clinical calls organized by season and day of the week. Thirty-three percent of all calls were made by the patient, 31% by a proxy (spouse, parent, friend), and 36% by other parties (nurse, pharmacy, unidentified party).
Although the rankings of calls for all patients and high utilizers in Table 1 were similar, several differences stand out. High utilizers account for only 0.6% of patients, but 23% of all calls. High utilizers called substantially more for complaints relating to medication, pain, asthma/breathing and chest problems; 39% of their calls were for medication or pain concerns. Of the high utilizers, 39% (22/56) made 46 emergency room visits, but only 7% (4/56) were hospitalized during the year.
TABLE 1
Percentage of after-hours calls, by chief complaint
| Number of complaints (%)* | ||
|---|---|---|
| Chief complaint | All subjects except utilizers (n = 1564) | High utilizers (n = 56) |
| Medication | 288 (15.1) | 110 (19.7) |
| Pain | 197 (10.3) | 107 (19.1) |
| Obstetric† | 195 (10.2) | 32 (5.7) |
| Fever | 191 (10.0) | 28 (5.0) |
| Nausea/vomiting | 108 (5.7) | 31 (5.5) |
| Blood/bleeding | 84 (4.4) | 32 (5.7) |
| Infection | 72 (3.8) | 24 (4.3) |
| Stomach | 70 (3.7) | 16 (2.9) |
| Headache/migraine | 67 (3.2) | 19 (3.4) |
| Asthma/breathing | 58 (3.0) | 32 (5.7) |
| Back | 55 (2.9) | 16 (2.9) |
| Laboratory results | 54 (2.8) | 8 (1.4) |
| Cough | 46 (2.4) | 6 (1.1) |
| Eye | 42 (2.2) | 8 (1.4) |
| Diarrhea | 41 (2.2) | 7 (1.2) |
| Throat | 38 (2.0) | 6 (1.1) |
| Fall | 36 (1.9) | 10 (1.8) |
| Rash | 34 (1.8) | 3 (0.5) |
| Ear | 33 (1.7) | 7 (1.2) |
| Chest | 30 (1.6) | 19 (3.4) |
| Total of top 20 complaints | 1739 | 521 |
| All other complaints | 625 (32.7) | 184 (32.9) |
| Total complaints | 2364 | 705 |
| Total calls | 1906 | 559 |
| Multiple complaint calls | 458 (24.0) | 146 (26.1) |
| Average calls per subject | 1.3 | 10.0 |
| *Information-only calls (n = 1073) not included. | ||
| †Includes nonobstetric problems in pregnant patients. | ||
TABLE 2
Average number of clinical calls by season and day of week
| Season | Mon | Tue | Wed | Thur | Fri | Sat | Sun | Seasonal average |
|---|---|---|---|---|---|---|---|---|
| Winter (Dec–Feb) | 8.9 | 8.7 | 6.1 | 8.1 | 9.1 | 16.6 | 11.5 | 9.9 |
| Spring (March–May) | 10.0 | 8.5 | 8.2 | 8.5 | 8.2 | 16.2 | 13.6 | 10.4 |
| Summer (Jun–Aug) | 12.5 | 8.8 | 8.8 | 8.8 | 8.2 | 15.5 | 12.0 | 10.6 |
| Fall (Sep–Nov) | 9.1 | 6.5 | 8.4 | 6.7 | 8.4 | 12.3 | 9.0 | 8.6 |
| Daily average | 10.1 | 8.1 | 7.8 | 8.0 | 8.5 | 15.6 | 11.5 |
DISCUSSION
This study expands on previous work by describing the total variety of after-hours phone calls to a family practice office over an entire year. Our findings on reasons for call, time of call, and demographics are similar to those of previous work.3,10 However, our study is one of the first to describe the subset of high utilizers. Introducing a patient health handbook, practice Web site, pharmacy help line, or other practice management tools might reduce the number of “information only” calls. Contrary to our expectation, the highest numbers of average daily calls were in the spring and summer and not in the winter. Saturdays and Sundays were the busiest days of the week for such calls.
Patients called for diverse clinical reasons (Table 1) and therefore physicians might focus their attention on the most frequent reasons for calls, in order to improve the effectiveness of their educational efforts. For example, physicians might discuss the patient’s medication concerns, give specific recommendations to talk to the pharmacist, and possibly offer an automated medication “tracking system” to alert patients during the week when their medications were running out, as a way of reducing the number of calls and allaying patient concerns.
Pain symptoms clearly account for a substantial number of calls. Although some of these calls might be serious emergencies (chest pain) and require immediate action, other calls, such as for migraine headaches, may point to a need to educate and set limits with patients during their regular appointments. For example, patients could be told that migraine headaches are not a “life-threatening” emergency and be urged to use self-management strategies until the next day.
Discussing fever management with new parents at well-child visits might decrease future calls. There is some research to suggest that providing new parents with specific guidelines about when to call if their child has a fever can dramatically reduce after-hours visits to the emergency room.11 Obstetric calls represent an important group requiring immediate callback with very specific questions (eg, fetal movement, bleeding), and might be a target area for physician education.
Out of approximately 9000 patients in the practice and 1564 patients who called the practice during the year, we identified 56 high utilizers (0.6% of all patients). They averaged nearly 10 calls per year in contrast to 1.3 calls for all other callers. Future research might be directed at trying to determine why these patients feel a need to call at nearly 10 times the rate of other patients.
These findings should be interpreted in light of several limitations. Because our findings are based on a family practice residency, the patient population may be different from the typical private family practice office and have less continuity. However, the wide range of calls is likely to be typical of the diverse problems managed by family physicians. This study did not collect information on the management and disposition of these after-hours calls. Certainly, understanding the entire episode of after-hours contact (reason for call, management, outcome, satisfaction) is important, and is the next step in our research.
The diversity and seriousness of medical problems addressed by the after-hours physician highlight the need to provide specific training to physicians for dealing with patient calls and educating patients on the many issues leading to after-hours calls.
ACKNOWLEDGMENTS
The authors thank Ellie Jensen for help with data collection, entry, and analysis.
1. Perkins A, Gagnon R, deGruy F. A comparison of after-hours telephone calls concerning ambulatory and nursing home patients. J Fam Pract 1993;37:247-50.
2. Hannis MD, Hazard RL, Rothschild M, Elnicki DM, Keyserling TC, DeVellis RF. Physician attitudes regarding telephone medicine. J Gen Intern Med 1996;11:678-83.
3. Greenhouse D, Probst J. After hours telephone calls in a family practice residency: volume, seriousness and patient satisfaction. Fam Med 1995;27:525-30.
4. Spencer DC, Daugird AJ. The nature and content of physician telephone calls in private practice. J Fam Pract 1988;27:201-5.
5. Bergman JJ, Rosenblatt RA. After hours calls: a 5-year longitudinal study in a family practice group. J Fam Pract 1982;15:101-6.
6. Poole SR, Schmitt BD, Carruth T, Peterson-Smith A, Slusarski M. After-hours telephone coverage: the application of an area-wide telephone triage and advice system for pediatric practices. Pediatrics 1993;92:670-9.
7. Hildebrandt D, Nicholas D, Westfall J. The development of continuity of care and patient satisfaction in a family medicine residency: a 3 year longitudinal study. In preparation, 2001.
8. Benjamin JT. Pediatric residents’ telephone triage experience: relevant to general pediatric practice? Arch Pediatr Adolesc Med 1997;151:1254-7.
9. Crane JD, Benjamin JT. Pediatric residents’ telephone triage experience. Arch Pediatr Adolesc Med 2000;154:71-4.
10. Peters RM. After hours telephone calls to general and subspecialty internists: an observational study. J Gen Intern Med 1994;9:554-7.
11. O’Neill-Murphy K, Liebman M, Barnsteiner JH. Fever education: does it reduce parent fever anxiety? Pediatr Emerg Care 2001;17:47-51.
- High utilizers (6 or more calls per year) represented 0.6% of active patients but accounted for 23% of calls.
- The most common reasons for after-hours calls were medication refills and concerns, pain, issues of pregnant patients, and fever.
- The number of after-hours calls peaked in the spring and summer, and doubled on Saturdays.
Previous studies of after-hours calls to family physicians focused on caller demographics, medical triage skills, and patient satisfaction, and were usually conducted for a limited time. We examined the frequency and nature of calls to a family practice residency over 1 year. Caller and patient information, date, time, and chief complaint were obtained from answering service logs. The 5 most frequent chief complaints related to medications, pain, obstetric issues, fever, and nausea. Interestingly, 56 “high utilizers” (0.6% of all patients) accounted for 23% of the calls.
Although telephone calls may account for 10% to 25% of all patient contacts,1,2 few studies have examined the frequency and nature of these calls over an extended time. A month-long study3 found that patients who telephoned after hours were 3 times more likely to rate their problem in the highest severity category compared with the physician’s rating of the problem. This study, done in July, may not reflect the diversity of patient problems, because of seasonal variations; also, it did not appear to include obstetric problems, which are a prominent reason for calls to family practice physicians.4,5 Many physician groups use answering services to screen calls as a method for decreasing the number of calls. The purpose of this study was to document the frequency and nature of after-hours calls to a family practice office over 1 year.
METHODS
All after-hours telephone calls (5 PM to 8 AM, weekends and holidays) made to a freestanding community-based family practice training program were collected for the 12-month period between April 2000 and March 2001. A recorded message directed the caller to call 911 for a life-threatening emergency or stay on the line for operator assistance. Emergency calls were forwarded to the resident physician on call. Sixteen family medicine residents supported by 8 faculty physicians took primary calls on a rotating basis. The practice had approximately 9000 active patients (at least 1 visit in the last 3 years), and about 1350 patient visits per month. Approximately 30% were covered by Medicaid, 10% by Medicare, 35% by managed care, and 12% by indemnity insurance; 13% were uninsured.
The operator recorded date and time, caller’s and patient’s first and last names, primary care physician, patient’s pregnancy status, date of last office visit, chief complaint(s), and whether the caller felt the situation was an emergency.
Previous studies variously classified patient calls based on diagnostic group, chief complaint, symptom, treatment and medication, injury, and organ system affected.1,3,6-10 We followed the lead of Benjamin8and Perkins and colleagues,1 who used the patient’s chief complaint to categorize calls. We classified the patient’s chief complaint by searching for key words such as “heart” (eg, “fast heartbeat,” “pains near heart,” or “isn’t feeling well, heart failure a couple of years ago”). This allowed for the broad inclusion of chief complaints while avoiding the risk of premature diagnosis.
A research assistant entered information from the operator’s records into a Microsoft Access Database. Patients who called more than 6 times after hours during the year were arbitrarily defined as “high utilizers.” We also gathered data on these callers’ hospital emergency room visits and admissions to affiliated hospitals. The HealthOne Institutional Review Board approved the study.
RESULTS
A total of 3538 calls were made by 1564 patients; 2465 were clinical calls, and key words or phrases were used to classify them under chief complaint headings. If a caller had a multiple-symptom complaint (ie, fever and headache), it was classified under all appropriate headings and counted twice. The total number of complaints is therefore higher than the total number of calls. Table 1 presents the frequency and percentage of after-hours clinical calls for all subjects, and separately for high utilizers. Table 2 presents the average number of clinical calls organized by season and day of the week. Thirty-three percent of all calls were made by the patient, 31% by a proxy (spouse, parent, friend), and 36% by other parties (nurse, pharmacy, unidentified party).
Although the rankings of calls for all patients and high utilizers in Table 1 were similar, several differences stand out. High utilizers account for only 0.6% of patients, but 23% of all calls. High utilizers called substantially more for complaints relating to medication, pain, asthma/breathing and chest problems; 39% of their calls were for medication or pain concerns. Of the high utilizers, 39% (22/56) made 46 emergency room visits, but only 7% (4/56) were hospitalized during the year.
TABLE 1
Percentage of after-hours calls, by chief complaint
| Number of complaints (%)* | ||
|---|---|---|
| Chief complaint | All subjects except utilizers (n = 1564) | High utilizers (n = 56) |
| Medication | 288 (15.1) | 110 (19.7) |
| Pain | 197 (10.3) | 107 (19.1) |
| Obstetric† | 195 (10.2) | 32 (5.7) |
| Fever | 191 (10.0) | 28 (5.0) |
| Nausea/vomiting | 108 (5.7) | 31 (5.5) |
| Blood/bleeding | 84 (4.4) | 32 (5.7) |
| Infection | 72 (3.8) | 24 (4.3) |
| Stomach | 70 (3.7) | 16 (2.9) |
| Headache/migraine | 67 (3.2) | 19 (3.4) |
| Asthma/breathing | 58 (3.0) | 32 (5.7) |
| Back | 55 (2.9) | 16 (2.9) |
| Laboratory results | 54 (2.8) | 8 (1.4) |
| Cough | 46 (2.4) | 6 (1.1) |
| Eye | 42 (2.2) | 8 (1.4) |
| Diarrhea | 41 (2.2) | 7 (1.2) |
| Throat | 38 (2.0) | 6 (1.1) |
| Fall | 36 (1.9) | 10 (1.8) |
| Rash | 34 (1.8) | 3 (0.5) |
| Ear | 33 (1.7) | 7 (1.2) |
| Chest | 30 (1.6) | 19 (3.4) |
| Total of top 20 complaints | 1739 | 521 |
| All other complaints | 625 (32.7) | 184 (32.9) |
| Total complaints | 2364 | 705 |
| Total calls | 1906 | 559 |
| Multiple complaint calls | 458 (24.0) | 146 (26.1) |
| Average calls per subject | 1.3 | 10.0 |
| *Information-only calls (n = 1073) not included. | ||
| †Includes nonobstetric problems in pregnant patients. | ||
TABLE 2
Average number of clinical calls by season and day of week
| Season | Mon | Tue | Wed | Thur | Fri | Sat | Sun | Seasonal average |
|---|---|---|---|---|---|---|---|---|
| Winter (Dec–Feb) | 8.9 | 8.7 | 6.1 | 8.1 | 9.1 | 16.6 | 11.5 | 9.9 |
| Spring (March–May) | 10.0 | 8.5 | 8.2 | 8.5 | 8.2 | 16.2 | 13.6 | 10.4 |
| Summer (Jun–Aug) | 12.5 | 8.8 | 8.8 | 8.8 | 8.2 | 15.5 | 12.0 | 10.6 |
| Fall (Sep–Nov) | 9.1 | 6.5 | 8.4 | 6.7 | 8.4 | 12.3 | 9.0 | 8.6 |
| Daily average | 10.1 | 8.1 | 7.8 | 8.0 | 8.5 | 15.6 | 11.5 |
DISCUSSION
This study expands on previous work by describing the total variety of after-hours phone calls to a family practice office over an entire year. Our findings on reasons for call, time of call, and demographics are similar to those of previous work.3,10 However, our study is one of the first to describe the subset of high utilizers. Introducing a patient health handbook, practice Web site, pharmacy help line, or other practice management tools might reduce the number of “information only” calls. Contrary to our expectation, the highest numbers of average daily calls were in the spring and summer and not in the winter. Saturdays and Sundays were the busiest days of the week for such calls.
Patients called for diverse clinical reasons (Table 1) and therefore physicians might focus their attention on the most frequent reasons for calls, in order to improve the effectiveness of their educational efforts. For example, physicians might discuss the patient’s medication concerns, give specific recommendations to talk to the pharmacist, and possibly offer an automated medication “tracking system” to alert patients during the week when their medications were running out, as a way of reducing the number of calls and allaying patient concerns.
Pain symptoms clearly account for a substantial number of calls. Although some of these calls might be serious emergencies (chest pain) and require immediate action, other calls, such as for migraine headaches, may point to a need to educate and set limits with patients during their regular appointments. For example, patients could be told that migraine headaches are not a “life-threatening” emergency and be urged to use self-management strategies until the next day.
Discussing fever management with new parents at well-child visits might decrease future calls. There is some research to suggest that providing new parents with specific guidelines about when to call if their child has a fever can dramatically reduce after-hours visits to the emergency room.11 Obstetric calls represent an important group requiring immediate callback with very specific questions (eg, fetal movement, bleeding), and might be a target area for physician education.
Out of approximately 9000 patients in the practice and 1564 patients who called the practice during the year, we identified 56 high utilizers (0.6% of all patients). They averaged nearly 10 calls per year in contrast to 1.3 calls for all other callers. Future research might be directed at trying to determine why these patients feel a need to call at nearly 10 times the rate of other patients.
These findings should be interpreted in light of several limitations. Because our findings are based on a family practice residency, the patient population may be different from the typical private family practice office and have less continuity. However, the wide range of calls is likely to be typical of the diverse problems managed by family physicians. This study did not collect information on the management and disposition of these after-hours calls. Certainly, understanding the entire episode of after-hours contact (reason for call, management, outcome, satisfaction) is important, and is the next step in our research.
The diversity and seriousness of medical problems addressed by the after-hours physician highlight the need to provide specific training to physicians for dealing with patient calls and educating patients on the many issues leading to after-hours calls.
ACKNOWLEDGMENTS
The authors thank Ellie Jensen for help with data collection, entry, and analysis.
1. Perkins A, Gagnon R, deGruy F. A comparison of after-hours telephone calls concerning ambulatory and nursing home patients. J Fam Pract 1993;37:247-50.
2. Hannis MD, Hazard RL, Rothschild M, Elnicki DM, Keyserling TC, DeVellis RF. Physician attitudes regarding telephone medicine. J Gen Intern Med 1996;11:678-83.
3. Greenhouse D, Probst J. After hours telephone calls in a family practice residency: volume, seriousness and patient satisfaction. Fam Med 1995;27:525-30.
4. Spencer DC, Daugird AJ. The nature and content of physician telephone calls in private practice. J Fam Pract 1988;27:201-5.
5. Bergman JJ, Rosenblatt RA. After hours calls: a 5-year longitudinal study in a family practice group. J Fam Pract 1982;15:101-6.
6. Poole SR, Schmitt BD, Carruth T, Peterson-Smith A, Slusarski M. After-hours telephone coverage: the application of an area-wide telephone triage and advice system for pediatric practices. Pediatrics 1993;92:670-9.
7. Hildebrandt D, Nicholas D, Westfall J. The development of continuity of care and patient satisfaction in a family medicine residency: a 3 year longitudinal study. In preparation, 2001.
8. Benjamin JT. Pediatric residents’ telephone triage experience: relevant to general pediatric practice? Arch Pediatr Adolesc Med 1997;151:1254-7.
9. Crane JD, Benjamin JT. Pediatric residents’ telephone triage experience. Arch Pediatr Adolesc Med 2000;154:71-4.
10. Peters RM. After hours telephone calls to general and subspecialty internists: an observational study. J Gen Intern Med 1994;9:554-7.
11. O’Neill-Murphy K, Liebman M, Barnsteiner JH. Fever education: does it reduce parent fever anxiety? Pediatr Emerg Care 2001;17:47-51.