User login
Advanced Imaging Techniques Use in Giant Cell Arteritis Diagnosis: The Experience at Walter Reed National Military Medical Center
Advanced Imaging Techniques Use in Giant Cell Arteritis Diagnosis: The Experience at Walter Reed National Military Medical Center
Giant cell arteritis (GCA), the most commonly diagnosed systemic vasculitis, is a large- and medium-vessel vasculitis that can lead to significant morbidity due to aneurysm formation or vascular occlusion if not diagnosed in a timely manner.1,2 Diagnosis is typically based on clinical history and inflammatory markers. Laboratory inflammatory markers may be normal in the early stages of GCA but can be abnormal due to other unrelated reasons leading to a false positive diagnosis.3 Delayed treatment may lead to visual loss, jaw or limb claudication, or ischemic stroke.2 Initial treatment typically includes high-dose steroids that can lead to significant adverse reactions such as hypothalamic-pituitary-adrenal axis dysfunction, metabolic syndrome, premature atherosclerosis, and increased risk of infection.4-6
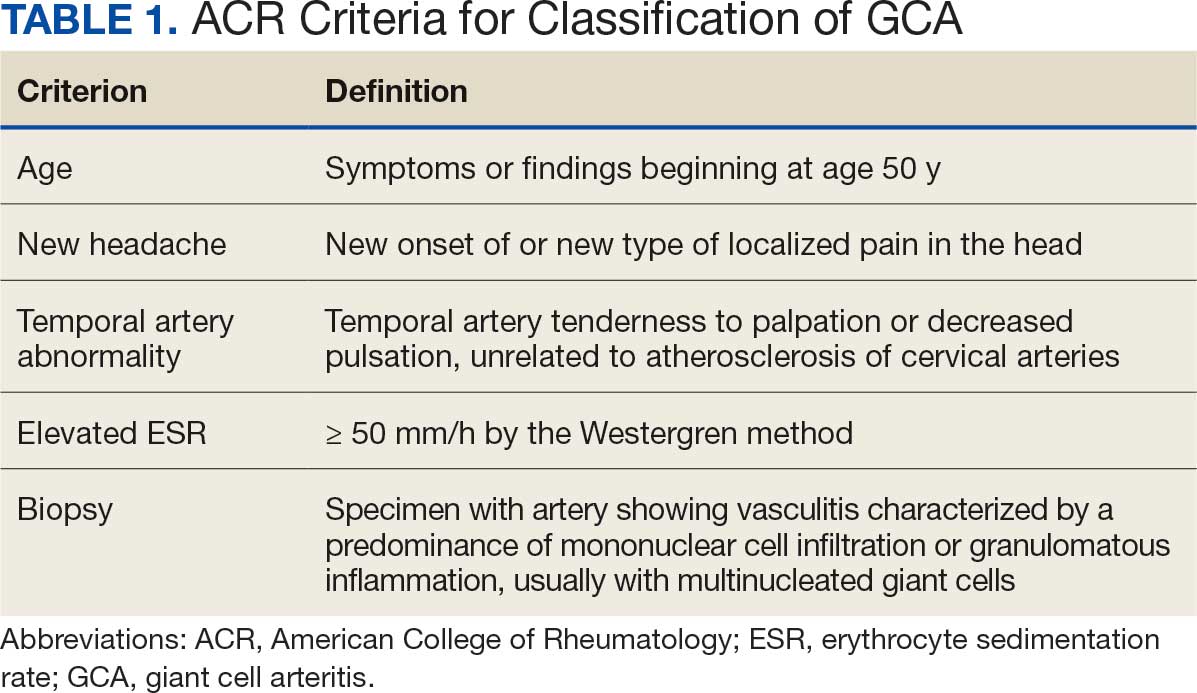
The 1990 American College of Rheumatology (ACR) criteria for GCA are widely recognized (Table 1).7 The criteria focuses on clinical manifestations, including new onset headache, temporal artery tenderness, age ≥ 50 years, erythrocyte sedimentation rate (ESR) ≥ 50 mm/hr, and temporal artery biopsy with positive anatomical findings.8 When 3 of the 5 1990 ACR criteria are present, the sensitivity and specificity is estimated to be > 90% for GCA vs alternative vasculitides.7
Although the 1990 ACR criteria do not include imaging, modalities such as ultrasound, computed tomography angiography (CTA), 18F-FDG positron emission tomography (PET), and magnetic resonance imaging (MRI)/magnetic resonance angiography (MRA) may be used in GCA diagnosis.8-10 These imaging modalities have been added to the proposed ACR classification criteria for GCA.11 For this updated point system standard, age ≥ 50 years is a requirement and includes a positive temporal artery biopsy or temporal artery halo sign on ultrasound (+5 points), an ESR ≥ 50 mm/h or C-reactive protein (CRP) ≥ 10 mg/L (+3 points), or sudden visual loss (+3 points). Scalp tenderness, jaw or tongue claudication, new temporal headache, morning stiffness in shoulders or neck, temporal artery abnormality on vascular examination, bilateral axillary vessel involvement on imaging, and 18F-FDG PET activity throughout the aorta are scored +2 points each. With these new criteria, a cumulative score ≥ 6 is classified as GCA. Diagnostic accuracy is further improved with imaging: ultrasonography (sensitivity 55% and specificity 95%) and 18F-FDG PET (sensitivity 69% and specificity 92%), CTA (sensitivity 71% and specificity 86%), and MRI/MRA (sensitivity 73% and specificity 88%).12-15
In recent years, clinicians have reported increased glucose uptake in arteries observed on PET imaging that suggests GCA.9,10,16-20 18F-FDG accumulates in cells with high metabolic activity rates, such as areas of inflammation. In assessing temporal arteries or other involved vasculature (eg, axillary or great vessels) for GCA, this modality indicates increased glucose uptake in the lining of vessel walls. The inflammation of vessel walls can then be visualized with PET. 18F-FDG PET presents a noninvasive imaging technique for evaluating GCA but its use has been limited in the United States due to its high cost.
Methods
Approval for a retrospective chart review of patients evaluated for suspected GCA was obtained from the Walter Reed National Military Medical Center (WRNMMC) Institutional Review Board. The review included patients who underwent diagnostic procedures such as ultrasound, MRI, CT angiogram, and PET studies from 2016 through 2022. International Classification of Diseases codes used for case identification included: M31.6, M31.5, I77.6, I77.8, I77.89, I67.7, and I68.2. The Current Procedural Terminology code used for temporal artery biopsy is 37609.
Results
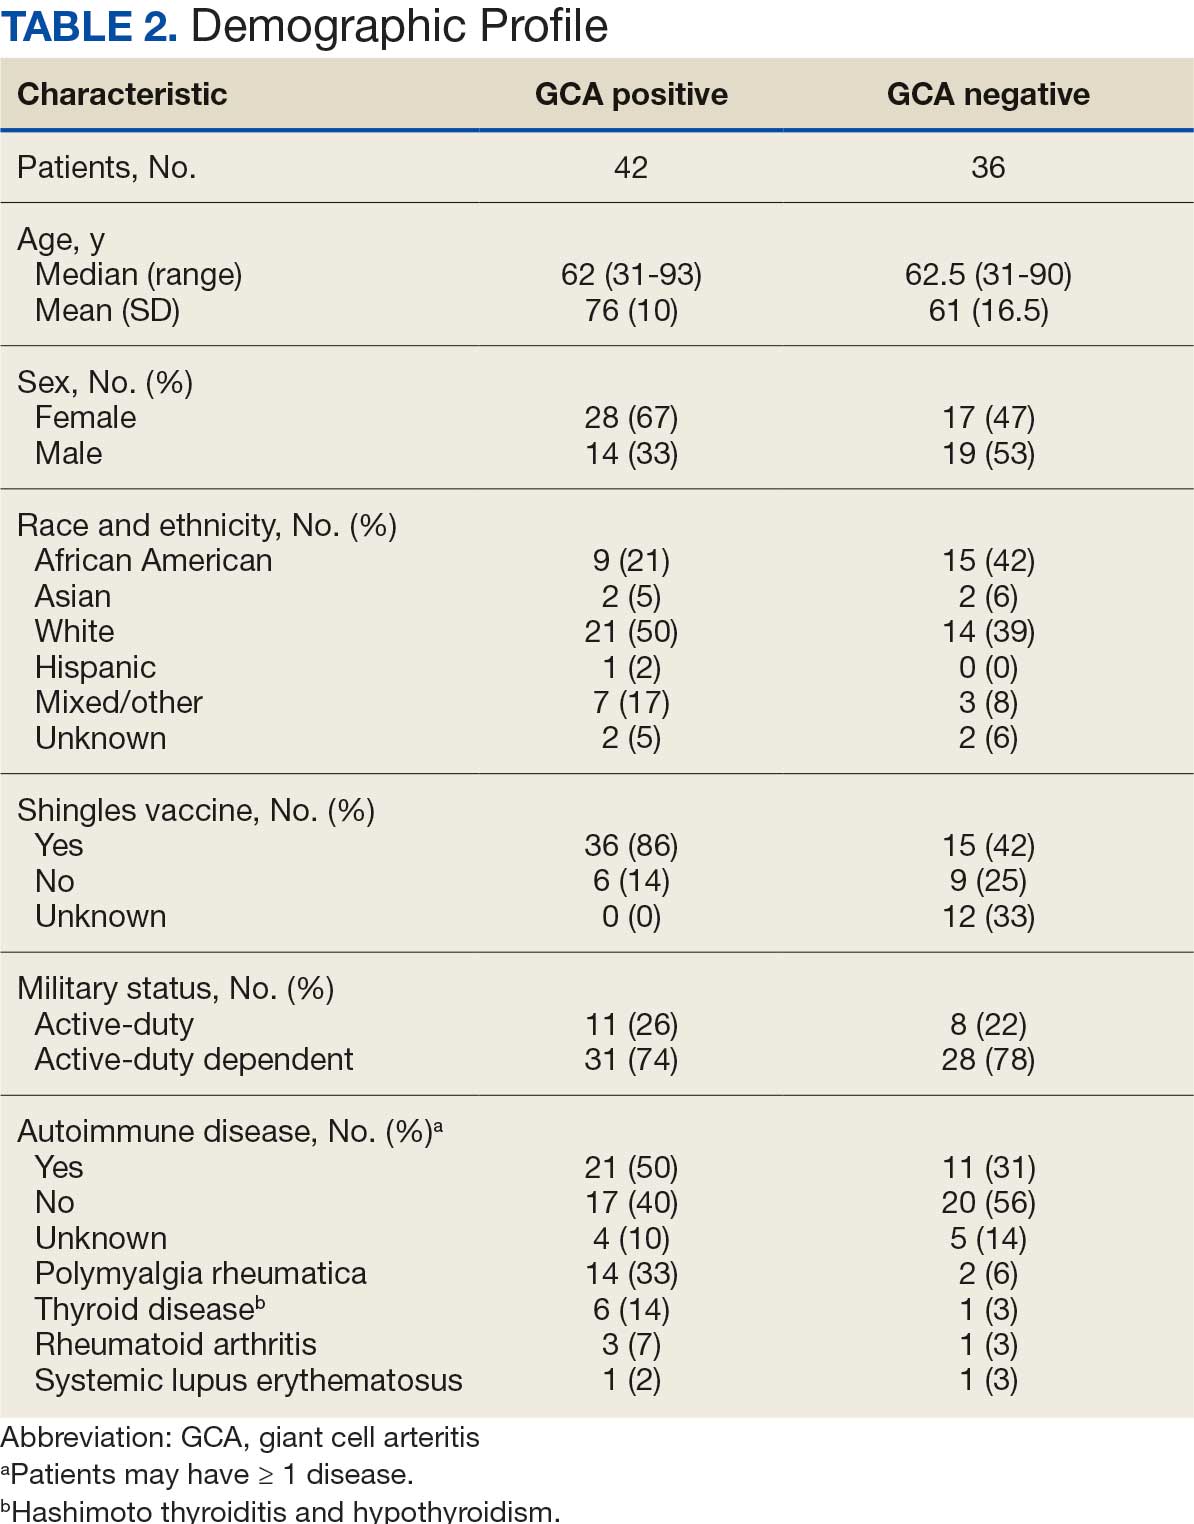
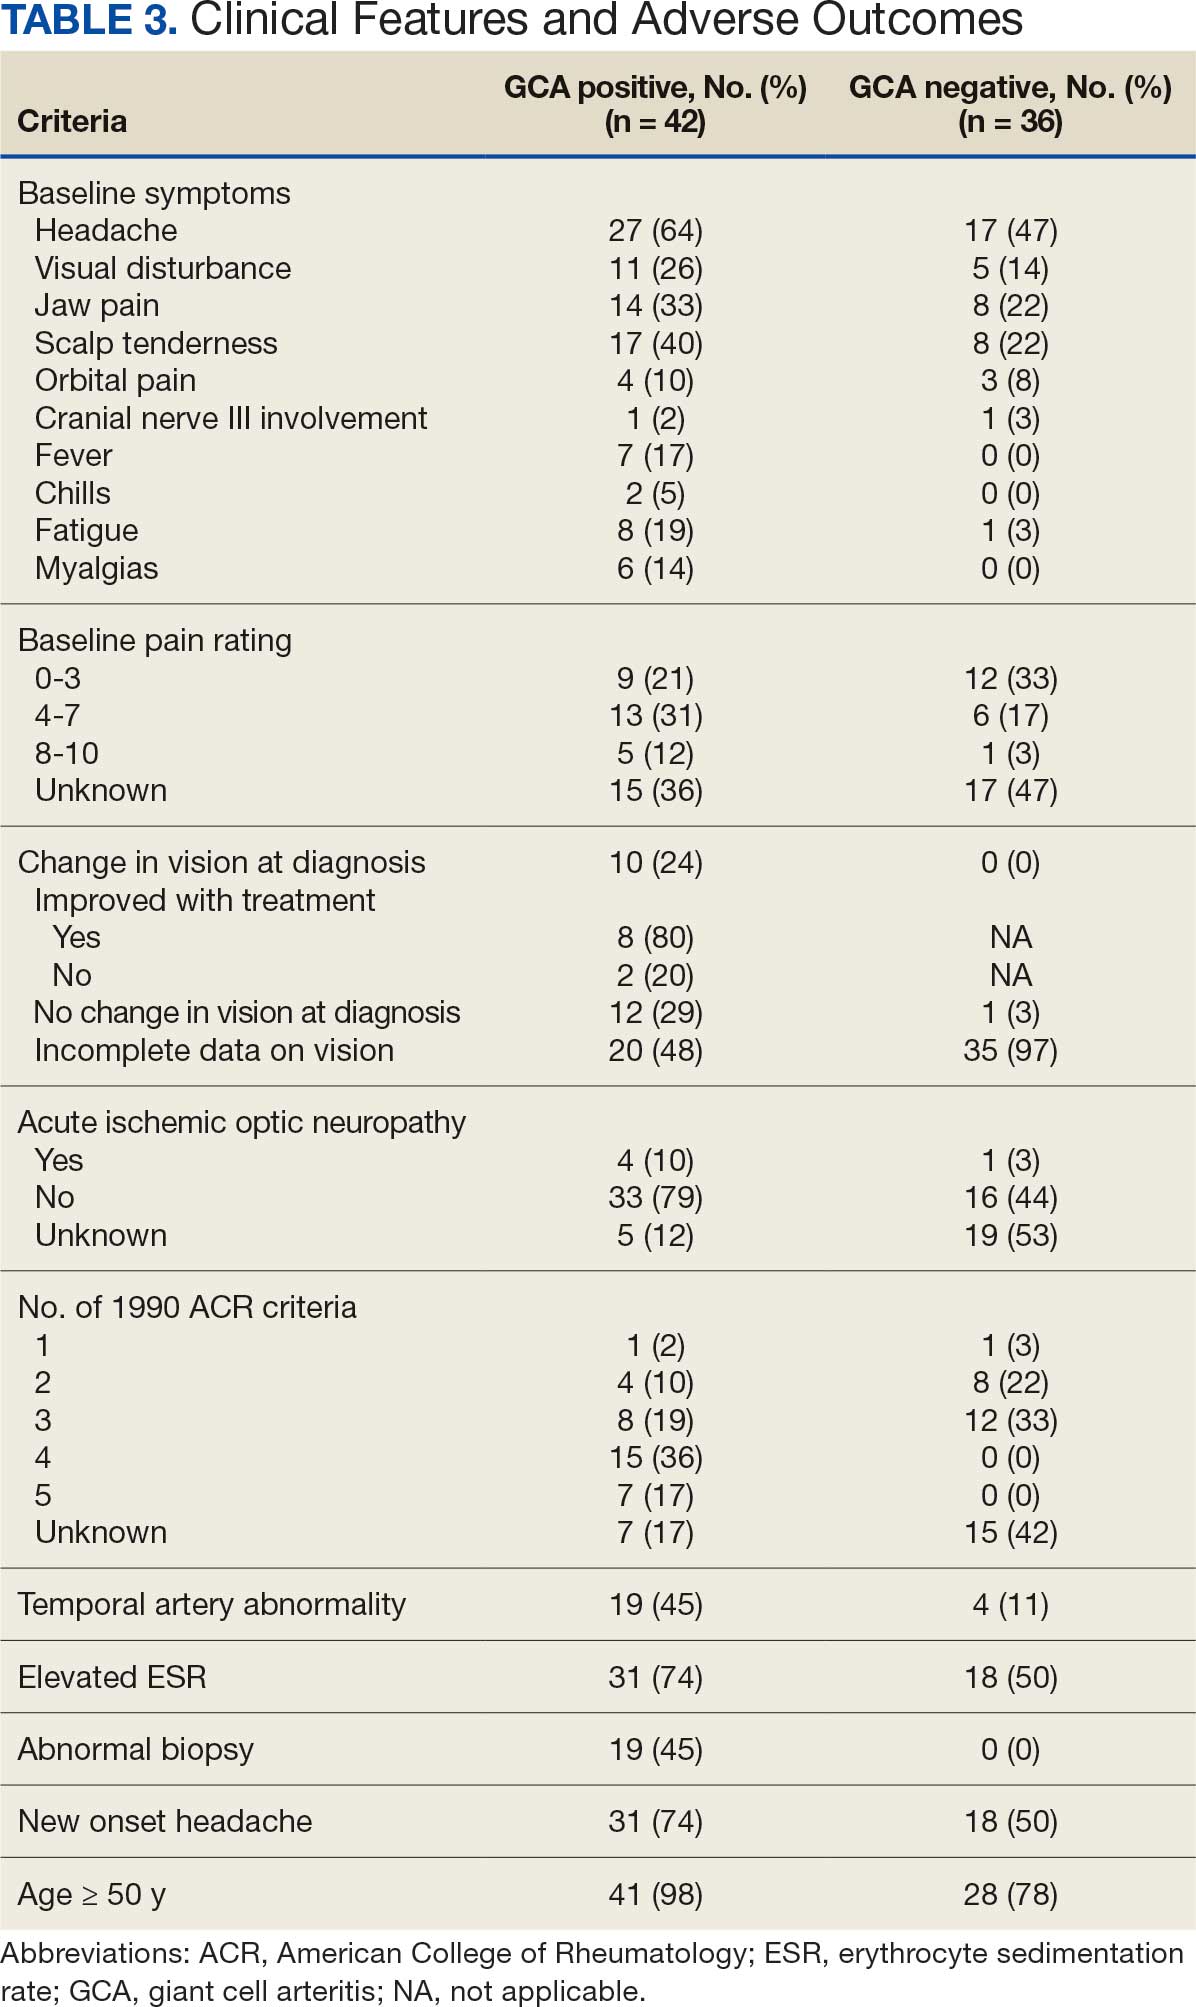
Seventy-eight charts were reviewed and 42 patients (54%) were diagnosed with GCA (Table 2). This study sample had a much higher proportion of African American subjects (31%) when compared with the civilian population, likely reflecting the higher representation of African Americans in the armed forces. Twenty-eight females (67%) were GCA positive. The most common presenting symptoms included 27 patients (64%) with headache, 17 (40%) with scalp tenderness, and 14 (33%) with jaw pain. The mean 1990 ACR score was 3.8 (range, 2-5). With respect to the score criteria: 41 patients (98%) were aged ≥ 50 years, 31 (74%) had new onset headache, and 31 (74%) had elevated ESR (Table 3). Acute ischemic optic neuropathy was documented in 4 patients (10%) with confirmed GCA. The mean ESR and CRP values at diagnosis were 66.2 mm/h (range, 7-122 mm/h) and 8.711 μg/mL (range, 0.054 – 92.690 μg/mL), respectively. Twenty-seven patients (64%) underwent biopsy: 24 (89%) were unilateral and 3 (11%) were bilateral (Table 4). Four patients with GCA (10%) were missing biopsy data. Nineteen patients with GCA (70%) had biopsies with pathologic findings consistent with GCA.
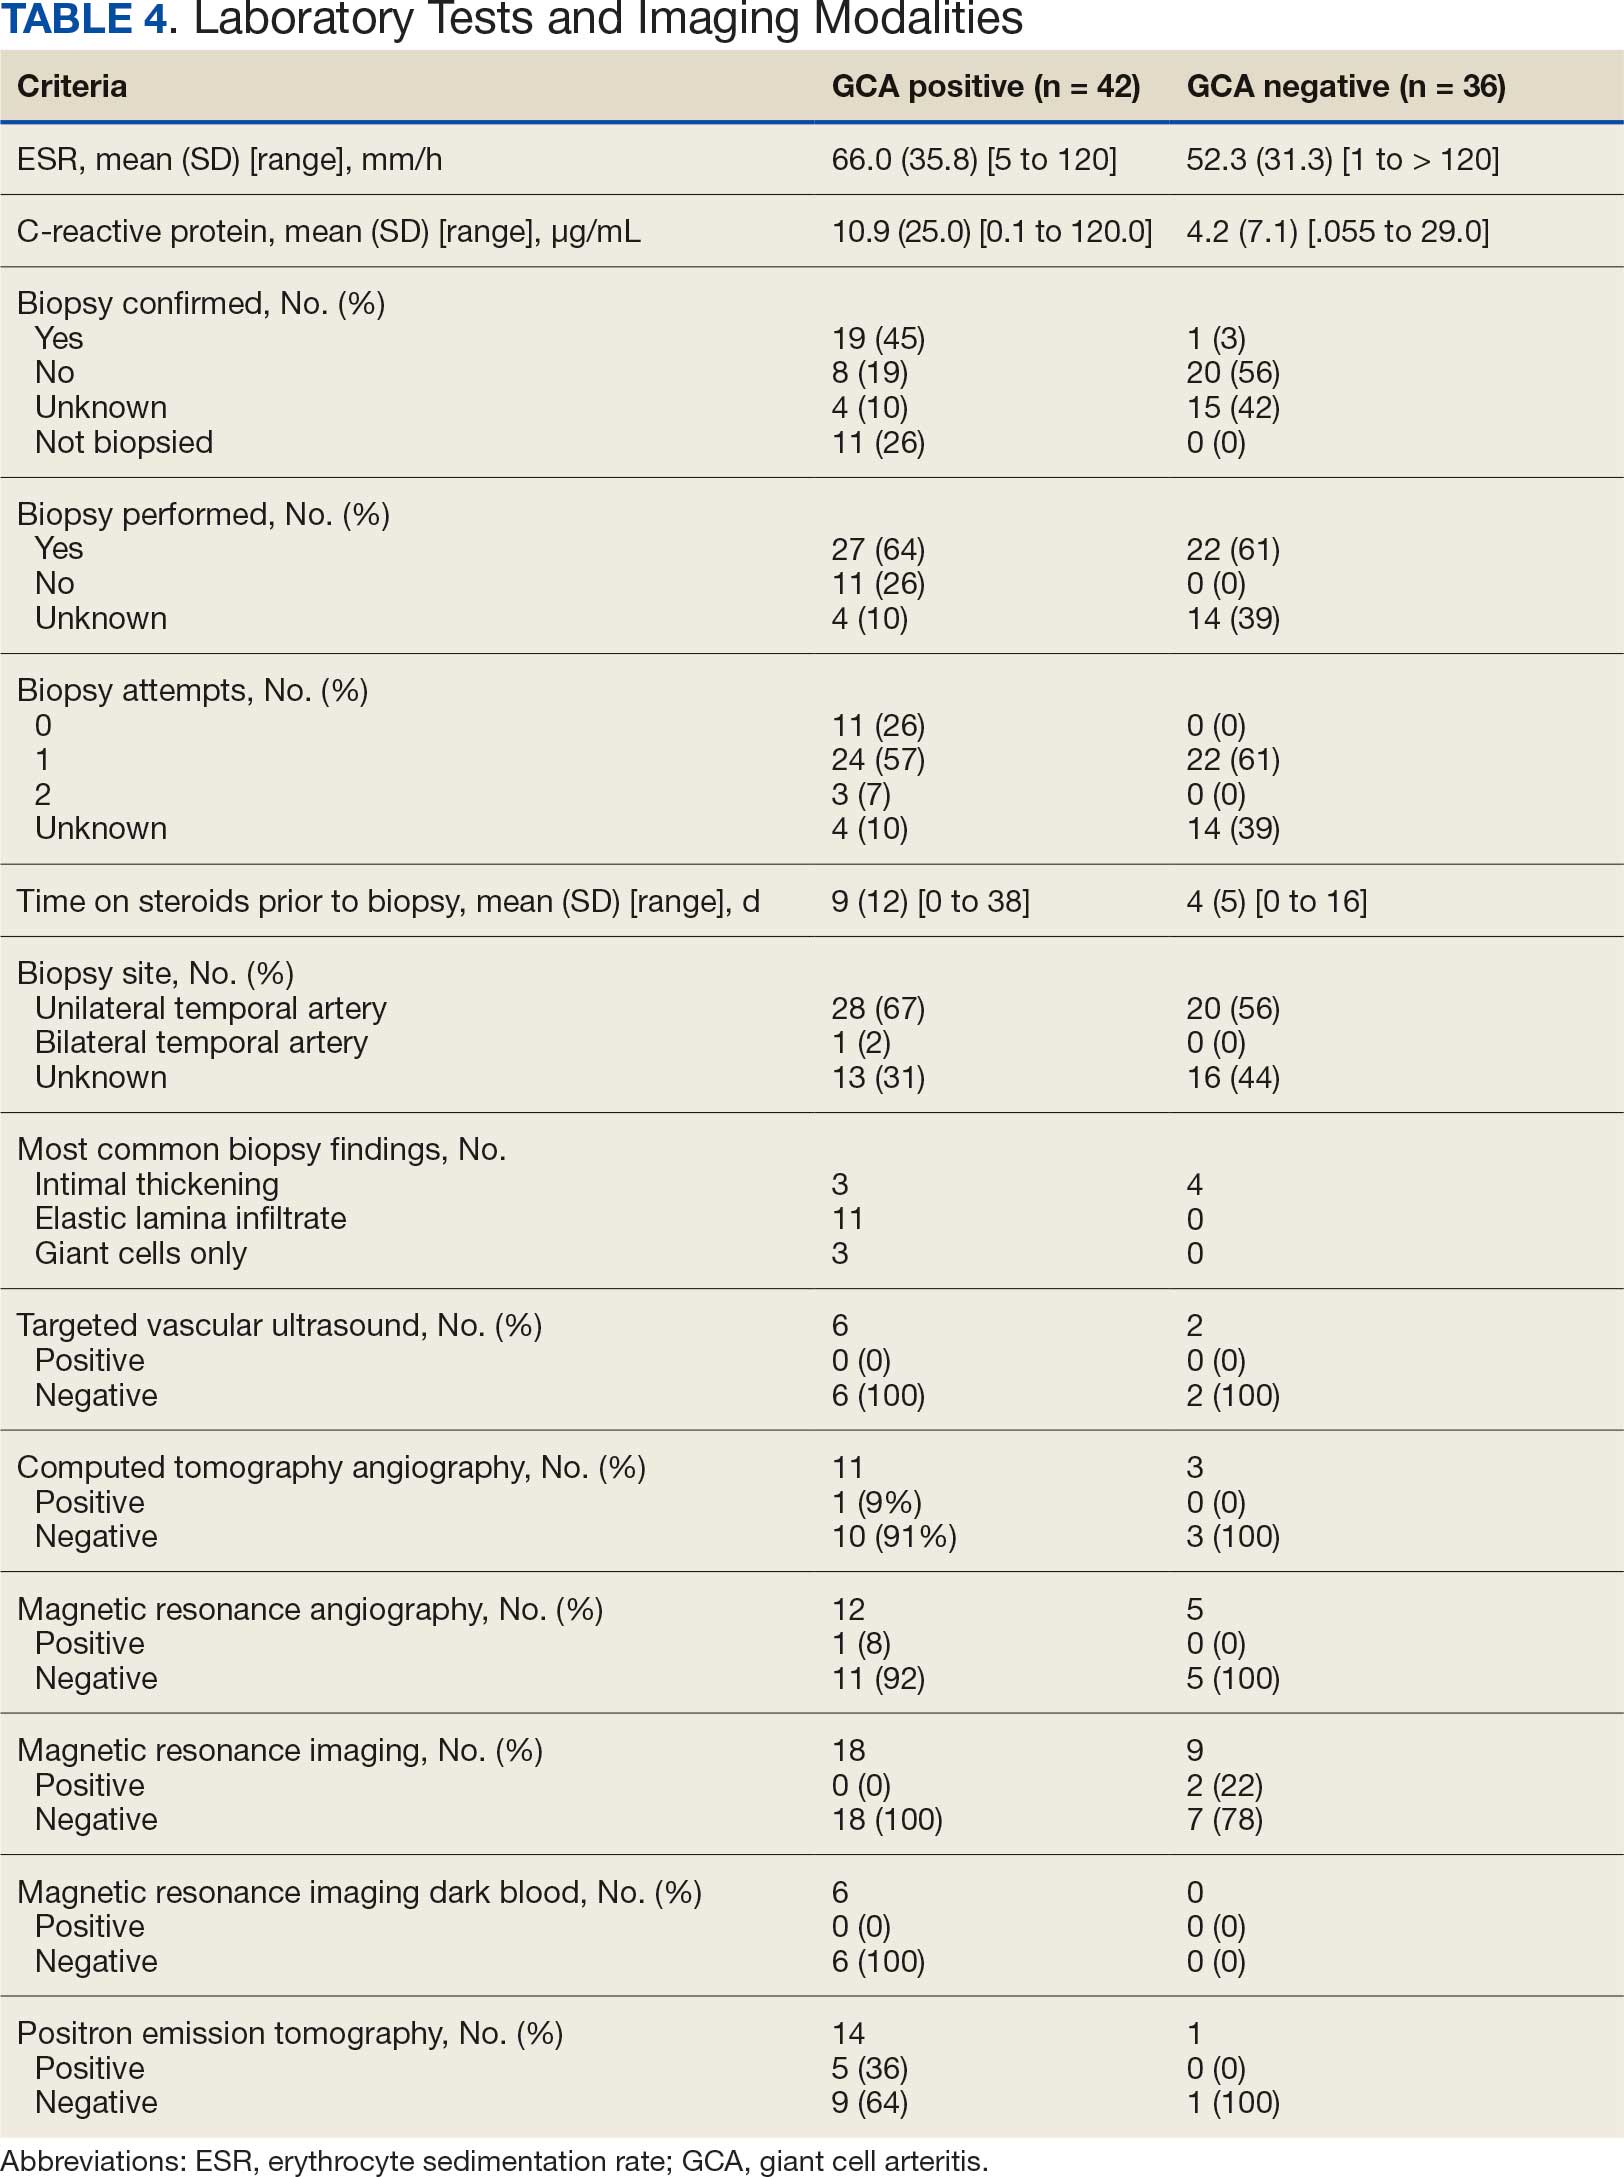
Twenty-five patients with GCA (60%) received ≥ 1 imaging modality. The most common imaging modality was MRI, which was used for 18 (43%) patients. Fourteen patients (33%) had 18F-FDG PET, 12 patients (29%) had MRA, and 11 patients (26%) had CTA. The small number of patients who underwent point-of-care ultrasound (POCUS), brain MRI, or dark blood MRI were negative for disease. Five patients who underwent 18F-FDG PET had findings consistent with GCA. One patient with GCA had CTA of the head and neck with radiographic findings supportive of GCA.
Discussion
The available evidence supports the use of additional screening tests to increase the temporal artery biopsy yield for GCA. Inflammatory laboratory markers demonstrate some sensitivity but are nonspecific for GCA. In this study, only 60% of patients with GCA underwent diagnostic imaging as part of the workup. There are multiple factors that may contribute to the underutilization of advanced imaging in the diagnosis of GCA, including outdated standardized diagnostic criteria, limited resources (direct access to modalities), and lack of clinician awareness of diagnostic testing options. In this retrospective review, 30 patients (71%) were diagnosed with GCA with a 1990 ACR GCA score ≤ 3. Of these 30 patients, 19 underwent confirmatory biopsy followed by prolonged courses of steroid therapy. In addition, only 25 patients underwent advanced imaging to increase diagnostic accuracy of the suspected syndrome.
A large meta-analysis demonstrated a sensitivity of 77.3% (95% CI, 71.8-81.9%) for temporal artery biopsy.21 The overall yield was 40% in the meta-analysis. Advanced noninvasive imaging represents an appropriate method of evaluating GCA.8-20 In our study, 18F-FDG PET demonstrated the highest sensitivity (36%) for the diagnosis of GCA. Ultrasonography is recommended as an initial screening tool to identify the noncompressible halo sign (a hypoechoic circumferential wall thickening due to edema) as a cost-effective and widely available technology.22 Other research has corroborated the beneficial use of ultrasonography in improving diagnostic accuracy by detecting the noncompressible halo sign in temporal arteries.22,23 GCA diagnostic performance has been significantly improved with the use of B-mode probes ≥ 15 MHz as well as proposals to incorporate a compression sign or interrogating the axillary vessels, showing a sensitivity of 54% to 77%.23,24
POCUS may reduce the risk of a false-negative biopsy and improve yield with more frequent utilization. However, ultrasonography may be limited by operator skills and visualization of the great vessels. The accuracy of ultrasonography is dependent on the experience and adeptness of the operator. Additional studies are needed to establish a systematic standard for POCUS training to ensure accurate interpretation and uniform interrogation procedure.24 Artificial intelligence (AI) may aid in interpreting results of POCUS and bridging the operator skill gap among operators.25,26 AI and machine learning techniques can assist in detecting the noncompressible halo sign and compression sign in temporal arteries and other affected vessels.
In comparing the WRNMMC patient population with other US civilian GCA cohorts, there are some differences and similarities. There was a high representation of African American patients in the study, which may reflect a greater severity of autoimmune disease expression in this population.27 We also observed a higher number of females and an association with polymyalgia rheumatica in the data, consistent with previous reports.28,29 The females in this study were primarily civilians and therefore more similar to the general population of individuals with GCA. In contrast, male patients were more likely to be active-duty service members or have prior service experience with increased exposure to novel environmental factors linked to increased risk of autoimmune disease. This includes an increased risk of Guillain-Barré syndrome and Graves disease among Vietnam veterans exposed to Agent Orange.30,31 Other studies have found that veterans with posttraumatic stress disorder are at increased risk for severe autoimmune diseases.32,33 As more women join the active-duty military, the impact of autoimmune disease in the military service population is expected to grow, requiring further research.
Conclusions
Early diagnosis and treatment of GCA are critical to preventing serious outcomes, such as visual loss, jaw or limb claudication, or ischemic stroke. The incidence of autoimmune disease is expected to rise in the armed forces and veteran populations due to exposure to novel environmental factors and the increasing representation of women in the military. The use of additional screening tools can aid in earlier diagnosis of GCA. The 2022 ACR classification criteria for GCA represent significant updates to the 1990 criteria, incorporating ancillary tests such as the temporal artery halo sign on ultrasound, bilateral axillary vessel screening on imaging, and 18F-FDG PET activity throughout the aorta. The updated criteria require further validation and supports the adoption of a multidisciplinary approach that includes ultrasonography, vascular MRI/CT, and 18F-FDG PET. Furthermore, AI may play a future key role in ultrasound interpretation and study interrogation procedure. Ultimately, ultrasonography is a noninvasive and promising technique for the early diagnosis of GCA. A target goal is to increase the yield of positive temporal artery biopsies to ≥ 70%.
- Jennette JC. Overview of the 2012 revised International Chapel Hill Consensus Conference nomenclature of vasculitides. Clin Exp Nephrol. 2013;17:603-606. doi:10.1007/s10157-013-0869-6
- Kale N, Eggenberger E. Diagnosis and management of giant cell arteritis: a review. Curr Opin Ophthalmol. 2010;21:417-422. doi:10.1097/ICU.0b013e32833eae8b
- Smetana GW, Shmerling RH. Does this patient have temporal arteritis? JAMA. 2002;287:92-101.
- Schäcke H, Döcke WD, Asadullah K. Mechanisms involved in the side effects of glucocorticoids. Pharmacol Ther. 2002;96:23-43. doi:10.1016/s0163-7258(02)00297-8
- Curtis JR, Patkar N, Xie A, et al. Risk of serious bacterial infections among rheumatoid arthritis patients exposed to tumor necrosis factor alpha antagonists. Arthritis Rheum. 2007;56:1125-1133. doi:10.1002/art.22504
- Hoes JN, van der Goes MC, van Raalte DH, et al. Glucose tolerance, insulin sensitivity and ß-cell function in patients with rheumatoid arthritis treated with or without low-to-medium dose glucocorticoids. Ann Rheum Dis. 2011;70:1887-1894. doi:10.1136/ard.2011.151464
- Hunder GG, Bloch DA, Michel BA, et al. The American College of Rheumatology 1990 criteria for the classification of giant cell arteritis. Arthritis Rheum. 1990;33:1122-1128. doi:10.1002/art.1780330810
- Dejaco C, Duftner C, Buttgereit F, Matteson EL, Dasgupta B. The spectrum of giant cell arteritis and polymyalgia rheumatica: revisiting the concept of the disease. Rheumatology (Oxford). 2017;56:506-515. doi:10.1093/rheumatology/kew273
- Slart RHJ, Nienhuis PH, Glaudemans AWJM, et al. Role of 18F-FDG PET/CT in large vessel vasculitis and polymyalgia rheumatica. J Nucl Med. 2023;64:515-521. doi:10.2967/jnumed.122.265016
- Shimol JB, Amital H, Lidar M, Domachevsky L, Shoenfeld Y, Davidson T. The utility of PET/CT in large vessel vasculitis. Sci Rep. 2020;10:17709. doi:10.1038/s41598-020-73818-2
- Ponte C, Grayson PC, Robson JC, et al. 2022 American College of Rheumatology/EULAR Classification Criteria for Giant Cell Arteritis. Arthritis Rheumatol. 2022;74:1881-1889. doi:10.1002/art.42325
- He J, Williamson L, Ng B, et al. The diagnostic accuracy of temporal artery ultrasound and temporal artery biopsy in giant cell arteritis: a single center Australian experience over 10 years. Int J Rheum Dis. 2022;25:447-453. doi:10.1111/1756-185X.14288
- Stellingwerff MD, Brouwer E, Lensen KDF, et al. Different scoring methods of FDG PET/CT in giant cell arteritis: need for standardization. Medicine (Baltimore). 2015;94:e1542. doi:10.1097/MD.0000000000001542
- Conway R, Smyth AE, Kavanagh RG, et al. Diagnostic utility of computed tomographic angiography in giant-cell arteritis. Stroke. 2018;49:2233-2236. doi:10.1161/STROKEAHA.118.021995
- Duftner C, Dejaco C, Sepriano A, et al. Imaging in diagnosis, outcome prediction and monitoring of large vessel vasculitis: a systematic literature review and meta-analysis informing the EULAR recommendations. RMD Open. 2018;4:e000612. doi:10.1136/rmdopen-2017-000612
- Rehak Z, Vasina J, Ptacek J, et al. PET/CT in giant cell arteritis: high 18F-FDG uptake in the temporal, occipital and vertebral arteries. Rev Esp Med Nucl Imagen Mol. 2016;35:398-401. doi:10.1016/j.remn.2016.03.007
- Salvarani C, Soriano A, Muratore F, et al. Is PET/CT essential in the diagnosis and follow-up of temporal arteritis? Autoimmun Rev. 2017;16:1125-1130. doi:10.1016/j.autrev.2017.09.007
- Brodmann M, Lipp RW, Passath A, et al. The role of 2-18F-fluoro-2-deoxy-D-glucose positron emission tomography in the diagnosis of giant cell arteritis of the temporal arteries. Rheumatology (Oxford). 2004;43:241-242. doi:10.1093/rheumatology/keh025
- Flaus A, Granjon D, Habouzit V, Gaultier JB, Prevot-Bitot N. Unusual and diffuse hypermetabolism in routine 18F-FDG PET/CT of the supra-aortic vessels in biopsy-positive giant cell arteritis. Clin Nucl Med. 2018;43:e336-e337. doi:10.1097/RLU.0000000000002198
- Berger CT, Sommer G, Aschwanden M, et al. The clinical benefit of imaging in the diagnosis and treatment of giant cell arteritis. Swiss Med Wkly. 2018;148:w14661. doi:10.4414/smw.2018.14661
- Rubenstein E, Maldini C, Gonzalez-Chiappe S, et al. Sensitivity of temporal artery biopsy in the diagnosis of giant cell arteritis: a systematic literature review and meta-analysis. Rheumatology (Oxford). 2020;59:1011-1020. doi:10.1093/rheumatology/kez385
- Tsivgoulis G, Heliopoulos I, Vadikolias K, et al. Teaching neuroimages: ultrasound findings in giant-cell arteritis. Neurology. 2010;75:e67-e68. doi:10.1212/WNL.0b013e3181f881e9
- Nakajima E, Moon FH, Canvas Jr N, et al. Accuracy of Doppler ultrasound in the diagnosis of giant cell arteritis: a systematic review and meta-analysis. Adv Rheumatol. 2023;63:5. doi:10.1186/s42358-023-00286-3
- Naumegni SR, Hoffmann C, Cornec D, et al. Temporal artery ultrasound to diagnose giant cell arteritis: a practical guide. Ultrasound Med Biol. 2021;47:201-213. doi:10.1016/j.ultrasmedbio.2020.10.004
- Kim YH. Artificial intelligence in medical ultrasonography: driving on an unpaved road. Ultrasonography. 2021;40:313-317. doi:10.14366/usg.21031
- Sultan LR, Mohamed MH, Andronikou S. ChatGPT-4: a breakthrough in ultrasound image analysis. Radiol Adv. 2024;1:umae006. doi:10.1093/radadv/umae006
- Cipriani VP, Klein S. Clinical characteristics of multiple sclerosis in African-Americans. Curr Neurol Neurosci Rep. 2019;19:87. doi:10.1007/s11910-019-1000-5
- Sturm A, Dechant C, Proft F, et al. Gender differences in giant cell arteritis: a case-control study. Clin Exp Rheumatol. 2016;34:S70-72.
- Li KJ, Semenov D, Turk M, et al. A meta-analysis of the epidemiology of giant cell arteritis across time and space. Arthritis Res Ther. 2021;23:82. doi:10.1186/s13075-021-02450-w
- Nelson L, Gormley R, Riddle MS, Tribble DR, Porter CK. The epidemiology of Guillain-Barré syndrome in U.S. military personnel: a case-control study. BMC Res Notes. 2009;2:171. doi:10.1186/1756-0500-2-171
- Spaulding SW. The possible roles of environmental factors and the aryl hydrocarbon receptor in the prevalence of thyroid diseases in Vietnam era veterans. Curr Opin Endocrinol Diabetes Obes. 2011;18:315-320.
- O’Donovan A, Cohen BE, Seal KH, et al. Elevated risk for autoimmune disorders in Iraq and Afghanistan veterans with posttraumatic stress disorder. Biol Psychiatry. 2015;77:365-374. doi:10.1016/j.biopsych.2014.06.015
- Bookwalter DB, Roenfeldt KA, LeardMann CA, Kong SY, Riddle MS, Rull RP. Posttraumatic stress disorder and risk of selected autoimmune diseases among US military personnel. BMC Psychiatry. 2020;20:23. doi:10.1186/s12888-020-2432-9
Giant cell arteritis (GCA), the most commonly diagnosed systemic vasculitis, is a large- and medium-vessel vasculitis that can lead to significant morbidity due to aneurysm formation or vascular occlusion if not diagnosed in a timely manner.1,2 Diagnosis is typically based on clinical history and inflammatory markers. Laboratory inflammatory markers may be normal in the early stages of GCA but can be abnormal due to other unrelated reasons leading to a false positive diagnosis.3 Delayed treatment may lead to visual loss, jaw or limb claudication, or ischemic stroke.2 Initial treatment typically includes high-dose steroids that can lead to significant adverse reactions such as hypothalamic-pituitary-adrenal axis dysfunction, metabolic syndrome, premature atherosclerosis, and increased risk of infection.4-6
The 1990 American College of Rheumatology (ACR) criteria for GCA are widely recognized (Table 1).7 The criteria focuses on clinical manifestations, including new onset headache, temporal artery tenderness, age ≥ 50 years, erythrocyte sedimentation rate (ESR) ≥ 50 mm/hr, and temporal artery biopsy with positive anatomical findings.8 When 3 of the 5 1990 ACR criteria are present, the sensitivity and specificity is estimated to be > 90% for GCA vs alternative vasculitides.7
Although the 1990 ACR criteria do not include imaging, modalities such as ultrasound, computed tomography angiography (CTA), 18F-FDG positron emission tomography (PET), and magnetic resonance imaging (MRI)/magnetic resonance angiography (MRA) may be used in GCA diagnosis.8-10 These imaging modalities have been added to the proposed ACR classification criteria for GCA.11 For this updated point system standard, age ≥ 50 years is a requirement and includes a positive temporal artery biopsy or temporal artery halo sign on ultrasound (+5 points), an ESR ≥ 50 mm/h or C-reactive protein (CRP) ≥ 10 mg/L (+3 points), or sudden visual loss (+3 points). Scalp tenderness, jaw or tongue claudication, new temporal headache, morning stiffness in shoulders or neck, temporal artery abnormality on vascular examination, bilateral axillary vessel involvement on imaging, and 18F-FDG PET activity throughout the aorta are scored +2 points each. With these new criteria, a cumulative score ≥ 6 is classified as GCA. Diagnostic accuracy is further improved with imaging: ultrasonography (sensitivity 55% and specificity 95%) and 18F-FDG PET (sensitivity 69% and specificity 92%), CTA (sensitivity 71% and specificity 86%), and MRI/MRA (sensitivity 73% and specificity 88%).12-15
In recent years, clinicians have reported increased glucose uptake in arteries observed on PET imaging that suggests GCA.9,10,16-20 18F-FDG accumulates in cells with high metabolic activity rates, such as areas of inflammation. In assessing temporal arteries or other involved vasculature (eg, axillary or great vessels) for GCA, this modality indicates increased glucose uptake in the lining of vessel walls. The inflammation of vessel walls can then be visualized with PET. 18F-FDG PET presents a noninvasive imaging technique for evaluating GCA but its use has been limited in the United States due to its high cost.
Methods
Approval for a retrospective chart review of patients evaluated for suspected GCA was obtained from the Walter Reed National Military Medical Center (WRNMMC) Institutional Review Board. The review included patients who underwent diagnostic procedures such as ultrasound, MRI, CT angiogram, and PET studies from 2016 through 2022. International Classification of Diseases codes used for case identification included: M31.6, M31.5, I77.6, I77.8, I77.89, I67.7, and I68.2. The Current Procedural Terminology code used for temporal artery biopsy is 37609.
Results
Seventy-eight charts were reviewed and 42 patients (54%) were diagnosed with GCA (Table 2). This study sample had a much higher proportion of African American subjects (31%) when compared with the civilian population, likely reflecting the higher representation of African Americans in the armed forces. Twenty-eight females (67%) were GCA positive. The most common presenting symptoms included 27 patients (64%) with headache, 17 (40%) with scalp tenderness, and 14 (33%) with jaw pain. The mean 1990 ACR score was 3.8 (range, 2-5). With respect to the score criteria: 41 patients (98%) were aged ≥ 50 years, 31 (74%) had new onset headache, and 31 (74%) had elevated ESR (Table 3). Acute ischemic optic neuropathy was documented in 4 patients (10%) with confirmed GCA. The mean ESR and CRP values at diagnosis were 66.2 mm/h (range, 7-122 mm/h) and 8.711 μg/mL (range, 0.054 – 92.690 μg/mL), respectively. Twenty-seven patients (64%) underwent biopsy: 24 (89%) were unilateral and 3 (11%) were bilateral (Table 4). Four patients with GCA (10%) were missing biopsy data. Nineteen patients with GCA (70%) had biopsies with pathologic findings consistent with GCA.
Twenty-five patients with GCA (60%) received ≥ 1 imaging modality. The most common imaging modality was MRI, which was used for 18 (43%) patients. Fourteen patients (33%) had 18F-FDG PET, 12 patients (29%) had MRA, and 11 patients (26%) had CTA. The small number of patients who underwent point-of-care ultrasound (POCUS), brain MRI, or dark blood MRI were negative for disease. Five patients who underwent 18F-FDG PET had findings consistent with GCA. One patient with GCA had CTA of the head and neck with radiographic findings supportive of GCA.
Discussion
The available evidence supports the use of additional screening tests to increase the temporal artery biopsy yield for GCA. Inflammatory laboratory markers demonstrate some sensitivity but are nonspecific for GCA. In this study, only 60% of patients with GCA underwent diagnostic imaging as part of the workup. There are multiple factors that may contribute to the underutilization of advanced imaging in the diagnosis of GCA, including outdated standardized diagnostic criteria, limited resources (direct access to modalities), and lack of clinician awareness of diagnostic testing options. In this retrospective review, 30 patients (71%) were diagnosed with GCA with a 1990 ACR GCA score ≤ 3. Of these 30 patients, 19 underwent confirmatory biopsy followed by prolonged courses of steroid therapy. In addition, only 25 patients underwent advanced imaging to increase diagnostic accuracy of the suspected syndrome.
A large meta-analysis demonstrated a sensitivity of 77.3% (95% CI, 71.8-81.9%) for temporal artery biopsy.21 The overall yield was 40% in the meta-analysis. Advanced noninvasive imaging represents an appropriate method of evaluating GCA.8-20 In our study, 18F-FDG PET demonstrated the highest sensitivity (36%) for the diagnosis of GCA. Ultrasonography is recommended as an initial screening tool to identify the noncompressible halo sign (a hypoechoic circumferential wall thickening due to edema) as a cost-effective and widely available technology.22 Other research has corroborated the beneficial use of ultrasonography in improving diagnostic accuracy by detecting the noncompressible halo sign in temporal arteries.22,23 GCA diagnostic performance has been significantly improved with the use of B-mode probes ≥ 15 MHz as well as proposals to incorporate a compression sign or interrogating the axillary vessels, showing a sensitivity of 54% to 77%.23,24
POCUS may reduce the risk of a false-negative biopsy and improve yield with more frequent utilization. However, ultrasonography may be limited by operator skills and visualization of the great vessels. The accuracy of ultrasonography is dependent on the experience and adeptness of the operator. Additional studies are needed to establish a systematic standard for POCUS training to ensure accurate interpretation and uniform interrogation procedure.24 Artificial intelligence (AI) may aid in interpreting results of POCUS and bridging the operator skill gap among operators.25,26 AI and machine learning techniques can assist in detecting the noncompressible halo sign and compression sign in temporal arteries and other affected vessels.
In comparing the WRNMMC patient population with other US civilian GCA cohorts, there are some differences and similarities. There was a high representation of African American patients in the study, which may reflect a greater severity of autoimmune disease expression in this population.27 We also observed a higher number of females and an association with polymyalgia rheumatica in the data, consistent with previous reports.28,29 The females in this study were primarily civilians and therefore more similar to the general population of individuals with GCA. In contrast, male patients were more likely to be active-duty service members or have prior service experience with increased exposure to novel environmental factors linked to increased risk of autoimmune disease. This includes an increased risk of Guillain-Barré syndrome and Graves disease among Vietnam veterans exposed to Agent Orange.30,31 Other studies have found that veterans with posttraumatic stress disorder are at increased risk for severe autoimmune diseases.32,33 As more women join the active-duty military, the impact of autoimmune disease in the military service population is expected to grow, requiring further research.
Conclusions
Early diagnosis and treatment of GCA are critical to preventing serious outcomes, such as visual loss, jaw or limb claudication, or ischemic stroke. The incidence of autoimmune disease is expected to rise in the armed forces and veteran populations due to exposure to novel environmental factors and the increasing representation of women in the military. The use of additional screening tools can aid in earlier diagnosis of GCA. The 2022 ACR classification criteria for GCA represent significant updates to the 1990 criteria, incorporating ancillary tests such as the temporal artery halo sign on ultrasound, bilateral axillary vessel screening on imaging, and 18F-FDG PET activity throughout the aorta. The updated criteria require further validation and supports the adoption of a multidisciplinary approach that includes ultrasonography, vascular MRI/CT, and 18F-FDG PET. Furthermore, AI may play a future key role in ultrasound interpretation and study interrogation procedure. Ultimately, ultrasonography is a noninvasive and promising technique for the early diagnosis of GCA. A target goal is to increase the yield of positive temporal artery biopsies to ≥ 70%.
- Jennette JC. Overview of the 2012 revised International Chapel Hill Consensus Conference nomenclature of vasculitides. Clin Exp Nephrol. 2013;17:603-606. doi:10.1007/s10157-013-0869-6
- Kale N, Eggenberger E. Diagnosis and management of giant cell arteritis: a review. Curr Opin Ophthalmol. 2010;21:417-422. doi:10.1097/ICU.0b013e32833eae8b
- Smetana GW, Shmerling RH. Does this patient have temporal arteritis? JAMA. 2002;287:92-101.
- Schäcke H, Döcke WD, Asadullah K. Mechanisms involved in the side effects of glucocorticoids. Pharmacol Ther. 2002;96:23-43. doi:10.1016/s0163-7258(02)00297-8
- Curtis JR, Patkar N, Xie A, et al. Risk of serious bacterial infections among rheumatoid arthritis patients exposed to tumor necrosis factor alpha antagonists. Arthritis Rheum. 2007;56:1125-1133. doi:10.1002/art.22504
- Hoes JN, van der Goes MC, van Raalte DH, et al. Glucose tolerance, insulin sensitivity and ß-cell function in patients with rheumatoid arthritis treated with or without low-to-medium dose glucocorticoids. Ann Rheum Dis. 2011;70:1887-1894. doi:10.1136/ard.2011.151464
- Hunder GG, Bloch DA, Michel BA, et al. The American College of Rheumatology 1990 criteria for the classification of giant cell arteritis. Arthritis Rheum. 1990;33:1122-1128. doi:10.1002/art.1780330810
- Dejaco C, Duftner C, Buttgereit F, Matteson EL, Dasgupta B. The spectrum of giant cell arteritis and polymyalgia rheumatica: revisiting the concept of the disease. Rheumatology (Oxford). 2017;56:506-515. doi:10.1093/rheumatology/kew273
- Slart RHJ, Nienhuis PH, Glaudemans AWJM, et al. Role of 18F-FDG PET/CT in large vessel vasculitis and polymyalgia rheumatica. J Nucl Med. 2023;64:515-521. doi:10.2967/jnumed.122.265016
- Shimol JB, Amital H, Lidar M, Domachevsky L, Shoenfeld Y, Davidson T. The utility of PET/CT in large vessel vasculitis. Sci Rep. 2020;10:17709. doi:10.1038/s41598-020-73818-2
- Ponte C, Grayson PC, Robson JC, et al. 2022 American College of Rheumatology/EULAR Classification Criteria for Giant Cell Arteritis. Arthritis Rheumatol. 2022;74:1881-1889. doi:10.1002/art.42325
- He J, Williamson L, Ng B, et al. The diagnostic accuracy of temporal artery ultrasound and temporal artery biopsy in giant cell arteritis: a single center Australian experience over 10 years. Int J Rheum Dis. 2022;25:447-453. doi:10.1111/1756-185X.14288
- Stellingwerff MD, Brouwer E, Lensen KDF, et al. Different scoring methods of FDG PET/CT in giant cell arteritis: need for standardization. Medicine (Baltimore). 2015;94:e1542. doi:10.1097/MD.0000000000001542
- Conway R, Smyth AE, Kavanagh RG, et al. Diagnostic utility of computed tomographic angiography in giant-cell arteritis. Stroke. 2018;49:2233-2236. doi:10.1161/STROKEAHA.118.021995
- Duftner C, Dejaco C, Sepriano A, et al. Imaging in diagnosis, outcome prediction and monitoring of large vessel vasculitis: a systematic literature review and meta-analysis informing the EULAR recommendations. RMD Open. 2018;4:e000612. doi:10.1136/rmdopen-2017-000612
- Rehak Z, Vasina J, Ptacek J, et al. PET/CT in giant cell arteritis: high 18F-FDG uptake in the temporal, occipital and vertebral arteries. Rev Esp Med Nucl Imagen Mol. 2016;35:398-401. doi:10.1016/j.remn.2016.03.007
- Salvarani C, Soriano A, Muratore F, et al. Is PET/CT essential in the diagnosis and follow-up of temporal arteritis? Autoimmun Rev. 2017;16:1125-1130. doi:10.1016/j.autrev.2017.09.007
- Brodmann M, Lipp RW, Passath A, et al. The role of 2-18F-fluoro-2-deoxy-D-glucose positron emission tomography in the diagnosis of giant cell arteritis of the temporal arteries. Rheumatology (Oxford). 2004;43:241-242. doi:10.1093/rheumatology/keh025
- Flaus A, Granjon D, Habouzit V, Gaultier JB, Prevot-Bitot N. Unusual and diffuse hypermetabolism in routine 18F-FDG PET/CT of the supra-aortic vessels in biopsy-positive giant cell arteritis. Clin Nucl Med. 2018;43:e336-e337. doi:10.1097/RLU.0000000000002198
- Berger CT, Sommer G, Aschwanden M, et al. The clinical benefit of imaging in the diagnosis and treatment of giant cell arteritis. Swiss Med Wkly. 2018;148:w14661. doi:10.4414/smw.2018.14661
- Rubenstein E, Maldini C, Gonzalez-Chiappe S, et al. Sensitivity of temporal artery biopsy in the diagnosis of giant cell arteritis: a systematic literature review and meta-analysis. Rheumatology (Oxford). 2020;59:1011-1020. doi:10.1093/rheumatology/kez385
- Tsivgoulis G, Heliopoulos I, Vadikolias K, et al. Teaching neuroimages: ultrasound findings in giant-cell arteritis. Neurology. 2010;75:e67-e68. doi:10.1212/WNL.0b013e3181f881e9
- Nakajima E, Moon FH, Canvas Jr N, et al. Accuracy of Doppler ultrasound in the diagnosis of giant cell arteritis: a systematic review and meta-analysis. Adv Rheumatol. 2023;63:5. doi:10.1186/s42358-023-00286-3
- Naumegni SR, Hoffmann C, Cornec D, et al. Temporal artery ultrasound to diagnose giant cell arteritis: a practical guide. Ultrasound Med Biol. 2021;47:201-213. doi:10.1016/j.ultrasmedbio.2020.10.004
- Kim YH. Artificial intelligence in medical ultrasonography: driving on an unpaved road. Ultrasonography. 2021;40:313-317. doi:10.14366/usg.21031
- Sultan LR, Mohamed MH, Andronikou S. ChatGPT-4: a breakthrough in ultrasound image analysis. Radiol Adv. 2024;1:umae006. doi:10.1093/radadv/umae006
- Cipriani VP, Klein S. Clinical characteristics of multiple sclerosis in African-Americans. Curr Neurol Neurosci Rep. 2019;19:87. doi:10.1007/s11910-019-1000-5
- Sturm A, Dechant C, Proft F, et al. Gender differences in giant cell arteritis: a case-control study. Clin Exp Rheumatol. 2016;34:S70-72.
- Li KJ, Semenov D, Turk M, et al. A meta-analysis of the epidemiology of giant cell arteritis across time and space. Arthritis Res Ther. 2021;23:82. doi:10.1186/s13075-021-02450-w
- Nelson L, Gormley R, Riddle MS, Tribble DR, Porter CK. The epidemiology of Guillain-Barré syndrome in U.S. military personnel: a case-control study. BMC Res Notes. 2009;2:171. doi:10.1186/1756-0500-2-171
- Spaulding SW. The possible roles of environmental factors and the aryl hydrocarbon receptor in the prevalence of thyroid diseases in Vietnam era veterans. Curr Opin Endocrinol Diabetes Obes. 2011;18:315-320.
- O’Donovan A, Cohen BE, Seal KH, et al. Elevated risk for autoimmune disorders in Iraq and Afghanistan veterans with posttraumatic stress disorder. Biol Psychiatry. 2015;77:365-374. doi:10.1016/j.biopsych.2014.06.015
- Bookwalter DB, Roenfeldt KA, LeardMann CA, Kong SY, Riddle MS, Rull RP. Posttraumatic stress disorder and risk of selected autoimmune diseases among US military personnel. BMC Psychiatry. 2020;20:23. doi:10.1186/s12888-020-2432-9
Advanced Imaging Techniques Use in Giant Cell Arteritis Diagnosis: The Experience at Walter Reed National Military Medical Center
Advanced Imaging Techniques Use in Giant Cell Arteritis Diagnosis: The Experience at Walter Reed National Military Medical Center

Epidemiologic and Clinical Evaluation of the Bidirectional Link Between Molluscum Contagiosum and Atopic Dermatitis in Children
Epidemiologic and Clinical Evaluation of the Bidirectional Link Between Molluscum Contagiosum and Atopic Dermatitis in Children
Molluscum contagiosum (MC), which is caused by a DNA virus in the Poxviridae family, is a common viral skin infection that primarily affects children.1-4 The reported incidence and prevalence of MC exhibit notable geographic variation. Worldwide, annual incidence rates per 1000 individuals range from 3.1 to 25, and prevalence ranges from 0.27% to 34.6%.2-7
Molluscum contagiosum is diagnosed clinically and typically manifests as smooth, flesh-colored papules measuring 2 to 6 mm in diameter with central umbilication. It can manifest as a single lesion or multiple clustered lesions, or in a disseminated pattern. The primary mode of transmission is through contact with skin, lesions, or contaminated personal items, or via self-inoculation. The majority of cases are asymptomatic, but in some patients, MC may be associated with pruritus, tenderness, erythema, or irritation. When present, secondary bacterial infections can cause localized inflammation and pain.1,3,4 The pathogenesis hinges on MC virus replication within keratinocytes, disrupting cellular differentiation and keratinization. The virus persists in the host by influencing the immune response through various mechanisms, including interference with signaling pathways, apoptosis inhibition, and antigen presentation disruption.3,4
Molluscum contagiosum typically follows a self-limiting trajectory, resolving over several months to 2 years.3,4 The resolution timeframe is intricately linked to variables such as the patient’s immune profile, lesion burden, and treatment approach. For symptomatic lesions, a variety of treatment options have been described, including physical ablation (eg, cryotherapy, curettage) and topical agents such as potassium hydroxide, cantharidin, imiquimod, and salicylic acid.3,4,8,9
Atopic dermatitis (AD) is a common chronic relapsing inflammatory skin disorder. In the United States, its prevalence ranges from 15% to 30% in children and from 2% to 10% in adults, with ongoing evidence of a growing global incidence.10-14 While AD can emerge at any age, typical onset is during early childhood. The clinical manifestation of AD includes a spectrum of eczematous features, often accompanied by persistent itching. The pathogenesis is multifactorial, involving a complex interplay of genetic, immunologic, and environmental factors. Key contributors to this multifaceted process encompass a compromised epidermal barrier, alterations in the skin microbiome, and an immune dysregulation promoting a type 2 immune response. Epidermal barrier dysfunction can be attributed to various factors, including diminished ceramide production, altered lipid composition, the release of inflammatory mediators, and mechanical damage from the persistent itch-scratch cycle.10-13,15 These factors or their interplay may enhance the susceptibility of patients with AD to infections.
Several studies conducted across various geographic regions examining the relationship between MC and AD have reported variable findings.2,6,7,16-21 Published studies have reported a prevalence of AD in children with MC ranging from 13.2% to 43%.2,6,7,16-21 Although some studies suggest a higher rate of atopy in patients with MC, not all research has confirmed this association.16,21 Dohil et al2 reported a greater number of MC lesions in children with AD than those without an atopic background. Silverberg20 reported that in 10% (5/50) of children with MC, the onset of AD was triggered, and in 22% (11/50) MC was associated with flares of pre-existing AD.
In this study, we aimed to assess MC infection rates in children with AD, analyze the epidemiologic aspects and severity differences between atopic children with and without MC infection, and compare data from atopic and nonatopic children with MC.
Methods
In this retrospective cohort study, we analyzed the medical records of pediatric patients diagnosed with MC, AD, or both conditions at an outpatient dermatology practice in Netanya, HaSharon, Israel, from September 2013 to August 2022. Data were collected from the electronic medical records and included patient demographics, the clinical presentation of MC and/or AD at diagnosis, and the duration of both conditions. Only patients with complete data and at least 6 months of follow-up were included. Key epidemiologic characteristics assessed included patient sex, age at the initial visit, and age at the onset of MC and/or AD. Diagnoses of MC and AD were established through clinical examinations conducted by dermatologists. The clinical evaluation of AD encompassed the assessment of body surface area involvement (categorized as <5%, 5%-10%, or >10%). Atopic dermatitis severity was classified as mild, moderate, or severe using the validated Investigator Global Assessment Scale for Atopic Dermatitis.22 Clinical evaluation of MC included assessment of the number of lesions (categorized as ≤4, 5-9, or ≥10), presence of inflammatory lesions, and resolution times for individual lesions (categorized as <1 week, several weeks, or unknown), as well as the overall resolution time for all lesions (categorized as <6 months, 6-12 months, 13-18 months, or >18 months). The temporal relationship between the appearance of MC and AD also was assessed.
Statistical Analysis—Numbers and percentages were used for categorical variables. Continuous variables were represented by mean and standard deviation. Categorical variables were compared using the χ2 test, and continuous variables between groups were compared using the Student t test. All statistical tests were 2-sided, with statistical significance defined as P≤.05. Statistical analysis was performed using SPSS software version 28 (IBM).
Results
Study Population—A total of 610 children were included in the study; 263 (43%) were female and 347 (57%) were male. The patients ranged in age from 4 months to 10 years, with a mean (SD) age of 4.87 (1.82) years. Five hundred fifty-six (91%) patients had AD, and 336 (55%) had MC. Within this cohort, 274 (45%) children had AD only, 54 (9%) had MC only, and 282 (46%) had both AD and MC. Regarding the temporal sequence, among the 282 children who had both AD and MC, AD preceded MC in 203 (72%) cases, both conditions were diagnosed concomitantly in 43 (15%) cases, and MC preceded AD in 36 (13%) cases. For cases in which the MC diagnosis followed the diagnosis of AD, the mean (SD) time between each diagnosis was 3.17 (1.5) years.
Comparison of Atopic and Nonatopic Children With MC—Although a higher proportion of males were diagnosed with MC (with or without concurrent AD), the differences in sex distribution between the 2 groups did not reach statistical significance. Among all children with MC, the majority (81.5% [274/336]) were aged 1 to 6 years at presentation. Patients with MC as their sole diagnosis had a similar mean age compared with those with concurrent AD. However, a detailed age subgroup analysis revealed a notable distinction: in the group with MC as the sole diagnosis, the majority (95% [51/54]) were younger than 7 years. In contrast, in the combined MC and AD group, MC manifested across a wider age range, with 21% (58/282) of patients being older than 7 years. In MC cases associated with AD, a notably higher lesion count and increased local inflammatory response were observed compared to those without AD. The time for complete resolution of all MC lesions was substantially prolonged in patients with comorbid AD. Specifically, 93% (50/54) of patients with MC without comorbid AD achieved full resolution within 1 year, whereas 52% (146/282) of patients with comorbid AD required more than 1 year for resolution (eTable 1).
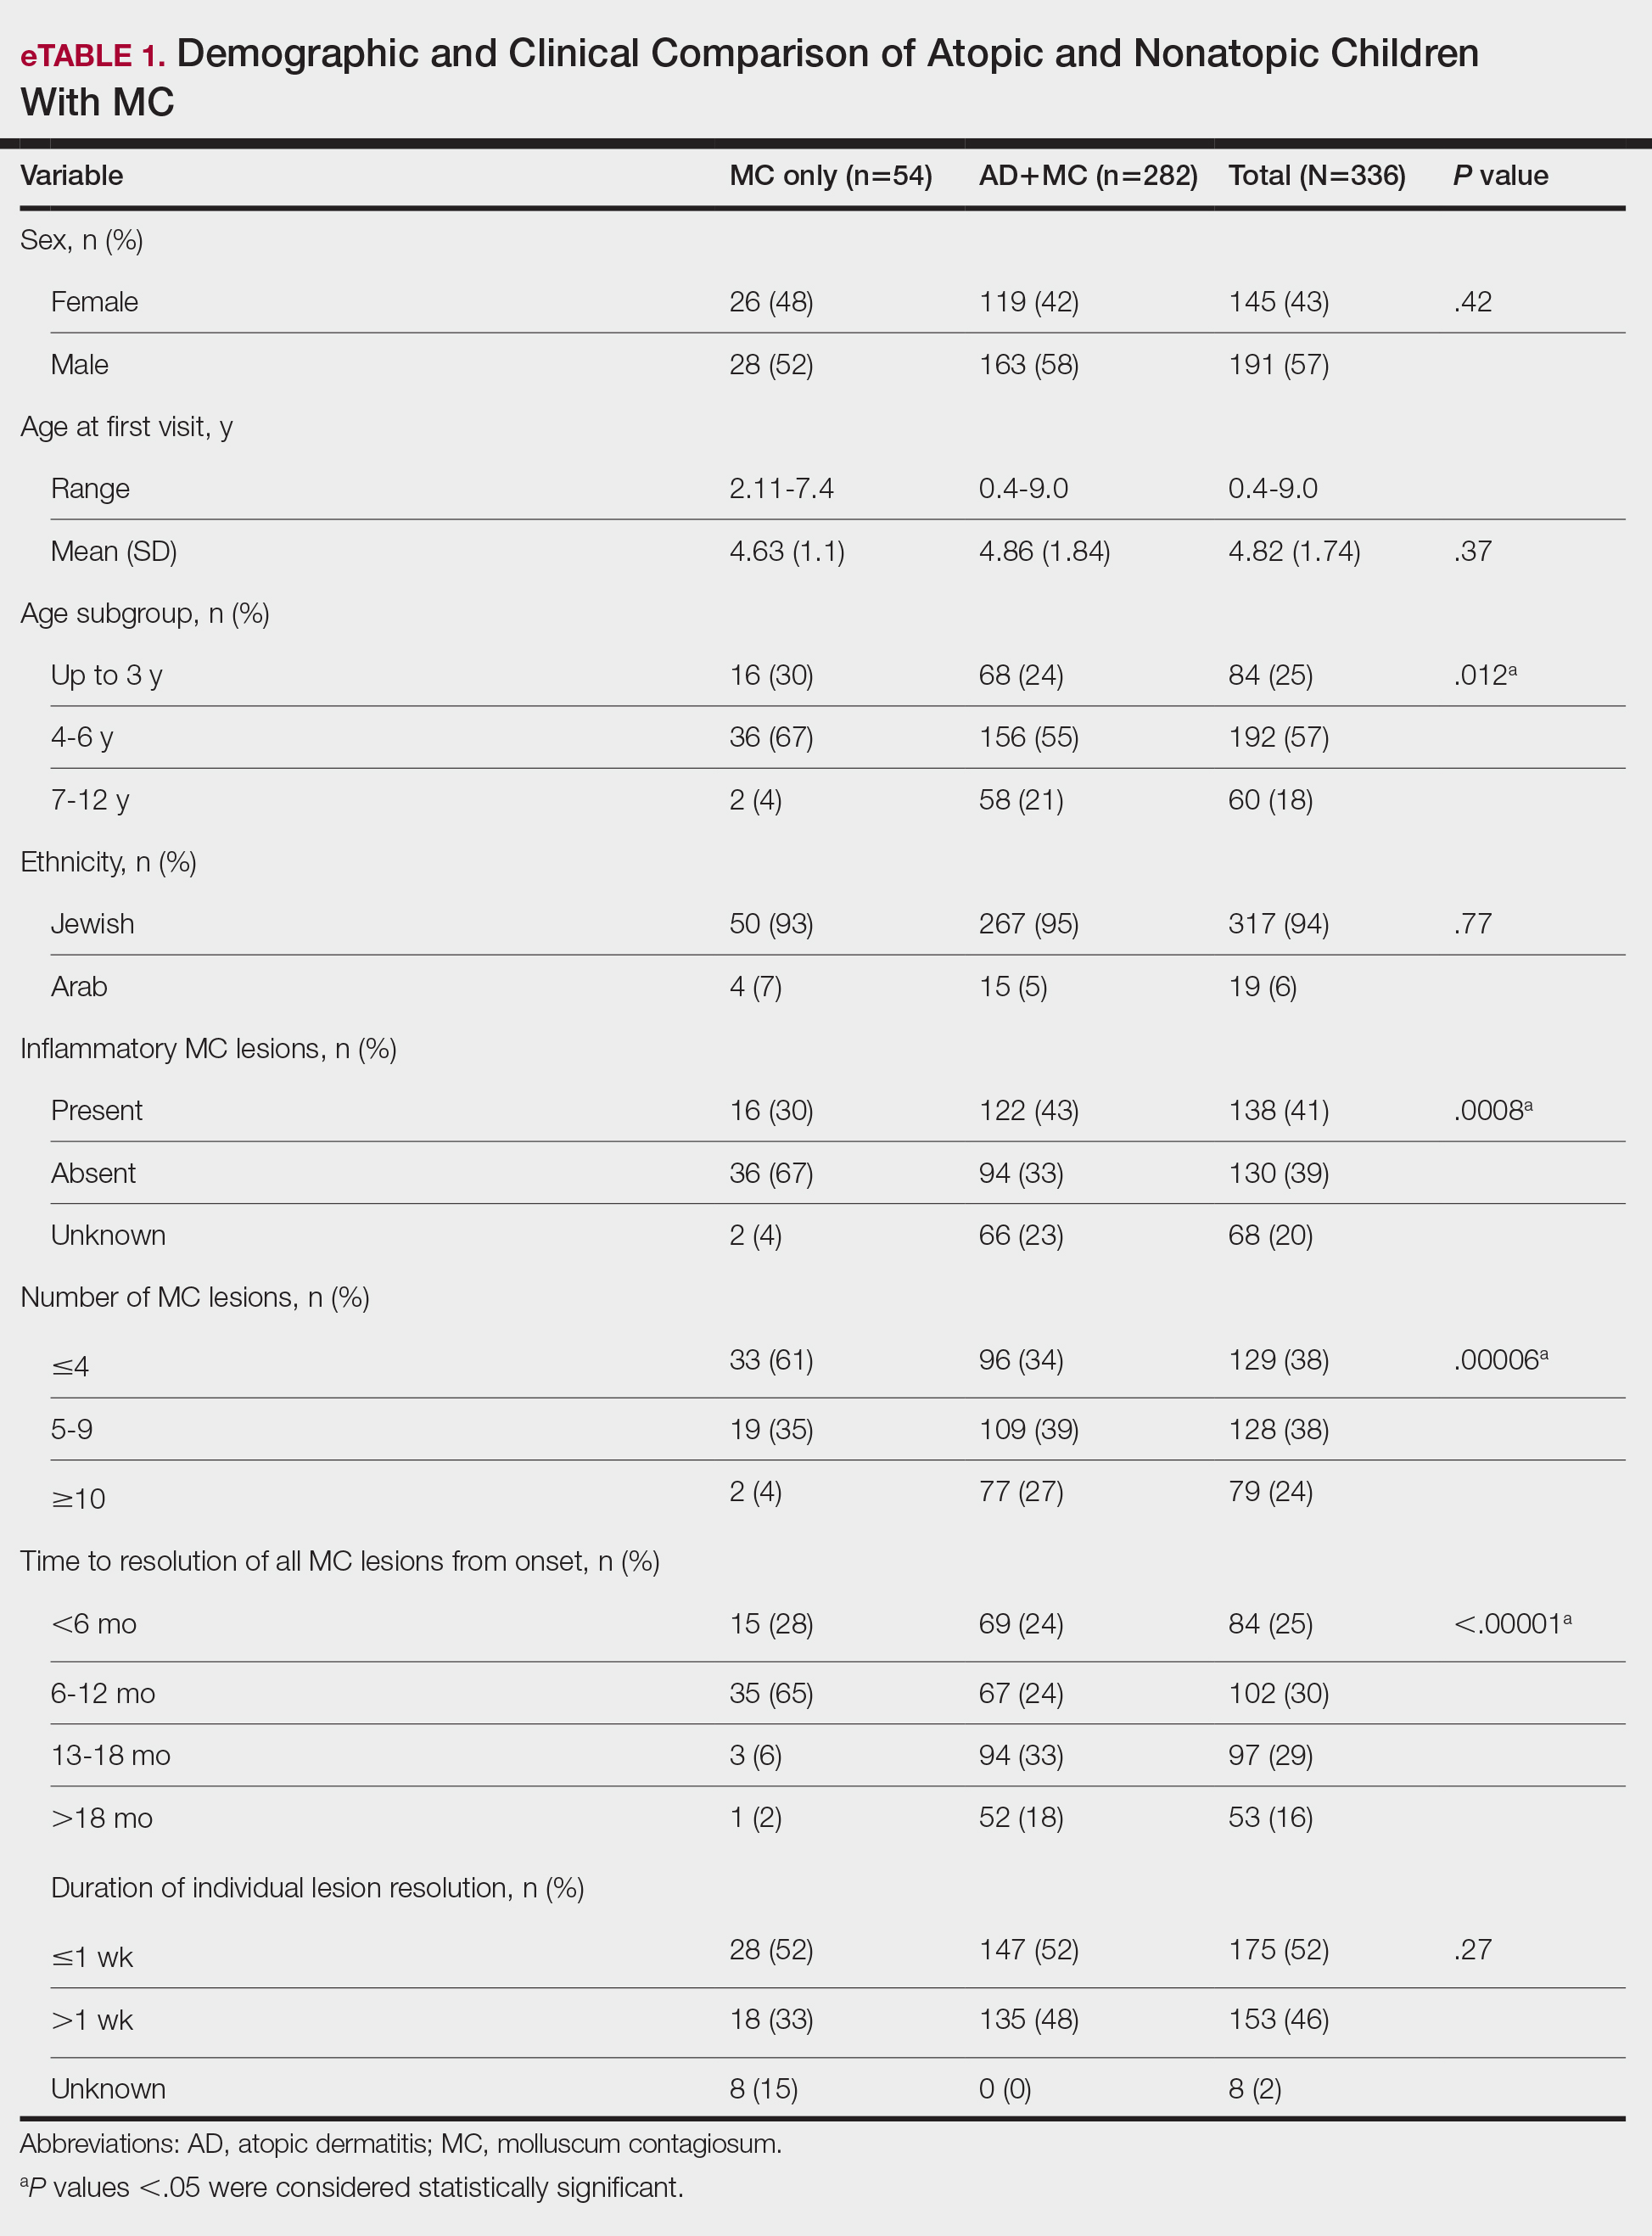
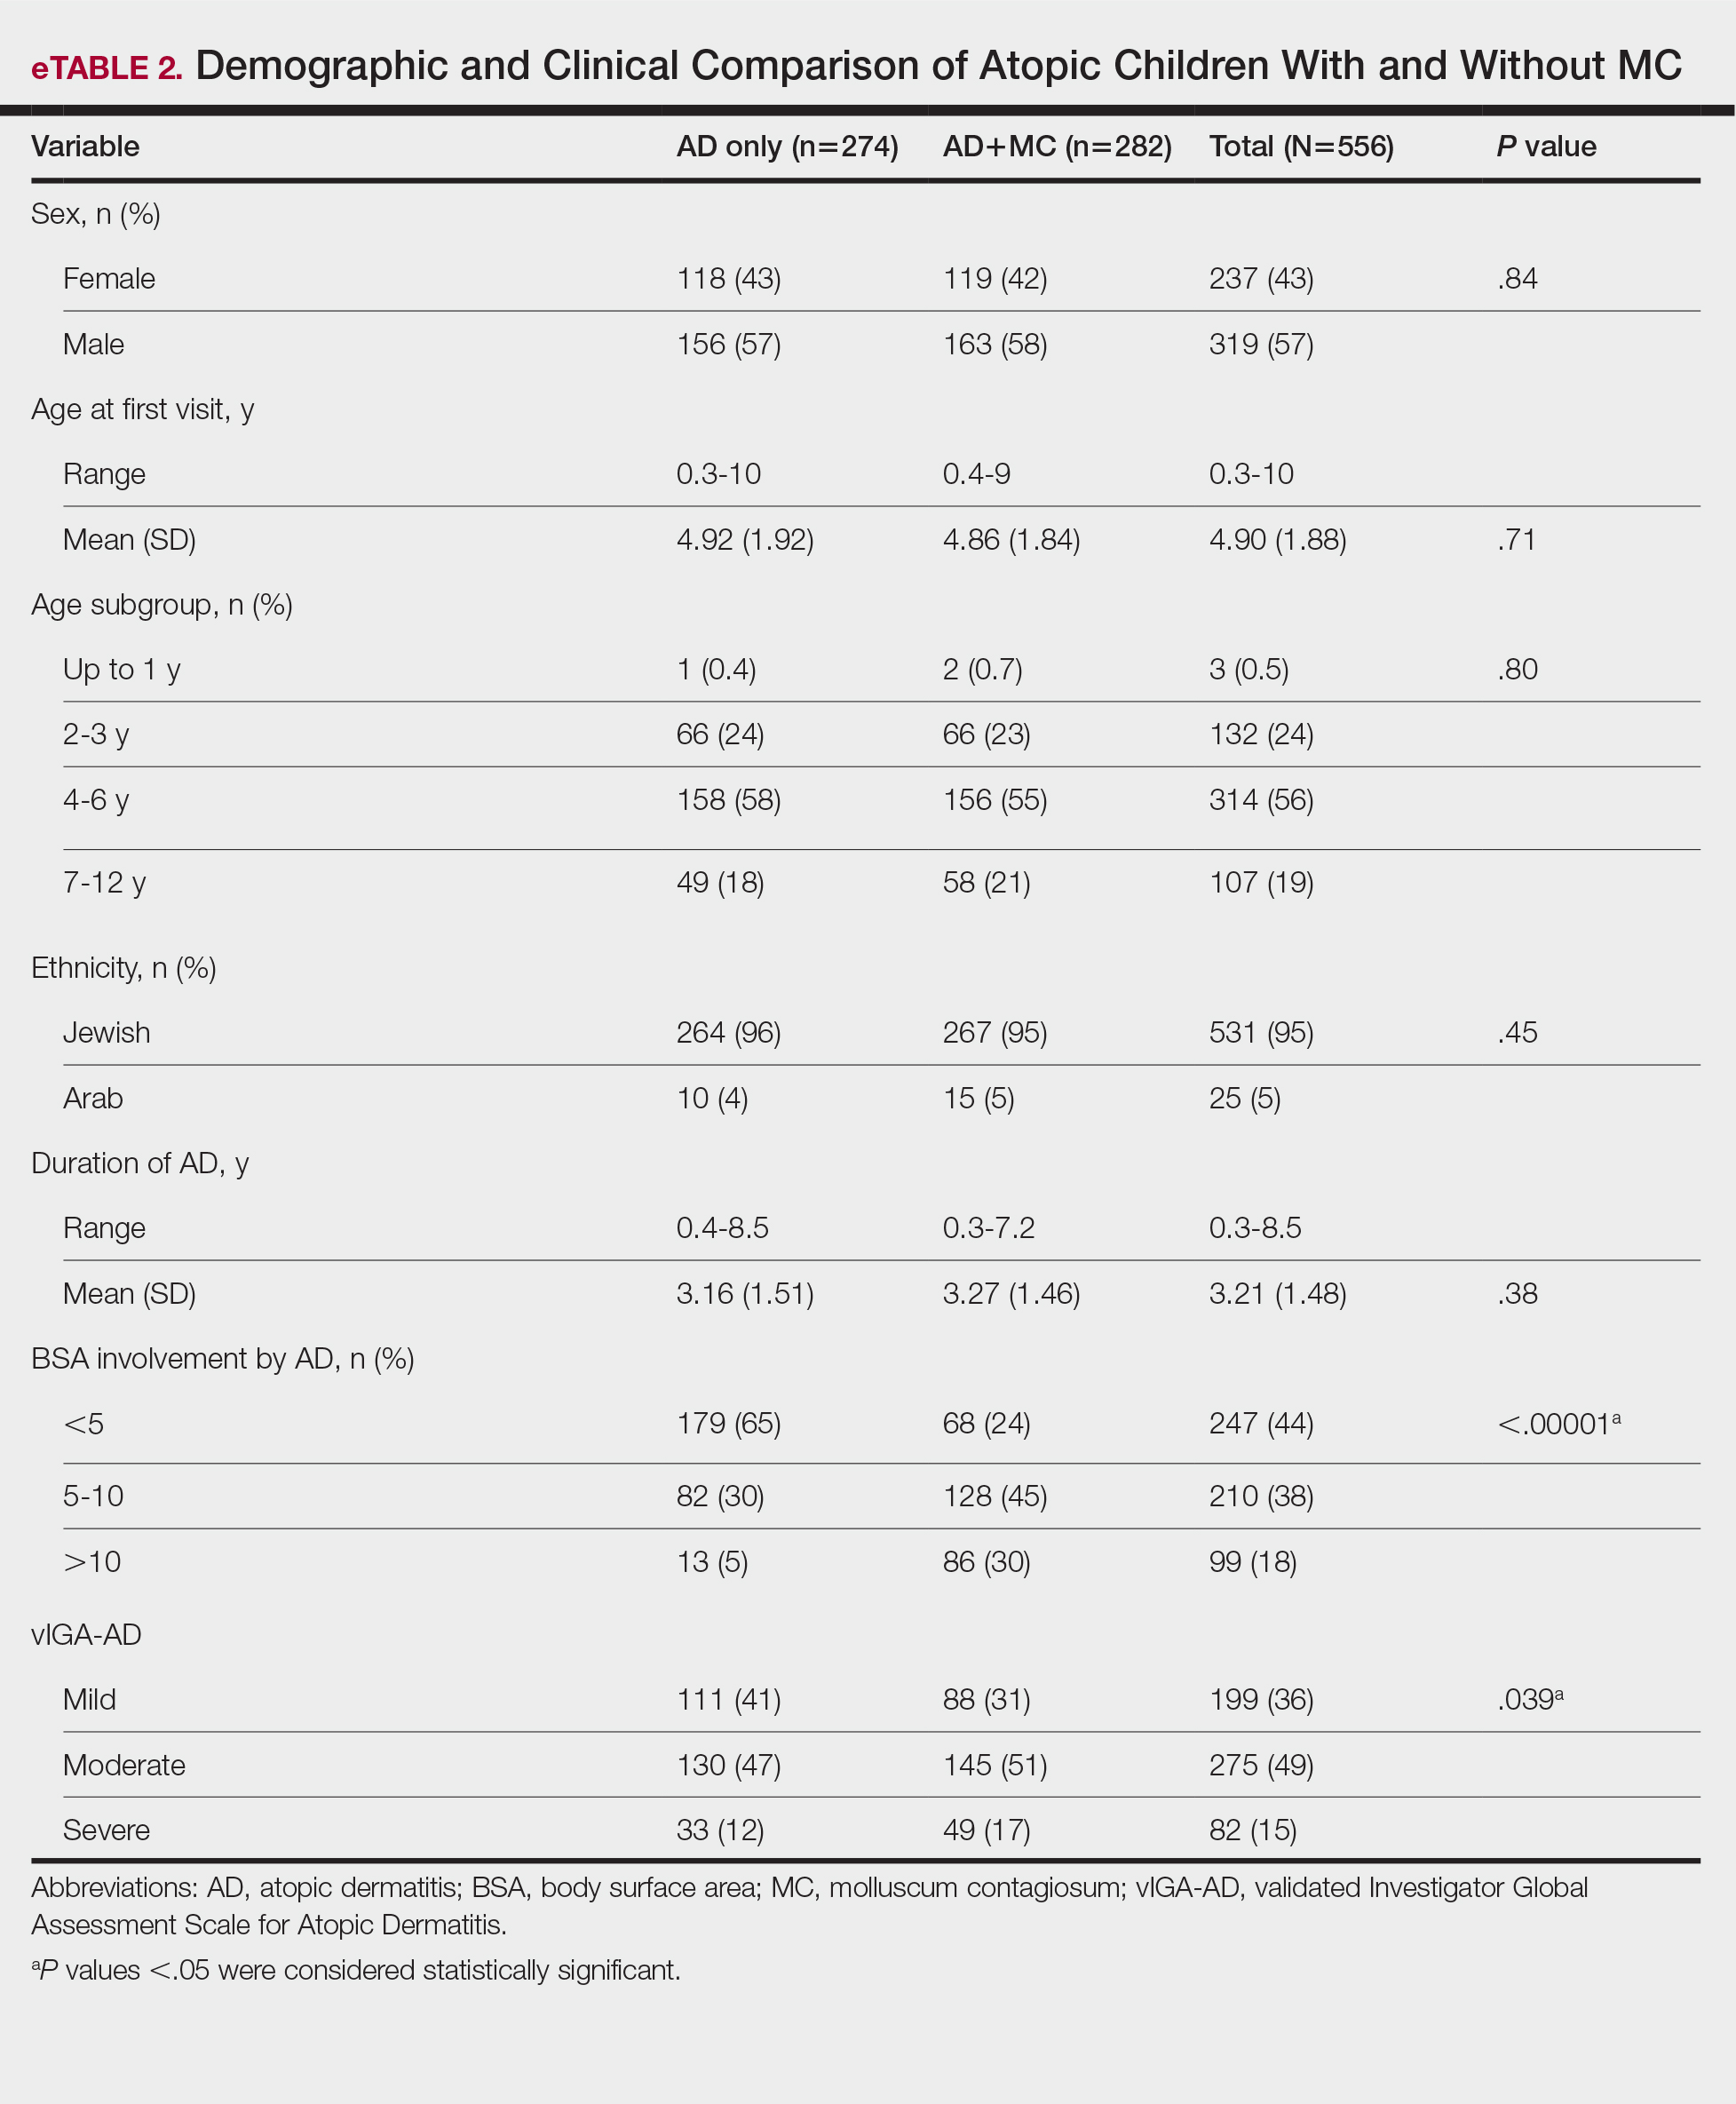
Comparison of Atopic Children With and Without MC—Sex, age distribution, and disease duration showed no differences between atopic patients with and without MC. Atopic patients with MC exhibited greater body surface area involvement and higher validated Investigator Global Assessment Scale for Atopic Dermatitis scores compared to atopic patients without MC (eTable 2).
Comment
This study examined the relationship between MC and AD in pediatric patients, revealing a notable correlation and yielding valuable epidemiologic and clinical insights. Consistent with previous research, our study demonstrated a high prevalence of AD in children with MC.2,6,7,16-21 Previous studies indicated AD rates of 13% to 43% in pediatric patients with MC, whereas our study found a higher prevalence (84%), signifying a substantial majority of patients with MC in our cohort had AD. This discrepancy arises from factors such as demographic, genetic, and environmental differences, along with differences in access to medical care, referral practices, and diagnostic approaches across health care systems.14
Our temporal analysis of MC and AD diagnoses offers important insights. In the majority (72% [203/282]) of cases, the diagnosis of AD preceded MC, supporting previous research suggesting that the underlying pathophysiology of AD heightens susceptibility to MC.15,17-20 Less frequently, MC was diagnosed before or concurrently with AD, indicating that MC may occasionally trigger or exacerbate milder or undiagnosed AD, as previously proposed.20
A notable finding in our study was the expanded age range for MC onset in patients with AD, encompassing older age groups compared to patients with MC as their sole diagnosis, possibly due to persistent immune dysregulation. To the best of our knowledge, this specific observation has not been systematically reported or documented in prior cohort studies. Visible skin lesions of MC may have a psychological impact on patients, influencing self-consciousness and causing embarrassment and emotional distress. This may be more pronounced in older children, who are more aware of their appearance and social perceptions.23-25 These considerations should play a role in the management of MC.
Our study revealed that children with AD and MC displayed higher lesion counts, increased local inflammatory responses, and a more protracted resolution period compared to nonatopic children. In more than 50% of children with AD, MC took more than 1 year for resolution, whereas the majority of those without AD achieved resolution within 1 year. These findings may be attributed to AD-related immune dysregulation, influencing the natural course of MC. Consequently, it suggests that while nonatopic children with MC usually are managed through observation, atopic patients may benefit from an intervention-oriented approach.
Comparing atopic patients with and without MC showed a heightened occurrence of severe and extensive AD among those with concurrent MC. Several factors could contribute to this observation. On one hand, there could be a direct association between the extent and severity of AD, leading to an elevated susceptibility to MC. Conversely, MC might exacerbate immunologic dysregulation and intensify skin inflammation in atopic individuals.20 Additionally, itching related to both disorders may exacerbate inflammation and compromise the epidermal barrier, facilitating the spread of MC. This interplay suggests that each condition exacerbates the other in a self-reinforcing cycle. The importance of patient and caregiver education is underscored by recognizing these interactions. To manage both conditions effectively, health care providers should counsel patients and caregivers on maintaining proper skin care practices such as gentle cleansing with mild, fragrance-free products, regular moisturization, and avoidance of irritants, encourage them to avoid scratching, and recommend adopting an active treatment approach.
Our study had notable strengths. Firstly, a substantial sample size enhanced the statistical reliability of our findings. Additionally, valuable insights into the epidemiology and clinical aspects of AD and MC were obtained by utilizing real-world data from an outpatient dermatology practice. In our study, clinical evaluations covered body surface area involvement and disease severity for AD while also assessing lesion counts and the presence of inflammatory lesions for MC. This comprehensive approach facilitated a thorough analysis of both conditions. The extended data collection period not only allowed for observation of their clinical course and duration, but also enabled a detailed assessment of their interplay.
Our study also had several limitations. Primarily, its retrospective design relied on the accuracy and comprehensiveness of medical records, which may have introduced bias. The exclusion of some patients due to incomplete data further increased the potential for selection bias. Additionally, this study was conducted in a single outpatient dermatology practice in Israel, resulting in a study population composed predominantly of Jewish patients (94%), with a minority (6%) of Arab patients. Other ethnic groups, including Black, Asian, and Hispanic populations, were not represented. This reflects the country’s demographic composition rather than an intentional selection bias. However, the limited ethnic diversity reduces the generalizability of our findings. Differences in demographics, coding practices, health care utilization (eg, timeliness of seeking care, access to dermatology services), and treatment strategies also may impact the observed prevalence, clinical characteristics, and patient outcomes. Furthermore, while our study highlighted the potential advantages of a proactive treatment approach for atopic children with MC, it did not evaluate specific treatment protocols. Future research should aim to confirm the most efficacious therapeutic strategies for managing MC in atopic individuals and to include a more diverse population to better understand the applicability of findings across various ethnic groups.
Conclusion
Our study found a high prevalence of AD in children with MC and a strong bidirectional relationship between these conditions. Pediatric patients with AD display a broader age range for MC, greater lesion burden, increased local inflammatory responses, prolonged resolution times, and more extensive and severe AD.
Recognizing the interplay between MC and AD is crucial, highlighting the importance of health care providers educating patients and caregivers. Emphasizing skin hygiene, discouraging scratching, and implementing proactive treatment approaches can enhance the outcomes of both conditions. Further research into the underlying mechanisms of this association and effective therapeutic strategies for MC in atopic individuals is warranted.
Acknowledgments—The authors thank Zvi Segal, MD (Tel Hashomer, Israel) for his insightful contribution to the statistical analysis of the results. We would like to express our appreciation to the dedicated team of the dermatology practice in Netanya for the support throughout the performance of the study. Additionally, we thank all study participants and their parents for their participation and contribution to our research.
- Han H, Smythe C, Yousefian F, et al. Molluscum contagiosum virus evasion of immune surveillance: a review. J Drugs Dermatol. 2023;22182-189.
- Dohil MA, Lin P, Lee J, et al. The epidemiology of molluscum contagiosum in children. J Am Acad Dermatol. 2006;54:47-54.
- Silverberg NB. Pediatric molluscum: an update. Cutis. 2019;104:301-305;E1;E2.
- Forbat E, Al-Niaimi F, Ali FR. Molluscum contagiosum: review and update on management. Pediatr Dermatol. 2017;34:504-515.
- Olsen JR, Gallacher J, Piguet V, et al. Epidemiology of molluscum contagiosum in children: a systematic review. Fam Pract. 2014;31:130-136.
- Kakourou T, Zachariades A, Anastasiou T, et al. Molluscum contagiosum in Greek children: a case series. Int J Dermatol. 2005;44:221-223.
- Osio A, Deslandes E, Saada V, et al. Clinical characteristics of molluscum contagiosum in children in a private dermatology practice in the greater Paris area, France: a prospective study in 661 patients. Dermatology. 2011;222:314-320.
- Hebert AA, Bhatia N, Del Rosso JQ. Molluscum contagiosum: epidemiology, considerations, treatment options, and therapeutic gaps. J Clin Aesthet Dermatol. 2023;16(8 Suppl 1):S4-S11.
- Chao YC, Ko MJ, Tsai WC, et al. Comparative efficacy of treatments for molluscum contagiosum: a systematic review and network meta-analysis. J Dtsch Dermatol Ges. 2023;21:587-597.
- Garg N, Silverberg JI. Epidemiology of childhood atopic dermatitis. Clin Dermatol. 2015;33:281-288.
- Hale G, Davies E, Grindlay DJC, et al. What’s new in atopic eczema? an analysis of systematic reviews published in 2017. part 2: epidemiology, etiology, and risk factors. Clin Exp Dermatol. 2019;44:868-873.
- Tracy A, Bhatti S, Eichenfield LF. Update on pediatric atopic dermatitis. Cutis. 2020;106:143-146.
- Langan SM, Irvine AD, Weidinger S. Atopic dermatitis. Lancet. 2020;396:345-360.
- Silverberg JI. Public health burden and epidemiology of atopic dermatitis. Dermatol Clin. 2017;35:283-289.
- Manti S, Amorini M, Cuppari C, et al. Filaggrin mutations and molluscum contagiosum skin infection in patients with atopic dermatitis. Ann Allergy Asthma Immunol. 2017;119446-451.
- Seize M, Ianhez M, Cestari S. A study of the correlation between molluscum contagiosum and atopic dermatitis in children. An Bras Dermatol. 2011;86:663-668.
- Ren Z, Silverberg JI. Association of atopic dermatitis with bacterial, fungal, viral, and sexually transmitted skin infections. Dermatitis. 2020;31:157-164.
- Olsen JR, Piguet V, Gallacher J, et al. Molluscum contagiosum and associations with atopic eczema in children: a retrospective longitudinal study in primary care. Br J Gen Pract. 2016;66:E53-E58.
- Han JH, Yoon JW, Yook HJ, et al. Evaluation of atopic dermatitis and cutaneous infectious disorders using sequential pattern mining: a nationwide population-based cohort study. J Clin Med. 2022;11:3422.
- Silverberg NB. Molluscum contagiosum virus infection can trigger atopic dermatitis disease onset or flare. Cutis. 2018;102:191-194.
- Hayashida S, Furusho N, Uchi H, et al. Are lifetime prevalence of impetigo, molluscum and herpes infection really increased in children having atopic dermatitis? J Dermatol Sci. 2010;60:173-178.
- Simpson E, Bissonnette R, Eichenfield LF, et al. The Validated Investigator Global Assessment for Atopic Dermatitis (vIGA-AD): the development and reliability testing of a novel clinical outcome measurement instrument for the severity of atopic dermatitis. J Am Acad Dermatol. 2020;83:839-846.
- Olsen JR, Gallacher J, Finlay AY, et al. Time to resolution and effect on quality of life of molluscum contagiosum in children in the UK: a prospective community cohort study. Lancet Infect Dis. 2015;15:190-195.
- Ðurovic´ MR, Jankovic´ J, Spiric´ VT, et al. Does age influence the quality of life in children with atopic dermatitis? PLoS One. 2019;14:E0224618.
- Chernyshov PV. Stigmatization and self-perception in children with atopic dermatitis. Clin Cosmet Investig Dermatol. 2016;9:159-166.
Molluscum contagiosum (MC), which is caused by a DNA virus in the Poxviridae family, is a common viral skin infection that primarily affects children.1-4 The reported incidence and prevalence of MC exhibit notable geographic variation. Worldwide, annual incidence rates per 1000 individuals range from 3.1 to 25, and prevalence ranges from 0.27% to 34.6%.2-7
Molluscum contagiosum is diagnosed clinically and typically manifests as smooth, flesh-colored papules measuring 2 to 6 mm in diameter with central umbilication. It can manifest as a single lesion or multiple clustered lesions, or in a disseminated pattern. The primary mode of transmission is through contact with skin, lesions, or contaminated personal items, or via self-inoculation. The majority of cases are asymptomatic, but in some patients, MC may be associated with pruritus, tenderness, erythema, or irritation. When present, secondary bacterial infections can cause localized inflammation and pain.1,3,4 The pathogenesis hinges on MC virus replication within keratinocytes, disrupting cellular differentiation and keratinization. The virus persists in the host by influencing the immune response through various mechanisms, including interference with signaling pathways, apoptosis inhibition, and antigen presentation disruption.3,4
Molluscum contagiosum typically follows a self-limiting trajectory, resolving over several months to 2 years.3,4 The resolution timeframe is intricately linked to variables such as the patient’s immune profile, lesion burden, and treatment approach. For symptomatic lesions, a variety of treatment options have been described, including physical ablation (eg, cryotherapy, curettage) and topical agents such as potassium hydroxide, cantharidin, imiquimod, and salicylic acid.3,4,8,9
Atopic dermatitis (AD) is a common chronic relapsing inflammatory skin disorder. In the United States, its prevalence ranges from 15% to 30% in children and from 2% to 10% in adults, with ongoing evidence of a growing global incidence.10-14 While AD can emerge at any age, typical onset is during early childhood. The clinical manifestation of AD includes a spectrum of eczematous features, often accompanied by persistent itching. The pathogenesis is multifactorial, involving a complex interplay of genetic, immunologic, and environmental factors. Key contributors to this multifaceted process encompass a compromised epidermal barrier, alterations in the skin microbiome, and an immune dysregulation promoting a type 2 immune response. Epidermal barrier dysfunction can be attributed to various factors, including diminished ceramide production, altered lipid composition, the release of inflammatory mediators, and mechanical damage from the persistent itch-scratch cycle.10-13,15 These factors or their interplay may enhance the susceptibility of patients with AD to infections.
Several studies conducted across various geographic regions examining the relationship between MC and AD have reported variable findings.2,6,7,16-21 Published studies have reported a prevalence of AD in children with MC ranging from 13.2% to 43%.2,6,7,16-21 Although some studies suggest a higher rate of atopy in patients with MC, not all research has confirmed this association.16,21 Dohil et al2 reported a greater number of MC lesions in children with AD than those without an atopic background. Silverberg20 reported that in 10% (5/50) of children with MC, the onset of AD was triggered, and in 22% (11/50) MC was associated with flares of pre-existing AD.
In this study, we aimed to assess MC infection rates in children with AD, analyze the epidemiologic aspects and severity differences between atopic children with and without MC infection, and compare data from atopic and nonatopic children with MC.
Methods
In this retrospective cohort study, we analyzed the medical records of pediatric patients diagnosed with MC, AD, or both conditions at an outpatient dermatology practice in Netanya, HaSharon, Israel, from September 2013 to August 2022. Data were collected from the electronic medical records and included patient demographics, the clinical presentation of MC and/or AD at diagnosis, and the duration of both conditions. Only patients with complete data and at least 6 months of follow-up were included. Key epidemiologic characteristics assessed included patient sex, age at the initial visit, and age at the onset of MC and/or AD. Diagnoses of MC and AD were established through clinical examinations conducted by dermatologists. The clinical evaluation of AD encompassed the assessment of body surface area involvement (categorized as <5%, 5%-10%, or >10%). Atopic dermatitis severity was classified as mild, moderate, or severe using the validated Investigator Global Assessment Scale for Atopic Dermatitis.22 Clinical evaluation of MC included assessment of the number of lesions (categorized as ≤4, 5-9, or ≥10), presence of inflammatory lesions, and resolution times for individual lesions (categorized as <1 week, several weeks, or unknown), as well as the overall resolution time for all lesions (categorized as <6 months, 6-12 months, 13-18 months, or >18 months). The temporal relationship between the appearance of MC and AD also was assessed.
Statistical Analysis—Numbers and percentages were used for categorical variables. Continuous variables were represented by mean and standard deviation. Categorical variables were compared using the χ2 test, and continuous variables between groups were compared using the Student t test. All statistical tests were 2-sided, with statistical significance defined as P≤.05. Statistical analysis was performed using SPSS software version 28 (IBM).
Results
Study Population—A total of 610 children were included in the study; 263 (43%) were female and 347 (57%) were male. The patients ranged in age from 4 months to 10 years, with a mean (SD) age of 4.87 (1.82) years. Five hundred fifty-six (91%) patients had AD, and 336 (55%) had MC. Within this cohort, 274 (45%) children had AD only, 54 (9%) had MC only, and 282 (46%) had both AD and MC. Regarding the temporal sequence, among the 282 children who had both AD and MC, AD preceded MC in 203 (72%) cases, both conditions were diagnosed concomitantly in 43 (15%) cases, and MC preceded AD in 36 (13%) cases. For cases in which the MC diagnosis followed the diagnosis of AD, the mean (SD) time between each diagnosis was 3.17 (1.5) years.
Comparison of Atopic and Nonatopic Children With MC—Although a higher proportion of males were diagnosed with MC (with or without concurrent AD), the differences in sex distribution between the 2 groups did not reach statistical significance. Among all children with MC, the majority (81.5% [274/336]) were aged 1 to 6 years at presentation. Patients with MC as their sole diagnosis had a similar mean age compared with those with concurrent AD. However, a detailed age subgroup analysis revealed a notable distinction: in the group with MC as the sole diagnosis, the majority (95% [51/54]) were younger than 7 years. In contrast, in the combined MC and AD group, MC manifested across a wider age range, with 21% (58/282) of patients being older than 7 years. In MC cases associated with AD, a notably higher lesion count and increased local inflammatory response were observed compared to those without AD. The time for complete resolution of all MC lesions was substantially prolonged in patients with comorbid AD. Specifically, 93% (50/54) of patients with MC without comorbid AD achieved full resolution within 1 year, whereas 52% (146/282) of patients with comorbid AD required more than 1 year for resolution (eTable 1).
Comparison of Atopic Children With and Without MC—Sex, age distribution, and disease duration showed no differences between atopic patients with and without MC. Atopic patients with MC exhibited greater body surface area involvement and higher validated Investigator Global Assessment Scale for Atopic Dermatitis scores compared to atopic patients without MC (eTable 2).
Comment
This study examined the relationship between MC and AD in pediatric patients, revealing a notable correlation and yielding valuable epidemiologic and clinical insights. Consistent with previous research, our study demonstrated a high prevalence of AD in children with MC.2,6,7,16-21 Previous studies indicated AD rates of 13% to 43% in pediatric patients with MC, whereas our study found a higher prevalence (84%), signifying a substantial majority of patients with MC in our cohort had AD. This discrepancy arises from factors such as demographic, genetic, and environmental differences, along with differences in access to medical care, referral practices, and diagnostic approaches across health care systems.14
Our temporal analysis of MC and AD diagnoses offers important insights. In the majority (72% [203/282]) of cases, the diagnosis of AD preceded MC, supporting previous research suggesting that the underlying pathophysiology of AD heightens susceptibility to MC.15,17-20 Less frequently, MC was diagnosed before or concurrently with AD, indicating that MC may occasionally trigger or exacerbate milder or undiagnosed AD, as previously proposed.20
A notable finding in our study was the expanded age range for MC onset in patients with AD, encompassing older age groups compared to patients with MC as their sole diagnosis, possibly due to persistent immune dysregulation. To the best of our knowledge, this specific observation has not been systematically reported or documented in prior cohort studies. Visible skin lesions of MC may have a psychological impact on patients, influencing self-consciousness and causing embarrassment and emotional distress. This may be more pronounced in older children, who are more aware of their appearance and social perceptions.23-25 These considerations should play a role in the management of MC.
Our study revealed that children with AD and MC displayed higher lesion counts, increased local inflammatory responses, and a more protracted resolution period compared to nonatopic children. In more than 50% of children with AD, MC took more than 1 year for resolution, whereas the majority of those without AD achieved resolution within 1 year. These findings may be attributed to AD-related immune dysregulation, influencing the natural course of MC. Consequently, it suggests that while nonatopic children with MC usually are managed through observation, atopic patients may benefit from an intervention-oriented approach.
Comparing atopic patients with and without MC showed a heightened occurrence of severe and extensive AD among those with concurrent MC. Several factors could contribute to this observation. On one hand, there could be a direct association between the extent and severity of AD, leading to an elevated susceptibility to MC. Conversely, MC might exacerbate immunologic dysregulation and intensify skin inflammation in atopic individuals.20 Additionally, itching related to both disorders may exacerbate inflammation and compromise the epidermal barrier, facilitating the spread of MC. This interplay suggests that each condition exacerbates the other in a self-reinforcing cycle. The importance of patient and caregiver education is underscored by recognizing these interactions. To manage both conditions effectively, health care providers should counsel patients and caregivers on maintaining proper skin care practices such as gentle cleansing with mild, fragrance-free products, regular moisturization, and avoidance of irritants, encourage them to avoid scratching, and recommend adopting an active treatment approach.
Our study had notable strengths. Firstly, a substantial sample size enhanced the statistical reliability of our findings. Additionally, valuable insights into the epidemiology and clinical aspects of AD and MC were obtained by utilizing real-world data from an outpatient dermatology practice. In our study, clinical evaluations covered body surface area involvement and disease severity for AD while also assessing lesion counts and the presence of inflammatory lesions for MC. This comprehensive approach facilitated a thorough analysis of both conditions. The extended data collection period not only allowed for observation of their clinical course and duration, but also enabled a detailed assessment of their interplay.
Our study also had several limitations. Primarily, its retrospective design relied on the accuracy and comprehensiveness of medical records, which may have introduced bias. The exclusion of some patients due to incomplete data further increased the potential for selection bias. Additionally, this study was conducted in a single outpatient dermatology practice in Israel, resulting in a study population composed predominantly of Jewish patients (94%), with a minority (6%) of Arab patients. Other ethnic groups, including Black, Asian, and Hispanic populations, were not represented. This reflects the country’s demographic composition rather than an intentional selection bias. However, the limited ethnic diversity reduces the generalizability of our findings. Differences in demographics, coding practices, health care utilization (eg, timeliness of seeking care, access to dermatology services), and treatment strategies also may impact the observed prevalence, clinical characteristics, and patient outcomes. Furthermore, while our study highlighted the potential advantages of a proactive treatment approach for atopic children with MC, it did not evaluate specific treatment protocols. Future research should aim to confirm the most efficacious therapeutic strategies for managing MC in atopic individuals and to include a more diverse population to better understand the applicability of findings across various ethnic groups.
Conclusion
Our study found a high prevalence of AD in children with MC and a strong bidirectional relationship between these conditions. Pediatric patients with AD display a broader age range for MC, greater lesion burden, increased local inflammatory responses, prolonged resolution times, and more extensive and severe AD.
Recognizing the interplay between MC and AD is crucial, highlighting the importance of health care providers educating patients and caregivers. Emphasizing skin hygiene, discouraging scratching, and implementing proactive treatment approaches can enhance the outcomes of both conditions. Further research into the underlying mechanisms of this association and effective therapeutic strategies for MC in atopic individuals is warranted.
Acknowledgments—The authors thank Zvi Segal, MD (Tel Hashomer, Israel) for his insightful contribution to the statistical analysis of the results. We would like to express our appreciation to the dedicated team of the dermatology practice in Netanya for the support throughout the performance of the study. Additionally, we thank all study participants and their parents for their participation and contribution to our research.
- Han H, Smythe C, Yousefian F, et al. Molluscum contagiosum virus evasion of immune surveillance: a review. J Drugs Dermatol. 2023;22182-189.
- Dohil MA, Lin P, Lee J, et al. The epidemiology of molluscum contagiosum in children. J Am Acad Dermatol. 2006;54:47-54.
- Silverberg NB. Pediatric molluscum: an update. Cutis. 2019;104:301-305;E1;E2.
- Forbat E, Al-Niaimi F, Ali FR. Molluscum contagiosum: review and update on management. Pediatr Dermatol. 2017;34:504-515.
- Olsen JR, Gallacher J, Piguet V, et al. Epidemiology of molluscum contagiosum in children: a systematic review. Fam Pract. 2014;31:130-136.
- Kakourou T, Zachariades A, Anastasiou T, et al. Molluscum contagiosum in Greek children: a case series. Int J Dermatol. 2005;44:221-223.
- Osio A, Deslandes E, Saada V, et al. Clinical characteristics of molluscum contagiosum in children in a private dermatology practice in the greater Paris area, France: a prospective study in 661 patients. Dermatology. 2011;222:314-320.
- Hebert AA, Bhatia N, Del Rosso JQ. Molluscum contagiosum: epidemiology, considerations, treatment options, and therapeutic gaps. J Clin Aesthet Dermatol. 2023;16(8 Suppl 1):S4-S11.
- Chao YC, Ko MJ, Tsai WC, et al. Comparative efficacy of treatments for molluscum contagiosum: a systematic review and network meta-analysis. J Dtsch Dermatol Ges. 2023;21:587-597.
- Garg N, Silverberg JI. Epidemiology of childhood atopic dermatitis. Clin Dermatol. 2015;33:281-288.
- Hale G, Davies E, Grindlay DJC, et al. What’s new in atopic eczema? an analysis of systematic reviews published in 2017. part 2: epidemiology, etiology, and risk factors. Clin Exp Dermatol. 2019;44:868-873.
- Tracy A, Bhatti S, Eichenfield LF. Update on pediatric atopic dermatitis. Cutis. 2020;106:143-146.
- Langan SM, Irvine AD, Weidinger S. Atopic dermatitis. Lancet. 2020;396:345-360.
- Silverberg JI. Public health burden and epidemiology of atopic dermatitis. Dermatol Clin. 2017;35:283-289.
- Manti S, Amorini M, Cuppari C, et al. Filaggrin mutations and molluscum contagiosum skin infection in patients with atopic dermatitis. Ann Allergy Asthma Immunol. 2017;119446-451.
- Seize M, Ianhez M, Cestari S. A study of the correlation between molluscum contagiosum and atopic dermatitis in children. An Bras Dermatol. 2011;86:663-668.
- Ren Z, Silverberg JI. Association of atopic dermatitis with bacterial, fungal, viral, and sexually transmitted skin infections. Dermatitis. 2020;31:157-164.
- Olsen JR, Piguet V, Gallacher J, et al. Molluscum contagiosum and associations with atopic eczema in children: a retrospective longitudinal study in primary care. Br J Gen Pract. 2016;66:E53-E58.
- Han JH, Yoon JW, Yook HJ, et al. Evaluation of atopic dermatitis and cutaneous infectious disorders using sequential pattern mining: a nationwide population-based cohort study. J Clin Med. 2022;11:3422.
- Silverberg NB. Molluscum contagiosum virus infection can trigger atopic dermatitis disease onset or flare. Cutis. 2018;102:191-194.
- Hayashida S, Furusho N, Uchi H, et al. Are lifetime prevalence of impetigo, molluscum and herpes infection really increased in children having atopic dermatitis? J Dermatol Sci. 2010;60:173-178.
- Simpson E, Bissonnette R, Eichenfield LF, et al. The Validated Investigator Global Assessment for Atopic Dermatitis (vIGA-AD): the development and reliability testing of a novel clinical outcome measurement instrument for the severity of atopic dermatitis. J Am Acad Dermatol. 2020;83:839-846.
- Olsen JR, Gallacher J, Finlay AY, et al. Time to resolution and effect on quality of life of molluscum contagiosum in children in the UK: a prospective community cohort study. Lancet Infect Dis. 2015;15:190-195.
- Ðurovic´ MR, Jankovic´ J, Spiric´ VT, et al. Does age influence the quality of life in children with atopic dermatitis? PLoS One. 2019;14:E0224618.
- Chernyshov PV. Stigmatization and self-perception in children with atopic dermatitis. Clin Cosmet Investig Dermatol. 2016;9:159-166.
Epidemiologic and Clinical Evaluation of the Bidirectional Link Between Molluscum Contagiosum and Atopic Dermatitis in Children
Epidemiologic and Clinical Evaluation of the Bidirectional Link Between Molluscum Contagiosum and Atopic Dermatitis in Children
Practice Points
- There is a high prevalence of atopic dermatitis (AD) in children with molluscum contagiosum, with a strong bidirectional relationship between these conditions.
- Children with AD display a broader age range for molluscum contagiosum, greater lesion burden, increased local inflammatory responses, prolonged resolution time, and more extensive and severe disease.

A Cross-Sectional Analysis of TikTok Skin Care Routines and the Associated Environmental Impact
A Cross-Sectional Analysis of TikTok Skin Care Routines and the Associated Environmental Impact
To the Editor:
The popularity of the social media platform TikTok, which is known for its short-form videos, has surged in recent years. Viral videos demonstrating skin care routines reach millions of viewers,1 showcasing specific products, detailing beauty regimens, and setting fads that many users eagerly follow. These trends often influence consumer behavior—in 2023, viral videos using the tag #TikTokMadeMeBuy lead to a 14% growth in the sale of skin care products.2 However, they also encourage purchasing decisions that may escalate environmental waste through plastic packaging and single-use products. In this study, we analyzed videos on TikTok to assess the environmental impact of trending skin care routines. By examining the types of products promoted, their packaging, and the frequency with which they appear in viral content, we aimed to investigate how these trends, which may be imitated by users, impact the environment.
A search of TikTok videos using #skincareroutine was conducted on June 21, 2024. Sponsored content, non–English language videos, videos without demonstrated skin care routines, and videos showing makeup routines were excluded from our analysis. Data collected from each video included username, date posted, number of likes, total number of skin care products used, number of single-use skin care products used, average amount of product used, number of skin care applicators used, and number of single-use applicators used. Single-use items, defined as those intended for one-time use and subsequent disposal, were identified visually by packaging, manufacturer intent, and common consumer usage patterns. The amount of product used per application was graded on a scale of 1 to 3 (1=pea-sized amount or less; 2=single full pump/spray; 3=multiple pumps/sprays). Videos were categorized as personal (ie, skin care routine walk-throughs by the creator) or autonomous sensory meridian response (ASMR)(focused on product sounds and aesthetics).3 A Mann-Whitney U test was utilized to statistically compare the 2 groups. Statistical analysis was performed using Microsoft Excel (α=0.05).
A total of 50 videos met the inclusion criteria and were included in the analysis. The average number of likes per video was 499,696.15, with skin care routines featuring an average of 6.4 unique products (Table). There was a weak positive correlation (r=0.1809) between the number of skin care products used and the number of likes. A total of 320 products were used across the videos, 23 of which were single-use (7.2%).On average, single-use skin care items were used 0.46 times per routine, comprising a mean 7.99% of total products per video. The average score for the amount of product used per application was 2.18. There was no difference in personal vs ASMR videos with regard to the total number of skin care products used or the average amount of product used per application (P>.05). Thirty-three (70.2%) of the 47 applicators used across all videos were single-use. An average of 0.94 applicators per routine were utilized, with a mean 68.83% being single-use applicators. Common single-use products were toner wipes and eye patches, and single-use applicators included cotton pads and plastic spatulas.
Our findings indicated a prevalence of multiple products and large amount of product used in trending skin care routines, suggesting a shift toward multistep skin care. This implies a high rate of product consumption that may accelerate the carbon footprint associated with skin care products,3 which could contribute to climate change and environmental degradation. Consumers also may feel compelled to purchase and discard numerous partially used products in order to keep up with the latest trends, exacerbating the environmental impact. Furthermore, the utilization of single-use products and applicators contributes to increased plastic waste, pollution, and resource depletion. Single-use items often are difficult to recycle due to their mixed materials and small size,4,5 and therefore they can accumulate in landfills and oceans. This impact can be mitigated by switching to reusable applicators, refillable packaging, and biodegradable materials.
The substantial average number of likes per video indicates high engagement with skin care content among TikTok users. The continued popularity of complex multistep skin care routines, despite a weak correlation between the number of skin care products used and the number of likes per video, likely stems from factors such as aesthetic appeal, ASMR effects, and creators’ established followings, which may drive user engagement to contribute to unsustainable consumption patterns. Factors such as presentation style, aesthetics, or creators’ pre-existing online following may have a major impact on how well a video performs on TikTok. The similarity between personal and ASMR videos, particularly in the number of products used and the amount applied, suggests that both formats employ common approaches to meet audience expectations and align with promotional trends, relying more on sensory and aesthetic strategies than substantive differences in skin care routines.
Our use of only one tag in our search as well as the subjective quantity scale limits the generalizability of these findings to broader TikTok skin care content.
Overall, our study underscores the role of brands and social media influencers in skin care education and promotion of sustainable practices. The extensive number of products used and generous application of each product in skin care routines demonstrated in TikTok videos may mislead viewers into believing that using more product improves outcomes, when often, less is more. We recommend that dermatologists counsel patients about informed skin care regimens that prioritize individual needs over social media fads.
- Pagani K, Lukac D, Martinez R, et al. Slugging: TikTokTM as a source of a viral “harmless” beauty trend. Clin Dermatol. 2022;40:810-812. doi:10.1016/j.clindermatol.2022.08.005
- Stern C. TikTok drives $31.7B in beauty sales: how viral trends are shaping the future of cosmetics. CosmeticsDesign. August 20, 2024. Accessed June 24, 2025. https://www.cosmeticsdesign.com/Article/2024/08/20/tiktok-drives-31.7b-in-beauty-sales-how-viral-trends-are-shaping-the-future-of-cosmetics/
- Fountain C. ASMR content saw huge growth on YouTube, but now creators are flocking to TikTok instead. Business Insider. July 4, 2022. Accessed June 24, 2025. https://www.businessinsider.com/asmr-tiktok-instead-of-youtube-growth-subscribers-2022-7
- Rathore S, Schuler B, Park J. Life cycle assessment of multiple dispensing systems used for cosmetic product packaging. Packaging Technol Sci. 2023;36:533-547. doi:10.1002/pts.2729
- Shaw S. How to actually recycle your empty beauty products. CNN Underscored. Updated April 17, 2024. Accessed June 24, 2025. https://www.cnn.com/cnn-underscored/beauty/how-to-recycle-beauty-products
To the Editor:
The popularity of the social media platform TikTok, which is known for its short-form videos, has surged in recent years. Viral videos demonstrating skin care routines reach millions of viewers,1 showcasing specific products, detailing beauty regimens, and setting fads that many users eagerly follow. These trends often influence consumer behavior—in 2023, viral videos using the tag #TikTokMadeMeBuy lead to a 14% growth in the sale of skin care products.2 However, they also encourage purchasing decisions that may escalate environmental waste through plastic packaging and single-use products. In this study, we analyzed videos on TikTok to assess the environmental impact of trending skin care routines. By examining the types of products promoted, their packaging, and the frequency with which they appear in viral content, we aimed to investigate how these trends, which may be imitated by users, impact the environment.
A search of TikTok videos using #skincareroutine was conducted on June 21, 2024. Sponsored content, non–English language videos, videos without demonstrated skin care routines, and videos showing makeup routines were excluded from our analysis. Data collected from each video included username, date posted, number of likes, total number of skin care products used, number of single-use skin care products used, average amount of product used, number of skin care applicators used, and number of single-use applicators used. Single-use items, defined as those intended for one-time use and subsequent disposal, were identified visually by packaging, manufacturer intent, and common consumer usage patterns. The amount of product used per application was graded on a scale of 1 to 3 (1=pea-sized amount or less; 2=single full pump/spray; 3=multiple pumps/sprays). Videos were categorized as personal (ie, skin care routine walk-throughs by the creator) or autonomous sensory meridian response (ASMR)(focused on product sounds and aesthetics).3 A Mann-Whitney U test was utilized to statistically compare the 2 groups. Statistical analysis was performed using Microsoft Excel (α=0.05).
A total of 50 videos met the inclusion criteria and were included in the analysis. The average number of likes per video was 499,696.15, with skin care routines featuring an average of 6.4 unique products (Table). There was a weak positive correlation (r=0.1809) between the number of skin care products used and the number of likes. A total of 320 products were used across the videos, 23 of which were single-use (7.2%).On average, single-use skin care items were used 0.46 times per routine, comprising a mean 7.99% of total products per video. The average score for the amount of product used per application was 2.18. There was no difference in personal vs ASMR videos with regard to the total number of skin care products used or the average amount of product used per application (P>.05). Thirty-three (70.2%) of the 47 applicators used across all videos were single-use. An average of 0.94 applicators per routine were utilized, with a mean 68.83% being single-use applicators. Common single-use products were toner wipes and eye patches, and single-use applicators included cotton pads and plastic spatulas.
Our findings indicated a prevalence of multiple products and large amount of product used in trending skin care routines, suggesting a shift toward multistep skin care. This implies a high rate of product consumption that may accelerate the carbon footprint associated with skin care products,3 which could contribute to climate change and environmental degradation. Consumers also may feel compelled to purchase and discard numerous partially used products in order to keep up with the latest trends, exacerbating the environmental impact. Furthermore, the utilization of single-use products and applicators contributes to increased plastic waste, pollution, and resource depletion. Single-use items often are difficult to recycle due to their mixed materials and small size,4,5 and therefore they can accumulate in landfills and oceans. This impact can be mitigated by switching to reusable applicators, refillable packaging, and biodegradable materials.
The substantial average number of likes per video indicates high engagement with skin care content among TikTok users. The continued popularity of complex multistep skin care routines, despite a weak correlation between the number of skin care products used and the number of likes per video, likely stems from factors such as aesthetic appeal, ASMR effects, and creators’ established followings, which may drive user engagement to contribute to unsustainable consumption patterns. Factors such as presentation style, aesthetics, or creators’ pre-existing online following may have a major impact on how well a video performs on TikTok. The similarity between personal and ASMR videos, particularly in the number of products used and the amount applied, suggests that both formats employ common approaches to meet audience expectations and align with promotional trends, relying more on sensory and aesthetic strategies than substantive differences in skin care routines.
Our use of only one tag in our search as well as the subjective quantity scale limits the generalizability of these findings to broader TikTok skin care content.
Overall, our study underscores the role of brands and social media influencers in skin care education and promotion of sustainable practices. The extensive number of products used and generous application of each product in skin care routines demonstrated in TikTok videos may mislead viewers into believing that using more product improves outcomes, when often, less is more. We recommend that dermatologists counsel patients about informed skin care regimens that prioritize individual needs over social media fads.
- Pagani K, Lukac D, Martinez R, et al. Slugging: TikTokTM as a source of a viral “harmless” beauty trend. Clin Dermatol. 2022;40:810-812. doi:10.1016/j.clindermatol.2022.08.005
- Stern C. TikTok drives $31.7B in beauty sales: how viral trends are shaping the future of cosmetics. CosmeticsDesign. August 20, 2024. Accessed June 24, 2025. https://www.cosmeticsdesign.com/Article/2024/08/20/tiktok-drives-31.7b-in-beauty-sales-how-viral-trends-are-shaping-the-future-of-cosmetics/
- Fountain C. ASMR content saw huge growth on YouTube, but now creators are flocking to TikTok instead. Business Insider. July 4, 2022. Accessed June 24, 2025. https://www.businessinsider.com/asmr-tiktok-instead-of-youtube-growth-subscribers-2022-7
- Rathore S, Schuler B, Park J. Life cycle assessment of multiple dispensing systems used for cosmetic product packaging. Packaging Technol Sci. 2023;36:533-547. doi:10.1002/pts.2729
- Shaw S. How to actually recycle your empty beauty products. CNN Underscored. Updated April 17, 2024. Accessed June 24, 2025. https://www.cnn.com/cnn-underscored/beauty/how-to-recycle-beauty-products
A Cross-Sectional Analysis of TikTok Skin Care Routines and the Associated Environmental Impact
A Cross-Sectional Analysis of TikTok Skin Care Routines and the Associated Environmental Impact
PRACTICE POINTS
- Social media platforms are increasingly influential in shaping consumer skin care habits, particularly among younger demographics.
- Dermatologists should be aware of the aesthetic-driven nature of online skin care trends when advising patients on product use.
- Viral skin care routines often feature multiple products and applicators, potentially encouraging excessive product use and waste.

Demographic and Clinical Factors Associated With PD-L1 Testing of Veterans With Advanced Non-Small Cell Lung Cancer
Background
Programmed death-ligand 1 (PD-L1) checkpoint inhibitors revolutionized the treatment of advanced non-small cell lung cancer (aNSCLC) by improving overall survival compared to chemotherapy. PD-L1 biomarker testing is paramount for informing treatment decisions in aNSCLC. Real-world data describing patterns of PD-L1 testing within the Veteran Health Administration (VHA) are limited. This retrospective study seeks to evaluate demographic and clinical factors associated with PD-L1 testing in VHA.
Methods
Veterans diagnosed with aNSCLC from 2019-2022 were identified using VHA’s Corporate Data Warehouse. Wilcoxon Rank Sum and Chi- Square tests measured association between receipt of PD-L1 testing and patient demographic and clinical characteristics at aNSCLC diagnosis. Logistic regression assessed predictors of PD-L1 testing, and subgroup analyses were performed for significant interactions.
Results
Our study included 4575 patients with aNSCLC; 57.0% received PD-L1 testing. The likelihood of PD-L1 testing increased among patients diagnosed with aNSCLC after 2019 vs during 2019 (OR≥1.118, p≤0.035) and in Black vs White patients (OR=1.227, p=0.011). However, the following had decreased likelihood of PD-L1 testing: patients with stage IIIB vs IV cancer (OR=0.683, p=0.004); non vs current/former smokers (OR=0.733, p=0.039); squamous (OR=0.863, p=0.030) or NOS (OR=0.695,p=0.013) vs. adenocarcinoma histology. Interactions were observed between patient residential region and residential rurality (p=0.003), and region and receipt of oncology community care consults (OCCC) (p=0.030). Patients in rural Midwest (OR=0.445,p=0.004) and rural South (OR=0.566, p=0.032) were less likely to receive PD-L1 testing than Metropolitan patients. Across patients with OCCC, Western US patients were more likely to receive PD-L1 testing (OR=1.554, p=0.001) than patients in other regions. However, within Midwestern patients, those without a OCCC were more likely to receive PD-L1 testing (OR=1.724, p< 0.001) than those with a OCCC. High comorbidity index (CCI≥3) is associated with an increased likelihood of PD-L1 testing in a univariable model (OR=1.286 vs. CCI=0,p=0.009), but not in the multivariable model (p=0.278).
Conclusions
We identified demographic and clinical factors, including regional differences in rurality and OCCC patterns, associated with PD-L1 testing. These factors can focus ongoing efforts to improve PD-L1 testing and efforts to be more in line with recommended care.

Survival Outcomes of Skin Adnexal Tumors: A National Cancer Database Analysis
Purpose
Skin adnexal tumors (SAT) include a group of benign and malignant appendageal tumors that arise from hair follicles, sebaceous glands, or sweat glands. They typically appear as small, painless bumps or nodules on the skin, and are more common in men compared to women. The 5-year overall SAT survival rate ranges from 74-90%. To better understand the differences in survival outcomes based on subtypes of SAT, the National Cancer Database (NCDB) was analyzed.
Methods
A retrospective cohort study of 11,627 patients with histologically confirmed SAT between 2004 and 2021 was conducted across 1,500 Commission on Cancer facilities located in the US and Puerto Rico. Demographic factors such as sex, age, and race were analyzed using Pearson Chi-squared tests, and survival outcomes were analyzed by Kaplan- Meier survival analysis. P value < 0.05 was considered statistically significant.
Results
Most patients with SAT were male (57.3%). The average age at diagnosis was 65.9 (SD=14.4, range 0-90). Of the patient sample, 87.2% were White, 7.6% Black, 2.5% Asian, and 2.7% other. Several subtypes disproportionately affected Black individuals, including apocrine adenocarcinoma (15.7%) and hidradenocarcinoma (13.6%). The estimated 5-year survival of SAT was 74.9% with an overall survival of 135.8 months (SE=1.1). Sebaceous carcinoma (which accounts for 41.8% of all cases) had the lowest average survival time of 119.6 months (SE=1.8), while digital papillary adenocarcinoma had the highest survival at around 183.5 months (SE=4.6).
Conclusions
This study supports a higher frequency of SAT among men. While White patients were more likely to get SAT overall, including the most common sebaceous carcinoma, Black race were associated with higher frequency of rarer subtypes. The average age of diagnosis of SAT mimics other non-melanoma skin cancers, but has a lower overall survival rate. Future studies should consider other risk factors that may be impacting the differences in survival outcomes to guide treatment and address health disparities among the various subtypes.
Timeliness of Specialty Palliative Care for Veterans With Cancer: An Analysis of Administrative Data
Background
Studies show that early referral to Specialty Palliative Care (SPC) can improve patient- reported outcomes among Veterans with cancer; quality metrics include referral within 8 weeks of an advanced cancer diagnosis. In this study, we explored timeliness of specialty referrals and compared various factors.
Methods
We identified our cohort using Department of Veterans Affairs (VA) Corporate Data Warehouse (CDW). Eligibility criteria included active or history of cancer—using a peer-reviewed, in-house list of ICD-9 and ICD-10 codes—between 2013-2023. We stratified our cohort of Veterans using factors including cancer stage, rurality, and care assessment needs (CAN) scores. We performed survival analyses to look at time to SPC from initial diagnosis and peak CAN score. Predictors of utilization were evaluated using multinomial regression and Cox proportional hazards models through R.
Results
Using CDW’s oncology domain, we identified 475,775 Veterans. 28% received SPC. Most received it near the end of their life as evidenced by the mortality rates (79.5%) in the early period following SPC consultation. Median time to SPC was 515 days. There was a significant difference in utilization rates between urban and rural Veterans (Wilcoxon W-statistic = 2.31E+10, p < 0.001). Peak CAN scores ranged from 0 to 0.81, median peak of 0.057 and interquartile range of 0.1. Multinomial regression model indicated statistically significant associations of advanced cancer (Stages 3 and 4) with timing of SPC. Stage 4 cancer showed the strongest association with receipt of palliative care within 60 days of initial diagnosis (OR 4.8, 95% CI: 4.69-4.93, p < 0.001), suggesting higher stage disease increases the likelihood of palliative care referral and accelerates the timing of these referrals.
Conclusions
We found Veterans received SPC from a broad range of peak CAN scores (0 to 0.81), suggesting that absolute CAN scores may not be clinically actionable indicators but perhaps indicative of changes in condition warranting referral. Stage IV cancer at diagnosis was associated with early SPC. The significant differences in utilization rates between urban and rural patients highlight potential access barriers that should be addressed.
Uncovering Food Insecurity in Veterans with Cancer Distress
Background
To close the food insecurity gap by providing food assistance and increasing opportunities for screening in Veterans receiving cancer treatment at a VA outpatient cancer clinic. Food Insecurity is associated with chronic disease such as cancer given insufficient access to nutritious foods leading to nutritional deficiencies and worsening health outcomes. The rates of food insecurity among Veterans revealed 28% of female veterans and 16% overall in male Veterans were faced with limited or uncertain access to adequate food.
Methods
A pivotal distress screening occurs at time of education consult or cycle 1 day 1 of antineoplastic therapy. A positive screening for any practical concern generates a discussion about food insecurity. A positive distress screen triggers an oncology social work referral to complete a systematic screening assessing circumstances and offering resources for needs (ACORN).
Results
Root cause analysis uncovered 24% of Veterans with cancer screened positive for food insecurity in the 9E oncology outpatient clinic. Post-implementation of robust screenings and conversation initiatives identified 36 unique Veterans who received 251 meals from July to December 2024.
Sustainability/Scalability
Prospective screening of Veterans at the time of a cancer diagnosis and ongoing screening during cancer treatment is the first step toward uncovering food insecurity and addressing this social determinate of health. A standard operating procedure following VA guidance and distress management guidelines should be updated as required. Oversight of the cancer leadership team annually evaluates the distress process, and the findings are reported to the cancer committee.
Conclusions
Uncovering food insecurity in Veterans at time of diagnosis and during cancer treatment is critical to optimize treatment outcomes. A systematic and robust screening standard operating procedure is key to implement. Veterans are a unique population with a spectrum of socioeconomic needs. Case management conferences or weekly huddles to discuss the Veteran’s needs will ensure food insecurity is addressed. Collection and analysis of screening data will highlight a program’s food insecurity need and supports community partnerships to available food resources and the opportunity to create a cancer outpatient clinic food hub for Veterans receiving cancer treatment.
Enhancing Molecular Testing Documentation in Prostate Cancer
Background
Prostate cancer is the most common non-cutaneous malignancy at the Veterans Health Administration (VHA) and every year approximately 15,000 Veterans are diagnosed and treated. Many advanced prostate cancer cases harbor genetic mutations that significantly impact prognosis, treatment decisions, and familial screening. In February 2021, the Prostate Cancer Molecular Testing Pathway (PCMTP) flow map was developed to increase appropriate genetic testing.
Methods
VHA initiated the Oncology Clinical Pathways (OCP) program to standardize cancer care for Veterans. The PCMTP was developed by a multidisciplinary team that created interactive templates within the Computerized Patient Record System (CPRS), to facilitate identification of eligible Veterans for germline and comprehensive genomic profiling (CGP). Clinical decision-making for these tests is documented as Health Factors (HF), in CPRS, allowing for assessment of pathway adherence and overall uptake.
Results
The PCMTP has achieved success, as there is over 90% compliance to molecular testing among participating Veterans which exceeds the pathway benchmark of 80%. PCMTP has been utilized at 88 VA sites, by over 700 distinct VA providers, with over 7,000 Veterans participating. This implementation has yielded over 19,200 Health Factors within CPRS.
Conclusions
The PCMTP has markedly improved the documentation and application of germline and CGP testing among Veterans diagnosed with prostate cancer. By facilitating genomic testing in appropriate patients, the PCMTP aims to enhance patient outcomes and optimize the quality of care. Prior to PCMTP establishment, assessing the prevalence of germline and CGP testing in eligible Veterans posed significant challenges. Future work will concentrate on increasing PCMTP utilization, evaluating downstream outcomes from genomic testing, including the identification of pathogenic variants, utilization of genetic counseling services, referrals to clinical trials, and the genomic impact on treatment strategies.

Rapid Implementation of a Clinical Workflow Support Tool to Engage Rural Veterans about a Smoking Cessation Trial
Background
Offering participation in clinical trials is a standard of care practice in oncology. It is also considered a quality indicator by various professional cancer societies, including the American Societies of Hematology (ASH) and Clinical Oncology (ASCO). In 2023, VA launched Clinical Cancer Research Services (CCRS) to ensure that all Veterans with cancer can participate in a clinical trial should they choose to do so. Research teams struggle to identify and engage potentially eligible patients. This is a complex process involving eligibility screening, outreach, and personalized support, which frequently involves a manual workflow with inefficiencies, delays, and missed opportunities for patients. To support CCRS’s mission, we used VA Enterprise Cloud (VAEC) to rapidly develop a clinical workflow support application for CCRS team members.
Methods
We used an internally developed framework to rapidly define program aims, provider workflows, opportunities to augment with data products, and lean principles applied to health information technology to design a clinical workflow supporting application. Data products leveraged VAEC’s Summit Data Platform (SDP), an open, multi-cloud platform for ingesting, curating, and managing multi-source VHA data into usable products. User interface was developed in a low code/no code power platform environment, which integrates with SDP and is also available in VAEC.
Results
An initial aim was identified as supporting engagement for the ‘Reaching Rural Cancer Survivors Who Smoke Using Text-based Cessation Interventions’ study. Augmented workflow was identified by meeting principal stakeholders and staff. Data product development involved retrieval of cancer diagnoses from the VA cancer registry system and smoking status from CDW HealthFactors. Rural residence was identified using 2023 Rural-Urban Continuum Codes. Application design, testing and refinement followed. Design to implementation was accomplished over the span of two months: from Aug 5, 2024 to Oct 3, 2024. Over the next seven months, the application identified 2,603 potentially eligible Veterans, and a single navigator using the tool was able to review 456 cases, send 189 study letters, and enroll 5 Veterans.
Conclusions
Clinical workflow support tools that leverage cloud infrastructure such as VAEC and Summit Data Platform can improve system efficiencies and increase access to clinical trials.

Hematology and Oncology Staffing Levels for Fiscal Years 19–24
Background
Department of Veterans Affairs (VA) faces a landscape of increasingly complex practice, especially in Hematology/Oncology (H/O), and a nationwide shortage of healthcare providers, while serving more Veterans than ever before. To understand current and future staffing needs, the VA National Oncology Program performed an assessment of H/O staffing, including attending physicians, residents/ fellows, licensed independent practitioners (LIPs) (nurse practitioners/physician assistants), and nurses for fiscal years (FY) 19–24.
Methods
Using VA Corporate Data Warehouse, we identified H/O visits in VA from 10/01/2018 through 09/30/2024 using stop codes. No-show (< 0.00001%) and National TeleOncology appointments (1%) were removed. We retrieved all notes associated with resulting visits and used area-ofspecialization and provider-type data to identify all attending physicians, trainees, LIPs, and nurses who authored or cosigned these notes. We identified H/O staff as 1. those associated with H/O clinic locations, 2. physicians who consistently cosigned H/O notes authored by fellows and LIPs associated with H/O locations, 3. fellows and LIPs authoring notes that were then cosigned by H/O physicians, and 4. nurses authoring notes associated with H/O visits.
Analysis
For each FY, we obtained total numbers of visits, unique patients, and care-providing staff by type. For validation, collaborating providers at several sites reviewed visit information, and a colleague also performed an independent, parallel data extraction. We adjusted FY totals to account for the growing patient population by dividing unique staff count by number of unique patients and multiplying by 200,000 (the approximate number of unique patients in FY19).
Results
From FY19 through FY24, VA Hematology/ Oncology saw a 14.6% rise in unique patients (from 232,084 to 265,926) and a 15.4% rise in visits (from 923,175 to 1,065,186). The absolute number of attendings rose by 4 (0.6%); of LIPs, by 138 (14.4%); and of nurses, by 142 (4.9%); trainees fell by 102 (4.3%). Adjusted to 200,000 patients, the number of attendings fell by 76 (12.3%); LIPs, by 1 (0.1%); trainees, by 335 (16.5%); and nurses, by 211 (8.4%).
Conclusions
Adjusted to number of Veterans, there are 10.4% fewer staff in Hematology/Oncology in FY24 compared to FY19.