User login
The Urology Prostate Cancer Note, One Tool to Increase Prostate Cancer Clinical Pathway Utilization
Background
Prostate cancer is the most common non-cutaneous malignancy diagnosis within the Department of Veterans Affairs (VA). The Prostate Cancer Clinical Pathways (PCCP) were developed to enable providers to treat all Veterans with prostate cancer at subject matter expert level.
Methods
The PCCP was launched in February 2021; however, provider documentation of PCCP is variable across the VA healthcare system and within the PCCP, specific flow maps have differential use. To increase urology specific flow map use, a collaboration between the National Surgery Office and National Oncology Program was established to develop a Urology Prostate Cancer Note (UPCN). The UPCN was designed by urologists with assistance from a medical oncologist and a clinical applications coordinator.
Results
The UPCN functions as a working clinical note for urologists and has the PCCPs embedded into reminder dialog templates, which when completed generate health factors. The health factors that are generated from the UPCN are data mined to record PCCP use and to perform data analytics. Since the UPCN national deployment on 9/6/24, documentation of high risk prostate cancer pathway utilization has increased 75% from 226 unique Veterans prior to launch to 395 unique Veterans after launch.
Conclusions
This collaborative effort did improve pathway utilization and documentation however other tools will need to be developed to improve provider PCCP documentation.
Expansion of an Intervention to Ensure Accuracy and Usefulness of a SQL Code Identifying Oncology Patients for VACCR
Purpose
The Veterans Affairs Central Cancer Registry (VACCR) is a data management system for cancer surveillance and epidemiologic-based efforts, seeking to reduce the overall cancer burden. In 2024, the local VACCR successfully implemented a Structured Query Language (SQL) code, created to identify documents in the electronic medical record (EMR) with associated ICD-10 codes matching reportable cancer cases in the Surveillance, Epidemiology, and End Results (SEER) list. In 2025, code application expansion began at four additional VISN9 sites.
Outcomes Studied
Accuracy and usefulness of SQL code application in a significantly larger population and a diagnosis-specific population.
Methods
Local Cancer Program leadership collaborated with VISN9 leadership to expand the SQL code to the four sites’ EMR, identifying the Veteran’s name, social security number, location by city/state/county, and visit-associated data including location, ICD-10 code, and visit year. Data validation focused on ICD- 10-specific data and quality replication.
Results
After SQL code application to Mt Home TN VACCR data, 750 unique, randomized charts from 2015-2025 were selected for accuracy review. Data validation found that 90.5% (679) had a reportable cancer; 14.9% (112) were not entered into VACCR. 9.5% (71) were not reportable. The SQL code was applied to Lexington data to identify colorectal cancer (CRC) (ICD-10 codes C17-C21.9). 746 charts from 2015-2025 were identified. 88.9% (663) had a reportable CRC; 14.9% (111) of those were not entered into VACCR, and 11% (83) were not reportable. Most cases not entered into VACCR at both sites were cases in which the majority of care was provided through Care in the Community (CITC). Historically, identification of CITC-provided oncologic care has been manual and notoriously difficult.
Conclusions
This study demonstrated the feasibility and accuracy of the SQL code in the identification of Veterans with diagnoses matching the SEER list in a large population and at a diagnosis-specific level. VISN-wide use of the report will increase efficiency and timeliness of data entry into VACCR, especially related to care provided through CITC. An improved understanding of oncologic care in the VISN would provide critical data to VISN executive leadership, enabling them to advocate for resources, targeted interventions, and access to care.
Analysis of the Frequency of level 1 OncoKB Genomic Alterations in Veterans With Various Solid Organ Malignancies
Purpose
The aim of this study is to quantify the frequency of Memorial Sloan Kettering (MSK) Precision Oncology Knowledge Base (OncoKB) Level 1 genetic alterations in Veterans with various solid organ malignancies and evaluate the clinical benefit and impact of testing on treatment of these patients.
Background
The VA National Precision Oncology Program (NPOP) facilitates comprehensive genomic profiling (CGP) testing of Veterans with advanced cancer. While CGP is increasingly utilized and routinely ordered in patients with advanced solid organ malignancies, the clinical utility and value has not been proven in certain cancers. We present data from 5,979 patients with head and neck (H&N), pancreatic, hepatocellular (HCC), esophageal and kidney cancers who underwent CGP.
Methods
Our cohort consists of Veterans that received CGP testing to identify somatic variants between 1/1/2019 and 4/2/2025. Identified variants and biomarkers were formatted for use with oncoKB-annotator, a publicly available tool to annotate genomic variants with FDA approved drug recommendations stored as Level 1 annotations in OncoKB, and prescribed drugs were extracted from the Veteran Health Administration’s (VHA) Corporate Data Warehouse (CDW). Cancers were grouped by MSK’s OncoTree codes, and summary counts of Veterans tested, Veterans recommended, Veterans prescribed recommended FDA approved drugs were determined. Percentages were calculated using the total number of Veterans tested as the denominator.
Results
Level 1 OncoKB alterations were infrequent in H&N (0.94%), kidney (0.45%), HCC(0.28%), and pancreatic adenocarcinomas (1%). The frequency of Level 1 alterations in esophageal adenocarcinomas (EAC) was 20%. Approximately 98% of the Level 1 alterations in EAC patients were HER2 positivity or MSI-High status, which can be determined by other diagnostic methodologies such as IHC. The remaining 2% of EAC patients with level 1 alterations had BRAF V600E or NTRK rearrangements.
Conclusions
The incidence of level 1 genetic variants in H&N, kidney, HCC and pancreatic adenocarcinoma is very low and would very uncommonly result in clinical benefit. Although there is an expanding number of precision oncology-based therapies available, the proportion of patients with the aforementioned solid organ malignancies who benefitted from CGP was low, suggesting CGP has minimal impact on the treatment of Veterans with these malignancies.
Pharmacogenomic Testing for Veterans Newly Diagnosed with GI Malignancies
Background
In December of 2023, a workgroup at VA Connecticut Healthcare System (“VACHS”) initiated a quality improvement project to use the weekly GI Tumor Board meeting to identify patients who would benefit from PHASER testing. The PHASER panel includes two genes that are involved in the metabolism of two commonly used chemotherapy drugs in this patient population. Our goal was to identify patients with potentially impaired metabolism of 5FU and/or irinotecan prior to initiating treatment so that the doses of the appropriate drugs could be adjusted, leading to less toxicity for patients while on treatment and fewer lingering side-effects from treatment.
Results
Here we report outcomes based on 12 months of data. We reviewed the charts of all patients who received 5-FU or irinotecan during the period 1/1/24-12/31/24 based on pharmacy records. We separately identified all VACHS patients with newly diagnosed GI cancers in 2024 using data generated by the Tumor Registrar. 39 patients met criteria for PHASER testing. Of those, 37/39 (95%) patients got the testing. The 2 additional patients who were identified during our data analysis will be offered PHASER testing. Of the 37 patients who were tested, 7 patients (19%) had a genetic variant that could potentially impact chemotherapy dosing. 3 of these 7 patients were treated with chemotherapy and did require dose-adjustment. Of note, 100% of patients diagnosed with a new GI malignancy at VA Connecticut in 2024 whose treatment plan included possible chemotherapy with 5FU or Irinotecan got PHASER testing. In one year, this best practice is now our standard procedure.
Conclusions
Despite access to pharmacogenomic testing at VA, there can be variations between VA sites in terms of uptake of this new testing. VA Connecticut’s PHASER testing initiative for patients with GI malignancies is a model that can be replicated throughout VA. This initiative is part of a broader focus at VACHS on “pre-habilitation” and pre-treatment testing that is designed to reduce toxicity of treatment and improve quality of life for cancer survivors.
A Workflow Initiative to Increase the Early Palliative Care Referral Rate in Patients With Advanced Cancer
Background
Early palliative care (PC) has been shown to improve cancer patients’ quality of life, symptom control, disease knowledge, psychological and spiritual health, end-of-life care, and survival, as well as reduce hospital admissions and emergency visits. The American Society of Clinical Oncology and the World Health Organization recommend that every patient with advanced cancer should be treated by a multidisciplinary palliative care team early in the course of the disease and in conjunction with anticancer treatment. Despite the documented benefits and the recommendations, early PC is still not often offered in clinical practice.
Results
Through a retrospective data review from July, August, and September 2023, a low percentage of early PC referrals were identified among Veterans with pancreatic, head and neck, and stage IV lung cancer in the Infusion Clinic. Only 48.5% had an early PC referral, which is a referral made within 8 weeks from the time of diagnosis and 3 or more months before death. A survey conducted among oncology providers suggests that the lack of provider knowledge about the scope of PC, the lack of set criteria/protocol to initiate a referral, and provider discomfort in referring patients were thought to hinder early referrals or cause late or/lack of referrals.
Discussion
This quality improvement project aimed to increase the early PC referral rate among advanced cancer patients in the infusion clinic to improve patient outcomes. An early PC referral toolkit was implemented consisting of (a) provider education about the scope of PC, (b) a script to help providers introduce PC as part of the comprehensive care team, (c) a PC brochure for reference, and (d) an Evidence-Based Five-item Screening Checklist to identify patients needing PC.
Conclusions
Nine months of data monitoring and analysis post-implementation revealed a 100% (n=12) early PC referral rate, and 80% (n=12) of providers reported feeling comfortable referring their patients. The project fostered a culture of comprehensive cancer care while empowering providers to make early referrals that improve patients’ multidimensional outcomes. The toolkit remains available to oncology providers and is shared upon request with other VA centers, as it is replicable in most VA settings that offer PC.
Implementation of an Interdisciplinary Precision Oncology Program at the Madison VA
Background
The William S. Middleton Memorial Veterans Hospital (Madison VA) prioritized the goal of ensuring patients with cancer are receiving guideline-based precision oncology care, including comprehensive genomic profiling (CGP) and germline genomics consultation based on evidence-based medicine and the VA Clinical Pathways. A local Precision Oncology Program was created to assist in review of CGP results including documentation in the electronic medical record (EMR) and recommendations for treatment or additional testing as appropriate. The program, which began in February 2024, focused on patients with prostate cancer initially. This was expanded to all genitourinary cancers in April 2024, non-small cell lung cancers (NSCLC) in August 2024, and all cancers in Dec 2024.
Results
Since the implementation of the Madison VA Precision Oncology Program, CGP was reviewed for 73 unique Veterans leading to 281 recommendations including: 25 FDA approved therapies, 2 off-label standard of care treatment options, 11 patients with potential clinical trial eligibility at the Madison VA. Forty-eight patients had no actionable mutations and 44 were recommended for additional germline genetics counseling. For patients with metastatic prostate cancer, after 1 year of program implementation, an increase was seen in the percentage of patients receiving guideline-based CGP, the percentage of actionable alterations identified, and the percentage of patients identified as potentially eligible for a clinical trial open at the Madison VA based on CGP. The percentage of patients with an interfacility consult to the Clinical Cancer Genetics Service was also increased. For patients with metastatic NSCLC, after 6 months of program implementation, an increase was seen in the percentage of patients appropriately receiving CGP, the percentage of actionable alterations identified, and the percentage of patients on targeted therapy. In all cases where an actionable alteration was not being targeted, the treatment option was not yet appropriate for the stage of disease.
Conclusions
The implementation of preemptive review of all CGP results at the Madison VA through the Precision Oncology Program has increased uptake and awareness of CGP results and potential treatment options, improving the access of targeted treatments and clinical trial opportunities for Veterans with cancer.
Successful and Sustainable Implementation of a VA Cancer Survivorship Clinic
Background
There are an estimated 18 million cancer survivors in the US with unique needs including specific surveillance imaging, testing for recurrence, monitoring for and managing late effects of cancer treatments, and for second malignancies. Survivorship care is an unmet need in most VAHC. Purpose: Assess implementation outcomes of a Survivorship Clinic.
Methods
A Survivorship Clinic was initiated comprising of a Survivorship APRN and Nurse Navigator. A referral process and workflow were created. Medical and Radiation Oncology providers were educated regarding availability of survivorship services. We describe the results of the Survivorship Clinic 2021-2025 including demographics, diagnoses and referral patterns.
Results
1,332 visits were completed for 424 patients. 2021 (Oct-Dec): 21, 2022: 219, 2023: 424, 2024: 508, 2025 (Jan-Mar): 160. 364 men and 60 women. Cancer diagnoses seen: lung: 108, lymphoma: 62, colorectal: 52, breast: 45, head and neck: 40, melanoma: 28, NET: 23, testicular: 13, bladder: 13, esophageal: 10, renal: 7, sarcomas: 7, anal: 6, HCC: 6, hepatobiliary: 6, gastric/GIST: 5, leukemia: 5, pancreatic: 5, prostate: 5, Merkel cell: 3, SCC: 3, thymus: 3, uterine: 2, 1 each appendix, anaplastic astrocytoma, periosteal carcinoma, poorly differentiated basaloid chest wall carcinoma, and small intestine. For symptom management the following referrals were placed: Rehab (all departments) : 71, Psychology/Whole Health/THRIVE: 52, Gastroenterology: 43, Nutrition: 24, Dermatology: 20, Urology, ED: 16, Pulmonology: 15, Plastic Surgery: 15, ENT: 12, LIVESTRONG YMCA: 10, Genetics: 9, General Surgery: 4, Neurology: 4, Breast Clinic: 3, Dental: 3, Neurosurgery: 2, Ophthalmology: 2, Pain Management: 2, Radiation Oncology: 2, Wound Care: 2, Pharmacy: 1, and Rheumatology: 1. Survivorship care plans were created and provided to all patients.
Conclusions
Since 2021, the Cancer Survivorship Clinic, operated by an APRN, has successfully served 424 cancer survivors encompassing a wide range of cancers. The disproportionately low number of prostate cancer survivors referred may be reflective of their care being managed by Urology, and presents an opportunity for future growth.
Implications for VA
Having a Survivorship Clinic provides cancer survivors specialized services and meets their unique needs; at the same allowing for improved capacity for new active cancer referrals for the Oncology Clinics.
Lung Cancer Exposome in U.S. Military Veterans: Study of Environment and Epigenetic Factors on Risk and Survival
Background
The Exposome—the comprehensive accumulation of environmental exposures from birth to death—provides a framework for linking external risk factors to cancer biology. In U.S. veterans, the exposome includes both military-specific exposures (e.g., asbestos, Agent Orange, burn pits) and postservice socioeconomic and environmental factors. These cumulative exposures may drive tumor development and progression via epigenetic mechanisms, though their impact on lung cancer outcomes remain poorly characterized.
Methods
This is a retrospective cohort study of 71 lung cancer subjects (NSCLC and SCLC) from the Jesse Brown VA Medical Center (IRB# 1586320). We assessed the Area Deprivation Index (ADI), Environmental Burden Index (EBI), and occupational exposure in relation to DNA methylation of CDO1, TAC1, SOX17, and HOXA7. Geospatial data were mapped to US census tracts, and standard statistical analysis were conducted.
Results
NSCLC patients exhibited significantly higher methylation levels across all genes. High EBI exposure was associated with lower SOX17 methylation (p = 0.064) and worse overall survival (p = 0.046). In NSCLC patients, occupational exposure predicted a 7.7-fold increased hazard of death (p = 0.027). SOX17 and TAC1 methylation were independently associated with reduced survival (p = 0.037 and 0.0058, respectively). While ADI did not independently predict survival, it correlated with late-stage presentation and reduced HOXA7 methylation.
Conclusions
Exposome factors such as environmental burden and occupational exposure are biologically embedded in lung cancer cell through gene-specific methylation and significantly impact survival. We posit that integrating exposomic and molecular data could enhance lung precision oncology approaches for high-risk veteran populations.
Insights Into Veterans’ Motivations and Hesitancies for COVID-19 Vaccine Uptake: A Mixed-Methods Analysis
Insights Into Veterans’ Motivations and Hesitancies for COVID-19 Vaccine Uptake: A Mixed-Methods Analysis
The SARS-CoV-2 virus has resulted in > 778 million reported COVID-19 cases and > 7 million deaths worldwide. 1 About 70% of the eligible US population has completed a primary COVID-19 vaccination series, yet only 17% have received an updated bivalent booster dose.2 These immunization rates fall below the World Health Organization (WHO) target of 70%.3
Early in the pandemic, US Department of Veterans Affairs (VA) vaccination rates ranged from 46% to 71%.4,5 Ensuring a high level of COVID-19 vaccination in the largest integrated US health care system aligns with the VA priority to provide high-quality, evidence-based care to a patient population that is older and has more comorbidities than the overall US population.6-9
Vaccine hesitancy, defined as a “delay in acceptance or refusal of vaccination despite availability of vaccination service,” is a major contributor to suboptimal vaccination rates.10-13 Previous studies used cluster analyses to identify the unique combinations of behavioral and social factors responsible for COVID-19 vaccine hesitancy.10,11 Lack of perceived vaccine effectiveness and low perceived risk of the health consequences from COVID-19 infection were frequently identified in clusters where patients had the lowest intent for vaccination.10,11 Similarly, low trust in health care practitioners (HCPs), government, and pharmaceutical companies diminished intent for vaccination in these clusters.10 These quantitative studies were limited by their exclusive focus on unvaccinated individuals, reliance on self-reported intent, and lack of assessment of a health care system with a COVID-19 vaccine delivery program designed to overcome barriers to health care access, such as the VA.
Prior qualitative studies of vaccine uptake in distinct veteran subgroups (ie, unhoused and in VA facilities with low vaccination rates) demonstrated that overriding medical priorities among the unhoused and vaccine safety concerns were associated with decreased vaccine uptake, and positive perceptions of HCPs and the health care system were associated with increased vaccine uptake.11,12 However, these studies were conducted during periods of greater COVID-19 vaccine availability and acceptance, and prior to booster recommendations.4,12,13
This mixed-methods quality improvement (QI) project assessed the barriers and facilitators of COVID-19 vaccination among veterans receiving primary care at a single VA health care facility. We assessed whether unique patient clusters could be identified based on COVID-19–related and vaccine-related thoughts and feelings and whether cluster membership was associated with COVID-19 vaccination. This analysis also explored how individuals’ beliefs and trust shaped motivations and hesitancies for vaccine uptake in quantitatively derived clusters with varying vaccination rates.
Methods
This QI project was conducted at the VA Pittsburgh Healthcare System (VAPHS), a tertiary care facility serving > 75,000 veterans in Pennsylvania, West Virginia, and Ohio. The VAPHS Institutional Review Board determined this QI study was exempt from review.14-17 Participation was voluntary and had no bearing on VA health care or benefits. Financial support for the project, including key personnel and participant compensation, was provided by VAPHS. We followed the STROBE reporting guideline for cross-sectional studies and the COREQ checklist for qualitative research.18,19
Quantitative Survey
The 32,271 veterans assigned to a VAPHS primary care HCP, effective April 1, 2020, were eligible. To ensure representation of subgroups underrecognized in research and/or QI projects, the sample included all 1980 female patients at VAPHS and a random sample of 500 White and 500 Hispanic and/or non-White men within 4 age categories (< 50, 50-64, 65-84, and > 84 years). For the < 50 years or > 84 years categories, all Hispanic and/or non-White men were included due to small sample sizes.20-22 The nonrandom sampling frame comprised 1708 Hispanic and/or non-White men and 2000 White men. After assigning the 5688 potentially eligible individuals a unique identifier, 31 opted out, resulting in a final sample of 5657 individuals.
The 5657 individuals received a letter requesting their completion of a future questionnaire about COVID-19 infection and vaccines. An electronic Qualtrics questionnaire link was emailed to 3221 individuals; nonresponders received 2 follow-up email reminders. For the 2436 veterans without an email address on file, trained interviewers conducted phone surveys and entered responses. Those patients who completed the questionnaire could enter a drawing to win 1 of 100 cash prizes valued at $100. We collected questionnaire data from July to September 2021.
Questionnaire Items
We constructed a 60-item questionnaire based on prior research on COVID-19 vaccine hesitancy and the WHO Guidebook for Immunization Programs and Implementing Partners.4,23-25 The WHO Guidebook comprises survey items organized within 4 domains reflecting the behavioral and social determinants of vaccination: thoughts and feelings; social processes; motivation and hesitancy; and practical factors.23
Sociodemographic, clinical, and personal characteristics. The survey assessed respondent ethnicity and race and used these data to create a composite race and ethnicity variable. Highest educational level was also attained using 8 response options. The survey also assessed prior COVID-19 infection; prior receipt of vaccines for influenza, pneumonia, tetanus, or shingles; and presence of comorbidities that increase the risk of severe COVID-19 infection. We used administrative data from the VA Corporate Data Warehouse to determine respondent age, sex, geographic residence (urban, rural), and to fill in missing self-reported data on sex (n = 4) and ethnicity and race (n = 12). The survey assessed political views using a 5-point Likert scale (1, very liberal; 5, very conservative) and was collapsed into 3 categories (ie, very conservative or conservative, moderate, very liberal or liberal), with prefer not to answer reported separately
COVID-19 infection and vaccine. We asked veterans if they had ever been infected with COVID-19, whether they had been offered and/or received a COVID-19 vaccine, and type (Pfizer, Moderna, or Johnson & Johnson), and number of doses received. Positive vaccination status was defined as the receipt of ≥ 1 dose of a COVID-19 vaccine approved by the US Food and Drug Administration.
COVID-19 opinions. Respondents were asked about perceived risk of COVID-19 infection and related health outcomes, as well as beliefs about COVID-19 vaccines, using a 4-point Likert scale for all items: (1, not at all concerned; 4, very concerned). Respondents were asked about concerns related to COVID-19 infection and severe illness. They also were asked about vaccine-related short-term adverse effects (AEs) and long-term complications. Respondents were asked how effective they believed COVID-19 vaccines were at preventing infection, serious illness, or death. Unvaccinated and vaccinated veterans were asked similar items, with a qualifier of “before getting vaccinated…” for those who were vaccinated.
Social processes. Respondents were asked to rate their level of trust in various sources of COVID-19 vaccine information using a 4-point Likert scale (1, trust not at all; 4, trust very much). Respondents were asked whether community or religious leaders or close family or friends wanted them to get vaccinated (yes, no, or unsure).
Practical factors. Respondents were asked to rate the logistical difficulty of getting vaccinated or trying to get vaccinated using a 4-point Likert scale (1, not at all; 4, extremely).
Participants
Respondents were asked to participate in a follow-up qualitative interview. Among 293 participants who agreed, we sampled all 86 unvaccinated individuals regardless of cluster assignment, a random sample of 88 individuals in the cluster with the lowest vaccination rate, and all 33 vaccinated individuals in the cluster with the second-lowest vaccination rate. Forty-nine veterans completed qualitative interviews.
Two research staff trained in qualitative research completed telephone interviews, averaging 16.5 minutes (March to May 2022), using semistructured scripts to elicit vaccine-related motivations, hesitancies, or concerns. Interviews were recorded, transcribed, and deidentified. Participants provided written consent for recording and received $50 cash-equivalent compensation for interview completion.
Qualitative Interview Script
The interview script consisted of open-ended questions related to vaccine uptake across WHO domains.23 Both unvaccinated and vaccinated respondents were asked similar questions and customized questions about boosters for the vaccinated subgroup. To assess motivations and hesitancies, respondents were asked how they made their decisions about vaccination and what they considered when deciding. Vaccinated participants were asked about motivations and overcoming concerns. Unvaccinated respondents were asked about reasons for concern. To assess social processes, the interviewers asked participants whose opinion or counsel they trusted when deciding whether to get vaccinated. Questions also focused on positive experiences and vaccination barriers. Vaccinated participants were asked what could have improved their vaccination experiences. Finally, the interviewers asked participants who received a complete primary vaccine series about their motivations and plans related to booster vaccines, and whether information about emerging COVID-19 variants influenced their decisions.
Data Analyses
This analysis used X2 and Fisher exact tests to assess the associations among respondent characteristics, questionnaire responses, vaccination status, and cluster membership. Items phrased similarly were handled in a similar fashion for vaccinated and unvaccinated respondents.
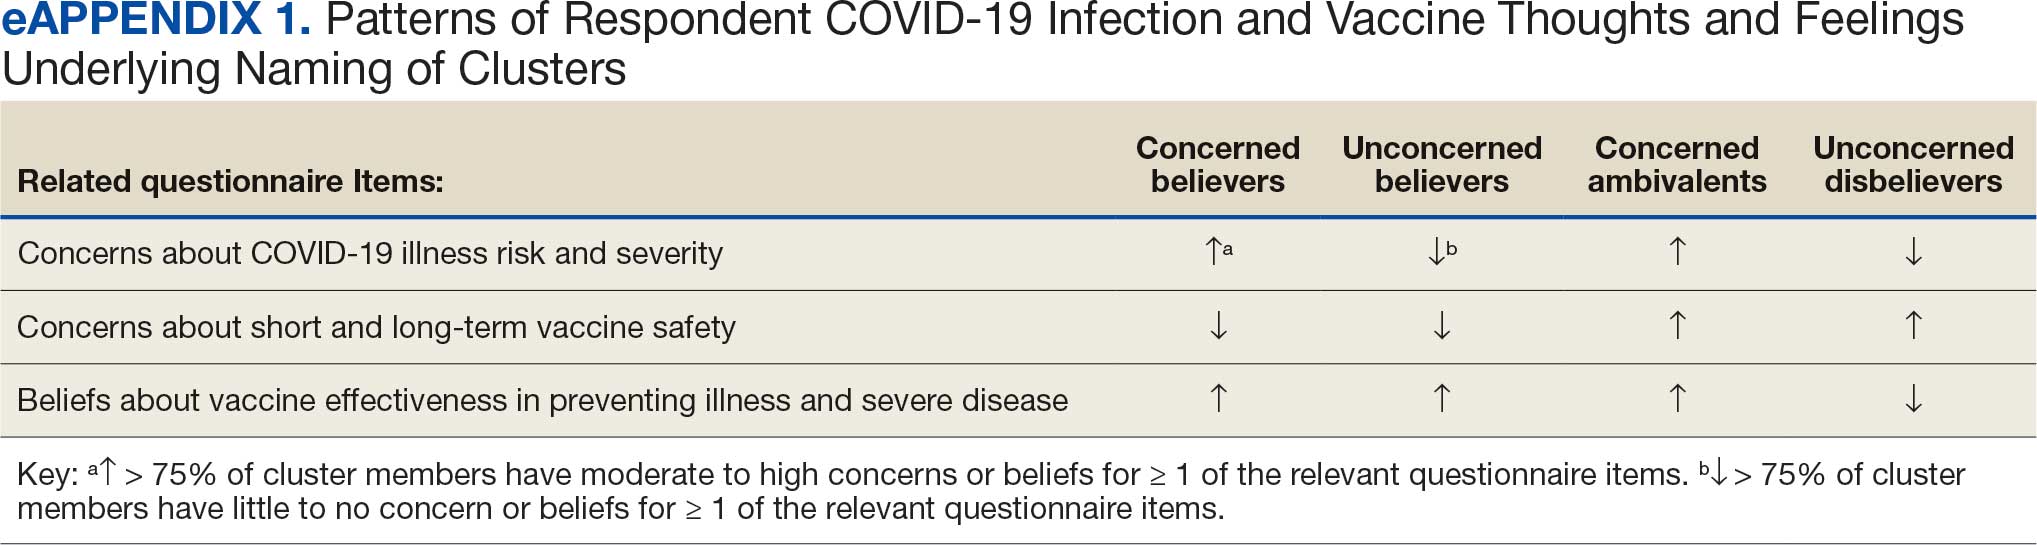
Cluster analysis assessed the possible groupings in responses to the quantitative questionnaire items focused on thoughts and feelings about COVID-19 infection risk and severity, vaccine effectiveness, and vaccine safety. This analysis treated the items’ ordinal response categories as continuous. We performed factor analysis using principal component analysis to explore dimension reduction and account for covariance between items. Two principal components were calculated and applied k-means clustering, determining the number of clusters through agreement from the elbow, gap statistic, and silhouette methods.26 Each cluster was named based on its unique pattern of responses to the items used to define them (eAppendix 1).
Multivariable logistic regression analyses assessed the independent association between cluster membership as the independent measure and vaccination status as the dependent measure, adjusting for respondent sociodemographic and personal characteristics and 2 measures of trust (ie, local VA HCP and the CDC). We selected these trust measures because they represent objective sources of medical information and were independently associated with COVID-19 vaccination status in a logistic regression model comprising all 6 trust items assessed.
This study defined statistical significance as a 2-tailed P value < .05. SAS 9.4 was used for all statistical analyses and Python 3.7.4 and the Scikit-learn package for cluster analyses.27 For qualitative analyses, this study used an inductive thematic approach guided by conventional qualitative content analysis, NVivo 12 Plus for Windows to code and analyze interview transcripts.28,29 We created an initial codebook based on 10 transcripts that were selected for high complexity and represented cluster membership and vaccination status.30,31 After 2 qualitative staff developed the initial codebook, 11 of 49 (22%) transcripts were independently coded by a primary and secondary coder to ensure consistent code application. Both coders reviewed the cocoded transcripts and resolved all discrepancies through negotiated consensus.32 After the cocoding process was complete, the primary coder coded the remaining transcripts. The primary and secondary coder met as needed to review and discuss any questions that arose during the primary coder’s work.
Results
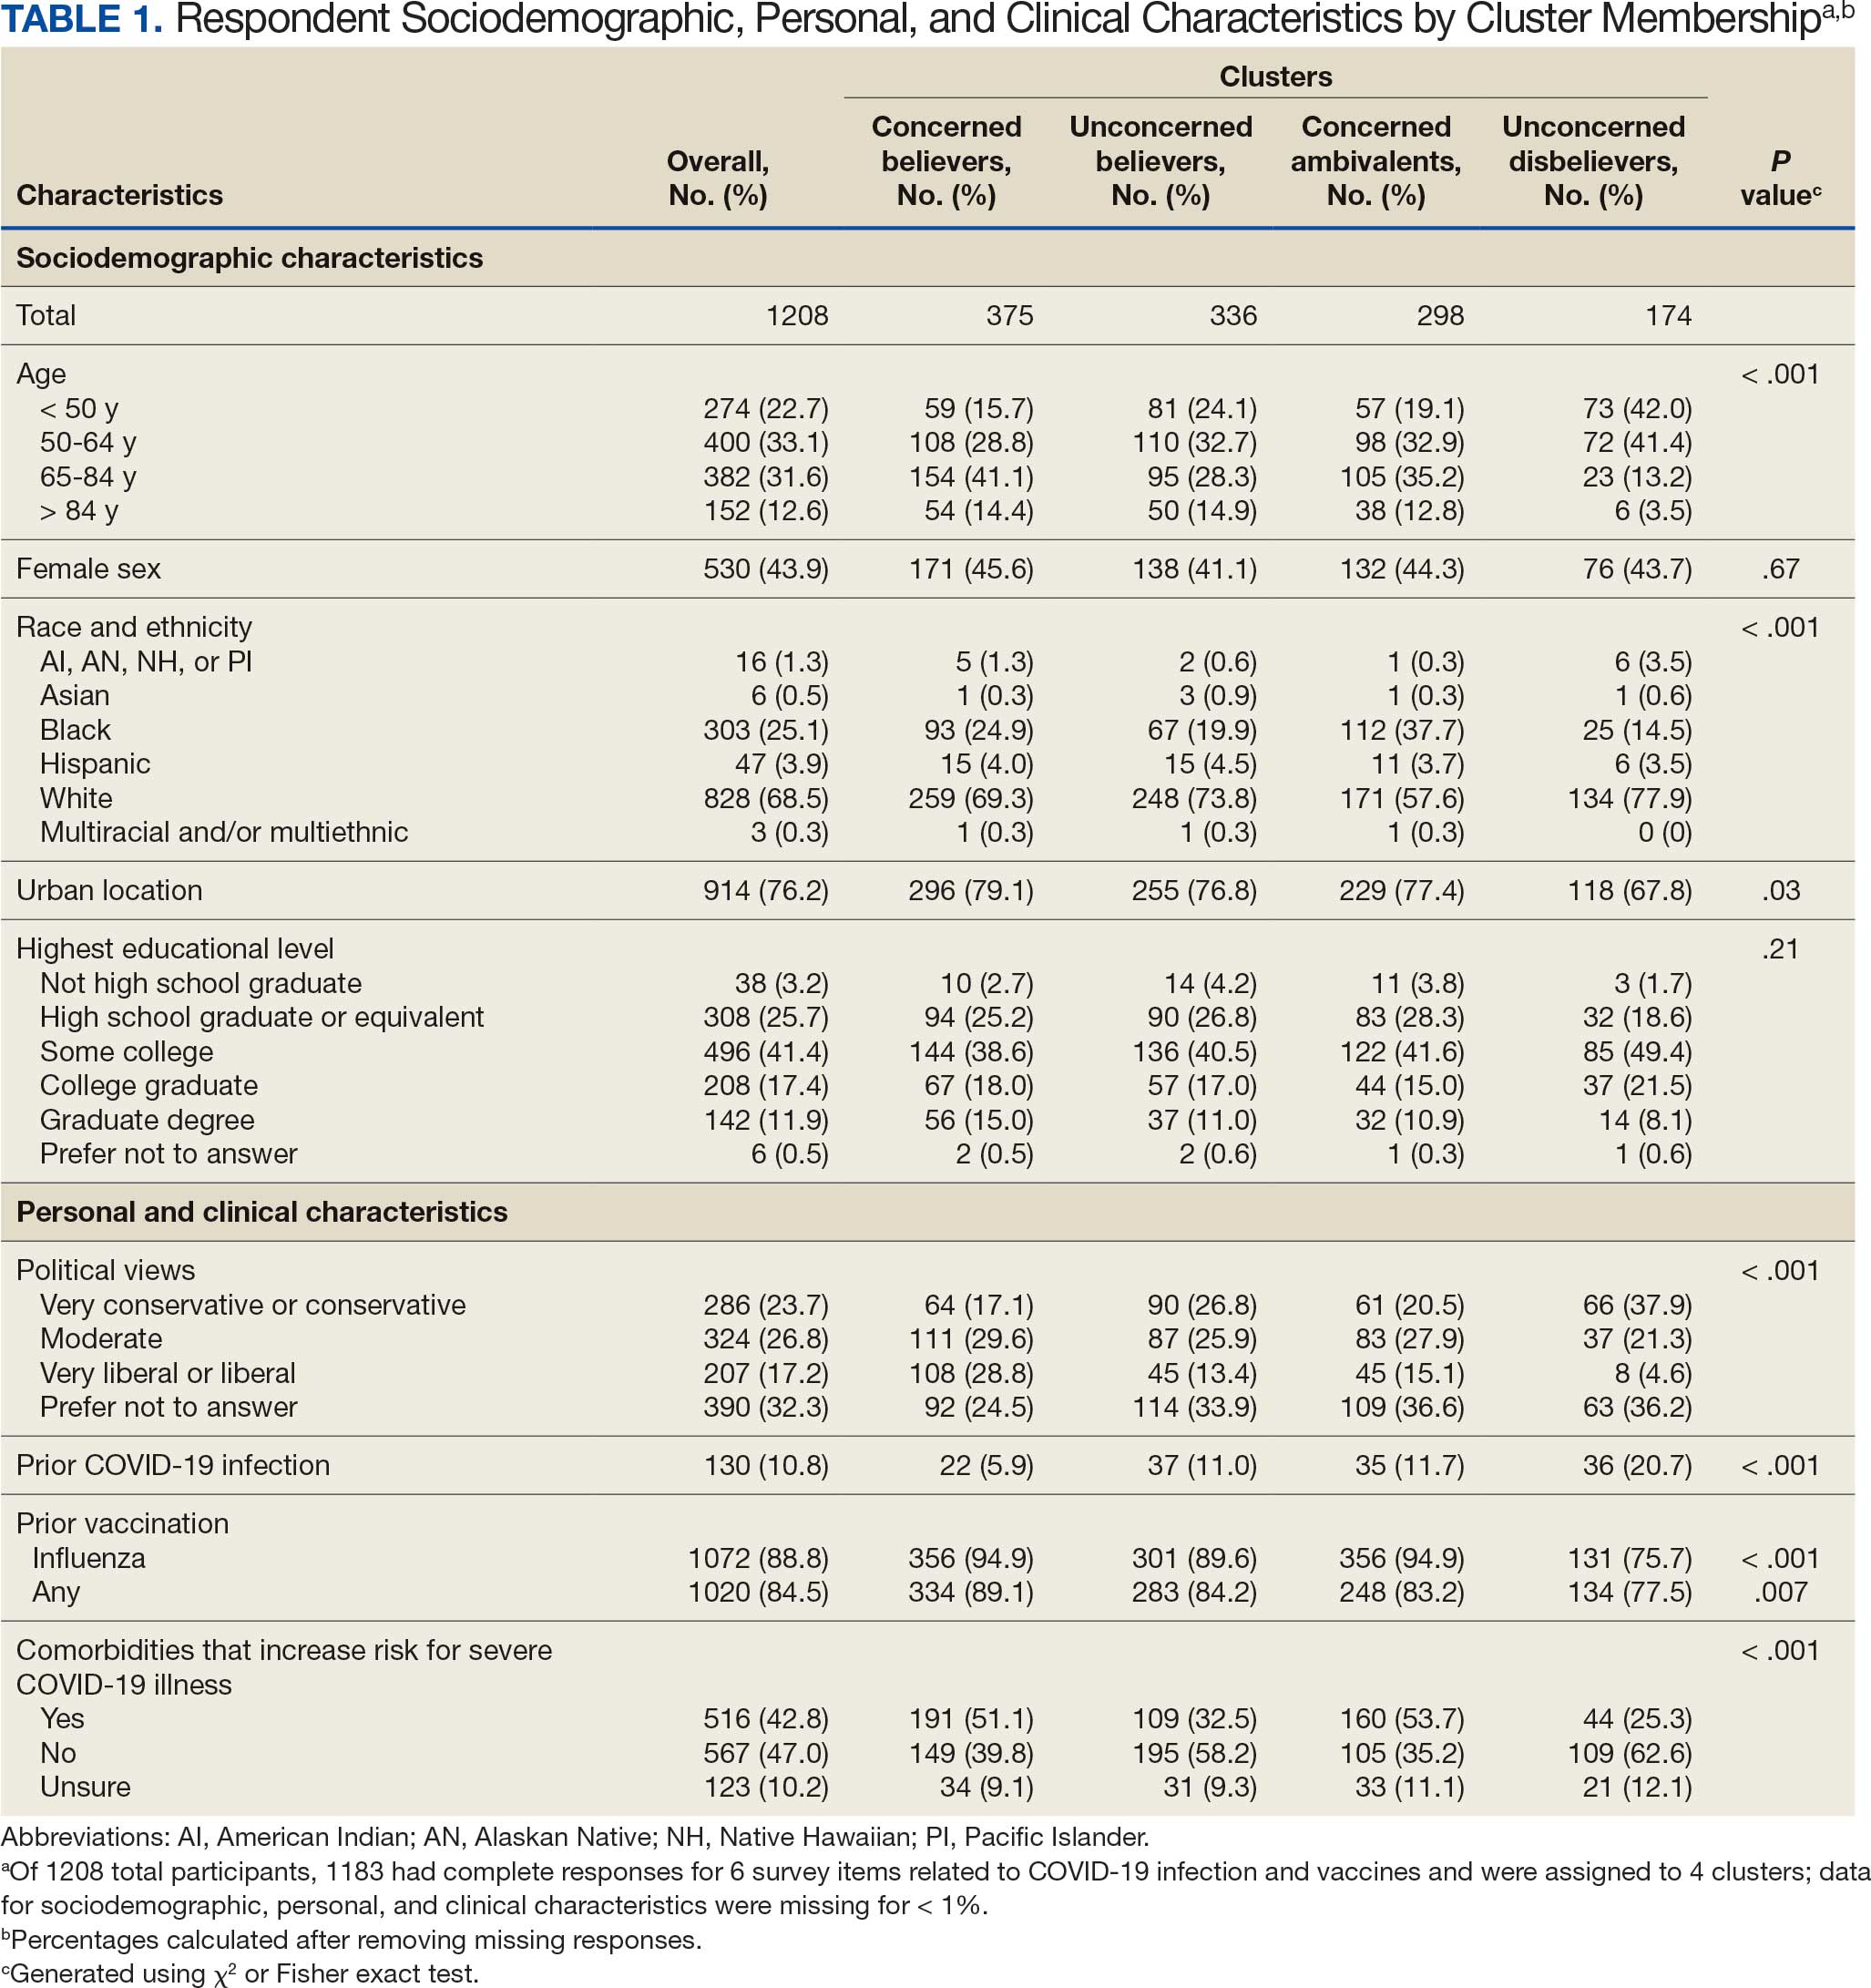
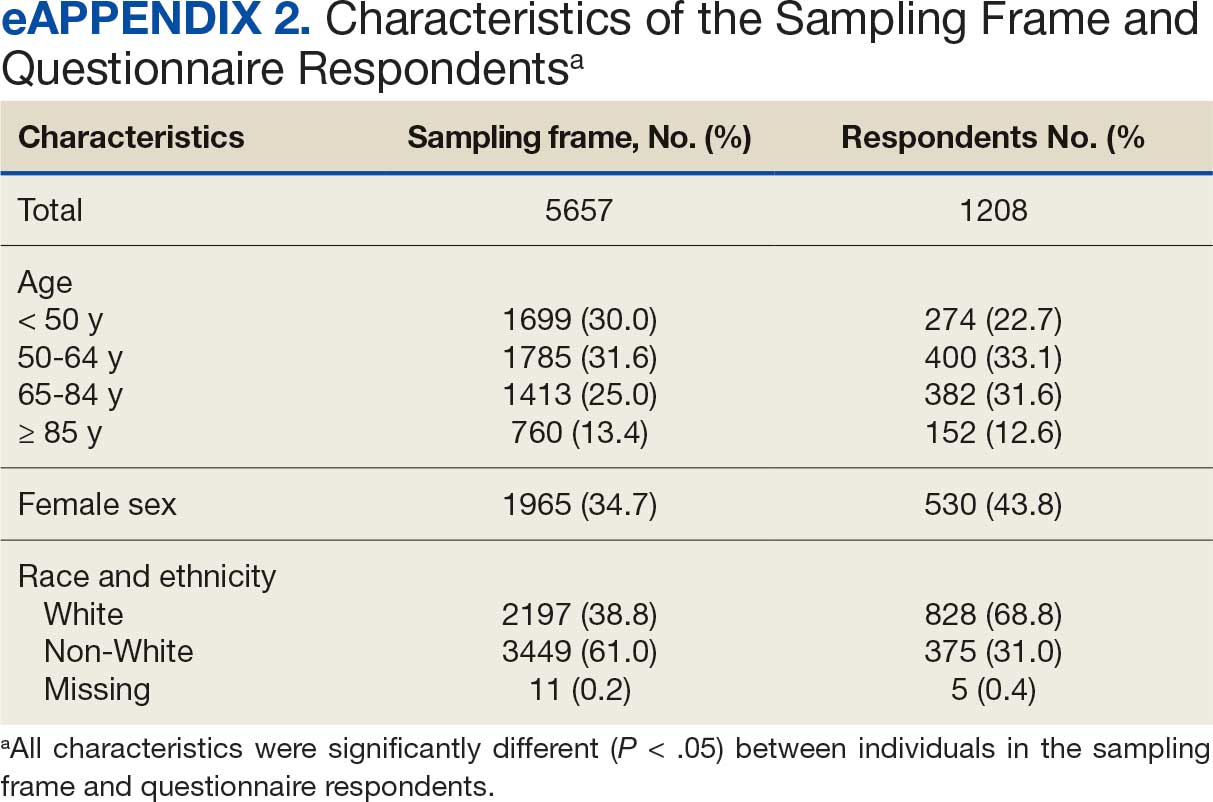
Of 5657 eligible participants, 1208 (21.4%) completed a questionnaire. Overall, 674 (55.8%) were aged < 65 years, 530 (43.9%) were women, 828 (68.5%) were non-Hispanic White, 303 (25.1%) were Black, and 47 (3.9%) were Hispanic, and 1034 (85.6%) were vaccinated (Table 1). Compared to the total sampled population, respondents were more often older, female, and White (eAppendix 2).
Cluster Membership
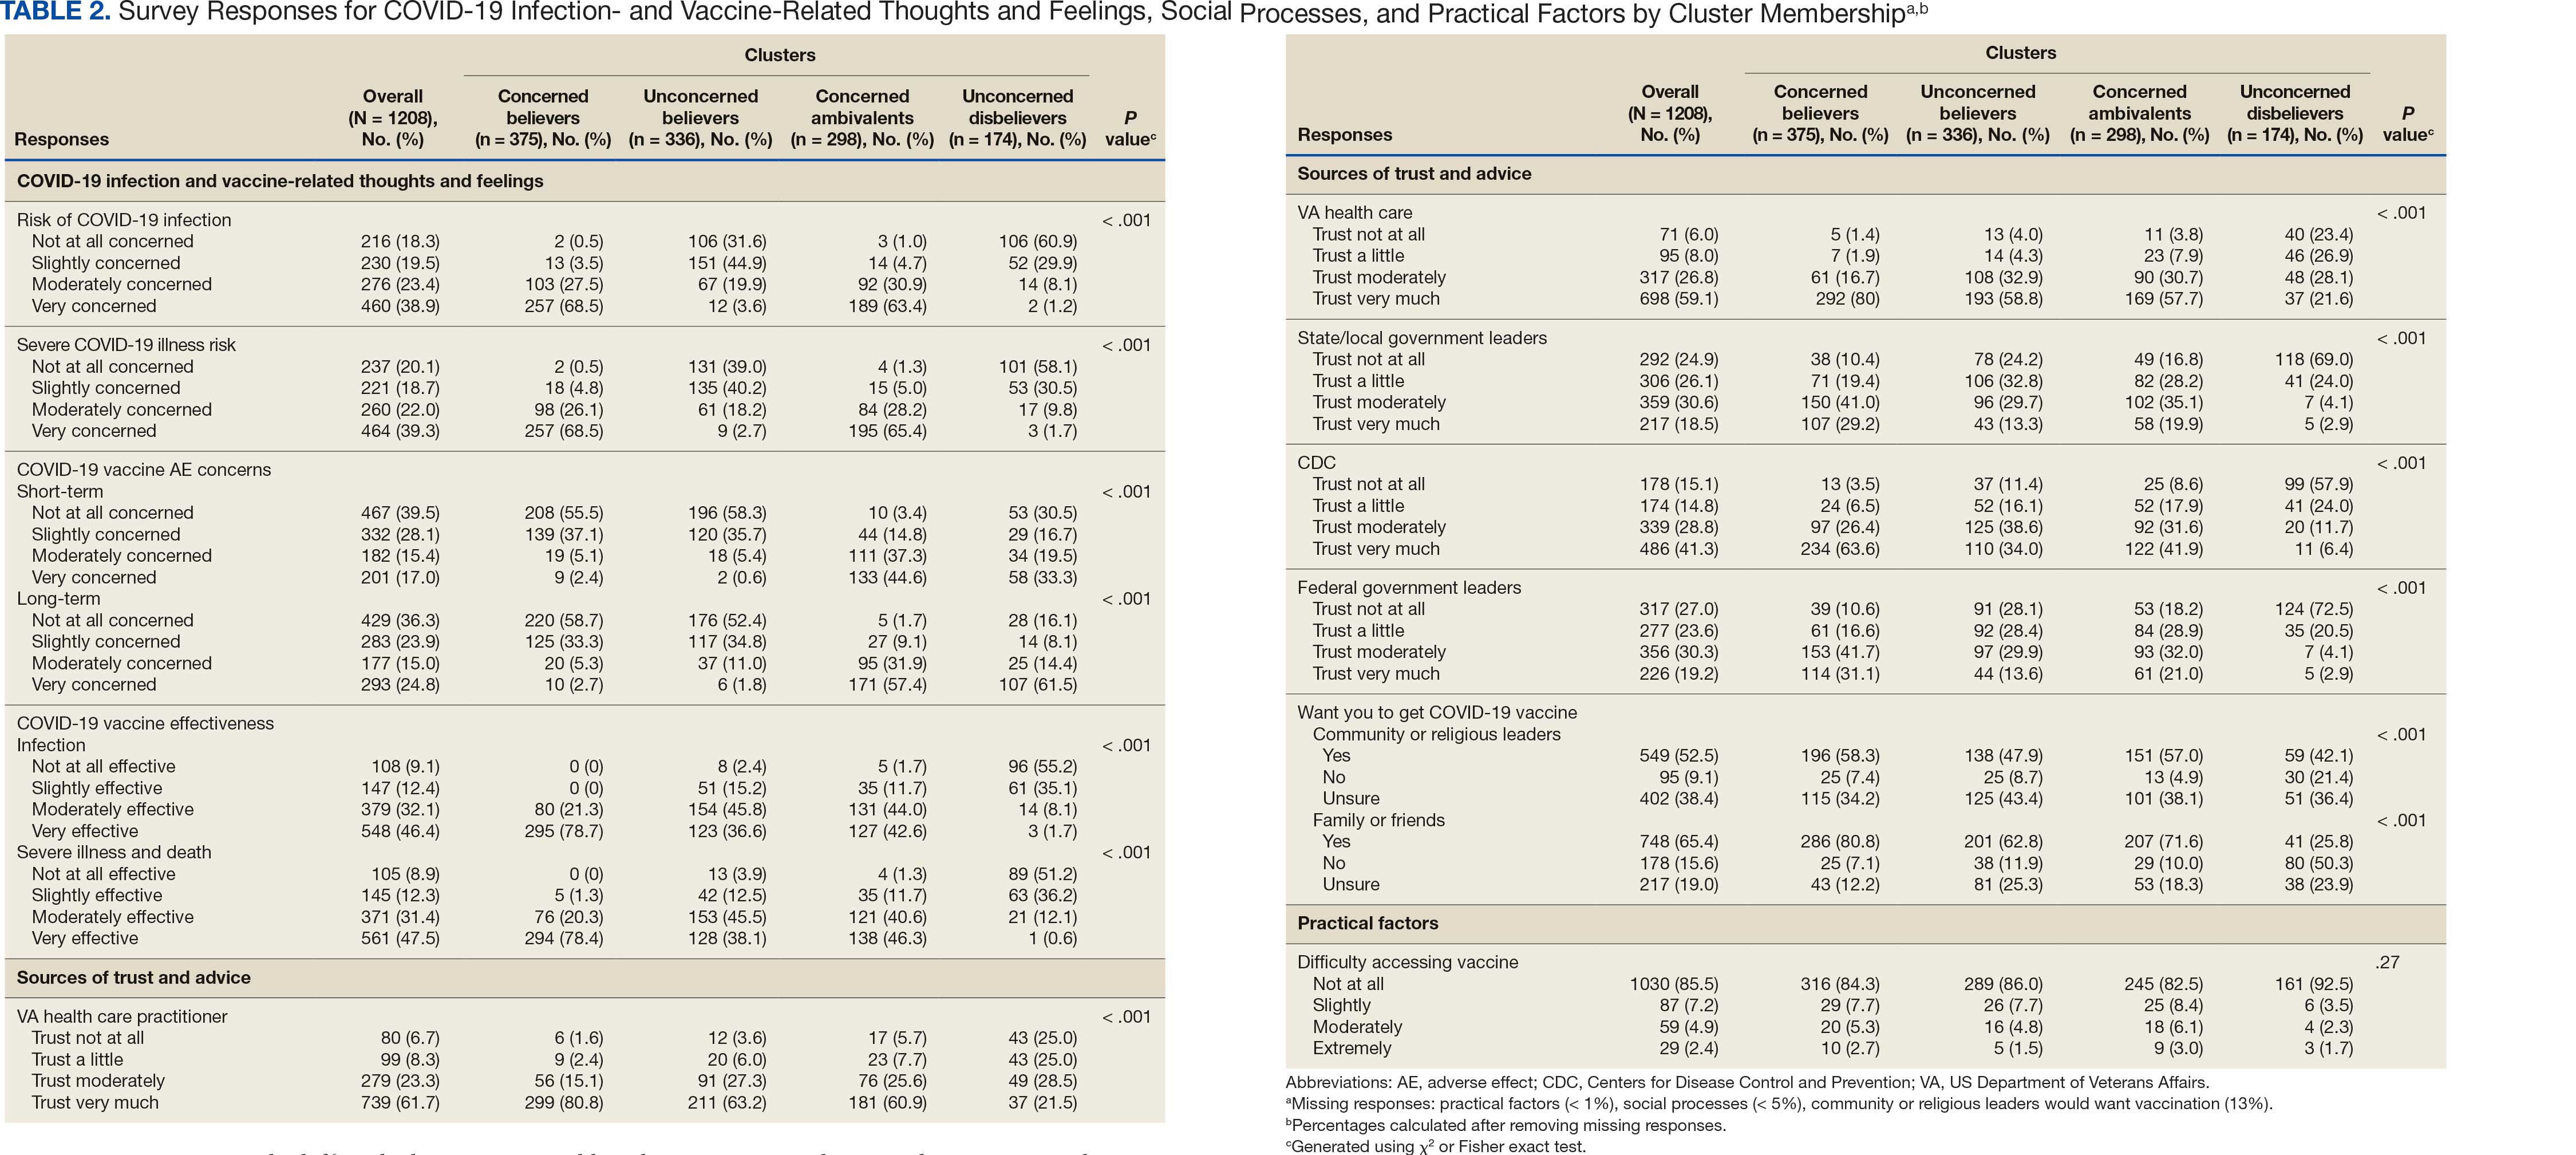
Four clusters were identified from 1183 (97.9%) participants who provided complete responses to 6 items assessing thoughts and feelings about COVID-19 infection and vaccines (Table 2). Of the 1183 respondents, 375 (31.7%) were Concerned Believers (cluster 1), 336 (28.4%) were Unconcerned Believers (cluster 2), 298 (25.2%) were Concerned Ambivalents (cluster 3), and 174 (14.7%) were Unconcerned Disbelievers (cluster 4). The Concerned Believers were moderately/ very concerned about COVID-19 infection (96.0%) and becoming very ill from infection (94.6%), believed the vaccine was moderately/very effective in preventing COVID-19 infection (100%) and severe illness or death from infection (98.7%), and had slight concern about short-term AEs (92.6%) or long-term complications (92.0%) from the vaccine. The Unconcerned Believers had no/slight concern about COVID-19 infection (76.5%) or becoming very ill (79.2%), believed the vaccine was effective in preventing infection (82.4%) and severe illness and death (83.6%), and had no/slight concern about short-term AEs (94.0%) or long-term complications (87.2%) from the vaccine. The Concerned Ambivalents were moderately/ very concerned about COVID-19 infection (94.3%) and becoming very ill (93.6%), believed the vaccine was moderately/very effective in preventing infection (86.6%) and severe illness or death (86.9%), and were moderately/very concerned about short-term AEs (81.9%) or long-term complications (89.3%) from the vaccine. The Unconcerned Disbelievers had no/slight concern about COVID-19 infection (90.8%) and becoming very ill (88.6%), believed the vaccine was not at all/slightly effective in preventing infection (90.3%) and severe illness or death (87.4%), and were moderately/very concerned about short-term AEs (52.8%) or long-term complications (75.9%) from the vaccine.
Cluster Membership
Respondent age, race and ethnicity, and political viewpoints differed significantly by cluster (P < .001). Compared with the other clusters, the Concerned Believer cluster was older (55.5% age ≥ 65 years vs 16.7%-48.0%) and more frequently reported liberal political views (28.8% vs 4.6%-15.1%). In contrast, the Unconcerned Disbeliever cluster was younger (83.4% age ≤ 64 years vs 44.5%-56.8%) and more frequently reported conservative political views (37.9% vs 17.1%-26.8%) than the other clusters. Whereas the Concerned Ambivalent cluster had the highest proportion of Black (37.7%) and the lowest proportion of White respondents (57.6%), the Unconcerned Disbelievers cluster had the lowest proportion of Black respondents (14.5%) and the highest proportion of White respondents (77.9%). The Unconcerned Disbelievers cluster were significantly less likely to trust COVID-19 vaccine information from any source and to believe those close to them wanted them to get vaccinated.
Association of Cluster Membership and COVID-19 Vaccination
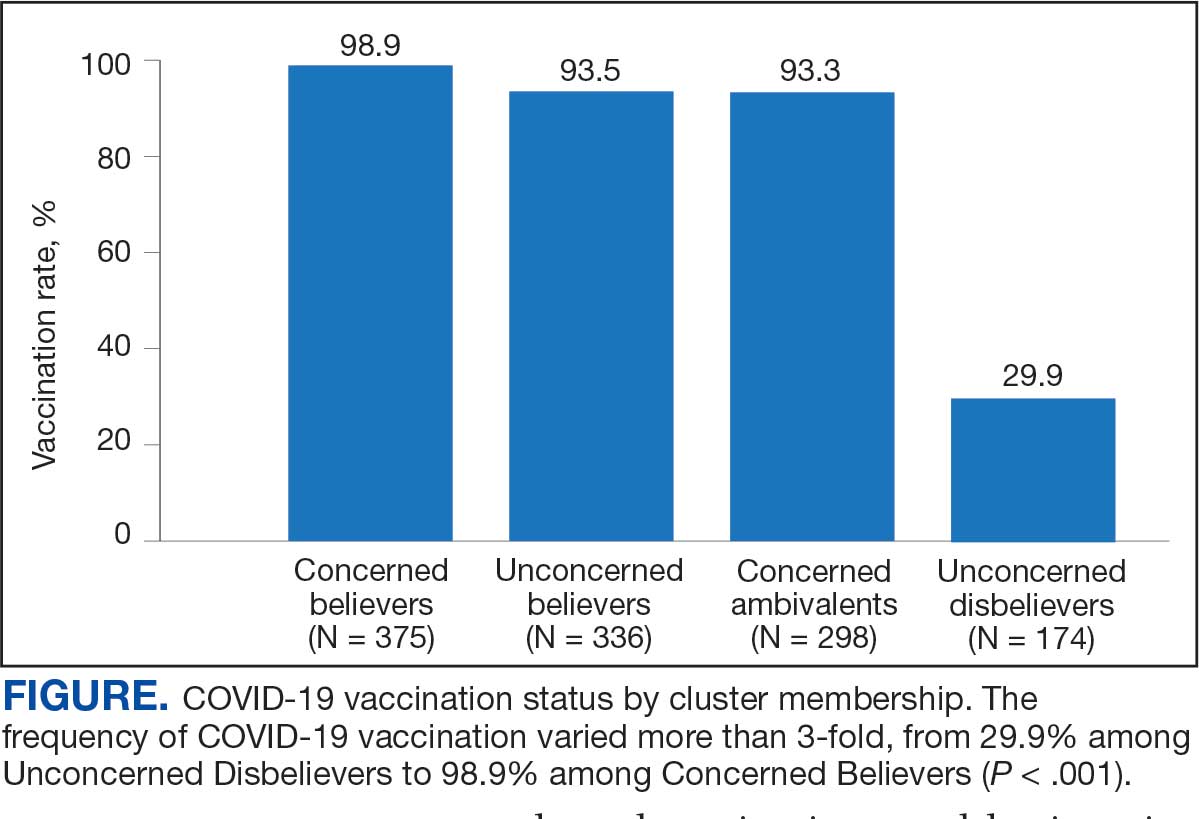
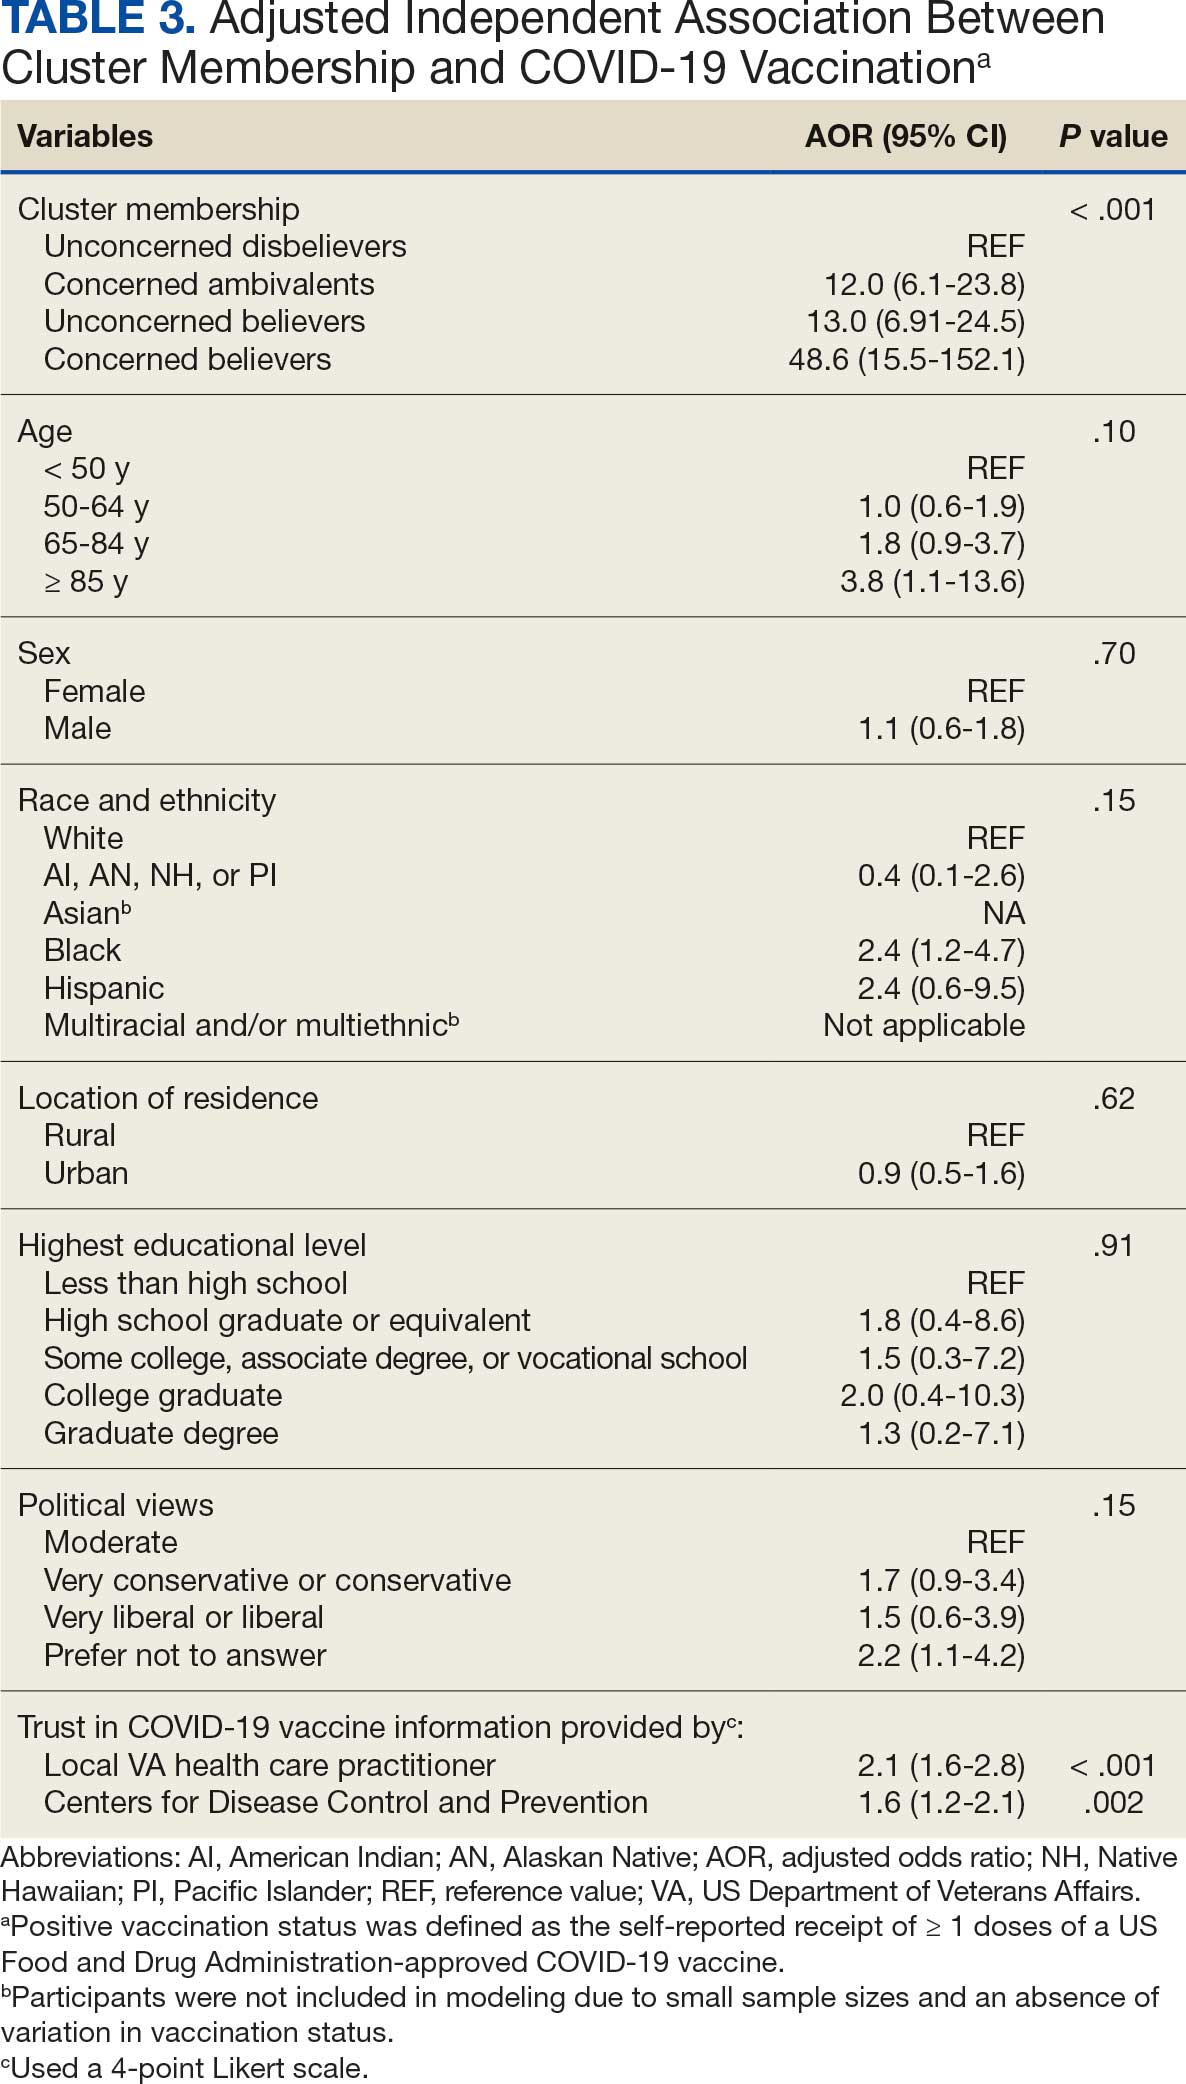
COVID-19 vaccination rates varied more than 3-fold (P < .001) by cluster, with 29.9% of Unconcerned Disbelievers, 93.3% of Concerned Ambivalents, 93.5% of Unconcerned Believers, and 98.9% of Concerned Believers reporting being vaccinated. (Figure). Cluster membership was independently associated with vaccination, with adjusted odds ratios (AORs) of 12.0 (95% CI, 6.1-23.8) for the Concerned Ambivalent, 13.0 (95% CI, 6.9-24.5) for Unconcerned Believer, and 48.6 (95% CI, 15.5-152.1) for Concerned Believer clusters (Table 3). Respondent trust in COVID-19 vaccine information from their VA HCP (AOR 2.1; 95% CI, 1.6-2.8) and the CDC (AOR 1.6; 95% CI, 1.2-2.1) were independently associated with vaccination status, while the remaining respondent sociodemographic or personal characteristics were not.
Qualitative Interview Participants
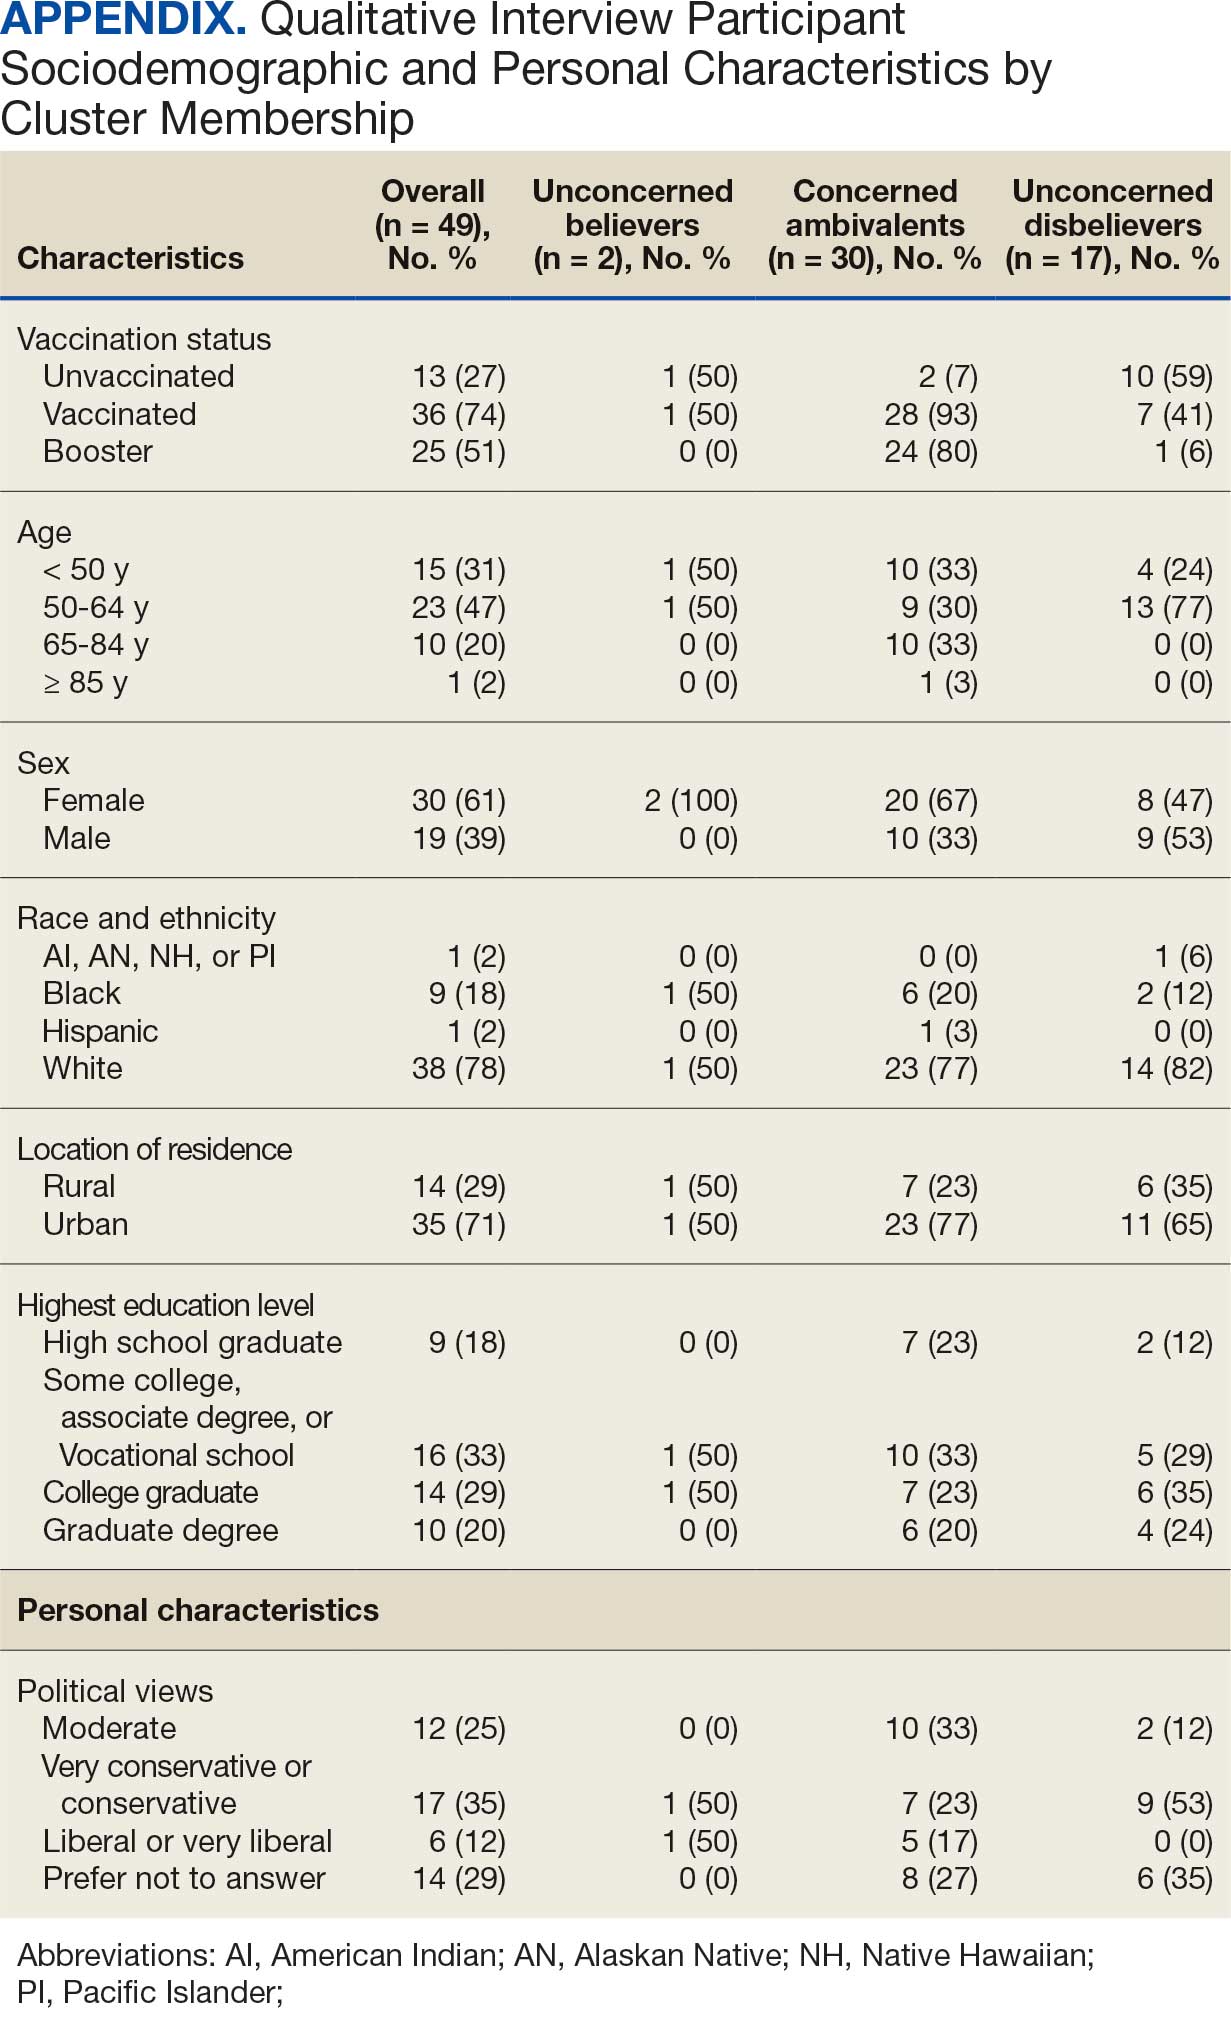
A 49-participant convenience sample completed interviews, including 30 Concerned Ambivalent, 17 Unconcerned Disbeliever, and 2 Unconcerned Believer respondents cluster. The data were not calculated for Unconcerned Believers due to the small sample size. Interview participants were more likely to be younger, female, non-Hispanic, White, less educated, and more politically conservative than the questionnaire respondents as a whole (Appendix). The vaccination rate for the interview participants was 73.5%, ranging from 29.9% in the Unconcerned Disbeliever to 93.3% in the Concerned Ambivalent cluster. Qualitative themes and participant quotes for Concerned Ambivalent and Unconcerned Disbeliever respondents are in eAppendix 3.
Motivations. Wanting personal protection from becoming infected or severely ill from COVID-19 (63.8%), caregiver wanting to protect others (17.0%), and employment vaccine requirements (14.9%) were frequent motivations for vaccination. Whereas personal protection (90.0%) and protection of others (23.3%) were identified more frequently in the Concerned Ambivalents cluster, employment vaccine requirements (35.3%) were more frequently identified in the Unconcerned Disbelievers cluster.
Hesitancies or concerns. Lack of sufficient information related to rapid vaccine development (55.3%), vaccine AEs (38.3%), and low confidence in vaccine efficacy (23.4%) were frequent concerns or hesitancies about vaccination. Unconcerned Disbelievers expressed higher levels of concern about the vaccine’s rapid development (82.4%), low perceived vaccine efficacy (47.1%), and a lack of trust in governmental vaccine promotion (23.5%) than did the Concerned Ambivalents.
Overcoming concerns. Not wanting to get sick or die from infection coupled with an understanding that vaccine benefits exceed risks (23.4%) and receiving information from a trusted source (10.6%) were common ways of overcoming concerns for vaccination. Although the Unconcerned Disbelievers infrequently identified reasons for overcoming concerns, they identified employment requirements (17.6%) as a reason for vaccination despite concerns. They also identified seeing others with positive vaccine experiences and pressure from family or friends as ways of overcoming concerns (11.8% each).
Social influences. Family members or partners (38.3%), personal opinions (38.3%), and HCPs (23.4%) were frequent social influences for vaccination. Concerned Ambivalents mentioned family members and partners (46.7%), HCPs (26.7%), and friends (20.0%) as common influences, while Unconcerned Disbelievers more frequently relied on their opinion (41.2%) and quoted specific scientifically reputable data sources (17.6%) to guide vaccine decision-making, although it is unclear whether these sources were accessed directly or if this information was obtained indirectly through scientifically unvetted data platforms.
Practical factors. Most participants had positive vaccination experiences (68.1%), determined mainly by the Concerned Ambivalents (90.0%), who were more highly vaccinated. Barriers to vaccination were reported by 9 (19.1%) participants, driven by those in the Concerned Ambivalent cluster (26.7%). Eight (17.0%) participants suggested improvements for vaccination processes, with similar overall reporting frequencies across clusters.
COVID-19 boosters and variants. Wanting continued protection from COVID-19 (36.2%), recommendations from a doctor or trusted source (17.0%), and news about emerging variants (10.6%) were frequent motivations for receiving a vaccine booster (eAppendix 4). These motivations were largely driven by the Concerned Ambivalents, of whom 25 of 30 were booster eligible and 24 received a booster dose. Belief that boosters were unnecessary (8.5%), concerns about efficacy (6.4%), and concerns about AEs (6.4%) were frequently identified hesitancies. These concerns were expressed largely by the Unconcerned Disbelievers, of whom 7 of 17 were booster dose eligible, but only 1 received a dose.
Evolving knowledge about variants was not a major concern overall and did not change existing opinions about the vaccine (36.2%). Concerned Ambivalents believed vaccination provided extra protection against variants (36.7%) and the emergence of variants served as a reminder of the ongoing pandemic (30.0%). In contrast, Unconcerned Disbelievers believed that the threat of variants was overblown (35.3%) and mutations are to be expected (17.6%).
Discussion
This study used a complementary mixed-methods approach to understand the motivations, hesitancies, and social and practical drivers of COVID-19 vaccine uptake among VA beneficiaries. Our quantitative analyses identified 4 distinct clusters based on respondents’ opinions on COVID-19 infection severity and vaccine effectiveness and safety. Veterans in 3 clusters were 12 to 49 times more likely to be vaccinated than those in the remaining cluster, even when controlling for baseline respondent characteristics and level of trust in credible sources of COVID-19 information. The observed vaccination rate of nearly 86% was higher than the contemporaneous national average of 62% for vaccine-eligible individuals, likely reflecting the comprehensive VA vaccine promotion strategies tailored to a patient demographic with a high COVID-19 risk profile.2,10
This cluster analyses demonstrated the importance of thoughts and feelings about COVID-19 infection and vaccination as influential social and behavioral drivers of vaccine uptake. These opinions help explain the strong association between cluster membership and vaccination status in this multivariable modeling. The cluster composition was consistent with findings from studies of nonveteran populations that identified perceived vulnerability to COVID-19 infection, beliefs in vaccine effectiveness, and adherence with protective behaviors during the pandemic as contributors to vaccine uptake.13,33 Qualitative themes showed that personal protection, protecting others, and vaccine mandates were frequent motivators for vaccination. Whereas protection of self and others from COVID-19 infection were more often expressed by the highly vaccinated Concerned Ambivalents, employment and travel vaccine mandates were more often identified by Unconcerned Disbelievers, who had a lower vaccination rate. Among Unconcerned Disbelievers, an employer vaccine requirement was the most frequent qualitative theme for overcoming vaccination concerns.
In addition to cluster membership, our modeling showed that trust in local VA HCPs and the CDC were independently associated with COVID-19 vaccination, which has been found in prior research.20 This qualitative analyses regarding vaccine hesitancy identified trust-related concerns that were more frequently expressed by Unconcerned Disbelievers than Concerned Ambivalents. Concerns included the rapid development of the vaccines potentially limiting the generation of scientifically sound effectiveness and safety data, and potential biases involving the entities promoting vaccine uptake.
Whereas the Concerned Believers, Unconcerned Believers, and Concerned Ambivalents all had high COVID-19 vaccination rates (≥ 93%), the decision-making pathways to vaccine uptake likely differ by their concerns about COVID-19 infection and perceptions of vaccine safety and effectiveness. For example, this mixed-methods analysis consistently showed that people in the Concerned Ambivalent cluster were positively motivated by concerns about COVID-19 infection and severity and beliefs about vaccine effectiveness that were tempered by concerns about vaccine AEs. For this cluster, their frequent thematic expression that the benefits of the vaccine exceed the risks, and the positive social influences of family, friends, and HCPs may explain their high vaccination rate.
Such insights into how the patterns of COVID-19–related thoughts and feelings vary across clusters can be used to design interventions to encourage initial and booster doses of COVID-19 vaccines. For example, messaging that highlights the infectivity and severity of COVID-19 and the potential for persistent negative health outcomes associated with long COVID could reinforce the beliefs of Concerned Believers and Concerned Ambivalents, and such messaging could also be used as a targeted intervention for Unconcerned Believers who expressed fewer concerns about the health consequences of COVID-19.23 Likewise, messaging about the safety profile of COVID-19 vaccines may reduce vaccine hesitancy for Concerned Ambivalents. Importantly, purposeful attention to health equity, community engagement, and involvement of racially diverse HCPs in patient discussions represent successful strategies to increase COVID-19 vaccine uptake among Black individuals, who were disproportionately represented in the Concerned Ambivalent cluster and may possess higher levels of mistrust due to racism experienced within the health care system.24
Our findings suggest that the greatest challenge for overcoming vaccine hesitancy is for individuals in the suboptimally vaccinated (30%) Unconcerned Disbeliever cluster. These individuals had low levels of concern about COVID-19 infection and severity, high levels of concern about vaccine safety, low perceived vaccine effectiveness, and low levels of trust in all information sources about COVID-19. While the Unconcerned Disbelievers cited scientifically reputable data sources, we were unable to verify whether participants accessed these reputable sources of information directly or obtained such information indirectly through potentially biased online sources. Nearly half of this cluster trusted their VA HCP and believed their community or religious leaders would want them to get vaccinated. This qualitative analyses found that Unconcerned Disbelievers relied on personal beliefs for vaccine decision-making more than Concerned Ambivalents. While Unconcerned Disbelievers were less likely to be socially influenced by family, friends, or religious leaders, they still acknowledged some impact from these sources. These findings suggest that addressing vaccine hesitancy among Unconcerned Disbelievers may require a multifaceted approach that respects their reliance on personal research while also leveraging the potential social influences. This approach supports the promising, previously reported practices of harnessing the social influences of HCPs and other community and religious leaders to promote vaccine uptake among Unconcerned Disbelievers.34,35 One evidence-based approach to effectively change patient health care behaviors is through motivational interviewing strategies that use open-ended questions, nonjudgmental interactions, and collaborative decision-making when discussing the risks and benefits of vaccination.21,22
Limitations
This study was conducted at a single VA health care facility and our sampling technique was nonrandom, suggesting that these results may not be generalizable to all veterans or non-VA patient populations. The 21% questionnaire response rate could have introduced selection bias into the respondent sample. All questionnaire data were self-reported, including vaccination status. Finally, the qualitative interviews consisted of a small number of unvaccinated individuals in 2 clusters (ie, Concerned Ambivalents and Unconcerned Disbelievers) and may not have reached thematic saturation in these subgroups.
Conclusions
Quantitative analyses identified 4 clusters based on individual thoughts and feelings about COVID-19 infection and vaccines. Cluster membership and levels of trust in COVID-19 information sources were independently associated with vaccination. Understanding the quantitative patterns of thoughts and beliefs across clusters, enriched by common qualitative themes for vaccine hesitancy, help inform tailored interventions to augment COVID-19 vaccine uptake and highlight the importance of targeted, trust-based communication and culturally sensitive interventions to enhance vaccine uptake across diverse populations.
- World Health Organization. WHO COVID-19 dashboard. Accessed July 18, 2025. https://covid19.who.int/
- Centers for Disease Control and Prevention. COVIDVax- View: Weekly COVID-19 Vaccination Coverage and Intent among Adults. Accessed June 10, 2025. https://www.cdc.gov/covidvaxview/weekly-dashboard/adult-vaccination-coverage.html
- World Health Organization. Strategy to achieve global Covid-19 vaccination by mid-2022. 2021. Accessed April 30, 2025. https://cdn.who.int/media/docs/default-source/immunization/covid-19/strategy-to-achieve-global-covid-19-vaccination-by-mid-2022.pdf
- Jasuja GK, Meterko M, Bradshaw LD, et al. Attitudes and intentions of US veterans regarding COVID-19 vaccination. JAMA Netw Open. 2021;4(11):e2132548. doi:10.1001/jamanetworkopen.2021.32548
- Der-Martirosian C, Steers WN, Northcraft H, Chu K, Dobalian A. Vaccinating veterans for COVID-19 at the U.S. Department of Veterans Affairs. Am J Prev Med. 2022;62(6):e317-e324. doi:10.1016/j.amepre.2021.12.016
- Bloeser K, Lipkowitz-Eaton J. Disproportionate multimorbidity among veterans in middle age. J Public Health (Oxf). 2022;44(1):28-35. doi:10.1093/pubmed/fdab149
- US Department of Veterans Affairs. National Center for Veterans Analysis and Statistics: veteran population. Updated March 26, 2025. Accessed April 30, 2025. https://www.va.gov/vetdata/Veteran_Population.asp
- Olenick M, Flowers M, Diaz VJ. US veterans and their unique issues: enhancing health care professional awareness. Adv Med Educ Pract. 2015;6:635-639. doi:10.2147/AMEP.S89479
- Orkaby AR, Nussbaum L, Ho YL, et al. The burden of frailty among U.S. veterans and its association with mortality, 2002-2012. J Gerontol A Biol Sci Med Sci. 2019;74(8):1257-1264. doi:10.1093/gerona/gly232
- Bass SB, Kelly PJ, Hoadley A, Arroyo Lloret A, Organtini T. Mapping perceptual differences to understand COVID-19 beliefs in those with vaccine hesitancy. J Health Commun. 2022;27(1):49-61. doi:10.1080/10810730.2022.2042627
- Meng L, Masters NB, Lu PJ, et al. Cluster analysis of adults unvaccinated for COVID-19 based on behavioral and social factors, National Immunization Survey-Adult COVID Module, United States. Prev Med. 2023;167:107415. doi:10.1016/j.ypmed.2022.107415
- Gin JL, Balut MD, Dobalian A. COVID-19 vaccination uptake and receptivity among veterans enrolled in homelessness- tailored primary health care clinics: provider trust vs. misinformation. BMC Prim Care. 2024;25(1):24. doi:10.1186/s12875-023-02251-x
- Wilson GM, Ray CE, Kale IO, et al. Age and beliefs about vaccines associated with COVID-19 vaccination among US veterans. Antimicrob Steward Healthc Epidemiol. 2023;3(1):e184. doi:10.1017/ash.2023.446
- VA Pittsburgh Healthcare System (VAPHS). Human Research Protection Program (HRPP) policy for quality assurance/ quality improvement projects. Policy H-013. December 31, 2021. Accessed April 30, 2025. https://www.va.gov/files/2020-11/H-013_QAQI%20Project_revised_updated%20format_clean_508.pdf
- Burkitt KH, Rodriguez KL, Mor MK, et al. Evaluation of a collaborative VA network initiative to reduce racial disparities in blood pressure control among veterans with severe hypertension. Healthc (Amst). 2021;8(suppl 1):100485. doi:10.1016/j.hjdsi.2020.100485
- Sinkowitz-Cochran RL, Burkitt KH, Cuerdon T, et al. The associations between organizational culture and knowledge, attitudes, and practices in a multicenter Veterans Affairs quality improvement initiative to prevent methicillin-resistant Staphylococcus aureus. Am J Infect Control. 2012;40(2):138-143. doi:10.1016/j.ajic.2011.04.332
- Burkitt KH, Sinkowitz-Cochran RL, Obrosky DS, et al. Survey of employee knowledge and attitudes before and after a multicenter Veterans’ Administration quality improvement initiative to reduce nosocomial methicillin-resistant Staphylococcus aureus infections. Am J Infect Control. 2010;38(4):274-282. doi:10.1016/j.ajic.2009.08.019
- STROBE - strengthening the reporting of observational studies in epidemiology. What is STROBE? Accessed April 30, 2025. https://www.strobe-statement.org/
- Tong A, Sainsbury P, Craig J. Consolidated criteria for reporting qualitative research (COREQ): a 32-item checklist for interviews and focus groups. Int J Qual Health Care. 2007;19(6):349-357. doi:10.1093/intqhc/mzm042
- Ward RE, Nguyen XT, Li Y, et al; on behalf of the VA Million Veteran Program. Racial and ethnic disparities in U.S. veteran health characteristics. Int J Environ Res Public Health. 2021;18(5):2411. doi:10.3390/ijerph18052411
- Harrington KM, Nguyen XT, Song RJ, et al; VA Million Veteran Program. Gender differences in demographic and health characteristics of the Million Veteran Program cohort. Womens Health Issues. 2019;29(suppl 1):S56-S66. doi:10.1016/j.whi.2019.04.012
- Washington DL, ed. National Veteran Health Equity Report 2021. Focus on Veterans Health Administration Patient Experience and Health Care Quality. VHA Office of Health Equity; September 2022. Accessed April 30, 2025. https://www.va.gov/healthequity/nvher.asp
- World Health Organization. Data for action: achieving high uptake of COVID-19 vaccines. April 1, 2021. Accessed April 30, 2025. https://www.who.int/publications/i/item/WHO-2019-nCoV-vaccination-demand-planning-2021.1
- Hoffman BL, Boness CL, Chu KH, et al. COVID- 19 vaccine hesitancy, acceptance, and promotion among healthcare workers: a mixed-methods analysis. J Community Health. 2022;47(5):750-758. doi:10.1007/s10900-022-01095-3
- Vasudevan L, Bruening R, Hung A, et al. COVID- 19 vaccination intention and activation among health care system employees: a mixed methods study. Vaccine. 2022;40(35):5141-5152. doi:10.1016/j.vaccine.2022.07.010
- Tibshirani R, Walther G, Hastie T. Estimating the number of clusters in a data set via the gap statistic. J R Stat Soc Series B Stat Methodol. 2001;63(2):411-423. doi:10.1111/1467-9868.00293
- Pedregosa FP, Varoquaux G, Gramfort A, et al. Scikitlearn: machine learning in Python. J Mach Learn Res. 2011;12:2825-2830.
- Proudfoot K. Inductive/deductive hybrid thematic analysis in mixed methods research. J Mix Methods Res. 2022;17(3): 308-326. doi:10.1177/15586898221126816
- Chapman AL, Hadfield M, Chapman CJ. Qualitative research in healthcare: an introduction to grounded theory using thematic analysis. J R Coll Physicians Edinb. 2015;45(3):201-205. doi:10.4997/jrcpe.2015.305
- Grandheim UH, Lundman B. Qualitative content analysis in nursing research: concepts, procedures and measures to achieve trustworthiness. Nurse Educ Today. 2004;24(2):105-112. doi:10.1016/j.nedt.2003.1001
- Sandelowski M. Whatever happened to qualitative description? Res Nurs Health. 2000;23(4):334-340. doi:10.1002/1098-240x(200008)23:4<334::aid-nur9 >3.0.co;2-g
- Garrison DR, Cleveland-Innes M, Koole M, Kappelman J. Revisiting methodological issues in transcript analysis: negotiated coding and reliability. Internet High Educ. 2006;9(1):1-8. doi:10.1016/j.iheduc.2005.11.001
- Wagner AL, Porth JM, Wu Z, Boulton ML, Finlay JM, Kobayashi LC. Vaccine hesitancy during the COVID-19 pandemic: a latent class analysis of middle-aged and older US adults. J Community Health. 2022;47(3):408- 415. doi:10.1007/s10900-022-01064-w
- Syed U, Kapera O, Chandrasekhar A, et al. The role of faith-based organizations in improving vaccination confidence & addressing vaccination disparities to help improve vaccine uptake: a systematic review. Vaccines (Basel). 2023;11(2):449. doi:10.3390/vaccines11020449
- Evans D, Norrbom C, Schmidt S, Powell R, McReynolds J, Sidibe T. Engaging community-based organizations to address barriers in public health programs: lessons learned from COVID-19 vaccine acceptance programs in diverse rural communities. Health Secur. 2023;21(S1):S17-S24. doi:10.1089/hs.2023.0017
The SARS-CoV-2 virus has resulted in > 778 million reported COVID-19 cases and > 7 million deaths worldwide. 1 About 70% of the eligible US population has completed a primary COVID-19 vaccination series, yet only 17% have received an updated bivalent booster dose.2 These immunization rates fall below the World Health Organization (WHO) target of 70%.3
Early in the pandemic, US Department of Veterans Affairs (VA) vaccination rates ranged from 46% to 71%.4,5 Ensuring a high level of COVID-19 vaccination in the largest integrated US health care system aligns with the VA priority to provide high-quality, evidence-based care to a patient population that is older and has more comorbidities than the overall US population.6-9
Vaccine hesitancy, defined as a “delay in acceptance or refusal of vaccination despite availability of vaccination service,” is a major contributor to suboptimal vaccination rates.10-13 Previous studies used cluster analyses to identify the unique combinations of behavioral and social factors responsible for COVID-19 vaccine hesitancy.10,11 Lack of perceived vaccine effectiveness and low perceived risk of the health consequences from COVID-19 infection were frequently identified in clusters where patients had the lowest intent for vaccination.10,11 Similarly, low trust in health care practitioners (HCPs), government, and pharmaceutical companies diminished intent for vaccination in these clusters.10 These quantitative studies were limited by their exclusive focus on unvaccinated individuals, reliance on self-reported intent, and lack of assessment of a health care system with a COVID-19 vaccine delivery program designed to overcome barriers to health care access, such as the VA.
Prior qualitative studies of vaccine uptake in distinct veteran subgroups (ie, unhoused and in VA facilities with low vaccination rates) demonstrated that overriding medical priorities among the unhoused and vaccine safety concerns were associated with decreased vaccine uptake, and positive perceptions of HCPs and the health care system were associated with increased vaccine uptake.11,12 However, these studies were conducted during periods of greater COVID-19 vaccine availability and acceptance, and prior to booster recommendations.4,12,13
This mixed-methods quality improvement (QI) project assessed the barriers and facilitators of COVID-19 vaccination among veterans receiving primary care at a single VA health care facility. We assessed whether unique patient clusters could be identified based on COVID-19–related and vaccine-related thoughts and feelings and whether cluster membership was associated with COVID-19 vaccination. This analysis also explored how individuals’ beliefs and trust shaped motivations and hesitancies for vaccine uptake in quantitatively derived clusters with varying vaccination rates.
Methods
This QI project was conducted at the VA Pittsburgh Healthcare System (VAPHS), a tertiary care facility serving > 75,000 veterans in Pennsylvania, West Virginia, and Ohio. The VAPHS Institutional Review Board determined this QI study was exempt from review.14-17 Participation was voluntary and had no bearing on VA health care or benefits. Financial support for the project, including key personnel and participant compensation, was provided by VAPHS. We followed the STROBE reporting guideline for cross-sectional studies and the COREQ checklist for qualitative research.18,19
Quantitative Survey
The 32,271 veterans assigned to a VAPHS primary care HCP, effective April 1, 2020, were eligible. To ensure representation of subgroups underrecognized in research and/or QI projects, the sample included all 1980 female patients at VAPHS and a random sample of 500 White and 500 Hispanic and/or non-White men within 4 age categories (< 50, 50-64, 65-84, and > 84 years). For the < 50 years or > 84 years categories, all Hispanic and/or non-White men were included due to small sample sizes.20-22 The nonrandom sampling frame comprised 1708 Hispanic and/or non-White men and 2000 White men. After assigning the 5688 potentially eligible individuals a unique identifier, 31 opted out, resulting in a final sample of 5657 individuals.
The 5657 individuals received a letter requesting their completion of a future questionnaire about COVID-19 infection and vaccines. An electronic Qualtrics questionnaire link was emailed to 3221 individuals; nonresponders received 2 follow-up email reminders. For the 2436 veterans without an email address on file, trained interviewers conducted phone surveys and entered responses. Those patients who completed the questionnaire could enter a drawing to win 1 of 100 cash prizes valued at $100. We collected questionnaire data from July to September 2021.
Questionnaire Items
We constructed a 60-item questionnaire based on prior research on COVID-19 vaccine hesitancy and the WHO Guidebook for Immunization Programs and Implementing Partners.4,23-25 The WHO Guidebook comprises survey items organized within 4 domains reflecting the behavioral and social determinants of vaccination: thoughts and feelings; social processes; motivation and hesitancy; and practical factors.23
Sociodemographic, clinical, and personal characteristics. The survey assessed respondent ethnicity and race and used these data to create a composite race and ethnicity variable. Highest educational level was also attained using 8 response options. The survey also assessed prior COVID-19 infection; prior receipt of vaccines for influenza, pneumonia, tetanus, or shingles; and presence of comorbidities that increase the risk of severe COVID-19 infection. We used administrative data from the VA Corporate Data Warehouse to determine respondent age, sex, geographic residence (urban, rural), and to fill in missing self-reported data on sex (n = 4) and ethnicity and race (n = 12). The survey assessed political views using a 5-point Likert scale (1, very liberal; 5, very conservative) and was collapsed into 3 categories (ie, very conservative or conservative, moderate, very liberal or liberal), with prefer not to answer reported separately
COVID-19 infection and vaccine. We asked veterans if they had ever been infected with COVID-19, whether they had been offered and/or received a COVID-19 vaccine, and type (Pfizer, Moderna, or Johnson & Johnson), and number of doses received. Positive vaccination status was defined as the receipt of ≥ 1 dose of a COVID-19 vaccine approved by the US Food and Drug Administration.
COVID-19 opinions. Respondents were asked about perceived risk of COVID-19 infection and related health outcomes, as well as beliefs about COVID-19 vaccines, using a 4-point Likert scale for all items: (1, not at all concerned; 4, very concerned). Respondents were asked about concerns related to COVID-19 infection and severe illness. They also were asked about vaccine-related short-term adverse effects (AEs) and long-term complications. Respondents were asked how effective they believed COVID-19 vaccines were at preventing infection, serious illness, or death. Unvaccinated and vaccinated veterans were asked similar items, with a qualifier of “before getting vaccinated…” for those who were vaccinated.
Social processes. Respondents were asked to rate their level of trust in various sources of COVID-19 vaccine information using a 4-point Likert scale (1, trust not at all; 4, trust very much). Respondents were asked whether community or religious leaders or close family or friends wanted them to get vaccinated (yes, no, or unsure).
Practical factors. Respondents were asked to rate the logistical difficulty of getting vaccinated or trying to get vaccinated using a 4-point Likert scale (1, not at all; 4, extremely).
Participants
Respondents were asked to participate in a follow-up qualitative interview. Among 293 participants who agreed, we sampled all 86 unvaccinated individuals regardless of cluster assignment, a random sample of 88 individuals in the cluster with the lowest vaccination rate, and all 33 vaccinated individuals in the cluster with the second-lowest vaccination rate. Forty-nine veterans completed qualitative interviews.
Two research staff trained in qualitative research completed telephone interviews, averaging 16.5 minutes (March to May 2022), using semistructured scripts to elicit vaccine-related motivations, hesitancies, or concerns. Interviews were recorded, transcribed, and deidentified. Participants provided written consent for recording and received $50 cash-equivalent compensation for interview completion.
Qualitative Interview Script
The interview script consisted of open-ended questions related to vaccine uptake across WHO domains.23 Both unvaccinated and vaccinated respondents were asked similar questions and customized questions about boosters for the vaccinated subgroup. To assess motivations and hesitancies, respondents were asked how they made their decisions about vaccination and what they considered when deciding. Vaccinated participants were asked about motivations and overcoming concerns. Unvaccinated respondents were asked about reasons for concern. To assess social processes, the interviewers asked participants whose opinion or counsel they trusted when deciding whether to get vaccinated. Questions also focused on positive experiences and vaccination barriers. Vaccinated participants were asked what could have improved their vaccination experiences. Finally, the interviewers asked participants who received a complete primary vaccine series about their motivations and plans related to booster vaccines, and whether information about emerging COVID-19 variants influenced their decisions.
Data Analyses
This analysis used X2 and Fisher exact tests to assess the associations among respondent characteristics, questionnaire responses, vaccination status, and cluster membership. Items phrased similarly were handled in a similar fashion for vaccinated and unvaccinated respondents.
Cluster analysis assessed the possible groupings in responses to the quantitative questionnaire items focused on thoughts and feelings about COVID-19 infection risk and severity, vaccine effectiveness, and vaccine safety. This analysis treated the items’ ordinal response categories as continuous. We performed factor analysis using principal component analysis to explore dimension reduction and account for covariance between items. Two principal components were calculated and applied k-means clustering, determining the number of clusters through agreement from the elbow, gap statistic, and silhouette methods.26 Each cluster was named based on its unique pattern of responses to the items used to define them (eAppendix 1).
Multivariable logistic regression analyses assessed the independent association between cluster membership as the independent measure and vaccination status as the dependent measure, adjusting for respondent sociodemographic and personal characteristics and 2 measures of trust (ie, local VA HCP and the CDC). We selected these trust measures because they represent objective sources of medical information and were independently associated with COVID-19 vaccination status in a logistic regression model comprising all 6 trust items assessed.
This study defined statistical significance as a 2-tailed P value < .05. SAS 9.4 was used for all statistical analyses and Python 3.7.4 and the Scikit-learn package for cluster analyses.27 For qualitative analyses, this study used an inductive thematic approach guided by conventional qualitative content analysis, NVivo 12 Plus for Windows to code and analyze interview transcripts.28,29 We created an initial codebook based on 10 transcripts that were selected for high complexity and represented cluster membership and vaccination status.30,31 After 2 qualitative staff developed the initial codebook, 11 of 49 (22%) transcripts were independently coded by a primary and secondary coder to ensure consistent code application. Both coders reviewed the cocoded transcripts and resolved all discrepancies through negotiated consensus.32 After the cocoding process was complete, the primary coder coded the remaining transcripts. The primary and secondary coder met as needed to review and discuss any questions that arose during the primary coder’s work.
Results
Of 5657 eligible participants, 1208 (21.4%) completed a questionnaire. Overall, 674 (55.8%) were aged < 65 years, 530 (43.9%) were women, 828 (68.5%) were non-Hispanic White, 303 (25.1%) were Black, and 47 (3.9%) were Hispanic, and 1034 (85.6%) were vaccinated (Table 1). Compared to the total sampled population, respondents were more often older, female, and White (eAppendix 2).
Cluster Membership
Four clusters were identified from 1183 (97.9%) participants who provided complete responses to 6 items assessing thoughts and feelings about COVID-19 infection and vaccines (Table 2). Of the 1183 respondents, 375 (31.7%) were Concerned Believers (cluster 1), 336 (28.4%) were Unconcerned Believers (cluster 2), 298 (25.2%) were Concerned Ambivalents (cluster 3), and 174 (14.7%) were Unconcerned Disbelievers (cluster 4). The Concerned Believers were moderately/ very concerned about COVID-19 infection (96.0%) and becoming very ill from infection (94.6%), believed the vaccine was moderately/very effective in preventing COVID-19 infection (100%) and severe illness or death from infection (98.7%), and had slight concern about short-term AEs (92.6%) or long-term complications (92.0%) from the vaccine. The Unconcerned Believers had no/slight concern about COVID-19 infection (76.5%) or becoming very ill (79.2%), believed the vaccine was effective in preventing infection (82.4%) and severe illness and death (83.6%), and had no/slight concern about short-term AEs (94.0%) or long-term complications (87.2%) from the vaccine. The Concerned Ambivalents were moderately/ very concerned about COVID-19 infection (94.3%) and becoming very ill (93.6%), believed the vaccine was moderately/very effective in preventing infection (86.6%) and severe illness or death (86.9%), and were moderately/very concerned about short-term AEs (81.9%) or long-term complications (89.3%) from the vaccine. The Unconcerned Disbelievers had no/slight concern about COVID-19 infection (90.8%) and becoming very ill (88.6%), believed the vaccine was not at all/slightly effective in preventing infection (90.3%) and severe illness or death (87.4%), and were moderately/very concerned about short-term AEs (52.8%) or long-term complications (75.9%) from the vaccine.
Cluster Membership
Respondent age, race and ethnicity, and political viewpoints differed significantly by cluster (P < .001). Compared with the other clusters, the Concerned Believer cluster was older (55.5% age ≥ 65 years vs 16.7%-48.0%) and more frequently reported liberal political views (28.8% vs 4.6%-15.1%). In contrast, the Unconcerned Disbeliever cluster was younger (83.4% age ≤ 64 years vs 44.5%-56.8%) and more frequently reported conservative political views (37.9% vs 17.1%-26.8%) than the other clusters. Whereas the Concerned Ambivalent cluster had the highest proportion of Black (37.7%) and the lowest proportion of White respondents (57.6%), the Unconcerned Disbelievers cluster had the lowest proportion of Black respondents (14.5%) and the highest proportion of White respondents (77.9%). The Unconcerned Disbelievers cluster were significantly less likely to trust COVID-19 vaccine information from any source and to believe those close to them wanted them to get vaccinated.
Association of Cluster Membership and COVID-19 Vaccination
COVID-19 vaccination rates varied more than 3-fold (P < .001) by cluster, with 29.9% of Unconcerned Disbelievers, 93.3% of Concerned Ambivalents, 93.5% of Unconcerned Believers, and 98.9% of Concerned Believers reporting being vaccinated. (Figure). Cluster membership was independently associated with vaccination, with adjusted odds ratios (AORs) of 12.0 (95% CI, 6.1-23.8) for the Concerned Ambivalent, 13.0 (95% CI, 6.9-24.5) for Unconcerned Believer, and 48.6 (95% CI, 15.5-152.1) for Concerned Believer clusters (Table 3). Respondent trust in COVID-19 vaccine information from their VA HCP (AOR 2.1; 95% CI, 1.6-2.8) and the CDC (AOR 1.6; 95% CI, 1.2-2.1) were independently associated with vaccination status, while the remaining respondent sociodemographic or personal characteristics were not.
Qualitative Interview Participants
A 49-participant convenience sample completed interviews, including 30 Concerned Ambivalent, 17 Unconcerned Disbeliever, and 2 Unconcerned Believer respondents cluster. The data were not calculated for Unconcerned Believers due to the small sample size. Interview participants were more likely to be younger, female, non-Hispanic, White, less educated, and more politically conservative than the questionnaire respondents as a whole (Appendix). The vaccination rate for the interview participants was 73.5%, ranging from 29.9% in the Unconcerned Disbeliever to 93.3% in the Concerned Ambivalent cluster. Qualitative themes and participant quotes for Concerned Ambivalent and Unconcerned Disbeliever respondents are in eAppendix 3.
Motivations. Wanting personal protection from becoming infected or severely ill from COVID-19 (63.8%), caregiver wanting to protect others (17.0%), and employment vaccine requirements (14.9%) were frequent motivations for vaccination. Whereas personal protection (90.0%) and protection of others (23.3%) were identified more frequently in the Concerned Ambivalents cluster, employment vaccine requirements (35.3%) were more frequently identified in the Unconcerned Disbelievers cluster.
Hesitancies or concerns. Lack of sufficient information related to rapid vaccine development (55.3%), vaccine AEs (38.3%), and low confidence in vaccine efficacy (23.4%) were frequent concerns or hesitancies about vaccination. Unconcerned Disbelievers expressed higher levels of concern about the vaccine’s rapid development (82.4%), low perceived vaccine efficacy (47.1%), and a lack of trust in governmental vaccine promotion (23.5%) than did the Concerned Ambivalents.
Overcoming concerns. Not wanting to get sick or die from infection coupled with an understanding that vaccine benefits exceed risks (23.4%) and receiving information from a trusted source (10.6%) were common ways of overcoming concerns for vaccination. Although the Unconcerned Disbelievers infrequently identified reasons for overcoming concerns, they identified employment requirements (17.6%) as a reason for vaccination despite concerns. They also identified seeing others with positive vaccine experiences and pressure from family or friends as ways of overcoming concerns (11.8% each).
Social influences. Family members or partners (38.3%), personal opinions (38.3%), and HCPs (23.4%) were frequent social influences for vaccination. Concerned Ambivalents mentioned family members and partners (46.7%), HCPs (26.7%), and friends (20.0%) as common influences, while Unconcerned Disbelievers more frequently relied on their opinion (41.2%) and quoted specific scientifically reputable data sources (17.6%) to guide vaccine decision-making, although it is unclear whether these sources were accessed directly or if this information was obtained indirectly through scientifically unvetted data platforms.
Practical factors. Most participants had positive vaccination experiences (68.1%), determined mainly by the Concerned Ambivalents (90.0%), who were more highly vaccinated. Barriers to vaccination were reported by 9 (19.1%) participants, driven by those in the Concerned Ambivalent cluster (26.7%). Eight (17.0%) participants suggested improvements for vaccination processes, with similar overall reporting frequencies across clusters.
COVID-19 boosters and variants. Wanting continued protection from COVID-19 (36.2%), recommendations from a doctor or trusted source (17.0%), and news about emerging variants (10.6%) were frequent motivations for receiving a vaccine booster (eAppendix 4). These motivations were largely driven by the Concerned Ambivalents, of whom 25 of 30 were booster eligible and 24 received a booster dose. Belief that boosters were unnecessary (8.5%), concerns about efficacy (6.4%), and concerns about AEs (6.4%) were frequently identified hesitancies. These concerns were expressed largely by the Unconcerned Disbelievers, of whom 7 of 17 were booster dose eligible, but only 1 received a dose.
Evolving knowledge about variants was not a major concern overall and did not change existing opinions about the vaccine (36.2%). Concerned Ambivalents believed vaccination provided extra protection against variants (36.7%) and the emergence of variants served as a reminder of the ongoing pandemic (30.0%). In contrast, Unconcerned Disbelievers believed that the threat of variants was overblown (35.3%) and mutations are to be expected (17.6%).
Discussion
This study used a complementary mixed-methods approach to understand the motivations, hesitancies, and social and practical drivers of COVID-19 vaccine uptake among VA beneficiaries. Our quantitative analyses identified 4 distinct clusters based on respondents’ opinions on COVID-19 infection severity and vaccine effectiveness and safety. Veterans in 3 clusters were 12 to 49 times more likely to be vaccinated than those in the remaining cluster, even when controlling for baseline respondent characteristics and level of trust in credible sources of COVID-19 information. The observed vaccination rate of nearly 86% was higher than the contemporaneous national average of 62% for vaccine-eligible individuals, likely reflecting the comprehensive VA vaccine promotion strategies tailored to a patient demographic with a high COVID-19 risk profile.2,10
This cluster analyses demonstrated the importance of thoughts and feelings about COVID-19 infection and vaccination as influential social and behavioral drivers of vaccine uptake. These opinions help explain the strong association between cluster membership and vaccination status in this multivariable modeling. The cluster composition was consistent with findings from studies of nonveteran populations that identified perceived vulnerability to COVID-19 infection, beliefs in vaccine effectiveness, and adherence with protective behaviors during the pandemic as contributors to vaccine uptake.13,33 Qualitative themes showed that personal protection, protecting others, and vaccine mandates were frequent motivators for vaccination. Whereas protection of self and others from COVID-19 infection were more often expressed by the highly vaccinated Concerned Ambivalents, employment and travel vaccine mandates were more often identified by Unconcerned Disbelievers, who had a lower vaccination rate. Among Unconcerned Disbelievers, an employer vaccine requirement was the most frequent qualitative theme for overcoming vaccination concerns.
In addition to cluster membership, our modeling showed that trust in local VA HCPs and the CDC were independently associated with COVID-19 vaccination, which has been found in prior research.20 This qualitative analyses regarding vaccine hesitancy identified trust-related concerns that were more frequently expressed by Unconcerned Disbelievers than Concerned Ambivalents. Concerns included the rapid development of the vaccines potentially limiting the generation of scientifically sound effectiveness and safety data, and potential biases involving the entities promoting vaccine uptake.
Whereas the Concerned Believers, Unconcerned Believers, and Concerned Ambivalents all had high COVID-19 vaccination rates (≥ 93%), the decision-making pathways to vaccine uptake likely differ by their concerns about COVID-19 infection and perceptions of vaccine safety and effectiveness. For example, this mixed-methods analysis consistently showed that people in the Concerned Ambivalent cluster were positively motivated by concerns about COVID-19 infection and severity and beliefs about vaccine effectiveness that were tempered by concerns about vaccine AEs. For this cluster, their frequent thematic expression that the benefits of the vaccine exceed the risks, and the positive social influences of family, friends, and HCPs may explain their high vaccination rate.
Such insights into how the patterns of COVID-19–related thoughts and feelings vary across clusters can be used to design interventions to encourage initial and booster doses of COVID-19 vaccines. For example, messaging that highlights the infectivity and severity of COVID-19 and the potential for persistent negative health outcomes associated with long COVID could reinforce the beliefs of Concerned Believers and Concerned Ambivalents, and such messaging could also be used as a targeted intervention for Unconcerned Believers who expressed fewer concerns about the health consequences of COVID-19.23 Likewise, messaging about the safety profile of COVID-19 vaccines may reduce vaccine hesitancy for Concerned Ambivalents. Importantly, purposeful attention to health equity, community engagement, and involvement of racially diverse HCPs in patient discussions represent successful strategies to increase COVID-19 vaccine uptake among Black individuals, who were disproportionately represented in the Concerned Ambivalent cluster and may possess higher levels of mistrust due to racism experienced within the health care system.24
Our findings suggest that the greatest challenge for overcoming vaccine hesitancy is for individuals in the suboptimally vaccinated (30%) Unconcerned Disbeliever cluster. These individuals had low levels of concern about COVID-19 infection and severity, high levels of concern about vaccine safety, low perceived vaccine effectiveness, and low levels of trust in all information sources about COVID-19. While the Unconcerned Disbelievers cited scientifically reputable data sources, we were unable to verify whether participants accessed these reputable sources of information directly or obtained such information indirectly through potentially biased online sources. Nearly half of this cluster trusted their VA HCP and believed their community or religious leaders would want them to get vaccinated. This qualitative analyses found that Unconcerned Disbelievers relied on personal beliefs for vaccine decision-making more than Concerned Ambivalents. While Unconcerned Disbelievers were less likely to be socially influenced by family, friends, or religious leaders, they still acknowledged some impact from these sources. These findings suggest that addressing vaccine hesitancy among Unconcerned Disbelievers may require a multifaceted approach that respects their reliance on personal research while also leveraging the potential social influences. This approach supports the promising, previously reported practices of harnessing the social influences of HCPs and other community and religious leaders to promote vaccine uptake among Unconcerned Disbelievers.34,35 One evidence-based approach to effectively change patient health care behaviors is through motivational interviewing strategies that use open-ended questions, nonjudgmental interactions, and collaborative decision-making when discussing the risks and benefits of vaccination.21,22
Limitations
This study was conducted at a single VA health care facility and our sampling technique was nonrandom, suggesting that these results may not be generalizable to all veterans or non-VA patient populations. The 21% questionnaire response rate could have introduced selection bias into the respondent sample. All questionnaire data were self-reported, including vaccination status. Finally, the qualitative interviews consisted of a small number of unvaccinated individuals in 2 clusters (ie, Concerned Ambivalents and Unconcerned Disbelievers) and may not have reached thematic saturation in these subgroups.
Conclusions
Quantitative analyses identified 4 clusters based on individual thoughts and feelings about COVID-19 infection and vaccines. Cluster membership and levels of trust in COVID-19 information sources were independently associated with vaccination. Understanding the quantitative patterns of thoughts and beliefs across clusters, enriched by common qualitative themes for vaccine hesitancy, help inform tailored interventions to augment COVID-19 vaccine uptake and highlight the importance of targeted, trust-based communication and culturally sensitive interventions to enhance vaccine uptake across diverse populations.
- World Health Organization. WHO COVID-19 dashboard. Accessed July 18, 2025. https://covid19.who.int/
- Centers for Disease Control and Prevention. COVIDVax- View: Weekly COVID-19 Vaccination Coverage and Intent among Adults. Accessed June 10, 2025. https://www.cdc.gov/covidvaxview/weekly-dashboard/adult-vaccination-coverage.html
- World Health Organization. Strategy to achieve global Covid-19 vaccination by mid-2022. 2021. Accessed April 30, 2025. https://cdn.who.int/media/docs/default-source/immunization/covid-19/strategy-to-achieve-global-covid-19-vaccination-by-mid-2022.pdf
- Jasuja GK, Meterko M, Bradshaw LD, et al. Attitudes and intentions of US veterans regarding COVID-19 vaccination. JAMA Netw Open. 2021;4(11):e2132548. doi:10.1001/jamanetworkopen.2021.32548
- Der-Martirosian C, Steers WN, Northcraft H, Chu K, Dobalian A. Vaccinating veterans for COVID-19 at the U.S. Department of Veterans Affairs. Am J Prev Med. 2022;62(6):e317-e324. doi:10.1016/j.amepre.2021.12.016
- Bloeser K, Lipkowitz-Eaton J. Disproportionate multimorbidity among veterans in middle age. J Public Health (Oxf). 2022;44(1):28-35. doi:10.1093/pubmed/fdab149
- US Department of Veterans Affairs. National Center for Veterans Analysis and Statistics: veteran population. Updated March 26, 2025. Accessed April 30, 2025. https://www.va.gov/vetdata/Veteran_Population.asp
- Olenick M, Flowers M, Diaz VJ. US veterans and their unique issues: enhancing health care professional awareness. Adv Med Educ Pract. 2015;6:635-639. doi:10.2147/AMEP.S89479
- Orkaby AR, Nussbaum L, Ho YL, et al. The burden of frailty among U.S. veterans and its association with mortality, 2002-2012. J Gerontol A Biol Sci Med Sci. 2019;74(8):1257-1264. doi:10.1093/gerona/gly232
- Bass SB, Kelly PJ, Hoadley A, Arroyo Lloret A, Organtini T. Mapping perceptual differences to understand COVID-19 beliefs in those with vaccine hesitancy. J Health Commun. 2022;27(1):49-61. doi:10.1080/10810730.2022.2042627
- Meng L, Masters NB, Lu PJ, et al. Cluster analysis of adults unvaccinated for COVID-19 based on behavioral and social factors, National Immunization Survey-Adult COVID Module, United States. Prev Med. 2023;167:107415. doi:10.1016/j.ypmed.2022.107415
- Gin JL, Balut MD, Dobalian A. COVID-19 vaccination uptake and receptivity among veterans enrolled in homelessness- tailored primary health care clinics: provider trust vs. misinformation. BMC Prim Care. 2024;25(1):24. doi:10.1186/s12875-023-02251-x
- Wilson GM, Ray CE, Kale IO, et al. Age and beliefs about vaccines associated with COVID-19 vaccination among US veterans. Antimicrob Steward Healthc Epidemiol. 2023;3(1):e184. doi:10.1017/ash.2023.446
- VA Pittsburgh Healthcare System (VAPHS). Human Research Protection Program (HRPP) policy for quality assurance/ quality improvement projects. Policy H-013. December 31, 2021. Accessed April 30, 2025. https://www.va.gov/files/2020-11/H-013_QAQI%20Project_revised_updated%20format_clean_508.pdf
- Burkitt KH, Rodriguez KL, Mor MK, et al. Evaluation of a collaborative VA network initiative to reduce racial disparities in blood pressure control among veterans with severe hypertension. Healthc (Amst). 2021;8(suppl 1):100485. doi:10.1016/j.hjdsi.2020.100485
- Sinkowitz-Cochran RL, Burkitt KH, Cuerdon T, et al. The associations between organizational culture and knowledge, attitudes, and practices in a multicenter Veterans Affairs quality improvement initiative to prevent methicillin-resistant Staphylococcus aureus. Am J Infect Control. 2012;40(2):138-143. doi:10.1016/j.ajic.2011.04.332
- Burkitt KH, Sinkowitz-Cochran RL, Obrosky DS, et al. Survey of employee knowledge and attitudes before and after a multicenter Veterans’ Administration quality improvement initiative to reduce nosocomial methicillin-resistant Staphylococcus aureus infections. Am J Infect Control. 2010;38(4):274-282. doi:10.1016/j.ajic.2009.08.019
- STROBE - strengthening the reporting of observational studies in epidemiology. What is STROBE? Accessed April 30, 2025. https://www.strobe-statement.org/
- Tong A, Sainsbury P, Craig J. Consolidated criteria for reporting qualitative research (COREQ): a 32-item checklist for interviews and focus groups. Int J Qual Health Care. 2007;19(6):349-357. doi:10.1093/intqhc/mzm042
- Ward RE, Nguyen XT, Li Y, et al; on behalf of the VA Million Veteran Program. Racial and ethnic disparities in U.S. veteran health characteristics. Int J Environ Res Public Health. 2021;18(5):2411. doi:10.3390/ijerph18052411
- Harrington KM, Nguyen XT, Song RJ, et al; VA Million Veteran Program. Gender differences in demographic and health characteristics of the Million Veteran Program cohort. Womens Health Issues. 2019;29(suppl 1):S56-S66. doi:10.1016/j.whi.2019.04.012
- Washington DL, ed. National Veteran Health Equity Report 2021. Focus on Veterans Health Administration Patient Experience and Health Care Quality. VHA Office of Health Equity; September 2022. Accessed April 30, 2025. https://www.va.gov/healthequity/nvher.asp
- World Health Organization. Data for action: achieving high uptake of COVID-19 vaccines. April 1, 2021. Accessed April 30, 2025. https://www.who.int/publications/i/item/WHO-2019-nCoV-vaccination-demand-planning-2021.1
- Hoffman BL, Boness CL, Chu KH, et al. COVID- 19 vaccine hesitancy, acceptance, and promotion among healthcare workers: a mixed-methods analysis. J Community Health. 2022;47(5):750-758. doi:10.1007/s10900-022-01095-3
- Vasudevan L, Bruening R, Hung A, et al. COVID- 19 vaccination intention and activation among health care system employees: a mixed methods study. Vaccine. 2022;40(35):5141-5152. doi:10.1016/j.vaccine.2022.07.010
- Tibshirani R, Walther G, Hastie T. Estimating the number of clusters in a data set via the gap statistic. J R Stat Soc Series B Stat Methodol. 2001;63(2):411-423. doi:10.1111/1467-9868.00293
- Pedregosa FP, Varoquaux G, Gramfort A, et al. Scikitlearn: machine learning in Python. J Mach Learn Res. 2011;12:2825-2830.
- Proudfoot K. Inductive/deductive hybrid thematic analysis in mixed methods research. J Mix Methods Res. 2022;17(3): 308-326. doi:10.1177/15586898221126816
- Chapman AL, Hadfield M, Chapman CJ. Qualitative research in healthcare: an introduction to grounded theory using thematic analysis. J R Coll Physicians Edinb. 2015;45(3):201-205. doi:10.4997/jrcpe.2015.305
- Grandheim UH, Lundman B. Qualitative content analysis in nursing research: concepts, procedures and measures to achieve trustworthiness. Nurse Educ Today. 2004;24(2):105-112. doi:10.1016/j.nedt.2003.1001
- Sandelowski M. Whatever happened to qualitative description? Res Nurs Health. 2000;23(4):334-340. doi:10.1002/1098-240x(200008)23:4<334::aid-nur9 >3.0.co;2-g
- Garrison DR, Cleveland-Innes M, Koole M, Kappelman J. Revisiting methodological issues in transcript analysis: negotiated coding and reliability. Internet High Educ. 2006;9(1):1-8. doi:10.1016/j.iheduc.2005.11.001
- Wagner AL, Porth JM, Wu Z, Boulton ML, Finlay JM, Kobayashi LC. Vaccine hesitancy during the COVID-19 pandemic: a latent class analysis of middle-aged and older US adults. J Community Health. 2022;47(3):408- 415. doi:10.1007/s10900-022-01064-w
- Syed U, Kapera O, Chandrasekhar A, et al. The role of faith-based organizations in improving vaccination confidence & addressing vaccination disparities to help improve vaccine uptake: a systematic review. Vaccines (Basel). 2023;11(2):449. doi:10.3390/vaccines11020449
- Evans D, Norrbom C, Schmidt S, Powell R, McReynolds J, Sidibe T. Engaging community-based organizations to address barriers in public health programs: lessons learned from COVID-19 vaccine acceptance programs in diverse rural communities. Health Secur. 2023;21(S1):S17-S24. doi:10.1089/hs.2023.0017
Insights Into Veterans’ Motivations and Hesitancies for COVID-19 Vaccine Uptake: A Mixed-Methods Analysis
Insights Into Veterans’ Motivations and Hesitancies for COVID-19 Vaccine Uptake: A Mixed-Methods Analysis


Radiation and Medical Oncology Perspectives on Oligometastatic Disease Treatment
Radiation and Medical Oncology Perspectives on Oligometastatic Disease Treatment
The treatment of metastatic solid tumors has been based historically on systemic therapies, with the goal of delaying progression and extend life as long as possible, with tolerable treatment-related adverse events. Some exceptions were made for local treatment with surgery or radiotherapy (RT), often for patients with a single metastasis. A 1939 report describes a patient with renal adenocarcinoma and a solitary lung metastasis who underwent RT to the lung lesion after nephrectomy and subsequently partial lobectomy after the metastatic lesion progressed. The authors argued that if a metastasis appears solitary and accessible, it is plausible to remove it in addition to the primary growth.1
In 1995 Hellman and Weichselbaum proposed oligometastatic disease (OMD). They reasoned that malignancy exists along a spectrum from localized disease to widely disseminated disease, with OMD existing in between with a still-restricted tumor metastatic capacity. Appropriately selected patients with OMD may be candidates for prolonged disease-free survival or cure with the addition of local therapy to systemic therapy.2
The EORTC 4004 phase 2 randomized control trial (RCT) analyzed radiofrequency ablation (RFA) for colorectal liver metastases with systemic therapy vs systemic therapy alone for patients with ≤ 9 liver lesions.3 Systemic therapyconsisted of 5-FU/leucovorin/oxaliplatin, with bevacizumab added to the regimen 3.5 years into the study, per updated standard- of-care. This trial was the first to demonstrate the benefit of aggressive local treatment vs system treatment alone for OMD with a progression-free survival (PFS) benefit (16.8 vs 9.9 months; hazard ratio [HR], 0.63; P = .03) and overall survival (OS) benefit (45.3 vs 40.5 months; HR, 0.74; P = .02) with the addition of local treatment with RFA.
Since the presentations of the SABR-COMET phase 2 RCT and another study by Gomez et al at the American Society for Radiation Oncology (ASTRO) 2018 annual meeting, the paradigm for offering local RT for OMD has rapidly evolved. Both studies found PFS and OS benefits of RT for patients with OMD.4,5 Additional RCTs have since demonstrated that for properly selected patients with OMD, aggressive local RT improved PFS and OS.6-9 These small studies have led to larger RCTs to better understand who benefits from local consolidative treatment, particularly RT.10,11
There is a large degree of heterogeneity in how oncologists define and approach OMD treatment. The 2020 European Society for Radiotherapy and Oncology (ESTRO) and ASTRO consensus guidelines defined the OMD state as 1 to 5 metastatic lesions for which all metastatic sites are safely treatable.12 The purpose of this study was to evaluate perceptions and practice patterns among radiation oncologists and medical oncologists regarding the use of local RT for OMD across the Veterans Health Administration (VHA).
Methods
A 12-question survey was developed by the VHA Palliative Radiotherapy Task Force using the ESTRO-ASTRO consensus guidelines to define OMD. The survey was emailed to the VHA radiation oncology and medical oncology listservs on August 1, 2023. These listservs consist of physicians in these specialties either directly employed by the VHA or serve in its facilities as contractors. The original response closure date was August 11, 2023, but it was extended to August 18, 2023, to increase responses. No incentives were offered to respondents. Two email reminders were sent to the medical oncology listserv and 3 to the radiation oncology listserv. Descriptive statistics and X2 tests were used for data analysis. The impact of specialty and presence of an on-site department of radiation oncology were reviewed. This project was approved by the VHA National Oncology Program and National Radiation Oncology Program.
Results
The survey was sent to 125 radiation oncologists and 515 medical oncologists and 106 were completed for a 16.6% response rate. There were 59 (55.7%) radiation oncologist responses and 47 (44.3%) medical oncologist responses. Most (96.2%) respondents were board-certified, and 84 (79.2%) were affiliated with an academic center. Not every respondent answered every question (Table).
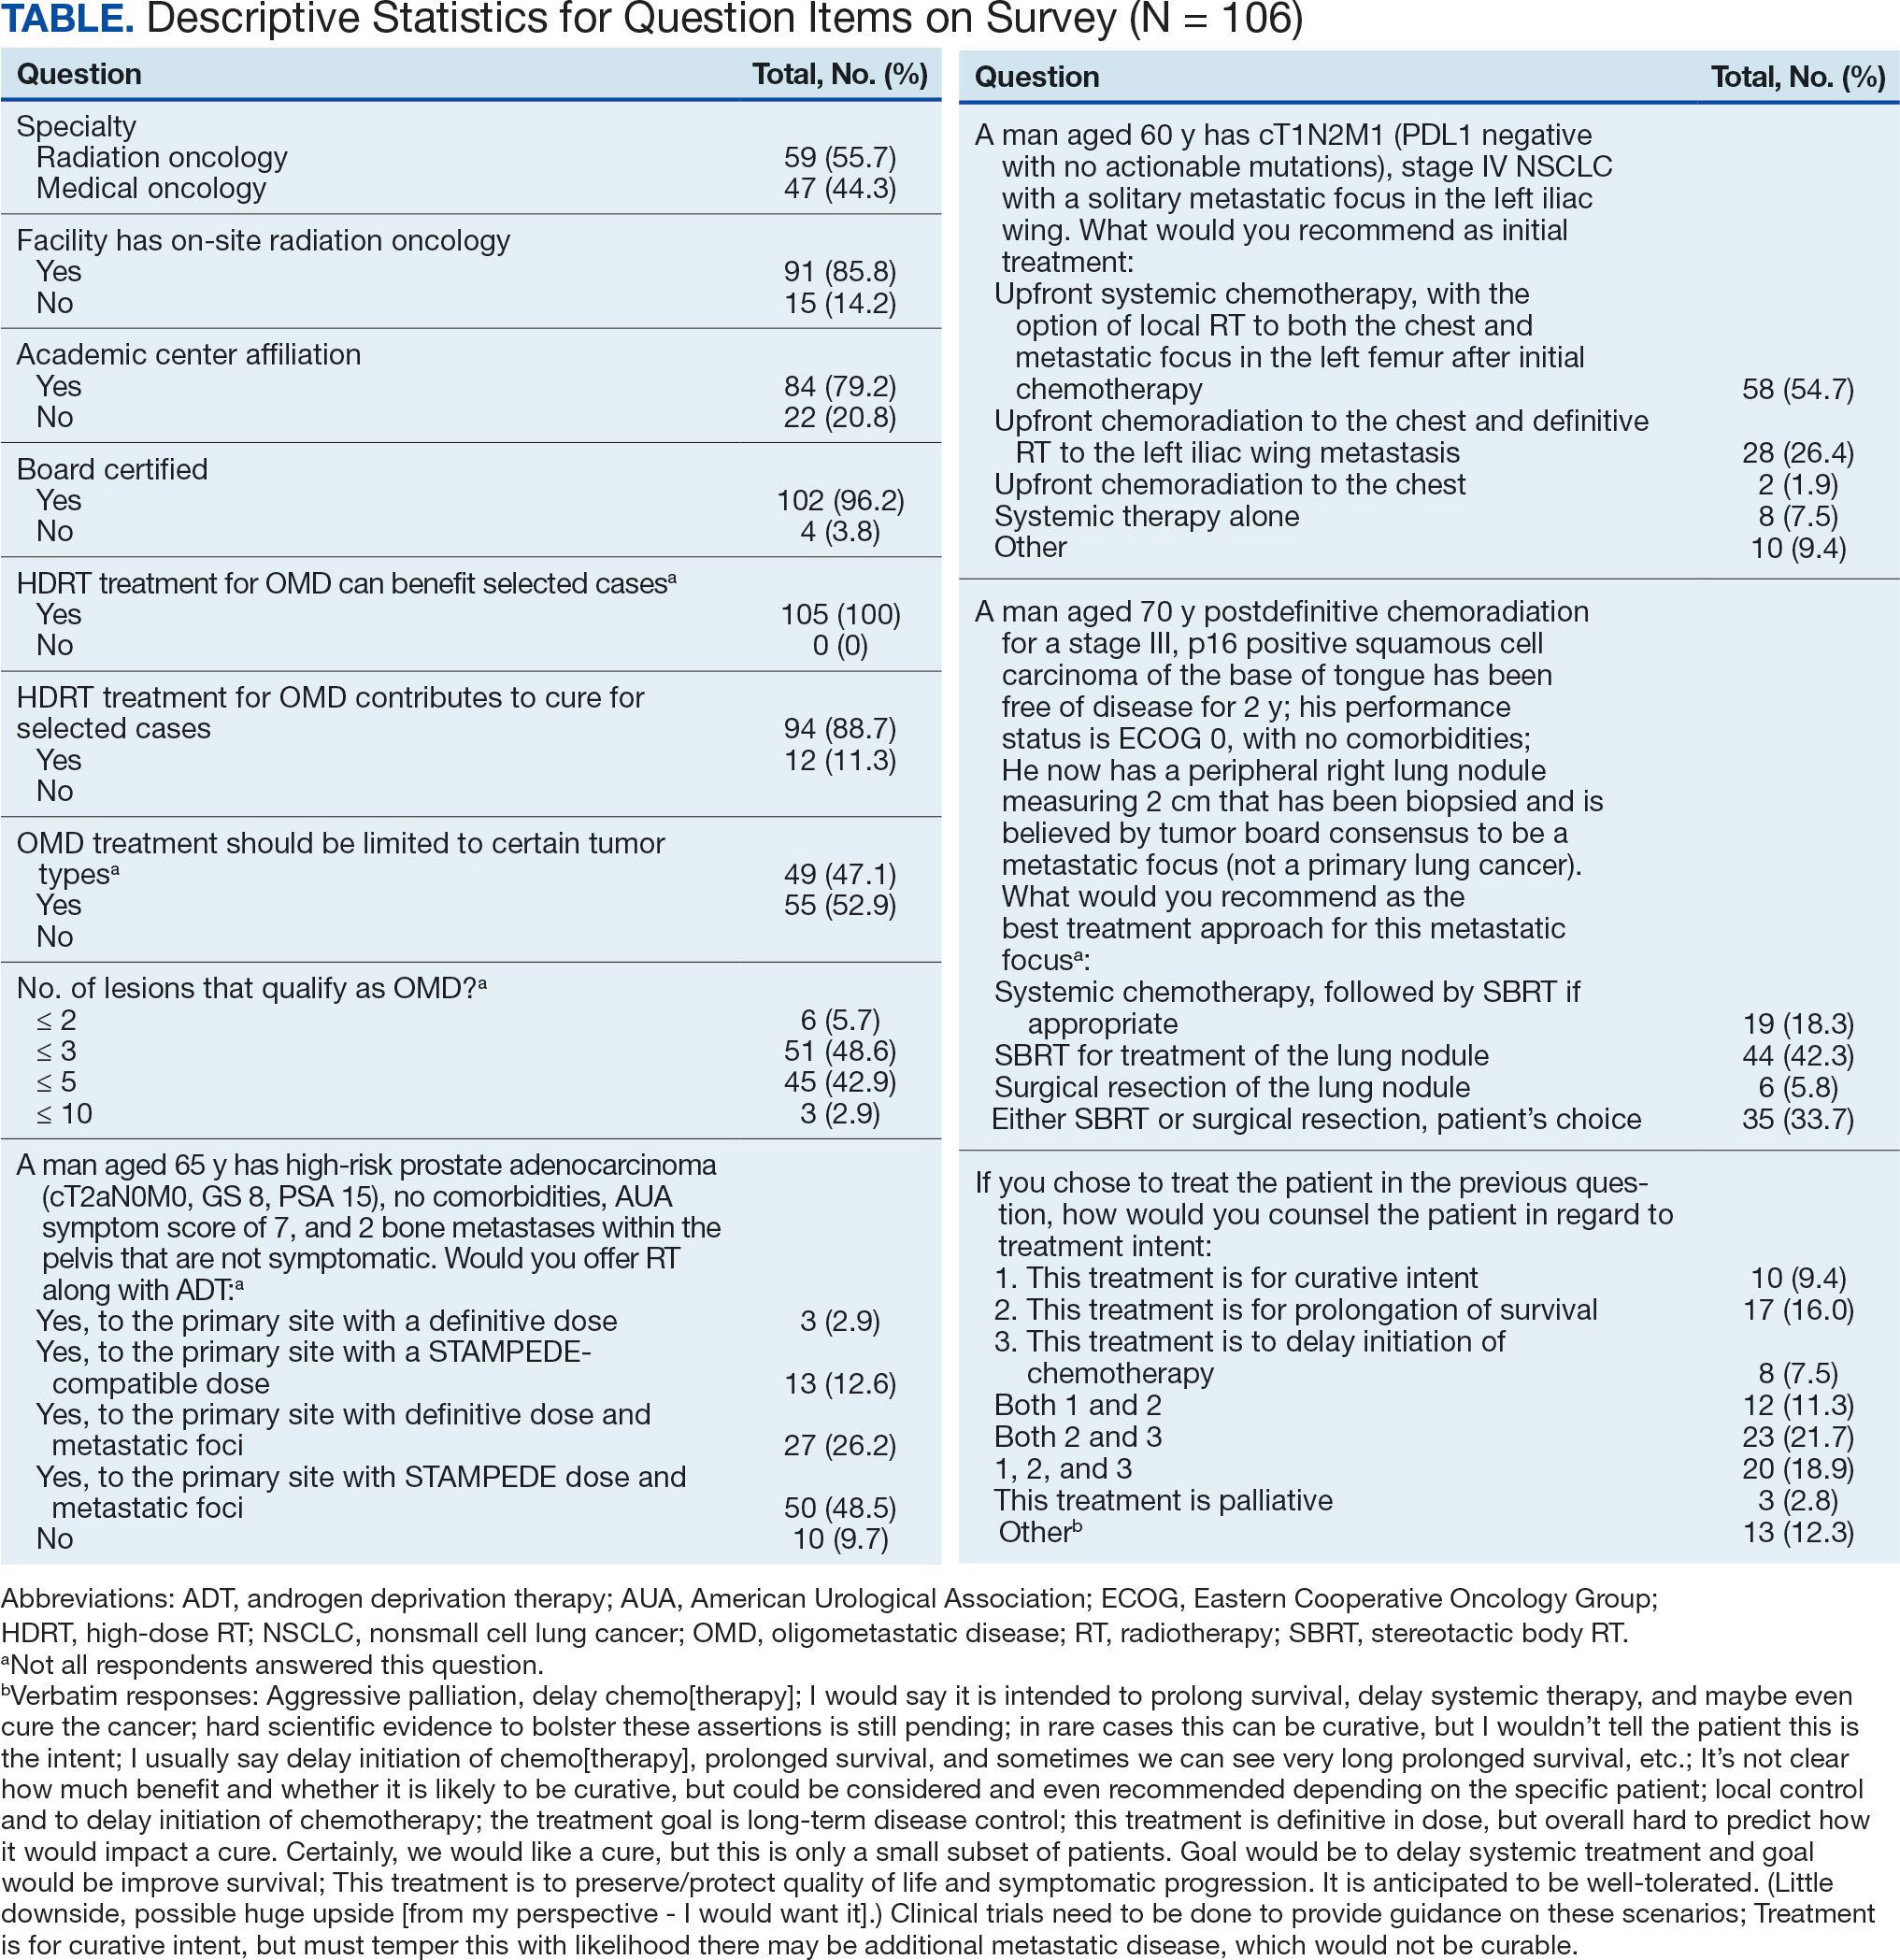
All respondents (n = 105) indicated there is a potential benefit of high-dose RT for appropriately selected cases. Ninety-four oncologists (88.7%) believed that RT for OMD contributes to cure (88.1% of radiation oncologists, 89.4% of medical oncologists; P = .84) for appropriately selected cases. Some respondents who did not believe RT for OMD contributes to cure added comments about other perceived benefits, such as local disease control for palliation, delaying systemic therapy with its associated toxicities, and prolongation of disease-free survival or OS. A higher percentage of respondents with academic affiliations believed high-dose RT contributes to cure, although this difference did not reach statistical significance (Figure 1).

Fifty-five respondents (51.9%; 55.2% radiation oncologists vs 50.0% medical oncologists; P = .60) responded that local RT for OMD treatment should not be limited by primary tumor type. Of respondents who responded that OMD treatment should be limited based on the type of primary tumor, many provided comments that argued there was a benefit for non-small cell lung cancer (NSCLC), prostate adenocarcinoma (PCa), and colorectal cancer.
The definition of how many metastatic lesions qualify as OMD varied. A total of 48.6% of respondents defined OMD as ≤ 3 lesions and 42.9% answered ≤ 5 lesions. A majority of radiation oncologists (55.2%) classified ≤ 5 lesions as OMD, whereas a majority of medical oncologists (66.0%) considered ≤ 3 lesions as OMD (P = .006) (Figure 2).
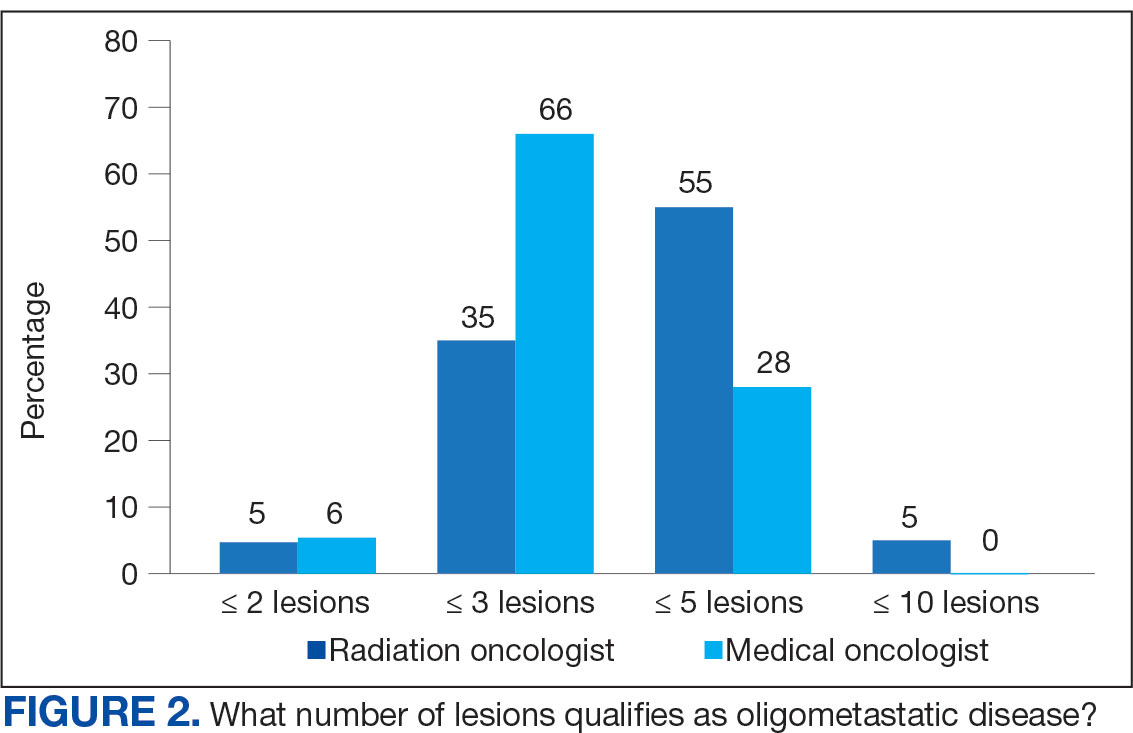
Thirty-six medical oncologists (76.6%) report having an on-site department of radiation oncology (Figure 3). This subgroup was more likely to consider local RT potentially curative compared with their medical oncology peers without on-site radiation oncology (94.4% vs 72.7%; P = .04).
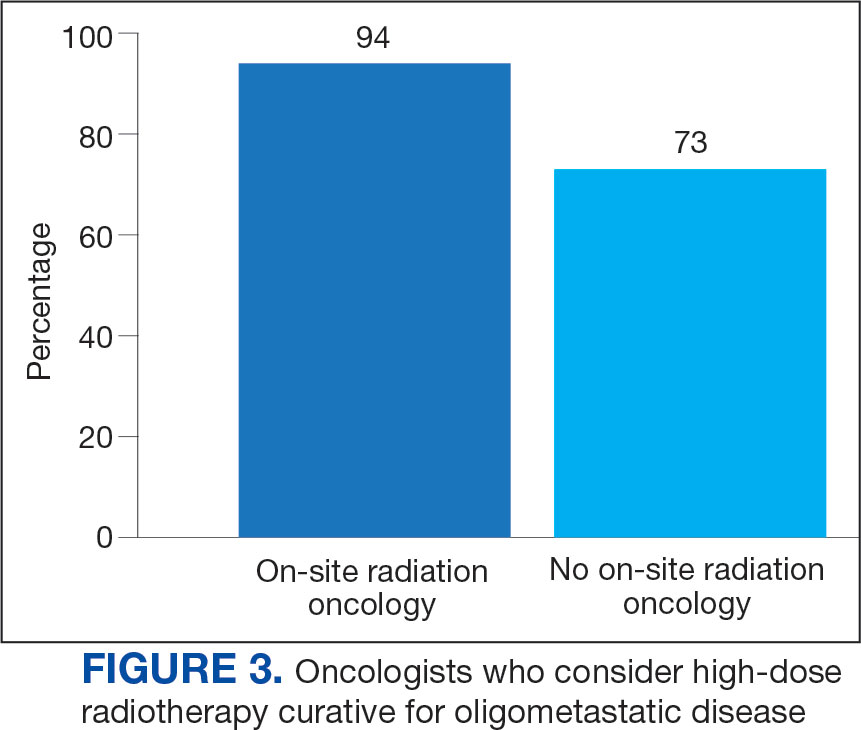
Case Management
The 3 clinical cases demonstrated the heterogeneity of management approaches for OMD. The first described a man aged 65 years with PCa and 2 asymptomatic pelvic bone metastases. Ninety-three respondents (90.3%) recommended RT at the primary site and 74.8% recommended RT to both the primary site and metastatic foci. Sixty-three respondents (67.7%) recommended a STAMPEDE-compatible dose, and 30 (32.3%) recommended a definitive dose.
The second clinical case was a 60-year-old man with a cT1N2M1 NSCLC, with a solitary metastatic focus to the left iliac wing. Fifty-eight respondents (54.7%) recommended upfront systemic chemotherapy and the option of local therapy to the chest and metastatic focus after initial chemotherapy; 28 respondents (26.4%) recommended upfront chemoradiation to the chest and definitive radiation to the left iliac wing metastasis.
The third clinical case described a male aged 70 years with a history of a treated base of tongue squamous cell carcinoma, with a solitary metastatic focus within the right lung. Respondents could pick multiple treatment options and 85 (81.7%) favored upfront definitive local therapy with surgery or stereotactic body radiotherapy (SBRT), rather than upfront chemotherapy, with future consideration for local treatment. About half of respondents (51.8%) recommended SBRT and 41.2% would let the patient decide between surgery or SBRT. Additionally, 39.6% included in their patient counselling that the treatment may be for curative intent.
Discussion
The use of local treatment to increased PFS, OS, or even cure treatment for OMD has become more accepted since the 2018 ASTRO meeting.4,5 Palma et al analyzed a controlled primary malignancy of any histology and ≤ 5 metastatic lesions, with all lesions amenable to SBRT.4 With a median follow-up of 51 months when comparing the standard-of-care (SOC) arm and the SBRT arm, the 5-year PFS was not reached and the 5-year OS rates were 17.7% and 42.3% (P = .006), respectively. In the SBRT arm, about 1 in 5 patients survived > 5 years without a recurrence or disease progression, vs 0 patients in the control arm. There was a 29% rate of grade 2 or higher toxicity in the SBRT arm, including 3 deaths that were likely due to treatment. Subsequent trials, such as the phase 3 SABR-COMET-3 (1-3 metastases), phase 3 SABR-COMET-10 (4-10 metastases), and phase 1 ARREST (> 10 metastases) trials, have been specifically designed to minimize treatment-related toxicities.13-15
Gomez et al analyzed patients at 3 sites with a controlled NSCLC primary tumor and ≤ 3 metastases.5 At a follow-up of 38.8 months, the PFS was 4.4 months in the SOC arm vs 14.2 months in the RT and/or surgery local treatment arm (P = .02). There was also an OS benefit of 17.0 vs 41.2 months (P = .02), respectively.
Several RCTs soon followed that demonstrated improved PFS and OS with local radiotherapy for OMD; however, total metastatic ablation of the foci is necessary to attain these PFS and OS benefits.6-9 Still, an oncologic benefit has yet to be proven. The randomized NRGBR002 study phase 2/3 trial for oligometastatic breast cancer included patients with ≤ 4 extracranial metastases and controlled primary disease to metastasis-directed therapy (SBRT and/ or surgical resection) and systemic therapy vs systemic therapy alone.10 The study did not demonstrate improved PFS or OS at 3 years. However, for most breast cancers, especially with the rapid advancements in systemic therapy that have been achieved, longer follow-up may be necessary to detect a significant difference.
The prospective single-arm phase 2 SABR-5 trial retrospectively demonstrated important lessons about the timing of SBRT and systemic therapy.11 This study included patients with ≤ 5 metastases of any histology, and they received SBRT to all lesions. SABR-5 retrospectively compared patients who received upfront systemic therapy followed by SBRT vs another cohort that first received SBRT and did not receive systemic therapy until there was disease progression. Patients with oligo-progression were excluded, as it demonstrated systemic drug resistance. At a median follow-up time of 34 months, delayed systemic treatment was associated with shorter PFS (23 vs 34 months, respectively; P = .001), but not worse 3-year OS (80% vs 85%, respectively; P = .66). In addition, the delayed systemic treatment arm demonstrated a reduced risk of grade 2 or higher SBRT-related toxicity (odds ratio, 0.35; P < .001).
Similarly, the STOMP phase 2 trial analyzed the role of metastasis-directed therapy (MDT) in delaying initiation of androgen deprivation therapy (ADT) in a randomized phase 2 trial.16 This study included patients with asymptomatic PCa with a biochemical recurrence after primary treatment, 1 to 3 extracranial metastatic lesions, and serum testosterone levels > 50 ng/mL. Sixty-two patients were randomized 1:1 to either MDT (SBRT or surgery) of all lesions or surveillance. The 5-year ADT-free survival was 34% for MDT vs 8% for surveillance (P = .06).
VHA Radiation Oncology
The VHA has 138 departments of medical oncology, but only 41 departments of radiation oncology. Compared with medical oncologists without an on-site radiation oncology department, those with on-site departments were more likely to believe that local RT was potentially curative (94.4% vs 72.7%, respectively; P = .04). This finding suggests that a cancer center that includes both specialties has closer collaboration, which results in greater inclination to embrace local RT for OMD, as it has demonstrated PFS and OS benefits.
The radiation and medical oncologists surveyed had statistically significant differences in response by specialty regarding the maximal number of lesions still believed to constitute OMD. Most radiation oncologists classified ≤ 5 lesions as OMD, whereas most medical oncologists classified ≤ 3 lesions as OMD. This difference is not unexpected. There is no universally agreed-upon definition of OMD, and criteria differ across studies.
While the SABR-COMET trial did include ≤ 5 metastatic lesions, it was a phase 2 RCT, making subgroup analysis difficult. Ongoing phase 3 trials that are more specific in the number of metastases, comparing 1 to 3 vs 4 to 10 metastases (SABR-COMET-3 and SABR-COMET-10, respectively).13,14 There is even an ongoing phase 1 trial (ARREST) studying the potential benefits of treating (“restraining”) > 10 metastases, if dosimetrically feasible.15 Within the VHA, VA STARPORT is investigating MDT for recurrent or de novo hormone-sensitive metastatic PCa.17 The ongoing HALT phase 2/3 trial focuses on patients with actionable mutations to help determine management of oligo-progression in mutation-positive NSCLC.18
There was no significant difference by specialty in who responded that offering local RT for OMD treatment should not be limited by histology (55.2% of radiation oncologists and 50.0% of medical oncologists; P = .60). Oncologists could make the argument that some histologies (eg, pancreatic adenocarcinomas) have such poor prognoses that local RT would not meaningfully affect oncologic outcomes, while potentially adding toxicity, whereas others could point to improved systemic therapy regimens and the low toxicity rates with careful hypofractionation regimens. Of note, the 41-patient phase 2 EXTEND trial for pancreatic ductal adenocarcinoma suggested an oncologic benefit to MDT, with far better PFS and no grade ≥ 3 toxicities related to MDT.19 About half of respondents for each specialty believed the primary histology should affect the decision. Further clarification may emerge from phase 3 trials.
Of note, a 2023 study of 44 radiation and medical oncologists at 2 Harvard Medical School-affiliated hospitals found that for synchronous OMD, 50.0% of medical oncologists and 5.3% (P < .01) of radiation oncologists recommended systemic treatment, suggesting a greater divergence in approach than found in this study.20
Limitations
The response rate of 17.0% raised a potential for selection bias, but this rate is expected for a nonincentivized medical survey. A study by the American Board of Internal Medicine with 11 surveys and 6 weekly email contacts only generated a 23.7% response rate, while another study among physicians demonstrated a 4.5% response rate for email-based contact and 11.8% for mail-based contact.21,22 We could have asked participants questions regarding demographics and geography to ensure the survey represented a diverse sample of the medical community, although additional questions would likely suppress the response rate. Additional data collection about respondents may elucidate the rationale for differences in their responses, especially between the specialties. In a planned subsequent survey in several years, the question on the number of lesions that qualifies as OMD may be amended to reflect the context and dosimetry for the maximal number of metastases constituting OMD; the joint ESTRO-ASTRO consensus defined OMD as 1 to 5 metastatic lesions, but in which all metastatic sites must be safely treatable.12 Also, fewer example cases could be included to simplify the survey and boost response rates. A future survey may ask about the timing of SBRT and systemic therapy, and whether SBRT can safely delay systemic therapy.
Conclusions
Survey results demonstrated significant confidence among both radiation oncologists and medical oncologists that local RT for OMD improves outcomes, which is encouraging and a reflection of the recent evidence-based paradigm shift in viewing metastatic disease as a spectrum. However, there is a difference between radiation oncologists and medical oncologists in how they define OMD, and preferred treatment of the sample cases presented revealed nuanced differences by specialty. Close collaboration with radiation oncologists influences the belief of medical oncologists in the beneficial role of RT for OMD. As more phase 3 data for OMD local treatments emerge, additional investigation is needed on how beliefs and practice patterns evolve among radiation and medical oncologists.
- Barney JD, Churchill EJ. Adenocarcinoma of the kidney with metastasis to the lung. J Urology. 1939.
- Hellman S, Weichselbaum RR. Oligometastases. J Clin Oncol. 1995;13(1):8-10. doi:10.1200/JCO.1995.13.1.8
- Ruers T, Punt C, Van Coevorden F, et al. Radiofrequency ablation combined with systemic treatment versus systemic treatment alone in patients with non-resectable colorectal liver metastases: a randomized EORTC Intergroup phase II study (EORTC 4004). Ann Oncol. 2012;23(10):2619-2626. doi:10.1093/annonc/mds053
- Palma DA, Olson R, Harrow S, et al. Stereotactic ablative radiotherapy for the comprehensive treatment of oligometastatic cancers: long-term results of the SABR-COMET phase II randomized trial. J Clin Oncol. 2020;38(25):2830- 2838. doi:10.1200/JCO.20.00818
- Gomez DR, Tang C, Zhang J, et al. Local consolidative therapy vs. maintenance therapy or observation for patients with oligometastatic non-small-cell lung cancer: long-term results of a multi-institutional, phase II, randomized study. J Clin Oncol. 2019;37(18):1558-1565. doi:10.1200/JCO.19.00201
- Iyengar P, Wardak Z, Gerber DE, et al. Consolidative radiotherapy for limited metastatic non-small-cell lung cancer: a phase 2 randomized clinical trial. JAMA Oncol. 2018;4(1):e173501. doi:10.1001/jamaoncol.2017.3501
- Phillips R, Shi WY, Deek M, et al. Outcomes of observation vs stereotactic ablative radiation for oligometastatic prostate cancer: the ORIOLE phase 2 randomized clinical trial. JAMA Oncol. 2020;6(5):650-659. doi:10.1001/jamaoncol.2020.0147
- Wang XS, Bai YF, Verma V, et al. Randomized trial of first-line tyrosine kinase inhibitor with or without radiotherapy for synchronous oligometastatic EGFR-mutated NSCLC. J Natl Cancer Inst 2023;115(6):742-748. doi:10.1093/jnci/djac015
- Tang C, Sherry AD, Haymaker C, et al. Addition of metastasis- directed therapy to intermittent hormone therapy for oligometastatic prostate cancer (EXTEND): a multicenter, randomized phase II trial. Am Soc Radiat Oncol Annu Meet. 2023;9(6):825-834. doi:10.1001/jamaoncol.2023.0161
- Chmura SJ, Winter KA, Woodward WA, et al. NRG-BR002: a phase IIR/III trial of standard of care systemic therapy with or without stereotactic body radiotherapy (SBRT) and/or surgical resection (SR) for newly oligometastatic breast cancer (NCT02364557). J Clin Oncol. 2022;40:1007. doi:10.1200/JCO.2022.40.16_suppl.1007
- Baker S, Lechner L, Liu M, et al. Upfront versus delayed systemic therapy in patients with oligometastatic cancer treated with SABR in the phase 2 SABR-5 trial. Int J Radiat Oncol Biol Phys. 2024;118(5):1497-1506. doi:10.1016/j.ijrobp.2023.11.007
- Lievens Y, Guckenberger M, Gomez D, et al. Defining oligometastatic disease from a radiation oncology perspective: an ESTRO-ASTRO consensus document. Radiother Oncol. 2020;148:157-166. doi:10.1016/j.radonc.2020.04.003
- Olson R, Mathews L, Liu M, et al. Stereotactic ablative radiotherapy for the comprehensive treatment of 1-3 oligometastatic tumors (SABR-COMET-3): study protocol for a randomized phase III trial. BMC Cancer. 2020;20(1):380. doi:10.1186/s12885-020-06876-4
- Palma DA, Olson R, Harrow S, et al. Stereotactic ablative radiotherapy for the comprehensive treatment of 4-10 oligometastatic tumors (SABR-COMET-10): study protocol for a randomized phase III trial. BMC Cancer. 2019;19(1):816. doi:10.1186/s12885-019-5977-6
- Bauman GS, Corkum MT, Fakir H, et al. Ablative radiation therapy to restrain everything safely treatable (ARREST): study protocol for a phase I trial treating polymetastatic cancer with stereotactic radiotherapy. BMC Cancer. 2021;21(1):405. doi:10.1186/s12885-021-08136-5
- Ost P, Reynders D, Decaestecker K, et al. Surveillance or metastasis-directed therapy for oligometastatic prostate cancer recurrence (STOMP): five-year results of a randomized phase II trial. J Clin Oncol. 2020;38:suppl.
- Solanki AA, Campbell D, Carlson K, et al. Veterans Affairs seamless phase II/III randomized trial of standard systemic therapy with or without PET-directed local therapy for oligometastatic prostate cancer (VA STARPORT). J Clin Oncol. 2024;42:16.
- McDonald F, Guckenberger M, Popat S. EP08.03-005 HALT – Targeted therapy with or without dose-intensified radiotherapy in oligo-progressive disease in oncogene addicted lung tumours. J Thor Oncol. 2022;17:S492.
- Ludmir EB, Sherry AD, Fellman BM, et al. Addition of metastasis- directed therapy to systemic therapy for oligometastatic pancreatic ductal adenocarcinoma (EXTEND): a multicenter, randomized phase II trial. J Clin Oncol. 2024;42(32):3795-3805. doi:10.1200/JCO.24.00081
- Cho HL, Balboni T, Christ SB, et al. Is oligometastatic cancer curable? A survey of oncologist perspectives, decision making, and communication. Adv Radiat Oncol. 2023;8(5):101221. doi:10.1016/j.adro.2023.101221
- Barnhart BJ, Reddy SG, Arnold GK. Remind me again: physician response to web surveys: the effect of email reminders across 11 opinion survey efforts at the American Board of Internal Medicine from 2017 to 2019. Eval Health Prof. 2021;44(3):245-259. doi:10.1177/01632787211019445
- Murphy CC, Lee SJC, Geiger AM, et al. A randomized trial of mail and email recruitment strategies for a physician survey on clinical trial accrual. BMC Med Res Methodol. 2020;20(1):123. doi:10.1186/s12874-020-01014-x
The treatment of metastatic solid tumors has been based historically on systemic therapies, with the goal of delaying progression and extend life as long as possible, with tolerable treatment-related adverse events. Some exceptions were made for local treatment with surgery or radiotherapy (RT), often for patients with a single metastasis. A 1939 report describes a patient with renal adenocarcinoma and a solitary lung metastasis who underwent RT to the lung lesion after nephrectomy and subsequently partial lobectomy after the metastatic lesion progressed. The authors argued that if a metastasis appears solitary and accessible, it is plausible to remove it in addition to the primary growth.1
In 1995 Hellman and Weichselbaum proposed oligometastatic disease (OMD). They reasoned that malignancy exists along a spectrum from localized disease to widely disseminated disease, with OMD existing in between with a still-restricted tumor metastatic capacity. Appropriately selected patients with OMD may be candidates for prolonged disease-free survival or cure with the addition of local therapy to systemic therapy.2
The EORTC 4004 phase 2 randomized control trial (RCT) analyzed radiofrequency ablation (RFA) for colorectal liver metastases with systemic therapy vs systemic therapy alone for patients with ≤ 9 liver lesions.3 Systemic therapyconsisted of 5-FU/leucovorin/oxaliplatin, with bevacizumab added to the regimen 3.5 years into the study, per updated standard- of-care. This trial was the first to demonstrate the benefit of aggressive local treatment vs system treatment alone for OMD with a progression-free survival (PFS) benefit (16.8 vs 9.9 months; hazard ratio [HR], 0.63; P = .03) and overall survival (OS) benefit (45.3 vs 40.5 months; HR, 0.74; P = .02) with the addition of local treatment with RFA.
Since the presentations of the SABR-COMET phase 2 RCT and another study by Gomez et al at the American Society for Radiation Oncology (ASTRO) 2018 annual meeting, the paradigm for offering local RT for OMD has rapidly evolved. Both studies found PFS and OS benefits of RT for patients with OMD.4,5 Additional RCTs have since demonstrated that for properly selected patients with OMD, aggressive local RT improved PFS and OS.6-9 These small studies have led to larger RCTs to better understand who benefits from local consolidative treatment, particularly RT.10,11
There is a large degree of heterogeneity in how oncologists define and approach OMD treatment. The 2020 European Society for Radiotherapy and Oncology (ESTRO) and ASTRO consensus guidelines defined the OMD state as 1 to 5 metastatic lesions for which all metastatic sites are safely treatable.12 The purpose of this study was to evaluate perceptions and practice patterns among radiation oncologists and medical oncologists regarding the use of local RT for OMD across the Veterans Health Administration (VHA).
Methods
A 12-question survey was developed by the VHA Palliative Radiotherapy Task Force using the ESTRO-ASTRO consensus guidelines to define OMD. The survey was emailed to the VHA radiation oncology and medical oncology listservs on August 1, 2023. These listservs consist of physicians in these specialties either directly employed by the VHA or serve in its facilities as contractors. The original response closure date was August 11, 2023, but it was extended to August 18, 2023, to increase responses. No incentives were offered to respondents. Two email reminders were sent to the medical oncology listserv and 3 to the radiation oncology listserv. Descriptive statistics and X2 tests were used for data analysis. The impact of specialty and presence of an on-site department of radiation oncology were reviewed. This project was approved by the VHA National Oncology Program and National Radiation Oncology Program.
Results
The survey was sent to 125 radiation oncologists and 515 medical oncologists and 106 were completed for a 16.6% response rate. There were 59 (55.7%) radiation oncologist responses and 47 (44.3%) medical oncologist responses. Most (96.2%) respondents were board-certified, and 84 (79.2%) were affiliated with an academic center. Not every respondent answered every question (Table).
All respondents (n = 105) indicated there is a potential benefit of high-dose RT for appropriately selected cases. Ninety-four oncologists (88.7%) believed that RT for OMD contributes to cure (88.1% of radiation oncologists, 89.4% of medical oncologists; P = .84) for appropriately selected cases. Some respondents who did not believe RT for OMD contributes to cure added comments about other perceived benefits, such as local disease control for palliation, delaying systemic therapy with its associated toxicities, and prolongation of disease-free survival or OS. A higher percentage of respondents with academic affiliations believed high-dose RT contributes to cure, although this difference did not reach statistical significance (Figure 1).
Fifty-five respondents (51.9%; 55.2% radiation oncologists vs 50.0% medical oncologists; P = .60) responded that local RT for OMD treatment should not be limited by primary tumor type. Of respondents who responded that OMD treatment should be limited based on the type of primary tumor, many provided comments that argued there was a benefit for non-small cell lung cancer (NSCLC), prostate adenocarcinoma (PCa), and colorectal cancer.
The definition of how many metastatic lesions qualify as OMD varied. A total of 48.6% of respondents defined OMD as ≤ 3 lesions and 42.9% answered ≤ 5 lesions. A majority of radiation oncologists (55.2%) classified ≤ 5 lesions as OMD, whereas a majority of medical oncologists (66.0%) considered ≤ 3 lesions as OMD (P = .006) (Figure 2).
Thirty-six medical oncologists (76.6%) report having an on-site department of radiation oncology (Figure 3). This subgroup was more likely to consider local RT potentially curative compared with their medical oncology peers without on-site radiation oncology (94.4% vs 72.7%; P = .04).
Case Management
The 3 clinical cases demonstrated the heterogeneity of management approaches for OMD. The first described a man aged 65 years with PCa and 2 asymptomatic pelvic bone metastases. Ninety-three respondents (90.3%) recommended RT at the primary site and 74.8% recommended RT to both the primary site and metastatic foci. Sixty-three respondents (67.7%) recommended a STAMPEDE-compatible dose, and 30 (32.3%) recommended a definitive dose.
The second clinical case was a 60-year-old man with a cT1N2M1 NSCLC, with a solitary metastatic focus to the left iliac wing. Fifty-eight respondents (54.7%) recommended upfront systemic chemotherapy and the option of local therapy to the chest and metastatic focus after initial chemotherapy; 28 respondents (26.4%) recommended upfront chemoradiation to the chest and definitive radiation to the left iliac wing metastasis.
The third clinical case described a male aged 70 years with a history of a treated base of tongue squamous cell carcinoma, with a solitary metastatic focus within the right lung. Respondents could pick multiple treatment options and 85 (81.7%) favored upfront definitive local therapy with surgery or stereotactic body radiotherapy (SBRT), rather than upfront chemotherapy, with future consideration for local treatment. About half of respondents (51.8%) recommended SBRT and 41.2% would let the patient decide between surgery or SBRT. Additionally, 39.6% included in their patient counselling that the treatment may be for curative intent.
Discussion
The use of local treatment to increased PFS, OS, or even cure treatment for OMD has become more accepted since the 2018 ASTRO meeting.4,5 Palma et al analyzed a controlled primary malignancy of any histology and ≤ 5 metastatic lesions, with all lesions amenable to SBRT.4 With a median follow-up of 51 months when comparing the standard-of-care (SOC) arm and the SBRT arm, the 5-year PFS was not reached and the 5-year OS rates were 17.7% and 42.3% (P = .006), respectively. In the SBRT arm, about 1 in 5 patients survived > 5 years without a recurrence or disease progression, vs 0 patients in the control arm. There was a 29% rate of grade 2 or higher toxicity in the SBRT arm, including 3 deaths that were likely due to treatment. Subsequent trials, such as the phase 3 SABR-COMET-3 (1-3 metastases), phase 3 SABR-COMET-10 (4-10 metastases), and phase 1 ARREST (> 10 metastases) trials, have been specifically designed to minimize treatment-related toxicities.13-15
Gomez et al analyzed patients at 3 sites with a controlled NSCLC primary tumor and ≤ 3 metastases.5 At a follow-up of 38.8 months, the PFS was 4.4 months in the SOC arm vs 14.2 months in the RT and/or surgery local treatment arm (P = .02). There was also an OS benefit of 17.0 vs 41.2 months (P = .02), respectively.
Several RCTs soon followed that demonstrated improved PFS and OS with local radiotherapy for OMD; however, total metastatic ablation of the foci is necessary to attain these PFS and OS benefits.6-9 Still, an oncologic benefit has yet to be proven. The randomized NRGBR002 study phase 2/3 trial for oligometastatic breast cancer included patients with ≤ 4 extracranial metastases and controlled primary disease to metastasis-directed therapy (SBRT and/ or surgical resection) and systemic therapy vs systemic therapy alone.10 The study did not demonstrate improved PFS or OS at 3 years. However, for most breast cancers, especially with the rapid advancements in systemic therapy that have been achieved, longer follow-up may be necessary to detect a significant difference.
The prospective single-arm phase 2 SABR-5 trial retrospectively demonstrated important lessons about the timing of SBRT and systemic therapy.11 This study included patients with ≤ 5 metastases of any histology, and they received SBRT to all lesions. SABR-5 retrospectively compared patients who received upfront systemic therapy followed by SBRT vs another cohort that first received SBRT and did not receive systemic therapy until there was disease progression. Patients with oligo-progression were excluded, as it demonstrated systemic drug resistance. At a median follow-up time of 34 months, delayed systemic treatment was associated with shorter PFS (23 vs 34 months, respectively; P = .001), but not worse 3-year OS (80% vs 85%, respectively; P = .66). In addition, the delayed systemic treatment arm demonstrated a reduced risk of grade 2 or higher SBRT-related toxicity (odds ratio, 0.35; P < .001).
Similarly, the STOMP phase 2 trial analyzed the role of metastasis-directed therapy (MDT) in delaying initiation of androgen deprivation therapy (ADT) in a randomized phase 2 trial.16 This study included patients with asymptomatic PCa with a biochemical recurrence after primary treatment, 1 to 3 extracranial metastatic lesions, and serum testosterone levels > 50 ng/mL. Sixty-two patients were randomized 1:1 to either MDT (SBRT or surgery) of all lesions or surveillance. The 5-year ADT-free survival was 34% for MDT vs 8% for surveillance (P = .06).
VHA Radiation Oncology
The VHA has 138 departments of medical oncology, but only 41 departments of radiation oncology. Compared with medical oncologists without an on-site radiation oncology department, those with on-site departments were more likely to believe that local RT was potentially curative (94.4% vs 72.7%, respectively; P = .04). This finding suggests that a cancer center that includes both specialties has closer collaboration, which results in greater inclination to embrace local RT for OMD, as it has demonstrated PFS and OS benefits.
The radiation and medical oncologists surveyed had statistically significant differences in response by specialty regarding the maximal number of lesions still believed to constitute OMD. Most radiation oncologists classified ≤ 5 lesions as OMD, whereas most medical oncologists classified ≤ 3 lesions as OMD. This difference is not unexpected. There is no universally agreed-upon definition of OMD, and criteria differ across studies.
While the SABR-COMET trial did include ≤ 5 metastatic lesions, it was a phase 2 RCT, making subgroup analysis difficult. Ongoing phase 3 trials that are more specific in the number of metastases, comparing 1 to 3 vs 4 to 10 metastases (SABR-COMET-3 and SABR-COMET-10, respectively).13,14 There is even an ongoing phase 1 trial (ARREST) studying the potential benefits of treating (“restraining”) > 10 metastases, if dosimetrically feasible.15 Within the VHA, VA STARPORT is investigating MDT for recurrent or de novo hormone-sensitive metastatic PCa.17 The ongoing HALT phase 2/3 trial focuses on patients with actionable mutations to help determine management of oligo-progression in mutation-positive NSCLC.18
There was no significant difference by specialty in who responded that offering local RT for OMD treatment should not be limited by histology (55.2% of radiation oncologists and 50.0% of medical oncologists; P = .60). Oncologists could make the argument that some histologies (eg, pancreatic adenocarcinomas) have such poor prognoses that local RT would not meaningfully affect oncologic outcomes, while potentially adding toxicity, whereas others could point to improved systemic therapy regimens and the low toxicity rates with careful hypofractionation regimens. Of note, the 41-patient phase 2 EXTEND trial for pancreatic ductal adenocarcinoma suggested an oncologic benefit to MDT, with far better PFS and no grade ≥ 3 toxicities related to MDT.19 About half of respondents for each specialty believed the primary histology should affect the decision. Further clarification may emerge from phase 3 trials.
Of note, a 2023 study of 44 radiation and medical oncologists at 2 Harvard Medical School-affiliated hospitals found that for synchronous OMD, 50.0% of medical oncologists and 5.3% (P < .01) of radiation oncologists recommended systemic treatment, suggesting a greater divergence in approach than found in this study.20
Limitations
The response rate of 17.0% raised a potential for selection bias, but this rate is expected for a nonincentivized medical survey. A study by the American Board of Internal Medicine with 11 surveys and 6 weekly email contacts only generated a 23.7% response rate, while another study among physicians demonstrated a 4.5% response rate for email-based contact and 11.8% for mail-based contact.21,22 We could have asked participants questions regarding demographics and geography to ensure the survey represented a diverse sample of the medical community, although additional questions would likely suppress the response rate. Additional data collection about respondents may elucidate the rationale for differences in their responses, especially between the specialties. In a planned subsequent survey in several years, the question on the number of lesions that qualifies as OMD may be amended to reflect the context and dosimetry for the maximal number of metastases constituting OMD; the joint ESTRO-ASTRO consensus defined OMD as 1 to 5 metastatic lesions, but in which all metastatic sites must be safely treatable.12 Also, fewer example cases could be included to simplify the survey and boost response rates. A future survey may ask about the timing of SBRT and systemic therapy, and whether SBRT can safely delay systemic therapy.
Conclusions
Survey results demonstrated significant confidence among both radiation oncologists and medical oncologists that local RT for OMD improves outcomes, which is encouraging and a reflection of the recent evidence-based paradigm shift in viewing metastatic disease as a spectrum. However, there is a difference between radiation oncologists and medical oncologists in how they define OMD, and preferred treatment of the sample cases presented revealed nuanced differences by specialty. Close collaboration with radiation oncologists influences the belief of medical oncologists in the beneficial role of RT for OMD. As more phase 3 data for OMD local treatments emerge, additional investigation is needed on how beliefs and practice patterns evolve among radiation and medical oncologists.
- Barney JD, Churchill EJ. Adenocarcinoma of the kidney with metastasis to the lung. J Urology. 1939.
- Hellman S, Weichselbaum RR. Oligometastases. J Clin Oncol. 1995;13(1):8-10. doi:10.1200/JCO.1995.13.1.8
- Ruers T, Punt C, Van Coevorden F, et al. Radiofrequency ablation combined with systemic treatment versus systemic treatment alone in patients with non-resectable colorectal liver metastases: a randomized EORTC Intergroup phase II study (EORTC 4004). Ann Oncol. 2012;23(10):2619-2626. doi:10.1093/annonc/mds053
- Palma DA, Olson R, Harrow S, et al. Stereotactic ablative radiotherapy for the comprehensive treatment of oligometastatic cancers: long-term results of the SABR-COMET phase II randomized trial. J Clin Oncol. 2020;38(25):2830- 2838. doi:10.1200/JCO.20.00818
- Gomez DR, Tang C, Zhang J, et al. Local consolidative therapy vs. maintenance therapy or observation for patients with oligometastatic non-small-cell lung cancer: long-term results of a multi-institutional, phase II, randomized study. J Clin Oncol. 2019;37(18):1558-1565. doi:10.1200/JCO.19.00201
- Iyengar P, Wardak Z, Gerber DE, et al. Consolidative radiotherapy for limited metastatic non-small-cell lung cancer: a phase 2 randomized clinical trial. JAMA Oncol. 2018;4(1):e173501. doi:10.1001/jamaoncol.2017.3501
- Phillips R, Shi WY, Deek M, et al. Outcomes of observation vs stereotactic ablative radiation for oligometastatic prostate cancer: the ORIOLE phase 2 randomized clinical trial. JAMA Oncol. 2020;6(5):650-659. doi:10.1001/jamaoncol.2020.0147
- Wang XS, Bai YF, Verma V, et al. Randomized trial of first-line tyrosine kinase inhibitor with or without radiotherapy for synchronous oligometastatic EGFR-mutated NSCLC. J Natl Cancer Inst 2023;115(6):742-748. doi:10.1093/jnci/djac015
- Tang C, Sherry AD, Haymaker C, et al. Addition of metastasis- directed therapy to intermittent hormone therapy for oligometastatic prostate cancer (EXTEND): a multicenter, randomized phase II trial. Am Soc Radiat Oncol Annu Meet. 2023;9(6):825-834. doi:10.1001/jamaoncol.2023.0161
- Chmura SJ, Winter KA, Woodward WA, et al. NRG-BR002: a phase IIR/III trial of standard of care systemic therapy with or without stereotactic body radiotherapy (SBRT) and/or surgical resection (SR) for newly oligometastatic breast cancer (NCT02364557). J Clin Oncol. 2022;40:1007. doi:10.1200/JCO.2022.40.16_suppl.1007
- Baker S, Lechner L, Liu M, et al. Upfront versus delayed systemic therapy in patients with oligometastatic cancer treated with SABR in the phase 2 SABR-5 trial. Int J Radiat Oncol Biol Phys. 2024;118(5):1497-1506. doi:10.1016/j.ijrobp.2023.11.007
- Lievens Y, Guckenberger M, Gomez D, et al. Defining oligometastatic disease from a radiation oncology perspective: an ESTRO-ASTRO consensus document. Radiother Oncol. 2020;148:157-166. doi:10.1016/j.radonc.2020.04.003
- Olson R, Mathews L, Liu M, et al. Stereotactic ablative radiotherapy for the comprehensive treatment of 1-3 oligometastatic tumors (SABR-COMET-3): study protocol for a randomized phase III trial. BMC Cancer. 2020;20(1):380. doi:10.1186/s12885-020-06876-4
- Palma DA, Olson R, Harrow S, et al. Stereotactic ablative radiotherapy for the comprehensive treatment of 4-10 oligometastatic tumors (SABR-COMET-10): study protocol for a randomized phase III trial. BMC Cancer. 2019;19(1):816. doi:10.1186/s12885-019-5977-6
- Bauman GS, Corkum MT, Fakir H, et al. Ablative radiation therapy to restrain everything safely treatable (ARREST): study protocol for a phase I trial treating polymetastatic cancer with stereotactic radiotherapy. BMC Cancer. 2021;21(1):405. doi:10.1186/s12885-021-08136-5
- Ost P, Reynders D, Decaestecker K, et al. Surveillance or metastasis-directed therapy for oligometastatic prostate cancer recurrence (STOMP): five-year results of a randomized phase II trial. J Clin Oncol. 2020;38:suppl.
- Solanki AA, Campbell D, Carlson K, et al. Veterans Affairs seamless phase II/III randomized trial of standard systemic therapy with or without PET-directed local therapy for oligometastatic prostate cancer (VA STARPORT). J Clin Oncol. 2024;42:16.
- McDonald F, Guckenberger M, Popat S. EP08.03-005 HALT – Targeted therapy with or without dose-intensified radiotherapy in oligo-progressive disease in oncogene addicted lung tumours. J Thor Oncol. 2022;17:S492.
- Ludmir EB, Sherry AD, Fellman BM, et al. Addition of metastasis- directed therapy to systemic therapy for oligometastatic pancreatic ductal adenocarcinoma (EXTEND): a multicenter, randomized phase II trial. J Clin Oncol. 2024;42(32):3795-3805. doi:10.1200/JCO.24.00081
- Cho HL, Balboni T, Christ SB, et al. Is oligometastatic cancer curable? A survey of oncologist perspectives, decision making, and communication. Adv Radiat Oncol. 2023;8(5):101221. doi:10.1016/j.adro.2023.101221
- Barnhart BJ, Reddy SG, Arnold GK. Remind me again: physician response to web surveys: the effect of email reminders across 11 opinion survey efforts at the American Board of Internal Medicine from 2017 to 2019. Eval Health Prof. 2021;44(3):245-259. doi:10.1177/01632787211019445
- Murphy CC, Lee SJC, Geiger AM, et al. A randomized trial of mail and email recruitment strategies for a physician survey on clinical trial accrual. BMC Med Res Methodol. 2020;20(1):123. doi:10.1186/s12874-020-01014-x
Radiation and Medical Oncology Perspectives on Oligometastatic Disease Treatment
Radiation and Medical Oncology Perspectives on Oligometastatic Disease Treatment