User login
Patient-Driven Management Using Same-Day Noninvasive Diagnosis and Complete Laser Treatment of Basal Cell Carcinomas: A Pilot Study
The increasing incidence of nonmelanoma skin cancer (NMSC) is a serious public health concern.1 Lesions often are identified on routine total-body examination, and there is a considerate burden on dermatologists to diagnose these lesions, which is both costly and results in a long wait time to see a specialist. Furthermore, standard care requires patients to attend multiple visits for the diagnosis and treatment of NMSC.
In recent decades, diagnosing basal cell carcinoma (BCC) has been facilitated by the handheld dermatoscope. The advent of dermoscopy has led to increased sensitivity and specificity of the NMSC diagnosis (estimated at 95%–99%) and has helped facilitate earlier diagnosis of BCC and reduce unnecessary biopsy of benign lesions.2-5 Dermoscopy also can be useful in monitoring response to treatment.5 Lesions that are detected early tend to be easier and less expensive to treat, a strong argument for the use of early detection techniques.6-8
More recently, in vivo reflectance confocal microscopy (RCM)(Vivascope 1500 [Caliber I.D.]) has become an acceptable means for confirming a BCC diagnosis, offering an alternative to tissue biopsy. Reflectance confocal microscopy can be reimbursed under Category I Current Procedural Terminology codes 96931 to 96936.9 Reflectance confocal microscopy is a noninvasive diagnostic technique that uses an 830-nm diode laser to enable visualization of a 0.5×0.5-mm patch of skin to a depth of 200 to 300 μm, which corresponds roughly to the papillary dermis. Reflectance confocal microscopy has the advantage of providing real-time diagnosis, enabling same-day treatment of BCC, and providing an efficient alternative to biopsy. Ultimately, these advantages are beneficial and time-saving for patients because biopsies can be painful; create a delay in diagnosis; and require further follow-up visits for treatment, which may be of importance to patients who have trouble attending multiple appointments.
Optical coherence tomography (OCT) is another noninvasive imaging device that is useful in BCC management. It uses an infrared broadband light source to visualize skin architecture to 2-mm deep with a 6×6-mm field of view.10 Although OCT does not offer the same cellular clarity as RCM, it allows visualization of a greater depth of skin and a wider field of view, making it a useful tool both in marginating NMSCs prior to treatment and monitoring response to treatment over time.11-16 Optical coherence tomography has demonstrated a high negative predictive value (92.1%) for BCC, which makes it useful for ruling out residual tumor in lesions undergoing management.17-19
With all available options, BCC management benefits from care that is tailored to the individual and the lesion, taking into account size and subtype because not every available treatment is appropriate. Lasers, including solid state, diode, dye, and gas types, are emerging as promising minimally invasive treatment modalities.20,21
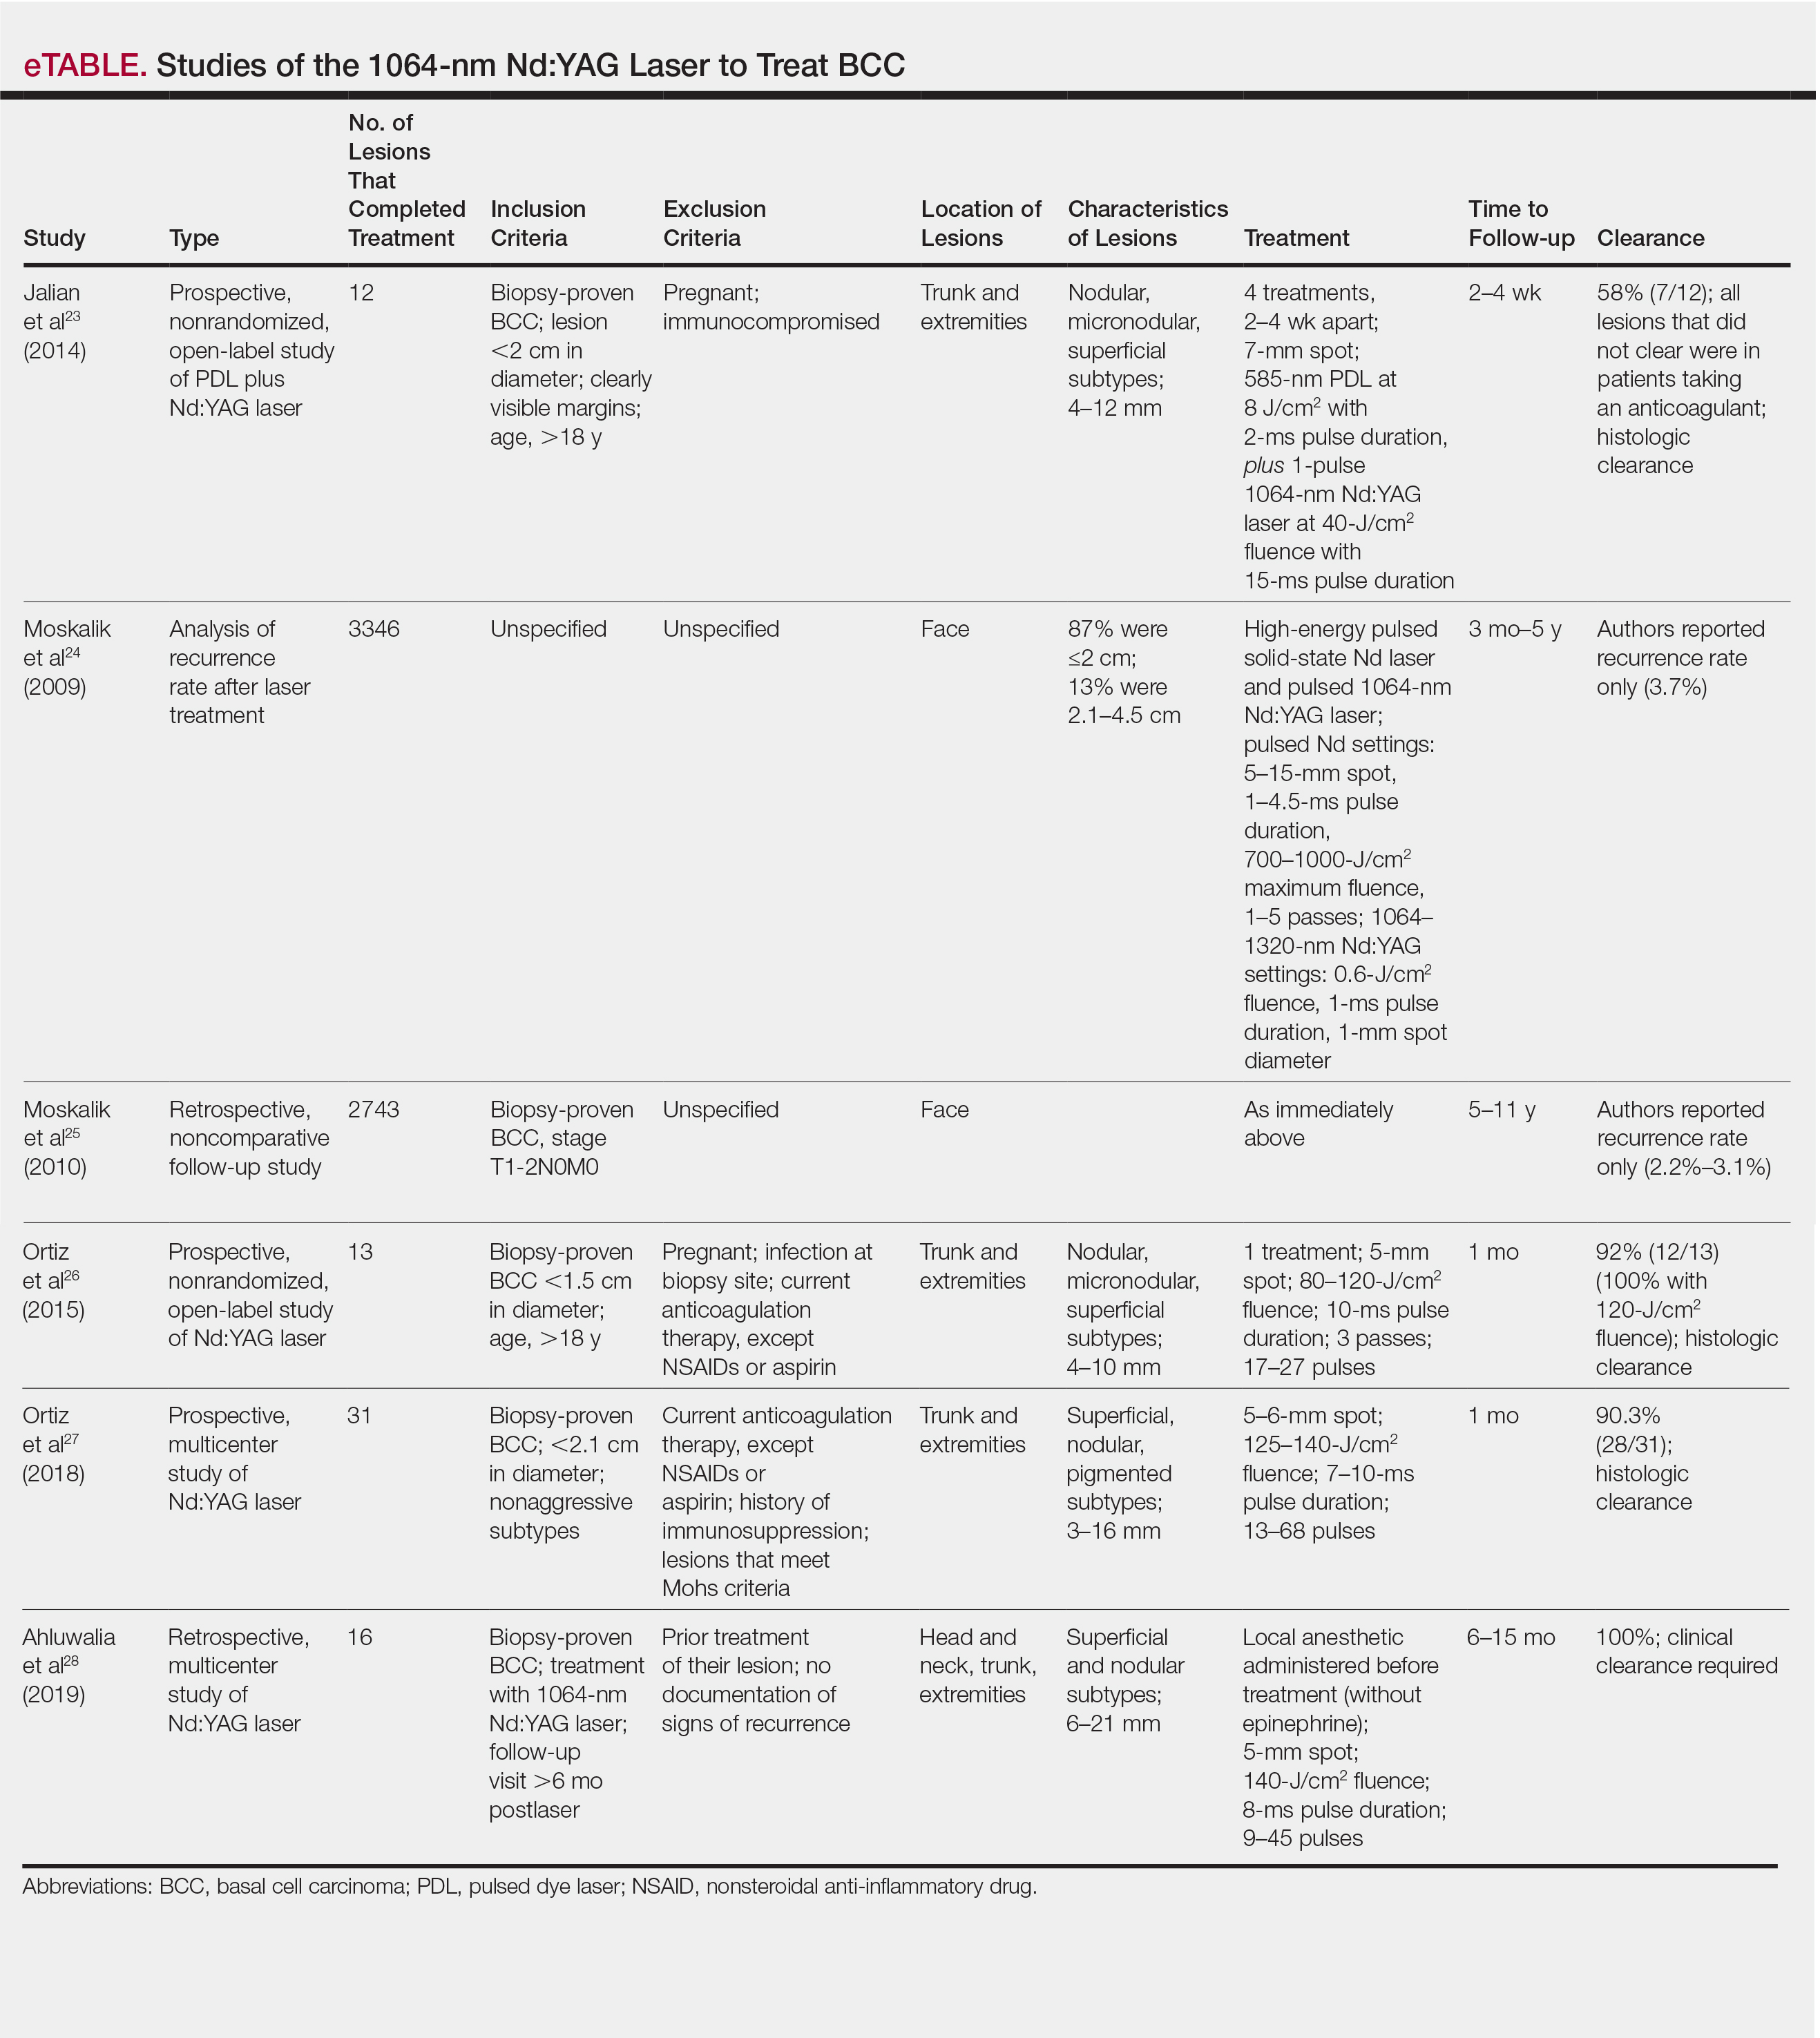
Nonablative laser therapy with a pulsed dye laser (PDL) and fractional laser is an example; the principal investigator (PI) of this study (O.M.) recently reported a 95.70% clearance rate utilizing a PDL and fractional laser protocol.22 The 1064-nm Nd:YAG laser also has been used with PDL and as a stand-alone treatment. Jalian et al23 used PDL and the Nd:YAG laser on 13 BCC lesions, with a 58% (7/12) clearance rate after 4 treatments; all nonresponders were taking an anticoagulant, which inhibited the laser’s mechanism of action, according to the researchers.
Moskalik et al24 published a report of 3346 facial BCC lesions treated with pulsed Nd and pulsed Nd:YAG lasers, and included follow-up for as long as 5 years, with a 3.7% recurrence rate. Another report by Moskalik et al25 recorded a recurrence rate of 2.2% to 3.1% for BCCs that were followed for at least 5 years.
Ortiz et al26 reported use of the long-pulsed 1064-nm Nd:YAG laser to treat 13 lesions with biopsy-confirmed BCC on the trunk and extremities, with a 92% (12/13) clearance rate based on histologic analysis 1 month after laser treatment. In an expanded study of 31 patients by Ortiz et al,27 the histologic clearance rate was 90.3% (28/31)—also obtained after 1 month—after 1 Nd:YAG laser treatment, also treating lesions on the trunk and extremities. A further retrospective review of Nd:YAG laser treatment of BCC revealed a 100% clearance rate for 16 lesions (including lesions on the face) that were monitored for at least 6 months (mean duration, 9 months; range, 6–15 months).28 Optical coherence tomography imaging was used for one of the review’s lesions before and after treatment and suggested that the Nd:YAG laser works by selectively destroying the vasculature supplying BCC tumors while preserving surrounding healthy tissue.28
Apart from Moskalik et al,24,25 these studies are limited by a relatively short follow-up time to confirm tumor clearance. Prior studies utilizing the Nd:YAG laser to treat BCC are summarized in the eTable.
This pilot study describes a model of care that aims to alleviate some of the demand placed both on the specialty and on patients by utilizing a novel same-day approach to BCC management. We sought to evaluate management using noninvasive diagnosis with RCM; same-day laser treatment; and follow-up examination with clinical, dermoscopic, and noninvasive imaging using OCT. This method focuses on patient-driven health care from various perspectives. Patients are given real-time information about their diagnosis using RCM, leading to an increased level of information flow and immediate transparency regarding their diagnosis and management options. Patients also are receiving tailored care by incorporating noninvasive imaging and same-day laser treatment, allowing collaboration between patient and physician. Patients have more choices—to undergo surgical care; other at-home topical regimens; or laser management with potentially fewer visits, immediate results, a clearance rate similar to surgery, and improved cosmetic outcome.
Our study attempts to further evaluate the efficacy of the 1064-nm Nd:YAG laser in treating BCC while leveraging noninvasive imaging technology. The objective was to perform a retrospective review of medical records of a subgroup of patients with BCC diagnosed by RCM who were treated with the 1064-nm Nd:YAG laser and monitored for clearance using OCT imaging, in addition to clinical and dermoscopic examination. Similar to prior long-term Nd:YAG laser follow-up studies, we aimed to demonstrate the possibility of a minimally invasive BCC management approach—in our protocol, utilizing imaging instead of biopsy to facilitate long-term follow-up and by offering a model for patient-driven care.
Methods
Study Design
Institutional review board approval was received from Icahn School of Medicine at Mount Sinai Program for the Protection of Human Subjects (New York, New York). We performed a retrospective review of medical records of patients diagnosed by RCM and treated with a 1064-nm Nd:YAG laser, as an alternative to surgery, at the Mount Sinai Faculty Practice Associates between March 2018 and August 2018. Included in this pilot study are 17 lesions in 16 patients.
Inclusion Criteria
Patients were enrolled based on the following criteria: BCCs diagnosed by clinical and dermoscopic examination followed by RCM imaging; treatment with the 1064-nm Nd:YAG laser, because of patients’ preference for this modality over surgery, superficial radiation therapy, topical regimens, and other laser therapies that require more visits; eligibility by PI included limited clinical ulceration or bleeding (or both) and a safe distance from the eye when wearing an external eye shield (ie, outside the orbital rim). The PI performed a detailed and thorough clinical and dermoscopic skin examination, enabling early detection of the BCCs. Basal cell carcinomas were not included if they exhibited rolled borders, visible ulceration, or oozing growths that allowed for treatment of less-advanced tumors. The PI utilized a clinical and dermoscopic color wheel algorithm to identify suspicious lesions combined with RCM for diagnostic confirmation.29
Two of 17 lesions that did not present as early lesions were included in the study due to patient refusal of surgery or radiation. We consider more advanced tumors to be exophytic, bleeding, crusting, nonhealing ulcerative growths. Patients who had received prior laser treatment with the PI’s PDL with fractional laser protocol with subsequent recurrence at the treatment site were included in the study. Lesions receiving concurrent or prior nonsurgical therapy, such as a topical immunomodulator or oral hedgehog inhibitor, were excluded.
Treatment Protocol
All patients attended the private clinic at Mount Sinai Hospital of a pigmented lesion expert (O.M.) for routine skin cancer screening. Patients with lesions suspicious for BCC—based on clinical and dermoscopic features—were offered tissue biopsy or RCM. Following diagnosis with RCM, treatment options were discussed, and patients were offered laser treatment when surgical options were declined. Topical treatment options were not emphasized because they require weeks of application to be effective and have been studied mainly in superficial BCC management.30,31
Patients with early lesions were offered either the PDL with fractional laser or Nd:YAG protocol, with their understanding that the Nd:YAG laser protocol would likely involve fewer treatments but a higher likelihood of residual hyperpigmentation or potential scarring (or both) than the more gentle PDL with fractional laser treatment.
All lesions on the face were premarginated using OCT by obtaining central scans and 4 additional scans—above, below, to the left, and to the right of the lesion—to ensure targeted laser treatment with desirable cosmetic results. Facial premargination scans were mandatory; however, patients with lesions on the trunk or extremities were offered the option to have pretreatment margination as an out-of-pocket expense. We did not require premargination of lesions on the body because of their location on less cosmetically critical areas. Most patients declined the optional scans.
This can be considered analogous to the situation in which more insurers reimburse Mohs surgery for cosmetically challenging areas such as the head and neck, while limiting reimbursement for treatment of lesions on the trunk and upper extremities to simple excision. Given cosmetic concerns on the head and neck compared to the body, some patients found it acceptable to have slightly increased dyschromia over a broader treatment area of non–cosmetically critical locations on the body.
Optical coherence tomography imaging was required for all anatomic locations at follow-up visits to detect residual disease or confirm clearance. All patients were given thorough information about the treatment, additional costs, treatment alternatives, potential adverse effects, and complications.
Clinical and dermoscopic images were obtained at every visit using a commercially available point-and-shoot digital single-lens reflex camera for clinical photographs, with an attached DermLite DL3N (3Gen) dermatoscope for all contact polarized dermoscopic photography.
Laser treatment was carried out with the 1064-nm Nd:YAG laser. Setting ranges were similar to previously published studies that used the 1064-nm Nd:YAG laser to treat BCCs (spot sizes, 5–6 mm; fluences, 125–140 J/cm2; pulse durations, 7–10 milliseconds).26-28 The exact settings and number of passes were tailored to the individual lesion based on skin type, anatomic location, extent of tumor involvement by depth (and margin on facial lesions), and posttreatment dermoscopic confirmation of clearance; additionally, for facial lesions, OCT confirmation of clearance.
Laser treatment was provided by the PI. Patients were instructed to apply a thick emollient (ie, formulation of petrolatum or 100% petrolatum) after treatment and until the area healed.
All tumors received 1 to 3 treatments at an interval of 1 to 2 months. The treatment end point was complete clearance, judged by absence of skin cancer clinically, dermoscopically, and on OCT scan. More specifically, the PI looked for vascular changes and echogenic changes on OCT consistent with tumor clearance as well as dermoscopic disappearance of recognized BCC features.
Patients were asked to return for follow-up visits 2 months after the final treatment to evaluate tumor clearance. They were asked to return subsequently every 6 to 12 months for routine care and long-term follow-up.
Results
Patient Characteristics
A total of 16 patients (6 female, 10 male) with 17 BCCs were included in this study. Mean age was 68 years (median, 71.5 years; range; 48–89 years). Mean lesion size was 7.1 mm (median, 6 mm; range, 3–15 mm). Eight lesions were on the face; 9 were on extrafacial sites. Two lesions had a history of laser treatment with the PI’s PDL with fractional laser treatment protocol and had locally recurred. Subtypes of lesions were not elicited by RCM.
Outcomes
Fourteen lesions (14/17 [82.4%]) required 1 treatment to achieve clearance, as confirmed clinically, dermoscopically, and by OCT scanning. One lesion on the back (1/17 [5.8%]) required 2 treatments (70 days between treatments). Two lesions (2/17 [11.8%]) required 3 treatments (time between treatments: 49 and 61 days [lesion 1]; 62 and 64 days [lesion 2]). Lesion 1 was on the face; lesion 2 was on the back. Mean time between last treatment and OCT clearance scan was 103 days (median, 64 days; range, 48–371 days).
Comment
Our study supports the notion that the 1064-nm Nd:YAG laser is a viable option for treating BCC. All (100%) lesions cleared, most (82.4%) with a single treatment. Of course, for patients who required more than 1 treatment (17.6%), we cannot make an argument for fewer patient visits because those patients had to return for multiple laser treatments, but they were able to avoid surgery, as they had wanted. Overall, our diagnostic approach utilizing RCM as opposed to traditional tissue biopsy meant that patients’ skin cancers were diagnosed and treated the same day.
A one-stop shop for diagnosis and treatment model has been reported by Kadouch et al32 as part of a randomized controlled trial in which patients were randomly assigned to receive standard care for BCC—biopsy followed by surgical excision—or RCM diagnosis followed by surgical excision. Their outcome was tumor-free margins after surgical treatment; the RCM approach was found to be noninferior to standard care.32 Our retrospective study differs, of course, in its laser treatment approach; however, both studies investigated a potentially more efficient pathway to BCC management, which becomes increasingly relevant given the rising incidence of NMSC.
A real-time, image-based diagnostic approach combined with laser treatment delivers patient-driven care, offering choice and convenience. It might be optimal for patients who have an extensive history of BCC, are poor surgical candidates, have difficulty with the logistics of the multiple visits required for surgical management, cannot (for practical reasons) spend multiple hours in office between Mohs stages, and do not want potentially disfiguring scars, making a minimally invasive treatment preferable.
As we found in our sample, not all patients are amenable to undergoing what is regarded now as the most definitive treatment—namely, surgical options. This subset of patients, whose lesions require more definitive treatment but who do not desire invasive management, need alternative approaches to BCC treatment. The present study proposes a model of patient-driven care that requires collaboration between physician and patient, offering more customized care that takes into account patient choice.
In our study, most patients had lesions that were detected early in their evolution; these lesions might be particularly amenable to laser management. The 2 resistant lesions in our set—requiring 3 treatments—appeared more aggressive clinically at initial evaluation but still had posttreatment outcomes with mild dyschromia similar to the lesions only treated once (Figure, A–D). Of those 2 lesions, the 9-mm lesion on the back (Figure, C and D) might have been larger than clinically apparent; in hindsight, it might have responded to a single treatment had it been premarginated. (An additional factor to have considered is the patient’s immunosuppressed status, which might have led to a more resistant lesion. Larger trials would help elucidate whether an immunosuppressed patient requires a different treatment approach, broader treatment area, OCT premargination regardless of anatomic location, or a greater number of treatments.) Nevertheless, the 2 aforementioned patients were offered treatment with the 1064-nm Nd:YAG laser because they refused surgery, radiation, and other more aggressive modalities. The patients were given advanced warning of an increased possibility of recurrence or nonclearance.
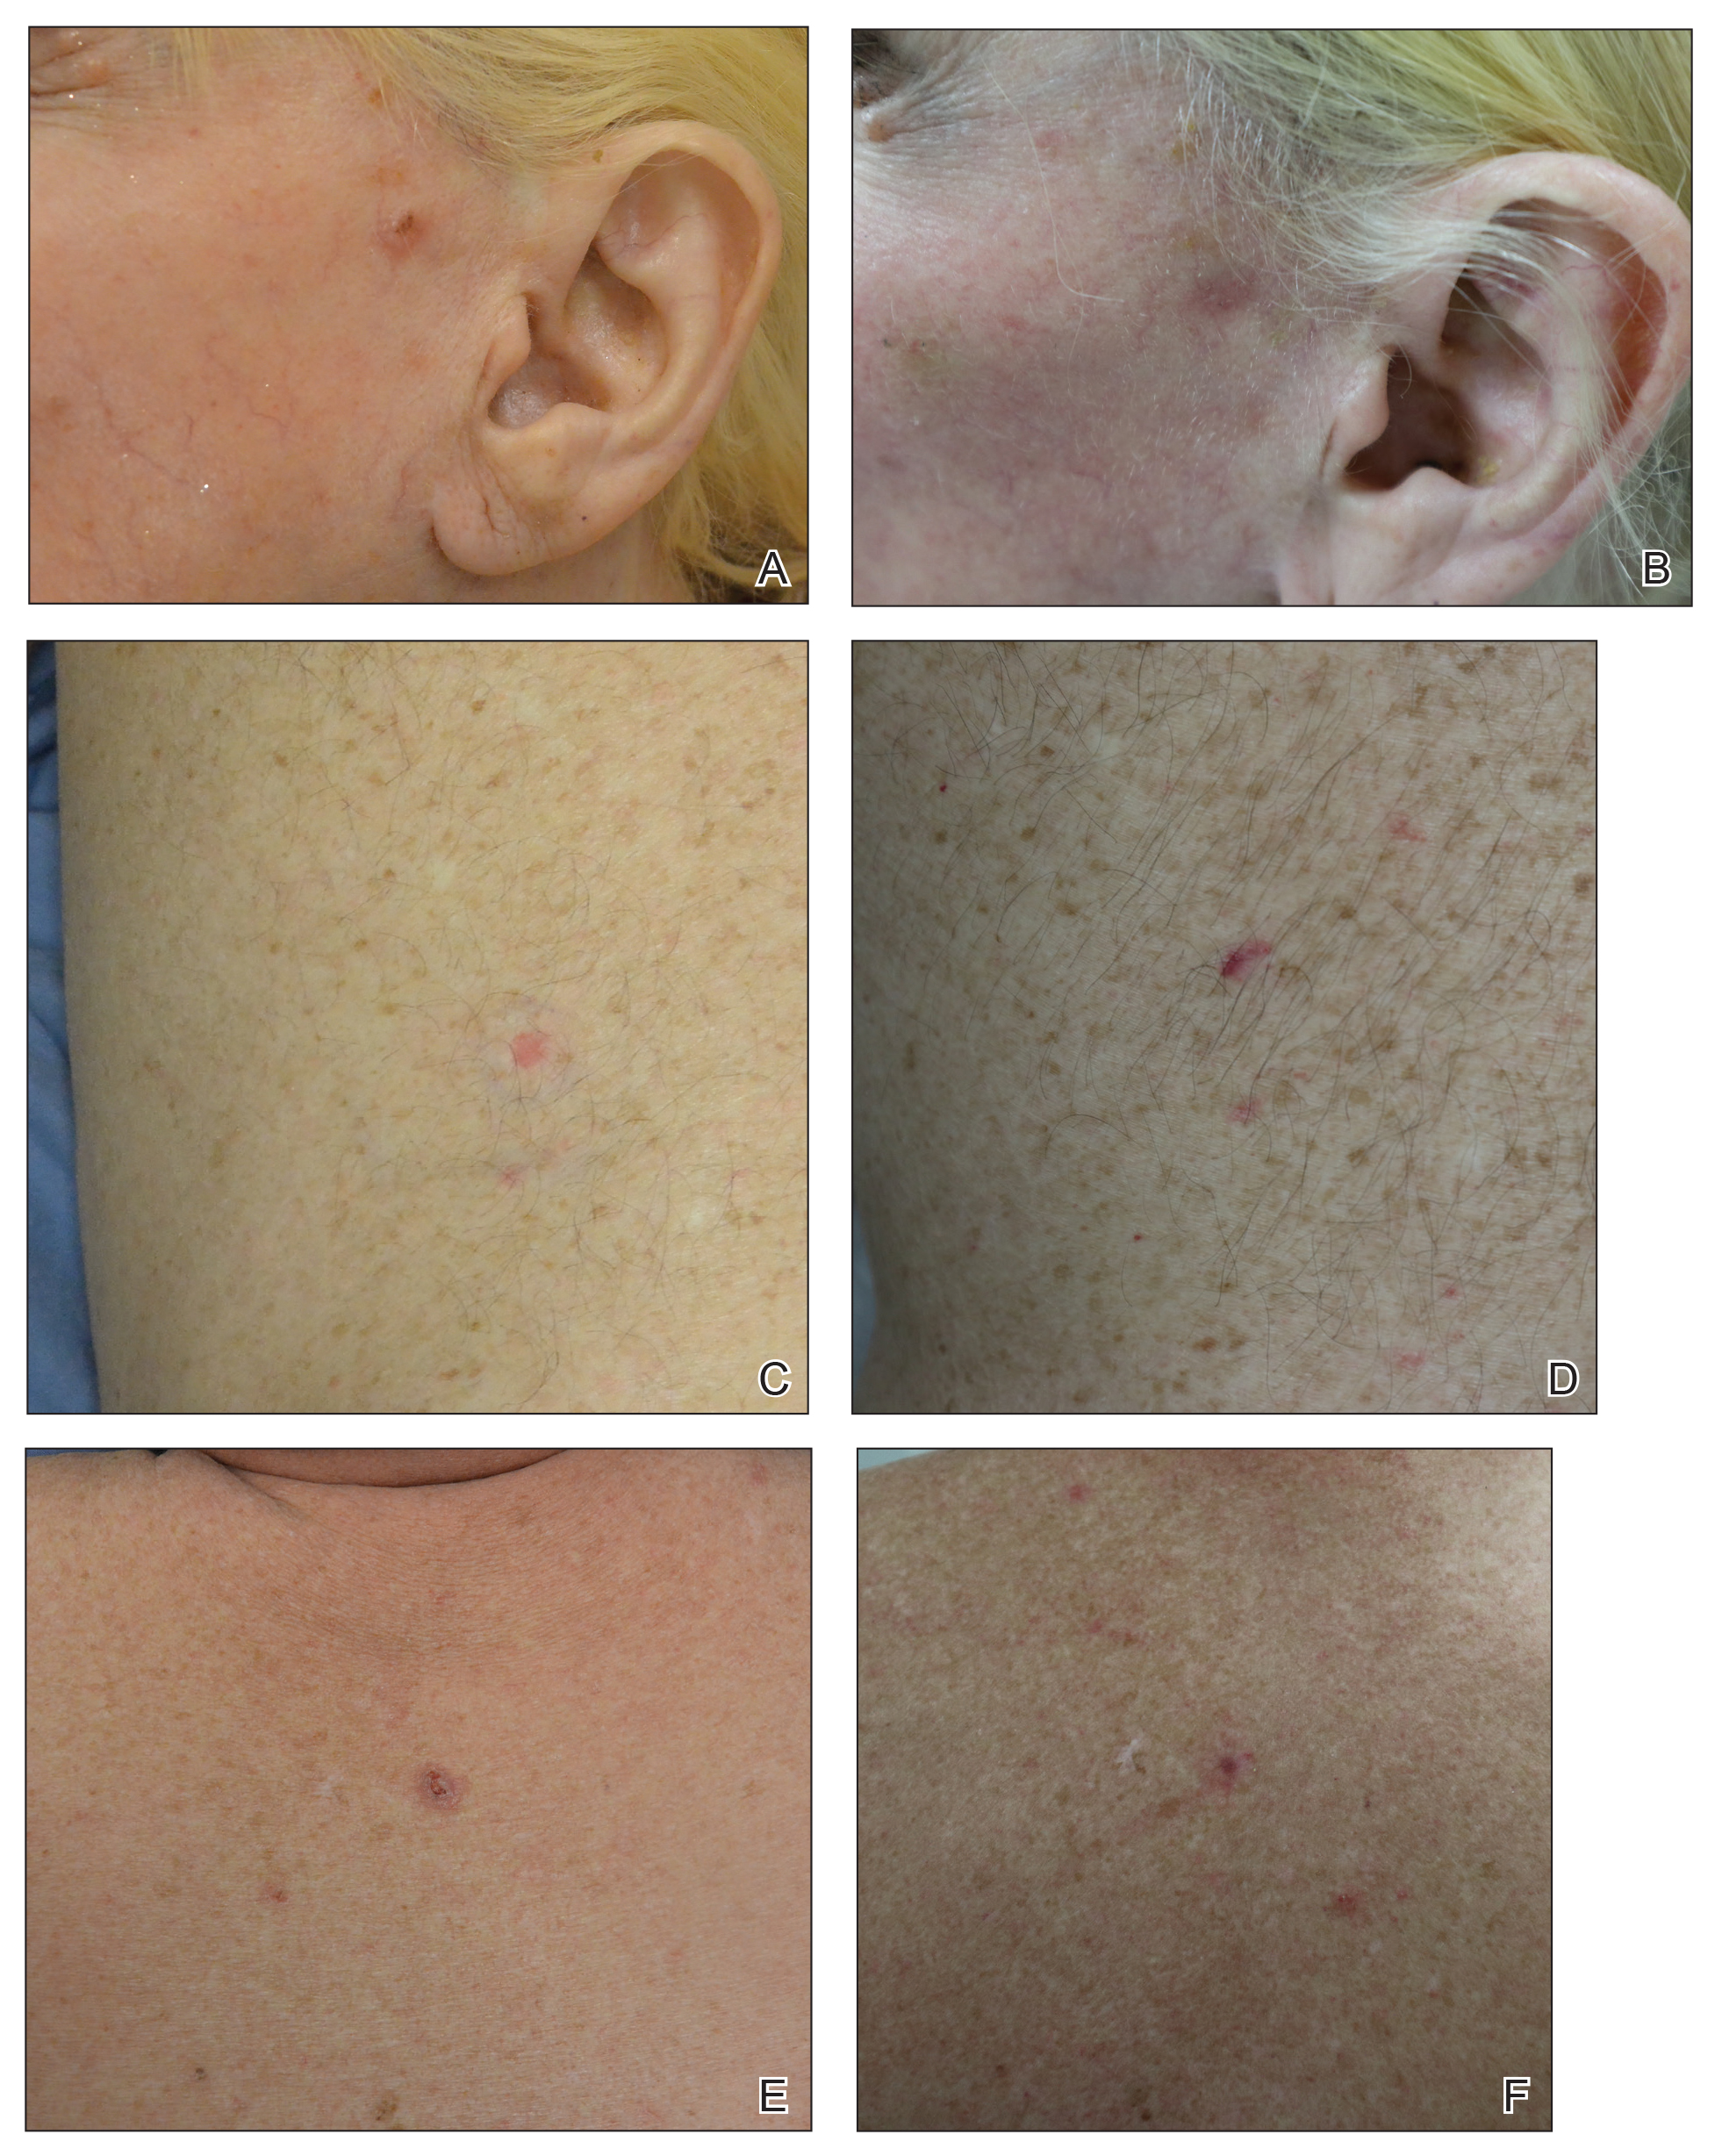
The lesion that required 2 treatments did not appear to be an aggressive subtype; however, it was considerably larger than most other treated lesions (1.5 cm)(Figure, E and F). In this patient, as with the others, we utilized milder (700–1000 J) fluence settings than those used in the Moskalik et al24 study; however, we were optimizing for patient comfort, overall downtime, and cosmetic outcomes.
Clearance in this study was assessed by OCT scanning. Scans were obtained 2 months after the last treatment to avoid detecting inflammation and early scar tissue. We opted not to perform biopsies to determine clearance, as done in prior studies, because we were investigating a fully nonsurgical protocol and wanted to enable patients to avoid surgical intervention, as they had requested. Clinical and dermoscopic examinations by a world expert in dermoscopy and OCT (O.M.) provided additional reassurance of lesion clearance.
Limitations
The retrospective study design with a limited sample size was a main limitation of our study. Our limited data suggest that there is value in further investigation and prospective trials of minimally invasive skin cancer management with the pulsed 1064-nm Nd:YAG laser.
Limitations or disadvantages of this nonablative laser treatment include dyschromia and minimal scarring. Furthermore, at fluence settings utilized, treatment can be painful. Without use of a local anesthetic, treatment is limited to what patients can tolerate.
The percentage of BCCs located on the body (53%) was higher in our study than in the general population, estimated in a study to be approximately 20%.33 This percentage might have been an effect of the larger Vivascope 1500 RCM probe, which made certain areas of the face difficult to access, therefore excluding certain facial lesions encountered in our practice from the initial noninvasive diagnosis.
Most lesions in our study have not been followed long-term; median noninvasive OCT follow-up was 64 days; however, the longest follow-up from our data set is longer than 1 year posttreatment (371 days). We have used OCT to establish clearance, which also will allow us to continue using imaging to monitor for changes that might indicate recurrence. Although OCT is not approved by the US Food and Drug Administration as a validated means of diagnosing and detecting BCC, numerous studies have suggested that this modality has high sensitivity (95.7%) and specificity (75.3%) for features of BCC as well as the more critical high negative predictive value (92.1%) for noninvasive management.22-24
Furthermore, setting up the lesions to be monitored long-term using OCT is likely to be more sensitive than monitoring lesions by clinical examination alone, as they have been followed in studies to date. In fact, an earlier study of 115 lesions by the PI found that utilizing OCT significantly improved sensitivity and specificity for detecting BCC (P<.01); improved diagnostic certainty by a factor of 4 compared to clinical examination alone; and improved overall diagnostic accuracy by 50% compared to clinical and dermoscopic examinations.19
Conclusion
Traditional approaches to BCC management usually involve multiple visits: the initial encounter, which might or might not include biopsy, and a return visit for more definitive management. Reflectance confocal microscopy enables live diagnosis and facilitates targeted same-day treatment of BCC. Our pilot study has contributed data to support the further investigation and use of the Nd:YAG laser to treat BCC in combination with early detection with noninvasive diagnosis for a more patient-driven approach. For some patients as well as for dermatologists, the potential for increased efficiency of same-day diagnosis and treatment might provide a clear advantage.
- Rogers HW, Weinstock MA, Feldman SR, et al. Incidence estimate of nonmelanoma skin cancer (keratinocyte carcinomas) in the US population, 2012. JAMA Dermatol. 2015;151:1081-1086.
- Menzies SW, Westerhoff K, Rabinovitz H, et al. Surface microscopy of pigmented basal cell carcinoma. Arch Dermatol. 2000;136:1012-1016.
- Altamura D, Menzies SW, Argenziano G, et al. Dermatoscopy of basal cell carcinoma: morphologic variability of global and local features and accuracy of diagnosis. J Am Acad Dermatol. 2010;62:67-75.
- Rosendahl C, Tschandl P, Cameron A, et al. Diagnostic accuracy of dermatoscopy for melanocytic and nonmelanocytic pigmented lesions. J Am Acad Dermatol. 2011;64:1068-1073.
- Lallas A, Apalla Z, Ioannides D, et al. Dermoscopy in the diagnosis and management of basal cell carcinoma. Futur Oncol. 2015;11:2975-2984.
- Ulrich M, Lange-Asschenfeldt S, Gonzalez S. The use of reflectance confocal microscopy for monitoring response to therapy of skin malignancies. Dermatol Pract Concept. 2012;2:202a10.
- Kauvar AN, Cronin T Jr, Roenigk R, et al; American Society for Dermatologic Surgery. Consensus for nonmelanoma skin cancer treatment: basal cell carcinoma, including a cost analysis of treatment methods. Dermatol Surg. 2015;41:550-571.
- Hoorens I, Vossaert K, Ongenae K, et al. Is early detection of basal cell carcinoma worthwhile? Systematic review based on the WHO criteria for screening. Br J Dermatol. 2016;174:1258-1265.
- Levine A, Markowitz O. In vivo reflectance confocal microscopy. Cutis. 2017;99:399-402.
- Levine A, Wang K, Markowitz O. Optical coherence tomography in the diagnosis of skin cancer. Dermatol Clin. 2017;35:465-488.
- Pomerantz R, Zell D, McKenzie G, et al. Optical coherence tomography used as a modality to delineate basal cell carcinoma prior to Mohs micrographic surgery. Case Rep Dermatol. 2011;3:212-218.
- Alawi SA, Kuck M, Wahrlich C, et al. Optical coherence tomography for presurgical margin assessment of non-melanoma skin cancer - a practical approach. Exp Dermatol. 2013;22:547-551.
- Wang KX, Meekings A, Fluhr JW, et al. Optical coherence tomography-based optimization of Mohs micrographic surgery of basal cell carcinoma: a pilot study. Dermatol Surg. 2013;39:627-633.
- van Manen L, Dijkstra J, Boccara C, et al. The clinical usefulness of optical coherence tomography during cancer interventions. J Cancer Res Clin Oncol. 2018;144:1967-1990.
- Banzhaf CA, Themstrup L, Ring HC, et al. Optical coherence tomography imaging of non-melanoma skin cancer undergoing imiquimod therapy. Ski Res Technol. 2014;20:170-176.
- Markowitz O, Schwartz M. The use of noninvasive optical coherence tomography to monitor the treatment progress of vismodegib and imiquimod 5% cream in a transplant patient with advanced basal cell carcinoma of the nose. J Clin Aesthet Dermatol. 2016;9:37-41.
- Cheng HM, Guitera P. Systematic review of optical coherence tomography usage in the diagnosis and management of basal cell carcinoma. Br J Dermatol. 2015;173:1371-1380.
- Ulrich M, von Braunmuehl T, Kurzen H, et al. The sensitivity and specificity of optical coherence tomography for the assisted diagnosis of nonpigmented basal cell carcinoma: an observational study. Br J Dermatol. 2015;173:428-435.
- Markowitz O, Schwartz M, Feldman E, et al. Evaluation of optical coherence tomography as a means of identifying earlier stage basal cell carcinomas while reducing the use of diagnostic biopsy. J Clin Aesthet Dermatol. 2015;8:14-20.
- Mirza FN, Khatri KA. The use of lasers in the treatment of skin cancer: a review. J Cosmet Laser Ther. 2017;19:451-458.
- Soleymani T, Abrouk M, Kelly KM. An analysis of laser therapy for the treatment of nonmelanoma skin cancer. Dermatol Surg. 2017;43:615-624.
- Markowitz O, Tongdee E, Levine A. Optimal cosmetic outcomes for basal cell carcinoma: a retrospective study of nonablative laser management. Cutis. 2019;103:292-297.
- Jalian HR, Avram MM, Stankiewicz KJ, et al. Combined 585 nm pulsed-dye and 1,064 nm Nd:YAG lasers for the treatment of basal cell carcinoma. Lasers Surg Med. 2014;46:1-7.
- Moskalik K, Kozlov A, Demin E, et al. The efficacy of facial skin cancer treatment with high-energy pulsed neodymium and Nd:YAG lasers. Photomed Laser Surg. 2009;27:345-349.
- Moskalik K, Kozlow A, Demin E, et al. Powerful neodymium laser radiation for the treatment of facial carcinoma: 5 year follow-up data. Eur J Dermatol. 2010;20:738-742.
- Ortiz AE, Anderson RR, Avram MM. 1064 nm long-pulsed Nd:YAG laser treatment of basal cell carcinoma. Lasers Surg Med. 2015;47:106-110.
- Ortiz AE, Anderson RR, DiGiorgio C, et al. An expanded study of long-pulsed 1064 nm Nd:YAG laser treatment of basal cell carcinoma. Lasers Surg Med. 2018;50:727-731.
- Ahluwalia J, Avram MM, Ortiz AE. Outcomes of long-pulsed 1064 nm Nd:YAG laser treatment of basal cell carcinoma: a retrospective review. Lasers Surg Med. 2019;51:34-39.
- Markowitz O. A Practical Guide to Dermoscopy. Philadelphia, PA: Wolters Kluwer; 2017.
- Papakostas D, Stockfleth E. Topical treatment of basal cell carcinoma with the immune response modifier imiquimod. Futur Oncol. 2015;11:2985-2990.
- Jansen MHE, Mosterd K, Arits AHMM, et al. Five-year results of a randomized controlled trial comparing effectiveness of photodynamic therapy, topical imiquimod, and topical 5-fluorouracil in patients with superficial basal cell carcinoma. J Invest Dermatol. 2018;138:527-533.
- Kadouch DJ, Elshot YS, Zupan-Kajcovski B, et al. One-stop-shop with confocal microscopy imaging vs. standard care for surgical treatment of basal cell carcinoma: an open-label, noninferiority, randomized controlled multicentre trial. Br J Dermatol. 2017;177:735-741.
- Scrivener Y, Grosshans E, Cribier B. Variations of basal cell carcinomas according to gender, age, location and histopathological subtype. Br J Dermatol. 2002;147:41-47.
The increasing incidence of nonmelanoma skin cancer (NMSC) is a serious public health concern.1 Lesions often are identified on routine total-body examination, and there is a considerate burden on dermatologists to diagnose these lesions, which is both costly and results in a long wait time to see a specialist. Furthermore, standard care requires patients to attend multiple visits for the diagnosis and treatment of NMSC.
In recent decades, diagnosing basal cell carcinoma (BCC) has been facilitated by the handheld dermatoscope. The advent of dermoscopy has led to increased sensitivity and specificity of the NMSC diagnosis (estimated at 95%–99%) and has helped facilitate earlier diagnosis of BCC and reduce unnecessary biopsy of benign lesions.2-5 Dermoscopy also can be useful in monitoring response to treatment.5 Lesions that are detected early tend to be easier and less expensive to treat, a strong argument for the use of early detection techniques.6-8
More recently, in vivo reflectance confocal microscopy (RCM)(Vivascope 1500 [Caliber I.D.]) has become an acceptable means for confirming a BCC diagnosis, offering an alternative to tissue biopsy. Reflectance confocal microscopy can be reimbursed under Category I Current Procedural Terminology codes 96931 to 96936.9 Reflectance confocal microscopy is a noninvasive diagnostic technique that uses an 830-nm diode laser to enable visualization of a 0.5×0.5-mm patch of skin to a depth of 200 to 300 μm, which corresponds roughly to the papillary dermis. Reflectance confocal microscopy has the advantage of providing real-time diagnosis, enabling same-day treatment of BCC, and providing an efficient alternative to biopsy. Ultimately, these advantages are beneficial and time-saving for patients because biopsies can be painful; create a delay in diagnosis; and require further follow-up visits for treatment, which may be of importance to patients who have trouble attending multiple appointments.
Optical coherence tomography (OCT) is another noninvasive imaging device that is useful in BCC management. It uses an infrared broadband light source to visualize skin architecture to 2-mm deep with a 6×6-mm field of view.10 Although OCT does not offer the same cellular clarity as RCM, it allows visualization of a greater depth of skin and a wider field of view, making it a useful tool both in marginating NMSCs prior to treatment and monitoring response to treatment over time.11-16 Optical coherence tomography has demonstrated a high negative predictive value (92.1%) for BCC, which makes it useful for ruling out residual tumor in lesions undergoing management.17-19
With all available options, BCC management benefits from care that is tailored to the individual and the lesion, taking into account size and subtype because not every available treatment is appropriate. Lasers, including solid state, diode, dye, and gas types, are emerging as promising minimally invasive treatment modalities.20,21
Nonablative laser therapy with a pulsed dye laser (PDL) and fractional laser is an example; the principal investigator (PI) of this study (O.M.) recently reported a 95.70% clearance rate utilizing a PDL and fractional laser protocol.22 The 1064-nm Nd:YAG laser also has been used with PDL and as a stand-alone treatment. Jalian et al23 used PDL and the Nd:YAG laser on 13 BCC lesions, with a 58% (7/12) clearance rate after 4 treatments; all nonresponders were taking an anticoagulant, which inhibited the laser’s mechanism of action, according to the researchers.
Moskalik et al24 published a report of 3346 facial BCC lesions treated with pulsed Nd and pulsed Nd:YAG lasers, and included follow-up for as long as 5 years, with a 3.7% recurrence rate. Another report by Moskalik et al25 recorded a recurrence rate of 2.2% to 3.1% for BCCs that were followed for at least 5 years.
Ortiz et al26 reported use of the long-pulsed 1064-nm Nd:YAG laser to treat 13 lesions with biopsy-confirmed BCC on the trunk and extremities, with a 92% (12/13) clearance rate based on histologic analysis 1 month after laser treatment. In an expanded study of 31 patients by Ortiz et al,27 the histologic clearance rate was 90.3% (28/31)—also obtained after 1 month—after 1 Nd:YAG laser treatment, also treating lesions on the trunk and extremities. A further retrospective review of Nd:YAG laser treatment of BCC revealed a 100% clearance rate for 16 lesions (including lesions on the face) that were monitored for at least 6 months (mean duration, 9 months; range, 6–15 months).28 Optical coherence tomography imaging was used for one of the review’s lesions before and after treatment and suggested that the Nd:YAG laser works by selectively destroying the vasculature supplying BCC tumors while preserving surrounding healthy tissue.28
Apart from Moskalik et al,24,25 these studies are limited by a relatively short follow-up time to confirm tumor clearance. Prior studies utilizing the Nd:YAG laser to treat BCC are summarized in the eTable.
This pilot study describes a model of care that aims to alleviate some of the demand placed both on the specialty and on patients by utilizing a novel same-day approach to BCC management. We sought to evaluate management using noninvasive diagnosis with RCM; same-day laser treatment; and follow-up examination with clinical, dermoscopic, and noninvasive imaging using OCT. This method focuses on patient-driven health care from various perspectives. Patients are given real-time information about their diagnosis using RCM, leading to an increased level of information flow and immediate transparency regarding their diagnosis and management options. Patients also are receiving tailored care by incorporating noninvasive imaging and same-day laser treatment, allowing collaboration between patient and physician. Patients have more choices—to undergo surgical care; other at-home topical regimens; or laser management with potentially fewer visits, immediate results, a clearance rate similar to surgery, and improved cosmetic outcome.
Our study attempts to further evaluate the efficacy of the 1064-nm Nd:YAG laser in treating BCC while leveraging noninvasive imaging technology. The objective was to perform a retrospective review of medical records of a subgroup of patients with BCC diagnosed by RCM who were treated with the 1064-nm Nd:YAG laser and monitored for clearance using OCT imaging, in addition to clinical and dermoscopic examination. Similar to prior long-term Nd:YAG laser follow-up studies, we aimed to demonstrate the possibility of a minimally invasive BCC management approach—in our protocol, utilizing imaging instead of biopsy to facilitate long-term follow-up and by offering a model for patient-driven care.
Methods
Study Design
Institutional review board approval was received from Icahn School of Medicine at Mount Sinai Program for the Protection of Human Subjects (New York, New York). We performed a retrospective review of medical records of patients diagnosed by RCM and treated with a 1064-nm Nd:YAG laser, as an alternative to surgery, at the Mount Sinai Faculty Practice Associates between March 2018 and August 2018. Included in this pilot study are 17 lesions in 16 patients.
Inclusion Criteria
Patients were enrolled based on the following criteria: BCCs diagnosed by clinical and dermoscopic examination followed by RCM imaging; treatment with the 1064-nm Nd:YAG laser, because of patients’ preference for this modality over surgery, superficial radiation therapy, topical regimens, and other laser therapies that require more visits; eligibility by PI included limited clinical ulceration or bleeding (or both) and a safe distance from the eye when wearing an external eye shield (ie, outside the orbital rim). The PI performed a detailed and thorough clinical and dermoscopic skin examination, enabling early detection of the BCCs. Basal cell carcinomas were not included if they exhibited rolled borders, visible ulceration, or oozing growths that allowed for treatment of less-advanced tumors. The PI utilized a clinical and dermoscopic color wheel algorithm to identify suspicious lesions combined with RCM for diagnostic confirmation.29
Two of 17 lesions that did not present as early lesions were included in the study due to patient refusal of surgery or radiation. We consider more advanced tumors to be exophytic, bleeding, crusting, nonhealing ulcerative growths. Patients who had received prior laser treatment with the PI’s PDL with fractional laser protocol with subsequent recurrence at the treatment site were included in the study. Lesions receiving concurrent or prior nonsurgical therapy, such as a topical immunomodulator or oral hedgehog inhibitor, were excluded.
Treatment Protocol
All patients attended the private clinic at Mount Sinai Hospital of a pigmented lesion expert (O.M.) for routine skin cancer screening. Patients with lesions suspicious for BCC—based on clinical and dermoscopic features—were offered tissue biopsy or RCM. Following diagnosis with RCM, treatment options were discussed, and patients were offered laser treatment when surgical options were declined. Topical treatment options were not emphasized because they require weeks of application to be effective and have been studied mainly in superficial BCC management.30,31
Patients with early lesions were offered either the PDL with fractional laser or Nd:YAG protocol, with their understanding that the Nd:YAG laser protocol would likely involve fewer treatments but a higher likelihood of residual hyperpigmentation or potential scarring (or both) than the more gentle PDL with fractional laser treatment.
All lesions on the face were premarginated using OCT by obtaining central scans and 4 additional scans—above, below, to the left, and to the right of the lesion—to ensure targeted laser treatment with desirable cosmetic results. Facial premargination scans were mandatory; however, patients with lesions on the trunk or extremities were offered the option to have pretreatment margination as an out-of-pocket expense. We did not require premargination of lesions on the body because of their location on less cosmetically critical areas. Most patients declined the optional scans.
This can be considered analogous to the situation in which more insurers reimburse Mohs surgery for cosmetically challenging areas such as the head and neck, while limiting reimbursement for treatment of lesions on the trunk and upper extremities to simple excision. Given cosmetic concerns on the head and neck compared to the body, some patients found it acceptable to have slightly increased dyschromia over a broader treatment area of non–cosmetically critical locations on the body.
Optical coherence tomography imaging was required for all anatomic locations at follow-up visits to detect residual disease or confirm clearance. All patients were given thorough information about the treatment, additional costs, treatment alternatives, potential adverse effects, and complications.
Clinical and dermoscopic images were obtained at every visit using a commercially available point-and-shoot digital single-lens reflex camera for clinical photographs, with an attached DermLite DL3N (3Gen) dermatoscope for all contact polarized dermoscopic photography.
Laser treatment was carried out with the 1064-nm Nd:YAG laser. Setting ranges were similar to previously published studies that used the 1064-nm Nd:YAG laser to treat BCCs (spot sizes, 5–6 mm; fluences, 125–140 J/cm2; pulse durations, 7–10 milliseconds).26-28 The exact settings and number of passes were tailored to the individual lesion based on skin type, anatomic location, extent of tumor involvement by depth (and margin on facial lesions), and posttreatment dermoscopic confirmation of clearance; additionally, for facial lesions, OCT confirmation of clearance.
Laser treatment was provided by the PI. Patients were instructed to apply a thick emollient (ie, formulation of petrolatum or 100% petrolatum) after treatment and until the area healed.
All tumors received 1 to 3 treatments at an interval of 1 to 2 months. The treatment end point was complete clearance, judged by absence of skin cancer clinically, dermoscopically, and on OCT scan. More specifically, the PI looked for vascular changes and echogenic changes on OCT consistent with tumor clearance as well as dermoscopic disappearance of recognized BCC features.
Patients were asked to return for follow-up visits 2 months after the final treatment to evaluate tumor clearance. They were asked to return subsequently every 6 to 12 months for routine care and long-term follow-up.
Results
Patient Characteristics
A total of 16 patients (6 female, 10 male) with 17 BCCs were included in this study. Mean age was 68 years (median, 71.5 years; range; 48–89 years). Mean lesion size was 7.1 mm (median, 6 mm; range, 3–15 mm). Eight lesions were on the face; 9 were on extrafacial sites. Two lesions had a history of laser treatment with the PI’s PDL with fractional laser treatment protocol and had locally recurred. Subtypes of lesions were not elicited by RCM.
Outcomes
Fourteen lesions (14/17 [82.4%]) required 1 treatment to achieve clearance, as confirmed clinically, dermoscopically, and by OCT scanning. One lesion on the back (1/17 [5.8%]) required 2 treatments (70 days between treatments). Two lesions (2/17 [11.8%]) required 3 treatments (time between treatments: 49 and 61 days [lesion 1]; 62 and 64 days [lesion 2]). Lesion 1 was on the face; lesion 2 was on the back. Mean time between last treatment and OCT clearance scan was 103 days (median, 64 days; range, 48–371 days).
Comment
Our study supports the notion that the 1064-nm Nd:YAG laser is a viable option for treating BCC. All (100%) lesions cleared, most (82.4%) with a single treatment. Of course, for patients who required more than 1 treatment (17.6%), we cannot make an argument for fewer patient visits because those patients had to return for multiple laser treatments, but they were able to avoid surgery, as they had wanted. Overall, our diagnostic approach utilizing RCM as opposed to traditional tissue biopsy meant that patients’ skin cancers were diagnosed and treated the same day.
A one-stop shop for diagnosis and treatment model has been reported by Kadouch et al32 as part of a randomized controlled trial in which patients were randomly assigned to receive standard care for BCC—biopsy followed by surgical excision—or RCM diagnosis followed by surgical excision. Their outcome was tumor-free margins after surgical treatment; the RCM approach was found to be noninferior to standard care.32 Our retrospective study differs, of course, in its laser treatment approach; however, both studies investigated a potentially more efficient pathway to BCC management, which becomes increasingly relevant given the rising incidence of NMSC.
A real-time, image-based diagnostic approach combined with laser treatment delivers patient-driven care, offering choice and convenience. It might be optimal for patients who have an extensive history of BCC, are poor surgical candidates, have difficulty with the logistics of the multiple visits required for surgical management, cannot (for practical reasons) spend multiple hours in office between Mohs stages, and do not want potentially disfiguring scars, making a minimally invasive treatment preferable.
As we found in our sample, not all patients are amenable to undergoing what is regarded now as the most definitive treatment—namely, surgical options. This subset of patients, whose lesions require more definitive treatment but who do not desire invasive management, need alternative approaches to BCC treatment. The present study proposes a model of patient-driven care that requires collaboration between physician and patient, offering more customized care that takes into account patient choice.
In our study, most patients had lesions that were detected early in their evolution; these lesions might be particularly amenable to laser management. The 2 resistant lesions in our set—requiring 3 treatments—appeared more aggressive clinically at initial evaluation but still had posttreatment outcomes with mild dyschromia similar to the lesions only treated once (Figure, A–D). Of those 2 lesions, the 9-mm lesion on the back (Figure, C and D) might have been larger than clinically apparent; in hindsight, it might have responded to a single treatment had it been premarginated. (An additional factor to have considered is the patient’s immunosuppressed status, which might have led to a more resistant lesion. Larger trials would help elucidate whether an immunosuppressed patient requires a different treatment approach, broader treatment area, OCT premargination regardless of anatomic location, or a greater number of treatments.) Nevertheless, the 2 aforementioned patients were offered treatment with the 1064-nm Nd:YAG laser because they refused surgery, radiation, and other more aggressive modalities. The patients were given advanced warning of an increased possibility of recurrence or nonclearance.
The lesion that required 2 treatments did not appear to be an aggressive subtype; however, it was considerably larger than most other treated lesions (1.5 cm)(Figure, E and F). In this patient, as with the others, we utilized milder (700–1000 J) fluence settings than those used in the Moskalik et al24 study; however, we were optimizing for patient comfort, overall downtime, and cosmetic outcomes.
Clearance in this study was assessed by OCT scanning. Scans were obtained 2 months after the last treatment to avoid detecting inflammation and early scar tissue. We opted not to perform biopsies to determine clearance, as done in prior studies, because we were investigating a fully nonsurgical protocol and wanted to enable patients to avoid surgical intervention, as they had requested. Clinical and dermoscopic examinations by a world expert in dermoscopy and OCT (O.M.) provided additional reassurance of lesion clearance.
Limitations
The retrospective study design with a limited sample size was a main limitation of our study. Our limited data suggest that there is value in further investigation and prospective trials of minimally invasive skin cancer management with the pulsed 1064-nm Nd:YAG laser.
Limitations or disadvantages of this nonablative laser treatment include dyschromia and minimal scarring. Furthermore, at fluence settings utilized, treatment can be painful. Without use of a local anesthetic, treatment is limited to what patients can tolerate.
The percentage of BCCs located on the body (53%) was higher in our study than in the general population, estimated in a study to be approximately 20%.33 This percentage might have been an effect of the larger Vivascope 1500 RCM probe, which made certain areas of the face difficult to access, therefore excluding certain facial lesions encountered in our practice from the initial noninvasive diagnosis.
Most lesions in our study have not been followed long-term; median noninvasive OCT follow-up was 64 days; however, the longest follow-up from our data set is longer than 1 year posttreatment (371 days). We have used OCT to establish clearance, which also will allow us to continue using imaging to monitor for changes that might indicate recurrence. Although OCT is not approved by the US Food and Drug Administration as a validated means of diagnosing and detecting BCC, numerous studies have suggested that this modality has high sensitivity (95.7%) and specificity (75.3%) for features of BCC as well as the more critical high negative predictive value (92.1%) for noninvasive management.22-24
Furthermore, setting up the lesions to be monitored long-term using OCT is likely to be more sensitive than monitoring lesions by clinical examination alone, as they have been followed in studies to date. In fact, an earlier study of 115 lesions by the PI found that utilizing OCT significantly improved sensitivity and specificity for detecting BCC (P<.01); improved diagnostic certainty by a factor of 4 compared to clinical examination alone; and improved overall diagnostic accuracy by 50% compared to clinical and dermoscopic examinations.19
Conclusion
Traditional approaches to BCC management usually involve multiple visits: the initial encounter, which might or might not include biopsy, and a return visit for more definitive management. Reflectance confocal microscopy enables live diagnosis and facilitates targeted same-day treatment of BCC. Our pilot study has contributed data to support the further investigation and use of the Nd:YAG laser to treat BCC in combination with early detection with noninvasive diagnosis for a more patient-driven approach. For some patients as well as for dermatologists, the potential for increased efficiency of same-day diagnosis and treatment might provide a clear advantage.
- Rogers HW, Weinstock MA, Feldman SR, et al. Incidence estimate of nonmelanoma skin cancer (keratinocyte carcinomas) in the US population, 2012. JAMA Dermatol. 2015;151:1081-1086.
- Menzies SW, Westerhoff K, Rabinovitz H, et al. Surface microscopy of pigmented basal cell carcinoma. Arch Dermatol. 2000;136:1012-1016.
- Altamura D, Menzies SW, Argenziano G, et al. Dermatoscopy of basal cell carcinoma: morphologic variability of global and local features and accuracy of diagnosis. J Am Acad Dermatol. 2010;62:67-75.
- Rosendahl C, Tschandl P, Cameron A, et al. Diagnostic accuracy of dermatoscopy for melanocytic and nonmelanocytic pigmented lesions. J Am Acad Dermatol. 2011;64:1068-1073.
- Lallas A, Apalla Z, Ioannides D, et al. Dermoscopy in the diagnosis and management of basal cell carcinoma. Futur Oncol. 2015;11:2975-2984.
- Ulrich M, Lange-Asschenfeldt S, Gonzalez S. The use of reflectance confocal microscopy for monitoring response to therapy of skin malignancies. Dermatol Pract Concept. 2012;2:202a10.
- Kauvar AN, Cronin T Jr, Roenigk R, et al; American Society for Dermatologic Surgery. Consensus for nonmelanoma skin cancer treatment: basal cell carcinoma, including a cost analysis of treatment methods. Dermatol Surg. 2015;41:550-571.
- Hoorens I, Vossaert K, Ongenae K, et al. Is early detection of basal cell carcinoma worthwhile? Systematic review based on the WHO criteria for screening. Br J Dermatol. 2016;174:1258-1265.
- Levine A, Markowitz O. In vivo reflectance confocal microscopy. Cutis. 2017;99:399-402.
- Levine A, Wang K, Markowitz O. Optical coherence tomography in the diagnosis of skin cancer. Dermatol Clin. 2017;35:465-488.
- Pomerantz R, Zell D, McKenzie G, et al. Optical coherence tomography used as a modality to delineate basal cell carcinoma prior to Mohs micrographic surgery. Case Rep Dermatol. 2011;3:212-218.
- Alawi SA, Kuck M, Wahrlich C, et al. Optical coherence tomography for presurgical margin assessment of non-melanoma skin cancer - a practical approach. Exp Dermatol. 2013;22:547-551.
- Wang KX, Meekings A, Fluhr JW, et al. Optical coherence tomography-based optimization of Mohs micrographic surgery of basal cell carcinoma: a pilot study. Dermatol Surg. 2013;39:627-633.
- van Manen L, Dijkstra J, Boccara C, et al. The clinical usefulness of optical coherence tomography during cancer interventions. J Cancer Res Clin Oncol. 2018;144:1967-1990.
- Banzhaf CA, Themstrup L, Ring HC, et al. Optical coherence tomography imaging of non-melanoma skin cancer undergoing imiquimod therapy. Ski Res Technol. 2014;20:170-176.
- Markowitz O, Schwartz M. The use of noninvasive optical coherence tomography to monitor the treatment progress of vismodegib and imiquimod 5% cream in a transplant patient with advanced basal cell carcinoma of the nose. J Clin Aesthet Dermatol. 2016;9:37-41.
- Cheng HM, Guitera P. Systematic review of optical coherence tomography usage in the diagnosis and management of basal cell carcinoma. Br J Dermatol. 2015;173:1371-1380.
- Ulrich M, von Braunmuehl T, Kurzen H, et al. The sensitivity and specificity of optical coherence tomography for the assisted diagnosis of nonpigmented basal cell carcinoma: an observational study. Br J Dermatol. 2015;173:428-435.
- Markowitz O, Schwartz M, Feldman E, et al. Evaluation of optical coherence tomography as a means of identifying earlier stage basal cell carcinomas while reducing the use of diagnostic biopsy. J Clin Aesthet Dermatol. 2015;8:14-20.
- Mirza FN, Khatri KA. The use of lasers in the treatment of skin cancer: a review. J Cosmet Laser Ther. 2017;19:451-458.
- Soleymani T, Abrouk M, Kelly KM. An analysis of laser therapy for the treatment of nonmelanoma skin cancer. Dermatol Surg. 2017;43:615-624.
- Markowitz O, Tongdee E, Levine A. Optimal cosmetic outcomes for basal cell carcinoma: a retrospective study of nonablative laser management. Cutis. 2019;103:292-297.
- Jalian HR, Avram MM, Stankiewicz KJ, et al. Combined 585 nm pulsed-dye and 1,064 nm Nd:YAG lasers for the treatment of basal cell carcinoma. Lasers Surg Med. 2014;46:1-7.
- Moskalik K, Kozlov A, Demin E, et al. The efficacy of facial skin cancer treatment with high-energy pulsed neodymium and Nd:YAG lasers. Photomed Laser Surg. 2009;27:345-349.
- Moskalik K, Kozlow A, Demin E, et al. Powerful neodymium laser radiation for the treatment of facial carcinoma: 5 year follow-up data. Eur J Dermatol. 2010;20:738-742.
- Ortiz AE, Anderson RR, Avram MM. 1064 nm long-pulsed Nd:YAG laser treatment of basal cell carcinoma. Lasers Surg Med. 2015;47:106-110.
- Ortiz AE, Anderson RR, DiGiorgio C, et al. An expanded study of long-pulsed 1064 nm Nd:YAG laser treatment of basal cell carcinoma. Lasers Surg Med. 2018;50:727-731.
- Ahluwalia J, Avram MM, Ortiz AE. Outcomes of long-pulsed 1064 nm Nd:YAG laser treatment of basal cell carcinoma: a retrospective review. Lasers Surg Med. 2019;51:34-39.
- Markowitz O. A Practical Guide to Dermoscopy. Philadelphia, PA: Wolters Kluwer; 2017.
- Papakostas D, Stockfleth E. Topical treatment of basal cell carcinoma with the immune response modifier imiquimod. Futur Oncol. 2015;11:2985-2990.
- Jansen MHE, Mosterd K, Arits AHMM, et al. Five-year results of a randomized controlled trial comparing effectiveness of photodynamic therapy, topical imiquimod, and topical 5-fluorouracil in patients with superficial basal cell carcinoma. J Invest Dermatol. 2018;138:527-533.
- Kadouch DJ, Elshot YS, Zupan-Kajcovski B, et al. One-stop-shop with confocal microscopy imaging vs. standard care for surgical treatment of basal cell carcinoma: an open-label, noninferiority, randomized controlled multicentre trial. Br J Dermatol. 2017;177:735-741.
- Scrivener Y, Grosshans E, Cribier B. Variations of basal cell carcinomas according to gender, age, location and histopathological subtype. Br J Dermatol. 2002;147:41-47.
Practice Points
- Novel imaging modalities such as reflectance confocal microscopy and optical coherence tomography can be used to diagnose, monitor treatment response, and confirm clearance of basal cell carcinoma.
- Leveraging new imaging technologies can enable a streamlined patient experience, with same-day diagnosis and management of skin cancer.
- For patients who do not desire surgical management of nonmelanoma skin cancer, laser treatment with Nd:YAG is a promising emerging therapeutic option.
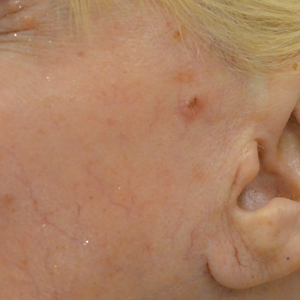
Millennials in Medicine: Cross-Trained Physicians Not Valued in Medical Marketplace
Millennials, defined as those born between 1981 and 1996, currently comprise 15% of all active physicians in the US.1,2 A recent survey found that nearly 4 of 5 US millennial physicians have a desire for cross-sectional work in areas beyond patient care, such as academic research, health care consulting, entrepreneurship, and health care administration.3
For employers and educators, a better understanding of these preferences, through consideration of the unique education and skill set of the millennial physician workforce, may lead to more effective recruitment of young physicians and improved health systems, avoiding a mismatch between health care provider skills and available jobs that can be costly for both employers and employees.4
This article describes how US millennial physicians are choosing to cross-train (obtaining multiple degrees and/or completing combined medical residency training) throughout undergraduate, medical, and graduate medical education. We also outline ways in which the current physician marketplace may not match the skills of this population and suggest some ways that health care organizations could capitalize on this trend toward more cross-trained personnel in order to effectively recruit and retain the next generation of physicians.
Millennial Education
Undergraduates
The number of interdisciplinary undergraduate majors increased by almost 250% from 1975 to 2000.5 In 2010, nearly 20% of US college students graduated with 2 majors, representing a 70% increase in double majors between 2001 and 2011.6,7 One emerging category of interdisciplinary majors in US colleges is health humanities programs, which have quadrupled since 2000.8
Medical school applicants and matriculants reflect this trend. Whereas in 1994, only 19% of applicants to medical school held nonscience degrees, about one-third of applicants now hold such degrees.9,10 We have found no aggregated data on double majors entering US medical schools, but public class profiles suggest that medical school matriculants mirror their undergraduate counterparts in their tendency to hold double majors. In 2016, for example, 15% of the incoming class at the University of Michigan Medical School was composed of double majors, increasing to over 25% in 2017.11
Medical Students
Early dual-degree programs in undergraduate medical training were reserved for MD/PhD programs.12 Most US MD/PhD programs (90 out of 151) now offer doctorates in social sciences, humanities, or other nontraditional fields of graduate medical study, reflecting a shift in interests of those seeking dual-degree training in undergraduate medical education.13 While only 3 MD/PhD programs in the 1970s included trainees in the social sciences, 17 such programs exist today.14
Interest in dual-degree programs offering master’s level study has also increased over the past decade. In 2017, 87 medical schools offered programs for students to pursue a master of public health (MPH) and 41 offered master of science degrees in various fields, up from 52 and 37 institutions, respectively in 2006.15 The number of schools offering combined training in nonscience fields has also grown, with 63 institutions now offering a master of business administration (MBA), nearly double the number offered in 2006.15 At some institutions more than 20% of students are earning a master’s degree or doctorate in addition to their MD degree.16
Residents
The authors found no documentation of US residency training programs, outside of those in the specialty of preventive medicine, providing trainees with formal opportunities to obtain an MBA or MPH prior to 2001.17 However, of the 510 internal medicine residency programs listed on the American Medical Association residency and fellowship database (freida.ama-assn.org), 45 identified as having established a pathway for residents to pursue an MBA, MPH, or PhD during residency.18
Over the past 20 years, combined residency programs have increased 49% (from 128 to 191), which is triple the 16% rate (1,350 to 1,562) of increase in programs in internal medicine, pediatrics, family medicine, psychiatry, and emergency medicine.19,20 A 2009 moratorium on the creation of new combined residency programs in psychiatry and neurology was lifted in 2016and is likely to increase the rate of total combined programs.21
The Table shows the number of categorical and combined residency programs available in 1996 and in 2016. Over 2 decades, 17 new specialty combinations became available for residency training. While there were no combined training programs within these 17 new combinations in 1996,there were 66 programs with these combinations in 2016.19,20
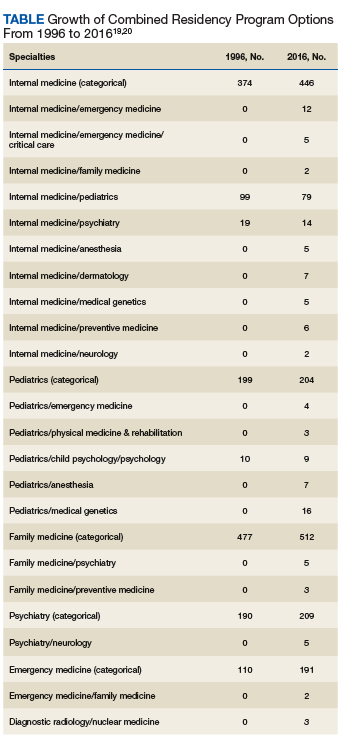
Although surgical specialties are notably absent from the list of combined residency options, likely due to the duration of surgical training, some surgical training programs do offer pathways that culminate in combined degrees,22 and a high number of surgery program directors agree that residents should receive formal training in business and practice management.23
The Medical Job Market
Although today’s young physicians are cross-trained in multiple disciplines, the current job market may not directly match these skill sets. Of the 7,235 jobs listed by the New England Journal of Medicine (NEJM) career center (www.nejmcareercenter.org/jobs), only 54 were targeted at those with combined training, the majority of which were aimed at those trained in internal medicine/pediatrics. Of the combined specialties in the Table, formal positions were listed for only 6.24 A search of nearly 1,500 federal medical positions on USAJOBS (www.usajobs.gov) found only 4 jobs that combined specialties, all restricted to internal medicine/pediatrics.25 When searching for jobs containing the terms MBA, MPH, and public health there were only 8 such positions on NEJM and 7 on USAJOBS.24,25 Although the totality of the medical marketplace may not be best encompassed by these sources, the authors believe NEJM and USAJOBS are somewhat representative of the opportunities for physicians in the US.
Medical jobs tailored to cross-trained physicians do not appear to have kept pace with the numbers of such specialists currently in medical school and residency training. Though millennials are cross-training in increasing numbers, we surmise that they are not doing so as a direct result of the job market.
Future Medicine
Regardless of the mismatch between cross-trained physicians and the current job market, millennials may be well suited for future health systems. In 2001, the National Academies of Sciences, Engineering and Medicine (NASEM) called for increasing interdisciplinary training and improving cross-functional team performance as a major goal for health care providers in twenty-first century health systems.26 NASEM also recommended that academic medical centers develop medical leaders who can manage systems changes required to enhance health, a proposal supported by the fact that hospitals with medically trained CEOs outperform others.27,28
Public Health 3.0, a federal initiative to improve and integrate public health efforts, also emphasizes cross-disciplinary teams and cross-sector partnerships,29 while the Centers for Medicare and Medicaid Services (CMS) has incentivized the development of interprofessional health care teams.30 While cross-training does not automatically connote interdisciplinary training, we believe that cross-training may reveal or develop an interdisciplinary mind-set that may support and embrace interdisciplinary performance. Finally, the US Department of Health and Human Services’ (HHS) Strategic Goals emphasize integrated care for vulnerable populations, something that cross-trained physicians may be especially poised to accomplish.31
A Path Forward
The education, training, and priorities of young physicians demonstrates career interests that diverge from mainstream, traditional options. Data provided herein describe the increasing rates at which millennial physicians are cross-training and have suggested that the current marketplace may not match the interests of this population. The ultimate question is where such cross-trained physicians fit into today’s (or tomorrow’s) health system?
It may be easiest to deploy cross-trained physicians in their respective clinical departments (eg, having a physician trained in internal medicine and pediatrics perform clinical duties in both a medicine department and a pediatrics department). But < 40% of dual-boarded physicians practice both specialties in which they’re trained, so other opportunities should be pursued.32,33 One strategy may be to embrace the promise of interdisciplinary care, as supported by Public Health 3.0 and NASEM.26,29 Our evidence may demonstrate that the interdisciplinary mind-set may be more readily evident in the millennial generation, and that this mind-set may improve interdisciplinary care.
As health is impacted both by direct clinical care as well as programs designed to address population health, cross-trained physicians may be better equipped to integrate aspects of clinical care spanning a variety of clinical fields as well as orchestrating programs designed to improve health at the population level. This mind-set may be best captured by organizations willing to adapt their medical positions to emphasize multidisciplinary training, skills, and capabilities. For example, a physician trained in internal medicine and psychiatry may have the unique training and skill-set to establish an integrated behavioral health clinic that crosses boundaries between traditional departments, emphasizing the whole health of the clinic’s population and not simply focusing on providing services of a particular specialty. Hiring cross-trained physicians throughout such a clinic may benefit the operations of the clinic and improve not only the services provided, but ultimately, the health of that clinic’s patients. By embracing cross-trained physicians, health care organizations and educators may better meet the needs of their employees, likely resulting in a more cost-effective investment for employers, employees, and the health system as a whole.4 Additionally, patient health may also improve.
There is evidence that cross-trained physicians are already likely to hold leadership positions compared with their categorically-trained counterparts, and this may reflect the benefits of an interdisciplinary mind-set.33 Perhaps a cross-trained physician is more likely to see beyond standard, specialty-based institutional barriers and develop processes and programs designed for overall patient benefit. Leadership is a skill that many millennials clearly wish to enhance throughout their career.34 Recruiting cross-trained physicians for leadership positions may reveal synergies between such training and an ability to lead health care organizations into the future.
Many millennial physicians are bringing a new set of skills into the medical marketplace. Health organizations should identify ways to recruit for these skills and deploy them within their systems in order to have more dedicated, engaged employees, more effective health systems, and ultimately, healthier patients.
Acknowledgments
Data from this analysis were presented at the 10th Consortium of Universities for Global Health conference in 2019.35
1. Dimock M. Defining generations: where millennials end and generation Z begins. http://www.pewresearch.org/fact-tank/2018/03/01/defining-generations-where-millennials-end-and-post-millennials-begin/. Published January 17, 2019. Accessed November 7, 2019.
2. IHS Inc. The complexities of physician supply and demand: projections from 2014 to 2025. Final report. https://www.modernhealthcare.com/assets/pdf/CH10888123.pdf. Published April 5, 2016. Accessed November 7, 2019.
3. Miller RN. Millennial physicians sound off on state of medicine today. https://wire.ama-assn.org/life-career/millennial-physicians-sound-state-medicine-today. Published March 27, 2017. Accessed November 7, 2019.
4. World Economic Forum. Matching skills and labour market needs: building social partnerships for better skills and better jobs. http://www3.weforum.org/docs/GAC/2014/WEF_GAC_Employment_MatchingSkillsLabourMarket_Report_2014.pdf. Published January 2014. Accessed November 7, 2019.
5. Brint SG, Turk-Bicakci L, Proctor K, Murphy SP. Expanding the social frame of knowledge: interdisciplinary, degree-granting fields in American Colleges and Universities, 1975–2000. Rev High Ed. 2009;32(2):155-183.
6. National Science Foundation. National survey of college graduates. https://www.nsf.gov/statistics/srvygrads. Updated February 2019. Accessed November 7, 2019.
7. Simon CC. Major decisions. New York Times. November 2, 2012. http://www.nytimes.com/2012/11/04/education/edlife/choosing-one-college-major-out-of-hundreds.html. Accessed November 7, 2019.
8. Berry SL, Erin GL, Therese J. Health humanities baccalaureate programs in the United States. http://www.hiram.edu/wp-content/uploads/2017/09/HHBP2017.pdf. Published September 2017. Accessed November 7, 2019.
9. Sorensen NE, Jackson JR. Science majors and nonscience majors entering medical school: acceptance rates and academic performance. NACADA J. 1997;17(1):32-41.
10. Association of American Medical Colleges. Table A-17: MCAT and GPAs for applicants and matriculants to U.S. medical schools by primary undergraduate major, 2019-2020. https://www.aamc.org/download/321496/data/factstablea17.pdf. Published October 16, 2019. Accessed November 7, 2019.
11. University of Michigan Medical School. Many paths, one destination: medical school welcomes its 170th class of medical students. https://medicine.umich.edu/medschool/news/many-paths-one-destination-medical-school-welcomes-its-170th-class-medical-students. Updated July 29, 2016. Accessed November 7, 2019.
12. Harding CV, Akabas MH, Andersen OS. History and outcomes of 50 years of physician-scientist training in medical scientist training programs. Acad Med. 2017; 92(10):1390-1398.
13. Association of American Medical Colleges. MD-PhD in “social sciences or humanities” and “other non-traditional fields of graduate study” - by school. https://students-residents.aamc.org/choosing-medical-career/careers-medical-research/md-phd-dual-degree-training/non-basic-science-phd-training-school/. Accessed November 8, 2019.
14. Holmes SM, Karlin J, Stonington SD, Gottheil DL. The first nationwide survey of MD-PhDs in the social sciences and humanities: training patterns and career choices. BMC Med Educ. 2017;17(1):60.
15. Association of American Medical Colleges Combined degrees and early acceptance programs. https://www.aamc.org/data-reports/curriculum-reports/interactive-data/combined-degrees-and-early-acceptance-programs. Accessed November 8, 2019.
16. Tufts University School of Medicine. 2023 class profile. http://medicine.tufts.edu/Education/MD-Programs/Doctor-of-Medicine/Class-Profile. Published 2015. Accessed November 8, 2019.
17. Zweifler J, Evan R. Development of a residency/MPH program. Family Med. 2001;33(6):453-458.
18. American Medical Association. The AMA residency and fellowship database. http://freida.ama-assn.org/Freida. Accessed November 7, 2019.
19. National Resident Matching Program. NRMP data. http://www.nrmp.org/wp-content/uploads/2013/08/resultsanddata1996.pdf. Published March 1996. Accessed November 7, 2019.
20. Brotherton SE, Etzel SI. Graduate medical education, 2016-2017. JAMA. 2017;318(23):2368-2387.
21. American Board of Psychiatry and Neurology. Update for psychiatry GME programs on combined training program accreditation/approval February 2012. https://www.umassmed.edu/globalassets/neuropsychiatry/files/combined-program-letter.pdf. Accessed November 7, 2019.
22. Massachusetts General Hospital. Surgical residency program. https://www.massgeneral.org/surgery/education/residency.aspx?id=77. Accessed November 7, 2019.
23. Lusco VC, Martinez SA, Polk HC Jr. Program directors in surgery agree that residents should be formally trained in business and practice management. Am J Surg. 2005;189(1):11-13.
24. New England Journal of Medicine. NEJM CareerCenter. http://www.nejmcareercenter.org. Accessed November 7, 2019.
25. US Office of Personnel Management. USAJOBS. https://www.usajobs.gov. Accessed November 7, 2019.
26. Institute of Medicine. Crossing the quality chasm: a new health system for the 21st century. http://www.nationalacademies.org/hmd/~/media/Files/Report%20Files/2001/Crossing-the-Quality-Chasm/Quality%20Chasm%202001%20%20report%20brief.pdf. Published March 2001. Accessed November 7, 2019.
27. Kohn LT, ed; Committee on the Roles of Academic Health Centers in the 21st Century; Institute of Medicine of the National Academies. Academic Health Centers: Leading Change in the 21st Century. National Academy Press: Washington, DC; 2004.
28. Goodall AH. Physician-leaders and hospital performance: is there an association? http://ftp.iza.org/dp5830.pdf. Published July 2011. Accessed November 7, 2019.
29. US Department of Health and Human Services, Office of the Assistant Secretary for Health. Public health 3.0: a call to action to create a 21st century public health infrastructure. https://www.healthypeople.gov/sites/default/files/Public-Health-3.0-White-Paper.pdf. Accessed November 7, 2019.
30. Centers for Medicare and Medicaid Services. Health care innovation awards round one project profiles. http://innovation.cms.gov/files/x/hcia-project-profiles.pdf. Updated December 2013. Accessed November 7, 2019.
31. US Department of Health and Human Services. Strategic Objective 1.3: Improve Americans’ access to healthcare and expand choices of care and service options. https://www.hhs.gov/about/strategic-plan/strategic-goal-1/index.html#obj_1_3. Updated March 18, 2019. Accessed November 7, 2019.
32. Kessler CS, Stallings LA, Gonzalez AA, Templeman TA. Combined residency training in emergency medicine and internal medicine: an update on career outcomes and job satisfaction. Acad Emerg Med. 2009;16(9):894-899.
33. Summergrad P, Silberman E, Price LL. Practice and career outcomes of double-boarded psychiatrists. Psychosomatics. 2011;52(6):537-543.
34. Rigoni B, Adkins A. What millennials want from a new job. Harvard Business Rev. May 11, 2016. https://hbr.org/2016/05/what-millennials-want-from-a-new-job. Accessed November 7, 2019.
35. Jung P, Smith C. Medical millennials: a mismatch between training preferences and employment opportunities. Lancet Glob Health. 2019;7(suppl 1):S38.
Millennials, defined as those born between 1981 and 1996, currently comprise 15% of all active physicians in the US.1,2 A recent survey found that nearly 4 of 5 US millennial physicians have a desire for cross-sectional work in areas beyond patient care, such as academic research, health care consulting, entrepreneurship, and health care administration.3
For employers and educators, a better understanding of these preferences, through consideration of the unique education and skill set of the millennial physician workforce, may lead to more effective recruitment of young physicians and improved health systems, avoiding a mismatch between health care provider skills and available jobs that can be costly for both employers and employees.4
This article describes how US millennial physicians are choosing to cross-train (obtaining multiple degrees and/or completing combined medical residency training) throughout undergraduate, medical, and graduate medical education. We also outline ways in which the current physician marketplace may not match the skills of this population and suggest some ways that health care organizations could capitalize on this trend toward more cross-trained personnel in order to effectively recruit and retain the next generation of physicians.
Millennial Education
Undergraduates
The number of interdisciplinary undergraduate majors increased by almost 250% from 1975 to 2000.5 In 2010, nearly 20% of US college students graduated with 2 majors, representing a 70% increase in double majors between 2001 and 2011.6,7 One emerging category of interdisciplinary majors in US colleges is health humanities programs, which have quadrupled since 2000.8
Medical school applicants and matriculants reflect this trend. Whereas in 1994, only 19% of applicants to medical school held nonscience degrees, about one-third of applicants now hold such degrees.9,10 We have found no aggregated data on double majors entering US medical schools, but public class profiles suggest that medical school matriculants mirror their undergraduate counterparts in their tendency to hold double majors. In 2016, for example, 15% of the incoming class at the University of Michigan Medical School was composed of double majors, increasing to over 25% in 2017.11
Medical Students
Early dual-degree programs in undergraduate medical training were reserved for MD/PhD programs.12 Most US MD/PhD programs (90 out of 151) now offer doctorates in social sciences, humanities, or other nontraditional fields of graduate medical study, reflecting a shift in interests of those seeking dual-degree training in undergraduate medical education.13 While only 3 MD/PhD programs in the 1970s included trainees in the social sciences, 17 such programs exist today.14
Interest in dual-degree programs offering master’s level study has also increased over the past decade. In 2017, 87 medical schools offered programs for students to pursue a master of public health (MPH) and 41 offered master of science degrees in various fields, up from 52 and 37 institutions, respectively in 2006.15 The number of schools offering combined training in nonscience fields has also grown, with 63 institutions now offering a master of business administration (MBA), nearly double the number offered in 2006.15 At some institutions more than 20% of students are earning a master’s degree or doctorate in addition to their MD degree.16
Residents
The authors found no documentation of US residency training programs, outside of those in the specialty of preventive medicine, providing trainees with formal opportunities to obtain an MBA or MPH prior to 2001.17 However, of the 510 internal medicine residency programs listed on the American Medical Association residency and fellowship database (freida.ama-assn.org), 45 identified as having established a pathway for residents to pursue an MBA, MPH, or PhD during residency.18
Over the past 20 years, combined residency programs have increased 49% (from 128 to 191), which is triple the 16% rate (1,350 to 1,562) of increase in programs in internal medicine, pediatrics, family medicine, psychiatry, and emergency medicine.19,20 A 2009 moratorium on the creation of new combined residency programs in psychiatry and neurology was lifted in 2016and is likely to increase the rate of total combined programs.21
The Table shows the number of categorical and combined residency programs available in 1996 and in 2016. Over 2 decades, 17 new specialty combinations became available for residency training. While there were no combined training programs within these 17 new combinations in 1996,there were 66 programs with these combinations in 2016.19,20
Although surgical specialties are notably absent from the list of combined residency options, likely due to the duration of surgical training, some surgical training programs do offer pathways that culminate in combined degrees,22 and a high number of surgery program directors agree that residents should receive formal training in business and practice management.23
The Medical Job Market
Although today’s young physicians are cross-trained in multiple disciplines, the current job market may not directly match these skill sets. Of the 7,235 jobs listed by the New England Journal of Medicine (NEJM) career center (www.nejmcareercenter.org/jobs), only 54 were targeted at those with combined training, the majority of which were aimed at those trained in internal medicine/pediatrics. Of the combined specialties in the Table, formal positions were listed for only 6.24 A search of nearly 1,500 federal medical positions on USAJOBS (www.usajobs.gov) found only 4 jobs that combined specialties, all restricted to internal medicine/pediatrics.25 When searching for jobs containing the terms MBA, MPH, and public health there were only 8 such positions on NEJM and 7 on USAJOBS.24,25 Although the totality of the medical marketplace may not be best encompassed by these sources, the authors believe NEJM and USAJOBS are somewhat representative of the opportunities for physicians in the US.
Medical jobs tailored to cross-trained physicians do not appear to have kept pace with the numbers of such specialists currently in medical school and residency training. Though millennials are cross-training in increasing numbers, we surmise that they are not doing so as a direct result of the job market.
Future Medicine
Regardless of the mismatch between cross-trained physicians and the current job market, millennials may be well suited for future health systems. In 2001, the National Academies of Sciences, Engineering and Medicine (NASEM) called for increasing interdisciplinary training and improving cross-functional team performance as a major goal for health care providers in twenty-first century health systems.26 NASEM also recommended that academic medical centers develop medical leaders who can manage systems changes required to enhance health, a proposal supported by the fact that hospitals with medically trained CEOs outperform others.27,28
Public Health 3.0, a federal initiative to improve and integrate public health efforts, also emphasizes cross-disciplinary teams and cross-sector partnerships,29 while the Centers for Medicare and Medicaid Services (CMS) has incentivized the development of interprofessional health care teams.30 While cross-training does not automatically connote interdisciplinary training, we believe that cross-training may reveal or develop an interdisciplinary mind-set that may support and embrace interdisciplinary performance. Finally, the US Department of Health and Human Services’ (HHS) Strategic Goals emphasize integrated care for vulnerable populations, something that cross-trained physicians may be especially poised to accomplish.31
A Path Forward
The education, training, and priorities of young physicians demonstrates career interests that diverge from mainstream, traditional options. Data provided herein describe the increasing rates at which millennial physicians are cross-training and have suggested that the current marketplace may not match the interests of this population. The ultimate question is where such cross-trained physicians fit into today’s (or tomorrow’s) health system?
It may be easiest to deploy cross-trained physicians in their respective clinical departments (eg, having a physician trained in internal medicine and pediatrics perform clinical duties in both a medicine department and a pediatrics department). But < 40% of dual-boarded physicians practice both specialties in which they’re trained, so other opportunities should be pursued.32,33 One strategy may be to embrace the promise of interdisciplinary care, as supported by Public Health 3.0 and NASEM.26,29 Our evidence may demonstrate that the interdisciplinary mind-set may be more readily evident in the millennial generation, and that this mind-set may improve interdisciplinary care.
As health is impacted both by direct clinical care as well as programs designed to address population health, cross-trained physicians may be better equipped to integrate aspects of clinical care spanning a variety of clinical fields as well as orchestrating programs designed to improve health at the population level. This mind-set may be best captured by organizations willing to adapt their medical positions to emphasize multidisciplinary training, skills, and capabilities. For example, a physician trained in internal medicine and psychiatry may have the unique training and skill-set to establish an integrated behavioral health clinic that crosses boundaries between traditional departments, emphasizing the whole health of the clinic’s population and not simply focusing on providing services of a particular specialty. Hiring cross-trained physicians throughout such a clinic may benefit the operations of the clinic and improve not only the services provided, but ultimately, the health of that clinic’s patients. By embracing cross-trained physicians, health care organizations and educators may better meet the needs of their employees, likely resulting in a more cost-effective investment for employers, employees, and the health system as a whole.4 Additionally, patient health may also improve.
There is evidence that cross-trained physicians are already likely to hold leadership positions compared with their categorically-trained counterparts, and this may reflect the benefits of an interdisciplinary mind-set.33 Perhaps a cross-trained physician is more likely to see beyond standard, specialty-based institutional barriers and develop processes and programs designed for overall patient benefit. Leadership is a skill that many millennials clearly wish to enhance throughout their career.34 Recruiting cross-trained physicians for leadership positions may reveal synergies between such training and an ability to lead health care organizations into the future.
Many millennial physicians are bringing a new set of skills into the medical marketplace. Health organizations should identify ways to recruit for these skills and deploy them within their systems in order to have more dedicated, engaged employees, more effective health systems, and ultimately, healthier patients.
Acknowledgments
Data from this analysis were presented at the 10th Consortium of Universities for Global Health conference in 2019.35
1. Dimock M. Defining generations: where millennials end and generation Z begins. http://www.pewresearch.org/fact-tank/2018/03/01/defining-generations-where-millennials-end-and-post-millennials-begin/. Published January 17, 2019. Accessed November 7, 2019.
2. IHS Inc. The complexities of physician supply and demand: projections from 2014 to 2025. Final report. https://www.modernhealthcare.com/assets/pdf/CH10888123.pdf. Published April 5, 2016. Accessed November 7, 2019.
3. Miller RN. Millennial physicians sound off on state of medicine today. https://wire.ama-assn.org/life-career/millennial-physicians-sound-state-medicine-today. Published March 27, 2017. Accessed November 7, 2019.
4. World Economic Forum. Matching skills and labour market needs: building social partnerships for better skills and better jobs. http://www3.weforum.org/docs/GAC/2014/WEF_GAC_Employment_MatchingSkillsLabourMarket_Report_2014.pdf. Published January 2014. Accessed November 7, 2019.
5. Brint SG, Turk-Bicakci L, Proctor K, Murphy SP. Expanding the social frame of knowledge: interdisciplinary, degree-granting fields in American Colleges and Universities, 1975–2000. Rev High Ed. 2009;32(2):155-183.
6. National Science Foundation. National survey of college graduates. https://www.nsf.gov/statistics/srvygrads. Updated February 2019. Accessed November 7, 2019.
7. Simon CC. Major decisions. New York Times. November 2, 2012. http://www.nytimes.com/2012/11/04/education/edlife/choosing-one-college-major-out-of-hundreds.html. Accessed November 7, 2019.
8. Berry SL, Erin GL, Therese J. Health humanities baccalaureate programs in the United States. http://www.hiram.edu/wp-content/uploads/2017/09/HHBP2017.pdf. Published September 2017. Accessed November 7, 2019.
9. Sorensen NE, Jackson JR. Science majors and nonscience majors entering medical school: acceptance rates and academic performance. NACADA J. 1997;17(1):32-41.
10. Association of American Medical Colleges. Table A-17: MCAT and GPAs for applicants and matriculants to U.S. medical schools by primary undergraduate major, 2019-2020. https://www.aamc.org/download/321496/data/factstablea17.pdf. Published October 16, 2019. Accessed November 7, 2019.
11. University of Michigan Medical School. Many paths, one destination: medical school welcomes its 170th class of medical students. https://medicine.umich.edu/medschool/news/many-paths-one-destination-medical-school-welcomes-its-170th-class-medical-students. Updated July 29, 2016. Accessed November 7, 2019.
12. Harding CV, Akabas MH, Andersen OS. History and outcomes of 50 years of physician-scientist training in medical scientist training programs. Acad Med. 2017; 92(10):1390-1398.
13. Association of American Medical Colleges. MD-PhD in “social sciences or humanities” and “other non-traditional fields of graduate study” - by school. https://students-residents.aamc.org/choosing-medical-career/careers-medical-research/md-phd-dual-degree-training/non-basic-science-phd-training-school/. Accessed November 8, 2019.
14. Holmes SM, Karlin J, Stonington SD, Gottheil DL. The first nationwide survey of MD-PhDs in the social sciences and humanities: training patterns and career choices. BMC Med Educ. 2017;17(1):60.
15. Association of American Medical Colleges Combined degrees and early acceptance programs. https://www.aamc.org/data-reports/curriculum-reports/interactive-data/combined-degrees-and-early-acceptance-programs. Accessed November 8, 2019.
16. Tufts University School of Medicine. 2023 class profile. http://medicine.tufts.edu/Education/MD-Programs/Doctor-of-Medicine/Class-Profile. Published 2015. Accessed November 8, 2019.
17. Zweifler J, Evan R. Development of a residency/MPH program. Family Med. 2001;33(6):453-458.
18. American Medical Association. The AMA residency and fellowship database. http://freida.ama-assn.org/Freida. Accessed November 7, 2019.
19. National Resident Matching Program. NRMP data. http://www.nrmp.org/wp-content/uploads/2013/08/resultsanddata1996.pdf. Published March 1996. Accessed November 7, 2019.
20. Brotherton SE, Etzel SI. Graduate medical education, 2016-2017. JAMA. 2017;318(23):2368-2387.
21. American Board of Psychiatry and Neurology. Update for psychiatry GME programs on combined training program accreditation/approval February 2012. https://www.umassmed.edu/globalassets/neuropsychiatry/files/combined-program-letter.pdf. Accessed November 7, 2019.
22. Massachusetts General Hospital. Surgical residency program. https://www.massgeneral.org/surgery/education/residency.aspx?id=77. Accessed November 7, 2019.
23. Lusco VC, Martinez SA, Polk HC Jr. Program directors in surgery agree that residents should be formally trained in business and practice management. Am J Surg. 2005;189(1):11-13.
24. New England Journal of Medicine. NEJM CareerCenter. http://www.nejmcareercenter.org. Accessed November 7, 2019.
25. US Office of Personnel Management. USAJOBS. https://www.usajobs.gov. Accessed November 7, 2019.
26. Institute of Medicine. Crossing the quality chasm: a new health system for the 21st century. http://www.nationalacademies.org/hmd/~/media/Files/Report%20Files/2001/Crossing-the-Quality-Chasm/Quality%20Chasm%202001%20%20report%20brief.pdf. Published March 2001. Accessed November 7, 2019.
27. Kohn LT, ed; Committee on the Roles of Academic Health Centers in the 21st Century; Institute of Medicine of the National Academies. Academic Health Centers: Leading Change in the 21st Century. National Academy Press: Washington, DC; 2004.
28. Goodall AH. Physician-leaders and hospital performance: is there an association? http://ftp.iza.org/dp5830.pdf. Published July 2011. Accessed November 7, 2019.
29. US Department of Health and Human Services, Office of the Assistant Secretary for Health. Public health 3.0: a call to action to create a 21st century public health infrastructure. https://www.healthypeople.gov/sites/default/files/Public-Health-3.0-White-Paper.pdf. Accessed November 7, 2019.
30. Centers for Medicare and Medicaid Services. Health care innovation awards round one project profiles. http://innovation.cms.gov/files/x/hcia-project-profiles.pdf. Updated December 2013. Accessed November 7, 2019.
31. US Department of Health and Human Services. Strategic Objective 1.3: Improve Americans’ access to healthcare and expand choices of care and service options. https://www.hhs.gov/about/strategic-plan/strategic-goal-1/index.html#obj_1_3. Updated March 18, 2019. Accessed November 7, 2019.
32. Kessler CS, Stallings LA, Gonzalez AA, Templeman TA. Combined residency training in emergency medicine and internal medicine: an update on career outcomes and job satisfaction. Acad Emerg Med. 2009;16(9):894-899.
33. Summergrad P, Silberman E, Price LL. Practice and career outcomes of double-boarded psychiatrists. Psychosomatics. 2011;52(6):537-543.
34. Rigoni B, Adkins A. What millennials want from a new job. Harvard Business Rev. May 11, 2016. https://hbr.org/2016/05/what-millennials-want-from-a-new-job. Accessed November 7, 2019.
35. Jung P, Smith C. Medical millennials: a mismatch between training preferences and employment opportunities. Lancet Glob Health. 2019;7(suppl 1):S38.
Aging and Trauma: Post Traumatic Stress Disorder Among Korean War Veterans
The Korean War lasted from June 25, 1950 through July 27, 1953. Although many veterans of the Korean War experienced traumas during extremely stressful combat conditions. However, they would not have been diagnosed with posttraumatic stress disorder (PTSD) at the time because the latter did not exist as a formal diagnosis until the publication of the third edition of the Diagnostic and Statistical Manual (DSM) in 1980.1 Prior to 1980, psychiatric syndromes resulting from war and combat exposure where known by numerous other terms including shell shock, chronic traumatic war neurosis, and combat fatigue/combat exhaustion.2,3 Military psychiatrists attended to combat fatigue during the course of the Korean War, but as was true of World War I and II, the focus was on returning soldiers to duty. Combat fatigue was generally viewed as a transient condition.4-8
Although now octo- and nonagenarians, in 2019 there are 1.2 million living Korean War veterans in the US, representing 6.7% of all current veterans.9 Understanding their war experiences and the nature of their current and past presentation of PTSD is relevant not only in formal mental health settings, but in primary care settings, including home-based primary care, as well as community living centers, skilled nursing facilities and assisted living facilities. Older adults with PTSD often present with somatic concerns rather than spontaneously reporting mental health symptoms.10 Beyond the short-term clinical management of Korean War veterans with PTSD, consideration of their experiences also has long-term relevance for the appropriate treatment of other veteran cohorts as they age in coming decades.
The purpose of this article is to provide a clinically focused overview of PTSD in Korean War veterans, to help promote understanding of this often-forgotten group of veterans, and to foster optimized personalized care. This overview will include a description of the Korean War veteran population and the Korean War itself, the manifestations and identification of PTSD among Korean War veterans, and treatment approaches using evidence-based psychotherapies and pharmacotherapies. Finally, we provide recommendations for future research to address present empirical gaps in the understanding and treatment of Korean War veterans with PTSD.
Causes and Course of the Korean War
When working with Korean War veterans it is important to consider the special nature of that specific conflict. Space considerations limit our ability to do justice to the complex history and numerous battles of the Korean War, but information in the following summary was gleaned from several excellent histories.11-13
The Korean War has been referred to as The Forgotten War, a concern expressed even during the latter parts of the war.14,15 But the war and its veterans warrant remembering. The root and proximal causes of the Korean War are complex and not fully agreed upon by the main participants.16-19 In part this may reflect the fact that there was no clear victor in the Korean War, so that the different protagonists have developed their own versions of the history of the conflict. Also, US involvement and the public reaction to the war must be viewed within the larger historical context of that time. This context included the recent end of 4 years of US involvement in World War II (1941-1945) and the subsequent rapid rise of Cold War tensions between the US and the Soviet Union. The latter also included a worldwide fear of nuclear war and the US fear of the global spread of communism. These fears were fueled by the Soviet-led Berlin Blockade from June 1948 through May 1949, the Soviet Union’s successful atomic bomb test in August 1949, the founding of the People’s Republic of China in October 1949, and the February 1950 Sino-Soviet Treaty of Friendship and Alliance.13
In the closing days of World War II, the US and Soviet Union agreed to a temporary division of Korea along the 38th parallel to facilitate timely and efficient surrender of Japanese troops. But as Cold War tensions rose, the temporary division became permanent, and Soviet- and US-backed governments of the north and south, respectively, were officially established on the Korean peninsula in 1948. Although by 1949 the Soviets and US had withdrawn most troops from the peninsula, tensions between the north and south continued to mount and hostilities increased. To this day the exact causes of the eruption of war remain disputed, although it is clear that ideological as well as economic factors played a role, and both leaders of North and South Korea were pledging to reunite the peninsula under their respective leadership.16-19 The tension culminated on June 25, 1950, when North Korean troops crossed the 38th parallel and invaded South Korea. On June 27, 1950, President Truman ordered US naval and air forces to support South Korea and then ordered the involvement of ground troops on June 30.16,17,19
Although several other member countries of the United Nations (UN) provided troops, 90% of the troops were from the US. About 5.7 million US military personnel served during the war, including about 1.8 million in Korea itself. The US forces experienced approximately 34,000 battle-related deaths, 103,000 were wounded, and 7,000 were prisoners of war (POWs).11,20-22 The nature and events of the Korean War made it particularly stressful and traumatizing for the soldiers, sailors, and marines involved throughout its entire course. These included near defeat in the early months, a widely alternating war front along the north/south axis during the first year, and subsequently, not only intense constant battles on the fronts, but also a demanding and exhausting guerrilla war in the south, which lasted throughout the remainder of the conflict.11,15 The US troops during the initial months of the war have been described as outnumbered and underprepared, as many in the initial phase were reassigned from peace-time occupation duty in Japan.7
The first year of war was characterized by a repeated north-to-south/south-to-north shifts in control of territory. During the first 3 months, the North Korean forces overwhelmed the South and captured control of all but 2 South Korean cities in the far southeastern region (Pusan, now Busan; and Daegu), and US and UN forces were forced to retreat to the perimeter around Pusan. The intense Battle of Pusan Perimeter lasted from August 4, 1950 to September 18, 1950, and resulted in massive causalities as well as a flood of civilian refugees.
The course of the war began to change in early September 1950 with the landing of amphibious US/UN forces at Inchon, behind North Korean lines, which cut off southern supply routes for the North Korean troops.11 US/UN forces soon crossed to the north of the 38th parallel and captured the North Korean capital, Pyongyang, on October 19, 1950. They continued to push north and approached the Yalu River border with China by late November 1950, but then the Chinese introduced their own troops forcing a southward retreat of US/UN troops during which there were again numerous US/UN casualties. Chinese troops retook Seoul in late December 1950/early January 1951. However, the US/UN forces soon recaptured Seoul and advanced back to the 38th parallel. This back-and-forth across the 38th parallel continued until July 1951 when the front line of battle stabilized there. Although the line stabilized, intense battles and casualties continued for 2 more years. During this period US/UN troops also had to deal with guerrilla warfare behind the front lines due to the actions of communist partisans and isolated North Korean troops. This situation continued until the armistice was signed July 27, 1953.
Trauma and Characteristic Stresses of the War
There were many factors that made the Korean War experience different from previous wars, particularly World War II. For example, in contrast to the strong public support during and after World War II, public support for the Korean War in the US was low, particularly during its final year.23 In public opinion polls from October 1952 through April 1953, only 23% to 39% reported feeling that the war was worth fighting.23 A retrospective 1985 survey also found that 70% of World War II veterans, but only 33% of Korean War veterans reported feeling appreciated by the US public on their return from the war.24
Those fighting in the initial months of the war faced a particularly grim situation. According to LTC Philip Smith, who served as Division Psychiatrist on the Masan Front (Pusan Perimeter) during August and September of 1950, “Fighting was almost continuous and all available troops were on the fighting front… For the most part these soldiers were soft from occupation duty, many had not received adequate combat basic training, no refresher combat training in Korea had as yet been instituted,” he reported.7 “The extremes of climate coupled with the generally rugged mountainous terrain in Korea were physical factors of importance…These men were psychologically unprepared for the horrors and isolation of war.” LTC Smith noted that the change in status from civilian or occupation life to the marked deprivation of the war in Korea had been “too abrupt to allow as yet for a reasonable adjustment to the new setting” and that as a result “the highest rate of wounded and neuropsychiatric casualties in the Korean campaign resulted.”7

Even after this initial period, the nature of the shifting war, the challenging terrain, the high military casualty rate, and the high rate of civilian casualties and displacement continued throughout the war.
PTSD in Korean War Veterans
It is clear that Korean War combat veterans were exposed to traumatic events. It is unknown how many developed PTSD. While notions of psychological distress and disability related to combat trauma exposure have existed for centuries, Korean War and World War II veterans are a remaining link to pre-DSM PTSD mental health in the military. Military/forward psychiatry—psychiatric services near the battle zone rather than requiring evacuation of patients—was present in Korea from the early months of the war, but the focus of forward psychiatry was to reduce psychiatric causalities from combat fatigue and maximize rapid return-to-duty.4-6 With no real conception of PTSD, there were limited treatments available, and evidenced-based trauma-focused treatments for PTSD would not be introduced for at least another 4 decades.27-29
Skinner and Kaplick conducted a historical review of case descriptions of trauma-related conditions from World War I through the Vietnam War and noted the consistent inclusion of hyperarousal and intrusive symptoms, although there also was a greater emphasis on somatic conversion or hysteria symptoms in the earlier descriptions.30 By the Korean War, descriptions of combat fatigue included a number of symptoms that overlap with PTSD, including preoccupation with the traumatic stressor, nightmares, irritability/anger, increased startle, and hyperarousal.31 But following the acute phases, attention to any chronic problems associated with these conditions waned. As was acknowledged by a military psychiatrist in a 1954 talk, studies of the long-term adjustment of those who had “broken down in combat” were sorely needed.6 In a small 1965 study reported by Archibald and Tuddenham, persistent symptoms of combat fatigue among Korean War veterans were definitely present, and there was even a suggestion that the symptoms had increased over the decade since the war.32
Given the stoicism that typified cultural expectations for military men during this period, Korean War veterans may also have been reluctant to seek mental health treatment either at the time or later. In short, it is likely that a nontrivial proportion of Korean War veterans with PTSD were underdiagnosed and received suboptimal or no mental health treatment for decades following their war experiences.33 Although the nature of the war, deployment, and public support were distinct in World War II vs the Korean War, the absence of attention to the long-term effects of disorders related to combat trauma and the cultural expectations for stoicism suggest that PTSD among aging World War II veterans may also have gone underrecognized and undertreated.
Apart from the lack of interest in chronic effects of stressors, another problem that has plagued the limited empirical research on Korean War veterans has been the propensity to combine Korean War with World War II veteran samples in studies. Because World War II veterans have outnumbered Korean War veterans until recently, combined samples tended to have relatively few Korean War veterans. Nevertheless, from those studies that have been reported in which 2 groups were compared, important differences have been revealed. Specifically, although precise estimates of the prevalence of PTSD among Korean War combat veterans have varied depending on sampling and method, studies from the 1990s and early 2000s suggested that the prevalence of PTSD and other mental health concerns as well as the severity of symptoms, suicide risk, and psychosocial adjustment difficulties were worse among Korean War combat veterans relative to those among World War II combat veterans; however, both groups had lower prevalence than did Vietnam War combat veterans.21,34-37 Several authors speculated that these differences in outcome were at least partially due to differences in public support for the respective wars.36,37
Although there has been a paucity of research on psychiatric issues and PTSD in Korean War veterans, POWs who were very likely to have been exposed to extreme psychological traumas have received some attention. There have been comparisons of mortality and morbidity among POWs from the Korean War (PWK), World War II Pacific Theater (PWJ), and Europe (PWE).38 Among measures that were administered to the former POWs, the overall pattern seen from survey data in the mid-1960s revealed significantly worse health and functioning among the PWK and PWJ groups relative to the PWE group, with psychiatric difficulties being the most commonly reported impairments among the former 2 groups. This pattern was found most strongly with regards to objective measures, such as hospitalizations for “psychoneuroses,” and US Department of Veterans Affairs (VA) disability records, as well as based on self-reported psychosocial/recreational difficulties measured using the Cornell Medical Index (CMI).38
Gold and colleagues reported a follow-up study of more than 700 former POWs who were reinterviewed between 1989 and 1992.39 Although there was no scale of PTSD symptoms prior to formulation of the diagnosis in 1980, the CMI was a self-reported checklist that included a large range of both medical as well as behavioral and psychiatric symptoms. Thus, using CMI survey responses from 1965, the authors examined the factor structure (ie, the correlational relationships between multiple scale items and subgroupings of items) of the CMI relative to diagnosis of PTSD in 1989 to 1992 based on results from the Structured Clinical Interview for the DSM-III-R (SCID). The intent was to help discern whether the component domains of PTSD were present and intercorrelated in a pattern similar to that of the contemporary diagnosis. The investigators examined the factor structure of 20 psychological items from the CMI that appeared relevant to PTSD criteria using the 1965 data. Three factors (subgroups of highly intercorrelated items) were found: irritability (31% of variance), fearfulness/anxiousness (9% of the variance), and social withdrawal (7% of the variance). Although these did not directly correspond to, or fully cover, DSM PTSD domains or criteria, there does appear to be a thematic resemblance of the CMI findings with PTSD, including alterations in arousal and mood, vigilance, and startle.
Identification and Treatment of PTSD in Older Veterans
Of the 1.2 million living Korean War veterans in the US, 36.3% use VA provided health care.40 There are a number of complicating factors to consider in the current identification and treatment of PTSD in this cohort, including their advanced age; physical, cognitive, and social changes associated with normal aging; the associated medical and cognitive comorbidities; and the specific social-contextual factors in that age cohort. Any combination of these factors may complicate recognition, diagnosis, and treatment. It is also important to be cognizant of the additional stressors that may have been experienced by ethnic minorites and women serving in Korea, which are poorly documented and studied. Racial integration of the US military began during the Korean War, but the general pattern was for African American soldiers to be assigned to all-white units, rather than the reverse.14,41,42 And although the majority of military personnel serving in Korea were male, there were women serving in health care positions at mobile army surgical hospital (MASH) units, medical air evacuation (Medevac) aircraft, and off-shore hospital ships.
The clinical presentation of PTSD in older adults has varied, which may partially relate to the time elapsed since the index trauma. For example, older veterans in general may show less avoidance behavior as a part of PTSD, but in those who experience trauma later in life there may actually be greater avoidance.43,44 There have also been discrepant reports of intrusion or reexperiencing of symptoms, with these also potentially reduced in older veterans.43,44 However, sleep disturbances seem to be very common among elderly combat veterans, and attention should be paid to the possible presence of sleep apnea, which may be more common in veterans with PTSD in general.43,45,46
PTSD symptoms may reemerge after decades of remission or quiescence during retirement and/or with the emergence of neurocognitive impairment, such as Alzheimer disease or dementia. These individuals may have more difficulty engaging in distracting activities and work and spend more time engaging in reminiscence about the past, which can include increased focus on traumatic memories.45,47 Davison and colleagues have suggested a concept they call later-adulthood trauma reengagement (LATR) where later in life combat veterans may “confront and rework their wartime memories in an effort to find meaning and build coherence.”48 This process can be a double-edged sword, leading at times positively to enhanced personal growth or negatively to increased symptoms; preventive interventions may be able foster a more positive outcome.48
There is some evidence supporting the validity of the Clinician Administered PTSD Scale (CAPS) for the evaluation of PTSD in older adults, although this was based on the DSM-III-revised criteria for PTSD and an earlier version of CAPS.49 Bhattarai and colleagues examined responses to the 35-item Mississippi Scale for Combat-Related PTSD (M-PTSD) using VA clinical data collected between 2008 and 2015 on veterans of each combat era from World War II through the post-9/11.50 Strong internal consistency and test-retest reliability of the M-PTSD was observed within each veteran era sample. However, using chart diagnosis of PTSD as the criterion standard, the cut-scores for optimal balance of sensitivity and specificity of the M-PTSD scores were substantially lower for the older cohorts (World War II and Korean War veterans) relative to those for Vietnam and more recent veteran cohorts. The authors concluded that M-PTSD can be validly used to screen for PTSD in veterans within each of these cohorts but recommended using lower than standard cut-scores for Korean War and World War II veterans.50
This is also consistent with reports that suggest the use of lower cut-scores on self-administered PTSD symptom screens.43,44 For the clinician interested in quantifying the severity of PTSD, the most recent tools available are the CAPS-5 and the PCL-5, which have both been created in accordance with the DSM-5. The CAPS-5 is a rater-administered tool, and the PCL-5 is self-administered by the veteran. Although there has been little research using these newer tools in geriatric populations, they can currently serve as a means of tracking the severity of PTSD while we await measures that are better validated in Korean War and other older veterans.
Beyond specific empirical guidance, VA clinicians must presently rely on clinical observations and experience. Patients from the Korean War cohort often present at the insistence of a family member for changes in sleep, mood, behavior, or cognition. When the veterans themselves present, older adults with PTSD often focus more on somatic concerns (including pain, sleep, and gastrointestinal disturbance) than psychiatric problems per se. The latter tendency may in part be due to the salience of such symptoms for them, but perhaps also due to considerable stigma of mental health care that is still largely present in this group.43,44
Psychotherapy
Current VA treatment guidelines recommend trauma-focused therapies, with the strongest evidence base for prolonged exposure (PE), cognitive processing therapy (CPT), and eye movement desensitization and reprocessing (EMDR) therapies.51
There have been several excellent prior reviews discussing treatment of PTSD in older adults generally.10,43,44,52 These reviews have invariably expressed concern about the lack of sufficient empirical studies, but based on evidence from studies and case reports, there seems to be tentative support that trauma-focused therapies are acceptable and efficacious for use with older adults with PTSD. In their recent scoping review, Pless Kaiser and colleagues made several recommendations for trauma-focused therapy with older adults, including slow/careful pacing and use of compensatory aids for cognitive and sensory deficits.44 When cognitive impairment has exacerbated PTSD symptoms, they suggest therapists consider using an adapted form of CPT completed without a trauma narrative. For PE they recommend extending content across sessions and involving spouse or caregivers to assist with in vivo exposure and homework completion.44
Recent studies suggest that PTSD may be a risk factor for the later development of neurodegenerative disorders, and it is often during assessments for dementia that a revelation of PTSD occurs.10,43,47,55 Cognitive impairment may also be of relevance in deciding on the type of psychotherapy to be implemented, as it may have more adverse effects on the effectiveness of CPT than of exposure-based treatments (PE or EMDR). It may be useful to perform a cognitive assessment prior to initiation of a cognitive-based therapy, although extensive cognitive testing may not be practical or may be contraindicated because of fatigue. A brief screening tool such as the Montreal Cognitive Assessment or the Mini-Mental State Examinationmay be helpful.56, 57
Prolonged exposure has been reported by many clinicians to be effective in older adults with PTSD; however, due consideration should be given to the needs of individuals, as many have functioned for decades by suppressing memories.
Apart from the treatment needs for specific PTSD symptoms, the decades-long effects of poor sleep, irritability, hypervigilance, and dissociation also have social consequences for patients, including marital discord and divorce, and social and family isolation that should be addressed in therapy when appropriate. In addition, many Korean War veterans, like all veterans, sought postmilitary employment in professions that are associated with higher rates of exposure to psychological trauma, such as police or fire departments, and this may have an exacerbating effect on PTSD.58
Pharmacotherapy
There is very little empirical evidence guiding pharmacologic approaches to PTSD in older veterans. This population is at increased risk for many comorbidities, and pharmacologic treatments many require dosage adjustments, as is the case for any geriatric patient. Selective serotonin reuptake inhibitor (SSRI) and serotonin norepinephrine reuptake inhibitor (SNRI) medications have been proposed for some cases of PTSD.59,60 Health care providers may consider the SSRIs escitalopram or sertraline preferentially given their decreased potential for drug-drug interactions, anticholinergic effects, or cardiac toxicity compared with that of other drugs in this class.60,61 As venlafaxine can increase blood pressure, especially at higher doses, prescribers may choose duloxetine as an alternative if a SNRI is indicated.60 For veterans when prazosin is being considered for nightmare control, monitoring for hypotension, orthostasis, and the administration of other antihypertensives or prostatic hypertrophy medications is necessary.61 The use of benzodiazepines, while not recommended for PTSD, should be viewed with even greater trepidation in a geriatric population given enhanced risk of falls and confusion in the geriatric veteran population.60,62
Conclusions
Many of the oldest veterans (aged > 80 years) are from the Korean War era. The harsh and unique nature of the war, as well as the differences in context and support from the US public, and the outcome of the war, may have all contributed to and elevation of “combat fatigue” and PTSD among combat veterans from the Korean War. As the “forgotten war” cohort also has been forgotten by researchers, relatively little is known about posttraumatic stress sequelae of these veterans in the decades following the war.
From available evidence, we can readily surmise that problems were underrecognized and suboptimally diagnosed and treated. There is tentative evidence supporting the use of standard interviews and rating scales, such as the CAPS, M-PTSD, and PCL, but lower cut-scores than applied with Vietnam and later veteran cohorts are generally recommended to avoid excessive false negative errors. In terms of psychotherapy treatment, there is again a stark paucity of systematic research, but the limited evidence from studies of PTSD treatment in older adults from the general population tentatively support the acceptability and potential efficacy of recognized evidence-based trauma-focused psychotherapies for PTSD. Research on medication treatment is similarly lacking, but the general recommendations for the use of SSRI or SNRI medications seem to be valid, at least in our clinical experience, and the general rules for geriatric psychopharmacology definitely apply here—start low, go slow.
There are several important avenues for future research. Most pressing among these are establishing the effectiveness of existing treatments, and the modifications that may be needed in the broader context of the above factors, as well as the physical and cognitive changes associated with advanced age. Further research on the phenomenologic aspects of PTSD among Korean War and subsequent cohorts are also needed, as the information obtained will not only guide more effective personalized treatment of the Korean War veterans who remain with us, but also inform future generations of care in terms of the degree and dimensions of variability that may present between cohorts and within cohorts over the life span.
1. American Psychiatric Association. Diagnostic and Statistical Manual of Mental Disorders, 3rd ed. Arlington VA: American Psychiatric Association; 1980.
2. Friedman MJ, Schnurr PP, McDonagh-Coyle A. Posttraumatic stress disorder in the military veteran. Psychiatr Clin North Am. 1994;17(2):265-277.
3. Salmon TW. The Care and Treatment of Mental Diseases and War Neuroses (“Shell Shock”) in the British Army. New York: War Work Committee of the National Committee for Mental Hygiene, Inc; 1917.
4. Jones E, Wessely S. “Forward psychiatry” in the military: its origins and effectiveness. J Trauma Stress. 2003;16(4):411-419.
5. Newman RA. Combat fatigue: a review to the Korean conflict. Mil Med. 1964;129:921-928.
6. Harris FG. Some comments on the differential diagnosis and treatment of psychiatric breakdowns in Korea. https://history.amedd.army.mil/booksdocs/korea/recad2/ch9-2.html. Published April 30, 1954. Accessed November 8, 2019.
7. Smith PB. Psychiatric experiences during the Korean conflict. Am Pract Dig Treat. 1955;6(2):183-189.
8. Koontz AR. Psychiatry in the Korean War. Military Surg.
1950;107(6):444-445.
9. US Department of Veterans Affairs. National Center for Veterans Analysis and Statistics. Population Tables - Table 2L: VETPOP2016 Living Veterans by period of service, gender, 2015-2045. https://www.va.gov/vetdata/docs/Demographics/New_Vetpop_Model/2L_VetPop2016
_POS_National.xlsx. Accessed November 8, 2019.
10. Cook JM, McCarthy E, Thorp SR. Older adults with PTSD: brief state of research and evidence-based psychotherapy case illustration. Am J Geriatr Psychiatry. 2017;25(5):522-530.
11. Millett AR. Korean War: 1950-1953. Encylopaedia Britannica. https://www.britannica.com/event/Korean-War#accordion-article-history. Updated Nov 7, 2019. Accessed November 8, 2019.
12. Stack L. Korean War, a ‘forgotten’ conflict that shaped the modern world. The New York Times. January 2, 2018. https://www.nytimes.com/2018/01/01/world/asia/korean-war-history.html. Accessed November 8, 2019.
13. Westad OA. The Cold War: A World History. New York: Basic Books; 2018.
14. Young C, Conard PL, Armstrong ML, Lacy D. Older military veteran care: many still believe they are forgotten. J Holist Nurs. 2018;36(3):291-300.
15. Huebner AJ. Kilroy is back, 1950-1953. In: The Warrior Image: Soldiers in American Culture From the Second World War to the Vietnam Era. Chapel Hill, NC: The University of North Carolina Press; 2008:97-131.
16. The annexation of Korea (editorial). Japan Times. https://www.japantimes.co.jp/opinion/2010/08/29/editorials/the-annexation-of-korea/#.XPgvJvlKhhE. Published August 29, 2010. Accessed November 8, 2019.
17. Gupta K. How did the Korean war begin? China Q. 1972;52:699-716.
18. Lin L, Zhao Y, Ogawa M, Hoge J, Kim BY. Whose history? An analysis of the Korean War in history textbooks from the United States, South Korea, Japan, and China. Social Studies. 2009;100(5):222-232.
19. Weathersby K. The Korean War revisited. Wilson Q. 1999;23(3):91.
20. US Department of Veterans Affairs, Office of Program and Data Analyses, Assistant Secretary for Planning and Analysis. Data on veterans of the Korean War. https://www.va.gov/vetdata/docs/SpecialReports/KW2000.pdf. Published June 2000. Accessed November 8, 2019.
21. Brooks MS, Fulton L. Evidence of poorer life-course mental health outcomes among veterans of the Korean War cohort. Aging Ment Health. 2010;14(2):177-183.
22. US Department of Veterans Affairs, Office of Public Affairs. America’s wars. https://www.va.gov/opa/publications/factsheets/fs_americas_wars.pdf. Accessed November 8, 2019.
23. Memorandum on recent polls on Korea. https://www.eisenhowerlibrary.gov/sites/default/files/research/online-documents/korean-war/public-opinion-1953-06-02.pdf. Published June 2, 1953. Accessed November 8, 2019.
24. Elder GH Jr, Clipp EC. Combat experience and emotional health: impairment and resilience in later life. J Pers. 1989;57(2):311-341.
25. US Department of Veterans Affairs. Public health: cold injuries. https://www.publichealth.va.gov/PUBLICHEALTH/exposures/cold-injuries/index.asp. Updated July 31, 2019. Accessed November 8, 2019.
26. US Department of Veterans Affairs. Korean War veterans health issues. https://www.va.gov/health-care/health-needs-conditions/health-issues-related-to-service-era
/korean-war/. Updated June 14, 2019. Accessed November 8, 2019.
27. Shapiro F. Efficacy of the eye movement desensitization procedure in the treatment of traumatic memories. J Trauma Stress. 1989;2(2):199-223.
28. Resick PA, Schnicke MK. Cognitive processing therapy for sexual assault victims. J Consul Clin Psychol. 1992;60(5):748-756.
29. Foa EB, Rothbaum BO. Treating Trauma of Rape: Cognitive-Behavioral Therapy for PTSD. New York: Guilford; 2001.
30. Skinner R, Kaplick PM. Cultural shift in mental illness: a comparison of stress responses in World War I and the Vietnam War. JRSM Open. 2017;8(12):2054270417746061.
31. Kardiner A, Spiegel H. War Stress and Neurotic Illness. New York: Hoeber; 1947.
32. Archibald HC, Tuddenham RD. Persistent stress reaction after combat: a 20-year follow-up. Arch Gen Psychiatry. 1965;12:475-481.
33. Cook JM, Simiola V. Trauma and aging. Curr Psychiatry Rep. 2018;20(10):93.
34. Rosenheck R, Fontana A. Long-term sequelae of combat in World War II, Korea and Vietnam: a comparative study. In: McCaughey BG, Fullerton CS, Ursano RJ, eds. Individual
and Community Responses to Trauma and Disaster: The Structure of Human Chaos. New York: Cambridge University Press; 1994:330-359.
35. Blake DD, Keane TM, Wine PR, Mora C, Taylor KL, Lyons JA. Prevalence of PTSD symptoms in combat veterans seeking medical treatment. J Trauma Stress. 1990;3(1):15-27.
36. McCranie EW, Hyer LA. Posttraumatic stress disorder symptoms in Korean conflict and World War II combat veterans seeking outpatient treatment. J Trauma Stress. 2000;13(3):427-439.
37. Fontana A, Rosenheck R. Traumatic war stressors and psychiatric symptoms among World War II, Korean, and Vietnam War veterans. Psychology Aging. 1994;9(1):27-33.
38. Beebe GW. Follow-up studies of World War II and Korean war prisoners. II. Morbidity, disability, and maladjustments. Am J Epidemiol. 1975;101(5):400-422.
39. Gold PB, Engdahl BE, Eberly RE, Blake RJ, Page WF, Frueh BC. Trauma exposure, resilience, social support, and PTSD construct validity among former prisoners of war. Social Psychiatry Psychiatr Epidemiol. 2000;35(1):36-42.
40. US Department of Veterans Affairs. Key statistics by veteran status and period of service. https://www.va.gov/vetdata/docs/SpecialReports/KeyStats.pdf. Accessed November 11, 2019.
41. Bowers WT, Hammond WM, MacGarrigle GL. Black Soldier, White Army. Washington DC: US Army Center of Military History; 1996.
42. Black HK. Three generations, three wars: African American veterans. Gerontologist. 2016;56(1):33-41.
43. Thorp SR, Sones HM, Cook JM. Posttraumatic stress disorder among older adults. In: Sorocco KH, Lauderdale S, eds. Cognitive Behavior Therapy With Older Adults: Innovations Across Care Settings. New York: Springer; 2011:189-217.
44. Pless Kaiser A, Cook JM, Glick DM, Moye J. Posttraumatic stress disorder in older adults: a conceptual review. Clinical Gerontol. 2019;42(4):359-376.
45. Sadavoy J. Survivors. A review of the late-life effects of prior psychological trauma. Am J Geriatr Psychiatry. 1997;5(4):287-301.
46. Tamanna S, Parker JD, Lyons J, Ullah MI. The effect of continuous positive air pressure (CPAP) on nightmares in patients with posttraumatic stress disorder (PTSD) and obstructive sleep apnea (OSA). J Clin Sleep Med. 2014;10(6):631-636.
47. Mota N, Tsai J, Kirwin PD, et al. Late-life exacerbation of PTSD symptoms in US veterans: results from the National Health and Resilience in Veterans Study. J Clin Psychiatry. 2016;77(3):348-354.
48. Davison EH, Kaiser AP, Spiro A 3rd, Moye J, King LA, King DW. From Late-onset stress symptomatology to later-adulthood trauma reengagement in aging combat veterans: taking a broader view. Gerontologist. 2016;56(1):14-21.
49. Hyer L, Summers MN, Boyd S, Litaker M, Boudewyns P. Assessment of older combat veterans with the clinician-administered PTSD scale. J Trauma Stress. 1996;9(3):587-593.
50. Bhattarai JJ, Oehlert ME, Weber DK. Psychometric properties of the Mississippi Scale for combat-related posttraumatic stress disorder based on veterans’ period of service. Psychol Serv. 2018. [Epub ahead of print]
51. US Department of Veterans Affairs, US Department of Defense. VA/DOD Clinical practice guideline for the management of posttraumatic stress disorder and acute stress disorder. Version 3.0. https://www.healthquality.va.gov/guidelines/MH/ptsd/VADoDPTSDCPGFinal012418.pdf.
Updated 2017. Accessed November 11, 2019.
52. Dinnen S, Simiola V, Cook JM. Post-traumatic stress disorder in older adults: a systematic review of the psychotherapy treatment literature. Aging Ment Health. 2015;19(2):144-150.
53. Jakel RJ. Posttraumatic Stress Disorder in the Elderly. Psychiatr Clin North Am. 2018;41(1):165-175.
54. Thorp SR, Glassman LH, Wells SY, et al. A randomized controlled trial of prolonged exposure therapy versus relaxation training for older veterans with military-related PTSD. J Anxiety Disord. 2019;64:45-54.
55. Kang B, Xu H, McConnell ES. Neurocognitive and psychiatric comorbidities of posttraumatic stress disorder among older veterans: a systematic review. Int J Geriatr Psychiatry. 2019;34(4):522-538.
56. Nasreddine ZS, Phillips NA, Bédirian V, et al. The Montreal Cognitive Assessment, MoCA: a brief screening tool for mild cognitive impairment. J Am Geriatr Soc. 2005;53(4):695-699.
57. Folstein MF, Folstein SE, McHugh PR. “Mini-mental state”. A practical method for grading the cognitive state of patients for the clinician. J Psychiatr Res. 1975;12(3):189-198.
58. Paton D. Traumatic Stress in Police Officers a Career-Length Assessment From Recruitment to Retirement. Springfield, IL: Charles C. Thomas; 2009.
59. Alexander W. Pharmacotherapy for post-traumatic stress disorder in combat veterans: focus on antidepressants and atypical antipsychotic agents. P T. 2012;37(1):32-38.
60. Beck JG, Sloan DM, Friedman MJ. Pharmacotherapy for PTSD. In: The Oxford Handbook of Traumatic Stress Disorders. Oxford University Press; 2012.
61. Waltman SH, Shearer D, Moore BA. Management of posttraumatic nightmares: a review of pharmacologic and nonpharmacologic treatments since 2013. Curr Psychiatry Rep. 2018;20(12):108.
62. Díaz-Gutiérrez MJ, Martínez-Cengotitabengoa M, Sáez de Adana E, et al. Relationship between the use of benzodiazepines and falls in older adults: a systematic review. Maturitas. 2017;101:17-22.
The Korean War lasted from June 25, 1950 through July 27, 1953. Although many veterans of the Korean War experienced traumas during extremely stressful combat conditions. However, they would not have been diagnosed with posttraumatic stress disorder (PTSD) at the time because the latter did not exist as a formal diagnosis until the publication of the third edition of the Diagnostic and Statistical Manual (DSM) in 1980.1 Prior to 1980, psychiatric syndromes resulting from war and combat exposure where known by numerous other terms including shell shock, chronic traumatic war neurosis, and combat fatigue/combat exhaustion.2,3 Military psychiatrists attended to combat fatigue during the course of the Korean War, but as was true of World War I and II, the focus was on returning soldiers to duty. Combat fatigue was generally viewed as a transient condition.4-8
Although now octo- and nonagenarians, in 2019 there are 1.2 million living Korean War veterans in the US, representing 6.7% of all current veterans.9 Understanding their war experiences and the nature of their current and past presentation of PTSD is relevant not only in formal mental health settings, but in primary care settings, including home-based primary care, as well as community living centers, skilled nursing facilities and assisted living facilities. Older adults with PTSD often present with somatic concerns rather than spontaneously reporting mental health symptoms.10 Beyond the short-term clinical management of Korean War veterans with PTSD, consideration of their experiences also has long-term relevance for the appropriate treatment of other veteran cohorts as they age in coming decades.
The purpose of this article is to provide a clinically focused overview of PTSD in Korean War veterans, to help promote understanding of this often-forgotten group of veterans, and to foster optimized personalized care. This overview will include a description of the Korean War veteran population and the Korean War itself, the manifestations and identification of PTSD among Korean War veterans, and treatment approaches using evidence-based psychotherapies and pharmacotherapies. Finally, we provide recommendations for future research to address present empirical gaps in the understanding and treatment of Korean War veterans with PTSD.
Causes and Course of the Korean War
When working with Korean War veterans it is important to consider the special nature of that specific conflict. Space considerations limit our ability to do justice to the complex history and numerous battles of the Korean War, but information in the following summary was gleaned from several excellent histories.11-13
The Korean War has been referred to as The Forgotten War, a concern expressed even during the latter parts of the war.14,15 But the war and its veterans warrant remembering. The root and proximal causes of the Korean War are complex and not fully agreed upon by the main participants.16-19 In part this may reflect the fact that there was no clear victor in the Korean War, so that the different protagonists have developed their own versions of the history of the conflict. Also, US involvement and the public reaction to the war must be viewed within the larger historical context of that time. This context included the recent end of 4 years of US involvement in World War II (1941-1945) and the subsequent rapid rise of Cold War tensions between the US and the Soviet Union. The latter also included a worldwide fear of nuclear war and the US fear of the global spread of communism. These fears were fueled by the Soviet-led Berlin Blockade from June 1948 through May 1949, the Soviet Union’s successful atomic bomb test in August 1949, the founding of the People’s Republic of China in October 1949, and the February 1950 Sino-Soviet Treaty of Friendship and Alliance.13
In the closing days of World War II, the US and Soviet Union agreed to a temporary division of Korea along the 38th parallel to facilitate timely and efficient surrender of Japanese troops. But as Cold War tensions rose, the temporary division became permanent, and Soviet- and US-backed governments of the north and south, respectively, were officially established on the Korean peninsula in 1948. Although by 1949 the Soviets and US had withdrawn most troops from the peninsula, tensions between the north and south continued to mount and hostilities increased. To this day the exact causes of the eruption of war remain disputed, although it is clear that ideological as well as economic factors played a role, and both leaders of North and South Korea were pledging to reunite the peninsula under their respective leadership.16-19 The tension culminated on June 25, 1950, when North Korean troops crossed the 38th parallel and invaded South Korea. On June 27, 1950, President Truman ordered US naval and air forces to support South Korea and then ordered the involvement of ground troops on June 30.16,17,19
Although several other member countries of the United Nations (UN) provided troops, 90% of the troops were from the US. About 5.7 million US military personnel served during the war, including about 1.8 million in Korea itself. The US forces experienced approximately 34,000 battle-related deaths, 103,000 were wounded, and 7,000 were prisoners of war (POWs).11,20-22 The nature and events of the Korean War made it particularly stressful and traumatizing for the soldiers, sailors, and marines involved throughout its entire course. These included near defeat in the early months, a widely alternating war front along the north/south axis during the first year, and subsequently, not only intense constant battles on the fronts, but also a demanding and exhausting guerrilla war in the south, which lasted throughout the remainder of the conflict.11,15 The US troops during the initial months of the war have been described as outnumbered and underprepared, as many in the initial phase were reassigned from peace-time occupation duty in Japan.7
The first year of war was characterized by a repeated north-to-south/south-to-north shifts in control of territory. During the first 3 months, the North Korean forces overwhelmed the South and captured control of all but 2 South Korean cities in the far southeastern region (Pusan, now Busan; and Daegu), and US and UN forces were forced to retreat to the perimeter around Pusan. The intense Battle of Pusan Perimeter lasted from August 4, 1950 to September 18, 1950, and resulted in massive causalities as well as a flood of civilian refugees.
The course of the war began to change in early September 1950 with the landing of amphibious US/UN forces at Inchon, behind North Korean lines, which cut off southern supply routes for the North Korean troops.11 US/UN forces soon crossed to the north of the 38th parallel and captured the North Korean capital, Pyongyang, on October 19, 1950. They continued to push north and approached the Yalu River border with China by late November 1950, but then the Chinese introduced their own troops forcing a southward retreat of US/UN troops during which there were again numerous US/UN casualties. Chinese troops retook Seoul in late December 1950/early January 1951. However, the US/UN forces soon recaptured Seoul and advanced back to the 38th parallel. This back-and-forth across the 38th parallel continued until July 1951 when the front line of battle stabilized there. Although the line stabilized, intense battles and casualties continued for 2 more years. During this period US/UN troops also had to deal with guerrilla warfare behind the front lines due to the actions of communist partisans and isolated North Korean troops. This situation continued until the armistice was signed July 27, 1953.
Trauma and Characteristic Stresses of the War
There were many factors that made the Korean War experience different from previous wars, particularly World War II. For example, in contrast to the strong public support during and after World War II, public support for the Korean War in the US was low, particularly during its final year.23 In public opinion polls from October 1952 through April 1953, only 23% to 39% reported feeling that the war was worth fighting.23 A retrospective 1985 survey also found that 70% of World War II veterans, but only 33% of Korean War veterans reported feeling appreciated by the US public on their return from the war.24
Those fighting in the initial months of the war faced a particularly grim situation. According to LTC Philip Smith, who served as Division Psychiatrist on the Masan Front (Pusan Perimeter) during August and September of 1950, “Fighting was almost continuous and all available troops were on the fighting front… For the most part these soldiers were soft from occupation duty, many had not received adequate combat basic training, no refresher combat training in Korea had as yet been instituted,” he reported.7 “The extremes of climate coupled with the generally rugged mountainous terrain in Korea were physical factors of importance…These men were psychologically unprepared for the horrors and isolation of war.” LTC Smith noted that the change in status from civilian or occupation life to the marked deprivation of the war in Korea had been “too abrupt to allow as yet for a reasonable adjustment to the new setting” and that as a result “the highest rate of wounded and neuropsychiatric casualties in the Korean campaign resulted.”7
Even after this initial period, the nature of the shifting war, the challenging terrain, the high military casualty rate, and the high rate of civilian casualties and displacement continued throughout the war.
PTSD in Korean War Veterans
It is clear that Korean War combat veterans were exposed to traumatic events. It is unknown how many developed PTSD. While notions of psychological distress and disability related to combat trauma exposure have existed for centuries, Korean War and World War II veterans are a remaining link to pre-DSM PTSD mental health in the military. Military/forward psychiatry—psychiatric services near the battle zone rather than requiring evacuation of patients—was present in Korea from the early months of the war, but the focus of forward psychiatry was to reduce psychiatric causalities from combat fatigue and maximize rapid return-to-duty.4-6 With no real conception of PTSD, there were limited treatments available, and evidenced-based trauma-focused treatments for PTSD would not be introduced for at least another 4 decades.27-29
Skinner and Kaplick conducted a historical review of case descriptions of trauma-related conditions from World War I through the Vietnam War and noted the consistent inclusion of hyperarousal and intrusive symptoms, although there also was a greater emphasis on somatic conversion or hysteria symptoms in the earlier descriptions.30 By the Korean War, descriptions of combat fatigue included a number of symptoms that overlap with PTSD, including preoccupation with the traumatic stressor, nightmares, irritability/anger, increased startle, and hyperarousal.31 But following the acute phases, attention to any chronic problems associated with these conditions waned. As was acknowledged by a military psychiatrist in a 1954 talk, studies of the long-term adjustment of those who had “broken down in combat” were sorely needed.6 In a small 1965 study reported by Archibald and Tuddenham, persistent symptoms of combat fatigue among Korean War veterans were definitely present, and there was even a suggestion that the symptoms had increased over the decade since the war.32
Given the stoicism that typified cultural expectations for military men during this period, Korean War veterans may also have been reluctant to seek mental health treatment either at the time or later. In short, it is likely that a nontrivial proportion of Korean War veterans with PTSD were underdiagnosed and received suboptimal or no mental health treatment for decades following their war experiences.33 Although the nature of the war, deployment, and public support were distinct in World War II vs the Korean War, the absence of attention to the long-term effects of disorders related to combat trauma and the cultural expectations for stoicism suggest that PTSD among aging World War II veterans may also have gone underrecognized and undertreated.
Apart from the lack of interest in chronic effects of stressors, another problem that has plagued the limited empirical research on Korean War veterans has been the propensity to combine Korean War with World War II veteran samples in studies. Because World War II veterans have outnumbered Korean War veterans until recently, combined samples tended to have relatively few Korean War veterans. Nevertheless, from those studies that have been reported in which 2 groups were compared, important differences have been revealed. Specifically, although precise estimates of the prevalence of PTSD among Korean War combat veterans have varied depending on sampling and method, studies from the 1990s and early 2000s suggested that the prevalence of PTSD and other mental health concerns as well as the severity of symptoms, suicide risk, and psychosocial adjustment difficulties were worse among Korean War combat veterans relative to those among World War II combat veterans; however, both groups had lower prevalence than did Vietnam War combat veterans.21,34-37 Several authors speculated that these differences in outcome were at least partially due to differences in public support for the respective wars.36,37
Although there has been a paucity of research on psychiatric issues and PTSD in Korean War veterans, POWs who were very likely to have been exposed to extreme psychological traumas have received some attention. There have been comparisons of mortality and morbidity among POWs from the Korean War (PWK), World War II Pacific Theater (PWJ), and Europe (PWE).38 Among measures that were administered to the former POWs, the overall pattern seen from survey data in the mid-1960s revealed significantly worse health and functioning among the PWK and PWJ groups relative to the PWE group, with psychiatric difficulties being the most commonly reported impairments among the former 2 groups. This pattern was found most strongly with regards to objective measures, such as hospitalizations for “psychoneuroses,” and US Department of Veterans Affairs (VA) disability records, as well as based on self-reported psychosocial/recreational difficulties measured using the Cornell Medical Index (CMI).38
Gold and colleagues reported a follow-up study of more than 700 former POWs who were reinterviewed between 1989 and 1992.39 Although there was no scale of PTSD symptoms prior to formulation of the diagnosis in 1980, the CMI was a self-reported checklist that included a large range of both medical as well as behavioral and psychiatric symptoms. Thus, using CMI survey responses from 1965, the authors examined the factor structure (ie, the correlational relationships between multiple scale items and subgroupings of items) of the CMI relative to diagnosis of PTSD in 1989 to 1992 based on results from the Structured Clinical Interview for the DSM-III-R (SCID). The intent was to help discern whether the component domains of PTSD were present and intercorrelated in a pattern similar to that of the contemporary diagnosis. The investigators examined the factor structure of 20 psychological items from the CMI that appeared relevant to PTSD criteria using the 1965 data. Three factors (subgroups of highly intercorrelated items) were found: irritability (31% of variance), fearfulness/anxiousness (9% of the variance), and social withdrawal (7% of the variance). Although these did not directly correspond to, or fully cover, DSM PTSD domains or criteria, there does appear to be a thematic resemblance of the CMI findings with PTSD, including alterations in arousal and mood, vigilance, and startle.
Identification and Treatment of PTSD in Older Veterans
Of the 1.2 million living Korean War veterans in the US, 36.3% use VA provided health care.40 There are a number of complicating factors to consider in the current identification and treatment of PTSD in this cohort, including their advanced age; physical, cognitive, and social changes associated with normal aging; the associated medical and cognitive comorbidities; and the specific social-contextual factors in that age cohort. Any combination of these factors may complicate recognition, diagnosis, and treatment. It is also important to be cognizant of the additional stressors that may have been experienced by ethnic minorites and women serving in Korea, which are poorly documented and studied. Racial integration of the US military began during the Korean War, but the general pattern was for African American soldiers to be assigned to all-white units, rather than the reverse.14,41,42 And although the majority of military personnel serving in Korea were male, there were women serving in health care positions at mobile army surgical hospital (MASH) units, medical air evacuation (Medevac) aircraft, and off-shore hospital ships.
The clinical presentation of PTSD in older adults has varied, which may partially relate to the time elapsed since the index trauma. For example, older veterans in general may show less avoidance behavior as a part of PTSD, but in those who experience trauma later in life there may actually be greater avoidance.43,44 There have also been discrepant reports of intrusion or reexperiencing of symptoms, with these also potentially reduced in older veterans.43,44 However, sleep disturbances seem to be very common among elderly combat veterans, and attention should be paid to the possible presence of sleep apnea, which may be more common in veterans with PTSD in general.43,45,46
PTSD symptoms may reemerge after decades of remission or quiescence during retirement and/or with the emergence of neurocognitive impairment, such as Alzheimer disease or dementia. These individuals may have more difficulty engaging in distracting activities and work and spend more time engaging in reminiscence about the past, which can include increased focus on traumatic memories.45,47 Davison and colleagues have suggested a concept they call later-adulthood trauma reengagement (LATR) where later in life combat veterans may “confront and rework their wartime memories in an effort to find meaning and build coherence.”48 This process can be a double-edged sword, leading at times positively to enhanced personal growth or negatively to increased symptoms; preventive interventions may be able foster a more positive outcome.48
There is some evidence supporting the validity of the Clinician Administered PTSD Scale (CAPS) for the evaluation of PTSD in older adults, although this was based on the DSM-III-revised criteria for PTSD and an earlier version of CAPS.49 Bhattarai and colleagues examined responses to the 35-item Mississippi Scale for Combat-Related PTSD (M-PTSD) using VA clinical data collected between 2008 and 2015 on veterans of each combat era from World War II through the post-9/11.50 Strong internal consistency and test-retest reliability of the M-PTSD was observed within each veteran era sample. However, using chart diagnosis of PTSD as the criterion standard, the cut-scores for optimal balance of sensitivity and specificity of the M-PTSD scores were substantially lower for the older cohorts (World War II and Korean War veterans) relative to those for Vietnam and more recent veteran cohorts. The authors concluded that M-PTSD can be validly used to screen for PTSD in veterans within each of these cohorts but recommended using lower than standard cut-scores for Korean War and World War II veterans.50
This is also consistent with reports that suggest the use of lower cut-scores on self-administered PTSD symptom screens.43,44 For the clinician interested in quantifying the severity of PTSD, the most recent tools available are the CAPS-5 and the PCL-5, which have both been created in accordance with the DSM-5. The CAPS-5 is a rater-administered tool, and the PCL-5 is self-administered by the veteran. Although there has been little research using these newer tools in geriatric populations, they can currently serve as a means of tracking the severity of PTSD while we await measures that are better validated in Korean War and other older veterans.
Beyond specific empirical guidance, VA clinicians must presently rely on clinical observations and experience. Patients from the Korean War cohort often present at the insistence of a family member for changes in sleep, mood, behavior, or cognition. When the veterans themselves present, older adults with PTSD often focus more on somatic concerns (including pain, sleep, and gastrointestinal disturbance) than psychiatric problems per se. The latter tendency may in part be due to the salience of such symptoms for them, but perhaps also due to considerable stigma of mental health care that is still largely present in this group.43,44
Psychotherapy
Current VA treatment guidelines recommend trauma-focused therapies, with the strongest evidence base for prolonged exposure (PE), cognitive processing therapy (CPT), and eye movement desensitization and reprocessing (EMDR) therapies.51
There have been several excellent prior reviews discussing treatment of PTSD in older adults generally.10,43,44,52 These reviews have invariably expressed concern about the lack of sufficient empirical studies, but based on evidence from studies and case reports, there seems to be tentative support that trauma-focused therapies are acceptable and efficacious for use with older adults with PTSD. In their recent scoping review, Pless Kaiser and colleagues made several recommendations for trauma-focused therapy with older adults, including slow/careful pacing and use of compensatory aids for cognitive and sensory deficits.44 When cognitive impairment has exacerbated PTSD symptoms, they suggest therapists consider using an adapted form of CPT completed without a trauma narrative. For PE they recommend extending content across sessions and involving spouse or caregivers to assist with in vivo exposure and homework completion.44
Recent studies suggest that PTSD may be a risk factor for the later development of neurodegenerative disorders, and it is often during assessments for dementia that a revelation of PTSD occurs.10,43,47,55 Cognitive impairment may also be of relevance in deciding on the type of psychotherapy to be implemented, as it may have more adverse effects on the effectiveness of CPT than of exposure-based treatments (PE or EMDR). It may be useful to perform a cognitive assessment prior to initiation of a cognitive-based therapy, although extensive cognitive testing may not be practical or may be contraindicated because of fatigue. A brief screening tool such as the Montreal Cognitive Assessment or the Mini-Mental State Examinationmay be helpful.56, 57
Prolonged exposure has been reported by many clinicians to be effective in older adults with PTSD; however, due consideration should be given to the needs of individuals, as many have functioned for decades by suppressing memories.
Apart from the treatment needs for specific PTSD symptoms, the decades-long effects of poor sleep, irritability, hypervigilance, and dissociation also have social consequences for patients, including marital discord and divorce, and social and family isolation that should be addressed in therapy when appropriate. In addition, many Korean War veterans, like all veterans, sought postmilitary employment in professions that are associated with higher rates of exposure to psychological trauma, such as police or fire departments, and this may have an exacerbating effect on PTSD.58
Pharmacotherapy
There is very little empirical evidence guiding pharmacologic approaches to PTSD in older veterans. This population is at increased risk for many comorbidities, and pharmacologic treatments many require dosage adjustments, as is the case for any geriatric patient. Selective serotonin reuptake inhibitor (SSRI) and serotonin norepinephrine reuptake inhibitor (SNRI) medications have been proposed for some cases of PTSD.59,60 Health care providers may consider the SSRIs escitalopram or sertraline preferentially given their decreased potential for drug-drug interactions, anticholinergic effects, or cardiac toxicity compared with that of other drugs in this class.60,61 As venlafaxine can increase blood pressure, especially at higher doses, prescribers may choose duloxetine as an alternative if a SNRI is indicated.60 For veterans when prazosin is being considered for nightmare control, monitoring for hypotension, orthostasis, and the administration of other antihypertensives or prostatic hypertrophy medications is necessary.61 The use of benzodiazepines, while not recommended for PTSD, should be viewed with even greater trepidation in a geriatric population given enhanced risk of falls and confusion in the geriatric veteran population.60,62
Conclusions
Many of the oldest veterans (aged > 80 years) are from the Korean War era. The harsh and unique nature of the war, as well as the differences in context and support from the US public, and the outcome of the war, may have all contributed to and elevation of “combat fatigue” and PTSD among combat veterans from the Korean War. As the “forgotten war” cohort also has been forgotten by researchers, relatively little is known about posttraumatic stress sequelae of these veterans in the decades following the war.
From available evidence, we can readily surmise that problems were underrecognized and suboptimally diagnosed and treated. There is tentative evidence supporting the use of standard interviews and rating scales, such as the CAPS, M-PTSD, and PCL, but lower cut-scores than applied with Vietnam and later veteran cohorts are generally recommended to avoid excessive false negative errors. In terms of psychotherapy treatment, there is again a stark paucity of systematic research, but the limited evidence from studies of PTSD treatment in older adults from the general population tentatively support the acceptability and potential efficacy of recognized evidence-based trauma-focused psychotherapies for PTSD. Research on medication treatment is similarly lacking, but the general recommendations for the use of SSRI or SNRI medications seem to be valid, at least in our clinical experience, and the general rules for geriatric psychopharmacology definitely apply here—start low, go slow.
There are several important avenues for future research. Most pressing among these are establishing the effectiveness of existing treatments, and the modifications that may be needed in the broader context of the above factors, as well as the physical and cognitive changes associated with advanced age. Further research on the phenomenologic aspects of PTSD among Korean War and subsequent cohorts are also needed, as the information obtained will not only guide more effective personalized treatment of the Korean War veterans who remain with us, but also inform future generations of care in terms of the degree and dimensions of variability that may present between cohorts and within cohorts over the life span.
1. American Psychiatric Association. Diagnostic and Statistical Manual of Mental Disorders, 3rd ed. Arlington VA: American Psychiatric Association; 1980.
2. Friedman MJ, Schnurr PP, McDonagh-Coyle A. Posttraumatic stress disorder in the military veteran. Psychiatr Clin North Am. 1994;17(2):265-277.
3. Salmon TW. The Care and Treatment of Mental Diseases and War Neuroses (“Shell Shock”) in the British Army. New York: War Work Committee of the National Committee for Mental Hygiene, Inc; 1917.
4. Jones E, Wessely S. “Forward psychiatry” in the military: its origins and effectiveness. J Trauma Stress. 2003;16(4):411-419.
5. Newman RA. Combat fatigue: a review to the Korean conflict. Mil Med. 1964;129:921-928.
6. Harris FG. Some comments on the differential diagnosis and treatment of psychiatric breakdowns in Korea. https://history.amedd.army.mil/booksdocs/korea/recad2/ch9-2.html. Published April 30, 1954. Accessed November 8, 2019.
7. Smith PB. Psychiatric experiences during the Korean conflict. Am Pract Dig Treat. 1955;6(2):183-189.
8. Koontz AR. Psychiatry in the Korean War. Military Surg.
1950;107(6):444-445.
9. US Department of Veterans Affairs. National Center for Veterans Analysis and Statistics. Population Tables - Table 2L: VETPOP2016 Living Veterans by period of service, gender, 2015-2045. https://www.va.gov/vetdata/docs/Demographics/New_Vetpop_Model/2L_VetPop2016
_POS_National.xlsx. Accessed November 8, 2019.
10. Cook JM, McCarthy E, Thorp SR. Older adults with PTSD: brief state of research and evidence-based psychotherapy case illustration. Am J Geriatr Psychiatry. 2017;25(5):522-530.
11. Millett AR. Korean War: 1950-1953. Encylopaedia Britannica. https://www.britannica.com/event/Korean-War#accordion-article-history. Updated Nov 7, 2019. Accessed November 8, 2019.
12. Stack L. Korean War, a ‘forgotten’ conflict that shaped the modern world. The New York Times. January 2, 2018. https://www.nytimes.com/2018/01/01/world/asia/korean-war-history.html. Accessed November 8, 2019.
13. Westad OA. The Cold War: A World History. New York: Basic Books; 2018.
14. Young C, Conard PL, Armstrong ML, Lacy D. Older military veteran care: many still believe they are forgotten. J Holist Nurs. 2018;36(3):291-300.
15. Huebner AJ. Kilroy is back, 1950-1953. In: The Warrior Image: Soldiers in American Culture From the Second World War to the Vietnam Era. Chapel Hill, NC: The University of North Carolina Press; 2008:97-131.
16. The annexation of Korea (editorial). Japan Times. https://www.japantimes.co.jp/opinion/2010/08/29/editorials/the-annexation-of-korea/#.XPgvJvlKhhE. Published August 29, 2010. Accessed November 8, 2019.
17. Gupta K. How did the Korean war begin? China Q. 1972;52:699-716.
18. Lin L, Zhao Y, Ogawa M, Hoge J, Kim BY. Whose history? An analysis of the Korean War in history textbooks from the United States, South Korea, Japan, and China. Social Studies. 2009;100(5):222-232.
19. Weathersby K. The Korean War revisited. Wilson Q. 1999;23(3):91.
20. US Department of Veterans Affairs, Office of Program and Data Analyses, Assistant Secretary for Planning and Analysis. Data on veterans of the Korean War. https://www.va.gov/vetdata/docs/SpecialReports/KW2000.pdf. Published June 2000. Accessed November 8, 2019.
21. Brooks MS, Fulton L. Evidence of poorer life-course mental health outcomes among veterans of the Korean War cohort. Aging Ment Health. 2010;14(2):177-183.
22. US Department of Veterans Affairs, Office of Public Affairs. America’s wars. https://www.va.gov/opa/publications/factsheets/fs_americas_wars.pdf. Accessed November 8, 2019.
23. Memorandum on recent polls on Korea. https://www.eisenhowerlibrary.gov/sites/default/files/research/online-documents/korean-war/public-opinion-1953-06-02.pdf. Published June 2, 1953. Accessed November 8, 2019.
24. Elder GH Jr, Clipp EC. Combat experience and emotional health: impairment and resilience in later life. J Pers. 1989;57(2):311-341.
25. US Department of Veterans Affairs. Public health: cold injuries. https://www.publichealth.va.gov/PUBLICHEALTH/exposures/cold-injuries/index.asp. Updated July 31, 2019. Accessed November 8, 2019.
26. US Department of Veterans Affairs. Korean War veterans health issues. https://www.va.gov/health-care/health-needs-conditions/health-issues-related-to-service-era
/korean-war/. Updated June 14, 2019. Accessed November 8, 2019.
27. Shapiro F. Efficacy of the eye movement desensitization procedure in the treatment of traumatic memories. J Trauma Stress. 1989;2(2):199-223.
28. Resick PA, Schnicke MK. Cognitive processing therapy for sexual assault victims. J Consul Clin Psychol. 1992;60(5):748-756.
29. Foa EB, Rothbaum BO. Treating Trauma of Rape: Cognitive-Behavioral Therapy for PTSD. New York: Guilford; 2001.
30. Skinner R, Kaplick PM. Cultural shift in mental illness: a comparison of stress responses in World War I and the Vietnam War. JRSM Open. 2017;8(12):2054270417746061.
31. Kardiner A, Spiegel H. War Stress and Neurotic Illness. New York: Hoeber; 1947.
32. Archibald HC, Tuddenham RD. Persistent stress reaction after combat: a 20-year follow-up. Arch Gen Psychiatry. 1965;12:475-481.
33. Cook JM, Simiola V. Trauma and aging. Curr Psychiatry Rep. 2018;20(10):93.
34. Rosenheck R, Fontana A. Long-term sequelae of combat in World War II, Korea and Vietnam: a comparative study. In: McCaughey BG, Fullerton CS, Ursano RJ, eds. Individual
and Community Responses to Trauma and Disaster: The Structure of Human Chaos. New York: Cambridge University Press; 1994:330-359.
35. Blake DD, Keane TM, Wine PR, Mora C, Taylor KL, Lyons JA. Prevalence of PTSD symptoms in combat veterans seeking medical treatment. J Trauma Stress. 1990;3(1):15-27.
36. McCranie EW, Hyer LA. Posttraumatic stress disorder symptoms in Korean conflict and World War II combat veterans seeking outpatient treatment. J Trauma Stress. 2000;13(3):427-439.
37. Fontana A, Rosenheck R. Traumatic war stressors and psychiatric symptoms among World War II, Korean, and Vietnam War veterans. Psychology Aging. 1994;9(1):27-33.
38. Beebe GW. Follow-up studies of World War II and Korean war prisoners. II. Morbidity, disability, and maladjustments. Am J Epidemiol. 1975;101(5):400-422.
39. Gold PB, Engdahl BE, Eberly RE, Blake RJ, Page WF, Frueh BC. Trauma exposure, resilience, social support, and PTSD construct validity among former prisoners of war. Social Psychiatry Psychiatr Epidemiol. 2000;35(1):36-42.
40. US Department of Veterans Affairs. Key statistics by veteran status and period of service. https://www.va.gov/vetdata/docs/SpecialReports/KeyStats.pdf. Accessed November 11, 2019.
41. Bowers WT, Hammond WM, MacGarrigle GL. Black Soldier, White Army. Washington DC: US Army Center of Military History; 1996.
42. Black HK. Three generations, three wars: African American veterans. Gerontologist. 2016;56(1):33-41.
43. Thorp SR, Sones HM, Cook JM. Posttraumatic stress disorder among older adults. In: Sorocco KH, Lauderdale S, eds. Cognitive Behavior Therapy With Older Adults: Innovations Across Care Settings. New York: Springer; 2011:189-217.
44. Pless Kaiser A, Cook JM, Glick DM, Moye J. Posttraumatic stress disorder in older adults: a conceptual review. Clinical Gerontol. 2019;42(4):359-376.
45. Sadavoy J. Survivors. A review of the late-life effects of prior psychological trauma. Am J Geriatr Psychiatry. 1997;5(4):287-301.
46. Tamanna S, Parker JD, Lyons J, Ullah MI. The effect of continuous positive air pressure (CPAP) on nightmares in patients with posttraumatic stress disorder (PTSD) and obstructive sleep apnea (OSA). J Clin Sleep Med. 2014;10(6):631-636.
47. Mota N, Tsai J, Kirwin PD, et al. Late-life exacerbation of PTSD symptoms in US veterans: results from the National Health and Resilience in Veterans Study. J Clin Psychiatry. 2016;77(3):348-354.
48. Davison EH, Kaiser AP, Spiro A 3rd, Moye J, King LA, King DW. From Late-onset stress symptomatology to later-adulthood trauma reengagement in aging combat veterans: taking a broader view. Gerontologist. 2016;56(1):14-21.
49. Hyer L, Summers MN, Boyd S, Litaker M, Boudewyns P. Assessment of older combat veterans with the clinician-administered PTSD scale. J Trauma Stress. 1996;9(3):587-593.
50. Bhattarai JJ, Oehlert ME, Weber DK. Psychometric properties of the Mississippi Scale for combat-related posttraumatic stress disorder based on veterans’ period of service. Psychol Serv. 2018. [Epub ahead of print]
51. US Department of Veterans Affairs, US Department of Defense. VA/DOD Clinical practice guideline for the management of posttraumatic stress disorder and acute stress disorder. Version 3.0. https://www.healthquality.va.gov/guidelines/MH/ptsd/VADoDPTSDCPGFinal012418.pdf.
Updated 2017. Accessed November 11, 2019.
52. Dinnen S, Simiola V, Cook JM. Post-traumatic stress disorder in older adults: a systematic review of the psychotherapy treatment literature. Aging Ment Health. 2015;19(2):144-150.
53. Jakel RJ. Posttraumatic Stress Disorder in the Elderly. Psychiatr Clin North Am. 2018;41(1):165-175.
54. Thorp SR, Glassman LH, Wells SY, et al. A randomized controlled trial of prolonged exposure therapy versus relaxation training for older veterans with military-related PTSD. J Anxiety Disord. 2019;64:45-54.
55. Kang B, Xu H, McConnell ES. Neurocognitive and psychiatric comorbidities of posttraumatic stress disorder among older veterans: a systematic review. Int J Geriatr Psychiatry. 2019;34(4):522-538.
56. Nasreddine ZS, Phillips NA, Bédirian V, et al. The Montreal Cognitive Assessment, MoCA: a brief screening tool for mild cognitive impairment. J Am Geriatr Soc. 2005;53(4):695-699.
57. Folstein MF, Folstein SE, McHugh PR. “Mini-mental state”. A practical method for grading the cognitive state of patients for the clinician. J Psychiatr Res. 1975;12(3):189-198.
58. Paton D. Traumatic Stress in Police Officers a Career-Length Assessment From Recruitment to Retirement. Springfield, IL: Charles C. Thomas; 2009.
59. Alexander W. Pharmacotherapy for post-traumatic stress disorder in combat veterans: focus on antidepressants and atypical antipsychotic agents. P T. 2012;37(1):32-38.
60. Beck JG, Sloan DM, Friedman MJ. Pharmacotherapy for PTSD. In: The Oxford Handbook of Traumatic Stress Disorders. Oxford University Press; 2012.
61. Waltman SH, Shearer D, Moore BA. Management of posttraumatic nightmares: a review of pharmacologic and nonpharmacologic treatments since 2013. Curr Psychiatry Rep. 2018;20(12):108.
62. Díaz-Gutiérrez MJ, Martínez-Cengotitabengoa M, Sáez de Adana E, et al. Relationship between the use of benzodiazepines and falls in older adults: a systematic review. Maturitas. 2017;101:17-22.
Patient Safety Indicator-12 Rarely Identifies Problems with Quality of Care in Perioperative Venous Thromboembolism
Perioperative venous thromboembolism (VTE) is a major contributor to the morbidity and mortality of hospitalized patients. The historical incidence of postoperative VTE varied between 15%-80% depending on the type of procedure and monitoring strategies. Higher incidences of VTE occurred with major surgery (15%-40%), knee or hip arthroplasty (40%-60%), and trauma (60%-80%).1 The use of VTE prophylaxis with subcutaneous heparin reduced DVTs by 70% and PEs by 50%.2 A recent study from Olmstead County showed improved adherence to inpatient VTE prophylaxis from 2005 to 2010 but no difference in VTE incidence. However, 52% of VTE events were associated with hospitalization.3 As such, VTE continues to be a healthcare-associated adverse event, and surgery remains a significant risk factor for thrombosis.4
The Agency for Healthcare Research and Quality (AHRQ) released Patient Safety Indicators (PSI) in 2003 to provide a means of screening for adverse events.5 Over time, PSIs have been adopted as a measure of hospital performance and are utilized in several pay-for-performance programs. PSI-90 is a composite measure of several other PSIs and is a core metric in the Centers for Medicare and Medicaid Services (CMS) Hospital-Acquired Condition Reduction Program and the Hospital Value-Based Purchasing Program which impacts up to 2% of a hospital’s Medicare payments.6,7 One component of PSI-90 is PSI-12, which captures perioperative VTE. PSI-12 events are identified using software that screens medical records based on International Classification of Diseases (ICD)-9/10 codes for thrombosis and procedure codes at time of discharge.8
Over the last several years, there has been concern regarding the validity of including PSI-12 in pay-for-performance metrics. Common areas for concern include PSI-12’s accuracy in detecting true postoperative VTE9 in addition to surveillance bias.10,11 However, some note that PSI-12 is useful when applied with its original intent: as a screening tool for hospitals to identify specific areas to implement improvements.9,12The aim of our study was to review all PSI-12 events at our institution to evaluate the accuracy of PSI-12 and identify areas for improvement to prevent VTE events in surgical patients. While several other studies have looked at the positive predictive values, accuracy, or surveillance bias of PSI-12, to the best of our knowledge, few, if any, previous studies have reported PSI-12 events in relation to their timing, type of prophylaxis used, and mitigating factors to identify areas for quality improvement.
METHODS
PSI-12 events were identified between June 2015 and June 2017 using AHRQ software (version 5). Cases were also identified through Vizient and reviewed to ensure congruence between the methods. Patients’ electronic medical records were reviewed for patient demographics, type of VTE event, platelet count at VTE diagnosis, procedure type, and both the timing and type of VTE prophylaxis. Summary statistics were calculated.
We considered perioperative VTE pharmacologic prophylaxis appropriate if started within 24 hours of a low bleeding risk procedure or 72 hours of a high-bleeding risk procedure.13 Mechanical prophylaxis was considered appropriate if pharmacologic prophylaxis was not used because of procedure risk, thrombocytopenia, or active bleeding. The medication administration record was reviewed to determine if prophylaxis was ordered, given, and/or refused.
RESULTS
During the two-year period, 18,084 surgeries were performed, and 161 cases of VTE events were identified. A detailed chart review and correction of documentation led to the exclusion of seven cases (4%) because the VTE event occurred prior to admission (n = 5) or were incidental findings that did not meet the Uniform Hospital Discharge Data Set definition for reporting (n = 2). In total, 154 (0.9% of all surgeries) cases were considered PSI-12 events. Pulmonary embolism (PE) occurred in most cases (n = 97, 62.9%), followed by deep vein thrombosis (DVT) (n = 37, 24.0%). Twenty cases (12.9%) experienced concurrent PE and DVT. Within the PE group, 16 cases (14%) were subsegmental PE only. Eight patients (14% of DVT cases) had only a distal DVT. The mean age of patients was 56 years (+/− 16 years), and the majority (59%) were male. The clinical specialties with the most events included neurosurgery (21%), orthopedics (14%), general surgery (13%), and trauma (11%). Fourteen patients (9%) died during the hospitalization, and of these, six (43%) had either sudden death or death attributed to PE (Table 1).
Cases were also reviewed for the type of VTE prophylactic strategy administered at the time of the event. The top three prophylactic strategies were subcutaneous unfractionated heparin (61%), mechanical prophylaxis only (51%), and enoxaparin (31%). Nine cases of VTE occurred during therapeutic anticoagulation (6%; Table 1).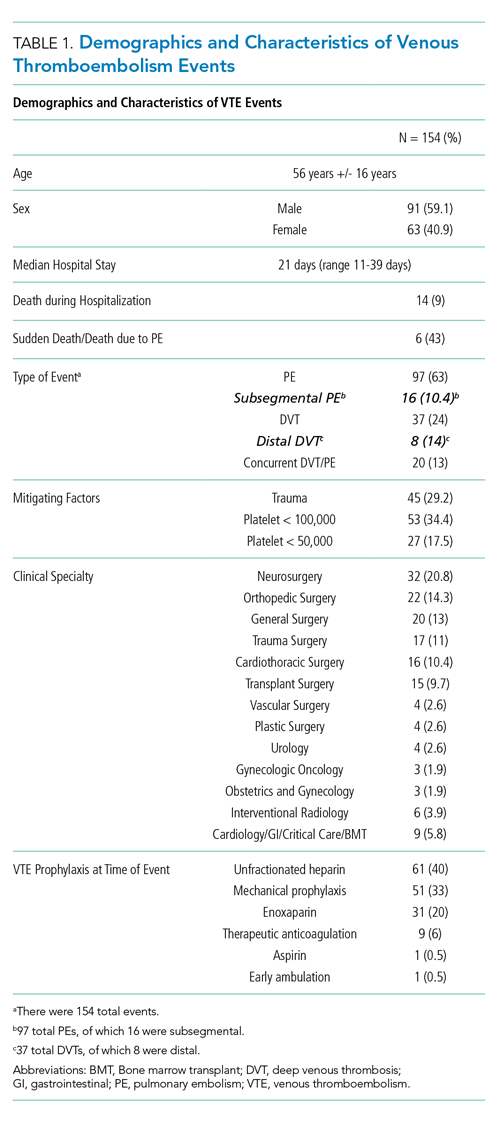
We also evaluated the timing of VTE in relation to hospitalization and procedure. Overall, the median length of hospital stay was 21 days (range: 11-39 days). VTE occurred early in the hospitalization; 21% of cases of VTE occurred within three days of admission, and 43.5% occurred within seven days of admission (Figure 1). With regard to VTE timing in relation to the procedure, 4.5% of cases of VTE occurred prior to the procedure, 33% occurred within three days of the procedure, and 53% occurred within seven days (Figure 2).
Absence of guideline-appropriate VTE prophylaxis was identified in only nine (6%) cases: seven patients had delayed initiation of pharmacologic prophylaxis, and two had pharmacologic prophylaxis held for unknown reasons. When accounting for pharmacologic prophylaxis missed based on patient refusal (n = 10 patients), the number of patients without guideline- appropriate VTE prophylaxis increased to 17 cases (11%), as two of the cases with patient refusal were found to have other quality issues present. Pharmacologic prophylaxis was given to 125 patients during their hospitalization. A median of 8% of ordered doses was refused, and an additional 8% of doses were held for a procedure (Table 2). We evaluated other factors that could have influenced the rate or type of VTE prophylactic strategies toward the use of mechanical prophylaxis, including thrombocytopenia and trauma. Although 11% of cases were treated primarily by the trauma teams (Table 1), a trauma-related procedure accounted for 29% of PSI-12 cases. Thrombocytopenia (platelets of less than 100,000) occurred in 53 cases (34%), with 27 patients (18%) having a platelet count of less than 50,000.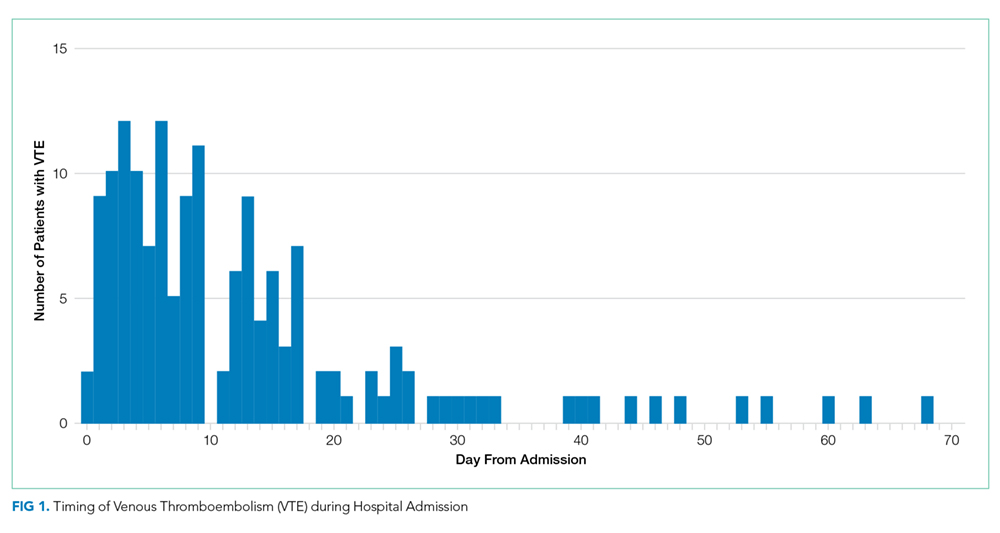
DISCUSSION
Utilizing AHRQ version 5 software for PSI-12, our institution identified 154 cases of perioperative VTE. Most of these cases were a pulmonary embolism, occurred within a week of admission, and were associated with surgical specialties that portend a higher risk of VTE. Very few of these cases were deficient in guideline-directed VTE prophylaxis, and several cases had associated factors such as trauma and thrombocytopenia that may have appropriately influenced the decision to use mechanical only prophylaxis. Sixteen percent of pharmacologic VTE prophylactic doses were refused or held for a procedure, a known but rarely quantified influence on rates of pharmacologic prophylaxis. The use of patient-level data and adjudication of the clinical decision that affected the administration of VTE prophylaxis is a major strength of this work. In all, our data raise several questions about the accuracy of PSI-12 in identifying preventable postoperative VTE, especially as it is utilized as a marker for pay-for-performance measures in addition to identifying further areas for research and improvement.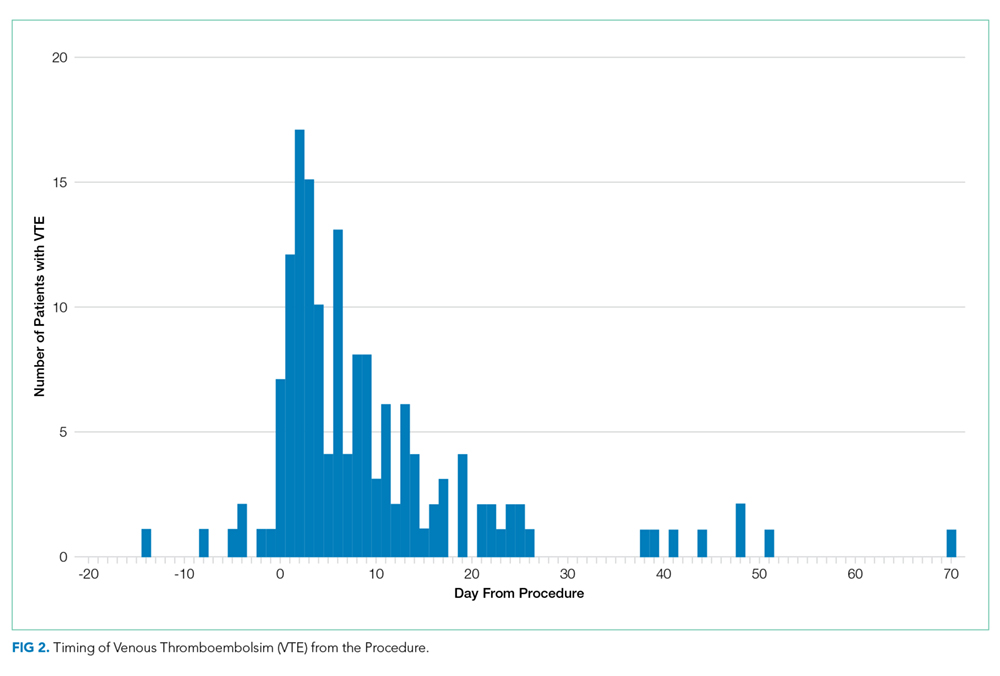
Our results align with previous studies that suggest that PSI-12 is an inaccurate measure of performance quality. A study by Bilimoria et al. in 2013 noted that surveillance biases associated with PSI-12, showing that hospitals with higher compliance to appropriate VTE prophylaxis paradoxically had worse outcomes.10 Furthermore, Blay et al. recently published a study evaluating PSI-90 scores for hospitals with and without the VTE measure included. Their results indicated that larger hospitals (teaching hospitals, level I trauma centers, etc) caring for sicker patients were noted to improve by 8%-25% when the VTE measure was removed.11 Similarly, our data indicate that the PSI-12 may not be an accurate measure of quality performance, as only 6% of cases were noted to be deficient in appropriate guideline-directed prophylaxis. Even when accounting for the refusal of doses of pharmacologic prophylaxis, this figure only increased to 11%.
Procedures included in the current PSI-12 algorithm also vary in the risk they pose to developing VTE. For example, the current version of PSI-12 includes surgical Medicare Severity Diagnosis Related Groups (MS-DRGs) for procedures with a high risk of VTE such as orthopedic, abdominal, or thoracic procedures.14,15, However, it is worth noting that procedures such as tracheostomy and ocular surgery are also included.14 The variation in risk for development of VTE is reflected in the Caprini score, a perioperative risk stratification tool. These latter procedures only contribute one point, whereas trauma would add five points each to the total score, and make the patient a high VTE risk from the procedure alone.16 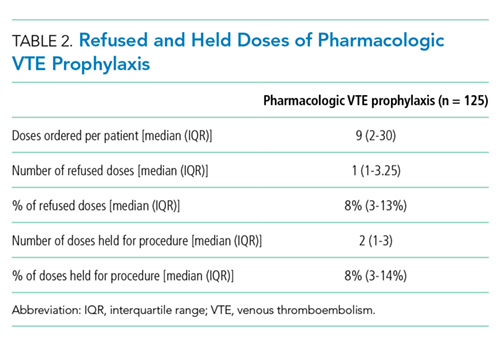
While most of our cases of VTE occurred within higher risk surgical subspecialties, 15 (10%) of our cases were within the clinical specialties of interventional radiology, cardiology, gastroenterology, and bone marrow transplant. One procedure of notable conflict includes bronchoalveolar lavage (BAL), which is included as an operating room procedure per the current version of PSI-12 software,17 but is no longer recognized by CMS as a surgical MS-DRG for reimbursement. The PSI-12 observed-to-expected rates take the DRG and comorbidity codes into consideration, but which DRG is selected does not always reflect the procedure type or the risk of VTE associated with the procedure.
Regarding the type of VTE event, our data revealed that PE was the predominant event, accounting for 62% of cases. This is different compared with other studies, such as the population-based studies in which PE and DVT account for approximately 40%-42% of events, respectively, and approximately 15% with concurrent PE and DVT. 9,18 Borzecki et al. however, noted similar rates to our study, with 55% as PE only, 38% as DVT only, and 8% had both PE and DVT. This study also found a positive correlation between PSI-12 rates and VTE imaging rates, such that if more CT scans were completed, more PEs could be found.19 Our data identified 16 of the 97 cases of PE were subsegmental PE, a subset of VTE whose clinical significance has been questioned.20 Excluding these cases brings the percentage closer to 52%. Also, screening ultrasounds are not performed at our institution. Asymptomatic or minimally symptomatic DVTs could be missed.
Further, this study also highlights that the reliability of PSI-12 is dependent on accurate documentation and coding. This is most evident when reviewing studies that evaluated the positive predictive value (PPV) of this measure.9,12,21 A study of 28 Veteran’s Affairs hospitals from 2003 to 2007 used the AHRQ version 3 software to assess the PPV of PSI-12. Out of the 112 cases flagged by the AHRQ PSI software, only 48 were true events of postoperative DVT, yielding a PPV of only 43%. False-positive results were primarily patients with VTE present on admission and cases that were diagnosed after admission but prior to the index procedure. They also noted that coding inaccuracies were present in 38% of cases.9 Similarly, Henderson et al. conducted a retrospective review of 112 postsurgical discharges noting a PPV of 54%, with most false-positives resulting from superficial clots identified by PSI-12 related to coding ambiguity.12 Our data similarly showed false-positive results as seven cases were excluded based on chart review and documentation correction, and 4.5% were preprocedural. However, there is some discordance with previous studies, as our data yields a PPV of 91% for VTE when accounting for preprocedural events as well as those excluded based on chart review. One explanation is an improvement in documentation strategies and coding, as our institution has adopted strategies to review cases and clarify documentation prior to billing to improve accuracy, and inclusion of a checkbox to indicate that a diagnosis was present on admission. Another possibility is improved accuracy with ICD-10 coding, as shown in a paper by Quan et al. that found a 79% PPV of PSI-12, which improved to 89% when cases present on admission were excluded.21 Lastly, we used newer versions of the AHRQ software, which could have improved the accuracy of detection. Despite these improvements in PSI-12 identifying true cases of postoperative VTE, as our data show, there is still much to be desired in terms of identifying issues with the quality of care and inclusion of PSI-12 in pay-for-performance.
Our study has several limitations. As a retrospective review, a major limiting factor is that data obtained are subject to the accuracy of documentation within the provider and nursing notes. As such, we focused on broad topics such as VTE events, the type of VTE event, and timing of the event in relation to admission and procedure. We actively review cases at discharge prior to billing to correct documentation if required. However, a prolonged hospital stay could lead to a review of the case weeks to months later. A real-time alert for a VTE event in a patient with surgery could improve documentation.
Further, although mechanical only prophylaxis was present on chart review, it is impossible to know both the rate of compliance with this method and whether it contributed to some events.
Despite these limitations, our goals of evaluating the validity of PSI-12 and identifying areas for improved measurement and techniques for DVT prophylaxis were met. As previously discussed, our data suggest that PSI-12 has several limitations in identifying quality of care issues with the prevention of DVT. For example, PSI-12 included many cases in which pharmacologic prophylaxis was appropriately not given. Approximately 50% of cases occurred in patients who were thrombocytopenic (platelets < 100,000), and 29% of events occurred in trauma patients. In addition, 33% of cases identified were within three days of the procedure, which, in cases of high-bleeding risk procedures, is an appropriate time to refrain from pharmacologic anticoagulation.13 In cases such as these, it may be worth evaluating alternative forms of mechanical only prophylaxis, or other strategies to mitigate this risk.
This study also highlights areas for further research. Many of the VTE events in this study occurred while patients were treated with appropriate prophylaxis, as other studies have also shown.22,23 Gangireddy et al. looked at demographic and clinical information surrounding postoperative VTE and found several other risk factors that incur a higher risk of VTE, including steroid use, infections, and myocardial infarction.24 Perhaps future studies could target these groups as potential points for increased prophylactic strategies. As noted by Lau et al. appropriate VTE prophylaxis involves risk stratification, ordering the appropriate prophylaxis by clinicians, patient acceptance of prescribed therapy, and nursing administration of prescribed therapy.25 As exemplified by our data, despite appropriate prophylaxis being ordered, eight events were associated solely with the refusal of pharmacologic prophylaxis. An ideal VTE metric would identify patients with a VTE who had a defective VTE prophylactic process,25 but the cost associated with manual data abstraction may limit the inclusion of a process metric into pay-for-performance. Additional research also needs to identify whether modifications to PSI-12 can improve its accuracy and predictive value, such as the exclusion of VTE prior to a procedure, modifications to what counts as a procedure, or utilizing markers to assess adherence to VTE prophylactic rates. These points are especially important to consider if PSI-12 is to remain as one of the key factors in pay-for-performance outcome measures. Lastly, understanding the effectiveness and patient adherence to oral VTE prophylactic regimens could also decrease the rates of refusal of VTE prophylaxis.
Overall, VTE remains a large contributor to morbidity and mortality among hospitalized surgical patients. While there is utility in PSI-12 as a screening tool to identify these events and potential areas for improved processes to decrease VTE, its usefulness for detection of true quality issues and its utilization in pay-for-performance is questionable. The universally high rates of VTE prophylaxis question the need for a VTE prophylactic metric. However, if these metrics are going to continue to be used in determining payments, modifications to the current processes and algorithms are needed to improve accuracy in identifying issues in quality of care.
1. Valsami S, Asmis LM. A brief review of 50 years of perioperative thrombosis and hemostasis management. Semin Hematol. 2013;50(2):79-87. https://doi.org/10.1053/j.seminhematol.2013.04.001.
2. Collins R, Scrimgeour A, Yusuf S, Peto R. Reduction in fatal pulmonary embolism and venous thrombosis by perioperative administration of subcutaneous heparin. N Engl J Med. 1988;318(18):1162-1173. https://doi.org/10.1056/NEJM198805053181805.
3. Heit JA, Crusan DJ, Ashrani AA, Petterson TM, Bailey KR. Effect of a near-universal hospitalization-based prophylaxis regimen on annual number of venous thromboembolism events in the US. Blood. 2017;130(2):109-114. https://doi.org/10.1182/blood-2016-12-758995.
4. Landrigan CP, Parry GJ, Bones CB, Hackbarth AD, Goldmann DA, Sharek PJ. Temporal trends in rates of patient harm resulting from medical care. N Engl J Med. 2010;363(22):2124-2134. https://doi.org/10.1056/NEJMsa1004404.
5. Agency for Healthcare Research and Quality. Patient Safety Indicators Brochure. 2015 Edition. https://www.qualityindicators.ahrq.gov/Downloads/Modules/PSI/V50/PSI_Brochure.pdf. Accessed 10 Jun 2019.
6. Centers for Medicare & Medicaid Services. CMS Hospital Value-Based Purchasing Program Results for Fiscal Year 2018. 2017. https://www.cms.gov/newsroom/fact-sheets/cms-hospital-value-based-purchasing-program-results-fiscal-year-2018. Accessed June 10, 2019.
7. Rajaram R, Barnard C, Bilimoria KY. Concerns about using the patient safety indicator-90 composite in pay-for-performance programs. JAMA. 2015;313(9):897-898. https://doi.org/10.1001/jamacardio.2018.2382.
8. Agency for Healthcare Research and Quality. Patient Safety Indicator 12 (PSI 12) Perioperative Pulmonary Embolism or Deep Vein Thrombosis Rate. 2017. https://www.qualityindicators.ahrq.gov/Downloads/Modules/PSI/V60-ICD09/TechSpecs/PSI_12_Perioperative_Pulmonary_Embolism_or_Deep_Vein_Thrombosis_Rate.pdf. Accessed June 9, 2019.
9. Kaafarani HM, Borzecki AM, Itani KM, et al. Validity of selected patient safety indicators: opportunities and concerns. J Am Coll Surg. 2011;212(6):924-934. https://doi.org/10.1016/j.jamcollsurg.2010.07.007.
10. Bilimoria KY, Chung J, Ju MH, et al. Evaluation of surveillance bias and the validity of the venous thromboembolism quality measure. JAMA. 2013;310(14):1482-1489. https://doi.org/10.1001/jama.2013.280048.
11. Blay E, Jr., Huang R, Chung JW, et al. Evaluating the impact of the venous thromboembolism outcome measure on the PSI 90 composite quality metric. Jt Comm J Qual Patient Saf. 2019;45(3):148-155. https://doi.org/10.1016/j.jcjq.2018.08.009
12. Henderson KE, Recktenwald A, Reichley RM, et al. Clinical validation of the AHRQ postoperative venous thromboembolism patient safety indicator. Jt Comm J Qual Patient Saf. 2009;35(7):370-376.
13. Douketis JD, Spyropoulos AC, Spencer FA, et al. Perioperative management of antithrombotic therapy: antithrombotic therapy and prevention of thrombosis, 9th ed: American College of Chest Physicians Evidence-Based Clinical Practice Guidelines. Chest. 2012;141(2):e326S-e350S. https://doi.org/10.1378/chest.11-2298.
14. Agency for Healthcare Research and Quality. Appendix E: Surgical Discharge MS-DRGs. 2018. https://www.qualityindicators.ahrq.gov/Downloads/Modules/PSI/V2018/TechSpecs/PSI_Appendix_E.pdf. Accessed June 9, 2019.
15. Anderson FA, Jr., Spencer FA. Risk factors for venous thromboembolism. Circulation. 2003;107(23 Suppl 1):I9-16. https://doi.org/10.1161/01.CIR.0000078469.07362.E6.
16. Caprini JA. Thrombosis risk assessment as a guide to quality patient care. Dis Mon. 2005;51(2-3):70-78. https://doi.org/10.1016/j.disamonth.2005.02.003.
17. Agency for Healthcare Research and Quality. Appendix A: Operating Room Procedure Codes. 2018. https://www.qualityindicators.ahrq.gov/Downloads/Modules/PSI/V2018/TechSpecs/PSI_Appendix_A.pdf. Accessed June 9, 2019
18. Silverstein MD, Heit JA, Mohr DN, Petterson TM, O’Fallon WM, Melton LJ, 3rd. Trends in the incidence of deep vein thrombosis and pulmonary embolism: a 25-year population-based study. Arch Intern Med. 1998;158(6):585-593. https://doi.org/10.1001/archinte.158.6.585.
19. Borzecki AM, Chen Q, O’Brien W, et al. The patient safety indicator perioperative pulmonary embolism or deep vein thrombosis: is there associated surveillance bias in the veterans health administration? Am J Surg. 2018;216(5):974-979. https://doi.org/10.1016/j.amjsurg.2018.06.023.
20. Carrier M, Righini M, Wells PS, et al. Subsegmental pulmonary embolism diagnosed by computed tomography: incidence and clinical implications. A systematic review and meta-analysis of the management outcome studies. J Thromb Haemost. 2010;8(8):1716-1722. https://doi.org/10.1111/j.1538-7836.2010.03938.x.
21. Quan H, Eastwood C, Cunningham CT, et al. Validity of AHRQ patient safety indicators derived from ICD-10 hospital discharge abstract data (chart review study). BMJ Open. 2013;3(10):e003716. https://doi.org/10.1136/bmjopen-2013-003716.
22. Flanders SA, Greene MT, Grant P, et al. Hospital performance for pharmacologic venous thromboembolism prophylaxis and rate of venous thromboembolism: a cohort study. JAMA Intern Med. 2014;174(10):1577-1584. https://doi.org/10.1001/jamainternmed.2014.3384.
23. Wang TF, Wong CA, Milligan PE, Thoelke MS, Woeltje KF, Gage BF. Risk factors for inpatient venous thromboembolism despite thromboprophylaxis. Thromb Res. 2014;133(1):25-29. https://doi.org/10.1016/j.thromres.2013.09.011.
24. Gangireddy C, Rectenwald JR, Upchurch GR, et al. Risk factors and clinical impact of postoperative symptomatic venous thromboembolism. J Vass Surg. 2007;45(2):335-341; discussion 341-332. https://doi.org/10.1016/j.jvs.2006.10.034.
25. Lau BD, Streiff MB, Pronovost PJ, Haut ER. Venous thromboembolism quality measures fail to accurately measure quality. Circulation. 2018;137(12):1278-1284. https://doi.org/10.1161/CIRCULATIONAHA.116.026897.
Perioperative venous thromboembolism (VTE) is a major contributor to the morbidity and mortality of hospitalized patients. The historical incidence of postoperative VTE varied between 15%-80% depending on the type of procedure and monitoring strategies. Higher incidences of VTE occurred with major surgery (15%-40%), knee or hip arthroplasty (40%-60%), and trauma (60%-80%).1 The use of VTE prophylaxis with subcutaneous heparin reduced DVTs by 70% and PEs by 50%.2 A recent study from Olmstead County showed improved adherence to inpatient VTE prophylaxis from 2005 to 2010 but no difference in VTE incidence. However, 52% of VTE events were associated with hospitalization.3 As such, VTE continues to be a healthcare-associated adverse event, and surgery remains a significant risk factor for thrombosis.4
The Agency for Healthcare Research and Quality (AHRQ) released Patient Safety Indicators (PSI) in 2003 to provide a means of screening for adverse events.5 Over time, PSIs have been adopted as a measure of hospital performance and are utilized in several pay-for-performance programs. PSI-90 is a composite measure of several other PSIs and is a core metric in the Centers for Medicare and Medicaid Services (CMS) Hospital-Acquired Condition Reduction Program and the Hospital Value-Based Purchasing Program which impacts up to 2% of a hospital’s Medicare payments.6,7 One component of PSI-90 is PSI-12, which captures perioperative VTE. PSI-12 events are identified using software that screens medical records based on International Classification of Diseases (ICD)-9/10 codes for thrombosis and procedure codes at time of discharge.8
Over the last several years, there has been concern regarding the validity of including PSI-12 in pay-for-performance metrics. Common areas for concern include PSI-12’s accuracy in detecting true postoperative VTE9 in addition to surveillance bias.10,11 However, some note that PSI-12 is useful when applied with its original intent: as a screening tool for hospitals to identify specific areas to implement improvements.9,12The aim of our study was to review all PSI-12 events at our institution to evaluate the accuracy of PSI-12 and identify areas for improvement to prevent VTE events in surgical patients. While several other studies have looked at the positive predictive values, accuracy, or surveillance bias of PSI-12, to the best of our knowledge, few, if any, previous studies have reported PSI-12 events in relation to their timing, type of prophylaxis used, and mitigating factors to identify areas for quality improvement.
METHODS
PSI-12 events were identified between June 2015 and June 2017 using AHRQ software (version 5). Cases were also identified through Vizient and reviewed to ensure congruence between the methods. Patients’ electronic medical records were reviewed for patient demographics, type of VTE event, platelet count at VTE diagnosis, procedure type, and both the timing and type of VTE prophylaxis. Summary statistics were calculated.
We considered perioperative VTE pharmacologic prophylaxis appropriate if started within 24 hours of a low bleeding risk procedure or 72 hours of a high-bleeding risk procedure.13 Mechanical prophylaxis was considered appropriate if pharmacologic prophylaxis was not used because of procedure risk, thrombocytopenia, or active bleeding. The medication administration record was reviewed to determine if prophylaxis was ordered, given, and/or refused.
RESULTS
During the two-year period, 18,084 surgeries were performed, and 161 cases of VTE events were identified. A detailed chart review and correction of documentation led to the exclusion of seven cases (4%) because the VTE event occurred prior to admission (n = 5) or were incidental findings that did not meet the Uniform Hospital Discharge Data Set definition for reporting (n = 2). In total, 154 (0.9% of all surgeries) cases were considered PSI-12 events. Pulmonary embolism (PE) occurred in most cases (n = 97, 62.9%), followed by deep vein thrombosis (DVT) (n = 37, 24.0%). Twenty cases (12.9%) experienced concurrent PE and DVT. Within the PE group, 16 cases (14%) were subsegmental PE only. Eight patients (14% of DVT cases) had only a distal DVT. The mean age of patients was 56 years (+/− 16 years), and the majority (59%) were male. The clinical specialties with the most events included neurosurgery (21%), orthopedics (14%), general surgery (13%), and trauma (11%). Fourteen patients (9%) died during the hospitalization, and of these, six (43%) had either sudden death or death attributed to PE (Table 1).
Cases were also reviewed for the type of VTE prophylactic strategy administered at the time of the event. The top three prophylactic strategies were subcutaneous unfractionated heparin (61%), mechanical prophylaxis only (51%), and enoxaparin (31%). Nine cases of VTE occurred during therapeutic anticoagulation (6%; Table 1).
We also evaluated the timing of VTE in relation to hospitalization and procedure. Overall, the median length of hospital stay was 21 days (range: 11-39 days). VTE occurred early in the hospitalization; 21% of cases of VTE occurred within three days of admission, and 43.5% occurred within seven days of admission (Figure 1). With regard to VTE timing in relation to the procedure, 4.5% of cases of VTE occurred prior to the procedure, 33% occurred within three days of the procedure, and 53% occurred within seven days (Figure 2).
Absence of guideline-appropriate VTE prophylaxis was identified in only nine (6%) cases: seven patients had delayed initiation of pharmacologic prophylaxis, and two had pharmacologic prophylaxis held for unknown reasons. When accounting for pharmacologic prophylaxis missed based on patient refusal (n = 10 patients), the number of patients without guideline- appropriate VTE prophylaxis increased to 17 cases (11%), as two of the cases with patient refusal were found to have other quality issues present. Pharmacologic prophylaxis was given to 125 patients during their hospitalization. A median of 8% of ordered doses was refused, and an additional 8% of doses were held for a procedure (Table 2). We evaluated other factors that could have influenced the rate or type of VTE prophylactic strategies toward the use of mechanical prophylaxis, including thrombocytopenia and trauma. Although 11% of cases were treated primarily by the trauma teams (Table 1), a trauma-related procedure accounted for 29% of PSI-12 cases. Thrombocytopenia (platelets of less than 100,000) occurred in 53 cases (34%), with 27 patients (18%) having a platelet count of less than 50,000.
DISCUSSION
Utilizing AHRQ version 5 software for PSI-12, our institution identified 154 cases of perioperative VTE. Most of these cases were a pulmonary embolism, occurred within a week of admission, and were associated with surgical specialties that portend a higher risk of VTE. Very few of these cases were deficient in guideline-directed VTE prophylaxis, and several cases had associated factors such as trauma and thrombocytopenia that may have appropriately influenced the decision to use mechanical only prophylaxis. Sixteen percent of pharmacologic VTE prophylactic doses were refused or held for a procedure, a known but rarely quantified influence on rates of pharmacologic prophylaxis. The use of patient-level data and adjudication of the clinical decision that affected the administration of VTE prophylaxis is a major strength of this work. In all, our data raise several questions about the accuracy of PSI-12 in identifying preventable postoperative VTE, especially as it is utilized as a marker for pay-for-performance measures in addition to identifying further areas for research and improvement.
Our results align with previous studies that suggest that PSI-12 is an inaccurate measure of performance quality. A study by Bilimoria et al. in 2013 noted that surveillance biases associated with PSI-12, showing that hospitals with higher compliance to appropriate VTE prophylaxis paradoxically had worse outcomes.10 Furthermore, Blay et al. recently published a study evaluating PSI-90 scores for hospitals with and without the VTE measure included. Their results indicated that larger hospitals (teaching hospitals, level I trauma centers, etc) caring for sicker patients were noted to improve by 8%-25% when the VTE measure was removed.11 Similarly, our data indicate that the PSI-12 may not be an accurate measure of quality performance, as only 6% of cases were noted to be deficient in appropriate guideline-directed prophylaxis. Even when accounting for the refusal of doses of pharmacologic prophylaxis, this figure only increased to 11%.
Procedures included in the current PSI-12 algorithm also vary in the risk they pose to developing VTE. For example, the current version of PSI-12 includes surgical Medicare Severity Diagnosis Related Groups (MS-DRGs) for procedures with a high risk of VTE such as orthopedic, abdominal, or thoracic procedures.14,15, However, it is worth noting that procedures such as tracheostomy and ocular surgery are also included.14 The variation in risk for development of VTE is reflected in the Caprini score, a perioperative risk stratification tool. These latter procedures only contribute one point, whereas trauma would add five points each to the total score, and make the patient a high VTE risk from the procedure alone.16
While most of our cases of VTE occurred within higher risk surgical subspecialties, 15 (10%) of our cases were within the clinical specialties of interventional radiology, cardiology, gastroenterology, and bone marrow transplant. One procedure of notable conflict includes bronchoalveolar lavage (BAL), which is included as an operating room procedure per the current version of PSI-12 software,17 but is no longer recognized by CMS as a surgical MS-DRG for reimbursement. The PSI-12 observed-to-expected rates take the DRG and comorbidity codes into consideration, but which DRG is selected does not always reflect the procedure type or the risk of VTE associated with the procedure.
Regarding the type of VTE event, our data revealed that PE was the predominant event, accounting for 62% of cases. This is different compared with other studies, such as the population-based studies in which PE and DVT account for approximately 40%-42% of events, respectively, and approximately 15% with concurrent PE and DVT. 9,18 Borzecki et al. however, noted similar rates to our study, with 55% as PE only, 38% as DVT only, and 8% had both PE and DVT. This study also found a positive correlation between PSI-12 rates and VTE imaging rates, such that if more CT scans were completed, more PEs could be found.19 Our data identified 16 of the 97 cases of PE were subsegmental PE, a subset of VTE whose clinical significance has been questioned.20 Excluding these cases brings the percentage closer to 52%. Also, screening ultrasounds are not performed at our institution. Asymptomatic or minimally symptomatic DVTs could be missed.
Further, this study also highlights that the reliability of PSI-12 is dependent on accurate documentation and coding. This is most evident when reviewing studies that evaluated the positive predictive value (PPV) of this measure.9,12,21 A study of 28 Veteran’s Affairs hospitals from 2003 to 2007 used the AHRQ version 3 software to assess the PPV of PSI-12. Out of the 112 cases flagged by the AHRQ PSI software, only 48 were true events of postoperative DVT, yielding a PPV of only 43%. False-positive results were primarily patients with VTE present on admission and cases that were diagnosed after admission but prior to the index procedure. They also noted that coding inaccuracies were present in 38% of cases.9 Similarly, Henderson et al. conducted a retrospective review of 112 postsurgical discharges noting a PPV of 54%, with most false-positives resulting from superficial clots identified by PSI-12 related to coding ambiguity.12 Our data similarly showed false-positive results as seven cases were excluded based on chart review and documentation correction, and 4.5% were preprocedural. However, there is some discordance with previous studies, as our data yields a PPV of 91% for VTE when accounting for preprocedural events as well as those excluded based on chart review. One explanation is an improvement in documentation strategies and coding, as our institution has adopted strategies to review cases and clarify documentation prior to billing to improve accuracy, and inclusion of a checkbox to indicate that a diagnosis was present on admission. Another possibility is improved accuracy with ICD-10 coding, as shown in a paper by Quan et al. that found a 79% PPV of PSI-12, which improved to 89% when cases present on admission were excluded.21 Lastly, we used newer versions of the AHRQ software, which could have improved the accuracy of detection. Despite these improvements in PSI-12 identifying true cases of postoperative VTE, as our data show, there is still much to be desired in terms of identifying issues with the quality of care and inclusion of PSI-12 in pay-for-performance.
Our study has several limitations. As a retrospective review, a major limiting factor is that data obtained are subject to the accuracy of documentation within the provider and nursing notes. As such, we focused on broad topics such as VTE events, the type of VTE event, and timing of the event in relation to admission and procedure. We actively review cases at discharge prior to billing to correct documentation if required. However, a prolonged hospital stay could lead to a review of the case weeks to months later. A real-time alert for a VTE event in a patient with surgery could improve documentation.
Further, although mechanical only prophylaxis was present on chart review, it is impossible to know both the rate of compliance with this method and whether it contributed to some events.
Despite these limitations, our goals of evaluating the validity of PSI-12 and identifying areas for improved measurement and techniques for DVT prophylaxis were met. As previously discussed, our data suggest that PSI-12 has several limitations in identifying quality of care issues with the prevention of DVT. For example, PSI-12 included many cases in which pharmacologic prophylaxis was appropriately not given. Approximately 50% of cases occurred in patients who were thrombocytopenic (platelets < 100,000), and 29% of events occurred in trauma patients. In addition, 33% of cases identified were within three days of the procedure, which, in cases of high-bleeding risk procedures, is an appropriate time to refrain from pharmacologic anticoagulation.13 In cases such as these, it may be worth evaluating alternative forms of mechanical only prophylaxis, or other strategies to mitigate this risk.
This study also highlights areas for further research. Many of the VTE events in this study occurred while patients were treated with appropriate prophylaxis, as other studies have also shown.22,23 Gangireddy et al. looked at demographic and clinical information surrounding postoperative VTE and found several other risk factors that incur a higher risk of VTE, including steroid use, infections, and myocardial infarction.24 Perhaps future studies could target these groups as potential points for increased prophylactic strategies. As noted by Lau et al. appropriate VTE prophylaxis involves risk stratification, ordering the appropriate prophylaxis by clinicians, patient acceptance of prescribed therapy, and nursing administration of prescribed therapy.25 As exemplified by our data, despite appropriate prophylaxis being ordered, eight events were associated solely with the refusal of pharmacologic prophylaxis. An ideal VTE metric would identify patients with a VTE who had a defective VTE prophylactic process,25 but the cost associated with manual data abstraction may limit the inclusion of a process metric into pay-for-performance. Additional research also needs to identify whether modifications to PSI-12 can improve its accuracy and predictive value, such as the exclusion of VTE prior to a procedure, modifications to what counts as a procedure, or utilizing markers to assess adherence to VTE prophylactic rates. These points are especially important to consider if PSI-12 is to remain as one of the key factors in pay-for-performance outcome measures. Lastly, understanding the effectiveness and patient adherence to oral VTE prophylactic regimens could also decrease the rates of refusal of VTE prophylaxis.
Overall, VTE remains a large contributor to morbidity and mortality among hospitalized surgical patients. While there is utility in PSI-12 as a screening tool to identify these events and potential areas for improved processes to decrease VTE, its usefulness for detection of true quality issues and its utilization in pay-for-performance is questionable. The universally high rates of VTE prophylaxis question the need for a VTE prophylactic metric. However, if these metrics are going to continue to be used in determining payments, modifications to the current processes and algorithms are needed to improve accuracy in identifying issues in quality of care.
1. Valsami S, Asmis LM. A brief review of 50 years of perioperative thrombosis and hemostasis management. Semin Hematol. 2013;50(2):79-87. https://doi.org/10.1053/j.seminhematol.2013.04.001.
2. Collins R, Scrimgeour A, Yusuf S, Peto R. Reduction in fatal pulmonary embolism and venous thrombosis by perioperative administration of subcutaneous heparin. N Engl J Med. 1988;318(18):1162-1173. https://doi.org/10.1056/NEJM198805053181805.
3. Heit JA, Crusan DJ, Ashrani AA, Petterson TM, Bailey KR. Effect of a near-universal hospitalization-based prophylaxis regimen on annual number of venous thromboembolism events in the US. Blood. 2017;130(2):109-114. https://doi.org/10.1182/blood-2016-12-758995.
4. Landrigan CP, Parry GJ, Bones CB, Hackbarth AD, Goldmann DA, Sharek PJ. Temporal trends in rates of patient harm resulting from medical care. N Engl J Med. 2010;363(22):2124-2134. https://doi.org/10.1056/NEJMsa1004404.
5. Agency for Healthcare Research and Quality. Patient Safety Indicators Brochure. 2015 Edition. https://www.qualityindicators.ahrq.gov/Downloads/Modules/PSI/V50/PSI_Brochure.pdf. Accessed 10 Jun 2019.
6. Centers for Medicare & Medicaid Services. CMS Hospital Value-Based Purchasing Program Results for Fiscal Year 2018. 2017. https://www.cms.gov/newsroom/fact-sheets/cms-hospital-value-based-purchasing-program-results-fiscal-year-2018. Accessed June 10, 2019.
7. Rajaram R, Barnard C, Bilimoria KY. Concerns about using the patient safety indicator-90 composite in pay-for-performance programs. JAMA. 2015;313(9):897-898. https://doi.org/10.1001/jamacardio.2018.2382.
8. Agency for Healthcare Research and Quality. Patient Safety Indicator 12 (PSI 12) Perioperative Pulmonary Embolism or Deep Vein Thrombosis Rate. 2017. https://www.qualityindicators.ahrq.gov/Downloads/Modules/PSI/V60-ICD09/TechSpecs/PSI_12_Perioperative_Pulmonary_Embolism_or_Deep_Vein_Thrombosis_Rate.pdf. Accessed June 9, 2019.
9. Kaafarani HM, Borzecki AM, Itani KM, et al. Validity of selected patient safety indicators: opportunities and concerns. J Am Coll Surg. 2011;212(6):924-934. https://doi.org/10.1016/j.jamcollsurg.2010.07.007.
10. Bilimoria KY, Chung J, Ju MH, et al. Evaluation of surveillance bias and the validity of the venous thromboembolism quality measure. JAMA. 2013;310(14):1482-1489. https://doi.org/10.1001/jama.2013.280048.
11. Blay E, Jr., Huang R, Chung JW, et al. Evaluating the impact of the venous thromboembolism outcome measure on the PSI 90 composite quality metric. Jt Comm J Qual Patient Saf. 2019;45(3):148-155. https://doi.org/10.1016/j.jcjq.2018.08.009
12. Henderson KE, Recktenwald A, Reichley RM, et al. Clinical validation of the AHRQ postoperative venous thromboembolism patient safety indicator. Jt Comm J Qual Patient Saf. 2009;35(7):370-376.
13. Douketis JD, Spyropoulos AC, Spencer FA, et al. Perioperative management of antithrombotic therapy: antithrombotic therapy and prevention of thrombosis, 9th ed: American College of Chest Physicians Evidence-Based Clinical Practice Guidelines. Chest. 2012;141(2):e326S-e350S. https://doi.org/10.1378/chest.11-2298.
14. Agency for Healthcare Research and Quality. Appendix E: Surgical Discharge MS-DRGs. 2018. https://www.qualityindicators.ahrq.gov/Downloads/Modules/PSI/V2018/TechSpecs/PSI_Appendix_E.pdf. Accessed June 9, 2019.
15. Anderson FA, Jr., Spencer FA. Risk factors for venous thromboembolism. Circulation. 2003;107(23 Suppl 1):I9-16. https://doi.org/10.1161/01.CIR.0000078469.07362.E6.
16. Caprini JA. Thrombosis risk assessment as a guide to quality patient care. Dis Mon. 2005;51(2-3):70-78. https://doi.org/10.1016/j.disamonth.2005.02.003.
17. Agency for Healthcare Research and Quality. Appendix A: Operating Room Procedure Codes. 2018. https://www.qualityindicators.ahrq.gov/Downloads/Modules/PSI/V2018/TechSpecs/PSI_Appendix_A.pdf. Accessed June 9, 2019
18. Silverstein MD, Heit JA, Mohr DN, Petterson TM, O’Fallon WM, Melton LJ, 3rd. Trends in the incidence of deep vein thrombosis and pulmonary embolism: a 25-year population-based study. Arch Intern Med. 1998;158(6):585-593. https://doi.org/10.1001/archinte.158.6.585.
19. Borzecki AM, Chen Q, O’Brien W, et al. The patient safety indicator perioperative pulmonary embolism or deep vein thrombosis: is there associated surveillance bias in the veterans health administration? Am J Surg. 2018;216(5):974-979. https://doi.org/10.1016/j.amjsurg.2018.06.023.
20. Carrier M, Righini M, Wells PS, et al. Subsegmental pulmonary embolism diagnosed by computed tomography: incidence and clinical implications. A systematic review and meta-analysis of the management outcome studies. J Thromb Haemost. 2010;8(8):1716-1722. https://doi.org/10.1111/j.1538-7836.2010.03938.x.
21. Quan H, Eastwood C, Cunningham CT, et al. Validity of AHRQ patient safety indicators derived from ICD-10 hospital discharge abstract data (chart review study). BMJ Open. 2013;3(10):e003716. https://doi.org/10.1136/bmjopen-2013-003716.
22. Flanders SA, Greene MT, Grant P, et al. Hospital performance for pharmacologic venous thromboembolism prophylaxis and rate of venous thromboembolism: a cohort study. JAMA Intern Med. 2014;174(10):1577-1584. https://doi.org/10.1001/jamainternmed.2014.3384.
23. Wang TF, Wong CA, Milligan PE, Thoelke MS, Woeltje KF, Gage BF. Risk factors for inpatient venous thromboembolism despite thromboprophylaxis. Thromb Res. 2014;133(1):25-29. https://doi.org/10.1016/j.thromres.2013.09.011.
24. Gangireddy C, Rectenwald JR, Upchurch GR, et al. Risk factors and clinical impact of postoperative symptomatic venous thromboembolism. J Vass Surg. 2007;45(2):335-341; discussion 341-332. https://doi.org/10.1016/j.jvs.2006.10.034.
25. Lau BD, Streiff MB, Pronovost PJ, Haut ER. Venous thromboembolism quality measures fail to accurately measure quality. Circulation. 2018;137(12):1278-1284. https://doi.org/10.1161/CIRCULATIONAHA.116.026897.
© 2019 Society of Hospital Medicine
Imaging Strategies and Outcomes in Children Hospitalized with Cervical Lymphadenitis
Cervical lymphadenitis is a common superficial neck infection in childhood. While most children with cervical lymphadenitis recover with antibiotic therapy, a subset can develop an abscess that may require surgical drainage. Radiologic imaging, most commonly ultrasound or computed tomography (CT), is often performed to identify such an abscess.1-3 However, no national standards exist to guide clinician decision making around imaging in this population. In the absence of evidence-based guidelines, variability in frequency, timing, and modality of imaging likely exists in children hospitalized with cervical lymphadenitis.
As demonstrated for several other common pediatric conditions,4,5 variability in imaging practices may contribute to overutilization of resources in children with cervical lymphadenitis. In particular, routinely conducting imaging on presentation may constitute overuse, as children with cervical lymphadenitis who present with less than 72 hours of neck swelling rarely undergo surgical drainage within the first 24 hours of hospitalization.1,6,7 Imaging performed on presentation is often repeated later during hospitalization, particularly if the patient has not improved with antibiotic therapy. The net result may be unnecessary, redundant radiologic studies. Furthermore, serious complications such as bacteremia, extension of infection into the retropharyngeal space, or involvement of the airway or vasculature rarely occur in children with cervical lymphadenitis.6,8 In this context, deferring initial imaging in this population is unlikely to lead to adverse outcomes and may reduce radiation exposure.
The overall objectives of this study are to describe hospital-level variation in imaging practices for pediatric cervical lymphadenitis and to examine the association between early imaging and outcomes in this population.
METHODS
Study Design and Data Source
We conducted a multicenter, cross-sectional study using the Pediatric Health Information Systems (PHIS) database, which contains administrative and billing data from 49 geographically diverse children’s hospitals across the United States (US) affiliated with the Children’s Hospital Association (Lenexa, Kansas). PHIS includes data on patient demographics, discharge diagnoses, and procedures using the International Classification of Diseases, 9th (ICD-9) and 10th Revision (ICD-10) diagnosis codes, as well as daily billed resource utilization for laboratory tests, imaging studies, and medications. Encrypted medical record numbers permit longitudinal identification of children across multiple visits to the same hospital. Use of de-identified PHIS data was deemed to be nonhuman subjects research; our approach to validation of ICD codes using local electronic medical record review was reviewed and approved by the Cincinnati Children’s Hospital Medical Center Institutional Review Board.
Study Population
Our study team developed an algorithm to identify children with cervical lymphadenitis and minimize misclassification using PHIS (Appendix A). All children with lymphadenitis-related ICD-9 and ICD-10 discharge diagnosis codes were eligible for inclusion.
This algorithm was subsequently applied to the PHIS database. Children ages two months to 18 years hospitalized at participating PHIS institutions between July 2013 and December 2017 with a diagnosis of cervical lymphadenitis as per th
Measures of Interest
To examine hospital-level variation in imaging practices, we measured the proportion of children at each hospital who underwent any neck imaging study, CT or ultrasound imaging, early imaging, and multiple imaging studies within a single hospitalization. Neck imaging was defined as the presence of a billing code for ultrasound, CT, or magnetic resonance imaging (MRI) study of the neck (Appendix B). Early imaging was defined as neck imaging conducted on day 0 of hospitalization (ie, calendar day of admission and ending at midnight). Multiple imaging studies were defined as the receipt of more than one imaging study, regardless of timing or modality. We also measured the proportion of children by hospital who received surgical drainage, defined by the presence of procedure codes for incision and drainage of abscess of the neck (Appendix B).
In examining patient-level association between early imaging and clinical outcomes, our primary outcome of interest was the receipt of multiple imaging studies. Secondary outcomes included rates of surgical drainage, length of stay (in hospital days), and rates of lymphadenitis-related hospital readmission within 30 days of index discharge.
Covariates
Baseline demographic characteristics included age, gender, race/ethnicity, and insurance type. We measured ED visits associated with lymphadenitis-related diagnosis codes in the 30 days prior to admission as a proxy measure for illness duration prior to presentation. To approximate illness severity, we included the following covariates: rates of intensive care unit admission on presentation, rates of receipt of intravenous (IV) analgesia (Appendix B) on hospital days prior to surgical drainage, and rates of receipt of broad-spectrum antibiotics on day 0 or 1 of hospitalization. Broad-spectrum antibiotics (Appendix B) were defined by an independent three-person review of available antibiotic codes (SD, SSS, and JT); differences were resolved by group consensus.
Analysis
Categorical variables were described using frequencies and percentages, while continuous data were described using median and interquartile range. We described hospital-level variation in imaging practices by calculating and comparing the proportion of children at each hospital who underwent any neck imaging study, CT imaging, ultrasound imaging, early imaging, multiple imaging studies, and surgical drainage.
Patient-level demographics and clinical characteristics were compared across groups using chi-square test. To examine the association between early imaging and outcomes, we used generalized linear or logistic mixed effects models to control for patient demographic characteristics and clinical markers of illness duration and severity, with a random effect for hospital to account for clustering. Patient demographics in the model defined a priori included age, race/ethnicity, and insurance type; clinical characteristics included prior ED visit for lymphadenitis, initial intensive care unit (ICU) admission, use of IV analgesia, and use of broad-spectrum antibiotics on day 0 or 1 of hospitalization. To assess the potential for misclassification related to the availability of calendar day but not time of imaging in PHIS, we conducted a secondary analysis to examine the patient-level association between early imaging and outcomes using an alternative definition for early imaging (defined as imaging conducted on day 0 or day 1 of hospitalization).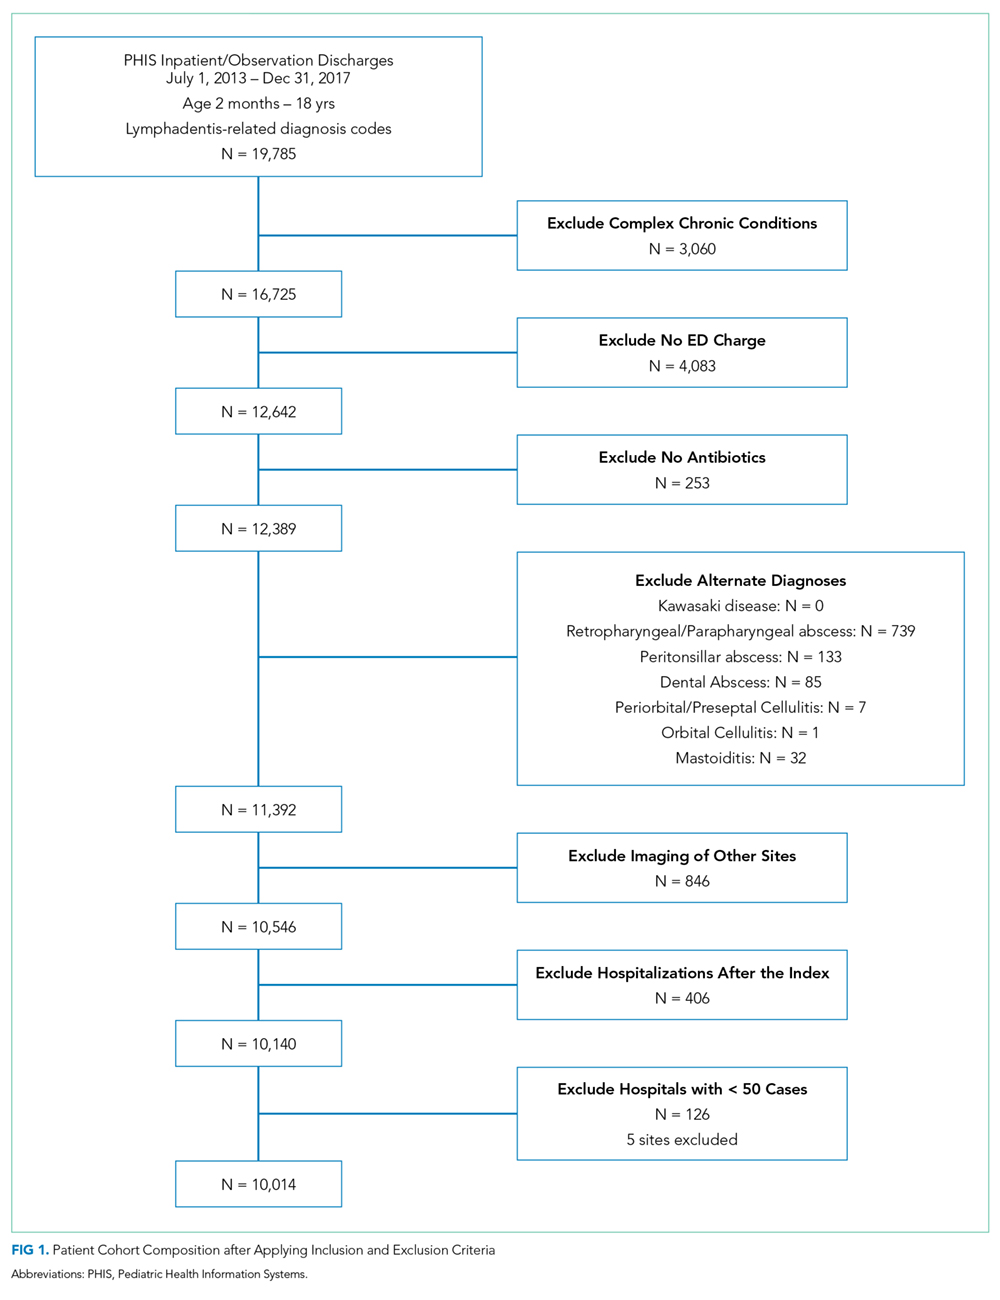
All statistical analyses were performed by using SAS version 9.4 (SAS Institute, Cary, North Carolina); P < .05 was considered statistically significant.
RESULTS
We identified 19,785 PHIS hospitalizations with lymphadenitis-related discharge diagnosis codes between July 1, 2013 and December 31, 2017. Applying our algorithm and exclusion criteria, we assembled a cohort of 10,014 children hospitalized with cervical lymphadenitis (Figure 1). Two-thirds of the children in our cohort were <4 years old, 42% were non-Hispanic white, and 63% had a government payor (Table 1). Neck imaging (ultrasound, CT, or MRI) was conducted in 8,103 (81%) children. CT imaging was performed in 4,097 (41%) of children, and early imaging was conducted in 6,111 (61%) of children with cervical lymphadenitis.
We noted hospital-level variation in rates of any neck imaging (median: 82.1%, interquartile range [IQR]: 77.7%-85.5%, full range: 68.7%-93.1%), CT imaging (median: 42.3%, IQR: 26.7%-55.2%, full range: 12.0%-81.5%), early imaging (median: 64.4%, IQR: 59.8%-68.4%, full range: 13.8%-76.9%), and multiple imaging studies (median: 23.7%, IQR: 18.6%-28.9%, full range: 1.2%-40.7%; Figure 2). Rates of surgical drainage also varied by hospital (median: 35.1%, IQR: 31.3%-42.0%, full range: 17.1%-54.5%).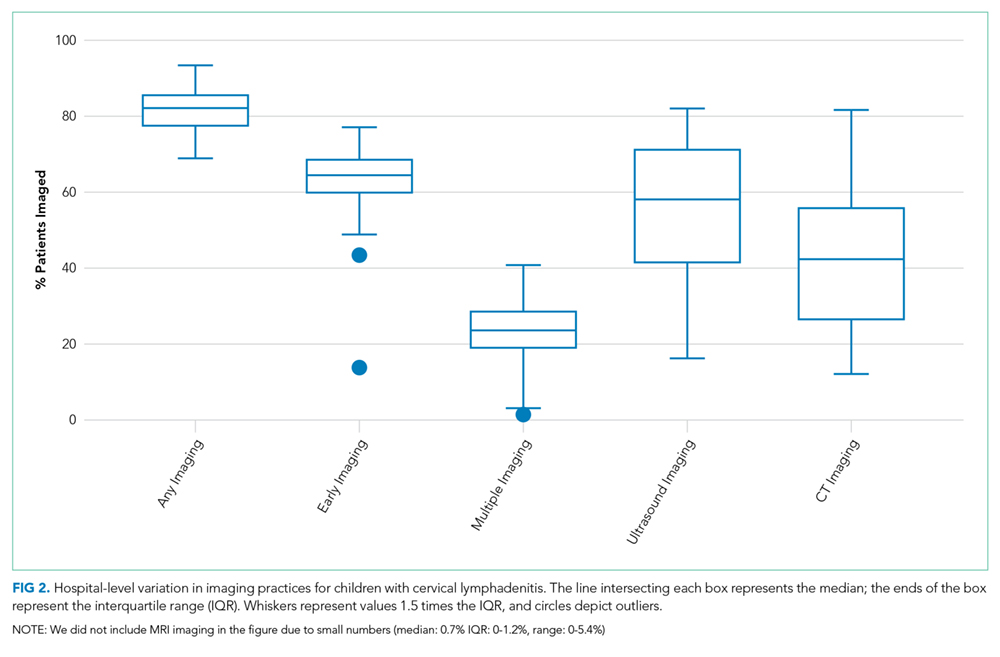
At the patient level, children who received early imaging were more likely to be <1 year old (21% vs 16%, P < .001), or Hispanic or Black when compared with children who did not receive early imaging (Table 1). Children who received early imaging were more likely to have had an ED visit for lymphadenitis in the preceding 30 days (8% vs 6%, P = .001). However, they were less likely to have received broad-spectrum antibiotics on admission (6% vs 8%, P < .001; Table 1). Of the 6,111 patients who received early imaging, 2,538 (41.5%) received CT imaging and 3,902 (63.9%) received ultrasound imaging on day 0. Of the 2,272 patients receiving multiple imaging studies, 116 (5.1%) received two or more CT scans.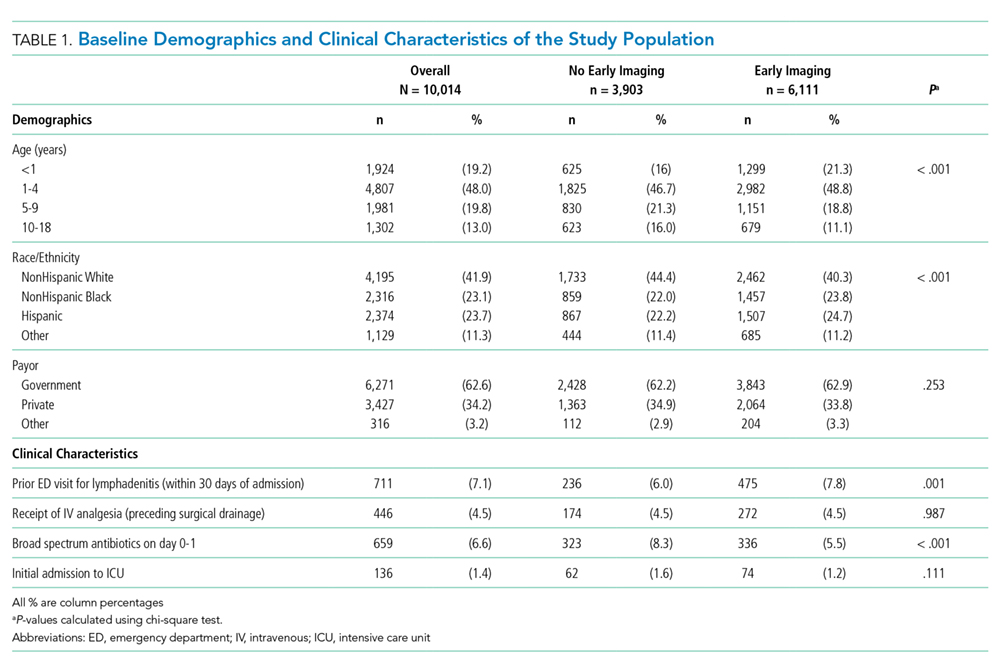
In multivariable analysis at the patient level, early imaging was associated with higher adjusted odds of receiving multiple imaging studies (adjusted odds ratio [aOR] 3.0, 95% CI: 2.6-3.6). Similarly, early imaging was associated with higher adjusted odds of surgical drainage (aOR: 1.3, 95% CI: 1.1-1.4), increased 30-day readmission for lymphadenitis (aOR: 1.5, 95% CI: 1.2-1.9), and longer length of stay (adjusted rate ratio: 1.2, 95% CI: 1.1-1.2; Table 2). For the subset of patients who did not receive surgical drainage during the index admission, the adjusted odds ratio for the association between early imaging at index admission and 30-day readmission was 1.7 (95% CI: 1.3-2.1). About 63% of readmissions occurred within 7 days of index discharge; 89% occurred within 14 days (Appendix Figure).
In secondary analysis using an alternative definition for early imaging (ie, imaging conducted on day 0 or day 1 of hospitalization), the adjusted odds ratio for multiple imaging studies was 22.6 (95% CI: 15.8-32.4). The adjusted odds and rate ratios for the remaining outcomes were similar to our primary analysis.
DISCUSSION
In this large multicenter study of children with cervical lymphadenitis, we found variation in imaging practices across 44 US children’s hospitals. Children with cervical lymphadenitis who underwent early imaging were more likely to receive multiple imaging studies during a single hospitalization than those who did not receive early imaging. At the patient level, early imaging was also associated with higher rates of surgical drainage, more frequent 30-day readmission, and longer lengths of stay.
To our knowledge, imaging practices in the population of children hospitalized with cervical lymphadenitis have not been previously characterized in the US; one study from Atlanta, Georgia, describes imaging practices in all children evaluated in the ED.1 Single-center studies of children hospitalized with cervical lymphadenitis have been previously conducted in Canada6 and New Zealand,8 in which 42%-51% of children received imaging. In our study, most (81%) children hospitalized with lymphadenitis received some form of imaging, with 61% of all children receiving early imaging. Furthermore, 41% received CT imaging, as compared with 8%-10% of children in the aforementioned studies from Canada and New Zealand.6,8 This finding is consistent with a pattern of imaging overuse in the US, which has amongst the highest utilization rates globally for advanced imaging such as CT and MRI.10,11 Identifying opportunities to safely reduce routine imaging, particularly CT imaging, in this population could decrease unnecessary radiation exposure without compromising outcomes.
We also noted variability in imaging practices across PHIS hospitals. Some of this variability may be partially explained by differences in the patient population or illness severity across hospitals. However, given the absence of evidence-based best practices for children with cervical lymphadenitis, clinicians may rely on anecdotal experience or local practice culture to guide their decision making,12 leading to variability in frequency, timing, and modality of imaging.
At the patient level, we found that children who received early imaging were more likely to receive multiple imaging studies. This finding supports our hypothesis that clinicians often order a second imaging study when the initial imaging study does not clearly demonstrate an abscess, and the child subsequently fails to demonstrate clear improvement after 24-48 hours of antibiotics.
Furthermore, early imaging was associated with overall increased utilization in our cohort, including increased likelihood of surgical drainage, 30-day readmission for lymphadenitis, as well as longer lengths of stay. Confounding may be one explanation for this finding. For instance, clinicians may pursue early imaging in children who present with longer duration of symptoms or more severe illness on presentation, as these factors may be associated with abscess formation.1,6,7 These clinical covariates are not available in PHIS. Thus, we used prior ED visits for lymphadenitis to approximate illness duration, and initial admission to ICU, receipt of IV analgesia, and receipt of broad-spectrum antibiotics to approximate illness severity in an attempt to mitigate confounding.
On the other hand, it is also possible that a proportion of children with a small fluid collection on imaging may have improved with antibiotics alone. There is a growing body of evidence in children with other head and neck infections (eg, retropharyngeal abscess and orbital cellulitis with periosteal abscess)13-15 that suggests that children with small abscesses often improve with antibiotic therapy alone. In children with cervical lymphadenitis who have small or developing abscesses identified via routine imaging on presentation, clinicians may be driven to pursue a surgical intervention with uncertain benefit. Deferring routine imaging in this population may provide an opportunity to improve the value of care in children with lymphadenitis without adversely affecting outcomes.
This study has several limitations given our use of an administrative database. Children with lymphadenitis may have been misclassified as these patients were identified using discharge diagnosis codes
Furthermore, we were unable to measure the exact time of imaging study in PHIS; we used imaging conducted on hospital day 0 as a proxy measure for imaging conducted within the first 24 hours of presentation. With this definition, some children who had early imaging were likely misclassified as not having received early imaging. For example, a patient who arrived in the ED at 9
Additionally, there may be a subset of children who underwent imaging prior to presentation at the PHIS hospital ED for further workup and admission. Imaging conducted outside a PHIS hospital was not captured in this database. Similarly, children who had a readmission at a different hospital than their index admission would not be captured using PHIS. Finally, PHIS captures data from children’s hospitals; practices at these hospitals may not be generalizable to practices in the community hospital setting.
CONCLUSION
In conclusion, we found that imaging practices in children hospitalized with cervical lymphadenitis were widely variable across hospitals. Children receiving early imaging had more resource utilization and intervention when compared with children who did not receive early imaging. Our findings may represent a cascade effect, in which routinely conducted early imaging prompts clinicians to pursue more testing and interventions in this population. Future studies should obtain more detailed patient level covariates to further characterize clinical factors that may impact decisions around imaging and clinical outcomes for children with cervical lymphadenitis.
Acknowledgments
The authors would like to acknowledge the following investigators for their contributions to data interpretation and review of the final manuscript: Angela Choe MD, Cincinnati Children’s Hospital Medical Center, Cincinnati, Ohio; Margaret Rush MD, Children’s National Medical Center, Washington, DC; Ryosuke Takei MD, Children’s Hospital of Philadelphia, Philadelphia, Pennsylvania; Wallis Molchen DO, Texas Children’s Hospital, Houston, Texas; Stephanie Royer Moss MD, Cleveland Clinic, Cleveland, Ohio; Rebecca Dang, MD, Lucile Packard Children’s Hospital Stanford, Palo Alto, California; Joy Solano MD, Children’s Mercy Hospital Kansas, Overland Park, Kansas; Nathaniel P. Goodrich MD, Children’s Hospital & Medical Center, Omaha, Nebraska; Ngozi Eboh MD, Texas Tech University Health Sciences Center, Dallas, Texas; Ashley Jenkins MD, Cincinnati Children’s Hospital Medical Center, Cincinnati, Ohio; Rebecca Steuart MD, Cincinnati Children’s Hospital Medical Center, Cincinnati, Ohio; Sonya Tang Girdwood MD, PhD, Cincinnati Children’s Hospital Medical Center, Cincinnati, Ohio; Alissa McInerney MD, Maria Fareri Children’s Hospital at Westchester Medical Center, Valhalla, New York; Sumeet Banker MD, MPH, New York Presbyterian Morgan Stanley Children’s Hospital, New York, New York; Corrie McDaniel DO, Seattle Children’s Hospital, Seattle, Washington; Christiane Lenzen MD, Rady Children’s Hospital, San Diego, California; Aleisha Nabower MD, Children’s Hospital & Medical Center, Omaha, Nebraska; Waheeda Samady MD, Ann & Robert H. Lurie Children’s Hospital, Chicago, Illinois; Jennifer Chen MD, Rady Children’s Hospital, San Diego, California; Marquita Genies MD, MPH, John’s Hopkins Children’s Center, Baltimore, Maryland; Justin Lockwood MD, Children’s Hospital Colorado, Aurora, Colorado; David Synhorst MD, Children’s Mercy Hospital Kansas, Overland Park, Kansas.
1. Sauer MW, Sharma S, Hirsh DA et al. Acute neck infections in children: who is likely to undergo surgical drainage? Am J Emerg Med. 2013;31(6):906-909. https://doi.org/10.1016/j.ajem.2013.02.043.
2. Sethia R, Mahida JB, Subbarayan RA, et al. Evaluation of an imaging protocol using ultrasound as the primary diagnostic modality in pediatric patients with superficial soft tissue infections of the face and neck. Int J Pediatr Otorhinolaryngol. 2017;96:89-93. https://doi.org/10.1016/j.ijporl.2017.02.027.
3. Neff L, Newland JG, Sykes KJ, Selvarangan R, Wei JL. Microbiology and antimicrobial treatment of pediatric cervical lymphadenitis requiring surgical intervention. Int J Pediatr Otorhinolaryngol. 2013;77(5):817-820. https://doi.org/10.1016/j.ijporl.2013.02.018.
4. Brogan TV, Hall M, Williams DJ, et al. Variability in processes of care and outcomes among children hospitalized with community-acquired pneumonia. Pediatr Infect Dis J. 2012;31(10):1036-1041. https://doi.org/10.1097/INF.0b013e31825f2b10.
5. Conway PH, Keren R. Factors associated with variability in outcomes for children hospitalized with urinary tract infection. J Pediatr. 2009;154(6):789-796. https://doi.org/10.1016/j.jpeds.2009.01.010.
6. Luu TM, Chevalier I, Gauthier M et al. Acute adenitis in children: clinical course and factors predictive of surgical drainage. J Paediatr Child Health. 2005;41(5-6):273-277. https://doi.org/10.1111/j.1440-1754.2005.00610.x.
7. Golriz F, Bisset GS, 3rd, D’Amico B, et al. A clinical decision rule for the use of ultrasound in children presenting with acute inflammatory neck masses. Pediatr Rad. 2017;47(4):422-428. https://doi.org/10.1007/s00247-016-3774-9.
8. Courtney MJ, Miteff A, Mahadevan M. Management of pediatric lateral neck infections: does the adage “… never let the sun go down on undrained pus …” hold true? Int J Pediatr Otorhinolaryngol. 2007;71(1):95-100. https://doi.org/10.1016/j.ijporl.2006.09.009.
9. Feudtner C, Feinstein JA, Zhong W, Hall M, Dai D. Pediatric complex chronic conditions classification system version 2: updated for ICD-10 and complex medical technology dependence and transplantation. BMC Pediatr. 2014;14:199. https://doi.org/10.1186/1471-2431-14-199.
10. Papanicolas I, Woskie LR, Jha AK. Health care spending in the United States and other high-income countries. JAMA. 2018;319(10):1024-1039. https://doi.org/10.1001/jama.2018.1150.
11. Oren O, Kebebew E, Ioannidis JPA. Curbing unnecessary and wasted diagnostic imaging. JAMA. 2019;321(3):245-246. https://doi.org/10.1001/jama.2018.20295.
12. Palmer RH, Miller MR. Methodologic challenges in developing and implementing measures of quality for child health care. Ambul Pediatr Off J Ambul Pediatr Assoc. 2001;1(1):39-52. https://doi.org/10.1367/1539-4409(2001)001<0039:MCIDAI>2.0.CO;2.
13. Daya H, Lo S, Papsin BC, et al. Retropharyngeal and parapharyngeal infections in children: the Toronto experience. Int J Pediatr Otorhinolaryngol. 2005;69(1):81-86. https://doi.org/10.1016/j.ijporl.2004.08.010.
14. Wong SJ, Levi J. Management of pediatric orbital cellulitis: A systematic review. Int J Pediatr Otorhinolaryngol. 2018;110:123-129. https://doi.org/10.1016/j.ijporl.2018.05.006.
15. Wong DK, Brown C, Mills N, Spielmann P, Neeff M. To drain or not to drain-management of pediatric deep neck abscesses: a case-control study. Int J Pediatr Otorhinolaryngol. 2012;76(12):1810-1813. https://doi.org/10.1016/j.ijporl.2012.09.006.
Cervical lymphadenitis is a common superficial neck infection in childhood. While most children with cervical lymphadenitis recover with antibiotic therapy, a subset can develop an abscess that may require surgical drainage. Radiologic imaging, most commonly ultrasound or computed tomography (CT), is often performed to identify such an abscess.1-3 However, no national standards exist to guide clinician decision making around imaging in this population. In the absence of evidence-based guidelines, variability in frequency, timing, and modality of imaging likely exists in children hospitalized with cervical lymphadenitis.
As demonstrated for several other common pediatric conditions,4,5 variability in imaging practices may contribute to overutilization of resources in children with cervical lymphadenitis. In particular, routinely conducting imaging on presentation may constitute overuse, as children with cervical lymphadenitis who present with less than 72 hours of neck swelling rarely undergo surgical drainage within the first 24 hours of hospitalization.1,6,7 Imaging performed on presentation is often repeated later during hospitalization, particularly if the patient has not improved with antibiotic therapy. The net result may be unnecessary, redundant radiologic studies. Furthermore, serious complications such as bacteremia, extension of infection into the retropharyngeal space, or involvement of the airway or vasculature rarely occur in children with cervical lymphadenitis.6,8 In this context, deferring initial imaging in this population is unlikely to lead to adverse outcomes and may reduce radiation exposure.
The overall objectives of this study are to describe hospital-level variation in imaging practices for pediatric cervical lymphadenitis and to examine the association between early imaging and outcomes in this population.
METHODS
Study Design and Data Source
We conducted a multicenter, cross-sectional study using the Pediatric Health Information Systems (PHIS) database, which contains administrative and billing data from 49 geographically diverse children’s hospitals across the United States (US) affiliated with the Children’s Hospital Association (Lenexa, Kansas). PHIS includes data on patient demographics, discharge diagnoses, and procedures using the International Classification of Diseases, 9th (ICD-9) and 10th Revision (ICD-10) diagnosis codes, as well as daily billed resource utilization for laboratory tests, imaging studies, and medications. Encrypted medical record numbers permit longitudinal identification of children across multiple visits to the same hospital. Use of de-identified PHIS data was deemed to be nonhuman subjects research; our approach to validation of ICD codes using local electronic medical record review was reviewed and approved by the Cincinnati Children’s Hospital Medical Center Institutional Review Board.
Study Population
Our study team developed an algorithm to identify children with cervical lymphadenitis and minimize misclassification using PHIS (Appendix A). All children with lymphadenitis-related ICD-9 and ICD-10 discharge diagnosis codes were eligible for inclusion.
This algorithm was subsequently applied to the PHIS database. Children ages two months to 18 years hospitalized at participating PHIS institutions between July 2013 and December 2017 with a diagnosis of cervical lymphadenitis as per th
Measures of Interest
To examine hospital-level variation in imaging practices, we measured the proportion of children at each hospital who underwent any neck imaging study, CT or ultrasound imaging, early imaging, and multiple imaging studies within a single hospitalization. Neck imaging was defined as the presence of a billing code for ultrasound, CT, or magnetic resonance imaging (MRI) study of the neck (Appendix B). Early imaging was defined as neck imaging conducted on day 0 of hospitalization (ie, calendar day of admission and ending at midnight). Multiple imaging studies were defined as the receipt of more than one imaging study, regardless of timing or modality. We also measured the proportion of children by hospital who received surgical drainage, defined by the presence of procedure codes for incision and drainage of abscess of the neck (Appendix B).
In examining patient-level association between early imaging and clinical outcomes, our primary outcome of interest was the receipt of multiple imaging studies. Secondary outcomes included rates of surgical drainage, length of stay (in hospital days), and rates of lymphadenitis-related hospital readmission within 30 days of index discharge.
Covariates
Baseline demographic characteristics included age, gender, race/ethnicity, and insurance type. We measured ED visits associated with lymphadenitis-related diagnosis codes in the 30 days prior to admission as a proxy measure for illness duration prior to presentation. To approximate illness severity, we included the following covariates: rates of intensive care unit admission on presentation, rates of receipt of intravenous (IV) analgesia (Appendix B) on hospital days prior to surgical drainage, and rates of receipt of broad-spectrum antibiotics on day 0 or 1 of hospitalization. Broad-spectrum antibiotics (Appendix B) were defined by an independent three-person review of available antibiotic codes (SD, SSS, and JT); differences were resolved by group consensus.
Analysis
Categorical variables were described using frequencies and percentages, while continuous data were described using median and interquartile range. We described hospital-level variation in imaging practices by calculating and comparing the proportion of children at each hospital who underwent any neck imaging study, CT imaging, ultrasound imaging, early imaging, multiple imaging studies, and surgical drainage.
Patient-level demographics and clinical characteristics were compared across groups using chi-square test. To examine the association between early imaging and outcomes, we used generalized linear or logistic mixed effects models to control for patient demographic characteristics and clinical markers of illness duration and severity, with a random effect for hospital to account for clustering. Patient demographics in the model defined a priori included age, race/ethnicity, and insurance type; clinical characteristics included prior ED visit for lymphadenitis, initial intensive care unit (ICU) admission, use of IV analgesia, and use of broad-spectrum antibiotics on day 0 or 1 of hospitalization. To assess the potential for misclassification related to the availability of calendar day but not time of imaging in PHIS, we conducted a secondary analysis to examine the patient-level association between early imaging and outcomes using an alternative definition for early imaging (defined as imaging conducted on day 0 or day 1 of hospitalization).
All statistical analyses were performed by using SAS version 9.4 (SAS Institute, Cary, North Carolina); P < .05 was considered statistically significant.
RESULTS
We identified 19,785 PHIS hospitalizations with lymphadenitis-related discharge diagnosis codes between July 1, 2013 and December 31, 2017. Applying our algorithm and exclusion criteria, we assembled a cohort of 10,014 children hospitalized with cervical lymphadenitis (Figure 1). Two-thirds of the children in our cohort were <4 years old, 42% were non-Hispanic white, and 63% had a government payor (Table 1). Neck imaging (ultrasound, CT, or MRI) was conducted in 8,103 (81%) children. CT imaging was performed in 4,097 (41%) of children, and early imaging was conducted in 6,111 (61%) of children with cervical lymphadenitis.
We noted hospital-level variation in rates of any neck imaging (median: 82.1%, interquartile range [IQR]: 77.7%-85.5%, full range: 68.7%-93.1%), CT imaging (median: 42.3%, IQR: 26.7%-55.2%, full range: 12.0%-81.5%), early imaging (median: 64.4%, IQR: 59.8%-68.4%, full range: 13.8%-76.9%), and multiple imaging studies (median: 23.7%, IQR: 18.6%-28.9%, full range: 1.2%-40.7%; Figure 2). Rates of surgical drainage also varied by hospital (median: 35.1%, IQR: 31.3%-42.0%, full range: 17.1%-54.5%).
At the patient level, children who received early imaging were more likely to be <1 year old (21% vs 16%, P < .001), or Hispanic or Black when compared with children who did not receive early imaging (Table 1). Children who received early imaging were more likely to have had an ED visit for lymphadenitis in the preceding 30 days (8% vs 6%, P = .001). However, they were less likely to have received broad-spectrum antibiotics on admission (6% vs 8%, P < .001; Table 1). Of the 6,111 patients who received early imaging, 2,538 (41.5%) received CT imaging and 3,902 (63.9%) received ultrasound imaging on day 0. Of the 2,272 patients receiving multiple imaging studies, 116 (5.1%) received two or more CT scans.
In multivariable analysis at the patient level, early imaging was associated with higher adjusted odds of receiving multiple imaging studies (adjusted odds ratio [aOR] 3.0, 95% CI: 2.6-3.6). Similarly, early imaging was associated with higher adjusted odds of surgical drainage (aOR: 1.3, 95% CI: 1.1-1.4), increased 30-day readmission for lymphadenitis (aOR: 1.5, 95% CI: 1.2-1.9), and longer length of stay (adjusted rate ratio: 1.2, 95% CI: 1.1-1.2; Table 2). For the subset of patients who did not receive surgical drainage during the index admission, the adjusted odds ratio for the association between early imaging at index admission and 30-day readmission was 1.7 (95% CI: 1.3-2.1). About 63% of readmissions occurred within 7 days of index discharge; 89% occurred within 14 days (Appendix Figure).
In secondary analysis using an alternative definition for early imaging (ie, imaging conducted on day 0 or day 1 of hospitalization), the adjusted odds ratio for multiple imaging studies was 22.6 (95% CI: 15.8-32.4). The adjusted odds and rate ratios for the remaining outcomes were similar to our primary analysis.
DISCUSSION
In this large multicenter study of children with cervical lymphadenitis, we found variation in imaging practices across 44 US children’s hospitals. Children with cervical lymphadenitis who underwent early imaging were more likely to receive multiple imaging studies during a single hospitalization than those who did not receive early imaging. At the patient level, early imaging was also associated with higher rates of surgical drainage, more frequent 30-day readmission, and longer lengths of stay.
To our knowledge, imaging practices in the population of children hospitalized with cervical lymphadenitis have not been previously characterized in the US; one study from Atlanta, Georgia, describes imaging practices in all children evaluated in the ED.1 Single-center studies of children hospitalized with cervical lymphadenitis have been previously conducted in Canada6 and New Zealand,8 in which 42%-51% of children received imaging. In our study, most (81%) children hospitalized with lymphadenitis received some form of imaging, with 61% of all children receiving early imaging. Furthermore, 41% received CT imaging, as compared with 8%-10% of children in the aforementioned studies from Canada and New Zealand.6,8 This finding is consistent with a pattern of imaging overuse in the US, which has amongst the highest utilization rates globally for advanced imaging such as CT and MRI.10,11 Identifying opportunities to safely reduce routine imaging, particularly CT imaging, in this population could decrease unnecessary radiation exposure without compromising outcomes.
We also noted variability in imaging practices across PHIS hospitals. Some of this variability may be partially explained by differences in the patient population or illness severity across hospitals. However, given the absence of evidence-based best practices for children with cervical lymphadenitis, clinicians may rely on anecdotal experience or local practice culture to guide their decision making,12 leading to variability in frequency, timing, and modality of imaging.
At the patient level, we found that children who received early imaging were more likely to receive multiple imaging studies. This finding supports our hypothesis that clinicians often order a second imaging study when the initial imaging study does not clearly demonstrate an abscess, and the child subsequently fails to demonstrate clear improvement after 24-48 hours of antibiotics.
Furthermore, early imaging was associated with overall increased utilization in our cohort, including increased likelihood of surgical drainage, 30-day readmission for lymphadenitis, as well as longer lengths of stay. Confounding may be one explanation for this finding. For instance, clinicians may pursue early imaging in children who present with longer duration of symptoms or more severe illness on presentation, as these factors may be associated with abscess formation.1,6,7 These clinical covariates are not available in PHIS. Thus, we used prior ED visits for lymphadenitis to approximate illness duration, and initial admission to ICU, receipt of IV analgesia, and receipt of broad-spectrum antibiotics to approximate illness severity in an attempt to mitigate confounding.
On the other hand, it is also possible that a proportion of children with a small fluid collection on imaging may have improved with antibiotics alone. There is a growing body of evidence in children with other head and neck infections (eg, retropharyngeal abscess and orbital cellulitis with periosteal abscess)13-15 that suggests that children with small abscesses often improve with antibiotic therapy alone. In children with cervical lymphadenitis who have small or developing abscesses identified via routine imaging on presentation, clinicians may be driven to pursue a surgical intervention with uncertain benefit. Deferring routine imaging in this population may provide an opportunity to improve the value of care in children with lymphadenitis without adversely affecting outcomes.
This study has several limitations given our use of an administrative database. Children with lymphadenitis may have been misclassified as these patients were identified using discharge diagnosis codes
Furthermore, we were unable to measure the exact time of imaging study in PHIS; we used imaging conducted on hospital day 0 as a proxy measure for imaging conducted within the first 24 hours of presentation. With this definition, some children who had early imaging were likely misclassified as not having received early imaging. For example, a patient who arrived in the ED at 9
Additionally, there may be a subset of children who underwent imaging prior to presentation at the PHIS hospital ED for further workup and admission. Imaging conducted outside a PHIS hospital was not captured in this database. Similarly, children who had a readmission at a different hospital than their index admission would not be captured using PHIS. Finally, PHIS captures data from children’s hospitals; practices at these hospitals may not be generalizable to practices in the community hospital setting.
CONCLUSION
In conclusion, we found that imaging practices in children hospitalized with cervical lymphadenitis were widely variable across hospitals. Children receiving early imaging had more resource utilization and intervention when compared with children who did not receive early imaging. Our findings may represent a cascade effect, in which routinely conducted early imaging prompts clinicians to pursue more testing and interventions in this population. Future studies should obtain more detailed patient level covariates to further characterize clinical factors that may impact decisions around imaging and clinical outcomes for children with cervical lymphadenitis.
Acknowledgments
The authors would like to acknowledge the following investigators for their contributions to data interpretation and review of the final manuscript: Angela Choe MD, Cincinnati Children’s Hospital Medical Center, Cincinnati, Ohio; Margaret Rush MD, Children’s National Medical Center, Washington, DC; Ryosuke Takei MD, Children’s Hospital of Philadelphia, Philadelphia, Pennsylvania; Wallis Molchen DO, Texas Children’s Hospital, Houston, Texas; Stephanie Royer Moss MD, Cleveland Clinic, Cleveland, Ohio; Rebecca Dang, MD, Lucile Packard Children’s Hospital Stanford, Palo Alto, California; Joy Solano MD, Children’s Mercy Hospital Kansas, Overland Park, Kansas; Nathaniel P. Goodrich MD, Children’s Hospital & Medical Center, Omaha, Nebraska; Ngozi Eboh MD, Texas Tech University Health Sciences Center, Dallas, Texas; Ashley Jenkins MD, Cincinnati Children’s Hospital Medical Center, Cincinnati, Ohio; Rebecca Steuart MD, Cincinnati Children’s Hospital Medical Center, Cincinnati, Ohio; Sonya Tang Girdwood MD, PhD, Cincinnati Children’s Hospital Medical Center, Cincinnati, Ohio; Alissa McInerney MD, Maria Fareri Children’s Hospital at Westchester Medical Center, Valhalla, New York; Sumeet Banker MD, MPH, New York Presbyterian Morgan Stanley Children’s Hospital, New York, New York; Corrie McDaniel DO, Seattle Children’s Hospital, Seattle, Washington; Christiane Lenzen MD, Rady Children’s Hospital, San Diego, California; Aleisha Nabower MD, Children’s Hospital & Medical Center, Omaha, Nebraska; Waheeda Samady MD, Ann & Robert H. Lurie Children’s Hospital, Chicago, Illinois; Jennifer Chen MD, Rady Children’s Hospital, San Diego, California; Marquita Genies MD, MPH, John’s Hopkins Children’s Center, Baltimore, Maryland; Justin Lockwood MD, Children’s Hospital Colorado, Aurora, Colorado; David Synhorst MD, Children’s Mercy Hospital Kansas, Overland Park, Kansas.
1. Sauer MW, Sharma S, Hirsh DA et al. Acute neck infections in children: who is likely to undergo surgical drainage? Am J Emerg Med. 2013;31(6):906-909. https://doi.org/10.1016/j.ajem.2013.02.043.
2. Sethia R, Mahida JB, Subbarayan RA, et al. Evaluation of an imaging protocol using ultrasound as the primary diagnostic modality in pediatric patients with superficial soft tissue infections of the face and neck. Int J Pediatr Otorhinolaryngol. 2017;96:89-93. https://doi.org/10.1016/j.ijporl.2017.02.027.
3. Neff L, Newland JG, Sykes KJ, Selvarangan R, Wei JL. Microbiology and antimicrobial treatment of pediatric cervical lymphadenitis requiring surgical intervention. Int J Pediatr Otorhinolaryngol. 2013;77(5):817-820. https://doi.org/10.1016/j.ijporl.2013.02.018.
4. Brogan TV, Hall M, Williams DJ, et al. Variability in processes of care and outcomes among children hospitalized with community-acquired pneumonia. Pediatr Infect Dis J. 2012;31(10):1036-1041. https://doi.org/10.1097/INF.0b013e31825f2b10.
5. Conway PH, Keren R. Factors associated with variability in outcomes for children hospitalized with urinary tract infection. J Pediatr. 2009;154(6):789-796. https://doi.org/10.1016/j.jpeds.2009.01.010.
6. Luu TM, Chevalier I, Gauthier M et al. Acute adenitis in children: clinical course and factors predictive of surgical drainage. J Paediatr Child Health. 2005;41(5-6):273-277. https://doi.org/10.1111/j.1440-1754.2005.00610.x.
7. Golriz F, Bisset GS, 3rd, D’Amico B, et al. A clinical decision rule for the use of ultrasound in children presenting with acute inflammatory neck masses. Pediatr Rad. 2017;47(4):422-428. https://doi.org/10.1007/s00247-016-3774-9.
8. Courtney MJ, Miteff A, Mahadevan M. Management of pediatric lateral neck infections: does the adage “… never let the sun go down on undrained pus …” hold true? Int J Pediatr Otorhinolaryngol. 2007;71(1):95-100. https://doi.org/10.1016/j.ijporl.2006.09.009.
9. Feudtner C, Feinstein JA, Zhong W, Hall M, Dai D. Pediatric complex chronic conditions classification system version 2: updated for ICD-10 and complex medical technology dependence and transplantation. BMC Pediatr. 2014;14:199. https://doi.org/10.1186/1471-2431-14-199.
10. Papanicolas I, Woskie LR, Jha AK. Health care spending in the United States and other high-income countries. JAMA. 2018;319(10):1024-1039. https://doi.org/10.1001/jama.2018.1150.
11. Oren O, Kebebew E, Ioannidis JPA. Curbing unnecessary and wasted diagnostic imaging. JAMA. 2019;321(3):245-246. https://doi.org/10.1001/jama.2018.20295.
12. Palmer RH, Miller MR. Methodologic challenges in developing and implementing measures of quality for child health care. Ambul Pediatr Off J Ambul Pediatr Assoc. 2001;1(1):39-52. https://doi.org/10.1367/1539-4409(2001)001<0039:MCIDAI>2.0.CO;2.
13. Daya H, Lo S, Papsin BC, et al. Retropharyngeal and parapharyngeal infections in children: the Toronto experience. Int J Pediatr Otorhinolaryngol. 2005;69(1):81-86. https://doi.org/10.1016/j.ijporl.2004.08.010.
14. Wong SJ, Levi J. Management of pediatric orbital cellulitis: A systematic review. Int J Pediatr Otorhinolaryngol. 2018;110:123-129. https://doi.org/10.1016/j.ijporl.2018.05.006.
15. Wong DK, Brown C, Mills N, Spielmann P, Neeff M. To drain or not to drain-management of pediatric deep neck abscesses: a case-control study. Int J Pediatr Otorhinolaryngol. 2012;76(12):1810-1813. https://doi.org/10.1016/j.ijporl.2012.09.006.
© 2019 Society of Hospital Medicine
The Association between Limited English Proficiency and Sepsis Mortality
Sepsis is defined as a life-threatening organ dysfunction that occurs in response to systemic infection.1,2 It is frequently fatal, common in hospital medicine, and a leading contributor to critical illness, morbidity, and healthcare expenditures.2-5 While sepsis care and outcomes have improved in the past decade,6,7 inpatient mortality remains high.8
A number of studies have sought to determine whether race plays a role in sepsis mortality. While Black patients with sepsis have frequently been identified as having the highest rates of death,9-14 similar observations have been made for most non-White races/ethnicities.13-15 Studies have also demonstrated higher rates of hospital-acquired infections among Asian and Latino patients.16
There are several possible explanations for why racial minorities experience disparate outcomes in sepsis, including access to care, comorbidities, implicit biases, and biological or environmental factors,17-20 as well as characteristics of hospitals most likely to care for racial minorities.13,15,21 One explanation that has not been explored is that racial disparities in sepsis are mediated by language. Limited English proficiency (LEP) has previously been associated with increased rates of adverse hospital events,22 longer length of stay,23 and greater likelihood of readmission.24 LEP has also been shown to represent a significant barrier to accessing healthcare and preventive screening.25 The role of LEP in sepsis mortality, however, has yet to be examined.
The diverse patient population at the University of California, San Francisco (UCSF) provides a unique opportunity to build upon existing literature by further exploring racial differences in sepsis, specifically by investigating the role of LEP. The objective of this study was to determine the association between LEP and inpatient mortality among adults hospitalized with sepsis.
METHODS
Setting
The study was conducted at the University of California, San Francisco, California (UCSF), an 800-bed tertiary care, academic medical center. It was approved by the UCSF Institutional Review Board with waiver of informed consent. UCSF cares for a population of patients who are racially and linguistically diverse, with high proportions of patients of East Asian descent and with LEP. According to recent United States census estimates, more than half of San Francisco County residents identify as non-White (35% Asians, 15% Hispanic/Latino, 6% Black), and 44% report speaking a language other than English at home.26
Study Population and Data Collection
The UCSF Medical Center uses the electronic health record (EHR) Epic (Epic 2017, Epic Systems Corporation, Verona, Wisconsin). We obtained computerized EHR data from Clarity, the relational database that stores Epic’s inpatient data in thousands of tables. We identified all patients ≥18 years of age presenting to the emergency department (ED) between June 1, 2012 and December 31, 2016 with suspected serious infection, defined as having blood cultures ordered within 72 hours of ED presentation (N = 25,441). Patients who did not receive at least two doses of intravenous (IV) antibiotics within 48 hours were excluded, as they were unlikely to have serious infections.
We defined sepsis based on Sepsis-3 consensus guidelines2 as a change in sequential [sepsis-related] organ failure assessment (SOFA) score ≥2 within the first 48 hours of ED presentation. The SOFA score is comprised of six variables representing different organ systems, each rated 0-4 based on the degree of dysfunction.2 Patient vital signs, laboratory data, vasopressor medication doses, and ventilator settings were used to determine the exact timestamp at which each patient attained a change in SOFA score ≥2. Missing values were considered to be normal. To adjust for baseline organ dysfunction, SOFA elements associated with elevated bilirubin and/or creatinine were excluded for patients with chronic liver/kidney disease based on Elixhauser comorbidities.27 We chose to focus on the first 48 hours in an attempt to capture patients with the most severe illnesses and the highest probability of true sepsis.
All primary and secondary International Classification of Diseases (ICD)-9/10 diagnosis codes were extracted from Clarity coding tables at the time of hospital discharge. Diagnosis codes signifying bacterial infection were grouped into the following categories based on type/location: pneumonia; bacteremia; urinary tract infection; and skin and soft tissue infection. All remaining diagnostic codes indicating bacterial infections at other sites were categorized as “Other”. If no codes indicating infection were present, patients were categorized as “None coded”. Patients with discharge diagnosis codes of “sepsis” were also identified. Dates and times of antibiotic administrations were obtained from the medications table. Time to first antibiotic was defined as the time in minutes from ED presentation to initiation of the first IV antibacterial medication. This variable was transformed using a natural log transformation based on best fit for normal distribution.
We limited our analyses to 8,974 patients who were diagnosed with sepsis as defined above and had either (1) ≥4 qualifying antibiotic days (QADs) or (2) an ICD-9/10 discharge diagnosis code of “sepsis” (Figure). QADs were defined based on the recent publication by Rhee et al. as having received four or more consecutive days of antibiotics, with the first dose given IV within 48 hours of presentation.28 Patients who died or were discharged to hospice prior to the 4th QAD were also included. These additional parameters were added to increase specificity of the study sample for patients with true sepsis. Patients admitted to all levels of care (acute care, transitional care unit [TCU], intensive care unit [ICU]) and under all hospital services were included. There were no missing data for mortality, race, or language. We chose to focus on patients with sepsis in this initial study as this is a common diagnosis in hospital medicine that is enriched for high mortality.
Primary Outcome
The primary outcome of the study was inpatient mortality, which was obtained from the hospital encounters table in Clarity.
Primary Predictors
The primary predictor of interest was LEP. The encounter numbers from the dataset were used to link to self-reported demographic data, including “preferred language” and need for interpreter services. A manual chart review of 60 patients speaking the top six languages was conducted to verify the accuracy of the data on language and interpreter use (KNK). Defining the gold standard for LEP as having any chart note indicating non-English language and/or that an interpreter was used, the “interpreter needed” variable in Epic was found to have a positive predictive value for LEP of 100%. Therefore, patients in the study cohort were defined as having LEP if they met both of the following criteria: (1) a self-reported “preferred language” other than English and (2) having the “interpreter needed” variable indicating “yes”.
Covariate Data Collection
Additional data were obtained from the demographics tables, including age, race, sex, and insurance status. Race and ethnicity were combined into a single five-category variable including White, Asian, Black, Latino, and Other. This approach has been suggested as the best way to operationalize these variables29 and has been utilized by similar studies in the literature.9,14,15 We considered the Asian race to include all people of East Asian, Southeast Asian, or South Asian descent, which is consistent with the United States Census Bureau definition.30 Patients identifying as Native Hawaiians/Pacific Islanders, Native Americans/Alaskan Natives, as well as those with unspecified race or ethnicity, were categorized as Other. Insurance status was categorized as Commercial, Medicare, Medicaid, or Other.
We estimated illness severity in several ways. First, the total qualifying SOFA score was calculated for each patient, which was defined as the total score achieved at the time that SOFA criteria were first met (≥2, within 48 hours). Second, we dichotomized patients based on whether they had received mechanical ventilation at any point during hospitalization. Finally, we used admission location as a surrogate marker for severity at the time of initial hospitalization.
To estimate the burden of baseline comorbidities, we calculated the van Walraven score (VWS),31 a validated modification of the Elixhauser Comorbidity Index.27 This score conveys an estimated risk of in hospital death based on ICD-9/10 diagnosis codes for preexisting conditions, which ranges from <1% for the minimum score of –19 to >99% for the maximum score of 89.
Statistical Analyses
All statistical analyses were performed using Stata software version 15 (StataCorp LLC, College Station, Texas). Baseline demographics and patient characteristics were stratified by LEP. These were compared using two-sample t-tests or chi-squared tests of significance. Wilcoxon rank-sum tests were used for non-normally distributed variables. Inpatient mortality was compared across all races stratified by LEP using chi-squared tests of significance.
We fit a series of multivariable logistic regression models to examine the association between race and inpatient mortality adjusting for LEP and other patient/clinical characteristics. We first examined the unadjusted association between mortality and race; then adjusted for LEP alone; and finally adjusted for all covariates of interest, including LEP, age, sex, insurance status, year, admission level of care, VWS, total qualifying SOFA score, need for mechanical ventilation, site of infection, and time to first IV antibiotic. A subgroup analysis was also performed using the fully adjusted model restricted to patients who were mechanically ventilated. This population was selected because the patients (1) have among the highest severity of illness and (2) share a common barrier to communication, regardless of English proficiency.
Several potential interactions between LEP with other covariates were explored, including age, race, ICU admission level of care, and need for mechanical ventilation. Lastly, a mediation analysis was performed based on Baron & Kenny’s four-step model32 in order to calculate the proportion of the association between race and mortality explained by the proposed mediator (LEP).
To evaluate for the likelihood of residual confounding, we calculated an E-value, which is defined as the minimum strength of association that an unmeasured confounder would need to have with both the predictor and outcome variables, above and beyond the measured covariates, in order to fully explain away an observed predictor-outcome association.33,34
RESULTS
We identified 8,974 patients hospitalized with sepsis based on the above inclusion criteria. This represented a medically complex, racially and linguistically diverse population (Table 1). The cohort was comprised of 24% Asian, 12% Black, and 11% Latino patients. Among those categorized as Other race, Native Americans/Alaskan Natives and Native Hawaiians/Pacific Islanders accounted for 4% (n = 31) and 21% (n = 159), respectively. A fifth of all patients had LEP (n = 1,716), 62% of whom were Asian (n = 1,064). Patients with LEP tended to be older, female, and to have a greater number of comorbid conditions (Table 1). The total qualifying SOFA score was also higher among patients with LEP (median 5; interquartile range [IQR]: 4-8 vs 5; IQR: 3-7; P <.001), though there was no association between LEP and mechanical ventilation (P = .22). The prevalence of LEP differed significantly across races, with 50% LEP among Asians, 32% among Latinos, 5% among White patients (P < .001). Only eight Black patients had LEP. More than 40 unique languages were represented in the cohort, with English, Cantonese, Spanish, Russian, and Mandarin accounting for ~95% (Appendix Table 1). Among Latino patients, 63% spoke English and 36% spoke Spanish.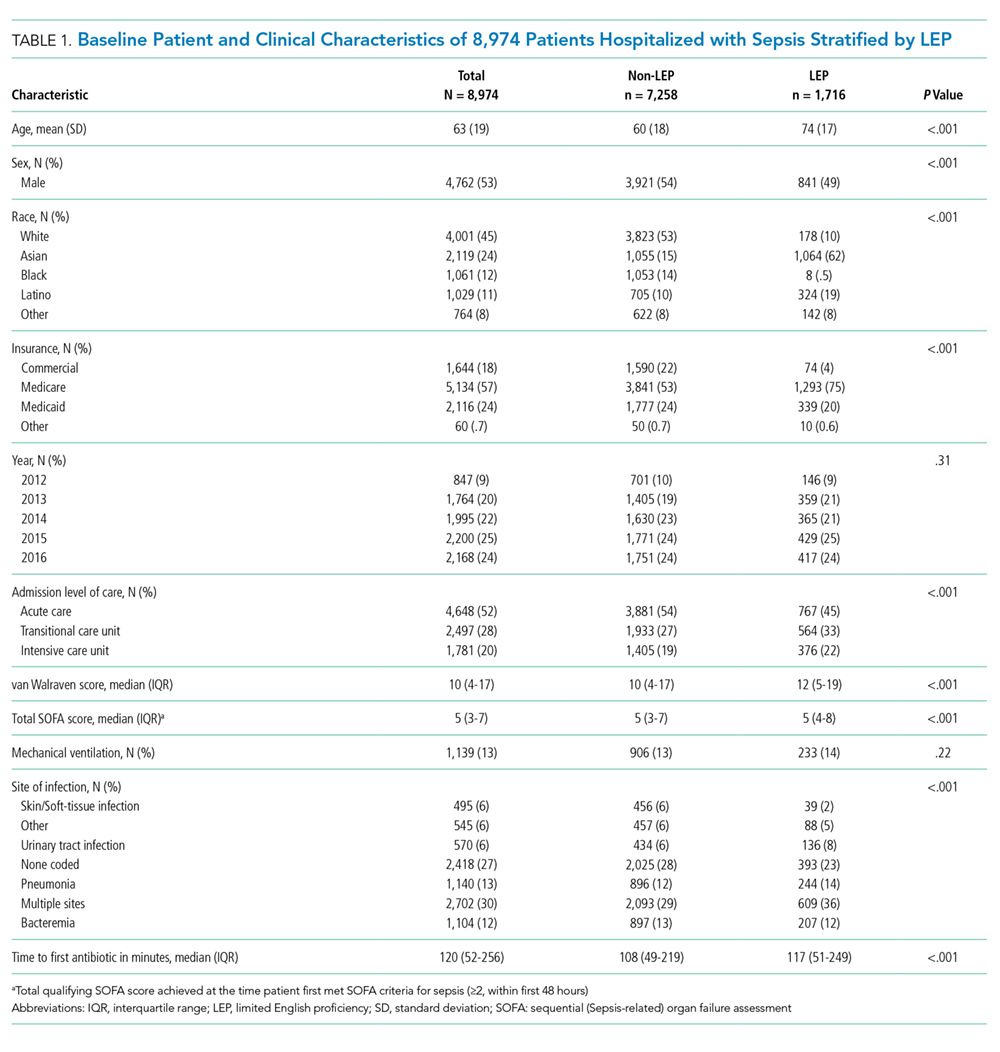
In-hospital mortality was significantly higher among patients who had LEP (n = 268/1,716, 16%) compared to non-LEP patients (n = 678/7,258, 9%), with 80% greater unadjusted odds of mortality (OR 1.80; 95% CI: 1.54-2.09; P < .001). Notably we also found that Asian race was associated with a 1.57 unadjusted odds of mortality compared to White race (95% CI: 1.34-1.85; P < .001). Age, VWS, total qualifying SOFA score, mechanical ventilation, and admission level of care all exhibited a positive dose-response association with mortality (Appendix Table 2). In unadjusted analyses, there was no evidence of interaction between LEP and age (P = .38), LEP and race (P = .45), LEP and ICU admission level of care (P = .31), or LEP and mechanical ventilation (P = .19). Asian patients had the highest overall mortality (14% total, 17% with LEP). LEP was associated with increased unadjusted mortality among White, Asian, and Other races compared to their non-LEP counterparts (Appendix Figure 1). There was no significant difference in mortality between Latino patients with and without LEP. The sample size for Black patients with LEP (n = 8) was too small to draw conclusions about mortality.
Following multivariable logistic regression modeling for the association between race and mortality, we found that the increased odds of death among Asian patients was partially attenuated after adjusting for LEP (odds ratio [OR] 1.23, 95% CI: 1.02-1.48; P = .03; Table 2). Meanwhile, LEP was associated with a 1.66 odds of mortality (95% CI: 1.38-1.99; P < .001) after adjustment for race. In the full multivariable model adjusting for demographics and clinical characteristics, illness severity, and comorbidities, LEP was associated with a 31% increase in the odds of mortality compared to non-LEP (95% CI: 1.06-1.63; P = .02). In this model, the association between Asian race and mortality was now fully attenuated, with a point estimate near 1.0 (OR 0.98; 95% CI: 0.79-1.22; P = .87). Markers of illness severity, including total qualifying SOFA score (OR 1.23; 95% CI: 1.20-1.27; P < .001) and need for mechanical ventilation (OR 1.88; 95% CI: 1.52-2.33; P < .001), were both associated with greater odds of death. Based on a four-step mediation analysis, LEP was found to be a partial mediator to the association between Asian race and mortality (76% proportion explained). The E-value for the association between LEP and mortality was 1.95, with an E-value for the corresponding confidence interval of 1.29.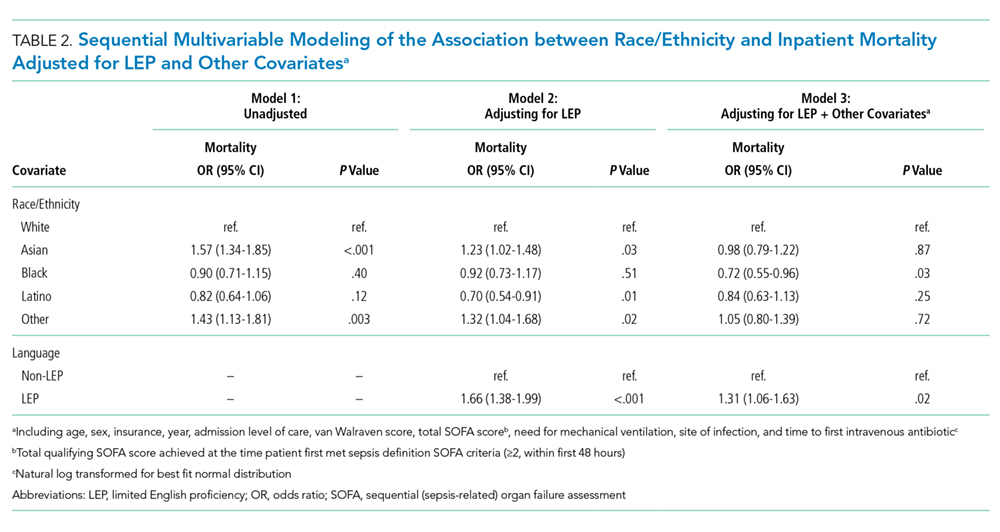
In a subgroup analysis using the fully adjusted model restricted to patients who were mechanically ventilated during hospitalization, the association between LEP and mortality was no longer present (OR 1.15; 95% CI: 0.76-1.72; P = .51).
DISCUSSION
At a single US academic medical center serving a diverse population, we found that LEP was associated with sepsis mortality across all races except Black and Latino, conveying a 31% increase in the odds of death after adjusting for illness severity, comorbidities, and baseline characteristics. The higher mortality among Asian patients was largely mediated by LEP (76% proportion explained). While previous studies have variably found Black, Asian, Latino, and other non-White races/ethnicities to be at an increased risk of death from sepsis,9-15 LEP has not been previously evaluated as a mediator of sepsis mortality. We were uniquely suited to uncover such an association due to the racial and linguistic diversity of our patient population. LEP has previously been implicated in poor health outcomes among hospitalized patients in general.22-24 Future studies will be necessary to determine whether similar associations between LEP and mortality are observed among broader patient populations outside of sepsis.
There are a number of possible explanations for how LEP could mediate the association between race and mortality. First, LEP is known to be associated with greater difficulties in accessing medical care,25 which could result in poorer baseline control of chronic comorbid conditions, fewer opportunities for preventive screening, and greater reluctance to seek medical attention when ill, theoretically leading to more severe presentations and worse outcomes. Indeed, LEP patients in our cohort had both a shorter median time to receiving their first antibiotic, as well as a higher total qualifying SOFA score, both of which may suggest more severe initial presentations. LEP is also known to contribute to, or exacerbate, the impact of low health literacy, which is itself associated with poor health.35 Second, implicit biases may also have been present, as they are known to be common among healthcare providers and have been shown to negatively impact patient care.36
Finally,it is possible that the association is related to the language barrier itself, which impacts providers’ ability to take an appropriate clinical history, and can lead to clinical errors or delays in care.37 The fact that the association between LEP and mortality was eliminated when the analysis was restricted to mechanically ventilated patients seems to support this, since differences in language proficiency become irrelevant in this subgroup. While we are unable to comment on causality based on this observational study, we included a directed acyclic graph (DAG) in the supplemental materials, which shows one proposed model for describing these associations (Appendix Figure 2).
Assuming that the language barrier itself does, at least in part, drive the observed association, LEP represents a potentially modifiable risk factor that could be a target for quality improvement interventions. There is evidence that the use of medical interpreters among patients with LEP leads to greater satisfaction, fewer errors, and improved clinical outcomes;38 however, several recent studies have documented underutilization of professional interpreter services, even when readily available.39,40 At our institution, phone and video interpreter services are available 24/7 for approximately 150 languages. Due to limitations inherent to the EHR, we were unable to ascertain the extent to which these services were used in the present study. Heavy clinical workloads, connectivity issues, and missing or faulty equipment represent theoretical barriers to utilization of these services.
There are some limitations to our study. First, by utilizing a large database of electronic data, the quality of our analyses was reliant on the accuracy of the EHR. Demographic data such as language may have been subject to misclassification due to self-reporting. We attempted to minimize this by also including the need for interpreter services within the definition of LEP, which was validated by manual chart review. Second, generalizability is limited in this single-center study conducted at an institution with unique demographics, wherein nearly two-thirds of the LEP patients were Asian, and the Chinese-speaking population outnumbered those who speak Spanish.
Finally, the most important limitation to our study is the potential for residual confounding. While we attempted to mitigate this by adjusting for as many clinically relevant covariates as possible, there may still be unmeasured confounders to the association between LEP and mortality, such as access to outpatient care, functional status, interpreter use, and other markers of illness severity like the number and type of supportive therapies received. Based on our E-value calculations, with an observed OR of 1.31 for the association between LEP and mortality, an unmeasured confounder with an OR of 1.95 would fully explain away this association, while an OR of 1.29 would shift the confidence interval to include the null. These values suggest at least some risk of residual confounding. The fact that our fully adjusted model included multiple covariates, including several markers of illness severity, does somewhat lessen the likelihood of a confounder achieving these values, since they represent the minimum strength of an unmeasured confounder above and beyond the measured covariates. Regardless, the finding that patients with LEP are more likely to die from sepsis remains an important one, recognizing the need for further studies including multicenter investigations.
In this study, we showed that LEP was associated with sepsis mortality across nearly all races in our cohort. While Asian race was associated with a higher unadjusted odds of death compared to White race, this was attenuated after adjusting for LEP. This may suggest that some of the racial disparities in sepsis identified in prior studies were in fact mediated by language proficiency. Further studies will be required to explore the causal nature of this novel association. If modifiable factors are identified, this could represent a potential target for future quality improvement initiatives aimed at improving sepsis outcomes.
Disclaimer
The contents are solely the responsibility of the authors and do not necessarily represent the official views of the University of California, San Francisco or the National Institutes of Health.
1. De Backer DD, Dorman T. Surviving sepsis guidelines: A continuous move toward better care of patients with sepsis. JAMA. 2017;317(8):807-808. https://doi.org/10.1001/jama.2017.0059.
2. Singer M, Deutschman CS, Seymour CW, et al. The third international consensus definitions for sepsis and septic shock (Sepsis-3). JAMA. 2016;315(8):801-810. https://doi.org/10.1001/jama.2016.0287.
3. Angus DC, Linde-Zwirble WT, Lidicker J, et al. Epidemiology of severe sepsis in the United States: analysis of incidence, outcome, and associated costs of care. Crit Care Med. 2001;29(7):1303-1310. https://doi.org/10.1097/00003246-200107000-00002.
4. Mayr FB, Yende S, Angus DC. Epidemiology of severe sepsis. Virulence. 2014;5(1):4-11. https://doi.org/10.4161/viru.27372.
5. Dellinger RP, Levy MM, Rhodes A, et al. Surviving Sepsis Campaign: international guidelines for management of severe sepsis and septic shock: 2012. Crit Care Med. 2013;41(2):580-637. https://doi.org/10.1097/CCM.0b013e31827e83af.
6. Levy MM, Rhodes A, Phillips GS, et al. Surviving Sepsis Campaign: association between performance metrics and outcomes in a 7.5-year study. Crit Care Med. 2015;43(1):3-12. https://doi.org/10.1097/CCM.0000000000000723.
7. Damiani E, Donati A, Serafini G, et al. Effect of performance improvement programs on compliance with sepsis bundles and mortality: a systematic review and meta-analysis of observational studies. PLOS ONE. 2015;10(5):e0125827. https://doi.org/10.1371/journal.pone.0125827.
8. Paoli CJ, Reynolds MA, Sinha M, Gitlin M, Crouser E. Epidemiology and costs of sepsis in the United States-an analysis based on timing of diagnosis and severity level. Crit Care Med. 2018;46(12):1889-1897. https://doi.org/10.1097/CCM.0000000000003342.
9. Barnato AE, Alexander SL, Linde-Zwirble WT, Angus DC. Racial variation in the incidence, care, and outcomes of severe sepsis: analysis of population, patient, and hospital characteristics. Am J Respir Crit Care Med [patient]. 2008;177(3):279-284. https://doi.org/10.1164/rccm.200703-480OC.
10. Mayr FB, Yende S, Linde-Zwirble WT, et al. Infection rate and acute organ dysfunction risk as explanations for racial differences in severe sepsis. JAMA. 2010;303(24):2495-2503. https://doi.org/10.1001/jama.2010.851.
11. Dombrovskiy VY, Martin AA, Sunderram J, Paz HL. Occurrence and outcomes of sepsis: influence of race. Crit Care Med. 2007;35(3):763-768. https://doi.org/10.1097/01.CCM.0000256726.80998.BF.
12. Yamane D, Huancahuari N, Hou P, Schuur J. Disparities in acute sepsis care: a systematic review. Crit Care. 2015;19(Suppl 1):22. https://doi.org/10.1186/cc14102.
13. Martin GS, Mannino DM, Eaton S, Moss M. The epidemiology of sepsis in the United States from 1979 through 2000. N Engl J Med. 2003;348(16):1546-1554. https://doi.org/10.1056/NEJMoa022139.
14. Melamed A, Sorvillo FJ. The burden of sepsis-associated mortality in the United States from 1999 to 2005: an analysis of multiple-cause-of-death data. Crit Care. 2009;13(1):R28. https://doi.org/10.1186/cc7733.
15. Jones JM, Fingar KR, Miller MA, et al. Racial disparities in sepsis-related in-hospital mortality: using a broad case capture method and multivariate controls for clinical and hospital variables, 2004-2013. Crit Care Med. 2017;45(12):e1209-e1217. https://doi.org/10.1097/CCM.0000000000002699.
16. Bakullari A, Metersky ML, Wang Y, et al. Racial and ethnic disparities in healthcare-associated infections in the United States, 2009–2011. Infect Control Hosp Epidemiol. 2014;35(S3):S10-S16. https://doi.org/10.1086/677827.
17. Institute of Medicine. Unequal Treatment: What Healthcare Providers Need to Know about Racial and Ethnic Disparities in Healthcare. Washington, DC: National Academy Press; 2002.
18. Vogel TR. Update and review of racial disparities in sepsis. Surg Infect. 2012;13(4):203-208. https://doi.org/10.1089/sur.2012.124.
19. Esper AM, Moss M, Lewis CA, et al. The role of infection and comorbidity: factors that influence disparities in sepsis. Crit Care Med. 2006;34(10):2576-2582. https://doi.org/10.1097/01.CCM.0000239114.50519.0E.
20. Soto GJ, Martin GS, Gong MN. Healthcare disparities in critical illness. Crit Care Med. 2013;41(12):2784-2793. https://doi.org/10.1097/CCM.0b013e3182a84a43.
21. Taylor SP, Karvetski CH, Templin MA, Taylor BT. Hospital differences drive antibiotic delays for black patients compared with white patients with suspected septic shock. Crit Care Med. 2018;46(2):e126-e131. https://doi.org/10.1097/CCM.0000000000002829.
22. Divi C, Koss RG, Schmaltz SP, Loeb JM. Language proficiency and adverse events in US hospitals: a pilot study. Int J Qual Health Care. 2007;19(2):60-67. https://doi.org/10.1093/intqhc/mzl069.
23. John-Baptiste A, Naglie G, Tomlinson G, et al. The effect of English language proficiency on length of stay and in-hospital mortality. J Gen Intern Med. 2004;19(3):221-228. https://doi.org/10.1111/j.1525-1497.2004.21205.x.
24. Karliner LS, Kim SE, Meltzer DO, Auerbach AD. Influence of language barriers on outcomes of hospital care for general medicine inpatients. J Hosp Med. 2010;5(5):276-282. https://doi.org/10.1002/jhm.658.
25. Hacker K, Anies M, Folb BL, Zallman L. Barriers to health care for undocumented immigrants: a literature review. Risk Manag Healthc Policy. 2015;8:175-183. https://doi.org/10.2147/RMHP.S70173.
26. QuickFacts: San Francisco County, California. U.S. Census Bureau (2016). https://www.census.gov/quickfacts/fact/table/sanfranciscocountycalifornia/RHI425216. Accessed May 15, 2018.
27. Moore BJ, White S, Washington R, Coenen N, Elixhauser A. Identifying increased risk of readmission and in-hospital mortality using hospital administrative data: The AHRQ Elixhauser comorbidity index. Med Care. 2017;55(7):698-705. https://doi.org/10.1097/MLR.0000000000000735.
28. Rhee C, Dantes R, Epstein L, et al. Incidence and trends of sepsis in us hospitals using clinical vs claims data, 2009-2014. JAMA. 2017;318(13):1241-1249. https://doi.org/10.1001/jama.2017.13836.
29. Howell J, Emerson MO, So M. What “should” we use? Evaluating the impact of five racial measures on markers of social inequality. Sociol Race Ethn. 2017;3(1):14-30. https://doi.org/10.1177/2332649216648465.
30. Reeves T, Claudett B. United States Census Bureau. Asian Pac Islander Popul. March 2002;2003.
31. van Walraven C, Austin PC, Jennings A, Quan H, Forster AJ. A modification of the Elixhauser comorbidity measures into a point system for hospital death using administrative data. Med Care. 2009;47(6):626-633. https://doi.org/10.1097/MLR.0b013e31819432e5.
32. Baron RM, Kenny DA. The moderator-mediator variable distinction in social psychological research: conceptual, strategic, and statistical considerations. J Pers Soc Psychol. 1986;51(6):1173-1182. https://doi.org/10.1037//0022-3514.51.6.1173. 33. VanderWeele TJ, Ding P. Sensitivity analysis in observational research: introducing the E-value. Ann Intern Med. 2017;167(4):268-274. https://doi.org/10.7326/M16-2607.
34. Mathur MB, Ding P, Riddell CA, VanderWeele TJ. Website and R package for computing E-values. Epidemiology. 2018;29(5):e45-e47. https://doi.org/10.1097/EDE.0000000000000864.
35. Sentell T, Braun KL. Low Health Literacy, Limited English proficiency, and health status in Asians, Latinos, and other racial/ethnic groups in California. J Health Commun. 2012;17 Supplement 3:82-99. https://doi.org/10.1080/10810730.2012.712621.
36. FitzGerald C, Hurst S. Implicit bias in healthcare professionals: a systematic review. BMC Med Eth. 2017;18(1):19. https://doi.org/10.1186/s12910-017-0179-8.
37. Flores G. The impact of medical interpreter services on the quality of health care: A systematic review. Med Care Res Rev. 2005;62(3):255-299. https://doi.org/10.1177/1077558705275416.
38. Karliner LS, Jacobs EA, Chen AH, Mutha S. Do professional interpreters improve clinical care for patients with limited English proficiency? A systematic review of the literature. Health Serv Res. 2007;42(2):727-754. https://doi.org/10.1111/j.1475-6773.2006.00629.x.
39. Diamond LC, Schenker Y, Curry L, Bradley EH, Fernandez A. Getting by: underuse of interpreters by resident physicians. J Gen Intern Med. 2009;24(2):256-262. https://doi.org/10.1007/s11606-008-0875-7.
40. López L, Rodriguez F, Huerta D, Soukup J, Hicks L. Use of interpreters by physicians for hospitalized limited English proficient patients and its impact on patient outcomes. J Gen Intern Med. 2015;30(6):783-789. https://doi.org/10.1007/s11606-015-3213-x.
Sepsis is defined as a life-threatening organ dysfunction that occurs in response to systemic infection.1,2 It is frequently fatal, common in hospital medicine, and a leading contributor to critical illness, morbidity, and healthcare expenditures.2-5 While sepsis care and outcomes have improved in the past decade,6,7 inpatient mortality remains high.8
A number of studies have sought to determine whether race plays a role in sepsis mortality. While Black patients with sepsis have frequently been identified as having the highest rates of death,9-14 similar observations have been made for most non-White races/ethnicities.13-15 Studies have also demonstrated higher rates of hospital-acquired infections among Asian and Latino patients.16
There are several possible explanations for why racial minorities experience disparate outcomes in sepsis, including access to care, comorbidities, implicit biases, and biological or environmental factors,17-20 as well as characteristics of hospitals most likely to care for racial minorities.13,15,21 One explanation that has not been explored is that racial disparities in sepsis are mediated by language. Limited English proficiency (LEP) has previously been associated with increased rates of adverse hospital events,22 longer length of stay,23 and greater likelihood of readmission.24 LEP has also been shown to represent a significant barrier to accessing healthcare and preventive screening.25 The role of LEP in sepsis mortality, however, has yet to be examined.
The diverse patient population at the University of California, San Francisco (UCSF) provides a unique opportunity to build upon existing literature by further exploring racial differences in sepsis, specifically by investigating the role of LEP. The objective of this study was to determine the association between LEP and inpatient mortality among adults hospitalized with sepsis.
METHODS
Setting
The study was conducted at the University of California, San Francisco, California (UCSF), an 800-bed tertiary care, academic medical center. It was approved by the UCSF Institutional Review Board with waiver of informed consent. UCSF cares for a population of patients who are racially and linguistically diverse, with high proportions of patients of East Asian descent and with LEP. According to recent United States census estimates, more than half of San Francisco County residents identify as non-White (35% Asians, 15% Hispanic/Latino, 6% Black), and 44% report speaking a language other than English at home.26
Study Population and Data Collection
The UCSF Medical Center uses the electronic health record (EHR) Epic (Epic 2017, Epic Systems Corporation, Verona, Wisconsin). We obtained computerized EHR data from Clarity, the relational database that stores Epic’s inpatient data in thousands of tables. We identified all patients ≥18 years of age presenting to the emergency department (ED) between June 1, 2012 and December 31, 2016 with suspected serious infection, defined as having blood cultures ordered within 72 hours of ED presentation (N = 25,441). Patients who did not receive at least two doses of intravenous (IV) antibiotics within 48 hours were excluded, as they were unlikely to have serious infections.
We defined sepsis based on Sepsis-3 consensus guidelines2 as a change in sequential [sepsis-related] organ failure assessment (SOFA) score ≥2 within the first 48 hours of ED presentation. The SOFA score is comprised of six variables representing different organ systems, each rated 0-4 based on the degree of dysfunction.2 Patient vital signs, laboratory data, vasopressor medication doses, and ventilator settings were used to determine the exact timestamp at which each patient attained a change in SOFA score ≥2. Missing values were considered to be normal. To adjust for baseline organ dysfunction, SOFA elements associated with elevated bilirubin and/or creatinine were excluded for patients with chronic liver/kidney disease based on Elixhauser comorbidities.27 We chose to focus on the first 48 hours in an attempt to capture patients with the most severe illnesses and the highest probability of true sepsis.
All primary and secondary International Classification of Diseases (ICD)-9/10 diagnosis codes were extracted from Clarity coding tables at the time of hospital discharge. Diagnosis codes signifying bacterial infection were grouped into the following categories based on type/location: pneumonia; bacteremia; urinary tract infection; and skin and soft tissue infection. All remaining diagnostic codes indicating bacterial infections at other sites were categorized as “Other”. If no codes indicating infection were present, patients were categorized as “None coded”. Patients with discharge diagnosis codes of “sepsis” were also identified. Dates and times of antibiotic administrations were obtained from the medications table. Time to first antibiotic was defined as the time in minutes from ED presentation to initiation of the first IV antibacterial medication. This variable was transformed using a natural log transformation based on best fit for normal distribution.
We limited our analyses to 8,974 patients who were diagnosed with sepsis as defined above and had either (1) ≥4 qualifying antibiotic days (QADs) or (2) an ICD-9/10 discharge diagnosis code of “sepsis” (Figure). QADs were defined based on the recent publication by Rhee et al. as having received four or more consecutive days of antibiotics, with the first dose given IV within 48 hours of presentation.28 Patients who died or were discharged to hospice prior to the 4th QAD were also included. These additional parameters were added to increase specificity of the study sample for patients with true sepsis. Patients admitted to all levels of care (acute care, transitional care unit [TCU], intensive care unit [ICU]) and under all hospital services were included. There were no missing data for mortality, race, or language. We chose to focus on patients with sepsis in this initial study as this is a common diagnosis in hospital medicine that is enriched for high mortality.
Primary Outcome
The primary outcome of the study was inpatient mortality, which was obtained from the hospital encounters table in Clarity.
Primary Predictors
The primary predictor of interest was LEP. The encounter numbers from the dataset were used to link to self-reported demographic data, including “preferred language” and need for interpreter services. A manual chart review of 60 patients speaking the top six languages was conducted to verify the accuracy of the data on language and interpreter use (KNK). Defining the gold standard for LEP as having any chart note indicating non-English language and/or that an interpreter was used, the “interpreter needed” variable in Epic was found to have a positive predictive value for LEP of 100%. Therefore, patients in the study cohort were defined as having LEP if they met both of the following criteria: (1) a self-reported “preferred language” other than English and (2) having the “interpreter needed” variable indicating “yes”.
Covariate Data Collection
Additional data were obtained from the demographics tables, including age, race, sex, and insurance status. Race and ethnicity were combined into a single five-category variable including White, Asian, Black, Latino, and Other. This approach has been suggested as the best way to operationalize these variables29 and has been utilized by similar studies in the literature.9,14,15 We considered the Asian race to include all people of East Asian, Southeast Asian, or South Asian descent, which is consistent with the United States Census Bureau definition.30 Patients identifying as Native Hawaiians/Pacific Islanders, Native Americans/Alaskan Natives, as well as those with unspecified race or ethnicity, were categorized as Other. Insurance status was categorized as Commercial, Medicare, Medicaid, or Other.
We estimated illness severity in several ways. First, the total qualifying SOFA score was calculated for each patient, which was defined as the total score achieved at the time that SOFA criteria were first met (≥2, within 48 hours). Second, we dichotomized patients based on whether they had received mechanical ventilation at any point during hospitalization. Finally, we used admission location as a surrogate marker for severity at the time of initial hospitalization.
To estimate the burden of baseline comorbidities, we calculated the van Walraven score (VWS),31 a validated modification of the Elixhauser Comorbidity Index.27 This score conveys an estimated risk of in hospital death based on ICD-9/10 diagnosis codes for preexisting conditions, which ranges from <1% for the minimum score of –19 to >99% for the maximum score of 89.
Statistical Analyses
All statistical analyses were performed using Stata software version 15 (StataCorp LLC, College Station, Texas). Baseline demographics and patient characteristics were stratified by LEP. These were compared using two-sample t-tests or chi-squared tests of significance. Wilcoxon rank-sum tests were used for non-normally distributed variables. Inpatient mortality was compared across all races stratified by LEP using chi-squared tests of significance.
We fit a series of multivariable logistic regression models to examine the association between race and inpatient mortality adjusting for LEP and other patient/clinical characteristics. We first examined the unadjusted association between mortality and race; then adjusted for LEP alone; and finally adjusted for all covariates of interest, including LEP, age, sex, insurance status, year, admission level of care, VWS, total qualifying SOFA score, need for mechanical ventilation, site of infection, and time to first IV antibiotic. A subgroup analysis was also performed using the fully adjusted model restricted to patients who were mechanically ventilated. This population was selected because the patients (1) have among the highest severity of illness and (2) share a common barrier to communication, regardless of English proficiency.
Several potential interactions between LEP with other covariates were explored, including age, race, ICU admission level of care, and need for mechanical ventilation. Lastly, a mediation analysis was performed based on Baron & Kenny’s four-step model32 in order to calculate the proportion of the association between race and mortality explained by the proposed mediator (LEP).
To evaluate for the likelihood of residual confounding, we calculated an E-value, which is defined as the minimum strength of association that an unmeasured confounder would need to have with both the predictor and outcome variables, above and beyond the measured covariates, in order to fully explain away an observed predictor-outcome association.33,34
RESULTS
We identified 8,974 patients hospitalized with sepsis based on the above inclusion criteria. This represented a medically complex, racially and linguistically diverse population (Table 1). The cohort was comprised of 24% Asian, 12% Black, and 11% Latino patients. Among those categorized as Other race, Native Americans/Alaskan Natives and Native Hawaiians/Pacific Islanders accounted for 4% (n = 31) and 21% (n = 159), respectively. A fifth of all patients had LEP (n = 1,716), 62% of whom were Asian (n = 1,064). Patients with LEP tended to be older, female, and to have a greater number of comorbid conditions (Table 1). The total qualifying SOFA score was also higher among patients with LEP (median 5; interquartile range [IQR]: 4-8 vs 5; IQR: 3-7; P <.001), though there was no association between LEP and mechanical ventilation (P = .22). The prevalence of LEP differed significantly across races, with 50% LEP among Asians, 32% among Latinos, 5% among White patients (P < .001). Only eight Black patients had LEP. More than 40 unique languages were represented in the cohort, with English, Cantonese, Spanish, Russian, and Mandarin accounting for ~95% (Appendix Table 1). Among Latino patients, 63% spoke English and 36% spoke Spanish.
In-hospital mortality was significantly higher among patients who had LEP (n = 268/1,716, 16%) compared to non-LEP patients (n = 678/7,258, 9%), with 80% greater unadjusted odds of mortality (OR 1.80; 95% CI: 1.54-2.09; P < .001). Notably we also found that Asian race was associated with a 1.57 unadjusted odds of mortality compared to White race (95% CI: 1.34-1.85; P < .001). Age, VWS, total qualifying SOFA score, mechanical ventilation, and admission level of care all exhibited a positive dose-response association with mortality (Appendix Table 2). In unadjusted analyses, there was no evidence of interaction between LEP and age (P = .38), LEP and race (P = .45), LEP and ICU admission level of care (P = .31), or LEP and mechanical ventilation (P = .19). Asian patients had the highest overall mortality (14% total, 17% with LEP). LEP was associated with increased unadjusted mortality among White, Asian, and Other races compared to their non-LEP counterparts (Appendix Figure 1). There was no significant difference in mortality between Latino patients with and without LEP. The sample size for Black patients with LEP (n = 8) was too small to draw conclusions about mortality.
Following multivariable logistic regression modeling for the association between race and mortality, we found that the increased odds of death among Asian patients was partially attenuated after adjusting for LEP (odds ratio [OR] 1.23, 95% CI: 1.02-1.48; P = .03; Table 2). Meanwhile, LEP was associated with a 1.66 odds of mortality (95% CI: 1.38-1.99; P < .001) after adjustment for race. In the full multivariable model adjusting for demographics and clinical characteristics, illness severity, and comorbidities, LEP was associated with a 31% increase in the odds of mortality compared to non-LEP (95% CI: 1.06-1.63; P = .02). In this model, the association between Asian race and mortality was now fully attenuated, with a point estimate near 1.0 (OR 0.98; 95% CI: 0.79-1.22; P = .87). Markers of illness severity, including total qualifying SOFA score (OR 1.23; 95% CI: 1.20-1.27; P < .001) and need for mechanical ventilation (OR 1.88; 95% CI: 1.52-2.33; P < .001), were both associated with greater odds of death. Based on a four-step mediation analysis, LEP was found to be a partial mediator to the association between Asian race and mortality (76% proportion explained). The E-value for the association between LEP and mortality was 1.95, with an E-value for the corresponding confidence interval of 1.29.
In a subgroup analysis using the fully adjusted model restricted to patients who were mechanically ventilated during hospitalization, the association between LEP and mortality was no longer present (OR 1.15; 95% CI: 0.76-1.72; P = .51).
DISCUSSION
At a single US academic medical center serving a diverse population, we found that LEP was associated with sepsis mortality across all races except Black and Latino, conveying a 31% increase in the odds of death after adjusting for illness severity, comorbidities, and baseline characteristics. The higher mortality among Asian patients was largely mediated by LEP (76% proportion explained). While previous studies have variably found Black, Asian, Latino, and other non-White races/ethnicities to be at an increased risk of death from sepsis,9-15 LEP has not been previously evaluated as a mediator of sepsis mortality. We were uniquely suited to uncover such an association due to the racial and linguistic diversity of our patient population. LEP has previously been implicated in poor health outcomes among hospitalized patients in general.22-24 Future studies will be necessary to determine whether similar associations between LEP and mortality are observed among broader patient populations outside of sepsis.
There are a number of possible explanations for how LEP could mediate the association between race and mortality. First, LEP is known to be associated with greater difficulties in accessing medical care,25 which could result in poorer baseline control of chronic comorbid conditions, fewer opportunities for preventive screening, and greater reluctance to seek medical attention when ill, theoretically leading to more severe presentations and worse outcomes. Indeed, LEP patients in our cohort had both a shorter median time to receiving their first antibiotic, as well as a higher total qualifying SOFA score, both of which may suggest more severe initial presentations. LEP is also known to contribute to, or exacerbate, the impact of low health literacy, which is itself associated with poor health.35 Second, implicit biases may also have been present, as they are known to be common among healthcare providers and have been shown to negatively impact patient care.36
Finally,it is possible that the association is related to the language barrier itself, which impacts providers’ ability to take an appropriate clinical history, and can lead to clinical errors or delays in care.37 The fact that the association between LEP and mortality was eliminated when the analysis was restricted to mechanically ventilated patients seems to support this, since differences in language proficiency become irrelevant in this subgroup. While we are unable to comment on causality based on this observational study, we included a directed acyclic graph (DAG) in the supplemental materials, which shows one proposed model for describing these associations (Appendix Figure 2).
Assuming that the language barrier itself does, at least in part, drive the observed association, LEP represents a potentially modifiable risk factor that could be a target for quality improvement interventions. There is evidence that the use of medical interpreters among patients with LEP leads to greater satisfaction, fewer errors, and improved clinical outcomes;38 however, several recent studies have documented underutilization of professional interpreter services, even when readily available.39,40 At our institution, phone and video interpreter services are available 24/7 for approximately 150 languages. Due to limitations inherent to the EHR, we were unable to ascertain the extent to which these services were used in the present study. Heavy clinical workloads, connectivity issues, and missing or faulty equipment represent theoretical barriers to utilization of these services.
There are some limitations to our study. First, by utilizing a large database of electronic data, the quality of our analyses was reliant on the accuracy of the EHR. Demographic data such as language may have been subject to misclassification due to self-reporting. We attempted to minimize this by also including the need for interpreter services within the definition of LEP, which was validated by manual chart review. Second, generalizability is limited in this single-center study conducted at an institution with unique demographics, wherein nearly two-thirds of the LEP patients were Asian, and the Chinese-speaking population outnumbered those who speak Spanish.
Finally, the most important limitation to our study is the potential for residual confounding. While we attempted to mitigate this by adjusting for as many clinically relevant covariates as possible, there may still be unmeasured confounders to the association between LEP and mortality, such as access to outpatient care, functional status, interpreter use, and other markers of illness severity like the number and type of supportive therapies received. Based on our E-value calculations, with an observed OR of 1.31 for the association between LEP and mortality, an unmeasured confounder with an OR of 1.95 would fully explain away this association, while an OR of 1.29 would shift the confidence interval to include the null. These values suggest at least some risk of residual confounding. The fact that our fully adjusted model included multiple covariates, including several markers of illness severity, does somewhat lessen the likelihood of a confounder achieving these values, since they represent the minimum strength of an unmeasured confounder above and beyond the measured covariates. Regardless, the finding that patients with LEP are more likely to die from sepsis remains an important one, recognizing the need for further studies including multicenter investigations.
In this study, we showed that LEP was associated with sepsis mortality across nearly all races in our cohort. While Asian race was associated with a higher unadjusted odds of death compared to White race, this was attenuated after adjusting for LEP. This may suggest that some of the racial disparities in sepsis identified in prior studies were in fact mediated by language proficiency. Further studies will be required to explore the causal nature of this novel association. If modifiable factors are identified, this could represent a potential target for future quality improvement initiatives aimed at improving sepsis outcomes.
Disclaimer
The contents are solely the responsibility of the authors and do not necessarily represent the official views of the University of California, San Francisco or the National Institutes of Health.
1. De Backer DD, Dorman T. Surviving sepsis guidelines: A continuous move toward better care of patients with sepsis. JAMA. 2017;317(8):807-808. https://doi.org/10.1001/jama.2017.0059.
2. Singer M, Deutschman CS, Seymour CW, et al. The third international consensus definitions for sepsis and septic shock (Sepsis-3). JAMA. 2016;315(8):801-810. https://doi.org/10.1001/jama.2016.0287.
3. Angus DC, Linde-Zwirble WT, Lidicker J, et al. Epidemiology of severe sepsis in the United States: analysis of incidence, outcome, and associated costs of care. Crit Care Med. 2001;29(7):1303-1310. https://doi.org/10.1097/00003246-200107000-00002.
4. Mayr FB, Yende S, Angus DC. Epidemiology of severe sepsis. Virulence. 2014;5(1):4-11. https://doi.org/10.4161/viru.27372.
5. Dellinger RP, Levy MM, Rhodes A, et al. Surviving Sepsis Campaign: international guidelines for management of severe sepsis and septic shock: 2012. Crit Care Med. 2013;41(2):580-637. https://doi.org/10.1097/CCM.0b013e31827e83af.
6. Levy MM, Rhodes A, Phillips GS, et al. Surviving Sepsis Campaign: association between performance metrics and outcomes in a 7.5-year study. Crit Care Med. 2015;43(1):3-12. https://doi.org/10.1097/CCM.0000000000000723.
7. Damiani E, Donati A, Serafini G, et al. Effect of performance improvement programs on compliance with sepsis bundles and mortality: a systematic review and meta-analysis of observational studies. PLOS ONE. 2015;10(5):e0125827. https://doi.org/10.1371/journal.pone.0125827.
8. Paoli CJ, Reynolds MA, Sinha M, Gitlin M, Crouser E. Epidemiology and costs of sepsis in the United States-an analysis based on timing of diagnosis and severity level. Crit Care Med. 2018;46(12):1889-1897. https://doi.org/10.1097/CCM.0000000000003342.
9. Barnato AE, Alexander SL, Linde-Zwirble WT, Angus DC. Racial variation in the incidence, care, and outcomes of severe sepsis: analysis of population, patient, and hospital characteristics. Am J Respir Crit Care Med [patient]. 2008;177(3):279-284. https://doi.org/10.1164/rccm.200703-480OC.
10. Mayr FB, Yende S, Linde-Zwirble WT, et al. Infection rate and acute organ dysfunction risk as explanations for racial differences in severe sepsis. JAMA. 2010;303(24):2495-2503. https://doi.org/10.1001/jama.2010.851.
11. Dombrovskiy VY, Martin AA, Sunderram J, Paz HL. Occurrence and outcomes of sepsis: influence of race. Crit Care Med. 2007;35(3):763-768. https://doi.org/10.1097/01.CCM.0000256726.80998.BF.
12. Yamane D, Huancahuari N, Hou P, Schuur J. Disparities in acute sepsis care: a systematic review. Crit Care. 2015;19(Suppl 1):22. https://doi.org/10.1186/cc14102.
13. Martin GS, Mannino DM, Eaton S, Moss M. The epidemiology of sepsis in the United States from 1979 through 2000. N Engl J Med. 2003;348(16):1546-1554. https://doi.org/10.1056/NEJMoa022139.
14. Melamed A, Sorvillo FJ. The burden of sepsis-associated mortality in the United States from 1999 to 2005: an analysis of multiple-cause-of-death data. Crit Care. 2009;13(1):R28. https://doi.org/10.1186/cc7733.
15. Jones JM, Fingar KR, Miller MA, et al. Racial disparities in sepsis-related in-hospital mortality: using a broad case capture method and multivariate controls for clinical and hospital variables, 2004-2013. Crit Care Med. 2017;45(12):e1209-e1217. https://doi.org/10.1097/CCM.0000000000002699.
16. Bakullari A, Metersky ML, Wang Y, et al. Racial and ethnic disparities in healthcare-associated infections in the United States, 2009–2011. Infect Control Hosp Epidemiol. 2014;35(S3):S10-S16. https://doi.org/10.1086/677827.
17. Institute of Medicine. Unequal Treatment: What Healthcare Providers Need to Know about Racial and Ethnic Disparities in Healthcare. Washington, DC: National Academy Press; 2002.
18. Vogel TR. Update and review of racial disparities in sepsis. Surg Infect. 2012;13(4):203-208. https://doi.org/10.1089/sur.2012.124.
19. Esper AM, Moss M, Lewis CA, et al. The role of infection and comorbidity: factors that influence disparities in sepsis. Crit Care Med. 2006;34(10):2576-2582. https://doi.org/10.1097/01.CCM.0000239114.50519.0E.
20. Soto GJ, Martin GS, Gong MN. Healthcare disparities in critical illness. Crit Care Med. 2013;41(12):2784-2793. https://doi.org/10.1097/CCM.0b013e3182a84a43.
21. Taylor SP, Karvetski CH, Templin MA, Taylor BT. Hospital differences drive antibiotic delays for black patients compared with white patients with suspected septic shock. Crit Care Med. 2018;46(2):e126-e131. https://doi.org/10.1097/CCM.0000000000002829.
22. Divi C, Koss RG, Schmaltz SP, Loeb JM. Language proficiency and adverse events in US hospitals: a pilot study. Int J Qual Health Care. 2007;19(2):60-67. https://doi.org/10.1093/intqhc/mzl069.
23. John-Baptiste A, Naglie G, Tomlinson G, et al. The effect of English language proficiency on length of stay and in-hospital mortality. J Gen Intern Med. 2004;19(3):221-228. https://doi.org/10.1111/j.1525-1497.2004.21205.x.
24. Karliner LS, Kim SE, Meltzer DO, Auerbach AD. Influence of language barriers on outcomes of hospital care for general medicine inpatients. J Hosp Med. 2010;5(5):276-282. https://doi.org/10.1002/jhm.658.
25. Hacker K, Anies M, Folb BL, Zallman L. Barriers to health care for undocumented immigrants: a literature review. Risk Manag Healthc Policy. 2015;8:175-183. https://doi.org/10.2147/RMHP.S70173.
26. QuickFacts: San Francisco County, California. U.S. Census Bureau (2016). https://www.census.gov/quickfacts/fact/table/sanfranciscocountycalifornia/RHI425216. Accessed May 15, 2018.
27. Moore BJ, White S, Washington R, Coenen N, Elixhauser A. Identifying increased risk of readmission and in-hospital mortality using hospital administrative data: The AHRQ Elixhauser comorbidity index. Med Care. 2017;55(7):698-705. https://doi.org/10.1097/MLR.0000000000000735.
28. Rhee C, Dantes R, Epstein L, et al. Incidence and trends of sepsis in us hospitals using clinical vs claims data, 2009-2014. JAMA. 2017;318(13):1241-1249. https://doi.org/10.1001/jama.2017.13836.
29. Howell J, Emerson MO, So M. What “should” we use? Evaluating the impact of five racial measures on markers of social inequality. Sociol Race Ethn. 2017;3(1):14-30. https://doi.org/10.1177/2332649216648465.
30. Reeves T, Claudett B. United States Census Bureau. Asian Pac Islander Popul. March 2002;2003.
31. van Walraven C, Austin PC, Jennings A, Quan H, Forster AJ. A modification of the Elixhauser comorbidity measures into a point system for hospital death using administrative data. Med Care. 2009;47(6):626-633. https://doi.org/10.1097/MLR.0b013e31819432e5.
32. Baron RM, Kenny DA. The moderator-mediator variable distinction in social psychological research: conceptual, strategic, and statistical considerations. J Pers Soc Psychol. 1986;51(6):1173-1182. https://doi.org/10.1037//0022-3514.51.6.1173.33. VanderWeele TJ, Ding P. Sensitivity analysis in observational research: introducing the E-value. Ann Intern Med. 2017;167(4):268-274. https://doi.org/10.7326/M16-2607.
34. Mathur MB, Ding P, Riddell CA, VanderWeele TJ. Website and R package for computing E-values. Epidemiology. 2018;29(5):e45-e47. https://doi.org/10.1097/EDE.0000000000000864.
35. Sentell T, Braun KL. Low Health Literacy, Limited English proficiency, and health status in Asians, Latinos, and other racial/ethnic groups in California. J Health Commun. 2012;17 Supplement 3:82-99. https://doi.org/10.1080/10810730.2012.712621.
36. FitzGerald C, Hurst S. Implicit bias in healthcare professionals: a systematic review. BMC Med Eth. 2017;18(1):19. https://doi.org/10.1186/s12910-017-0179-8.
37. Flores G. The impact of medical interpreter services on the quality of health care: A systematic review. Med Care Res Rev. 2005;62(3):255-299. https://doi.org/10.1177/1077558705275416.
38. Karliner LS, Jacobs EA, Chen AH, Mutha S. Do professional interpreters improve clinical care for patients with limited English proficiency? A systematic review of the literature. Health Serv Res. 2007;42(2):727-754. https://doi.org/10.1111/j.1475-6773.2006.00629.x.
39. Diamond LC, Schenker Y, Curry L, Bradley EH, Fernandez A. Getting by: underuse of interpreters by resident physicians. J Gen Intern Med. 2009;24(2):256-262. https://doi.org/10.1007/s11606-008-0875-7.
40. López L, Rodriguez F, Huerta D, Soukup J, Hicks L. Use of interpreters by physicians for hospitalized limited English proficient patients and its impact on patient outcomes. J Gen Intern Med. 2015;30(6):783-789. https://doi.org/10.1007/s11606-015-3213-x.
© 2019 Society of Hospital Medicine
Impact on Length of Stay of a Hospital Medicine Emergency Department Boarder Service
Emergency department (ED) crowding and boarding of patients awaiting admission to the hospital (ED boarding) are growing problems with important clinical care and public safety implications.1-4 Increased ED boarding times have been associated with lower patient satisfaction, inadequate care of critically ill patients, adverse events, and increased mortality.3,5-7 Furthermore, ED boarding can diminish the ED’s ability to evaluate new patients.5,8,9 ED boarding is more severe in hospitals with high inpatient occupancy with resultant disproportionate burden on large urban institutions.2,4,5,10
Earlier studies suggest, but have not consistently shown, an association between longer ED length of stay (LOS) and longer overall hospital LOS.5 This association implies that the additional time spent in the ED waiting for a bed does not meaningfully contribute to advancing the required inpatient care. Thus, this waiting time is “dead time” that is added to the overall hospital duration.
The complexity and the volume of medical patients boarding in the ED can challenge the resources of an already overtaxed ED staff. Potential solutions to mitigate ED boarding of medicine patients generally focus on reducing barriers to timely movement of patients from the ED to an inpatient unit.1,3,11-13 Ultimately, these barriers are a function of inadequate hospital capacity (eg, hospital beds, staffing) and are difficult to overcome. Two primary strategies have been used to reduce these barriers. One strategy focuses on shifting inpatient discharge times earlier to better match inpatient bed supply with ED demand.14-19 Another common strategy is utilizing inpatient attendings to triage and better match bed needs to bed availability.20-22
A separate area of interest, and the focus of this study, is the deployment of inpatient teams to hasten delivery of inpatient care to patients waiting in the ED.8,23 One institution implemented an “ED hospitalist” model.23 Another created a hospital medicine team to provide inpatient medical care to ED boarder patients and to lend clinical input to bed management.8
At our large, urban academic medical center, the Department of Medicine in collaboration with the Department of Emergency Medicine created a full-time hospital medicine team dedicated to providing care in the ED for patients awaiting admission to a general medicine unit. We present our multiyear experience with this ED-based hospital medicine team. We hypothesized that this new team would expedite inpatient care delivery to medical boarder patients, thereby reducing the overall hospital LOS.
METHODS
Study Setting and Design
This retrospective cross-sectional study, approved by the Institutional Review Board, was conducted at a 1,011-bed academic medical center in the northeast United States. The study period was July 1, 2016 through June 30, 2018, which was divided into Academic Year 16 (AY) (July 1, 2016 to June 30, 2017) and AY17 (July 1, 2017 to June 30, 2018).
The Hospital Medicine Unit (HMU) was a 60 full-time equivalent hospital medicine group consisting of 80 physicians and 25 advanced practice providers (APPs). During the study, the general medical services cared for an average of 260 patients per day on inpatient units with a wide variety of diagnoses and comorbidities. The ED had 48 monitored bed spaces for adult patients, as well as two dedicated ED observation units with 32 beds. The observation units are separate units within the hospital, staffed by ED clinicians, and were not included in this study. In 2016, the ED had a total of 110,741 patient visits and 13,908 patients were admitted to a medical service.
In 2010, the Department of Public Health for the state in which the medical center resides defined an ED boarder (EDB) patient as “a patient who remains in the ED two hours after the decision to admit.”24 According to this definition, any patient waiting for an inpatient bed for more than two hours after a bed request was considered as an EDB. Operationally, further distinctions were made between patients who were “eligible” for care by an internal medicine team in the ED versus those who were actually “covered”. Before the intervention outlined in the current study, some care was provided by resident and hospitalist teams to eligible EDB patients from 2010 to 2015, although this was limited in scope. From July 1, 2015 to June 30, 2016, there was no coverage of medicine EDB patients.
Intervention
ED Boarder Service Staffing
On July 1, 2016, the HMU deployed a dedicated full-time team of clinicians to care for boarding patients, which was known as the EDB service. The service was created with the goal of seeing a maximum of 25 patients over 24 hours.
Inpatient medicine attending physicians (hospitalists) and APPs worked on the EDB service. During the day (7
There was a dedicated nursing team for the EDB service. For AY16, there were two daytime EDB nurses and one night nurse, all with a coverage ratio of three to four patients per nurse. For AY17, there were four to five daytime nurses and two to three nighttime nurses with the same coverage ratio as that for AY16. EDB nurses received special training on caring for boarder patients and followed the usual inpatient nursing protocols and assessments. During each shift, an EDB charge nurse worked in conjunction with the hospitalist, bed management, and inpatient units to determine patients requiring coverage by the EDB team.
Patient Eligibility
Similar to the workflow before the intervention, the ED team was responsible for determining a patient’s need for admission to a medical service. Patients were eligible for EDB service coverage if they waited in the ED for more than two hours after the request for an inpatient bed was made. The EDB charge nurse was responsible for identifying all eligible boarder patients based on time elapsed since bed request. Patients were not eligible for the hospital medicine EDB service if they were in the ED observation units or were being admitted to the intensive care unit, cardiology service, oncology service, or any service outside of the Department of Medicine.
The EDB service did not automatically assume care of all eligible patients. Instead, eligible patients were accepted based on several factors including EDB clinician census, anticipated availability of an inpatient bed, and clinical appropriateness as deemed by the physician. If the EDB physician census was fewer than 10 patients and an eligible patient was not expected to move to an inpatient unit within the next hour, the patient was accepted by the EDB service. Patients who were not accepted by the EDB service remained under the care of the ED team until either the patient received an inpatient bed or space became available on the EDB service census. Eligible EDB patients who received an inpatient bed before being picked up by the EDB service were considered as noncovered EDB patients. Alternatively, an eligible patient may initially be declined from EDB service coverage due to, for example, a high census but later accepted when capacity allowed—this patient would be considered a covered EDB patient.
Handoff and Coordination
When an eligible patient was accepted onto the EDB service, clinical handoff between the ED and EDB teams occurred. The EDB physician wrote admission orders, including the inpatient admission order. Once on the EDB service, when space allowed, the patient was physically moved to a dedicated geographic space (8 beds) within the ED designed for the EDB service. When the dedicated EDB area was full, new patients would remain in their original patient bay and receive care from the EDB service. Multidisciplinary rounds with nursing, inpatient clinicians, and case management that normally occur every weekday on inpatient units were adapted to occur on the EDB service to discuss patient care needs. The duration of the patient’s stay in the ED, including the time on the EDB service, was dictated by bed availability rather than by clinical discretion of the EDB clinician. When an EDB patient was assigned a ready inpatient bed, the EDB clinician immediately passed off clinical care to the inpatient medical team. There was no change in the process of assigning patients to inpatient beds during the intervention period.
Study Population
This study included patients who were admitted to the general medical services through the ED during the defined period. We excluded medicine patients who did not pass through the ED (eg, direct admissions or outside transfer) as well as patients admitted to a specialty service (cardiology, oncology) or the intensive care unit. Patients admitted to a nonmedical service were also excluded.
Two hours following a bed request, an ED patient was designated as an eligible EDB patient. Operationally, and for the purposes of this study, patients were separated into three groups: (1) an eligible EDB patient for whom the EDB service assumed care for any portion of their ED stay was considered as a “covered ED boarder,” (2) an eligible EDB patient who did not have any coverage by the EDB service at any point during their ED stay was considered as a “noncovered boarder,” and (3) a patient who received an inpatient bed within two hours of bed request was considered as a “nonboarder”. Patients admitted to a specialty service, intensive care unit, or nonmedical services were not included in any of the abovementioned three groups.
We defined metrics to quantify the extent of EDB team coverage. First, the number of covered EDB patients was divided by all medicine boarders (covered + noncovered) to determine the percentage of medicine EDBs covered. Second, the total patient hours spent under the care of the EDB service was divided by the total boarding hours for all medicine boarders to determine the percentage of boarder hours covered.
Data Sources and Collection
The Electronic Health Record (EHR; Epic Systems Corporation, Verona, Wisconsin) captured whether patients were eligible EDBs. For covered EDB patients, the time when care was assumed by the EDB service was captured electronically. Patient demographics, admitting diagnoses, time stamps throughout the hospitalization, admission volumes, LOS, and discharge disposition were extracted from the EHR.
Primary and Secondary Outcome Measures
The primary outcome of this study was hospital LOS defined as the time from ED arrival to hospital departure (Figure). Secondary outcomes included ED LOS (time from ED arrival to ED departure) and the rate of 30-day ED readmission to the study institution.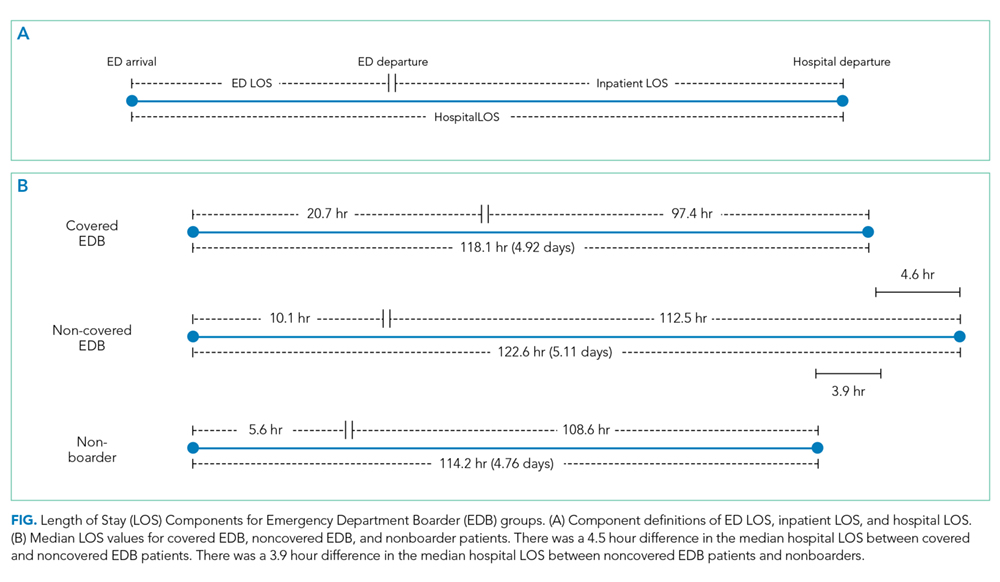
Statistical Analysis
SAS version 9.4 (SAS Institute, Cary, North Carolina) was used for all statistical analyses. Continuous outcomes were compared using the Mann–Whitney test and dichotomized outcomes were compared using chi-square tests. We further analyzed the differences in the primary and secondary outcomes between covered and noncovered EDB groups using a multivariable regression analysis adjusting for age, gender, race, academic year, hour of the day, and day of the week at the time of becoming an EDB. We used quantile regression and linear regression with log-transformed continuous outcomes and logistic regression for the dichotomized outcome. A P value of .05 was used as a threshold for statistical significance.
RESULTS
Study Population and Demographics
There were a total of 16,668 patients admitted from the ED to the general medical services during the study period (Table 1). There were 8,776 (53%) patients in the covered EDB group, 5,866 (35%) patients in the noncovered EDB group, and 2,026 (12%) patients in the nonboarder group. There were more patients admitted during AY17 compared with AY16 (8,934 vs 7,734 patients, respectively, Appendix 1). Patient demographics, including age, gender, race, insurance coverage, admitting diagnoses, and discharge disposition, were similar among all three patient groups (Table 1). A majority of patients in the covered EDB and nonboarder groups presented to the ED in the afternoon, whereas noncovered EDB patients presented more in the morning (Table 1). Consistent with this pattern, inpatient bed requests for covered EDB and nonboarder patients were more frequent between 7 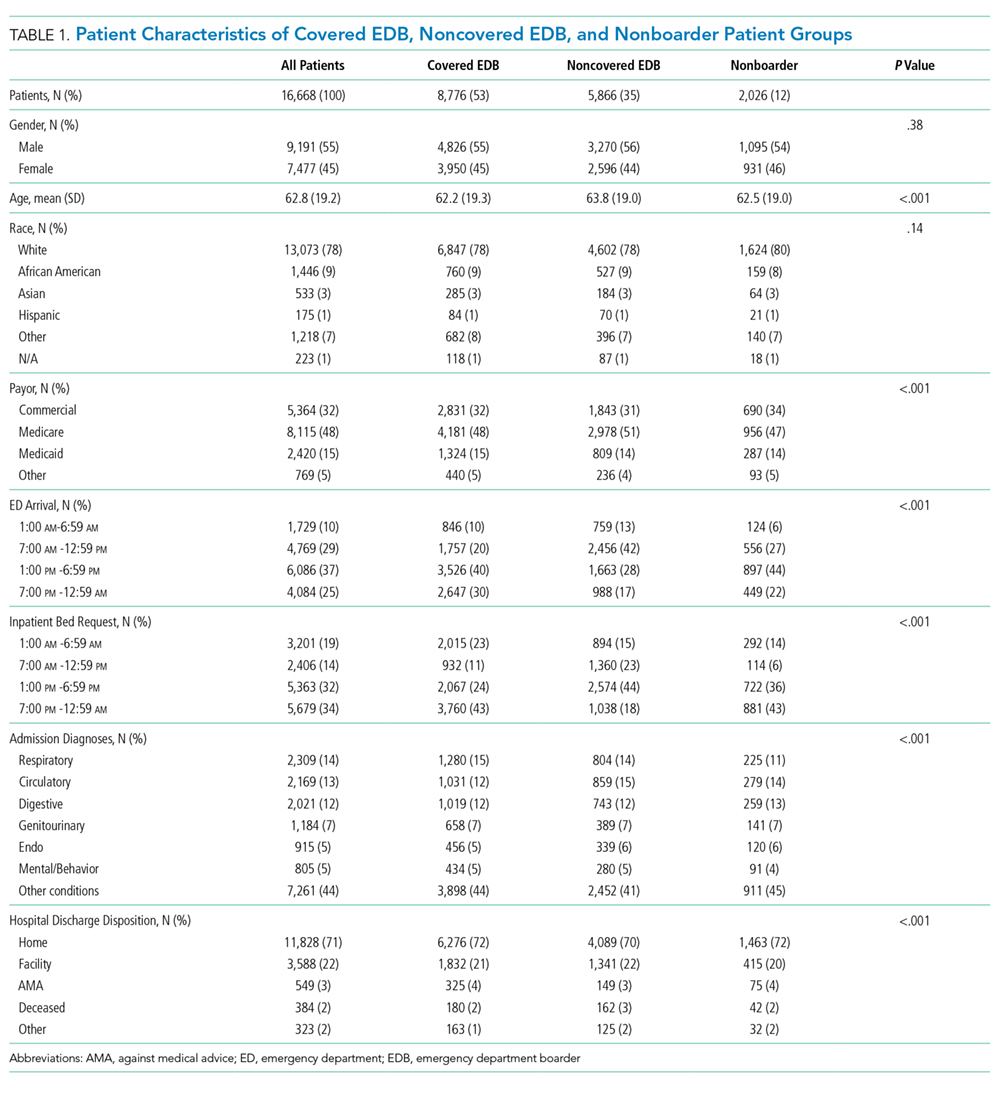
Hospital Length of Stay
Nonboarders had the shortest median hospital LOS (4.76; interquartile range [IQR] 2.90-7.22 days). Covered EDB patients had a median hospital LOS that was 4.6 hours (0.19 day) shorter compared with noncovered EDB patients (4.92 [IQR 3.00-8.03] days vs 5.11 [IQR 3.16-8.34 days]; Table 2). The differences among the three groups were all significant in the univariate comparison (P < .001). Multivariable regression controlling for patient age, gender, race, academic year, and hour and day of the week at the time of becoming an EDB demonstrated that the difference in hospital LOS between covered and noncovered EDB patients remained significant (P < .001).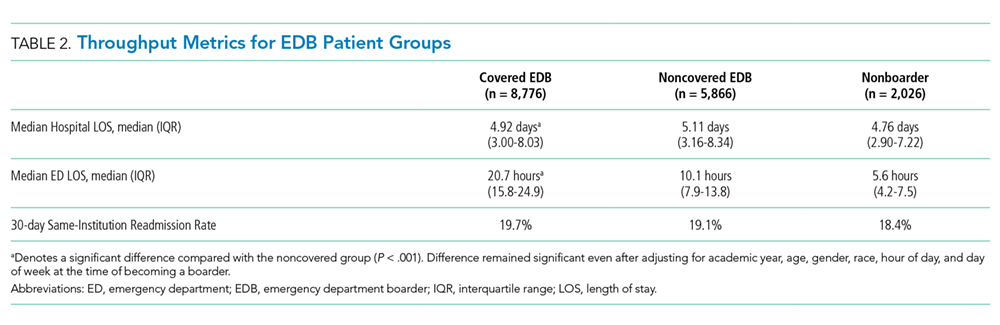
ED Length of Stay and 30-Day ED Readmission
Covered EDB patients had a longer median ED LOS compared with noncovered EDB patients and nonboarder patients (20.7 [IQR 15.8-24.9] hours vs 10.1 [IQR 7.9-13.8] hours vs 5.6 [IQR 4.2-7.5] hours, respectively, Table 2). These differences remained significant in the multivariable regression models (P < .001). Finally, the 30-day same-institution ED readmission rate was similar between covered and noncovered EDB patients.
DISCUSSION
We present two years of data describing a hospital medicine-led team designed to enhance the care of medical patients boarding in the ED. The period spent boarding in the ED is a vulnerable time for patients, and we created the EDB service with the goal of delivering inpatient medicine-led care to ED patients awaiting their inpatient bed.
When a bed request is made in an efficient ideal world, patients could be immediately transferred to an open inpatient bed to initiate care. In our study, patients who were not EDBs (ie, waited for less than two hours for their inpatient bed) had the most time-efficient care as they had the shortest ED and hospital LOS. However, nonboarders represented only 12% of patients and the majority of patients admitted to medicine were boarders. Patients covered by the EDB service had an overall hospital LOS that was 4.6 hours shorter compared with noncovered EDB patients despite having an ED LOS that was 15.1 hours longer. These LOS differences were observed without any difference to 30-day ED readmission rates.
Given that not all boarding patients were cared by the EDB service, the role of selection bias in our study warrants discussion. Similar to other studies, ED LOS for our patient cohort is heavily influenced by the availability of inpatient beds.10-12 The EDB service handed off patients they were covering as soon as an inpatient bed became available. Although there was discretion from the EDB charge nurse and the EDB physician about which patient to accept, this was primarily focused on choosing patients who did not have a pending inpatient bed (eg, a patient who was assigned a bed but was awaiting room cleaning). Importantly, there was no change in the bed assignment process as a part of the intervention. Our intervention’s design did not allow for elucidation of causation; however, we believe that the longer ED LOS for covered EDB patients compared with noncovered EDB patients reflects the fact that the team chose patients with a higher expected ED LOS rather than that the patients had a longer LOS due to being cared by the service. Consistent with this, patients covered by the EDB service tended to have bed requests placed during the night shift compared with noncovered EDB patients; patients with bed requests at night are more likely to wait longer for their inpatient bed given that inpatient beds are generally freed up in the afternoon. We acknowledge that it is impossible to completely rule out the possibility that patient factors (eg, infectious precautions) influence inpatient bed wait time and could be another factor influencing the probability of EDB service coverage.
The current study adds to the expanding literature on EDB care models. Briones et al. demonstrated that an “ED hospitalist” led to increased care delivery as measured by an increased follow-up on laboratory results and medication orders.23 However, their study was not structured to demonstrate LOS changes.23 In another study, Chadaga et al. reported about their experience with a hospital medicine team providing care for EDB patients, similar to our study.8 Their hospital medicine team consisted of a hospitalist and APP deployed in the ED during the day, with night coverage provided by existing ED clinicians. They demonstrated less ED diversion, more ED discharges, and positive perceptions among the ED team.8 However, there was no impact on ED or hospital LOS, although their results may have been limited by the short duration of postintervention data and the lack of nighttime coverage.8 Finally, a modeling study demonstrated a reduction in ED LOS by adding ED clinicians only for patients being discharged from the ED and not for those being admitted, although there was no explicit adjustment for LOS accounting for initiation of inpatient care in the ED.15 Extending the current literature, our study suggests that a hospitalist team providing continuous coverage to a large portion of EDB patients could shorten the overall hospital LOS for boarding patients, but even this was not enough to reduce LOS to the same level as that of patients who did not board.
Practically, there were challenges to creating the EDB service described in our study. Additional clinical staff (physician, APP, and nursing) were hired for the team, requiring a financial commitment from the institution. The new team required space within the ED footprint incurring construction costs. Before the existence of the EDB service, other ancillary services (eg, physical therapy) were unaccustomed to seeing ED patients, and thus new workflows were created. Another challenge was that internal medicine clinicians were not used to caring for patients for short durations of time before passing off clinical care to another team. This required a different approach, focusing on acute issues rather than conducting an exhaustive evaluation. Finally, the EDB service workflow introduced an additional handoff, increasing discontinuity of care. These challenges are factors to consider for institutions considering a similar EDB team and should be weighed against other interventions to alleviate ED boarding or improve throughput such as expanding inpatient capacity.
Ideal metrics to track the coverage and performance of an EDB service such as the one described in this study are undefined. It was difficult to know whether the goal should be complete coverage given the increase in handoffs, particularly for patients with short boarding times. This EDB service covered 59.9% of boarding patients and 62.9% of total boarding hours. Factors that contributed to covering less than 100% included physician staffing that was insufficient to meet demand and discretion to not accept patients expected to quickly get an inpatient bed. Therefore, the percentage of patients and boarding hours covered are crude metrics and further investigation is needed to develop optimal metrics for an EDB team.
Future studies on care models for EDB patients are warranted. Recognizing that EDB teams require additional resources, studies to define which patients receive the most benefit from EDB coverage will be helpful. Moreover, the EDB team composition may need to adapt to different environments (eg, academic, urban, nonacademic, rural). Diving deeper to study whether specific patient populations benefit more than others from care by the EDB service, as measured by hospital LOS or other outcomes, would be important. Clinical outcomes, in addition to throughput metrics such as LOS, must be analyzed to understand whether factors such as increased handoffs outweigh any benefits in throughput.
There were several limitations to this study. First, it was performed at a single academic institution, potentially limiting its generalizability. However, although some workflows and team coverage structures may be institution-specific, the concept of a hospital medicine-led EDB team providing earlier inpatient care can be adapted locally and may probably achieve similar benefits. Our study population included only patients destined for general medical admission; thus, it is uncertain whether the gains demonstrated in our study would be realized for patients boarding for nonmedical services. In addition, considering the observational nature of this study, it is difficult to prove the causation that a hospitalist EDB service solely led to reductions in hospital LOS. Finally, we did not adjust for nor measure whether ED clinicians provided different care to patients whom they felt were destined for the EDB service.
In summary, nonboarder patients had the shortest overall LOS; however, among those patients who boarded, coverage by a hospitalist-led team was associated with a shorter LOS. Given the limited inpatient capacity, eliminating ED boarding is often not possible. We present a model to expedite inpatient care and allow ED clinicians to focus on newly arriving ED patients. Additional studies are required to better understand how to optimally care for patients boarding in the ED.
1. Asplin BR, Magid DJ, Rhodes KV, Solberg LI, Lurie N, Camargo CA, Jr. A conceptual model of emergency department crowding. Ann Emerg Med. 2003;42(2):173-180. https://doi.org/10.1067/mem.2003.302.
2. Trzeciak S, Rivers EP. Emergency department overcrowding in the United States: an emerging threat to patient safety and public health. Emerg Med J. 2003;20(5):402-405. https://doi.org/10.1136/emj.20.5.402.
3. Olshaker JS. Managing emergency department overcrowding. Emerg Med Clin North Am. 2009;27(4):593-603. https://doi.org/10.1016/jemc.2009.07.004.
4. Richardson LD, Asplin BR, Lowe RA. Emergency department crowding as a health policy issue: past development, future directions. Ann Emerg Med. 2002;40(4):388-393. https://doi.org/10.1067/mem.2002.128012.
5. Bernstein SL, Aronsky D, Duseja R, et al. The effect of emergency department crowding on clinically oriented outcomes. Acad Emerg Med. 2009;16(1):1-10. https://doi.org/10.1111/j.1553-2712.2008.00295.x.
6. Singer AJ, Thode HC, Jr., Viccellio P, Pines JM. The association between length of emergency department boarding and mortality. Acad Emerg Med. 2011;18(12):1324-1329. https://doi.org/10.1111/j.1553-2712.2011.01236.x.
7. Silvester KM, Mohammed MA, Harriman P, Girolami A, Downes TW. Timely care for frail older people referred to hospital improves efficiency and reduces mortality without the need for extra resources. Age Ageing. 2014;43(4):472-477. https://doi.org/10.1093/ageing/aft170.
8. Chadaga SR, Shockley L, Keniston A, et al. Hospitalist-led medicine emergency department team: associations with throughput, timeliness of patient care, and satisfaction. J Hosp Med. 2012;7(7):562-566. https://doi.org/10.1002/jhm.1957.
9. Lucas R, Farley H, Twanmoh J, Urumov A, Evans B, Olsen N. Measuring the opportunity loss of time spent boarding admitted patients in the emergency department: a multihospital analysis. J Healthc Manag. 2009;54(2):117-124; discussion 124-115. https://doi.org/10.1097/00115514-200903000-00009.
10. Forster AJ, Stiell I, Wells G, Lee AJ, van Walraven C. The effect of hospital occupancy on emergency department length of stay and patient disposition. Acad Emerg Med. 2003;10(2):127-133. https://doi.org/10.1111/j.1553-2712.2003.tb00029.x.
11. Hoot NR, Aronsky D. Systematic review of emergency department crowding: causes, effects, and solutions. Ann Emerg Med. 2008;52(2):126-136. https://doi.org/10.1016/j.annemergmed.2008.03.014.
12. Asaro PV, Lewis LM, Boxerman SB. The impact of input and output factors on emergency department throughput. Acad Emerg Med. 2007;14(3):235-242. https://doi.org/10.1197/j.aem.2006.10.104.
13. Khare RK, Powell ES, Reinhardt G, Lucenti M. Adding more beds to the emergency department or reducing admitted patient boarding times: which has a more significant influence on emergency department congestion? Ann Emerg Med. 2009;53(5):575-585. https://doi.org/10.1016/j.annemergmed.2008.07.009.
14. Wertheimer B, Jacobs RE, Bailey M, et al. Discharge before noon: an achievable hospital goal. J Hosp Med. 2014;9(4):210-214. https://doi.org/10.1002/jhm.2154.
15. Paul JA, Lin L. Models for improving patient throughput and waiting at hospital emergency departments. J Emerg Med. 2012;43(6):1119-1126. https://doi.org/10.1016/j.jemermed.2012.01.063.
16. Wertheimer B, Jacobs RE, Iturrate E, Bailey M, Hochman K. Discharge before noon: effect on throughput and sustainability. J Hosp Med. 2015;10(10):664-669. https://doi.org/10.1002/jhm.2412.
17. Khanna S, Sier D, Boyle J, Zeitz K. Discharge timeliness and its impact on hospital crowding and emergency department flow performance. Emerg Med Australas. 2016;28(2):164-170. https://doi.org/10.1111/1742-6723.12543.
18. Patel H, Morduchowicz S, Mourad M. Using a systematic framework of interventions to improve early discharges. Jt Comm J Qual Patient Saf. 2017;43(4):189-196. https://doi.org/10.1016/j.jcjq.2016.12.003.
19. Powell ES, Khare RK, Venkatesh AK, Van Roo BD, Adams JG, Reinhardt G. The relationship between inpatient discharge timing and emergency department boarding. J Emerg Med. 2012;42(2):186-196. https://doi.org/10.1016/j.jemermed.2010.06.028.
20. Howell E, Bessman E, Kravet S, Kolodner K, Marshall R, Wright S. Active bed management by hospitalists and emergency department throughput. Ann Intern Med. 2008;149(11):804-811. https://doi.org/10.7326/0003-4819-149-11-200812020-00006.
21. Howell E, Bessman E, Marshall R, Wright S. Hospitalist bed management effecting throughput from the emergency department to the intensive care unit. J Crit Care. 2010;25(2):184-189. https://doi.org/10.1016/j.jcrc.2009.08.004.
22. Howell EE, Bessman ES, Rubin HR. Hospitalists and an innovative emergency department admission process. J Gen Intern Med. 2004;19(3):266-268. https://doi.org/10.1111/j.1525-1497.2004.30431.x.
23. Briones A, Markoff B, Kathuria N, et al. A model of a hospitalist role in the care of admitted patients in the emergency department. J Hosp Med. 2010;5(6):360-364. https://doi.org/10.1002/jhm.636.
24. Auerbach J. Reducing emergency department patient boarding and submitting code help policies to the Department of Public Health. In: Executive Office of Health and Human Services. Boston: Department of Public Health; 2010.
Emergency department (ED) crowding and boarding of patients awaiting admission to the hospital (ED boarding) are growing problems with important clinical care and public safety implications.1-4 Increased ED boarding times have been associated with lower patient satisfaction, inadequate care of critically ill patients, adverse events, and increased mortality.3,5-7 Furthermore, ED boarding can diminish the ED’s ability to evaluate new patients.5,8,9 ED boarding is more severe in hospitals with high inpatient occupancy with resultant disproportionate burden on large urban institutions.2,4,5,10
Earlier studies suggest, but have not consistently shown, an association between longer ED length of stay (LOS) and longer overall hospital LOS.5 This association implies that the additional time spent in the ED waiting for a bed does not meaningfully contribute to advancing the required inpatient care. Thus, this waiting time is “dead time” that is added to the overall hospital duration.
The complexity and the volume of medical patients boarding in the ED can challenge the resources of an already overtaxed ED staff. Potential solutions to mitigate ED boarding of medicine patients generally focus on reducing barriers to timely movement of patients from the ED to an inpatient unit.1,3,11-13 Ultimately, these barriers are a function of inadequate hospital capacity (eg, hospital beds, staffing) and are difficult to overcome. Two primary strategies have been used to reduce these barriers. One strategy focuses on shifting inpatient discharge times earlier to better match inpatient bed supply with ED demand.14-19 Another common strategy is utilizing inpatient attendings to triage and better match bed needs to bed availability.20-22
A separate area of interest, and the focus of this study, is the deployment of inpatient teams to hasten delivery of inpatient care to patients waiting in the ED.8,23 One institution implemented an “ED hospitalist” model.23 Another created a hospital medicine team to provide inpatient medical care to ED boarder patients and to lend clinical input to bed management.8
At our large, urban academic medical center, the Department of Medicine in collaboration with the Department of Emergency Medicine created a full-time hospital medicine team dedicated to providing care in the ED for patients awaiting admission to a general medicine unit. We present our multiyear experience with this ED-based hospital medicine team. We hypothesized that this new team would expedite inpatient care delivery to medical boarder patients, thereby reducing the overall hospital LOS.
METHODS
Study Setting and Design
This retrospective cross-sectional study, approved by the Institutional Review Board, was conducted at a 1,011-bed academic medical center in the northeast United States. The study period was July 1, 2016 through June 30, 2018, which was divided into Academic Year 16 (AY) (July 1, 2016 to June 30, 2017) and AY17 (July 1, 2017 to June 30, 2018).
The Hospital Medicine Unit (HMU) was a 60 full-time equivalent hospital medicine group consisting of 80 physicians and 25 advanced practice providers (APPs). During the study, the general medical services cared for an average of 260 patients per day on inpatient units with a wide variety of diagnoses and comorbidities. The ED had 48 monitored bed spaces for adult patients, as well as two dedicated ED observation units with 32 beds. The observation units are separate units within the hospital, staffed by ED clinicians, and were not included in this study. In 2016, the ED had a total of 110,741 patient visits and 13,908 patients were admitted to a medical service.
In 2010, the Department of Public Health for the state in which the medical center resides defined an ED boarder (EDB) patient as “a patient who remains in the ED two hours after the decision to admit.”24 According to this definition, any patient waiting for an inpatient bed for more than two hours after a bed request was considered as an EDB. Operationally, further distinctions were made between patients who were “eligible” for care by an internal medicine team in the ED versus those who were actually “covered”. Before the intervention outlined in the current study, some care was provided by resident and hospitalist teams to eligible EDB patients from 2010 to 2015, although this was limited in scope. From July 1, 2015 to June 30, 2016, there was no coverage of medicine EDB patients.
Intervention
ED Boarder Service Staffing
On July 1, 2016, the HMU deployed a dedicated full-time team of clinicians to care for boarding patients, which was known as the EDB service. The service was created with the goal of seeing a maximum of 25 patients over 24 hours.
Inpatient medicine attending physicians (hospitalists) and APPs worked on the EDB service. During the day (7
There was a dedicated nursing team for the EDB service. For AY16, there were two daytime EDB nurses and one night nurse, all with a coverage ratio of three to four patients per nurse. For AY17, there were four to five daytime nurses and two to three nighttime nurses with the same coverage ratio as that for AY16. EDB nurses received special training on caring for boarder patients and followed the usual inpatient nursing protocols and assessments. During each shift, an EDB charge nurse worked in conjunction with the hospitalist, bed management, and inpatient units to determine patients requiring coverage by the EDB team.
Patient Eligibility
Similar to the workflow before the intervention, the ED team was responsible for determining a patient’s need for admission to a medical service. Patients were eligible for EDB service coverage if they waited in the ED for more than two hours after the request for an inpatient bed was made. The EDB charge nurse was responsible for identifying all eligible boarder patients based on time elapsed since bed request. Patients were not eligible for the hospital medicine EDB service if they were in the ED observation units or were being admitted to the intensive care unit, cardiology service, oncology service, or any service outside of the Department of Medicine.
The EDB service did not automatically assume care of all eligible patients. Instead, eligible patients were accepted based on several factors including EDB clinician census, anticipated availability of an inpatient bed, and clinical appropriateness as deemed by the physician. If the EDB physician census was fewer than 10 patients and an eligible patient was not expected to move to an inpatient unit within the next hour, the patient was accepted by the EDB service. Patients who were not accepted by the EDB service remained under the care of the ED team until either the patient received an inpatient bed or space became available on the EDB service census. Eligible EDB patients who received an inpatient bed before being picked up by the EDB service were considered as noncovered EDB patients. Alternatively, an eligible patient may initially be declined from EDB service coverage due to, for example, a high census but later accepted when capacity allowed—this patient would be considered a covered EDB patient.
Handoff and Coordination
When an eligible patient was accepted onto the EDB service, clinical handoff between the ED and EDB teams occurred. The EDB physician wrote admission orders, including the inpatient admission order. Once on the EDB service, when space allowed, the patient was physically moved to a dedicated geographic space (8 beds) within the ED designed for the EDB service. When the dedicated EDB area was full, new patients would remain in their original patient bay and receive care from the EDB service. Multidisciplinary rounds with nursing, inpatient clinicians, and case management that normally occur every weekday on inpatient units were adapted to occur on the EDB service to discuss patient care needs. The duration of the patient’s stay in the ED, including the time on the EDB service, was dictated by bed availability rather than by clinical discretion of the EDB clinician. When an EDB patient was assigned a ready inpatient bed, the EDB clinician immediately passed off clinical care to the inpatient medical team. There was no change in the process of assigning patients to inpatient beds during the intervention period.
Study Population
This study included patients who were admitted to the general medical services through the ED during the defined period. We excluded medicine patients who did not pass through the ED (eg, direct admissions or outside transfer) as well as patients admitted to a specialty service (cardiology, oncology) or the intensive care unit. Patients admitted to a nonmedical service were also excluded.
Two hours following a bed request, an ED patient was designated as an eligible EDB patient. Operationally, and for the purposes of this study, patients were separated into three groups: (1) an eligible EDB patient for whom the EDB service assumed care for any portion of their ED stay was considered as a “covered ED boarder,” (2) an eligible EDB patient who did not have any coverage by the EDB service at any point during their ED stay was considered as a “noncovered boarder,” and (3) a patient who received an inpatient bed within two hours of bed request was considered as a “nonboarder”. Patients admitted to a specialty service, intensive care unit, or nonmedical services were not included in any of the abovementioned three groups.
We defined metrics to quantify the extent of EDB team coverage. First, the number of covered EDB patients was divided by all medicine boarders (covered + noncovered) to determine the percentage of medicine EDBs covered. Second, the total patient hours spent under the care of the EDB service was divided by the total boarding hours for all medicine boarders to determine the percentage of boarder hours covered.
Data Sources and Collection
The Electronic Health Record (EHR; Epic Systems Corporation, Verona, Wisconsin) captured whether patients were eligible EDBs. For covered EDB patients, the time when care was assumed by the EDB service was captured electronically. Patient demographics, admitting diagnoses, time stamps throughout the hospitalization, admission volumes, LOS, and discharge disposition were extracted from the EHR.
Primary and Secondary Outcome Measures
The primary outcome of this study was hospital LOS defined as the time from ED arrival to hospital departure (Figure). Secondary outcomes included ED LOS (time from ED arrival to ED departure) and the rate of 30-day ED readmission to the study institution.
Statistical Analysis
SAS version 9.4 (SAS Institute, Cary, North Carolina) was used for all statistical analyses. Continuous outcomes were compared using the Mann–Whitney test and dichotomized outcomes were compared using chi-square tests. We further analyzed the differences in the primary and secondary outcomes between covered and noncovered EDB groups using a multivariable regression analysis adjusting for age, gender, race, academic year, hour of the day, and day of the week at the time of becoming an EDB. We used quantile regression and linear regression with log-transformed continuous outcomes and logistic regression for the dichotomized outcome. A P value of .05 was used as a threshold for statistical significance.
RESULTS
Study Population and Demographics
There were a total of 16,668 patients admitted from the ED to the general medical services during the study period (Table 1). There were 8,776 (53%) patients in the covered EDB group, 5,866 (35%) patients in the noncovered EDB group, and 2,026 (12%) patients in the nonboarder group. There were more patients admitted during AY17 compared with AY16 (8,934 vs 7,734 patients, respectively, Appendix 1). Patient demographics, including age, gender, race, insurance coverage, admitting diagnoses, and discharge disposition, were similar among all three patient groups (Table 1). A majority of patients in the covered EDB and nonboarder groups presented to the ED in the afternoon, whereas noncovered EDB patients presented more in the morning (Table 1). Consistent with this pattern, inpatient bed requests for covered EDB and nonboarder patients were more frequent between 7
Hospital Length of Stay
Nonboarders had the shortest median hospital LOS (4.76; interquartile range [IQR] 2.90-7.22 days). Covered EDB patients had a median hospital LOS that was 4.6 hours (0.19 day) shorter compared with noncovered EDB patients (4.92 [IQR 3.00-8.03] days vs 5.11 [IQR 3.16-8.34 days]; Table 2). The differences among the three groups were all significant in the univariate comparison (P < .001). Multivariable regression controlling for patient age, gender, race, academic year, and hour and day of the week at the time of becoming an EDB demonstrated that the difference in hospital LOS between covered and noncovered EDB patients remained significant (P < .001).
ED Length of Stay and 30-Day ED Readmission
Covered EDB patients had a longer median ED LOS compared with noncovered EDB patients and nonboarder patients (20.7 [IQR 15.8-24.9] hours vs 10.1 [IQR 7.9-13.8] hours vs 5.6 [IQR 4.2-7.5] hours, respectively, Table 2). These differences remained significant in the multivariable regression models (P < .001). Finally, the 30-day same-institution ED readmission rate was similar between covered and noncovered EDB patients.
DISCUSSION
We present two years of data describing a hospital medicine-led team designed to enhance the care of medical patients boarding in the ED. The period spent boarding in the ED is a vulnerable time for patients, and we created the EDB service with the goal of delivering inpatient medicine-led care to ED patients awaiting their inpatient bed.
When a bed request is made in an efficient ideal world, patients could be immediately transferred to an open inpatient bed to initiate care. In our study, patients who were not EDBs (ie, waited for less than two hours for their inpatient bed) had the most time-efficient care as they had the shortest ED and hospital LOS. However, nonboarders represented only 12% of patients and the majority of patients admitted to medicine were boarders. Patients covered by the EDB service had an overall hospital LOS that was 4.6 hours shorter compared with noncovered EDB patients despite having an ED LOS that was 15.1 hours longer. These LOS differences were observed without any difference to 30-day ED readmission rates.
Given that not all boarding patients were cared by the EDB service, the role of selection bias in our study warrants discussion. Similar to other studies, ED LOS for our patient cohort is heavily influenced by the availability of inpatient beds.10-12 The EDB service handed off patients they were covering as soon as an inpatient bed became available. Although there was discretion from the EDB charge nurse and the EDB physician about which patient to accept, this was primarily focused on choosing patients who did not have a pending inpatient bed (eg, a patient who was assigned a bed but was awaiting room cleaning). Importantly, there was no change in the bed assignment process as a part of the intervention. Our intervention’s design did not allow for elucidation of causation; however, we believe that the longer ED LOS for covered EDB patients compared with noncovered EDB patients reflects the fact that the team chose patients with a higher expected ED LOS rather than that the patients had a longer LOS due to being cared by the service. Consistent with this, patients covered by the EDB service tended to have bed requests placed during the night shift compared with noncovered EDB patients; patients with bed requests at night are more likely to wait longer for their inpatient bed given that inpatient beds are generally freed up in the afternoon. We acknowledge that it is impossible to completely rule out the possibility that patient factors (eg, infectious precautions) influence inpatient bed wait time and could be another factor influencing the probability of EDB service coverage.
The current study adds to the expanding literature on EDB care models. Briones et al. demonstrated that an “ED hospitalist” led to increased care delivery as measured by an increased follow-up on laboratory results and medication orders.23 However, their study was not structured to demonstrate LOS changes.23 In another study, Chadaga et al. reported about their experience with a hospital medicine team providing care for EDB patients, similar to our study.8 Their hospital medicine team consisted of a hospitalist and APP deployed in the ED during the day, with night coverage provided by existing ED clinicians. They demonstrated less ED diversion, more ED discharges, and positive perceptions among the ED team.8 However, there was no impact on ED or hospital LOS, although their results may have been limited by the short duration of postintervention data and the lack of nighttime coverage.8 Finally, a modeling study demonstrated a reduction in ED LOS by adding ED clinicians only for patients being discharged from the ED and not for those being admitted, although there was no explicit adjustment for LOS accounting for initiation of inpatient care in the ED.15 Extending the current literature, our study suggests that a hospitalist team providing continuous coverage to a large portion of EDB patients could shorten the overall hospital LOS for boarding patients, but even this was not enough to reduce LOS to the same level as that of patients who did not board.
Practically, there were challenges to creating the EDB service described in our study. Additional clinical staff (physician, APP, and nursing) were hired for the team, requiring a financial commitment from the institution. The new team required space within the ED footprint incurring construction costs. Before the existence of the EDB service, other ancillary services (eg, physical therapy) were unaccustomed to seeing ED patients, and thus new workflows were created. Another challenge was that internal medicine clinicians were not used to caring for patients for short durations of time before passing off clinical care to another team. This required a different approach, focusing on acute issues rather than conducting an exhaustive evaluation. Finally, the EDB service workflow introduced an additional handoff, increasing discontinuity of care. These challenges are factors to consider for institutions considering a similar EDB team and should be weighed against other interventions to alleviate ED boarding or improve throughput such as expanding inpatient capacity.
Ideal metrics to track the coverage and performance of an EDB service such as the one described in this study are undefined. It was difficult to know whether the goal should be complete coverage given the increase in handoffs, particularly for patients with short boarding times. This EDB service covered 59.9% of boarding patients and 62.9% of total boarding hours. Factors that contributed to covering less than 100% included physician staffing that was insufficient to meet demand and discretion to not accept patients expected to quickly get an inpatient bed. Therefore, the percentage of patients and boarding hours covered are crude metrics and further investigation is needed to develop optimal metrics for an EDB team.
Future studies on care models for EDB patients are warranted. Recognizing that EDB teams require additional resources, studies to define which patients receive the most benefit from EDB coverage will be helpful. Moreover, the EDB team composition may need to adapt to different environments (eg, academic, urban, nonacademic, rural). Diving deeper to study whether specific patient populations benefit more than others from care by the EDB service, as measured by hospital LOS or other outcomes, would be important. Clinical outcomes, in addition to throughput metrics such as LOS, must be analyzed to understand whether factors such as increased handoffs outweigh any benefits in throughput.
There were several limitations to this study. First, it was performed at a single academic institution, potentially limiting its generalizability. However, although some workflows and team coverage structures may be institution-specific, the concept of a hospital medicine-led EDB team providing earlier inpatient care can be adapted locally and may probably achieve similar benefits. Our study population included only patients destined for general medical admission; thus, it is uncertain whether the gains demonstrated in our study would be realized for patients boarding for nonmedical services. In addition, considering the observational nature of this study, it is difficult to prove the causation that a hospitalist EDB service solely led to reductions in hospital LOS. Finally, we did not adjust for nor measure whether ED clinicians provided different care to patients whom they felt were destined for the EDB service.
In summary, nonboarder patients had the shortest overall LOS; however, among those patients who boarded, coverage by a hospitalist-led team was associated with a shorter LOS. Given the limited inpatient capacity, eliminating ED boarding is often not possible. We present a model to expedite inpatient care and allow ED clinicians to focus on newly arriving ED patients. Additional studies are required to better understand how to optimally care for patients boarding in the ED.
1. Asplin BR, Magid DJ, Rhodes KV, Solberg LI, Lurie N, Camargo CA, Jr. A conceptual model of emergency department crowding. Ann Emerg Med. 2003;42(2):173-180. https://doi.org/10.1067/mem.2003.302.
2. Trzeciak S, Rivers EP. Emergency department overcrowding in the United States: an emerging threat to patient safety and public health. Emerg Med J. 2003;20(5):402-405. https://doi.org/10.1136/emj.20.5.402.
3. Olshaker JS. Managing emergency department overcrowding. Emerg Med Clin North Am. 2009;27(4):593-603. https://doi.org/10.1016/jemc.2009.07.004.
4. Richardson LD, Asplin BR, Lowe RA. Emergency department crowding as a health policy issue: past development, future directions. Ann Emerg Med. 2002;40(4):388-393. https://doi.org/10.1067/mem.2002.128012.
5. Bernstein SL, Aronsky D, Duseja R, et al. The effect of emergency department crowding on clinically oriented outcomes. Acad Emerg Med. 2009;16(1):1-10. https://doi.org/10.1111/j.1553-2712.2008.00295.x.
6. Singer AJ, Thode HC, Jr., Viccellio P, Pines JM. The association between length of emergency department boarding and mortality. Acad Emerg Med. 2011;18(12):1324-1329. https://doi.org/10.1111/j.1553-2712.2011.01236.x.
7. Silvester KM, Mohammed MA, Harriman P, Girolami A, Downes TW. Timely care for frail older people referred to hospital improves efficiency and reduces mortality without the need for extra resources. Age Ageing. 2014;43(4):472-477. https://doi.org/10.1093/ageing/aft170.
8. Chadaga SR, Shockley L, Keniston A, et al. Hospitalist-led medicine emergency department team: associations with throughput, timeliness of patient care, and satisfaction. J Hosp Med. 2012;7(7):562-566. https://doi.org/10.1002/jhm.1957.
9. Lucas R, Farley H, Twanmoh J, Urumov A, Evans B, Olsen N. Measuring the opportunity loss of time spent boarding admitted patients in the emergency department: a multihospital analysis. J Healthc Manag. 2009;54(2):117-124; discussion 124-115. https://doi.org/10.1097/00115514-200903000-00009.
10. Forster AJ, Stiell I, Wells G, Lee AJ, van Walraven C. The effect of hospital occupancy on emergency department length of stay and patient disposition. Acad Emerg Med. 2003;10(2):127-133. https://doi.org/10.1111/j.1553-2712.2003.tb00029.x.
11. Hoot NR, Aronsky D. Systematic review of emergency department crowding: causes, effects, and solutions. Ann Emerg Med. 2008;52(2):126-136. https://doi.org/10.1016/j.annemergmed.2008.03.014.
12. Asaro PV, Lewis LM, Boxerman SB. The impact of input and output factors on emergency department throughput. Acad Emerg Med. 2007;14(3):235-242. https://doi.org/10.1197/j.aem.2006.10.104.
13. Khare RK, Powell ES, Reinhardt G, Lucenti M. Adding more beds to the emergency department or reducing admitted patient boarding times: which has a more significant influence on emergency department congestion? Ann Emerg Med. 2009;53(5):575-585. https://doi.org/10.1016/j.annemergmed.2008.07.009.
14. Wertheimer B, Jacobs RE, Bailey M, et al. Discharge before noon: an achievable hospital goal. J Hosp Med. 2014;9(4):210-214. https://doi.org/10.1002/jhm.2154.
15. Paul JA, Lin L. Models for improving patient throughput and waiting at hospital emergency departments. J Emerg Med. 2012;43(6):1119-1126. https://doi.org/10.1016/j.jemermed.2012.01.063.
16. Wertheimer B, Jacobs RE, Iturrate E, Bailey M, Hochman K. Discharge before noon: effect on throughput and sustainability. J Hosp Med. 2015;10(10):664-669. https://doi.org/10.1002/jhm.2412.
17. Khanna S, Sier D, Boyle J, Zeitz K. Discharge timeliness and its impact on hospital crowding and emergency department flow performance. Emerg Med Australas. 2016;28(2):164-170. https://doi.org/10.1111/1742-6723.12543.
18. Patel H, Morduchowicz S, Mourad M. Using a systematic framework of interventions to improve early discharges. Jt Comm J Qual Patient Saf. 2017;43(4):189-196. https://doi.org/10.1016/j.jcjq.2016.12.003.
19. Powell ES, Khare RK, Venkatesh AK, Van Roo BD, Adams JG, Reinhardt G. The relationship between inpatient discharge timing and emergency department boarding. J Emerg Med. 2012;42(2):186-196. https://doi.org/10.1016/j.jemermed.2010.06.028.
20. Howell E, Bessman E, Kravet S, Kolodner K, Marshall R, Wright S. Active bed management by hospitalists and emergency department throughput. Ann Intern Med. 2008;149(11):804-811. https://doi.org/10.7326/0003-4819-149-11-200812020-00006.
21. Howell E, Bessman E, Marshall R, Wright S. Hospitalist bed management effecting throughput from the emergency department to the intensive care unit. J Crit Care. 2010;25(2):184-189. https://doi.org/10.1016/j.jcrc.2009.08.004.
22. Howell EE, Bessman ES, Rubin HR. Hospitalists and an innovative emergency department admission process. J Gen Intern Med. 2004;19(3):266-268. https://doi.org/10.1111/j.1525-1497.2004.30431.x.
23. Briones A, Markoff B, Kathuria N, et al. A model of a hospitalist role in the care of admitted patients in the emergency department. J Hosp Med. 2010;5(6):360-364. https://doi.org/10.1002/jhm.636.
24. Auerbach J. Reducing emergency department patient boarding and submitting code help policies to the Department of Public Health. In: Executive Office of Health and Human Services. Boston: Department of Public Health; 2010.
© 2020 Society of Hospital Medicine
Antibiotics for Aspiration Pneumonia in Neurologically Impaired Children
Neurologic impairment (NI) encompasses static and progressive diseases of the central and/or peripheral nervous systems that result in functional and intellectual impairments.1 While a variety of neurologic diseases are responsible for NI (eg, hypoxic-ischemic encephalopathy, muscular dystrophy), consequences of these diseases extend beyond neurologic manifestations.1 These children are at an increased risk for aspiration of oral and gastric contents given their common comorbidities of dysphagia, gastroesophageal reflux, impaired cough, and respiratory muscle weakness.2 While aspiration may manifest as a self-resolving pneumonitis, the presence of oral or enteric bacteria in aspirated material may result in the development of bacterial pneumonia. Children with NI hospitalized with aspiration pneumonia have higher complication rates, longer and costlier hospitalizations, and higher readmission rates when compared with children with nonaspiration pneumonia.3
While pediatric aspiration pneumonia is commonly attributed to anaerobic bacteria, this is largely based on extrapolation from epidemiologic studies that were conducted in past decades.4-8 A single randomized controlled trial found that penicillin and clindamycin, antimicrobials with similar antimicrobial activity against anaerobes, to be equally effective.9 However, the recent literature emphasizes the polymicrobial nature of aspiration pneumonia in adults, with the common isolation of Gram-negative enteric bacteria.10 Further, while Pseudomonas aeruginosa is often identified in respiratory cultures from children with NI and chronic respiratory insufficiency,11,12 the significance of P. aeruginosa in lower airways remains unclear.
We designed this study to compare hospital outcomes associated with the most commonly prescribed empiric antimicrobial therapies for aspiration pneumonia in children with NI.
MATERIALS AND METHODS
Study Design and Data Source
This multicenter, retrospective cohort study used the Pediatric Health Information System (PHIS) database. PHIS, an administrative database of 50 not-for-profit tertiary care pediatric hospitals, contains data regarding patient demographics, diagnoses and procedures, and daily billed resource utilization, including laboratory and imaging studies. Data quality and reliability are assured through the Children’s Hospital Association (CHA; Lenexa, Kansas) and participating hospitals. Due to incomplete data through the study period and data quality issues, six hospitals were excluded.
STUDY POPULATION
Inclusion Criteria
Children 1-18 years of age who were discharged between July 1, 2007 and June 30, 2015 were included if they had a NI diagnosis,1 a principal diagnosis indicative of aspiration pneumonia (507.x),3,13,14 and received antibiotics in the first two calendar days of admission. NI was determined using previously defined International Classification of Diseases, Ninth Revision-Clinical Modification (ICD-9-CM) diagnosis codes.1 We only included children who received antibiotics in the first two calendar days of admission to minimize the likelihood of including children admitted for other reasons who acquired aspiration pneumonia after hospitalization. For children with multiple hospitalizations, one admission was randomly selected for inclusion to minimize weighting results toward repeat visits.
Exclusion Criteria
Children transferred from another hospital were excluded as records from their initial presentation, including treatment and outcomes, were not available. We also excluded children with tracheostomy15,16 or chronic ventilator dependence,17 those with a diagnosis of human immunodeficiency virus or tuberculosis, and children who received chemotherapy during hospitalization given expected differences in etiology, treatment, and outcomes.18
Exposure
The primary exposure was antibiotic therapy received in the first two days of admission. Antibiotics were classified by their antimicrobial spectra of activity as defined by The Sanford Guide to Antimicrobial Therapy19 against the most commonly recognized pathogens of aspiration pneumonia: anaerobes, Gram-negatives, and P. aeruginosa (Appendix Table 1).10,20 For example, penicillin G and clindamycin were among the antibiotics classified as providing anaerobic coverage alone, whereas ceftriaxone was classified as providing Gram-negative coverage alone and ampicillin-sulbactam or as combination therapy with clindamycin and ceftriaxone were classified as providing anaerobic and Gram-negative coverage. Piperacillin-tazobactam and meropenem were classified as providing anaerobic, Gram-negative, and P. aeruginosa coverage. We excluded antibiotics that do not provide coverage against anaerobes, Gram-negative, or P. aeruginosa (eg, ampicillin, azithromycin) or that provide coverage against Gram-negative and P. aeruginosa, but not anaerobes (eg, cefepime, tobramycin), as these therapies were prescribed for <5% of the cohort. We chose not to examine the coverage for Streptococcus pneumonia or Staphylococcus aureus as antibiotics included in this analysis covered these bacteria for 99.9% of our cohort.
OUTCOMES
Outcomes included acute respiratory failure during hospitalization, intensive care unit (ICU) transfer, and hospital length of stay (LOS). Acute respiratory failure during hospitalization was defined as the presence of Clinical Transaction Classification (CTC) or ICD-9 procedure code for noninvasive or invasive mechanical ventilation on day two or later of hospitalization, with or without the need for respiratory support on day 0 or day 1 (Appendix Table 2). Given the variability in hospital policies that may drive ICU admission criteria for complex patients, our outcome of ICU transfer was defined as the requirement for ICU level care on day two or later of hospitalization without ICU admission. Acute respiratory failure and ICU care occurring within the first two hospital days were not classified as outcomes because these early events likely reflect illness severity at presentation rather than outcomes attributable to treatment failure; these were included as markers of severity in the models.
Patient Demographics and Clinical Characteristics
Demographic and clinical characteristics that might influence antibiotic choice and/or hospital outcomes were assessed. Clinical characteristics included complex chronic conditions,21-23 medical technology assistance,24 performance of diagnostic testing, and markers of severe illness on presentation. Diagnostic testing included bacterial cultures (blood, respiratory, urine) and chest radiograph performance in the first two days of hospitalization. Results of diagnostic testing are not available in the PHIS. Illness severity on presentation included acute respiratory failure, pleural drainage, receipt of vasoactive agents, and transfusion of blood products in the first two days of hospitalization (Appendix Table 2).17,25,26
STASTICAL ANALYSIS
Continuous data were described with median and interquartile ranges (IQR) due to nonnormal distribution. Categorical data were described with frequencies and percentages. Patient demographics, clinical characteristics, and hospital outcomes were stratified by empiric antimicrobial coverage and compared using chi-square and Kruskal–Wallis tests as appropriate.
Generalized linear mixed-effects models with random hospital intercepts were derived to assess the independent effect of antimicrobial spectra of activity on outcomes of acute respiratory failure, ICU transfer, and LOS while adjusting for important differences in demographic and clinical characteristics. LOS had a nonnormal distribution. Thus, we used an exponential distribution. Covariates were chosen a priori given the clinical and biological relevance to exposure and outcomes—age, presence of complex chronic condition diagnoses, the number of complex chronic conditions, technology dependence, the performance of diagnostic tests on presentation, and illness severity on presentation. ICU admission was included as a covariate in acute respiratory failure and LOS outcome models. The results of the model for acute respiratory failure and ICU transfer are presented as adjusted odds ratios (OR) with a 95% CI. LOS results are presented as adjusted rate ratios (RR) with 95% CI.
All analyses were performed with SAS 9.3 (SAS Institute, Cary, North Carolina). P values <.05 were considered statistically significant. Cincinnati Children’s Hospital Medical Center Institutional Review Board considered this deidentified dataset study as not human subjects research.
RESULTS
Study Cohort
At the 44 hospitals included, 4,812 children with NI hospitalized with the diagnosis of aspiration pneumonia met the eligibility criteria. However, 79 received antibiotics with the spectra of activity not examined, leaving 4,733 children in our final analysis (Appendix Figure). Demographic and clinical characteristics of the study cohort are shown in Table 1. Median age was five years (interquartile range [IQR]: 2-11 years). Most subjects were male (53.9%), non-Hispanic white (47.9%), and publicly insured (63.6%). There was a slight variation in the distribution of admissions across seasons (spring 31.6%, summer 19.2%, fall 21.3%, and winter 27.9%). One-third of children had four or more comorbid CCCs (complex chronic conditions; 34.2%). The three most common nonneurologic CCC diagnosis categories were gastrointestinal (63.1%), congenital and/or genetic defects (36.9%), and respiratory (8.9%). Assistance with medical technologies was also common (82%)—particularly gastrointestinal (63.1%) and neurologic/neuromuscular (9.8%) technologies. The vast majority of children (92.5%) had either a chest radiograph (90.5%), respiratory viral study (33.7%), or respiratory culture (10.0%) obtained on presentation. A minority required noninvasive or invasive respiratory support (25.4%), vasoactive agents (8.9%), blood products (1.2%), or pleural drainage (0.3%) in the first two hospital days.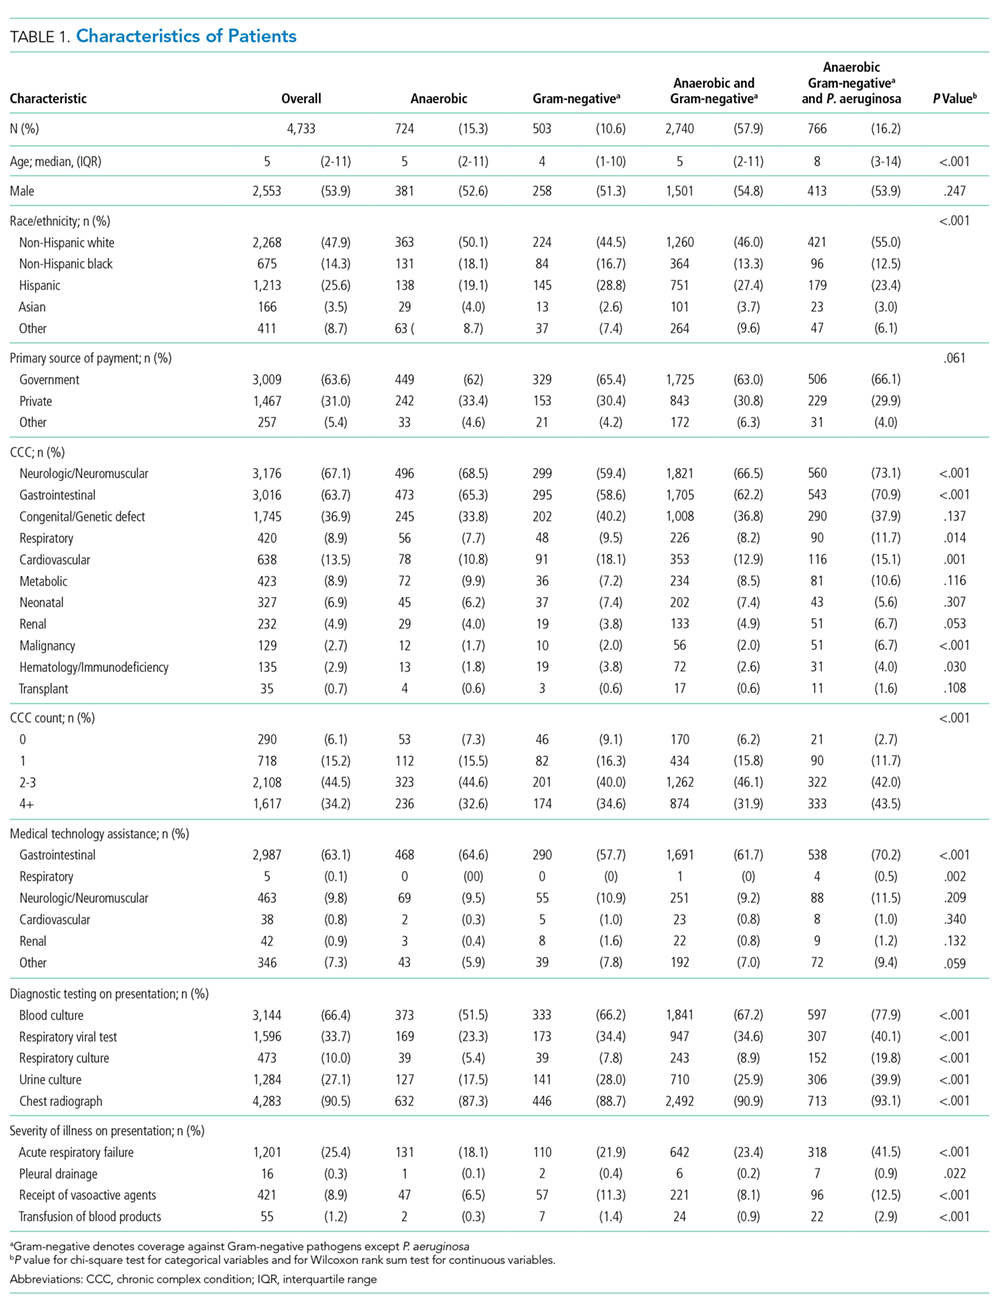
Spectrum of Antimicrobial Coverage
Most children (57.9%) received anaerobic and Gram-negative coverage; 16.2% received anaerobic, Gram-negative and P. aeruginosa coverage; 15.3% received anaerobic coverage alone; and 10.6% received Gram-negative coverage alone. Empiric antimicrobial coverage varied substantially across hospitals: anaerobic coverage was prescribed for 0%-44% of patients; Gram-negative coverage was prescribed for 3%-26% of patients; anaerobic and Gram-negative coverage was prescribed for 25%-90% of patients; and anaerobic, Gram-negative, and P. aeruginosa coverage was prescribed for 0%-65% of patients (Figure 1).
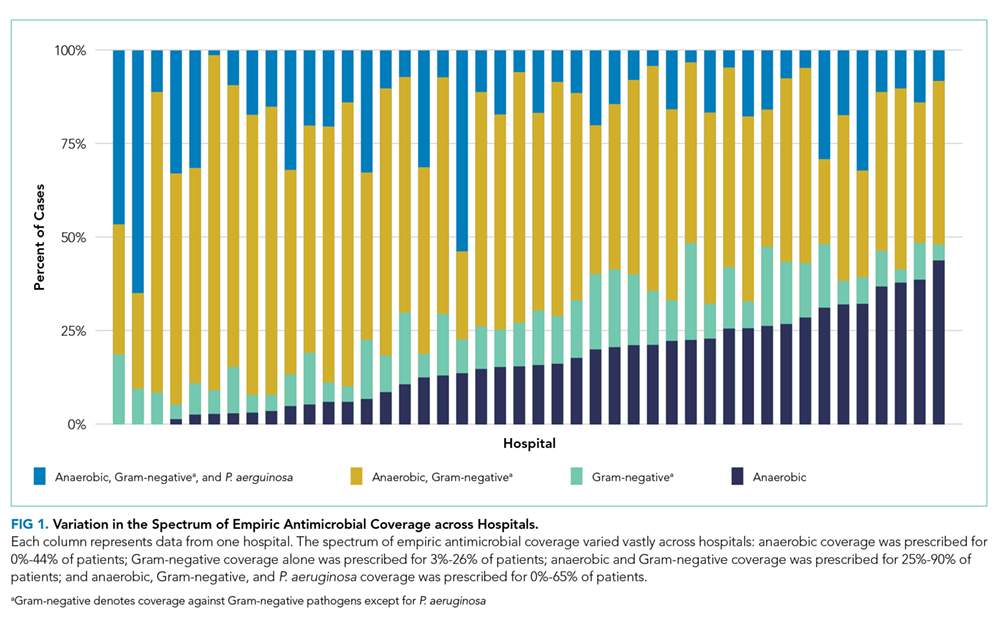
Outcomes
Acute Respiratory Failure
One-quarter (25.4%) of patients had acute respiratory failure on presentation; 22.5% required respiratory support (continued from presentation or were new) on day two or later of hospitalization (Table 2). In the adjusted analysis, children receiving Gram-negative coverage alone had two-fold greater odds (OR 2.15, 95% CI: 1.41-3.27) and children receiving anaerobic and Gram-negative coverage had 1.6-fold greater odds (OR 1.65, 95% CI: 1.19-2.28), of respiratory failure during hospitalization compared with those receiving anaerobic coverage alone (Figure 2). Odds of respiratory failure during hospitalization did not significantly differ for children receiving anaerobic, Gram-negative, and P. aeruginosa coverage compared with those receiving anaerobic coverage alone.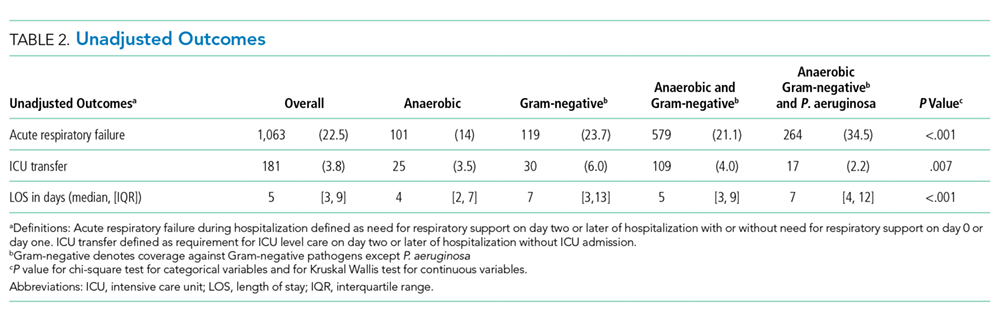
ICU Transfer
Nearly thirty percent (29.0%) of children required ICU admission, with an additional 3.8% requiring ICU transfer following admission (Table 2). In the multivariable analysis, the odds of an ICU transfer were greater for children receiving Gram-negative coverage alone (OR 1.80, 95% CI: 1.03-3.14) compared with those receiving anaerobic coverage alone. There was no statistical difference in ICU transfer for those receiving anaerobic and Gram-negative coverage (with or without P. aeruginosa coverage) compared with those receiving anaerobic coverage alone (Figure 2).
Length of Stay
Median hospital LOS for the total cohort was five days (IQR: 3-9 days; Table 2). In the multivariable analysis, children receiving Gram-negative coverage alone had a longer LOS (RR 1.28; 95% CI: 1.16-1.41) compared with those receiving anaerobic coverage alone, whereas children receiving anaerobic, Gram-negative, and P. aeruginosa coverage had a shorter LOS (RR 0.83; 95% CI: 0.76-0.90) than those receiving anaerobic coverage alone (Figure 2). There was no statistical difference in the LOS between children receiving anaerobic and Gram-negative coverage and those receiving anaerobic coverage alone.
DISCUSSION
In this multicenter study of children with NI hospitalized with aspiration pneumonia, we found substantial variation in empiric antimicrobial coverage for children with aspiration pneumonia. When comparing outcomes across groups, children who received anaerobic and Gram-negative coverage had outcomes similar to children who received anaerobic therapy alone. However, children who did not receive anaerobic coverage (ie, Gram-negative coverage alone) had worse outcomes, most notably a greater than two-fold increase in the odds of experiencing acute respiratory failure during hospitalization when compared with children receiving anaerobic therapy. These findings support prior literature that has highlighted the importance of anaerobic therapy in the treatment of aspiration pneumonia. The benefit of antibiotics targeting Gram-negative organisms, in addition to anaerobes, remains uncertain.
The variability in empiric antimicrobial coverage likely reflects the paucity of available information on oral and/or enteric bacteria required to identify them as causative organisms in aspiration pneumonia. In part, this problem is due to the difficulty in obtaining adequate sputum for culture from pediatric patients.27 While it may be more feasible to obtain tracheal aspirates for respiratory culture in children with a tracheostomy, interpretation of culture results remains challenging because the lower airways of children with tracheostomy are commonly colonized with bacterial pathogens.28 Thus, physicians are often left to choose empiric antimicrobial coverage with inadequate supporting evidence.29 Although the polymicrobial nature of aspiration pneumonia is well recognized in adult and pediatric literature,10,30 it is less clear which organisms are of pathological significance and require treatment.
The treatment standard for aspiration pneumonia has long included anaerobic therapy.29 The worse outcomes of children not receiving anaerobic therapy (ie, Gram-negative coverage alone) compared with children who received anaerobic therapy support the continued importance of anaerobic therapy in the treatment of aspiration pneumonia for hospitalized children with NI. The role of antibiotics covering Gram-negative organisms is less clear. Recent studies suggest the role of anaerobes is overemphasized in the etiology and treatment of aspiration pneumonia.10,29,31-38 Multiple studies on aspiration pneumonia bacteriology in hospitalized adults have demonstrated a predominance of Gram-negative organisms (ranging from 37%-71% of isolates identified on respiratory culture) and a relative scarcity of anaerobes (ranging from 0%-16% of isolates).31-37 A prospective study of 50 children hospitalized with clinical and radiographic evidence of pneumonia with known aspiration risk (eg, neuromuscular disease or dysphagia) found that ~80% of 163 bacterial isolates were Gram-negative.38 However, this study included repeat cultures from the same children, and thus, may overestimate the prevalence of Gram-negative organisms. In our study, children who received both anaerobic and Gram-negative therapy had no differences in ICU transfer or LOS but did experience higher odds of acute respiratory failure. As these results may be due to unmeasured confounding, future studies should further explore the necessity of Gram-negative coverage in addition to anaerobic coverage in this population.
While these recent studies may seem to suggest that anaerobic coverage is not necessary for aspiration pneumonia, there are important limitations worth noting. First, these studies used a variety of sampling techniques. While organisms grown from samples obtained via bronchoalveolar lavage31-34,36 are likely pathogenic, those grown from tracheal or oral samples obtained via percutaneous transtracheal aspiration,34 a protected specimen brush,34,36,37 or expectorated sputum35,38 may not represent lower airway organisms. Second, anaerobic cultures were not obtained in all studies.31,34,38 Anaerobic organisms are difficult to isolate using traditional clinical specimen collection techniques and aerobic culture media.18 Furthermore, anaerobes are not easily recovered from lung infections after the receipt of antibiotic therapy.39 Details regarding pretreatment, which are largely lacking from these studies, are necessary to interpret the relative scarcity of anaerobes on respiratory culture. Finally, caution should be taken when extrapolating the results of studies focused on the etiology and treatment of aspiration pneumonia in elderly adults to children. Our results, particularly in the context of the limitation of these more recent studies, suggest that the role of anaerobes has been underestimated.
Recent studies examining populations of children with cerebral palsy and/or tracheostomy have emphasized the high rates of carriage and infection rates with Gram-negative and drug-resistant bacteria; in particular, P. aeruginosa accounts for 50%-72% of pathogenic bacteria.11,12,38,40
Our multicenter observational study has several limitations. We used diagnosis codes to identify patients with aspiration pneumonia. As validated clinical criteria for the diagnosis of aspiration pneumonia do not exist, clinicians may assign a diagnosis of and treatment for aspiration pneumonia by subjective suspicion based on a child’s severe NI or illness severity on presentation leading to selection bias. Although administrative data are not able to verify pneumonia type with absolute certainty, we previously demonstrated that the differences in the outcomes of children with aspiration and nonaspiration pneumonia diagnosis codes persist after accounting for the complexity that might influence the diagnosis.3
Frthermore, we were unable to account for laboratory, microbiology, or radiology test results, and other management practices (eg, frequency of airway clearance, previous antimicrobial therapy) that may influence outcomes. Future studies should certainly include an examination of the concordance of the antibiotics prescribed with causative organisms, as this undoubtedly affects patient outcomes. Other outcomes are important to examine (eg, time to return to respiratory baseline), but we were unable to do so, given the lack of clinical detail in our database. We randomly selected a single hospitalization for children with multiple admissions; alternative methods could have different results. Although children with NI predominately use children’s hospitals,1 results may not be generalizable.
CONCLUSION
These findings support prior literature that has highlighted the important role anaerobic therapy plays in the treatment of aspiration pneumonia in children with NI. In light of the limitations of our study design, we believe that rigorous clinical trials comparing anaerobic with anaerobic and Gram-negative therapy are an important and necessary next step to determine the optimal treatment for aspiration pneumonia in this population.
Disclosures
The authors do not have any financial relationships relevant to this article to disclose.
Funding
Dr. Thomson was supported by the Agency for Healthcare Research and Quality (AHRQ) under award number K08HS025138. Dr. Ambroggio was supported by the National Institute for Allergy and Infectious Diseases (NIAID) under award number K01AI125413. The content is solely the responsibility of the authors and does not necessarily represent the official views of the AHRQ or NIAID.
1. Berry JG, Poduri A, Bonkowsky JL, et al. Trends in resource utilization by children with neurological impairment in the United States inpatient health care system: a repeat cross-sectional study. PLoS Med. 2012;9(1):e1001158. https://doi.org/10.1371/journal.pmed.1001158.
2. Seddon PC, Khan Y. Respiratory problems in children with neurological impairment. Arch Dis Child. 2003;88(1):75-78. https://doi.org/10.1136/adc.88.1.75.
3. Thomson J, Hall M, Ambroggio L, et al. Aspiration and non-aspiration pneumonia in hospitalized children with neurologic impairment. Pediatrics. 2016;137(2):e20151612. https://doi.org/10.1542/peds.2015-1612.
4. Brook I. Anaerobic pulmonary infections in children. Pediatr Emerg Care. 2004;20(9):636-640. https://doi.org/10.1097/01.pec.0000139751.63624.0b.
5. Bartlett JG, Gorbach SL. Treatment of aspiration pneumonia and primary lung abscess. Penicillin G vs clindamycin. JAMA. 1975;234(9):935-937. https://doi.org/10.1001/jamadermatol.2017.0297.
6. Bartlett JG, Gorbach SL, Finegold SM. The bacteriology of aspiration pneumonia. Am J Med. 1974;56(2):202-207. https://doi.org/10.1016/0002-9343(74)90598-1.
7. Lode H. Microbiological and clinical aspects of aspiration pneumonia. J Antimicrob Chemother. 1988;21:83-90. https://doi.org/10.1093/jac/21.suppl_c.83.
8. Brook I. Treatment of aspiration or tracheostomy-associated pneumonia in neurologically impaired children: effect of antimicrobials effective against anaerobic bacteria. Int J Pediatr Otorhinolaryngol. 1996;35(2):171-177. https://doi.org/10.1016/0165-5876(96)01332-8.
9. Jacobson SJ, Griffiths K, Diamond S, et al. A randomized controlled trial of penicillin vs clindamycin for the treatment of aspiration pneumonia in children. Arch Pediatr Adolesc Med. 1997;151(7):701-704. https://doi.org/10.1001/archpedi.1997.02170440063011.
10. DiBardino DM, Wunderink RG. Aspiration pneumonia: a review of modern trends. J Crit Care. 2015;30(1):40-48. https://doi.org/10.1016/j.jcrc.2014.07.011.
11. Gerdung CA, Tsang A, Yasseen AS, 3rd, Armstrong K, McMillan HJ, Kovesi T. Association between chronic aspiration and chronic airway infection with Pseudomonas aeruginosa and other Gram-negative bacteria in children with cerebral palsy. Lung. 2016;194(2):307-314. https://doi.org/10.1007/s00408-016-9856-5.
12. Thorburn K, Jardine M, Taylor N, Reilly N, Sarginson RE, van Saene HK. Antibiotic-resistant bacteria and infection in children with cerebral palsy requiring mechanical ventilation. Pedr Crit Care Med. 2009;10(2):222-226. https://doi.org/10.1097/PCC.0b013e31819368ac.
13. Lanspa MJ, Jones BE, Brown SM, Dean NC. Mortality, morbidity, and disease severity of patients with aspiration pneumonia. J Hosp Med. 2013;8(2):83-90. https://doi.org/10.1002/jhm.1996.
14. Lanspa MJ, Peyrani P, Wiemken T, Wilson EL, Ramirez JA, Dean NC. Characteristics associated with clinician diagnosis of aspiration pneumonia: a descriptive study of afflicted patients and their outcomes. J Hosp Med. 2015;10(2):90-96. https://doi.org/10.1002/jhm.2280.
15. Berry JG, Graham RJ, Roberson DW, et al. Patient characteristics associated with in-hospital mortality in children following tracheotomy. Arch Dis Child. 2010;95(9):703-710.
16. Berry JG, Graham DA, Graham RJ, et al. Predictors of clinical outcomes and hospital resource use of children after tracheotomy. Pediatrics. 2009;124(2):563-572. https://doi.org/10.1136/adc.2009.180836.
17. Balamuth F, Weiss SL, Hall M, et al. Identifying pediatric severe sepsis and septic shock: Accuracy of diagnosis codes. J Pediatr. 2015;167(6):1295-1300 e1294. https://doi.org/10.1016/j.jpeds.2015.09.027.
18. American Academy of Pediatrics., Pickering LK, American Academy of Pediatrics. Committee on Infectious Diseases. In: Red book : 2012 report of the Committee on Infectious Diseases. 29th ed. Elk Grove Village: American Academy of Pediatrics; 2012.
19. Gilbert DN. The Sanford Guide to Antimicrobial Therapy 2014. 44th ed. Sperryville: Antimicrobial Therapy, Inc; 2011.
20. Marik PE. Aspiration pneumonitis and aspiration pneumonia. N Engl J Med. 2001;344(9):665-671. https://doi.org/10.1056/NEJM200103013440908.
21. Feudtner C, Feinstein JA, Zhong W, Hall M, Dai D. Pediatric complex chronic conditions classification system version 2: updated for ICD-10 and complex medical technology dependence and transplantation. BMC Pediatrics. 2014;14:199. https://doi.org/10.1186/1471-2431-14-199.
22. Feudtner C, Hays RM, Haynes G, Geyer JR, Neff JM, Koepsell TD. Deaths attributed to pediatric complex chronic conditions: national trends and implications for supportive care services. Pediatrics. 2001;107(6):E99. https://doi.org/10.1542/peds.107.6.e99.
23. Feinstein JA, Russell S, DeWitt PE, Feudtner C, Dai D, Bennett TD. R package for pediatric complex chronic condition classification. JAMA Pediatr. 2018;172(6):596-598. https://doi.org/10.1001/jamapediatrics.2018.0256.
24. Berry JG, Hall DE, Kuo DZ, Cohen E, Agrawal R, Feudtner C, Hall M, Kueser J, Kaplan W, Neff J. Hospital utilization and characteristics of patients experiencing recurrent readmissions within children’s hospitals. JAMA. 2011;305(7):682-690. https://doi.org/10.1001/jama.2011.122.
25. Shah SS, Hall M, Newland JG, et al. Comparative effectiveness of pleural drainage procedures for the treatment of complicated pneumonia in childhood. J Hosp Med. 2011;6(5):256-263. https://doi.org/10.1002/jhm.872.
26. Child Health Corporation of America. CTC™ 2010 Code Structure: Module 5 Clinical Services. 2010 January 4; Available at https://sharepoint.chca.com/CHCAForums/PerformanceImprovement/PHIS/Reference Library/CTC Resources/Forms/AllItems.aspx Version: Modified.
27. Bradley JS, Byington CL, Shah SS, et al. The management of community-acquired pneumonia in infants and children older than 3 months of age: clinical practice guidelines by the Pediatric Infectious Diseases Society and the Infectious Diseases Society of America. Clin Infect Dis. 2011;53(7):e25-76. https://doi.org/10.1093/cid/cir531.
28. Brook I. Bacterial colonization, tracheobronchitis, and pneumonia following tracheostomy and long-term intubation in pediatric patients. Chest. 1979;76(4):420-424.
29. Waybright RA, Coolidge W, Johnson TJ. Treatment of clinical aspiration: a reappraisal. Am J Health Syst Pharm. 2013;70(15):1291-1300. https://doi.org/10.2146/ajhp120319.
30. Brook I, Finegold SM. Bacteriology of aspiration pneumonia in children. Pediatrics. 1980;65(6):1115-1120.
31. Wei C, Cheng Z, Zhang L, Yang J. Microbiology and prognostic factors of hospital- and community-acquired aspiration pneumonia in respiratory intensive care unit. Am J Infect Control. 2013;41(10):880-884. https://doi.org/10.1016/j.ajic.2013.01.007.
32. El-Solh AA, Pietrantoni C, Bhat A, et al. Microbiology of severe aspiration pneumonia in institutionalized elderly. Am J Respir Crit Care Med. 2003;167(12):1650-1654. https://doi.org/10.1164/rccm.200212-1543OC.
33. Tokuyasu H, Harada T, Watanabe E, et al. Effectiveness of meropenem for the treatment of aspiration pneumonia in elderly patients. Intern Med. 2009;48(3):129-135. https://doi.org/10.2169/internalmedicine.48.1308.
34. Ott SR, Allewelt M, Lorenz J, Reimnitz P, Lode H, German Lung Abscess Study Group. Moxifloxacin vs ampicillin/sulbactam in aspiration pneumonia and primary lung abscess. Infection. 2008;36(1):23-30. https://doi.org/10.1007/s15010-007-7043-6.
35. Kadowaki M, Demura Y, Mizuno S, et al. Reappraisal of clindamycin IV monotherapy for treatment of mild-to-moderate aspiration pneumonia in elderly patients. Chest. 2005;127(4):1276-1282. https://doi.org/10.1016/j.chest.2017.05.019.
36. Marik PE, Careau P. The role of anaerobes in patients with ventilator-associated pneumonia and aspiration pneumonia: a prospective study. Chest. 1999;115(1):178-183. https://doi.org/10.1378/chest.115.1.178.
37. Mier L, Dreyfuss D, Darchy B, et al. Is penicillin G an adequate initial treatment for aspiration pneumonia? A prospective evaluation using a protected specimen brush and quantitative cultures. Intensive Care Med. 1993;19(5):279-284. https://doi.org/10.1007/bf01690548.
38. Ashkenazi-Hoffnung L, Ari A, Bilavsky E, Scheuerman O, Amir J, Prais D. Pseudomonas aeruginosa identified as a key pathogen in hospitalised children with aspiration pneumonia and a high aspiration risk. Acta Paediatr. 2016;105(12):e588-e592. https://doi.org/10.1111/apa.13523.
39. Bartlett JG, Gorbach SL, Tally FP, Finegold SM. Bacteriology and treatment of primary lung abscess. Am Rev Respir Dis. 1974;109(5):510-518. https://doi.org/10.1164/arrd.1974.109.5.510.
40. Russell CJ, Simon TD, Mamey MR, Newth CJL, Neely MN. Pseudomonas aeruginosa and post-tracheotomy bacterial respiratory tract infection readmissions. Pediatr Pulmonol. 2017;52(9):1212-1218. https://doi.org/10.1002/ppul.23716.
41. Russell CJ, Mamey MR, Koh JY, Schrager SM, Neely MN, Wu S. Length of stay and hospital revisit after bacterial tracheostomy-associated respiratory tract infection hospitalizations. Hosp Pediatr. Hosp Pediatr. 2018;8(2):72-80. https://doi.org/10.1542/hpeds.2017-0106.
42. Russell CJ, Mack WJ, Schrager SM, Wu S. Care variations and outcomes for children hospitalized with bacterial tracheostomy-associated respiratory infections. Hosp Pediatr. 2017;7(1):16-23. https://doi.org/10.1542/hpeds.2016-0104.
Neurologic impairment (NI) encompasses static and progressive diseases of the central and/or peripheral nervous systems that result in functional and intellectual impairments.1 While a variety of neurologic diseases are responsible for NI (eg, hypoxic-ischemic encephalopathy, muscular dystrophy), consequences of these diseases extend beyond neurologic manifestations.1 These children are at an increased risk for aspiration of oral and gastric contents given their common comorbidities of dysphagia, gastroesophageal reflux, impaired cough, and respiratory muscle weakness.2 While aspiration may manifest as a self-resolving pneumonitis, the presence of oral or enteric bacteria in aspirated material may result in the development of bacterial pneumonia. Children with NI hospitalized with aspiration pneumonia have higher complication rates, longer and costlier hospitalizations, and higher readmission rates when compared with children with nonaspiration pneumonia.3
While pediatric aspiration pneumonia is commonly attributed to anaerobic bacteria, this is largely based on extrapolation from epidemiologic studies that were conducted in past decades.4-8 A single randomized controlled trial found that penicillin and clindamycin, antimicrobials with similar antimicrobial activity against anaerobes, to be equally effective.9 However, the recent literature emphasizes the polymicrobial nature of aspiration pneumonia in adults, with the common isolation of Gram-negative enteric bacteria.10 Further, while Pseudomonas aeruginosa is often identified in respiratory cultures from children with NI and chronic respiratory insufficiency,11,12 the significance of P. aeruginosa in lower airways remains unclear.
We designed this study to compare hospital outcomes associated with the most commonly prescribed empiric antimicrobial therapies for aspiration pneumonia in children with NI.
MATERIALS AND METHODS
Study Design and Data Source
This multicenter, retrospective cohort study used the Pediatric Health Information System (PHIS) database. PHIS, an administrative database of 50 not-for-profit tertiary care pediatric hospitals, contains data regarding patient demographics, diagnoses and procedures, and daily billed resource utilization, including laboratory and imaging studies. Data quality and reliability are assured through the Children’s Hospital Association (CHA; Lenexa, Kansas) and participating hospitals. Due to incomplete data through the study period and data quality issues, six hospitals were excluded.
STUDY POPULATION
Inclusion Criteria
Children 1-18 years of age who were discharged between July 1, 2007 and June 30, 2015 were included if they had a NI diagnosis,1 a principal diagnosis indicative of aspiration pneumonia (507.x),3,13,14 and received antibiotics in the first two calendar days of admission. NI was determined using previously defined International Classification of Diseases, Ninth Revision-Clinical Modification (ICD-9-CM) diagnosis codes.1 We only included children who received antibiotics in the first two calendar days of admission to minimize the likelihood of including children admitted for other reasons who acquired aspiration pneumonia after hospitalization. For children with multiple hospitalizations, one admission was randomly selected for inclusion to minimize weighting results toward repeat visits.
Exclusion Criteria
Children transferred from another hospital were excluded as records from their initial presentation, including treatment and outcomes, were not available. We also excluded children with tracheostomy15,16 or chronic ventilator dependence,17 those with a diagnosis of human immunodeficiency virus or tuberculosis, and children who received chemotherapy during hospitalization given expected differences in etiology, treatment, and outcomes.18
Exposure
The primary exposure was antibiotic therapy received in the first two days of admission. Antibiotics were classified by their antimicrobial spectra of activity as defined by The Sanford Guide to Antimicrobial Therapy19 against the most commonly recognized pathogens of aspiration pneumonia: anaerobes, Gram-negatives, and P. aeruginosa (Appendix Table 1).10,20 For example, penicillin G and clindamycin were among the antibiotics classified as providing anaerobic coverage alone, whereas ceftriaxone was classified as providing Gram-negative coverage alone and ampicillin-sulbactam or as combination therapy with clindamycin and ceftriaxone were classified as providing anaerobic and Gram-negative coverage. Piperacillin-tazobactam and meropenem were classified as providing anaerobic, Gram-negative, and P. aeruginosa coverage. We excluded antibiotics that do not provide coverage against anaerobes, Gram-negative, or P. aeruginosa (eg, ampicillin, azithromycin) or that provide coverage against Gram-negative and P. aeruginosa, but not anaerobes (eg, cefepime, tobramycin), as these therapies were prescribed for <5% of the cohort. We chose not to examine the coverage for Streptococcus pneumonia or Staphylococcus aureus as antibiotics included in this analysis covered these bacteria for 99.9% of our cohort.
OUTCOMES
Outcomes included acute respiratory failure during hospitalization, intensive care unit (ICU) transfer, and hospital length of stay (LOS). Acute respiratory failure during hospitalization was defined as the presence of Clinical Transaction Classification (CTC) or ICD-9 procedure code for noninvasive or invasive mechanical ventilation on day two or later of hospitalization, with or without the need for respiratory support on day 0 or day 1 (Appendix Table 2). Given the variability in hospital policies that may drive ICU admission criteria for complex patients, our outcome of ICU transfer was defined as the requirement for ICU level care on day two or later of hospitalization without ICU admission. Acute respiratory failure and ICU care occurring within the first two hospital days were not classified as outcomes because these early events likely reflect illness severity at presentation rather than outcomes attributable to treatment failure; these were included as markers of severity in the models.
Patient Demographics and Clinical Characteristics
Demographic and clinical characteristics that might influence antibiotic choice and/or hospital outcomes were assessed. Clinical characteristics included complex chronic conditions,21-23 medical technology assistance,24 performance of diagnostic testing, and markers of severe illness on presentation. Diagnostic testing included bacterial cultures (blood, respiratory, urine) and chest radiograph performance in the first two days of hospitalization. Results of diagnostic testing are not available in the PHIS. Illness severity on presentation included acute respiratory failure, pleural drainage, receipt of vasoactive agents, and transfusion of blood products in the first two days of hospitalization (Appendix Table 2).17,25,26
STASTICAL ANALYSIS
Continuous data were described with median and interquartile ranges (IQR) due to nonnormal distribution. Categorical data were described with frequencies and percentages. Patient demographics, clinical characteristics, and hospital outcomes were stratified by empiric antimicrobial coverage and compared using chi-square and Kruskal–Wallis tests as appropriate.
Generalized linear mixed-effects models with random hospital intercepts were derived to assess the independent effect of antimicrobial spectra of activity on outcomes of acute respiratory failure, ICU transfer, and LOS while adjusting for important differences in demographic and clinical characteristics. LOS had a nonnormal distribution. Thus, we used an exponential distribution. Covariates were chosen a priori given the clinical and biological relevance to exposure and outcomes—age, presence of complex chronic condition diagnoses, the number of complex chronic conditions, technology dependence, the performance of diagnostic tests on presentation, and illness severity on presentation. ICU admission was included as a covariate in acute respiratory failure and LOS outcome models. The results of the model for acute respiratory failure and ICU transfer are presented as adjusted odds ratios (OR) with a 95% CI. LOS results are presented as adjusted rate ratios (RR) with 95% CI.
All analyses were performed with SAS 9.3 (SAS Institute, Cary, North Carolina). P values <.05 were considered statistically significant. Cincinnati Children’s Hospital Medical Center Institutional Review Board considered this deidentified dataset study as not human subjects research.
RESULTS
Study Cohort
At the 44 hospitals included, 4,812 children with NI hospitalized with the diagnosis of aspiration pneumonia met the eligibility criteria. However, 79 received antibiotics with the spectra of activity not examined, leaving 4,733 children in our final analysis (Appendix Figure). Demographic and clinical characteristics of the study cohort are shown in Table 1. Median age was five years (interquartile range [IQR]: 2-11 years). Most subjects were male (53.9%), non-Hispanic white (47.9%), and publicly insured (63.6%). There was a slight variation in the distribution of admissions across seasons (spring 31.6%, summer 19.2%, fall 21.3%, and winter 27.9%). One-third of children had four or more comorbid CCCs (complex chronic conditions; 34.2%). The three most common nonneurologic CCC diagnosis categories were gastrointestinal (63.1%), congenital and/or genetic defects (36.9%), and respiratory (8.9%). Assistance with medical technologies was also common (82%)—particularly gastrointestinal (63.1%) and neurologic/neuromuscular (9.8%) technologies. The vast majority of children (92.5%) had either a chest radiograph (90.5%), respiratory viral study (33.7%), or respiratory culture (10.0%) obtained on presentation. A minority required noninvasive or invasive respiratory support (25.4%), vasoactive agents (8.9%), blood products (1.2%), or pleural drainage (0.3%) in the first two hospital days.
Spectrum of Antimicrobial Coverage
Most children (57.9%) received anaerobic and Gram-negative coverage; 16.2% received anaerobic, Gram-negative and P. aeruginosa coverage; 15.3% received anaerobic coverage alone; and 10.6% received Gram-negative coverage alone. Empiric antimicrobial coverage varied substantially across hospitals: anaerobic coverage was prescribed for 0%-44% of patients; Gram-negative coverage was prescribed for 3%-26% of patients; anaerobic and Gram-negative coverage was prescribed for 25%-90% of patients; and anaerobic, Gram-negative, and P. aeruginosa coverage was prescribed for 0%-65% of patients (Figure 1).
Outcomes
Acute Respiratory Failure
One-quarter (25.4%) of patients had acute respiratory failure on presentation; 22.5% required respiratory support (continued from presentation or were new) on day two or later of hospitalization (Table 2). In the adjusted analysis, children receiving Gram-negative coverage alone had two-fold greater odds (OR 2.15, 95% CI: 1.41-3.27) and children receiving anaerobic and Gram-negative coverage had 1.6-fold greater odds (OR 1.65, 95% CI: 1.19-2.28), of respiratory failure during hospitalization compared with those receiving anaerobic coverage alone (Figure 2). Odds of respiratory failure during hospitalization did not significantly differ for children receiving anaerobic, Gram-negative, and P. aeruginosa coverage compared with those receiving anaerobic coverage alone.
ICU Transfer
Nearly thirty percent (29.0%) of children required ICU admission, with an additional 3.8% requiring ICU transfer following admission (Table 2). In the multivariable analysis, the odds of an ICU transfer were greater for children receiving Gram-negative coverage alone (OR 1.80, 95% CI: 1.03-3.14) compared with those receiving anaerobic coverage alone. There was no statistical difference in ICU transfer for those receiving anaerobic and Gram-negative coverage (with or without P. aeruginosa coverage) compared with those receiving anaerobic coverage alone (Figure 2).
Length of Stay
Median hospital LOS for the total cohort was five days (IQR: 3-9 days; Table 2). In the multivariable analysis, children receiving Gram-negative coverage alone had a longer LOS (RR 1.28; 95% CI: 1.16-1.41) compared with those receiving anaerobic coverage alone, whereas children receiving anaerobic, Gram-negative, and P. aeruginosa coverage had a shorter LOS (RR 0.83; 95% CI: 0.76-0.90) than those receiving anaerobic coverage alone (Figure 2). There was no statistical difference in the LOS between children receiving anaerobic and Gram-negative coverage and those receiving anaerobic coverage alone.
DISCUSSION
In this multicenter study of children with NI hospitalized with aspiration pneumonia, we found substantial variation in empiric antimicrobial coverage for children with aspiration pneumonia. When comparing outcomes across groups, children who received anaerobic and Gram-negative coverage had outcomes similar to children who received anaerobic therapy alone. However, children who did not receive anaerobic coverage (ie, Gram-negative coverage alone) had worse outcomes, most notably a greater than two-fold increase in the odds of experiencing acute respiratory failure during hospitalization when compared with children receiving anaerobic therapy. These findings support prior literature that has highlighted the importance of anaerobic therapy in the treatment of aspiration pneumonia. The benefit of antibiotics targeting Gram-negative organisms, in addition to anaerobes, remains uncertain.
The variability in empiric antimicrobial coverage likely reflects the paucity of available information on oral and/or enteric bacteria required to identify them as causative organisms in aspiration pneumonia. In part, this problem is due to the difficulty in obtaining adequate sputum for culture from pediatric patients.27 While it may be more feasible to obtain tracheal aspirates for respiratory culture in children with a tracheostomy, interpretation of culture results remains challenging because the lower airways of children with tracheostomy are commonly colonized with bacterial pathogens.28 Thus, physicians are often left to choose empiric antimicrobial coverage with inadequate supporting evidence.29 Although the polymicrobial nature of aspiration pneumonia is well recognized in adult and pediatric literature,10,30 it is less clear which organisms are of pathological significance and require treatment.
The treatment standard for aspiration pneumonia has long included anaerobic therapy.29 The worse outcomes of children not receiving anaerobic therapy (ie, Gram-negative coverage alone) compared with children who received anaerobic therapy support the continued importance of anaerobic therapy in the treatment of aspiration pneumonia for hospitalized children with NI. The role of antibiotics covering Gram-negative organisms is less clear. Recent studies suggest the role of anaerobes is overemphasized in the etiology and treatment of aspiration pneumonia.10,29,31-38 Multiple studies on aspiration pneumonia bacteriology in hospitalized adults have demonstrated a predominance of Gram-negative organisms (ranging from 37%-71% of isolates identified on respiratory culture) and a relative scarcity of anaerobes (ranging from 0%-16% of isolates).31-37 A prospective study of 50 children hospitalized with clinical and radiographic evidence of pneumonia with known aspiration risk (eg, neuromuscular disease or dysphagia) found that ~80% of 163 bacterial isolates were Gram-negative.38 However, this study included repeat cultures from the same children, and thus, may overestimate the prevalence of Gram-negative organisms. In our study, children who received both anaerobic and Gram-negative therapy had no differences in ICU transfer or LOS but did experience higher odds of acute respiratory failure. As these results may be due to unmeasured confounding, future studies should further explore the necessity of Gram-negative coverage in addition to anaerobic coverage in this population.
While these recent studies may seem to suggest that anaerobic coverage is not necessary for aspiration pneumonia, there are important limitations worth noting. First, these studies used a variety of sampling techniques. While organisms grown from samples obtained via bronchoalveolar lavage31-34,36 are likely pathogenic, those grown from tracheal or oral samples obtained via percutaneous transtracheal aspiration,34 a protected specimen brush,34,36,37 or expectorated sputum35,38 may not represent lower airway organisms. Second, anaerobic cultures were not obtained in all studies.31,34,38 Anaerobic organisms are difficult to isolate using traditional clinical specimen collection techniques and aerobic culture media.18 Furthermore, anaerobes are not easily recovered from lung infections after the receipt of antibiotic therapy.39 Details regarding pretreatment, which are largely lacking from these studies, are necessary to interpret the relative scarcity of anaerobes on respiratory culture. Finally, caution should be taken when extrapolating the results of studies focused on the etiology and treatment of aspiration pneumonia in elderly adults to children. Our results, particularly in the context of the limitation of these more recent studies, suggest that the role of anaerobes has been underestimated.
Recent studies examining populations of children with cerebral palsy and/or tracheostomy have emphasized the high rates of carriage and infection rates with Gram-negative and drug-resistant bacteria; in particular, P. aeruginosa accounts for 50%-72% of pathogenic bacteria.11,12,38,40
Our multicenter observational study has several limitations. We used diagnosis codes to identify patients with aspiration pneumonia. As validated clinical criteria for the diagnosis of aspiration pneumonia do not exist, clinicians may assign a diagnosis of and treatment for aspiration pneumonia by subjective suspicion based on a child’s severe NI or illness severity on presentation leading to selection bias. Although administrative data are not able to verify pneumonia type with absolute certainty, we previously demonstrated that the differences in the outcomes of children with aspiration and nonaspiration pneumonia diagnosis codes persist after accounting for the complexity that might influence the diagnosis.3
Frthermore, we were unable to account for laboratory, microbiology, or radiology test results, and other management practices (eg, frequency of airway clearance, previous antimicrobial therapy) that may influence outcomes. Future studies should certainly include an examination of the concordance of the antibiotics prescribed with causative organisms, as this undoubtedly affects patient outcomes. Other outcomes are important to examine (eg, time to return to respiratory baseline), but we were unable to do so, given the lack of clinical detail in our database. We randomly selected a single hospitalization for children with multiple admissions; alternative methods could have different results. Although children with NI predominately use children’s hospitals,1 results may not be generalizable.
CONCLUSION
These findings support prior literature that has highlighted the important role anaerobic therapy plays in the treatment of aspiration pneumonia in children with NI. In light of the limitations of our study design, we believe that rigorous clinical trials comparing anaerobic with anaerobic and Gram-negative therapy are an important and necessary next step to determine the optimal treatment for aspiration pneumonia in this population.
Disclosures
The authors do not have any financial relationships relevant to this article to disclose.
Funding
Dr. Thomson was supported by the Agency for Healthcare Research and Quality (AHRQ) under award number K08HS025138. Dr. Ambroggio was supported by the National Institute for Allergy and Infectious Diseases (NIAID) under award number K01AI125413. The content is solely the responsibility of the authors and does not necessarily represent the official views of the AHRQ or NIAID.
1. Berry JG, Poduri A, Bonkowsky JL, et al. Trends in resource utilization by children with neurological impairment in the United States inpatient health care system: a repeat cross-sectional study. PLoS Med. 2012;9(1):e1001158. https://doi.org/10.1371/journal.pmed.1001158.
2. Seddon PC, Khan Y. Respiratory problems in children with neurological impairment. Arch Dis Child. 2003;88(1):75-78. https://doi.org/10.1136/adc.88.1.75.
3. Thomson J, Hall M, Ambroggio L, et al. Aspiration and non-aspiration pneumonia in hospitalized children with neurologic impairment. Pediatrics. 2016;137(2):e20151612. https://doi.org/10.1542/peds.2015-1612.
4. Brook I. Anaerobic pulmonary infections in children. Pediatr Emerg Care. 2004;20(9):636-640. https://doi.org/10.1097/01.pec.0000139751.63624.0b.
5. Bartlett JG, Gorbach SL. Treatment of aspiration pneumonia and primary lung abscess. Penicillin G vs clindamycin. JAMA. 1975;234(9):935-937. https://doi.org/10.1001/jamadermatol.2017.0297.
6. Bartlett JG, Gorbach SL, Finegold SM. The bacteriology of aspiration pneumonia. Am J Med. 1974;56(2):202-207. https://doi.org/10.1016/0002-9343(74)90598-1.
7. Lode H. Microbiological and clinical aspects of aspiration pneumonia. J Antimicrob Chemother. 1988;21:83-90. https://doi.org/10.1093/jac/21.suppl_c.83.
8. Brook I. Treatment of aspiration or tracheostomy-associated pneumonia in neurologically impaired children: effect of antimicrobials effective against anaerobic bacteria. Int J Pediatr Otorhinolaryngol. 1996;35(2):171-177. https://doi.org/10.1016/0165-5876(96)01332-8.
9. Jacobson SJ, Griffiths K, Diamond S, et al. A randomized controlled trial of penicillin vs clindamycin for the treatment of aspiration pneumonia in children. Arch Pediatr Adolesc Med. 1997;151(7):701-704. https://doi.org/10.1001/archpedi.1997.02170440063011.
10. DiBardino DM, Wunderink RG. Aspiration pneumonia: a review of modern trends. J Crit Care. 2015;30(1):40-48. https://doi.org/10.1016/j.jcrc.2014.07.011.
11. Gerdung CA, Tsang A, Yasseen AS, 3rd, Armstrong K, McMillan HJ, Kovesi T. Association between chronic aspiration and chronic airway infection with Pseudomonas aeruginosa and other Gram-negative bacteria in children with cerebral palsy. Lung. 2016;194(2):307-314. https://doi.org/10.1007/s00408-016-9856-5.
12. Thorburn K, Jardine M, Taylor N, Reilly N, Sarginson RE, van Saene HK. Antibiotic-resistant bacteria and infection in children with cerebral palsy requiring mechanical ventilation. Pedr Crit Care Med. 2009;10(2):222-226. https://doi.org/10.1097/PCC.0b013e31819368ac.
13. Lanspa MJ, Jones BE, Brown SM, Dean NC. Mortality, morbidity, and disease severity of patients with aspiration pneumonia. J Hosp Med. 2013;8(2):83-90. https://doi.org/10.1002/jhm.1996.
14. Lanspa MJ, Peyrani P, Wiemken T, Wilson EL, Ramirez JA, Dean NC. Characteristics associated with clinician diagnosis of aspiration pneumonia: a descriptive study of afflicted patients and their outcomes. J Hosp Med. 2015;10(2):90-96. https://doi.org/10.1002/jhm.2280.
15. Berry JG, Graham RJ, Roberson DW, et al. Patient characteristics associated with in-hospital mortality in children following tracheotomy. Arch Dis Child. 2010;95(9):703-710.
16. Berry JG, Graham DA, Graham RJ, et al. Predictors of clinical outcomes and hospital resource use of children after tracheotomy. Pediatrics. 2009;124(2):563-572. https://doi.org/10.1136/adc.2009.180836.
17. Balamuth F, Weiss SL, Hall M, et al. Identifying pediatric severe sepsis and septic shock: Accuracy of diagnosis codes. J Pediatr. 2015;167(6):1295-1300 e1294. https://doi.org/10.1016/j.jpeds.2015.09.027.
18. American Academy of Pediatrics., Pickering LK, American Academy of Pediatrics. Committee on Infectious Diseases. In: Red book : 2012 report of the Committee on Infectious Diseases. 29th ed. Elk Grove Village: American Academy of Pediatrics; 2012.
19. Gilbert DN. The Sanford Guide to Antimicrobial Therapy 2014. 44th ed. Sperryville: Antimicrobial Therapy, Inc; 2011.
20. Marik PE. Aspiration pneumonitis and aspiration pneumonia. N Engl J Med. 2001;344(9):665-671. https://doi.org/10.1056/NEJM200103013440908.
21. Feudtner C, Feinstein JA, Zhong W, Hall M, Dai D. Pediatric complex chronic conditions classification system version 2: updated for ICD-10 and complex medical technology dependence and transplantation. BMC Pediatrics. 2014;14:199. https://doi.org/10.1186/1471-2431-14-199.
22. Feudtner C, Hays RM, Haynes G, Geyer JR, Neff JM, Koepsell TD. Deaths attributed to pediatric complex chronic conditions: national trends and implications for supportive care services. Pediatrics. 2001;107(6):E99. https://doi.org/10.1542/peds.107.6.e99.
23. Feinstein JA, Russell S, DeWitt PE, Feudtner C, Dai D, Bennett TD. R package for pediatric complex chronic condition classification. JAMA Pediatr. 2018;172(6):596-598. https://doi.org/10.1001/jamapediatrics.2018.0256.
24. Berry JG, Hall DE, Kuo DZ, Cohen E, Agrawal R, Feudtner C, Hall M, Kueser J, Kaplan W, Neff J. Hospital utilization and characteristics of patients experiencing recurrent readmissions within children’s hospitals. JAMA. 2011;305(7):682-690. https://doi.org/10.1001/jama.2011.122.
25. Shah SS, Hall M, Newland JG, et al. Comparative effectiveness of pleural drainage procedures for the treatment of complicated pneumonia in childhood. J Hosp Med. 2011;6(5):256-263. https://doi.org/10.1002/jhm.872.
26. Child Health Corporation of America. CTC™ 2010 Code Structure: Module 5 Clinical Services. 2010 January 4; Available at https://sharepoint.chca.com/CHCAForums/PerformanceImprovement/PHIS/Reference Library/CTC Resources/Forms/AllItems.aspx Version: Modified.
27. Bradley JS, Byington CL, Shah SS, et al. The management of community-acquired pneumonia in infants and children older than 3 months of age: clinical practice guidelines by the Pediatric Infectious Diseases Society and the Infectious Diseases Society of America. Clin Infect Dis. 2011;53(7):e25-76. https://doi.org/10.1093/cid/cir531.
28. Brook I. Bacterial colonization, tracheobronchitis, and pneumonia following tracheostomy and long-term intubation in pediatric patients. Chest. 1979;76(4):420-424.
29. Waybright RA, Coolidge W, Johnson TJ. Treatment of clinical aspiration: a reappraisal. Am J Health Syst Pharm. 2013;70(15):1291-1300. https://doi.org/10.2146/ajhp120319.
30. Brook I, Finegold SM. Bacteriology of aspiration pneumonia in children. Pediatrics. 1980;65(6):1115-1120.
31. Wei C, Cheng Z, Zhang L, Yang J. Microbiology and prognostic factors of hospital- and community-acquired aspiration pneumonia in respiratory intensive care unit. Am J Infect Control. 2013;41(10):880-884. https://doi.org/10.1016/j.ajic.2013.01.007.
32. El-Solh AA, Pietrantoni C, Bhat A, et al. Microbiology of severe aspiration pneumonia in institutionalized elderly. Am J Respir Crit Care Med. 2003;167(12):1650-1654. https://doi.org/10.1164/rccm.200212-1543OC.
33. Tokuyasu H, Harada T, Watanabe E, et al. Effectiveness of meropenem for the treatment of aspiration pneumonia in elderly patients. Intern Med. 2009;48(3):129-135. https://doi.org/10.2169/internalmedicine.48.1308.
34. Ott SR, Allewelt M, Lorenz J, Reimnitz P, Lode H, German Lung Abscess Study Group. Moxifloxacin vs ampicillin/sulbactam in aspiration pneumonia and primary lung abscess. Infection. 2008;36(1):23-30. https://doi.org/10.1007/s15010-007-7043-6.
35. Kadowaki M, Demura Y, Mizuno S, et al. Reappraisal of clindamycin IV monotherapy for treatment of mild-to-moderate aspiration pneumonia in elderly patients. Chest. 2005;127(4):1276-1282. https://doi.org/10.1016/j.chest.2017.05.019.
36. Marik PE, Careau P. The role of anaerobes in patients with ventilator-associated pneumonia and aspiration pneumonia: a prospective study. Chest. 1999;115(1):178-183. https://doi.org/10.1378/chest.115.1.178.
37. Mier L, Dreyfuss D, Darchy B, et al. Is penicillin G an adequate initial treatment for aspiration pneumonia? A prospective evaluation using a protected specimen brush and quantitative cultures. Intensive Care Med. 1993;19(5):279-284. https://doi.org/10.1007/bf01690548.
38. Ashkenazi-Hoffnung L, Ari A, Bilavsky E, Scheuerman O, Amir J, Prais D. Pseudomonas aeruginosa identified as a key pathogen in hospitalised children with aspiration pneumonia and a high aspiration risk. Acta Paediatr. 2016;105(12):e588-e592. https://doi.org/10.1111/apa.13523.
39. Bartlett JG, Gorbach SL, Tally FP, Finegold SM. Bacteriology and treatment of primary lung abscess. Am Rev Respir Dis. 1974;109(5):510-518. https://doi.org/10.1164/arrd.1974.109.5.510.
40. Russell CJ, Simon TD, Mamey MR, Newth CJL, Neely MN. Pseudomonas aeruginosa and post-tracheotomy bacterial respiratory tract infection readmissions. Pediatr Pulmonol. 2017;52(9):1212-1218. https://doi.org/10.1002/ppul.23716.
41. Russell CJ, Mamey MR, Koh JY, Schrager SM, Neely MN, Wu S. Length of stay and hospital revisit after bacterial tracheostomy-associated respiratory tract infection hospitalizations. Hosp Pediatr. Hosp Pediatr. 2018;8(2):72-80. https://doi.org/10.1542/hpeds.2017-0106.
42. Russell CJ, Mack WJ, Schrager SM, Wu S. Care variations and outcomes for children hospitalized with bacterial tracheostomy-associated respiratory infections. Hosp Pediatr. 2017;7(1):16-23. https://doi.org/10.1542/hpeds.2016-0104.
© 2019 Society of Hospital Medicine
Hypoglycemia Safety Initiative: Working With PACT Clinical Pharmacy Specialists to Individualize HbA1c Goals (FULL)
Clinical pharmacy specialist interventions after patient consultation resulted in statistically significant increases in HbA1c levels in patients at risk for hypoglycemia who relaxed their therapy.
Intensive glycemic lowering for the treatment for type 2 diabetes mellitus (T2DM) has been shown to decrease microvascular and macrovascular outcomes in the UK Prospective Diabetes Study (UKPDS) without any risk of increased harm.1,2 Over the past decade, evidence has shown that the outcomes and risk do not hold true in an older population with additional comorbidities and longer duration of DM. Both the Action to Control Cardiovascular Risk in Diabetes (ACCORD) and Veterans Affairs Diabetes Trial (VADT) trials showed no decreased incidence of macrovascular or microvascular complications of DM with intensive glucose lowering but an additional risk of hypoglycemia and even death.2-4
Patient-specific risk factors, such as age, impaired renal function, and cognitive impairment, have been shown to lead to an increased risk of hypoglycemia independent of hemoglobin A1c (HbA1c). Dementia and cognitive impairment are associated with a 2.42 and 1.72 times greater risk of hypoglycemia, respectively, compared with a patient without dementia or cognitive impairment.5 A post-hoc analysis of the ACCORD trial that analyzed the risk of hypoglycemia in subgroup populations showed an increased risk of hypoglycemia in those with a serum creatinine (SCr) level > 1.3 mg/dL (hazard ratio, 1.66, P < .01) and increasing age. Risk of hypoglycemia was highest in those aged ≥ 75 years but increased by 3% for every subsequent year (P < .01).6 These risk factors should be addressed and considered in individual patients with DM to safely guide therapy.
The evidence from these landmark trials has led to increased HbA1c goals for specific patient populations in the most recent 2017 VA/DoD Clinical Practice Guideline (CPG) for the Management of Type 2 Diabetes Mellitus in Primary Care.7 The majority of patients with T2DM now qualify for HBA1c goals > 7.0%. According to the 2017 VA/DoD CPG, younger patients with the absence of a major comorbidity and life expectancy of > 10 to 15 years with mild or absent microvascular complications is the only group of patients who should be treated to an A1c goal of 6.0 to 7.0%.7 The use of shared decision making and patient education to set glycemic goals based on “patient capabilities, needs, goals, prior treatment experience, and preferences” also should be used to increase patient education and satisfaction.7
In December 2014, the VA introduced the Hypoglycemia Safety Initiative (HSI). The goal of the HSI is to “enable veterans living with diabetes to work more closely with their VA clinicians to personalize health care goals and improve self-management of the disease.”8 This goal also aligns with the US Department of Health and Human Services National Action Plan for Adverse Drug Event Prevention. One of 3 initial targets of this plan includes DM agents and the prevention of hypoglycemia.9
To combat the risk of hypoglycemia and potentially negative outcomes, as part of the HSI, the VA is implementing a clinical reminder within the Computerized Patient Record System (CPRS) that will prompt the primary care team to screen select patients at risk for hypoglycemia. The purpose of this project was to identify patients at high risk of hypoglycemia, individualize HbA1c goals, and consider de-escalation in therapy, using shared decision making.
Methods
This quality improvement project, conducted at the Fayetteville VA Medical Center (FVAMC), consisted of outpatient services provided at 2 health care centers and 6 community-based outpatient clinics. The project was exempt from institutional review board approval as the protocol met national VA criteria as a quality assurance project.
Patients were identified using the HSI Corporate Data Warehouse (CDR) reports. Once patients were identified, a list was distributed to the appropriate clinical pharmacy specialist (CPS), according to patient aligned care teams (PACTs). The CPS contacted the patient via telephone or in person to conduct hypoglycemia screening. Patients on a sulfonylurea or insulin and an HbA1c < 7% plus 1 risk factor for hypoglycemia (aged ≥ 75 years, serum creatinine[SCr] ≥1.7 mg/dL, diagnosis of cognitive impairment, or prescribed a cholinesterase inhibitor) were included. These risk factors were chosen to align with the future clinical reminder, which is based on an increased risk of hypoglycemia seen in these patient populations.
Patients were included if they were receiving antidiabetic medications through the FVAMC or outside of the VA and/or prescribed by a non-VA provider. Medications and doses prescribed by a non-VA provider were verified with the patient verbally during the initial interview. Once contacted by the CPS, any patients who no longer met inclusion criteria were excluded.
The CPS used a national VA hypoglycemia screening note template to ask the patient about frequency and severity of hypoglycemia. Hypoglycemia was defined as a self-monitored blood glucose < 70 mg/dL with or without symptoms. An additional definition consisted of typical hypoglycemia symptoms as reported by the patient even if self-monitored blood glucose was not obtained while exhibiting symptoms. Using shared decision making between the CPS and veteran, antidiabetic therapy was either relaxed or continued. Relaxing therapy was defined as decreasing doses or discontinuation of antidiabetic medications that are known for potentiating hypoglycemia (ie, sulfonylurea and insulin).
The CPS had autonomy in deciding how much to lower dose(s) or when to discontinue medication(s). Additional counseling in proper medication administration, including appropriate timing of medication administration, also could have been the sole intervention needed for a given patient who experienced hypoglycemia. Counseling would have been considered continuation of therapy. For example, if a patient was experiencing hypoglycemia while taking a sulfonylurea twice daily, the CPS would provide counseling on proper timing of medication administration 20 to 30 minutes before morning and evening meals rather than the patient’s perceived administration of twice daily without regard to meals. Even in patients who met inclusion criteria but who did not experience any hypoglycemia symptoms, the CPS and patient could use shared decision making with emphasis on appropriate HbA1c goals to determine whether relaxation in therapy was appropriate.
Data Collection
Baseline demographics, including prespecified risk factors for hypoglycemia, were collected. Data were imported into the HSI CDW from the national VA hypoglycemia screening note template completed by the CPS. From the data CDW, frequency and severity of hypoglycemia were recorded. The CPS interventions were also quantified; HbA1c data were obtained in patients in whom therapy was relaxed 3- to 6-months postintervention.
Statistical Analysis
Descriptive statistics (mean, range) were used for analyzing results. A t test with a 1-tailed distribution was used to analyze the change in HbA1c after CPS intervention (α = .05).
Results
On August 17, 2017, 839 patients were identified across all FVAMC facilities from the HSI data CDW. Patients were contacted through February 16, 2018. A total of 52 patients were excluded as they no longer met inclusion criteria or were deceased at time of review. 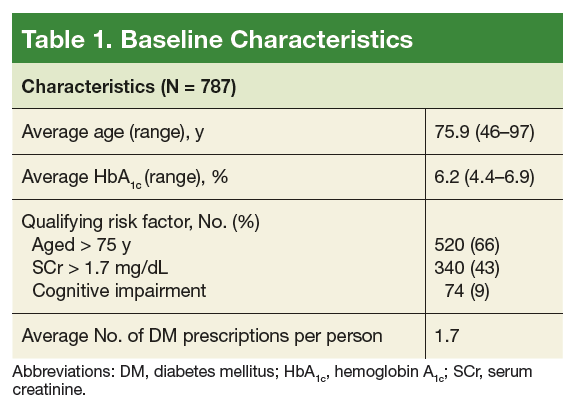
The most commonly prescribed antidiabetic prescription was a sulfonylurea (482 prescriptions) followed by basal insulin (319 prescriptions; Table 2). 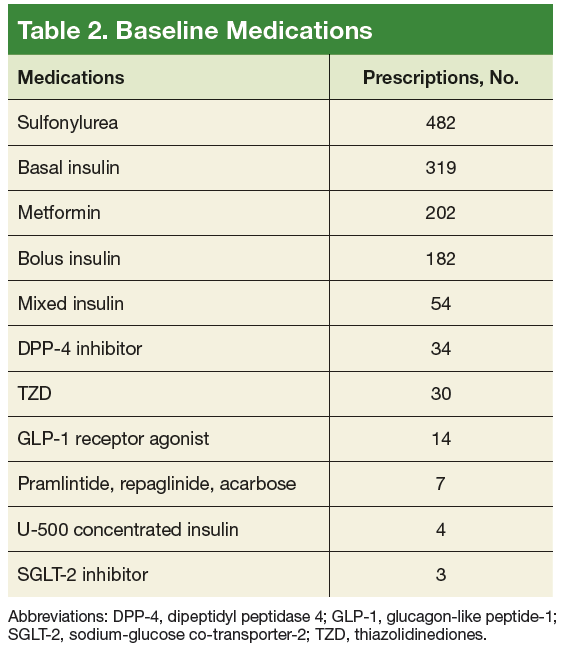
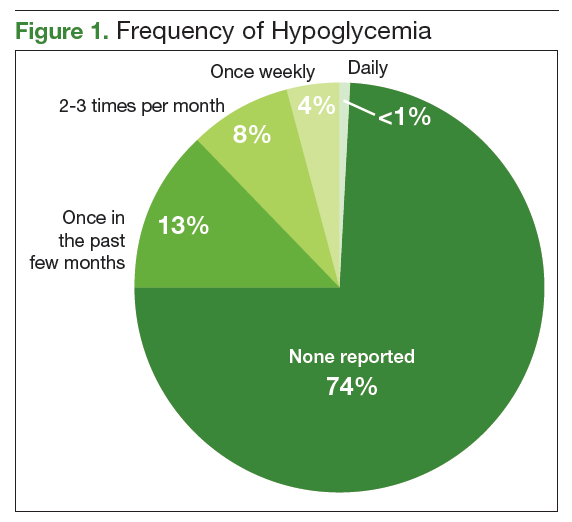
The CPS used shared decision making to relax antidiabetic therapy in 102 (16.5%) of the total number of patients contacted (Figure 2). Lab orders were entered for the patient to obtain an HbA1c in 3 to 6 months in those in whom therapy was relaxed. 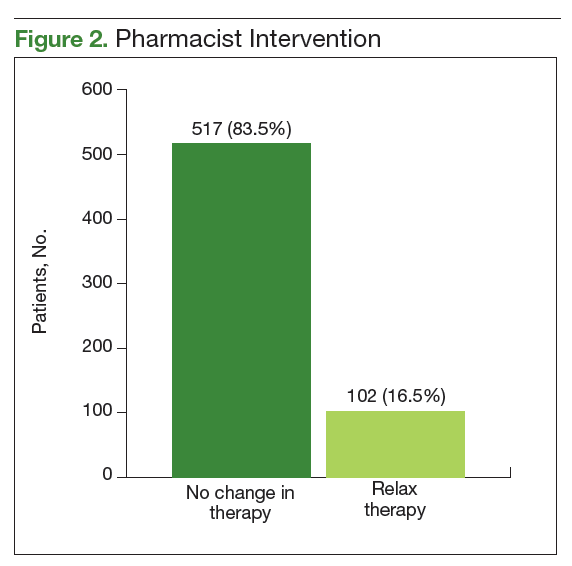
Discussion
The primary objective of this project was to identify patients at risk for hypoglycemia. Approximately 1 in 4 patients reported any incidence of hypoglycemia, which shows that the prespecified inclusion criteria was an appropriate guide for hypoglycemia screening. The episodes of hypoglycemia were typically infrequent, occurring only once every few months. This could have contributed to a lower rate of therapy changes compared with the rate of hypoglycemia. Overall, hypoglycemia was not severe; 83% of patients did not report any symptoms of faintness. Pharmacists were able to intervene and relax therapy in 102 patients to try to prevent episodes of hypoglycemia and negative outcomes. These interventions led to a statistically significant increase in average HbA1c in these patients. Throughout these encounters with the CPS and patient, there were also innumerable outcomes secondary to the use of shared decision making. Regardless of medication changes, there was increased patient education concerning hypoglycemia treatment, medication administration times, and HbA1c goals.
This project’s strengths included the large sample size, appropriate inclusion criteria that identified patients at risk for hypoglycemia, and the use of shared decision making. It was also beneficial to obtain HbA1c levels after a relaxation in therapy for objective outcomes. The increase in HbA1c levels showed a statistically significant gain, which led to more patients having an HbA1c closer to a CPG-recommended goal range, given their risk factors for hypoglycemia. This pharmacy initiative fostered increased communication between providers and CPS within the PACT team. The pharmacist was not consulted by the provider for management of these patients with DM, so therapy relaxation was documented in CPRS and was addressed at the patient’s next primary care appointment. Some changes also required discussion with the primary care provider prior to relaxation in therapy. By initiating these discussions with providers, opportunities arose for additional education on appropriate HbA1c goals and why therapy should be relaxed in select patient populations.
Limitations
Some limitations to this project were the use of telephone encounters and interpharmacist variability. Patients who were contacted via telephone by a pharmacist who was unknown to them were more hesitant to make changes. Patients managed for DM by non-VA providers or patients receiving medications at a non-VA pharmacy were also reluctant to implement changes. Education was the major intervention for these patients. Pharmacists were instructed to use their clinical judgment in addition to shared decision making with the patient when relaxing therapy. There was no protocol for medication changes. Although interpharmacist variability is identified as a weakness, it could be considered more representative of daily practice.
Additionally, despite a statistically significant increase in HbA1c, which would presumably lead to fewer episodes of hypoglycemia, patients were not contacted again after the intervention to inquire whether hypoglycemia had decreased. Studies targeted at the impact of less frequent hypoglycemia events, including fewer emergency department visits, hospital admissions, or primary care walk-in appointments, would improve the clinical significance of these data. As the HSI is implemented nationally within the VA, more data will be available to better evaluate the applicability of this clinical reminder. Locally, the criteria for the clinical reminder has proved to capture a significant number of patients experiencing hypoglycemia. Using national data will also help to guide the frequency of screening needed in this population.
Conclusion
The implementation of the HSI led to increased provider and patient awareness of hypoglycemia. The CPS interventions have resulted in statistically significant increases in HbA1c levels, which would seemingly decrease the patient’s risk of adverse outcomes as shown in the ACCORD and VADT trials.
1. UK Prospective Diabetes Study (UKPDS) Group. Effect of intensive blood-glucose control with metformin on complications in overweight patients with type 2 diabetes (UKPDS 34). UK Prospective Diabetes Study (UKPDS) Group. Lancet. 1998;352(9131):854-865.
2. Kirkman MS, Mahmud H, Korytkowski MT. Intensive blood glucose control and vascular outcomes in patients with type 2 diabetes mellitus. Endocrinol Metab Clin North Am. 2018;47(1):81-96.
3. Action to Control Cardiovascular Risk in Diabetes Study Group, Gerstein HC, Miller ME, et al. Effects of intensive glucose lowering in type 2 diabetes. N Engl J Med. 2008;358(24):2545-2559.
4. Duckworth W, Abraira C, Moritz T, et al; VADT Investigators. Glucose control and vascular complications in veterans with type 2 diabetes. N Engl J Med. 2009;360(2):129-139.
5. Feil DG, Rajan M, Soroka O, Tseng CL, Miller DR, Pogach LM. Risk of hypoglycemia in older veterans with dementia and cognitive impairment: implications for practice and policy. J Am Geriatr Soc. 2011;59(12):2263-2272.
6. Miller ME, Bonds DE, Gerstein HC, et al; ACCORD Investigators. The effects of baseline characteristics, glycaemia treatment approach, and glycated haemoglobin concentration on the risk of severe hypoglycaemia: post hoc epidemiological analysis of the ACCORD study. BMJ. 2010;340:b5444.
7. US Department of Veterans Affairs, Department of Defense. VA/DoD Clinical Practice Guideline for the Management of Type 2 Diabetes Mellitus in Primary Care. Version 5.0. https://www.healthquality.va.gov/guidelines/CD/diabetes/VADoDD MCPGFinal508.pdf. Published 2017. Accessed September 28, 2018.
8. US Department of Veterans Affairs. VA implements national hypoglycemic safety initiative. https://www.qualityandsafety.va.gov/docs/HSI-Clinician-PressRelease2014.pdf. Published December 10, 2014. Accessed September 28, 2018.
9. US Department of Health and Human Services, Office of Disease Prevention and Health Promotion. National Action Plan for Adverse Drug Event Prevention. https://health.gov/hcq/pdfs/ADE-Action-Plan-508c.pdf. Published 2014. Accessed September 28, 2018.
Clinical pharmacy specialist interventions after patient consultation resulted in statistically significant increases in HbA1c levels in patients at risk for hypoglycemia who relaxed their therapy.
Clinical pharmacy specialist interventions after patient consultation resulted in statistically significant increases in HbA1c levels in patients at risk for hypoglycemia who relaxed their therapy.
Intensive glycemic lowering for the treatment for type 2 diabetes mellitus (T2DM) has been shown to decrease microvascular and macrovascular outcomes in the UK Prospective Diabetes Study (UKPDS) without any risk of increased harm.1,2 Over the past decade, evidence has shown that the outcomes and risk do not hold true in an older population with additional comorbidities and longer duration of DM. Both the Action to Control Cardiovascular Risk in Diabetes (ACCORD) and Veterans Affairs Diabetes Trial (VADT) trials showed no decreased incidence of macrovascular or microvascular complications of DM with intensive glucose lowering but an additional risk of hypoglycemia and even death.2-4
Patient-specific risk factors, such as age, impaired renal function, and cognitive impairment, have been shown to lead to an increased risk of hypoglycemia independent of hemoglobin A1c (HbA1c). Dementia and cognitive impairment are associated with a 2.42 and 1.72 times greater risk of hypoglycemia, respectively, compared with a patient without dementia or cognitive impairment.5 A post-hoc analysis of the ACCORD trial that analyzed the risk of hypoglycemia in subgroup populations showed an increased risk of hypoglycemia in those with a serum creatinine (SCr) level > 1.3 mg/dL (hazard ratio, 1.66, P < .01) and increasing age. Risk of hypoglycemia was highest in those aged ≥ 75 years but increased by 3% for every subsequent year (P < .01).6 These risk factors should be addressed and considered in individual patients with DM to safely guide therapy.
The evidence from these landmark trials has led to increased HbA1c goals for specific patient populations in the most recent 2017 VA/DoD Clinical Practice Guideline (CPG) for the Management of Type 2 Diabetes Mellitus in Primary Care.7 The majority of patients with T2DM now qualify for HBA1c goals > 7.0%. According to the 2017 VA/DoD CPG, younger patients with the absence of a major comorbidity and life expectancy of > 10 to 15 years with mild or absent microvascular complications is the only group of patients who should be treated to an A1c goal of 6.0 to 7.0%.7 The use of shared decision making and patient education to set glycemic goals based on “patient capabilities, needs, goals, prior treatment experience, and preferences” also should be used to increase patient education and satisfaction.7
In December 2014, the VA introduced the Hypoglycemia Safety Initiative (HSI). The goal of the HSI is to “enable veterans living with diabetes to work more closely with their VA clinicians to personalize health care goals and improve self-management of the disease.”8 This goal also aligns with the US Department of Health and Human Services National Action Plan for Adverse Drug Event Prevention. One of 3 initial targets of this plan includes DM agents and the prevention of hypoglycemia.9
To combat the risk of hypoglycemia and potentially negative outcomes, as part of the HSI, the VA is implementing a clinical reminder within the Computerized Patient Record System (CPRS) that will prompt the primary care team to screen select patients at risk for hypoglycemia. The purpose of this project was to identify patients at high risk of hypoglycemia, individualize HbA1c goals, and consider de-escalation in therapy, using shared decision making.
Methods
This quality improvement project, conducted at the Fayetteville VA Medical Center (FVAMC), consisted of outpatient services provided at 2 health care centers and 6 community-based outpatient clinics. The project was exempt from institutional review board approval as the protocol met national VA criteria as a quality assurance project.
Patients were identified using the HSI Corporate Data Warehouse (CDR) reports. Once patients were identified, a list was distributed to the appropriate clinical pharmacy specialist (CPS), according to patient aligned care teams (PACTs). The CPS contacted the patient via telephone or in person to conduct hypoglycemia screening. Patients on a sulfonylurea or insulin and an HbA1c < 7% plus 1 risk factor for hypoglycemia (aged ≥ 75 years, serum creatinine[SCr] ≥1.7 mg/dL, diagnosis of cognitive impairment, or prescribed a cholinesterase inhibitor) were included. These risk factors were chosen to align with the future clinical reminder, which is based on an increased risk of hypoglycemia seen in these patient populations.
Patients were included if they were receiving antidiabetic medications through the FVAMC or outside of the VA and/or prescribed by a non-VA provider. Medications and doses prescribed by a non-VA provider were verified with the patient verbally during the initial interview. Once contacted by the CPS, any patients who no longer met inclusion criteria were excluded.
The CPS used a national VA hypoglycemia screening note template to ask the patient about frequency and severity of hypoglycemia. Hypoglycemia was defined as a self-monitored blood glucose < 70 mg/dL with or without symptoms. An additional definition consisted of typical hypoglycemia symptoms as reported by the patient even if self-monitored blood glucose was not obtained while exhibiting symptoms. Using shared decision making between the CPS and veteran, antidiabetic therapy was either relaxed or continued. Relaxing therapy was defined as decreasing doses or discontinuation of antidiabetic medications that are known for potentiating hypoglycemia (ie, sulfonylurea and insulin).
The CPS had autonomy in deciding how much to lower dose(s) or when to discontinue medication(s). Additional counseling in proper medication administration, including appropriate timing of medication administration, also could have been the sole intervention needed for a given patient who experienced hypoglycemia. Counseling would have been considered continuation of therapy. For example, if a patient was experiencing hypoglycemia while taking a sulfonylurea twice daily, the CPS would provide counseling on proper timing of medication administration 20 to 30 minutes before morning and evening meals rather than the patient’s perceived administration of twice daily without regard to meals. Even in patients who met inclusion criteria but who did not experience any hypoglycemia symptoms, the CPS and patient could use shared decision making with emphasis on appropriate HbA1c goals to determine whether relaxation in therapy was appropriate.
Data Collection
Baseline demographics, including prespecified risk factors for hypoglycemia, were collected. Data were imported into the HSI CDW from the national VA hypoglycemia screening note template completed by the CPS. From the data CDW, frequency and severity of hypoglycemia were recorded. The CPS interventions were also quantified; HbA1c data were obtained in patients in whom therapy was relaxed 3- to 6-months postintervention.
Statistical Analysis
Descriptive statistics (mean, range) were used for analyzing results. A t test with a 1-tailed distribution was used to analyze the change in HbA1c after CPS intervention (α = .05).
Results
On August 17, 2017, 839 patients were identified across all FVAMC facilities from the HSI data CDW. Patients were contacted through February 16, 2018. A total of 52 patients were excluded as they no longer met inclusion criteria or were deceased at time of review.
The most commonly prescribed antidiabetic prescription was a sulfonylurea (482 prescriptions) followed by basal insulin (319 prescriptions; Table 2).
The CPS used shared decision making to relax antidiabetic therapy in 102 (16.5%) of the total number of patients contacted (Figure 2). Lab orders were entered for the patient to obtain an HbA1c in 3 to 6 months in those in whom therapy was relaxed.
Discussion
The primary objective of this project was to identify patients at risk for hypoglycemia. Approximately 1 in 4 patients reported any incidence of hypoglycemia, which shows that the prespecified inclusion criteria was an appropriate guide for hypoglycemia screening. The episodes of hypoglycemia were typically infrequent, occurring only once every few months. This could have contributed to a lower rate of therapy changes compared with the rate of hypoglycemia. Overall, hypoglycemia was not severe; 83% of patients did not report any symptoms of faintness. Pharmacists were able to intervene and relax therapy in 102 patients to try to prevent episodes of hypoglycemia and negative outcomes. These interventions led to a statistically significant increase in average HbA1c in these patients. Throughout these encounters with the CPS and patient, there were also innumerable outcomes secondary to the use of shared decision making. Regardless of medication changes, there was increased patient education concerning hypoglycemia treatment, medication administration times, and HbA1c goals.
This project’s strengths included the large sample size, appropriate inclusion criteria that identified patients at risk for hypoglycemia, and the use of shared decision making. It was also beneficial to obtain HbA1c levels after a relaxation in therapy for objective outcomes. The increase in HbA1c levels showed a statistically significant gain, which led to more patients having an HbA1c closer to a CPG-recommended goal range, given their risk factors for hypoglycemia. This pharmacy initiative fostered increased communication between providers and CPS within the PACT team. The pharmacist was not consulted by the provider for management of these patients with DM, so therapy relaxation was documented in CPRS and was addressed at the patient’s next primary care appointment. Some changes also required discussion with the primary care provider prior to relaxation in therapy. By initiating these discussions with providers, opportunities arose for additional education on appropriate HbA1c goals and why therapy should be relaxed in select patient populations.
Limitations
Some limitations to this project were the use of telephone encounters and interpharmacist variability. Patients who were contacted via telephone by a pharmacist who was unknown to them were more hesitant to make changes. Patients managed for DM by non-VA providers or patients receiving medications at a non-VA pharmacy were also reluctant to implement changes. Education was the major intervention for these patients. Pharmacists were instructed to use their clinical judgment in addition to shared decision making with the patient when relaxing therapy. There was no protocol for medication changes. Although interpharmacist variability is identified as a weakness, it could be considered more representative of daily practice.
Additionally, despite a statistically significant increase in HbA1c, which would presumably lead to fewer episodes of hypoglycemia, patients were not contacted again after the intervention to inquire whether hypoglycemia had decreased. Studies targeted at the impact of less frequent hypoglycemia events, including fewer emergency department visits, hospital admissions, or primary care walk-in appointments, would improve the clinical significance of these data. As the HSI is implemented nationally within the VA, more data will be available to better evaluate the applicability of this clinical reminder. Locally, the criteria for the clinical reminder has proved to capture a significant number of patients experiencing hypoglycemia. Using national data will also help to guide the frequency of screening needed in this population.
Conclusion
The implementation of the HSI led to increased provider and patient awareness of hypoglycemia. The CPS interventions have resulted in statistically significant increases in HbA1c levels, which would seemingly decrease the patient’s risk of adverse outcomes as shown in the ACCORD and VADT trials.
1. UK Prospective Diabetes Study (UKPDS) Group. Effect of intensive blood-glucose control with metformin on complications in overweight patients with type 2 diabetes (UKPDS 34). UK Prospective Diabetes Study (UKPDS) Group. Lancet. 1998;352(9131):854-865.
2. Kirkman MS, Mahmud H, Korytkowski MT. Intensive blood glucose control and vascular outcomes in patients with type 2 diabetes mellitus. Endocrinol Metab Clin North Am. 2018;47(1):81-96.
3. Action to Control Cardiovascular Risk in Diabetes Study Group, Gerstein HC, Miller ME, et al. Effects of intensive glucose lowering in type 2 diabetes. N Engl J Med. 2008;358(24):2545-2559.
4. Duckworth W, Abraira C, Moritz T, et al; VADT Investigators. Glucose control and vascular complications in veterans with type 2 diabetes. N Engl J Med. 2009;360(2):129-139.
5. Feil DG, Rajan M, Soroka O, Tseng CL, Miller DR, Pogach LM. Risk of hypoglycemia in older veterans with dementia and cognitive impairment: implications for practice and policy. J Am Geriatr Soc. 2011;59(12):2263-2272.
6. Miller ME, Bonds DE, Gerstein HC, et al; ACCORD Investigators. The effects of baseline characteristics, glycaemia treatment approach, and glycated haemoglobin concentration on the risk of severe hypoglycaemia: post hoc epidemiological analysis of the ACCORD study. BMJ. 2010;340:b5444.
7. US Department of Veterans Affairs, Department of Defense. VA/DoD Clinical Practice Guideline for the Management of Type 2 Diabetes Mellitus in Primary Care. Version 5.0. https://www.healthquality.va.gov/guidelines/CD/diabetes/VADoDD MCPGFinal508.pdf. Published 2017. Accessed September 28, 2018.
8. US Department of Veterans Affairs. VA implements national hypoglycemic safety initiative. https://www.qualityandsafety.va.gov/docs/HSI-Clinician-PressRelease2014.pdf. Published December 10, 2014. Accessed September 28, 2018.
9. US Department of Health and Human Services, Office of Disease Prevention and Health Promotion. National Action Plan for Adverse Drug Event Prevention. https://health.gov/hcq/pdfs/ADE-Action-Plan-508c.pdf. Published 2014. Accessed September 28, 2018.