User login
Impact of the Choosing Wisely® Campaign Recommendations for Hospitalized Children on Clinical Practice: Trends from 2008 to 2017
The Choosing Wisely® Campaign (CWC) was launched in 2012. This ongoing national initiative encourages conversations among patients and clinicians about the need —or the lack thereof—for frequent tests, treatments, and procedures in healthcare. More than 80 professional societies have developed short lists of evidence-based recommendations aimed at avoiding unnecessary, “low-value” care. More than 550 recommendations are currently available.1 The Society of Hospital Medicine (SHM) Pediatric Committee published a list of five recommendations for the CWC in 2013.2
After seven years, the campaign has posted several success stories highlighting the increase in clinicians’ awareness about the recommendations. Several local, regional, and national initiatives and quality improvement (QI) projects have been inspired by the CWC and its tenants.1,3 However, limited research has been performed on the true impact of these recommendations on avoiding “low-value” services. A more comprehensive approach is required to “measure wisely” the impact of the campaign on bedside clinical practice.4 Stakeholders in healthcare value have been challenged to collaborate in creating high-impact lists of “low-value” interventions and designing effective tools to measure their impact on clinical practice and costs.5
We initially developed a report card with five metrics derived from the CWC-SHM pediatric recommendations to help individual institutions and group practices to measure their performance and benchmark their results with peers.6 The report card is available for hospital members of the Children’s Hospital Association (CHA).7
The current study analyzes the frequency of utilization and trends of five metrics included in the CHA/Pediatric Health Information System® (PHIS) CWC report card in tertiary children’s hospitals in the United States. We analyzed data from five years before and five years after the CWC-PHM recommendations were published in 2013. We hypothesize that the publication and dissemination of the CWC-PHM recommendations—the intervention—will result in either an immediate decrease in the use of the “low-value” services studied and/or a change in the trend of utilization over time.
METHODS
Study Design
We conducted an observational, longitudinal retrospective study aimed at evaluating the impact of the CWC-PHM recommendations on clinical practice in tertiary children’s hospitals in the US.
Study Population
The population included inpatient and observation stays for children aged 0-18 years admitted to the 36 children’s hospitals consistently providing data from 2008 to 2017 to the PHIS administrative database (CHA, Lenexa, Kansas). This database contains inpatient, emergency department, ambulatory, and observation encounter–level data from more than 50 not-for-profit, tertiary care pediatric hospitals and accounts for ~20% of all pediatric hospitalizations in the US every year.
A joint effort between the CHA and the participating hospitals ensures the quality of the data submitted, as previously described.8 These data are subjected to a routine quality check with each submission and within each report. Data were fully deidentified for this study. In total, 36 PHIS hospitals met the strict quality standards for inclusion of submitted data. The remaining hospitals were excluded because they did not have complete data or had incomplete billing information.
For external benchmarking purposes, PHIS participating hospitals provide encounter data, including demographics, diagnoses, and procedures (International Classification of Diseases versions 9 and 10).9,10 The transition from ICD-9 to ICD-10 in the US took place during the study period. However, the CHA completed a process of translating and mapping all ICD-9 codes to every possible equivalent ICD-10 code in the PHIS database. Thus, the change from ICD-9 to ICD-10 should not have had any significant effect on population definition and data analytics, including trend analysis.
For each condition, the study population was divided into the following two cohorts for comparison of the trends: all admissions from January 1, 2008 to December 31, 2012 (before) and all admissions from January 1, 2013 to December 31, 2017 (after) the CWC-PHM recommendations were published.
This study was determined to be nonhuman subject research and was therefore exempted by Nicklaus Children’s Hospital Human Research Protection Program.
Outcomes
The outcomes for this study were the percentages of patients receiving the not-recommended “low-value” services targeted by the CWC-PHM recommendations. For this purpose, four of the five recommendations were translated into the following five metrics, operationalized in the PHIS database and displayed in the “Choosing Wisely” report card:6
1. Percentage of patients with uncomplicated asthma receiving chest radiograph (CXR).
2. Percentage of patients with uncomplicated bronchiolitis receiving CXR.
3. Percentage of patients with uncomplicated bronchiolitis receiving bronchodilators.
4. Percentage of patients with lower respiratory tract infection (LRTI) receiving systemic corticosteroids (relievers).
5. Percentage of patients with uncomplicated gastroesophageal reflux (GER) receiving acid suppressor therapy.
The fifth recommendation—limiting the use of continuous pulse oximetry unless the patient is receiving supplemental oxygen—could not be operationalized in the PHIS database because of inconsistent reporting of these resources.6
The resulting percentages represent nonadherence to the recommendations, suggesting overuse of the specific “low-value” intervention. As such, a decreasing trend over time is the desired direction of improvement.
The definition of “uncomplicated” conditions and the metrics are presented in Table 1. A complete list of the inclusion and exclusion criteria to define “uncomplicated” conditions and the complete list of the clinical translation codes used in PHIS to identify the “low-value” services are presented as an electronic supplement.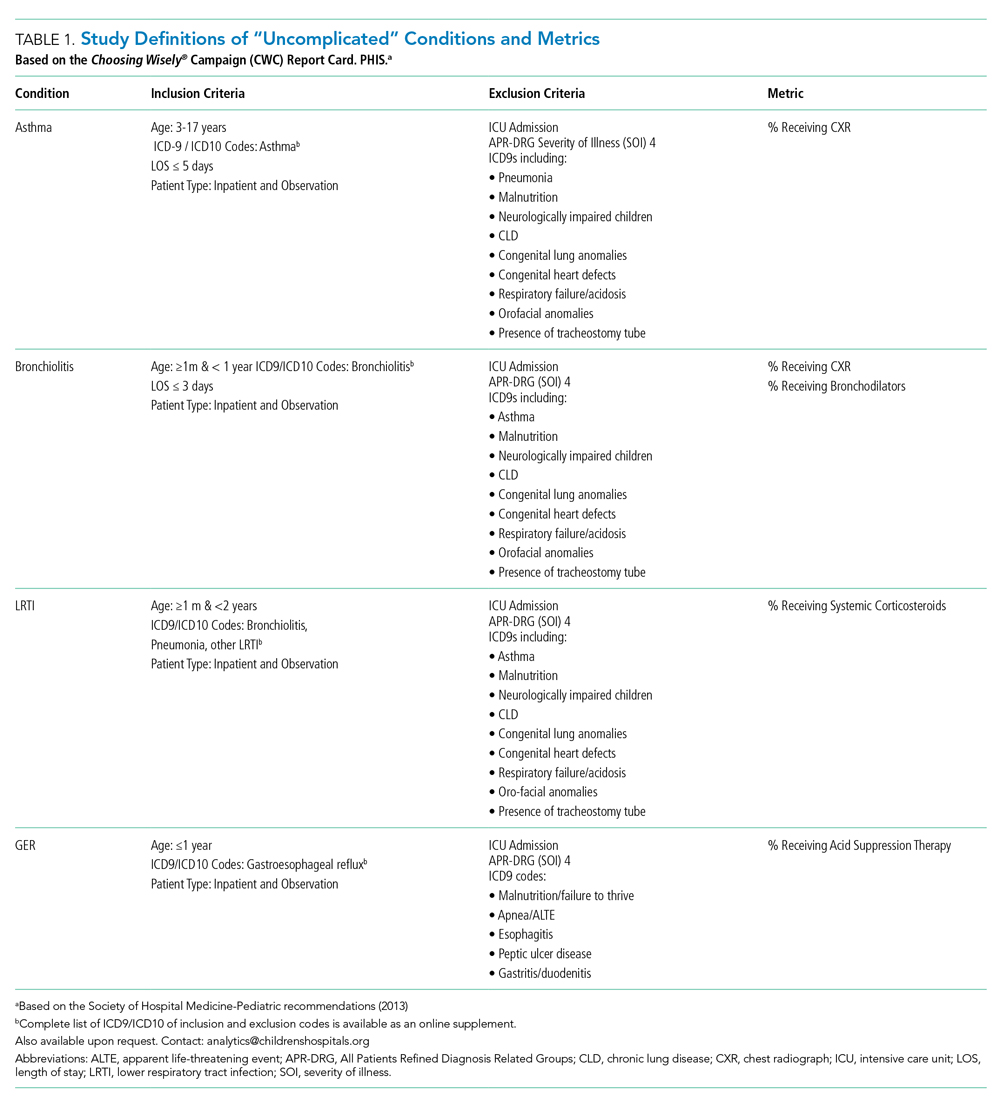
Statistical Analyses
We compared the demographic and clinical characteristics of the various cohorts before and after the release of the CWC-PHM recommendations—the intervention—using chi-square statistics. To assess the individual hospital-level trends over time for each measure, we modeled the patient-level data of each hospital using generalized linear mixed effects models with a binomial distribution. These models were adjusted for patient demographic and clinical factors that were found to be significantly different (P < .01) before and after the intervention on bivariate analyses. From these models, we generated adjusted estimates for the quarterly percentages for each hospital. We then conducted an interrupted time series (ITS) using these estimates to compare trends in the five years before (2008-2012) and five years after (2013-2017) the publication of the CWC-PHM recommendations. For the ITS analysis, we used a generalized linear mixed effects model with the quarterly adjusted hospital-level utilization rates of “low-value” services for each cohort as the unit of analysis and a random intercept for each hospital. The model used an autoregressive(1) covariance structure to account for autocorrelation. The ITS allowed us to test our hypothesis by assessing the following two important features: (a) if a significant decrease occurred right after the CWC-PHM recommendations were published (level-change) and/or (b) if the intervention altered the secular trend (slope-change). All statistical analyses were performed using SAS v. 9.4 (SAS Institute, Cary, North Carolina), and P values <.01 were considered to be statistically significant.
RESULTS
Table 2 presents the demographic characteristics of the cohorts before (2008-2012) and after (2013-2017) the publication of the CWC-PHM recommendations. Hospitalizations due to asthma represented the largest cohort with 142,067 cases, followed by hospitalizations due to bronchiolitis with 94,253 cases. Hospitalizations due to GER comprised the smallest cohort with 13,635 cases. Most of the children had government insurance and had “minor” severity according to the All Patient Revised Diagnosis Related Group (APR-DRG) system.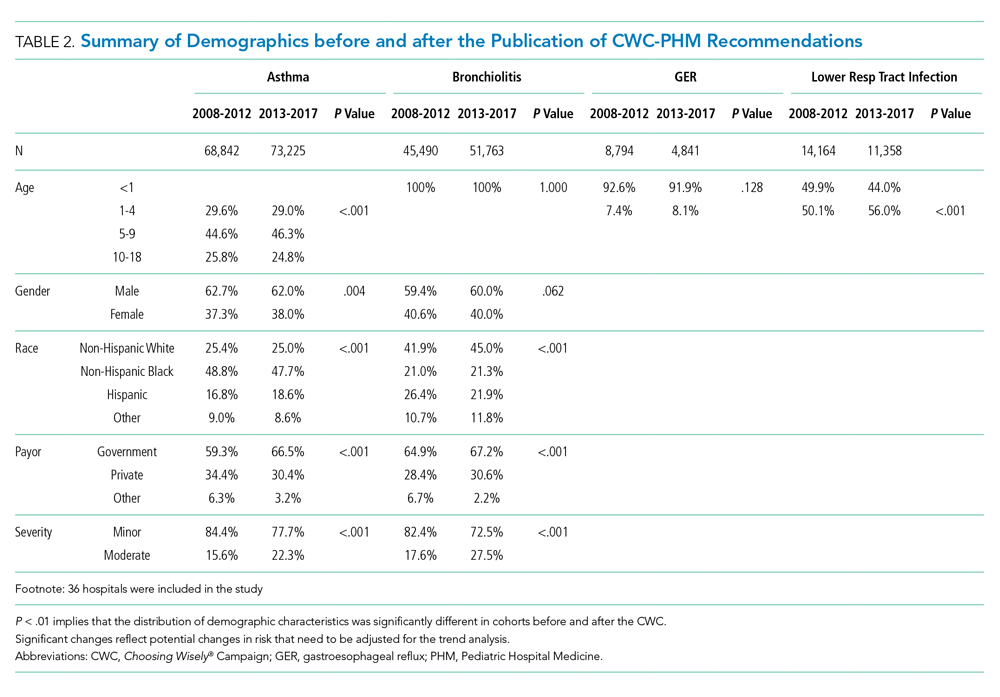
We found statistically significant differences in most of the demographic characteristics for the cohorts when comparing cases before and after the introduction of the CWC-PHM recommendations.
After adjusting for demographic characteristics, we estimated the percentages of the utilization of the “low-value” services from 2008 to 2017. We observed a steady decrease in overutilization of all services over time. The absolute percentage decrease was more evident in the reduction of the utilization of relievers by 36.6% and that of CXR by 31.5% for bronchiolitis. We also observed a 20.8% absolute reduction in the use of CXR for asthma.
The use of systemic steroids in LRTI revealed the lowest utilization among the “low-value” services studied, with 15.1% in 2008 and 12.2% in 2017, a 2.9% absolute reduction. However, the prescription of acid suppressors for GER showed the highest utilization among all the overuse metrics studied, ie, 63% in 2008 and 48.9% in 2017, with an absolute decrease of 24.1%. The yearly adjusted estimated percentages of utilization for each “low-value” service are presented in Appendix Table A.
Table 3 and the Figure (attached as supplemental online graphic) respectively present the risk-adjusted ITS parameter estimates and the graphic representation before and after the inception of the CWC-PHM recommendations for the trend analysis.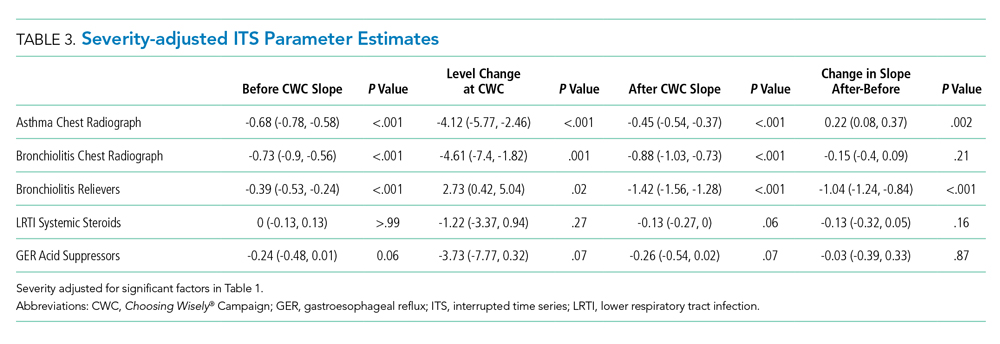
During the five years preceding the intervention (2008-2012), a statistically significant decrease (P < .01) was already noted in the trend of utilization of relievers and CXR in bronchiolitis and CXR in asthma. However, we found no significant change in the trend of the use of systemic corticosteroids in cases with LRTI or the use of acid suppression therapy for GER.
The immediate effect of the intervention is represented by the level change. We found a statistically significant (P < .01) reduction according to the CWC-PHM recommendations only for the use of CXR in hospitalized children with uncomplicated asthma.
During the five years after the CWC-PHM recommendations were published (2013-2017), a sustained, significant decrease in the trend of the use of CXR in asthma and bronchiolitis and the use of relievers in bronchiolitis (P < .01) was observed. However, there was no significant change in the trend of the use of systemic corticosteroids in cases with LRTI or in the use of acid suppression therapy for GER during this period.
Comparison of the trends before and after the publication of the CWC-PHM recommendations revealed that only the decreasing trend in the use of relievers for bronchiolitis over time significantly correlated with the campaign (P < .01).
DISCUSSION
We found a steady reduction in the frequency of overutilization of five “low-value” services described in the CWC-PHM recommendations from 2008 to 2017 in 36 tertiary children’s hospitals in the US. This trend was more evident in the utilization of relievers and CXR for bronchiolitis. The ITS analysis demonstrated that immediately after the publication of the CWC-PHM recommendations, only the use of CXR for asthma decreased significantly. Then, only the use of relievers for bronchiolitis decreased significantly over time in comparison with the secular trend.
These results support our hypothesis for two of the five metrics studied, suggesting that the publication of the CWC-PHM recommendations had a modest impact in clinical practices related to those services in tertiary children’s hospitals.
These findings align with a limited number of published studies that have consistently found a modest decrease in the use of “low-value” services before 201211-13 and a limited impact of the CWC in clinical practices on the use of “low-value” services after the inception of the campaign.14-17
For instance, in a cross-sectional analysis of the 1999 and 2009 samples of ambulatory care practices in the US, only two of 11 overuse quality indicators showed improvement.11 The authors recognized that reducing inappropriate care will require the same attention to guideline development and performance measurement that was directed at reducing the underuse of needed therapies. However, determining whether a patient received inappropriate care generally requires a much more detailed analysis of clinical information than what is required for assessments of underuse.11
Another study designed claims-based algorithms to measure the prevalence of 11 Choosing Wisely-identified “low-value” services in fee-for-service Medicare patients aged >65 years from 2006 to 2011.12 The annual prevalence of selected CWC “low-value” services ranged from 1.2% (upper urinary tract imaging in men with benign prostatic hyperplasia) to 46.5% (preoperative cardiac testing for low-risk, noncardiac procedures). The study concluded that identifying and measuring “low-value” health services is a prerequisite for improving quality and eliminating waste.12
In pediatric medicine, the authors investigated a large cohort of infants aged one to 24 months hospitalized with bronchiolitis to 41 tertiary children’s hospitals reporting data to the PHIS database from 2004 to 2012.13 The trend analysis revealed a decrease in the utilization of diagnostics and treatment interventions before the publication of the American Academy of Pediatrics 2006 Bronchiolitis Guidelines.18 There was an additional reduction in the use of CXR, steroids, and bronchodilators after the publication of the guidelines.13
After the CWC was launched in 2012, several surveys have demonstrated a tangible increase in awareness of the CWC and its goals, mostly among primary care physicians and subspecialists. Clinicians who were aware of the campaign found the recommendations to be useful as a legitimate source of guidance and were more likely to reduce the indication of unnecessary care and “low-value” clinical services included in the CWC.1,3,19,20
Few studies in adults have focused on measuring the trends in overuse metrics derived from the CWC recommendations.14-16 The initial studies have found limited reduction on the use of “low-value” care after the inception of the CWC. They suggest that clinician education, awareness, and public promotion alone do not appear to be sufficient to achieve widespread changes in clinical practice. Additional interventions are necessary for the wider implementation and success of the CWC recommendations.11,14,15,19,21,22
However, a more recent study was conducted in 91 academic centers from 2013 through 2016, before and after the publication of a CWC recommendation on the use of troponin-only testing for the diagnosis of acute myocardial infarction. Hospitals with low rates of troponin-only testing before the publication of the recommendation demonstrated a statistically significant increase over time in the rate of adherence. The authors postulated that the impact of the CWC might have been significant because of the increase in the institutional and provider attention to “high-value” care as a result of the campaign.16
In pediatrics, a cross-sectional study defined 20 “low-value” services from a list of more than 400 items from the CWC and other sources of highly regarded, evidence-based pediatrics healthcare recommendations. The list included six diagnostic tests, five imaging tests, and nine prescription drugs ordered in a robust cohort of 4.4 million children nationwide in 2014. The study concluded that approximately one in 10 children received a “low-value” service. The majority (59.4%) were related to prescription drugs, specifically the inappropriate use of antibiotics for a variety of conditions. The estimated combined cost of these unnecessary services was approximately $27 million, with one-third of the cost being paid out of pocket, arguing for significant financial harm. However, this study did not perform a trend analysis.17
Our results are comparable with these studies, reporting an initial increase in awareness and beliefs, followed by progressive changes in clinical practice among pediatric hospital-based clinicians in delivering evidence-based, high-value care after the CWC.
The attribution of the steady reduction in the absolute percentages of overuse/waste in the five metrics related to the CWC observed in this study, including the significant changes noted in two of the overuse indicators after the publication of the CWC-PHM recommendations, should be interpreted with caution. For example, the significant decrease in the use of “low-value” services in bronchiolitis could be attributed to multiple factors such as national guidelines released in 2014 after the campaign,23 national multicenter QI collaborative projects,24,25 and multiple local QI efforts.26,27 The increase in the awareness and impact of the CWC recommendations among pediatric providers could also be a contributing factor, but this association cannot be established in the light of our findings.
On the other hand, despite extensive evidence for the lack of efficacy and the potential harm associated with the use of acid suppressors for uncomplicated GER in infants,28-30 the frequency of this “low-value” therapeutic intervention remains high (~50%). The trend in utilization was not impacted by the CWC-PHM recommendations. This finding could be explained by several factors, including the possibility that several hospitalized patients may suffer from GER disease requiring acid suppressors. Another possibility is that acid suppressors are generally prescribed as an outpatient medication, and physicians treating inpatients may be reluctant to discontinue it during hospitalization. Nevertheless, this recommendation represents a target for review, update, and QI interventions in the near future.
The delivery of inappropriate “low-value” care represents the most significant dimension of waste in healthcare.31 The development of quality measures of “low-value” services representing overuse and waste is the most needed step toward assessing the magnitude of the problem. Overuse metrics could be incorporated into QI interventions to decrease the provision of such services. However, systematic efforts aimed at developing quality indicators of overuse based on the CWC recommendations have been limited. To our knowledge, this is the first study on the trends of metrics derived from the CWC recommendations in pediatric medicine.
Future research is needed to develop overuse metrics further to assess the specific outcomes related to the implementation of the CWC. How much has clinical practice changed as a result of the campaign? What are the outcomes and savings attributable to these efforts? These are critical questions for the immediate future that should be answered to sustain the ongoing efforts and results and to validate that the efforts are worthwhile.
This study has several limitations. First, this is a retrospective and observational study. It cannot prove a direct causal relationship between the publication of the CWC-PHM and the observed trends, as other potential factors may have contributed to the outcomes. Second, in administrative databases, the data quality is dependent on proper documentation and coding that may vary among reporting institutions. These data lack clinical information, and a fair assessment of “appropriateness” could be questioned. In addition, the study included only 36 academic, tertiary children’s hospitals. Because approximately two-thirds of all pediatric hospitalizations in the US occur in community settings,32 this study may not fully represent clinical practice in the majority of pediatric hospitalizations in the US. Finally, the validity of the ITS analysis has inherent limitations due to the variability of the data in some metrics that may affect the power of the analysis. This fact could lead to inaccurate conclusions regarding intervention effectiveness due to the data-driven model applied, as well as the lack of control for other time-varying confounders.33
CONCLUSIONS
After seven years, the CWC faces important challenges. Critical to the success of the campaign is to “measure wisely” by developing quality indicators of overuse and operationalizing them into administrative and clinical data sources to assess the impact on clinical practice. Our study highlights some limited but steady reduction in the use of some “low-value” services before the campaign. It also demonstrates a modest impact of the campaign on clinical practices in tertiary care children’s hospitals in the US. Clinicians and institutions still have a long way to go in reducing the use of “low-value” interventions in pediatric medicine. These observations challenge us to step up our efforts to implement QI interventions aimed at incorporating these professional, society-endorsed recommendations into our clinical practice.
Acknowledgments
The authors thank Dr. Kristine De La Torre and Dr. Jennifer McCafferty-Fernandez and the Research Institute of Nicklaus Children’s Hospital for medical writing assistance. They also acknowledge Tatiana Consuegra, library technician, for her clerical assistance in the preparation and submission of this article.
1. Choosing Wisely. Choosing Wisely Campaign Official Site. http://www.choosingwisely.org/. Accessed May 2019.
2. Quinonez RA, Garber MD, Schroeder AR, et al. Choosing wisely in pediatric hospital medicine: five opportunities for improved healthcare value. J Hosp Med. 2013;8(9):479-485. https://doi.org/10.1002/jhm.2064.
3. ABIM Foundation CR. Choosing Wisely: A Special Report on the First Five Years. http://www.choosingwisely.org/choosing-wisely-a-special-report-on-the-first-five-years/. Updated 2017. Accessed May 2019.
4. Wolfson D, Santa J, Slass L. Engaging physicians and consumers in conversations about treatment overuse and waste: a short history of the choosing wisely campaign. Acad Med. 2014;89(7):990-995. https://doi.org/10.1097/ACM.0000000000000270.
5. Morden NE, Colla CH, Sequist TD, Rosenthal MB. Choosing wisely—the politics and economics of labeling low-value services. N Engl J Med. 2014;370(7):589-592. https://doi.org/10.1056/NEJMp1314965.
6. Reyes M, Paulus E, Hronek C, et al. Choosing wisely campaign: Report card and achievable benchmarks of care for children’s hospitals. Hosp Pediatr. 2017;7(11):633-641. https://doi.org/10.1542/hpeds.2017-0029.
7. Report Cards. Choosing Wisely Measures - Pediatric Hospital Medicine Detail Reports. Children’s Hospital Association Web site. https://www.childrenshospitals.org/. Accessed May 2019.
8. Mongelluzzo J, Mohamad Z, Ten Have TR, Shah SS. Corticosteroids and mortality in children with bacterial meningitis. JAMA. 2008;299(17):2048-2055. https://doi.org/10.1001/jama.299.17.2048.
9. Buck CJ. 2013 ICD 9 CM for Physicians, Volumes 1 & 2. Chicago, IL: American Medical Association; 2013.
10. Buck CJ. 2018 ICD-10-CM for Physicians. Chicago, IL: American Medical Association; 2018.
11. Kale MS, Bishop TF, Federman AD, Keyhani S. Trends in the overuse of ambulatory health care services in the United States. JAMA Inter Med. 2013;173(2):142-148. https://doi.org/10.1001/2013.jamainternmed.1022.
12. Colla CH, Morden NE, Sequist TD, Schpero WL, Rosenthal MB. Choosing wisely: Prevalence and correlates of low-value health care services in the United States. J Gen Intern Med. 2015;30(2):221-228. https://doi.org/10.1007/s11606-014-3070-z
13. Parikh K, Hall M, Teach SJ. Bronchiolitis management before and after the AAP guidelines. Pediatrics. 2014;133(1): e1-7. https://doi.org/10.1542/peds.2013-2005.
14. Rosenberg A, Agiro A, Gottlieb M, et al. Early trends among seven recommendations from the Choosing Wisely campaign. JAMA Inter Med. 2015;175(12):1913-1920. https://doi.org/10.1001/jamainternmed.2015.5441.
15. Reid RO, Rabideau B, Sood N. Low-value health care services in a commercially insured population. JAMA Inter Med. 2016;176(10):1567-1571. https://doi.org/10.1001/jamainternmed.2016.5031.
16. Prochaska MT, Hohmann SF, Modes M, Arora VM. Trends in troponin-only testing for AMI in academic teaching hospitals and the impact of choosing wisely(R). J Hosp Med. 2017;12(12):957-962. https://doi.org/10.12788/jhm.2846.
17. Chua KP, Schwartz AL, Volerman A, Conti RM, Huang ES. Use of low-value pediatric services among the commercially insured. Pediatrics. 2016;138(6):e20161809. https://doi.org/10.1542/peds.2016-1809.
18. American Academy of Pediatrics Subcommittee on Diagnosis and Management of Bronchiolitis. Diagnosis and management of bronchiolitis. Pediatrics. 2006;118(4):1774-1793.
19. Colla CH, Kinsella EA, Morden NE, Meyers DJ, Rosenthal MB, Sequist TD. Physician perceptions of Choosing Wisely and drivers of overuse. Am J Manag Care. 2016;22(5):337-343.
20. PerryUndem Research/Communication AF. DataBrief: Findings from a National Survey of Physicians. http://www.choosingwisely.org/wp-content/uploads/2017/10/Summary-Research-Report-Survey-2017.pdf. Updated 2017.
21. Wolfson D. Choosing wisely recommendations using administrative claims data. JAMA Inter Med. 2016;176(4):565. https://doi.org/10.1001/jamainternmed.2016.0357.
22. Heekin AM, Kontor J, Sax HC, Keller M, Wellington A, Weingarten S. Choosing wisely clinical decision support adherence and associated patient outcomes. Am J Manag Care. 2018;24(8):361-366.
23. Ralston SL, Lieberthal AS, Meissner HC, et al. Clinical practice guideline: the diagnosis, management, and prevention of bronchiolitis. Pediatrics. 2014;134(5):e1474-e502. https://doi.org/10.1542/peds.2014-2742.
24. Ralston SL, Garber MD, Rice-Conboy E, et al. A multicenter collaborative to reduce unnecessary care in inpatient bronchiolitis. Pediatrics. 2016;137(1):e20150851. https://doi.org/10.1542/peds.2015-0851.
25. Mussman GM, Lossius M, Wasif F, et al. Multisite emergency department inpatient collaborative to reduce unnecessary bronchiolitis care. Pediatrics. 2018;141(2):e20170830. https://doi.org/10.1542/peds.2017-0830.
26. Mittal V, Hall M, Morse R, et al. Impact of inpatient bronchiolitis clinical practice guideline implementation on testing and treatment. J Pediatr. 2014;165(3):570-576. https://doi.org/10.1016/j.jpeds.2014.05.021.
27. Tyler A, Krack P, Bakel LA, et al. Interventions to reduce over-utilized tests and treatments in bronchiolitis. Pediatrics. 2018;141(6):e20170485. https://doi.org/10.1542/peds.2017-0485.
28. Rosen R, Vandenplas Y, Singendonk M, et al. Pediatric gastroesophageal reflux clinical practice guidelines: joint recommendations of the North American Society for Pediatric Gastroenterology, Hepatology, and Nutrition and the European Society for Pediatric Gastroenterology, Hepatology, and Nutrition. J Pediatr Gastroenterol Nutr. 2018;66(3):516-554. https://doi.org/10.1097/MPG.0b013e3181b7f563.
29. Eichenwald EC, COMMITTEE ON FETUS AND NEWBORN. Diagnosis and management of gastroesophageal reflux in preterm infants. Pediatrics. 2018;142(1):e20181061. https://doi.org/10.1542/peds.2018-1061
30. van der Pol RJ, Smits MJ, van Wijk MP, Omari TI, Tabbers MM, Benninga MA. Efficacy of proton-pump inhibitors in children with gastroesophageal reflux disease: a systematic review. Pediatrics. 2011;127(5):925-935. https://doi.org/10.1542/peds.2010-2719.
31. IOM Report: Estimated $750B Wasted Annually In Health Care System. Kaiser Health News Web site. https://khn.org/morning-breakout/iom-report/. Updated 2012. Accessed May 2019.
32. Leyenaar JK, Ralston SL, Shieh M, Pekow PS, Mangione‐Smith R, Lindenauer PK. Epidemiology of pediatric hospitalizations at general hospitals and freestanding children’s hospitals in the United States. J Hosp Med. 2016;11(11):743-749. https://doi.org/10.1002/jhm.2624.
33. Bernal JL, Cummins S, Gasparrini A. Interrupted time series regression for the evaluation of public health interventions: a tutorial. Int J Epidemiol. 2017;46(1):348-355. https://doi.org/10.1093/ije/dyw098.
The Choosing Wisely® Campaign (CWC) was launched in 2012. This ongoing national initiative encourages conversations among patients and clinicians about the need —or the lack thereof—for frequent tests, treatments, and procedures in healthcare. More than 80 professional societies have developed short lists of evidence-based recommendations aimed at avoiding unnecessary, “low-value” care. More than 550 recommendations are currently available.1 The Society of Hospital Medicine (SHM) Pediatric Committee published a list of five recommendations for the CWC in 2013.2
After seven years, the campaign has posted several success stories highlighting the increase in clinicians’ awareness about the recommendations. Several local, regional, and national initiatives and quality improvement (QI) projects have been inspired by the CWC and its tenants.1,3 However, limited research has been performed on the true impact of these recommendations on avoiding “low-value” services. A more comprehensive approach is required to “measure wisely” the impact of the campaign on bedside clinical practice.4 Stakeholders in healthcare value have been challenged to collaborate in creating high-impact lists of “low-value” interventions and designing effective tools to measure their impact on clinical practice and costs.5
We initially developed a report card with five metrics derived from the CWC-SHM pediatric recommendations to help individual institutions and group practices to measure their performance and benchmark their results with peers.6 The report card is available for hospital members of the Children’s Hospital Association (CHA).7
The current study analyzes the frequency of utilization and trends of five metrics included in the CHA/Pediatric Health Information System® (PHIS) CWC report card in tertiary children’s hospitals in the United States. We analyzed data from five years before and five years after the CWC-PHM recommendations were published in 2013. We hypothesize that the publication and dissemination of the CWC-PHM recommendations—the intervention—will result in either an immediate decrease in the use of the “low-value” services studied and/or a change in the trend of utilization over time.
METHODS
Study Design
We conducted an observational, longitudinal retrospective study aimed at evaluating the impact of the CWC-PHM recommendations on clinical practice in tertiary children’s hospitals in the US.
Study Population
The population included inpatient and observation stays for children aged 0-18 years admitted to the 36 children’s hospitals consistently providing data from 2008 to 2017 to the PHIS administrative database (CHA, Lenexa, Kansas). This database contains inpatient, emergency department, ambulatory, and observation encounter–level data from more than 50 not-for-profit, tertiary care pediatric hospitals and accounts for ~20% of all pediatric hospitalizations in the US every year.
A joint effort between the CHA and the participating hospitals ensures the quality of the data submitted, as previously described.8 These data are subjected to a routine quality check with each submission and within each report. Data were fully deidentified for this study. In total, 36 PHIS hospitals met the strict quality standards for inclusion of submitted data. The remaining hospitals were excluded because they did not have complete data or had incomplete billing information.
For external benchmarking purposes, PHIS participating hospitals provide encounter data, including demographics, diagnoses, and procedures (International Classification of Diseases versions 9 and 10).9,10 The transition from ICD-9 to ICD-10 in the US took place during the study period. However, the CHA completed a process of translating and mapping all ICD-9 codes to every possible equivalent ICD-10 code in the PHIS database. Thus, the change from ICD-9 to ICD-10 should not have had any significant effect on population definition and data analytics, including trend analysis.
For each condition, the study population was divided into the following two cohorts for comparison of the trends: all admissions from January 1, 2008 to December 31, 2012 (before) and all admissions from January 1, 2013 to December 31, 2017 (after) the CWC-PHM recommendations were published.
This study was determined to be nonhuman subject research and was therefore exempted by Nicklaus Children’s Hospital Human Research Protection Program.
Outcomes
The outcomes for this study were the percentages of patients receiving the not-recommended “low-value” services targeted by the CWC-PHM recommendations. For this purpose, four of the five recommendations were translated into the following five metrics, operationalized in the PHIS database and displayed in the “Choosing Wisely” report card:6
1. Percentage of patients with uncomplicated asthma receiving chest radiograph (CXR).
2. Percentage of patients with uncomplicated bronchiolitis receiving CXR.
3. Percentage of patients with uncomplicated bronchiolitis receiving bronchodilators.
4. Percentage of patients with lower respiratory tract infection (LRTI) receiving systemic corticosteroids (relievers).
5. Percentage of patients with uncomplicated gastroesophageal reflux (GER) receiving acid suppressor therapy.
The fifth recommendation—limiting the use of continuous pulse oximetry unless the patient is receiving supplemental oxygen—could not be operationalized in the PHIS database because of inconsistent reporting of these resources.6
The resulting percentages represent nonadherence to the recommendations, suggesting overuse of the specific “low-value” intervention. As such, a decreasing trend over time is the desired direction of improvement.
The definition of “uncomplicated” conditions and the metrics are presented in Table 1. A complete list of the inclusion and exclusion criteria to define “uncomplicated” conditions and the complete list of the clinical translation codes used in PHIS to identify the “low-value” services are presented as an electronic supplement.
Statistical Analyses
We compared the demographic and clinical characteristics of the various cohorts before and after the release of the CWC-PHM recommendations—the intervention—using chi-square statistics. To assess the individual hospital-level trends over time for each measure, we modeled the patient-level data of each hospital using generalized linear mixed effects models with a binomial distribution. These models were adjusted for patient demographic and clinical factors that were found to be significantly different (P < .01) before and after the intervention on bivariate analyses. From these models, we generated adjusted estimates for the quarterly percentages for each hospital. We then conducted an interrupted time series (ITS) using these estimates to compare trends in the five years before (2008-2012) and five years after (2013-2017) the publication of the CWC-PHM recommendations. For the ITS analysis, we used a generalized linear mixed effects model with the quarterly adjusted hospital-level utilization rates of “low-value” services for each cohort as the unit of analysis and a random intercept for each hospital. The model used an autoregressive(1) covariance structure to account for autocorrelation. The ITS allowed us to test our hypothesis by assessing the following two important features: (a) if a significant decrease occurred right after the CWC-PHM recommendations were published (level-change) and/or (b) if the intervention altered the secular trend (slope-change). All statistical analyses were performed using SAS v. 9.4 (SAS Institute, Cary, North Carolina), and P values <.01 were considered to be statistically significant.
RESULTS
Table 2 presents the demographic characteristics of the cohorts before (2008-2012) and after (2013-2017) the publication of the CWC-PHM recommendations. Hospitalizations due to asthma represented the largest cohort with 142,067 cases, followed by hospitalizations due to bronchiolitis with 94,253 cases. Hospitalizations due to GER comprised the smallest cohort with 13,635 cases. Most of the children had government insurance and had “minor” severity according to the All Patient Revised Diagnosis Related Group (APR-DRG) system.
We found statistically significant differences in most of the demographic characteristics for the cohorts when comparing cases before and after the introduction of the CWC-PHM recommendations.
After adjusting for demographic characteristics, we estimated the percentages of the utilization of the “low-value” services from 2008 to 2017. We observed a steady decrease in overutilization of all services over time. The absolute percentage decrease was more evident in the reduction of the utilization of relievers by 36.6% and that of CXR by 31.5% for bronchiolitis. We also observed a 20.8% absolute reduction in the use of CXR for asthma.
The use of systemic steroids in LRTI revealed the lowest utilization among the “low-value” services studied, with 15.1% in 2008 and 12.2% in 2017, a 2.9% absolute reduction. However, the prescription of acid suppressors for GER showed the highest utilization among all the overuse metrics studied, ie, 63% in 2008 and 48.9% in 2017, with an absolute decrease of 24.1%. The yearly adjusted estimated percentages of utilization for each “low-value” service are presented in Appendix Table A.
Table 3 and the Figure (attached as supplemental online graphic) respectively present the risk-adjusted ITS parameter estimates and the graphic representation before and after the inception of the CWC-PHM recommendations for the trend analysis.
During the five years preceding the intervention (2008-2012), a statistically significant decrease (P < .01) was already noted in the trend of utilization of relievers and CXR in bronchiolitis and CXR in asthma. However, we found no significant change in the trend of the use of systemic corticosteroids in cases with LRTI or the use of acid suppression therapy for GER.
The immediate effect of the intervention is represented by the level change. We found a statistically significant (P < .01) reduction according to the CWC-PHM recommendations only for the use of CXR in hospitalized children with uncomplicated asthma.
During the five years after the CWC-PHM recommendations were published (2013-2017), a sustained, significant decrease in the trend of the use of CXR in asthma and bronchiolitis and the use of relievers in bronchiolitis (P < .01) was observed. However, there was no significant change in the trend of the use of systemic corticosteroids in cases with LRTI or in the use of acid suppression therapy for GER during this period.
Comparison of the trends before and after the publication of the CWC-PHM recommendations revealed that only the decreasing trend in the use of relievers for bronchiolitis over time significantly correlated with the campaign (P < .01).
DISCUSSION
We found a steady reduction in the frequency of overutilization of five “low-value” services described in the CWC-PHM recommendations from 2008 to 2017 in 36 tertiary children’s hospitals in the US. This trend was more evident in the utilization of relievers and CXR for bronchiolitis. The ITS analysis demonstrated that immediately after the publication of the CWC-PHM recommendations, only the use of CXR for asthma decreased significantly. Then, only the use of relievers for bronchiolitis decreased significantly over time in comparison with the secular trend.
These results support our hypothesis for two of the five metrics studied, suggesting that the publication of the CWC-PHM recommendations had a modest impact in clinical practices related to those services in tertiary children’s hospitals.
These findings align with a limited number of published studies that have consistently found a modest decrease in the use of “low-value” services before 201211-13 and a limited impact of the CWC in clinical practices on the use of “low-value” services after the inception of the campaign.14-17
For instance, in a cross-sectional analysis of the 1999 and 2009 samples of ambulatory care practices in the US, only two of 11 overuse quality indicators showed improvement.11 The authors recognized that reducing inappropriate care will require the same attention to guideline development and performance measurement that was directed at reducing the underuse of needed therapies. However, determining whether a patient received inappropriate care generally requires a much more detailed analysis of clinical information than what is required for assessments of underuse.11
Another study designed claims-based algorithms to measure the prevalence of 11 Choosing Wisely-identified “low-value” services in fee-for-service Medicare patients aged >65 years from 2006 to 2011.12 The annual prevalence of selected CWC “low-value” services ranged from 1.2% (upper urinary tract imaging in men with benign prostatic hyperplasia) to 46.5% (preoperative cardiac testing for low-risk, noncardiac procedures). The study concluded that identifying and measuring “low-value” health services is a prerequisite for improving quality and eliminating waste.12
In pediatric medicine, the authors investigated a large cohort of infants aged one to 24 months hospitalized with bronchiolitis to 41 tertiary children’s hospitals reporting data to the PHIS database from 2004 to 2012.13 The trend analysis revealed a decrease in the utilization of diagnostics and treatment interventions before the publication of the American Academy of Pediatrics 2006 Bronchiolitis Guidelines.18 There was an additional reduction in the use of CXR, steroids, and bronchodilators after the publication of the guidelines.13
After the CWC was launched in 2012, several surveys have demonstrated a tangible increase in awareness of the CWC and its goals, mostly among primary care physicians and subspecialists. Clinicians who were aware of the campaign found the recommendations to be useful as a legitimate source of guidance and were more likely to reduce the indication of unnecessary care and “low-value” clinical services included in the CWC.1,3,19,20
Few studies in adults have focused on measuring the trends in overuse metrics derived from the CWC recommendations.14-16 The initial studies have found limited reduction on the use of “low-value” care after the inception of the CWC. They suggest that clinician education, awareness, and public promotion alone do not appear to be sufficient to achieve widespread changes in clinical practice. Additional interventions are necessary for the wider implementation and success of the CWC recommendations.11,14,15,19,21,22
However, a more recent study was conducted in 91 academic centers from 2013 through 2016, before and after the publication of a CWC recommendation on the use of troponin-only testing for the diagnosis of acute myocardial infarction. Hospitals with low rates of troponin-only testing before the publication of the recommendation demonstrated a statistically significant increase over time in the rate of adherence. The authors postulated that the impact of the CWC might have been significant because of the increase in the institutional and provider attention to “high-value” care as a result of the campaign.16
In pediatrics, a cross-sectional study defined 20 “low-value” services from a list of more than 400 items from the CWC and other sources of highly regarded, evidence-based pediatrics healthcare recommendations. The list included six diagnostic tests, five imaging tests, and nine prescription drugs ordered in a robust cohort of 4.4 million children nationwide in 2014. The study concluded that approximately one in 10 children received a “low-value” service. The majority (59.4%) were related to prescription drugs, specifically the inappropriate use of antibiotics for a variety of conditions. The estimated combined cost of these unnecessary services was approximately $27 million, with one-third of the cost being paid out of pocket, arguing for significant financial harm. However, this study did not perform a trend analysis.17
Our results are comparable with these studies, reporting an initial increase in awareness and beliefs, followed by progressive changes in clinical practice among pediatric hospital-based clinicians in delivering evidence-based, high-value care after the CWC.
The attribution of the steady reduction in the absolute percentages of overuse/waste in the five metrics related to the CWC observed in this study, including the significant changes noted in two of the overuse indicators after the publication of the CWC-PHM recommendations, should be interpreted with caution. For example, the significant decrease in the use of “low-value” services in bronchiolitis could be attributed to multiple factors such as national guidelines released in 2014 after the campaign,23 national multicenter QI collaborative projects,24,25 and multiple local QI efforts.26,27 The increase in the awareness and impact of the CWC recommendations among pediatric providers could also be a contributing factor, but this association cannot be established in the light of our findings.
On the other hand, despite extensive evidence for the lack of efficacy and the potential harm associated with the use of acid suppressors for uncomplicated GER in infants,28-30 the frequency of this “low-value” therapeutic intervention remains high (~50%). The trend in utilization was not impacted by the CWC-PHM recommendations. This finding could be explained by several factors, including the possibility that several hospitalized patients may suffer from GER disease requiring acid suppressors. Another possibility is that acid suppressors are generally prescribed as an outpatient medication, and physicians treating inpatients may be reluctant to discontinue it during hospitalization. Nevertheless, this recommendation represents a target for review, update, and QI interventions in the near future.
The delivery of inappropriate “low-value” care represents the most significant dimension of waste in healthcare.31 The development of quality measures of “low-value” services representing overuse and waste is the most needed step toward assessing the magnitude of the problem. Overuse metrics could be incorporated into QI interventions to decrease the provision of such services. However, systematic efforts aimed at developing quality indicators of overuse based on the CWC recommendations have been limited. To our knowledge, this is the first study on the trends of metrics derived from the CWC recommendations in pediatric medicine.
Future research is needed to develop overuse metrics further to assess the specific outcomes related to the implementation of the CWC. How much has clinical practice changed as a result of the campaign? What are the outcomes and savings attributable to these efforts? These are critical questions for the immediate future that should be answered to sustain the ongoing efforts and results and to validate that the efforts are worthwhile.
This study has several limitations. First, this is a retrospective and observational study. It cannot prove a direct causal relationship between the publication of the CWC-PHM and the observed trends, as other potential factors may have contributed to the outcomes. Second, in administrative databases, the data quality is dependent on proper documentation and coding that may vary among reporting institutions. These data lack clinical information, and a fair assessment of “appropriateness” could be questioned. In addition, the study included only 36 academic, tertiary children’s hospitals. Because approximately two-thirds of all pediatric hospitalizations in the US occur in community settings,32 this study may not fully represent clinical practice in the majority of pediatric hospitalizations in the US. Finally, the validity of the ITS analysis has inherent limitations due to the variability of the data in some metrics that may affect the power of the analysis. This fact could lead to inaccurate conclusions regarding intervention effectiveness due to the data-driven model applied, as well as the lack of control for other time-varying confounders.33
CONCLUSIONS
After seven years, the CWC faces important challenges. Critical to the success of the campaign is to “measure wisely” by developing quality indicators of overuse and operationalizing them into administrative and clinical data sources to assess the impact on clinical practice. Our study highlights some limited but steady reduction in the use of some “low-value” services before the campaign. It also demonstrates a modest impact of the campaign on clinical practices in tertiary care children’s hospitals in the US. Clinicians and institutions still have a long way to go in reducing the use of “low-value” interventions in pediatric medicine. These observations challenge us to step up our efforts to implement QI interventions aimed at incorporating these professional, society-endorsed recommendations into our clinical practice.
Acknowledgments
The authors thank Dr. Kristine De La Torre and Dr. Jennifer McCafferty-Fernandez and the Research Institute of Nicklaus Children’s Hospital for medical writing assistance. They also acknowledge Tatiana Consuegra, library technician, for her clerical assistance in the preparation and submission of this article.
1. Choosing Wisely. Choosing Wisely Campaign Official Site. http://www.choosingwisely.org/. Accessed May 2019.
2. Quinonez RA, Garber MD, Schroeder AR, et al. Choosing wisely in pediatric hospital medicine: five opportunities for improved healthcare value. J Hosp Med. 2013;8(9):479-485. https://doi.org/10.1002/jhm.2064.
3. ABIM Foundation CR. Choosing Wisely: A Special Report on the First Five Years. http://www.choosingwisely.org/choosing-wisely-a-special-report-on-the-first-five-years/. Updated 2017. Accessed May 2019.
4. Wolfson D, Santa J, Slass L. Engaging physicians and consumers in conversations about treatment overuse and waste: a short history of the choosing wisely campaign. Acad Med. 2014;89(7):990-995. https://doi.org/10.1097/ACM.0000000000000270.
5. Morden NE, Colla CH, Sequist TD, Rosenthal MB. Choosing wisely—the politics and economics of labeling low-value services. N Engl J Med. 2014;370(7):589-592. https://doi.org/10.1056/NEJMp1314965.
6. Reyes M, Paulus E, Hronek C, et al. Choosing wisely campaign: Report card and achievable benchmarks of care for children’s hospitals. Hosp Pediatr. 2017;7(11):633-641. https://doi.org/10.1542/hpeds.2017-0029.
7. Report Cards. Choosing Wisely Measures - Pediatric Hospital Medicine Detail Reports. Children’s Hospital Association Web site. https://www.childrenshospitals.org/. Accessed May 2019.
8. Mongelluzzo J, Mohamad Z, Ten Have TR, Shah SS. Corticosteroids and mortality in children with bacterial meningitis. JAMA. 2008;299(17):2048-2055. https://doi.org/10.1001/jama.299.17.2048.
9. Buck CJ. 2013 ICD 9 CM for Physicians, Volumes 1 & 2. Chicago, IL: American Medical Association; 2013.
10. Buck CJ. 2018 ICD-10-CM for Physicians. Chicago, IL: American Medical Association; 2018.
11. Kale MS, Bishop TF, Federman AD, Keyhani S. Trends in the overuse of ambulatory health care services in the United States. JAMA Inter Med. 2013;173(2):142-148. https://doi.org/10.1001/2013.jamainternmed.1022.
12. Colla CH, Morden NE, Sequist TD, Schpero WL, Rosenthal MB. Choosing wisely: Prevalence and correlates of low-value health care services in the United States. J Gen Intern Med. 2015;30(2):221-228. https://doi.org/10.1007/s11606-014-3070-z
13. Parikh K, Hall M, Teach SJ. Bronchiolitis management before and after the AAP guidelines. Pediatrics. 2014;133(1): e1-7. https://doi.org/10.1542/peds.2013-2005.
14. Rosenberg A, Agiro A, Gottlieb M, et al. Early trends among seven recommendations from the Choosing Wisely campaign. JAMA Inter Med. 2015;175(12):1913-1920. https://doi.org/10.1001/jamainternmed.2015.5441.
15. Reid RO, Rabideau B, Sood N. Low-value health care services in a commercially insured population. JAMA Inter Med. 2016;176(10):1567-1571. https://doi.org/10.1001/jamainternmed.2016.5031.
16. Prochaska MT, Hohmann SF, Modes M, Arora VM. Trends in troponin-only testing for AMI in academic teaching hospitals and the impact of choosing wisely(R). J Hosp Med. 2017;12(12):957-962. https://doi.org/10.12788/jhm.2846.
17. Chua KP, Schwartz AL, Volerman A, Conti RM, Huang ES. Use of low-value pediatric services among the commercially insured. Pediatrics. 2016;138(6):e20161809. https://doi.org/10.1542/peds.2016-1809.
18. American Academy of Pediatrics Subcommittee on Diagnosis and Management of Bronchiolitis. Diagnosis and management of bronchiolitis. Pediatrics. 2006;118(4):1774-1793.
19. Colla CH, Kinsella EA, Morden NE, Meyers DJ, Rosenthal MB, Sequist TD. Physician perceptions of Choosing Wisely and drivers of overuse. Am J Manag Care. 2016;22(5):337-343.
20. PerryUndem Research/Communication AF. DataBrief: Findings from a National Survey of Physicians. http://www.choosingwisely.org/wp-content/uploads/2017/10/Summary-Research-Report-Survey-2017.pdf. Updated 2017.
21. Wolfson D. Choosing wisely recommendations using administrative claims data. JAMA Inter Med. 2016;176(4):565. https://doi.org/10.1001/jamainternmed.2016.0357.
22. Heekin AM, Kontor J, Sax HC, Keller M, Wellington A, Weingarten S. Choosing wisely clinical decision support adherence and associated patient outcomes. Am J Manag Care. 2018;24(8):361-366.
23. Ralston SL, Lieberthal AS, Meissner HC, et al. Clinical practice guideline: the diagnosis, management, and prevention of bronchiolitis. Pediatrics. 2014;134(5):e1474-e502. https://doi.org/10.1542/peds.2014-2742.
24. Ralston SL, Garber MD, Rice-Conboy E, et al. A multicenter collaborative to reduce unnecessary care in inpatient bronchiolitis. Pediatrics. 2016;137(1):e20150851. https://doi.org/10.1542/peds.2015-0851.
25. Mussman GM, Lossius M, Wasif F, et al. Multisite emergency department inpatient collaborative to reduce unnecessary bronchiolitis care. Pediatrics. 2018;141(2):e20170830. https://doi.org/10.1542/peds.2017-0830.
26. Mittal V, Hall M, Morse R, et al. Impact of inpatient bronchiolitis clinical practice guideline implementation on testing and treatment. J Pediatr. 2014;165(3):570-576. https://doi.org/10.1016/j.jpeds.2014.05.021.
27. Tyler A, Krack P, Bakel LA, et al. Interventions to reduce over-utilized tests and treatments in bronchiolitis. Pediatrics. 2018;141(6):e20170485. https://doi.org/10.1542/peds.2017-0485.
28. Rosen R, Vandenplas Y, Singendonk M, et al. Pediatric gastroesophageal reflux clinical practice guidelines: joint recommendations of the North American Society for Pediatric Gastroenterology, Hepatology, and Nutrition and the European Society for Pediatric Gastroenterology, Hepatology, and Nutrition. J Pediatr Gastroenterol Nutr. 2018;66(3):516-554. https://doi.org/10.1097/MPG.0b013e3181b7f563.
29. Eichenwald EC, COMMITTEE ON FETUS AND NEWBORN. Diagnosis and management of gastroesophageal reflux in preterm infants. Pediatrics. 2018;142(1):e20181061. https://doi.org/10.1542/peds.2018-1061
30. van der Pol RJ, Smits MJ, van Wijk MP, Omari TI, Tabbers MM, Benninga MA. Efficacy of proton-pump inhibitors in children with gastroesophageal reflux disease: a systematic review. Pediatrics. 2011;127(5):925-935. https://doi.org/10.1542/peds.2010-2719.
31. IOM Report: Estimated $750B Wasted Annually In Health Care System. Kaiser Health News Web site. https://khn.org/morning-breakout/iom-report/. Updated 2012. Accessed May 2019.
32. Leyenaar JK, Ralston SL, Shieh M, Pekow PS, Mangione‐Smith R, Lindenauer PK. Epidemiology of pediatric hospitalizations at general hospitals and freestanding children’s hospitals in the United States. J Hosp Med. 2016;11(11):743-749. https://doi.org/10.1002/jhm.2624.
33. Bernal JL, Cummins S, Gasparrini A. Interrupted time series regression for the evaluation of public health interventions: a tutorial. Int J Epidemiol. 2017;46(1):348-355. https://doi.org/10.1093/ije/dyw098.
© 2019 Society of Hospital Medicine
Implementing Pediatric Asthma Pathways in Community Hospitals: A National Qualitative Study
Despite the widespread availability of evidence-based guidelines,1 there is inappropriate variation in the care and outcomes for children with asthma in both the emergency department (ED) and the inpatient setting.2-6 Operational versions of evidence-based guidelines known as “pathways” have been shown to improve adoption of evidence-based guidelines, quality of care, and health outcomes for children with asthma.7-14 However, little is known about how to successfully implement pathways outside of free-standing children’s hospitals.15-19
The majority of children with asthma in the United States are cared for in community hospitals, which provide services for both adults and children.20 However, prior studies of pediatric asthma pathways have largely excluded community hospitals. These studies primarily focused on determining clinical effectiveness, rather than detailing the implementation process. These approaches have left critical gaps that hinder our ability to implement pathways and improve care in community hospitals, which have unique barriers and less resources.21,22 Therefore, understanding the process of pathway implementation in community hospitals is critical to improving care for children.22 Our objective was to identify the key determinants of successful pediatric asthma pathway implementation using a national sample of community hospitals. This knowledge can guide hospital leaders and healthcare providers in efforts to improve pediatric care and outcomes in these settings.
METHODS
Study Setting, Design, and Population
In Fall 2017, the Value in Inpatient Pediatrics (VIP) network launched PIPA, Pathways to Improving Pediatric Asthma care.23 The VIP network, a part of the American Academy of Pediatrics (AAP), aims to improve the value of care delivered to any pediatric patient in a hospital bed, from rural to free-standing children’s hospitals.24 PIPA used a learning collaborative model25 and recruited local project leaders (physicians, nurses, respiratory therapists (RT), and pharmacists) from 89 hospitals around the country. PIPA provided these hospital teams with asthma pathways and several resources for implementation support, including educational meetings, quality improvement (QI) training, audit and feedback, and facilitation. Facilitation is a process of interactive problem-solving and support that occurs in the context of a supportive interpersonal relationship and a recognized need for improvement.26 A facilitator, or a “coach”, is an external expert who provides project mentorship and assists the process of making meaningful changes to improve patient care.26 Facilitation was provided by external consultants with QI expertise.
For this qualitative study, facilitators conducted semi-structured interviews with a convenience sample of project leaders from community hospitals participating in PIPA, with some interviews including multiple project leaders (eg, nursing, inpatient, and Emergency Department [ED] leaders). Verbal consent was obtained from all participants. No incentives were provided. This study was approved by the AAP institutional review board.
Data Collection
We used the constructs described in the Consolidated Framework for Implementation Research (CFIR)27 and adapted those salient to pediatric asthma pathways to develop an interview guide that was used with all participants (Appendix 1). The CFIR offers an overarching typology to understand what works where and why across five major domains that influence implementation: intervention characteristics, inner setting (hospital), outer setting (economic, political, and social context of the hospital), characteristics of the individuals involved, and the process of implementation. Data were collected across these domains to inform our analysis of the key determinants of pediatric asthma pathway implementation in community hospitals.
Interviews were conducted by phone from December 2017 to April 2018 (first four months of pathway implementation). Interviews lasted 30-60 minutes and were recorded and transcribed verbatim. Transcripts were edited for accuracy using the audio recordings. As data collection occurred concurrently with analysis, the interview guide was iteratively revised to reflect new insights and patterns that emerged from our analysis. All sites were anonymized in the data analysis. New interviews were coded until thematic saturation was reached.
Analysis
We conducted an inductive thematic analysis using the CFIR as our conceptual framework.28,29 Four investigators (CM, MJ, ES, and SK) performed the initial open coding of the data. Investigators met twice during the open coding process to develop and then finalize a codebook of standard definitions for codes. This codebook facilitated coding consistency through the remainder of the analytic process. Two investigators (CM and MJ) then independently read and coded all data to ensure intercoder reliability. During this process, CM and MJ met every two weeks to compare coding consistency, resolve discrepancies, and discuss preliminary findings. When the coding was complete, all investigators met to explore and develop themes that encompassed related common codes.
The CFIR was used at two stages of the study: (1) developing the interview guide and (2) cross-checking for any potentially important codes that were missing/needed to be explored further. Thus, the investigators maintained an inductive approach grounded in the data. To assure study rigor, we employed investigator triangulation (use of multiple investigators and participants from multiple clinical roles) and reflexivity (ongoing critique and critical reflection of the individual biases of the investigators).30 Coding was performed using Dedoose (version 7.0.23; Los Angeles, California).
RESULTS
A total of 34 community hospitals completed the PIPA project, of which the project leaders of 25 hospitals connected with the facilitators and were approached to participate; 18 (72%) hospitals’ project leaders participated in the study. We analyzed 18 interviews conducted between facilitators and project leaders, which included a total of 32 project leaders (one to five leaders per interview). The hospitals represented were diverse in geographic location and size (range 4-50 pediatric beds per hospital), and the majority of sites (78%) supported the trainees (Table 1).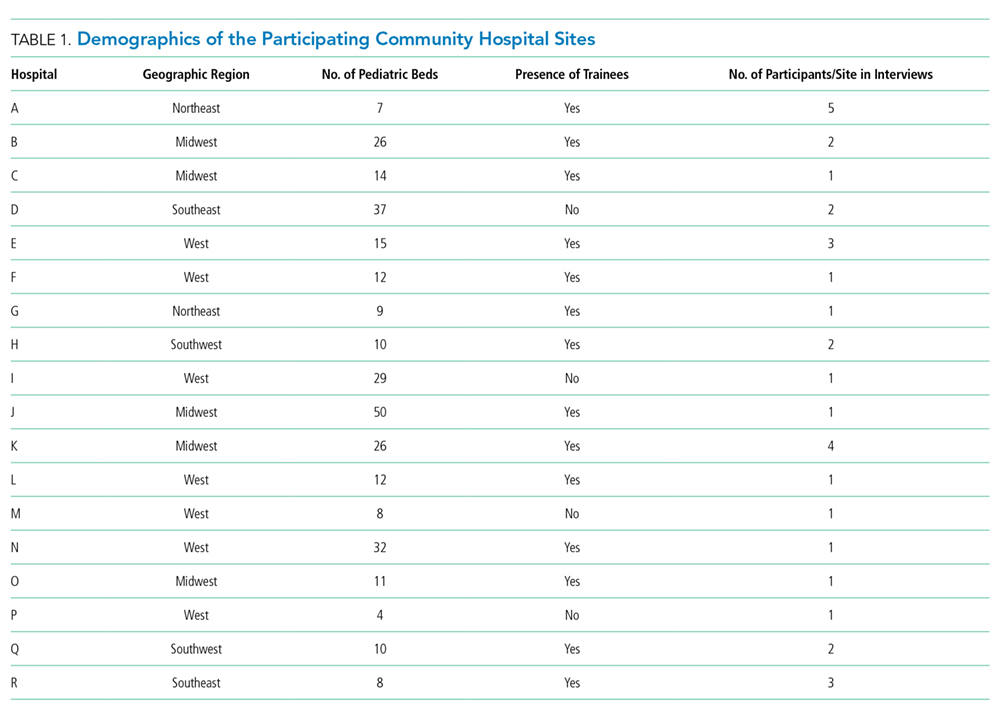
We identified four overarching themes that described the key determinants of pathway implementation in community hospitals. These themes are presented in order of their frequency of occurrence in the data. They included (1) building an implementation infrastructure, (2) engaging and motivating providers, (3) addressing organizational and resource limitations, and (4) devising implementation solutions with facilitators. Descriptions and exemplary quotations for each theme are provided in Table 2 and Appendix Figure 1.
Building an Implementation Infrastructure
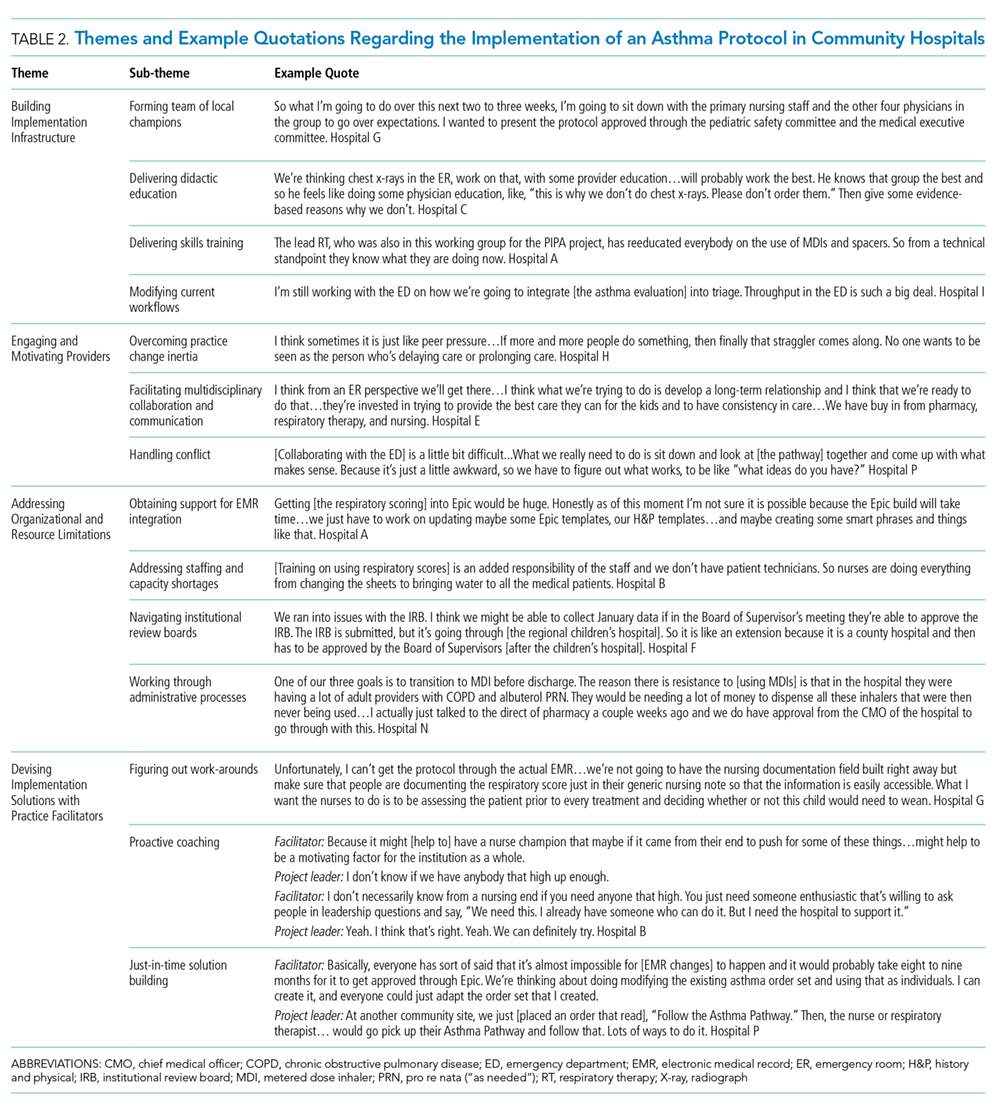
“So, I’m going to sit down with the primary nursing staff and the other four physicians in the group to go over the expectations…We’re not going to have the actual EMR [changes] and we’re not going to have the nursing documentation field built right away but [we want to] make sure that people are documenting the respiratory score in their generic nursing note so that the information is easily accessible.” (Physician leader, Hospital G)
Participants also described the need to deliver education on the evidence supporting changes in practice and skills training specific to pediatric asthma care:
“Once we realized that we were going to be doing this pathway, we started training our nurses on the inpatient side on [pediatric respiratory scoring].” (Nursing leader, Hospital P)
In addition, pathway implementation required modification of clinical workflows via changes to hospital policies or guidelines, electronic medical records (EMR), and/or the physical environment (eg, placing supplies in proximity to care delivery):
“I think it can help if we could get an order set or a nursing protocol where asthmatics over a certain severity can just get steroids in triage.” (Physician leader, Hospital A)
Engaging and Motivating Providers
Another crucial step in pathway implementation was engaging and motivating providers. This included overcoming inertia to practice change, facilitating multidisciplinary collaboration, and handling conflicts regarding practice changes. Participants discussed the excitement of participating in a national collaborative as especially motivating to help drive engagement and overcome barriers to change, particularly the ability to compare local hospital performance to national peers.
“I think everyone is a little competitive. So I think that when we see how we compare to other institutions—both our group and the ER—I think it also adds a little oomph…I think for our nurses too; we’re able to say, ‘[look how we compare to] most of the other hospitals.’ I think that helps.” (Physician leader, Hospital B)
Multidisciplinary collaboration across a wide variety of frontline pediatric and nonpediatric providers was key to understanding current workflows and identifying needed modifications for pathway implementation:
“I do think clearly our biggest obstacles are the fact that we have adult ED providers. We have the opportunity on the inpatient side [with nursing and respiratory therapy], who really do awesome with pediatric changes, to take our wins where we can and make the changes with the ED. In the ED we have an RN educator. She’s very on board with doing the respiratory scoring and getting this whole thing started.” (Physician leader, Hospital L)
Intentional communication and leadership skills also played key roles in engaging hesitant providers and handling conflict:
“Just sitting and talking with our respiratory therapist about the ability to provide this type of service or support and seeing what their reservations have been, at least it’s open to conversation so that we could provide these types of therapies in the future and we’re able to see like what people’s concerns are. I think just basically increasing familiarity with not only these processes, but different types of therapy will hopefully in the future help us provide better care to our patients.” (Physician leader, Hospital Q)
Addressing Organizational and Resource Limitations
Participants recognized organizational and resource limitations, some of which may be unique to community hospitals that prioritize resources for adult care. The limitations described included EMR staff support, healthcare provider staffing/capacity, navigating IRBs, and addressing administrative processes. Competing demands for information technology staff support and lack of prioritization of pediatric-specific initiatives often hindered efforts to modify the EMR.
“Resource wise, we are hoping to implement an order set in our Epic EMR, [but] finding the availability from the Epic team may be a challenge.” (Physician Leader, Hospital A)
Participants also reported that limited staff capacity (eg, nursing, RT) hindered pathway implementation efforts. This limited capacity hindered workflow changes and limited the time available for education and training on pathways:
“[Respiratory scoring for asthma is] an added responsibility for the [nursing] staff and we don’t have patient technicians. So they’re doing everything from changing the sheets to bringing water to all of the medical patients. So, that I think may be a barrier.” (Physician leader, Hospital B)
Across sites, navigating the IRB posed various challenges. Some sites were required to obtain approval from regional IRBs, which did not have resources to devote to pediatric projects. Other sites did not have IRBs at all, but instead required separate approvals for the project from hospital leadership or other entities:
“On the IRB, I contacted the manager of the IRB and she’s said, ‘No, it’s not an IRB project,’ but she sent it to another director for review, and it took forever to be able to get a data agreement with [the local university hospital] so that we can pull the data. I just couldn’t believe it took months to get done.” (Physician Leader, Hospital K)
Finally, administrative barriers such as addressing formulary changes in the context of adult-focused settings were challenging. For example, at one hospital, metered dose inhalers (MDIs) were not used for adult patients, and the hospital administration was resistant to incorporate their use into practice for pediatric patients due to the cost of such changes.
“The [general hospital] didn’t have MDI’s anymore because of cost reasons, and when we started the pediatric work, we really made it a point to get the MDI’s for pediatric patients back in the formulary.” (Physician leader, Hospital A)
Devising Implementation Solutions with Practice Facilitators
Participants often devised pathway implementation solutions with facilitators in-the-moment during meetings. This problem-solving included figuring out work-arounds, proactive coaching by external facilitators, and just-in-time solution building. Furthermore, in meetings that included more than one project leader, leaders would often work with each other to devise solutions. Meetings provided forums that stimulated identification of implementation barriers, brainstorming, and subsequently solution building.
Physician leader: I’m wondering if we could, as an interim solution, try out an algorithm on paper, I don’t know if that’s allowed, until we get Epic approval. Do you know?
Nurse Leader: You mean having an algorithm posted in triage? Yeah, I don’t see why not. (Hospital A)
Next, problem solving was often driven by the facilitator’s experience and knowledge, drawn from their interactions with other collaborative sites or their own prior experiences with asthma, QI, or pathway implementation. The facilitators brought an outside perspective, not bound by that particular hospital’s local culture or structural intricacies. This proactive coaching spurred the identification of creative, yet practical solutions:
Project Leader: We’re still trying to get all our templates [for the EMR]…because [currently they are] all adult templates.
Facilitator: If you’re making templates right now, could you also add the three asterisks? Like smoking or exposure to second hand tobacco smoke or marijuana…then have the three asterisks there and then “Referral made?***”. That would force people to document in a certain place in the template as well.Project Leader: That’s definitely something we could add right now. (Hospital O)
Check-in meetings with facilitators offered an opportunity to trouble shoot, brainstorm work-arounds, devise in-the-moment site-specific solutions to enable successful pathway implementation, and provide ongoing support throughout implementation.
DISCUSSION
Pathways can improve the quality of care for children with asthma.31 However, there is little evidence-based guidance on how to implement pathways and improve pediatric care in community hospitals,17-20 where the majority of children are cared for nationally. This is the first study to our knowledge that details the key determinants of pediatric asthma pathway implementation in community hospital settings. We identified four key determinants of implementation that can help guide others in similar settings. These include building an implementation infrastructure, engaging and motivating multidisciplinary providers, addressing organizational and resource limitations, and using external facilitators to devise implementation solutions.
Existing frameworks such as the CFIR outline the potential determinants of implementation success but do not provide population- or setting-specific guidance.27 There have been prior studies detailing pathway implementation for pediatric populations, but these studies did not focus on community hospitals.32,33 Our findings align with these prior studies, which highlight the importance of identifying implementation champions, engaging and motivating multidisciplinary providers, establishing a QI infrastructure, and addressing organizational and resource limitations, such as EMR integration.32,33 However, our study provides unique insights into issues that are important to successful pathway implementation in community hospitals, including engagement of adult-focused healthcare providers, reprioritization of resources toward the care of children, and the potentially critical role of external facilitators.
Our findings indicate that community hospitals seeking to improve care for children may particularly benefit from using external facilitators and/or partnering with external organizations. We found that external facilitators played a significant and proactive role in community hospitals’ efforts to improve care for children. Facilitators helped devise work-arounds and engaged in just-in-time solution building with local project leaders. For instance, facilitators helped develop strategies for training healthcare providers in performing new clinical tasks, building reminders of pathway recommendations into clinical workflows, and overcoming resource barriers. Thus, community hospitals may uniquely benefit from participation in national learning collaboratives, which often provide avenues for external facilitation.25,34,35 National networks, such as the VIP network, lead national learning collaboratives that provide external facilitation as well as other resources (eg, educational materials, data analysis support) to community hospitals seeking to improve pediatric care.24 Previous work by McDaniel et al. identified that intentional partnerships between children’s and community hospitals can also potentially provide access to resources for education and training in pediatric care and support in navigating organizational and resource challenges.22
Our results characterize the key determinants of pediatric asthma pathway implementation using a national sample of community hospitals that were diverse in geography, size, and structure. This imparts greater transferability of our findings. We also used strategies to promote the rigor of our findings, including triangulation and reflexivity. However, our study has several limitations. First, we analyzed only the meetings that occurred during the early months of pathway implementation. As such, we did not capture any key determinants that may have arisen later in implementation. However, process analyses of implementation indicate that the majority of implementation efforts occurred within these first three to four months.36 Second, we did not elicit input from hospital administration or leadership. The lack of administrative/leadership input probably affected the CFIR themes we found, as no themes from the outer setting were elicited. However, the goal of our study was to characterize the experiences of those leading implementation efforts, and focusing on these leaders allows our work to better guide those doing similar work in the future. Third, we used CFIR to guide the development of our interview guide and as a reference during analysis, which may have skewed our findings to preferentially reflect CFIR constructs. However, our overall analysis was grounded in the primary data and we employed reflexivity during all stages of our analysis. In addition, having the facilitators conduct the qualitative interviews may have biased our findings toward the perspectives of the facilitators; however, the facilitators represented quite diverse clinical and QI backgrounds. Finally, our findings do not necessarily correlate with improvements in clinical outcomes. As such, they are not meant to serve as explicit recommendations for improving patient outcomes, but rather as a characterization of the context, processes, and experiences of implementing pathways in the community setting to inform others doing this important work.
CONCLUSIONS
We identified the key determinants of pediatric asthma pathway implementation in community hospitals, which may help inform QI efforts in these settings. We also identified organizational and resource limitations that are probably unique to these adult-focused hospitals. Participating in national learning collaboratives and/or working with facilitators may support pathway implementation and improved quality of care for children with asthma in community hospitals.
Future work should seek to correlate these and other determinants of pathway implementation with health outcomes for hospitalized children, as well as integrate broader and more diverse samples of community hospitals.
1. National Asthma E, Prevention P. Expert Panel Report 3 (EPR-3): Guidelines for the diagnosis and management of asthma-summary report 2007. J Allergy Clin Immunol. 2007;120(5):S94-S138. https://doi.org/10.1016/j.jaci.2007.09.043.
2. Bekmezian A, Hersh AL, Maselli JH, Cabana MD. Pediatric emergency departments are more likely than general emergency departments to treat asthma exacerbation with systemic corticosteroids. J Asthma. 2011;48(1):69-74. https://doi.org/10.3109/02770903.2010.535884.
3. Biagini Myers JM, Simmons JM, Kercsmar CM, et al. Heterogeneity in asthma care in a statewide collaborative: the Ohio Pediatric Asthma Repository. Pediatrics. 2015;135(2):271-279. https://doi.org/10.1542/peds.2014-2230.
4. Kharbanda AB, Hall M, Shah SS, et al. Variation in resource utilization across a national sample of pediatric emergency departments. J Pediatr. 2013;163(1):230-236. https://doi.org/10.1016/j.jpeds.2012.12.013.
5. O’Con
6. Lougheed MD, Garvey N, Chapman KR, et al. Variations and gaps in management of acute asthma in Ontario emergency departments. Chest. 2009;135(3):724-736. https://doi.org/10.1378/chest.08-0371.
7. Bekmezian A, Fee C, Weber E. Clinical pathway improves pediatrics asthma management in the emergency department and reduces admissions. J Asthma. 2015;52(8):806-814. https://doi.org/10.3109/02770903.2015.1019086.
8. Chen KH, Chen CC, Liu HE, Tzeng PC, Glasziou PP. Effectiveness of paediatric asthma clinical pathways: a narrative systematic review. J Asthma. 2014;51(5):480-492. https://doi.org/10.3109/02770903.2014.887728.
9. Johnson KB, Blaisdell CJ, Walker A, Eggleston P. Effectiveness of a clinical pathway for inpatient asthma management. Pediatrics. 2000;106(5):1006-1012. https://doi.org/10.1542/peds.106.5.1006.
10. Kelly CS, Andersen CL, Pestian JP, et al. Improved outcomes for hospitalized asthmatic children using a clinical pathway. Ann Allergy Asthma Immunol. 2000;84(5):509-516. https://doi.org/10.1016/S1081-1206(10)62514-8.
11. McDowell KM, Chatburn RL, Myers TR, O’Riordan MA, Kercsmar CM. A cost-saving algorithm for children hospitalized for status asthmaticus. Arch Pediatr Adolesc Med. 1998;152(10):977-984. https://doi.org/10.1001/archpedi.152.10.977.
12. Miller AG, Breslin ME, Pineda LC, Fox JW. An asthma protocol improved adherence to evidence-based guidelines for pediatric subjects with status asthmaticus in the emergency department. Respir Care. 2015;60(12):1759-1764. https://doi.org/10.4187/respcare.04011.
13. Nkoy F, Fassl B, Stone B, et al. Improving pediatric asthma care and outcomes across multiple hospitals. Pediatrics. 2015;136(6):e1602-e1610. https://doi.org/10.1542/peds.2015-0285.
14. Rutman L, Atkins RC, Migita R, et al. Modification of an established pediatric asthma pathway improves evidence-based, efficient care. Pediatrics. 2016;138(6). https://doi.org/10.1542/peds.2016-1248.
15. Glauber JH, Farber HJ, Homer CJ. Asthma clinical pathways: toward what end? Pediatrics. 2001;107(3):590-592. https://doi.org/10.1542/peds.107.3.590.
16. Grimshaw J, Eccles M, Thomas R, et al. Toward evidence-based quality improvement. Evidence (and its limitations) of the effectiveness of guideline dissemination and implementation strategies 1966-1998. J Gen Intern Med. 2006;21(2):S14-S20. https://doi.org/10.1111/j.1525-1497.2006.00357.x.
17. Scott SD, Grimshaw J, Klassen TP, Nettel-Aguirre A, Johnson DW. Understanding implementation processes of clinical pathways and clinical practice guidelines in pediatric contexts: a study protocol. Implement Sci. 2011;6:133. https://doi.org/10.1186/1748-5908-6-133.
18. Walls TA, Hughes NT, Mullan PC, Chamberlain JM, Brown K. Improving pediatric asthma outcomes in a community emergency department. Pediatrics. 2017;139(1). https://doi.org/10.1542/peds.2016-0088.
19. Kaiser SV, Lam R, Cabana MD, et al. Best practices in implementing inpatient pediatric asthma pathways: a qualitative study. J Asthma. 2019:1-11. https://doi.org/10.1080/02770903.2019.1606237.
20. Leyenaar JK, Ralston SL, Shieh MS, Pekow PS, Mangione-Smith R, Lindenauer PK. Epidemiology of pediatric hospitalizations at general hospitals and freestanding children’s hospitals in the United States. J Hosp Med. 2016;11(11):743-749. https://doi.org/10.1002/jhm.2624.
21. Franca UL, McManus ML. Availability of definitive hospital care for children. JAMA Pediatr. 2017;171(9):e171096. https://doi.org/10.1001/jamapediatrics.2017.1096.
22. McDaniel CE, Jennings R, Schroeder AR, Paciorkowski N, Hofmann M, Leyenaar J. Aligning inpatient pediatric research with settings of care: a call to action. Pediatrics. 2019;143(5). https://doi.org/10.1542/peds.2018-2648.
23. Kaiser SV JB. Value in inpatient pediatrics network launches National Asthma Project. In: AAP Quality Connections 2018; 26:8-9. Retrieved from: https://www.aap.org/en-us/Documents/coqips_newsletter_2018_winter_26.pdf
24. Value in Inpatient Pediatrics. https://www.aap.org/en-us/professional-resources/quality-improvement/Pages/Value-in-Inpatient-Pediatrics.aspx. Accessed December 1, 2017.
25. The Breakthrough Series: IHI’s Collaborative Model for Achieving Breakthrough Improvement. IHI Innovation Series white paper. Boston: Institute for Healthcare Improvement; 2003. Retrieved from: www.IHI.org
26. Powell BJ, Waltz TJ, Chinman MJ, et al. A refined compilation of implementation strategies: results from the Expert Recommendations for Implementing Change (ERIC) project. Implement Sci. 2015;10:21. https://doi.org/10.1186/s13012-015-0209-1.
27. Damschroder LJ, Aron DC, Keith RE, Kirsh SR, Alexander JA, Lowery JC. Fostering implementation of health services research findings into practice: a consolidated framework for advancing implementation science. Implement Sci. 2009;4:50. https://doi.org/10.1186/1748-5908-4-50.
28. Braun VaC, V. Thematic analysis. In: H. Cooper PC, Long DL, Panter AT, Rindskopf E, Sher KJ, eds. APA handbook of research methods in psychology, Vol 2. Research designs: Quantitative, qualitative, neuropsychologial, and biological. Washington, DC, US: American Psychological Association; 2012. https://doi.org/10.1037/13620-000.
29. Charmaz K. Grounded Theory. 2nd ed. Thousand Oaks, CA: SAGE Publications; 2014.
30. Creswell JW, Poth CNCN CJaP. Qualitative Inquiry and Research Design: Choosing Among Five Approaches. Thousand Oaks, CA: Sage; 2017.
31. Kaiser SV, Rodean J, Bekmezian A, et al. Effectiveness of pediatric asthma pathways for hospitalized children: a multicenter, national analysis. J. Pediatr. 2018;197:165-171. https://doi.org/10.1016/j.jpeds.2018.01.084.
32. Leyenaar JK, Andrews CB, Tyksinski ER, Biondi E, Parikh K, Ralston S. Facilitators of interdepartmental quality improvement: a mixed-methods analysis of a collaborative to improve pediatric community-acquired pneumonia management. BMJ Qual Saf. 2019;28(3):215-222. https://doi.org/10.1136/bmjqs-2018-008065. 33. Ralston SL, Atwood EC, Garber MD, Holmes AV. What works to reduce unnecessary care for bronchiolitis? A qualitative analysis of a national collaborative. Acad Pediatr. 2017;17(2):198-204. https://doi.org/10.1016/j.acap.2016.07.001.
34. Parikh K, Biondi E, Nazif J, et al. A multicenter collaborative to improve care of community acquired pneumonia in hospitalized children. Pediatrics. 2017;139(2). https://doi.org/10.1542/peds.2016-1411.
35. Ralston S, Garber M, Narang S, et al. Decreasing unnecessary utilization in acute bronchiolitis care: results from the value in inpatient pediatrics network. J Hosp Med. 2013;8(1):25-30. https://doi.org/10.1002/jhm.1982.
36. Gupta N CA, Cabana MD, Jennings B, Parikh K, Kaiser SV. PIPA (Pathways for Improving Pediatric Asthma Care): Process Evaluation of a National Collaborative to Implement Pathways. Platform presented at Pediatric Academic Society National Meeting. Baltimore, Maryland; 2019.
Despite the widespread availability of evidence-based guidelines,1 there is inappropriate variation in the care and outcomes for children with asthma in both the emergency department (ED) and the inpatient setting.2-6 Operational versions of evidence-based guidelines known as “pathways” have been shown to improve adoption of evidence-based guidelines, quality of care, and health outcomes for children with asthma.7-14 However, little is known about how to successfully implement pathways outside of free-standing children’s hospitals.15-19
The majority of children with asthma in the United States are cared for in community hospitals, which provide services for both adults and children.20 However, prior studies of pediatric asthma pathways have largely excluded community hospitals. These studies primarily focused on determining clinical effectiveness, rather than detailing the implementation process. These approaches have left critical gaps that hinder our ability to implement pathways and improve care in community hospitals, which have unique barriers and less resources.21,22 Therefore, understanding the process of pathway implementation in community hospitals is critical to improving care for children.22 Our objective was to identify the key determinants of successful pediatric asthma pathway implementation using a national sample of community hospitals. This knowledge can guide hospital leaders and healthcare providers in efforts to improve pediatric care and outcomes in these settings.
METHODS
Study Setting, Design, and Population
In Fall 2017, the Value in Inpatient Pediatrics (VIP) network launched PIPA, Pathways to Improving Pediatric Asthma care.23 The VIP network, a part of the American Academy of Pediatrics (AAP), aims to improve the value of care delivered to any pediatric patient in a hospital bed, from rural to free-standing children’s hospitals.24 PIPA used a learning collaborative model25 and recruited local project leaders (physicians, nurses, respiratory therapists (RT), and pharmacists) from 89 hospitals around the country. PIPA provided these hospital teams with asthma pathways and several resources for implementation support, including educational meetings, quality improvement (QI) training, audit and feedback, and facilitation. Facilitation is a process of interactive problem-solving and support that occurs in the context of a supportive interpersonal relationship and a recognized need for improvement.26 A facilitator, or a “coach”, is an external expert who provides project mentorship and assists the process of making meaningful changes to improve patient care.26 Facilitation was provided by external consultants with QI expertise.
For this qualitative study, facilitators conducted semi-structured interviews with a convenience sample of project leaders from community hospitals participating in PIPA, with some interviews including multiple project leaders (eg, nursing, inpatient, and Emergency Department [ED] leaders). Verbal consent was obtained from all participants. No incentives were provided. This study was approved by the AAP institutional review board.
Data Collection
We used the constructs described in the Consolidated Framework for Implementation Research (CFIR)27 and adapted those salient to pediatric asthma pathways to develop an interview guide that was used with all participants (Appendix 1). The CFIR offers an overarching typology to understand what works where and why across five major domains that influence implementation: intervention characteristics, inner setting (hospital), outer setting (economic, political, and social context of the hospital), characteristics of the individuals involved, and the process of implementation. Data were collected across these domains to inform our analysis of the key determinants of pediatric asthma pathway implementation in community hospitals.
Interviews were conducted by phone from December 2017 to April 2018 (first four months of pathway implementation). Interviews lasted 30-60 minutes and were recorded and transcribed verbatim. Transcripts were edited for accuracy using the audio recordings. As data collection occurred concurrently with analysis, the interview guide was iteratively revised to reflect new insights and patterns that emerged from our analysis. All sites were anonymized in the data analysis. New interviews were coded until thematic saturation was reached.
Analysis
We conducted an inductive thematic analysis using the CFIR as our conceptual framework.28,29 Four investigators (CM, MJ, ES, and SK) performed the initial open coding of the data. Investigators met twice during the open coding process to develop and then finalize a codebook of standard definitions for codes. This codebook facilitated coding consistency through the remainder of the analytic process. Two investigators (CM and MJ) then independently read and coded all data to ensure intercoder reliability. During this process, CM and MJ met every two weeks to compare coding consistency, resolve discrepancies, and discuss preliminary findings. When the coding was complete, all investigators met to explore and develop themes that encompassed related common codes.
The CFIR was used at two stages of the study: (1) developing the interview guide and (2) cross-checking for any potentially important codes that were missing/needed to be explored further. Thus, the investigators maintained an inductive approach grounded in the data. To assure study rigor, we employed investigator triangulation (use of multiple investigators and participants from multiple clinical roles) and reflexivity (ongoing critique and critical reflection of the individual biases of the investigators).30 Coding was performed using Dedoose (version 7.0.23; Los Angeles, California).
RESULTS
A total of 34 community hospitals completed the PIPA project, of which the project leaders of 25 hospitals connected with the facilitators and were approached to participate; 18 (72%) hospitals’ project leaders participated in the study. We analyzed 18 interviews conducted between facilitators and project leaders, which included a total of 32 project leaders (one to five leaders per interview). The hospitals represented were diverse in geographic location and size (range 4-50 pediatric beds per hospital), and the majority of sites (78%) supported the trainees (Table 1).
We identified four overarching themes that described the key determinants of pathway implementation in community hospitals. These themes are presented in order of their frequency of occurrence in the data. They included (1) building an implementation infrastructure, (2) engaging and motivating providers, (3) addressing organizational and resource limitations, and (4) devising implementation solutions with facilitators. Descriptions and exemplary quotations for each theme are provided in Table 2 and Appendix Figure 1.
Building an Implementation Infrastructure
“So, I’m going to sit down with the primary nursing staff and the other four physicians in the group to go over the expectations…We’re not going to have the actual EMR [changes] and we’re not going to have the nursing documentation field built right away but [we want to] make sure that people are documenting the respiratory score in their generic nursing note so that the information is easily accessible.” (Physician leader, Hospital G)
Participants also described the need to deliver education on the evidence supporting changes in practice and skills training specific to pediatric asthma care:
“Once we realized that we were going to be doing this pathway, we started training our nurses on the inpatient side on [pediatric respiratory scoring].” (Nursing leader, Hospital P)
In addition, pathway implementation required modification of clinical workflows via changes to hospital policies or guidelines, electronic medical records (EMR), and/or the physical environment (eg, placing supplies in proximity to care delivery):
“I think it can help if we could get an order set or a nursing protocol where asthmatics over a certain severity can just get steroids in triage.” (Physician leader, Hospital A)
Engaging and Motivating Providers
Another crucial step in pathway implementation was engaging and motivating providers. This included overcoming inertia to practice change, facilitating multidisciplinary collaboration, and handling conflicts regarding practice changes. Participants discussed the excitement of participating in a national collaborative as especially motivating to help drive engagement and overcome barriers to change, particularly the ability to compare local hospital performance to national peers.
“I think everyone is a little competitive. So I think that when we see how we compare to other institutions—both our group and the ER—I think it also adds a little oomph…I think for our nurses too; we’re able to say, ‘[look how we compare to] most of the other hospitals.’ I think that helps.” (Physician leader, Hospital B)
Multidisciplinary collaboration across a wide variety of frontline pediatric and nonpediatric providers was key to understanding current workflows and identifying needed modifications for pathway implementation:
“I do think clearly our biggest obstacles are the fact that we have adult ED providers. We have the opportunity on the inpatient side [with nursing and respiratory therapy], who really do awesome with pediatric changes, to take our wins where we can and make the changes with the ED. In the ED we have an RN educator. She’s very on board with doing the respiratory scoring and getting this whole thing started.” (Physician leader, Hospital L)
Intentional communication and leadership skills also played key roles in engaging hesitant providers and handling conflict:
“Just sitting and talking with our respiratory therapist about the ability to provide this type of service or support and seeing what their reservations have been, at least it’s open to conversation so that we could provide these types of therapies in the future and we’re able to see like what people’s concerns are. I think just basically increasing familiarity with not only these processes, but different types of therapy will hopefully in the future help us provide better care to our patients.” (Physician leader, Hospital Q)
Addressing Organizational and Resource Limitations
Participants recognized organizational and resource limitations, some of which may be unique to community hospitals that prioritize resources for adult care. The limitations described included EMR staff support, healthcare provider staffing/capacity, navigating IRBs, and addressing administrative processes. Competing demands for information technology staff support and lack of prioritization of pediatric-specific initiatives often hindered efforts to modify the EMR.
“Resource wise, we are hoping to implement an order set in our Epic EMR, [but] finding the availability from the Epic team may be a challenge.” (Physician Leader, Hospital A)
Participants also reported that limited staff capacity (eg, nursing, RT) hindered pathway implementation efforts. This limited capacity hindered workflow changes and limited the time available for education and training on pathways:
“[Respiratory scoring for asthma is] an added responsibility for the [nursing] staff and we don’t have patient technicians. So they’re doing everything from changing the sheets to bringing water to all of the medical patients. So, that I think may be a barrier.” (Physician leader, Hospital B)
Across sites, navigating the IRB posed various challenges. Some sites were required to obtain approval from regional IRBs, which did not have resources to devote to pediatric projects. Other sites did not have IRBs at all, but instead required separate approvals for the project from hospital leadership or other entities:
“On the IRB, I contacted the manager of the IRB and she’s said, ‘No, it’s not an IRB project,’ but she sent it to another director for review, and it took forever to be able to get a data agreement with [the local university hospital] so that we can pull the data. I just couldn’t believe it took months to get done.” (Physician Leader, Hospital K)
Finally, administrative barriers such as addressing formulary changes in the context of adult-focused settings were challenging. For example, at one hospital, metered dose inhalers (MDIs) were not used for adult patients, and the hospital administration was resistant to incorporate their use into practice for pediatric patients due to the cost of such changes.
“The [general hospital] didn’t have MDI’s anymore because of cost reasons, and when we started the pediatric work, we really made it a point to get the MDI’s for pediatric patients back in the formulary.” (Physician leader, Hospital A)
Devising Implementation Solutions with Practice Facilitators
Participants often devised pathway implementation solutions with facilitators in-the-moment during meetings. This problem-solving included figuring out work-arounds, proactive coaching by external facilitators, and just-in-time solution building. Furthermore, in meetings that included more than one project leader, leaders would often work with each other to devise solutions. Meetings provided forums that stimulated identification of implementation barriers, brainstorming, and subsequently solution building.
Physician leader: I’m wondering if we could, as an interim solution, try out an algorithm on paper, I don’t know if that’s allowed, until we get Epic approval. Do you know?
Nurse Leader: You mean having an algorithm posted in triage? Yeah, I don’t see why not. (Hospital A)
Next, problem solving was often driven by the facilitator’s experience and knowledge, drawn from their interactions with other collaborative sites or their own prior experiences with asthma, QI, or pathway implementation. The facilitators brought an outside perspective, not bound by that particular hospital’s local culture or structural intricacies. This proactive coaching spurred the identification of creative, yet practical solutions:
Project Leader: We’re still trying to get all our templates [for the EMR]…because [currently they are] all adult templates.
Facilitator: If you’re making templates right now, could you also add the three asterisks? Like smoking or exposure to second hand tobacco smoke or marijuana…then have the three asterisks there and then “Referral made?***”. That would force people to document in a certain place in the template as well.Project Leader: That’s definitely something we could add right now. (Hospital O)
Check-in meetings with facilitators offered an opportunity to trouble shoot, brainstorm work-arounds, devise in-the-moment site-specific solutions to enable successful pathway implementation, and provide ongoing support throughout implementation.
DISCUSSION
Pathways can improve the quality of care for children with asthma.31 However, there is little evidence-based guidance on how to implement pathways and improve pediatric care in community hospitals,17-20 where the majority of children are cared for nationally. This is the first study to our knowledge that details the key determinants of pediatric asthma pathway implementation in community hospital settings. We identified four key determinants of implementation that can help guide others in similar settings. These include building an implementation infrastructure, engaging and motivating multidisciplinary providers, addressing organizational and resource limitations, and using external facilitators to devise implementation solutions.
Existing frameworks such as the CFIR outline the potential determinants of implementation success but do not provide population- or setting-specific guidance.27 There have been prior studies detailing pathway implementation for pediatric populations, but these studies did not focus on community hospitals.32,33 Our findings align with these prior studies, which highlight the importance of identifying implementation champions, engaging and motivating multidisciplinary providers, establishing a QI infrastructure, and addressing organizational and resource limitations, such as EMR integration.32,33 However, our study provides unique insights into issues that are important to successful pathway implementation in community hospitals, including engagement of adult-focused healthcare providers, reprioritization of resources toward the care of children, and the potentially critical role of external facilitators.
Our findings indicate that community hospitals seeking to improve care for children may particularly benefit from using external facilitators and/or partnering with external organizations. We found that external facilitators played a significant and proactive role in community hospitals’ efforts to improve care for children. Facilitators helped devise work-arounds and engaged in just-in-time solution building with local project leaders. For instance, facilitators helped develop strategies for training healthcare providers in performing new clinical tasks, building reminders of pathway recommendations into clinical workflows, and overcoming resource barriers. Thus, community hospitals may uniquely benefit from participation in national learning collaboratives, which often provide avenues for external facilitation.25,34,35 National networks, such as the VIP network, lead national learning collaboratives that provide external facilitation as well as other resources (eg, educational materials, data analysis support) to community hospitals seeking to improve pediatric care.24 Previous work by McDaniel et al. identified that intentional partnerships between children’s and community hospitals can also potentially provide access to resources for education and training in pediatric care and support in navigating organizational and resource challenges.22
Our results characterize the key determinants of pediatric asthma pathway implementation using a national sample of community hospitals that were diverse in geography, size, and structure. This imparts greater transferability of our findings. We also used strategies to promote the rigor of our findings, including triangulation and reflexivity. However, our study has several limitations. First, we analyzed only the meetings that occurred during the early months of pathway implementation. As such, we did not capture any key determinants that may have arisen later in implementation. However, process analyses of implementation indicate that the majority of implementation efforts occurred within these first three to four months.36 Second, we did not elicit input from hospital administration or leadership. The lack of administrative/leadership input probably affected the CFIR themes we found, as no themes from the outer setting were elicited. However, the goal of our study was to characterize the experiences of those leading implementation efforts, and focusing on these leaders allows our work to better guide those doing similar work in the future. Third, we used CFIR to guide the development of our interview guide and as a reference during analysis, which may have skewed our findings to preferentially reflect CFIR constructs. However, our overall analysis was grounded in the primary data and we employed reflexivity during all stages of our analysis. In addition, having the facilitators conduct the qualitative interviews may have biased our findings toward the perspectives of the facilitators; however, the facilitators represented quite diverse clinical and QI backgrounds. Finally, our findings do not necessarily correlate with improvements in clinical outcomes. As such, they are not meant to serve as explicit recommendations for improving patient outcomes, but rather as a characterization of the context, processes, and experiences of implementing pathways in the community setting to inform others doing this important work.
CONCLUSIONS
We identified the key determinants of pediatric asthma pathway implementation in community hospitals, which may help inform QI efforts in these settings. We also identified organizational and resource limitations that are probably unique to these adult-focused hospitals. Participating in national learning collaboratives and/or working with facilitators may support pathway implementation and improved quality of care for children with asthma in community hospitals.
Future work should seek to correlate these and other determinants of pathway implementation with health outcomes for hospitalized children, as well as integrate broader and more diverse samples of community hospitals.
1. National Asthma E, Prevention P. Expert Panel Report 3 (EPR-3): Guidelines for the diagnosis and management of asthma-summary report 2007. J Allergy Clin Immunol. 2007;120(5):S94-S138. https://doi.org/10.1016/j.jaci.2007.09.043.
2. Bekmezian A, Hersh AL, Maselli JH, Cabana MD. Pediatric emergency departments are more likely than general emergency departments to treat asthma exacerbation with systemic corticosteroids. J Asthma. 2011;48(1):69-74. https://doi.org/10.3109/02770903.2010.535884.
3. Biagini Myers JM, Simmons JM, Kercsmar CM, et al. Heterogeneity in asthma care in a statewide collaborative: the Ohio Pediatric Asthma Repository. Pediatrics. 2015;135(2):271-279. https://doi.org/10.1542/peds.2014-2230.
4. Kharbanda AB, Hall M, Shah SS, et al. Variation in resource utilization across a national sample of pediatric emergency departments. J Pediatr. 2013;163(1):230-236. https://doi.org/10.1016/j.jpeds.2012.12.013.
5. O’Con
6. Lougheed MD, Garvey N, Chapman KR, et al. Variations and gaps in management of acute asthma in Ontario emergency departments. Chest. 2009;135(3):724-736. https://doi.org/10.1378/chest.08-0371.
7. Bekmezian A, Fee C, Weber E. Clinical pathway improves pediatrics asthma management in the emergency department and reduces admissions. J Asthma. 2015;52(8):806-814. https://doi.org/10.3109/02770903.2015.1019086.
8. Chen KH, Chen CC, Liu HE, Tzeng PC, Glasziou PP. Effectiveness of paediatric asthma clinical pathways: a narrative systematic review. J Asthma. 2014;51(5):480-492. https://doi.org/10.3109/02770903.2014.887728.
9. Johnson KB, Blaisdell CJ, Walker A, Eggleston P. Effectiveness of a clinical pathway for inpatient asthma management. Pediatrics. 2000;106(5):1006-1012. https://doi.org/10.1542/peds.106.5.1006.
10. Kelly CS, Andersen CL, Pestian JP, et al. Improved outcomes for hospitalized asthmatic children using a clinical pathway. Ann Allergy Asthma Immunol. 2000;84(5):509-516. https://doi.org/10.1016/S1081-1206(10)62514-8.
11. McDowell KM, Chatburn RL, Myers TR, O’Riordan MA, Kercsmar CM. A cost-saving algorithm for children hospitalized for status asthmaticus. Arch Pediatr Adolesc Med. 1998;152(10):977-984. https://doi.org/10.1001/archpedi.152.10.977.
12. Miller AG, Breslin ME, Pineda LC, Fox JW. An asthma protocol improved adherence to evidence-based guidelines for pediatric subjects with status asthmaticus in the emergency department. Respir Care. 2015;60(12):1759-1764. https://doi.org/10.4187/respcare.04011.
13. Nkoy F, Fassl B, Stone B, et al. Improving pediatric asthma care and outcomes across multiple hospitals. Pediatrics. 2015;136(6):e1602-e1610. https://doi.org/10.1542/peds.2015-0285.
14. Rutman L, Atkins RC, Migita R, et al. Modification of an established pediatric asthma pathway improves evidence-based, efficient care. Pediatrics. 2016;138(6). https://doi.org/10.1542/peds.2016-1248.
15. Glauber JH, Farber HJ, Homer CJ. Asthma clinical pathways: toward what end? Pediatrics. 2001;107(3):590-592. https://doi.org/10.1542/peds.107.3.590.
16. Grimshaw J, Eccles M, Thomas R, et al. Toward evidence-based quality improvement. Evidence (and its limitations) of the effectiveness of guideline dissemination and implementation strategies 1966-1998. J Gen Intern Med. 2006;21(2):S14-S20. https://doi.org/10.1111/j.1525-1497.2006.00357.x.
17. Scott SD, Grimshaw J, Klassen TP, Nettel-Aguirre A, Johnson DW. Understanding implementation processes of clinical pathways and clinical practice guidelines in pediatric contexts: a study protocol. Implement Sci. 2011;6:133. https://doi.org/10.1186/1748-5908-6-133.
18. Walls TA, Hughes NT, Mullan PC, Chamberlain JM, Brown K. Improving pediatric asthma outcomes in a community emergency department. Pediatrics. 2017;139(1). https://doi.org/10.1542/peds.2016-0088.
19. Kaiser SV, Lam R, Cabana MD, et al. Best practices in implementing inpatient pediatric asthma pathways: a qualitative study. J Asthma. 2019:1-11. https://doi.org/10.1080/02770903.2019.1606237.
20. Leyenaar JK, Ralston SL, Shieh MS, Pekow PS, Mangione-Smith R, Lindenauer PK. Epidemiology of pediatric hospitalizations at general hospitals and freestanding children’s hospitals in the United States. J Hosp Med. 2016;11(11):743-749. https://doi.org/10.1002/jhm.2624.
21. Franca UL, McManus ML. Availability of definitive hospital care for children. JAMA Pediatr. 2017;171(9):e171096. https://doi.org/10.1001/jamapediatrics.2017.1096.
22. McDaniel CE, Jennings R, Schroeder AR, Paciorkowski N, Hofmann M, Leyenaar J. Aligning inpatient pediatric research with settings of care: a call to action. Pediatrics. 2019;143(5). https://doi.org/10.1542/peds.2018-2648.
23. Kaiser SV JB. Value in inpatient pediatrics network launches National Asthma Project. In: AAP Quality Connections 2018; 26:8-9. Retrieved from: https://www.aap.org/en-us/Documents/coqips_newsletter_2018_winter_26.pdf
24. Value in Inpatient Pediatrics. https://www.aap.org/en-us/professional-resources/quality-improvement/Pages/Value-in-Inpatient-Pediatrics.aspx. Accessed December 1, 2017.
25. The Breakthrough Series: IHI’s Collaborative Model for Achieving Breakthrough Improvement. IHI Innovation Series white paper. Boston: Institute for Healthcare Improvement; 2003. Retrieved from: www.IHI.org
26. Powell BJ, Waltz TJ, Chinman MJ, et al. A refined compilation of implementation strategies: results from the Expert Recommendations for Implementing Change (ERIC) project. Implement Sci. 2015;10:21. https://doi.org/10.1186/s13012-015-0209-1.
27. Damschroder LJ, Aron DC, Keith RE, Kirsh SR, Alexander JA, Lowery JC. Fostering implementation of health services research findings into practice: a consolidated framework for advancing implementation science. Implement Sci. 2009;4:50. https://doi.org/10.1186/1748-5908-4-50.
28. Braun VaC, V. Thematic analysis. In: H. Cooper PC, Long DL, Panter AT, Rindskopf E, Sher KJ, eds. APA handbook of research methods in psychology, Vol 2. Research designs: Quantitative, qualitative, neuropsychologial, and biological. Washington, DC, US: American Psychological Association; 2012. https://doi.org/10.1037/13620-000.
29. Charmaz K. Grounded Theory. 2nd ed. Thousand Oaks, CA: SAGE Publications; 2014.
30. Creswell JW, Poth CNCN CJaP. Qualitative Inquiry and Research Design: Choosing Among Five Approaches. Thousand Oaks, CA: Sage; 2017.
31. Kaiser SV, Rodean J, Bekmezian A, et al. Effectiveness of pediatric asthma pathways for hospitalized children: a multicenter, national analysis. J. Pediatr. 2018;197:165-171. https://doi.org/10.1016/j.jpeds.2018.01.084.
32. Leyenaar JK, Andrews CB, Tyksinski ER, Biondi E, Parikh K, Ralston S. Facilitators of interdepartmental quality improvement: a mixed-methods analysis of a collaborative to improve pediatric community-acquired pneumonia management. BMJ Qual Saf. 2019;28(3):215-222. https://doi.org/10.1136/bmjqs-2018-008065.33. Ralston SL, Atwood EC, Garber MD, Holmes AV. What works to reduce unnecessary care for bronchiolitis? A qualitative analysis of a national collaborative. Acad Pediatr. 2017;17(2):198-204. https://doi.org/10.1016/j.acap.2016.07.001.
34. Parikh K, Biondi E, Nazif J, et al. A multicenter collaborative to improve care of community acquired pneumonia in hospitalized children. Pediatrics. 2017;139(2). https://doi.org/10.1542/peds.2016-1411.
35. Ralston S, Garber M, Narang S, et al. Decreasing unnecessary utilization in acute bronchiolitis care: results from the value in inpatient pediatrics network. J Hosp Med. 2013;8(1):25-30. https://doi.org/10.1002/jhm.1982.
36. Gupta N CA, Cabana MD, Jennings B, Parikh K, Kaiser SV. PIPA (Pathways for Improving Pediatric Asthma Care): Process Evaluation of a National Collaborative to Implement Pathways. Platform presented at Pediatric Academic Society National Meeting. Baltimore, Maryland; 2019.
© 2020 Society of Hospital Medicine
Coordination of Care Between Primary Care and Oncology for Patients With Prostate Cancer (FULL)
The following is a lightly edited transcript of a teleconference recorded in July 2018. The teleconference brought together health care providers from the Greater Los Angeles VA Health Care System (GLAVAHCS) to discuss the real-world processes for managing the treatment of patients with prostate cancer as they move between primary and specialist care.
William J. Aronson, MD. We are fortunate in having a superb medical record system at the Department of Veterans Affairs (VA) where we can all communicate with each other through a number of methods. Let’s start our discussion by reviewing an index patient that we see in our practice who has been treated with either radical prostatectomy or radiation therapy. One question to address is: Is there a point when the Urology or Radiation Oncology service can transition the patient’s entire care back to the primary care team? And if so, what would be the optimal way to accomplish this?
Nick, is there some point at which you discharge the patient from the radiation oncology service and give specific directions to primary care, or is it primarily just back to urology in your case?
Nicholas G. Nickols, MD, PhD. I have not discharged any patient from my clinic after definitive prostate cancer treatment. During treatment, patients are seen every week. Subsequently, I see them 6 weeks posttreatment, and then every 4 months for the first year, then every 6 months for the next 4 years, and then yearly after that. Although I never formally discharged a patient from my clinic, you can see based on the frequency of visits, that the patient will see more often than their primary care provider (PCP) toward the beginning. And then, after some years, the patient sees their primary more than they me. So it’s not an immediate hand off but rather a gradual transition. It’s important that the PCP is aware of what to look for especially for the late recurrences, late potential side effects, probably more significantly than the early side effects, how to manage them when appropriate, and when to ask the patient to see our team more frequently in follow-up.
William Aronson. We have a number of patients who travel tremendous distances to see us, and I tend to think that many of our follow-up patients, once things are stabilized with regards to management of their side effects, really could see their primary care doctors if we can give them specific instructions on, for example, when to get a prostate-specific antigen (PSA) test and when to refer back to us.
Alison, can you think of some specific cases where you feel like we’ve successfully done that?
Alison Neymark, MS. For the most part we haven’t discharged people, either. What we have done is transitioned them over to a phone clinic. In our department, we have 4 nurse practitioners (NPs) who each have a half-day of phone clinic where they call patients with their test results. Some of those patients are prostate cancer patients that we have been following for years. We schedule them for a phone call, whether it’s every 3 months, every 6 months or every year, to review the updated PSA level and to just check in with them by phone. It’s a win-win because it’s a really quick phone call to reassure the veteran that the PSA level is being followed, and it frees up an in-person appointment slot for another veteran.
We still have patients that prefer face-to-face visits, even though they know we’re not doing anything except discussing a PSA level with them—they just want that security of seeing our face. Some patients are very nervous, and they don’t necessarily want to be discharged, so to speak, back to primary care. Also, for those patients that travel a long distance to clinic, we offer an appointment in the video chat clinic, with the community-based outpatient clinics in Bakersfield and Santa Maria, California.
PSA Levels
William Aronson. I probably see a patient about every 4 to 6 weeks who has a low PSA after about 10 years and has a long distance to travel and mobility and other problems that make it difficult to come in. 
The challenge that I have is, what is that specific guideline to give with regards to the rise in PSA? I think it all depends on the patients prostate cancer clinical features and comorbidities.
Nicholas Nickols. If a patient has been seen by me in follow-up a number of times and there’s really no active issues and there’s a low suspicion of recurrence, then I offer the patient the option of a phone follow-up as an alternative to face to face. Some of them accept that, but I ask that they agree to also see either urology or their PCP face to face. I will also remotely ensure that they’re getting the right laboratory tests, and if not, I’ll put those orders in.
With regard to when to refer a patient back for a suspected recurrence after definitive radiation therapy, there is an accepted definition of biochemical failure called the Phoenix definition, which is an absolute rise in 2 ng/mL of PSA over their posttreatment nadir. Often the posttreatment nadir, especially if they were on hormone therapy, will be close to 0. If the PSA gets to 2, that is a good trigger for a referral back to me and/or urology to discuss restaging and workup for a suspected recurrence.
For patients that are postsurgery and then subsequently get salvage radiation, it is not as clear when a restaging workup should be initiated. Currently, the imaging that is routine care is not very sensitive for detecting PSA in that setting until the PSA is around 0.8 ng/mL, and that’s with the most modern imaging available. Over time that may improve.
William Aronson. The other index patient to think about would be the patient who is on watchful waiting for their prostate cancer, which is to be distinguished from active surveillance. If someone’s on active surveillance, we’re regularly doing prostate biopsies and doing very close monitoring; but we also have patients who have multiple other medical problems, have a limited life expectancy, don’t have aggressive prostate cancer, and it’s extremely reasonable not to do a biopsy in those patients.
Again, those are patients where we do follow the PSA generally every 6 months. And I think there’s also scenarios there where it’s reasonable to refer back to primary care with specific instructions. These, again, are patients who had difficulty getting in to see us or have mobility issues, but it is also a way to limit patient visits if that’s their desire.
Peter Glassman, MBBS, MSc: I’m trained as both a general internist and board certified in hospice and palliative medicine. I currently provide primary care as well as palliative care. I view prostate cancer from the diagnosis through the treatment spectrum as a continuum. It starts with the PCP with an elevated PSA level or if the digital rectal exam has an abnormality, and then the role of the genitourinary (GU) practitioner becomes more significant during the active treatment and diagnostic phases.
Primary care doesn’t disappear, and I think there are 2 major issues that go along with that. First of all, we in primary care, because we take care of patients that often have other comorbidities, need to work with the patient on those comorbidities. Secondly, we need the information shared between the GU and primary care providers so that we can answer questions from our patients and have an understanding of what they’re going through and when.
As time goes on, we go through various phases: We may reach a cure, a quiescent period, active therapy, watchful waiting, or recurrence. Primary care gets involved as time goes on when the disease either becomes quiescent, is just being followed, or is considered cured. Clearly when you have watchful waiting, active treatment, or are in a recurrence, then GU takes the forefront.
I view it as a wave function. Primary care to GU with primary in smaller letters and then primary, if you will, in larger letters, GU becomes a lesser participant unless there is active therapy, watchful waiting or recurrence.
In doing a little bit of research, I found 2 very good and very helpful documents. One is the American Cancer Society (ACS) prostate cancer survivorship care guidelines (Box). And the other is a synopsis of the guidelines. What I liked was that the guidelines focused not only on what should be done for the initial period of prostate cancer, but also for many of the ancillary issues which we often don’t give voice to. The guidelines provide a structure, a foundation to work with our patients over time on their prostate cancer-related issues while, at the same time, being cognizant that we need to deal with their other comorbid conditions.
Modes of Communication
Alison Neymark. We find that including parameters for PSA monitoring in our Progress Notes in the electronic health record (EHR) the best way to communicate with other providers. We’ll say, “If PSA gets to this level, please refer back.” We try to make it clear because with the VA being a training facility, it could be a different resident/attending physician team that’s going to see the patient the next time he is in primary care.
Peter Glassman. Yes, we’re very lucky, as Bill talked about earlier and Alison just mentioned. We have the EHR, and Bill may remember this. Before the EHR, we were constantly fishing to find the most relevant notes. If a patient saw a GU practitioner the day before they saw me, I was often asking the patient what was said. Now we can just review the notes.
It’s a double-edged sword though because there are, of course, many notes in a medical record; and you have to look for the specific items. The EHR and documenting the medical record probably plays the primary role in getting information across. When you want to have an active handoff, or you need to communicate with each other, we have a variety of mechanisms, ranging from the phone to the Microsoft Skype Link (Redmond, WA) system that allows us to tap a message to a colleague.
And I’ve been here long enough that I’ve seen most permutations of how prostate cancer is diagnosed as well as shared among providers. Bill and I have shared patients. Alison and I have shared patients, not necessarily with prostate cancer, although that too. But we know how to communicate with each other. And of course, there’s paging if you need something more urgently.
William Aronson. We also use Microsoft Outlook e-mail, and encrypt the messages to keep them confidential and private. The other nice thing we have is there is a nationwide urology Outlook e-mail, so if any of us have any specific questions, through one e-mail we can send it around the country; and there’s usually multiple very useful responses. That’s another real strength of our system within the VA that helps patient care enormously.
Nicholas Nickols. Sometimes, if there’s a critical note that I absolutely want someone on the care team to read, I’ll add them as a cosigner; and that will pop up when they log in to the Computerized Patient Record System (CPRS) as something that they need to read.
If the patient lives particularly far or gets his care at another VA medical center and laboratory tests are needed, then I will reach out to their PCP via e-mail. If contact is not confirmed, I will reach out via phone or Skype.
Peter Glassman. The most helpful notes are those that are very specific as to what primary care is being asked to do and/or what urology is going to be doing. So, the more specific we get in the notes as to what is being addressed, I think that’s very helpful.
I have been here long enough that I’ve known both Alison and Bill; and if they have an issue, they will tap me a message. It wasn’t long ago that Bill sent a message to me, and we worked on a patient with prostate cancer who was going to be on long-term hormone therapy. We talked about osteoporosis management, and between us we worked out who was going to do what. Those are the kind of shared decision-making situations that are very, very helpful.
Alison Neymark. Also, GLAVAHCS has a home-based primary care team (HBPC), and a lot of the PCPs for that team are NPs. They know that they can contact me for their patients because a lot of those patients are on watchful waiting, and we do not necessarily need to see them face to face in clinic. Our urology team just needs to review updated lab results and how they are doing clinically. The HBPC NP who knows them best can contact me every 6 months or so, and we’ll discuss the case, which avoids making the patient come in, especially when they’re homebound. Those of us that have been working at the VA for many years have established good relationships. We feel very comfortable reaching out and talking to each other about these patients
Peter Glassman. Alison, I agree. When I can talk to my patients and say, “You know, we had that question about,” whatever the question might be, “and I contacted urology, and this is what they said.” It gives the patient confidence that we’re following up on the issues that they have and that we’re communicating with each other in a way that is to their benefit. And I think it’s very appreciated both by the provider as well as the patient.
William Aronson. Not infrequently I’ll have patients who have nonurologic issues, which I may first detect, or who have specific issues with their prostate cancer that can be comanaged. And I have found that when I send an encrypted e-mail to the PCP, it has been an extremely satisfying interaction; and we really get to the heart of the matter quickly for the sake of the veteran.
Veterans With Comorbidities
William Aronson. Posttraumatic stress disorder (PTSD) is a very significant and unique aspect of our patients, which is enormously important to recognize. For example, the side effects of prostate treatments can be very significant, whether radiation or surgery. Our patients understandably can be very fearful of the prostate cancer diagnosis and treatment side effects.
We know, for example, after a patient gets a diagnosis of prostate cancer, they’re at increased risk of cardiac death. That’s an especially important issue for our patients that there be an ongoing interaction between urology and primary care.
The ACS guidelines that Dr. Glassman referred to were enlightening. In many cases, primary care can look at the whole patient and their circumstances better than we can and may detect, for example, specific psychological issues that either they can manage or refer to other specialists.
Peter Glassman. One of the things that was highlighted in the ACS guideline is that in any population of men who have this disease, there’s going to be distress, anxiety, and full-fledged depression. Of course, there are psychosocial aspects of prostate cancer, such as sexual activity and intimacy with a partner that we often don’t explore but are probably playing an important role in the overall health of our patients. We need to be mindful of these psychosocial aspects and at least periodically ask them, “How are you doing with this? How are things at home?” And of course, we already use screeners for depression. As the article noted, distress and anxiety and other factors can make somebody’s life less optimal with poorer quality of life.
Dual Care Patients
Alison Neymark. Many patients whether they have Medicare, insurance through their spouse, or Kaiser Permanente through their job, choose to go to both places. The challenge is communicating with the non-VA providers because here at the VA we can communicate easily through Skype, Outlook e-mail, or CPRS, but for dual care patients who’s in charge? I encourage the veterans to choose whom they want to manage their care; we’re always here and happy to treat them, but they need to decide who’s in charge because I don’t want them to get into a situation where the differing opinions lead to a delay in care.
Nicholas Nickols. The communication when the patient is receiving care outside VA, either on a continuous basis or temporarily, is more of a challenge. We obviously can’t rely upon the messaging system, face-to-face contact is difficult, and they may not be able to use e-mail as well. So in those situations, usually a phone call is the best approach. I have found that the outside providers are happy to speak on the phone to coordinate care.
Peter Glassman. I agree, it does add a layer of complexity because we don’t readily have the notes, any information in front of us. That said, a lot of our patients can and do bring in information from outside specialists, and I’m hopeful that they share the information that we provide back to their outside doctors as well.
William Aronson. Some patient get nervous. They might decide they want care elsewhere, but they still want the VA available for them. I always let them know they should proceed in whatever way they prefer, but we’re always available and here for them. I try to empower them to make their own decisions and feel comfortable with them.
Nicholas Nickols. Notes from the outside, if they’re being referred for VA Choice or community care, do get uploaded into VistA Imaging and can be accessed, although it’s not instantaneous. Sometimes there’s a delay, but I have been able to access outside notes most of the time. If a patient goes through a clinic at the VA, the note is written in real time, and you can read it immediately.
Peter Glassman. That is true for patients that are within the VA system who receive contracted care either through Choice or through non-VA care that is contracted through VA. For somebody who is choosing to use 2 health care systems, that can provide more of a challenge because those notes don’t come to us. Over time, most of my patients have brought test results to me.
The thing with oncologic care, of course, is it’s a lot more complex. And it’s hard to know without reasonable documentation what’s been going on. At some level, you have to trust that the outside provider is doing whatever they need to do, or you have to take it upon yourself to do it within the system.
Alison Neymark. In my experience with the Choice Program, it really depends on the outside providers and how comfortable they are with the system that has been established to share records. Not all providers are going into that system and accessing it. I have had cases where I will see the non-VA provider’s note and it’ll say, “No documentation available for this consultation.” It just happens that they didn’t go into the system to review it. So it can be a challenge.
I’ve had good communication with the providers who use the system correctly. In some cases, just to make it easier, I will go ahead and communicate with them through encrypted e-mail, or I’ll talk to their care coordinators directly by phone. 
Peter Glassman. Many, if not most, PCPs are going to take care of these patients, certainly within the VA, with their GU colleagues. And most of us feel comfortable using the current documentation system in a way that allows us to share information or at least to gather information about these patients.
One of the things that I think came out for me in looking at this was that there are guidelines or there are ideas out there on how to take better care of these patients. And I for one learned a fair bit just by going through these documents, which I’m very appreciative of. But it does highlight to me that we can give good care and provide good shared care for prostate cancer survivors. I think that is something that perhaps this discussion will highlight that not only are people doing that, but there are resources they can utilize that will help them get a more comprehensive picture of taking care of prostate cancer survivors in the primary care clinic.
The beauty of the VA system as a system is that as these issues come up that might affect the overall health of the veteran with prostate cancer, for example, psychosocial issues, we have many people that can address this that are experts in their area. And one of the great beauties of having an all-encompassing healthcare system is being able to use resources within the system, whether that be for other medical problems or other social or other psychological issues, that we ourselves are not expert in. We can reach out to our other colleagues and ask them for assistance. We have that available to help the patients. It’s really holistic.
We even have integrated medicine where we can help patients, hopefully, get back into a healthy lifestyle, for example, whereas we may not have that expertise or knowledge. We often think of this as sort of a shared decision between GU and primary care. But, in fact, it’s really the responsibility of many, many people of the system at large. We are very lucky to have that.
The following is a lightly edited transcript of a teleconference recorded in July 2018. The teleconference brought together health care providers from the Greater Los Angeles VA Health Care System (GLAVAHCS) to discuss the real-world processes for managing the treatment of patients with prostate cancer as they move between primary and specialist care.
William J. Aronson, MD. We are fortunate in having a superb medical record system at the Department of Veterans Affairs (VA) where we can all communicate with each other through a number of methods. Let’s start our discussion by reviewing an index patient that we see in our practice who has been treated with either radical prostatectomy or radiation therapy. One question to address is: Is there a point when the Urology or Radiation Oncology service can transition the patient’s entire care back to the primary care team? And if so, what would be the optimal way to accomplish this?
Nick, is there some point at which you discharge the patient from the radiation oncology service and give specific directions to primary care, or is it primarily just back to urology in your case?
Nicholas G. Nickols, MD, PhD. I have not discharged any patient from my clinic after definitive prostate cancer treatment. During treatment, patients are seen every week. Subsequently, I see them 6 weeks posttreatment, and then every 4 months for the first year, then every 6 months for the next 4 years, and then yearly after that. Although I never formally discharged a patient from my clinic, you can see based on the frequency of visits, that the patient will see more often than their primary care provider (PCP) toward the beginning. And then, after some years, the patient sees their primary more than they me. So it’s not an immediate hand off but rather a gradual transition. It’s important that the PCP is aware of what to look for especially for the late recurrences, late potential side effects, probably more significantly than the early side effects, how to manage them when appropriate, and when to ask the patient to see our team more frequently in follow-up.
William Aronson. We have a number of patients who travel tremendous distances to see us, and I tend to think that many of our follow-up patients, once things are stabilized with regards to management of their side effects, really could see their primary care doctors if we can give them specific instructions on, for example, when to get a prostate-specific antigen (PSA) test and when to refer back to us.
Alison, can you think of some specific cases where you feel like we’ve successfully done that?
Alison Neymark, MS. For the most part we haven’t discharged people, either. What we have done is transitioned them over to a phone clinic. In our department, we have 4 nurse practitioners (NPs) who each have a half-day of phone clinic where they call patients with their test results. Some of those patients are prostate cancer patients that we have been following for years. We schedule them for a phone call, whether it’s every 3 months, every 6 months or every year, to review the updated PSA level and to just check in with them by phone. It’s a win-win because it’s a really quick phone call to reassure the veteran that the PSA level is being followed, and it frees up an in-person appointment slot for another veteran.
We still have patients that prefer face-to-face visits, even though they know we’re not doing anything except discussing a PSA level with them—they just want that security of seeing our face. Some patients are very nervous, and they don’t necessarily want to be discharged, so to speak, back to primary care. Also, for those patients that travel a long distance to clinic, we offer an appointment in the video chat clinic, with the community-based outpatient clinics in Bakersfield and Santa Maria, California.
PSA Levels
William Aronson. I probably see a patient about every 4 to 6 weeks who has a low PSA after about 10 years and has a long distance to travel and mobility and other problems that make it difficult to come in.
The challenge that I have is, what is that specific guideline to give with regards to the rise in PSA? I think it all depends on the patients prostate cancer clinical features and comorbidities.
Nicholas Nickols. If a patient has been seen by me in follow-up a number of times and there’s really no active issues and there’s a low suspicion of recurrence, then I offer the patient the option of a phone follow-up as an alternative to face to face. Some of them accept that, but I ask that they agree to also see either urology or their PCP face to face. I will also remotely ensure that they’re getting the right laboratory tests, and if not, I’ll put those orders in.
With regard to when to refer a patient back for a suspected recurrence after definitive radiation therapy, there is an accepted definition of biochemical failure called the Phoenix definition, which is an absolute rise in 2 ng/mL of PSA over their posttreatment nadir. Often the posttreatment nadir, especially if they were on hormone therapy, will be close to 0. If the PSA gets to 2, that is a good trigger for a referral back to me and/or urology to discuss restaging and workup for a suspected recurrence.
For patients that are postsurgery and then subsequently get salvage radiation, it is not as clear when a restaging workup should be initiated. Currently, the imaging that is routine care is not very sensitive for detecting PSA in that setting until the PSA is around 0.8 ng/mL, and that’s with the most modern imaging available. Over time that may improve.
William Aronson. The other index patient to think about would be the patient who is on watchful waiting for their prostate cancer, which is to be distinguished from active surveillance. If someone’s on active surveillance, we’re regularly doing prostate biopsies and doing very close monitoring; but we also have patients who have multiple other medical problems, have a limited life expectancy, don’t have aggressive prostate cancer, and it’s extremely reasonable not to do a biopsy in those patients.
Again, those are patients where we do follow the PSA generally every 6 months. And I think there’s also scenarios there where it’s reasonable to refer back to primary care with specific instructions. These, again, are patients who had difficulty getting in to see us or have mobility issues, but it is also a way to limit patient visits if that’s their desire.
Peter Glassman, MBBS, MSc: I’m trained as both a general internist and board certified in hospice and palliative medicine. I currently provide primary care as well as palliative care. I view prostate cancer from the diagnosis through the treatment spectrum as a continuum. It starts with the PCP with an elevated PSA level or if the digital rectal exam has an abnormality, and then the role of the genitourinary (GU) practitioner becomes more significant during the active treatment and diagnostic phases.
Primary care doesn’t disappear, and I think there are 2 major issues that go along with that. First of all, we in primary care, because we take care of patients that often have other comorbidities, need to work with the patient on those comorbidities. Secondly, we need the information shared between the GU and primary care providers so that we can answer questions from our patients and have an understanding of what they’re going through and when.
As time goes on, we go through various phases: We may reach a cure, a quiescent period, active therapy, watchful waiting, or recurrence. Primary care gets involved as time goes on when the disease either becomes quiescent, is just being followed, or is considered cured. Clearly when you have watchful waiting, active treatment, or are in a recurrence, then GU takes the forefront.
I view it as a wave function. Primary care to GU with primary in smaller letters and then primary, if you will, in larger letters, GU becomes a lesser participant unless there is active therapy, watchful waiting or recurrence.
In doing a little bit of research, I found 2 very good and very helpful documents. One is the American Cancer Society (ACS) prostate cancer survivorship care guidelines (Box). And the other is a synopsis of the guidelines. What I liked was that the guidelines focused not only on what should be done for the initial period of prostate cancer, but also for many of the ancillary issues which we often don’t give voice to. The guidelines provide a structure, a foundation to work with our patients over time on their prostate cancer-related issues while, at the same time, being cognizant that we need to deal with their other comorbid conditions.
Modes of Communication
Alison Neymark. We find that including parameters for PSA monitoring in our Progress Notes in the electronic health record (EHR) the best way to communicate with other providers. We’ll say, “If PSA gets to this level, please refer back.” We try to make it clear because with the VA being a training facility, it could be a different resident/attending physician team that’s going to see the patient the next time he is in primary care.
Peter Glassman. Yes, we’re very lucky, as Bill talked about earlier and Alison just mentioned. We have the EHR, and Bill may remember this. Before the EHR, we were constantly fishing to find the most relevant notes. If a patient saw a GU practitioner the day before they saw me, I was often asking the patient what was said. Now we can just review the notes.
It’s a double-edged sword though because there are, of course, many notes in a medical record; and you have to look for the specific items. The EHR and documenting the medical record probably plays the primary role in getting information across. When you want to have an active handoff, or you need to communicate with each other, we have a variety of mechanisms, ranging from the phone to the Microsoft Skype Link (Redmond, WA) system that allows us to tap a message to a colleague.
And I’ve been here long enough that I’ve seen most permutations of how prostate cancer is diagnosed as well as shared among providers. Bill and I have shared patients. Alison and I have shared patients, not necessarily with prostate cancer, although that too. But we know how to communicate with each other. And of course, there’s paging if you need something more urgently.
William Aronson. We also use Microsoft Outlook e-mail, and encrypt the messages to keep them confidential and private. The other nice thing we have is there is a nationwide urology Outlook e-mail, so if any of us have any specific questions, through one e-mail we can send it around the country; and there’s usually multiple very useful responses. That’s another real strength of our system within the VA that helps patient care enormously.
Nicholas Nickols. Sometimes, if there’s a critical note that I absolutely want someone on the care team to read, I’ll add them as a cosigner; and that will pop up when they log in to the Computerized Patient Record System (CPRS) as something that they need to read.
If the patient lives particularly far or gets his care at another VA medical center and laboratory tests are needed, then I will reach out to their PCP via e-mail. If contact is not confirmed, I will reach out via phone or Skype.
Peter Glassman. The most helpful notes are those that are very specific as to what primary care is being asked to do and/or what urology is going to be doing. So, the more specific we get in the notes as to what is being addressed, I think that’s very helpful.
I have been here long enough that I’ve known both Alison and Bill; and if they have an issue, they will tap me a message. It wasn’t long ago that Bill sent a message to me, and we worked on a patient with prostate cancer who was going to be on long-term hormone therapy. We talked about osteoporosis management, and between us we worked out who was going to do what. Those are the kind of shared decision-making situations that are very, very helpful.
Alison Neymark. Also, GLAVAHCS has a home-based primary care team (HBPC), and a lot of the PCPs for that team are NPs. They know that they can contact me for their patients because a lot of those patients are on watchful waiting, and we do not necessarily need to see them face to face in clinic. Our urology team just needs to review updated lab results and how they are doing clinically. The HBPC NP who knows them best can contact me every 6 months or so, and we’ll discuss the case, which avoids making the patient come in, especially when they’re homebound. Those of us that have been working at the VA for many years have established good relationships. We feel very comfortable reaching out and talking to each other about these patients
Peter Glassman. Alison, I agree. When I can talk to my patients and say, “You know, we had that question about,” whatever the question might be, “and I contacted urology, and this is what they said.” It gives the patient confidence that we’re following up on the issues that they have and that we’re communicating with each other in a way that is to their benefit. And I think it’s very appreciated both by the provider as well as the patient.
William Aronson. Not infrequently I’ll have patients who have nonurologic issues, which I may first detect, or who have specific issues with their prostate cancer that can be comanaged. And I have found that when I send an encrypted e-mail to the PCP, it has been an extremely satisfying interaction; and we really get to the heart of the matter quickly for the sake of the veteran.
Veterans With Comorbidities
William Aronson. Posttraumatic stress disorder (PTSD) is a very significant and unique aspect of our patients, which is enormously important to recognize. For example, the side effects of prostate treatments can be very significant, whether radiation or surgery. Our patients understandably can be very fearful of the prostate cancer diagnosis and treatment side effects.
We know, for example, after a patient gets a diagnosis of prostate cancer, they’re at increased risk of cardiac death. That’s an especially important issue for our patients that there be an ongoing interaction between urology and primary care.
The ACS guidelines that Dr. Glassman referred to were enlightening. In many cases, primary care can look at the whole patient and their circumstances better than we can and may detect, for example, specific psychological issues that either they can manage or refer to other specialists.
Peter Glassman. One of the things that was highlighted in the ACS guideline is that in any population of men who have this disease, there’s going to be distress, anxiety, and full-fledged depression. Of course, there are psychosocial aspects of prostate cancer, such as sexual activity and intimacy with a partner that we often don’t explore but are probably playing an important role in the overall health of our patients. We need to be mindful of these psychosocial aspects and at least periodically ask them, “How are you doing with this? How are things at home?” And of course, we already use screeners for depression. As the article noted, distress and anxiety and other factors can make somebody’s life less optimal with poorer quality of life.
Dual Care Patients
Alison Neymark. Many patients whether they have Medicare, insurance through their spouse, or Kaiser Permanente through their job, choose to go to both places. The challenge is communicating with the non-VA providers because here at the VA we can communicate easily through Skype, Outlook e-mail, or CPRS, but for dual care patients who’s in charge? I encourage the veterans to choose whom they want to manage their care; we’re always here and happy to treat them, but they need to decide who’s in charge because I don’t want them to get into a situation where the differing opinions lead to a delay in care.
Nicholas Nickols. The communication when the patient is receiving care outside VA, either on a continuous basis or temporarily, is more of a challenge. We obviously can’t rely upon the messaging system, face-to-face contact is difficult, and they may not be able to use e-mail as well. So in those situations, usually a phone call is the best approach. I have found that the outside providers are happy to speak on the phone to coordinate care.
Peter Glassman. I agree, it does add a layer of complexity because we don’t readily have the notes, any information in front of us. That said, a lot of our patients can and do bring in information from outside specialists, and I’m hopeful that they share the information that we provide back to their outside doctors as well.
William Aronson. Some patient get nervous. They might decide they want care elsewhere, but they still want the VA available for them. I always let them know they should proceed in whatever way they prefer, but we’re always available and here for them. I try to empower them to make their own decisions and feel comfortable with them.
Nicholas Nickols. Notes from the outside, if they’re being referred for VA Choice or community care, do get uploaded into VistA Imaging and can be accessed, although it’s not instantaneous. Sometimes there’s a delay, but I have been able to access outside notes most of the time. If a patient goes through a clinic at the VA, the note is written in real time, and you can read it immediately.
Peter Glassman. That is true for patients that are within the VA system who receive contracted care either through Choice or through non-VA care that is contracted through VA. For somebody who is choosing to use 2 health care systems, that can provide more of a challenge because those notes don’t come to us. Over time, most of my patients have brought test results to me.
The thing with oncologic care, of course, is it’s a lot more complex. And it’s hard to know without reasonable documentation what’s been going on. At some level, you have to trust that the outside provider is doing whatever they need to do, or you have to take it upon yourself to do it within the system.
Alison Neymark. In my experience with the Choice Program, it really depends on the outside providers and how comfortable they are with the system that has been established to share records. Not all providers are going into that system and accessing it. I have had cases where I will see the non-VA provider’s note and it’ll say, “No documentation available for this consultation.” It just happens that they didn’t go into the system to review it. So it can be a challenge.
I’ve had good communication with the providers who use the system correctly. In some cases, just to make it easier, I will go ahead and communicate with them through encrypted e-mail, or I’ll talk to their care coordinators directly by phone.
Peter Glassman. Many, if not most, PCPs are going to take care of these patients, certainly within the VA, with their GU colleagues. And most of us feel comfortable using the current documentation system in a way that allows us to share information or at least to gather information about these patients.
One of the things that I think came out for me in looking at this was that there are guidelines or there are ideas out there on how to take better care of these patients. And I for one learned a fair bit just by going through these documents, which I’m very appreciative of. But it does highlight to me that we can give good care and provide good shared care for prostate cancer survivors. I think that is something that perhaps this discussion will highlight that not only are people doing that, but there are resources they can utilize that will help them get a more comprehensive picture of taking care of prostate cancer survivors in the primary care clinic.
The beauty of the VA system as a system is that as these issues come up that might affect the overall health of the veteran with prostate cancer, for example, psychosocial issues, we have many people that can address this that are experts in their area. And one of the great beauties of having an all-encompassing healthcare system is being able to use resources within the system, whether that be for other medical problems or other social or other psychological issues, that we ourselves are not expert in. We can reach out to our other colleagues and ask them for assistance. We have that available to help the patients. It’s really holistic.
We even have integrated medicine where we can help patients, hopefully, get back into a healthy lifestyle, for example, whereas we may not have that expertise or knowledge. We often think of this as sort of a shared decision between GU and primary care. But, in fact, it’s really the responsibility of many, many people of the system at large. We are very lucky to have that.
Cognitive Biases Influence Decision-Making Regarding Postacute Care in a Skilled Nursing Facility
The combination of decreasing hospital lengths of stay and increasing age and comorbidity of the United States population is a principal driver of the increased use of postacute care in the US.1-3 Postacute care refers to care in long-term acute care hospitals, inpatient rehabilitation facilities, skilled nursing facilities (SNFs), and care provided by home health agencies after an acute hospitalization. In 2016, 43% of Medicare beneficiaries received postacute care after hospital discharge at the cost of $60 billion annually; nearly half of these received care in an SNF.4 Increasing recognition of the significant cost and poor outcomes of postacute care led to payment reforms, such as bundled payments, that incentivized less expensive forms of postacute care and improvements in outcomes.5-9 Early evaluations suggested that hospitals are sensitive to these reforms and responded by significantly decreasing SNF utilization.10,11 It remains unclear whether this was safe and effective.
In this context, increased attention to how hospital clinicians and hospitalized patients decide whether to use postacute care (and what form to use) is appropriate since the effect of payment reforms could negatively impact vulnerable populations of older adults without adequate protection.12 Suboptimal decision-making can drive both overuse and inappropriate underuse of this expensive medical resource. Initial evidence suggests that patients and clinicians are poorly equipped to make high-quality decisions about postacute care, with significant deficits in both the decision-making process and content.13-16 While these gaps are important to address, they may only be part of the problem. The fields of cognitive psychology and behavioral economics have revealed new insights into decision-making, demonstrating that people deviate from rational decision-making in predictable ways, termed decision heuristics, or cognitive biases.17 This growing field of research suggests heuristics or biases play important roles in decision-making and determining behavior, particularly in situations where there may be little information provided and the patient is stressed, tired, and ill—precisely like deciding on postacute care.18 However, it is currently unknown whether cognitive biases are at play when making hospital discharge decisions.
We sought to identify the most salient heuristics or cognitive biases patients may utilize when making decisions about postacute care at the end of their hospitalization and ways clinicians may contribute to these biases. The overall goal was to derive insights for improving postacute care decision-making.
METHODS
Study Design
We conducted a secondary analysis on interviews with hospital and SNF clinicians as well as patients and their caregivers who were either leaving the hospital for an SNF or newly arrived in an SNF from the hospital to understand if cognitive biases were present and how they manifested themselves in a real-world clinical context.19 These interviews were part of a larger qualitative study that sought to understand how clinicians, patients, and their caregivers made decisions about postacute care, particularly related to SNFs.13,14 This study represents the analysis of all our interviews, specifically examining decision-making bias. Participating sites, clinical roles, and both patient and caregiver characteristics (Table 1) in our cohort have been previously described.13,14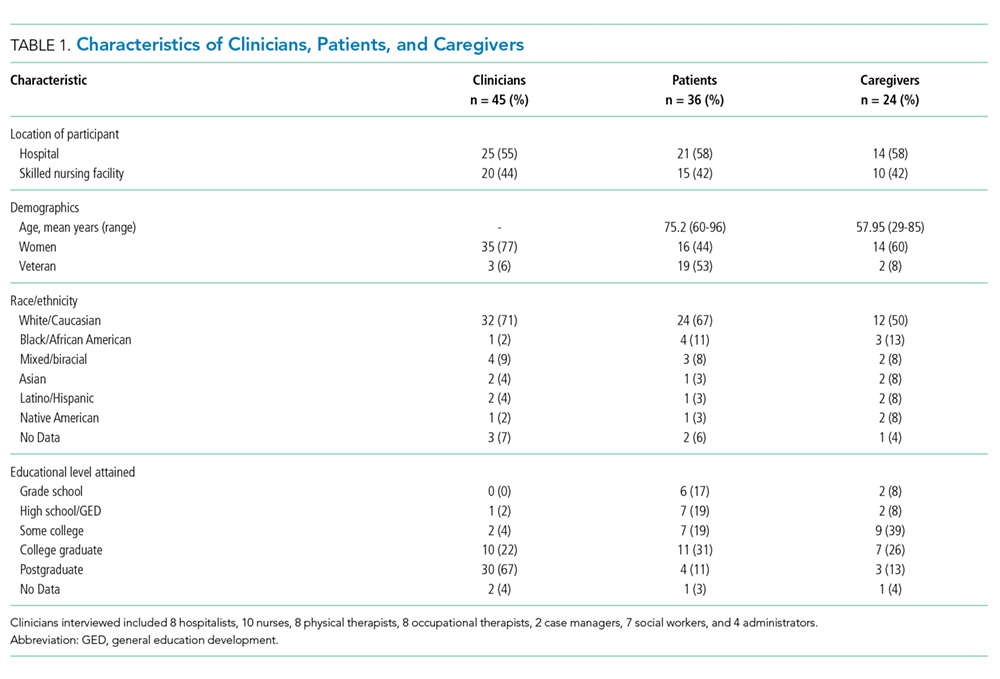
Analysis
We used a team-based approach to framework analysis, which has been used in other decision-making studies14, including those measuring cognitive bias.20 A limitation in cognitive bias research is the lack of a standardized list or categorization of cognitive biases. We reviewed prior systematic17,21 and narrative reviews18,22, as well as prior studies describing examples of cognitive biases playing a role in decision-making about therapy20 to construct a list of possible cognitive biases to evaluate and narrow these a priori to potential biases relevant to the decision about postacute care based on our prior work (Table 2).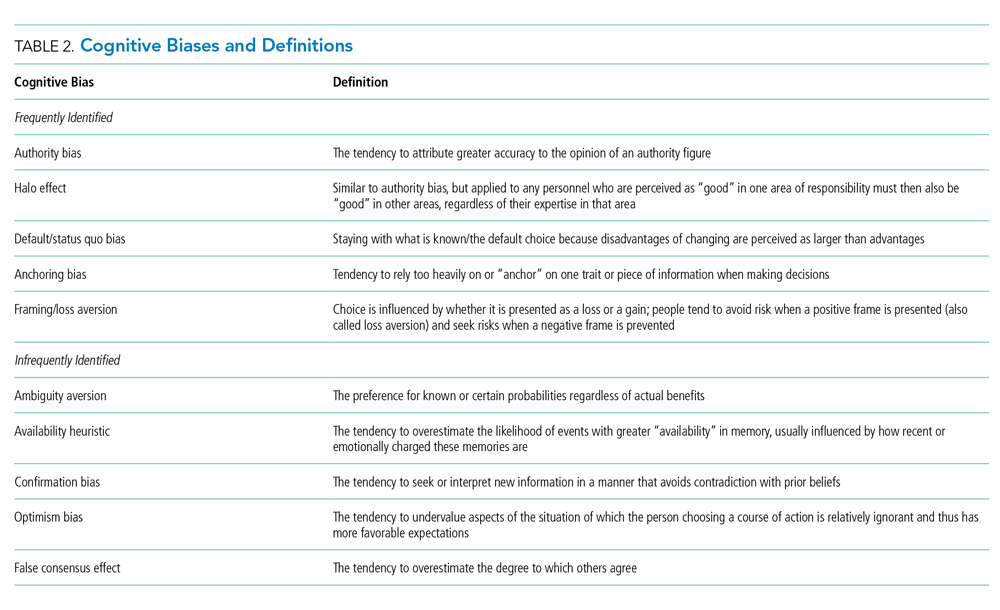
We applied this framework to analyze transcripts through an iterative process of deductive coding and reviewing across four reviewers (ML, RA, AL, CL) and a hospitalist physician with expertise leading qualitative studies (REB).
Intercoder consensus was built through team discussion by resolving points of disagreement.23 Consistency of coding was regularly checked by having more than one investigator code individual manuscripts and comparing coding, and discrepancies were resolved through team discussion. We triangulated the data (shared our preliminary results) using a larger study team, including an expert in behavioral economics (SRG), physicians at study sites (EC, RA), and an anthropologist with expertise in qualitative methods (CL). We did this to ensure credibility (to what extent the findings are credible or believable) and confirmability of findings (ensuring the findings are based on participant narratives rather than researcher biases).
RESULTS
We reviewed a total of 105 interviews with 25 hospital clinicians, 20 SNF clinicians, 21 patients and 14 caregivers in the hospital, and 15 patients and 10 caregivers in the SNF setting (Table 1). We found authority bias/halo effect; default/status quo bias, anchoring bias, and framing was commonly present in decision-making about postacute care in a SNF, whereas there were few if any examples of ambiguity aversion, availability heuristic, confirmation bias, optimism bias, or false consensus effect (Table 2).
Authority Bias/Halo Effect
While most patients deferred to their inpatient teams when it came to decision-making, this effect seemed to differ across VA and non-VA settings. Veterans expressed a higher degree of potential authority bias regarding the VA as an institution, whereas older adults in non-VA settings saw physicians as the authority figure making decisions in their best interests.
Veterans expressed confidence in the VA regarding both whether to go to a SNF and where to go:
“The VA wouldn’t license [an SNF] if they didn’t have a good reputation for care, cleanliness, things of that nature” (Veteran, VA CLC)
“I just knew the VA would have my best interests at heart” (Veteran, VA CLC)
Their caregivers expressed similar confidence:
“I’m not gonna decide [on whether the patient they care for goes to postacute care], like I told you, that’s totally up to the VA. I have trust and faith in them…so wherever they send him, that’s where he’s going” (Caregiver, VA hospital)
In some cases, this perspective was closer to the halo effect: a positive experience with the care provider or the care team led the decision-makers to believe that their recommendations about postacute care would be similarly positive.
“I think we were very trusting in the sense that whatever happened the last time around, he survived it…they took care of him…he got back home, and he started his life again, you know, so why would we question what they’re telling us to do? (Caregiver, VA hospital)
In contrast to Veterans, non-Veteran patients seemed to experience authority bias when it came to the inpatient team.
“Well, I’d like to know more about the PTs [Physical Therapists] there, but I assume since they were recommended, they will be good.” (Patient, University hospital)
This perspective was especially apparent when it came to physicians:
“The level of trust that they [patients] put in their doctor is gonna outweigh what anyone else would say.” (Clinical liaison, SNF)
“[In response to a question about influences on the decision to go to rehab] I don’t…that’s not my decision to make, that’s the doctor’s decision.” (Patient, University hospital)
“They said so…[the doctor] said I needed to go to rehab, so I guess I do because it’s the doctor’s decision.” (Patient, University hospital)
Default/Status quo Bias
In a related way, patients and caregivers with exposure to a SNF seemed to default to the same SNF with which they had previous experience. This bias seems to be primarily related to knowing what to expect.
“He thinks it’s [a particular SNF] the right place for him now…he was there before and he knew, again, it was the right place for him to be” (Caregiver, VA hospital)
“It’s the only one I’ve ever been in…but they have a lot of activities; you have a lot of freedom, staff was good” (Patient, VA hospital)
“I’ve been [to this SNF] before and I kind of know what the program involves…so it was kind of like going home, not, going home is the wrong way to put it…I mean coming here is like something I know, you know, I didn’t need anybody to explain it to me.” (Patient, VA hospital)
“Anybody that’s been to [SNF], that would be their choice to go back to, and I guess I must’ve liked it that first time because I asked to go back again.” (Patient, University hospital)
Anchoring Bias
While anchoring bias was less frequent, it came up in two domains: first, related to costs of care, and second, related to facility characteristics. Costs came up most frequently for Veterans who preferred to move their care to the VA for cost reasons, which appeared in these cases to overshadow other considerations:
“I kept emphasizing that the VA could do all the same things at a lot more reasonable price. The whole purpose of having the VA is for the Veteran, so that…we can get the healthcare that we need at a more reasonable [sic] or a reasonable price.” (Veteran, CLC)
“I think the CLC [VA SNF] is going to take care of her probably the same way any other facility of its type would, unless she were in a private facility, but you know, that costs a lot more money.” (Caregiver, VA hospital)
Patients occasionally had striking responses to particular characteristics of SNFs, regardless of whether this was a central feature or related to their rehabilitation:
“The social worker comes and talks to me about the nursing home where cats are running around, you know, to infect my leg or spin their little cat hairs into my lungs and make my asthma worse…I’m going to have to beg the nurses or the aides or the family or somebody to clean the cat…” (Veteran, VA hospital)
Framing
Framing was the strongest theme among clinician interviews in our sample. Clinicians most frequently described the SNF as a place where patients could recover function (a positive frame), explaining risks (eg, rehospitalization) associated with alternative postacute care options besides the SNF in great detail.
“Aside from explaining the benefits of going and…having that 24-hour care, having the therapies provided to them [the patients], talking about them getting stronger, phrasing it in such a way that patients sometimes are more agreeable, like not calling it a skilled nursing facility, calling it a rehab you know, for them to get physically stronger so they can be the most independent that they can once they do go home, and also explaining … we think that this would be the best plan to prevent them from coming back to the hospital, so those are some of the things that we’ll mention to patients to try and educate them and get them to be agreeable for placement.” (Social worker, University hospital)
Clinicians avoided negative associations with “nursing home” (even though all SNFs are nursing homes) and tended to use more positive frames such as “rehabilitation facility.”
“Use the word rehab….we definitely use the word rehab, to get more therapy, to go home; it’s not a, we really emphasize it’s not a nursing home, it’s not to go to stay forever.” (Physical therapist, safety-net hospital)
Clinicians used a frame of “safety” when discussing the SNF and used a frame of “risk” when discussing alternative postacute care options such as returning home. We did not find examples of clinicians discussing similar risks in going to a SNF even for risks, such as falling, which exist in both settings.
“I’ve talked to them primarily on an avenue of safety because I think people want and they value independence, they value making sure they can get home, but you know, a lot of the times they understand safety is, it can be a concern and outlining that our goal is to make sure that they’re safe and they stay home, and I tend to broach the subject saying that our therapists believe that they might not be safe at home in the moment, but they have potential goals to be safe later on if we continue therapy. I really highlight safety being the major driver of our discussion.” (Physician, VA hospital)
In some cases, framing was so overt that other risk-mitigating options (eg, home healthcare) are not discussed.
“I definitely tend to explain the ideal first. I’m not going to bring up home care when we really think somebody should go to rehab, however, once people say I don’t want to do that, I’m not going, then that’s when I’m like OK, well, let’s talk to the doctors, but we can see about other supports in the home.” (Social worker, VA hospital)
DISCUSSION
In a large sample of patients and their caregivers, as well as multidisciplinary clinicians at three different hospitals and three SNFs, we found authority bias/halo effect and framing biases were most common and seemed most impactful. Default/status quo bias and anchoring bias were also present in decision-making about a SNF. The combination of authority bias/halo effect and framing biases could synergistically interact to augment the likelihood of patients accepting a SNF for postacute care. Patients who had been to a SNF before seemed more likely to choose the SNF they had experienced previously even if they had no other postacute care experiences, and could be highly influenced by isolated characteristics of that facility (such as the physical environment or cost of care).
It is important to mention that cognitive biases do not necessarily have a negative impact: indeed, as Kahneman and Tversky point out, these are useful heuristics from “fast” thinking that are often effective.24 For example, clinicians may be trying to act in the best interests of the patient when framing the decision in terms of regaining function and averting loss of safety and independence. However, the evidence base regarding the outcomes of an SNF versus other postacute options is not robust, and this decision-making is complex. While this decision was most commonly framed in terms of rehabilitation and returning home, the fact that only about half of patients have returned to the community by 100 days4 was not discussed in any interview. In fact, initial evidence suggests replacing the SNF with home healthcare in patients with hip and knee arthroplasty may reduce costs without worsening clinical outcomes.6 However, across a broader population, SNFs significantly reduce 30-day readmissions when directly compared with home healthcare, but other clinical outcomes are similar.25 This evidence suggests that the “right” postacute care option for an individual patient is not clear, highlighting a key role biases may play in decision-making. Further, the nebulous concept of “safety” could introduce potential disparities related to social determinants of health.12 The observed inclination to accept an SNF with which the individual had prior experience may be influenced by the acceptability of this choice because of personal factors or prior research, even if it also represents a bias by limiting the consideration of current alternatives.
Our findings complement those of others in the literature which have also identified profound gaps in discharge decision-making among patients and clinicians,13-16,26-31 though to our knowledge the role of cognitive biases in these decisions has not been explored. This study also addresses gaps in the cognitive bias literature, including the need for real-world data rather than hypothetical vignettes,17 and evaluation of treatment and management decisions rather than diagnoses, which have been more commonly studied.21
These findings have implications for both individual clinicians and healthcare institutions. In the immediate term, these findings may serve as a call to discharging clinicians to modulate language and “debias” their conversations with patients about care after discharge.18,22 Shared decision-making requires an informed choice by patients based on their goals and values; framing a decision in a way that puts the clinician’s goals or values (eg, safety) ahead of patient values (eg, independence and autonomy) or limits disclosure (eg, a “rehab” is a nursing home) in the hope of influencing choice may be more consistent with framing bias and less with shared decision-making.14 Although controversy exists about the best way to “debias” oneself,32 self-awareness of bias is increasingly recognized across healthcare venues as critical to improving care for vulnerable populations.33 The use of data rather than vignettes may be a useful debiasing strategy, although the limitations of currently available data (eg, capturing nursing home quality) are increasingly recognized.34 From a policy and health system perspective, cognitive biases should be integrated into the development of decision aids to facilitate informed, shared, and high-quality decision-making that incorporates patient values, and perhaps “nudges” from behavioral economics to assist patients in choosing the right postdischarge care for them. Such nudges use principles of framing to influence care without restricting choice.35 As the science informing best practice regarding postacute care improves, identifying the “right” postdischarge care may become easier and recommendations more evidence-based.36
Strengths of the study include a large, diverse sample of patients, caregivers, and clinicians in both the hospital and SNF setting. Also, we used a team-based analysis with an experienced team and a deep knowledge of the data, including triangulation with clinicians to verify results. However, all hospitals and SNFs were located in a single metropolitan area, and responses may vary by region or population density. All three hospitals have housestaff teaching programs, and at the time of the interviews all three community SNFs were “five-star” facilities on the Nursing Home Compare website; results may be different at community hospitals or other SNFs. Hospitalists were the only physician group sampled in the hospital as they provide the majority of inpatient care to older adults; geriatricians, in particular, may have had different perspectives. Since we intended to explore whether cognitive biases were present overall, we did not evaluate whether cognitive biases differed by role or subgroup (by clinician type, patient, or caregiver), but this may be a promising area to explore in future work. Many cognitive biases have been described, and there are likely additional biases we did not identify. To confirm the generalizability of these findings, they should be studied in a larger, more generalizable sample of respondents in future work.
Cognitive biases play an important role in patient decision-making about postacute care, particularly regarding SNF care. As postacute care undergoes a transformation spurred by payment reforms, it is more important than ever to ensure that patients understand their choices at hospital discharge and can make a high-quality decision consistent with their goals.
1. Burke RE, Juarez-Colunga E, Levy C, Prochazka AV, Coleman EA, Ginde AA. Rise of post-acute care facilities as a discharge destination of US hospitalizations. JAMA Intern Med. 2015;175(2):295-296. https://doi.org/10.1001/jamainternmed.2014.6383.
2. Burke RE, Juarez-Colunga E, Levy C, Prochazka AV, Coleman EA, Ginde AA. Patient and hospitalization characteristics associated with increased postacute care facility discharges from US hospitals. Med Care. 2015;53(6):492-500. https://doi.org/10.1097/MLR.0000000000000359.
3. Werner RM, Konetzka RT. Trends in post-acute care use among medicare beneficiaries: 2000 to 2015. JAMA. 2018;319(15):1616-1617. https://doi.org/10.1001/jama.2018.2408.
4. Medicare Payment Advisory Commission June 2018 Report to Congress. http://www.medpac.gov/docs/default-source/reports/jun18_ch5_medpacreport_sec.pdf?sfvrsn=0. Accessed November 9, 2018.
5. Burke RE, Cumbler E, Coleman EA, Levy C. Post-acute care reform: implications and opportunities for hospitalists. J Hosp Med. 2017;12(1):46-51. https://doi.org/10.1002/jhm.2673.
6. Dummit LA, Kahvecioglu D, Marrufo G, et al. Association between hospital participation in a medicare bundled payment initiative and payments and quality outcomes for lower extremity joint replacement episodes. JAMA. 2016;316(12):1267-1278. https://doi.org/10.1001/jama.2016.12717.
7. Navathe AS, Troxel AB, Liao JM, et al. Cost of joint replacement using bundled payment models. JAMA Intern Med. 2017;177(2):214-222. https://doi.org/10.1001/jamainternmed.2016.8263.
8. Kennedy G, Lewis VA, Kundu S, Mousqués J, Colla CH. Accountable care organizations and post-acute care: a focus on preferred SNF networks. Med Care Res Rev MCRR. 2018;1077558718781117. https://doi.org/10.1177/1077558718781117.
9. Chandra A, Dalton MA, Holmes J. Large increases in spending on postacute care in Medicare point to the potential for cost savings in these settings. Health Aff Proj Hope. 2013;32(5):864-872. https://doi.org/10.1377/hlthaff.2012.1262.
10. McWilliams JM, Gilstrap LG, Stevenson DG, Chernew ME, Huskamp HA, Grabowski DC. Changes in postacute care in the Medicare shared savings program. JAMA Intern Med. 2017;177(4):518-526. https://doi.org/10.1001/jamainternmed.2016.9115.
11. Zhu JM, Patel V, Shea JA, Neuman MD, Werner RM. Hospitals using bundled payment report reducing skilled nursing facility use and improving care integration. Health Aff Proj Hope. 2018;37(8):1282-1289. https://doi.org/10.1377/hlthaff.2018.0257.
12. Burke RE, Ibrahim SA. Discharge destination and disparities in postoperative care. JAMA. 2018;319(16):1653-1654. https://doi.org/10.1001/jama.2017.21884.
13. Burke RE, Lawrence E, Ladebue A, et al. How hospital clinicians select patients for skilled nursing facilities. J Am Geriatr Soc. 2017;65(11):2466-2472. https://doi.org/10.1111/jgs.14954.
14. Burke RE, Jones J, Lawrence E, et al. Evaluating the quality of patient decision-making regarding post-acute care. J Gen Intern Med. 2018;33(5):678-684. https://doi.org/10.1007/s11606-017-4298-1.
15. Gadbois EA, Tyler DA, Mor V. Selecting a skilled nursing facility for postacute care: individual and family perspectives. J Am Geriatr Soc. 2017;65(11):2459-2465. https://doi.org/10.1111/jgs.14988.
16. Tyler DA, Gadbois EA, McHugh JP, Shield RR, Winblad U, Mor V. Patients are not given quality-of-care data about skilled nursing facilities when discharged from hospitals. Health Aff. 2017;36(8):1385-1391. https://doi.org/10.1377/hlthaff.2017.0155.
17. Blumenthal-Barby JS, Krieger H. Cognitive biases and heuristics in medical decision making: a critical review using a systematic search strategy. Med Decis Mak Int J Soc Med Decis Mak. 2015;35(4):539-557. https://doi.org/10.1177/0272989X14547740.
18. Croskerry P, Singhal G, Mamede S. Cognitive debiasing 1: origins of bias and theory of debiasing. BMJ Qual Saf. 2013;22 Suppl 2:ii58-ii64. https://doi.org/10.1136/bmjqs-2012-001712.
19. Hinds PS, Vogel RJ, Clarke-Steffen L. The possibilities and pitfalls of doing a secondary analysis of a qualitative data set. Qual Health Res. 1997;7(3):408-424. https://doi.org/10.1177/104973239700700306.
20. Magid M, Mcllvennan CK, Jones J, et al. Exploring cognitive bias in destination therapy left ventricular assist device decision making: a retrospective qualitative framework analysis. Am Heart J. 2016;180:64-73. https://doi.org/10.1016/j.ahj.2016.06.024.
21. Saposnik G, Redelmeier D, Ruff CC, Tobler PN. Cognitive biases associated with medical decisions: a systematic review. BMC Med Inform Decis Mak. 2016;16(1):138. https://doi.org/10.1186/s12911-016-0377-1.
22. Croskerry P, Singhal G, Mamede S. Cognitive debiasing 2: impediments to and strategies for change. BMJ Qual Saf. 2013;22 Suppl 2:ii65-ii72. https://doi.org/10.1136/bmjqs-2012-001713.
23. Bradley EH, Curry LA, Devers KJ. Qualitative data analysis for health services research: developing taxonomy, themes, and theory. Health Serv Res. 2007;42(4):1758-1772. https://doi.org/10.1111/j.1475-6773.2006.00684.x.
24. Thinking, Fast and Slow. Daniel Kahneman. Macmillan. US Macmillan. https://us.macmillan.com/thinkingfastandslow/danielkahneman/9780374533557. Accessed February 5, 2019.
25. Werner RM, Konetzka RT, Coe NB. Does type of post-acute care matter? The effect of hospital discharge to home with home health care versus to skilled nursing facility. JAMA Intern Med. In press.
26. Jones J, Lawrence E, Ladebue A, Leonard C, Ayele R, Burke RE. Nurses’ role in managing “The Fit” of older adults in skilled nursing facilities. J Gerontol Nurs. 2017;43(12):11-20. https://doi.org/10.3928/00989134-20171110-06.
27. Lawrence E, Casler J-J, Jones J, et al. Variability in skilled nursing facility screening and admission processes: implications for value-based purchasing. Health Care Manage Rev. 2018. https://doi.org/10.1097/HMR.0000000000000225.
28. Ayele R, Jones J, Ladebue A, et al. Perceived costs of care influence post-acute care choices by clinicians, patients, and caregivers. J Am Geriatr Soc. 2019. https://doi.org/10.1111/jgs.15768.
29. Sefcik JS, Nock RH, Flores EJ, et al. Patient preferences for information on post-acute care services. Res Gerontol Nurs. 2016;9(4):175-182. https://doi.org/10.3928/19404921-20160120-01.
30. Konetzka RT, Perraillon MC. Use of nursing home compare website appears limited by lack of awareness and initial mistrust of the data. Health Aff Proj Hope. 2016;35(4):706-713. https://doi.org/10.1377/hlthaff.2015.1377.
31. Schapira MM, Shea JA, Duey KA, Kleiman C, Werner RM. The nursing home compare report card: perceptions of residents and caregivers regarding quality ratings and nursing home choice. Health Serv Res. 2016;51 Suppl 2:1212-1228. https://doi.org/10.1111/1475-6773.12458.
32. Dhaliwal G. Premature closure? Not so fast. BMJ Qual Saf. 2017;26(2):87-89. https://doi.org/10.1136/bmjqs-2016-005267.
33. Masters C, Robinson D, Faulkner S, Patterson E, McIlraith T, Ansari A. Addressing biases in patient care with the 5Rs of cultural humility, a clinician coaching tool. J Gen Intern Med. 2019;34(4):627-630. https://doi.org/10.1007/s11606-018-4814-y.
34. Burke RE, Werner RM. Quality measurement and nursing homes: measuring what matters. BMJ Qual Saf. 2019;28(7);520-523. https://doi.org/10.1136/bmjqs-2019-009447.
35. Patel MS, Volpp KG, Asch DA. Nudge units to improve the delivery of health care. N Engl J Med. 2018;378(3):214-216. https://doi.org/10.1056/NEJMp1712984.
36. Jenq GY, Tinetti ME. Post–acute care: who belongs where? JAMA Intern Med. 2015;175(2):296-297. https://doi.org/10.1001/jamainternmed.2014.4298.
The combination of decreasing hospital lengths of stay and increasing age and comorbidity of the United States population is a principal driver of the increased use of postacute care in the US.1-3 Postacute care refers to care in long-term acute care hospitals, inpatient rehabilitation facilities, skilled nursing facilities (SNFs), and care provided by home health agencies after an acute hospitalization. In 2016, 43% of Medicare beneficiaries received postacute care after hospital discharge at the cost of $60 billion annually; nearly half of these received care in an SNF.4 Increasing recognition of the significant cost and poor outcomes of postacute care led to payment reforms, such as bundled payments, that incentivized less expensive forms of postacute care and improvements in outcomes.5-9 Early evaluations suggested that hospitals are sensitive to these reforms and responded by significantly decreasing SNF utilization.10,11 It remains unclear whether this was safe and effective.
In this context, increased attention to how hospital clinicians and hospitalized patients decide whether to use postacute care (and what form to use) is appropriate since the effect of payment reforms could negatively impact vulnerable populations of older adults without adequate protection.12 Suboptimal decision-making can drive both overuse and inappropriate underuse of this expensive medical resource. Initial evidence suggests that patients and clinicians are poorly equipped to make high-quality decisions about postacute care, with significant deficits in both the decision-making process and content.13-16 While these gaps are important to address, they may only be part of the problem. The fields of cognitive psychology and behavioral economics have revealed new insights into decision-making, demonstrating that people deviate from rational decision-making in predictable ways, termed decision heuristics, or cognitive biases.17 This growing field of research suggests heuristics or biases play important roles in decision-making and determining behavior, particularly in situations where there may be little information provided and the patient is stressed, tired, and ill—precisely like deciding on postacute care.18 However, it is currently unknown whether cognitive biases are at play when making hospital discharge decisions.
We sought to identify the most salient heuristics or cognitive biases patients may utilize when making decisions about postacute care at the end of their hospitalization and ways clinicians may contribute to these biases. The overall goal was to derive insights for improving postacute care decision-making.
METHODS
Study Design
We conducted a secondary analysis on interviews with hospital and SNF clinicians as well as patients and their caregivers who were either leaving the hospital for an SNF or newly arrived in an SNF from the hospital to understand if cognitive biases were present and how they manifested themselves in a real-world clinical context.19 These interviews were part of a larger qualitative study that sought to understand how clinicians, patients, and their caregivers made decisions about postacute care, particularly related to SNFs.13,14 This study represents the analysis of all our interviews, specifically examining decision-making bias. Participating sites, clinical roles, and both patient and caregiver characteristics (Table 1) in our cohort have been previously described.13,14
Analysis
We used a team-based approach to framework analysis, which has been used in other decision-making studies14, including those measuring cognitive bias.20 A limitation in cognitive bias research is the lack of a standardized list or categorization of cognitive biases. We reviewed prior systematic17,21 and narrative reviews18,22, as well as prior studies describing examples of cognitive biases playing a role in decision-making about therapy20 to construct a list of possible cognitive biases to evaluate and narrow these a priori to potential biases relevant to the decision about postacute care based on our prior work (Table 2).
We applied this framework to analyze transcripts through an iterative process of deductive coding and reviewing across four reviewers (ML, RA, AL, CL) and a hospitalist physician with expertise leading qualitative studies (REB).
Intercoder consensus was built through team discussion by resolving points of disagreement.23 Consistency of coding was regularly checked by having more than one investigator code individual manuscripts and comparing coding, and discrepancies were resolved through team discussion. We triangulated the data (shared our preliminary results) using a larger study team, including an expert in behavioral economics (SRG), physicians at study sites (EC, RA), and an anthropologist with expertise in qualitative methods (CL). We did this to ensure credibility (to what extent the findings are credible or believable) and confirmability of findings (ensuring the findings are based on participant narratives rather than researcher biases).
RESULTS
We reviewed a total of 105 interviews with 25 hospital clinicians, 20 SNF clinicians, 21 patients and 14 caregivers in the hospital, and 15 patients and 10 caregivers in the SNF setting (Table 1). We found authority bias/halo effect; default/status quo bias, anchoring bias, and framing was commonly present in decision-making about postacute care in a SNF, whereas there were few if any examples of ambiguity aversion, availability heuristic, confirmation bias, optimism bias, or false consensus effect (Table 2).
Authority Bias/Halo Effect
While most patients deferred to their inpatient teams when it came to decision-making, this effect seemed to differ across VA and non-VA settings. Veterans expressed a higher degree of potential authority bias regarding the VA as an institution, whereas older adults in non-VA settings saw physicians as the authority figure making decisions in their best interests.
Veterans expressed confidence in the VA regarding both whether to go to a SNF and where to go:
“The VA wouldn’t license [an SNF] if they didn’t have a good reputation for care, cleanliness, things of that nature” (Veteran, VA CLC)
“I just knew the VA would have my best interests at heart” (Veteran, VA CLC)
Their caregivers expressed similar confidence:
“I’m not gonna decide [on whether the patient they care for goes to postacute care], like I told you, that’s totally up to the VA. I have trust and faith in them…so wherever they send him, that’s where he’s going” (Caregiver, VA hospital)
In some cases, this perspective was closer to the halo effect: a positive experience with the care provider or the care team led the decision-makers to believe that their recommendations about postacute care would be similarly positive.
“I think we were very trusting in the sense that whatever happened the last time around, he survived it…they took care of him…he got back home, and he started his life again, you know, so why would we question what they’re telling us to do? (Caregiver, VA hospital)
In contrast to Veterans, non-Veteran patients seemed to experience authority bias when it came to the inpatient team.
“Well, I’d like to know more about the PTs [Physical Therapists] there, but I assume since they were recommended, they will be good.” (Patient, University hospital)
This perspective was especially apparent when it came to physicians:
“The level of trust that they [patients] put in their doctor is gonna outweigh what anyone else would say.” (Clinical liaison, SNF)
“[In response to a question about influences on the decision to go to rehab] I don’t…that’s not my decision to make, that’s the doctor’s decision.” (Patient, University hospital)
“They said so…[the doctor] said I needed to go to rehab, so I guess I do because it’s the doctor’s decision.” (Patient, University hospital)
Default/Status quo Bias
In a related way, patients and caregivers with exposure to a SNF seemed to default to the same SNF with which they had previous experience. This bias seems to be primarily related to knowing what to expect.
“He thinks it’s [a particular SNF] the right place for him now…he was there before and he knew, again, it was the right place for him to be” (Caregiver, VA hospital)
“It’s the only one I’ve ever been in…but they have a lot of activities; you have a lot of freedom, staff was good” (Patient, VA hospital)
“I’ve been [to this SNF] before and I kind of know what the program involves…so it was kind of like going home, not, going home is the wrong way to put it…I mean coming here is like something I know, you know, I didn’t need anybody to explain it to me.” (Patient, VA hospital)
“Anybody that’s been to [SNF], that would be their choice to go back to, and I guess I must’ve liked it that first time because I asked to go back again.” (Patient, University hospital)
Anchoring Bias
While anchoring bias was less frequent, it came up in two domains: first, related to costs of care, and second, related to facility characteristics. Costs came up most frequently for Veterans who preferred to move their care to the VA for cost reasons, which appeared in these cases to overshadow other considerations:
“I kept emphasizing that the VA could do all the same things at a lot more reasonable price. The whole purpose of having the VA is for the Veteran, so that…we can get the healthcare that we need at a more reasonable [sic] or a reasonable price.” (Veteran, CLC)
“I think the CLC [VA SNF] is going to take care of her probably the same way any other facility of its type would, unless she were in a private facility, but you know, that costs a lot more money.” (Caregiver, VA hospital)
Patients occasionally had striking responses to particular characteristics of SNFs, regardless of whether this was a central feature or related to their rehabilitation:
“The social worker comes and talks to me about the nursing home where cats are running around, you know, to infect my leg or spin their little cat hairs into my lungs and make my asthma worse…I’m going to have to beg the nurses or the aides or the family or somebody to clean the cat…” (Veteran, VA hospital)
Framing
Framing was the strongest theme among clinician interviews in our sample. Clinicians most frequently described the SNF as a place where patients could recover function (a positive frame), explaining risks (eg, rehospitalization) associated with alternative postacute care options besides the SNF in great detail.
“Aside from explaining the benefits of going and…having that 24-hour care, having the therapies provided to them [the patients], talking about them getting stronger, phrasing it in such a way that patients sometimes are more agreeable, like not calling it a skilled nursing facility, calling it a rehab you know, for them to get physically stronger so they can be the most independent that they can once they do go home, and also explaining … we think that this would be the best plan to prevent them from coming back to the hospital, so those are some of the things that we’ll mention to patients to try and educate them and get them to be agreeable for placement.” (Social worker, University hospital)
Clinicians avoided negative associations with “nursing home” (even though all SNFs are nursing homes) and tended to use more positive frames such as “rehabilitation facility.”
“Use the word rehab….we definitely use the word rehab, to get more therapy, to go home; it’s not a, we really emphasize it’s not a nursing home, it’s not to go to stay forever.” (Physical therapist, safety-net hospital)
Clinicians used a frame of “safety” when discussing the SNF and used a frame of “risk” when discussing alternative postacute care options such as returning home. We did not find examples of clinicians discussing similar risks in going to a SNF even for risks, such as falling, which exist in both settings.
“I’ve talked to them primarily on an avenue of safety because I think people want and they value independence, they value making sure they can get home, but you know, a lot of the times they understand safety is, it can be a concern and outlining that our goal is to make sure that they’re safe and they stay home, and I tend to broach the subject saying that our therapists believe that they might not be safe at home in the moment, but they have potential goals to be safe later on if we continue therapy. I really highlight safety being the major driver of our discussion.” (Physician, VA hospital)
In some cases, framing was so overt that other risk-mitigating options (eg, home healthcare) are not discussed.
“I definitely tend to explain the ideal first. I’m not going to bring up home care when we really think somebody should go to rehab, however, once people say I don’t want to do that, I’m not going, then that’s when I’m like OK, well, let’s talk to the doctors, but we can see about other supports in the home.” (Social worker, VA hospital)
DISCUSSION
In a large sample of patients and their caregivers, as well as multidisciplinary clinicians at three different hospitals and three SNFs, we found authority bias/halo effect and framing biases were most common and seemed most impactful. Default/status quo bias and anchoring bias were also present in decision-making about a SNF. The combination of authority bias/halo effect and framing biases could synergistically interact to augment the likelihood of patients accepting a SNF for postacute care. Patients who had been to a SNF before seemed more likely to choose the SNF they had experienced previously even if they had no other postacute care experiences, and could be highly influenced by isolated characteristics of that facility (such as the physical environment or cost of care).
It is important to mention that cognitive biases do not necessarily have a negative impact: indeed, as Kahneman and Tversky point out, these are useful heuristics from “fast” thinking that are often effective.24 For example, clinicians may be trying to act in the best interests of the patient when framing the decision in terms of regaining function and averting loss of safety and independence. However, the evidence base regarding the outcomes of an SNF versus other postacute options is not robust, and this decision-making is complex. While this decision was most commonly framed in terms of rehabilitation and returning home, the fact that only about half of patients have returned to the community by 100 days4 was not discussed in any interview. In fact, initial evidence suggests replacing the SNF with home healthcare in patients with hip and knee arthroplasty may reduce costs without worsening clinical outcomes.6 However, across a broader population, SNFs significantly reduce 30-day readmissions when directly compared with home healthcare, but other clinical outcomes are similar.25 This evidence suggests that the “right” postacute care option for an individual patient is not clear, highlighting a key role biases may play in decision-making. Further, the nebulous concept of “safety” could introduce potential disparities related to social determinants of health.12 The observed inclination to accept an SNF with which the individual had prior experience may be influenced by the acceptability of this choice because of personal factors or prior research, even if it also represents a bias by limiting the consideration of current alternatives.
Our findings complement those of others in the literature which have also identified profound gaps in discharge decision-making among patients and clinicians,13-16,26-31 though to our knowledge the role of cognitive biases in these decisions has not been explored. This study also addresses gaps in the cognitive bias literature, including the need for real-world data rather than hypothetical vignettes,17 and evaluation of treatment and management decisions rather than diagnoses, which have been more commonly studied.21
These findings have implications for both individual clinicians and healthcare institutions. In the immediate term, these findings may serve as a call to discharging clinicians to modulate language and “debias” their conversations with patients about care after discharge.18,22 Shared decision-making requires an informed choice by patients based on their goals and values; framing a decision in a way that puts the clinician’s goals or values (eg, safety) ahead of patient values (eg, independence and autonomy) or limits disclosure (eg, a “rehab” is a nursing home) in the hope of influencing choice may be more consistent with framing bias and less with shared decision-making.14 Although controversy exists about the best way to “debias” oneself,32 self-awareness of bias is increasingly recognized across healthcare venues as critical to improving care for vulnerable populations.33 The use of data rather than vignettes may be a useful debiasing strategy, although the limitations of currently available data (eg, capturing nursing home quality) are increasingly recognized.34 From a policy and health system perspective, cognitive biases should be integrated into the development of decision aids to facilitate informed, shared, and high-quality decision-making that incorporates patient values, and perhaps “nudges” from behavioral economics to assist patients in choosing the right postdischarge care for them. Such nudges use principles of framing to influence care without restricting choice.35 As the science informing best practice regarding postacute care improves, identifying the “right” postdischarge care may become easier and recommendations more evidence-based.36
Strengths of the study include a large, diverse sample of patients, caregivers, and clinicians in both the hospital and SNF setting. Also, we used a team-based analysis with an experienced team and a deep knowledge of the data, including triangulation with clinicians to verify results. However, all hospitals and SNFs were located in a single metropolitan area, and responses may vary by region or population density. All three hospitals have housestaff teaching programs, and at the time of the interviews all three community SNFs were “five-star” facilities on the Nursing Home Compare website; results may be different at community hospitals or other SNFs. Hospitalists were the only physician group sampled in the hospital as they provide the majority of inpatient care to older adults; geriatricians, in particular, may have had different perspectives. Since we intended to explore whether cognitive biases were present overall, we did not evaluate whether cognitive biases differed by role or subgroup (by clinician type, patient, or caregiver), but this may be a promising area to explore in future work. Many cognitive biases have been described, and there are likely additional biases we did not identify. To confirm the generalizability of these findings, they should be studied in a larger, more generalizable sample of respondents in future work.
Cognitive biases play an important role in patient decision-making about postacute care, particularly regarding SNF care. As postacute care undergoes a transformation spurred by payment reforms, it is more important than ever to ensure that patients understand their choices at hospital discharge and can make a high-quality decision consistent with their goals.
1. Burke RE, Juarez-Colunga E, Levy C, Prochazka AV, Coleman EA, Ginde AA. Rise of post-acute care facilities as a discharge destination of US hospitalizations. JAMA Intern Med. 2015;175(2):295-296. https://doi.org/10.1001/jamainternmed.2014.6383.
2. Burke RE, Juarez-Colunga E, Levy C, Prochazka AV, Coleman EA, Ginde AA. Patient and hospitalization characteristics associated with increased postacute care facility discharges from US hospitals. Med Care. 2015;53(6):492-500. https://doi.org/10.1097/MLR.0000000000000359.
3. Werner RM, Konetzka RT. Trends in post-acute care use among medicare beneficiaries: 2000 to 2015. JAMA. 2018;319(15):1616-1617. https://doi.org/10.1001/jama.2018.2408.
4. Medicare Payment Advisory Commission June 2018 Report to Congress. http://www.medpac.gov/docs/default-source/reports/jun18_ch5_medpacreport_sec.pdf?sfvrsn=0. Accessed November 9, 2018.
5. Burke RE, Cumbler E, Coleman EA, Levy C. Post-acute care reform: implications and opportunities for hospitalists. J Hosp Med. 2017;12(1):46-51. https://doi.org/10.1002/jhm.2673.
6. Dummit LA, Kahvecioglu D, Marrufo G, et al. Association between hospital participation in a medicare bundled payment initiative and payments and quality outcomes for lower extremity joint replacement episodes. JAMA. 2016;316(12):1267-1278. https://doi.org/10.1001/jama.2016.12717.
7. Navathe AS, Troxel AB, Liao JM, et al. Cost of joint replacement using bundled payment models. JAMA Intern Med. 2017;177(2):214-222. https://doi.org/10.1001/jamainternmed.2016.8263.
8. Kennedy G, Lewis VA, Kundu S, Mousqués J, Colla CH. Accountable care organizations and post-acute care: a focus on preferred SNF networks. Med Care Res Rev MCRR. 2018;1077558718781117. https://doi.org/10.1177/1077558718781117.
9. Chandra A, Dalton MA, Holmes J. Large increases in spending on postacute care in Medicare point to the potential for cost savings in these settings. Health Aff Proj Hope. 2013;32(5):864-872. https://doi.org/10.1377/hlthaff.2012.1262.
10. McWilliams JM, Gilstrap LG, Stevenson DG, Chernew ME, Huskamp HA, Grabowski DC. Changes in postacute care in the Medicare shared savings program. JAMA Intern Med. 2017;177(4):518-526. https://doi.org/10.1001/jamainternmed.2016.9115.
11. Zhu JM, Patel V, Shea JA, Neuman MD, Werner RM. Hospitals using bundled payment report reducing skilled nursing facility use and improving care integration. Health Aff Proj Hope. 2018;37(8):1282-1289. https://doi.org/10.1377/hlthaff.2018.0257.
12. Burke RE, Ibrahim SA. Discharge destination and disparities in postoperative care. JAMA. 2018;319(16):1653-1654. https://doi.org/10.1001/jama.2017.21884.
13. Burke RE, Lawrence E, Ladebue A, et al. How hospital clinicians select patients for skilled nursing facilities. J Am Geriatr Soc. 2017;65(11):2466-2472. https://doi.org/10.1111/jgs.14954.
14. Burke RE, Jones J, Lawrence E, et al. Evaluating the quality of patient decision-making regarding post-acute care. J Gen Intern Med. 2018;33(5):678-684. https://doi.org/10.1007/s11606-017-4298-1.
15. Gadbois EA, Tyler DA, Mor V. Selecting a skilled nursing facility for postacute care: individual and family perspectives. J Am Geriatr Soc. 2017;65(11):2459-2465. https://doi.org/10.1111/jgs.14988.
16. Tyler DA, Gadbois EA, McHugh JP, Shield RR, Winblad U, Mor V. Patients are not given quality-of-care data about skilled nursing facilities when discharged from hospitals. Health Aff. 2017;36(8):1385-1391. https://doi.org/10.1377/hlthaff.2017.0155.
17. Blumenthal-Barby JS, Krieger H. Cognitive biases and heuristics in medical decision making: a critical review using a systematic search strategy. Med Decis Mak Int J Soc Med Decis Mak. 2015;35(4):539-557. https://doi.org/10.1177/0272989X14547740.
18. Croskerry P, Singhal G, Mamede S. Cognitive debiasing 1: origins of bias and theory of debiasing. BMJ Qual Saf. 2013;22 Suppl 2:ii58-ii64. https://doi.org/10.1136/bmjqs-2012-001712.
19. Hinds PS, Vogel RJ, Clarke-Steffen L. The possibilities and pitfalls of doing a secondary analysis of a qualitative data set. Qual Health Res. 1997;7(3):408-424. https://doi.org/10.1177/104973239700700306.
20. Magid M, Mcllvennan CK, Jones J, et al. Exploring cognitive bias in destination therapy left ventricular assist device decision making: a retrospective qualitative framework analysis. Am Heart J. 2016;180:64-73. https://doi.org/10.1016/j.ahj.2016.06.024.
21. Saposnik G, Redelmeier D, Ruff CC, Tobler PN. Cognitive biases associated with medical decisions: a systematic review. BMC Med Inform Decis Mak. 2016;16(1):138. https://doi.org/10.1186/s12911-016-0377-1.
22. Croskerry P, Singhal G, Mamede S. Cognitive debiasing 2: impediments to and strategies for change. BMJ Qual Saf. 2013;22 Suppl 2:ii65-ii72. https://doi.org/10.1136/bmjqs-2012-001713.
23. Bradley EH, Curry LA, Devers KJ. Qualitative data analysis for health services research: developing taxonomy, themes, and theory. Health Serv Res. 2007;42(4):1758-1772. https://doi.org/10.1111/j.1475-6773.2006.00684.x.
24. Thinking, Fast and Slow. Daniel Kahneman. Macmillan. US Macmillan. https://us.macmillan.com/thinkingfastandslow/danielkahneman/9780374533557. Accessed February 5, 2019.
25. Werner RM, Konetzka RT, Coe NB. Does type of post-acute care matter? The effect of hospital discharge to home with home health care versus to skilled nursing facility. JAMA Intern Med. In press.
26. Jones J, Lawrence E, Ladebue A, Leonard C, Ayele R, Burke RE. Nurses’ role in managing “The Fit” of older adults in skilled nursing facilities. J Gerontol Nurs. 2017;43(12):11-20. https://doi.org/10.3928/00989134-20171110-06.
27. Lawrence E, Casler J-J, Jones J, et al. Variability in skilled nursing facility screening and admission processes: implications for value-based purchasing. Health Care Manage Rev. 2018. https://doi.org/10.1097/HMR.0000000000000225.
28. Ayele R, Jones J, Ladebue A, et al. Perceived costs of care influence post-acute care choices by clinicians, patients, and caregivers. J Am Geriatr Soc. 2019. https://doi.org/10.1111/jgs.15768.
29. Sefcik JS, Nock RH, Flores EJ, et al. Patient preferences for information on post-acute care services. Res Gerontol Nurs. 2016;9(4):175-182. https://doi.org/10.3928/19404921-20160120-01.
30. Konetzka RT, Perraillon MC. Use of nursing home compare website appears limited by lack of awareness and initial mistrust of the data. Health Aff Proj Hope. 2016;35(4):706-713. https://doi.org/10.1377/hlthaff.2015.1377.
31. Schapira MM, Shea JA, Duey KA, Kleiman C, Werner RM. The nursing home compare report card: perceptions of residents and caregivers regarding quality ratings and nursing home choice. Health Serv Res. 2016;51 Suppl 2:1212-1228. https://doi.org/10.1111/1475-6773.12458.
32. Dhaliwal G. Premature closure? Not so fast. BMJ Qual Saf. 2017;26(2):87-89. https://doi.org/10.1136/bmjqs-2016-005267.
33. Masters C, Robinson D, Faulkner S, Patterson E, McIlraith T, Ansari A. Addressing biases in patient care with the 5Rs of cultural humility, a clinician coaching tool. J Gen Intern Med. 2019;34(4):627-630. https://doi.org/10.1007/s11606-018-4814-y.
34. Burke RE, Werner RM. Quality measurement and nursing homes: measuring what matters. BMJ Qual Saf. 2019;28(7);520-523. https://doi.org/10.1136/bmjqs-2019-009447.
35. Patel MS, Volpp KG, Asch DA. Nudge units to improve the delivery of health care. N Engl J Med. 2018;378(3):214-216. https://doi.org/10.1056/NEJMp1712984.
36. Jenq GY, Tinetti ME. Post–acute care: who belongs where? JAMA Intern Med. 2015;175(2):296-297. https://doi.org/10.1001/jamainternmed.2014.4298.
© 2020 Society of Hospital Medicine
Barriers to Providing VTE Chemoprophylaxis to Hospitalized Patients: A Nursing-Focused Qualitative Evaluation
Venous thromboembolism (VTE), comprising deep venous thrombosis and pulmonary embolism (PE),1 is a serious medical condition that results in preventable morbidity and mortality.1-5 VTE affects all age groups, all races/ethnicities, and both genders, but there are known factors that increase the risk of developing VTE (eg, advanced age, undergoing surgery, hospitalization, and immobility).1-3,5-7 Prevention of VTE among hospitalized patients is of paramount importance to avoid preventable death, chronic illness/long-term complications,8 longer hospital stays, and increased hospital costs.9 Fortunately, there is clear evidence that provision of appropriate prophylaxis can decrease the risk of a VTE event occurring, and broadly accepted best-practice guidelines reflect this evidence.3,5
Given the inadequacy of current VTE-related quality measures to identify actionable failures in the provision of VTE prophylaxis, our group created a VTE process-of-care measure to assess adherence to the components of VTE prophylaxis: (1) early ambulation, (2) mechanical prophylaxis (sequential compression devices [SCDs]), and (3) chemoprophylaxis administered at the correct dose and frequency for the duration of the patient’s hospital stay.3,10,11 This quality measure was conceived, created, and iteratively revised to measure whether optimal care is provided to patients throughout their hospitalization and identify actionable areas in which failures of care occur, in order to decrease the risk of a VTE event. Data from our institution provided evidence that while ambulation and SCD component measure adherence is high, chemoprophylaxis adherence required significant improvement.10 When chemoprophylaxis process measure adherence data were analyzed further, a major failure mode was patient refusal of one or more doses. However, the drivers of patient refusal are not well defined in the literature, and previous studies have called for a greater focus on developing interventions to improve VTE chemoprophylaxis administration.12
Previous research has shown that nurses can influence patient compliance with VTE prophylaxis.13-15 A mixed-methods study by Elder et al. found that nurses in units with high rates of failure to provide optimal chemoprophylaxis offered the medication as optional, leading researchers to conclude that nurses perceived chemoprophylaxis as discretionary.13 Another study by Lee et al., conducted a survey of bedside registered nurses and identified nurses’ lack of education on VTE prevention as a significant barrier to providing care.14 These studies show that multiple levels of influence impact how nurses provide VTE chemoprophylaxis, particularly when they encounter patients who refuse chemoprophylaxis.
To explore the nuance and interplay of multiple influences, we used the Theoretical Domains Framework (TDF), an integrative framework that applies theoretical approaches to interventions aimed at behavior change.15-18 The framework contains 14 interrelated domains that characterize the behavior being studied, in this case, administration of VTE chemoprophylaxis. Consequently, we designed a nurse-focused, qualitative evaluation with the objective to identify nursing-related barriers to administration of VTE chemoprophylaxis.
METHODS
Inpatient Unit Selection
The study team accessed data from the hospital’s Enterprise Data Warehouse to review patient refusal rates of VTE chemoprophylaxis for each inpatient unit in the hospital. Patient refusal was utilized as a proxy measure for the behavior of nurses attempting to administer VTE chemoprophylaxis. Of the 14 medical and surgical units in the hospital, two medical and two surgical units were selected to participate in the qualitative evaluation based on having the highest patient refusal rates. One unit (surgical) was also selected to serve as a benchmark because it had the lowest patient refusal rate. Table 1 includes the refusal rates for the five units. Given the low refusal rate for the best performing unit, we suspected that it would be possible to decrease the patient refusal rate for other units with similar patient populations and interprofessional teams at the institution.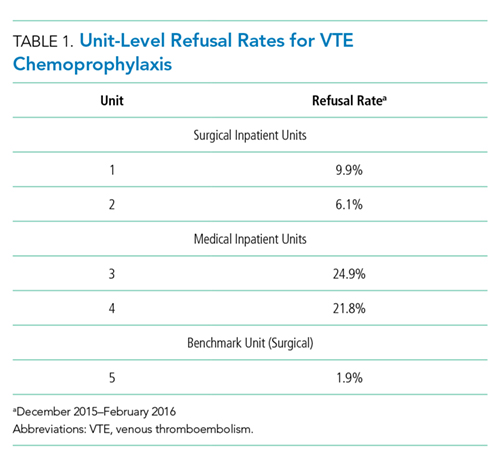
Observations
We observed chemoprophylaxis administration on the five units to understand the process for ordering and administering chemoprophylaxis. An observation protocol was utilized to document the date, time, and location of the observation as well as descriptive notes including accounts of particular events.19,20 Observations occurred in May 2016 and informed the creation of a process map outlining the procedure for ordering and administering VTE chemoprophylaxis. The process map was utilized to create the focus group interview guide and ensure the interview guide included pertinent questions for each step of the process (Appendix A).
Focus Group Interviews
We conducted focus group interviews with day and night shift nurses on the five units to assess nurses’ understanding of VTE chemoprophylaxis and nurses’ perceptions of barriers to administration of VTE chemoprophylaxis. The study team chose to conduct focus group interviews in an effort to maximize participation and to speak with multiple nurses within a shorter period of time. The focus group structure allowed the study team to speak with nurses during their shifts, as one could briefly step out, if required, for patient care and return to rejoin the discussion.
We developed a semistructured interview guide21 with questions focused on identifying nurses’ perceptions of guideline-recommended care for VTE chemoprophylaxis, where they learned these guidelines, how nurses discuss chemoprophylaxis with patients, how they handle the conversation with patients who refuse, and if there are times when chemoprophylaxis is not necessary. The interview guide was vetted by a multidisciplinary team consisting of clinical nursing coordinators and nurse managers from medical and surgical units, hospital quality leaders, surgeons and general internists, and qualitative research experts. The interview guide is included as Appendix B.
The unit clinical coordinators and nurse managers identified dates and times for the focus groups that would be minimally disruptive to the unit. For each of the four units with a high patient refusal rate, two focus groups were conducted during the lunch hour and one was conducted at the end of the night shift to ensure that both day and night shift nurses were included in the study. Two focus groups were conducted with the best-practice unit during the lunch hour. For each focus group, the clinical coordinator identified two to eight nurses who could step away from patient care to participate or who had completed their shifts. In total, approximately 67 nurses participated in the focus groups.
The focus groups (n = 14) lasted approximately 40 minutes during May and June 2016. Two members of the study team cofacilitated interviews, which were recorded and transcribed verbatim.
Coding and Data Analysis
To develop the code book, the study team, consisting of three qualitative researchers, independently read one focus group transcript and applied the TDF domains to the nurses’ perceptions of barriers to administration of VTE chemoprophylaxis.21-24 In addition to coding by domain, the study team also coded nursing perceptions as barriers or facilitators. The study team reviewed the coded transcript and reconciled any differences in coding. This process was repeated for a second transcript, and then all remaining transcripts were assigned to two out of three study team members for coding, with the entire study team meeting to reconcile any differences. If necessary, the team member who did not code a transcript acted as the tie-breaker if there were discrepancies in codes that could not be reconciled.
Once coding was completed, we identified the TDF domains that were most relevant to the administration of VTE chemoprophylaxis.16 Member checking (testing the analysis, interpretations, and conclusions with members of those groups from whom the data were originally obtained) was performed with the four clinical nursing coordinators and four nurse managers from the participating units to establish face validity of the themes identified from the focus group interviews.25
The study team used MaxQDA, V12 (Berlin, Germany) to support data coding and analysis.26 The Northwestern University institutional review board office deemed this project research on nonhuman-subjects because it focused on the process of providing VTE chemoprophylaxis and not about the patients themselves. The purpose of the study was explained at the beginning of each focus group, and nurses gave verbal consent to have the focus group recorded.
RESULTS
We conducted 14 focus groups with day and night shift nurses from five units (two medical and three surgical) at a single institution. All nurses invited to participate in a focus group agreed to participate. The data were coded and grouped by domain and identified as barriers or facilitators. The findings included below are for the domains most relevant to the provision of VTE prophylaxis. Table 2 provides illustrative verbatim quotes for each domain that was represented in the focus groups.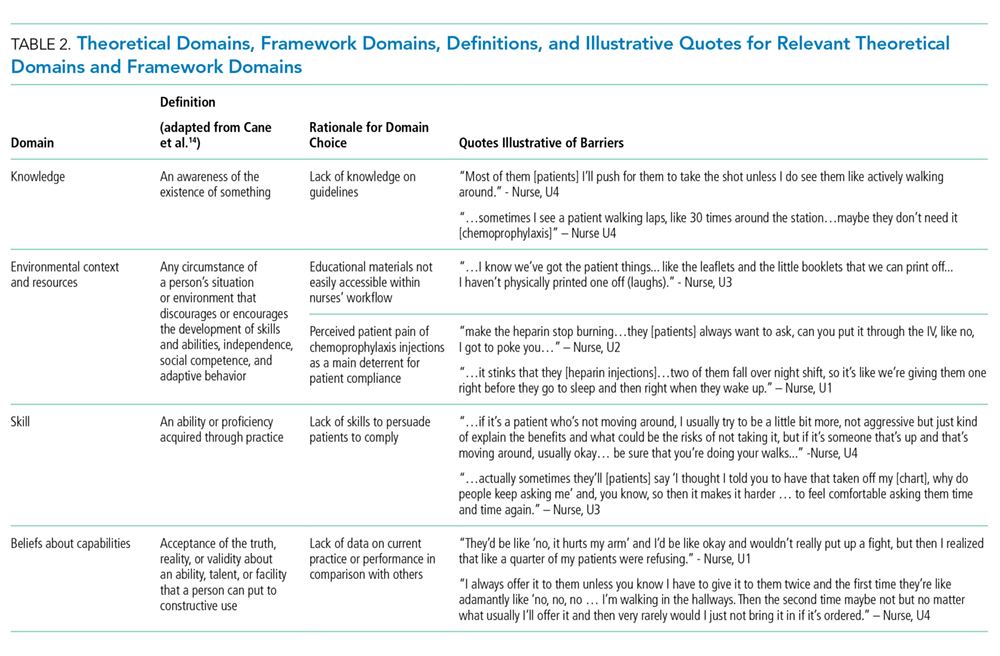
THEORETICAL DOMAINS FRAMEWORK DOMAINS
Knowledge
All interviewees recognized that providing some form of prophylaxis to mitigate the risk of a VTE event is essential. Some nurses stated that seeing a patient ambulating meant they would consider not administering prescribed chemoprophylaxis, while others would try to negotiate with patients by asking the patient to allow one dose of chemoprophylaxis prescribed two to three times daily because it was better than receiving no doses.
Environmental Context and Resources
Multiple barriers to providing optimal care were associated with the environmental context and a lack of resources. There was a lack of accessible, comprehensive, patient-centered education materials on VTE chemoprophylaxis to supplement a nurse’s explanation about the importance of chemoprophylaxis. Furthermore, many nurses cited the perceived patient pain of chemoprophylaxis injections as the main deterrent to patient compliance, especially subcutaneous heparin injections, which occur up to three times in 24 hours and often cause more pain at the site of injection than low-molecular-weight heparin. Nurses felt that transitioning patients from receiving subcutaneous heparin injections to receiving low-molecular-weight heparin could be a main driver to reduce patient refusals.
Skills
Nurses felt inadequately equipped to handle patient refusals. Many said that patient refusal of treatments was never discussed in nursing school. As a result, when patients refused treatments, the nurses did not know how to handle the situation. They felt that they lacked the tools and techniques to persuade the patient to comply.
Beliefs about Capabilities
Nurses did not know their own patient refusal rate or benchmarks of an acceptable refusal rate in contrast to one that is too high. Without this feedback, they were unable to assess their own behavior or performance related to providing VTE chemoprophylaxis.
DISCUSSION
Nurses play a critical role in providing VTE chemoprophylaxis to patients throughout their hospitalization. This study provided a unique opportunity to perform an in-depth, qualitative analysis of the barriers nurses face in providing patients with VTE chemoprophylaxis as part of their daily work caring for patients. We discovered several nursing-related barriers to the provision of VTE chemoprophylaxis, including lack of knowledge, resources, skill, and misconceptions of their capability to provide VTE chemoprophylaxis. We used a bottom-up approach by incorporating the voices of unit nurses, clinical coordinators, and nurse managers to understand potential barriers. Our findings brought to light the challenge of delivering standardized care in an area of care that is generally agreed upon, yet not fully followed. Some nurses display greater proficiency than others at communicating with patients who do not understand their risk for VTE and need for chemoprophylaxis. Furthermore, there is a pronounced misconception around the delivery of VTE chemoprophylaxis. Nurses have the inaccurate belief that even if ordered, chemoprophylaxis is not required. This misconception was widespread among nurses taking care of both medical and surgical patients. These factors appear to be modifiable targets for quality improvement and highlight the need for a skills-based education during the new hire onboarding process, as well as ongoing reeducation to ensure nursing staff have the skills to appropriately provide best-practice care for VTE chemoprophylaxis. Nurses felt ownership of the results of the qualitative evaluation because they were included in every aspect from the beginning.27 This sense of ownership will support future quality improvement efforts to develop a skills-based intervention to improve the provision of VTE chemoprophylaxis.18,27
This study has certain limitations. First, it was a qualitative study assessing nursing-related barriers to providing VTE chemoprophylaxis at a single institution, and the results cannot be generalized broadly. However, the techniques and results are transferable to other hospital settings and other clinical care situations. Thus, we believe that other institutions can utilize our methods and that similar lessons can be learned and applied. Furthermore, the validity of our study is bolstered by concordance between the results of this study and those of other studies conducted on the topic of provision of VTE prophylaxis by nurses.13-15,21 Other studies utilized observations and surveys to determine potential nurse-related barriers to the provision of VTE prophylaxis, such as lack of knowledge and the belief that the need for prophylaxis can be determined based on whether or not the patient is ambulating;13,14 however, by utilizing focus group interviews, we allowed nurses to speak in their own voices about their experiences with VTE prophylaxis, and we were able to delve deeper and identify additional barriers that emerged from discussions with nurses, such as the lack of skill and misconceptions of capability.28,29 Second, the study focused solely on nurses. Additional initiatives are underway to assess the roles of resident physicians, attending physicians, and patients in the provision of VTE prophylaxis.
Nursing-related barriers to the provision of VTE chemoprophylaxis include a lack of knowledge, resources, skills, and misconceptions of the consequences of missed elements of VTE prophylaxis. Future initiatives will focus on equipping nurses to have meaningful conversations with patients and engaging patients in their care through development of a multifaceted bundle of interventions. Furthermore, similar methods of qualitative inquiry will be used to identify the role of resident and attending physicians and patients in the provision of VTE chemoprophylaxis.
Acknowledgments
The authors thank Sonali Oberoi, Joanne Prinz, Nancy Tomaska, and Kate Paredes, as well as all the nurses who participated in focus group interviews for this study and the nurse managers and clinical coordinators who helped to schedule the focus group interviews.
Disclosures
The authors declare that they have no competing interests.
Funding
This study was funded by the Surgical Outcomes and Quality Improvement Center at Northwestern University.
1. Beckman MG, Hooper WC, Critchley SE, Ortel TL. Venous thromboembolism: a public health concern. Am J Prev Med. 2010;38(4):S495-S501. https://doi.org/10.1016/j.amepre.2009.12.017.
2. Falck-Ytter Y, Francis CW, Johanson NA, et al. Prevention of VTE in orthopedic surgery patients: Antithrombotic Therapy and Prevention of Thrombosis, 9th ed: American College of Chest Physicians evidence-based clinical practice guidelines. Chest. 2012;141(2):e278S-e325S. https://doi.org/10.1378/chest.11-2404.
3. Gould MK, Garcia DA, Wren SM, et al. Prevention of VTE in nonorthopedic surgical patients: antithrombotic therapy and prevention of thrombosis: American College of Chest Physicians evidence-based clinical practice guidelines. Chest. 2012;141(2):e227S-e277S. https://doi.org/10.1378/chest.11-2297.
4. Guyatt GH, Akl EA, Crowther M, et al. Executive summary: antithrombotic therapy and prevention of thrombosis: American College of Chest Physicians evidence-based clinical practice guidelines. Chest. 2012;141(2):7S-47S. https://doi.org/10.1378/chest.1412S3.
5. Office of the Surgeon General. National Heart L, and Blood Institute. The Surgeon General’s Call to Action to Prevent Deep Vein Thrombosis and Pulmonary Embolism. Rockville, MD; 2008.
6. Geerts WH, Pineo GF, Heit JA, et al. Prevention of venous thromboembolism: the Seventh ACCP Conference on Antithrombotic and Thrombolytic Therapy. Chest. 2004;126(3):338S-400S. https://doi.org/10.1378/chest.126.3_suppl.338S.
7. Haut ER, Lau BD, Kraus PS, et al. Preventability of hospital-acquired venous thromboembolism. JAMA Surg. 2015;150(9):912-915. https://doi.org/10.1001/jamasurg.2015.1340.
8. Kahn SR, Solymoss S, Lamping DL, Abenhaim L. Long-term outcomes after deep vein thrombosis: postphlebitic syndrome and quality of life. J Gen Intern Med. 2000;15(6):425-429. https://doi.org/10.1046/j.1525-1497.2000.06419.x.
9. Mahan CE, Holdsworth MT, Welch SM, Borrego M, Spyropoulos AC. Deep-vein thrombosis: a United States cost model for a preventable and costly adverse event. Thromb Haemost. 2011;106(3):405-415. https://doi.org/10.1160/TH11-02-0132.
10. Kinnier CV, Ju MH, Kmiecik T, et al. Development of a novel composite process measure for venous thromboembolism prophylaxis. Med Care. 2016;54(2):210-217. https://doi.org/10.1097/MLR.0000000000000474.
11. Schünemann HJ, Cushman M, Burnett AE, et al. American Society of Hematology 2018 guidelines for management of venous thromboembolism: prophylaxis for hospitalized and nonhospitalized medical patients. Blood Adv. 2018;2(22):3198-3225. https://doi.org/10.1182/bloodadvances.2018022954.
12. Lau BD, Streiff MB, Kraus PS, et al. Missed doses of venous thromboembolism (VTE) prophylaxis at community hospitals: cause for alarm. J Gen Intern Med. 2018;33(1):19-20. https://doi.org/10.1007/s11606-017-4203-y.
13. Elder S, Hobson DB, Rand CS, et al. Hidden barriers to delivery of pharmacological venous thromboembolism prophylaxis: the role of nursing beliefs and practices. J Patient Saf. 2016;12(2):63-68. https://doi.org/10.1097/PTS.0000000000000086.
14. Lee JA, Grochow D, Drake D, et al. Evaluation of hospital nurses’ perceived knowledge and practices of venous thromboembolism assessment and prevention. J Vasc Nurs. 2014;32(1):18-24. https://doi.org/10.1016/j.jvn.2013.06.001.
15. Shermock KM, Lau BD, Haut ER, et al. Patterns of non-administration of ordered doses of venous thromboembolism prophylaxis: implications for novel intervention strategies. PLOS ONE. 2013;8(6):e66311. https://doi.org/10.1371/journal.pone.0066311.
16. Lipworth W, Taylor N, Braithwaite J. Can the theoretical domains framework account for the implementation of clinical quality interventions? BMC Health Serv Res. 2013;13(1):530. https://doi.org/10.1186/1472-6963-13-530.
17. Taylor N, Lawton R, Moore S, et al. Collaborating with front-line healthcare professionals: the clinical and cost effectiveness of a theory based approach to the implementation of a national guideline. BMC Health Serv Res. 2014;14(1):648. https://doi.org/10.1186/s12913-014-0648-4.
18. Cane J, O’Connor D, Michie S. Validation of the theoretical domains framework for use in behaviour change and implementation research. Implement Sci. 2012;7(1):37. https://doi.org/10.1186/1748-5908-7-37.
19. Bogdan R, Biklen S. Qualitative Research for Education: an Introduction to Theory and Methods. Boston: Allyn & Bacon; 1992.
20. Creswell J. Research Design: Qualitative and Quantitative Approaches. Thousand Oaks, CA: Sage Publications; 1994.
21. Patton M. Qualitative Research & Evaluation Methods: Integrating Theory and Practice. 4th ed. Thousand Oaks, CA: SAGE Publications, Inc.; 2014.
22. Alexander KE, Brijnath B, Mazza D. Barriers and enablers to delivery of the Healthy Kids Check: an analysis informed by the theoretical domains framework and COM-B model. Implement Sci. 2014;9(1):60. https://doi.org/10.1186/1748-5908-9-60.
23. Birken SA, Presseau J, Ellis SD, Gerstel AA, Mayer DK. Potential determinants of health-care professionals’ use of survivorship care plans: a qualitative study using the theoretical domains framework. Implement Sci. 2014;9(1):167. https://doi.org/10.1186/s13012-014-0167-z.
24. Atkins L, Francis J, Islam R, et al. A guide to using the theoretical domains framework of behaviour change to investigate implementation problems. Implement Sci. 2017;12(1):77. https://doi.org/10.1186/s13012-017-0605-9.
25. Lincoln YS, Guba EG. Naturalistic Inquiry. Newbury Park, CA: Sage Publications; 1985.
26. Berlin G. MAXQDA, Software for Qualitative Data Analysis. VERBI Software – Consult. Sozialforschung GmbH [computer program]; 1989-2016.
27. Lipmanowicz H. Buy-in v. ownership. Liberating Structures. http://www.liberatingstructures.com/hl-articles/. Accessed July 5, 2019.
28. Morgan D. Why Should You Use Focus Groups? and what focus groups are (and are not). In: The Focus Group Guidebook. Thousand Oaks, CA: Sage Publications; 1998:9-15, 29-35.
29. Sofaer S. Qualitative methods: what are they and why use them? Health Serv Res. 1999;34(5):1101-1118.
Venous thromboembolism (VTE), comprising deep venous thrombosis and pulmonary embolism (PE),1 is a serious medical condition that results in preventable morbidity and mortality.1-5 VTE affects all age groups, all races/ethnicities, and both genders, but there are known factors that increase the risk of developing VTE (eg, advanced age, undergoing surgery, hospitalization, and immobility).1-3,5-7 Prevention of VTE among hospitalized patients is of paramount importance to avoid preventable death, chronic illness/long-term complications,8 longer hospital stays, and increased hospital costs.9 Fortunately, there is clear evidence that provision of appropriate prophylaxis can decrease the risk of a VTE event occurring, and broadly accepted best-practice guidelines reflect this evidence.3,5
Given the inadequacy of current VTE-related quality measures to identify actionable failures in the provision of VTE prophylaxis, our group created a VTE process-of-care measure to assess adherence to the components of VTE prophylaxis: (1) early ambulation, (2) mechanical prophylaxis (sequential compression devices [SCDs]), and (3) chemoprophylaxis administered at the correct dose and frequency for the duration of the patient’s hospital stay.3,10,11 This quality measure was conceived, created, and iteratively revised to measure whether optimal care is provided to patients throughout their hospitalization and identify actionable areas in which failures of care occur, in order to decrease the risk of a VTE event. Data from our institution provided evidence that while ambulation and SCD component measure adherence is high, chemoprophylaxis adherence required significant improvement.10 When chemoprophylaxis process measure adherence data were analyzed further, a major failure mode was patient refusal of one or more doses. However, the drivers of patient refusal are not well defined in the literature, and previous studies have called for a greater focus on developing interventions to improve VTE chemoprophylaxis administration.12
Previous research has shown that nurses can influence patient compliance with VTE prophylaxis.13-15 A mixed-methods study by Elder et al. found that nurses in units with high rates of failure to provide optimal chemoprophylaxis offered the medication as optional, leading researchers to conclude that nurses perceived chemoprophylaxis as discretionary.13 Another study by Lee et al., conducted a survey of bedside registered nurses and identified nurses’ lack of education on VTE prevention as a significant barrier to providing care.14 These studies show that multiple levels of influence impact how nurses provide VTE chemoprophylaxis, particularly when they encounter patients who refuse chemoprophylaxis.
To explore the nuance and interplay of multiple influences, we used the Theoretical Domains Framework (TDF), an integrative framework that applies theoretical approaches to interventions aimed at behavior change.15-18 The framework contains 14 interrelated domains that characterize the behavior being studied, in this case, administration of VTE chemoprophylaxis. Consequently, we designed a nurse-focused, qualitative evaluation with the objective to identify nursing-related barriers to administration of VTE chemoprophylaxis.
METHODS
Inpatient Unit Selection
The study team accessed data from the hospital’s Enterprise Data Warehouse to review patient refusal rates of VTE chemoprophylaxis for each inpatient unit in the hospital. Patient refusal was utilized as a proxy measure for the behavior of nurses attempting to administer VTE chemoprophylaxis. Of the 14 medical and surgical units in the hospital, two medical and two surgical units were selected to participate in the qualitative evaluation based on having the highest patient refusal rates. One unit (surgical) was also selected to serve as a benchmark because it had the lowest patient refusal rate. Table 1 includes the refusal rates for the five units. Given the low refusal rate for the best performing unit, we suspected that it would be possible to decrease the patient refusal rate for other units with similar patient populations and interprofessional teams at the institution.
Observations
We observed chemoprophylaxis administration on the five units to understand the process for ordering and administering chemoprophylaxis. An observation protocol was utilized to document the date, time, and location of the observation as well as descriptive notes including accounts of particular events.19,20 Observations occurred in May 2016 and informed the creation of a process map outlining the procedure for ordering and administering VTE chemoprophylaxis. The process map was utilized to create the focus group interview guide and ensure the interview guide included pertinent questions for each step of the process (Appendix A).
Focus Group Interviews
We conducted focus group interviews with day and night shift nurses on the five units to assess nurses’ understanding of VTE chemoprophylaxis and nurses’ perceptions of barriers to administration of VTE chemoprophylaxis. The study team chose to conduct focus group interviews in an effort to maximize participation and to speak with multiple nurses within a shorter period of time. The focus group structure allowed the study team to speak with nurses during their shifts, as one could briefly step out, if required, for patient care and return to rejoin the discussion.
We developed a semistructured interview guide21 with questions focused on identifying nurses’ perceptions of guideline-recommended care for VTE chemoprophylaxis, where they learned these guidelines, how nurses discuss chemoprophylaxis with patients, how they handle the conversation with patients who refuse, and if there are times when chemoprophylaxis is not necessary. The interview guide was vetted by a multidisciplinary team consisting of clinical nursing coordinators and nurse managers from medical and surgical units, hospital quality leaders, surgeons and general internists, and qualitative research experts. The interview guide is included as Appendix B.
The unit clinical coordinators and nurse managers identified dates and times for the focus groups that would be minimally disruptive to the unit. For each of the four units with a high patient refusal rate, two focus groups were conducted during the lunch hour and one was conducted at the end of the night shift to ensure that both day and night shift nurses were included in the study. Two focus groups were conducted with the best-practice unit during the lunch hour. For each focus group, the clinical coordinator identified two to eight nurses who could step away from patient care to participate or who had completed their shifts. In total, approximately 67 nurses participated in the focus groups.
The focus groups (n = 14) lasted approximately 40 minutes during May and June 2016. Two members of the study team cofacilitated interviews, which were recorded and transcribed verbatim.
Coding and Data Analysis
To develop the code book, the study team, consisting of three qualitative researchers, independently read one focus group transcript and applied the TDF domains to the nurses’ perceptions of barriers to administration of VTE chemoprophylaxis.21-24 In addition to coding by domain, the study team also coded nursing perceptions as barriers or facilitators. The study team reviewed the coded transcript and reconciled any differences in coding. This process was repeated for a second transcript, and then all remaining transcripts were assigned to two out of three study team members for coding, with the entire study team meeting to reconcile any differences. If necessary, the team member who did not code a transcript acted as the tie-breaker if there were discrepancies in codes that could not be reconciled.
Once coding was completed, we identified the TDF domains that were most relevant to the administration of VTE chemoprophylaxis.16 Member checking (testing the analysis, interpretations, and conclusions with members of those groups from whom the data were originally obtained) was performed with the four clinical nursing coordinators and four nurse managers from the participating units to establish face validity of the themes identified from the focus group interviews.25
The study team used MaxQDA, V12 (Berlin, Germany) to support data coding and analysis.26 The Northwestern University institutional review board office deemed this project research on nonhuman-subjects because it focused on the process of providing VTE chemoprophylaxis and not about the patients themselves. The purpose of the study was explained at the beginning of each focus group, and nurses gave verbal consent to have the focus group recorded.
RESULTS
We conducted 14 focus groups with day and night shift nurses from five units (two medical and three surgical) at a single institution. All nurses invited to participate in a focus group agreed to participate. The data were coded and grouped by domain and identified as barriers or facilitators. The findings included below are for the domains most relevant to the provision of VTE prophylaxis. Table 2 provides illustrative verbatim quotes for each domain that was represented in the focus groups.
THEORETICAL DOMAINS FRAMEWORK DOMAINS
Knowledge
All interviewees recognized that providing some form of prophylaxis to mitigate the risk of a VTE event is essential. Some nurses stated that seeing a patient ambulating meant they would consider not administering prescribed chemoprophylaxis, while others would try to negotiate with patients by asking the patient to allow one dose of chemoprophylaxis prescribed two to three times daily because it was better than receiving no doses.
Environmental Context and Resources
Multiple barriers to providing optimal care were associated with the environmental context and a lack of resources. There was a lack of accessible, comprehensive, patient-centered education materials on VTE chemoprophylaxis to supplement a nurse’s explanation about the importance of chemoprophylaxis. Furthermore, many nurses cited the perceived patient pain of chemoprophylaxis injections as the main deterrent to patient compliance, especially subcutaneous heparin injections, which occur up to three times in 24 hours and often cause more pain at the site of injection than low-molecular-weight heparin. Nurses felt that transitioning patients from receiving subcutaneous heparin injections to receiving low-molecular-weight heparin could be a main driver to reduce patient refusals.
Skills
Nurses felt inadequately equipped to handle patient refusals. Many said that patient refusal of treatments was never discussed in nursing school. As a result, when patients refused treatments, the nurses did not know how to handle the situation. They felt that they lacked the tools and techniques to persuade the patient to comply.
Beliefs about Capabilities
Nurses did not know their own patient refusal rate or benchmarks of an acceptable refusal rate in contrast to one that is too high. Without this feedback, they were unable to assess their own behavior or performance related to providing VTE chemoprophylaxis.
DISCUSSION
Nurses play a critical role in providing VTE chemoprophylaxis to patients throughout their hospitalization. This study provided a unique opportunity to perform an in-depth, qualitative analysis of the barriers nurses face in providing patients with VTE chemoprophylaxis as part of their daily work caring for patients. We discovered several nursing-related barriers to the provision of VTE chemoprophylaxis, including lack of knowledge, resources, skill, and misconceptions of their capability to provide VTE chemoprophylaxis. We used a bottom-up approach by incorporating the voices of unit nurses, clinical coordinators, and nurse managers to understand potential barriers. Our findings brought to light the challenge of delivering standardized care in an area of care that is generally agreed upon, yet not fully followed. Some nurses display greater proficiency than others at communicating with patients who do not understand their risk for VTE and need for chemoprophylaxis. Furthermore, there is a pronounced misconception around the delivery of VTE chemoprophylaxis. Nurses have the inaccurate belief that even if ordered, chemoprophylaxis is not required. This misconception was widespread among nurses taking care of both medical and surgical patients. These factors appear to be modifiable targets for quality improvement and highlight the need for a skills-based education during the new hire onboarding process, as well as ongoing reeducation to ensure nursing staff have the skills to appropriately provide best-practice care for VTE chemoprophylaxis. Nurses felt ownership of the results of the qualitative evaluation because they were included in every aspect from the beginning.27 This sense of ownership will support future quality improvement efforts to develop a skills-based intervention to improve the provision of VTE chemoprophylaxis.18,27
This study has certain limitations. First, it was a qualitative study assessing nursing-related barriers to providing VTE chemoprophylaxis at a single institution, and the results cannot be generalized broadly. However, the techniques and results are transferable to other hospital settings and other clinical care situations. Thus, we believe that other institutions can utilize our methods and that similar lessons can be learned and applied. Furthermore, the validity of our study is bolstered by concordance between the results of this study and those of other studies conducted on the topic of provision of VTE prophylaxis by nurses.13-15,21 Other studies utilized observations and surveys to determine potential nurse-related barriers to the provision of VTE prophylaxis, such as lack of knowledge and the belief that the need for prophylaxis can be determined based on whether or not the patient is ambulating;13,14 however, by utilizing focus group interviews, we allowed nurses to speak in their own voices about their experiences with VTE prophylaxis, and we were able to delve deeper and identify additional barriers that emerged from discussions with nurses, such as the lack of skill and misconceptions of capability.28,29 Second, the study focused solely on nurses. Additional initiatives are underway to assess the roles of resident physicians, attending physicians, and patients in the provision of VTE prophylaxis.
Nursing-related barriers to the provision of VTE chemoprophylaxis include a lack of knowledge, resources, skills, and misconceptions of the consequences of missed elements of VTE prophylaxis. Future initiatives will focus on equipping nurses to have meaningful conversations with patients and engaging patients in their care through development of a multifaceted bundle of interventions. Furthermore, similar methods of qualitative inquiry will be used to identify the role of resident and attending physicians and patients in the provision of VTE chemoprophylaxis.
Acknowledgments
The authors thank Sonali Oberoi, Joanne Prinz, Nancy Tomaska, and Kate Paredes, as well as all the nurses who participated in focus group interviews for this study and the nurse managers and clinical coordinators who helped to schedule the focus group interviews.
Disclosures
The authors declare that they have no competing interests.
Funding
This study was funded by the Surgical Outcomes and Quality Improvement Center at Northwestern University.
1. Beckman MG, Hooper WC, Critchley SE, Ortel TL. Venous thromboembolism: a public health concern. Am J Prev Med. 2010;38(4):S495-S501. https://doi.org/10.1016/j.amepre.2009.12.017.
2. Falck-Ytter Y, Francis CW, Johanson NA, et al. Prevention of VTE in orthopedic surgery patients: Antithrombotic Therapy and Prevention of Thrombosis, 9th ed: American College of Chest Physicians evidence-based clinical practice guidelines. Chest. 2012;141(2):e278S-e325S. https://doi.org/10.1378/chest.11-2404.
3. Gould MK, Garcia DA, Wren SM, et al. Prevention of VTE in nonorthopedic surgical patients: antithrombotic therapy and prevention of thrombosis: American College of Chest Physicians evidence-based clinical practice guidelines. Chest. 2012;141(2):e227S-e277S. https://doi.org/10.1378/chest.11-2297.
4. Guyatt GH, Akl EA, Crowther M, et al. Executive summary: antithrombotic therapy and prevention of thrombosis: American College of Chest Physicians evidence-based clinical practice guidelines. Chest. 2012;141(2):7S-47S. https://doi.org/10.1378/chest.1412S3.
5. Office of the Surgeon General. National Heart L, and Blood Institute. The Surgeon General’s Call to Action to Prevent Deep Vein Thrombosis and Pulmonary Embolism. Rockville, MD; 2008.
6. Geerts WH, Pineo GF, Heit JA, et al. Prevention of venous thromboembolism: the Seventh ACCP Conference on Antithrombotic and Thrombolytic Therapy. Chest. 2004;126(3):338S-400S. https://doi.org/10.1378/chest.126.3_suppl.338S.
7. Haut ER, Lau BD, Kraus PS, et al. Preventability of hospital-acquired venous thromboembolism. JAMA Surg. 2015;150(9):912-915. https://doi.org/10.1001/jamasurg.2015.1340.
8. Kahn SR, Solymoss S, Lamping DL, Abenhaim L. Long-term outcomes after deep vein thrombosis: postphlebitic syndrome and quality of life. J Gen Intern Med. 2000;15(6):425-429. https://doi.org/10.1046/j.1525-1497.2000.06419.x.
9. Mahan CE, Holdsworth MT, Welch SM, Borrego M, Spyropoulos AC. Deep-vein thrombosis: a United States cost model for a preventable and costly adverse event. Thromb Haemost. 2011;106(3):405-415. https://doi.org/10.1160/TH11-02-0132.
10. Kinnier CV, Ju MH, Kmiecik T, et al. Development of a novel composite process measure for venous thromboembolism prophylaxis. Med Care. 2016;54(2):210-217. https://doi.org/10.1097/MLR.0000000000000474.
11. Schünemann HJ, Cushman M, Burnett AE, et al. American Society of Hematology 2018 guidelines for management of venous thromboembolism: prophylaxis for hospitalized and nonhospitalized medical patients. Blood Adv. 2018;2(22):3198-3225. https://doi.org/10.1182/bloodadvances.2018022954.
12. Lau BD, Streiff MB, Kraus PS, et al. Missed doses of venous thromboembolism (VTE) prophylaxis at community hospitals: cause for alarm. J Gen Intern Med. 2018;33(1):19-20. https://doi.org/10.1007/s11606-017-4203-y.
13. Elder S, Hobson DB, Rand CS, et al. Hidden barriers to delivery of pharmacological venous thromboembolism prophylaxis: the role of nursing beliefs and practices. J Patient Saf. 2016;12(2):63-68. https://doi.org/10.1097/PTS.0000000000000086.
14. Lee JA, Grochow D, Drake D, et al. Evaluation of hospital nurses’ perceived knowledge and practices of venous thromboembolism assessment and prevention. J Vasc Nurs. 2014;32(1):18-24. https://doi.org/10.1016/j.jvn.2013.06.001.
15. Shermock KM, Lau BD, Haut ER, et al. Patterns of non-administration of ordered doses of venous thromboembolism prophylaxis: implications for novel intervention strategies. PLOS ONE. 2013;8(6):e66311. https://doi.org/10.1371/journal.pone.0066311.
16. Lipworth W, Taylor N, Braithwaite J. Can the theoretical domains framework account for the implementation of clinical quality interventions? BMC Health Serv Res. 2013;13(1):530. https://doi.org/10.1186/1472-6963-13-530.
17. Taylor N, Lawton R, Moore S, et al. Collaborating with front-line healthcare professionals: the clinical and cost effectiveness of a theory based approach to the implementation of a national guideline. BMC Health Serv Res. 2014;14(1):648. https://doi.org/10.1186/s12913-014-0648-4.
18. Cane J, O’Connor D, Michie S. Validation of the theoretical domains framework for use in behaviour change and implementation research. Implement Sci. 2012;7(1):37. https://doi.org/10.1186/1748-5908-7-37.
19. Bogdan R, Biklen S. Qualitative Research for Education: an Introduction to Theory and Methods. Boston: Allyn & Bacon; 1992.
20. Creswell J. Research Design: Qualitative and Quantitative Approaches. Thousand Oaks, CA: Sage Publications; 1994.
21. Patton M. Qualitative Research & Evaluation Methods: Integrating Theory and Practice. 4th ed. Thousand Oaks, CA: SAGE Publications, Inc.; 2014.
22. Alexander KE, Brijnath B, Mazza D. Barriers and enablers to delivery of the Healthy Kids Check: an analysis informed by the theoretical domains framework and COM-B model. Implement Sci. 2014;9(1):60. https://doi.org/10.1186/1748-5908-9-60.
23. Birken SA, Presseau J, Ellis SD, Gerstel AA, Mayer DK. Potential determinants of health-care professionals’ use of survivorship care plans: a qualitative study using the theoretical domains framework. Implement Sci. 2014;9(1):167. https://doi.org/10.1186/s13012-014-0167-z.
24. Atkins L, Francis J, Islam R, et al. A guide to using the theoretical domains framework of behaviour change to investigate implementation problems. Implement Sci. 2017;12(1):77. https://doi.org/10.1186/s13012-017-0605-9.
25. Lincoln YS, Guba EG. Naturalistic Inquiry. Newbury Park, CA: Sage Publications; 1985.
26. Berlin G. MAXQDA, Software for Qualitative Data Analysis. VERBI Software – Consult. Sozialforschung GmbH [computer program]; 1989-2016.
27. Lipmanowicz H. Buy-in v. ownership. Liberating Structures. http://www.liberatingstructures.com/hl-articles/. Accessed July 5, 2019.
28. Morgan D. Why Should You Use Focus Groups? and what focus groups are (and are not). In: The Focus Group Guidebook. Thousand Oaks, CA: Sage Publications; 1998:9-15, 29-35.
29. Sofaer S. Qualitative methods: what are they and why use them? Health Serv Res. 1999;34(5):1101-1118.
© 2019 Society of Hospital Medicine
Leveraging the Outpatient Pharmacy to Reduce Medication Waste in Pediatric Asthma Hospitalizations
Asthma results in approximately 125,000 hospitalizations for children annually in the United States.1,2 The National Heart, Lung, and Blood Institute guidelines recommend that children with persistent asthma be treated with a daily controller medication, ie, an inhaled corticosteroid (ICS).3 Hospitalization for an asthma exacerbation provides an opportunity to optimize daily controller medications and improve disease self-management by providing access to medications and teaching appropriate use of complicated inhalation devices.
To reduce readmission4 by mitigating low rates of postdischarge filling of ICS prescriptions,5,6 a strategy of “meds-in-hand” was implemented at discharge. “Meds-in-hand” mitigates medication access as a barrier to adherence by ensuring that patients are discharged from the hospital with all required medications in hand, removing any barriers to filling their initial prescriptions.7 The Asthma Improvement Collaborative at Cincinnati Children’s Hospital Medical Center (CCHMC) previously applied quality improvement methodology to implement “meds-in-hand” as a key intervention in a broad strategy that successfully reduced asthma-specific utilization for the 30-day period following an asthma-related hospitalization of publicly insured children from 12% to 7%.8,9
At the onset of the work described in this manuscript, children hospitalized with an acute exacerbation of persistent asthma were most often treated with an ICS while inpatients in addition to a standard short course of oral systemic corticosteroids. Conceptually, inpatient administration of ICS provided the opportunity to teach effective device usage with each inpatient administration and to reinforce daily use of the ICS as part of the patient’s daily home medication regimen. However, a proportion of patients admitted for an asthma exacerbation were noted to receive more than one ICS inhaler during their admission, most commonly due to a change in dose or type of ICS. When this occurred, the initially dispensed inhaler was discarded despite weeks of potential doses remaining. While some hospitals preferentially dispense ICS devices marketed to institutions with fewer doses per device, our pharmacy primarily dispensed ICS devices identical to retail locations containing at least a one-month supply of medication. In addition to the wasted medication, this practice resulted in additional work by healthcare staff, unnecessary patient charges, and potentially contributed to confusion about the discharge medication regimen.
Our specific aim for this quality improvement study was to reduce the monthly percentage of admissions for an acute asthma exacerbation treated with >1 ICS from 7% to 4% over a six-month period.
METHODS
Context
CCHMC is a quaternary care pediatric health system with more than 600 inpatient beds and 800-900 inpatient admissions per year for acute asthma exacerbation. The Hospital Medicine service cares for patients with asthma on five clinical teams across two different campuses. Care teams are supervised by an attending physician and may include residents, fellows, or nurse practitioners. Patients hospitalized for an acute asthma exacerbation may receive a consult from the Asthma Center consult team, staffed by faculty from either the Pediatric Pulmonology or Allergy/Immunology divisions. Respiratory therapists (RTs) administer inhaled medications and provide asthma education.
Planning the Intervention
Our improvement team included physicians from Hospital Medicine and Pulmonary Medicine, an Asthma Education Coordinator, a Clinical Pharmacist, a Pediatric Chief Resident, and a clinical research coordinator. Initial interventions targeted a single resident team at the main campus before spreading improvement activities to all resident teams at the main campus and then the satellite campus by February 2017.
Development of our process map (Figure 1) revealed that the decision for ordering inpatient ICS treatment frequently occurred at admission. Subsequently, the care team or consulting team might make a change in the ICS to fine-tune the outpatient medication regimen given that admission for asthma often results from suboptimal chronic symptom control. Baseline analysis of changes in ICS orders revealed that 81% of ICS changes were associated with a step-up in therapy, defined as an increase in the daily dose of the ICS or the addition of a long-acting beta-agonist. The other common ICS adjustment, accounting for 17%, was a change in corticosteroid without a step-up in therapy, (ie, beclomethasone to fluticasone) that typically occurred near the end of the hospitalization to accommodate outpatient insurance formularies, independent of patient factors related to illness severity.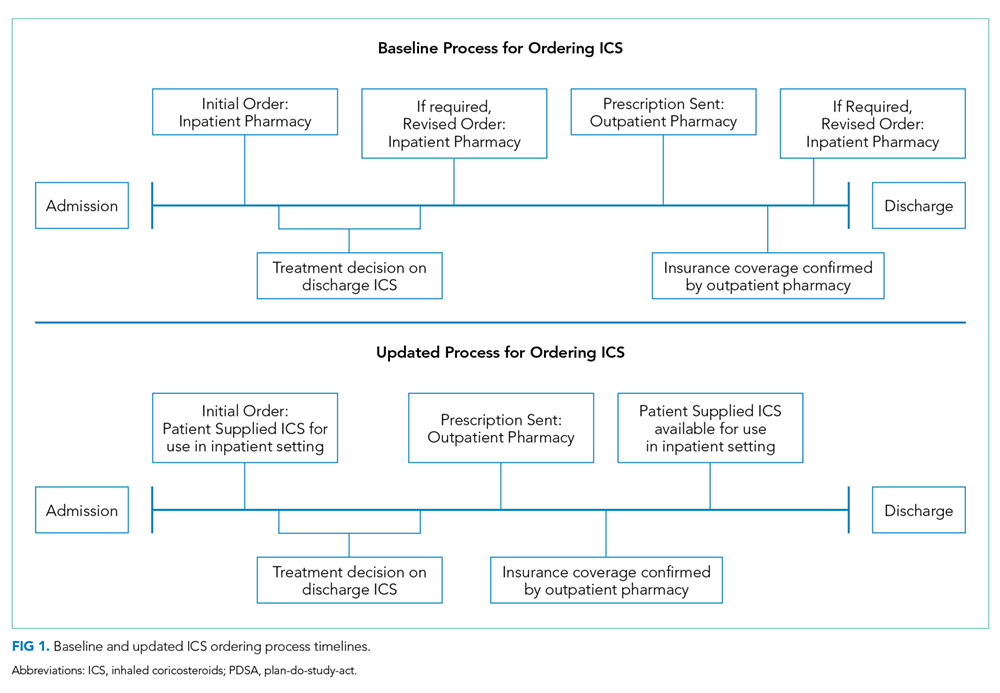
We utilized the model for improvement and sought to decrease the number of patients administered more than one ICS during an admission through a step-wise quality improvement approach, utilizing plan-do-study-act (PDSA) cycles.10 This study was reviewed and designated as not human subjects research by the CCHMC institutional review board.
Improvement Activities
We conceived key drivers or domains that would be necessary to address to effect change. Key drivers included a standardized process for delayed initiation of ICS and confirmation of outpatient insurance prescription drug coverage, prescriber education, and real-time failure notification.
PDSA Interventions
PDSA 1 & 2: Standardized Process for Initiation of ICS
Our initial tests of change targeted the timing of when an ICS was ordered during hospitalization for an asthma exacerbation. Providers were instructed to delay ordering an ICS until the patient’s albuterol treatments were spaced to every three hours and to include a standardized communication prompt within the albuterol order. The prompt instructed the RT to contact the provider once the patient’s albuterol treatments were spaced to every three hours and ask for an ICS order, if appropriate. This intervention was abandoned because it did not reliably occur.
The subsequent intervention delayed the start of ICS treatment by using a PRN indication advising that the ICS was to be administered once the patient’s albuterol treatments were spaced to every three hours. However, after an error resulted in the PRN indication being included on a discharge prescription for an ICS, the PRN indication was abandoned. Subsequent work to develop a standardized process for delayed initiation of ICS occurred as part of the workflow to address the confirmation of outpatient formulary coverage as described next.
PDSA 3: Prioritize the Use of the Institution’s Outpatient Pharmacy
Medication changes that occurred because of outpatient insurance formulary denials were a unique challenge; they required a medication change after the discharge treatment plan had been finalized, and a prescription was already submitted to the outpatient pharmacy. In addition, neither our inpatient electronic medical record nor our inpatient hospital pharmacy has access to decision support tools that incorporate outpatient prescription formulary coverage. Alternatively, outpatient pharmacies have a standard workflow that routinely confirms insurance coverage before dispensing medication. The institutional policy was modified to allow for the inpatient administration of patient-supplied medications, pursuant to an inpatient order. Patient-supplied medications include those brought from home or those supplied by the outpatient pharmacy.
Subsequently, we developed a standardized process to confirm outpatient prescription drug coverage by using our hospital-based outpatient pharmacy to dispense ICS for inpatient treatment and asthma education. This new workflow included placing an order for an ICS at admission as a patient-supplied medication with an administration comment to “please administer once available from the outpatient pharmacy” (Figure 1). Then, once the discharge medication plan is finalized, the prescription is submitted to the outpatient pharmacy. Following verification of insurance coverage, the outpatient pharmacy dispenses the ICS, allowing it to be used for patient education and inpatient administration. If the patient is ineligible to have their prescription filled by the outpatient pharmacy for reasons other than formulary coverage, the ICS is dispensed from the hospital inpatient pharmacy as per the previous standard workflow. Inpatient ICS inhalers are then relabeled for home use per the existing practice to support medications-in-hand.
Further workflow improvements occurred following the development of an algorithm to help the outpatient pharmacy contact the correct inpatient team, and augmentation of the medication delivery process included notification of the RT when the ICS was delivered to the inpatient unit.
PDSA 4: Prescriber Education
Prescribers received education regarding PDSA interventions before testing and throughout the improvement cycle. Education sessions included informal coaching by the Asthma Education Coordinator, e-mail reminders containing screenshots of the ordering process, and formal didactic sessions for ordering providers. The Asthma Education Coordinator also provided education to the nursing and respiratory therapy staff regarding the implemented process and workflow changes.
PDSA 5: Real-Time Failure Notification
To supplement education for the complicated process change, the improvement team utilized a decision support tool (Vigilanz Corp., Chicago, IL) linked to EMR data to provide notification of real-time process failures. When a patient with an admission diagnosis of asthma had a prescription for an ICS verified and dispensed by the inpatient pharmacy, an automated message with relevant patient information would be sent to a member of the improvement team. Following a brief chart review, directed feedback could be offered to the ordering provider, allowing the prescription to be redirected to the outpatient pharmacy.
Study of the Improvement
Patients of all ages, with the International Classification of Diseases, Ninth Revision, and Tenth Revision codes for asthma (493.xx or J45.xx) were included in data collection and analysis if they were treated by the Hospital Medicine service, as the first inpatient service or after transfer from the ICU, and prescribed an ICS with or without a long-acting beta-agonist. Data were collected retrospectively and aggregated monthly. The baseline period was from January 2015 through October 2016. The intervention period was from November 2016 through March 2018. The prolonged baseline and study periods were utilized to understand the seasonal nature of asthma exacerbations.
Measures
Our primary outcome measure was defined as the monthly number of patients admitted to Hospital Medicine for an acute asthma exacerbation administered more than one ICS divided by the total number of asthma patients administered at least one dose of an ICS (patient-supplied or dispensed from the inpatient pharmacy). A full list of ICS is included in the appendix Table.
A secondary process measure approximated our adherence to obtaining ICS from the outpatient pharmacy for inpatient use. All medications administered during hospitalization are documented in the medication administration report. However, only medications dispensed from the inpatient pharmacy are associated with a patient charge. Patient-supplied medications, including those dispensed from the hospital outpatient pharmacy, are not associated with an inpatient charge. Therefore, the secondary process measure was defined as the monthly number of asthma patients administered an ICS not associated with an inpatient charge divided by the total number of asthma patients administered an ICS.
A cost outcome measure was developed to track changes in the average cost of an ICS included on inpatient bills during hospitalization for an asthma exacerbation. This outcome measure was defined as the total monthly cost, using the average wholesale price, of the ICS included on the inpatient bill for an asthma exacerbation, divided by the total number of asthma patients administered at least one dose of an ICS (patient supplied or dispensed from the inpatient pharmacy).
Our a priori intent was to reduce ICS medication waste while maintaining a highly reliable system that included inpatient administration and education with ICS devices and maintain our medications-in-hand practice. A balancing measure was developed to monitor the reliability of inpatient administration of ICS. It was defined as the monthly number of patients who received a discharge prescription for an ICS and were administered an ICS while an inpatient divided by the total number of asthma patients with a discharge prescription for an ICS.
Analysis
Measures were evaluated using statistical process control charts and special cause variation was determined by previously established rules. Our primary, secondary, and balancing measures were all evaluated using a p-chart with variable subgroup size. The cost outcome measure was evaluated using an X-bar S control chart.11-13
RESULTS
Primary Outcome Measure
During the baseline period, 7.4% of patients admitted to Hospital Medicine for an acute asthma exacerbation were administered more than one ICS, ranging from 0%-20% of patients per month (Figure 2). Following the start of our interventions, we met criteria for special cause allowing adjustment of the centerline.13 The mean percentage of patients receiving more than one ICS decreased from 7.4% to 0.7%. Figure 2 includes the n-value displayed each month and represents all patients admitted to the Hospital Medicine service with an asthma exacerbation who were administered at least one ICS.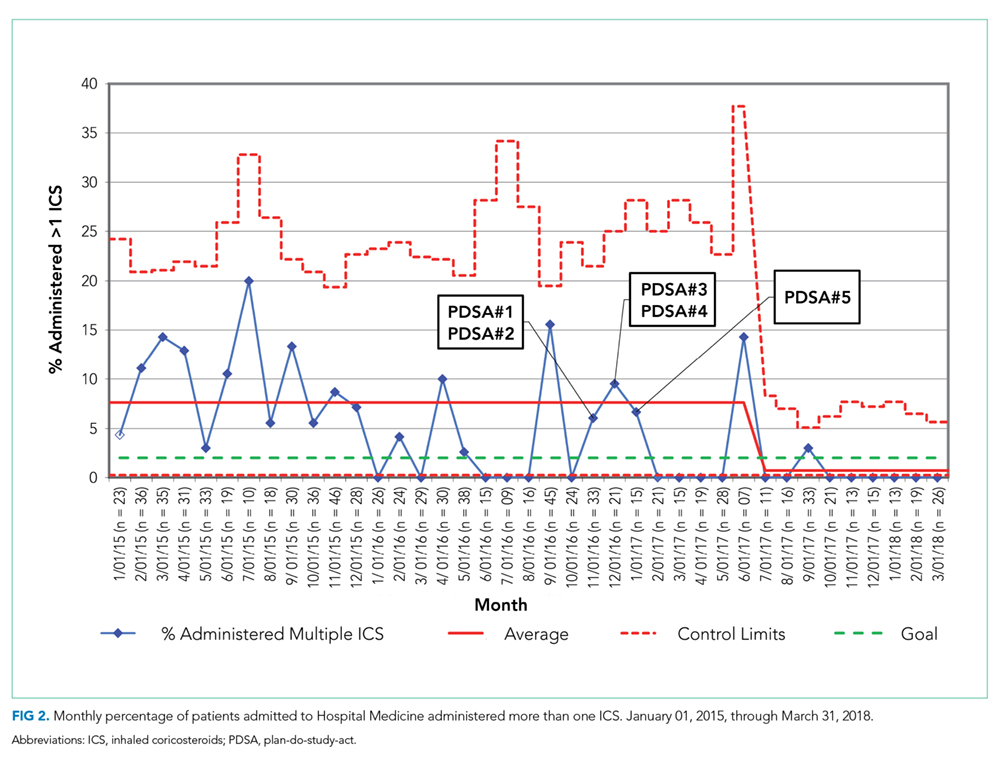
Secondary Process Measure
During the baseline period, there were only rare occurrences (less than 1%) of a patient-supplied ICS being administered during an asthma admission. Following the start of our intervention period, the frequency of inpatient administration of patient-supplied ICS showed a rapid increase and met rules for special cause with an increase in the mean percent from 0.7% to 50% (Figure 3). The n-value displayed each month represents all patients admitted to the Hospital Medicine service for an asthma exacerbation administered at least one ICS.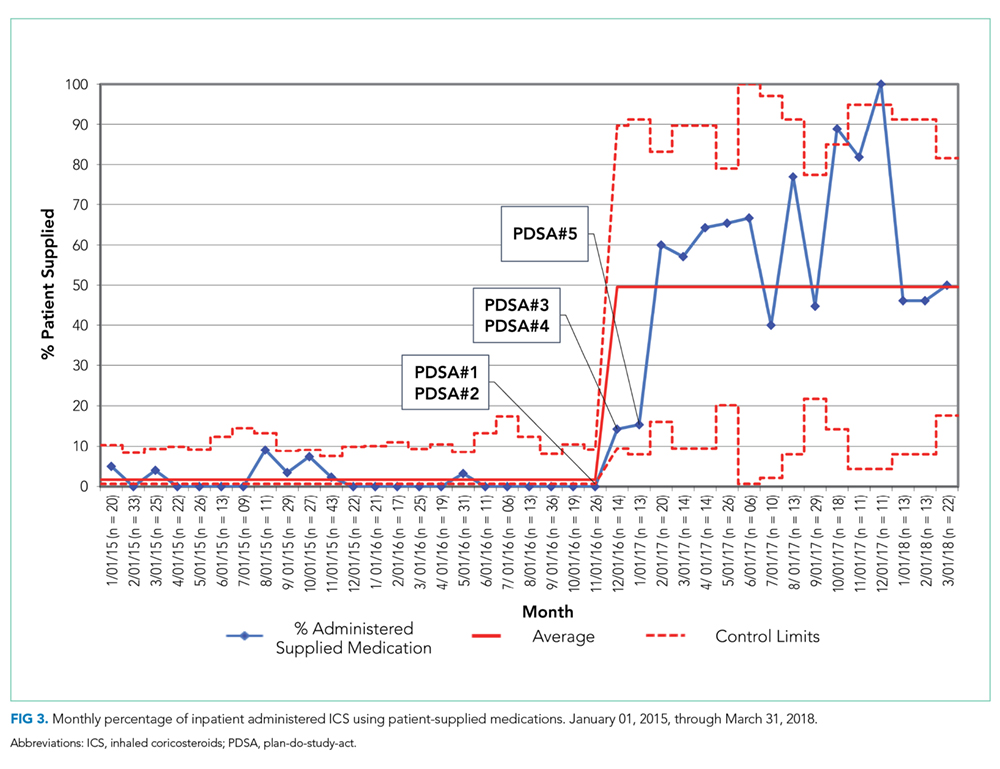
Cost Outcome Measure
The average cost of an ICS billed during hospitalization for an acute asthma exacerbation was $236.57 per ICS during the baseline period. After the intervention period, the average inpatient cost for ICS decreased by 62% to $90.25 per ICS (Figure 4).
Balancing Measure
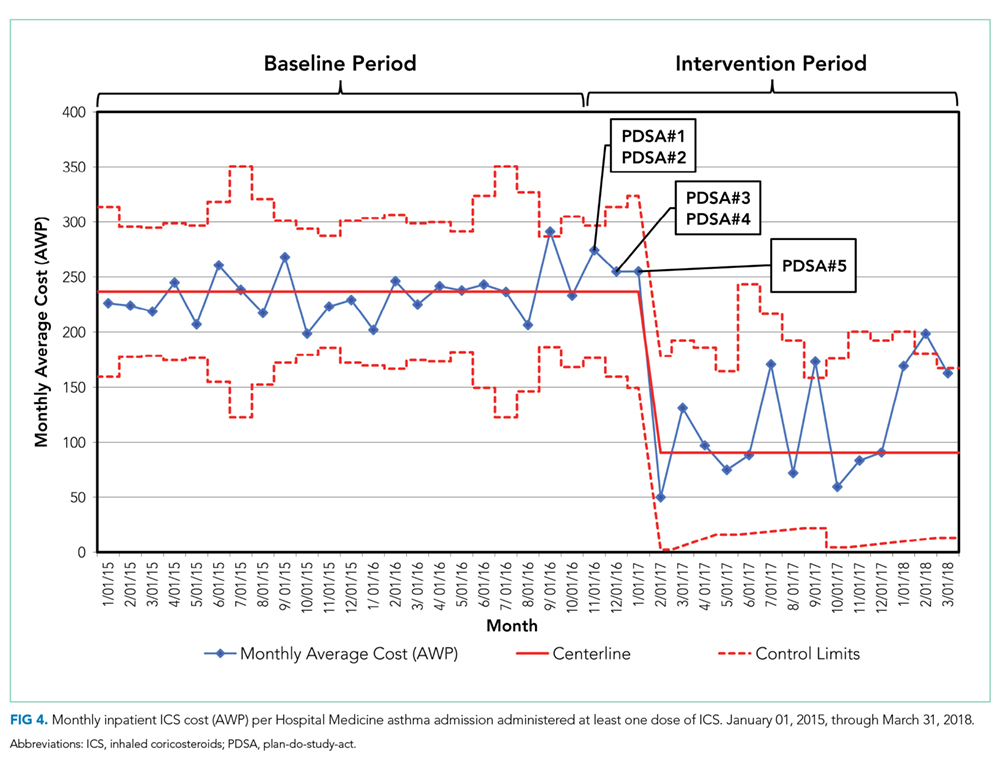
DISCUSSION
Our team reduced the monthly percent of children hospitalized with an acute asthma exacerbation administered more than one ICS from 7.4% to 0.7% after implementation of a new workflow process for ordering ICS utilizing the hospital-based outpatient pharmacy. The new workflow delayed ordering and administration of the initial inpatient ICS treatment, allowing time to consider a step-up in therapy. The brief delay in initiating ICS is not expected to have clinical consequence given the concomitant treatment with systemic corticosteroids. In addition, the outpatient pharmacy was utilized to verify insurance coverage reliably prior to dispensing ICS, reducing medication waste, and discharge delays due to outpatient medication formulary conflicts.
Our hospital’s previous approach to inpatient asthma care resulted in a highly reliable process to ensure patients were discharged with medications-in-hand as part of a broader system that effectively decreased reutilization. However, the previous process inadvertently resulted in medication waste. This waste included nearly full inhalers being discarded, additional work by the healthcare team (ordering providers, pharmacists, and RTs), and unnecessary patient charges.
While the primary driver of our decision to use the outpatient pharmacy was to adjudicate insurance prescription coverage reliably to prevent waste, this change likely resulted in a financial benefit to patients. The average cost per asthma admission of an inpatient billed for ICS using the average wholesale price, decreased by 62% following our interventions. The decrease in cost was primarily driven by using patient-supplied medications, including prescriptions newly filled by the on-site outpatient pharmacy, whose costs were not captured in this measure. While our secondary measure may underestimate the total expense incurred by families for an ICS, families likely receive their medications at a lower cost from the outpatient pharmacy than if the ICS was provided by an inpatient pharmacy. The average wholesale price is not what families are charged or pay for medications, partly due to differences in overhead costs that result in inpatient pharmacies having significantly higher charges than outpatient pharmacies. In addition, the 6.7% absolute reduction of our primary measure resulted in direct savings by reducing inpatient medication waste. Our process results in 67 fewer wasted ICS devices ($15,960) per 1,000 admissions for asthma exacerbation, extrapolated using the average cost ($238.20, average wholesale price) of each ICS during the baseline period.
Our quality improvement study had several limitations. (1) The interventions occurred at a single center with an established culture that embraces quality improvement, which may limit the generalizability of the work. (2) Our process verified insurance coverage with a hospital-based outpatient pharmacy. Some ICS prescriptions continued to be dispensed from the inpatient pharmacy, limiting our ability to verify insurance coverage. Local factors, including regulatory restrictions and delivery requirements, may limit the generalizability of using an outpatient pharmacy in this manner. (3) We achieved our goal of decreasing medication waste, but our a priori goal was to maintain our commitment to our established practice of interactive patient education with an ICS device as well as medications-in-hand at time of discharge. Our balancing measure showed a decrease in the percent of patients with a discharge prescription for an ICS who also received an inpatient dose of that ICS. This implies a decreased fidelity in our previously established education protocols. We had postulated that this occurred when the patient-supplied medication arrived on the day of discharge, but not close to when the medication was scheduled on the medication administration report, preventing administration. However, this is not a direct measure of patients receiving medications-in-hand or interactive medication education. Both may have occurred without administration of the ICS. (4) Despite a hospital culture that embraces quality improvement, this project required a significant change in the workflow that required considerable education at the time of implementation to integrate the new process reliably. However, once the process was in place, we have been able to sustain our improvement with limited educational investment.
CONCLUSIONS
Implementation of a new process for ordering ICS that emphasized delaying treatment until all necessary information was available and using an outpatient pharmacy to confirm insurance formulary coverage reduced the waste associated with more than one ICS being prescribed during a single admission.
Acknowledgments
The authors thank Sally Pope, MPH and Dr. Michael Carlisle, MD for their contribution to the quality improvement project. Thank you to Drs. Karen McDowell, MD and Carolyn Kercsmar, MD for advisement of our quality improvement project.
The authors appreciate the following individuals for their invaluable contributions. Dr. Hoefgen conceptualized and designed the study, was a member of the primary improvement team, carried out initial analysis, drafted the initial manuscript, and reviewed and revised the manuscript. Drs. Jones and Torres Garcia, and Mr. Hare were members of the primary improvement team who contributed to the design of the quality improvement study and interventions, ongoing data interpretation, and critically reviewed the manuscript. Dr. Courter contributed to the conceptualization and designed the study, was a member of the primary improvement team, designed data collection instruments, and critically reviewed and revised the manuscript. Dr. Simmons conceptualized and designed the study, critically reviewed the manuscript for important intellectual content, and reviewed and revised the manuscript. All authors approved the final manuscript as submitted and agree to be accountable for all aspects of the work.
Disclaimer
The information or content and conclusions are those of the author and should not be construed as the official position or policy of, nor should any endorsements be inferred by the BHPR, HRSA, DHHS, or the U.S. Government.
1. Akinbami LJ, Simon AE, Rossen LM. Changing trends in asthma prevalence among children. Pediatrics. 2016;137(1):e20152354. https://doi.org/10.1542/peds.2015-2354.
2. HCUP Databases. Healthcare Cost and Utilization Project (HCUP). www.hcup.us.ahrq.gov/kidoverview.jsp. Published 2016. Accessed September 14, 2016.
3. NHLBI. Expert Panel Report 3 (EPR-3): Guidelines for the diagnosis and management of asthma–summary report 2007. J Allergy Clin Immunol. 2007;120(5):S94-S138. https://doi.org/10.1016/j.jaci.2007.09.029.
4. Kenyon CC, Rubin DM, Zorc JJ, Mohamad Z, Faerber JA, Feudtner C. Childhood asthma hospital discharge medication fills and risk of subsequent readmission. J Pediatr. 2015;166(5):1121-1127. https://doi.org/10.1016/j.jpeds.2014.12.019.
5. Bollinger ME, Mudd KE, Boldt A, Hsu VD, Tsoukleris MG, Butz AM. Prescription fill patterns in underserved children with asthma receiving subspecialty care. Ann Allergy Asthma Immunol. 2013;111(3):185-189. https://doi.org/10.1016/j.anai.2013.06.009.
6. Cooper WO, Hickson GB. Corticosteroid prescription filling for children covered by Medicaid following an emergency department visit or a hospitalization for asthma. Arch Pediatr Adolesc Med. 2001;155(10):1111-1115. https://doi.org/10.1001/archpedi.155.10.1111.
7. Hatoun J, Bair-Merritt M, Cabral H, Moses J. Increasing medication possession at discharge for patients with asthma: the Meds-in-Hand Project. Pediatrics. 2016;137(3):e20150461-e20150461. https://doi.org/10.1542/peds.2015-0461.
8. Kercsmar CM, Beck AF, Sauers-Ford H, et al. Association of an asthma improvement collaborative with health care utilization in medicaid-insured pediatric patients in an urban community. JAMA Pediatr. 2017;171(11):1072-1080. https://doi.org/10.1001/jamapediatrics.2017.2600.
9. Sauers HS, Beck AF, Kahn RS, Simmons JM. Increasing recruitment rates in an inpatient clinical research study using quality improvement methods. Hosp Pediatr. 2014;4(6):335-341. https://doi.org/10.1542/hpeds.2014-0072.
10. Langley GJ, Moen R, Nolan KM, Nolan TW, Norman CL, Provost LP. The Improvement Guide: A Practical Approach to Enhancing Organizational Performance. Hoboken: John Wiley & Sons, Inc.; 2009.
11. Benneyan JC, Lloyd RC, Plsek PE. Statistical process control as a tool for research and healthcare improvement. Qual Saf Health Care. 2003;12(6):458-464. https://doi.org/10.1136/qhc.12.6.458.
12. Mohammed MA, Panesar JS, Laney DB, Wilson R. Statistical process control charts for attribute data involving very large sample sizes: a review of problems and solutions. BMJ Qual Saf. 2013;22(4):362-368. https://doi.org/10.1136/bmjqs-2012-001373.
13. Moen R, Nolan T, Provost L. Quality Improvement through Planned Experimentation. 2nd ed. New York City: McGraw-Hill Professional; 1998.
Asthma results in approximately 125,000 hospitalizations for children annually in the United States.1,2 The National Heart, Lung, and Blood Institute guidelines recommend that children with persistent asthma be treated with a daily controller medication, ie, an inhaled corticosteroid (ICS).3 Hospitalization for an asthma exacerbation provides an opportunity to optimize daily controller medications and improve disease self-management by providing access to medications and teaching appropriate use of complicated inhalation devices.
To reduce readmission4 by mitigating low rates of postdischarge filling of ICS prescriptions,5,6 a strategy of “meds-in-hand” was implemented at discharge. “Meds-in-hand” mitigates medication access as a barrier to adherence by ensuring that patients are discharged from the hospital with all required medications in hand, removing any barriers to filling their initial prescriptions.7 The Asthma Improvement Collaborative at Cincinnati Children’s Hospital Medical Center (CCHMC) previously applied quality improvement methodology to implement “meds-in-hand” as a key intervention in a broad strategy that successfully reduced asthma-specific utilization for the 30-day period following an asthma-related hospitalization of publicly insured children from 12% to 7%.8,9
At the onset of the work described in this manuscript, children hospitalized with an acute exacerbation of persistent asthma were most often treated with an ICS while inpatients in addition to a standard short course of oral systemic corticosteroids. Conceptually, inpatient administration of ICS provided the opportunity to teach effective device usage with each inpatient administration and to reinforce daily use of the ICS as part of the patient’s daily home medication regimen. However, a proportion of patients admitted for an asthma exacerbation were noted to receive more than one ICS inhaler during their admission, most commonly due to a change in dose or type of ICS. When this occurred, the initially dispensed inhaler was discarded despite weeks of potential doses remaining. While some hospitals preferentially dispense ICS devices marketed to institutions with fewer doses per device, our pharmacy primarily dispensed ICS devices identical to retail locations containing at least a one-month supply of medication. In addition to the wasted medication, this practice resulted in additional work by healthcare staff, unnecessary patient charges, and potentially contributed to confusion about the discharge medication regimen.
Our specific aim for this quality improvement study was to reduce the monthly percentage of admissions for an acute asthma exacerbation treated with >1 ICS from 7% to 4% over a six-month period.
METHODS
Context
CCHMC is a quaternary care pediatric health system with more than 600 inpatient beds and 800-900 inpatient admissions per year for acute asthma exacerbation. The Hospital Medicine service cares for patients with asthma on five clinical teams across two different campuses. Care teams are supervised by an attending physician and may include residents, fellows, or nurse practitioners. Patients hospitalized for an acute asthma exacerbation may receive a consult from the Asthma Center consult team, staffed by faculty from either the Pediatric Pulmonology or Allergy/Immunology divisions. Respiratory therapists (RTs) administer inhaled medications and provide asthma education.
Planning the Intervention
Our improvement team included physicians from Hospital Medicine and Pulmonary Medicine, an Asthma Education Coordinator, a Clinical Pharmacist, a Pediatric Chief Resident, and a clinical research coordinator. Initial interventions targeted a single resident team at the main campus before spreading improvement activities to all resident teams at the main campus and then the satellite campus by February 2017.
Development of our process map (Figure 1) revealed that the decision for ordering inpatient ICS treatment frequently occurred at admission. Subsequently, the care team or consulting team might make a change in the ICS to fine-tune the outpatient medication regimen given that admission for asthma often results from suboptimal chronic symptom control. Baseline analysis of changes in ICS orders revealed that 81% of ICS changes were associated with a step-up in therapy, defined as an increase in the daily dose of the ICS or the addition of a long-acting beta-agonist. The other common ICS adjustment, accounting for 17%, was a change in corticosteroid without a step-up in therapy, (ie, beclomethasone to fluticasone) that typically occurred near the end of the hospitalization to accommodate outpatient insurance formularies, independent of patient factors related to illness severity.
We utilized the model for improvement and sought to decrease the number of patients administered more than one ICS during an admission through a step-wise quality improvement approach, utilizing plan-do-study-act (PDSA) cycles.10 This study was reviewed and designated as not human subjects research by the CCHMC institutional review board.
Improvement Activities
We conceived key drivers or domains that would be necessary to address to effect change. Key drivers included a standardized process for delayed initiation of ICS and confirmation of outpatient insurance prescription drug coverage, prescriber education, and real-time failure notification.
PDSA Interventions
PDSA 1 & 2: Standardized Process for Initiation of ICS
Our initial tests of change targeted the timing of when an ICS was ordered during hospitalization for an asthma exacerbation. Providers were instructed to delay ordering an ICS until the patient’s albuterol treatments were spaced to every three hours and to include a standardized communication prompt within the albuterol order. The prompt instructed the RT to contact the provider once the patient’s albuterol treatments were spaced to every three hours and ask for an ICS order, if appropriate. This intervention was abandoned because it did not reliably occur.
The subsequent intervention delayed the start of ICS treatment by using a PRN indication advising that the ICS was to be administered once the patient’s albuterol treatments were spaced to every three hours. However, after an error resulted in the PRN indication being included on a discharge prescription for an ICS, the PRN indication was abandoned. Subsequent work to develop a standardized process for delayed initiation of ICS occurred as part of the workflow to address the confirmation of outpatient formulary coverage as described next.
PDSA 3: Prioritize the Use of the Institution’s Outpatient Pharmacy
Medication changes that occurred because of outpatient insurance formulary denials were a unique challenge; they required a medication change after the discharge treatment plan had been finalized, and a prescription was already submitted to the outpatient pharmacy. In addition, neither our inpatient electronic medical record nor our inpatient hospital pharmacy has access to decision support tools that incorporate outpatient prescription formulary coverage. Alternatively, outpatient pharmacies have a standard workflow that routinely confirms insurance coverage before dispensing medication. The institutional policy was modified to allow for the inpatient administration of patient-supplied medications, pursuant to an inpatient order. Patient-supplied medications include those brought from home or those supplied by the outpatient pharmacy.
Subsequently, we developed a standardized process to confirm outpatient prescription drug coverage by using our hospital-based outpatient pharmacy to dispense ICS for inpatient treatment and asthma education. This new workflow included placing an order for an ICS at admission as a patient-supplied medication with an administration comment to “please administer once available from the outpatient pharmacy” (Figure 1). Then, once the discharge medication plan is finalized, the prescription is submitted to the outpatient pharmacy. Following verification of insurance coverage, the outpatient pharmacy dispenses the ICS, allowing it to be used for patient education and inpatient administration. If the patient is ineligible to have their prescription filled by the outpatient pharmacy for reasons other than formulary coverage, the ICS is dispensed from the hospital inpatient pharmacy as per the previous standard workflow. Inpatient ICS inhalers are then relabeled for home use per the existing practice to support medications-in-hand.
Further workflow improvements occurred following the development of an algorithm to help the outpatient pharmacy contact the correct inpatient team, and augmentation of the medication delivery process included notification of the RT when the ICS was delivered to the inpatient unit.
PDSA 4: Prescriber Education
Prescribers received education regarding PDSA interventions before testing and throughout the improvement cycle. Education sessions included informal coaching by the Asthma Education Coordinator, e-mail reminders containing screenshots of the ordering process, and formal didactic sessions for ordering providers. The Asthma Education Coordinator also provided education to the nursing and respiratory therapy staff regarding the implemented process and workflow changes.
PDSA 5: Real-Time Failure Notification
To supplement education for the complicated process change, the improvement team utilized a decision support tool (Vigilanz Corp., Chicago, IL) linked to EMR data to provide notification of real-time process failures. When a patient with an admission diagnosis of asthma had a prescription for an ICS verified and dispensed by the inpatient pharmacy, an automated message with relevant patient information would be sent to a member of the improvement team. Following a brief chart review, directed feedback could be offered to the ordering provider, allowing the prescription to be redirected to the outpatient pharmacy.
Study of the Improvement
Patients of all ages, with the International Classification of Diseases, Ninth Revision, and Tenth Revision codes for asthma (493.xx or J45.xx) were included in data collection and analysis if they were treated by the Hospital Medicine service, as the first inpatient service or after transfer from the ICU, and prescribed an ICS with or without a long-acting beta-agonist. Data were collected retrospectively and aggregated monthly. The baseline period was from January 2015 through October 2016. The intervention period was from November 2016 through March 2018. The prolonged baseline and study periods were utilized to understand the seasonal nature of asthma exacerbations.
Measures
Our primary outcome measure was defined as the monthly number of patients admitted to Hospital Medicine for an acute asthma exacerbation administered more than one ICS divided by the total number of asthma patients administered at least one dose of an ICS (patient-supplied or dispensed from the inpatient pharmacy). A full list of ICS is included in the appendix Table.
A secondary process measure approximated our adherence to obtaining ICS from the outpatient pharmacy for inpatient use. All medications administered during hospitalization are documented in the medication administration report. However, only medications dispensed from the inpatient pharmacy are associated with a patient charge. Patient-supplied medications, including those dispensed from the hospital outpatient pharmacy, are not associated with an inpatient charge. Therefore, the secondary process measure was defined as the monthly number of asthma patients administered an ICS not associated with an inpatient charge divided by the total number of asthma patients administered an ICS.
A cost outcome measure was developed to track changes in the average cost of an ICS included on inpatient bills during hospitalization for an asthma exacerbation. This outcome measure was defined as the total monthly cost, using the average wholesale price, of the ICS included on the inpatient bill for an asthma exacerbation, divided by the total number of asthma patients administered at least one dose of an ICS (patient supplied or dispensed from the inpatient pharmacy).
Our a priori intent was to reduce ICS medication waste while maintaining a highly reliable system that included inpatient administration and education with ICS devices and maintain our medications-in-hand practice. A balancing measure was developed to monitor the reliability of inpatient administration of ICS. It was defined as the monthly number of patients who received a discharge prescription for an ICS and were administered an ICS while an inpatient divided by the total number of asthma patients with a discharge prescription for an ICS.
Analysis
Measures were evaluated using statistical process control charts and special cause variation was determined by previously established rules. Our primary, secondary, and balancing measures were all evaluated using a p-chart with variable subgroup size. The cost outcome measure was evaluated using an X-bar S control chart.11-13
RESULTS
Primary Outcome Measure
During the baseline period, 7.4% of patients admitted to Hospital Medicine for an acute asthma exacerbation were administered more than one ICS, ranging from 0%-20% of patients per month (Figure 2). Following the start of our interventions, we met criteria for special cause allowing adjustment of the centerline.13 The mean percentage of patients receiving more than one ICS decreased from 7.4% to 0.7%. Figure 2 includes the n-value displayed each month and represents all patients admitted to the Hospital Medicine service with an asthma exacerbation who were administered at least one ICS.
Secondary Process Measure
During the baseline period, there were only rare occurrences (less than 1%) of a patient-supplied ICS being administered during an asthma admission. Following the start of our intervention period, the frequency of inpatient administration of patient-supplied ICS showed a rapid increase and met rules for special cause with an increase in the mean percent from 0.7% to 50% (Figure 3). The n-value displayed each month represents all patients admitted to the Hospital Medicine service for an asthma exacerbation administered at least one ICS.
Cost Outcome Measure
The average cost of an ICS billed during hospitalization for an acute asthma exacerbation was $236.57 per ICS during the baseline period. After the intervention period, the average inpatient cost for ICS decreased by 62% to $90.25 per ICS (Figure 4).
Balancing Measure
DISCUSSION
Our team reduced the monthly percent of children hospitalized with an acute asthma exacerbation administered more than one ICS from 7.4% to 0.7% after implementation of a new workflow process for ordering ICS utilizing the hospital-based outpatient pharmacy. The new workflow delayed ordering and administration of the initial inpatient ICS treatment, allowing time to consider a step-up in therapy. The brief delay in initiating ICS is not expected to have clinical consequence given the concomitant treatment with systemic corticosteroids. In addition, the outpatient pharmacy was utilized to verify insurance coverage reliably prior to dispensing ICS, reducing medication waste, and discharge delays due to outpatient medication formulary conflicts.
Our hospital’s previous approach to inpatient asthma care resulted in a highly reliable process to ensure patients were discharged with medications-in-hand as part of a broader system that effectively decreased reutilization. However, the previous process inadvertently resulted in medication waste. This waste included nearly full inhalers being discarded, additional work by the healthcare team (ordering providers, pharmacists, and RTs), and unnecessary patient charges.
While the primary driver of our decision to use the outpatient pharmacy was to adjudicate insurance prescription coverage reliably to prevent waste, this change likely resulted in a financial benefit to patients. The average cost per asthma admission of an inpatient billed for ICS using the average wholesale price, decreased by 62% following our interventions. The decrease in cost was primarily driven by using patient-supplied medications, including prescriptions newly filled by the on-site outpatient pharmacy, whose costs were not captured in this measure. While our secondary measure may underestimate the total expense incurred by families for an ICS, families likely receive their medications at a lower cost from the outpatient pharmacy than if the ICS was provided by an inpatient pharmacy. The average wholesale price is not what families are charged or pay for medications, partly due to differences in overhead costs that result in inpatient pharmacies having significantly higher charges than outpatient pharmacies. In addition, the 6.7% absolute reduction of our primary measure resulted in direct savings by reducing inpatient medication waste. Our process results in 67 fewer wasted ICS devices ($15,960) per 1,000 admissions for asthma exacerbation, extrapolated using the average cost ($238.20, average wholesale price) of each ICS during the baseline period.
Our quality improvement study had several limitations. (1) The interventions occurred at a single center with an established culture that embraces quality improvement, which may limit the generalizability of the work. (2) Our process verified insurance coverage with a hospital-based outpatient pharmacy. Some ICS prescriptions continued to be dispensed from the inpatient pharmacy, limiting our ability to verify insurance coverage. Local factors, including regulatory restrictions and delivery requirements, may limit the generalizability of using an outpatient pharmacy in this manner. (3) We achieved our goal of decreasing medication waste, but our a priori goal was to maintain our commitment to our established practice of interactive patient education with an ICS device as well as medications-in-hand at time of discharge. Our balancing measure showed a decrease in the percent of patients with a discharge prescription for an ICS who also received an inpatient dose of that ICS. This implies a decreased fidelity in our previously established education protocols. We had postulated that this occurred when the patient-supplied medication arrived on the day of discharge, but not close to when the medication was scheduled on the medication administration report, preventing administration. However, this is not a direct measure of patients receiving medications-in-hand or interactive medication education. Both may have occurred without administration of the ICS. (4) Despite a hospital culture that embraces quality improvement, this project required a significant change in the workflow that required considerable education at the time of implementation to integrate the new process reliably. However, once the process was in place, we have been able to sustain our improvement with limited educational investment.
CONCLUSIONS
Implementation of a new process for ordering ICS that emphasized delaying treatment until all necessary information was available and using an outpatient pharmacy to confirm insurance formulary coverage reduced the waste associated with more than one ICS being prescribed during a single admission.
Acknowledgments
The authors thank Sally Pope, MPH and Dr. Michael Carlisle, MD for their contribution to the quality improvement project. Thank you to Drs. Karen McDowell, MD and Carolyn Kercsmar, MD for advisement of our quality improvement project.
The authors appreciate the following individuals for their invaluable contributions. Dr. Hoefgen conceptualized and designed the study, was a member of the primary improvement team, carried out initial analysis, drafted the initial manuscript, and reviewed and revised the manuscript. Drs. Jones and Torres Garcia, and Mr. Hare were members of the primary improvement team who contributed to the design of the quality improvement study and interventions, ongoing data interpretation, and critically reviewed the manuscript. Dr. Courter contributed to the conceptualization and designed the study, was a member of the primary improvement team, designed data collection instruments, and critically reviewed and revised the manuscript. Dr. Simmons conceptualized and designed the study, critically reviewed the manuscript for important intellectual content, and reviewed and revised the manuscript. All authors approved the final manuscript as submitted and agree to be accountable for all aspects of the work.
Disclaimer
The information or content and conclusions are those of the author and should not be construed as the official position or policy of, nor should any endorsements be inferred by the BHPR, HRSA, DHHS, or the U.S. Government.
1. Akinbami LJ, Simon AE, Rossen LM. Changing trends in asthma prevalence among children. Pediatrics. 2016;137(1):e20152354. https://doi.org/10.1542/peds.2015-2354.
2. HCUP Databases. Healthcare Cost and Utilization Project (HCUP). www.hcup.us.ahrq.gov/kidoverview.jsp. Published 2016. Accessed September 14, 2016.
3. NHLBI. Expert Panel Report 3 (EPR-3): Guidelines for the diagnosis and management of asthma–summary report 2007. J Allergy Clin Immunol. 2007;120(5):S94-S138. https://doi.org/10.1016/j.jaci.2007.09.029.
4. Kenyon CC, Rubin DM, Zorc JJ, Mohamad Z, Faerber JA, Feudtner C. Childhood asthma hospital discharge medication fills and risk of subsequent readmission. J Pediatr. 2015;166(5):1121-1127. https://doi.org/10.1016/j.jpeds.2014.12.019.
5. Bollinger ME, Mudd KE, Boldt A, Hsu VD, Tsoukleris MG, Butz AM. Prescription fill patterns in underserved children with asthma receiving subspecialty care. Ann Allergy Asthma Immunol. 2013;111(3):185-189. https://doi.org/10.1016/j.anai.2013.06.009.
6. Cooper WO, Hickson GB. Corticosteroid prescription filling for children covered by Medicaid following an emergency department visit or a hospitalization for asthma. Arch Pediatr Adolesc Med. 2001;155(10):1111-1115. https://doi.org/10.1001/archpedi.155.10.1111.
7. Hatoun J, Bair-Merritt M, Cabral H, Moses J. Increasing medication possession at discharge for patients with asthma: the Meds-in-Hand Project. Pediatrics. 2016;137(3):e20150461-e20150461. https://doi.org/10.1542/peds.2015-0461.
8. Kercsmar CM, Beck AF, Sauers-Ford H, et al. Association of an asthma improvement collaborative with health care utilization in medicaid-insured pediatric patients in an urban community. JAMA Pediatr. 2017;171(11):1072-1080. https://doi.org/10.1001/jamapediatrics.2017.2600.
9. Sauers HS, Beck AF, Kahn RS, Simmons JM. Increasing recruitment rates in an inpatient clinical research study using quality improvement methods. Hosp Pediatr. 2014;4(6):335-341. https://doi.org/10.1542/hpeds.2014-0072.
10. Langley GJ, Moen R, Nolan KM, Nolan TW, Norman CL, Provost LP. The Improvement Guide: A Practical Approach to Enhancing Organizational Performance. Hoboken: John Wiley & Sons, Inc.; 2009.
11. Benneyan JC, Lloyd RC, Plsek PE. Statistical process control as a tool for research and healthcare improvement. Qual Saf Health Care. 2003;12(6):458-464. https://doi.org/10.1136/qhc.12.6.458.
12. Mohammed MA, Panesar JS, Laney DB, Wilson R. Statistical process control charts for attribute data involving very large sample sizes: a review of problems and solutions. BMJ Qual Saf. 2013;22(4):362-368. https://doi.org/10.1136/bmjqs-2012-001373.
13. Moen R, Nolan T, Provost L. Quality Improvement through Planned Experimentation. 2nd ed. New York City: McGraw-Hill Professional; 1998.
© 2020 Society of Hospital Medicine
Impact of Preoperative Specialty Consults on Hospitalist Comanagement of Hip Fracture Patients
Hip fractures in the elderly are associated with significant morbidity and mortality.1 These are typically fragility fractures since they are caused by mechanical forces that would ordinarily not result in a serious injury, such as a fall from or below standing level. The incidence of hip fractures in the United States is expected to increase as the population ages; estimates project 512,000 hip fractures with an associated cost of $16 billion annually by the year 2040.2 Timely surgery is recommended for hip fracture patients as delayed surgery beyond 24 to 48 hours of presentation is associated with increased morbidity and mortality.3-6 Time to surgery (TTS) has been shown to be the major potentially modifiable risk factor in the management of a hip fracture.7
Factors that have been noted to influence TTS include the American Society of Anesthesiologists’ (ASA) score, the day of the week of hospital admission, and preoperative testing.8,9 Preoperative cardiology consultation and subsequent cardiac testing, in particular, can increase the TTS and length of stay (LOS) without changing perioperative management.9,10 In our review of literature, we could not identify any studies specifically looking at the impact of preoperative specialty consults on short-term mortality or comparison of care provided by hospitalists alone versus additionally involving subspecialists such as cardiologists. To our knowledge, there are no studies that have categorized recommendations from a preoperative specialty consult as minor, moderate, or major.
Our study evaluated whether preoperative specialty consults meaningfully change management and influence outcomes for hip fracture patients. At our institution, all hip fracture patients are admitted to the hospitalist service and comanaged with the orthopedic team. The hospitalist physician performs the preoperative evaluation as part of the admission history and physical exam. Preoperative specialty consult(s), if needed, are requested only by the hospitalist team. A consultant such as a cardiologist provides input; however, final management decisions are coordinated by the hospitalist physician.
METHODS
Study Design
We performed a retrospective cohort study of patients aged 50 years and older who underwent surgery for an isolated fragility fracture of the hip at Hartford Hospital, a level one trauma and tertiary care medical center, within the 24-month period from April 2015 to March 2017. Fragility hip fracture is defined as one occurring from a fall of a height of standing or less. A consult referred to a specialty or subspecialty consultation, other than hospital medicine, obtained prior to surgery. Patients with additional skeletal trauma and periprosthetic fractures were excluded. A total of 491 unique patients met the inclusion criteria, and data were obtained from chart review and an orthopedic surgery registry. The Hartford Hospital Institutional Review Board approved this study.
Our primary predictor was the presence or absence of a preoperative specialty consultation requested by the hospitalist. We also analyzed the following: covariates of demographics (age, sex, race), the ASA score, and severity of comorbidities using the Charlson comorbidity index (CCI) with a Quan modification;11 “R program package, International Classification of Disease (ICD)”12 was used to calculate the CCI using ICD-9 and ICD-10 diagnostic codes.
The primary outcome measures were TTS (measured in hours), LOS (measured in days), complications, and preoperative specialty consult resulting in a change in perioperative management. TTS was defined as the time elapsed from the presentation at the emergency department (ED) to surgery start. For transfer or direct admission patients, the time of admission was used in place of time of presentation. The measured complications included postoperative venous thromboembolic events, surgical site infection, myocardial infarction, stroke, and sepsis. Secondary outcome measures included 30-day mortality, readmission rate, and rate of return to OR. There were no elective or planned readmissions postoperatively on review of our institution’s orthopedic surgery registry.
Our team performed an extensive chart review including reviewing the admission note, consulting physician notes, and relevant test results. Our senior investigator (MK) then rated each preoperative specialty consult on appropriateness, the relative strength of the consultant’s recommendation, and resulting change in perioperative management. Cardiology consultations were deemed reasonable if a patient’s cardiac risk was considered elevated by the admitting physician or an active cardiac condition was present (suggestion of or clear evidence for acute coronary syndrome, acute congestive heart failure, uncontrolled arrhythmia, or symptomatic valvular disease). The determination of “elevated cardiac risk” was made, if admit note contained verbiage expressing concern for further evaluation for cardiac issues or words such as “high risk” or “elevated risk”. A specific guideline-based score such as the revised cardiac risk index was not consistently available in this retrospective chart review. A noncardiology consult was deemed reasonable only if it would have been warranted for the specific clinical situation—for example, a neurology consult for an acute stroke or a pulmonary consult for acute respiratory failure. Consult recommendations or outcomes were rated as minor, moderate, or major (see Table 1 for detailed criteria). Some consults may generate more than one recommendation, in these cases, we determined that a major recommendation supersedes a moderate or minor recommendation and only one was counted in the final analysis. Next we determined if a consult recommendation led to a change in perioperative or therapeutic management, defined as a medication or dosage change, need to delay surgery to stabilize an unstable medical condition, invasive procedures (such as thoracentesis or cardiac catheterization) or change in postoperative monitoring. As a way of clarification, a consult may have a minor recommendation such as an EKG but if no other recommendations were given and there was no change in therapeutic management such as a medication change, this would be considered as a “no change”.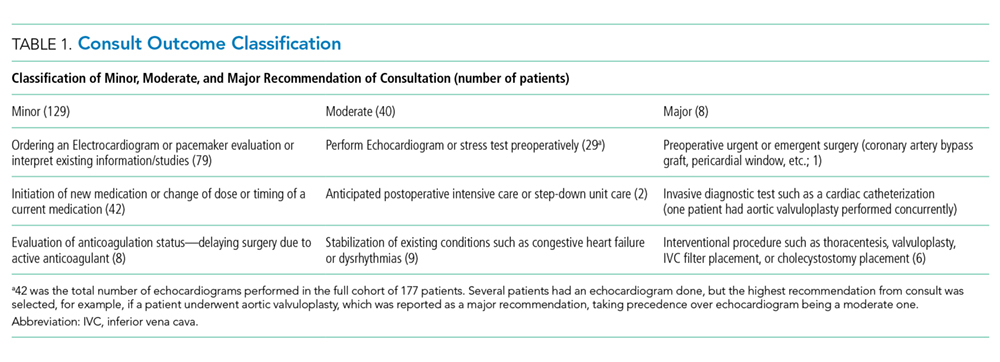
An independent rating of the entire dataset was subsequently performed by another hospitalist (KM) to establish interrater reliability. This reviewer was blinded to the initial rating and not involved in the initial design of the study or the data collection process. Because of the labor-intensive task of reviewing full charts, we followed a nonstandard process for interrater reliability. This rating was performed with the same dataset that was extracted by three members of our team (NB, SS, and MK); consequently, this does not account for variability in chart extraction as reiterated in the discussion.
Statistical Analysis
The main analyses compared the two patient subgroups (with or without preoperative specialty consults) around outcome measures. Primary outcome measures were TTS, LOS, complications, and consult resulting in a change in perioperative management. Secondary outcome measures were 30-day readmit, return to OR, and mortality. A preliminary analysis was conducted to explore distributions for TTS and LOS. As expected, none met the assumptions of normality and were thus analyzed with Wilcoxon ranked-sum tests. The other outcomes were dichotomous and analyzed with chi-square tests of proportion or Fisher’s exact test when the expected cell frequencies were too low. Dichotomized variables for TTS (within 24 hours and 48 hours) and LOS (within five days, the median LOS for this cohort) were calculated and subsequently analyzed with additional chi-square tests of proportion or Fisher’s exact test13. To explore the effect of preoperative specialty consults independent of potential confounders, logistic regression analyses predicting each of the dichotomous outcomes were conducted with age and CCI used as predictors in addition to the main variable of whether or not there was a preoperative specialty consult. Since the CCI and ASA scores were highly intercorrelated, only the former was chosen for the multivariate analyses based on the consistent algorithm used to calculate CCI.
Additional analyses with the subgroup of patients with a preoperative specialty consult explored whether the consult was reasonable, the relative strength of resulting recommendation and whether it resulted in a change in management. The statistical approach used was the same as for the other dichotomous outcomes. All analyses used 0.05 as the level of statistical significance; SPSSv21 (IBM, Armonk, New York) was the statistical software used.
The sample size for this retrospective analysis was determined by the available number of patients meeting the inclusion criteria. An a priori power calculation was done to determine if the expected volume would be sufficient for the multivariate analysis; the presence of a complication was selected for calculation. Based on an expected volume of approximately 500 and an estimate of a 10% serious complication rate, it was determined that the sample could support the analysis of up to five predictor variables, sufficient for the main variable and four potential confounders; this was considered adequate.14 Propensity scoring was considered but did not offer any advantages to logistic regression because we only had two observed covariates: CCI and age.
RESULTS
A total of 491 unique patients met our inclusion criteria, 177 patients had a preoperative specialty consult. Of these 177 patients, 24 patients had more than one consult; hence, the total number of consults was 201. Most of the consults were cardiology (159). Others were Infectious disease (11), Pulmonology (10), Neurology (7), and Miscellaneous (14, which included Nephrology, Gastroenterology, Hematology, and Oncology).
No significant differences were found between the consult and no-consult groups with respect to gender, race, body mass index, type of anesthesia, and day of the week of surgery. We did note that patients with a consult were older and had a significantly higher CCI and ASA score (Table 2).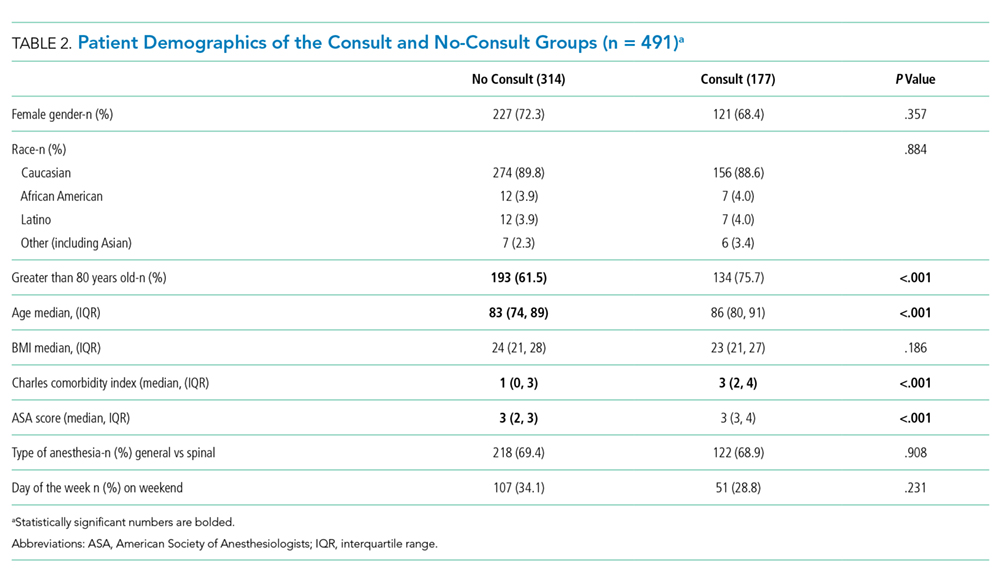
Initial analyses compared those with and without consults unadjusted for other factors with respect to TTS, LOS, 30-day readmission rate, 30-day return to OR rate, and 30-day mortality rate. The median TTS was 22.1 hours for the no-consult group compared with 34.3 hours for the consult group. The percentage of patients with TTS within 24 hours was higher (58.6% compared with 23.7%) and TTS within 48 hours was higher (90.1% compared to 76.8%) if there was no consult. The median LOS was five days for the no-consult group compared with six days for the consult group. There was no difference in complications between the two groups. Patients with consults were more likely to have a readmission (Table 3). No association was found between the type of consult (cardiology, pulmonary, etc.) and outcomes.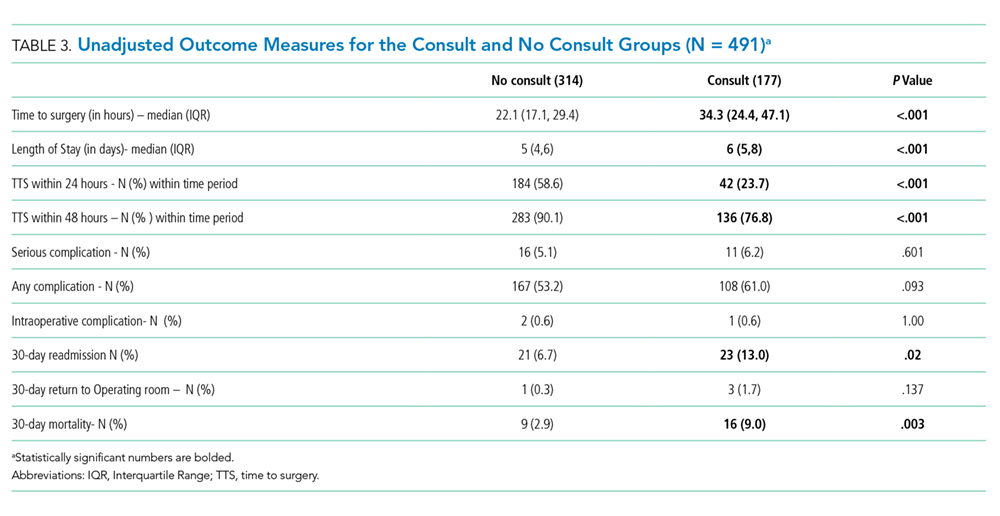
In the main analyses adjusted for potential confounders of age and CCI, consults were more likely to be independently associated with TTS beyond 24 hours, TTS beyond 48 hours, an extended LOS, and a higher 30-day readmission rate. CCI independently predicted a higher LOS, 30-day mortality rate, and serious complication rate. Similarly, age predicted 30-day mortality. Consults were not independently associated with 30-day mortality (Table 4).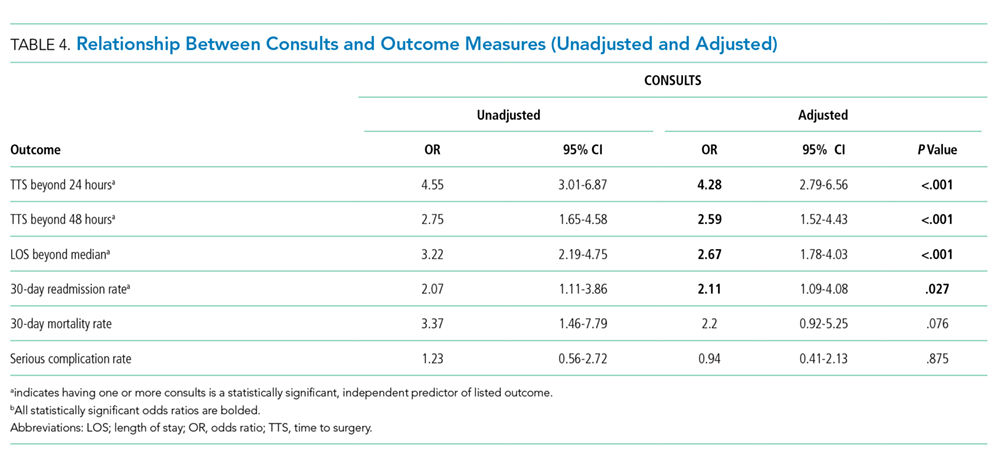
Of the 177 patients with one or more consults, 163 (92%) were deemed reasonable. Of the patients, 129 (72.8%) had minor, 40 (22.6%) moderate, and 8 (4.5%) major recommendations as a result of the consultation. There was an identifiable change in perioperative management for 66 (37%) patients with consults. The independent review done for interrater reliability examined the entire dataset. This review demonstrated the following percent agreements: 99.4% for if the consult was indicated (kappa = 0.962), 97.7% for the consult outcome classification (minor, moderate, or major; kappa = 0.947), and 94.4% for if the intervention resulted in a change in management (kappa = 0.878).
While reviewing our subset of cardiology consults, we noted moderate or major recommendations from a cardiologist only in cases where an active cardiac condition was suspected by the hospitalist requesting the consult. Only eight patients in our study had major recommendations from a consult, of which, three underwent aortic valvuloplasty and one patient each underwent the following: pericardial window for tamponade, cholecystostomy tube placement to treat acute cholecystitis, thoracentesis, endoscopic retrograde cholangiopancreatography for obstructive jaundice, and inferior vena cava filter placement for acute pulmonary embolism. All these procedures were done prior to hip fracture repair. Interestingly, 42 out of the 177 patients in our consult group had a preoperative echocardiogram performed, with only three patients with critical aortic stenosis undergoing valvuloplasty preoperatively.
DISCUSSION
Patients with preoperative specialty consults were older and had more comorbidities than patients without consults. Our findings suggest that consults contribute to delays to surgery and may lead to higher LOS and higher risk of 30-day readmission after controlling for age and comorbidities in a multivariate analysis. This observation is significant considering that consults were requested more frequently on patients with a higher comorbidity burden and included patients who did not get additional preoperative testing, suggesting that a delay from waiting for a consult alone may be deleterious. This was a unique observation in our study; prior studies examining this subject have attributed delays to additional testing and not consults alone. Even though most consult requests appear to be reasonable according to our criteria, the majority of recommendations were minor (72.9%), and 62.7% of consults resulted in no change in perioperative management. Major changes in perioperative management were noted in only 4.5% of patients.
Our finding that a majority of patients in the consult group had no significant change in perioperative management raises an important area of potential improvement in the care of hip fracture patients. We believe that narrowing indications for preoperative specialty consults may result in shorter TTS and LOS for this group of frail elderly patients without sacrificing the quality of care. Since all patients in our study were comanaged by hospitalists and patients without additional consults had similar or better outcomes, we believe that hospitalist physicians are well positioned to provide standardized comanagement to this patient group without additional consultation unless absolutely necessary.
The primary limitation of our study was that this was a retrospective case analysis. The designation of minor, moderate, or major recommendation was done after the consults were already completed, and it may not be possible to predict that a consult results in no change without it being actually performed. Additionally, our classification of recommendations is somewhat arbitrary and subjective; for example, some readers might argue that a medication change counts as a moderate recommendation. We rated a medication change to be minor as we believe that an experienced hospitalist may likely make such management decisions on their own, and if this is the only recommendation from a consult, it is not additional information critical to patient care. There may also be an “unmeasured complexity” noted by the admitting physician, which was not necessarily accounted for by multivariate analysis of age and CCI but one that led to higher mortality and readmissions. However, we feel that this “unmeasured complexity” is likely inconsequential as the vast majority of consults did not result in any change in management. We did adjust for covariates as noted, but some confounding by indication is likely to remain. Additionally, categorization of consult recommendations and consequent changes by one physician could be considered subjective. We did control for this by having another physician review the entire dataset and rate it independently for interrater reliability with excellent correlation and kappa, although these may be inflated to some degree because our chart review did not account for variability among chart extractors.
A prospective evaluation of a clinical protocol that delineates reasonable indications for a preoperative consult would be helpful to validate our findings. In our study, we noted moderate or major recommendations from a cardiologist only in cases where an active cardiac condition was suspected by the hospitalist requesting the consult; hence, limiting preoperative cardiology consults to active cardiac conditions may be a reasonable approach to evaluate in a prospective study.
In conclusion, a majority of preoperative specialty consults do not appear to meaningfully influence management and may indirectly increase morbidity by delaying surgery and extending hospital stays. Our data suggest that unless the patient is clinically unstable and likely to require active management by a consultant prior to hip fracture repair, consults may offer limited benefit. Appropriately standardized perioperative management of this patient group by hospitalist physicians appears to manage most hip fracture patients as effectively with faster TTS and shorter hospital LOS.
Acknowledgments
The authors would like to thank John Corradi, PhD (Research Department at Hartford Hospital) for his input in calculating the Charlson comorbidity index.12,13
1. Youm T, Koval KJ, Zuckerman JD. The economic impact of geriatric hip fractures. Am J Orthop. 1999;28(7):423-428.
2. Cummings SR, Rubin SM, Black D. The future of hip fractures in the United States: numbers, costs, and potential effects of post-menopausal estrogen. Clin Orthop Relat Res. 1990;(252):163-166.z
3. Mitchell SM, Chung AS, Walker JB, Hustedt JW, Russell GV, Jones CB. Delay in hip fracture surgery prolongs postoperative hospital length of stay but does not adversely affect outcomes at 30 days. J Orthop Trauma. 2018;32(12):629-633. https://doi.org/10.1097/BOT.0000000000001306.
4. Sobolev B, Guy P, Sheehan KJ, et al. Mortality effects of timing alternatives for hip fracture surgery. CMAJ. 2018;190(31):E923-E932. https://doi.org/10.1503/cmaj.171512.
5. Pincus D, Ravi B, Wasserstein D, et al. Association between wait time and 30-day mortality in adults undergoing hip fracture surgery. JAMA. 2017;318(20):1994-2003. https://doi.org/10.1001/jama.2017.17606.
6. Fu MC, Boddapati V, Gausden EB, Samuel AM, Russell LA, Lane JM. Surgery for a fracture of the hip within 24 hours of admission is independently associated with reduced short-term post-operative complications. Bone Joint J. 2017;99-B(9):1216-1222. https://doi.org/10.1302/0301-620X.99B9.BJJ-2017-0101.R1.
7. Belmont PJ Jr, Garcia EJ, Romano D, Bader JO, Nelso KJ, Schoenfeld AJ. Risk factors for complications and in-hospital mortality following hip fractures: a study using the National Trauma Data Bank. Arch Orthop Trauma Surg. 2014;134(5):597-604. https://doi.org/10.1007/s00402-014-1959-y.
8. Ricci WM, Brandt A, McAndrew C, Gardner MJ. Factors affecting delay to surgery and length of stay for patients with hip fracture. J Orthop Trauma. 2015;29(3):e109-e114. https://doi.org/10.1097/BOT.0000000000000221.
9. Bernstein J, Roberts FO, Wiesel BB, Ahn J. Preoperative testing for hip fracture patients delays surgery, prolongs hospital stays, and rarely dictates care. J Orthop Trauma. 2016;30(2):78-80. https://doi.org/10.1097/BOT.0000000000000444.
10, , Borrelli J. The medical and economic impact of preoperative cardiac testing in elderly patients with hip fractures. Injury. 2007;38(suppl 3):S49-S52. https://doi.org/10.1016/j.injury.2007.08.011.
11. Quan H, Li B, Couris CM, et al. Updating and validating the Charlson comorbidity index and score for risk adjustment in hospital discharge abstracts using data from 6 countries. Am J Epidemiol. 2011;173(6):676-682. https://doi.org/10.1093/aje/kwq433.
12. Wasey JO. icd: Tools for working with ICD-9 and ICD-10 codes, and finding comorbidities. R package version 3.2.0. https://CRAN.R-project.org/package=icd. Published 2018. Accessed November 13, 2018.
13. Uitenbroek D. The Fisher exact test for 2*5 or smaller crosstable. Quantitativeskills.com. https://www.quantitativeskills.com/sisa/statistics/fiveby2.htm. Published 2019. Accessed November 13, 2018.
14. Peduzzi P, Concato J, Kemper E, Holford TR, Feinstein AR. A simulation study of the number of events per variable in logistic regression analysis. J Clin Epidemiol. 1996;49(12):1373-1379. https://doi.org/10.1016/S0895-4356(96)00236-3.
Hip fractures in the elderly are associated with significant morbidity and mortality.1 These are typically fragility fractures since they are caused by mechanical forces that would ordinarily not result in a serious injury, such as a fall from or below standing level. The incidence of hip fractures in the United States is expected to increase as the population ages; estimates project 512,000 hip fractures with an associated cost of $16 billion annually by the year 2040.2 Timely surgery is recommended for hip fracture patients as delayed surgery beyond 24 to 48 hours of presentation is associated with increased morbidity and mortality.3-6 Time to surgery (TTS) has been shown to be the major potentially modifiable risk factor in the management of a hip fracture.7
Factors that have been noted to influence TTS include the American Society of Anesthesiologists’ (ASA) score, the day of the week of hospital admission, and preoperative testing.8,9 Preoperative cardiology consultation and subsequent cardiac testing, in particular, can increase the TTS and length of stay (LOS) without changing perioperative management.9,10 In our review of literature, we could not identify any studies specifically looking at the impact of preoperative specialty consults on short-term mortality or comparison of care provided by hospitalists alone versus additionally involving subspecialists such as cardiologists. To our knowledge, there are no studies that have categorized recommendations from a preoperative specialty consult as minor, moderate, or major.
Our study evaluated whether preoperative specialty consults meaningfully change management and influence outcomes for hip fracture patients. At our institution, all hip fracture patients are admitted to the hospitalist service and comanaged with the orthopedic team. The hospitalist physician performs the preoperative evaluation as part of the admission history and physical exam. Preoperative specialty consult(s), if needed, are requested only by the hospitalist team. A consultant such as a cardiologist provides input; however, final management decisions are coordinated by the hospitalist physician.
METHODS
Study Design
We performed a retrospective cohort study of patients aged 50 years and older who underwent surgery for an isolated fragility fracture of the hip at Hartford Hospital, a level one trauma and tertiary care medical center, within the 24-month period from April 2015 to March 2017. Fragility hip fracture is defined as one occurring from a fall of a height of standing or less. A consult referred to a specialty or subspecialty consultation, other than hospital medicine, obtained prior to surgery. Patients with additional skeletal trauma and periprosthetic fractures were excluded. A total of 491 unique patients met the inclusion criteria, and data were obtained from chart review and an orthopedic surgery registry. The Hartford Hospital Institutional Review Board approved this study.
Our primary predictor was the presence or absence of a preoperative specialty consultation requested by the hospitalist. We also analyzed the following: covariates of demographics (age, sex, race), the ASA score, and severity of comorbidities using the Charlson comorbidity index (CCI) with a Quan modification;11 “R program package, International Classification of Disease (ICD)”12 was used to calculate the CCI using ICD-9 and ICD-10 diagnostic codes.
The primary outcome measures were TTS (measured in hours), LOS (measured in days), complications, and preoperative specialty consult resulting in a change in perioperative management. TTS was defined as the time elapsed from the presentation at the emergency department (ED) to surgery start. For transfer or direct admission patients, the time of admission was used in place of time of presentation. The measured complications included postoperative venous thromboembolic events, surgical site infection, myocardial infarction, stroke, and sepsis. Secondary outcome measures included 30-day mortality, readmission rate, and rate of return to OR. There were no elective or planned readmissions postoperatively on review of our institution’s orthopedic surgery registry.
Our team performed an extensive chart review including reviewing the admission note, consulting physician notes, and relevant test results. Our senior investigator (MK) then rated each preoperative specialty consult on appropriateness, the relative strength of the consultant’s recommendation, and resulting change in perioperative management. Cardiology consultations were deemed reasonable if a patient’s cardiac risk was considered elevated by the admitting physician or an active cardiac condition was present (suggestion of or clear evidence for acute coronary syndrome, acute congestive heart failure, uncontrolled arrhythmia, or symptomatic valvular disease). The determination of “elevated cardiac risk” was made, if admit note contained verbiage expressing concern for further evaluation for cardiac issues or words such as “high risk” or “elevated risk”. A specific guideline-based score such as the revised cardiac risk index was not consistently available in this retrospective chart review. A noncardiology consult was deemed reasonable only if it would have been warranted for the specific clinical situation—for example, a neurology consult for an acute stroke or a pulmonary consult for acute respiratory failure. Consult recommendations or outcomes were rated as minor, moderate, or major (see Table 1 for detailed criteria). Some consults may generate more than one recommendation, in these cases, we determined that a major recommendation supersedes a moderate or minor recommendation and only one was counted in the final analysis. Next we determined if a consult recommendation led to a change in perioperative or therapeutic management, defined as a medication or dosage change, need to delay surgery to stabilize an unstable medical condition, invasive procedures (such as thoracentesis or cardiac catheterization) or change in postoperative monitoring. As a way of clarification, a consult may have a minor recommendation such as an EKG but if no other recommendations were given and there was no change in therapeutic management such as a medication change, this would be considered as a “no change”.
An independent rating of the entire dataset was subsequently performed by another hospitalist (KM) to establish interrater reliability. This reviewer was blinded to the initial rating and not involved in the initial design of the study or the data collection process. Because of the labor-intensive task of reviewing full charts, we followed a nonstandard process for interrater reliability. This rating was performed with the same dataset that was extracted by three members of our team (NB, SS, and MK); consequently, this does not account for variability in chart extraction as reiterated in the discussion.
Statistical Analysis
The main analyses compared the two patient subgroups (with or without preoperative specialty consults) around outcome measures. Primary outcome measures were TTS, LOS, complications, and consult resulting in a change in perioperative management. Secondary outcome measures were 30-day readmit, return to OR, and mortality. A preliminary analysis was conducted to explore distributions for TTS and LOS. As expected, none met the assumptions of normality and were thus analyzed with Wilcoxon ranked-sum tests. The other outcomes were dichotomous and analyzed with chi-square tests of proportion or Fisher’s exact test when the expected cell frequencies were too low. Dichotomized variables for TTS (within 24 hours and 48 hours) and LOS (within five days, the median LOS for this cohort) were calculated and subsequently analyzed with additional chi-square tests of proportion or Fisher’s exact test13. To explore the effect of preoperative specialty consults independent of potential confounders, logistic regression analyses predicting each of the dichotomous outcomes were conducted with age and CCI used as predictors in addition to the main variable of whether or not there was a preoperative specialty consult. Since the CCI and ASA scores were highly intercorrelated, only the former was chosen for the multivariate analyses based on the consistent algorithm used to calculate CCI.
Additional analyses with the subgroup of patients with a preoperative specialty consult explored whether the consult was reasonable, the relative strength of resulting recommendation and whether it resulted in a change in management. The statistical approach used was the same as for the other dichotomous outcomes. All analyses used 0.05 as the level of statistical significance; SPSSv21 (IBM, Armonk, New York) was the statistical software used.
The sample size for this retrospective analysis was determined by the available number of patients meeting the inclusion criteria. An a priori power calculation was done to determine if the expected volume would be sufficient for the multivariate analysis; the presence of a complication was selected for calculation. Based on an expected volume of approximately 500 and an estimate of a 10% serious complication rate, it was determined that the sample could support the analysis of up to five predictor variables, sufficient for the main variable and four potential confounders; this was considered adequate.14 Propensity scoring was considered but did not offer any advantages to logistic regression because we only had two observed covariates: CCI and age.
RESULTS
A total of 491 unique patients met our inclusion criteria, 177 patients had a preoperative specialty consult. Of these 177 patients, 24 patients had more than one consult; hence, the total number of consults was 201. Most of the consults were cardiology (159). Others were Infectious disease (11), Pulmonology (10), Neurology (7), and Miscellaneous (14, which included Nephrology, Gastroenterology, Hematology, and Oncology).
No significant differences were found between the consult and no-consult groups with respect to gender, race, body mass index, type of anesthesia, and day of the week of surgery. We did note that patients with a consult were older and had a significantly higher CCI and ASA score (Table 2).
Initial analyses compared those with and without consults unadjusted for other factors with respect to TTS, LOS, 30-day readmission rate, 30-day return to OR rate, and 30-day mortality rate. The median TTS was 22.1 hours for the no-consult group compared with 34.3 hours for the consult group. The percentage of patients with TTS within 24 hours was higher (58.6% compared with 23.7%) and TTS within 48 hours was higher (90.1% compared to 76.8%) if there was no consult. The median LOS was five days for the no-consult group compared with six days for the consult group. There was no difference in complications between the two groups. Patients with consults were more likely to have a readmission (Table 3). No association was found between the type of consult (cardiology, pulmonary, etc.) and outcomes.
In the main analyses adjusted for potential confounders of age and CCI, consults were more likely to be independently associated with TTS beyond 24 hours, TTS beyond 48 hours, an extended LOS, and a higher 30-day readmission rate. CCI independently predicted a higher LOS, 30-day mortality rate, and serious complication rate. Similarly, age predicted 30-day mortality. Consults were not independently associated with 30-day mortality (Table 4).
Of the 177 patients with one or more consults, 163 (92%) were deemed reasonable. Of the patients, 129 (72.8%) had minor, 40 (22.6%) moderate, and 8 (4.5%) major recommendations as a result of the consultation. There was an identifiable change in perioperative management for 66 (37%) patients with consults. The independent review done for interrater reliability examined the entire dataset. This review demonstrated the following percent agreements: 99.4% for if the consult was indicated (kappa = 0.962), 97.7% for the consult outcome classification (minor, moderate, or major; kappa = 0.947), and 94.4% for if the intervention resulted in a change in management (kappa = 0.878).
While reviewing our subset of cardiology consults, we noted moderate or major recommendations from a cardiologist only in cases where an active cardiac condition was suspected by the hospitalist requesting the consult. Only eight patients in our study had major recommendations from a consult, of which, three underwent aortic valvuloplasty and one patient each underwent the following: pericardial window for tamponade, cholecystostomy tube placement to treat acute cholecystitis, thoracentesis, endoscopic retrograde cholangiopancreatography for obstructive jaundice, and inferior vena cava filter placement for acute pulmonary embolism. All these procedures were done prior to hip fracture repair. Interestingly, 42 out of the 177 patients in our consult group had a preoperative echocardiogram performed, with only three patients with critical aortic stenosis undergoing valvuloplasty preoperatively.
DISCUSSION
Patients with preoperative specialty consults were older and had more comorbidities than patients without consults. Our findings suggest that consults contribute to delays to surgery and may lead to higher LOS and higher risk of 30-day readmission after controlling for age and comorbidities in a multivariate analysis. This observation is significant considering that consults were requested more frequently on patients with a higher comorbidity burden and included patients who did not get additional preoperative testing, suggesting that a delay from waiting for a consult alone may be deleterious. This was a unique observation in our study; prior studies examining this subject have attributed delays to additional testing and not consults alone. Even though most consult requests appear to be reasonable according to our criteria, the majority of recommendations were minor (72.9%), and 62.7% of consults resulted in no change in perioperative management. Major changes in perioperative management were noted in only 4.5% of patients.
Our finding that a majority of patients in the consult group had no significant change in perioperative management raises an important area of potential improvement in the care of hip fracture patients. We believe that narrowing indications for preoperative specialty consults may result in shorter TTS and LOS for this group of frail elderly patients without sacrificing the quality of care. Since all patients in our study were comanaged by hospitalists and patients without additional consults had similar or better outcomes, we believe that hospitalist physicians are well positioned to provide standardized comanagement to this patient group without additional consultation unless absolutely necessary.
The primary limitation of our study was that this was a retrospective case analysis. The designation of minor, moderate, or major recommendation was done after the consults were already completed, and it may not be possible to predict that a consult results in no change without it being actually performed. Additionally, our classification of recommendations is somewhat arbitrary and subjective; for example, some readers might argue that a medication change counts as a moderate recommendation. We rated a medication change to be minor as we believe that an experienced hospitalist may likely make such management decisions on their own, and if this is the only recommendation from a consult, it is not additional information critical to patient care. There may also be an “unmeasured complexity” noted by the admitting physician, which was not necessarily accounted for by multivariate analysis of age and CCI but one that led to higher mortality and readmissions. However, we feel that this “unmeasured complexity” is likely inconsequential as the vast majority of consults did not result in any change in management. We did adjust for covariates as noted, but some confounding by indication is likely to remain. Additionally, categorization of consult recommendations and consequent changes by one physician could be considered subjective. We did control for this by having another physician review the entire dataset and rate it independently for interrater reliability with excellent correlation and kappa, although these may be inflated to some degree because our chart review did not account for variability among chart extractors.
A prospective evaluation of a clinical protocol that delineates reasonable indications for a preoperative consult would be helpful to validate our findings. In our study, we noted moderate or major recommendations from a cardiologist only in cases where an active cardiac condition was suspected by the hospitalist requesting the consult; hence, limiting preoperative cardiology consults to active cardiac conditions may be a reasonable approach to evaluate in a prospective study.
In conclusion, a majority of preoperative specialty consults do not appear to meaningfully influence management and may indirectly increase morbidity by delaying surgery and extending hospital stays. Our data suggest that unless the patient is clinically unstable and likely to require active management by a consultant prior to hip fracture repair, consults may offer limited benefit. Appropriately standardized perioperative management of this patient group by hospitalist physicians appears to manage most hip fracture patients as effectively with faster TTS and shorter hospital LOS.
Acknowledgments
The authors would like to thank John Corradi, PhD (Research Department at Hartford Hospital) for his input in calculating the Charlson comorbidity index.12,13
1. Youm T, Koval KJ, Zuckerman JD. The economic impact of geriatric hip fractures. Am J Orthop. 1999;28(7):423-428.
2. Cummings SR, Rubin SM, Black D. The future of hip fractures in the United States: numbers, costs, and potential effects of post-menopausal estrogen. Clin Orthop Relat Res. 1990;(252):163-166.z
3. Mitchell SM, Chung AS, Walker JB, Hustedt JW, Russell GV, Jones CB. Delay in hip fracture surgery prolongs postoperative hospital length of stay but does not adversely affect outcomes at 30 days. J Orthop Trauma. 2018;32(12):629-633. https://doi.org/10.1097/BOT.0000000000001306.
4. Sobolev B, Guy P, Sheehan KJ, et al. Mortality effects of timing alternatives for hip fracture surgery. CMAJ. 2018;190(31):E923-E932. https://doi.org/10.1503/cmaj.171512.
5. Pincus D, Ravi B, Wasserstein D, et al. Association between wait time and 30-day mortality in adults undergoing hip fracture surgery. JAMA. 2017;318(20):1994-2003. https://doi.org/10.1001/jama.2017.17606.
6. Fu MC, Boddapati V, Gausden EB, Samuel AM, Russell LA, Lane JM. Surgery for a fracture of the hip within 24 hours of admission is independently associated with reduced short-term post-operative complications. Bone Joint J. 2017;99-B(9):1216-1222. https://doi.org/10.1302/0301-620X.99B9.BJJ-2017-0101.R1.
7. Belmont PJ Jr, Garcia EJ, Romano D, Bader JO, Nelso KJ, Schoenfeld AJ. Risk factors for complications and in-hospital mortality following hip fractures: a study using the National Trauma Data Bank. Arch Orthop Trauma Surg. 2014;134(5):597-604. https://doi.org/10.1007/s00402-014-1959-y.
8. Ricci WM, Brandt A, McAndrew C, Gardner MJ. Factors affecting delay to surgery and length of stay for patients with hip fracture. J Orthop Trauma. 2015;29(3):e109-e114. https://doi.org/10.1097/BOT.0000000000000221.
9. Bernstein J, Roberts FO, Wiesel BB, Ahn J. Preoperative testing for hip fracture patients delays surgery, prolongs hospital stays, and rarely dictates care. J Orthop Trauma. 2016;30(2):78-80. https://doi.org/10.1097/BOT.0000000000000444.
10, , Borrelli J. The medical and economic impact of preoperative cardiac testing in elderly patients with hip fractures. Injury. 2007;38(suppl 3):S49-S52. https://doi.org/10.1016/j.injury.2007.08.011.
11. Quan H, Li B, Couris CM, et al. Updating and validating the Charlson comorbidity index and score for risk adjustment in hospital discharge abstracts using data from 6 countries. Am J Epidemiol. 2011;173(6):676-682. https://doi.org/10.1093/aje/kwq433.
12. Wasey JO. icd: Tools for working with ICD-9 and ICD-10 codes, and finding comorbidities. R package version 3.2.0. https://CRAN.R-project.org/package=icd. Published 2018. Accessed November 13, 2018.
13. Uitenbroek D. The Fisher exact test for 2*5 or smaller crosstable. Quantitativeskills.com. https://www.quantitativeskills.com/sisa/statistics/fiveby2.htm. Published 2019. Accessed November 13, 2018.
14. Peduzzi P, Concato J, Kemper E, Holford TR, Feinstein AR. A simulation study of the number of events per variable in logistic regression analysis. J Clin Epidemiol. 1996;49(12):1373-1379. https://doi.org/10.1016/S0895-4356(96)00236-3.
© 2020 Society of Hospital Medicine
Immune Checkpoint Inhibitors for Urothelial Cancer: An Update on New Therapies (FULL)
An essential feature of cancer is its ability to evade the immune system. Multiple mechanisms are used for this purpose, including the disruption of antigen presentation and suppression of the immune response. The latter mechanism involves the activation of T-cell inhibition by recruiting regulatory T cells that weaken this response. Recent progress in understanding the ability of cancer to evade the immune system has paved the way to develop strategies to reverse this process and reactivate the immune system. Particularly, immune checkpoint signaling between T cells and tumor cells has been targeted with a new class of drug, immune checkpoint inhibitors. Immunotherapy has been an established and effective treatment in bladder cancer since 1976 when Morales and colleagues demonstrated that intravesical treatments with bacillus Calmette-Guérin can treat carcinoma in situ and prevent nonmuscle invasive urothelial cancer recurrence.1,2 This treatment elicits a cytotoxic response via antigenic presentation by bladder tumor cells.
Cytotoxic T-lymphocyte-associated protein (CTLA)-4, programmed death-1 (PD-1) and programmed death-ligand-1 (PD-L1) are molecules that downregulate the immune response and are targets of therapeutic antibodies that have demonstrated clinical efficacy across a wide range of malignancies. Five such agents—pembrolizumab, atezolizumab, nivolumab, avelumab and durvalumab—were recently approved by the US Food and Drug Administration (FDA) for clinical use in patients with advanced urothelial cancers.3 This class of agents also has been approved for several other malignancies, most notably in melanoma, non-small cell lung cancer, and renal cell carcinoma.3
Immune Biology
CTLA-4 is expressed on activated CD4 and CD8 T cells and competes with CD28 on T cells to interact with the costimulatory B7 proteins on antigen presenting cells. The CD28/B7 interaction promotes T-cell activation and effector functions, and the CTLA-4/B7 interaction inhibits them. In addition, PD-1 is a receptor expressed on CD4 and CD8 T cells, T regulatory (Treg) cells, B cells and natural killer (NK) cells that interacts with its ligand PD-L1 to suppress the immune response. Urothelial cancer possesses features that make it an adequate target for immunotherapeutic agents. Primarily, it is characterized by a high-mutation load, which lends itself to an increased expression of immunogenic antigens on tumor cells.4
Immunotherapy Treatments in Cisplatin-Ineligible Patients
Cisplatin-based chemotherapy is the first-line treatment and standard of care in unresectable or metastatic urothelial cancer. However, many patients are unable to receive cisplatin secondary to renal dysfunction, poor performance status, or other comorbidities. Alternative cytotoxic therapies in the first-line setting such as carboplatin-based regimens are associated with inferior outcomes and poor tolerability. There is, therefore, a need for effective and well-tolerated therapies in cisplatin-ineligible patients (Table).
In the phase 2 Keynote-052 trial, 370 cisplatin-ineligible patients were treated with the anti-PD-1 antibody pembrolizumab 200 mg every 3 weeks for up to 2 years.5At a median follow-up of 9.5 months, the objective response rate (+ORR) was 29% for the entire cohort, with a 7% complete response (CR) rate, and a 22% partial response (PR) rate.5 The median duration of response had not been reached at the time of analysis. Responses were seen regardless of PD-L1 expression, although high response rates were noted in patients whose tumors had PD-L1 expression > 10%. Pembrolizumab had an acceptable tolerability profile in this population. The most common grade 3 or 4 treatment-related adverse event (AE) was fatigue at 2%; 5% of patients discontinued therapy due to treatment related AEs, whereas 17% of patients had immune-mediated AEs.5
Similarly, in a single-arm phase 2 trial, atezolizumab, an anti-PD-L1 antibody, dosed at 1,200 mg every 3 weeks was used as first-line therapy in 119 patients with advanced urothelial cancer who were cisplatin ineligible. At a median follow-up of 17 months, the ORR was 23%, with a 9% CR rate. The median duration of response had not been reached. Median progression free survival (PFS) was 2.7 months, whereas overall survival (OS) was 16 months. Eight percent of patients had an AE leading to treatment discontinuation, and 17% had immune-mediated AEs.6 Both pembrolizumab and atezolizumab were granted FDA approval in 2017 for patients with locally advanced or metastatic urothelial carcinoma who are not eligible for cisplatin-based chemotherapy.3
Immunotherapy Treatments After Progression With Cisplatin
Cytotoxic chemotherapy in the second-line setting with disease progression following platinum-based treatment has shown dismal responses, with a median OS of about 6 to 7 months.7 Immunotherapy provides an effective and a much-needed option in this scenario.
Five antibodies targeting the PD-1/PD-L1 pathway, pembrolizumab, nivolumab, atezolizumab, avelumab and durvalumab, have been granted FDA approval for patients who have progressed during or after platinum-based therapy (Table).3 In the phase 3 Keynote-045 trial, 542 patients were randomly assigned to receive either pembrolizumab 200 mg administered every 3 weeks or investigator’s choice chemotherapy (paclitaxel, docetaxel, or vinflunine).7 Median OS was 10.3 months in the pembrolizumab group and 7.4 months in the chemotherapy group (hazard ratio for death, 0.73; P = .002). Serious (grade 3 or above) treatment-related AEs were significantly less frequent with pembrolizumab (15% vs 49.4%).7 In a phase 2 trial, 270 patients were treated with nivolumab, a PD-1 inhibitor, at a dose of 3 mg/kg given every 2 weeks.8 The ORR was 19.6%, while the median OS for the entire cohort was 7 months. Responses were seen at all levels of PD-L1 expression, although in patients whose tumor expressed PD-L1 ≥1%, median OS was 11.3 months.8
It should be noted that in a large phase 3 trial comparing atezolizumab with chemotherapy in the second-line setting, ORR and OS were not statistically different between the 2 groups, although the duration of response was longer with atezolizumab.9 In early phase trials, avelumab and durvalumab, both PD-L1 inhibitors showed an ORR of about 17%, with higher ORR seen in patients with tumors positive for PD-L1 expression.10,11 The AE profile of immune checkpoint inhibitors is relatively favorable in clinical trials. The American Society of Clinical Oncology and National Comprehensive Cancer Network have jointly published evidence-based guidelines for the management of their immune related AEs.12
Future Directions
Several challenges have emerged with immunotherapy treatments. One issue is the relatively low ORRs for immune checkpoint inhibitors, ranging from 13.4% to 24% depending on the trial. Therefore, there is a need to identify reliable biomarkers and selection criteria to predict their efficacy and improve patient selection. Although tumor PD-L1 expression has shown some usefulness in this setting, responses have been noted in patients whose tumors have low or no expression of PD-L1. This low predictive accuracy is caused by several factors, including PD-L1 intratumor expression heterogeneity, primary vs metastatic site PD-L1 expression heterogeneity, lack of consensus on which PD-L1 assays and which value cutoffs to use, and the differences seen in marker expression depending on the freshness of the tissue specimen.
Other predictive biomarkers with potential include tumor gene expression profiles/tumor mutational load, T-cell and B-cell signatures. The optimal imaging modality and timing of this imaging for response assessment also is uncertain. So-called tumor pseudo-progression seen on imaging after treatment with these agents as a result of the immune/inflammatory response to the tumor is now a well-recognized phenomenon, but it can be challenging to differentiate from true disease progression. Other challenges include deciding on which immune checkpoint inhibitor to use given a lack of head-to-head comparisons of these immunotherapeutic agents, finding the proper drug doses to maximize efficacy, as well as determining the optimal duration of treatment in patients with continued response to immunotherapy. Many oncologists continue these treatments for up to 2 years in the setting of a significant or complete response.
Conclusion
Immune checkpoint inhibitors have emerged as pivotal treatments for patients with advanced urothelial cancer who are unfit to receive cisplatin in the first-line setting or who experience disease progression after cisplatin-based chemotherapy. This field continues to expand at a rapid pace due to multiple ongoing clinical trials assessing these agents, whether alone, in combination with cytotoxic, targeted, radiation therapies, or with other immune checkpoint inhibitors, both in the advanced as well as the neoadjuvant/adjuvant settings.
1. Morales A, Eidinger D, Bruce AW. Intracavitary bacillus Calmette-Guerin in the treatment of superficial bladder tumors. J Urol. 1976;116(2):180-183.
2. Morales A. Treatment of carcinoma in situ of the bladder with BCG. Cancer Immunol Immunother. 1980;9 (1-2):69-72.
3. US Food and drug administration. FDA approved drug products. www.accessdata.fda.gov/scripts/cder/daf/index.cfm. Accessed July 5, 2018.
4. Farina MS, Lundgren KT, Bellmunt J. Immunotherapy in urothelial cancer: recent results and future perspectives. Drugs. 2017;77(10):1077-1089.
5. Balar AV, Castellano DE, O’Donnell PH, et al. First-line pembrolizumab in cisplatin-ineligible patients with locally advanced and unresectable or metastatic urothelial cancer (KEYNOTE-052): a multicentre, single-arm, phase 2 study. Lancet Oncol. 2017;18(11):1483-1492.
6. Balar AV, Galsky MD, Rosenberg JE, et al; IMvigor210 Study Group. Atezolizumab as first-line treatment in cisplatin-ineligible patients with locally advanced and metastatic urothelial carcinoma: a single-arm, multicentre, phase 2 trial. Lancet. 2017;389(10064):67-76.
7. Bellmunt J, de Wit R, Vaughn DJ, et al; KEYNOTE-045 Investigators. Pembrolizumab as second-line therapy for advanced urothelial carcinoma. N Engl J Med. 2017;376(11):1015-1026.
8. Sharma P, Retz M, Siefker-Radtke A, et al. Nivolumab in metastatic urothelial carcinoma after platinum therapy (CheckMate 275): a multicentre, single-arm, phase 2 trial. Lancet Oncol. 2017;18(3):312-322.
9. Powles T, Durán I, van der Heijden MS, et al. Atezolizumab versus chemotherapy in patients with platinum-treated locally advanced or metastatic urothelial carcinoma (IMvigor211): a multicentre, open-label, phase 3 randomised controlled trial. Lancet. 2018;391(10122):748-757.
10. Patel MR, Ellerton J, Infante JR, et al. Avelumab in metastatic urothelial carcinoma after platinum failure (JAVELIN Solid Tumor): pooled results from two expansion cohorts of an open-label, phase 1 trial. Lancet Oncol. 2018;19(1):51-64.
11. Powles T, O’Donnell PH, Massard C, et al. Efficacy and safety of durvalumab in locally advanced or metastatic urothelial carcinoma: updated results from a phase 1/2 open-label study. JAMA Oncol. 2017;3(9):e172411.
12. Brahmer JR, Lacchetti C, Schneider BJ, et al; National Comprehensive Cancer Network. Management of immune-related adverse events in patients treated with immune checkpoint inhibitor therapy: American Society of Clinical Oncology clinical practice guideline. J Clin Oncol. 2018;36(17):1714-1768.
An essential feature of cancer is its ability to evade the immune system. Multiple mechanisms are used for this purpose, including the disruption of antigen presentation and suppression of the immune response. The latter mechanism involves the activation of T-cell inhibition by recruiting regulatory T cells that weaken this response. Recent progress in understanding the ability of cancer to evade the immune system has paved the way to develop strategies to reverse this process and reactivate the immune system. Particularly, immune checkpoint signaling between T cells and tumor cells has been targeted with a new class of drug, immune checkpoint inhibitors. Immunotherapy has been an established and effective treatment in bladder cancer since 1976 when Morales and colleagues demonstrated that intravesical treatments with bacillus Calmette-Guérin can treat carcinoma in situ and prevent nonmuscle invasive urothelial cancer recurrence.1,2 This treatment elicits a cytotoxic response via antigenic presentation by bladder tumor cells.
Cytotoxic T-lymphocyte-associated protein (CTLA)-4, programmed death-1 (PD-1) and programmed death-ligand-1 (PD-L1) are molecules that downregulate the immune response and are targets of therapeutic antibodies that have demonstrated clinical efficacy across a wide range of malignancies. Five such agents—pembrolizumab, atezolizumab, nivolumab, avelumab and durvalumab—were recently approved by the US Food and Drug Administration (FDA) for clinical use in patients with advanced urothelial cancers.3 This class of agents also has been approved for several other malignancies, most notably in melanoma, non-small cell lung cancer, and renal cell carcinoma.3
Immune Biology
CTLA-4 is expressed on activated CD4 and CD8 T cells and competes with CD28 on T cells to interact with the costimulatory B7 proteins on antigen presenting cells. The CD28/B7 interaction promotes T-cell activation and effector functions, and the CTLA-4/B7 interaction inhibits them. In addition, PD-1 is a receptor expressed on CD4 and CD8 T cells, T regulatory (Treg) cells, B cells and natural killer (NK) cells that interacts with its ligand PD-L1 to suppress the immune response. Urothelial cancer possesses features that make it an adequate target for immunotherapeutic agents. Primarily, it is characterized by a high-mutation load, which lends itself to an increased expression of immunogenic antigens on tumor cells.4
Immunotherapy Treatments in Cisplatin-Ineligible Patients
Cisplatin-based chemotherapy is the first-line treatment and standard of care in unresectable or metastatic urothelial cancer. However, many patients are unable to receive cisplatin secondary to renal dysfunction, poor performance status, or other comorbidities. Alternative cytotoxic therapies in the first-line setting such as carboplatin-based regimens are associated with inferior outcomes and poor tolerability. There is, therefore, a need for effective and well-tolerated therapies in cisplatin-ineligible patients (Table).
In the phase 2 Keynote-052 trial, 370 cisplatin-ineligible patients were treated with the anti-PD-1 antibody pembrolizumab 200 mg every 3 weeks for up to 2 years.5At a median follow-up of 9.5 months, the objective response rate (+ORR) was 29% for the entire cohort, with a 7% complete response (CR) rate, and a 22% partial response (PR) rate.5 The median duration of response had not been reached at the time of analysis. Responses were seen regardless of PD-L1 expression, although high response rates were noted in patients whose tumors had PD-L1 expression > 10%. Pembrolizumab had an acceptable tolerability profile in this population. The most common grade 3 or 4 treatment-related adverse event (AE) was fatigue at 2%; 5% of patients discontinued therapy due to treatment related AEs, whereas 17% of patients had immune-mediated AEs.5
Similarly, in a single-arm phase 2 trial, atezolizumab, an anti-PD-L1 antibody, dosed at 1,200 mg every 3 weeks was used as first-line therapy in 119 patients with advanced urothelial cancer who were cisplatin ineligible. At a median follow-up of 17 months, the ORR was 23%, with a 9% CR rate. The median duration of response had not been reached. Median progression free survival (PFS) was 2.7 months, whereas overall survival (OS) was 16 months. Eight percent of patients had an AE leading to treatment discontinuation, and 17% had immune-mediated AEs.6 Both pembrolizumab and atezolizumab were granted FDA approval in 2017 for patients with locally advanced or metastatic urothelial carcinoma who are not eligible for cisplatin-based chemotherapy.3
Immunotherapy Treatments After Progression With Cisplatin
Cytotoxic chemotherapy in the second-line setting with disease progression following platinum-based treatment has shown dismal responses, with a median OS of about 6 to 7 months.7 Immunotherapy provides an effective and a much-needed option in this scenario.
Five antibodies targeting the PD-1/PD-L1 pathway, pembrolizumab, nivolumab, atezolizumab, avelumab and durvalumab, have been granted FDA approval for patients who have progressed during or after platinum-based therapy (Table).3 In the phase 3 Keynote-045 trial, 542 patients were randomly assigned to receive either pembrolizumab 200 mg administered every 3 weeks or investigator’s choice chemotherapy (paclitaxel, docetaxel, or vinflunine).7 Median OS was 10.3 months in the pembrolizumab group and 7.4 months in the chemotherapy group (hazard ratio for death, 0.73; P = .002). Serious (grade 3 or above) treatment-related AEs were significantly less frequent with pembrolizumab (15% vs 49.4%).7 In a phase 2 trial, 270 patients were treated with nivolumab, a PD-1 inhibitor, at a dose of 3 mg/kg given every 2 weeks.8 The ORR was 19.6%, while the median OS for the entire cohort was 7 months. Responses were seen at all levels of PD-L1 expression, although in patients whose tumor expressed PD-L1 ≥1%, median OS was 11.3 months.8
It should be noted that in a large phase 3 trial comparing atezolizumab with chemotherapy in the second-line setting, ORR and OS were not statistically different between the 2 groups, although the duration of response was longer with atezolizumab.9 In early phase trials, avelumab and durvalumab, both PD-L1 inhibitors showed an ORR of about 17%, with higher ORR seen in patients with tumors positive for PD-L1 expression.10,11 The AE profile of immune checkpoint inhibitors is relatively favorable in clinical trials. The American Society of Clinical Oncology and National Comprehensive Cancer Network have jointly published evidence-based guidelines for the management of their immune related AEs.12
Future Directions
Several challenges have emerged with immunotherapy treatments. One issue is the relatively low ORRs for immune checkpoint inhibitors, ranging from 13.4% to 24% depending on the trial. Therefore, there is a need to identify reliable biomarkers and selection criteria to predict their efficacy and improve patient selection. Although tumor PD-L1 expression has shown some usefulness in this setting, responses have been noted in patients whose tumors have low or no expression of PD-L1. This low predictive accuracy is caused by several factors, including PD-L1 intratumor expression heterogeneity, primary vs metastatic site PD-L1 expression heterogeneity, lack of consensus on which PD-L1 assays and which value cutoffs to use, and the differences seen in marker expression depending on the freshness of the tissue specimen.
Other predictive biomarkers with potential include tumor gene expression profiles/tumor mutational load, T-cell and B-cell signatures. The optimal imaging modality and timing of this imaging for response assessment also is uncertain. So-called tumor pseudo-progression seen on imaging after treatment with these agents as a result of the immune/inflammatory response to the tumor is now a well-recognized phenomenon, but it can be challenging to differentiate from true disease progression. Other challenges include deciding on which immune checkpoint inhibitor to use given a lack of head-to-head comparisons of these immunotherapeutic agents, finding the proper drug doses to maximize efficacy, as well as determining the optimal duration of treatment in patients with continued response to immunotherapy. Many oncologists continue these treatments for up to 2 years in the setting of a significant or complete response.
Conclusion
Immune checkpoint inhibitors have emerged as pivotal treatments for patients with advanced urothelial cancer who are unfit to receive cisplatin in the first-line setting or who experience disease progression after cisplatin-based chemotherapy. This field continues to expand at a rapid pace due to multiple ongoing clinical trials assessing these agents, whether alone, in combination with cytotoxic, targeted, radiation therapies, or with other immune checkpoint inhibitors, both in the advanced as well as the neoadjuvant/adjuvant settings.
1. Morales A, Eidinger D, Bruce AW. Intracavitary bacillus Calmette-Guerin in the treatment of superficial bladder tumors. J Urol. 1976;116(2):180-183.
2. Morales A. Treatment of carcinoma in situ of the bladder with BCG. Cancer Immunol Immunother. 1980;9 (1-2):69-72.
3. US Food and drug administration. FDA approved drug products. www.accessdata.fda.gov/scripts/cder/daf/index.cfm. Accessed July 5, 2018.
4. Farina MS, Lundgren KT, Bellmunt J. Immunotherapy in urothelial cancer: recent results and future perspectives. Drugs. 2017;77(10):1077-1089.
5. Balar AV, Castellano DE, O’Donnell PH, et al. First-line pembrolizumab in cisplatin-ineligible patients with locally advanced and unresectable or metastatic urothelial cancer (KEYNOTE-052): a multicentre, single-arm, phase 2 study. Lancet Oncol. 2017;18(11):1483-1492.
6. Balar AV, Galsky MD, Rosenberg JE, et al; IMvigor210 Study Group. Atezolizumab as first-line treatment in cisplatin-ineligible patients with locally advanced and metastatic urothelial carcinoma: a single-arm, multicentre, phase 2 trial. Lancet. 2017;389(10064):67-76.
7. Bellmunt J, de Wit R, Vaughn DJ, et al; KEYNOTE-045 Investigators. Pembrolizumab as second-line therapy for advanced urothelial carcinoma. N Engl J Med. 2017;376(11):1015-1026.
8. Sharma P, Retz M, Siefker-Radtke A, et al. Nivolumab in metastatic urothelial carcinoma after platinum therapy (CheckMate 275): a multicentre, single-arm, phase 2 trial. Lancet Oncol. 2017;18(3):312-322.
9. Powles T, Durán I, van der Heijden MS, et al. Atezolizumab versus chemotherapy in patients with platinum-treated locally advanced or metastatic urothelial carcinoma (IMvigor211): a multicentre, open-label, phase 3 randomised controlled trial. Lancet. 2018;391(10122):748-757.
10. Patel MR, Ellerton J, Infante JR, et al. Avelumab in metastatic urothelial carcinoma after platinum failure (JAVELIN Solid Tumor): pooled results from two expansion cohorts of an open-label, phase 1 trial. Lancet Oncol. 2018;19(1):51-64.
11. Powles T, O’Donnell PH, Massard C, et al. Efficacy and safety of durvalumab in locally advanced or metastatic urothelial carcinoma: updated results from a phase 1/2 open-label study. JAMA Oncol. 2017;3(9):e172411.
12. Brahmer JR, Lacchetti C, Schneider BJ, et al; National Comprehensive Cancer Network. Management of immune-related adverse events in patients treated with immune checkpoint inhibitor therapy: American Society of Clinical Oncology clinical practice guideline. J Clin Oncol. 2018;36(17):1714-1768.
Timely Diagnosis of Lung Cancer in a Dedicated VA Referral Unit with Endobronchial Ultrasound Capability (FULL)
Lung cancer is the leading cause of cancer death in the US, with 154 050 deaths in 2018.1 There have been many attempts to reduce mortality of the disease through early diagnosis with use of computed tomography (CT). The National Lung Cancer Screening trial showed that screening high-risk populations with low-dose CT (LDCT) can reduce mortality.2 However, implementing LDCT screening in the clinical setting has proven challenging, as illustrated by the VA Lung Cancer Screening Demonstration Project (LCSDP).3 A lung cancer diagnosis typically comprises several steps that require different medical specialties; this can lead to delays. In the LCSDP, the mean time to diagnosis was 137 days.3 There are no federal standards for timeliness of lung cancer diagnosis.
The nonprofit RAND Corporation is the only American research organization that has published guidelines specifying acceptable intervals for the diagnosis and treatment of lung cancer. In Quality of Care for Oncologic Conditions and HIV, RAND Corporation researchers propose management quality indicators: lung cancer diagnosis within 2 months of an abnormal radiologic study and treatment within 6 weeks of diagnosis.4 The Swedish Lung Cancer Study5 and the Canadian Strategy for Cancer Control6 both recommended a standard of about 30 days—half the time recommended by the RAND Corporation.
Bukhari and colleagues at the Dayton US Department of Veterans Affairs (VA) Medical Center (VAMC) conducted a quality improvement study that examined lung cancer diagnosis and management.7 They found the time (SD) from abnormal chest imaging to diagnosis was 35.5 (31.6) days. Of those veterans who received a lung cancer diagnosis, 89.2% had the diagnosis made within the 60 days recommended by the RAND Corporation. Although these results surpass those of the LCSDP, they can be exceeded.
Beyond the potential emotional distress of awaiting the final diagnosis of a lung lesion, a delay in diagnosis and treatment may adversely affect outcomes. LDCT screening has been shown to reduce mortality, which implies a link between survival and time to intervention. There is no published evidence that time to diagnosis in advanced stage lung cancer affects outcome. The National Cancer Database (NCDB) contains informtion on about 70% of the cancers diagnosed each year in the US.8 An analysis of 4984 patients with stage IA squamous cell lung cancer undergoing lobectomy from NCDB showed that earlier surgery was associated with an absolute decrease in 5-year mortality of 5% to 8%. 9 Hence, at least in early-stage disease, reduced time from initial suspect imaging to definitive treatment may improve survival.
A system that coordinates the requisite diagnostic steps and avoids delays should provide a significant improvement in patient care. The results of such an approach that utilized nurse navigators has been previously published. 10 Here, we present the results of a dedicated VA referral clinic with priority access to pulmonary consultation and procedures in place that are designed to expedite the diagnosis of potential lung cancer.
Methods
The John L. McClellan Memorial Veterans Hospital (JLMMVH) in Little Rock, Arkansas institutional review board approved this study, which was performed in accordance with the Declaration of Helsinki. Requirement for informed consent was waived, and patient confidentiality was maintained throughout.
We have developed a plan of care specifically to facilitate diagnosis and treatment of the large number of veterans referred to the JLMMVH Diagnostic Clinic for abnormal results of chest imaging. The clinic has priority access to same-day imaging and subspecialty consultation services. In the clinic, medical students and residents perform evaluations and a registered nurse (RN) manager coordinates care.
A Diagnostic Clinic consult for abnormal thoracic imaging immediately triggers an e-consult to an interventional pulmonologist (Figure). The RN manager and pulmonologist perform a joint review of records/imaging prior to scheduling, and the pulmonologist triages the patient. Triage options include follow-up imaging, bronchoscopy with endobronchial ultrasound (EBUS), endoscopic ultrasound (EUS), and CT-guided biopsy.
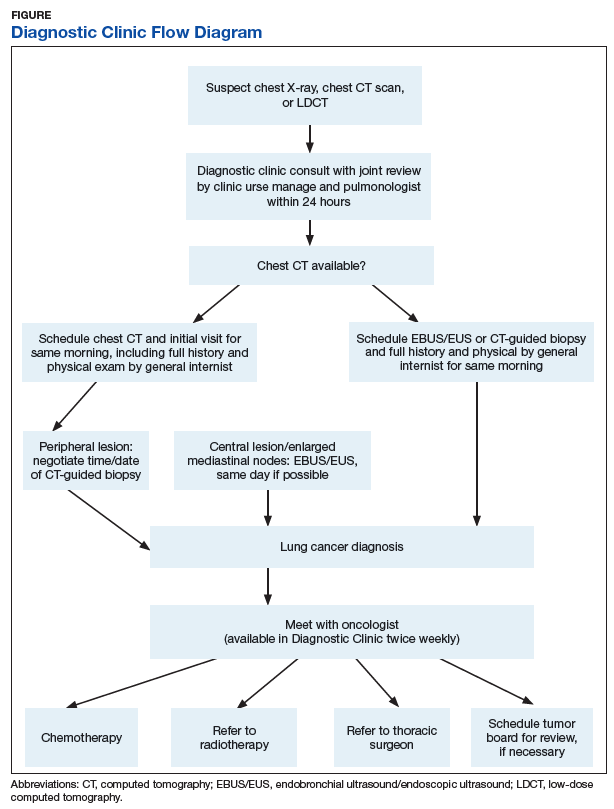
The RN manager then schedules a clinic visit that includes a medical evaluation by clinic staff and any indicated procedures on the same day. The interventional pulmonologist performs EBUS, EUS with the convex curvilinear bronchoscope, or both combined as indicated for diagnosis and staging. All procedures are performed in the JLMMVH bronchoscopy suite with standard conscious sedation using midazolam and fentanyl. Any other relevant procedures, such as pleural tap, also are performed at time of procedure. The pulmonologist and an attending pathologist interpret biopsies obtained in the bronchoscopy suite.
We performed a retrospective chart review of patients diagnosed with primary lung cancer through referral to the JLMMVH Diagnostic Clinic. The primary outcome was time from initial suspect chest imaging to cancer diagnosis. The study population consisted of patients referred for abnormal thoracic imaging between January 1, 2013 and December 31, 2016 and subsequently diagnosed with a primary lung cancer.
Subjects were excluded if (1) the patient was referred from outside our care network and a delay of > 10 days occurred between initial lesion imaging and referral; (2) the patient did not show up for appointments or chose to delay evaluation following referral; (3) biopsy demonstrated a nonlung primary cancer; and (4) serious intercurrent illness interrupted the diagnostic plan. In some cases, the radiologist or consulting pulmonologist had judged the lung lesion too small for immediate biopsy and recommended repeat imaging at a later date.
Patients were included in the study if the follow- up imaging led to a lung cancer diagnosis. However, because the interval between the initial imaging and the follow-up imaging in these patients did not represent a systems delay problem, the date of the scheduled follow-up abnormal imaging, which resulted in initiation of a potential cancer evaluation, served as the index suspect imaging date for this study.
Patient electronic medical records were reviewed and the following data were abstracted: date of the abnormal imaging that led to referral and time from abnormal chest X-ray to chest CT scan if applicable; date of referral and date of clinic visit; date of biopsy; date of lung cancer diagnosis; method of obtaining diagnostic specimen; lung cancer type and stage; type and date of treatment initiation or decision for supportive care only; and decision to seek further evaluation or care outside of our system.
All patients diagnosed with lung cancer during the study period were reviewed for inclusion, hence no required sample-size estimate was calculated. All outcomes were assessed as calendar days. The primary outcome was the time from the index suspect chest imaging study to the date of diagnosis of lung cancer. Prior to the initiation of our study, we chose this more stringent 30-day recommendation of the Canadian6 and Swedish5 studies as the comparator for our primary outcome, although data with respect to the 60-day Rand Corporation guidelines also are reported.4
Statistical Methods
The mean time to lung cancer diagnosis in our cohort was compared with this 30-day standard using a 2-sided Mann–Whitney U test. Normality of data distribution was determined using the Kolmogorov–Smirnov test. For statistical significance testing a P value of .05 was used. Statistical calculations were performed using R statistical software version 3.2.4. Secondary outcomes consisted of time from diagnosis to treatment; proportion of subjects diagnosed within 60 days; time from initial clinic visit to biopsy; and time from biopsy to diagnosis.
Results
Overall, 222 patients were diagnosed with a malignant lung lesion, of which 63 were excluded from analysis: 22 cancelled or did not appear for appointments, declined further evaluation, or completed evaluation outside of our network; 13 had the diagnosis made prior to Diagnostic Clinic visit; 13 proved to have a nonlung primary tumor presenting in the lung or mediastinal nodes; 12 were delayed > 10 days in referral from an outside network; and 3 had an intervening serious acute medical problem forcing delay in the diagnostic process.
Of the 159 included subjects, 154 (96.9%) were male, and the mean (SD) age was 67.6 (8.1) years. For 76 subjects, the abnormal chest X-ray and subsequent chest CT scan were performed the same day or the lung lesion had initially been noted on a CT scan. For 54 subjects, there was a delay of ≥ 1 week in obtaining a chest CT scan. The mean (SD) time from placement of the Diagnostic Clinic consultation by the primary care provider (PCP) or other provider and the initial Diagnostic Clinic visit was 6.3 (4.4) days. The mean (SD) time from suspect imaging to diagnosis (primary outcome) was 22.6(16.6) days.
The distribution of this outcome was nonnormal (Kolmogorov-Smirnov test P < .01). When compared with the standard of 30 days, the primary outcome of 22.6 days was significantly shorter (2-sided Mann–Whitney U test P < .01). Three-quarters (76.1%) of subjects were diagnosed within 30 days and 95.0% of subjects were diagnosed within 60 days of the initial imaging. For the 8 subjects diagnosed after 60 days, contributing factors included PCP delay in Diagnostic Clinic consultation, initial negative biopsy, delay in performance of chest CT scan prior to consultation, and outsourcing of positron emission tomography (PET) scans.
Overall, 57 (35.8%) of the subjects underwent biopsy on the day of their Diagnostic Clinic visit: 14 underwent CT-guided biopsy and 43 underwent EBUS/EUS. Within 2 days of the initial visit 106 subjects (66.7%) had undergone biopsy. The mean (SD) time from initial Diagnostic Clinic visit to biopsy was 6.3 (9.5) days. The mean (SD) interval was 1.8 (3.0) days for EBUS/ EUS and 11.3 (11.7) days for CT-guided biopsy. The mean (SD) interval from biopsy to diagnosis was 3.2 (6.2) days with 64 cases (40.3%) diagnosed the day of biopsy.
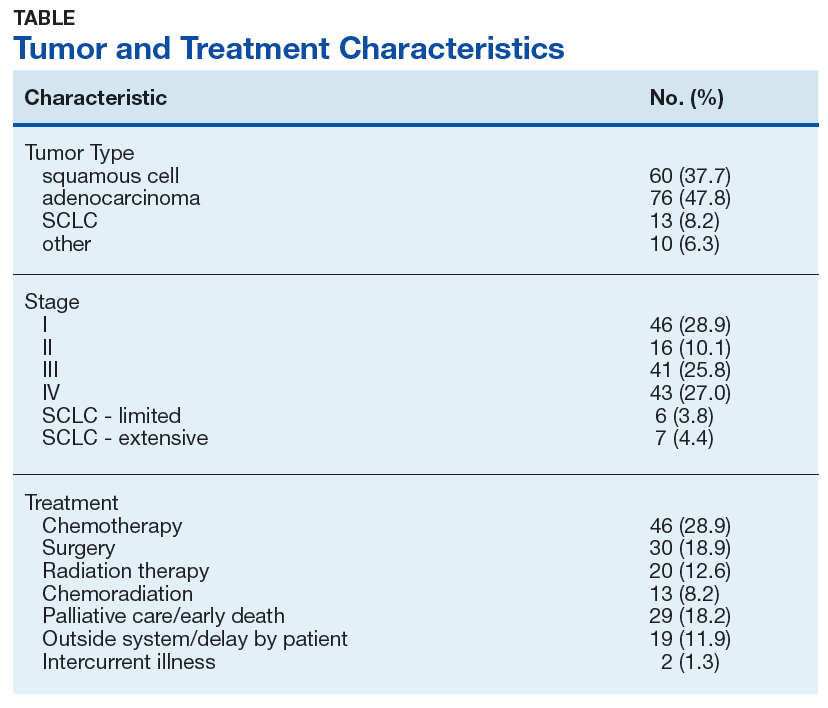
Excluding subjects whose treatment was delayed by patient choice or intercurrent illness, and those who left the VA system to seek treatment elsewhere (n = 21), 24 opted for palliative care, 5 died before treatment could be initiated, and 109 underwent treatment for their tumors (Table). The mean times (SD) from diagnosis to treatment were: chemotherapy alone 34.7 (25.3) days; chemoradiation 37.0 (22.8) days; surgery 44.3 (24.4) days; radiation therapy alone 47.9 (26.0) days. With respect to the RAND Corporation recommended diagnosis to treatment time, 60.9% of chemotherapy alone, 61.5% of chemoradiation, 66.7% of surgery, and 45.0% of radiation therapy alone treatments were initiated within the 6-week window.
Discussion
This retrospective case study demonstrates the effectiveness of a dedicated diagnostic clinic with priority EBUS/EUS access in diagnosing lung cancer within the VA system. Although there is no universally accepted quality standard for comparison, the RAND Corporation recommendation of 60 days from abnormal imaging to diagnosis and the Dayton VAMC published mean of 35.5 days are guideposts; however, the results from the Dayton VAMC may have been affected negatively by some subjects undergoing serial imaging for asymptomatic nodules. We chose a more stringent standard of 30 days as recommended by Swedish and Canadian task forces.
When diagnosing lung cancer, the overriding purpose of the Diagnostic Clinic is to minimize system delays. The method is to have as simple a task as possible for the PCP or other provider who identifies a lung nodule or mass and submits a single consultation request to the Diagnostic Clinic. Once this consultation is placed, the clinic RN manager oversees all further steps required for diagnosis and referral for treatment. The key factor in achieving a mean diagnosis time of 22.6 days is the cooperation between the RN manager and the interventional pulmonologist. When a consultation is received, the RN manager and pulmonologist review the data together and schedule the initial clinic visit; the goal is same-day biopsy, which is achieved in more than one-third of cases. Not all patients with a chest image suspected for lung cancer had it ordered by their PCP. For this reason, a Diagnostic Clinic consultation is available to all health care providers in our system. Many patients reach the clinic after the discovery of a suspect chest X-ray during an emergency department visit, a regularly scheduled subspecialty appointment, or during a preoperative evaluation.
The mean time from initial visit to biopsy was 1.8 days for EBUS/EUS compared with an interval of 11.3 days for CT-guided biopsy. This difference reflects the pulmonologist’s involvement in initial scheduling of Diagnostic Clinic patients. The ability of the pulmonologist to provide an accurate assessment of sample adequacy and a preliminary diagnosis at bedside, with concurrent confirmation by a staff pathologist, permitted the Diagnostic Clinic to inform 40.3% of patients of the finding of malignancy on the day of biopsy. A published comparison of the onsite review of biopsy material showed our pulmonologist and staff pathologists to be equally accurate in their interpretations.11
Sources of Delays
While this study documents the shortest intervals from suspect imaging to diagnosis reported to date, it also identifies sources of system delay in diagnosing lung cancer that JLMMVH could further optimize. The first is the time from initial abnormal chest X-ray imaging to performance of the chest CT scan. On occasion, the index lung lesion is identified unexpectedly on an outpatient or emergency department chest CT scan. With greater use of LDCT lung cancer screening, the initial detection of suspect lesions by CT scanning will increase in the future. However, the PCP most often investigates a patient complaint with a standard chest X-ray that reveals a suspect nodule or mass. When ordered by the PCP as an outpatient test, scheduling of the follow-up chest CT scan is not given priority. More than a third of subjects experienced a delay ≥ 1 week in obtaining a chest CT scan ordered by the PCP; for 29 subjects the delay was ≥ 3weeks. At JLMMVH, the Diagnostic Clinic is given priority in scheduling CT scans. Hence, for suspect lung lesions, the chest CT scan, if not already obtained, is generally performed on the morning of the clinic visit. Educating the PCP to refer the patient immediately to the Diagnostic Clinic rather than waiting to obtain an outpatient chest CT scan may remove this source of unnecessary delay.
Scheduling a CT-guided fine needle aspiration of a lung lesion is another source of system delay. When the chest CT scan is available at the time of the Diagnostic Clinic referral, the clinic visit is scheduled for the earliest day a required CT-guided biopsy can be performed. However, the mean time of 11.3 days from initial Diagnostic Clinic visit to CT-guided biopsy is indicative of the backlog faced by the interventional radiologists.
Although infrequent, PET scans that are required before biopsy can lead to substantial delays. PET scans are performed at our university affiliate, and the joint VA-university lung tumor board sometimes generates requests for such scans prior to tissue diagnosis, yet another source of delay.
The time from referral receipt to the Diagnostic Clinic visit averaged 6.3 days. This delay usually was determined by the availability of the CT-guided biopsy or the dedicated interventional pulmonologist. Although other interventional pulmonologists at JLMMVH may perform the requisite diagnostic procedures, they are not always available for immediate review of imaging studies of referred patients nor can their schedules flexibly accommodate the number of patients seen in our clinic for evaluation.
Lung Cancer Diagnosis
Prompt diagnosis in the setting of a worrisome chest X-ray may help decrease patient anxiety, but does the clinic improve lung cancer treatment outcomes? Such improvement has been demonstrated only in stage IA squamous cell lung cancer.9 Of our study population, 37.7% had squamous cell carcinoma, and 85.5% had non-small cell lung cancer. Of those with non-small cell lung cancer, 28.9% had a clinical stage I tumor. Stage I squamous cell carcinoma, the type of tumor most likely to benefit from early diagnosis and treatment, was diagnosed in 11.3% of patients. With the increased application of LDCT screening, the proportion of veterans identified with early stage lung cancer may rise. The Providence VAMC in Rhode Island reported its results from instituting LDCT screening.12 Prior to screening, 28% of patients diagnosed with lung cancer had a stage I tumor. Following the introduction of LDCT screening, 49% diagnosed by LDCT screening had a stage I tumor. Nearly a third of their patients diagnosed with lung cancer through LDCT screening had squamous cell tumor histology. Thus, we can anticipate an increasing number of veterans with early stage lung cancer who would benefit from timely diagnosis.
The JLMMVH is a referral center for the entire state of Arkansas. Quite a few of its referred patients come from a long distance, which may require overnight housing and other related travel expenses. Apart from any potential outcome benefit, the efficiencies of the system described herein include the minimization of extra trips, an inconvenience and cost to both patient and JLMMVH.
Although the primary task of the clinic is diagnosis, we also seek to facilitate timely treatment. Our lack of an on-site PET scanner and radiation therapy, resources present on-site at the Dayton VAMC, contribute to longer therapy wait times. The shortest mean wait time at JLMMVH is for chemotherapy alone (34.7 days), in part because the JLMMVH oncologists, performing initial consultations 2 to 3 times weekly in the Diagnostic Clinic, are more readily available than are our thoracic surgeons or radiation therapists. Yet overall, JLMMVH patients often face delay from the time of lung cancer diagnosis to initiation of treatment.
The Connecticut Veterans Affairs Healthcare System has published the results of changes in lung cancer management associated with a nurse navigator system.10 Prior to creating the position of cancer care coordinator, filled by an advanced practice RNs, the mean time from clinical suspicion of lung cancer to treatment was 117 days. After 4 years of such care navigation, this waiting time had decreased to 52.4 days. Associated with this dramatic improvement in overall waiting time were decreases in the turnaround time required for performance of CT and PET scans. With respect to this big picture view of lung cancer care, our Diagnostic Clinic serves as a model for the initial step of diagnosis. Coordination and streamlining of the various steps from diagnosis to definitive therapy shall require a more system-wide effort involving all the key players in cancer care.
Conclusion
We have developed a care pathway based in a dedicated diagnostic clinic and have been able to document the shortest interval from abnormality to diagnosis of lung cancer reported in the literature to date. Efficient functioning of this clinic is dependent upon the close cooperation between a full-time RN clinic manager and an interventional pulmonologist experienced in lung cancer management and able to interpret cytologic samples at the time of biopsy. Shortening the delay between diagnosis and definitive therapy remains a challenge and may benefit from the oncology nurse navigator model previously described within the VA system. 10
1. American Cancer Society. Cancer Facts & Figures. https://www.cancer.org/content/dam/cancer-org/research/cancer-facts-and-statistics/annual-cancer-facts-and-figures/2018/cancer-facts-and-figures-2018.pdf. Accessed July 13, 2019.
2. National Lung Screening Trial Research Team, Aberle DR, Adams AM, et al. Reduced lung-cancer mortality with low-dose computed tomographic screening. N Eng J Med. 2011;365(5):395-409.
3. Kinsinger LS, Anderson C, Kim J, et al. Implementation of lung cancer screening in the Veterans Health Administration. JAMA Intern Med. 2017;177(3):399-406.
4. Asch SM, Kerr EA, Hamilton EG, Reifel JL, McGlynn EA, eds. Quality of Care for Oncologic Conditions and HIV: A Review of the Literature and Quality Indicators. Santa Monica, CA: RAND Corporation; 2000.
5. Hillerdal G. [Recommendations from the Swedish Lung Cancer Study Group: Shorter waiting times are demanded for quality in diagnostic work-ups for lung care.] Swedish Med J 1999; 96: 4691.
6. Simunovic M, Gagliardi A, McCready D, Coates A, Levine M, DePetrillo D. A snapshot of waiting times for cancer surgery provided by surgeons affiliated with regional cancer centres in Ontario. CMAJ. 2001;165(4):421-425. [Canadian Strategy for Cancer Control]
7. Bukhari A, Kumar G, Rajsheker R, Markert R. Timeliness of lung cancer diagnosis and treatment. Fed Pract. 2017;34(suppl 1):24S-29S.
8. Bilimoria KY, Ko CY, Tomlinson JS, et al. Wait times for cancer surgery in the United States: trends and predictors of delays. Ann Surg. 2011;253(4):779-785.
9. Yang CJ, Wang H, Kumar A, et al. Impact of timing of lobectomy on survival for clinical stage IA lung squamous cell carcinoma. Chest. 2017;152(6):1239-1250.
10. Hunnibell LS, Rose MG, Connery DM, et al. Using nurse navigation to improve timeliness of lung cancer care at a veterans hospital. Clin J Oncol Nurs. 2012;16(1):29-36.
11. Meena N, Jeffus S, Massoll N, et al. Rapid onsite evaluation: a comparison of cytopathologist and pulmonologist performance. Cancer Cytopatho. 2016;124(4):279-84.
12. Okereke IC, Bates MF, Jankowich MD, et al. Effects of implementation of lung cancer screening at one Veterans Affairs Medical Center. Chest 2016;150(5):1023-1029.
Lung cancer is the leading cause of cancer death in the US, with 154 050 deaths in 2018.1 There have been many attempts to reduce mortality of the disease through early diagnosis with use of computed tomography (CT). The National Lung Cancer Screening trial showed that screening high-risk populations with low-dose CT (LDCT) can reduce mortality.2 However, implementing LDCT screening in the clinical setting has proven challenging, as illustrated by the VA Lung Cancer Screening Demonstration Project (LCSDP).3 A lung cancer diagnosis typically comprises several steps that require different medical specialties; this can lead to delays. In the LCSDP, the mean time to diagnosis was 137 days.3 There are no federal standards for timeliness of lung cancer diagnosis.
The nonprofit RAND Corporation is the only American research organization that has published guidelines specifying acceptable intervals for the diagnosis and treatment of lung cancer. In Quality of Care for Oncologic Conditions and HIV, RAND Corporation researchers propose management quality indicators: lung cancer diagnosis within 2 months of an abnormal radiologic study and treatment within 6 weeks of diagnosis.4 The Swedish Lung Cancer Study5 and the Canadian Strategy for Cancer Control6 both recommended a standard of about 30 days—half the time recommended by the RAND Corporation.
Bukhari and colleagues at the Dayton US Department of Veterans Affairs (VA) Medical Center (VAMC) conducted a quality improvement study that examined lung cancer diagnosis and management.7 They found the time (SD) from abnormal chest imaging to diagnosis was 35.5 (31.6) days. Of those veterans who received a lung cancer diagnosis, 89.2% had the diagnosis made within the 60 days recommended by the RAND Corporation. Although these results surpass those of the LCSDP, they can be exceeded.
Beyond the potential emotional distress of awaiting the final diagnosis of a lung lesion, a delay in diagnosis and treatment may adversely affect outcomes. LDCT screening has been shown to reduce mortality, which implies a link between survival and time to intervention. There is no published evidence that time to diagnosis in advanced stage lung cancer affects outcome. The National Cancer Database (NCDB) contains informtion on about 70% of the cancers diagnosed each year in the US.8 An analysis of 4984 patients with stage IA squamous cell lung cancer undergoing lobectomy from NCDB showed that earlier surgery was associated with an absolute decrease in 5-year mortality of 5% to 8%. 9 Hence, at least in early-stage disease, reduced time from initial suspect imaging to definitive treatment may improve survival.
A system that coordinates the requisite diagnostic steps and avoids delays should provide a significant improvement in patient care. The results of such an approach that utilized nurse navigators has been previously published. 10 Here, we present the results of a dedicated VA referral clinic with priority access to pulmonary consultation and procedures in place that are designed to expedite the diagnosis of potential lung cancer.
Methods
The John L. McClellan Memorial Veterans Hospital (JLMMVH) in Little Rock, Arkansas institutional review board approved this study, which was performed in accordance with the Declaration of Helsinki. Requirement for informed consent was waived, and patient confidentiality was maintained throughout.
We have developed a plan of care specifically to facilitate diagnosis and treatment of the large number of veterans referred to the JLMMVH Diagnostic Clinic for abnormal results of chest imaging. The clinic has priority access to same-day imaging and subspecialty consultation services. In the clinic, medical students and residents perform evaluations and a registered nurse (RN) manager coordinates care.
A Diagnostic Clinic consult for abnormal thoracic imaging immediately triggers an e-consult to an interventional pulmonologist (Figure). The RN manager and pulmonologist perform a joint review of records/imaging prior to scheduling, and the pulmonologist triages the patient. Triage options include follow-up imaging, bronchoscopy with endobronchial ultrasound (EBUS), endoscopic ultrasound (EUS), and CT-guided biopsy.
The RN manager then schedules a clinic visit that includes a medical evaluation by clinic staff and any indicated procedures on the same day. The interventional pulmonologist performs EBUS, EUS with the convex curvilinear bronchoscope, or both combined as indicated for diagnosis and staging. All procedures are performed in the JLMMVH bronchoscopy suite with standard conscious sedation using midazolam and fentanyl. Any other relevant procedures, such as pleural tap, also are performed at time of procedure. The pulmonologist and an attending pathologist interpret biopsies obtained in the bronchoscopy suite.
We performed a retrospective chart review of patients diagnosed with primary lung cancer through referral to the JLMMVH Diagnostic Clinic. The primary outcome was time from initial suspect chest imaging to cancer diagnosis. The study population consisted of patients referred for abnormal thoracic imaging between January 1, 2013 and December 31, 2016 and subsequently diagnosed with a primary lung cancer.
Subjects were excluded if (1) the patient was referred from outside our care network and a delay of > 10 days occurred between initial lesion imaging and referral; (2) the patient did not show up for appointments or chose to delay evaluation following referral; (3) biopsy demonstrated a nonlung primary cancer; and (4) serious intercurrent illness interrupted the diagnostic plan. In some cases, the radiologist or consulting pulmonologist had judged the lung lesion too small for immediate biopsy and recommended repeat imaging at a later date.
Patients were included in the study if the follow- up imaging led to a lung cancer diagnosis. However, because the interval between the initial imaging and the follow-up imaging in these patients did not represent a systems delay problem, the date of the scheduled follow-up abnormal imaging, which resulted in initiation of a potential cancer evaluation, served as the index suspect imaging date for this study.
Patient electronic medical records were reviewed and the following data were abstracted: date of the abnormal imaging that led to referral and time from abnormal chest X-ray to chest CT scan if applicable; date of referral and date of clinic visit; date of biopsy; date of lung cancer diagnosis; method of obtaining diagnostic specimen; lung cancer type and stage; type and date of treatment initiation or decision for supportive care only; and decision to seek further evaluation or care outside of our system.
All patients diagnosed with lung cancer during the study period were reviewed for inclusion, hence no required sample-size estimate was calculated. All outcomes were assessed as calendar days. The primary outcome was the time from the index suspect chest imaging study to the date of diagnosis of lung cancer. Prior to the initiation of our study, we chose this more stringent 30-day recommendation of the Canadian6 and Swedish5 studies as the comparator for our primary outcome, although data with respect to the 60-day Rand Corporation guidelines also are reported.4
Statistical Methods
The mean time to lung cancer diagnosis in our cohort was compared with this 30-day standard using a 2-sided Mann–Whitney U test. Normality of data distribution was determined using the Kolmogorov–Smirnov test. For statistical significance testing a P value of .05 was used. Statistical calculations were performed using R statistical software version 3.2.4. Secondary outcomes consisted of time from diagnosis to treatment; proportion of subjects diagnosed within 60 days; time from initial clinic visit to biopsy; and time from biopsy to diagnosis.
Results
Overall, 222 patients were diagnosed with a malignant lung lesion, of which 63 were excluded from analysis: 22 cancelled or did not appear for appointments, declined further evaluation, or completed evaluation outside of our network; 13 had the diagnosis made prior to Diagnostic Clinic visit; 13 proved to have a nonlung primary tumor presenting in the lung or mediastinal nodes; 12 were delayed > 10 days in referral from an outside network; and 3 had an intervening serious acute medical problem forcing delay in the diagnostic process.
Of the 159 included subjects, 154 (96.9%) were male, and the mean (SD) age was 67.6 (8.1) years. For 76 subjects, the abnormal chest X-ray and subsequent chest CT scan were performed the same day or the lung lesion had initially been noted on a CT scan. For 54 subjects, there was a delay of ≥ 1 week in obtaining a chest CT scan. The mean (SD) time from placement of the Diagnostic Clinic consultation by the primary care provider (PCP) or other provider and the initial Diagnostic Clinic visit was 6.3 (4.4) days. The mean (SD) time from suspect imaging to diagnosis (primary outcome) was 22.6(16.6) days.
The distribution of this outcome was nonnormal (Kolmogorov-Smirnov test P < .01). When compared with the standard of 30 days, the primary outcome of 22.6 days was significantly shorter (2-sided Mann–Whitney U test P < .01). Three-quarters (76.1%) of subjects were diagnosed within 30 days and 95.0% of subjects were diagnosed within 60 days of the initial imaging. For the 8 subjects diagnosed after 60 days, contributing factors included PCP delay in Diagnostic Clinic consultation, initial negative biopsy, delay in performance of chest CT scan prior to consultation, and outsourcing of positron emission tomography (PET) scans.
Overall, 57 (35.8%) of the subjects underwent biopsy on the day of their Diagnostic Clinic visit: 14 underwent CT-guided biopsy and 43 underwent EBUS/EUS. Within 2 days of the initial visit 106 subjects (66.7%) had undergone biopsy. The mean (SD) time from initial Diagnostic Clinic visit to biopsy was 6.3 (9.5) days. The mean (SD) interval was 1.8 (3.0) days for EBUS/ EUS and 11.3 (11.7) days for CT-guided biopsy. The mean (SD) interval from biopsy to diagnosis was 3.2 (6.2) days with 64 cases (40.3%) diagnosed the day of biopsy.
Excluding subjects whose treatment was delayed by patient choice or intercurrent illness, and those who left the VA system to seek treatment elsewhere (n = 21), 24 opted for palliative care, 5 died before treatment could be initiated, and 109 underwent treatment for their tumors (Table). The mean times (SD) from diagnosis to treatment were: chemotherapy alone 34.7 (25.3) days; chemoradiation 37.0 (22.8) days; surgery 44.3 (24.4) days; radiation therapy alone 47.9 (26.0) days. With respect to the RAND Corporation recommended diagnosis to treatment time, 60.9% of chemotherapy alone, 61.5% of chemoradiation, 66.7% of surgery, and 45.0% of radiation therapy alone treatments were initiated within the 6-week window.
Discussion
This retrospective case study demonstrates the effectiveness of a dedicated diagnostic clinic with priority EBUS/EUS access in diagnosing lung cancer within the VA system. Although there is no universally accepted quality standard for comparison, the RAND Corporation recommendation of 60 days from abnormal imaging to diagnosis and the Dayton VAMC published mean of 35.5 days are guideposts; however, the results from the Dayton VAMC may have been affected negatively by some subjects undergoing serial imaging for asymptomatic nodules. We chose a more stringent standard of 30 days as recommended by Swedish and Canadian task forces.
When diagnosing lung cancer, the overriding purpose of the Diagnostic Clinic is to minimize system delays. The method is to have as simple a task as possible for the PCP or other provider who identifies a lung nodule or mass and submits a single consultation request to the Diagnostic Clinic. Once this consultation is placed, the clinic RN manager oversees all further steps required for diagnosis and referral for treatment. The key factor in achieving a mean diagnosis time of 22.6 days is the cooperation between the RN manager and the interventional pulmonologist. When a consultation is received, the RN manager and pulmonologist review the data together and schedule the initial clinic visit; the goal is same-day biopsy, which is achieved in more than one-third of cases. Not all patients with a chest image suspected for lung cancer had it ordered by their PCP. For this reason, a Diagnostic Clinic consultation is available to all health care providers in our system. Many patients reach the clinic after the discovery of a suspect chest X-ray during an emergency department visit, a regularly scheduled subspecialty appointment, or during a preoperative evaluation.
The mean time from initial visit to biopsy was 1.8 days for EBUS/EUS compared with an interval of 11.3 days for CT-guided biopsy. This difference reflects the pulmonologist’s involvement in initial scheduling of Diagnostic Clinic patients. The ability of the pulmonologist to provide an accurate assessment of sample adequacy and a preliminary diagnosis at bedside, with concurrent confirmation by a staff pathologist, permitted the Diagnostic Clinic to inform 40.3% of patients of the finding of malignancy on the day of biopsy. A published comparison of the onsite review of biopsy material showed our pulmonologist and staff pathologists to be equally accurate in their interpretations.11
Sources of Delays
While this study documents the shortest intervals from suspect imaging to diagnosis reported to date, it also identifies sources of system delay in diagnosing lung cancer that JLMMVH could further optimize. The first is the time from initial abnormal chest X-ray imaging to performance of the chest CT scan. On occasion, the index lung lesion is identified unexpectedly on an outpatient or emergency department chest CT scan. With greater use of LDCT lung cancer screening, the initial detection of suspect lesions by CT scanning will increase in the future. However, the PCP most often investigates a patient complaint with a standard chest X-ray that reveals a suspect nodule or mass. When ordered by the PCP as an outpatient test, scheduling of the follow-up chest CT scan is not given priority. More than a third of subjects experienced a delay ≥ 1 week in obtaining a chest CT scan ordered by the PCP; for 29 subjects the delay was ≥ 3weeks. At JLMMVH, the Diagnostic Clinic is given priority in scheduling CT scans. Hence, for suspect lung lesions, the chest CT scan, if not already obtained, is generally performed on the morning of the clinic visit. Educating the PCP to refer the patient immediately to the Diagnostic Clinic rather than waiting to obtain an outpatient chest CT scan may remove this source of unnecessary delay.
Scheduling a CT-guided fine needle aspiration of a lung lesion is another source of system delay. When the chest CT scan is available at the time of the Diagnostic Clinic referral, the clinic visit is scheduled for the earliest day a required CT-guided biopsy can be performed. However, the mean time of 11.3 days from initial Diagnostic Clinic visit to CT-guided biopsy is indicative of the backlog faced by the interventional radiologists.
Although infrequent, PET scans that are required before biopsy can lead to substantial delays. PET scans are performed at our university affiliate, and the joint VA-university lung tumor board sometimes generates requests for such scans prior to tissue diagnosis, yet another source of delay.
The time from referral receipt to the Diagnostic Clinic visit averaged 6.3 days. This delay usually was determined by the availability of the CT-guided biopsy or the dedicated interventional pulmonologist. Although other interventional pulmonologists at JLMMVH may perform the requisite diagnostic procedures, they are not always available for immediate review of imaging studies of referred patients nor can their schedules flexibly accommodate the number of patients seen in our clinic for evaluation.
Lung Cancer Diagnosis
Prompt diagnosis in the setting of a worrisome chest X-ray may help decrease patient anxiety, but does the clinic improve lung cancer treatment outcomes? Such improvement has been demonstrated only in stage IA squamous cell lung cancer.9 Of our study population, 37.7% had squamous cell carcinoma, and 85.5% had non-small cell lung cancer. Of those with non-small cell lung cancer, 28.9% had a clinical stage I tumor. Stage I squamous cell carcinoma, the type of tumor most likely to benefit from early diagnosis and treatment, was diagnosed in 11.3% of patients. With the increased application of LDCT screening, the proportion of veterans identified with early stage lung cancer may rise. The Providence VAMC in Rhode Island reported its results from instituting LDCT screening.12 Prior to screening, 28% of patients diagnosed with lung cancer had a stage I tumor. Following the introduction of LDCT screening, 49% diagnosed by LDCT screening had a stage I tumor. Nearly a third of their patients diagnosed with lung cancer through LDCT screening had squamous cell tumor histology. Thus, we can anticipate an increasing number of veterans with early stage lung cancer who would benefit from timely diagnosis.
The JLMMVH is a referral center for the entire state of Arkansas. Quite a few of its referred patients come from a long distance, which may require overnight housing and other related travel expenses. Apart from any potential outcome benefit, the efficiencies of the system described herein include the minimization of extra trips, an inconvenience and cost to both patient and JLMMVH.
Although the primary task of the clinic is diagnosis, we also seek to facilitate timely treatment. Our lack of an on-site PET scanner and radiation therapy, resources present on-site at the Dayton VAMC, contribute to longer therapy wait times. The shortest mean wait time at JLMMVH is for chemotherapy alone (34.7 days), in part because the JLMMVH oncologists, performing initial consultations 2 to 3 times weekly in the Diagnostic Clinic, are more readily available than are our thoracic surgeons or radiation therapists. Yet overall, JLMMVH patients often face delay from the time of lung cancer diagnosis to initiation of treatment.
The Connecticut Veterans Affairs Healthcare System has published the results of changes in lung cancer management associated with a nurse navigator system.10 Prior to creating the position of cancer care coordinator, filled by an advanced practice RNs, the mean time from clinical suspicion of lung cancer to treatment was 117 days. After 4 years of such care navigation, this waiting time had decreased to 52.4 days. Associated with this dramatic improvement in overall waiting time were decreases in the turnaround time required for performance of CT and PET scans. With respect to this big picture view of lung cancer care, our Diagnostic Clinic serves as a model for the initial step of diagnosis. Coordination and streamlining of the various steps from diagnosis to definitive therapy shall require a more system-wide effort involving all the key players in cancer care.
Conclusion
We have developed a care pathway based in a dedicated diagnostic clinic and have been able to document the shortest interval from abnormality to diagnosis of lung cancer reported in the literature to date. Efficient functioning of this clinic is dependent upon the close cooperation between a full-time RN clinic manager and an interventional pulmonologist experienced in lung cancer management and able to interpret cytologic samples at the time of biopsy. Shortening the delay between diagnosis and definitive therapy remains a challenge and may benefit from the oncology nurse navigator model previously described within the VA system. 10
1. American Cancer Society. Cancer Facts & Figures. https://www.cancer.org/content/dam/cancer-org/research/cancer-facts-and-statistics/annual-cancer-facts-and-figures/2018/cancer-facts-and-figures-2018.pdf. Accessed July 13, 2019.
2. National Lung Screening Trial Research Team, Aberle DR, Adams AM, et al. Reduced lung-cancer mortality with low-dose computed tomographic screening. N Eng J Med. 2011;365(5):395-409.
3. Kinsinger LS, Anderson C, Kim J, et al. Implementation of lung cancer screening in the Veterans Health Administration. JAMA Intern Med. 2017;177(3):399-406.
4. Asch SM, Kerr EA, Hamilton EG, Reifel JL, McGlynn EA, eds. Quality of Care for Oncologic Conditions and HIV: A Review of the Literature and Quality Indicators. Santa Monica, CA: RAND Corporation; 2000.
5. Hillerdal G. [Recommendations from the Swedish Lung Cancer Study Group: Shorter waiting times are demanded for quality in diagnostic work-ups for lung care.] Swedish Med J 1999; 96: 4691.
6. Simunovic M, Gagliardi A, McCready D, Coates A, Levine M, DePetrillo D. A snapshot of waiting times for cancer surgery provided by surgeons affiliated with regional cancer centres in Ontario. CMAJ. 2001;165(4):421-425. [Canadian Strategy for Cancer Control]
7. Bukhari A, Kumar G, Rajsheker R, Markert R. Timeliness of lung cancer diagnosis and treatment. Fed Pract. 2017;34(suppl 1):24S-29S.
8. Bilimoria KY, Ko CY, Tomlinson JS, et al. Wait times for cancer surgery in the United States: trends and predictors of delays. Ann Surg. 2011;253(4):779-785.
9. Yang CJ, Wang H, Kumar A, et al. Impact of timing of lobectomy on survival for clinical stage IA lung squamous cell carcinoma. Chest. 2017;152(6):1239-1250.
10. Hunnibell LS, Rose MG, Connery DM, et al. Using nurse navigation to improve timeliness of lung cancer care at a veterans hospital. Clin J Oncol Nurs. 2012;16(1):29-36.
11. Meena N, Jeffus S, Massoll N, et al. Rapid onsite evaluation: a comparison of cytopathologist and pulmonologist performance. Cancer Cytopatho. 2016;124(4):279-84.
12. Okereke IC, Bates MF, Jankowich MD, et al. Effects of implementation of lung cancer screening at one Veterans Affairs Medical Center. Chest 2016;150(5):1023-1029.